
National Institute of Standards and Technology
273
This publication is available free of charge from: http://dx.doi.org/10.6028/NIST.SP.1190v2
-
Upload
khangminh22 -
Category
Documents
-
view
3 -
download
0
Transcript of National Institute of Standards and Technology
This publication is available free of charge from: http://dx.doi.org/10.6028/NIST.SP.1190v2

Community Resilience Planning Guide for Buildings and Infrastructure Systems - Volume I
Contributors
i
Disclaimer No. 1
Certain commercial entities, equipment, or materials may be identified in this document to describe an experimental
procedure or concept adequately. Such identification is not intended to imply recommendation or endorsement by
the National Institute of Standards and Technology, nor is it intended to imply that the entities, materials, or
equipment are necessarily the best available for the purpose.
Disclaimer No. 2
The policy of NIST is to use the International System of Units (SI) in all publications. In this document, however,
units are presented in the system prevalent in the relevant discipline, although in some cases more than one system
of units may be presented.
Copyright
This NIST publication is a work of the United States Government not subject to copyright protection within the
United States under Title 17 United States Code § 105. This publication may include copyrighted content (such as
photographs) used with permission of the credited copyright holder. Reproduction, redistribution or reuse of such
copyrighted content apart from this publication may require permission, which should be sought from the credited
copyright holder. Where no copyright holder or source is credited for a figure or table in this publication, the source
is NIST, which would appreciate attribution.
National Institute of Standards and Technology Special Publication 1190
258 pages (October 2015)
CODEN: NSPUE2
This Publication is available free of charge from:
http://dx.doi.org/10.6028/NIST.SP.1190v1

Community Resilience Planning Guide for Buildings and Infrastructure Systems - Volume I
Contributors
ii
Contributors
NIST
David Butry
Steve Cauffman
Stanley Gilbert
Erica Kuligowski
Therese McAllister
Nancy McNabb
Doug Thomas
Applied Research Associates (ARA), Inc. – Prime Contractor
Ryan Anthony
Jessica Colopy
Bill Judge
Frank Lavelle
David Mizzen
Janet MacKenzie
Sebastian Penedo
Peter Vickery
NIST Disaster Resilience Fellows
Don Ballantyne (Ballantyne Consulting)
Erich Gunther (EnerNex)
Joe Englot (HNTB)
George Huff (The Continuity Project)
Stuart McCafferty (GridIntellect)
Kevin Morley (American Water Works
Association)
Chris Poland (Chris D. Poland Consulting Engineer)
Steve Poupos (AT&T)
Liesel Ritchie (University of Colorado at Boulder)
Jay Wilson (Clackamas County, OR Office of
Emergency Management)
Ted Zoli (HNTB)
Contractor Team
Erin Ashley (AECOM)
Andrew Cairns (AECOM)
Chris Chafee (AECOM)
Jay Doyle (AECOM)
Mat Heyman (Impresa Management Solutions)
Alan Klindworth (AECOM)
Jeffrey Kotcamp (TRC Solutions)
Lauren O‘Donnell (TRC Solutions)
Robert Pekelnicky (Degenkolb Engineers)
Nick Rubino (AECOM)
Kathy Schaefer (AECOM)
Larry Studdiforf (AECOM)
Adrienne Sheldon (AECOM)
Scott Tezak (TRC Solutions)
Simon Van Leeuwen (TRC Solutions)
Kent Yu (SEFT Consulting)
Voluntary Contributors
Jim Castagna (Verizon)
Robert Jakubek (US Cellular)
Rosemary Leffler (AT&T)
Alexis Kwasinski (University of Pittsburgh)
John Plodinec (CARRI)
Jim Shortal (Cox Communications)
Community Resilience Planning Guide for Buildings and Infrastructure Systems - Volume I
Table of Contents
ii
Table of Contents
Executive Summary ...................................................................................................................................... 1
10. Understanding and Characterizing the Social Community .............................................................. 9
Social Community Executive Summary ................................................................................................ 9
10.1. Introduction ............................................................................................................................. 10
10.2. Social Capital and Community Engagement ........................................................................... 11
10.3. Community Members and Their Needs (Now and in the Future) ........................................... 12 10.3.1. Social Vulnerabilities ................................................................................................. 12 10.3.2. Needs of Community Members ................................................................................. 13
10.4. Social Institutions within the Community ............................................................................... 14 10.4.1. Family and Kinship .................................................................................................... 15 10.4.2. Economic .................................................................................................................... 15 10.4.3. Government ................................................................................................................ 16 10.4.4. Health ......................................................................................................................... 19 10.4.5. Education .................................................................................................................... 20 10.4.6. Community Service Organizations ............................................................................ 21 10.4.7. Religious, Cultural, and Other Organizations that Support Belief Systems ............... 22 10.4.8. Media .......................................................................................................................... 22
10.5. Dependencies among and within Social Institutions ............................................................... 23 10.5.1. Dependencies among Social Institutions .................................................................... 23 10.5.2. Dependencies within Social Institutions .................................................................... 24
10.6. Social- and Economic-Based Community Metrics ................................................................. 24
10.7. Links between the Social Institutions and the Built Environment .......................................... 26 10.7.1. Links between Buildings and Social Institutions ....................................................... 26 10.7.2. Links between Transportation and Social Institutions ............................................... 32 10.7.3. Links between Energy and Social Institutions ........................................................... 32 10.7.4. Links between Communications and Social Institutions ............................................ 32 10.7.5. Links between Water and Wastewater and Social Institutions ................................... 33 10.7.6. Links between Social Institutions and the Built Environment after a Disaster .......... 33
10.8. Community Performance Goals Based on Community Member Needs ................................. 33
10.9. References ............................................................................................................................... 35
11. Dependencies and Cascading Effects ............................................................................................ 39
Dependencies Executive Summary ...................................................................................................... 39
11.1. Introduction ............................................................................................................................. 39
11.2. Dimensions of Dependency ..................................................................................................... 40 11.2.1. Internal and External Dependency ............................................................................. 40 11.2.2. Time ........................................................................................................................... 44 11.2.3. Space .......................................................................................................................... 46 11.2.4. Source Dependency .................................................................................................... 48
11.3. Planning for Infrastructure System Dependencies .................................................................. 48
11.4. References ............................................................................................................................... 53

Community Resilience Planning Guide for Buildings and Infrastructure Systems - Volume I
Table of Contents
iii
12. Buildings ........................................................................................................................................ 54
Buildings Executive Summary ............................................................................................................. 54
12.1. Introduction ............................................................................................................................. 55 12.1.1. Social Needs and Systems Performance Goals .......................................................... 55 12.1.2. Reliability vs. Resilience ............................................................................................ 55 12.1.3. Dependencies ............................................................................................................. 56
12.2. Building Categories and Functions ......................................................................................... 56 12.2.1. Government ................................................................................................................ 58 12.2.2. Health Care ................................................................................................................. 59 12.2.3. Schools and Daycare Centers ..................................................................................... 59 12.2.4. Religious and Spiritual Centers .................................................................................. 60 12.2.5. Residential and Hospitality ........................................................................................ 60 12.2.6. Business and Services ................................................................................................ 61 12.2.7. Conference and Event Venues ................................................................................... 61 12.2.8. Detention and Correctional Facilities ......................................................................... 62
12.3. Performance Goals .................................................................................................................. 62
12.4. Regulatory Environment ......................................................................................................... 67
12.5. Codes and Standards ............................................................................................................... 68 12.5.1. New Construction ....................................................................................................... 69 12.5.2. Existing Buildings ...................................................................................................... 72
12.6. Strategies for Implementing Plans for Community Resilience ............................................... 73 12.6.1. Available Guidance .................................................................................................... 73 12.6.2. Solutions for Future Construction .............................................................................. 74 12.6.3. Solutions for Existing Construction ........................................................................... 75 12.6.4. Strategy Prioritization................................................................................................. 77
12.7. References ............................................................................................................................... 78
13. Transportation Systems .................................................................................................................. 81
Transportation Systems Executive Summary ....................................................................................... 81
13.1. Introduction ............................................................................................................................. 83 13.1.1. Social Needs and System Performance Goals ............................................................ 84 13.1.2. Dependencies ............................................................................................................. 85
13.2. Transportation Infrastructure ................................................................................................... 88 13.2.1. Roads, Bridges, Highways, and Road Tunnels .......................................................... 88 13.2.2. Rail ............................................................................................................................. 91 13.2.3. Air............................................................................................................................... 93 13.2.4. Ports, Harbors, and Waterways .................................................................................. 94 13.2.5. Pipelines ..................................................................................................................... 97
13.3. Performance Goals ................................................................................................................ 101
13.4. Regulatory Environment ....................................................................................................... 107
13.5. Standards and Codes ............................................................................................................. 110 13.5.1. New Construction ..................................................................................................... 112 13.5.2. Existing Construction ............................................................................................... 116
13.6. Strategies for Implementing Plans for Community Resilience ............................................. 117

Community Resilience Planning Guide for Buildings and Infrastructure Systems - Volume I
Table of Contents
iv
13.6.1. Available Guidance .................................................................................................. 117 13.6.2. Solutions for Future Construction ............................................................................ 118 13.6.3. Solutions for Existing Construction ......................................................................... 120
13.7. References ............................................................................................................................. 122
14. Energy Systems ............................................................................................................................ 129
Energy Systems Executive Summary ................................................................................................. 129
14.1. Introduction ........................................................................................................................... 130 14.1.1. Social Needs and System Performance Goals .......................................................... 130 14.1.2. Reliability, Resilience, and Energy Assurance ......................................................... 131 14.1.3. Dependencies ........................................................................................................... 132
14.2. Energy Infrastructure ............................................................................................................. 133 14.2.1. Electric Power .......................................................................................................... 133 14.2.2. Liquid Fuel ............................................................................................................... 140 14.2.3. Natural Gas ............................................................................................................... 143 14.2.4. Emergency and Standby Power ................................................................................ 143
14.3. Performance Goals ................................................................................................................ 146
14.4. Regulatory Environment ....................................................................................................... 148 14.4.1. Federal ...................................................................................................................... 149 14.4.2. State .......................................................................................................................... 149 14.4.3. Local ......................................................................................................................... 150
14.5. Codes and Standards ............................................................................................................. 150 14.5.1. New Construction ..................................................................................................... 151 14.5.2. Existing Construction ............................................................................................... 152
14.6. Strategies for Implementation of Plans for Community Resilience ...................................... 155 14.6.1. Available Guidance .................................................................................................. 155 14.6.2. Solutions for Future Construction ............................................................................ 157 14.6.3. Solutions for Existing Construction ......................................................................... 158
14.7. References ............................................................................................................................. 159
15. Communication Systems ............................................................................................................. 164
Communication Systems Executive Summary................................................................................... 164
15.1. Introduction ........................................................................................................................... 165 15.1.1. Social Needs and System Performance Goals .......................................................... 165 15.1.2. Availability, Reliability, and Resilience ................................................................... 166 15.1.3. Dependencies ........................................................................................................... 167
15.2. Communication Infrastructure............................................................................................... 168 15.2.1. Core Infrastructure and Wireline System ................................................................. 169 15.2.2. Wireless Systems ...................................................................................................... 175 15.2.3. Cable and Broadcast Systems ................................................................................... 176 15.2.4. Emergency Communications ................................................................................... 177
15.3. Performance Goals ................................................................................................................ 178
15.4. Regulatory Environment ....................................................................................................... 182 15.4.1. Federal ...................................................................................................................... 182 15.4.2. State .......................................................................................................................... 183

Community Resilience Planning Guide for Buildings and Infrastructure Systems - Volume I
Table of Contents
v
15.4.3. Local ......................................................................................................................... 183 15.4.4. Overlapping Jurisdiction .......................................................................................... 184
15.5. Codes and Standards ............................................................................................................. 184 15.5.1. New Construction ..................................................................................................... 184 15.5.2. Existing Construction ............................................................................................... 188
15.6. Strategies for Implementing Plans for Community Resilience ............................................. 190 15.6.1. Available Guidance .................................................................................................. 190 15.6.2. Solutions for Future Construction ............................................................................ 190 15.6.3. Solutions for Existing Construction ......................................................................... 192
15.7. References ............................................................................................................................. 195
16. Water and Wastewater Systems ................................................................................................... 198
Water and Wastewater Systems Executive Summary ........................................................................ 198
16.1. Introduction ........................................................................................................................... 199 16.1.1. Social Needs and Systems Performance Goals ........................................................ 199 16.1.2. Dependencies ........................................................................................................... 200
16.2. Water and Wastewater Infrastructure .................................................................................... 202 16.2.1. Water Infrastructure ................................................................................................. 202 16.2.2. Wastewater Systems ................................................................................................. 209
16.3. Performance Goals ................................................................................................................ 213
16.4. Regulatory Environment ....................................................................................................... 217 16.4.1. Federal and State Primacy ........................................................................................ 217 16.4.2. Other State ................................................................................................................ 217
16.5. Codes and Standards ............................................................................................................. 217 16.5.1. New Construction ..................................................................................................... 218 16.5.2. Existing Construction ............................................................................................... 220
16.6. Strategies for Implementing Plans for Community Resilience ............................................. 221 16.6.1. System Assessment Approaches .............................................................................. 221 16.6.2. Solutions to Improve System Performance .............................................................. 224
16.7. References ............................................................................................................................. 226
17. Community Resilience Metrics .................................................................................................... 230
Community Resilience Metrics Executive Summary ......................................................................... 230
17.1. Background ........................................................................................................................... 230
17.2. Desirable Characteristics for Community Resilience Metrics .............................................. 231
17.3. Types of Metrics .................................................................................................................... 231 17.3.1. Time to Recovery of Function .................................................................................. 231 17.3.2. Economic Vitality .................................................................................................... 232 17.3.3. Social Well-Being .................................................................................................... 233 17.3.4. Environmental Resilience......................................................................................... 235 17.3.5. Hybrid Metrics ......................................................................................................... 236 17.3.6. Other Metrics ............................................................................................................ 236
17.4. Examples of Existing Community Resilience Assessment Methodologies .......................... 236 17.4.1. SPUR Methodology ................................................................................................. 236

Community Resilience Planning Guide for Buildings and Infrastructure Systems - Volume I
Table of Contents
vi
17.4.2. Oregon Resilience Plan ............................................................................................ 237 17.4.3. UNISDR Disaster Resilience Scorecard for Cities .................................................. 237 17.4.4. CARRI Community Resilience System ................................................................... 238 17.4.5. Communities Advancing Resilience Toolkit (CART) ............................................. 238 17.4.6. Baseline Resilience Indicators for Communities (BRIC) ........................................ 239 17.4.7. Rockefeller Foundation City Resilience Framework ............................................... 239 17.4.8. NOAA Coastal Community Resilience Index .......................................................... 240 17.4.9. FEMA Hazus Methodology ..................................................................................... 241 17.4.10. Comparison Matrix .................................................................................................. 241
17.5. Economic Evaluation of Community Resilience Investment Portfolio ................................. 242 17.5.1. Portfolio Considerations ........................................................................................... 243 17.5.2. Economic Decision-Making Involving Risk and Uncertainty ................................. 244
17.6. References ............................................................................................................................. 244
18. Glossary ....................................................................................................................................... 247
18.1. List of Terms ......................................................................................................................... 247
18.2. List of Acronyms ................................................................................................................... 250
18.3. References ............................................................................................................................. 257

Community Resilience Planning Guide for Buildings and Infrastructure Systems - Volume I
List of Figures
vii
List of Figures
Figure ES-1: Downtown Cedar Rapids, Iowa, during the 2008 floods [Source: FEMA 2009] .................... 2
Figure ES-2: Cedar Rapids, Iowa Resilience Plan [adapted and redrawn, Cedar Rapids 2014] .................. 3
Figure ES-3: Six-step planning process for community resilience ............................................................... 4
Figure 10-1: The social and economic functions of a community define the functional
requirements of the community‘s buildings and infrastructure systems. ....................................... 10
Figure 10-2: The hierarchy of human needs (Adapted from Maslow‘s Hierarchy of Needs – a
psychological perspective [Maslow 1943]) ................................................................................... 13
Figure 10-3: Alignment of the Government and health institutions with Maslow‘s Hierarchy of
Needs [Adapted from Maslow 1943] ............................................................................................. 34
Figure 10-4: Alignment of the economic and family/kinship institutions with Maslow‘s Hierarchy
of Needs [Adapted from Maslow 1943] ........................................................................................ 35
Figure 10-5: Alignment of all the social institutions with Maslow‘s Hierarchy of Needs [Adapted
from Maslow 1943]........................................................................................................................ 35
Figure 11-1. Example of infrastructure internal and external dependencies for emergency services
[Source: Pederson et al. 2006]. ...................................................................................................... 41
Figure 11-2. Example of external dependency relationships [Adapted and redrawn, Rinaldi et al
2001] .............................................................................................................................................. 42
Figure 11-3: Power system internal dependence cascading failure in the 2003 Northeast Blackout ......... 43
Figure 11-4: External dependence cascading failure in the 2003 Northeast Blackout ............................... 43
Figure 11-5: Four impact zones for M9.0 Cascadia earthquake scenario [Source: OSSPAC 2013] .......... 47
Figure 11-6: Example of infrastructure co-location .................................................................................... 47
Figure 11-7: Portland, OR liquid fuel tank farm is vulnerable to failures in pipelines in
Washington State. (Source: Yumei Wang [DOGAMI 2012] ........................................................ 48
Figure 11-8: Potential service restoration timeframes following a scenario M 7.9 earthquake on
the San Andreas Fault estimated in City of San Francisco Study .................................................. 49
Figure 11-9: GIS map of infrastructure systems around Portland, Oregon [Source: USGS] ..................... 51
Figure 11-10: Pre-event simulation of LADWP restoration of pump stations and power supply .............. 52
Figure 12-1: Failure of unreinforced masonry wall during an earthquake event ........................................ 64
Figure 12-2: Non-structural damage to interior finishes following an earthquake event ........................... 65
Figure 12-3: Floodwaters reached just under the first floor on this building. ............................................. 65
Figure 12-4: Damage to roof covering, vinyl siding and fascia as the result of wind ................................ 65
Figure 12-5: Significant nonstructural damage inside structurally stable building after earthquake
event ............................................................................................................................................... 65
Figure 12-6: As a result of an estimated 0.9-1.2 m (3-4 ft) of flooding, interior walls had to be
replaced as well as an exterior door and window. [Source: FEMA] ............................................. 66
Community Resilience Planning Guide for Buildings and Infrastructure Systems - Volume I
List of Figures
viii
Figure 12-7: Siding loss and minor envelope damage on low-rise building from a wind event
[Source: FEMA] ............................................................................................................................ 66
Figure 12-8: Apartment building with damaged structural members that is structurally stable ................. 66
Figure 12-9: Fractured brace connection in a building damaged in an earthquake .................................... 66
Figure 12-10: Foundation wall collapse due to hydrostatic pressure from floodwaters [Source:
FEMA] ........................................................................................................................................... 67
Figure 12-11: Wind and wind-borne debris resulted in considerable damage to glazing on this
building. [Source: FEMA] ............................................................................................................. 67
Figure 12-12: Collapse of five-story building due to undermining (from flooding) of shallow
foundation [Source: FEMA] .......................................................................................................... 67
Figure 13-1: Road undercutting in the aftermath of Hurricane Irene (Source: Photo by Elissa Jun
[FEMA 2014a]) .............................................................................................................................. 89
Figure 13-2: Local road blocked by fallen trees after remnants of extra-tropical storm struck
Kentucky [Source: Kentucky Public Service Commission 2009] ................................................. 89
Figure 13-3: Bridge sections knocked off their supports during Hurricane Katrina due to wave
action. (Source: Photo by Win Henderson [FEMA 2014d]) .......................................................... 90
Figure 13-4: A railroad bridge in New Orleans was washed out by flooding during Hurricane
Katrina. (Source: Photo by Marvin Nauman [FEMA 2014c]) ....................................................... 92
Figure 13-5: Flooding in 1993 closed the Chester County Airport and moved planes. (Source:
Photo by Andrea Booher [FEMA 2014b]) ..................................................................................... 94
Figure 13-6: Shipping containers are displaced by high winds and storm surge following Katrina
in 2005. (Source: Photo by Win Henderson [FEMA 2014e]) ........................................................ 95
Figure 13-7: Iowa DOT comparison chart .................................................................................................. 96
Figure 13-8: Natural gas crew shuts off gas after Hurricane Sandy. [Source: Liz Roll, FEMA
2012] .............................................................................................................................................. 97
Figure 13-9: Fire damage from broken gas lines [Source: Christopher Mardorf, FEMA 2014] ................ 98
Figure 13-10: Timeframes for transportation systems functionality and potential climate change
impacts [Source: Michael Savonis, FHWA 2009] ....................................................................... 117
Figure 13-11: Airtrain seismic isolation bearing ...................................................................................... 118
Figure 14-1: NASEO [2009] Energy Assurance Guidelines .................................................................... 132
Figure 14-2: NIST smart grid conceptual model [Source: NIST 2014] .................................................... 134
Figure 14-3: Energy assurance flowchart developed by CaLEAP [Source: CaLEAP 2015[ ................... 156
Figure 15-1: Trees fallen across roads due to ice storm in Kentucky slowed down recovery efforts
[Source: Kentucky Public Service Commission 2009] ................................................................ 168
Figure 15-2: Overview of services and applications supported by communication infrastructure
systems (Source: [DHS 2008, Used with Permission] ) .............................................................. 169
Figure 15-3: Large standby portable power unit used when basement generators failed [Source:
FEMA 2013] ................................................................................................................................ 171
Figure 15-4: Failure of CATV cable due to wind effects ......................................................................... 173

Community Resilience Planning Guide for Buildings and Infrastructure Systems - Volume I
List of Figures
ix
Figure 15-5: Elevated DLC RT with natural gas standby generator installed after Hurricane
Katrina ......................................................................................................................................... 174
Figure 15-6: Placement of UPS systems is an important consideration for resilience and periodic
maintenance. ................................................................................................................................ 177
Figure 15-7: Watertight door used on central office in Kamaishi, Japan ................................................. 191
Figure 16-1: Water dependencies with other infrastructure systems ........................................................ 200
Figure 16-2: Water transmission pipeline bridge damaged by landslide .................................................. 204
Figure 16-3: Santa Clara Valley Water District, water treatment plant clarifier launders damaged
due to sloshing, 1989 Loma Prieta Earthquake ............................................................................ 205
Figure 16-4: Liquefaction caused differential settlement between pile-supported structures and
buried pipe during the 2011 Tohoku Earthquake ......................................................................... 205
Figure 16-5: Collapsed water tank in Buras, LA near Hurricane Katrina landfall location [Source:
FEMA] ......................................................................................................................................... 206
Figure 16-6: Steel tanks damaged due to Tohoku, Japan Tsunami in 2011.............................................. 206
Figure 16-7: Tank moved, severing connecting pipe in 1994 Northridge Earthquake ............................. 207
Figure 16-8: Steel tank elephant‘s foot buckling in 1994 Northridge Earthquake ................................... 207
Figure 16-9: Exposed (left) and broken(right) distribution lines resulting from flooding in
Jamestown, CO [Source: Environmental Protection Agency] ..................................................... 208
Figure 16-10: Ground cracking (left) and joint separation in ductile iron pipe (right) due to
liquefaction during 1995 Kobe Earthquake ................................................................................. 208
Figure 16-11: Non-pile supported structures failed due to liquefaction in 1995 Kobe Earthquake. ........ 212
Figure 16-12: Higashinda WWTP Channel offset by liquefaction in 1995 Kobe Earthquake ................. 212
Figure 16-13: Sendai WWTP Effluent Pump Station damaged by Tsunami in 2011 Tohoku
Earthquake ................................................................................................................................... 212
Figure 16-14: Sendai WWTP equipment and piping damage from the 2011 earthquake ........................ 212
Figure 17-1: Preliminary summary assessment of nine existing community resilience
methodologies .............................................................................................................................. 242

Community Resilience Planning Guide for Buildings and Infrastructure Systems - Volume I
List of Tables
x
List of Tables
Table ES-1: Planning steps and key activities for community resilience ..................................................... 8
Table 10-1: U.S. employment characteristics, 2013 [Source: Bureau of Labor Statistics 2015] ................ 17
Table 10-2: Consumption expenditures as a percent of total, by type of product [Source: Bureau
of Economic Analysis 2013] .......................................................................................................... 18
Table 10-3: Industry size and inter-industry relevance in the United States [Source: World Input-
Output Database 2011; Timmer 2012]........................................................................................... 25
Table 10-4: Links between social institutions and buildings ...................................................................... 27
Table 10-5: Links between social institutions and transportation systems ................................................. 28
Table 10-6: Links between social institutions and energy systems ............................................................ 29
Table 10-7: Links between social institutions and communications systems ............................................. 30
Table 10-8: Links between social institutions and water and wastewater systems ..................................... 31
Table 11-1: Infrastructure system dependencies identified by the City of San Francisco‘s Lifelines
Council following a scenario M7.9 earthquake on the San Andreas Fault [Adapted from
Laurie Johnson, CCSF Lifelines Council 2014] ............................................................................ 50
Table 12-1: Risk categories for buildings [ASCE/SEI 2010] ..................................................................... 57
Table 12-2: Performance level definitions for building clusters ................................................................. 58
Table 12-3: Example table for building performance goals to be filled out by the community and
its stakeholders ............................................................................................................................... 63
Table 12-4: Hazard levels for buildings and facilities ................................................................................ 70
Table 13-1: The American Lifelines Association high-level performance metrics for pipeline
systems [Adapted from ALA 2005] ............................................................................................... 99
Table 13-2: Qualitative Ranking of Hazard Vulnerability for Typical Pipeline System
Components and Facilities [Adapted from ALA 2005] ............................................................... 100
Table 13-3: Example transportation infrastructure performance goals table to be filled out by a
community and its stakeholders ................................................................................................... 102
Table 13-4: Example pipelines performance goals table to be filled out by community and its
stakeholders ................................................................................................................................. 104
Table 13-5: Transportation infrastructure ownership and governing regulatory agencies ....................... 108
Table 13-6: Role of transportation oversight agency ................................................................................ 109
Table 13-7: Surface transport codes, standards, or guidelines .................................................................. 113
Table 13-8: Rail surface transport codes, standards, or guidelines ........................................................... 114
Table 13-9: Multimodal Value of Time Units (VOTU) for calculating cost of delay [Farokhi et al.
2015; Englot 2011] ...................................................................................................................... 120
Table 14-1: The American Lifelines Association high-level performance measures and
performance metrics for pipeline systems [Adapted from ALA 2005] ....................................... 141

Community Resilience Planning Guide for Buildings and Infrastructure Systems - Volume I
List of Tables
xi
Table 14-2: Qualitative ranking of typical pipeline system components and facilities vulnerability
to hazards to [Adapted from ALA 2005] ..................................................................................... 142
Table 14-3: Example electrical energy infrastructure performance goals table to be filled out by
community and its stakeholders ................................................................................................... 147
Table 15-1: Example communications infrastructure performance goals table to be filled out by
community and its stakeholders ................................................................................................... 180
Table 15-2: Example communication codes and standards discussed in this chapter .............................. 184
Table 15-3: Example best practices for communications infrastructure ................................................... 186
Table 16-1: Common hazards and their potential related consequences [Adapted from
Preparedness, Emergency Response, and Recovery CIPAC Workgroup 2009].......................... 203
Table 16-2: Example water infrastructure performance goals table to be filled out by community
and its stakeholders ...................................................................................................................... 214
Table 16-3: Example wastewater infrastructure performance goals table to be filled out by
community and its stakeholders ................................................................................................... 215
Table 16-4: Codes, standards, and guidelines related to resilience at drinking water and
wastewater facilities ..................................................................................................................... 219

Community Resilience Planning Guide for Buildings and Infrastructure Systems - Volume II
Executive Summary, Social Community Executive Summary
1
Executive Summary
Community Resilience: The Big Picture. In the United States, there are always communities working to
recover from a disaster. Although communities cannot stop natural hazards and have only limited ability
to prevent technological and human-caused hazards, they can minimize disastrous consequences.
The extent of recovery and the ultimate outcome depend upon the nature and severity of the event and the
community‘s preparedness to prevent incidents, mitigate risk, protect assets, respond in a timely and
coordinate way, and recover community functions. Together, these measures determine the community‘s
resilience.
This Community Resilience Planning Guide for Buildings and Infrastructure Systems (Guide) has been
developed to help communities address these challenges through a practical approach that takes into
account community social goals and their dependencies on the ―built environment‖ – buildings and
infrastructure systems.
The Guide recognizes that most
communities have limited resources to
devote to resilience-related actions and
that improving resilience is a process that
likely will be achieved over many years.
The Guide‘s six-step planning process
provides a way to align priorities and
resources with community goals to jump
start or boost the community resilience
process. The Guide can help communities
build back better in ways that reflect their
unique cultures, conditions, and capabilities.
Community Resilience Goals and this Guide. Community resilience, which spans activities ranging from
preparing for hazard events, risk mitigation, and post-event recovery, should be proactive, continuous,
and integrated into other community goals and plans. Traditional activities, such as disaster preparedness
will help and are part of resilience planning when they include prevention, protection, mitigation,
response, and recovery.
Some communities are well on their way to achieving resilience. These communities incorporate
continuity planning, risk management, and long-term community resilience goals. But many others can
do more to improve their resilience to hazards by incorporating more comprehensive and purposeful
planning that engages a broad set of stakeholders.
The National Preparedness Goal, developed by the Federal Emergency Management Agency (FEMA) in
response to a Presidential Policy Directive, envisions ―a secure and resilient nation with the capabilities
required across the whole community to prevent, protect against, mitigate, respond to, and recover from
the threats and hazards that pose the greatest risk‖ [FEMA 2015a]. The Guide supports that goal by
addressing the role buildings and infrastructure systems play in assuring the health and vitality of the
social and economic fabric of the community.
Resilience planning and actions do not happen overnight and should be part of a comprehensive,
thoughtful process. The Guide offers a six-step planning process for local governments, the logical
conveners, to bring stakeholders together and incorporate resilience into their short- and long-term
planning. This process will enable communities to improve their resilience over time in a way that is cost
effective and consistent with their development goals.
Community resilience is the ability of a
community to
Prepare for anticipated hazards
Adapt to changing conditions
Withstand and recover rapidly from
disruptions

Community Resilience Planning Guide for Buildings and Infrastructure Systems - Volume II
Executive Summary, Social Community Executive Summary
2
Having a plan in place and undertaking steps to improve resilience before a hazard strikes increases the
ability of communities to recover quickly in a way that better prepares them for future events. Even if an
extreme event occurs, a resilient community likely will experience reduced disruption and recovery time.
Communities that do not prepare well are more likely to be overwhelmed when hazard events strike.
Communities are often not prepared to recover from hazard events, as evidenced by the number of
Presidential Disaster Declarations each year [FEMA 2011a]. Poor performance may result from aging
infrastructure, dependencies between physical systems, poor siting, or lack of maintenance. Truly
transformative planning for resilience is often assigned a low priority unless a recent event grabs
community interest. Even then, communities tend to focus on restoration to previous conditions and
capacities rather than building back better.
Some communities have taken significant steps
to develop, implement, and update their plans to
improve resilience. Cedar Rapids, Iowa, for
example, developed and exercised an evacuation
plan for dealing with a potential incident at an
upstream nuclear power plant. Cedar Rapids
executed that plan during 2008 flooding, when
the Cedar River crested well above its predicted
500-year flood level (Figure ES-1). No lives
were lost, despite the tremendous economic
damage.
Realizing the benefit and importance of
resilience planning, in the following four months
the City Council and City Manager instituted a
community engagement process and developed a
broader Recovery and Reinvestment Plan, being
implemented today, that is receiving national
recognition. Figure ES-2 shows a community
plan with floodways, levees, floodwalls, and dams to improve the resilience of the community to flood
events. That plan aims to improve overall quality of life within the community, including resilience to
flooding events. Communities with a vision for growth, stability, and resilience encourage economic
development, as Cedar Rapids has, even as they recover from a disaster.
The Community Resilience Planning Guide: How can it help? While more and more organizations –
domestic and international, public and private – are promoting community resilience to lower disaster
tolls, transforming this important concept to practice remains a work in progress. Working with public
and private stakeholders, the National Institute of Standards and Technology (NIST) developed this
voluntary Guide as a component of the President‘s Climate Action Plan. It offers a process for
communities to incorporate short- and long-term measures to enhance resilience.
This Guide helps connect good ideas and constructive actions for long-term community prosperity. In
addressing the how of resilience, the Guide is a tool that will help communities unify disaster risk
management, emergency response planning, and long-term community and economic development
planning.
Figure ES-1: Downtown Cedar Rapids, Iowa,
during the 2008 floods [Source: FEMA 2009]

Community Resilience Planning Guide for Buildings and Infrastructure Systems - Volume II
Executive Summary, Social Community Executive Summary
3
Figure ES-2: Cedar Rapids, Iowa Resilience Plan [adapted and redrawn, Cedar Rapids 2014]
The Guide describes a six-step planning process that helps communities develop customized resilience
plans by bringing together all relevant stakeholders, establishing community-level performance goals, and
developing and implementing plans to become more resilient. This approach focuses on the roles
buildings and physical infrastructure systems play in assuring social functions resume when needed after
a hazard event. (Social functions include government, business, healthcare, education, community
services, religion, culture, and media communications.) If a catastrophic event does occur, resilience
planning encourages and enables the community to have plans in place to recover and rebuild in a
thoughtful way. Such plans include coordinating with nearby communities as well as with state, regional,
and federal agencies.
The Guide can help a community take specific actions:
Build on, broaden, bridge, and integrate its current plans (e.g., economic, emergency
preparedness, land use) with community resilience plans, particularly for the built environment.
Identify risks, priorities, and pre- and post-event costs, including the consequences of not taking
certain actions.
Prioritize resilience actions for buildings and infrastructure systems, based on the specific hazards
the community is most likely to face and the importance of these buildings and infrastructure
systems in supporting key social functions.

Community Resilience Planning Guide for Buildings and Infrastructure Systems - Volume II
Executive Summary, Social Community Executive Summary
4
How do resilience plans fit in with other
community plans? Many disaster plans are
not well integrated with other community
plans, including the community‘s
comprehensive general plan or the
emergency operations plan. Planning for
resilience can and should build on other
community plans that are already in place.
A general plan addresses the long-range
goals and objectives for the local
government; emergency operations plans
prepare the community response to
emergencies. An integrated community-
level resilience plan seamlessly
incorporates steps for disaster preparedness
and recovery actions that will help them to
be resilient. Communities should ensure
that resilience is a common goal for all of
their planning.
Incorporating resilience planning as a
common goal usually will involve adding
specific performance goals for buildings
and infrastructure systems, and much more.
It requires detailed input and development
by a broad cross section of leaders and
stakeholders, both public and private. It
calls for understanding the community‘s
social, political, and economic systems, and
an understanding of how they are supported
by the built environment. What are their
vulnerabilities? How will damage to
buildings and infrastructure systems impact
community recovery? For buildings and
infrastructure systems, which may be either
publicly or privately owned and operated,
understanding their exposure to prevalent
hazards, and their anticipated performance
or possible improvement, is key.
Who should lead? Who should be
involved? Community resilience should be
championed by a planning team that
provides leadership and engages public,
non-profit, and private stakeholders, along
with the broader community throughout the
process (Figure ES-3). Much of the
building stock and infrastructure systems,
particularly in the energy and
communication sectors, are privately
owned, so stakeholder collaboration is
essential to successful planning.
Figure ES-3: Six-step planning process for community
resilience

Community Resilience Planning Guide for Buildings and Infrastructure Systems - Volume II
Executive Summary, Social Community Executive Summary
5
The local government is the logical convener for coordinating interests related to community resilience
because it is responsible for implementing community building codes, statutes, and community plans, and
can collaborate and coordinate with other entities. Many of the successful community resilience efforts to
date have been led by a community official working with a resilience team, established by the local
government, that collaborates with other public, non-profit, and private entities. Working groups with
representative stakeholders and subject matter experts develop recommendations. A dedicated community
resilience office, with a leading official who has supporting staff, can provide strong and consistent
leadership. But every community has different capabilities and resources, and each should approach this
process in a way that fits best within its style and means. In all cases, community leadership buy-in and
community stakeholder engagement are vital.
How does this Guide link a community’s social needs to its built environment? In the context of this
Guide, communities are places (such as towns, cities, or counties), designated by geographical
boundaries, that function under the jurisdiction of a governance structure. It is within these places that
most people live, work, find security, and feel a sense of belonging so they can grow and prosper. All
communities have social institutions to support the needs of individuals and households. They include
family, economic, government, health, education, community service, religious, cultural, and media
organizations.
Users of the Guide will assess their social
institutions and built environment, focusing on
their role and importance in community
resilience. Understanding how a community‘s
people, social institutions, and needs depend on
the built environment is key. When considering a
community‘s institutions and its reliance on the
built environment, it is important to consider the
vulnerabilities and needs of all segments of the
population. Using this Guide, resilience planners
will identify how people in their communities
depend on buildings and infrastructure systems to
support community recovery. They will establish
goals to sequence the recovery of functions after
a hazard event.
The built environment can suffer significant
damage during a hazard event. Depending on the
event‘s severity, many people could be ill-
prepared to manage on their own, especially for
an extended period of time. To support vital social needs, such as emergency response and
acute/emergency healthcare, communities need to determine in advance which buildings and
infrastructure systems are most essential and must be functional during and immediately after a hazard
event. They also need to determine if and how the rest of the built environment can return to functionality
in the subsequent days, weeks, and months of recovery.
Determining Community Resilience Goals and Objectives. Communities should establish long-term
resilience goals to guide resilience planning, prioritize activities, and develop implementation strategies.
For example, a community may wish to develop improved infrastructure to attract new business. Or, it
may want to increase social well-being by redeveloping a floodplain to become a community park, while
also providing natural protection from flooding. With long-term community resilience goals identified,
communities can identify related performance goals for those buildings and physical infrastructure
systems that are relied upon for important social services.
Examples of how community members depend on
the built environment:
The need for housing and healthcare is
universal.
Children need school buildings.
Neighborhoods need retail districts.
Businesses need suitable facilities,
functioning supply chains, delivery
networks, and a workforce that is readily
available.
Everyone needs a transportation network,
electricity, fuel, water, wastewater
systems, and communication/information
access.

Community Resilience Planning Guide for Buildings and Infrastructure Systems - Volume II
Executive Summary, Social Community Executive Summary
6
One key question that this Guide prompts and helps community leaders to answer is, ―When do the
buildings and infrastructure systems that support each social institution need to be restored before
adversely affecting the community‘s longer-term ability to serve its members?‖ The Guide assists in
determining the desired time and sequence for restoring community functions.
To determine how the community‘s built environment would fare, planners need to estimate the
anticipated performance of the community‘s existing buildings and infrastructure systems for the most
likely hazards. Many communities may have identified prevailing hazards when developing plans for
natural hazard mitigation, emergency operations, continuity of operations, or Threat and Hazard
Identification and Risk Assessment (THIRA).
This Guide encourages communities to use three
hazard levels – routine, design, and extreme – to
address a range of potential damage and
consequences. Evaluation of three hazard level
help communities to develop comprehensive
resilience plans. When codes do not define design
hazard levels (e.g., wildfire or tornadoes), the
community may establish a hazard level or
scenario based on available guidance. A
community‘s resilience plan should be anchored
around the design event, but routine and extreme
events also should be evaluated to ensure that the
community is planning comprehensively for a
range of possibilities.
The difference between the built environment‘s
anticipated performance today and its desired performance in the future constitute the critical gaps in
performance. Those gaps, then, guide development of solutions and strategies to meet long-term
community goals and specific desired performance goals for the built environment. Simply identifying
those gaps is an important outcome for users of this Guide.
Determining feasible, effective solutions to fill those gaps is critical. This Guide encourages considering
administrative options, like incorporating resilience principles into other community plans (e.g., land use
planning and mutual aid agreements). Such options frequently cost less and often can be put into place
more quickly than construction options, which take longer to implement but can be equally important.
Once they identify, evaluate, and recommend potential solutions, users of this Guide will prepare a formal
community resilience plan based on the information gathered by the planning team and present that plan
for review and discussion by stakeholders and the community. When it is finalized and approved, the
resilience plan should to be put into action, reviewed periodically, and maintained.
Community Resilience in Six Steps: Figure ES-3 summarizes the six basic planning steps recommended
by this Guide, with additional detail available in Table ES-1. Volume I further develops these six basic
planning steps and other key activities. The Community Resilience Planning Example in Chapter 9
(Volume I) provides an example of community planning in Riverbend, USA, a fictional city that uses the
Guide. That example walks through each of the six steps and illustrates how communities can effectively
use the Guide. Volume II presents supporting information and resources regarding the social dimensions
of resilience and dependencies between and among buildings and infrastructure systems (e.g., energy
systems, transportation systems, communication systems, and water and wastewater systems).
Essential ingredients: time, commitment, and engagement. Improving community resilience takes time
to plan and implement and for benefits to accrue – sometimes decades. Because priorities differ from one
community to another, resilience should be addressed at varying levels of detail to suit the size,
Three hazard levels used in this Guide:
Routine hazard events are more frequent,
less consequential events that should not
cause significant damage.
Design hazard events are used to design
structures; design loads are specified in
building codes for many natural hazards.
Extreme events may also be defined in
building codes for some hazards; they are
the most likely to cause extensive
damage.
Community Resilience Planning Guide for Buildings and Infrastructure Systems - Volume II
Executive Summary, Social Community Executive Summary
7
capability, and uniqueness of each community. However resilience also is furthered when communities
cooperate with neighboring and regional jurisdictions, especially when services are shared.
Above all, identifying goals and objectives and achieving community resilience requires initiative and
support from community leadership; broad community engagement that includes focus and persistence;
and a willingness of public and private stakeholders to assess candidly the interplay of hazard events,
social institutions, governance, economics, and the community‘s buildings and infrastructure systems.
This Guide offers a practical way forward for community leaders. They should review this approach with
potential stakeholders – and then take action. Simply beginning the process will advance a community‘s
understanding of its situation, what is possible, and how its resilience can be improved.

Community Resilience Planning Guide for Buildings and Infrastructure Systems - Volume II
Executive Summary, Social Community Executive Summary
8
Table ES-1: Planning steps and key activities for community resilience
Planning Steps Key Activities
1. Form a
Collaborative
Planning Team
(Chapter 2)
Identify resilience leader for the community
Identify team members, and their roles and responsibilities
Identify key public and private stakeholders for all phases of planning and
implementation
2. Understand the
Situation
(Chapter 3)
Social Dimensions –
Identify and characterize functions and dependencies of social institutions, including
business, industry, and financial systems, based on individual/social needs met by
these institutions and social assets and vulnerabilities
Identify how social functions are supported by the built environment
Identify key contacts and representatives for evaluation, coordination, and decision
making activities
Built Environment –
Identify and characterize buildings and infrastructure systems, including condition,
location, and dependencies between and among systems
Identify key contacts/representatives for evaluation, coordination, and decision
making activities
Identify existing plans to be coordinated with the resilience plan
Link social functions to the supporting built environment
Define building clusters and supporting infrastructure
3. Determine
Goals and
Objectives
(Chapter 4)
Establish long-term community goals
Establish desired recovery performance goals for the built environment at the community
level based on social needs, and dependencies and cascading effects between systems
Define community hazards and levels
Determine anticipated performance during and after a hazard event to support social
functions
Summarize the results
4. Plan
Development
(Chapter 5)
Evaluate gaps between the desired and anticipated performance of the built environment
to improve community resilience and summarize results
Identify solutions to address gaps including both administrative and construction options
Prioritize solutions and develop an implementation strategy
5. Plan
Preparation,
Review, and
Approval
(Chapter 6)
Document the community plan and implementation strategy
Obtain feedback and approval from stakeholders and community
Finalize and approve the plan
6. Plan
Implementation
and
Maintenance
(Chapter 7)
Execute approved administrative and construction solutions
Evaluate and update on a periodic basis
Modify short or long-term implementation strategy to achieve performance goals as
needed

Community Resilience Planning Guide for Buildings and Infrastructure Systems - Volume II
Understanding and Characterizing the Social Community, Social Community Executive Summary
9
10. Understanding and Characterizing the Social Community
Social Community Executive Summary
In the context of this Guide, communities are places, designated by geographical boundaries – such as
towns, cities, or counties – that function under the jurisdiction of a governance structure. People are the
foundation of any community. Within these places people live, work, find security, and feel a sense of
belonging so they can grow and achieve. A community consists of individuals and households, each with
unique characteristics and needs.
Communities attempt to organize themselves to meet the needs of their members. Social institutions are
one way to view a community‘s organization. A community typically consists of eight different social
institutions that exist to meet community member needs – 1) family/kinship; 2) the economy; 3)
government; 4) health; 5) education; 6) community service organizations; 7) religious, cultural and other
organizations that support belief systems; and 8) the media.
The built environment in any community includes its buildings and infrastructure systems. When a hazard
event occurs, damage to the built environment can make it difficult for a community‘s institutions to
function and meet members‘ needs. While some social institutions rely more heavily on the built
environment than others, there are linkages between the social and built environments that need to remain
strong for a community to thrive. This Guide is based upon the foundation that the social and economic
functions of a community drive the requirements of the built environment.
The Guide outlines a methodology to plan for resilience by prioritizing buildings and infrastructure
systems based on their importance in supporting social and economic functions in the community.
Characterizing the community, including both the community‘s social and built environments, is an
integral stage of this process. This chapter provides the context and tools to guide the community‘s
planning team in characterizing the social dimensions of their community.
Before a community begins to characterize its social dimensions, however, it should identify leaders from
the community‘s population, groups, and organizations for inclusion into the planning team. This chapter
begins by discussing the importance of community engagement in this process.
Understanding and characterizing the social community first involves characterizing its members and
their needs, now and in the future. Information on the types of data that can be gathered about the
population is used to construct a snapshot of current conditions and of the future. Information on the
needs of community members is also required. This chapter discusses needs of community members in
the context of Maslow‘s hierarchy, acknowledging that some needs are more urgent than others.
Additionally, the importance of identifying social capacities and vulnerabilities among the population is
discussed. The needs of everyone likely to be affected in a hazard event (or on a day-to-day basis) may
not be equitably addressed, such as older adults, people living in poverty, racial and ethnic minority
groups, people with disabilities, and those suffering from chronic illness.
This chapter also focuses on the social institutions that exist within a community to meet the needs of
community members. Each chapter section is devoted to one of the eight institutions listed above –
summarizing the socially based purposes and functions each serves in communities, as well as the human
needs it meets. The chapter also guides communities through the process of identifying the ways in which
dependencies exist among and within social institutions, and the links between social institutions and the
built environment. Linkages between the social and built environments are particularly important since
they guide the team to develop community-wide resilience goals for their social institutions that will, in
turn, drive development of similar performance goals for the built environment.

Community Resilience Planning Guide for Buildings and Infrastructure Systems - Volume II
Understanding and Characterizing the Social Community, Introduction
10
10.1. Introduction
Achieving community resilience is a social process. This Guide gives communities a methodology to plan
for resilience by prioritizing buildings and infrastructure systems based on their importance in supporting
the social and economic functions in the community. Figure 10-1 illustrates this concept.
Figure 10-1: The social and economic functions of a community define the functional requirements of
the community’s buildings and infrastructure systems.
The Guide describes a six-step process communities can follow to increase community resilience. The
first step is forming a collaborative planning team (see Chapter 2 of Volume I). Therefore, Section 10.2
discusses the importance of community engagement when planning for resilience. In the second step, the
planning team, which includes community leaders, characterizes the social dimensions of the community
– i.e., the social and economic functions of a community that are in place to meet community member
needs (see Chapter 3 of Volume I). This chapter provides context and tools to guide the planning team in
characterizing the social community. The steps to characterize the social community are:
1. Characterize community members and their needs (current and future). This process includes
identifying community population demographics and their geographic locations within the
community, social vulnerabilities and inequities within the population, the needs of community
members, and the community‘s economic profile. Additionally, the community should project the
long-term growth/needs of community members.
2. Identify social institutions/systems within the community, including their functions, the needs
they meet, and any gaps in capacity that can be reduced by a change/improvement to the built
environment.
3. Identify any dependencies among and within social institutions.
4. Identify key social- and economic-based community metrics; i.e., methods of tracking success of
planning efforts and improvements made to achieve community resilience.
Once both the social and built communities are characterized, it is important that the planning team
identify the dependencies of the social institutions on the built environment (discussed in Section 10.7).
This chapter ends by offering examples of resilience goals communities might set for their social
institutions that can be used to develop performance goals for the built environment (Section 10.8 and
Chapter 4 of Volume I).

Community Resilience Planning Guide for Buildings and Infrastructure Systems - Volume II
Understanding and Characterizing the Social Community, Social Capital and Community Engagement
11
10.2. Social Capital and Community Engagement
The report, Disaster Resilience: A National Imperative, highlights the need for a paradigm shift in the
United States to a new ―culture of disaster resilience‖ [The National Academies 2012]. In this report,
social capital is included among other social factors such as health and socioeconomic status, that
influence a community‘s ability to prepare for, respond to, and recover from disaster. Since 2006,
published research on the importance of social capital in disaster resilience has increased dramatically
[Aldrich and Meyer 2014; Ritchie and Gill 2007].
The term ―social capital‖ refers to social networks, the reciprocity and trust generated by them among
individuals, groups, and communities, and the value of these social networks for achieving mutual goals
[Schuller, Baron, and Field 2000]. Similar to cultural capital, social capital reflects the convergence of
shared values in a community. It is especially valuable because it enhances a community‘s ability to work
toward collective goals—many of which include an increase in other forms of capital. As Putnam [2000]
notes, social capital ―greases the wheels that allow communities to advance smoothly.‖ At the most basic
level, social capital facilitates information sharing, serves as a conduit for providing social support, and
enhances the capacity for collective action. Recently, the importance of social capital has been
demonstrated in hazard and disaster research.
Social capital can contribute to resilience by enhancing the sense of belonging and strengthening bonds
between individuals and groups within communities. This potential increases when civic engagement
involves multiple and diverse sets of stakeholders. As noted in the 2012 National Academies report,
―Building resilience in the face of disaster risk can also have benefits for a community even in the
absence of a disaster in advancing social capital for dealing with more mundane community challenges‖
[The National Academies 2012].
Community engagement is an important aspect of a community‘s social capital. It is important that the
planning team identify and actively engage with individuals in the community planning process who
represent the diverse views and needs within the community. People live, work, learn, and play within a
community and, therefore, need to have a voice in the community‘s planning process. Communities may
wish to invite individuals who are already actively engaged in other community-based activities, not
necessarily related to resilience. In addition, communities may wish to identify individuals who are highly
connected and engaged with neighborhood, business, or community groups. These individuals can help
represent particular group perspectives/interests that become important as resilience improvements are
proposed through the planning process.
For communities to become engaged in the pursuit of resilience, there needs to be a collective belief in
the potential threat from hazard(s) and the value of investing in resilience. These beliefs and values also
reflect the level of risk a community is willing to tolerate. This level of risk is usually based on experience
and available science. Communities rely on science and engineering to present hazard probabilities and
design options for reducing or avoiding exposure to community hazards. Scientists, engineers, and
decision makers need to have a common understanding of purpose, roles, responsibilities, and limitations
as they relate to potential disasters and the means to plan, detect, notify, and respond to threats.
By going through the resilience planning process, communities can better understand how their decisions
result in an increased or decreased level of risk from potential hazards. They can also identify
opportunities to reduce future losses through mitigation and recovery strategies. Ideally, resilience
planning will help communities demonstrate credible investments toward improved quality of life during
and after design-level hazards. Planning can support expedited recovery following extreme hazard events
and take advantage of recovery and reconstruction opportunities.

Community Resilience Planning Guide for Buildings and Infrastructure Systems - Volume II
Understanding and Characterizing the Social Community, Community Members and Their Needs (Now and
in the Future)
12
10.3. Community Members and Their Needs (Now and in the Future)
The Community & Regional Resilience Institute‘s (CARRI) Community Resilience System (CRS)
[CARRI 2013] equates characterizing the social community to defining the community‘s identity.
Characterization involves:
Analyzing existing data, or possibly collecting data, on community demographics and their
geographic locations, and economic indicators
Identifying social assets, capacities (i.e., social capital), vulnerabilities, and inequities within the
population
Recognizing the needs of different groups in the community
Since resilience involves long-term planning and decision-making, community leaders could begin by
identifying the ways in which community demographics, capacities, vulnerabilities, and specific local
needs may change over time.
A population‘s identity, from a social perspective, may differ greatly from one community to another. It is
important that a community examine data on the demographics of their community members, including
age, education, gender, income, ethnicity, employment rates, rates of insurance coverage, special needs
groups, and other important variables. Much of these data are available without cost from federal
agencies, e.g., U.S. Census Bureau [2015], but locally-specific data can also be collected via surveys,
questionnaires or interviews or focus groups with community members. Data should also be used to
create a business or industry profile of the community, e.g., the percentage of the community‘s economy
occupied by each type of industry. By understanding these aspects of their community, community
leaders can begin to identify local capacities, as well as social vulnerabilities, and in turn, the specific
needs of community members.
10.3.1. Social Vulnerabilities
When assessing a community‘s population, it is important to recognize and address social vulnerability.
Not all people use community systems or have access to community systems in the same ways. Therefore,
the needs of everyone likely to be affected in a disaster (or on a day-to-day basis) – such as older adults,
people living in poverty, racial and ethnic minority groups, people with disabilities, and those suffering
from chronic illness – may not be met. In addition, renters, students, single-parent families, small
business owners, culturally diverse groups, and residents of historic neighborhoods may not be adequately
represented [Phillips et al. 2009]. Therefore, interactions of individuals/households with community
systems can introduce inequities among certain subpopulations of a community.
These inequities tend to worsen in and following a hazard event. Specifically, a large and growing body
of empirical research on hazards and disasters shows that risk is not distributed or shared equally across
all groups [Bullard and Wright 2009; Phillips et al. 2009; Tierney 2014; The National Academies 2012;
The Institute of Medicine 2015]. Pre-disaster vulnerability, inherent in social institutions, may negatively
impact response, recovery, and resilience following a disaster event. For example, some individuals and
groups face greater risks than others based upon where they are located in the community, the buildings in
which they live or work (e.g., inferior housing), or having to rely only on public transportation. These
groups are also less likely to be included in the political process, and often have little voice in disaster
planning, response, and recovery activities.
Vulnerability is highlighted here to ensure all community members and their resources (or lack of
resources) are considered when planning for resilience. Community leaders should identify those
populations who are most affected – not only in and after a disaster, but also on a day-to-day basis – to
make resilience-based decisions that improve the life-safety and well-being of all community members.

Community Resilience Planning Guide for Buildings and Infrastructure Systems - Volume II
Understanding and Characterizing the Social Community, Community Members and Their Needs (Now and
in the Future)
13
Communities can assess their social vulnerability using a variety of tools, including the Social
Vulnerability Index [University of South Carolina 2013]. Further information on vulnerable populations
is available in Phillips et al. [2009] and Tierney [2014].
10.3.2. Needs of Community Members
Individuals and households in any community
have a set of needs they strive to meet on a daily
basis. Figure 10-2 presents a generalized
hierarchy of individual and household needs,
which may require further adaptation and
specification by each community. The figure
shows the most fundamental needs at the bottom
(survival), followed by safety and security,
belonging, and growth and achievement needs
[Maslow 1943]. While all needs are important, the
hierarchy shows that some needs are more urgent
or time sensitive than others, a concept that is
particularly useful in the context of recovery and
resilience. Although there are more detailed
conceptual models that discuss human needs [e.g.,
see Max-Neef, Elizalde, and Hopenhayn 1991],
this approach – adapted from Maslow‘s Hierarchy
of Needs – captures the most essential dimensions
with which this chapter is concerned.
The first and most fundamental need is that of
survival. Survival includes necessary physical
requirements, such as air, water, food, shelter, and
clothing. If these needs are not met, the human body cannot sustain life – people cannot live longer than 5
days without water and 6 weeks without food, assuming an adequate water supply [Lieberson 2004].
Survival also includes protection of life from hazard events.
The second need, safety and security, includes all aspects of personal, financial (economic) security, and
health and well-being. People require safety and security in their personal lives from situations of
violence, physical and verbal abuse, war, etc. They also must know their families and friendship networks
are secure. Individuals need financial safety (e.g., job security, a consistent income, savings accounts,
insurance policies, and other types of financial safety nets). Studies of disasters during the recovery phase
[Dickenson 2013; Binder 2014] show that people are likely to relocate to another community in search of
new employment [Sanders et al. 2003; Fraser et al. 2006; Hunter 2005] or economic gain, such as higher
wages [Belcher and Bates 1983], or because they lost access to their non-liquid assets, such as farm land
or fishing boats [Black et al. 2008; Gray et al. 2009]. These studies emphasize the importance of
providing employment and financial security to those within a community. Finally, people require safety
from negative health conditions, so they can enjoy life and consistent well-being in their communities.
The third need is belonging. This need represents belonging and acceptance among various groups of
people (e.g., family, friends, school groups, sports teams, work colleagues, religious congregation) or
belonging to a place or location. In relation to groups of people, experts often discuss the concept of
social capital within a community. Social capital describes the networks and relationships that connect
members of a community, including the extensiveness and interconnectedness of social networks within
the community, levels of civic engagement, and interpersonal, inter-organizational, and institutional trust
Figure 10-2: The hierarchy of human needs
(Adapted from Maslow’s Hierarchy of Needs – a
psychological perspective [Maslow 1943])
Growth&
Achievement
Survival
Safety and Security
Belonging
Life, food, water, shelter, clothing
Law and order, stability, employment, health
Family/friends/neighborhood
Achievement, recognition, fulfillment

Community Resilience Planning Guide for Buildings and Infrastructure Systems - Volume II
Understanding and Characterizing the Social Community, Social Institutions within the Community
14
[The National Academies 2006; Aldrich and Meyer 2014]. The importance of a sense of belonging within
a community has been demonstrated by research into community recovery, which shows that the
likelihood of people leaving a community increases when social networks are lost [Sanders et al. 2003].
Research also demonstrates that individuals benefit from a strong sense of belonging to a place, which
inhibits their desire to relocate after a hazard event [Groen and Polivka 2010; Cutter et al. 2014]. A strong
place attachment or sense of belonging to a place can be influenced by, for example, home ownership or
having strong, extensive social networks within the community.
The fourth need is growth and achievement. Humans need to feel a sense of achievement and that they are
respected in society. In Figure 10-2, this need is accompanied by continual growth and exploration within
society, including an individual‘s ability to realize his/her full potential – to accomplish all that he/she can
– within his/her lifetime. Although this need may seem less tangible than others, growth and achievement
are as important as other needs, often being accomplished through educational achievement and
participation in arts and recreation.
Maslow‘s hierarchy, supported by research studies of hazard event recovery, identifies the functions that
must be maintained in a resilient community [Arup 2014]. For example, based on the hierarchy of needs,
a resilient community:
Safeguards human life
Delivers basic needs
Provides safety and security from a personal, financial, and health/well-being perspective
Facilitates human relationships and identification (with groups and to a place)
Supports growth and achievement
However, all communities are different and meet these needs in different ways through their social
institutions.
10.4. Social Institutions within the Community
Characterizing the social community also involves identifying the social institutions, including their
functions, the needs they meet, and any gaps in capacity that can be remedied by a change or
improvement to the built environment. A social institution is a complex, organized pattern of beliefs and
behaviors and can include family, education, government, religion, economy, each of which is
overlapping and interdependent. The purpose of social institutions is to meet the basic individual and
household needs.
This section describes eight social institutions to guide communities in understanding their own set of
social institutions. Sections 10.4.1 through 10.4.8 summarize the socially-based purposes and functions
each institution serves in communities, as well as the human needs they meet in the context of Maslow‘s
hierarchy. The eight institutions described in this chapter include:
Family and Kinship 1.
Economic (i.e., business and commerce) 2.
Government 3.
Health 4.
Education 5.
Community Service Organizations 6.

Community Resilience Planning Guide for Buildings and Infrastructure Systems - Volume II
Understanding and Characterizing the Social Community, Social Institutions within the Community
15
Religious, Cultural, and Other Organizations that Support Belief Systems 7.
Media 8.
Although ad hoc groups can form both within and outside of these social institutions after a hazard event,
this section presents the ways a community is typically organized for its day-to-day functions.
10.4.1. Family and Kinship
Family is the first institution to which we are exposed. Within a family, an individual can learn about the
world and the importance of love, care, and a sense of belonging. The family unit is typically defined as
―a relationship between two or more people who are related by birth, marriage, or adoption.‖ However, it
is difficult to define fully what is meant by the term ―family,‖ since our understanding varies across
cultures and over time. We might consider only those within our family of origin as part of our family
unit, even limiting the family unit to those living in the same residence [Nam 2004]. More often,
however, our definition of family broadens to include extended family members (e.g., grandparents,
aunts, uncles, and cousins), or even long-time friends, friends of family, or other individuals who are not
related by blood or marriage. Tight, close-knit bonds are developed within family/kinship units that,
among other factors, can determine a community‘s level of resilience in response to a hazard event.
Proximity of family members to one another is also an important consideration. Family members may
live within the same residence or different residences within the same community, providing larger
numbers of close-knit groups within a community to respond and recover from an event. In other cases,
family members may live in different geographical parts of the world. While such distance may decrease
the opportunity for social capital, it provides additional sheltering options to family members who wish to
evacuate a community that has been disrupted by a hazard event, either temporarily or permanently.
Family or kinship units exist to support all human needs in Maslow‘s hierarchy, from very basic needs to
the need for growth and achievement. The family or kinship unit is responsible for providing support and
resources to meet survival, safety/security, belonging/acceptance, and growth/achievement needs.
10.4.2. Economic
Economic institutions facilitate allocation of scarce resources across society. Producers and suppliers
combine factors of production (e.g., land, labor, and capital) to create goods and services that meet the
needs and desires of consumers. The availability of production factors, along with the demand of
consumers, determines the final mix of goods and services produced, supplied, and consumed.
The economy is a mechanism by which most human needs are satisfied. While not all needs are provided
for, the economy produces goods and services that fulfill some element of survival, safety and security,
belonging, and growth and achievement from Maslow‘s hierarchy. Some needs are met through the direct
consumption of goods and services, such as food and shelter. Other needs are satisfied as a result of a
functioning economy. For example, employment affords individuals the means to provide, but also can
afford opportunities for career growth and achievement. Further, many commercial and for-profit venues,
such as shopping malls, barbershops, and restaurants, facilitate the social gatherings of individuals with
shared interests and life experiences, providing people with a sense of belonging. It is obvious then, that
the pursuit of economic interests also creates values that have no market; yet, it is also vulnerable to
disruptive events.
Good Production and Service Supply. Industries within the economy are classified by their production or
supply role. Three economic sectors exist:

Community Resilience Planning Guide for Buildings and Infrastructure Systems - Volume II
Understanding and Characterizing the Social Community, Social Institutions within the Community
16
Primary Economic Sector – Producers of raw materials, such as the agriculture, forestry, fishing,
and mining industries. In 2011, these industries represented 3.9 % of U.S. gross domestic
product.1
Secondary Economic Sector – Producers of goods, such as the manufacturing and construction
industries. In 2011, these industries represented 15.8 % of U.S. gross domestic product.
Tertiary Economic Sector – Suppliers of services, such as utilities, wholesale and retail trade,
transportation and warehousing, information, financial activities, professional and business
services, education services, health care and social assistance, leisure and hospitality, other
services, and federal, state, and local government. In 2011, these industries represented 80.3 % of
U.S. gross domestic product.
Labor Supply. Of the 316 million people in the U.S. reported by the U.S. Census Bureau‘s 2013
Population Estimates, approximately 144 million were employed (Table 10-1). According to the 2013
American Community Survey, 96.3 % of employees worked in their state of residence; however 23.8 %
worked outside their county of residence [United States Census Bureau 2015]. For some communities
(located within a county), an even larger percentage of employees may work outside their communities‘
jurisdictional boundaries. Therefore, it is likely that a hazard event that affects a particular community
will not affect the community‘s entire workforce.
Around 11 million persons, aged 16 and over, were unemployed (Table 10-1). Industries that have low
unemployment and/or require highly trained and skilled employees, might find it difficult to handle a
disruption from a hazard event that displaces their employees.
Consumer Demand. In 2013, according to the Bureau of Economic Analysis, National Income and
Product Accounts Tables on Gross Domestic Product, personal consumption expenditures amounted to
$11.5 trillion or 68 % of GDP, investment amounted to $2.6 trillion (16 % of GDP), government
consumption amounted to $3.1 trillion (19 % of GDP), and net exports were -$508.2 billion [Bureau of
Economic Analysis 2013]. As seen in Table 10-2, approximately a third of personal consumption
expenditures went toward goods, while the rest went towards services. Consumers purchase and use
goods and services from vendors within their community, while away on business or vacation (tourism),
and online.
A hazard event may affect consumer demand. Those sectors that serve tourism may experience a decrease
in consumption expenditures. Additionally, the economy might see an increased demand in the
construction industry, if a significant number of commercial or residential buildings require repair or a
rebuild.
10.4.3. Government
Laws, regulations, and services provided by the government protect life and property, preserve peace and
well-being, strengthen group identity and norms, and define social and economic goals for the future. In
response to a disruptive event, for example, the government may provide for many of Maslow‘s needs,
starting with the necessities of food, water, and shelter and extending through safety and security. (See
Section 1.6 in Volume 1, Other Federal Activities Supporting Resilience, for a broader discussion of
current federal programs that support community resilience.) However, the governmental entity providing
service may shift following a hazard event to support recovery from federal to local (or vice versa), or
even necessitate change from private to public, for example. Such shifts could alter local reliance on the
built environment.
1 Gross domestic product (GDP) is the market value of goods and services produced by labor and capital in a country. In 2011,
U.S. GDP measured $15.5 trillion (Bureau of Economic Analysis 2013)

Community Resilience Planning Guide for Buildings and Infrastructure Systems - Volume II
Understanding and Characterizing the Social Community, Social Institutions within the Community
17
Table 10-1: U.S. employment characteristics, 2013 [Source: Bureau of Labor Statistics 2015]
Employed
(Thousands)
Unemployed
(Thousands)
Average
Weekly
Hours
Average Hourly
Earnings
(Dollars)
Agriculture and related 2 130 141 - -
Mining, quarrying, and oil and gas extraction 1 065 64 43.90 29.73
Construction 9 271 935 39.00 26.12
Manufacturing 14 869 1 019 40.80 24.35
Wholesale and retail trade 19 653 1 463 35.05* 22.13*
Transportation and utilities 7 415 406 40.45 ** 28.77 **
Information 2 960 175 36.70 32.90
Financial activities 9 849 424 37.10 30.15
Professional and business services 16 793 1 284 36.10 28.52
Education and health services 32 535 1 098 32.70 24.44
Leisure and hospitality 13 554 1 379 26.00 13.50
Other services 7 127 445 31.70 21.40
Public administration/government 6 708 851 - -
Self-employed, family, and other - 1 774 - -
Total 143 929 11 458 - -
* Average of wholesale trade and retail trade ** Average of transportation/warehousing and utilities

Community Resilience Planning Guide for Buildings and Infrastructure Systems - Volume II
Understanding and Characterizing the Social Community, Social Institutions within the Community
18
Table 10-2: Consumption expenditures as a percent of total, by type of product [Source: Bureau of
Economic Analysis 2013]
Goods 34% Services 66%
Durable goods: 11% Household consumption: 64%
Motor vehicles and parts 4% Housing and utilities 18%
Furnishings and household equipment 2% Health care 17%
Recreational goods and vehicles 3% Transportation services 3%
Other durable goods 2% Recreation services 4%
Nondurable goods: 23% Food services and accommodations 6%
Food and beverages (off-premises) 8% Financial services and insurance 7%
Clothing and footwear 3% Other services 9%
Gasoline and other energy goods 4% Consumption expenditures of nonprofit
institutions serving households
3%
Other nondurable goods 8%
Local governments, which are the focus of this Guide, are made up of general and specific purpose
entities, and vary in terms of autonomy. For instance, some communities have complete autonomy to
adopt codes and develop statutes, while others are restricted by state regulations. General purpose entities
include county, municipal, and township governments. Specific purpose entities are more singular in
function (e.g., school districts). In 2012, there were 90,059 local governments, with 43 % serving a
general purpose [Hogue 2013].
Community Development. Community development is a major issue for local communities, as local
governments strive for a vibrant and thriving economy. Community development largely consists of
attracting and retaining businesses and jobs, enhancing local amenities, addressing poverty and inequity,
and maintaining the quality of the local environment. Often communities hope that improving local
amenities will indirectly attract and retain businesses and jobs. Providing local services, such as schools,
roads and public safety, is a core function of local governments. Public safety and roads directly impact
the resilience of a community in the face of hazards. Quality schools serve as an amenity that can attract
jobs and businesses. Communities that cannot attract and retain businesses and jobs tend to fare more
poorly after hazard events than communities that can do so.
For most cities, local revenue sources consist of some combination of property and sales tax. A sales tax
revenue base is maintained by attracting commercial businesses and jobs. The property tax revenue base
is dependent on property values, which can be supported by improving disaster resilience, since disaster
risk is negatively correlated with home sale prices [Gilbert 2010].
Poverty. Poverty is also a major concern for local communities. Many projects communities pursue are
aimed at decreasing poverty in their neighborhoods; and many external funding sources available to
communities are aimed at alleviating poverty. These issues intersect with disaster resilience in that the
disadvantaged are often most vulnerable to the consequences of hazard events. Improving resilience often
starts with protecting the disadvantaged.

Community Resilience Planning Guide for Buildings and Infrastructure Systems - Volume II
Understanding and Characterizing the Social Community, Social Institutions within the Community
19
Environmental Stewardship. Local governments are often interested in ensuring their communities are
good environmental stewards by protecting and improving their environments. Being green and
maintaining a small ecological footprint are important to many local communities. In turn, these efforts
can impact community resilience (see Chapter 17).
10.4.4. Health
Health is a ―state of complete physical, mental and social well-being and not merely the absence of
disease or infirmity‖ [World Health Organization 1948]. There are differences in the unit (or level) of
health care. Public health focuses on health at the community level, whereas health care services typically
are provided to individuals and families within a community. This section discusses both levels of health
services.
Public health involves the actions taken, as a society, to collectively ―… assure the conditions in which
people can be healthy‖ [Division of Health Care Services, Institute of Medicine 1998; Centers for Disease
Control and Prevention 2014]. Overall, the goals of public health are to: 1) prevent epidemics and the
spread of disease, 2) protect people from environmental hazards, 3) prevent injury, 4) promote and
encourage healthy behavior, 5) assist communities in disaster response and recovery, and 6) assure quality
and accessible health services. The public health system provides many essential services, including:
monitoring health status of a community, informing and educating individuals on health risks and
protective behaviors, developing policies and plans to promote healthier communities, enforcing laws and
regulations, fostering community partnerships, evaluating current health services, and conduct research.
Public health departments exist at the federal, state, local and tribal levels. This chapter addresses the
local and tribal health departments. In some places, local health departments exist as an entity within the
local government, and may make most of the decisions for community public health. However, in other
places, local health departments are led by state governments or governed by both state and local
authorities. Frequent activities engaged in by local health departments include immunization provisions,
infectious disease surveillance, tuberculosis screening, food service establishment inspection, and food
safety education, some of which may become increasingly important after a hazard event occurs.
At the individual or family level, health care services promote, monitor, maintain, and restore health.
According to the World Health Organization, regardless of how they are organized, all health systems
need to address six basic functions: 1) provide health services; 2) develop health workers; 3) develop a
functioning health information system; 4) provide equitable access to essential medical products,
vaccines, and technologies; 5) mobilize and allocate finances; and 6) ensure leadership and governance
[World Health Organization 2007].
The health care institution primarily meets the survival, and safety and security needs of Maslow‘s
hierarchy. However, a community may consider that, through obtaining a higher level of well-being for
its members, a strong community-based health care system can assist with the need for belonging as well
as growth and achievement.
Health care systems consist of a complex and diverse set of players. Many individuals and organizations
are involved in the health care system, including educational and research institutions, medical suppliers,
insurers, health care providers, payers (e.g., commercial insurers and employers), claims processers, and
regulators, and policy makers [Shi and Singh 2008]. Within the health care system, many of these groups
can fall under other institutions that are discussed in this section, including education, the economy, and
government.
The different types of services delivered by health care providers within a community, however, are
unique to the healthcare institution [Centers for Disease Control and Prevention 2014; Association for
Prevention Teaching and Research 2015]:

Community Resilience Planning Guide for Buildings and Infrastructure Systems - Volume II
Understanding and Characterizing the Social Community, Social Institutions within the Community
20
Preventative care. Aims to prevent future injury or illness, including blood pressure screening,
diabetes and cholesterol tests, cancer screenings, counseling on topics such as quitting smoking or
losing weight, routine vaccinations, counseling, screening and vaccinations to ensure healthy
pregnancies, and flu shots [U.S. Department of Health and Human Services 2015]
Primary care. Provides integrated health care services aimed at providing the patient with a broad
spectrum of preventative and curative care over a period of time [MedicineNet.com 2015]
Specialized care. Provides specialized care by physicians trained in a particular field (e.g.,
neurology, cardiology, dermatology, etc.), usually upon referral from primary care [Johns
Hopkins Medicine 2015]
Chronic or long-term care. Addresses pre-existing or long-term illness
Sub-acute care. Provides care for patients who do not require hospital care (acute care), yet need
more intensive skilled nursing care [California Department of Health Care Services 2014]
Acute care. Addresses short-term or severe illness with a shorter timeframe (i.e., emergency care)
Rehabilitative care. Aids a person in restoring lost skills or function from an injury or illness
(physical or mental)
End-of-life care. Provides care for those facing a life-limiting illness or injury
Mental or behavioral health care. Treats health conditions that ―are characterized by alterations
in thinking, mood, or behavior (or some combination thereof) associated with distress and/or
impaired functioning‖ [U.S. Department of Health and Human Services 1999] including
treatment for addiction/substance abuse
Home health care. Provides a wide variety of services for illness and injury that can be given to
individuals within their home.
Elements of each of these services can include prescribing medication to patients, highlighting the
increasing importance of pharmacy services and staff, which also provide individual care in many cases,
and the provision of durable medical equipment.
The urgency of care is one important difference among all health care services. Some services, for
example, acute and chronic or long-term care (i.e., assisted living facilities, nursing homes, adult homes),
provide patients with critical, life-saving care on a day-to-day basis. Each community should assess health
care services provided to its members, with an understanding that a hazard event may affect the demands
and provision of services for injuries and emotional trauma of residents and the labor force, and assign
priority to those services rated as most critical.
10.4.5. Education
Education is the primary social institution dedicated to the transfer of knowledge, skills, and values from
one individual or group to another. Typically, when one thinks of education, formal education comes to
mind. Formal education can begin in nursery school, and continues through primary and secondary
school, often referred to as elementary, middle, and high schools. This education may take place in
public, private, or home school settings. Formal education also includes higher education in colleges and
universities.
Knowledge, skills, and values transfer in other ways within the education institution, including adult
education (or continuing education), special education, and informal education. Adult education ranges
from basic literacy to personal fulfillment (e.g., culinary or language classes) to attainment of an
advanced degree [About Education 2015]. Special education provides ―specifically-designed instruction
Community Resilience Planning Guide for Buildings and Infrastructure Systems - Volume II
Understanding and Characterizing the Social Community, Social Institutions within the Community
21
to meet the unique needs of a child (or adult) with a disability‖ [U.S. Department of Education 2004].
Finally, informal education can include any other means of knowledge, skills, or value transfer, including
visiting museums, reading books, attending book clubs, or participating in recreational classes or
demonstrations.
The functions of the educational institution described in this section focus on the day-to-day. After a
disruptive event, the educational institution within a community provides a venue to educate the public
about current hazards the community faces. Additionally, the education institution can provide a support
system for the students and their teachers to regain a sense of normalcy after an event occurs.
The educational institution primarily meets the growth and achievement needs of Maslow‘s hierarchy.
However, participating in any of the forms of education, described in the preceding paragraphs, satisfies
an individual‘s need for belonging. Additionally, formal educational institutions often provide meals to
children in nursery, primary, and secondary schools, meeting the survival need.
10.4.6. Community Service Organizations
Community service organizations (CSOs) are non-profit and non-governmental entities of varying sizes
and missions that provide services to individuals around the U.S. While CSOs, such as the Red Cross and
the Salvation Army, are active in response and recovery efforts, this section also considers organizations
that do not have such a focus as part of their mission. Such organizations may take on such roles after a
hazard event. Generally speaking, these organizations tend to operate at a local level, often relying on
volunteers to support minimal full-time staff. CSOs typically focus on human services, natural
environment conservation or restoration, and urban safety and revitalization [PBWorks 2015]. CSOs may
assist individuals in meeting basic needs, such as shelter, food, and clothing, as well as provide emotional
and mental health support. They may also enhance the overall quality of life in a community by engaging
in work related to neighborhood revitalization, affordable housing, food security, accessible
transportation, senior citizens associations, community sustainability, humanitarian response, medical
relief funds, after school programs, youth homes and centers, skill building and education, and civic
engagement.
During and after a disruptive event, the role of CSOs, particularly those that provide essential services,
becomes even more critical. As noted by Ritchie et al. [2008] in a comprehensive study of preparedness
among community-based organizations:
After major disasters, frail elderly people living alone still will need meals and other
services; low-income disaster victims will need assistance from community clinics;
services for people with AIDS and for those with chronic mental illness will need to
remain operational; and immigrants still will need aid and support from the same
organizations that provide assistance during non-disaster times.
In many cases, demands for the types of assistance provided by CSOs increase substantially following a
disaster, as more people seek assistance. In post-disaster contexts, CSOs of almost any type may adapt
and expand their roles and services to support community disaster response and recovery efforts.
Apart from organizations that provide essential services, CSOs such as civic, social, and recreational
clubs (e.g., Rotary Clubs, Boys and Girls Clubs, after school programs) become increasingly important in
community recovery processes by providing opportunities and physical settings to draw upon, maintain,
and to build social capital. For example, buildings that house CSOs may provide a place for recovery
planning. This consideration is important with respect to understanding the needs of CSOs as related to
the built environment in terms of broader community resilience.
With respect to Maslow‘s hierarchy, CSOs address human needs related to survival, safety and security,
belonging, and growth and achievement. The nature of the needs met by any given CSO depends on its

Community Resilience Planning Guide for Buildings and Infrastructure Systems - Volume II
Understanding and Characterizing the Social Community, Social Institutions within the Community
22
mission and the people it serves. In many cases, CSOs fulfill daily needs of survival, safety and security,
belonging, and growth and achievement for older adults, people living in poverty, racial and ethnic
minority groups, people with disabilities, and those suffering from chronic debilitating illness. These
needs may not otherwise be met by traditional family and kinship groups. Other types of CSOs, such as
civic, social, and recreational clubs are more likely to address, on a regular basis, the needs associated
with belonging and growth and achievement, rather than meeting basic needs. CSOs provide
opportunities and physical settings to draw upon, maintain, and to build social capital.
10.4.7. Religious, Cultural, and Other Organizations that Support Belief Systems
This section addresses social institutions, including religious and cultural organizations, as well as other
groups that support various belief systems, such as philosophies, ideologies, and science. From a
traditional sociological perspective, religion is one of society‘s fundamental institutions.
As an institution, religion involves shared patterns of beliefs and behaviors that bring people together,
helping them understand the meaning and purpose of life. Religion is additionally characterized as groups
that provide a sense of solidarity and common purpose [Witt 2013]. Generally, the institution of religion
facilitates social cohesion, emotional support, and social control, in addition to serving as an instrument
for socialization and providing answers for unexplained natural phenomena. Other organizations that
support belief systems serve a similar function.
As with community service organizations, the roles of religious and other organizations may change in
the context of a hazard event. The demands for their day-to-day services may increase, to provide
additional social (e.g., emotional and mental health) support for members. In addition, their services may
change based on the physical needs of their members; for example, providing food and shelter.
As a social institution, organizations that support belief systems primarily meet the belonging and growth
and achievement needs identified by Maslow. In some cases, they also address basic survival needs.
10.4.8. Media
Media refers to the channels of communication that, in some way, disseminate information to large
markets (e.g., the entire population of a country) and smaller markets (e.g., a community or specific
demographic within a larger population). A channel or form of communication is often referred to as one-
to-many in that one person (for example, the author of a book) communicates his/her information to an
audience of many. The communication is one-way, as there is rarely an ability to provide feedback to the
author [Sociology Central 2011], and requires a vehicle, e.g., newspaper, books, and magazines for print
media; and radio, television, cable, and the Internet for broadcast media.
Within the last 25 years, the opportunity for many-to-many communication was created with the
development of computer networks. Internet chatrooms, peer-to-peer networks, and social network media
provide means for mass audiences to simultaneously interact and communicate with each other.
The media institution has four main functions and four additional sub-functions. The four main functions
are: dissemination of information, education (directly or indirectly, via documentaries, interviews, etc.),
entertainment, and persuasion. Additional sub-functions include surveillance (watching society to warn
about threatening actions); interpretation (supplying data and facts, explaining and interpreting events and
situations); linkages, joining together other types of social institutions (Section 10.7); and socialization or
the transmission of culture [The Online Media 2012].
The media institution connects individuals with information from around the world, the nation, the state,
and the local community. Most communities have local media outlets that disseminate information about
local conditions on a daily basis, via local newspapers, websites, magazines, radio stations, and/or

Community Resilience Planning Guide for Buildings and Infrastructure Systems - Volume II
Understanding and Characterizing the Social Community, Dependencies among and within Social
Institutions
23
television. Additionally, some local communities house main offices or headquarters of world-, national-,
or state-level news outlets.
When a hazard event occurs, it is often the role of the media to relay information on the physical and
social consequences of the event, as well as details on recovery assistance to community survivors. In
addition to their own sources, the media rely on other sources to disseminate recovery information,
including the local government (i.e., emergency management agencies), businesses, health departments,
community groups, and the public. Information about an event can come from any level of media,
including the public, itself, often within moments of the disaster occurring. Depending upon the hazard
event‘s lead or warning time, levels of news outlets often rush to the location to provide coverage. For
hazard events with little or no lead-time, local media broadcasters and writers are often first on scene;
however, within hours or days, media outlets from around the world converge to cover the story. It is
often not until days – or even weeks – after an event, when all larger-scale media outlets have left the
area, that the dissemination of response and recovery information falls primarily to local media sources.
The media institution, at all levels, meets many of Maslow‘s hierarchy of needs. First, it meets safety and
security needs, by providing information, interpretation and surveillance to the audiences. Additionally,
via its socialization function, it can promote belonging among its audience. Finally, the media institution
meets the need for growth and achievement by educating and entertaining society.
10.5. Dependencies among and within Social Institutions
Characterizing the social community also includes identifying the dependencies among and within social
institutions.
10.5.1. Dependencies among Social Institutions
A disruption in the built environment that affects one social institution will likely affect others. It is
important for a community to identify the ways social institutions are connected with each other, referred
to here as dependencies. Since each community is different, it is impossible to provide an exhaustive list
of all the ways social institutions are dependent on one another. Instead, examples of dependencies among
social institutions are provided here [Holistic Disaster Recovery 2006], using the following template
phrase: Institution A relies on Institution B for (insert function). Note: their reliance on each other is
likely to vary over time and depends on the nature of their connection.
The government relies on the economic institution for local taxes (e.g., sales taxes)
The government relies on the economic institution (i.e., law firms) to conduct legal cases
[Cassens Weiss 2008]
The family/kinship institution relies on the economic or government institutions for jobs
The economic institution (i.e., suppliers of goods and service [e.g., restaurants, staff]) relies on
the family/kinship institution for a customer base; at the same time, the family/kinship institution
relies on the economic institution for places to shop for goods and services [Phillips 2009]
Each social institution relies on the family/kinship institution for labor supply or workforce.
There are additional instances where dependencies may include more than two social institutions. The
examples below show dependencies that involve three or more social institutions:
The family and kinship institution relies on the media to provide information on what is
happening within the government, health, and educational institutions [The Online Media 2012].

Community Resilience Planning Guide for Buildings and Infrastructure Systems - Volume II
Understanding and Characterizing the Social Community, Social- and Economic-Based Community Metrics
24
The family and kinship institution relies on the education or government institutions to provide
childcare, in order for adults to return to work within the economic or government institutions.
The family and kinship institution relies on the government and/or economic institutions for food
and water at home, and financial assistance (for example) before they can return to work within
the economic or government institutions.
10.5.2. Dependencies within Social Institutions
Within particular institutions, such as the economic or government institutions, industries/entities rely on
each another to perform their functions. Therefore, dependencies also exist among services located within
each institution. An example is shown here for dependencies within the economic institution.
Industries can be important drivers of the economy due to their size (e.g., contribution to GDP),
proportion of the workforce they employ, or their importance to other industries (e.g., as producers and
consumers of intermediate goods from other industries). A disruption to the built environment has the
potential to affect several, seemingly unrelated industries across the economy through these inter-industry
relationships. National and regional input-output models capture the inter-industry linkages.
Table 10-3 presents each industry‘s (1) size in millions of dollars of GDP, (2) percent contribution to total
GDP, (3) impact per dollar demand, and (4) impact of dollar supply. The percent contribution of GDP
shows the total flows from an industry as a percent of all flows in the economy. The impact per dollar
demand is the value of GDP from other industries needed to produce one dollar of GDP from the listed
industry – it shows what happens when flows to an industry are disrupted. The impact per dollar supply is
the change in GDP that results from a dollar change in GDP from the listed industry – it shows what
happens when the flows from an industry are disrupted [World Input-Output Database 2011]. For
example, the Wholesale and Retail Trade industry added $1.96 trillion dollars to the U.S. economy in
2011, which constituted 13 % of U.S. GDP. To produce $1.0 million of GDP in Wholesale and Retail
Trade, required $1.4 million of GDP produced by the other industries in the economy. To produce $1.0
million of GDP from other industries in the economy requires $1.94 million of GDP produced by
Wholesale and Retail Trade.
A smaller impact per dollar demand value implies a larger potential for an industry to be affected by
disruptions in other industries. For example, the electricity, gas, and water supply industry is the most
sensitive to production value changes from the rest of the economy. A smaller impact per dollar supply
value implies a larger potential for other industries to be affected by a disruption from an industry (e.g.,
the economy is most sensitive to production value changes from the finance and real estate industry).
The example in Table 10-3 details data on industry size and inter-industry relevance at a national level.
This example can help communities think about the ways their industries interconnect at the local level
and provide some guidance on how to quantify dependencies, if the industry size and relevance data
exists at the local level.
10.6. Social- and Economic-Based Community Metrics
Another aspect of characterizing the social community is identifying what success may look like in terms
of resilience for the community. In other words, what methods (or metrics) will they use to track success
of planning efforts and improvements made to achieve community resilience? The overall questions that
community metrics will help to answer are:
How resilient is my community?

Community Resilience Planning Guide for Buildings and Infrastructure Systems - Volume II
Understanding and Characterizing the Social Community, Social- and Economic-Based Community Metrics
25
Will my community‘s decisions and investments improve resilience? If so, how significant a
difference will be made?
Table 10-3: Industry size and inter-industry relevance in the United States [Source: World Input-
Output Database 2011; Timmer 2012]
Industry GDP
($ million) % GDP
Impact $/
Demand
Impact $/
Supply
Agriculture and mining 466,194 3.1 1.74 1.92
Food, beverages and tobacco 221,187 1.5 3.36 2.48
Other manufacturing 1,627,644 10.8 2.08 1.66
Electricity, gas and water supply 246,896 1.6 1.21 2.62
Construction 549,011 3.6 1.69 2.70
Wholesale and retail trade 1,960,689 13.0 1.40 1.94
Hotels and restaurants 473,854 3.1 1.71 2.68
Inland transport 191,587 1.3 1.82 2.51
Water transport 14,819 0.1 2.14 2.99
Air transport 65,468 0.4 2.07 2.97
Other supporting and auxiliary transport activities;
activities of travel agencies
142,442 0.9 1.44 2.33
Post and telecommunications 370,637 2.5 1.62 2.33
Finance and real estate 5,034,867 33.4 1.50 1.36
Public admin and defense; compulsory social security 1,853,704 12.3 1.54 2.68
Community, social and personal services 1,869,079 12.4 1.57 2.35
Social and economic metrics are important, specifically for the purposes of this Guide, because
community decision-makers will be interested in predicting the economic and social implications (either
positive or negative) of community decisions (either active or passive) made with respect to planning,
siting, design, construction, operation, protection, maintenance, repair, and restoration of the built
environment. Social and economic-based resilience metrics can be quantitative or descriptive in nature.
The output or result can be presented as an overall resilience-related score or as a set of separately
reported scores across a broad spectrum of physical, economic, and social dimensions. Examples of
resilience metrics for social and economic systems and existing community resilience assessment
methodologies are provided in Chapter 16 of this Guide.

Community Resilience Planning Guide for Buildings and Infrastructure Systems - Volume II
Understanding and Characterizing the Social Community, Links between the Social Institutions and the Built
Environment
26
10.7. Links between the Social Institutions and the Built Environment
Some social institutions rely more heavily on the built environment than others. An example of this is
within the health institution, where, for the most part, emergency services are often difficult to provide
outside of hospitals or other buildings on a longer-term basis. The study conducted by the Oregon
Department of Geology and Mineral Industries (DOGMI), in partnership with the Oregon Health
Authority, examined the dependencies that hospitals had on infrastructure systems. After a Cascadia
earthquake, damage to the local water systems and transportation networks will slow response and
recovery of hospitals, and impair hospital services for community members [Wang 2014].
However, not all social institutions rely on the built environment in the same way. Information, skills, and
values may be transferred through the Internet or virtually within the education institution. However, even
in remote situations, where the need for a particular building is absent, we rely on communications
systems to function.
The built environment supports many functions of social institutions within a community. It is important
that a community identify the ways in which the built environment supports each social institution‘s
functions. Sections 10.7.1 through 10.7.4 offer examples of linkages between social institutions and the
built environment, specifically buildings, transportation, energy, communication, and water and
wastewater systems under normal circumstances. Examples are provided in Section 10.7.6 to explore
additional links between social institutions and the built environment in the event of a hazard event.
Table 10-4 to Table 10-7 provide examples of day-to-day linkages between the social institutions and the
built environment. For each social institution, the tables offer examples of the purpose of the built
environment for the social institution, how that purpose is actualized, and the direct and indirect
consequences that may occur to individuals, groups, and the community after a design or extreme event.
10.7.1. Links between Buildings and Social Institutions
Buildings provide places to live, work, learn, access health services, obtain goods and services, conduct
business, and produce and package raw materials and goods, for example. In addition, buildings provide
shelter and storage locations, and house technology for a number of different purposes within a
community.
These purposes are actualized through construction and maintenance of different types of building stock,
including residential, commercial, industrial, educational, institutional, and storage buildings. Without
buildings to support social functions within a community, the community can be exposed to direct or
indirect consequences that can impact individuals, families, businesses, or the broader community.
Examples of possible direct consequences include disruption of governmental services (such as
emergency response), loss of employment or shelter for community members, loss of revenue for
businesses or the community, and increased mental distress for community members. Examples of
indirect consequences include loss of workforce, shortages of supplies, and an increased number of
people at risk of further harm (labeled in the tables as ―at-risk populations‖).
Table 10-4 provides examples of the ways the eight social institutions rely on buildings on a day-to-day
basis. More specifically, examples are provided to present the purpose of buildings within each social
institution, the ways in which these purposes are actualized among building types, and the impact to
individuals, businesses, and community if buildings were damaged. Additional information on buildings
and the methods used to create performance goals for buildings can be found in Chapter 12.

Community Resilience Planning Guide for Buildings and Infrastructure Systems - Volume II
Understanding and Characterizing the Social Community, Links between the Social Institutions and the Built Environment
27
Table 10-4: Links between social institutions and buildings
Purpose of Buildings within each Social
Institution
How Purpose is Actualized within Built
Environment
Possible Impacts if Buildings are Damaged
Direct Indirect
Family Provide a place to live; build a family;
provide shelter, safety and security;
provide a place for belonging (among family/friends)
Housing (e.g., single-family; multi-family; etc.) Loss of shelter, personal possessions;
displaced population; increased
causalities; increased mental distress
Overcrowding; inability to locate and
communicate with others; increased
unrest/crime; loss of workforce
Economic Prepare materials for transport; store
materials and products; house equipment
and machinery; design and develop goods
(buildings and manufactured products);
process raw materials; production
location; point of sale; locations for
employment, commerce/exchange, recreation
Processing facility; warehouse; commercial office;
processing plant; manufacturing facility; warehouse;
goods (buildings and manufactured products) for
sale; stores; malls; restaurants; banks; hotels;
schools and colleges; hospitals and medical
facilities; arenas/stadia; salons and barbershops;
Internet cafes; online storefronts; gas stations; airports; houses and apartments
Loss of revenue; loss of employment;
loss of materials on-hand; loss of
goods and services for sale; loss of
income; loss of means of production
Loss of taxes; loss of market share;
price increases; shortages; decreased
spending; increased demand of
substitutes; decreased demand of
complements; increased demand for
unemployment benefits; increased
supply of labor in ‗like‘ industries; loss of residents
Government Provide work and meeting space for
leaders and staff; serve as a document
repository; protect communication
systems; house public safety and emergency response capabilities (people;
equipment; vehicles); provide public
spaces for recreation
Offices; police stations; fire and EMS stations;
emergency operations centers (EOCs); military
installations; jails and prisons; government
chambers; courts and courthouses; libraries and archives
Diminished emergency response;
disruption to government continuity;
loss of archived materials
Increased causalities and economic
damage; increased opportunity for
social disorder and crime; inability to
respond to emergent issues and needs; loss of residents
Health Provide places to receive emergency care;
to address short- and long-term health
needs (physical and mental); store medical
records, equipment, and pharmaceuticals
Hospitals; clinics; mental health agencies;; urgent
care centers; poison centers; dialysis centers;
rehabilitation centers; hospices; assisted living
facilities; nursing homes; pharmacies;
residential/housing (e.g., home health care)
Decreased ability to treat; increased
causalities; increased mental distress
Increased long-term causality rates;
increased disease transmission; loss
of residents
Education Provide places to learn; to
interact/connect; storage for equipment
and books
Schools; universities (campus and dormitories);
educational offices; museums; libraries
Loss of shelter; displaced student
population
Decreased economic productivity;
lower wages; loss of residents
Community
Service
Organization
Provide places where basic needs can be
met (in some cases; shelter and
sustenance); locations where people can interact with others
Housing and provision of sustenance, offices Loss of food, water; shelter for at-
risk populations; increased mental
distress
Increased at-risk population;
increased crime; loss of
residents/volunteers
Religious
Organization
Provide places of worship; social
interaction; education; daycare; and other
basic services; provide places to house
and protect religious and cultural artifacts/
documents (the buildings themselves may
be considered sacred or have symbolic
meaning)
Churches; synagogues; other places of worship;
meeting places
Loss of shelter; loss of cultural value;
increased mental distress Increased at-risk population
Media Provide places to gather and disseminate
news and information; protect all media technology and equipment
News and broadcasting stations; television stations;
radio station; newspapers/ magazine publishing; publishers‘ headquarters; offices; equipment/
computer storage
Loss of information; loss of the
dissemination of information
Increased uncertainty; increased
threat exposure

Community Resilience Planning Guide for Buildings and Infrastructure Systems - Volume II
Understanding and Characterizing the Social Community, Links between the Social Institutions and the Built Environment
28
Table 10-5: Links between social institutions and transportation systems
Purpose of Transportation within
each Social Institution How Actualized within Built Environment
Possible Impacts if Transportation Systems are Damaged
Direct Indirect
Family Access to and from housing, i.e., to
and from locations for employment,
social events, shopping, and other locations important to the family.
Roads and bridges; airports; railways and rail
stations; seaports; pipelines; tunnels; subways;
public transit
Displaced population (lack of
access); inability to physically
connect with others
Demand for short-term and
nearby shelter alternatives
Economic Distribute goods for processing;
obtain labor and capital; distribute
intermediate goods; distribute final
goods and products for sale; bring
sellers (providers) and consumers
together; transport of products; getting to and returning from work
Supply chain disruptions; loss of
employment; consumers unable
to obtain survival goods
Loss of taxes; decreased demand
of complements; increased
demand of substitutes; decreased
spending; increased demand for
unemployment benefits;
increased supply of labor in ‗like‘ industries
Loss of market share
Government Provide access to services; facilitates
delivery of services (including
emergency response, patrol, and
surveillance); provide physical access
to lawmakers and law-making bodies;
provide physical access to legal venues; Transport of products
Diminished emergency response;
disruption to government continuity
Increased causalities and
economic damage; increased
opportunity for social disorder and crime;
Understaffing; inability to
respond to emergent issues and needs
Health Provide access to and from health
services for patients, staff; Delivery of equipment, materials, and supplies
Longer travel times for
care/delivery of supplies;
increased causalities; increased
number of acute patients; increased mental distress
Equipment and supply shortages;
understaffing; overloading of health care system
Education Provide access to and from
educational services for
students/parents; teachers
Displaced student population (lack of access)
Increased reliance on distance learning
Community
Service
Organization
Provide access to and from CSO
services for clients, staff, volunteers;
transport of products
Inability of at-risk population to
obtain food, water and shelter;
increased mental distress
Increased at-risk population
Religious
Organization
Provide access to and from religious
and cultural services for leaders,
staff, congregation, community members
Increased mental distress Increased at-risk population
Media Provide access to and from media
services; also to news sites
Inability to obtain information Spread of misinformation

Community Resilience Planning Guide for Buildings and Infrastructure Systems - Volume II
Understanding and Characterizing the Social Community, Links between the Social Institutions and the Built Environment
29
Table 10-6: Links between social institutions and energy systems
Purpose of Energy within each
Social Institution
How Actualized within Built
Environment
Possible Impacts if Energy Systems are Damaged
Direct Indirect
Family Lighting; heating; cooling; use of
appliances, equipment; charging
of electronics; fuel for vehicles
Generation facilities; grids; substations;
lines; Supply, distribution and collection
pipelines; pump stations; valves
Displaced population;
increased difficulty to
maintain food, water, and
shelter security;
communication ability
limited
Increased exposure to risk
from displacement or
searching for those unable to
contact; increased fire risk
and reduced indoor air quality
from use of alternative
lighting/heating sources
Economic Ability to operate machinery;
lighting; power for point of sale
devices; heating and cooling;
power for point of non-sale;
service use area; fuel for vehicles
Supply chain disruptions; loss
of employment; reduced
availability to distribute
survival goods; decreased
security
Loss of taxes; increased
waste; decreased spending
Government Lighting; heating; cooling; fuel
for vehicles
Increased reliance on
temporary power supply;
reduced response
effectiveness
Increased security risks for
public officials
Health Lighting; heating; cooling; power
for technology, equipment,
appliances (e.g., life support
systems); fuel for vehicles
Increased reliance on
temporary power supply;
increased causalities
Increased cost; reliability
concerns
Education Lighting; heating; cooling; power
for technology, equipment (e.g.,
computers; appliances)
Displaced student population;
communication ability
limited, including long
distance learning
Decreased economic
productivity; lower wages
Community
Service
Organization
Lighting; heating; cooling; power
for technology, equipment,
appliances
Inability of at-risk population
to obtain food, water, and
shelter; increased mental
distress
Increased at-risk population
Religious
Organization
Lighting; heating; cooling; power
for technology, equipment,
appliances
Increased mental distress Increased at-risk population
Media Lighting; heating; cooling; allow
for use of broadcasting/ media
equipment; fuel for vehicles
Increased reliance on
temporary power supply
Spread of misinformation

Community Resilience Planning Guide for Buildings and Infrastructure Systems - Volume II
Understanding and Characterizing the Social Community, Links between the Social Institutions and the Built Environment
30
Table 10-7: Links between social institutions and communications systems
Purpose of Communication within
each Social Institution How Actualized within Built Environment
Possible Impacts if Communications are Damaged
Direct Indirect
Family Develop/strengthen ties with
family/friends; Promote a sense of
belonging
Telephones (landlines and cell/mobile);
computers; Internet; TV and radio media; 9-1-
1
(Critical Nodes [Central Offices, Internet
Exchange Points, Mobile Switching Centers],
and distribution [i.e., the last mile])
Increased mental distress; Loss
of situation awareness on status
of family
Increased exposure risk from
searching for those unable to
communicate
Economic Obtain market signals; support
production and safety activities;
advertising; recruiting new
employees; transmit and receive
financial transactions; offer and
deliver services; obtain information
on goods and services available;
process payments
Supply chain disruptions; loss of
employment/clients; loss of
business continuity; shortages of
food, water, and shelter; inability
to access finances to purchase
goods
Large price adjustment due to
over- or under-supply of goods
and services (from incorrect
market signals); decreased
spending
Government Transmission of information;
including emergency broadcast
messaging; provide public access to
government employees, programs,
messages, etc.
Telephones; computers; Internet; TV and radio
media; 9-1-1 call centers; reverse 9-1-1; social
media; community alert and warning systems
(Critical Nodes [Central Offices, Internet
Exchange Points, Mobile Switching Centers],
and distribution [i.e., the last mile])
Diminished emergency response;
increased causalities and
economic damage; disruption to
government continuity; increased
opportunity for social disorder
and crime
Decreased trust of government;
increased voter apathy
Health Transfer of information among heath
staff; access information/ resources
(e.g.; medical records);
Facilitate/strengthen ties between
patients, staff, and families/friends
Telephones; computers; Internet; TV and radio
media
(Critical Nodes [Central Offices, Internet
Exchange Points, Mobile Switching Centers],
and distribution [i.e., the last mile])
Increased inability to access
patient records, inability to
prepare for patient influx
Increased causalities due to
incorrect self-treatment
Education Transfer of information among
educators, staff; access
information/resources (e.g.; online);
Facilitate/strengthen ties between
students, staff, families
Limited use of long-distance
learning; Loss of situation
awareness on status of
students/children
Decreased economic productivity;
lower wages
Community
Service
Organization
Facilitate/strengthen ties between
clients, staff, volunteers with CSO
and between CSOs
Increased mental distress Increased at-risk population
Religious
Organization
Facilitate/strengthen ties between
leaders, staff, congregation,
community members, others outside
of org
Increased mental distress Increased at-risk population
Media Facilitate/strengthen ties among staff;
access information/ resources (e.g.;
online); broadcast information
Limited ability to obtain and
disseminate information
Spread of misinformation; poor
decision making

Community Resilience Planning Guide for Buildings and Infrastructure Systems - Volume II
Understanding and Characterizing the Social Community, Links between the Social Institutions and the Built Environment
31
Table 10-8: Links between social institutions and water and wastewater systems
Purpose of Water/Wastewater
within each Social Institution
How Actualized within Built
Environment
Possible Impacts if Water/Wastewater Systems are Damaged
Direct Indirect
Family Drinking; cooling; cleaning
(bathing, laundry, washing);
waste disposal; fire protection;
irrigation, drainage
Supply, distribution and collection
pipelines; pump stations; valves; fire
hydrants; treatment facilities;
finished water storage
Increased health risk; displaced
population; unsanitary conditions;
increased likelihood of disease
outbreak; loss of public
confidence
Loss of neighborhoods,
workforce, social capital
Economic Processing; manufacturing;
production; fire protection;
drinking; cooling; cleaning
(bathing, laundry, washing);
waste disposal; fire protection;
irrigation, drainage; recreation
Supply chain disruptions;
Workforce & production
disruption; reduced facility
function
Increased environmental
degradation; reduced
productivity due to workforce
disruption; decreased
spending
Government Drinking; cooling; cleaning
(bathing, laundry, washing);
waste disposal; fire protection;
irrigation, drainage; recreation
Diminished emergency response;
increased causalities and
economic damage; increased fire
risk; disruption to government
continuity and loss of public
confidence
Diminished fire suppression
capability; inability to respond
to emergent issues and needs
Health Drinking; cooling; cleaning
(bathing, laundry, washing);
waste disposal; fire protection;
irrigation, drainage; and ability to
use specific medical equipment
and processes that require water
(e.g.; dialysis, laundry)
Unsanitary conditions; increased
likelihood for disease
transmission; loss of medical
facility functionality; patient
displacement
Increased at-risk population
Education Drinking; cooling; cleaning
(bathing, laundry, washing);
waste disposal; fire protection;
irrigation, drainage; recreation
Displaced student population;
unsanitary conditions
Increased reliance on distance
learning
Community
Service
Organization
Inability of at-risk population to
obtain food, water, and shelter;
increased mental distress
Increased at-risk population
Religious
Organization
Increased mental distress Increased at-risk population
Media Limit ability to obtain and
disseminate information
Spread of misinformation and
loss of public confidence

Community Resilience Planning Guide for Buildings and Infrastructure Systems - Volume II
Understanding and Characterizing the Social Community, Links between the Social Institutions and the Built
Environment
32
10.7.2. Links between Transportation and Social Institutions
Transportation systems include roads and bridges, airports, railways and rail stations, seaports,
waterways, pipelines, tunnels, subways, and other public transit systems. Transportation systems provide
access to the buildings discussed in Table 10-4, as well as allow for other vital activities, including the
distribution of raw materials and intermediate goods to producers and final goods to consumers. For
example, roads and bridges support the transport of raw materials to production facilities, final goods to
retail stores, and ultimately, to consumers, and workers to their places of employment. Rail networks
support the same types of functions. The transportation assets available within the community and the
ways these assets support the functions of the community‘s social institutions need to be characterized.
Table 10-5 provides examples of the purpose of transportation systems within each social institution and
the possible consequences to these social institutions if the transportation systems were damaged within a
community. Additional information on transportation systems and the methods used to create
performance goals for these systems is found in Chapter 13.
10.7.3. Links between Energy and Social Institutions
Energy systems allow for use of buildings (i.e., lighting, heating, and cooling) as well as operation of
equipment, appliances, and technology vital to the functions of each social institution. For example,
hospitals rely on energy to operate life-saving technology in intensive care units. Energy is also used to
operate machinery within manufacturing plants and facilities to produce materials and goods for the
economic institution.
Table 10-6 gives examples of the purpose of power/energy systems within each social institution and the
possible consequences to these social institutions if the energy systems were damaged within a
community. Additional information on power and energy networks and the methods used to create
performance goals for these systems is in Chapter 13.
10.7.4. Links between Communications and Social Institutions
Communication systems transmit information, allowing recipients to achieve situational awareness on a
specific subject or event. For example, the media and government institutions are often tasked with
communicating information to the public in the event of an emergency. Often this information is urgent,
in that it has to be disseminated in a timely manner, to ensure safety.
Almost all social institutions use communication systems to access or transmit records or other
information among relevant parties. Within the economic institution, communication systems can be used
to obtain market signals, support production and safety activities, advertise products and services,
transmit and receive financial transactions, offer and deliver services, obtain information on goods and
services available, and process payments.
Many different types of technology can be used to disseminate or transmit information between parties.
For example, technologies can include phones, computers, television, radio, Reverse 9-1-1, social media,
and community alert and warning systems for emergencies (for example, public siren systems). These
technologies are included in Table 10-7.
Table 10-7 provides examples of the purpose of communication systems within each social institution and
the possible impacts to these social institutions if these systems were damaged within a community.
Additional information on communication networks and developing performance goals can be found in
Chapter15.

Community Resilience Planning Guide for Buildings and Infrastructure Systems - Volume II
Understanding and Characterizing the Social Community, Community Performance Goals Based on
Community Member Needs
33
10.7.5. Links between Water and Wastewater and Social Institutions
Water and wastewater systems support many functions within social institutions, including the safe use
and operation of various types of buildings. Water and wastewater systems allow drinking, cooking,
cleaning (including bathing, laundry, washing), cooling (for air conditioning), irrigation, drainage, as well
as the ability to eliminate personal waste. Within the economics institution, and more specifically, in the
production of raw materials and goods, water is also used to create goods and services, and wastewater
systems are important in the elimination of production waste from equipment operation. Additionally, the
water distribution system provides fire suppression capabilities at a neighborhood level, as well as
internal building fire suppression systems.
Table 10-8 gives examples of the purpose of water/wastewater systems within each social institution and
the possible impacts to these social institutions if the water/wastewater systems were damaged within a
community. Additional information on water and wastewater networks and the methods used to create
performance goals for these systems can be found in Chapter 15.
10.7.6. Links between Social Institutions and the Built Environment after a Disaster
After a hazard event, new linkages between social institutions and the built environment may develop, or
existing linkages may change for a period of time.
A building‘s use may change to support critical functions within the community. Examples of buildings
that have been used as shelters include schools, hospitals, community service organizations, and houses of
worship. Other community buildings, like libraries, might also be repurposed for government offices.
Additionally, there is often a need to connect or reconnect with family members and friends after a hazard
event occurs. In these cases, buildings have been used as reunification points. Church buildings or
schools, in particular, tend to emerge as central meeting locations in the days and weeks during response
and recovery activities. It is important, however, for communities to consider buildings supporting critical
and recovery functions as a system of systems that need to be supported with services from infrastructure
systems.
The transportation system is needed to physically access critical buildings and locations throughout the
community. Access is required by decision-makers who assess the damage; staff, volunteers and key
personnel who provide essential services; and members of the public who are in need of these essential
services. Transportation systems can also be used to evacuate people from the area as well as a way to
reunite family members following an event.
The communication system allows communication between emergency agencies and the public prior to,
during, and after a hazard event to disseminate response and recovery information. Communication
systems support situational awareness, so that family and friends know the status of their loved ones‘
safety and their location. With many of the social institutions, especially those that are required to
function immediately after the event occurs, e.g., health and government, it is critical that decision-
makers can reach their staff, volunteers, emergency providers, and those they serve.
Most of the examples discussed in this section occur during the short-term or intermediate periods of the
recovery timeline. As the community rebuilds and recovers, and begins to function again, the reliance of
the social systems on the built environment returns to the desired day-to-day status.
10.8. Community Performance Goals Based on Community Member Needs
Once the community‘s social dimensions and the built environment are characterized, and linkages are
identified between the two, communities can see the consequences of damage to or degradation of the

Community Resilience Planning Guide for Buildings and Infrastructure Systems - Volume II
Understanding and Characterizing the Social Community, Community Performance Goals Based on
Community Member Needs
34
built environment on the social environment. Examples of consequences are given in the last two columns
of Table 10-4 to Table 10-8.
Characterization of the social and built environments provides an informed basis upon which to establish
long-term community goals for resilience, the third step of the six-step Guide methodology. This section
contains examples of long-term community performance goals for social institutions. These goals can
help communities prioritize resilience investments in their buildings and infrastructure systems.
Examples of community performance goals for the social institutions that meet urgent or time sensitive
needs of community members include the following:
Goal 1: Strengthen the ability for government to function continuously after an event
Goal 2: Strengthen ability for critical health care to function continuously before and after an
event
Specific government functions (e.g., police, fire,
medical, and emergency management), as well as
critical health care functions (e.g., acute, sub-
acute, chronic, and mental health care), among
other institutions (e.g., CSOs), provide services
that meet survival and urgent safety and security
needs of community members, as shown in Figure
10-3. Therefore, it may be an important goal for
communities to strengthen the buildings and
infrastructure systems that support the continuous
functioning of government and/or health
institutions before and after a hazard event occurs.
Communities may also wish to develop long-term
community goals that meet safety and security
needs of community members, i.e.,
employment/jobs, in addition to supporting the
longer-term needs of a community to grow and
prosper, economically. Two examples are:
Goal 3: Improve current employment
rates within the community
Goal 4: Attract new businesses to the
community
A community‘s local economy provides jobs to
people within the community, allowing them to achieve the financial security they require (as shown by
Maslow‘s hierarchy, Figure 10-4). A growing economy provides not only additional jobs to community
members, lowering the unemployment rate and increasing their changes for financial security, it also
provides a stable flow of taxes into the community‘s reserves, potentially allowing them to provide
additional services for individuals and families living within the community. Therefore, it may be an
important goal for communities to strengthen the buildings and infrastructure systems that support the
economy after a hazard event occurs.
Numerous additional examples can be developed by communities for education, media, CSOs, and
religious/belief organizations. All of these organizations meet various needs of individuals and families
within communities along the Maslow continuum, as shown in Figure 10-5. It will be up to individual
communities to identify the specific community-wide goals for social institutions – and from these goals,
Figure 10-3: Alignment of the Government and
health institutions with Maslow’s Hierarchy of
Needs [Adapted from Maslow 1943]
Growth&
Achievement
Survival
Safety and Security
Belonging
Government Health

Community Resilience Planning Guide for Buildings and Infrastructure Systems - Volume II
Understanding and Characterizing the Social Community, References
35
begin to prioritize changes and/or improvements to the buildings and infrastructure systems that support
them.
10.9. References
Aldrich, D.P. and M.A. Meyer (2014) ―Social Capital and Community Resilience,‖ American Behavioral
Scientist, published online, 1 October 2014.
Arup (2014) City Resilience Framework, The Rockefeller Foundation and Ove Arup & Partners
International Limited, April,
http://www.arup.com/~/media/Publications/Files/Publications/C/City_Resilience_Framework_pdf.ashx.
Viewed December 28, 2014.
Association for Prevention Teaching and Research (2015) Module 5: Healthcare Systems,
http://www.aptrweb.org/?page=module5. Viewed January 5, 2015.
Belcher, J.C., and F.L. Bates (1983) ―Aftermath of natural disasters: Coping through residential
mobility,‖ Disasters, June, 7 (2): 118-128.
Binder, Sherri Brokopp (2014) Resilience and Postdisaster Relocation: A study of New York‘s home
buyout plan in the wake of Hurricane Sandy. Quick Response Grant Final Report: New York‘s Home
Buyout Plan after Hurricane Sandy, University of Hawaii at Manoa,
http://www.colorado.edu/hazards/research/qr/submitted/binder_2013.pdf.
Black, R.; D. Kniveton; R. Skeldon; D. Coppard; A. Murata; and K. Schmidt-Verkerk (2008)
Demographics and Climate Change: Future Trends and their Policy Implications for Migration,
Development Research Centre on Migration, Globalisation and Poverty,
http://www.migrationdrc.org/publications/working_papers/WP-T27.pdf.
Figure 10-4: Alignment of the economic and
family/kinship institutions with Maslow’s
Hierarchy of Needs [Adapted from Maslow 1943]
Figure 10-5: Alignment of all the social
institutions with Maslow’s Hierarchy of Needs
[Adapted from Maslow 1943]
Growth&
Achievement
Survival
Safety and Security
Belonging
Economic
Family
Growth&
Achievement
Survival
Safety and Security
Belonging
Government Health
Education
Media
Economic
Family Belief SystemsCSOs

Community Resilience Planning Guide for Buildings and Infrastructure Systems - Volume II
Understanding and Characterizing the Social Community, References
36
Bullard, R.D. and B. Wright, ed. (2009) Race, Place, and Environmental Justice After Hurricane
Katrina: Struggles to reclaim, rebuild, and revitalize New Orleans and the Gulf Coast. Westview Press,
Boulder, CO.
Bureau of Economic Analysis (2013) Personal Consumption Expenditures by Major Type of Product,
www.bea.gov.
Bureau of Labor Statistics (2015) Current Population Survey, www.bls.gov.
California Department of Health Care Services (2014) Subacute Care,
http://www.dhcs.ca.gov/provgovpart/Pages/SubacuteCare.aspx. Viewed January 5, 2015.
Cassens Weiss, D. (2008) ―Cedar Rapids Law Firm Opens Offices in Nearby Middle School,‖ ABA
Journal,
http://www.abajournal.com/news/article/cedar_rapids_law_firm_opens_offices_in_nearby_middle_schoo
l. Viewed January 10, 2015.
Centers for Disease Control and Prevention (CDC 2014) ―The Public Health System and the 10 Essential
Public Health Services,‖ National Public Health Performance Standards (NPHPS), Atlanta, GA,
http://www.cdc.gov/nphpsp/essentialServices.html. Viewed February 26, 2015.
Community & Regional Resilience Institute, Community Resilience Team (CARRI 2013) Building
Resilience in America‘s Communities: Observations and Implications of the CRS Pilots, Community &
Regional Resilience Institute (CARRI), Washington, DC, http://www.resilientus.org/wp-
content/uploads/2013/05/CRS-Final-Report.pdf.
Cutter, S.L.; K.D. Ash; C.T. Emrich (2014) ―The geographies of community disaster resilience,‖ Global
Environmental Change, Volume 29, Pages 65-77.
Dickinson, Simon Bernard (2013) Post-Disaster Mobilities: Exploring household relocation after the
Canterbury Earthquakes, M.S. Thesis, Department of Geography, University of Canterbury,
Christchurch, NZ.
Division of Health Care Services, Institute of Medicine (1998) Measuring the Quality of Health Care,
Molla S. Donaldson ed., National Academy Press, Washington, DC.
Fraser, J. C.; M.W. Doyle; and H. Young (2006) Creating Effective Flood Mitigation Policies, Eos,
87(27): 265–270.
Gilbert, Stanley W (2010) Disaster Resilience: A Guide to the Literature, National Institute of Standards
and Technology (NIST) Special Publication 1117, October 13.
Gray, C.; E. Frankenberg; T. Gillespie; C. Sumantri; and D. Thomas (2009) Population Displacement and
Mobility in Sumatra after the Tsunami, August, http://iussp2009.princeton.edu/papers/90318.
Groen, J.A. and A.E. Polivka (2010) ―Going Home after Hurricane Katrina: Determinants of Return
Migration and Changes in Affected Areas,‖ Demography,47(4):821-844.
Hogue, Carma (2013) Government Organization Summary Report: 2012, United States Census Bureau,
http://www2.census.gov/govs/cog/g12_org.pdf. Viewed January 15, 2015.
Holistic Disaster Recovery (2006) Holistic Disaster Recovery: Ideas for Building Local Sustainability
After a Natural Disaster (2006), Natural Hazards Center, University of Colorado at Boulder, Boulder,
CO, http://www.colorado.edu/hazards/publications/holistic/holistic2006.html.
Hunter, L.M. (2005) ―Migration and Environmental Hazards,‖ Population and environment, 26(4): 273–
302. doi:10.1007/s11111-005-3343-x.

Community Resilience Planning Guide for Buildings and Infrastructure Systems - Volume II
Understanding and Characterizing the Social Community, References
37
Johns Hopkins Medicine (2015) Tertiary Care Definition,
http://www.hopkinsmedicine.org/patient_care/pay_bill/insurance_footnotes.html. Viewed January 5,
2015.
Lieberson, Alan D. (2004) ―How Long Can a Person Survive without Food?‖ Scientific American,
November 8, http://www.scientificamerican.com/article/how-long-can-a-person-sur/. Viewed October 1,
2014.
Maslow, A.H. (1943) ―A Theory of Human Motivation,‖ Psychological Review, 50 (4) 370–96.
Max-Neef, M.A.; A. Elizalde; and M. Hopenhayn (1991) Human Scale Development: Conception,
Application and Further Reflections, The Apex Press, New York and London, http://www.area-
net.org/fileadmin/user_upload/papers/Max-neef_Human_Scale_development.pdf.
MedicineNet.com (2015) Definition of Primary Care,
http://www.medicinenet.com/script/main/art.asp?articlekey=5042. Viewed January 5, 2015.
Nam, C.B (2004) "The Concept of The Family: Demographic and Genealogical Perspectives,‖ Sociation
Today, 2(2), http://www.ncsociology.org/sociationtoday/v22/family.htm.
PBWorks (2007) CBOs – Introduction, public wiki,
http://eder671nonprofit.pbworks.com/w/page/18541471/CBOs%20-%20Introduction. Retrieved April 7,
2015.
Peterson, D. (2015) ―What is Adult Education?‖ About Education,
http://adulted.about.com/od/whatisadultlearning/p/whatisadulteducation.htm. Viewed January 7, 2015.
Phillips, Brenda (2009) Disaster Recovery, Boca Raton, FL: Taylor and Francis CRC Press.
Phillips, Brenda; Deborah S.K. Thomas; Alice Fothergill; Lynn Blinn-Pike (2009) Social Vulnerability to
Disasters, Boca Raton, FL: Taylor and Francis CRC Press.
Putnam, Robert D (2000) Bowling Alone: The collapse and revival of American community, Simon &
Schuster, New York, NY.
Ritchie, L.A. and D.A. Gill (2007) ―Social Capital Theory as an Integrating Theoretical Framework in
Technological Disaster Research,‖ Sociological Spectrum, 27:103-129.
Ritchie, L.A.; K. Tierney; D. Austin; M. Beres; C. Bevc; B. Gilbert; and J. Sutton (2008) Disaster
Preparedness Among Community-Based Organizations in the City and County of San Francisco,
Boulder, CO: The University of Colorado, Institute of Behavioral Science, Natural Hazards Center.
Sanders, S.; S. Bowie; and Y.D. Bowie (2003) ―Lessons learned on forced relocation of older adults: The
impact of Hurricane Andrew on health, mental health, and social support of public housing residents,‖
Journal of Gerontological Social Work, 40(4), pp. 23-35
Schuller, T.; S. Baron; and J. Field (2000) ―Social Capital: A Review and Critique.‖ Social Capital:
Critical Perspectives, edited by Stephen Baron, John Field, and Tom Schuller, Oxford: Oxford University
Press, pp. 1-38.
Shi, Leiyu and Douglas A. Singh (2008) Delivering Health Care in America: A systems approach, Jones
& Bartlett Publishers, Inc. Sudbury, MA.
Sociology Central (2011) Defining the Mass Media,
http://www.sociology.org.uk/media_defined.pdf.Viewed January 8, 2015.
The Institute of Medicine (2015) Healthy, Resilient, and Sustainable Communities After Disasters:
Strategies, opportunities, and planning for recovery, National Academies Press, Washington, DC.

Community Resilience Planning Guide for Buildings and Infrastructure Systems - Volume II
Understanding and Characterizing the Social Community, References
38
The National Academies (2006) Facing Hazards and Disasters: Understanding human dimensions,
National Academies Press, Washington, DC.
The National Academies (2012) Disaster Resilience: A National Imperative, National Academies Press,
Washington, DC.
The Online Media (2012) Functions of Mass Media,
http://theonlinemedia.blogspot.com/2012/06/functions-of-mass-media.html. Viewed January 9, 2015.
Tierney, Kathleen (2014) The Social Roots of Risk: Producing Disasters, Promoting Resilience, Stanford
University Press, Stanford, CA.
Timmer, Marcel P. ed. (2012), The World Input-Output Database (WIOD): Contents, Sources and
Methods, WIOD Working Paper Number 10, http://www.wiod.org/publications/papers/wiod10.pdf.
United States Census Bureau (2015) United States Census Bureau, United States Department of
Commerce, Washington, DC, http://www.census.gov/.
United States Department of Education (2004) Building the Legacy: IDEA 2004,
http://idea.ed.gov/explore/view/p/,root,regs,300,A,300%252E39. Viewed January 8, 2015.
United States Department of Health and Human Services (DHHS 1999) Mental Health: A Report of the
Surgeon General. U.S. Department of Health and Human Services (DHHS); Substance Abuse and Mental
Health Services Administration, Center for Mental Health Services, National Institutes of Health,
National Institute of Mental Health, Rockville, MD, http://profiles.nlm.nih.gov/ps/access/NNBBHS.pdf.
United States Department of Health and Human Services (DHHS 2015) Preventive Care, United States
Department of Health and Human Services (DHHS), http://www.hhs.gov/healthcare/about-the-
law/preventive-care/index.html. Viewed January 5, 2015.
University of South Carolina (2013) Social Vulnerability Index for the United States 2006-10, Hazards
and Vulnerability Research Institute, University of South Carolina,
http://webra.cas.sc.edu/hvri/products/sovi.aspx.
Wang, Yumei (2014) Hospital and Water System Earthquake Risk Evaluation: Report to the Oregon
Health Authority, Oregon Department of Geology and Mineral Industries.
Witt, Jon (2013) SOC, 3rd
Edition, New York: McGraw Hill.
World Health Organization (1948) Preamble to the Constitution of the World Health Organization as
adopted by the International Health Conference, New York, 19-22 June, 1946; signed on 22 July 1946 by
the representatives of 61 States (Official Records of the World Health Organization, no (2, p. 100) and
entered into force on 7 April 1948, World Health Organization (WHO).
World Health Organization (2007) ―Everybody‘s Business: Strengthening Health Systems to Improve
Health Outcomes,‖ WHO‘s Framework for Action,
http://www.who.int/healthsystems/strategy/everybodys_business.pdf. Viewed December 15, 2014.
World Input-Output Database, http://www.wiod.org/new_site/database/wiots.htm.

Community Resilience Planning Guide for Buildings and Infrastructure Systems - Volume II
Dependencies and Cascading Effects, Dependencies Executive Summary
39
11. Dependencies and Cascading Effects
Dependencies Executive Summary
A community resilience plan requires an understanding of building and infrastructure system
dependencies and potential cascading effects. An overview is provided of possible dependencies between
social systems and buildings and infrastructure systems for consideration when setting performance goals
for community response and recovery times. Available tools for identifying dependencies, predicting the
impact, and mitigating or managing dependencies are also presented. The term ―dependency‖ is used in
the Guide to indicate one-way dependencies. The term ―interdependency‖ can indicate one-way
dependencies, reciprocal dependencies, or multiple-level dependencies.
Cascading failures occur when one failure triggers those of other components or systems. They can occur
within one system or between systems when the failure of one system triggers failures in other systems.
Dependency between infrastructure systems needs to be understood to restore infrastructure services in an
appropriate sequence, and to avoid cascading delays in restoration of critical services.
To determine the performance needed for clusters of the built environment and to protect a community
from significant and non-reversible deterioration, communities need an orderly and rapid process for
managing recovery. The recovery sequence should address the desired number of buildings in each
designated cluster and the infrastructure systems that support them. Each cluster‘s performance depends
not only on its primary function, but also on dependencies between clusters and the infrastructure systems
that support them.
This chapter presents multiple dimensions of dependency: internal and external, time, space, and source
dependencies. Due to the complex nature of infrastructure system interactions, these dimensions of
dependency may not be decoupled.
As part of the planning process, private and non-profit stakeholders, such as utilities, businesses, and
organizations, should be encouraged to develop their own emergency and continuity of operations plans
that include identifying dependencies, and the impacts of those dependencies on their operations.
With knowledge of dependencies, stakeholders can have an informed discussion about the anticipated
performance of buildings and infrastructure systems for the prevailing community hazards and desired
service restoration times, and short and long-term resilience goals. It is important that all stakeholders are
included in these discussions, including: elected officials, emergency managers, first responders, service
providers, business leaders, civic organizations, community services organizations, etc.
A community may use maps with a Geographic Information System (GIS) overlay of infrastructure
systems and hazard data to coordinate the potential temporal and spatial dependencies of infrastructure
systems. Such an assessment may include scenario-based assessment of infrastructure system
depencencies or optomized prioritization of recovery of infrastructure function.
11.1. Introduction
An orderly and rapid process for managing recovery is needed for the designated clusters and
infrastructure systems. Each cluster‘s performance and primary function may be affected by dependencies
between clusters. Considering dependencies can avoid potential cascading failures of multiple systems.
Cascading failures can occur within one system, such as a power grid, when one component fails, causing
an overload and subsequent failure of other components. They can also occur between systems, such as
when loss of power causes failure in the cell phone system after emergency power for cell towers is
expended.
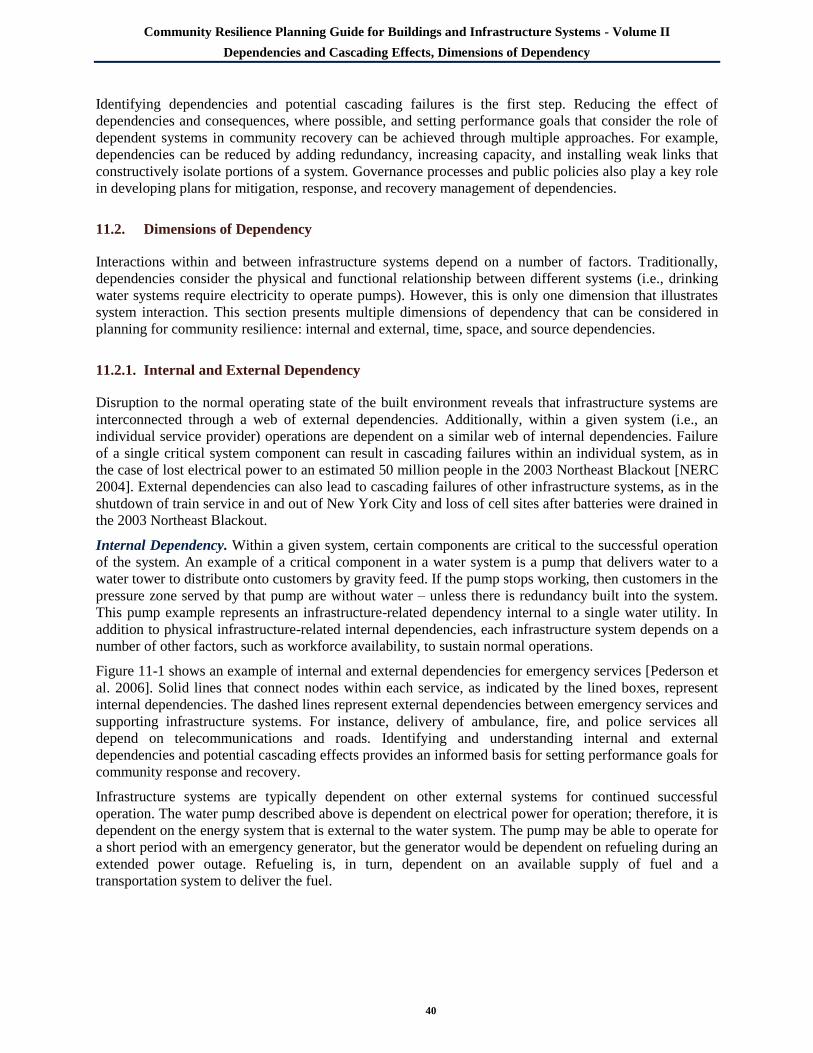
Community Resilience Planning Guide for Buildings and Infrastructure Systems - Volume II
Dependencies and Cascading Effects, Dimensions of Dependency
40
Identifying dependencies and potential cascading failures is the first step. Reducing the effect of
dependencies and consequences, where possible, and setting performance goals that consider the role of
dependent systems in community recovery can be achieved through multiple approaches. For example,
dependencies can be reduced by adding redundancy, increasing capacity, and installing weak links that
constructively isolate portions of a system. Governance processes and public policies also play a key role
in developing plans for mitigation, response, and recovery management of dependencies.
11.2. Dimensions of Dependency
Interactions within and between infrastructure systems depend on a number of factors. Traditionally,
dependencies consider the physical and functional relationship between different systems (i.e., drinking
water systems require electricity to operate pumps). However, this is only one dimension that illustrates
system interaction. This section presents multiple dimensions of dependency that can be considered in
planning for community resilience: internal and external, time, space, and source dependencies.
11.2.1. Internal and External Dependency
Disruption to the normal operating state of the built environment reveals that infrastructure systems are
interconnected through a web of external dependencies. Additionally, within a given system (i.e., an
individual service provider) operations are dependent on a similar web of internal dependencies. Failure
of a single critical system component can result in cascading failures within an individual system, as in
the case of lost electrical power to an estimated 50 million people in the 2003 Northeast Blackout [NERC
2004]. External dependencies can also lead to cascading failures of other infrastructure systems, as in the
shutdown of train service in and out of New York City and loss of cell sites after batteries were drained in
the 2003 Northeast Blackout.
Internal Dependency. Within a given system, certain components are critical to the successful operation
of the system. An example of a critical component in a water system is a pump that delivers water to a
water tower to distribute onto customers by gravity feed. If the pump stops working, then customers in the
pressure zone served by that pump are without water – unless there is redundancy built into the system.
This pump example represents an infrastructure-related dependency internal to a single water utility. In
addition to physical infrastructure-related internal dependencies, each infrastructure system depends on a
number of other factors, such as workforce availability, to sustain normal operations.
Figure 11-1 shows an example of internal and external dependencies for emergency services [Pederson et
al. 2006]. Solid lines that connect nodes within each service, as indicated by the lined boxes, represent
internal dependencies. The dashed lines represent external dependencies between emergency services and
supporting infrastructure systems. For instance, delivery of ambulance, fire, and police services all
depend on telecommunications and roads. Identifying and understanding internal and external
dependencies and potential cascading effects provides an informed basis for setting performance goals for
community response and recovery.
Infrastructure systems are typically dependent on other external systems for continued successful
operation. The water pump described above is dependent on electrical power for operation; therefore, it is
dependent on the energy system that is external to the water system. The pump may be able to operate for
a short period with an emergency generator, but the generator would be dependent on refueling during an
extended power outage. Refueling is, in turn, dependent on an available supply of fuel and a
transportation system to deliver the fuel.

Community Resilience Planning Guide for Buildings and Infrastructure Systems - Volume II
Dependencies and Cascading Effects, Dimensions of Dependency
41
Solid lines that connect nodes within each service, as indicated by the lined boxes, represent internal dependencies.
Dashed lines represent external dependencies between emergency services and supporting infrastructure systems.
For instance, delivery of ambulance, fire, and police services all depend on telecommunications and roads.
Figure 11-1. Example of infrastructure internal and external dependencies for emergency services
[Source: Pederson et al. 2006].
External Dependency. Figure 11-2 illustrates other examples of interdependent relationships among
infrastructure systems. These relationships can be characterized by multiple connections among
infrastructure systems. The behavior of a given infrastructure system may be initially evaluated in
isolation from other infrastructure systems, but planning for resilience requires understanding of the
integrated performance of the physical infrastructure. Wang [2014] conducted a specific study that
evaluates the interdependencies of a hospital and the supporting infrastructure that illustrates this topic.
Cascading Effects. Internal dependency-related cascading failures can affect power transmission,
computer networking, mechanical and structural systems, and communication systems. External
dependency-related cascading failures can affect all buildings and systems. Figure 11-3 and Figure 11-4
illustrate how internal and external dependencies caused cascading failures in the 2003 Northeast
Blackout. The Blackout resulted in widespread societal and economic disruption. It started when an
electricity generating plant went offline, and took less than three hours to propagate across an area with a
population of some 50 million. The outage impacted buildings and other power-dependent infrastructure
systems, including transportation, energy, communication, and water [NERC 2004]. Failures in physical
infrastructure can also have cascading impacts on social institutions. For example, prolonged loss of
critical services following a disaster may drive small businesses to relocate or go out of business entirely.

Community Resilience Planning Guide for Buildings and Infrastructure Systems - Volume II
Dependencies and Cascading Effects, Dimensions of Dependency
42
Figure 11-2. Example of external dependency relationships [Adapted and redrawn, Rinaldi et al 2001]

Community Resilience Planning Guide for Buildings and Infrastructure Systems - Volume II
Dependencies and Cascading Effects, Dimensions of Dependency
43
Figure 11-3: Power system internal dependence cascading failure in the 2003 Northeast Blackout
Figure 11-4: External dependence cascading failure in the 2003 Northeast Blackout
External dependencies among various infrastructure systems that serve other systems means that
infrastructure services need to be restored in sequence. For example, the roads that lead to the electrical
system components that serve the water system that needs repair must be cleared to create access for
repair crews. Such dependency could lead to significant cascading delay in restoring critical services. For
example, delays in restoration of liquid fuel could impact restoration of roads and bridges. Delays in
restoration of roads could impact transport of repair crews, equipment, and restoration of the electric
power system which, in turn, could impact restoration of water services.

Community Resilience Planning Guide for Buildings and Infrastructure Systems - Volume II
Dependencies and Cascading Effects, Dimensions of Dependency
44
11.2.2. Time
Recovery Phases. After a hazard event, the time required to restore services depends on how rapidly
supporting infrastructure systems recover. Rail transportation systems, such as the Bay Area Rapid
Transit (BART) system in the San Francisco Bay area, require electrical power for operation. No matter
how resilient the rail infrastructure system, recovery of service depends on restoration of electrical power.
There may also be operational dependencies that impact a utility provider‘s ability to perform repairs.
Crews typically rely on roads and bridges to access repair sites, liquid fuel for trucks and equipment,
cellular phones for communication, availability of repair supplies through the supply chain, etc.
Disruption in any one or a combination of these systems can increase delays in recovery of service.
The Guide organizes the community resilience plan around three phases of recovery using four categories
of building clusters (see Chapter 4 in Volume I). The nature of the dependency issues differs for each
phase. The first phase, focused on immediate response and labeled ―short-term,‖ is expected to last for
days. This phase requires critical facilities and provisions for emergency housing. The second,
intermediate recovery phase, is expected to last for weeks to months. The second phase can include
restoration of housing and neighborhood services, such as retail, healthcare, and schools. The third, long-
term recovery phase, is expected to last from months to years and focuses on full recovery of the
community‘s economic and social base.
Short-Term Recovery Phase. During the short-term phase (days), the normal operation of infrastructure
systems may be impaired. Individual system operators will activate their emergency response plans.
Internal dependencies (such as staff, operations center, data, repair supplies, etc.) and key external
dependencies (such as transportation) will be critical in defining the pace of the initial response. A well-
defined governance process, between and among government emergency managers and system providers,
will be essential to coordinate system restoration priorities that are best for the community, especially
when the recommended restoration sequence might not be optimal for an individual system provider. A
report by the City and County of San Francisco Lifelines Council indicated that a top planning and
preparedness priority for system providers is to develop communication and employ priority decision-
making strategies to aid in post-event response [The Lifelines Council, City and County of San Francisco
2014].
Critical facilities, as defined in Chapter 4 (Volume I), are a small number of building clusters and
supporting infrastructure systems that need to be functional immediately after an event to support the
emergency response and provide a safe environment for emergency responders. During this early phase,
the degree of dependence on other infrastructure systems depends on the facility‘s ability to operate with
emergency power, an independent communication network, and possibly onsite housing and subsistence
for the staff. Critical transportation routes need to be established prior to the event and made a high
priority in post-event cleanup and debris removal. These routes enable replenishment of onsite supplies
including fuel, water, food, medical supplies, etc. Performance goals for recovery need to balance the
supplies needed to operate independently for a short period and achievable restoration times.
For example, some hospitals have stored water that can supply drinking water for three to four days. This
supply may represent about 5 % of total water usage. Some hospitals‘ total water usage may exceed
300,000 gal/day. Many hospitals do not have onsite storage capacity for wastewater and have limited
storage capacity for medical waste. Such limitations would impair hospital functionality after a hazard
event. In California, the Office of Statewide Health Planning and Development is implementing
requirements to provide three days of an operational supply of water (including water for drinking, food
preparation, sterilization, HVAC cooling towers, etc.), wastewater storage, and fuel for emergency
generators [CBC 2013].
The timing of a hazard event may also impact the resources available for response. Availability of
hospital beds is often seasonally dependent. For instance, during the winter flu season, hospitals may

Community Resilience Planning Guide for Buildings and Infrastructure Systems - Volume II
Dependencies and Cascading Effects, Dimensions of Dependency
45
operate at or near capacity, limiting the number of patient beds available for response (even after
discharge of less critical patients and canceling elective procedures).
Temporary housing for emergency responders and displaced individuals and animals, as discussed in
Chapter 10, is often met by using schools, shelters, hotels, conference centers, residences that are safe to
shelter-in-place, etc. Food, water, security, and sanitation needed to protect public health are usually
provided at centralized locations.
An inability to provide sufficient emergency housing can lead to a mass exodus from the community,
which could cascade into a permanent loss of residents and inability to restore the economic base of the
community. Performance goals need to realistically estimate both the number of displaced residents and
emergency responders to be accommodated and the availability of adequate facilities within or adjacent to
the community.
Intermediate Recovery Phase. In the intermediate recovery phase (weeks to months), the dependency
focus is expected to shift more to external dependencies (electricity, liquid fuel, transportation, etc.) along
with key internal dependencies (funding for payroll and repair supplies, contractors, etc.).
Restoring neighborhood functionality is key to maintaining the workforce needed to restore the economic
vitality of the community after a hazard event. During this period, it is important that special attention be
paid to the needs of the disadvantaged and at-risk populations who require a higher level of assistance.
Functioning residences, schools, healthcare facilities, and businesses are needed to give the population
confidence to stay and help support community recovery. If people cannot return to their neighborhoods,
small neighborhood businesses will likely lose their client base and relocate or close. This, in turn, may
cascade into delays for recovering the community‘s economy or permanent losses. See Section 10.5 for
additional social institution dependencies.
Commercial services also support recovery of a community. If the primary economic engine of a region is
based on a manufacturing plant that requires water, wastewater, and power to operate within two weeks
after a design hazard event, then the intermediate recovery phase should address restoration of those
dependent systems.
The condition of the built environment that supports residences, neighborhoods, and businesses is one key
factor that determines recovery time. Significant structural damage to buildings and infrastructure systems
cannot be repaired within a few weeks; it takes months or longer, depending on the damage. Buildings
need to be safe to use while being repaired for minor damage or temporary facilities will need to be
provided, especially for damaged residences. The components of the transportation, energy, water,
wastewater, and communication systems that support these facilities need to be restored within the same
timeframe.
Long-Term Recovery Phase. In the long-term recovery phase (months to years), it is anticipated that
utility services will be restored, at least with temporary fixes. If a community is in the early stages of
developing its resilience, the recovery time may take longer due to needed repairs or rebuilding. As a
community achieves resilience, a similar event should cause less damage and have shorter, less costly
recovery times. The key dependencies at this point are related to supplies, equipment, and resource
availability for repairs and reconstruction.
Construction activities to repair and rebuild after major event will provide a significant, short-term
stimulus to the economy and offer an opportunity to improve the built environment according to a
community‘s plan for resilience. The restoration may be financed by the government, insurance
companies, large businesses, private savings, and/or developers. For the recovery process to successfully
improve community resilience, a governance structure needs to be in place that approves reconstruction
rapidly and in accordance with the community‘s interests and resilience plans. Any stall or stalemate in
decision-making will delay the construction activities needed to restart the economy.

Community Resilience Planning Guide for Buildings and Infrastructure Systems - Volume II
Dependencies and Cascading Effects, Dimensions of Dependency
46
It is important that communities develop a resilience plan that addresses how to manage the logistics of
recovery. For example, logistics include expedited building permit processes and adequate resources for
building inspections during a post-event construction boom. Logistics also include land use planning
decisions that will guide rebuilding. If the process is delayed, then people and businesses may move out
of the region and the opportunity to build back a better, more resilient community is lost. The Oregon
Resilience Plan indicated that businesses are only able to accommodate approximately two to four weeks
of business interruption before they would need to relocate or go out of business [OSSPAC 2013]. This is
particularly troubling to a state like Oregon where a large portion of the economy relies on small
businesses and where the current expected level of resilience for a Cascadia Subduction Zone earthquake
does not meet this four-week time window. Japan experienced small business losses because of delayed
decisions in land use planning to rebuild in the tsunami-impacted region after the 2011 Tohoku
earthquake [Mochizuki 2014].
11.2.3. Space
Hazard Impact Region. Hazard events can have variable impacts across affected regions. Hurricanes or a
Cascadia Subduction Zone earthquake may impact a large multi-state region, while tornadoes may only
impact a portion of a community.
Communities need to consider the potential geographic area of impact for their expected hazards as part
of the planning process. The Oregon Resilience Plan [OSSPAC 2013] was developed for a scenario
Cascadia Subduction Zone earthquake that would likely impact a region including Northern California,
Oregon, Washington, and British Columbia (Figure 11-5). The plan discusses a strategy where the central
and eastern portions of the state would provide assistance to the Willamette Valley/I-5 Corridor region
(area including the state‘s largest population centers) and then the Willamette Valley/I-5 Corridor would
provide assistance to the coastal region. Other mutual aid assistance would likely be mobilized from
Idaho, Montana, and other adjacent states. This is in contrast to a Midwest tornado, which may cause
significant devastation to a particular community, but assistance in response and recovery is available
from the surrounding communities.
Location of Critical Infrastructure. The location of physical infrastructure within a community impacts
how it is expected to perform in a hazard event. For example, wastewater treatment plants are often
located close to rivers, bays, or other bodies of water for system operation reasons, making them
particularly vulnerable to flooding, sea level rise, and tsunami hazards. In the resilience planning process,
communities need to consider how the prevailing hazards and location of existing infrastructure systems
impacts system performance. Resilience plans could include land use planning policies that consider the
dependence between physical location and system performance, when evaluating upgrades to existing
buildings, construction of new infrastructure systems, and rebuilding after a hazard event.
Co-location. Infrastructure systems are often co-located along transportation or other utility corridors.
The close proximity of these different systems can lead to unintended damage to these co-located systems
[O‘Rourke 2007].

Community Resilience Planning Guide for Buildings and Infrastructure Systems - Volume II
Dependencies and Cascading Effects, Dimensions of Dependency
47
Figure 11-5: Four impact zones for M9.0 Cascadia earthquake scenario [Source: OSSPAC 2013]
Pipelines and conduits are often co-located
on bridges or other crossing structures and
can be significantly impacted by earthquake
and inundation (flood and tsunami) events.
Figure 11-6 shows an example of bridge
displacement during the 2011 Christchurch
New Zealand earthquake. A sewer pipeline,
supported by the bridge, failed and spilled
raw sewage into the river below. The new
black sewer line on the bridge deck was
temporarily installed after the earthquake.
Telecommunications wires are often
supported by electrical power poles, so if the
pole breaks, both systems are impacted.
Water and wastewater pipelines are often co-
located near other buried infrastructure under
or adjacent to roadways. Failure of pipelines
may result in damage to the roadway (i.e.
sinkhole from water main break or collapsed
sewer pipeline) and impacts to traffic when repairs are being made. Co-located infrastructure not only
results in potential damage to multiple systems, but also often requires significantly more coordination
between service providers during repair.
Figure 11-6: Example of infrastructure co-location

Community Resilience Planning Guide for Buildings and Infrastructure Systems - Volume II
Dependencies and Cascading Effects, Planning for Infrastructure System Dependencies
48
11.2.4. Source Dependency
Communities depend on goods and services that may or may not be available locally. Hazard events that
impact the source of these goods and services can have far-reaching downstream consequences.
In the Pacific Northwest, Oregon is
dependent on refineries in the State of
Washington for a supply of liquid fuel.
Figure 11-7 shows the Portland, OR liquid
fuel tank farm that relies on pipelines
running from just south of the Canadian
border to this storage site. A Cascadia
Subduction Zone earthquake would likely
disrupt refinery operation and limit available
liquid fuel supplies in Washington and
Oregon. If not identified and addressed, this
could cripple restoration of roads and
bridges, which, in turn, would paralyze
restoration of electric power and water
services. Similarly, a Gulf Coast hurricane
could damage offshore drilling platforms
and oil refinery facilities, disrupting the
liquid fuel supply for the hurricane-impacted region and other regions of the U.S.
Regional utility systems provide another example of source dependency. The Tennessee Valley Authority
(TVA) supplies power to over 150 municipal utility companies and several large industrial users in
Alabama, Kentucky, Mississippi, and Tennessee [TVA 2014]. A hazard event, such as an ice storm, that
damages one or more TVA power generation facilities or transmission lines has the potential to disrupt
electric power over a large geographic area.
A wildfire can impact the drinking water supply with high post-fire sediment loads. These sediment loads
can damage reservoirs and treatment plants, resulting in increased treatment costs to remove suspended
solids from drinking water. The impact of sediment is highest in the burned area, but data from the
Southern California wildfires in the fall of 2003 indicated increased sediment loads at treatment plants up
to 160 km (100 miles) from the fire [Meixner and Wohlgemuth 2004].
11.3. Planning for Infrastructure System Dependencies
As part of the planning process, utility providers, businesses, and other community organizations should
be encouraged to refresh or develop their own emergency and continuity of operations plans and address
internal dependencies. As organizations are conducting internal planning activities to achieve resilience,
they can compile a list of external dependencies and how they may impact their operations and recovery
process. With informed stakeholders, a discussion can be held that develops an understanding of the
desired and anticipated performance of the built environment for prevailing hazards, including
dependencies.
Understanding the dependencies within and between physical infrastructure systems is a developing area
of planning related to resilience and recovery from significant disruptions. However, there is an
immediate need for a process to identify dependencies in the built environment, and an empirical method
based on historical data seems to be the most achievable at this point. Such a method was used for the
City and County of San Francisco Lifelines Council in 2013 and it may be applied to other communities.
San Francisco reported their findings and recommendations (Figure 11-8) in February 2014 [The
Lifelines Council, City and County of San Francisco 2014]. The steps in their process were:
Figure 11-7: Portland, OR liquid fuel tank farm is
vulnerable to failures in pipelines in Washington State.
(Source: Yumei Wang [DOGAMI 2012]

Community Resilience Planning Guide for Buildings and Infrastructure Systems - Volume II
Dependencies and Cascading Effects, Planning for Infrastructure System Dependencies
49
Figure 11-8: Potential service restoration timeframes following a scenario M 7.9 earthquake on the
San Andreas Fault estimated in City of San Francisco Study
Form a service provider council of private and public infrastructure owners and plan a quarterly
forum for them to meet, share current planning activities, and discuss response and recovery
issues, their dependencies on other systems, and methods to improve the existing conditions.
For the extreme level of all prevailing hazards, characterize the expected level of damage in terms
related to infrastructure system performance from the view of the infrastructure provider. Figure
11-8 illustrates restoration times estimated by the providers in the San Francisco study. While
most utilities get progressively better over time, the loss of battery power and fuel in the first few
days causes the decrease in service restoration for some systems. Once electricity is restored, the
service restoration of other infrastructure systems increases, some more rapidly than others.
For each infrastructure system, document the planned response and restoration process, likely
dependencies on other systems, and the understanding of other system dependencies on them.
Process the information and determine overall interactions between systems and the related
dependencies. Identify areas with potential for cascading effects, occurrences of co-location,
overlaps, and hindrances related to restoration and recovery plans. Table 11-1 illustrates the
dependencies identified in the San Francisco Study, as well as the nature of the interaction.
Develop a series of recommendations related to the next steps needed to better define the needs,
advance collaborative planning where needed, prioritize the needed mitigation projects and
identify funding sources for pre- and post-event needs.
Table 11-1 lists infrastructure systems along both axis of the table. The type of dependencies and
significance of the dependency is indicated, with significant (yellow) dependencies needing to be resolved
first. For example, the dependency between electric power and city streets can be significant. Streets and
power are co-located when power lines are within the right-of-way of the streets, and each system may
hinder the restoration of the other. Roads are needed to transport the power crews and debris on the roads
will delay repairs to the electrical system.
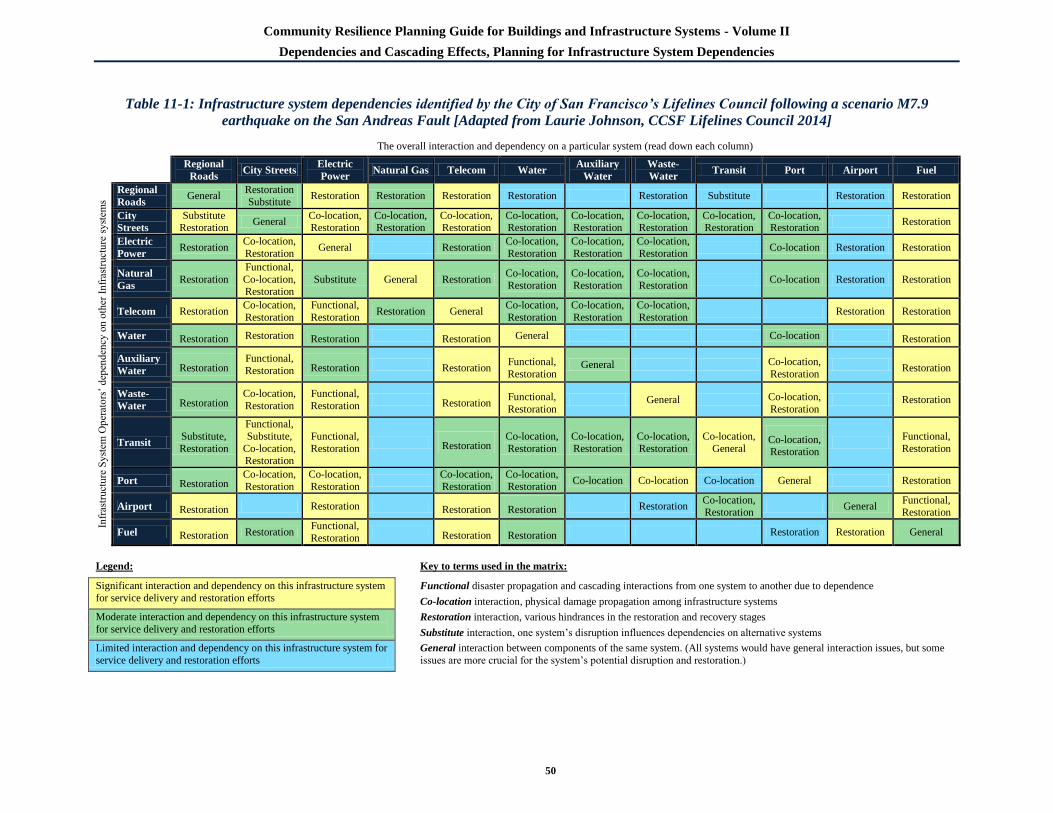
Community Resilience Planning Guide for Buildings and Infrastructure Systems - Volume II
Dependencies and Cascading Effects, Planning for Infrastructure System Dependencies
50
Table 11-1: Infrastructure system dependencies identified by the City of San Francisco’s Lifelines Council following a scenario M7.9
earthquake on the San Andreas Fault [Adapted from Laurie Johnson, CCSF Lifelines Council 2014]
The overall interaction and dependency on a particular system (read down each column)
Regional
Roads City Streets
Electric
Power Natural Gas Telecom Water
Auxiliary
Water
Waste-
Water Transit Port Airport Fuel
Infr
astr
uct
ure
Sy
stem
Op
erat
ors
‘ dep
enden
cy o
n o
ther
In
fras
truct
ure
sy
stem
s
(rea
d a
cro
ss e
ach
ro
w)
Regional
Roads General
Restoration
Substitute Restoration Restoration Restoration Restoration Restoration Substitute Restoration Restoration
City
Streets
Substitute Restoration
General Co-location, Restoration
Co-location, Restoration
Co-location, Restoration
Co-location, Restoration
Co-location, Restoration
Co-location, Restoration
Co-location, Restoration
Co-location, Restoration
Restoration
Electric
Power Restoration
Co-location,
Restoration General Restoration
Co-location,
Restoration
Co-location,
Restoration
Co-location,
Restoration Co-location Restoration Restoration
Natural
Gas Restoration
Functional,
Co-location, Restoration
Substitute General Restoration Co-location,
Restoration
Co-location,
Restoration
Co-location,
Restoration Co-location Restoration Restoration
Telecom Restoration Co-location,
Restoration
Functional,
Restoration Restoration General
Co-location,
Restoration
Co-location,
Restoration
Co-location,
Restoration Restoration Restoration
Water Restoration Restoration Restoration Restoration General Co-location Restoration
Auxiliary
Water Restoration Functional,
Restoration Restoration Restoration Functional,
Restoration General Co-location,
Restoration Restoration
Waste-
Water Restoration Co-location,
Restoration
Functional,
Restoration Restoration
Functional,
Restoration General Co-location,
Restoration Restoration
Transit Substitute,
Restoration
Functional,
Substitute,
Co-location, Restoration
Functional,
Restoration Restoration
Co-location,
Restoration
Co-location,
Restoration
Co-location,
Restoration
Co-location,
General Co-location, Restoration
Functional,
Restoration
Port Restoration Co-location,
Restoration
Co-location,
Restoration
Co-location,
Restoration
Co-location,
Restoration Co-location Co-location Co-location General Restoration
Airport Restoration Restoration Restoration Restoration Restoration Co-location, Restoration
General Functional, Restoration
Fuel Restoration Restoration Functional,
Restoration Restoration Restoration Restoration Restoration General
Legend: Key to terms used in the matrix:
Significant interaction and dependency on this infrastructure system
for service delivery and restoration efforts Functional disaster propagation and cascading interactions from one system to another due to dependence
Co-location interaction, physical damage propagation among infrastructure systems
Moderate interaction and dependency on this infrastructure system
for service delivery and restoration efforts Restoration interaction, various hindrances in the restoration and recovery stages
Substitute interaction, one system‘s disruption influences dependencies on alternative systems
Limited interaction and dependency on this infrastructure system for
service delivery and restoration efforts General interaction between components of the same system. (All systems would have general interaction issues, but some
issues are more crucial for the system‘s potential disruption and restoration.)

Community Resilience Planning Guide for Buildings and Infrastructure Systems - Volume II
Dependencies and Cascading Effects
51
Figure 11-9 shows a map of Portland, Oregon with a GIS overlay of infrastructure systems that are
contained in the Earthquake Response Appendix to the City‘s Basic Emergency Operations Plan
[Portland Bureau of Emergency Management 2012]. The city used this information to coordinate the
potential spatial dependencies of its infrastructure sytems.
Figure 11-9: GIS map of infrastructure systems around Portland, Oregon [Source: USGS]
The Multidisciplinary Center for Earthquake Engineering Research, MCEER [Shinozuka et al. 2004],
investigated earthquake effects on the Los Angeles Department of Water and Power (LADWP) combined
water and power systems, and showed that GIS assisted modeling could effectively illustrate the temporal
and spatial aspects of the combined system performance. Figure 11-10 shows a pre-event simulation of
the progression of the restoration process after a scenario event. The state of the restoration is
demonstrated in GIS format at 0 hours, 12 hours, 24 hours, and 48 hours after the scenario earthquake.
This type of restoration simulation is useful for assessing infrastructure system dependencies and
develop/validate solutions for minimize cascading effects.

Community Resilience Planning Guide for Buildings and Infrastructure Systems - Volume II
Dependencies and Cascading Effects
52
a. 0 hours
b. 12 hours
c. 24 hours
d. 48 hours
© Multidisciplinary Center for Earthquake Engineering Research (MCEER) at the State University of New York at Buffalo.
Used with Permission.
Figure 11-10: Pre-event simulation of LADWP restoration of pump stations and power supply
Community Resilience Planning Guide for Buildings and Infrastructure Systems - Volume II
Dependencies and Cascading Effects
53
11.4. References
California Building Standards Commission (CBC 2013) California Building Standards Code, California
Building Standards Commission, Sacramento, CA, http://www.bsc.ca.gov/Home/Current2013Codes.aspx.
Mexiner, T. and P. Wohlgemuth (2004) ―Wildfire Impacts on Water Quality,‖ Southwest Hydrology, pp.
24-25, September/October, http://www.swhydro.arizona.edu/archive/V3_N5/feature7.pdf.
Mochizuki, J. (2014) ―Decision-Making, Policy Choices and Community Rebuilding after the Tohoku
Disaster,‖ Journal of Integrated Disaster Risk Management, 4 (2): 11-26.
North American Electric Reliability Council (NERC 2004) Technical Analysis of the August 14, 2003,
Blackout: What Happened, Why, and What Did We Learn? Princeton, NJ, North American Electric
Reliability Council.
O‘Rourke, T. (2007) ―Critical Infrastructure, Interdependencies, and Resilience,‖ The Bridge, vol. 37, no.
1, Spring, National Academy of Engineering of the National Academies, Washington, DC,
https://www.nae.edu/File.aspx?id=7405.
Oregon Seismic Safety Policy Advisory Commission (OSSPAC 2013) The Oregon Resilience Plan,
Reducing Risk and Improving Recovery for the Next Cascadia Earthquake and Tsunami, Salem, OR:
Oregon Seismic Safety Policy Advisory Commission.
Pederson, P.; D. Dudenhoeffer; S. Hartley; and M. Permann (2006) Critical Infrastructure
Interdependency Modeling: A Survey of U.S. and International Research, INL/EXT-06-11464, Idaho
National Laboratory.
Portland Bureau of Emergency Management (2013) City of Portland Basic Emergency Operations Plan,
Earthquake Response Appendix. Portland, OR, https://www.portlandoregon.gov/pbem/article/135813.
Rinaldi, S.M.; J.P. Peerenboom; and T.K. Kelly (2001) ―Identifying, Understanding, and Analyzing
Critical Infrastructure Interdependencies,‖ IEEE Control Systems Magazine, December
Shinozuka, M.; S.E. Chang; T-C. Cheng; M. Feng; T.D. O‘Rourke; M. Ala Saadeghvaziri; X. Dong; X.
Jin; Y. Wahg; and P. Shi (2004) ―Resilience of Integrated Power and Water Systems,‖ Research Progress
and Accomplishments 2003-2004, MCEER, Buffalo, NY.
Tennessee Valley Authority (TVA 2014) Tennessee Valley Authority Strategic Plan: Fiscal Years 2014-
2018, Tennessee Valley Authority (TVA), Knoxville, TN.
The Lifelines Council, City and County of San Francisco (2014) Lifelines Interdependency Study/Report,
San Francisco, CA, http://www.sfgsa.org/modules/showdocument.aspx?documentid=12025.
Wang, Y. (2014) Hospital and Water System Risk Evaluation, Report to the Oregon Health Authority,
Oregon Department of Geology and Mineral Industries, September.
Wang, Y.; S. Bartlett; S. and Miles (2012) Earthquake Risk Study for Oregon's Critical Energy
Infrastructure Hub, Final Report to Oregon Department of Energy & Oregon Public Utility Commission,
Oregon Department of Geology and Mineral Industries, August.
Community Resilience Planning Guide for Buildings and Infrastructure Systems - Volume II
Buildings
54
12. Buildings
Buildings Executive Summary
Buildings support many social needs from the most basic, such as providing shelter, to providing services
like medical care and education. Following a disruptive hazard event, some buildings need to be
functional immediately, while others need to remain stable to protect occupants. Building stock within a
community varies widely, in terms of use, occupancy, ownership, age, construction type, and condition.
These factors can affect the performance of existing buildings during hazard events, as well as the ability
to restore their intended function within a reasonable time.
The Guide groups buildings that have similar functions and performance goals into clusters to focus on
the role of buildings at the community level rather than individual buildings. Accordingly, performance
goals are expressed in terms of time to recovery of function for building clusters following a hazard event.
Building clusters are buildings and supporting infrastructure systems that support a social need or
function in the community that have a common performance goal. Recovery of function is affected by the
condition of the buildings and supporting infrastructure systems (including their design, mitigation, and
maintenance) as well as damage levels, resources for repairs and rebuilding, and temporary measures,
such as interim power sources. Functionality across a building cluster may be restored incrementally
during recovery phases. For example, critical facilities like emergency care centers in hospitals are needed
immediately following hazard events. Other less critical hospital functions can be restored as needed.
Another example is residential clusters that need to be stable and safe for occupancy immediately after the
event, so residents can remain in the community to support its recovery.
The community resilience plan addresses gaps between the desired (future) performance of buildings to
support recovery of function and the anticipated (current) performance of the existing building stock and
supporting infrastructure systems. Much of the building stock may not meet the desired performance
goals. A community resilience plan can address gaps between the desired and anticipated performance
with prioritized solutions and strategies. For example, updated or improved codes and standards can be
adopted. This approach has limited short and intermediate term impact because existing buildings and
infrastructure systems are replaced slowly in most communities. Only new construction or significant
renovations will conform to the new standards. When existing buildings pose a substantial risk to
occupants during a hazard event, retrofit requirements are an option, but often a challenging one, due to
potential costs and occupant disruption.
The Guide encourages communities to consider multiple hazard levels: routine, design, and extreme.
Consideration of multiple hazard levels supports fuller understanding of potential consequences and
recovery actions for community resilience. The performance of buildings is anchored around the design
hazard. For a design hazard event, desired performance could be that buildings are functional within days
to weeks, depending on their role in the community. For a routine hazard event, desired performance
could be that all buildings are functional within a few days. For an extreme hazard event, desired
performance could be that certain critical facilities are functional after the event, most residents can
shelter in their own homes, and businesses essential for recovery are open within several weeks.
Most of the building codes and standards adopted by communities are based on model building codes.
Model building codes are developed at the national or international level and primarily address minimum
requirements for life safety of occupants, not comprehensive community resilience. States and local
municipalities may modify the model building codes to achieve specific goals that are more stringent for
local or regional hazards. Other states and localities adopt model building codes, but amend or remove
requirements to make them less stringent. Other states adopt model building codes but do not allow
amendments by local jurisdictions.

Community Resilience Planning Guide for Buildings and Infrastructure Systems - Volume II
Buildings
55
Enforcing building codes and construction standards is as important as their adoption. Even if the most
up-to-date building code and standards are in effect, buildings designed and constructed in a substandard
manner are likely to have substandard performance. The level of enforcement can significantly impact
resilience. A properly trained building department to review designs for code conformance and inspect
construction for conformance with the approved plans is an essential component of community resilience.
Making a community more resilient is a long-term proposition. Communities can develop short, medium
and long-term goals for resilience. Short-term goals typically include creating a resilience plan and
adopting improved building codes and standards. Short-term goals support long-term goals by gradually
adding more resilient buildings. Medium and long-term goals typically relate to improving the existing
building stock, such as incentivized or mandated retrofit of specific building types.
All solutions that make communities more resilient have associated costs. Communities need to balance
resilience plans against their available resources. The Guide offers a six-step method to identify gaps
between desired and anticipated performance and prioritize solutions to address the gaps. Prioritization
and participation by all stakeholders helps communities develop plans that can achieve their community
resilience goals within their means.
12.1. Introduction
Community building stock can vary widely. Differences in occupancy, use, age, and condition can present
challenges in meeting desired performance goals. Public and private ownership can also present
challenges in implementing resilience solutions and strategies. This chapter discusses building categories
and functions, performance goals, regulatory environment, codes and standards, and possible solutions
and strategies for buildings that support community resilience.
12.1.1. Social Needs and Systems Performance Goals
Buildings play a central role in our communities, as they fulfill a multitude of social needs from providing
shelter to providing locations for services such as health care, education, and grocery stores, as discussed
in Chapter 10. Therefore, desired performance goals for buildings depend specifically on what the
building houses or the function it serves. Some buildings should be functional immediately, or soon after,
the hazard event, while other buildings need to be stable so they do not collapse or place the life safety of
the occupants at risk. Section 12.2 discusses building categories and uses; Section 12.3 provides guidance
for developing performance goals based on the methodology in Chapter 4 (Volume I). Current building
codes adopted and enforced by the community may not achieve the desired performance goals.
12.1.2. Reliability vs. Resilience
Buildings are an integrated set of systems – structural, architectural, utilities, etc. – that perform together
to serve the intended function of the building. Structural systems provide a stable frame that carries
gravity loads and resists forces imposed by hazard events. Architectural systems supply protection from
outside elements through the cladding systems (e.g., roof, exterior walls or panels, doors, windows), life
safety systems (e.g., sprinklers, fire alarms), and interior finishes. Utility systems deliver services that
support the building function and occupants (e.g., electric power, communication, water, wastewater).
Buildings are designed based on provisions in building codes and engineering design standards to meet
their intended purpose and provide occupant safety for fires and prevailing hazard events. Most
provisions in building codes and standards are prescriptive (i.e., rules or regulations are specified for
design). However, most codes and standards also permit the use of alternative products, systems or design

Community Resilience Planning Guide for Buildings and Infrastructure Systems - Volume II
Buildings
56
methods if equivalent performance is demonstrated through engineering analysis, testing, or performance-
based design.
Structural systems are typically designed for the required minimum level of hazard intensity, which is
based on a target performance level based on reliability for a 50 year service period (see Chapter 4 in
Volume 1). Structural reliability refers to the probability that a structural member or system will not fail
during the service period in a specified fashion, such as member buckling or fracture. For gravity, wind,
snow, and flood design loads, structural design is based on member performance, so that structural
members are designed to have a low probability of failure during a design hazard event. For seismic
design hazard events, structures are designed for system performance, where the structural system is
expected to remain stable, but individual members may fail. Thus, for wind, snow, and flood events, a
structure is expected to sustain little or no damage during a design event. For seismic events, the structure
is expected to remain stable but localized structural damage may occur. Depending on the degree of
damage, a building may not be functional afterwards and may even need to be demolished.
Hazard events may disrupt services, such as water and electric power, which are required for building
functionality. If water pressure cannot be maintained, then fire hydrants, fire suppression, and sanitary
systems are out of service, and buildings may not be suitable for occupancy.
Designing a building that supports its role in a resilient community requires understanding the social
functions that building supports in the community, and the building performance needed to ensure those
functions during or after a hazard event. Some requirements for resilience may exceed those required by
model building codes and standards.
12.1.3. Dependencies
A community‘s resilience strongly depends on the performance of its buildings. The functionality of most
buildings, in turn, depends on services provided by utilities (e.g., energy, communication, water, and
wastewater) and transportation systems. Conversely, some buildings support the utility systems.
Community resilience requires that dependencies between buildings and supporting infrastructure systems
have compatible performance goals to achieve the desired performance. For example, emergency
operation centers and hospitals are needed during and immediately after a hazard event. However,
supporting power and water infrastructure systems may be damaged. To support community needs during
short-term recovery, critical facilities need to plan to operate without external power and water until those
services are expected to be recovered. Alternatively, the functionality of specific buildings can depend on
the occupants as well. First responders need accessible routes to reach the buildings where equipment is
housed to provide emergency services.
12.2. Building Categories and Functions
Design and construction criteria in building codes and standards are organized according to the desired
performance of the building, based on its intended use, occupancy, and public health, safety, and welfare
considerations. Many buildings are designed according to the building occupancy classifications in the
International Building Code [IBC 2015] and the National Fire Protection Association codes [NFPA
2015], and the risk categories in the American Society of Civil Engineers Standard 7 [ASCE 2010].
The term ―occupancy‖ in building codes refers to the nature of the activities that occur inside the
buildings; fire and life safety provisions are based on the activities. Occupancy classifications can include
assembly, business, day care, education, factory/industrial, high hazard, institutional, mercantile,
residential, storage, utility, and miscellaneous.

Community Resilience Planning Guide for Buildings and Infrastructure Systems - Volume II
Buildings
57
Risks associated with structural failure are addressed separately by risk categories, which relate
exceeding the design loads and associated criteria to the consequence of failure for the structure and its
occupants. Risk categories are distinct from occupancy groups in building codes. Risk categories reflect a
progression of the anticipated seriousness of the consequence of failure from lowest risk (Risk Category
I) to the highest (Risk Category IV). Buildings and other structures are assigned the highest applicable
risk category based on the risk to human life, health, and welfare associated with their damage or failure
by nature of their occupancy or use [ASCE/SEI 2010].
Risk categories are shown in Table 12-1. Risk Category II includes the majority of building types, such as
residential, commercial, and industrial buildings, as well as all other buildings not designated to the other
risk categories. Essential buildings fall under Risk Category IV, which requires the highest level of
reliability. In ASCE/SEI [2010], essential buildings are intended to remain operational in the event of an
extreme flood, wind, snow, or earthquake event. Some buildings that a community may deem as essential
are classified as Risk Category III, which includes buildings and structures that house a large number of
people in one place or those people with limited mobility or ability to travel to a safe haven, including
healthcare facilities, elementary schools, and prisons. This category also includes structures associated
with utilities that protect the health and safety of a community, including power-generating stations and
water and sewage treatment plants. Risk Category III requires a higher level of reliability than Risk
Category II. Minimum design loads for structures are modified by importance factors for each risk
category.
Table 12-1: Risk categories for buildings [ASCE/SEI 2010]
Risk Category Definition
I. Buildings and other structures that represent low risk to human life in the event of failure.
II. All buildings and other structures except those listed in Risk Categories I, III, and IV.
III. Buildings and other structures, the failure of which could pose a substantial risk to human life in
the event of failure.
Buildings and other structures, not included in Risk Category IV, with potential to cause a
substantial economic impact and/or mass disruption of day-to-day civilian life in the event of
failure.
Buildings and other structures not included in Risk Category IV (including, but not limited to,
facilities that manufacture, process, handle, store, use, or dispose of such substances as hazardous
fuels, hazardous chemicals, hazardous waste, or explosives) containing toxic or explosive
substances where the quantity of the material exceeds a threshold quantity established by the
authority having jurisdiction and is sufficient to pose a threat to the public if released.
IV. Buildings and other structures designated as essential facilities.
Buildings and other structures, the failure of which could pose a substantial hazard to the
community.
Buildings and other structures (including, but not limited to, facilities that manufacture, process,
handle, store, use, or dispose of such substances as hazardous fuels, hazardous chemicals, or
hazardous waste) containing sufficient quantities of highly toxic substances where the quantity of
the material exceeds a threshold quantity established by the authority having jurisdiction and is
sufficient to pose a threat to the public if released.
Buildings and other structures required to maintain the functionality of other Risk Category IV
structures.

Community Resilience Planning Guide for Buildings and Infrastructure Systems - Volume II
Buildings
58
Building use and occupancy classifications and risk categories are important parameters for design, but do
not address a key aspect of resilience: time to recovery of function. Four building performance categories
that address recovery are defined in Table 12-2. The reference to tags in Table 12-2 are based on a
methodology established initially for building safety inspections following earthquakes, but is also used
following other hazard events to evaluate structures [ATC 2003]. A red tag indicates severe structural
damaged such that it will likely need to be replaced and is unsafe for occupancy. Similarly, a yellow tag is
used for buildings that are significantly damaged and occupancy of the building will be delayed until it is
repaired. A green tag means has minimal to no damage and can be occupied while minor repairs are
made.
Table 12-2: Performance level definitions for building clusters
Performance Level Definition
A. Safe and
operational
These facilities incur minor damage and continue to function without interruption.
Essential facilities need this level of function.
B. Safe and usable
during repair
These facilities experience moderate damage to their interior finishes, contents and
support systems. They receive green tags when inspected and are safe to occupy after a
hazard event. This performance is suitable for shelter-in-place residential buildings,
neighborhood businesses and services, and other businesses or services deemed important
to community recovery.
C. Safe and not
usable
These facilities meet minimum safety goals, but are not otherwise functional, and remain
closed until they are repaired. These facilities receive yellow tags. This performance may
be suitable for some of the facilities that support the community‘s economy. Demand for
business and market factors will determine how soon they need to be functional.
D. Unsafe – partial or
complete collapse
These facilities are dangerous because the extent of damage make occupancy unsafe.
These buildings receive red tags.
The following sections discuss performance considerations for various building clusters. Performance
goals are set during the resilience planning process (Chapter 4, Volume 1) and summarized in the
performance goals table as discussed in Section 12.3.
There is no established correlation between performance categories and risk categories, although
communities can consider them together for resilience planning. For instance, a building cluster designed
to Risk Category IV criteria may be designated to have Category A performance during recovery.
Achieving such performance will require understanding of the design and maintenance of individual
buildings within the cluster.
12.2.1. Government
In most communities, emergency operations centers, first responder facilities, airports, prisons, and water
and wastewater treatment facilities are government-owned buildings. These buildings provide essential
services, shelter occupants, and shelter equipment that supports essential services. Therefore, essential
buildings should remain operational, as defined by Category A (safe and operational).
Other government buildings may not need to be functional immediately following a hazard event (e.g.,
City Hall or county administrative building, public schools, mass transit stations and garages, judicial
courts, and community centers). However, these buildings may be needed during the intermediate

Community Resilience Planning Guide for Buildings and Infrastructure Systems - Volume II
Buildings
59
recovery phase. An appropriate performance goal for these types of buildings might be either Category A
(safe and operational) or Category B (safe and usable during repair), depending on their role in the
community recovery plan.
12.2.2. Health Care
Emergency medical facilities are critical to response and recovery efforts. Therefore hospitals, essential
health care facilities, and their supporting infrastructure, should be functional (Category A) during and
following a hazard event. While the entire facility may not need to be fully operational, critical functions,
such as the emergency room and life support systems, should be operational as other functions are
restored. Hospitals are designed to Risk Category IV requirements. Some local communities or federal
agencies impose additional requirements. For example, California requires that all hospital designs,
regardless of location or ownership (municipal or private), be reviewed and construction overseen by a
state agency, in addition to review by local building officials.
Nursing homes and residential treatment facilities that house patients who cannot care for themselves
should be functional immediately after a hazard event. Communities can determine which subset of
doctors‘ offices, pharmacies for access to medicines, and outpatient clinics for dialysis or other urgent,
ongoing treatments will also be need to remain functional. Some medical office buildings and pharmacies
may need to be designed to perform to Performance Category A or B, depending on their role in
community recovery and resilience. In most cases, buildings for these types of medical offices are
currently designed as Risk Category II buildings.
12.2.3. Schools and Daycare Centers
Many schools (K-12) are designed to a higher performance level (Risk Category III) because they house
large assemblies of children. Additionally, school gymnasiums or other areas often are designated as
emergency shelters during hazard events. Schools may also be designated as emergency staging areas
after a hazard event. Additionally, the SPUR [2009] Resilience City Initiative found that when children
return to day care and school, the community is perceived as returning to normal and parents can return to
work. Thus, expeditious resumption of function is important for schools across a community.
There can be a mix of performance requirements for schools or other designated buildings. For normal
use, a school may be designed for Risk Category III and Performance Category B. However, if the school
or some portion of the school is used as an emergency shelter, that requires Risk Category A
performance. Depending on the hazard, the Risk Category III provisions to which most primary schools
are designed may provide Performance Category A or B performance. Therefore, any school designated
as an emergency shelter should be evaluated to ensure it is appropriately designed for its intended use.
Higher education facilities are generally regulated as business (Risk Category II) or assembly (Risk
Category III) occupancies with exceptions for specific uses, such as laboratory and other research uses.
Research universities may be concerned with protecting their research facilities, long-term experiments,
associated specimens and data. However, such facilities may not have been initially designed for
protection of data and specimens during hazard events, or timely recovery of function.
Daycare centers house young children that require mobility assistance and are unable to make decisions,
but daycare populations may not meet assembly requirements of Risk Category III. Therefore, such
centers may be located in buildings that meet Risk Category II requirements. In some communities, there
are additional requirements for daycare occupancies; in other instances there are few constraints beyond
basic code requirements for Risk Category II buildings. Communities may decide to require that daycare
centers be designed to a higher level of performance, similar to school buildings.

Community Resilience Planning Guide for Buildings and Infrastructure Systems - Volume II
Buildings
60
12.2.4. Religious and Spiritual Centers
Religious and spiritual centers play a special role in communities. They can offer a safe haven for people
with emotional distress following a hazard event. Often, these buildings play a role in post-event
recovery. Many religious organizations operate charity networks that provide supplies to people following
a hazard event. In past disasters, many religious institutions opened their doors to provide temporary
housing. Newer buildings may be designed as Risk Category II or III buildings. These buildings can also
be among the oldest in a community, and built with materials and construction methods that perform
poorly in hazard events.
If these facilities fill an important role in the community recovery plan, Performance Category B would
be desired. However, a number of factors could influence their role in community recovery. First, most of
these institutions are nonprofit entities, with little funding for infrastructure improvement. Second, many
that are historic buildings would have to be modified to meet desired performance goals. Therefore, a
community should understand the anticipated performance of its religious and spiritual centers and their
role in community recovery.
12.2.5. Residential and Hospitality
Communities should consider whether residential buildings and neighborhoods will shelter a significant
portion of the population following a hazard event. Houses, apartment buildings, and condominiums need
not be fully functional, like a hospital or emergency operation center, but they should safely house
occupants to support recovery and re-opening of businesses and schools. However, higher performance
goals should be developed for facilities that house vulnerable residents, such as nursing homes and senior
living centers. A house or apartment may be without power or water for a reasonable period of time (e.g.
days to 1-2 weeks), but can be safely occupied. The significant destruction of neighborhoods and the
supporting built environment led to the migration of a significant portion of the population following
Hurricane Katrina‘s impact on New Orleans [Plyer 2015]. Such a shelter-in-place performance level is
key to the SPUR [2009] Resilient City initiative and prompted the City of San Francisco to mandate a
retrofit ordinance for vulnerable multi-family housing.
Currently, multi-unit residential structures are typically designed to Risk Category II provisions, except
where the number of occupants is quite large (e.g., > 5,000 people); then the designs should meet Risk
Category III criteria. For multi-family residential structures, there are two dominant construction types:
light frame (wood and cold-formed steel) construction and structural (hot rolled) steel or reinforced
concrete construction. Light frame residential structures have different performance issues than structural
steel or reinforced concrete buildings, which are typically larger.
Most new one and two-family dwellings are constructed in accordance with the International Residential
Code [IRC 2015]. The prescriptive provisions of the IRC are mostly consistent with those required for a
Risk Category II building. One- and two-family dwellings constructed in accordance with a building code
have generally performed well in earthquakes at the routine or design hazard level. In some cases, such as
the Loma Prieta and Northridge earthquakes, one and two-family dwellings performed as well as or better
than engineered buildings. However, their performance in design-level windstorms can be quite variable,
depending on construction features, such as a continuous load path, type of cladding, or roof geometry.
An effective response to some hazard events may require first responders and personnel from outside the
community. If most residential buildings are not functional or safe to occupy, demand for temporary
shelter for residents may compete with the need to temporarily house response and recovery workers.
Hotels and motels can support response and recovery efforts if they are operational shortly after the event.
Typically these buildings are designed to meet Risk Category II criteria, like multi-family residential
structures, and may need to be evaluated for their anticipated performance if they are needed for
community recovery.

Community Resilience Planning Guide for Buildings and Infrastructure Systems - Volume II
Buildings
61
12.2.6. Business and Services
While it would be ideal to have all community businesses open shortly after a hazard event, such an
outcome may not be practical. Many business offices, retail stores, and manufacturing plants are located
in older buildings that may not perform well during a hazard event. If constructed more recently, the
buildings may be designed to Risk Category II criteria. However, some commercial buildings may be
designed to higher performance levels.
Each community should select design and recovery performance goals for its businesses and services,
depending on their role in community recovery. Certain types of commercial buildings may be critical to
the recovery effort. The community needs to identify businesses that are critical to community recovery
and able to meet the desired performance level. Some businesses and services that are commonly essential
to recovery include:
Grocery stores and pharmacies – People need food, water, medicine, and first aid supplies
following a hazard event. Regional or national grocery stores and pharmacies typically have
robust distribution networks that can replenish supplies. Although the common preparedness
recommendation is for people to have 72 hours of food and water on hand, no assumptions should
be made about actual adherence to this 72-hour guidance. Moreover, the potential for disruption
beyond three days should be evaluated based on the prevalent hazard and the condition of
buildings and physical infrastructure. For example, the Oregon Resilience Plan [OSSPAC 2013]
recommends that people have two weeks of food and water on hand for a Cascadia earthquake
event.
Banks or financial institutions – Banks or structures that house automated teller machines
provide access to money if they have an independent power source and internet communications.
Hardware and home improvement stores – These businesses provide building materials for
repairs, reconstruction, and emergency shoring of damaged buildings.
Gas stations and petroleum refineries – Many communities rely on automobiles and trucks for
most transportation functions. Gasoline may be difficult to obtain for a period of time. Some
homes and businesses may rely on emergency generators during electrical outages if they have
fuel. A disruptive event may impact fuel delivery systems, which can be significant during cold
weather when heating is also required.
Buildings and other structures containing toxic or explosive substances may be classified as Risk
Category II structures if it can be demonstrated that the risk to the public from a release of these materials
is minimal. However, communities should verify that the risk management plan addresses community
hazards, and any potential releases that may occur during or after a hazard event.
The resilience needs of other types of businesses, and the buildings that house them, depend to a large
extent on the business and community‘s tolerance for those businesses to be delayed in reopening or
closed. Many professional service businesses can rely on employees working remotely from home or
alternate office spaces. Manufacturing, retail, and food service businesses may not have that luxury.
Customers and their employees need to travel to their location. If a restaurant or store cannot serve the
public or a factory is unable to manufacture its product, then the business may fail. Losing these
businesses can adversely impact the community‘s recovery and long-term resilience because of lost jobs
and other economic impacts.
12.2.7. Conference and Event Venues
Convention centers, stadiums, and other large event venues can be important for the long term recovery of
many communities because of the revenue these types of events can generate. Typically these venues are

Community Resilience Planning Guide for Buildings and Infrastructure Systems - Volume II
Buildings
62
designed to meet Risk Category III criteria because of the large number of occupants. However, they may
need additional improvements before being considered for temporary use as a shelter or recovery staging
area, including requirements beyond structural considerations if they are to be used for these purposes.
Supporting physical infrastructure systems as well as the viability of supplying food and water should be
taken into account.
12.2.8. Detention and Correctional Facilities
Many communities have standalone detention centers and prisons. Building codes typically require higher
performance and risk categories for these types of facilities because the people housed in them cannot
evacuate without supervision. The level of enhanced design requirements varies based on the facility
requirements and federal, state, or local jurisdiction. It is suggested that these types of facility clusters be
designed to Category A or B performance.
12.3. Performance Goals
The desired and anticipated performance of a building cluster, and its timely recovery of function, need to
be considered from a community resilience perspective. A summary of the gaps between the desired and
anticipated performance for building clusters can be summarized using a resilience table. Table 12-3
shows an example resilience table for building clusters that were evaluated for a specific hazard type
(e.g., wind, flood, earthquake, etc.) and hazard level (e.g., routine, design, or extreme). The disturbance
criteria and restoration levels listed at the top of Table 12-3 summarize the anticipated overall impact on
the community. They are further discussed in Chapter 4 of Volume 1.
Since communities are constructed for prevailing hazards, the design hazard level provides the foundation
for resilience planning. Examining the response of buildings and infrastructure systems to multiple levels
of a hazard (i.e., routine, design, and extreme) can provide insight and understanding regarding system
performance. For example, a building or infrastructure systems may not perform well at the routine level,
especially older systems developed with older codes and methods or those that are not well maintained. If
the building or infrastructure system has an important role in the community, it may trigger cascading
effects in other buildings or systems. Such performance indicates that mitigation or retrofit options may
be required to improve community functionality for routine events.
For buildings, a community should identify clusters for which the same performance goals are desired.
The example table can be used by any community, whether large, small, urban, or rural, as the assignment
of buildings to clusters is decided by each community. The building clusters listed in the left column of
Table 12-3 are grouped as critical facilities, emergency housing, housing/neighborhoods, and community
recovery. These groups are intended to reflect a typical sequence for recovery of function following a
hazard event.
The desired rate of recovery is indicated by percentages, 30 %, 60 %, and 90 %, to indicate how many
buildings within the cluster are recovered and functioning during the three recovery phases (e.g., short-
term, intermediate, and long-term) across the top row of the table.
Anticipated performance of the existing construction for each building cluster is estimated (at the 90 %
level) for the selected hazard event and also recorded in the table. The difference between the desired 90
% restoration level and the anticipated 90 % performance level indicates the gap that needs to be
addressed to improve community resilience.
In Phase I of recovery, building function may initially be restored at a minimum or interim level to
support essential tasks that start the recovery process. For example, an emergency operations center
(EOC) in city hall may have enough power provided to support lighting, phones, and computers for the
EOC, but not the entire building.

Community Resilience Planning Guide for Buildings and Infrastructure Systems - Volume II
Buildings
63
Table 12-3: Example table for building performance goals to be filled out by the community and its
stakeholders
Disturbance 1 Restoration Levels 2,3
Hazard Type Any 30% Function Restored
Hazard Level Routine, Design, Extreme 60% Function Restored
Affected Area Localized, Community, Regional 90% Function Restored
Disruption Level Usual, Moderate, Severe X Anticipated Performance
Building Clusters Support
Needed4
Design Hazard Performance
Phase 1
Short-Term
Phase 2
Intermediate
Phase 3
Long-Term
Days Weeks Months
0 1 1-3 1-4 4-8 8-12 4 4-24 24+
Building Performance Category
A B C D
Critical Facilities
Emergency Operation Centers
First Responder Facilities
Acute Care Hospitals
Non-ambulatory Occupants (prisons, nursing
homes, etc.)
Emergency Housing
Temporary Emergency Shelters
Single and Multi-family Housing (Shelter in place)
Housing/Neighborhoods
Critical Retail
Religious and Spiritual Centers
Single and Multi-family Housing (Functional)
Schools
Hotels & Motels
Community Recovery
Businesses - Manufacturing
Businesses - Commodity Services
Businesses - Service Professions
Conference & Event Venues
Footnotes:
1 Specify hazard type being considered
Specify hazard level – Routine, Design, Extreme
Specify the anticipated size of the area affected – Local, Community, Regional
Specify anticipated severity of disruption – Minor, Moderate, Severe
2 30% 60% 90% Desired restoration times for percentage of elements within the cluster
3 X Anticipated performance for 90 % restoration of cluster for existing buildings and infrastructure systems
Cluster recovery times will be shown on the Summary Matrix
4 Indicate levels of support anticipated by plan
R = Regional; S= State; MS=Multi-State; C = Civil (Corporate/Local)

Community Resilience Planning Guide for Buildings and Infrastructure Systems - Volume II
Buildings
64
It is difficult for designers to specify repair
times for anticipated damage, as there are
numerous sources of uncertainty. However,
based on best practices, historical events,
and expert judgment, designers can estimate
anticipated levels of damage and based on
that, assign a likelihood that the buildings
within a cluster will be functional.
Existing buildings in suburban and urban
communities were designed and constructed
under the building codes in force at that
time, potentially creating a range of
performance levels for the same type of
buildings. Rural towns or unincorporated
areas may have large stocks of buildings not
constructed to any code, or at least predating
modern building codes. Sometimes, older
buildings were designed using provisions
that were later found to be inadequate, but
rarely are new provisions retroactively applied. Figure 12-1 shows a partially collapsed unreinforced
masonry building following a major earthquake. This type of construction performs poorly in
earthquakes, but many communities have not mandated retrofitting these types of buildings to avoid
damage or collapse.
As part of developing desired performance goals for building clusters, the community should identify
whether any types of buildings pose a significant safety hazard to occupants or the public. Mitigation or
retrofit programs can be developed to address buildings that pose a significant safety hazard, such as
unreinforced masonry building retrofit ordinances, requirements for elevated construction in a flood plain,
or requiring storm shelters in new homes.
The following paragraphs summarize expected performance for seismic, flood, and wind events for each
Performance Category.
Performance Category A buildings should require little repair to return to function. Often recovery of
function is limited by outside factors such as the availability of power or water. Essential facilities should
have plans for providing onsite power and water after a hazard event.
Seismic events: There may be some damage to a Category A building, but the damage can easily be
addressed (i.e., toppled shelves or cosmetic damage to the structure) as shown in Figure 12-2.
Flood events: Category A buildings are expected to have damage limited primarily to the exposed
portions of the building exterior. If buildings are properly elevated, floodwaters may reach subflooring
and building infrastructure systems but should not overtop the first floor or wet the interior. Figure 12-3
shows an example of minor flood damage.
Wind events: Buildings may experience minor damage to roof coverings, openings (e.g., less than 10 % of
doors and windows broken), and exterior finishes. Figure 12-4 illustrates minor wind damage.
Performance Category B buildings are expected to sustain damage to building contents, finishes, and
cladding systems, but the building should be structurally stable. There may be significant nonstructural
damage, but the building can be used while repairs are made.
Figure 12-1: Failure of unreinforced masonry wall
during an earthquake event

Community Resilience Planning Guide for Buildings and Infrastructure Systems - Volume II
Buildings
65
Seismic events: Figure 12-5 shows pictures of significant nonstructural damage inside a building that was
structurally stable following an earthquake event. It may take up to several weeks to repair minor damage
to walls or cladding systems and clean up fallen contents .
Figure 12-2: Non-structural damage to
interior finishes following an earthquake event
Figure 12-3: Floodwaters reached just under the first
floor on this building.
Figure 12-4: Damage to roof covering, vinyl
siding and fascia as the result of wind
Figure 12-5: Significant nonstructural damage
inside structurally stable building after earthquake
event
Flood events: Buildings may sustain moderate damage for a limited depth of flooding over the first floor.
The foundation may have minor undermining or scour. Exterior and interior walls may have water stains
and possible contamination that requires replacement. Floors and electrical systems may require
replacement if wetted. While the building may be structurally stable, it may not be safe for use until
properly dried and cleaned to prevent mold growth, or the drywall is replaced. Figure 12-6 show
examples of moderate flood damage.
Wind events: Moderate wind damage may include moderate to major damage to roofing systems and
exterior finishes. There may be some interior water damage from wind-driven rain. Figure 12-7 shows
moderate wind damage.

Community Resilience Planning Guide for Buildings and Infrastructure Systems - Volume II
Buildings
66
Figure 12-6: As a result of an estimated 0.9-1.2 m (3-4
ft) of flooding, interior walls had to be replaced as well
as an exterior door and window. [Source: FEMA]
Figure 12-7: Siding loss and minor envelope
damage on low-rise building from a wind
event [Source: FEMA]
Performance Category C buildings are expected to have significant nonstructural and some structural
damage. The structural damage should not cause structural instability, but may require shoring while
repairs are conducted. This level of damage may take weeks to months to repair.
Seismic events: Figure 12-8 shows structural damage, but the structure remains stable. Figure 12-9 shows
one of ten fractured brace connections in one story of a four story building after a seismic event. Repairs
took over three months before the building could be reoccupied.
Figure 12-8: Apartment building with damaged
structural members that is structurally stable
Figure 12-9: Fractured brace connection in a
building damaged in an earthquake
Flood events: For flood depths above the first floor or floods with moving water, foundation damage that
could include settlement and severe scour and undermining may occur. Exterior walls may be severely
damaged with large missing sections. Interior floor and wall finishes will need replacement. Limited
deformation of the structural frame may be evident, though the structure remains stable. Proper drying

Community Resilience Planning Guide for Buildings and Infrastructure Systems - Volume II
Buildings
67
and cleaning is necessary prior to prevent mold growth, or the drywall is replaced. Figure 12-10 shows
severe damage as the result of flooding.
Wind events: Building damage may include major roof sheathing loss, extensive interior water damage,
and minor to major cladding damage. Additionally, roof damage may occur where the roof framing is
uplifted from the walls. Extensive repairs and replacement of interior finishes and cladding systems may
be required. Figure 12-11 shows severe wind damage.
Figure 12-10: Foundation wall collapse due to
hydrostatic pressure from floodwaters [Source:
FEMA]
Figure 12-11: Wind and wind-borne debris
resulted in considerable damage to glazing on this
building. [Source: FEMA]
Performance Category D buildings cannot be
used or occupied after a hazard event. Severe
damage or collapse may occur. This level of
damage may require removal and new
construction.
The example in Figure 12-12 shows structural
collapse as the result of flood and wind events.
Such severe damage requires demolition and
rebuilding, possibly in a new location.
12.4. Regulatory Environment
Building construction throughout the United
States is regulated by each community (the local
jurisdiction) based on the building codes they
adopt. These building codes are based on model
codes and amended as needed to match the local
conditions. Amendments to the model code are often governed by state regulations which vary widely.
Some states do not permit modification by local jurisdictions.
Typically the local jurisdiction should assure initial construction provides a reasonable degree of safety to
building users and occupants. After a certificate of occupancy is issued, there are generally no inspection
or maintenance requirements for residential properties, and generally only annual fire safety inspections
for commercial buildings. Some building owners voluntarily monitor the condition of their buildings and
Figure 12-12: Collapse of five-story building due
to undermining (from flooding) of shallow
foundation [Source: FEMA]

Community Resilience Planning Guide for Buildings and Infrastructure Systems - Volume II
Buildings
68
upgrade them as needed. Buildings owned or leased by the federal government are designed and
constructed to federal government standards.
Model building codes are developed at the national level for adoption across the country. In the U.S., two
organizations publish model building codes for adoption by federal agencies or state and local
governments. One is published by the International Code Council, which formed as a merger of three
organizations that published regional model building codes. The other code is published by the National
Fire Protection Association. The ICC‘s International Building Code is the most widely adopted model
building codes; and the International Fire Code [ICC 2009] is the most widely adopted model fire code in
the U.S. Most federal agencies also use these codes, with agency-specific amendments, as the basis for
their building requirements. These codes contain many reference standards that are typically published by
non-profit standards development organizations, professional societies, and industry groups. Model
building codes and the referenced standards may be modified by federal, state, and local agencies for their
specific purposes.
While the model building codes specify minimum requirements that are applicable throughout the
country, states and local municipalities may modify the model building codes to achieve specific goals for
local or regional hazards. For example, in areas of Florida, building codes were changed to require more
hurricane-resilient construction following Hurricane Andrew [Tsikoudakis 2012]. Code changes included
requiring certain types of roofing materials, stronger windows and doors, and greater inspection and
enforcement.
Alternatively, some states and local jurisdictions adopt, but amend or remove requirements in model
building codes, to make them less stringent. Some states have codes that restrict or preclude modifications
by local jurisdictions. Communities may need to coordinate with state officials to facilitate local adoption
of code criteria that are more stringent than those of the statewide code. Similarly, jurisdictions may be
limited from imposing requirements on regulated systems (e.g., energy, communication). Some
jurisdictions only adopt the model code for government-owned or specific occupancy buildings, but not
for all buildings in their community. Some communities do not adopt or enforce any building code.
Enforcing building codes and construction standards is as important as adopting building codes and
standards. The level of enforcement can significantly impact resilience. Even if the most up-to-date
building code and standards are in effect, buildings designed and constructed in a substandard manner
negatively impact community resilience. Therefore, having a properly trained building department to
review designs for code conformance and inspect construction for conformance with the approved plans,
is an essential component of community resilience.
12.5. Codes and Standards
The International Building Code [IBC 2015], a commonly adopted model building code, was developed
to provide design requirements that ―safeguard public health, safety and general welfare through
structural strength, means of egress facilities, stability, sanitation, adequate light and ventilation, energy
conservation, safety to life and property from fire and other hazards attributed to the building
environment, and to provide safety to fire fighters and emergency responders during emergency
operations.‖
The International Residential Code [IRC 2015] is widely adopted for residential construction not more
than three stories in height. The IRC consists of prescriptive code provisions, tables, and figures that can
be used to construct a dwelling without requiring a registered design professional.
The International Existing Building Code [IEBC 2015] is used for modifying existing structures,
including alterations, repairs, additions, relocation, or changes in occupancy. The IEBC provides
flexibility in the use of alternative approaches to achieve compliance with its requirements.

Community Resilience Planning Guide for Buildings and Infrastructure Systems - Volume II
Buildings
69
The International Code Council Performance Code [ICC 2015] provides a procedure to address design
and review issues associated with the alternative materials and methods sections of the IBC, IRC, and
IEBC codes for new and existing buildings.
The expected performance of each building depends upon the codes and standards enforced at the time of
construction, as well as the level of enforcement and maintenance. Building codes and standards are
dynamic and improved on a regular basis. Many changes to codes and standards are due to development
of new materials and technologies, in response to disasters, or new research on perceived weaknesses.
The evolving nature of building codes and enforcement, combined with the degradation that occurs over
time, results in a building stock with variable capacities to resist hazard events. Unless buildings undergo
major renovation, they generally are not expected to upgrade to current building codes. See Section 12.6.3
in this chapter.
Building codes and standards for new construction are based on consensus of best practices and design
methods at the time they are written. After a significant hazard event, the building code may be modified
based on observed damage or failures. Some provisions, when changed, become retroactive or are
enforced during renovations. Examples of these are egress protection, accessibility for differently abled
persons, and fire suppression system requirements.
Codes and standards also play an important role when evaluating the performance of a community‘s
existing building stock. The mix of building types, construction, and age can create significant challenges
when developing plans for a resilient community. Knowledge of past adoption and enforcement of codes
and standards will improve understanding of anticipated performance of building clusters and the
associated time to recovery of function.
12.5.1. New Construction
Appropriate design criteria for new construction are needed to achieve long-term community resilience
goals. Revisions to the model codes may be needed to achieve a community‘s desired performance . Such
changes may add incremental costs, but they are minor relative to costs associated with repairs,
retrofitting existing buildings, or rebuilding.
Table 12-4 shows hazard levels for buildings and other structures (copied from Chapter 4, Volume I). The
table is based on ASCE 7-10 [ASCE/SEI 2010]. The hazards are listed in two ways that convey the same
probability of occurrence: as an average interval of occurrence over time between events with the same
intensity or magnitude (mean recurrence interval, MRI) or as the probability the event level occurring
over a 50-year time period. The probability of occurrence description helps convey the relative likelihood
of hazard event occurrence for the same time period. For each prevailing hazard, communities are
encouraged to determine three hazard levels for planning: routine, design, and extreme.
The routine hazard level is below the design level for the built environment and occurs more frequently.
This event has a high probability of occurring (on the order of 50 % over a 50-year period). At this level,
resilient buildings and infrastructure systems should remain functional and not experience any significant
damage that would disrupt social functions in the community.
The design hazard level is used in codes and standards for buildings, bridges, and similar physical
infrastructure systems. Design-level events tend to have a probability of occurring on the order of 10 %
over a 50-year period for ordinary structures, and corresponds with Risk Category II design criteria for
buildings. The design hazard level for a specific building or infrastructure component may be greater,
based on its occupancy and risk category classifications. To support community resilience, buildings and
infrastructure systems should remain sufficiently functional to support the response and recovery of the
community.

Community Resilience Planning Guide for Buildings and Infrastructure Systems - Volume II
Buildings
70
The extreme hazard level exceeds the design level for the built environment. (Seismic ground motion
hazards refer to the maximum considered event, which has a probabilistic basis that is supplemented with
historical data). Extreme events have a small probability of occurrence, on the order of 2 % to 3 % over a
50-year period. The extreme hazard level should include rare hazards which may plausibly impact a
community, and may include anticipated long-term changes in hazards due to climate change. Critical
facilities and infrastructure systems should remain partially functional, with ability to support the
response and recovery of the community. Other buildings and infrastructure systems should perform at a
level that protects the occupants, though they may need to be rescued and the buildings may not be safely
occupied until major repairs are completed – or may need to be demolished and rebuilt.
Where hazard levels are not defined by code, the community may establish a scenario or hazard level
based on available guidance or predicted frequency of occurrence. This case is indicated in Table 12-4 by
locally determined.
Table 12-4: Hazard levels for buildings and facilities
Hazard Routine Design Extreme
Ground Snow 50 year MRI or
64% in 50 years
300 to 500 year MRI1 or
15 to 10% in 50 years
TBD 4
Rain Locally determined 2
Locally determined 2
Locally determined 2
Wind – Non-Hurricane 50 to 100 year MRI or
64 to 39% in 50 years
700 year MRI or
7% in 50 year
1,700 year MRI 3 or
3% in 50 years
Wind – Hurricane 50 to 100 year MRI or
64 to 39% in 50 years
700 year MRI or
7% in 50 years
1,700 year MRI 3 or
3% in 50 years
Wind – Tornado Locally determined 3
Locally determined 3
Locally determined 3
Earthquake4
50 year MRI or
64% in 50 years
500 year MRI or
10% in 50 years
2,500 year MRI or
2% in 50 years
Tsunami Locally determined3 Locally determined
3 Locally determined
3
Flood Locally determined 100 to 500 year MRI or
39 to 10% in 50 years
Locally determined
Fire – Wildfire Locally determined 4
Locally determined 4
Locally determined 4
Fire –Urban/Manmade Locally determined 4
Locally determined 4
Locally determined 4
Blast / Terrorism Locally determined 5
Locally determined 5
Locally determined 5
1 For the northeast, 1.6 (the Load and Resistance Factor Design (LRFD) factor on snow load) times the 50-year
ground snow load is equivalent to the 300 to 500 year snow load. 2 Rain is designed by rainfall intensity of inches per hour or mm/h, as specified by the local code.
3 Tornado and tsunami loads are not addressed in ASCE 7-10. Tornadoes are presently classified by the EF scale.
See FEMA 361 [2015] for tornado EF-scale wind speeds. 4 Hazards to be determined in conjunction with design professionals based on deterministic scenarios.
5 Hazards to be determined based on deterministic scenarios.

Community Resilience Planning Guide for Buildings and Infrastructure Systems - Volume II
Buildings
71
Wind hazards. ASCE 7-10 [ASCE/SEI 2010] prescribes design wind speeds for each Risk Category. For
Risk Category I, the mean return period is 300 years for facilities that have a low risk to human life and
are typically unoccupied buildings. For Risk Category II facilities, that include typical buildings and other
structures, the return period is 700 years. For Risk Category III and IV facilities, the return period is 1,700
years. The wind speeds derived from these return periods are based on extratropical (non-hurricane)
winds and hurricane winds. Tornado wind loads are not currently required to be considered in building
design except for the design of tornado shelters. FEMA P-361 [2015a] and ICC-500 [2014] both provide
tornadic wind loading and design guidance for these shelters.
The majority of wind design requirements address the structural frame and cladding systems.
Requirements for functionality are indirectly addressed through design methods and requirements, such as
attachment strength of nonstructural components (e.g., piping systems or exterior panels). The IBC
requires consideration of a drift (i.e., lateral displacement) limit between stories under a reduced wind
load (the factor approximates a 100-year MRI). There are no explicit structural design requirements for
the building envelope to ensure post-event function, but there are some prescriptive requirements for
doors and windows.
Snow hazards. ASCE 7-10 snow design loads are based on a 50-year mean recurrence interval for ground
snow loads. It is increased with an importance factor for higher Risk Category structures.
Rain hazards. ASCE 7-10 rain design loads are based on a 100-year rain storm with a time dependent
(usually 60 minutes) rainfall rate as the design hazard, with loads increased by 60 % to account for
uncertainty in predicting rainfall in a major event. However, the majority of rain provisions relate to
providing proper drainage and stiffness to the roof to prevent ponding (i.e., sagging of the roof surface
that results in a pond of water). There are no code requirements for the building envelope to maintain its
ability to prevent water infiltration.
Flood hazards. Flood design provisions for all buildings are typically based on a 100-year MRI for flood
elevation, though 500-year flood elevations are recommended for design of critical facilities.
Recommended practice is to locate buildings out of the 100-year flood zone. If they must be within the
flood zone, floodplain management provisions and building codes require that they be elevated above the
design flood elevation. Buildings with nonresidential uses may be dry flood-proofed up to the design
flood elevation if they are not subject to wave forces or high velocity floods. For structures subject to
flood, the current provisions provide methods to avoid or resist flood forces, but may not be sufficient to
preserve functionality of the building during a flood event.
Flood design provisions are neither fully prescriptive or performance based. Instead, they are a mixture of
the two. Elevation requirements are considered prescriptive because the elevation is mandated by flood
maps and local codes. Other requirements, such as building designs that resist flotation, collapse, and
lateral movement, design will be performance based.
Seismic hazards. It has long been recognized that designing for seismic events requires a different
approach from other hazards. ASCE 7-10 seismic forces and design requirements allow buildings to be
damaged, but not collapse. Following the 1971 San Fernando earthquake, hospitals were required to be
designed to a higher standard, significantly improving their likelihood of remaining functional following
the design earthquake.
The emphasis placed on the design requirements for nonstructural systems is an important distinction
between seismic design provisions and design provisions for other natural hazards [FEMA 2009a, ASCE
2010]. Many nonstructural systems have bracing requirements. In addition to the bracing requirements,
nonstructural systems in essential facilities or systems that support life-safety should maintain function or
immediately return to function following the design seismic hazard.
Fire hazards. The performance of buildings during fires is addressed through building and fire codes. The
height, area, design, and construction materials for a building as well as its separation distance from other

Community Resilience Planning Guide for Buildings and Infrastructure Systems - Volume II
Buildings
72
structures are all limited by fire considerations in the building code. Building officials regulate the design
and construction of new construction, but typically fire officials at the state and local levels enforce the
fire code. A fire code is primarily intended to advance fire and life safety for the public and first
responders as well as for property protection. Requirements cover a range of fire and life safety issues
related to the operation and use of the building after it has been constructed, including the maintenance
and use of fire protection systems and equipment, occupant safety and hazards management. Fire codes
also reference many standards that address inspection and maintenance requirements of fire protection
systems, equipment, flammable and combustible liquids, liquefied petroleum (LP) gas, hazardous
processes, and other related issues.
Building codes originated as local regulations to address fire and public health. Passive fire protection
requirements include limitations on construction materials and interior finishes, and compartmentation, as
well as providing paths of egress for building occupants. Requirements for active fire protection systems,
such as automatic fire sprinkler systems in residential, health care, and assembly buildings, are also
provided. After the WTC disaster, the scope of the building codes was expanded to include protection for
emergency responders following a major event.
Fire threats that originate outside the building have traditionally been addressed through provisions for
exterior fire separation and exterior finish materials. More recently, as the number of structures located in
the wildland-urban interface (WUI) has increased, the threat of fire spread from wildfires is being
addressed. Some state and local municipalities have guidelines or code requirements that limit or prohibit
the use of combustible exterior materials and surrounding vegetation for buildings located in wild fire
hazard areas. Examples of requirements are prohibition on specific roof and siding materials. Additional
guidance may be found in the International Wildland-Urban Interface Code [ICC 2011] and the National
Fire Protection Association (NFPA) FireWise Communities Program [NFPA 2015].
Human-caused hazards. Codes and standards do not have explicit structural design requirements for
human-caused hazards (e.g., arson, explosions or impact events), although some nominal provisions
attempt to provide robustness to arrest the spread of damage so disproportionate collapse does not occur.
Many requirements in the IBC require facility layout and hazard mitigation measures to prevent
explosions of building contents. Guidelines for design of human-caused hazards do exist for specific
buildings [FEMA 2003, FEMA 2005], federal buildings [DoD 2008] and industrial facilities. Such
guidelines may have restricted distribution because they contain proprietary or security-sensitive
information.
12.5.2. Existing Buildings
Existing buildings often pose greater challenges than new buildings. For new buildings, codes can be
amended or re-written. Although construction costs may increase somewhat, new buildings would be
designed for the state-of-the-practice. Retrofit of existing buildings to the desired level of resilience, in
contrast, can require significant financial commitment and necessitate major disruption to the building‘s
function, which tends to dissuade building owners from retrofit.
The cost and disruption associated with retrofit can also make mandating retrofit measures a politically
unpopular decision. In California, for example, only unreinforced masonry buildings have had widespread
support as a building type that should be mandated for retrofit since they are most vulnerable to collapse
during an earthquake.
For buildings constructed prior to development of flood provisions or a community‘s adoption of flood
provisions, there is a trigger in the National Flood Insurance Program (NFIP) requiring retrofit to meet
current flood provisions. Buildings within designated flood hazard areas (generally the 100-year
floodplain) that sustain damage of any origin, for which the cost to repair the building to its pre-damage

Community Resilience Planning Guide for Buildings and Infrastructure Systems - Volume II
Buildings
73
conditions equals or exceeds 50 percent of the market value of the building, must be brought into
compliance with current flood provisions.
The same is true for improvements or rehabilitation of buildings when the cost equals or exceeds this
threshold. The International Existing Building Code (IEBC) regulates repairs, alterations, additions, and
change of occupancy dictates various triggers of this type for when retrofit must be done. However,
enforcement of this requirement can be challenging, particularly in a post-disaster environment when
communities are anxious to support building owners in reconstruction.
12.6. Strategies for Implementing Plans for Community Resilience
12.6.1. Available Guidance
Current engineering standards provide tools to support assessment of the structural safety of buildings.
ASCE/SEI 41 [2013], the seismic standard for evaluating and retrofitting existing buildings, provides a
methodology to assess the performance of buildings for both safety and reoccupation following an
earthquake. FEMA P-420 Engineering Guidelines for Incremental Strengthening provides information
related to retrofitting buildings over a period of time. Applied Technology Council (ATC)-45 [2004]
provides an assessment methodology and re-occupancy guide for damage related to wind and flood
events. Similar standards do not exist for other hazards.
Building code provisions can be used to determine whether a building has sufficient fire resistance,
egress, and other occupant safety-related issues. These methodologies are useful for individual building
safety, but do not address damage levels and recovery time to function.
Hazus [FEMA 2015b] provides a tool for communities to assess their vulnerability to earthquakes,
hurricanes, and other hazards. Hazus is useful for assessing effects of a disaster on a community.
However, the existing building stock should be adequately reflected in the model, which can require
significant data gathering.
Several resources exist for property owners, designers and communities to use to better understand best
practices for wind and flood resistant design and construction including:
FEMA P-55 (Volumes I and II [2011]), Coastal Construction Manual: Principles and Practices of
Planning, Siting, Designing, Constructing, and Maintaining Residential Buildings in Coastal
Areas
FEMA P-259 [2012a], Engineering Principles and Practices for Retrofitting Floodprone
Buildings
FEMA P-312 [2014], Homeowner's Guide to Retrofitting Six Ways to Protect Home Flooding
FEMA P-424 [2010a], Design Guide Improve School Safety EQ, Floods, and High Winds
FEMA P-499 [2010b], Home Builder‘s Guide to Coastal Construction: Technical Fact Sheet
Series
FEMA P-550 [2009b], Recommended Residential Construction for Coastal Areas: Building on
Strong and Safe Foundations
FEMA P-804 [2010c], Wind Retrofit Guide for Residential Buildings
FEMA P-936 [2013], Floodproofing Non-Residential Buildings
ICC 600 [2008], Standard for Residential Construction in High-Wind Regions
ATC [2009] Design Guide 2, Basic Wind Engineering for Low-Rise Buildings.

Community Resilience Planning Guide for Buildings and Infrastructure Systems - Volume II
Buildings
74
12.6.2. Solutions for Future Construction
For future construction, desired performance goals and current adopted building codes should be
evaluated to determine if additional local requirements are required. Risk categories currently in the
building codes can support the desired levels of performance and resilience goals. By establishing desired
building performance for a hazard event in terms of performance and recovery of function, communities
can add provisions to local building codes and standards that support specific resilience goals. As
communities rebuild or build new, there is an opportunity to capture the resilience goals of the
community through building code modifications.
Some communities may also need to address changing conditions, such as sea level rise, that increase the
impact of design events, such as coastal floods. For example, some coastal areas are predicted to be below
sea level by 2100.
Flood Solutions. For flood-resistant design and construction, best practices exist for communities or
individuals to implement in addition to code minimum requirements. One basic, but effective, practice is
locating all new construction outside of flood zones. Additionally, using additional height, or freeboard,
in building design can also be effective.
The risk associated with existing flood-prone construction can be addressed primarily through retrofitting:
Elevation – Elevation is one of the most common flood retrofitting techniques because it provides
a high level of protection and does not require the owner to relocate. Elevation involves raising
the lowest floor or lowest horizontal structural member to be at or above the regulated flood level.
Common elevation techniques include elevation on piles, piers or columns, and elevation on
extended foundation walls.
Floodproofing – There are two types of floodproofing.
Wet floodproofing allows floodwaters to enter the building and quickly reach the same level
as the floodwaters on the building exterior. Equalizing the water level greatly reduces the
damaging effects of hydrostatic pressure and buoyancy. Wet floodproofing is generally used
to limit damage to enclosures below elevated buildings, basements, crawlspaces, or garages.
Wet floodproofing is not practical for areas used as habitable space.
Dry floodproofing involves making a dry floodproofed enclosure substantially impermeable
to floodwaters, and providing a sump pump to address minimal seepage that can be expected.
Due to large hydrostatic pressures, dry floodproofing is practical only for buildings with
reinforced concrete or masonry walls; it is typically not practical for residential buildings or
for buildings where flood depths exceed 0.6 to 0.9 m (2 to 3 ft). Additional information is
found in FEMA P-936 [2013].
Wind Solutions. Stronger design and construction practices for wind resistance are encouraged through a
variety of existing resources with primary goals of improving continuous load path connections,
strengthening building envelopes, and protecting openings.
For buildings subject to a wind hazard, the following solutions are widely accepted as among the most
effective to address potential damage:

Community Resilience Planning Guide for Buildings and Infrastructure Systems - Volume II
Buildings
75
Improving roof and wall coverings – Roof and wall coverings are important components of the
building cladding. If the building cladding is breached during a storm, wind pressures can
drastically increase internal pressures and cause the failure of the structural system. Wind driven
rain through breached cladding may cause extensive water damage to interior contents.
Improving roof coverings may involve reinforcing the roof deck or removing the existing
covering, securing the roof deck, and installing a new roof covering. Improving wall coverings
may involve installing moisture barriers and ensuring proper fastener spacing is used or removing
the existing covering and installing a new wall covering that is rated for high winds.
Protecting openings – Openings (e.g., windows, doors, skylights, soffits, and vents) are
important to the integrity of the building cladding. Glazed openings, such as windows, are often
vulnerable to debris impact and wind driven rain intrusion. Protecting openings usually involves
installing an impact-resistant covering (such as a storm shutter) over an unprotected opening or
installing impact-resistant products (such as a window or door assembly).
Continuous load path – The term ―continuous load path‖ refers to construction that resists all
loads – such as lateral and uplift wind pressures. A continuous load path starts at the point or
surface where loads are applied, moves through the framing, continues to the foundation, and
transfers the loads to the soils that support the building. To be effective, each link in the load path
– from the roof to the foundation – must transfer loads without failure. Continuous load path
design typically involves a series of approved connections, such as the roof sheathing to roof
framing; roof framing to wall; wall to floor; and floor to foundation.
Rain Solutions. Rain primarily damages buildings through retention on low slope roofs through two
mechanisms that result in water collection on the roof: inadequate drainage and ponding.
Provide proper drainage – Building roof failures due to rain are often the result of blocked or
undersized drains. Drains should be kept clean. The primary and secondary drain system can be
evaluated based on current building code requirements to determine if they are sufficient for the
rain loads.
Provide sufficient roof slope or stiffness – Another common manner in which roofs fail from
rain is due to ponding that occurs when the roof deflects. If there is not sufficient slope or
stiffness, rainwater can accumulate in ponds created as the roof framing deflects. As the rainwater
increases, the framing deflects more, allowing for more water to accumulate until the roof
member is overstressed. The stiffness of roof members against ponding can be assessed.
Typically it is easier to provide additional slope to mitigate ponding than to stiffen the framing
members.
Fire Solutions. Fire is a secondary risk from many other hazards, such as seismic and wind. Retrofit of
existing structures with automatic sprinkler systems is often an effective way for many communities to
reduce the immediate threat of fire risk in existing construction.
For fire hazards, active fire protection through automatic extinguishing systems (AES) to provide
occupant safety and property protection may not be sufficient during or after some hazard events. Other
measures may be considered for cases where sprinkler systems fail to extinguish fires. However, fire-
fighting solutions may also be affected by the loss of power, water supply or adequate fire department
access.
12.6.3. Solutions for Existing Construction
Building codes and standards evolve, but little retroactive compliance is required because the cost of
retrofit can be significant relative to property values. There can be strong resistance to building retrofit
because it can result in challenges due to cost, inconvenience to building occupants, and disruption of
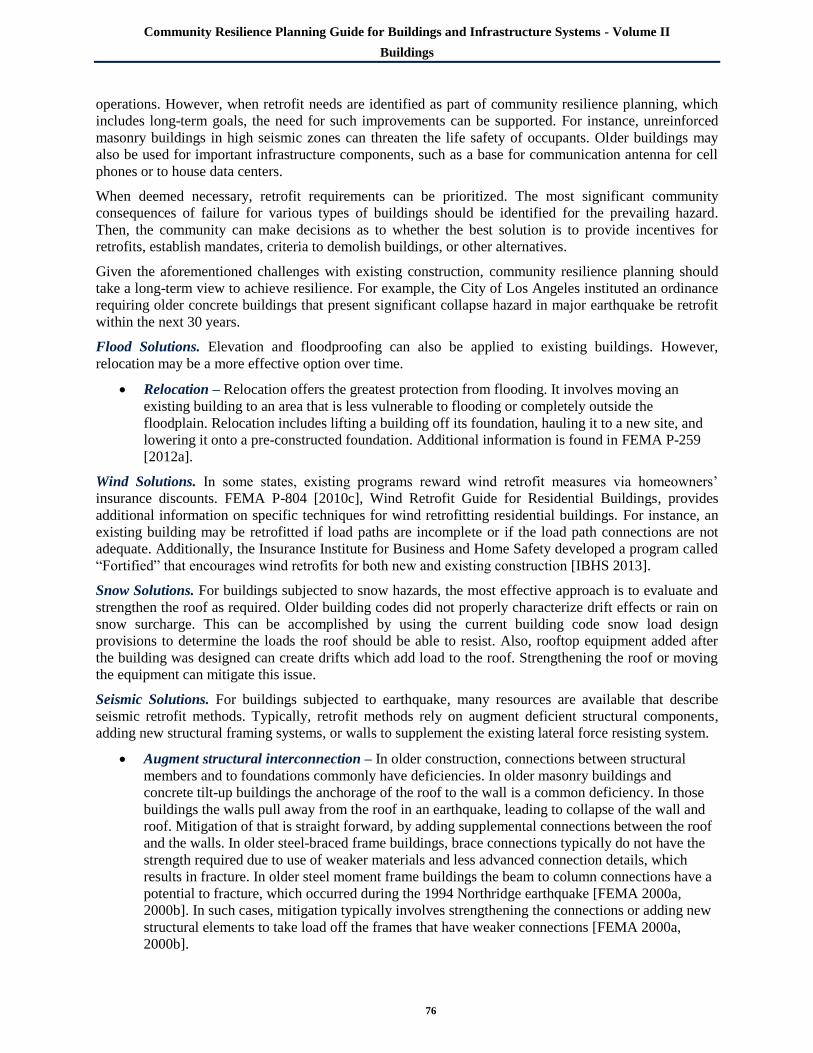
Community Resilience Planning Guide for Buildings and Infrastructure Systems - Volume II
Buildings
76
operations. However, when retrofit needs are identified as part of community resilience planning, which
includes long-term goals, the need for such improvements can be supported. For instance, unreinforced
masonry buildings in high seismic zones can threaten the life safety of occupants. Older buildings may
also be used for important infrastructure components, such as a base for communication antenna for cell
phones or to house data centers.
When deemed necessary, retrofit requirements can be prioritized. The most significant community
consequences of failure for various types of buildings should be identified for the prevailing hazard.
Then, the community can make decisions as to whether the best solution is to provide incentives for
retrofits, establish mandates, criteria to demolish buildings, or other alternatives.
Given the aforementioned challenges with existing construction, community resilience planning should
take a long-term view to achieve resilience. For example, the City of Los Angeles instituted an ordinance
requiring older concrete buildings that present significant collapse hazard in major earthquake be retrofit
within the next 30 years.
Flood Solutions. Elevation and floodproofing can also be applied to existing buildings. However,
relocation may be a more effective option over time.
Relocation – Relocation offers the greatest protection from flooding. It involves moving an
existing building to an area that is less vulnerable to flooding or completely outside the
floodplain. Relocation includes lifting a building off its foundation, hauling it to a new site, and
lowering it onto a pre-constructed foundation. Additional information is found in FEMA P-259
[2012a].
Wind Solutions. In some states, existing programs reward wind retrofit measures via homeowners‘
insurance discounts. FEMA P-804 [2010c], Wind Retrofit Guide for Residential Buildings, provides
additional information on specific techniques for wind retrofitting residential buildings. For instance, an
existing building may be retrofitted if load paths are incomplete or if the load path connections are not
adequate. Additionally, the Insurance Institute for Business and Home Safety developed a program called
―Fortified‖ that encourages wind retrofits for both new and existing construction [IBHS 2013].
Snow Solutions. For buildings subjected to snow hazards, the most effective approach is to evaluate and
strengthen the roof as required. Older building codes did not properly characterize drift effects or rain on
snow surcharge. This can be accomplished by using the current building code snow load design
provisions to determine the loads the roof should be able to resist. Also, rooftop equipment added after
the building was designed can create drifts which add load to the roof. Strengthening the roof or moving
the equipment can mitigate this issue.
Seismic Solutions. For buildings subjected to earthquake, many resources are available that describe
seismic retrofit methods. Typically, retrofit methods rely on augment deficient structural components,
adding new structural framing systems, or walls to supplement the existing lateral force resisting system.
Augment structural interconnection – In older construction, connections between structural
members and to foundations commonly have deficiencies. In older masonry buildings and
concrete tilt-up buildings the anchorage of the roof to the wall is a common deficiency. In those
buildings the walls pull away from the roof in an earthquake, leading to collapse of the wall and
roof. Mitigation of that is straight forward, by adding supplemental connections between the roof
and the walls. In older steel-braced frame buildings, brace connections typically do not have the
strength required due to use of weaker materials and less advanced connection details, which
results in fracture. In older steel moment frame buildings the beam to column connections have a
potential to fracture, which occurred during the 1994 Northridge earthquake [FEMA 2000a,
2000b]. In such cases, mitigation typically involves strengthening the connections or adding new
structural elements to take load off the frames that have weaker connections [FEMA 2000a,
2000b].

Community Resilience Planning Guide for Buildings and Infrastructure Systems - Volume II
Buildings
77
Adding new lateral force elements – Many older buildings do not possess the strength or
ductility to resist earthquake forces. This is especially common in some older concrete buildings,
where code minimum reinforcement requirements were found to be inadequate after the 1971 San
Fernando earthquake. Another example is the unbraced cripple walls under light frame residential
construction. For these buildings it is advisable to construct new walls or braced frames to stiffen
the structure to reduce demands on the older members. For light frame construction, plywood can
be used to provide bracing.
Augmenting existing members – In some cases structural members do not possess the required
strength or ductility to resist earthquake forces. One possible solution may be to augment existing
elements to provide additional strength, which is less invasive than adding new structural
elements. Common ways this augmentation occurs is by adding more concrete and reinforcement
to concrete walls and columns, wrapping concrete elements with fiber reinforced polymer
elements or steel jackets.
Example publications that provide direction on how to retrofit building for earthquake resilience are:
ASCE 41-13 [ASCE 2013]– Seismic Evaluation and Retrofit of Existing Buildings. This is a
consensus standard that allows users to perform an evaluation and retrofit using performance-
based provisions which match a given earthquake shaking intensity with a specific performance
level. It is referenced by many building codes and jurisdictions.
FEMA 549 [FEMA 2006]– Techniques for Seismic Retrofit. This publication provides examples
of methods to seismically retrofit various types of construction materials and structural
configurations. It contains example retrofit strategies and details to address identified
deficiencies.
FEMA P-807 [FEMA 2012b]– Seismic Evaluation and Retrofit of Multi-Unit Wood-Frame
Buildings with Weak First Stories, Federal Emergency Management Agency
12.6.4. Strategy Prioritization
Gaps in desired performance should be prioritized based on either the most significant gaps, the beneficial
gaps to mitigate, or impact to the community. Even small improvements in building‘s performance may
have major positive impacts on community resilience.
Making a community more resilient is a long-term proposition. Communities can develop short, medium
and long-term goals for addressing resilience. Typically the shorter term goals relate to creating a
resilience plan and changes to new building codes and standards. This can have the positive affect of not
adding any more non-resilient buildings to a cluster. Medium and long-term goals typically relate to
incentivized or mandated retrofit of specific building clusters. Often the differentiator between medium
and long-term retrofit or replacement goals is based on the amount of cost associated with the retrofit or
replacement.
As an example, the city of San Francisco created a comprehensive Earthquake Safety Implementation
Plan [The City and County of San Francisco 2011]. The plan sets forth a variety of goals to improve the
city‘s resilience to a major earthquake. Retrofit of large wood framed multi-family buildings was deemed
important enough and had somewhat lower costs associated with it (when compared to retrofit of other
buildings), so it was deemed a medium term goal. Retrofit of large, older concrete buildings, while still a
significant hazard was identified as a long term goal in part because the cost and disruption of retrofit to
those buildings was significantly greater. Also, mandating retrofit of the large concrete buildings would
not have protected as many residents as mandating retrofit of wood frame residential apartment buildings.

Community Resilience Planning Guide for Buildings and Infrastructure Systems - Volume II
Buildings
78
12.7. References
American Society of Civil Engineers (ASCE 2010) ASCE 7-10: Minimum Design Loads for Buildings
and Other Structures, Second Edition, American Society of Civil Engineers (ASCE) Structural
Engineering Institute (SEI), Reston, VA.
American Society of Civil Engineers (ASCE 2013) ASCE 41-13: Seismic Evaluation and Retrofit of
Existing Buildings, American Society of Civil Engineers (ASCE) Structural Engineering Institute (SEI),
Reston, VA.
American Society of Civil Engineers (ASCE 2013) ASCE 41-13: Seismic Evaluation and Retrofit of
Existing Buildings, American Society of Civil Engineers (ASCE) Structural Engineering Institute (SEI),
Reston, VA.
Applied Technology Council (ATC 2003) ATC-58-2: Preliminary evaluation of methods for defining
performance, Applied Technology Council (ATC), Redwood City, California.
Applied Technology Council (ATC 2004) ATC-45: Field Manual: Safety Evaluation of Buildings after
Windstorms and Floods, Applied Technology Council (ATC), Redwood City, California.
Applied Technology Council (ATC 2009) ATC Design Guide 2: Basic Wind Engineering for Low-Rise
Buildings, Applied Technology Council (ATC), Redwood City, CA.
Department of Defense (DoD 2008) Unified Facilities Criteria (UFC): DoD Security Engineering
Facilities Planning Manual, UFC 4-020-01. DoD, Washington, DC.
Federal Emergency Management Agency (FEMA 2000a) FEMA-351: Recommended Seismic Evaluation
and Upgrade Criteria for Existing Welded Steel Moment-Frame Buildings, Federal Emergency
Management Agency (FEMA), Washington, DC.
Federal Emergency Management Agency (FEMA 2000b) FEMA-355F: State of the Art Report on
Performance Prediction and Evaluation of Steel Moment-Frame Buildings, Federal Emergency
Management Agency (FEMA), Washington, DC.
Federal Emergency Management Agency (FEMA 2003) FEMA-426: Reference Manual to Mitigate
Potential Terrorist Attacks Against Buildings. Risk Management Series, December, Federal Emergency
Management Agency (FEMA), Washington, DC.
Federal Emergency Management Agency (FEMA 2005) FEMA-452: Risk Assessment A How-To Guide to
Mitigate Potential Terrorist Attacks Against Buildings, Risk Management Series, January, Federal
Emergency Management Agency (FEMA), Washington, DC.
Federal Emergency Management Agency (FEMA 2006) FEMA 549, Hurricane Katrina in the Gulf
Coast: Mitigation Assessment Team Report, Building Performance Observations, Recommendations, and
Technical Guidance, Federal Emergency Management Agency (FEMA), Washington DC.
Federal Emergency Management Agency (FEMA 2009a) FEMA P-750: NEHRP Recommended Seismic
Provisions for New Buildings and Other Structures, Federal Emergency Management Agency (FEMA),
Washington, DC
Federal Emergency Management Agency (FEMA 2009b) FEMA P-550: Recommended Residential
Construction for Coastal Areas: Building on Strong and Safe Foundations, Second Edition, Federal
Emergency Management Agency (FEMA), Washington, DC.
Federal Emergency Management Agency (FEMA 2010a) FEMA P-424: Design Guide for Improving
School Safety in Earthquake, Floods, and High Winds, Federal Emergency Management Agency
(FEMA), Washington, DC.
Community Resilience Planning Guide for Buildings and Infrastructure Systems - Volume II
Buildings
79
Federal Emergency Management Agency (FEMA 2010b) FEMA P-499: Home Builder‘s Guide to
Coastal Construction: Technical Fact Sheet Series, Federal Emergency Management Agency (FEMA),
Washington, DC.
Federal Emergency Management Agency (FEMA 2010c) FEMA P-804: Wind Retrofit Guide for
Residential Buildings, Federal Emergency Management Agency (FEMA), Washington, DC.
Federal Emergency Management Agency (FEMA 2011) FEMA P-55 (Volume I and II): Coastal
Construction Manual: Principles and Practices of Planning, Siting, Designing, Constructing, and
Maintaining Residential Buildings in Coastal Areas, Fourth Edition. Federal Emergency Management
Agency (FEMA), Washington DC.
Federal Emergency Management Agency (FEMA 2012a) FEMA P-259: Engineering Principles and
Practices for Retrofitting Flood-Prone Residential Structures, Third Edition, Federal Emergency
Management Agency (FEMA), Washington, DC.
Federal Emergency Management Agency (FEMA 2012b) FEMA P-807: Seismic Evaluation and Retrofit
of Multi-Unit Wood-Frame Buildings with Weak First Stories, Federal Emergency Management Agency
(FEMA), Washington DC.
Federal Emergency Management Agency (FEMA 2013) FEMA P-936: Floodproofing Non-Residential
Buildings, Federal Emergency Management Agency (FEMA), Washingron, DC.
Federal Emergency Management Agency (FEMA 2014) FEMA P-312: Homeowner‘s Guide to
Retrofitting: Six Ways to Protect your Home from Flooding, Third Edition, Federal Emergency
Management Agency (FEMA), Washington, DC.
Federal Emergency Management Agency (FEMA 2015a) FEMA P-361: Safe Rooms for Tornadoes and
Hurricanes, Third Edition, Federal Emergency Management Agency (FEMA), Washington, DC.
Federal Emergency Management Agency (FEMA 2015b) Hazus Multi-Hazard Program. Federal
Emergency Management Agency (FEMA), Washington, DC, https://www.fema.gov/hazus.
IBC (2015) International Building Code, International Code Council, http://shop.iccsafe.org/codes/2015-
international-codes-and-references/2015-international-building-code-and-references.html.
Insurance Institute of Business & Home Safety (IBHS 2013) FORTIFIED Overview, Tampa, FL,
https://disastersafety.org/fortified/fortified-home/. Last viewed April 18, 2015.
International Code Council (ICC 2009) International Fire Code, Country Club Hills, IL.
International Code Council (ICC 2011) International Wildland-Urban Interface Code, Country Club
Hills, IL.
International Code Council (ICC 2014) ICC 500-2014: ICC/NSSA Standard for the Design and
Construction of Storm Shelters, Country Club Hills, IL.
International Code Council (ICC 2015) ICCPC: 2015 International Code Council Performance Code for
Buildings and Facilities, International Code Council, Country Club Hills, IL.
International Code Council, Inc. (ICC 2008) Standard for Residential Construction in High-Wind
Regions, Country Club Hills, IL.
IRC (2015) International Residential Code, International Code Council,
http://shop.iccsafe.org/codes/2015-international-codes-and-references/2015-international-residential-
code-and-references.html.
National Fire Protection Association (NFPA 2015) FireWise Communities, National Fire Protection
Association, Battery Park, MA. http://www.firewise.org/?sso=0.

Community Resilience Planning Guide for Buildings and Infrastructure Systems - Volume II
Buildings
80
Oregon Seismic Safety Policy Advisory Commission (OSSPAC 2013) The Oregon Resilience Plan:
Reducing Risk and Improving Recovery for the Next Cascadia Earthquake and Tsunami, Report to the
77th Legislative Assembly from the Oregon Seismic Safety Policy Advisory Commission, Salem, OR.
Plyer, A. (2015) ―Facts for Features: Katrina Impact,‖ The Data Center, Nonprofit Knowledge Works,
August 28, http://www.datacenterresearch.org/data-resources/katrina/facts-for-impact/.
San Francisco Planning and Urban Research Association (SPUR 2009) The Resilient City: What San
Francisco Needs from its Seismic Mitigation Policies, San Francisco Planning and Urban Research
Association (SPUR), San Francisco, CA.
The City and County of San Francisco (CAPSS 2011) Earthquake Safety Implementation Program, San
Francisco, CA.
Tsikoudakis, M. (2012) ―Hurricane Andrew prompted better building code requirements: Some regions
seeing new building codes,‖ Business Insurance, Crain Communications, August 19,
http://www.businessinsurance.com/article/20120819/NEWS06/308199985.

Community Resilience Planning Guide for Buildings and Infrastructure Systems - Volume II
Transportation Systems
81
13. Transportation Systems
Transportation Systems Executive Summary
Community Dependence. Transportation systems are critical to communities. People use various
transportation systems daily to travel to and from work and school, visit family and friends, attend
business meetings, and reach medical facilities during emergencies. Businesses use trucks, ships, trains,
and airplanes to transport goods from their point of production to their point of use or consumption.
While roads and bridges are a critical part of the transportation network, communities also rely upon other
systems of transportation, including:
Airports to transport people and goods long distances in a short period of time
Passenger and freight rail lines to transport people and goods regionally/nationally
Subway lines or light rail corridors in large urban centers to transport people to/from work and
entertainment/leisure activities
Harbors and ports to import/export goods globally and distribute them on inland waterways
Inland waterways, such as the Mississippi River, to transport people and goods
Ferry terminals/waterways to transport the workforce to/from work (e.g., New York , San
Francisco, Seattle)
Pipelines to transport natural gas and petroleum nationally and regionally to utilities and
refineries
Complexities. The transportation system as a whole is complex because people and businesses often rely
on multiple transportation modes. When one connection point between modes is negatively affected, it
can result in trip delays or delivery interruptions. Multi-modal systems and connection points add to the
challenge of coordinating activities to build resilience of the transportation system and the communities it
supports.
Transportation infrastructure can play an important role when preparing for natural hazard events for
which there is advanced warning and supporting recovery after an event. Prior to an event, families may
need to travel home and then follow evacuation routes to safe shelters. After an event, transportation
infrastructure is critical for first responders to reach those in need, for electric power and communication
crews to restore utility lines, and for ingress of critical supplies needed by community members.
Vulnerabilities. When planning for a hazard event and beginning the recovery process after an event
occurs, communities should consider any vulnerability in the transportation network that may seriously
affect the ability of the community to achieve full recovery in the intermediate and long terms.
Communities should also consider improving the level of transportation network performance in future
hazard events. Intermediate community transportation needs may include: the ability of public sector
employees to get to their posts; the ability of community members to get to work, school, retail stores,
and hospitals; and the ability to access airports, ports and harbors, and railway stations for travel and
commerce. In the long term, communities should strive to go beyond simply recovering by prioritizing
improvements to the transportation network, particularly parts that failed or were the source of stress on
the network.
Dependencies. Infrastructure systems critical to community recovery and restoration, both pre- and post-
event, have significant dependencies on transportation systems. These critical infrastructure systems
include energy systems, communications systems, buildings, and water/wastewater systems. For example,
electric power plants rely on bulk shipments of coal or fuel by barge and freight rail and gas-fired plants

Community Resilience Planning Guide for Buildings and Infrastructure Systems - Volume II
Transportation Systems
82
rely on natural gas pipelines. The energy system also relies on transportation systems so repair crews can
reach areas where power failures have occurred and bring services online quickly.
Community Resilience. Infrastructure for roads and highways, rail, air travel, ports, harbors, waterways
and pipelines all have known vulnerabilities to hazard events. Community resilience performance goals
for the transportation system in this Guide are defined by how quickly the functionality of infrastructure
systems recover after a hazard event. Minimizing downtime can be achieved during design or by
developing and implementing well-prepared recovery plans (ideally both). Performance goals for the
transportation system should be established by a panel of key stakeholders from within the community
system owners and operators, engineers, planners, regulators, codes and standards representatives, and
representatives of other infrastructure systems.
Performance Goals. Performance goals for transportation systems are necessary to support prioritization
of system components that are most critical to community response and recovery. Prioritization relative to
performance goals ensures that efforts to improve resilience focus on actions that will bring the most
benefit to the community. Priorities for each system that supports ingress, egress, and community
transportation functions depend on the system‘s role in the community. The ability of each system to
effectively serve these functions is a balance of the volume of people or goods that the system has the
capacity to move and its ability to interface with both the local community and surrounding region.
Codes and Standards. The transportation industry uses standards to establish the minimum acceptable
criteria for design and construction. Transportation codes and standards are typically adopted and
enforced by each state‘s Department of Transportation, though many local jurisdictions may also impose
additional local requirements. While practice varies somewhat, for the most part state DOT design
manuals and practices closely follow the guidance in the AASHTO Policy. The FHWA is responsible for
approving the design of highways on the National Highway System. FHWA has adopted the AASHTO
Policy as the applicable set of design values and criteria that apply to such facilities. Although adoption of
standards is important, enforcement is key to ensure compliance of the built environment with these
standards.
For new transportation construction, current federal and state project development guidelines require an
environmental study at the early stages of projects to identify potential environmental impacts and
state/federal permitting requirements. An Environmental Impact Statement (EIS), Environment
Assessment (EA), and other similar processes require local community input. Such processes can be an
important opportunity for the community to discuss the resiliency performance criteria and goals for the
project, regardless of whether or not they are covered by the codes. For example, a community could
request that the performance goal exceed the 500-year flood criteria for an interstate highway project to
assure continued operation in an extreme flood event.
The design of transportation systems has been refined over time; however, existing transportation systems
are usually bound by the codes and standards for which they were initially designed. Typically, there is no
requirement that transportation infrastructure be upgraded to meet the new standards as they develop,
with the exception of the Federal Highway Administration (FHWA) guidelines for seismic retrofit of
bridges promulgated in the 1980s. However, it is possible to make improvements to meet the criteria of
current standards during retrofits. For example, when planning rehabilitation of a highway bridge or
tunnel, the community should consider upgrading other system features to meet the current performance
goals and to protect the investment being made.
Resilience Solutions. Resilience solutions for new and future construction should start in the project
planning phase. Selection of site location, alignment, and grade level can increase resilience with the
lowest cost and schedule impacts. For new surface transportation projects, placing roadways, tracks and
tunnel portals at a naturally high grade, locating bridge foundations outside of a waterway when feasible,
and avoiding roadways cut into unstable side slopes are options that should be taken advantage of when

Community Resilience Planning Guide for Buildings and Infrastructure Systems - Volume II
Transportation Systems
83
they are available. Likewise for airports near bodies of water and seaports, elevating critical infrastructure
components and avoiding soils that are unstable during earthquakes will improve system performance.
To increase the resiliency of existing transportation infrastructure, a good strategy is to first prioritize the
transportation assets by their degree of criticality for supporting community resilience and their
vulnerability to damage or loss from a hazard. After prioritizing assets, a plan to improve resilience can
be developed to meet both short-term and long-term needs.
13.1. Introduction
Transportation systems are critical to our daily lives. People use transportation systems to travel to and
from work, school, visits to family and friends, attend business meetings, and manage their health.
However, the transportation network meets many needs beyond those of individuals. Businesses use
trucks, ships, trains, and airplanes to transport goods from the point of production to the point of use or
consumption. For example, food is often transported from the producer (e.g., a farm) to a processing and
packing plant, then to a regional or national distribution center, and finally to the local stores where it can
be purchased by consumers. All steps in this product distribution example rely heavily on transportation
systems.
Traditionally, people think of transportation systems as roads and bridges for moving both goods and
people. Although roads and bridges are a critical part of the transportation network, communities also rely
upon other transportation systems, including:
Airports to transport people and goods long distances in a short period of time
Passenger and freight rail lines to transport people and goods regionally/nationally
Subway lines or light rail corridors in large urban centers (e.g., New York, D.C., Chicago, Los
Angeles) to transport people to and from work, entertainment, and leisure activities
Harbors and ports to import/export goods globally and distribute them on inland waterways
Inland waterways, such as the Mississippi River, to transport people and goods
Ferry terminals and waterways to transport the workforce to and from work (e.g., San Francisco,
New York, Seattle)
Pipelines2 to transport natural gas and petroleum nationally and regionally to utilities and
refineries
The transportation system is complex, with multiple modes, each having its own complexities. These
complexities can make coordinating activities between systems for community resilience challenging.
Examples of complexity include:
Within a small geographical area (i.e., a community) many stakeholders may be responsible for
design, operation, maintenance and funding of the road network, including federal, state, and
local public agencies, as well as private operators of toll ways.
The rail system includes both freight networks, which are key to support economic activity, and
passenger rail services within cities and across states, which may have multiple private and public
stakeholders.
2 Pipelines are included in the transportation chapter because they are regulated by the Department of Transportation. Water
pipelines are discussed in Chapter 15.

Community Resilience Planning Guide for Buildings and Infrastructure Systems - Volume II
Transportation Systems
84
Marine transportation includes domestic and international movement of passengers and goods
across regions. The various regions may have their own standards and guidelines for design,
operation and maintenance for marine transportation systems. In the case of passenger ferries, a
lack of docking requirement standardization limits the transferability of vessels to support
recovery from hazard events.
The aviation system includes public and private airports of varying sizes, with public and private
stakeholders, that support air freight and commercial air passenger services. Air fields are sized to
accommodate aircraft landing needs, and larger aircraft may not be able to land at smaller
airports.
Many people rely on multiple modes of transportation (i.e., intermodal transportation) every day.
Businesses use multiple systems of transportation to move goods efficiently and cost effectively.
Similarly, goods may be imported using ships; however, to get the goods from the ship to the next step in
the supply chain trucks or rail are requires. Section 13.1.2 contains more discussion on intermodal
transportation.
This chapter addresses the role of the transportation system in community resilience. To address
resilience of their infrastructure, communities need to first understand how the transportation system
supports the community and characterize the existing transportation systems. This step includes
identifying the parties responsible for the condition and maintenance of the infrastructure, regulatory
bodies, and other key stakeholders. Communities should work with stakeholders to determine desired
performance goals for the transportation infrastructure and evaluate the anticipated performance of the
existing infrastructure for prevailing hazards. Determining differences between the desired and
anticipated system performance will identify weak nodes and links in the network, and aid communities
to prioritize proposed upgrades to improve resilience of individual network components and,
consequently, the transportation network as a whole. Section 13.3 provides a performance goal table that
communities can use to identify the desired and anticipated performance of transportation systems, and
the gaps in performance.
13.1.1. Social Needs and System Performance Goals
The social needs of the community drive the performance goals to be defined by each community, its
infrastructure owner, and stakeholders, as discussed in Chapter 10. The social needs of the community
include those of community members, local businesses, supply chains of large national and multi-national
businesses, industry, and government. Each community should define its own performance goals based
on the time needed for its infrastructure to be restored following a hazard event for three levels of hazard:
routine, expected, and extreme, as defined in Chapter 4 (Volume I).
While not all natural hazard events can be forecast, the transportation system may play an important role
prior to a natural hazard event with advanced warning (e.g., hurricane), and after a hazard event. Prior to
an event, transportation systems enable:
Transport of residents to their homes from work, school or daycare
Ability to evacuate to shelters or distant safe communities
Following a hazard event, the community may have short-term (0-3 days), intermediate (1-12 weeks), or
long term (4-36+ months) recovery needs. For transportation, short-term needs may include:
Access for emergency responders (firefighters, paramedics, police) to reach people in need
Access for workers to restore critical facilities and supporting infrastructure (energy,
communications, water, wastewater)

Community Resilience Planning Guide for Buildings and Infrastructure Systems - Volume II
Transportation Systems
85
Access to facilities for shelter, medical care, banks, commerce, and food
Egress or evacuation from a community immediately after a hazard event, if needed
Ingress of goods and supplies immediately after event to provide aid
Communities need to also consider vulnerabilities in the transportation network that may seriously affect
full recovery. Resilience plans should consider ways to improve the level of transportation network
performance for the next hazard event. Intermediate and long-term transportation needs may include:
Ability of public sector employees (who run government, direct traffic, respond to emergencies,
run transit systems, and teach or work in schools) to reach their posts
Ability for community members to get to work, school, medical facilities, sports and
entertainment venues, and places to gather for religious or cultural events.
Access to businesses (both small and large), banks, retail, manufacturing, and similar facilities so
they can receive supplies and serve their customers
Access to key transportation facilities (airports, ports/harbors, railway stations) so goods can be
transported and the supply chain restored
Communities should strive to go beyond simply recovering by prioritizing and planning for
improvements to the sections of the transportation network that address their current and project social
needs.
13.1.2. Dependencies
Chapter 11 details the dependencies of all critical infrastructure systems in a community. As the built
environment within communities grows more complex and different systems grow more dependent on
one another to provide services, addressing the issue of dependencies becomes an increasingly critical
aspect of resilience.
Transportation systems play a critical role in supporting each other, as well as critical services and other
infrastructure systems. Hospitals, fire stations, police, and other emergency response systems depend on
transportation before, during, and after a hazard event. Evacuation depends on the capacity of roads,
waterways, airports, and rail, as well as the government‘s ability to manage them. Relief efforts are
hindered until damage to transportation systems is repaired.
Specific dependencies on the transportation system include:
Energy – Many power plants rely on bulk shipments of coal or fuel via barge and freight rail for
their operation. Gas fired plants rely on natural gas pipelines. Resource recovery plants rely on
bulk shipments of refuse via truck. Interruption to barge, freight rail, and truck routes from a
hazard event can affect power generation if fuel at these power plants is not stockpiled in
advance.
Communication and Information – As fiber networks are expanded, many are routed through
leased conduits over bridges and through tunnels to cross waterways or other geographic features.
This makes them vulnerable if those transportation assets are damaged from flooding,
earthquakes, or storm surge, which can knock out portions of the fiber communications network.
Postal services delivering letters, documents, and packages also rely entirely on the transportation
network.

Community Resilience Planning Guide for Buildings and Infrastructure Systems - Volume II
Transportation Systems
86
Buildings/Facilities – Large transportation terminals or stations, airline terminals, and port cargo
facilities cease to function when transportation systems are shut down by a hazard event. Mixed
use transportation facilities that are integrated with retail, businesses, and hotels are also impacted
when transportation stops.
Water/Wastewater – The pipelines used by water and wastewater systems are often located
within the right-of-way of roads and bridges, and are considered part of the transportation system.
Water and wastewater treatment plants also rely on transportation to deliver chemicals used for
treatment.
Specific interdependencies of transportations systems with the other infrastructure systems addressed in
this Guide include:
Energy – The transportation system depends on the power and energy grid. Gas stations need
electricity for vehicle owners to access fuel. Following Hurricane Sandy, gas stations, utilities,
and other entities that fuel transportation vehicles could not operate without power, which
hindered both evacuation and recovery. Electric power is also necessary for traffic signals to
function. During the northeast blackout of 2003, New York City‘s 11,600 traffic signals were
inoperable due to the loss of power, resulting in mass gridlock [DeBlasio et al. 2004]. Airports,
rail stations, moveable bridges, vehicular tunnels and ports rely on electric energy for lighting,
functionality of mechanical components, fire and life safety, and for functionality of the buildings
themselves (see Chapter 12). Regional passenger rail, subways, and light rail rely on electric
energy to function as well as for fire/life safety inside the tunnels. However, the energy industry
also relies on transportation systems to allow repair crews to reach areas where failures have
occurred and bring services online quickly. The logistics of deploying repair crews often starts
with clearing roads to provide access to utility repair crews.
Transportation systems also include natural gas and petroleum pipelines that supply fuel storage,
generation, and distribution systems. Pipelines also transport jet fuel to major airports. Most
pipelines in the continental United States are buried beneath the ground and can rupture from
earthquakes or wash out due to flooding.
Communication – The communications system relies on roads and bridges so repair crews can
get into areas where restoration is needed for telephone and cable lines, cell towers, and fiber
optic networks. Conversely, transportation systems depend on communications to relay
information. Airports use communications for instrument-controlled aircraft operations to relay
logistical and scheduling information to passengers and to communicate with other air traffic via
air traffic control. Light rail, train, and bus stations rely on communication systems to coordinate
and schedule inbound/outbound times for users. Highways depend on Intelligent Transportation
Systems (ITS) to monitor traffic levels, direct traffic around areas of congestion, and respond to
accidents and emergencies. ITS cameras, sensors, and variable message signs are supported on
fiber networks, some owned and some leased by Departments of Transportation (DOTs). Tolled
highways and bridges rely on communication systems for electronic toll collection.
Building/Facilities – Buildings are rendered useless if people cannot reach them. Transportation
systems allow people to travel to critical facilities, businesses, and to other homes and facilities to
check on the safety of friends, family and vulnerable populations. When transportation systems
are not available to get community members to buildings and facilities, such structures also
cannot contribute to the recovery.

Community Resilience Planning Guide for Buildings and Infrastructure Systems - Volume II
Transportation Systems
87
Water and Wastewater – Water and wastewater lines are often buried beneath roads (i.e., below
grade). Moreover, leaks and failure of waterlines under roads can damage road foundations and
sinkholes may form. Consequently, access to roads is needed to reach points of failure.
Conversely, critical facilities in the transportation system require water and wastewater for
maintenance, sanitation, disposal, and emergency services (e.g., firefighting).
Intermodal Transportation. Due to the nature of our large, diverse transportation network and
how it is used today, intermodal transportation is a key consideration for communities.
Intermodal transportation varies by community, depending on the community‘s size, needs,
structure, and complexity. Individuals in some communities may function well using only the
road network. However, the community needs access to the larger transportation network. Hence,
other methods of transportation are needed to get food and supplies to local retailers in these
communities.
In today‘s global environment, goods are imported via airplane, ship, truck, or train. Goods imported by
airplane or ship, are then loaded onto either trains or trucks. Depending on the goods being transported,
the next stop in the supply chain may be a manufacturing or processing plant, national or regional
distribution center, or a warehouse. Retailers often use warehouses or regional distribution centers to
manage products and provide goods to local stores via truck in a short time period. Therefore,
coordination is needed between the different methods of transportation used by businesses to ensure their
products can be delivered to the customer.
People also use multiple methods of transportation, particularly in large urban centers, to get to and from
work, school, entertainment facilities, homes, banks, etc. People who work in large cities often rely on
mass transit, such as bus transit for most of their commutes. However, to get to their bus stop, rail station,
or final destination, individuals may rely on the roadway system, including buses, taxis, bicycles, or
walking.
Although several methods of transportation are available to individuals and businesses, providing
redundancy to the overall network, failures in one system can put significant stress on other transportation
systems. For example, even partial loss of use of the subway system in Chicago, New York, or
Washington DC would cause significant congestion and gridlock in the roadway network.
Freight transportation systems in the U.S. have less redundancy than systems that transport people. The
freight rail lines currently have detours of hundreds of miles around certain critical routes that follow river
beds and cross large rivers. With the reduced number of freight trains and the high costs for maintaining
the right of way of freight tracks, railroads have reduced the number of redundant lines. Many of the
abandoned rail lines have been converted to recreational paths for pedestrians and cyclists. However,
there is redundancy in the freight system due to the ability to choose between barges, rail, and trucks.
Freight transportation by barge moves very large volumes at relatively low energy costs, but has very
limited system redundancy since it depends on navigable waterways. River flooding or a damaged or
collapsed river crossing can lead to major delays of large volumes of freight.
In general, freight transported by truck has more redundancy than rail or barge freight; however, the
national highway system has certain critical river crossings that, if damaged in a hazard event, can lead to
long detours and heavily congested highway bottlenecks.
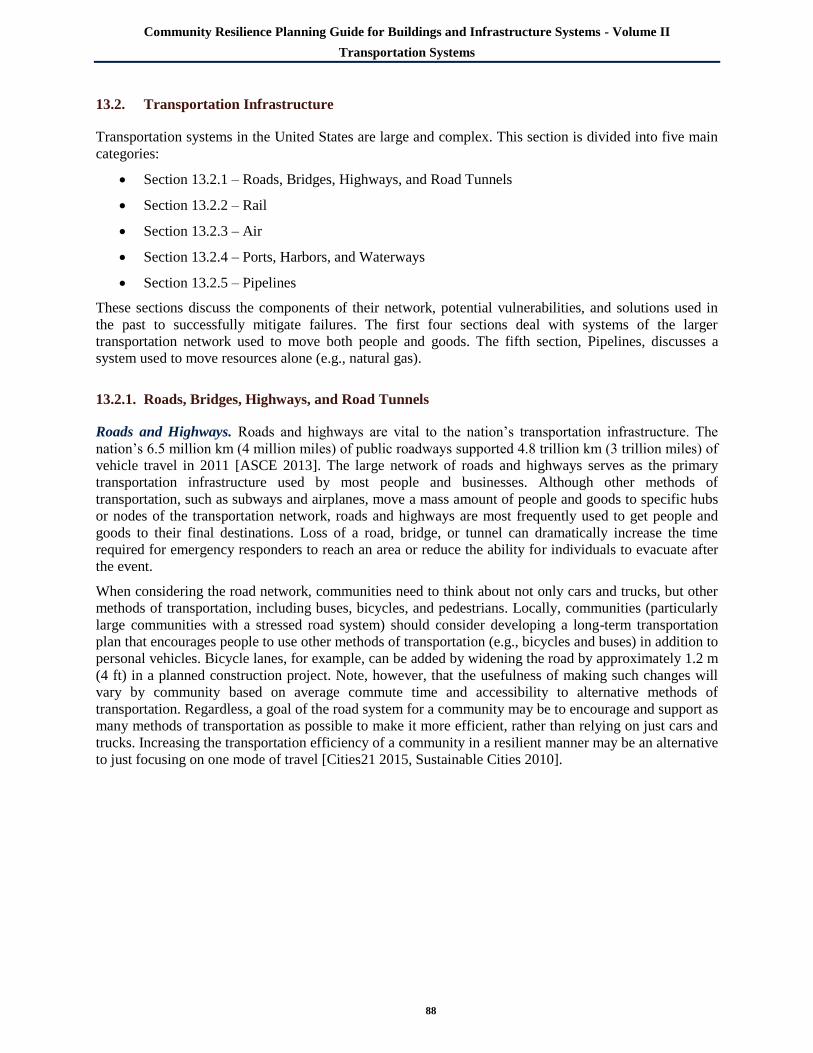
Community Resilience Planning Guide for Buildings and Infrastructure Systems - Volume II
Transportation Systems
88
13.2. Transportation Infrastructure
Transportation systems in the United States are large and complex. This section is divided into five main
categories:
Section 13.2.1 – Roads, Bridges, Highways, and Road Tunnels
Section 13.2.2 – Rail
Section 13.2.3 – Air
Section 13.2.4 – Ports, Harbors, and Waterways
Section 13.2.5 – Pipelines
These sections discuss the components of their network, potential vulnerabilities, and solutions used in
the past to successfully mitigate failures. The first four sections deal with systems of the larger
transportation network used to move both people and goods. The fifth section, Pipelines, discusses a
system used to move resources alone (e.g., natural gas).
13.2.1. Roads, Bridges, Highways, and Road Tunnels
Roads and Highways. Roads and highways are vital to the nation‘s transportation infrastructure. The
nation‘s 6.5 million km (4 million miles) of public roadways supported 4.8 trillion km (3 trillion miles) of
vehicle travel in 2011 [ASCE 2013]. The large network of roads and highways serves as the primary
transportation infrastructure used by most people and businesses. Although other methods of
transportation, such as subways and airplanes, move a mass amount of people and goods to specific hubs
or nodes of the transportation network, roads and highways are most frequently used to get people and
goods to their final destinations. Loss of a road, bridge, or tunnel can dramatically increase the time
required for emergency responders to reach an area or reduce the ability for individuals to evacuate after
the event.
When considering the road network, communities need to think about not only cars and trucks, but other
methods of transportation, including buses, bicycles, and pedestrians. Locally, communities (particularly
large communities with a stressed road system) should consider developing a long-term transportation
plan that encourages people to use other methods of transportation (e.g., bicycles and buses) in addition to
personal vehicles. Bicycle lanes, for example, can be added by widening the road by approximately 1.2 m
(4 ft) in a planned construction project. Note, however, that the usefulness of making such changes will
vary by community based on average commute time and accessibility to alternative methods of
transportation. Regardless, a goal of the road system for a community may be to encourage and support as
many methods of transportation as possible to make it more efficient, rather than relying on just cars and
trucks. Increasing the transportation efficiency of a community in a resilient manner may be an alternative
to just focusing on one mode of travel [Cities21 2015, Sustainable Cities 2010].

Community Resilience Planning Guide for Buildings and Infrastructure Systems - Volume II
Transportation Systems
89
In addition to moving people and goods on roads
and highways, essential utilities distribute services
either along-side, above, or below the grade of
roads. Therefore, the failure of roads and
highways not only disrupts the ability to move
people and goods, it can leave the necessary utility
services vulnerable to both initial and secondary
hazards (e.g., uprooting of a tree or other debris
falling on a power or communication line). For
example, flooding can undercut road beds. Figure
13-1 provides an example of interdependency. In
the figure, a pipe that lay directly underneath the
road shoulder was vulnerable to damage as a
result of road failure.
Roads are also susceptible to damage from
earthquakes. The force of earthquakes can cause
roads to split, as seen after the Loma Prieta
earthquake [Duwadi 2010]. Moreover, secondary
effects of earthquakes, such as landslides and fires can also damage roadways or other transportation
infrastructure.
Failure or loss of service of individual roads does
not typically cause a major disruption for a
community, because redundancy is often built into
the road network. Major disruptions occur when a
significant portion or critical component of the
road/highway network fails, such that people and
goods cannot get to their destinations. Flash
flooding in mountain communities, where roads
typically follow river beds with multiple bridge
crossings, has left entire communities cut off
when roads and bridges collapsed from scour (i.e.,
erosion of bank material around foundations,
particularly for bridges). For example, a dozen
towns in Vermont were completely cut off from
emergency aid in 2011 when Hurricane Irene
dumped 280 mm (11 inches) of rain over a
weekend, washing out roads and bridges [Dolak
2011]. Similarly, in Boulder, Colorado, search and rescue teams could not reach stranded communities
after 150 mm (6 inches) of rain fell over 12 hours in September 2013, cutting off mountain towns after
recent wildfires depleted the terrain of vegetation [Frosch and Williams 2013]. Large areas of the road
and highway system can be impacted by debris from high wind events (e.g., hurricanes, extra-tropical
storms, tornadoes), flooding (as seen in Hurricane Sandy), earthquakes, and ice storms. In the short term,
tree fall (see Figure 13-2) on roads slows-down emergency response and repair crews from getting to
locations where their assistance is needed, and may also damage electric power and communication
systems.
Ice storms, as previously discussed, can also cause road blockages by tree fall, as seen after the January
2009 ice storm in Kentucky [Kentucky Public Service Commission 2009]. However, ice itself can also
shut down the road network because even relatively small amounts of ice make driving conditions
dangerous, particularly in those areas where communities are not well prepared for snow and ice storms
Figure 13-1: Road undercutting in the aftermath
of Hurricane Irene (Source: Photo by Elissa Jun
[FEMA 2014a])
Figure 13-2: Local road blocked by fallen trees
after remnants of extra-tropical storm struck
Kentucky [Source: Kentucky Public Service
Commission 2009]

Community Resilience Planning Guide for Buildings and Infrastructure Systems - Volume II
Transportation Systems
90
due to their infrequent occurrence. In states that are well prepared for these events and experience them
regularly, ice storms or large snowfall events do not typically cause significant disruptions to
transportation.
Bridges. Bridges are important components of the road and railway networks, because they traverse
significant geological features such as canyons, rivers, and bodies of water. Bridges are the most costly
part of a roadway or railway system to build and maintain. Temporary closure of a bridge may lead to
significant detour travel distances.
Bridges, like roads, are impacted by the harshness of their respective environmental conditions (e.g.,
freeze-thaw cycles). Many bridges include expansion joints that may allow water and other debris to
infiltrate the road surface, leading to corrosion and deterioration of both the superstructure (i.e., beams
and deck) and substructure (e.g., piers, bearings, and abutments), and degradation of bridge performance.
However, some short bridges (i.e., less than 90 m [300 ft]) are designed using integral abutments to
eliminate expansion joints and reduce this source of degradation [Johnson 2012].
Scour is a leading cause of bridge failures [FHWA
2011]. Scour occurs when a combination of water
velocity and soil characteristics leads to erosion of
the stream bed around a foundation. Scour can be
resisted through proper design and construction.
Flooding and wave action from hurricane storm
surge (or tsunamis) can damage bridges in other
ways. During Hurricane Katrina, wave-induced
forces lifted and displaced multiple spans of the I-
10 twin bridges over Lake Pontchartrain off their
bearings (Figure 13-3) [Duwadi 2010].
Earthquakes in San Fernando Valley, Loma Prieta,
and Northridge, CA resulted in bridge collapses
through failure of piers and decks [Duwadi 2010].
Longer bridges tend to have relatively lightweight
superstructures (decks and girders) to span long
distances. Historically, their relatively low natural
frequencies made some of these bridges
susceptible to damage by high winds, because such low natural frequencies could be excited by high
winds. If resonance of the bridge occurred, large oscillations and failure followed in some cases.
However, modern long span bridges are designed with aeroelastic wind tunnel testing that confirms
design features and final aerodynamic properties to avoid failure during high wind events [FHWA
2015a]. Some older long span bridges were tested and retrofitted to ensure they were not vulnerable to
wind failures.
Similar to roads, failure of an individual bridge causes a disruption to the local road network, but does not
always cause a major disruption of an entire community‘s road network because there are often
alternative routes. However, the driver‘s commute time might increase. Failure of a bridge puts additional
stress on other parts of the road network locally, because the bridge is a choke point, which could cause
people to avoid certain areas and thus businesses. Therefore, when communities evaluate the design and
functionality of their bridges, they should consider the purpose of the structure and redundancy of the
surrounding road network. For example, if the bridge is the only way road through which commuters and
goods can access an area of the community that has many businesses and critical facilities, the bridge
should be designed for the extreme event, as defined in Chapter 4 (Volume I). However, given that bridge
failures are not common in hazard events, most bridges should be designed and built for the expected
event.
Figure 13-3: Bridge sections knocked off their
supports during Hurricane Katrina due to wave
action. (Source: Photo by Win Henderson [FEMA
2014d])

Community Resilience Planning Guide for Buildings and Infrastructure Systems - Volume II
Transportation Systems
91
Road Tunnels. Road tunnels serve a similar purpose to bridges in the road network. They connect links of
the road network by passing under water, through mountains, or under other roads or highways. In
general, tunnels present more risk to life safety when failures occur than other transportation systems,
which have more accessible methods of egress. Fires in tunnels are deadly hazards because fire in an
enclosed space decreases oxygen levels, contains toxic gases, and radiates heat like a furnace [Meng &
Qu 2010]. Precipitation is another threat: flooding in surrounding areas can lead to dangerously high soil
moisture levels that compromise structural integrity of tunnels through mountains [Meyer et al. 2014].
Tunnels beneath rivers are not affected by moisture through the walls but by surrounding flooding
through the tunnel portal. During long term inundation inside a tunnel, corrosion is a major mode of
damage, especially to any ventilation, electrical, or communications systems within the structure. More
resilient designs and novel protection measures, such as inflatable tunnel plugs, may need to be employed
to adequately mitigate the risk associated with tunnels [U.S. DHS 2013].
13.2.2. Rail
Rail systems consist of mass transit systems, such as subways, that operate within large high-density
cities; regional commuter rail systems, which connect suburban communities to the city core; intercity
passenger rail systems; and freight rail systems that transport cargo both regionally and across the nation.
Light rail systems that operate within cities and airports are also included.
Rail systems, which typically carry bulk commodities and assist in commuter services, have seen a boom
in recent years. Amtrak reported more than 31.2 million passengers in 2012, double the reported figure
from 2000. Freight railroads transport almost half the nation‘s intercity freight and approximately a third
of its exports with both numbers projected to increase. Freight and passenger railroads invested $75
billion into freight rail systems since 2009. In 2010, freight railroads renewed enough miles of track to go
from coast to coast. This investment policy supports the rail system capacity to meet future needs and
represents an opportune time to build resilience into the system [ASCE 2013].
Since rail systems tend to be less interconnected than roadway systems, key juncture points may become
bottlenecks following system damage or failure [Lazo 2013]. One example is the Virginia Avenue tunnel
in Washington D.C., through which 20 to 30 cargo trains travel each day. The tunnel, now 110 years old
with structural issues estimated to cost $200 million to repair, has a single rail line that requires freight
trains to wait while others pass through [Lazo 2013]. Bottlenecks like this cost the U.S. about $200 billion
annually, or 1.6 % of GDP, and are projected to rise if rail capacity is not added along significant
corridors [ASCE 2013]. Any disruption to these key points in the system could cause significant
economic disruptions, indicating a need to build alternate routes to increase redundancy in the system.
Freight rail systems in the U.S. also play an important role in the intermodal transportation of
containerized cargo and imported automobiles from ports on both coasts to points in the Midwest.
Containers are double stacked on rail cars and transported to interior distribution hubs that then transfer
cargo to trucks, which is then taken to a final destinations.

Community Resilience Planning Guide for Buildings and Infrastructure Systems - Volume II
Transportation Systems
92
The railway network is similar to road and
highway infrastructure; both rely on bridges and
tunnels. However, the railway network is not as
redundant as local road networks. Thus
disruptions in the railway network can have a
significant impact. During Hurricane Katrina,
flooding caused railway tracks to be impassible
and some railway bridges failed, as shown in
Figure 13-4. Careful planning can ensure tracks
are appropriately elevated and mitigated for
potential natural hazards. Relocating transit lines
to newer tracks reduces natural hazard risks and
vulnerability, as does keeping older tracks in good
repair for redundancy. Since railways, like
roadways, are replaced every 20 years on average,
resilience can be built into the system over time
[Field et al. 2012].
Rail systems have other vulnerabilities. Most
regional and intercity passenger rail systems either
rely on electrified overhead catenaries or on third-rail power. While overhead catenary systems are more
vulnerable to damage in storms from winds, falling trees, and branches, both are vulnerable to flooding,
ice storms, and blizzards. Passenger rail in rural areas uses diesel locomotives and is more resilient. Some
railroads have invested in hybrid locomotives that can be powered by diesel or electric power and be
deployed to restore limited service when there is loss of electric power. Freight rail cargo is transported
by diesel locomotives and so is less affected by storms, ice and flooding.
An early warning system prior to a hazard event allows time for trains are to be moved to safer locations
to avoid damage. As with other forms of transportation, damage and recovery assessments will enable
better prioritization of resources and lead to faster recovery in a post-hazard environment [The World
Bank 2012].
Subway Systems. Subway systems effectively
transport many people for work, school,
entertainment events, or other leisure
activities. Because subways are largely located
underground, flooding is especially
problematic. During Hurricane Sandy, the
New York City subway system experienced
heavy flooding; some tunnels filled up
entirely. Where protective measures, such as
barriers and elevated openings, were in place,
they were overtopped. The subway pumps
were overwhelmed and the flooding damaged
utility equipment, including electrical systems
(transformers, switchgear, distribution panels,
etc.), communication and data/IT systems, and
electronic controls and equipment [FEMA 2013]. The severe damage to the subway system will require
years of repair and rebuilding before every station is reopened [City of New York 2013].
Figure 13-4: A railroad bridge in New Orleans
was washed out by flooding during Hurricane
Katrina. (Source: Photo by Marvin Nauman
[FEMA 2014c])
Resilience Example: The New York City Transit
(NYCT) subway system, despite being one of the
oldest transportation infrastructures in the city,
showcased adaptability in its response to the 9/11
attacks. Decision making was dispersed
throughout the system. As a result of empowered
leadership throughout the system, trains were
quickly rerouted around the disrupted area. When
the nature of the event became clear, the subway
system brought more trains to outgoing tracks for
evacuation. During the recovery, the system was
adapted to transport emergency personnel and
supplies into and around the city [PWC 2013].

Community Resilience Planning Guide for Buildings and Infrastructure Systems - Volume II
Transportation Systems
93
13.2.3. Air
The nation‘s air infrastructure provides the fastest way for freight and people to travel long distances. The
airport system moves over $562 billion in cargo each year, in addition to providing 728 million passenger
flights [ASCE 2013]. Commercial flights increased by approximately 33 million from 2000 to 2011
[ASCE 2013]. By 2040, it is projected that air cargo will triple and over a billion passenger flights will
traverse the nation‘s skies [ASCE 2013]. Studies already show that disruptions to this massive system has
significant economic implications. The estimated cost of congestion and delays was almost $22 billion in
2012 and is projected to rise to $63 billion by 2040, if national spending levels on air infrastructure
remains stagnant [ASCE 2013].
Airports are a key component of supply chain for commerce activities. Internet purchases in particular
result in tons of overnight air cargo transferred to trucks at airports and delivered to communities. There is
a strong dependency between airports and roadway systems for timely delivery of high priority and
perishable goods. Airport closures cause re-routing to other airports with longer truck travel times,
delaying goods.
Large airports are communities in themselves where many people are employed and there is significant
retail business and real-estate development, such as hotels. When an airport is closed, it does not just
impact air travelers. People employed at airports are significantly affected by disruptions to normal air
operations.
There are many dependencies between airports and other modes of transport. Passengers access airports
by roadways or rail networks. Freight services and the provision of fuel to airports rely on roadways. In
addition, when airports are disrupted, people and cargo are typically re-routed to road and rail networks.
Military airbases typically have facilities similar to those of a civilian airport, such as traffic control and
firefighting. Airbases are located throughout the U.S. and its territories and provide a variety of services
for the military such as refueling, storage and maintenance, training centers, and mission launch points.
As with civilian air infrastructure, military air infrastructure provides the fastest way to transport
personnel, cargo, arms, supplies, and other physical assets. As such, airbases play a critical role in
supporting national security.
Disaster response is not a primary role of the armed forces; however, after major events, military airbases
may double as launch points and staging areas for recovery operations. When federal, state, and local
agencies respond to hazard events that have become disasters, the military may be called on for support.
Increased air transportation capabilities are particularly needed after hazard events that hinder ground
transportation, such as floods, earthquakes, wildfires, and major snow storms, or after hazard events in
areas with prohibitive terrain. Common response-related uses for military aircraft, include evacuation,
search and rescue, supply delivery, and personnel mobilization. Airbases are governed by the branch of
the military they serve, though assets may be provided to civilian governments under civilian control after
a major event.
Unfortunately, airports are sensitive to hazard events and prone to disruptions. Seventy percent of airport
delays are due to severe weather events, which may become more frequent in some locations [ACRP
2012]. This sensitivity is partly attributed to system complexity, which can include more risks than are
immediately obvious [PWC 2013]. Thus, completely assessing all vulnerabilities for an airport can be
difficult. Nevertheless, valuable lessons can be learned from past events.

Community Resilience Planning Guide for Buildings and Infrastructure Systems - Volume II
Transportation Systems
94
Runways are vulnerable to the same hazards as
roads, but typically have a higher threshold for
safe operating conditions. Runways can be shut
down by flooding (Figure 13-5), ice, and snow.
Additionally, runways are vulnerable to soil
liquefaction during seismic events [ACRP 2012].
In 2011, the area around the Dallas Fort Worth
airport received 6.6 cm (2.6 inches) of snow
before the Super Bowl. The airport was
underprepared and suffered significant disruptions.
Their equipment cleared a single runway one hour
after de-icer was applied, leading to cancellation
of over 300 flights. In response, the airport
invested over $13 million in equipment to clear
three runways of 5 cm (2 inches) of snow in 14
minutes. Although this is a good example of steps
taken to create a more resilient airport, it also
showcases how easily an unexpected weather
event can cause disruptions [TRB 2014].
Airport terminals are vulnerable to the same hazards as other buildings (see Chapter 12). Energy, fuel,
communications, water, and wastewater services are all critical to the safe operation of airports. Chapters
14, 15 and 16, respectively, discuss the resiliency of these infrastructure systems.
Airports play an integral role in moving people and supplies before and after a hazard event. If airports in
an area close, other airports must handle redirected flights and increased loads [ACRP 2012]. Federal and
state aid is most quickly administered by air. These factors mean that airports are most needed when they
are most vulnerable – directly before and after a hazard event. Therefore, increasing resilience in airports
is essential to increasing overall community resilience.
13.2.4. Ports, Harbors, and Waterways
Ports, harbors, and waterways are primarily used for import/export of goods and materials. The U.S.
Army Corps of Engineers estimates that over 95 % of U.S. trade, by volume, moves through ports [ASCE
2013]. The U.S. has over 300 commercial harbors that process over 2.3 billion tons of cargo per year and
over 600 additional smaller harbors [ASCE 2013]. In 2010, $460 billion worth of goods were exported
and $940 billion were imported through ports [ASCE 2013]. Although most ports are in good condition,
terminals need further investment to accommodate larger vessels following the scheduled 2015 Panama
Canal expansion. Due to the increasing size of commercial ships, many ports with shallow waterways are
already inaccessible. Once the Panama Canal expansion is complete, more ports in the United States will
be unable to service the larger ships that may have double the capacity of cargo ships in use today
[NOAA 2014]. The need for further investment, as with the other transportation systems, provides an
opportunity to plan for resilient improvements to this critical infrastructure [ASCE 2013].
Maritime infrastructure also provides waterborne transport of passengers and vehicles, which is another
important component of domestic trade [MARAD 2015]. Ferries provide a safe and reliable link across
bodies of water for commuters in major metropolitan areas where tunnels and bridges are not available or
traffic is congested. Additionally, ferries can support emergency evacuations of metropolitan areas when
other transportation networks are inundated, gridlocked, or otherwise non-functional. According to the
Bureau of Transportation Statistics, there were 231 ferry operators across 37 states and territories in 2009.
It is estimated that U.S. ferries carried close to 103 million passengers and over 37 million vehicles in
Figure 13-5: Flooding in 1993 closed the Chester
County Airport and moved planes. (Source: Photo
by Andrea Booher [FEMA 2014b])
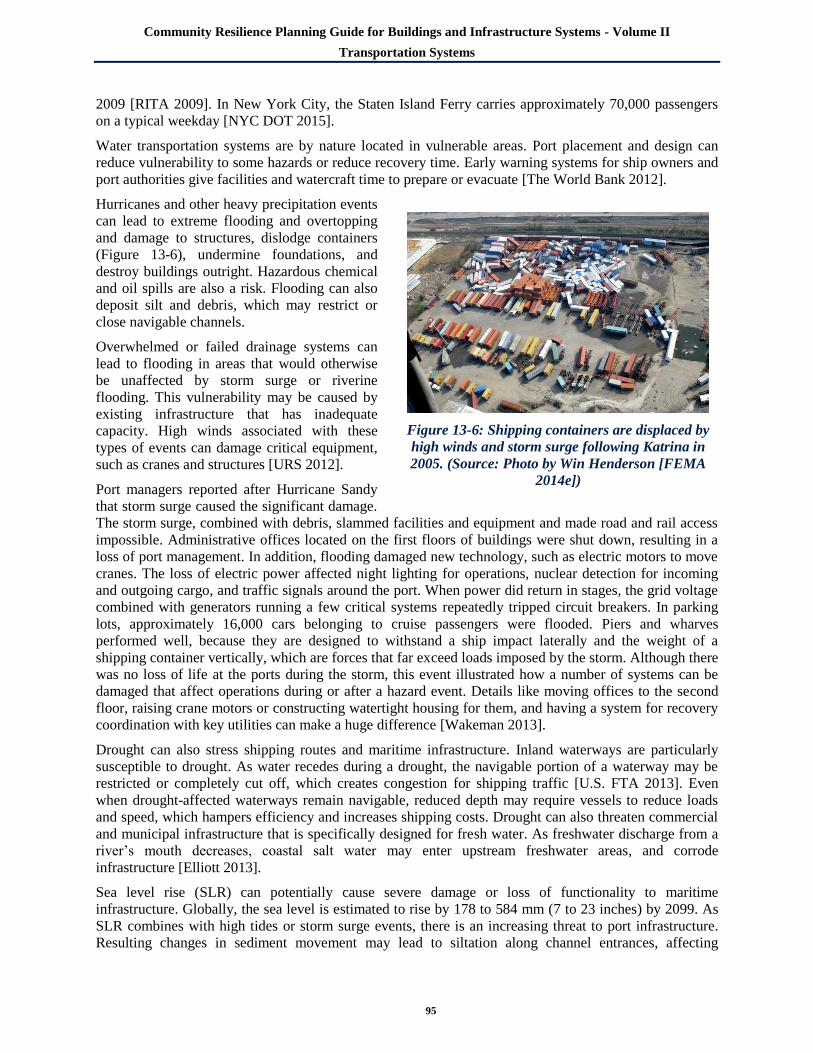
Community Resilience Planning Guide for Buildings and Infrastructure Systems - Volume II
Transportation Systems
95
2009 [RITA 2009]. In New York City, the Staten Island Ferry carries approximately 70,000 passengers
on a typical weekday [NYC DOT 2015].
Water transportation systems are by nature located in vulnerable areas. Port placement and design can
reduce vulnerability to some hazards or reduce recovery time. Early warning systems for ship owners and
port authorities give facilities and watercraft time to prepare or evacuate [The World Bank 2012].
Hurricanes and other heavy precipitation events
can lead to extreme flooding and overtopping
and damage to structures, dislodge containers
(Figure 13-6), undermine foundations, and
destroy buildings outright. Hazardous chemical
and oil spills are also a risk. Flooding can also
deposit silt and debris, which may restrict or
close navigable channels.
Overwhelmed or failed drainage systems can
lead to flooding in areas that would otherwise
be unaffected by storm surge or riverine
flooding. This vulnerability may be caused by
existing infrastructure that has inadequate
capacity. High winds associated with these
types of events can damage critical equipment,
such as cranes and structures [URS 2012].
Port managers reported after Hurricane Sandy
that storm surge caused the significant damage.
The storm surge, combined with debris, slammed facilities and equipment and made road and rail access
impossible. Administrative offices located on the first floors of buildings were shut down, resulting in a
loss of port management. In addition, flooding damaged new technology, such as electric motors to move
cranes. The loss of electric power affected night lighting for operations, nuclear detection for incoming
and outgoing cargo, and traffic signals around the port. When power did return in stages, the grid voltage
combined with generators running a few critical systems repeatedly tripped circuit breakers. In parking
lots, approximately 16,000 cars belonging to cruise passengers were flooded. Piers and wharves
performed well, because they are designed to withstand a ship impact laterally and the weight of a
shipping container vertically, which are forces that far exceed loads imposed by the storm. Although there
was no loss of life at the ports during the storm, this event illustrated how a number of systems can be
damaged that affect operations during or after a hazard event. Details like moving offices to the second
floor, raising crane motors or constructing watertight housing for them, and having a system for recovery
coordination with key utilities can make a huge difference [Wakeman 2013].
Drought can also stress shipping routes and maritime infrastructure. Inland waterways are particularly
susceptible to drought. As water recedes during a drought, the navigable portion of a waterway may be
restricted or completely cut off, which creates congestion for shipping traffic [U.S. FTA 2013]. Even
when drought-affected waterways remain navigable, reduced depth may require vessels to reduce loads
and speed, which hampers efficiency and increases shipping costs. Drought can also threaten commercial
and municipal infrastructure that is specifically designed for fresh water. As freshwater discharge from a
river‘s mouth decreases, coastal salt water may enter upstream freshwater areas, and corrode
infrastructure [Elliott 2013].
Sea level rise (SLR) can potentially cause severe damage or loss of functionality to maritime
infrastructure. Globally, the sea level is estimated to rise by 178 to 584 mm (7 to 23 inches) by 2099. As
SLR combines with high tides or storm surge events, there is an increasing threat to port infrastructure.
Resulting changes in sediment movement may lead to siltation along channel entrances, affecting
Figure 13-6: Shipping containers are displaced by
high winds and storm surge following Katrina in
2005. (Source: Photo by Win Henderson [FEMA
2014e])

Community Resilience Planning Guide for Buildings and Infrastructure Systems - Volume II
Transportation Systems
96
accessibility for some ships. The risk of corrosion increases as more infrastructure comes into contact
with the water. Susceptibility to scour and flooding may be exacerbated by SLR [Wakeman 2013].
As with other transportation modes there are dependencies on other infrastructure systems. For example,
road and rail infrastructure transport goods and people to and from ports and harbors to their final
destination. Ferries can provide a temporary replacement for bridge infrastructure. However, the lack of
docking requirement standardization limits the transferability of vessels and infrastructure to support
efforts following a hazard event.
Inland waterways in the U.S. move large volumes of bulk cargo through a system of rivers and lakes
interconnected by locks. As shown in Figure 13-7, one barge, which can carry 1,500 tons of cargo, moves
the equivalent tonnage of 13.4 jumbo freight rail hopper cars or 58 large semi-trucks. A large barge tow,
consisting of 15 barges, can transport the equivalent of 870 large semi-trucks. When the inland waterways
flood or there is a bridge collapse blocking a key river on their route, there is tremendous delay to bulk
cargo movement that cannot be made up by other modes of freight transportation.
Figure 13-7: Iowa DOT comparison chart
Inland navigable waterways are crucial to the health of the U.S. trade economy. Shallow draft navigation
(e.g., barges) serves 87 % of all major U.S. cities, which accounts for 79 % of all domestic waterborne
freight [MARAD 2015]. In 2005, inland waterways handled over 624 million tons of freight valued over
$70 billion [Kruse et al. 2007]. The U.S. Maritime Administration estimates that if inland waterways
became unavailable for transport, truck traffic on rural highways would increase by approximately 33 %

Community Resilience Planning Guide for Buildings and Infrastructure Systems - Volume II
Transportation Systems
97
(58 million truck trips annually) and rail transport, by tonnage, would increase by 25 %. Increases of these
magnitudes would put tremendous stress on land-based infrastructure, resulting in increased maintenance
costs, fuel consumption, congestion, and decreased safety. As waterways are maintained and improved,
resilience to lasting drought conditions should be a chief consideration in affected areas of the country.
13.2.5. Pipelines
Pipelines are a key component of the U.S. transportation and energy supply infrastructure, delivering
natural gas, crude oil, refined products such as gasoline and diesel, and natural gas liquids such as ethane
and propane. Because the engineering standards for pipeline safety and design are administered by the
U.S. Department of Transportation‘s Pipeline and Hazardous Materials Safety Administration (PHMSA),
pipelines that transport natural gas and liquid fuels are discussed here as part of the transportation system.
The regulation and enforcement of safety for all types of pipelines are the responsibility of the PHMSA.
A combination of federal, state, and local agencies are responsible for siting pipelines and their economic
regulation (e.g., rates and tariffs).
Pipelines are generally grouped into three categories based on function: gathering (small pipelines in an
oil or gas production area), transmission (larger, longer pipelines transporting products from supply areas
to market areas), and distribution (pipelines delivering the product to residential, commercial or industrial
end users). Including both onshore and offshore lines, there are approximately 482,000 km (300,000
miles) of natural gas transmission pipelines, and 3.4 million km (2.1 million miles) of distribution
pipelines delivering over 730 million cubic meters (26 billion cubic feet) of natural gas. Over 306,000 km
(190,000 miles) of liquids pipeline delivered nearly 15 billion barrels of crude oil and petroleum products
in 2013. Over the last 10 years, liquids pipeline has increased by 41,404 km (25,727 miles) or 15.4 %,
with crude oil pipeline mileage growing 18,744 km (11,647 miles) or 23.6 % since 2004 [AOPL 2014].
Pipelines connect to compression and pumping stations, processing
facilities, production platforms, wells, storage facilities and end
users, such as power plants and residential or commercial customers.
Disruptions of the pipeline system by hazards complicate, hinder,
and prolong response and recovery by communities.
Pipelines and associated aboveground facilities are vulnerable to
damage by flooding and storm surge, impact from flood or
windborne debris, and movement of land both on and offshore
(earthquakes, subsidence, mudslides). Impacts to, or movement of, a
pipeline can cause the line to rupture and spill contents into the soil
or a body of water, or some products may ignite or explode.
Cascading effects of pipeline disruptions include delays and fuel
supply loss for the transportation system and natural gas to the
energy infrastructure. Such losses can affect 1) the movement of
responders and goods into affected areas and 2) power distribution to
residents, businesses, and industry.
Hurricanes can laterally displace or expose buried offshore pipes,
which can cause leaks at clamps, welds, flanges, and fittings, and
can cause pipes to be pulled apart and rupture. Earthquakes can
damage pipes by ground deformation – landslides, liquefaction and
lateral movement of pipes – and by ground wave propagation or
ground shaking [Ballantyne 2008]. Such displacements and forces
can result in pipe compression or wrinkling, and cracking and
separation at joints, welds, flanges, and fittings [Ballantyne 2008].
Figure 13-8: Natural gas crew
shuts off gas after Hurricane
Sandy. [Source: Liz Roll,
FEMA 2012]
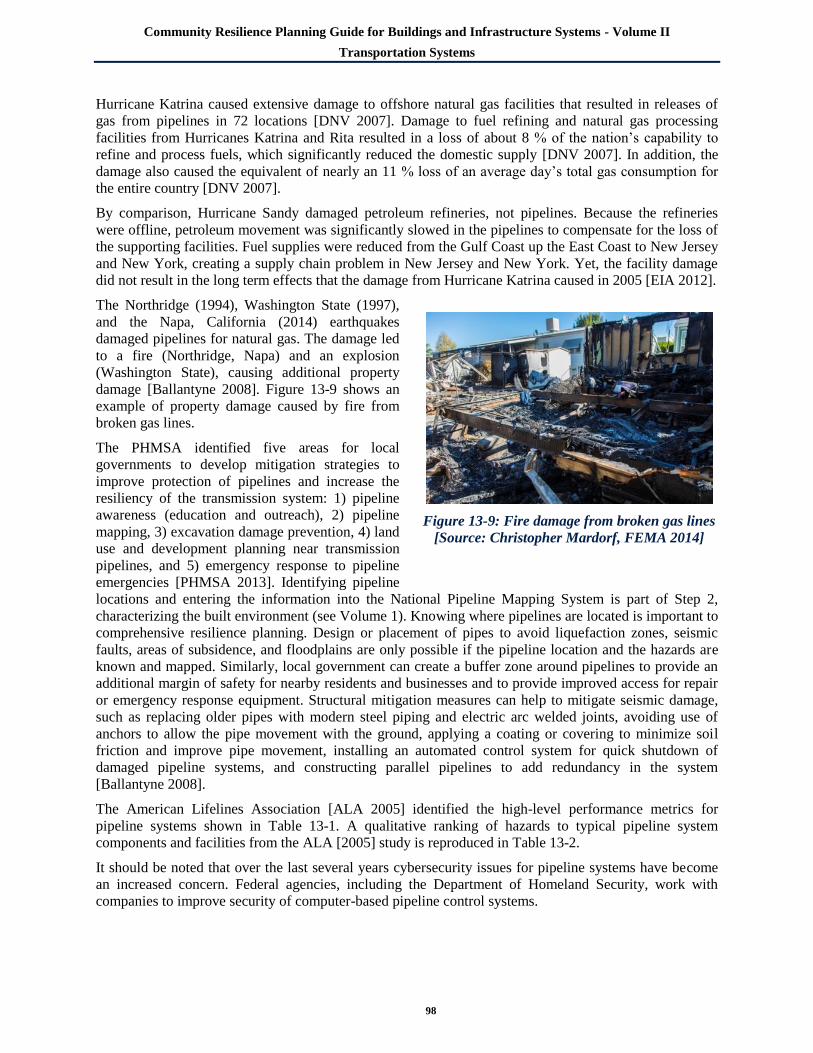
Community Resilience Planning Guide for Buildings and Infrastructure Systems - Volume II
Transportation Systems
98
Hurricane Katrina caused extensive damage to offshore natural gas facilities that resulted in releases of
gas from pipelines in 72 locations [DNV 2007]. Damage to fuel refining and natural gas processing
facilities from Hurricanes Katrina and Rita resulted in a loss of about 8 % of the nation‘s capability to
refine and process fuels, which significantly reduced the domestic supply [DNV 2007]. In addition, the
damage also caused the equivalent of nearly an 11 % loss of an average day‘s total gas consumption for
the entire country [DNV 2007].
By comparison, Hurricane Sandy damaged petroleum refineries, not pipelines. Because the refineries
were offline, petroleum movement was significantly slowed in the pipelines to compensate for the loss of
the supporting facilities. Fuel supplies were reduced from the Gulf Coast up the East Coast to New Jersey
and New York, creating a supply chain problem in New Jersey and New York. Yet, the facility damage
did not result in the long term effects that the damage from Hurricane Katrina caused in 2005 [EIA 2012].
The Northridge (1994), Washington State (1997),
and the Napa, California (2014) earthquakes
damaged pipelines for natural gas. The damage led
to a fire (Northridge, Napa) and an explosion
(Washington State), causing additional property
damage [Ballantyne 2008]. Figure 13-9 shows an
example of property damage caused by fire from
broken gas lines.
The PHMSA identified five areas for local
governments to develop mitigation strategies to
improve protection of pipelines and increase the
resiliency of the transmission system: 1) pipeline
awareness (education and outreach), 2) pipeline
mapping, 3) excavation damage prevention, 4) land
use and development planning near transmission
pipelines, and 5) emergency response to pipeline
emergencies [PHMSA 2013]. Identifying pipeline
locations and entering the information into the National Pipeline Mapping System is part of Step 2,
characterizing the built environment (see Volume 1). Knowing where pipelines are located is important to
comprehensive resilience planning. Design or placement of pipes to avoid liquefaction zones, seismic
faults, areas of subsidence, and floodplains are only possible if the pipeline location and the hazards are
known and mapped. Similarly, local government can create a buffer zone around pipelines to provide an
additional margin of safety for nearby residents and businesses and to provide improved access for repair
or emergency response equipment. Structural mitigation measures can help to mitigate seismic damage,
such as replacing older pipes with modern steel piping and electric arc welded joints, avoiding use of
anchors to allow the pipe movement with the ground, applying a coating or covering to minimize soil
friction and improve pipe movement, installing an automated control system for quick shutdown of
damaged pipeline systems, and constructing parallel pipelines to add redundancy in the system
[Ballantyne 2008].
The American Lifelines Association [ALA 2005] identified the high-level performance metrics for
pipeline systems shown in Table 13-1. A qualitative ranking of hazards to typical pipeline system
components and facilities from the ALA [2005] study is reproduced in Table 13-2.
It should be noted that over the last several years cybersecurity issues for pipeline systems have become
an increased concern. Federal agencies, including the Department of Homeland Security, work with
companies to improve security of computer-based pipeline control systems.
Figure 13-9: Fire damage from broken gas lines
[Source: Christopher Mardorf, FEMA 2014]

Community Resilience Planning Guide for Buildings and Infrastructure Systems - Volume II
Transportation Systems
99
Table 13-1: The American Lifelines Association high-level performance metrics for pipeline systems
[Adapted from ALA 2005]
Desired Outcomes
(Performance Goals)
System Performance Metrics
Capital
Losses ($)
Revenue
Losses ($)
Service Disruption
(% Service
Population)
Downtime
(hours)
Casualties
(Deaths,
Injuries)
Lost
Product
Protect public and utility
personnel safety X X
Maintain system reliability X X
Prevent monetary loss X X X X X
Prevent environmental damage X
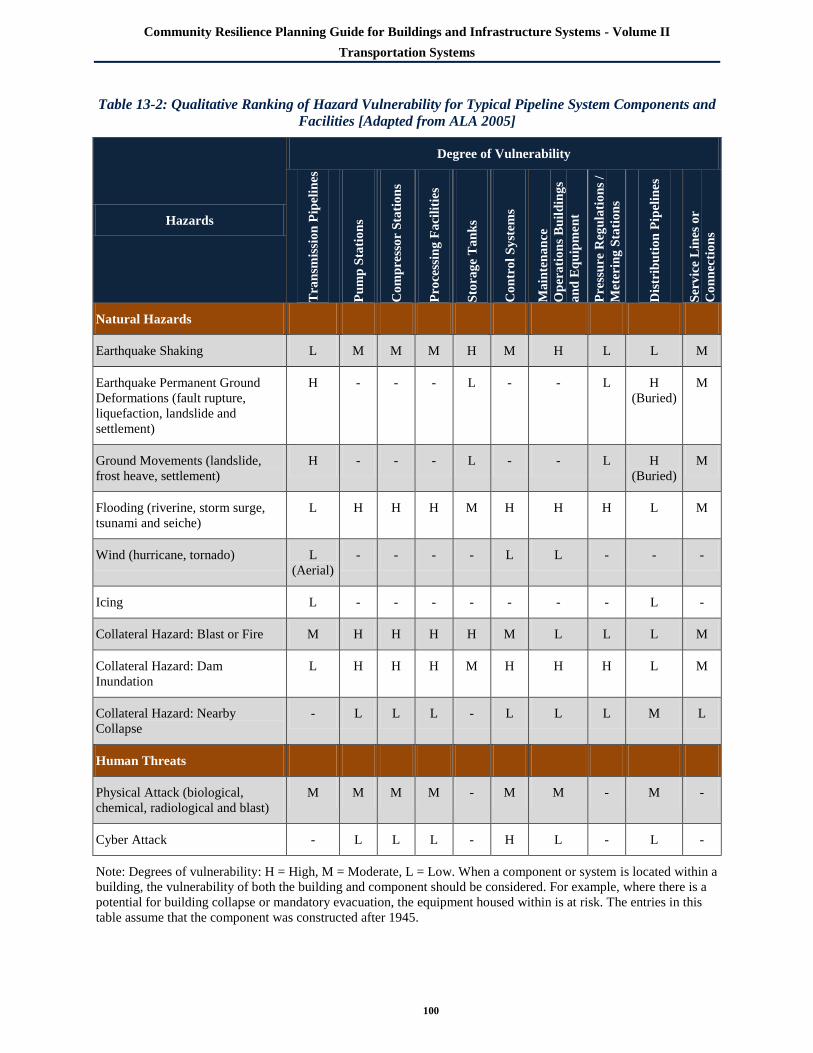
Community Resilience Planning Guide for Buildings and Infrastructure Systems - Volume II
Transportation Systems
100
Table 13-2: Qualitative Ranking of Hazard Vulnerability for Typical Pipeline System Components and
Facilities [Adapted from ALA 2005]
Hazards
Degree of Vulnerability
Tra
nsm
issi
on
Pip
elin
es
Pu
mp
Sta
tio
ns
Co
mp
ress
or
Sta
tio
ns
Pro
cess
ing
Fa
cili
ties
Sto
rag
e T
an
ks
Co
ntr
ol
Sy
stem
s
Ma
inte
na
nce
Op
era
tio
ns
Bu
ild
ing
s
an
d E
qu
ipm
en
t
Pre
ssu
re R
egu
lati
on
s /
Met
erin
g S
tati
on
s
Dis
trib
uti
on
Pip
elin
es
Ser
vic
e L
ines
or
Co
nn
ecti
on
s
Natural Hazards
Earthquake Shaking L M M M H M H L L M
Earthquake Permanent Ground
Deformations (fault rupture,
liquefaction, landslide and
settlement)
H - - - L - - L H
(Buried)
M
Ground Movements (landslide,
frost heave, settlement)
H - - - L - - L H
(Buried)
M
Flooding (riverine, storm surge,
tsunami and seiche)
L H H H M H H H L M
Wind (hurricane, tornado) L
(Aerial)
- - - - L L - - -
Icing L - - - - - - - L -
Collateral Hazard: Blast or Fire M H H H H M L L L M
Collateral Hazard: Dam
Inundation
L H H H M H H H L M
Collateral Hazard: Nearby
Collapse
- L L L - L L L M L
Human Threats
Physical Attack (biological,
chemical, radiological and blast)
M M M M - M M - M -
Cyber Attack - L L L - H L - L -
Note: Degrees of vulnerability: H = High, M = Moderate, L = Low. When a component or system is located within a
building, the vulnerability of both the building and component should be considered. For example, where there is a
potential for building collapse or mandatory evacuation, the equipment housed within is at risk. The entries in this
table assume that the component was constructed after 1945.

Community Resilience Planning Guide for Buildings and Infrastructure Systems - Volume II
Transportation Systems
101
13.3. Performance Goals
Performance goals for the transportation system should align with the broader community goals
established (see Step 3, Determine goals and objectives in Volume 1). Key stakeholders within the
community, including owners, engineers, planners, regulators, codes and standards representatives, and
representatives of other infrastructure systems (e.g., power and water/wastewater) should help develop or
review the performance goals. Transportation system users may include commuters, school districts,
emergency response services, local businesses, and other private and commercial property owners.
Transportation stakeholders may include state DOT, city DOT, township engineer, transit authorities,
highway authorities, airport authorities, Amtrak, freight and short line railroads, independent taxi, bus,
marine, airline and truck operators, United States Army Corps of Engineers (USACE), FHWA, Federal
Aviation Administration (FAA), Federal Railroad Administration (FRA), Federal Transit Administration
(FTA), United States Coast Guard (USCG), state, city and township code officials, American Association
of State Highway and Transportation Officials (AASHTO), American Railway Engineering and
Maintenance-of-Way Association (AREMA), state, city and township Office of Emergency Medical
Services (EMS).
For transportation systems, it is imperative that other infrastructure systems be involved in establishing
the performance goals, because they have strong dependencies on transportation systems, as discussed in
Section 13.1.2. For example, both overhead and underground distribution lines for power and
communication systems are often within the right-of-way of roads and bridges, thus are subject to DOT
requirements. Water, gas, and wastewater utilities may also have buried lines within the road right-of-
way. Passenger and light rail systems are heavily reliant on energy systems.
The example performance goals table in Table 13-3 allows communities to summarize the desired (future)
and anticipated (current) performance of transportation systems for the hazard event specified in the
Disturbance table (top left table in Table 13-3). Performance goals in this Guide are defined as ―time to
recovery of function‖ after a hazard event. Example performance goals for the fictional community of
Riverbend, USA, are provided Volume I. These example performance goals are intended to illustrate the
6-step process.
The example table for performance goals has three functional categories for general transportation
services that support: ingress, egress and community resilience. Ingress refers to transportation of goods,
services and first responders into a community immediately after a hazard event and in the period of
rebuilding and recovery. Egress refers to the need to evacuate the population before and immediately after
a hazard event. The transportation network must be viable and able to provide safe egress for all people
located in the affected community. Community recovery addresses transportation systems that support
recovery of building clusters and other community needs. For example, segments of the transportation
network will need to provide passage to the critical facilities directly after an event. Additional segments
will need to support businesses when they re-open several days or weeks later.
Recovery times are broken down into three main phases: short-term, intermediate, and long-term. The
short term phase (0-3 days) supports immediate recovery of the community. The intermediate recovery
phase (1-12 weeks) supports the return of individuals and businesses to their daily functions. The long
term recovery phase (4-36+ months) supports the need to rebuild, retrofit, and strengthen the
transportation network.
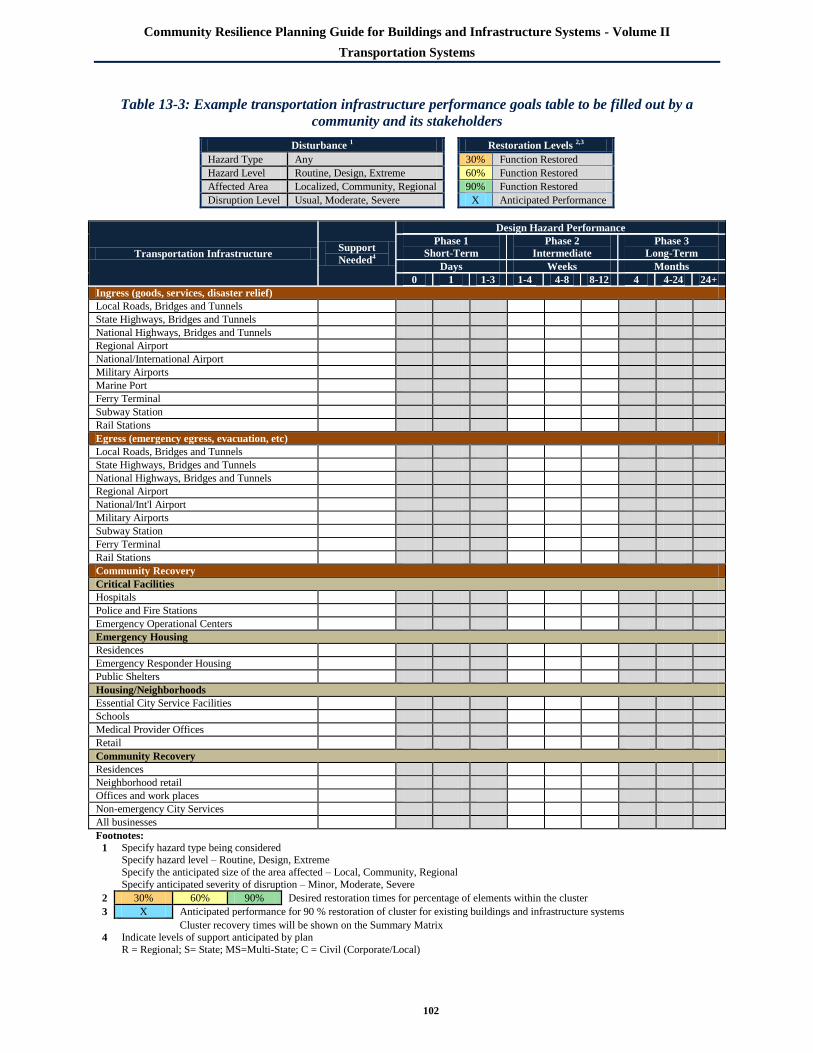
Community Resilience Planning Guide for Buildings and Infrastructure Systems - Volume II
Transportation Systems
102
Table 13-3: Example transportation infrastructure performance goals table to be filled out by a
community and its stakeholders
Disturbance 1 Restoration Levels 2,3
Hazard Type Any 30% Function Restored
Hazard Level Routine, Design, Extreme 60% Function Restored
Affected Area Localized, Community, Regional 90% Function Restored
Disruption Level Usual, Moderate, Severe X Anticipated Performance
Transportation Infrastructure Support
Needed4
Design Hazard Performance
Phase 1
Short-Term
Phase 2
Intermediate
Phase 3
Long-Term
Days Weeks Months
0 1 1-3 1-4 4-8 8-12 4 4-24 24+
Ingress (goods, services, disaster relief)
Local Roads, Bridges and Tunnels
State Highways, Bridges and Tunnels
National Highways, Bridges and Tunnels
Regional Airport
National/International Airport
Military Airports
Marine Port
Ferry Terminal
Subway Station
Rail Stations
Egress (emergency egress, evacuation, etc)
Local Roads, Bridges and Tunnels
State Highways, Bridges and Tunnels
National Highways, Bridges and Tunnels
Regional Airport
National/Int'l Airport
Military Airports
Subway Station
Ferry Terminal
Rail Stations
Community Recovery
Critical Facilities
Hospitals
Police and Fire Stations
Emergency Operational Centers
Emergency Housing
Residences
Emergency Responder Housing
Public Shelters
Housing/Neighborhoods
Essential City Service Facilities
Schools
Medical Provider Offices
Retail
Community Recovery
Residences
Neighborhood retail
Offices and work places
Non-emergency City Services
All businesses
Footnotes:
1 Specify hazard type being considered
Specify hazard level – Routine, Design, Extreme
Specify the anticipated size of the area affected – Local, Community, Regional
Specify anticipated severity of disruption – Minor, Moderate, Severe
2 30% 60% 90% Desired restoration times for percentage of elements within the cluster
3 X Anticipated performance for 90 % restoration of cluster for existing buildings and infrastructure systems
Cluster recovery times will be shown on the Summary Matrix
4 Indicate levels of support anticipated by plan
R = Regional; S= State; MS=Multi-State; C = Civil (Corporate/Local)

Community Resilience Planning Guide for Buildings and Infrastructure Systems - Volume II
Transportation Systems
103
Each community should identify and plan for prevailing hazards that may have significant negative
impact on the built environment. A full discussion of hazard types and level is given in Chapter 4
(Volume I).
The affected area of a given hazard event, which often depends on the type and intensity of the hazard, is
identified to support resilience planning. For example, earthquake and hurricanes typically have large
affected areas, whereas tornadoes and tsunamis have relatively small affected areas. The affected area
indicates the extent of potential damage by the hazard event, including surrounding communities, which
will impact the duration of the recovery process.
The disruption level, on the other hand, is a general estimate of potential disruption to the existing
transportation infrastructure system as a whole, and should be specified as minor, moderate, or severe.
Table 13-4 provides an example performance goals table for pipelines. The pipeline systems most likely
to affect a community are distribution systems for liquid fuels and natural gas, rather than production or
transmission systems. Because natural gas and oil serve similar functions as electric power in the
residential and commercial markets, the functional categories listed in Table 13-4 are essentially the same
as the corresponding performance goal tables for electric transmission and distribution systems in Chapter
13.
To establish performance goals for transportation systems, it is necessary to prioritize the transportation
systems and components that support the desired community response and recovery based on its role in
the community. The ability of each system to effectively serve its function is a balance of the volume of
people or goods that the system can move and its interface with the local community it serves. For
example, highways are designed as networks for evacuation and egress. Local streets feed state county
routes, which feed state highways, which feed interstate highways. The capacity of each branch is
commensurate with the demand. If a local street is blocked, a detour to another street can be found and
the impact on traffic congestion is small. If a major interstate highway is blocked, the consequences are
more significant because detour routes will be needed for large traffic volumes.
In turn, highway design standards are most stringent for interstate highways because they are critical for
movement of people and goods. They are graded to be above flood plains, trees are cut back from the
shoulders, rock slopes are well back of shoulders, and they are well maintained. State highways are next
in the level of performance standards and numbered county routes follow.
When establishing performance goals for transportation system infrastructure, adherence to state, federal
and industry standards may pose some limitations. In most cases design standards and specifications for
transportation infrastructure establish minimum requirements that can be exceeded. However, in some
states, legislation prevents local jurisdictions from exceeding state standards and specifications.
Each performance improvement has an associated financial cost, time table, and possible inconvenience
to the community to modify existing infrastructure. Obtaining funds from the state or federal government
will require supporting documentation to establish community benefits that justify the cost expenditures.
Solutions that serve the interests of multiple stakeholders and lead to win-win situations are more likely to
gain widespread community support and the support of elected officials.

Community Resilience Planning Guide for Buildings and Infrastructure Systems - Volume II
Transportation Systems
104
Table 13-4: Example pipelines performance goals table to be filled out by community and its
stakeholders
Disturbance 1 Restoration Levels 2,3
Hazard Type Any 30% Function Restored
Hazard Level Routine, Design, Extreme 60% Function Restored
Affected Area Localized, Community, Regional 90% Function Restored
Disruption Level Usual, Moderate, Severe X Anticipated Performance
Pipelines Support
Needed4
Design Hazard Performance
Phase 1
Short-Term
Phase 2
Intermediate
Phase 3
Long-Term
Days Weeks Months
0 1 1-3 1-4 4-8 8-12 4 4-24 24+
Distribution
Critical Response Facilities and Support Systems
Hospitals, Police and Fire Stations
Emergency Operations Centers
Debris/recycling centers
Related lifeline systems
Emergency Housing and Support Systems
Public Shelters (General Population, Animal, etc.)
Food distribution centers
Nursing homes, transitional housing
Emergency shelter for response/recovery workforce
Related lifeline systems
Housing and Neighborhood infrastructure
Essential city services facilities
Schools
Medical provider offices
Houses of worship/meditation/ exercise
Buildings/space for social services (e.g., child
services) and prosecution activities
Food distribution from local grocery stores (location
known by community)
Community Recovery Infrastructure
Residential housing restoration
Commercial and industrial businesses
Non-emergency city services
Community Recovery Infrastructure
Residential housing restoration
Commercial and industrial businesses
Non-emergency city services
Related lifeline systems
Footnotes:
1 Specify hazard type being considered
Specify hazard level – Routine, Design, Extreme
Specify the anticipated size of the area affected – Local, Community, Regional
Specify anticipated severity of disruption – Minor, Moderate, Severe
2 30% 60% 90% Desired restoration times for percentage of elements within the cluster
3 X Anticipated performance for 90 % restoration of cluster for existing buildings and infrastructure systems
Cluster recovery times will be shown on the Summary Matrix
4 Indicate levels of support anticipated by plan
R = Regional; S= State; MS=Multi-State; C = Civil (Corporate/Local)

Community Resilience Planning Guide for Buildings and Infrastructure Systems - Volume II
Transportation Systems
105
Similarly, highway bridges and road tunnels are part of the highway infrastructure and cannot be
prioritized separately from the highway they connect. Bridges on interstate highways are more important
than bridges on state highways and county routes when it comes to egress and ingress. Bridges or tunnels
that are part of a subway or rail system that relies on them cannot be prioritized separately.
The logic for prioritizing roadways may be extended to all transportation infrastructure serving a
community. The following transportation systems and their role in supporting community functions are
summarized for consideration when setting transportation system performance goals:
1. Evacuation routes and emergency access routes are designated to function as a network that
transfers vehicles from local streets, to county routes, state highways, and interstate highways,
moving travelers to higher ground or away from other hazards, such as a nuclear power plant.
Highways may have intelligent transportation systems (ITS) to alert travelers of travel times,
detours, and potential traffic congestion that can be avoided. ITS devices like cameras, sensors
and variable message signs let traffic command centers communicate with travelers in vehicles to
direct them. Evacuation plans may reverse the direction of highways, so all travel lanes are
outbound, away from the hazard.
2. Interstate highways are constructed to higher standards and carry the highest volume of vehicles,
which makes them critical in the road system.
3. State highways are important for similar reasons to those listed above.
4. Numbered county routes (numbered parts of complete systems).
5. Pipelines serving energy systems in the community. In the short-term phase, ruptured natural gas,
fuel, water, and wastewater lines need to be repaired to support recovery.
6. Buses use all the highway routes described above. Bus fleets should be protected, fueled, and
strategically located and staged to support egress. They can move the greatest volumes of people,
especially those in communities who do not own vehicles. In the short-term phase, they can also
move the largest volume of relief and recovery workers to an area. In evacuation planning it is
preferable that people who do not have access to automobiles use buses instead of taxis or livery
vehicles, since it results in less highway congestion.
7. In large cities, subway mass transit systems are generally designed to collect commuters traveling
to the city center from their local communities via walking, bicycle, bus, regional rail, park and
ride lots, and livery vehicles. Subway lines also connect at transfer stations, which serve as hubs
to allow commuters to get to the specific destination station closest to where they work. At the
end of the business day they perform these functions in reverse. Subway systems are capable of
moving large volumes of people for egress purposes away from a hazard in the city center. When
used for ingress purposes, the subway routes will likely allow passengers to use transfer stations
to reach a point close to their destinations if their normal destination station is closed. Subways
may not be useful for egress or ingress for events other than those described here. For this reason
they follow buses in priority.
8. Light rail transit systems often link communities, the town center, and other modes of
transportation, such as airports or passenger rail stations. They transport much lower volumes of
passengers at lower speeds than mass transit systems, but provide more frequent service with
shorter headways between trains. In general, light rail systems are not as resilient as other rail
systems. They do not operate in high winds and have problems with icing, since they are either
powered by overhead electric catenaries or have electric bus bars similar to, but less robust than,
third rails.
9. Regional rail is generally designed to collect commuters traveling to the city center from local
suburban communities via local stations or distribute them in the reverse direction. Travel to

Community Resilience Planning Guide for Buildings and Infrastructure Systems - Volume II
Transportation Systems
106
stations is by automobile, taxi, livery car, walking, or bicycle. Some stations are hubs with larger
park and ride lots or garages. Regional rail usually feeds a multimodal train terminal station in the
city or town center where passengers extend their trip to their ultimate destination by intercity
rail, subway, bus transit systems, or taxis. Examples of regional rail are Penn Station in New
York City and Union Station in Washington, DC. Regional rail can serve for egress or ingress;
however, travelers evacuating from the suburbs need to know if other transportation systems they
rely on for connections are functioning.
10. Intercity rail, such as Amtrak, can be used for egress of travelers who need to return to their
community, or residents evacuating to other communities. In the ingress mode, it can bring
recovery workers from distant cities unaffected by the hazard event. Intercity rail stations are
generally in the town center or city center and are well connected to the regional rail or local
subway or bus transit system with taxi and rental car service.
11. Freight rail lines connect to major distribution centers in inland cities and to major port facilities
on the coasts. Use for egress would include removal of debris and refuse. Use for ingress would
include recovery supplies, bulk cargo, and heavy equipment.
12. National or international airports can be used by travelers returning home, or community
residents evacuating to other cities. In the ingress mode, they can receive large volumes of
emergency aid as air cargo and bring recovery workers from large distances unaffected by the
hazard event. Airports are generally well connected to the regional highway network, which is
likely to be the first local transportation system functioning after a hazard event. They may also
be connected to regional rail, subway systems, or light rail systems.
13. Regional airports can function similar to national or international airports to serve communities
that are outside of large cities. The highway networks that support these airports should be sized
according to the lower volumes of cargo and passengers they transport.
14. Marine ports are comprised of docks, waterways, locks, and supporting upland facilities, which
include cargo storage and distribution centers, cargo and container cranes, intermodal freight rail
yards, and truck transfer and inspection facilities. Egress at these facilities involves scheduling
large container ships and cargo vessels to divert to other ports, and diverting rail and truck
exports to other ports. Ingress for recovery supplies and bulk and container cargo can only take
place after restoration of the docks, waterways, locks, supporting upland facilities, and the
connecting highways and rail yards.
15. Large ferry vessels move significant volumes of people across bodies of water that otherwise
would require long travel distances by other modes of transportation. Examples are the ferry
system in San Francisco and the Staten Island Ferry in New York City. They can perform this
function well on an emergency basis for egress or ingress. Their operation, however, is limited in
storm conditions when they are required to shut down. Large ferry systems have robust ferry
terminal docking systems that are less likely to suffer damage during an expected storm event;
however, in more extreme storm events they may suffer significant damage.
16. Ferry terminals for smaller vessels carrying lower volumes of travelers do not have a big impact
on egress, except where they may serve waterfront communities that are otherwise isolated
(island communities). In addition, during the recovery phases, temporary ferry operations can be
quickly established to serve communities cut off by bodies of water after the wash out of roads
and bridges.

Community Resilience Planning Guide for Buildings and Infrastructure Systems - Volume II
Transportation Systems
107
13.4. Regulatory Environment
Multiple regulatory bodies at various levels of government (federal, state, and local) have authority over
the transportation system. The transportation system is not regulated by a single regulatory body, even
within a single transportation mode. This section discusses regulatory bodies of transportation
infrastructure at the federal, state, and local levels.
Federal. Federal regulatory agencies oversee transportation networks and methods of transportation used
within those networks. These agencies promulgate policies and regulations to maintain the safety and
security of the infrastructure and its operations. The transportation industry is overseen by a number of
regulatory agencies that assess and monitor the diverse transportation systems, methods, and operating
environments. Chapter 15 on water and wastewater systems covers environmental aspects including
water, air quality, and waste management and sites environmental acts pertaining to regulations.
Table 13-5 summarizes the methods of transportation used, typical ownership (private or public), and the
oversight authorities involved in their regulation. Table 13-6 lists the role of key Federal agencies that
oversee the transportation industry.
Regional, State, and Local. Metropolitan Planning Organizations (MPO) were encouraged to review the
safety and security of their regional transportation network following the enactment of the Safe
Accountable Flexible Efficient Transportation Equity Act: A Legacy for Users (SAFETEA-LU) in 2005.
FHWA funded and encouraged MPOs across the U.S. to look into ways they to foster safety and security
planning, including resilience efforts, in the long-term capital plans that MPOs develop and fund.
Roads, Bridges, Highways and Road Tunnels. Moving Ahead for Progress in the 21st Century (MAP-21)
is a bill signed into law in July 2012 [FHWA 2015b]. MAP-21 makes funds available for studies related
to the effects of weather and natural hazards, to improve the dissemination of research products, to
accelerate deployment of new technologies, and to ensure existing programs are informed and updated.
MAP-21 requires the U.S. DOT to create a bureau that will oversee a national transportation library, an
advisory council on transportation statistics, and a national database. The bill gives the option for
developing a national data center for transportation agencies, including weather related information and
the development of codes and standards.
Air. The FAA regulates commercial service airports under the Code of Federal Regulations (CFR), 14
CFR Part 139, Certification of Airports. This regulation prescribes rules governing the certification and
operation of airports in any U.S. state, the District of Columbia, or any U.S. territory or possession
providing scheduled passenger service of an aircraft configured for more than 9 passenger seats. Advisory
Circulars (AC) contain methods and procedures that certificate holders use to comply with the
requirements of Part 139.
FAA AC 150/5200-31C, Airport Emergency Plan, provides guidance to the airport operator in the
development and implementation of an Airport Emergency Plan (AEP) that should address essential
actions in the event of possible emergencies, including natural hazards. The guidance includes mitigation,
such as zoning and earthquake-resistant construction, as an important component of comprehensive
emergency management.
Ports, Harbors, and Waterways. State regulatory agencies oversee the ports, harbors, and waterways.
Coastal Zone Management Federal Consistency is a process that requires federal agencies to follow state
coastal management policies when conducting a project or issuing a permit that could affect coastal
resources. It also enables increased coordination between government agencies.
Natural hazard mitigation may be addressed by local regulations, independent of the codes and standards
selected. These regulations would apply to a project, such as a pier or bulkhead, whether it is proposed as
part of development of upland property or to protect upland property from sea level rise for an extended
period.

Community Resilience Planning Guide for Buildings and Infrastructure Systems - Volume II
Transportation Systems
108
Table 13-5: Transportation infrastructure ownership and governing regulatory agencies In
du
stry
Infr
ast
ruct
ure
Type Method of
Transportation
Pu
bli
c
Pri
va
te
Oversight Authority
DH
S
FE
MA
NT
SB
US
DO
T
FR
A
FT
A
TS
A
FM
CS
A
FH
WA
US
CG
EP
A
FA
A
1+
sta
te a
gen
cies
Su
rfa
ce T
ran
spo
rt
Ra
il
Passenger Inter-City Rail
(Amtrak)
X X X X X X X X
Commuter Rail X X X X X X X X X X
Subway X X X X X X X X
Light Rail X X X X X X X X
Inclined Plane X X X X X X X X
Trolley/ Cable Car X X X X X X X X
Freight Class 1 Freight Carriers X X X X X X X X
Ro
ad
s, B
rid
ges
an
d T
un
nel
s
Passenger Inter-City Motor coach X X X X X X X X X
Intra-City Bus/Motor
coach
X X X X X X X X X X X
Paratransit/ Jitneys X X X X X X X X X X X
Taxis X X X X X X X X X X
Personal Cars X X X
Freight Commercial Trucking X X X X X X X X
Ma
riti
me
Passenger Ocean Lines X X X X X X X
Ferries X X X X X X X X X X X
Commercial Boats X X X X X X X
Personal Boats X X X X X X X
Freight Freighters X X X X X X X X X
Barges X X X X X X X X X
Air
Air
Passenger Commercial Airplanes X X X X X X X
Blimps X X X X X X X
Drones X X X X X X X X
Freight Commercial Air Freight X X X X X X X

Community Resilience Planning Guide for Buildings and Infrastructure Systems - Volume II
Transportation Systems
109
Table 13-6: Role of transportation oversight agency
Agency Role and Website
U.S Department of
Transportation (DOT)
Provides oversight of transportation networks. It includes agencies such as FHWA,
FTA, FRA, FAA, Surface Transportation Board, and Maritime Administration
(www.dot.gov).
Federal Highway
Administration (FHWA)
Supports state and local governments in the design, construction and maintenance
of the roadway system (www.fhwa.dot.gov).
Federal Transit Admiration
(FTA)
Provides financial and technical support to local public transit systems
(www.fta.dot.gov).
Federal Railroad
Administration (FRA)
Oversees heavy rail freight, commuter and inter-city passenger rail systems
(www.fra.dot.gov).
Federal Aviation
Administration (FAA)
Oversees all civil aviation in the country (www.faa.gov)
Transportation Security
Administration (TSA)
Prevents the intentional destruction or disablement of all transportation modes.
Imposes security oversight and regulation in aviation, highway, mass transit,
passenger and freight rail, pipeline and maritime where it shares oversight with the
U.S. Coast Guard (www.tsa.gov).
Federal Emergency
Management Agency
(FEMA)
Coordinates the response to a disaster that has occurred in the United States and
that overwhelms the resources of local and state authorities, and supports planning
to reduce vulnerabilities (www.fema.gov).
United States Coast Guard
(USCG)
Oversees safety and security of national waterways, including commercial freight
and passenger service, and public transportation such as municipal ferry service,
boaters, and kayakers (www.uscg.mil).
United States Corp of
Engineers (USACE)
Provides support in the emergency operation and restoration of inland waterways,
ports, and harbors under the supervision of DOD/USACE, including dredging
operations and assists in restoring the transportation infrastructure
(www.usace.army.mil).
United States
Environmental Protection
Agency (EPA)
Protects human health and the environment by writing and enforcing regulations
based on laws passed by Congress (www.epa.gov).
Pipeline and Hazardous
Materials Administration
(PHMSA)
Identifies and evaluates safety risks, develops and enforces standards for
transporting hazardous materials and for the design, construction, operation, and
maintenance of pipelines carrying natural gas or hazardous liquids.
(www.phmsa.dot.gov).
Federal Energy Regulatory
Commission (FERC)
Oversees the transmission and wholesale of electricity and natural gas in interstate
commerce and regulates the transportation of oil by pipeline in interstate commerce
(www.ferc.gov).

Community Resilience Planning Guide for Buildings and Infrastructure Systems - Volume II
Transportation Systems
110
Pipelines. The nation‘s pipeline safety programs are overseen by Congress and administered by PHMSA.
However, PHMSA delegates the majority of these responsibilities for intrastate (generally the gathering
and distribution pipelines) lines to the states. PHMSA retains the role as primary safety inspector for
interstate pipelines (generally, the transmission pipelines), except in 11 states (Arizona, California,
Connecticut, Iowa, Michigan, Minnesota, New York, Ohio, Washington, Virginia and West Virginia).
State pipeline safety personnel represent more than 75 % of the state/federal inspection workforce,
although state employees account for less than 40 % of the federal pipeline safety budget. This means that
the bulk of the safety and inspection responsibility lies at the state level. Under existing law, states opt
into this relationship with PHMSA. If a state decides not to participate, PHMSA does the safety
inspection on its own. At present, this applies only to Alaska and Hawaii.
All state programs must certify to DOT that they will adopt regulations that are as stringent as the Federal
Pipeline Safety Regulations. States are allowed to adopt pipeline safety regulations that are stricter than
federal government regulations and the overwhelming majority of states do have more stringent
requirements. State regulations were developed over the years based on specific results of state
inspections, changing public priorities, and increased safety expectations of the local public. A 2013
report issued by the National Association of Pipeline Safety Representatives (NAPSR), with assistance
and support from the National Association of Regulatory Utility Commissioners (NARUC), found that
most states have adopted pipeline safety regulations more stringent than the federal regulations. The
report also contains a compendium of state regulations and identifies those that exceed federal
requirements. [NAPSR 2013].
PHMSA has separate safety and design standards for natural gas and liquids pipelines (49 CFR Part 192
for natural gas and 49 CFR Part 195 for liquids). The regulations also provide guidance for proper
management and operation of these pipelines.
13.5. Standards and Codes
Codes and standards are used by the transportation industry to establish minimum acceptable criteria for
design and construction. Although adoption of codes is important, enforcement is a key factor in ensuring
compliance of the built environment with codes and standards. The following sections discuss some of
the standards and codes for each transportation system:
Transportation Facilities. Stations, terminals, maintenance facilities, substations, cargo storage facilities,
and other buildings supporting the transportation system are governed by adopted state and local building
codes, which are often based on model codes. Many cities and states are adopting international model
building codes. More information on codes and applicable standards is found in Chapter 12 (Buildings).
Roads, Bridges, Highways and Road Tunnels. AASHTO is a standards-setting body that publishes
specifications, test protocols, and guidelines used in highway and bridge design and construction
throughout the United States. AASHTO specifications for the design of bridges consider waterfront
effects, since bridges often span waterways. Hence, the provisions of these specifications are often used in
the design of similar waterfront structures.
Rail. The American Railway Engineering and Maintenance-of-Way Association (AREMA) authors a
Manual for Railway Engineering (MRE) [AREMA 2015a], and a Communications and Signals Manual,
among other guides. The MRE is updated annually with new design standards for fixed railway.
Air. For airports, FAA can accept state standards for construction materials and methods. Under certain
conditions, the use of state dimensional standards that differ from the standards in FAA Advisory
Circulars are acceptable for federally obligated or certificated airports.
Many communities have zoning ordinances, building codes, and fire regulations that may place additional
requirements on airport development and operations. For example, if a new hangar or other structure is to

Community Resilience Planning Guide for Buildings and Infrastructure Systems - Volume II
Transportation Systems
111
be built at an existing airport, approval and/or permits must be received from the local building
department or planning authority. For example, the Borough of Lincoln Park, New Jersey has strict storm
water management requirements due to high flood hazard potential.
The FAA issues advisories that govern engineering, design, and construction standards for various
airport-related equipment, facilities, and structures. Their Series 150 AC Library has a complete listing of
current advisory circulars. If a project is funded wholly or partly through FAA, it will comply with these
standards.
ACs cover standards for general airport design, specifying construction, design and installation of visual
aids, drainage design, approach path systems, runway and taxiway pavement and lighting design, and
planning and design guidelines for airport terminals and facilities. ACs define design criteria for most
details of an airport‘s facilities, including terminal buildings, lighting, and navigational aids. These
documents define standard criteria for design and construction, but do not specifically address extreme
weather events beyond drainage construction for a 50-year storm.
Ports, Harbors, and Waterways. In the purpose and need statement for a proposed project, the basis of
design should state the standards and codes used, and the regulations and guidelines that apply to the
project. Organizations that provide codes, standards, and guidelines commonly used in maritime
infrastructure design and construction include:
American Association of State Highway Officials (AASHTO)
Permanent International Association of Navigation Congress (PIANC)
American Society of Civil Engineers (ASCE)
American Concrete Institute (ACI)
U.S. Department of Defense (DoD)
U.S. Army Corps of Engineers (USACE)
American Institute of Steel Construction (AISC)
British Standards Institution (BSI)
International Organization for Standardization (ISO)
Overseas Coastal Area Development Institute of Japan (OCDI)
The American Society of Civil Engineers, ASCE, maintains ASCE 61 [2014a] Seismic Design Standard
for Piers and Wharves, which defines a displacement-based design method to establish guidelines for
piers and wharves to withstand the effects of earthquakes [Meng and Qu 2010].
Many organizations have guidance documents based on industry expertise to supplement codes and
standards and to support designers.
The American Concrete Institute (ACI) developed and maintains ACI 357.3R [2014] Guide for Design
and Construction of Waterfront and Coastal Concrete Marine Structures. This guide addresses the
durability and serviceability of concrete waterfront structures, as well as analysis techniques and design
methodologies.
The World Association for Waterborne Transport Infrastructure [PIANC 2012] provides expert guidance,
recommendations and technical advice for design, development, and maintenance of ports, waterways and
coastal areas. Two guidelines of frequent interest in port design are: Seismic Design Guidelines for Port
Structures [International Navigation Association 2002b] and Guidelines for the Design of Fender Systems
[International Navigation Association 2002a].

Community Resilience Planning Guide for Buildings and Infrastructure Systems - Volume II
Transportation Systems
112
The DoD initiated the Unified Facilities Criteria (UFC) program to unify all technical criteria and
standards pertaining to planning, design, and construction of facilities, which were previously issued by
individual Defense agencies [NIBS 2015]. They cover military harbors, coastal facilities, waterfront
construction, and design of piers, wharves, berthing and mooring facilities.
The USACE published an extensive library of Engineering Manuals [USACE 2015] covering the design
of a variety of major civil works along waterways and coastal environments. The manuals, typically used
for waterfront design, cover flood walls, navigation locks, cofferdams, and coastal design and engineering
of revetments, seawalls and bulkheads – none of which specifically incorporate adaptation policies that
support resilience [NYC DOT 2015].
BSI standards for waterfront construction, BSI 6349, Maritime Structures [BSI 2013], cover general
criteria, materials, design of quay walls, jetties, dolphins, shipyards and sea locks. They also include a
code of practice for the design of fendering and mooring systems, and design of roll-off and roll-on
ramps, linkspans and walkways.
Pipelines. PHMSA employees participate in more than 25 national voluntary consensus standards-setting
organizations that address pipeline design, construction, maintenance, inspection, and repair. PHMSA
then reviews and approves standards for incorporation by reference into its regulations. PHMSA currently
incorporates by reference all or parts of more than 60 voluntary standards and specifications developed
and published by technical organizations, including consensus engineering standards from the American
Society of Mechanical Engineers (ASME), the American Petroleum Institute (API), the American Gas
Association, the National Fire Protection Association, and the American Society for Testing and
Materials (ASTM) International. For example, ASME Standard B31.8S establishes risk assessment
practices for identifying pipelines (primarily older pipelines) that could possibly be susceptible to material
and construction-related integrity concerns. In addition, many agencies – federal, state and local – share
responsibility for developing and enforcing other codes and standards applicable to pipeline
infrastructure, such as erosion control requirements, noise ordinances, and building codes.
13.5.1. New Construction
Current federal and state project development guidelines require an environmental study at the early
stages of transportation projects to identify potential environmental impacts and state/federal permitting
requirements. The study must provide a sufficient level of understanding of the projected routing and
locations to enable engineers and planners to identify likely impacts.
If federal funding is used for the project, it will be subject to environmental review under the National
Environmental Policy Act (NEPA) [EPA 2008]. Projects go through a scoping process to establish
general parameters of the work and the potential for impact. The scoping process leads to a Class of
Action determination establishing whether the project is Categorically Exempt from NEPA review, or
will need either an Environmental Assessment (EA) or the highest level of review, which is an
Environmental Impact Statement (EIS). An EIS requires local community input and is an important
opportunity for the community to discuss the alignment of their resilience goals and those of the project.
With the exception of highways that are owned by either toll authorities or by public private partnerships
and pipelines that are owned by private industry, major new transportation projects in a community will
generally have a large portion (more than 50 %) that is federally funded by agencies such as the FAA,
FTA, FHWA, or USCG. While the majority of new freight rail construction projects are privately funded,
FRA supports passenger and freight railroading through a variety of grant and loan programs to improve
safety, relieve congestion, and encourage the expansion and upgrade of passenger and freight rail
infrastructure and services. The U.S. DOT publishes codes, standards and guidelines, such as FAA
advisory circulars, and works in close collaboration with organizations like AASHTO and AREMA,
shown in Table 13-7 and Table 13-8.

Community Resilience Planning Guide for Buildings and Infrastructure Systems - Volume II
Transportation Systems
113
Table 13-7: Surface transport codes, standards, or guidelines
Component Organization Codes, Standards or Guideline
General AASHTO Road Design Guide, 4th
Edition [AASHTO 2011b]
A Policy on Geometric Design of Highways and Streets, 6th
Edition
[AASHTO 2011a]
General AASHTO LRFD Bridge Design Specifications, 7th
Edition [AASHTO 2014]
AASHTO Highway Drainage Guidelines [AASHTO 2014]
AASHTO Guide for Design of Pavement Structures, 4th
Edition [AASHTO
1998]
Design Standards Interstate System
A Policy on Design Standards – Interstate Systems, January 2005
FHWA Highways in the Coastal Environment, 2nd
Edition [FHWA 2008]
Highways in the Coastal Environment: Assessing Extreme Events, HEC-
25, Volume 2 [Douglas et al. 2014]
Specific to
Severe
Weather/
Hazards
AASHTO Guide Specifications for Bridges Vulnerable to Coastal Storms [AASHTO
2008]
Transportation Asset Management Guide [AASHTO 2013]
Integrating Extreme Weather Risk into Transportation Asset Management
[xxxx]
NCHRP Climate Change, Extreme Weather Events, and the Highway System
[NCHRP 2014]
FHWA Impacts of Climate Change and Variability on Transportation Systems and
Infrastructure, The Gulf Coast Study, Phase 2, Task 3.2 [FHWA 2014]
FHWA Order 5520: Transportation System Preparedness and Resilience to
Climate Change and Extreme Weather Events [FHWA 2014]
United States DOT 2014 DOT Climate Adaptation Plan [USDOT 2014]
U.S. Global Change
Research Program
National Climate Assessment [US Global Change Research Program 2014]

Community Resilience Planning Guide for Buildings and Infrastructure Systems - Volume II
Transportation Systems
114
Table 13-8: Rail surface transport codes, standards, or guidelines
Component Organization Codes, Standards or Guideline
General AREMA
Manual for Railway Engineering [AREMA 2015a]
Communications and Signals (C&S) Manual
[AREMA 2014]
Portfolio of Track Work Plans [AREMA 2014]
General AREMA
Practical Guide to Railway Engineering [AREMA
2003]
Bridge Inspection Handbook [AREMA 2015b]
Design of Modern Steel Railway Bridges, First
Edition [Unsworth 2010]
Specific to
Natural Hazard
Mitigation
AREMA None identified
AAR None identified
United States DOT 2014 DOT Climate Adaptation Plan [USDOT 2014]
U.S. Global Change Research Program National Climate Assessment [US Global Change
Research Program 2014]
Roads, Bridges, Highways and Road Tunnels. The interstate system with roads, bridges, highways, and
road tunnels, and virtually all other state and local roadways and bridges in the U.S. are owned and
operated by the public sector. Toll roads are typically owned and operated by public/private partnerships,
but are subject to the same federal and state design standards issued primarily by FHWA and state
Departments of Transportation (DOT). State DOTs establish standards within the framework of
AASHTO specifications and standards. AASHTO‘s most recent bridge design manual, the Load Factor
and Resistance Design (LFRD) Bridge Design Specifications [AASHTO 2012], incorporates a risk factor
into load bearing calculations to address effects due to deflection, cracking, fatigue, flexure, shear,
torsion, buckling, settlement, bearing, and sliding.
After Hurricanes Ivan and Katrina, FHWA began recommending that design of major interstate structures
in coastal regions consider a combination of wave and surge effects, as well as other site specific risks
from coastal flood events. Additionally, FHWA also suggested that a flood frequency surge and wave
action (500-year storm) may be appropriate to consider in some cases [Meyer et al. 2014]. Some of the
codes, standards, and guidelines for surface transportation are shown in Table 13-8.
Rail. The freight rail network in the United States is primarily owned and operated by the private sector.
This network consists of national freight railroads and short line railroads that connect national lines to
local industrial areas. Amtrak (National Railroad Passenger Corporation) primarily owns the national
passenger rail network and hosts regional commuter rail lines in some areas, such as the Northeast
Corridor. Many regional commuter lines (under public authorities) have their own large rail networks.
There are many sections of rail lines where freight trains, Amtrak, and even commuter rail lines share
tracks. In the railroad industry, AREMA establishes and updates design standards for track, structures,
and facilities. Operating standards in the rail industry pertaining to safety are under the jurisdiction of

Community Resilience Planning Guide for Buildings and Infrastructure Systems - Volume II
Transportation Systems
115
FRA. Additionally, the industry trade organization, Association of American Railways (AAR), has a role
in the development of operating standards and policies pertaining to railroad operations. Some codes,
standards, and guidelines for rail are listed in Table 13-8.
Ports. New maritime construction needs to follow the local codes and standards for design and
construction. Natural hazard impacts are usually incorporated by local authorities by utilizing the
guidance documents issued by various local and federal authorities, such as USACE and IPCC. For
example, the City of New York adopted specific guidelines in regards to the effects of natural hazards
through an authorized panel, New York Panel on Climate Change [2010].
Pipelines. New pipelines are subject to current federal and state design and safety guidelines. Liquids
pipelines and intrastate natural gas pipelines are regulated at the state level; therefore, regulations and risk
evaluations for assessment of hazards will vary depending on location.
13.5.1.1. Design Hazard Levels
National codes do not specify hazard levels for all hazards or situations, but many provide guidance on
how they should be developed for such circumstances. Some hazards, such as flood elevations and wave
conditions, need to be evaluated locally, as they depend on local topography and soil conditions. For
example, rail codes stipulate various flood levels for which a structure may need to be designed, as a 50
or 100-year flood event. Similarly for wave loads, various codes (e.g., USACE Coastal Engineering
Manual [USACE 2002]) advise that waves should be considered, but a design professional needs to
determine appropriate local wave characteristics. Similarly, the FHWA lists three approaches for
determining site-specific design water levels in Highways in the Coastal Environment [FHWA 2008].
These include use of available analyses, historical data, and numerical simulations with historic inputs, or
some combination of these approaches. These are general guidelines, but they apply to all regions of the
country and ensure the process is data driven.
When describing Drainage Channels, the AASHTO Road Design Guide [AASHTO 2011b] states that
―channels should be designed to carry the design runoff and to accommodate excessive storm water with
minimal highway flooding or damage.‖ No specific hazard levels are mentioned, leaving hazard
specification up to state regulations and engineering judgment. AREMA provides more specific
requirements than AASHTO in regards to hazard levels, but still leaves room for site-specific decisions.
To continue the drainage example, the Manual for Railway Engineering [AREMA 2015a] states that ―the
100-year base flood elevation is the most commonly regulated storm water elevation associated with
rivers, streams and concentrated flow areas.‖ It goes on to describe how, ―any change to the flood plain
will generally result in extensive studies and computer modeling to be submitted for approval.‖ Again,
these regulations are not quantitative regulations, but a guidance that ensures proper steps are taken by the
appropriate agency to mitigate risk.
State and local legislative bodies are not obligated to adopt model building codes and may write their own
code or portions of a code. For example, New York City Building code describes the requirement for
flood-resistant construction, referencing FEMA flood maps and ASCE 24 [2014c] for ―dry flood-
proofing.‖ The Design Flood Elevation for certain structures, such as terminals, air traffic control towers,
and electrical substations, is the 100-year floodplain plus one-foot of freeboard, or additional foot of
elevation above the floodplain level.
The National Cooperative Highway Research Program (NCHRP) conducted a study on natural hazard
adaptation strategies in 2013 and provided some specific examples of dealing with increasing severity of
weather events. For example, precipitation event modeling may be improved by using climate-dependent
input parameters, or using relative increases in precipitation amounts following the Clausius-Clapeyron
relationship [Meyer et al. 2014].

Community Resilience Planning Guide for Buildings and Infrastructure Systems - Volume II
Transportation Systems
116
Interstate natural gas infrastructure is regulated by FERC, which is responsible for compliance with
NEPA. The NEPA document addresses potential impacts resulting from the project and natural hazard
impacts on the project. As stated previously, impacts on pipelines are generally limited because they are
buried, but aboveground facilities such as compressor stations could be affected by storm-related
incidents. Input from state and local governments is a key component of the review process at FERC.
Local knowledge of environmental conditions and concerns about inter-relationships with other critical
infrastructure should be identified to FERC at the earliest point in any project review. For example, there
may be resiliency and reliability concerns if a new pipeline‘s proposed route would be adjacent to a
critical electric transmission line.
13.5.1.2. Recovery Levels
For roadway and rail transportation, no specific criteria for recovery levels are identified in codes or
standards. However, at state and local levels there may be operational or performance goals with regards
to recovery of function.
There is minimal description of required recovery levels for airports. Language for storm water drainage
requires surface runoff from a design storm be disposed of without damage to facilities, undue saturation
of the subsoil, or significant interruption of normal traffic. ―The drainage system will have the maximum
reliability of operation practicable under all conditions, with due consideration given to abnormal
requirements, such as debris and annual periods of snowmelt and ice jam breakup.‖
Marine infrastructure is critical to the transportation industry (commercial, public, and private) and the
full recovery will be necessary for proper functionality. However, no specific guidance was identified.
13.5.2. Existing Construction
A model code does not have legal standing until it is adopted as law by a legislative body (state
legislature, county board, city council, etc.). Because codes are updated regularly, existing structures and
infrastructure systems are traditionally required to only meet the code that was enforced at the time of
design and construction unless it undergoes significant reconstruction, rehabilitation, alteration, or if the
occupancy of an existing building changes. In such case, provisions are often included in adopted codes to
require partial to full compliance [ASCE 2014b].
Existing transportation systems are similarly bound by the codes and standards for which they were
initially designed. Typically, transportation infrastructure is not required to be upgraded as new codes are
adopted. However, AASHTO and the FHWA have seismic retrofit standards for existing bridges and
transportation infrastructure systems. Thresholds for enforcement are established by each state DOT or
local jurisdiction to determine if a rehabilitation project should require a full seismic upgrade of the
existing structures to the current codes and standards. For example, in New York and New Jersey, bridge
structures that undergo rehabilitation generally require a full seismic upgrade if the project includes a
replacement of the concrete bridge deck slab.
There are similar policies in place for transportation facility buildings such as stations, terminals, and
maintenance facilities. Most building codes require full seismic compliance for building renovation
projects if the value of the project improvement is equal to or greater than a threshold percentage of the
buildings replacement value (usually 50 %).
Airport codes and standards do not address retrofit of existing construction. Several advisory circulars
outline procedures for maintaining existing facilities:
AC 150/5380-6C, Guidelines and Procedures for Maintenance of Airport Pavements [FAA 2010]
AC 150/5380-7B, Airport Pavement Management Program (PMP [FAA 2014a])

Community Resilience Planning Guide for Buildings and Infrastructure Systems - Volume II
Transportation Systems
117
AC 150/5340-26C, Maintenance of Airport Visual Aid Facilities [FAA 2014b]
AC 150/5200-33, Hazardous Wildlife Attractants on or Near Airports [FAA 2007]
For rail, roadway, and maritime systems, codes and standards that specifically address evaluation or
improvements to existing construction have not been identified.
Figure 13-10 compares the time frame of transportation projects and expected service periods against the
possible future climate impacts, such as drought or sea level rise. According to Moritz et al. [2012],
infrastructure planned and built with current design criteria may not be adequate for future operation and
resilience. Hence, communities should consider the desired functions and environmental conditions that
may be needed over the service life during transportation planning process.
Figure 13-10: Timeframes for transportation systems functionality and potential climate change
impacts [Source: Michael Savonis, FHWA 2009]
13.6. Strategies for Implementing Plans for Community Resilience
13.6.1. Available Guidance
Section 13.2 describes the various components of the transportation systems and case studies of where
these systems may have failed in the past. The performance of transportation systems depends on the age
of the system, the type and intensity of natural hazard, the codes and standards to which it was designed,
maintenance levels, and operational decisions made immediately before and after the hazard event.
Current engineering standards and guidelines provide tools to assess the performance of bridges and
roadways, such as the Manual for Bridge Evaluation [AASHTO 2010]. Similar standards exist for other
transportation system components, such as airports, rail, subways, etc.
AASHTO‘s Transportation Asset Management Guide [AASHTO 2011c] applies to both roads and rail
systems, as it encourages agencies to include life-cycle planning, operations, and maintenance into state
and local resource management programs. The guide recommends processes and tools for life cycle
management, incorporating effects due to weather events, and monitoring the assets to continually
improve performance forecasting.
The Greater Toronto Airports Authority (GTAA) uses the PIEVC (Public Infrastructure Engineering
Vulnerability Committee) Protocol from Engineers Canada to assess risk and identify preliminary needs
(such as storm water facilities).
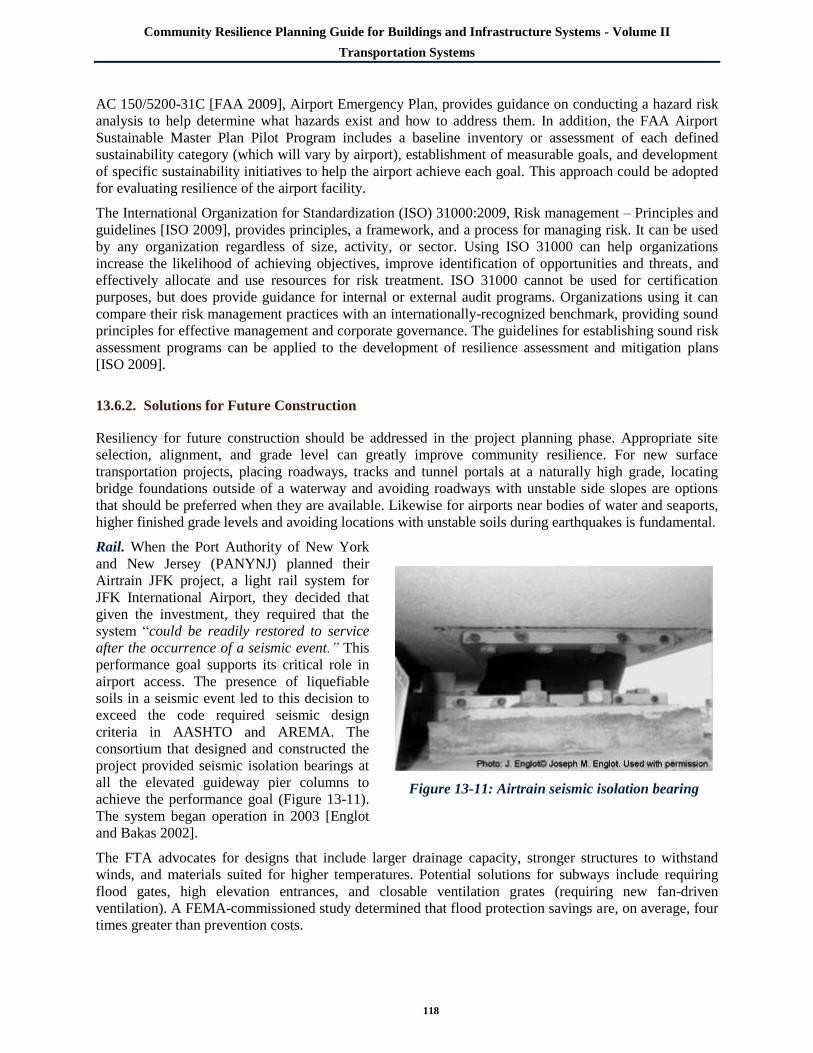
Community Resilience Planning Guide for Buildings and Infrastructure Systems - Volume II
Transportation Systems
118
AC 150/5200-31C [FAA 2009], Airport Emergency Plan, provides guidance on conducting a hazard risk
analysis to help determine what hazards exist and how to address them. In addition, the FAA Airport
Sustainable Master Plan Pilot Program includes a baseline inventory or assessment of each defined
sustainability category (which will vary by airport), establishment of measurable goals, and development
of specific sustainability initiatives to help the airport achieve each goal. This approach could be adopted
for evaluating resilience of the airport facility.
The International Organization for Standardization (ISO) 31000:2009, Risk management – Principles and
guidelines [ISO 2009], provides principles, a framework, and a process for managing risk. It can be used
by any organization regardless of size, activity, or sector. Using ISO 31000 can help organizations
increase the likelihood of achieving objectives, improve identification of opportunities and threats, and
effectively allocate and use resources for risk treatment. ISO 31000 cannot be used for certification
purposes, but does provide guidance for internal or external audit programs. Organizations using it can
compare their risk management practices with an internationally-recognized benchmark, providing sound
principles for effective management and corporate governance. The guidelines for establishing sound risk
assessment programs can be applied to the development of resilience assessment and mitigation plans
[ISO 2009].
13.6.2. Solutions for Future Construction
Resiliency for future construction should be addressed in the project planning phase. Appropriate site
selection, alignment, and grade level can greatly improve community resilience. For new surface
transportation projects, placing roadways, tracks and tunnel portals at a naturally high grade, locating
bridge foundations outside of a waterway and avoiding roadways with unstable side slopes are options
that should be preferred when they are available. Likewise for airports near bodies of water and seaports,
higher finished grade levels and avoiding locations with unstable soils during earthquakes is fundamental.
Rail. When the Port Authority of New York
and New Jersey (PANYNJ) planned their
Airtrain JFK project, a light rail system for
JFK International Airport, they decided that
given the investment, they required that the
system ―could be readily restored to service
after the occurrence of a seismic event.‖ This
performance goal supports its critical role in
airport access. The presence of liquefiable
soils in a seismic event led to this decision to
exceed the code required seismic design
criteria in AASHTO and AREMA. The
consortium that designed and constructed the
project provided seismic isolation bearings at
all the elevated guideway pier columns to
achieve the performance goal (Figure 13-11).
The system began operation in 2003 [Englot
and Bakas 2002].
The FTA advocates for designs that include larger drainage capacity, stronger structures to withstand
winds, and materials suited for higher temperatures. Potential solutions for subways include requiring
flood gates, high elevation entrances, and closable ventilation grates (requiring new fan-driven
ventilation). A FEMA-commissioned study determined that flood protection savings are, on average, four
times greater than prevention costs.
Figure 13-11: Airtrain seismic isolation bearing

Community Resilience Planning Guide for Buildings and Infrastructure Systems - Volume II
Transportation Systems
119
Localized flooding for transit and other transportation facilities can be prevented by establishing proper
stormwater management. Best practices include rain gardens, stormwater ponds, increased vegetation,
green roofs, rain barrels, and pervious pavements. These solutions allow stormwater to be absorbed
through natural processes, reducing, or preventing flooding altogether [FTA 2013].
Transportation Facilities. PANYNJ has Sustainable Infrastructure Guidelines that are implemented for
projects such as terminal building construction, building demolition, electronics systems, communications
systems, airfield construction or rehabilitation, and landscaping [PANYNJ 2011]. The guidelines require
the protection of the ecological health of wetlands, floodplains, and riparian buffers, protection and
maintenance of absorbent landscapes, mitigation of the heat island effect, and implementation of storm
water best management practice, implementation of sustainable landscape maintenance. LAWA‘s
Sustainable Airport Planning, Design, and Construction Guidelines are similar, identifying many
technical approaches to natural hazard adaptation planning such as increasing the capacity of storm water
conveyance and storage (e.g., design for 100-year and 500-year storms) and using heat-resistant paving
materials.
New buildings and infrastructure systems, particularly those adjacent to coastal resources or within a
floodplain, should implement flood hazard mitigation as part of the design. PANYNJ established a
requirement for additional elevation of 457 mm (18 inches) higher than the current code requirement for
flood elevations, based on an anticipated increase of the mean sea level. If the requirement is not feasible,
then it could perhaps be met for all critical project elements (electrical equipment, communications, etc.).
San Diego International Airport incorporated low impact solutions (e.g., pervious pavement, infiltration
storage chambers, bio-retention swales, modular wetlands, riprap energy dissipater) into their north side
improvements to reduce flooding risks.
The American Society of Civil Engineers (ASCE) issued a series of policy statements [ASCE 2015]
supporting resilient and sustainable reconstruction of areas devastated by hazard events. ASCE
specifically supports the following actions:
Redesign and reconstruction of hazard protection systems for affected communities at a level
appropriate for protection of the population, critical infrastructure and the environment; and
Reconstruction that incorporates appropriate studies, urban design, application of technology,
land use, zoning, and utilization of natural systems to recreate communities that are resilient,
sustainable, more livable and less vulnerable to accidental, intentional and/or natural hazard
events.
The challenges include evaluation of the prior conditions and effects caused by the hazard(s) to determine
if reconstruction of the affected infrastructure is viable, feasible and beneficial to facilitate the task of
protecting life, property, and national critical infrastructure.
To better protect lives, property, and infrastructure systems, the affected areas cannot always be rebuilt to
match prior conditions. Reconstruction and recovery includes considering the existing conditions, that
may have facilitated the destruction. It also includes considering the principles of resilience and
sustainability.
The Transportation Research Board (TRB) serves the research and practice needs of the U.S.
transportation systems. TRB has members from the U.S. DOT, state DOTs, practicing transportation
professionals, and transportation experts. Committee TRB ABE40: Committee on Critical Transportation
Infrastructure Protection [TRB 2015a] considers threats and hazards to transportation infrastructure. This
includes terrorist threats and large-scale or complex and catastrophic hazards. The committee that deals
with extreme weather events is TRB A0020T: Special Task Force on Climate Change and Energy [TRB
2015b].
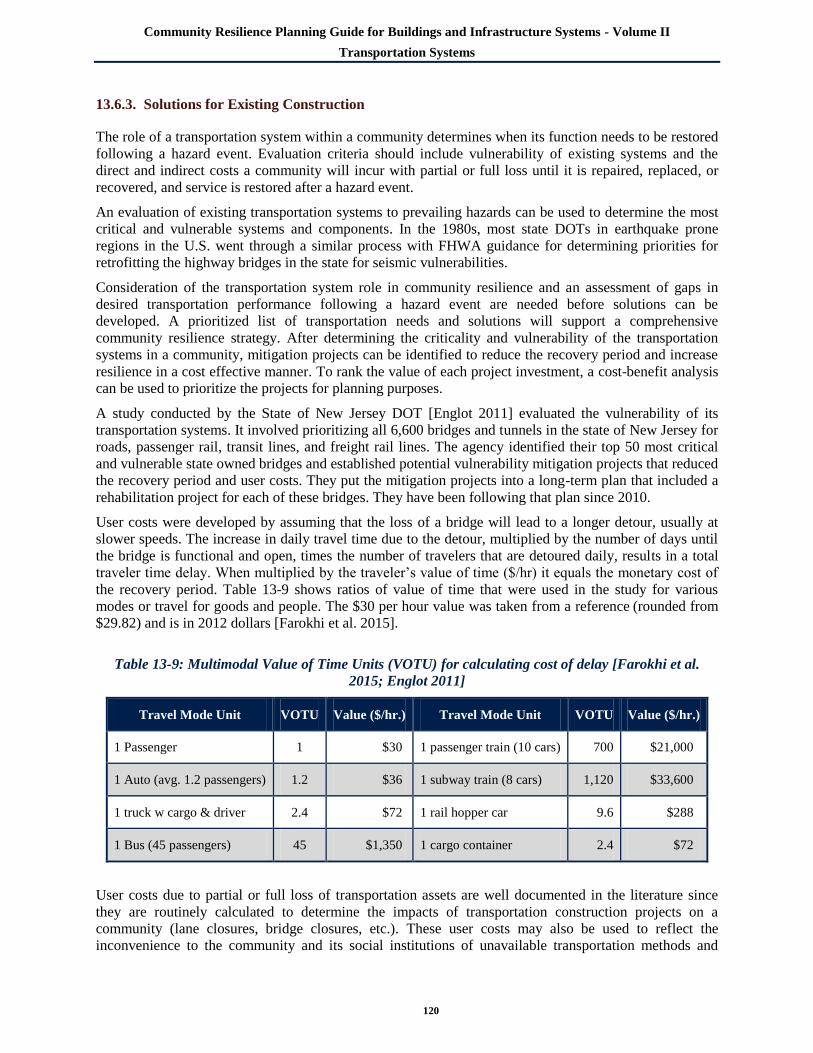
Community Resilience Planning Guide for Buildings and Infrastructure Systems - Volume II
Transportation Systems
120
13.6.3. Solutions for Existing Construction
The role of a transportation system within a community determines when its function needs to be restored
following a hazard event. Evaluation criteria should include vulnerability of existing systems and the
direct and indirect costs a community will incur with partial or full loss until it is repaired, replaced, or
recovered, and service is restored after a hazard event.
An evaluation of existing transportation systems to prevailing hazards can be used to determine the most
critical and vulnerable systems and components. In the 1980s, most state DOTs in earthquake prone
regions in the U.S. went through a similar process with FHWA guidance for determining priorities for
retrofitting the highway bridges in the state for seismic vulnerabilities.
Consideration of the transportation system role in community resilience and an assessment of gaps in
desired transportation performance following a hazard event are needed before solutions can be
developed. A prioritized list of transportation needs and solutions will support a comprehensive
community resilience strategy. After determining the criticality and vulnerability of the transportation
systems in a community, mitigation projects can be identified to reduce the recovery period and increase
resilience in a cost effective manner. To rank the value of each project investment, a cost-benefit analysis
can be used to prioritize the projects for planning purposes.
A study conducted by the State of New Jersey DOT [Englot 2011] evaluated the vulnerability of its
transportation systems. It involved prioritizing all 6,600 bridges and tunnels in the state of New Jersey for
roads, passenger rail, transit lines, and freight rail lines. The agency identified their top 50 most critical
and vulnerable state owned bridges and established potential vulnerability mitigation projects that reduced
the recovery period and user costs. They put the mitigation projects into a long-term plan that included a
rehabilitation project for each of these bridges. They have been following that plan since 2010.
User costs were developed by assuming that the loss of a bridge will lead to a longer detour, usually at
slower speeds. The increase in daily travel time due to the detour, multiplied by the number of days until
the bridge is functional and open, times the number of travelers that are detoured daily, results in a total
traveler time delay. When multiplied by the traveler‘s value of time ($/hr) it equals the monetary cost of
the recovery period. Table 13-9 shows ratios of value of time that were used in the study for various
modes or travel for goods and people. The $30 per hour value was taken from a reference (rounded from
$29.82) and is in 2012 dollars [Farokhi et al. 2015].
Table 13-9: Multimodal Value of Time Units (VOTU) for calculating cost of delay [Farokhi et al.
2015; Englot 2011]
Travel Mode Unit VOTU Value ($/hr.) Travel Mode Unit VOTU Value ($/hr.)
1 Passenger 1 $30 1 passenger train (10 cars) 700 $21,000
1 Auto (avg. 1.2 passengers) 1.2 $36 1 subway train (8 cars) 1,120 $33,600
1 truck w cargo & driver 2.4 $72 1 rail hopper car 9.6 $288
1 Bus (45 passengers) 45 $1,350 1 cargo container 2.4 $72
User costs due to partial or full loss of transportation assets are well documented in the literature since
they are routinely calculated to determine the impacts of transportation construction projects on a
community (lane closures, bridge closures, etc.). These user costs may also be used to reflect the
inconvenience to the community and its social institutions of unavailable transportation methods and

Community Resilience Planning Guide for Buildings and Infrastructure Systems - Volume II
Transportation Systems
121
delays in travel when forced to take alternate means of transportation. However, such indirect costs are
not well documented. Most state DOTs have a manual for determining user costs due to highway
construction.
The same type of calculation can be used to determine user costs for the recovery period of a subway
tunnel, an airport closure, or a container port facility. This simplified methodology yields costs in dollars
that can be easily understood by the community to measure the value of a strategy to improve resilience
(reduce the time to recovery of function) of any transportation asset.
Additional Solutions. Sea level rise strategies may need to be applied to existing buildings as well as new
building projects for many coastal transportation systems. For example, Key West International Airport in
Florida is vulnerable to hurricanes and sea level rise. They have been retrofitting existing infrastructure by
installing flapper valves inside drainage structures to avoid standing water on runways and taxiways. In
addition, they have adapted their wildlife hazard mitigation strategies to handle new animals that are
encroaching on the airport as a result of changing habitat. Additional solutions are outlined in the Monroe
County Climate Action Plan [Monroe County Climate Change Advisory Committee 2013].
USACE employs a 3-tier process for screening projects that need to address sea level rise [Moritz 2012].
Tier 1 establishes a Strategic Decision Context, Tier 2 involves Project Area Vulnerability and Tier 3
evaluates Alternative Development, Evaluation, and Adaptability. As sea levels rise, both the frequency
of flooding and associated loads on structural may increase. Structural loads may need to consider:
Increased variability of load factors
Tidal and wave height range
Local sea level change rate
Frequency of events
Key project processes
Short and long-term erosion and land recession
Cumulative impacts with other natural drivers
The FTA identifies four strategies for adaptation that are broad enough that they apply to a range of
transportation facilities [FTA 2013]:
Maintain and manage – adjust budgets for increased maintenance cost and improve severe event
response times. Utilize technologies that detect changes such as pressure and temperature in
materials as a precaution against structure damage or rising water levels.
Strengthen and protect – existing infrastructure should be retrofitted to withstand future weather
conditions. Ensure facilities can stand up against high winds and extreme temperatures, and
assure flood prevention and adequate drainage.
Enhance redundancy – identify system alternatives in the event of service interruption and
develop a regional mobility perspective that includes all transportation modes.
Retreat – Abandon at risk infrastructure located in vulnerable or indefensible areas. Potentially
relocate in a less vulnerable location.
For subways, many solutions have been implemented to address rain events that may otherwise result in
tunnel flooding, such as increasing the number of pumps or pump capacity. New York City implemented
raised ventilation grates to prevent runoff into subway lines. Tokyo ventilation shafts are designed to
close when a heavy rain warning is issued, and can be closed by remote control or automatically in

Community Resilience Planning Guide for Buildings and Infrastructure Systems - Volume II
Transportation Systems
122
response to a flood sensor. The PANYNJ raised floodgates at station platforms to account for sea level
rise and sealed all gates below the 100-year floodplain.
For open railways, track buckling results from increased temperatures and are costly as well as a safety
hazard. Slow orders (mandated speed reductions) are typically issued on sections of track in areas where
an elevated rail temperature is expected and risk of track buckling is increased. Replacement track has a
higher lateral resistance to combat buckling forces. FRA has created a model for predicting rail
temperatures, allowing proper replacement before an incident occurs [FRA 2014].
13.7. References
Airport Cooperative Research Program (ACRP 2012) ACRP Synthesis 33: Airport Climate Adaptation
and Resilience – A Synthesis of Airport Practice, Sponsored by the Federal Aviation Administration,
Transportation Research Board of the National Academies, Washington, DC,
http://onlinepubs.trb.org/onlinepubs/acrp/acrp_syn_033.pdf.
American Association of State Highway and Transportation Officials (AASHTO 1998) AASHTO Guide
for Design of Pavement Structures, Fourth Edition (with Supplement), American Association of State
Highway and Transportation Officials (AASHTO), Washington, DC.
American Association of State Highway and Transportation Officials (AASHTO 2008) Guide
Specifications for Bridges Vulnerable to Coastal Storms, American Association of State Highway and
Transportation Officials (AASHTO), Washington, DC.
American Association of State Highway and Transportation Officials (AASHTO 2010) Manual for
Bridge Evaluation, Second Edition, American Association of State Highway and Transportation Officials
(AASHTO), Washington, DC.
American Association of State Highway and Transportation Officials (AASHTO 2011a) A Policy on
Geometric Design of Highways and Streets, Sixth Edition, American Association of State Highway and
Transportation Officials (AASHTO), Washington, DC.
American Association of State Highway and Transportation Officials (AASHTO 2011b) AASHTO Road
Design Guide, Fourth Edition, American Association of State Highway and Transportation Officials
(AASHTO), Washington, DC.
American Association of State Highway and Transportation Officials (AASHTO 2011c) AASHTO
Transportation Asset Management Guide: A Focus on Implementation, First Edition, American
Association of State Highway and Transportation Officials, Washington, DC.
American Association of State Highway and Transportation Officials (AASHTO 2012) AASHTO LRFD
Bridge Design Specifications, Sixth Edition, American Association of State Highway and Transportation
Officials (AASHTO), Washington, DC.
American Association of State Highway and Transportation Officials (AASHTO 2013) AASHTO
Transportation Asset Management Guide: A Focus on Implementation, FHWA-HIF-10-023, American
Association of State Highway and Transportation Officials (AASHTO) and Transportation Research
Board (TRB), Washington, DC.
American Concrete Institute (ACI 2014) ACI 357.3R-14: Guide for Design and Construction of
Waterfront and Coastal Concrete Marine Structures, American Concrete Institute (ACI), Farmington
Hills, MI.

Community Resilience Planning Guide for Buildings and Infrastructure Systems - Volume II
Transportation Systems
123
American Lifelines Alliance (ALA 2005) Draft Guideline for Assessing the Performance of Oil and
Natural Gas Pipeline Systems in Natural Hazard and Human Threat Events, American Lifelines
Alliance(ALA), Washington, DC,
http://www.americanlifelinesalliance.com/pdf/PipeguideFinalPosted061705.pdf.
American Railway Engineering and Maintenance-of-Way Association (AREMA 2015a) Manual for
Railway Engineering, American Railway Engineering and Maintenance-of-Way Association AREMA),
Lanham, MD.
American Railway Engineering and Maintenance-of-Way Association (AREMA 2015b) Bridge
Inspection Handbook, American Railway Engineering and Maintenance-of-Way Association AREMA),
Lanham, MD.
American Society of Civil Engineers (ASCE 2013) 2013 Report Card for America's Infrastructure,
American Society of Civil Engineers (ASCE), Reston, VA, http://www.infrastructurereportcard.org/.
American Society of Civil Engineers (ASCE 2014a) ASCE 61-14: Seismic Design Standards for Piers
and Wharves, Standards Committee on Seismic Design of Piers and Wharves of the Coasts, Oceans,
Ports, and Rivers Institute, American Society of Civil Engineers (ASCE), Reston, VA.
American Society of Civil Engineers (ASCE 2014b) ASCE Policy Statement 525: Model Building Codes,
American Society of Civil Engineers (ASCE), http://www.asce.org/issues-and-advocacy/public-
policy/policy-statement-525---model-building-codes/. Viewed: April 18, 2015.
American Society of Civil Engineers (ASCE 2014c) ASCE 24: Flood Resistant Design and Construction,
American Society of Civil Engineers (ASCE) Structural Engineering Institute (SEI), Reston, VA.
American Society of Civil Engineers (ASCE 2015) Public Policy Statements, American Society of Civil
Engineers (ASCE), http://www.asce.org/public_policy_statements/. Viewed April 24, 2015.
Association of Oil Pipe Lines (AOPL 2014) U.S. Liquids Pipeline Usage & Mileage Report, Association
of Oil Pipe Lines (AOPL) and American Petroleum Institute (API), Washington, DC.
Ballantyne, D. (2008) The ShakeOut Scenario, Supplemental Study: Oil and Gas Pipelines, USGS
Circular 1324; California Geological Survey Special Report 207, version 1.0,
http://www.colorado.edu/hazards/shakeout/pipelines.pdf. Viewed October 1, 2014.
British Standards Institute (BSI 2013) Maritime works: Part 1-4: General – Code of practice for
materials, BS 6349-1-4:2013, British Standards Institute (BSI), February 28.
Cities21 (2015), Cities21, http://www.cities21.org/cms/. Viewed July 22, 2015.
DeBlasio, A.J.; T.J. Regan; M.E. Zirker; K. Lovejoy; and K. Fichter (2004) ―Learning from the 2003
Blackout,‖ Public Roads, United States Department of Transportation (DOT) Federal Highway
Administration (FHA), https://www.fhwa.dot.gov/publications/publicroads/04sep/04.cfm Viewed
October 14, 2014.
Det Norske Veritas (DNV 2007) Pipeline Damage Assessment from Hurricane Katrina and Rita in the
Gulf of Mexico, Report No. 448 14182, Revision No. 1, Prepared for the Minerals Management Service,
January 22.
Dolak, Kevin (2011) ―Irene: Flooding Cuts off Towns in Vermont, New York,‖ ABC News, August 29,
http://abcnews.go.com/US/hurricanes/hurricane-irene-flooding-cuts-off-towns-vermont-
york/story?id=14402696. Viewed October 24, 2015.
Douglas, Scott L.; Bret M. Webb; and Roger Kilgore (FHWA 2014) Highways in the Coastal
Environment: Assessing Extreme Events, Hydraulic Engineering Circular No. 25 – Volume 2, FHWA-
NHI-14-006, Office of Bridge Technology, Federal Highway Administration (FHWA), October,
http://www.fhwa.dot.gov/engineering/hydraulics/pubs/nhi14006/nhi14006.pdf.
Community Resilience Planning Guide for Buildings and Infrastructure Systems - Volume II
Transportation Systems
124
Duwadi, Sheila Rimal (2010) Hazard Mitigation R&D Series: Article 1: Taking a Key Role in Reducing
Disaster Risks, FHWA-HRT-10-004, United States Department of Transportation (DOT)/Federal
Highway Administration (FHWA), Vol. 73 No. 6, May/June,
https://www.fhwa.dot.gov/publications/publicroads/10mayjun/04.cfm. Viewed October 16, 2014.
Elliott, Debbie (2013) ―Drought Causes Ripple Effect Along Mighty Mississippi River,‖ All Things
Considered, National Public Radio (NPR), http://www.npr.org/2013/01/30/170286658/drought-causes-
ripple-effect-along-mighty-mississippi-river.
Englot, J. (2011) Case Study of Bridge and Tunnel TVAs: Since the Blue Ribbon Panel Recommendations
for Bridge and Tunnel Security Were Issued, American Society of Civil Engineers (ASCE), Reston, VA.
Englot, J. and P. Bakas (2002) ―Performance/Design Criteria for the Airtrain JFK Guideway,‖
Proceedings AREMA 2002 Annual Conference & Exposition, Washington, DC, September 22 – 25.
Environmental Protection Agency (EPA 2008) Environmental Review Guide for Special Appropriation
Grants, EPA Publication No: 315-K-08-001, Environmental Protection Agency (EPA), Washington, DC.
Farokhi, K. et al. (2015) Value of Travel Time Reliability in Transportation Decision Making: Proof of
Concept—Maryland, SHRP 2 Report S2-L35B-RW-1, Strategic Highway Research Program (SHRP).
Federal Aviation Administration (FAA 2007) ―Hazardous Wildlife Attractants on or Near Airports,‖ FAA
Advisory Circular, AC 150/5200-33B, Federal Aviation Administration (FAA), Washington, DC.
Federal Aviation Administration (FAA 2009) ―Airport Emergency Plan‖ (Consolidated AC includes
Change 2), FAA Advisory Circular, AC 150/5200-31C, Federal Aviation Administration (FAA),
Washington, DC.
Federal Aviation Administration (FAA 2010) ―Guidelines and Procedures for Maintenance of Airport
Payments,‖ FAA Advisory Circular, AC 150/5380-6C, Federal Aviation Administration, Washington,
DC.
Federal Aviation Administration (FAA 2011) ―Development of State Standards and Nonprimary
Airports,‖ FAA Advisory Circular, AC 150/5100-13B, Federal Aviation Administration (FAA),
Washington, DC.
Federal Aviation Administration (FAA 2014 b) ―Maintenance of Airport Visual Aid Facilities.‖ FAA
Advisory Circular, AC 150/5340-26C, Federal Aviation Administration (FAA), Washington, DC.
Federal Aviation Administration (FAA 2014a) ―Airport Pavement Management Program (PMP),‖ FAA
Advisory Circular, AC 150/5380-7B, Federal Aviation Administration (FAA), Washington, DC.
Federal Emergency Management Agency (FEMA 2013) Mitigation Assessment Team Report Hurricane
Sandy in New Jersey and New York Building Performance Observations, Recommendations, and
Technical Guidance, Federal Emergency Management Agency (FEMA), Washington, DC.
Federal Emergency Management Agency (FEMA 2014a) ―Damaged Roads from Hurricane Irene,‖
FEMA, last updated March 19, 2014, https://www.fema.gov/media-library/assets/images/61278. Viewed
October 24, 2015.
Federal Emergency Management Agency (FEMA 2014b) ―Photograph by Andrea Booher taken on 07/09/1993 in
Missouri,‖ FEMA, last updated March 19, 2014, https://www.fema.gov/media-library/assets/images/38000. Viewed
October 24, 2015.
Federal Emergency Management Agency (FEMA 2014c) ―Photograph by Marvin Nauman taken on
09/27/2005 in Louisiana,‖ FEMA, last updated March 19, 2014, https://www.fema.gov/media-
library/assets/images/46394. Viewed October 24, 2015.

Community Resilience Planning Guide for Buildings and Infrastructure Systems - Volume II
Transportation Systems
125
Federal Emergency Management Agency (FEMA 2014d) ―Photograph by Win Henderson taken on
09/20/2005,‖ FEMA, last updated March 19, 2014, https://www.fema.gov/media-
library/assets/images/46243. Viewed October 24, 2015.
Federal Emergency Management Agency (FEMA 2014e) ―Photograph by Win Henderson taken on
09/20/2005 in Louisiana,‖ FEMA, last updated March 19, 2014, https://www.fema.gov/media-
library/assets/images/46290. Viewed October 24, 2015.
Federal Highway Administration (FHWA 2008) Highways in the Coastal Environment, Second Edition,
Federal Highway Administration (FHWA), Washington, DC, June.
Federal Highway Administration (FHWA 2011) Expanded FHWA Hydraulics Laboratory to Conduct
Major New Bridge Scour Studies, Federal Highway Administration (FHWA), Washington, DC,
http://www.fhwa.dot.gov/publications/focus/11aug/11aug02.cfm. Viewed April 24, 2015.
Federal Highway Administration (FHWA 2015a) Aerodynamic Design of Highway Structures Federal
Highway Administration (FHWA), Washington, DC,
http://www.fhwa.dot.gov/publications/publicroads/96winter/p96wi46.cfm. FHWA.
Federal Highway Administration (FHWA 2015b) MAP-21: Moving Ahead for Progress in the 21st
Century. http://www.fhwa.dot.gov/map21/. Viewed April 23, 2015. FHWA, Washington, DC.
Federal Transit Administration (FTA 2013) Transit Climate Change Adaption Assessment/Asset
Management Pilot for the Metropolitan Atlanta Rapid Transit Authority. FTA, Washington, DC.
Field, C. B., Barros V., Stocker T. F., Qin D., Dokken D. J., Ebi K. L., Mastrandrea M. D., Mach K. J.,
Plattner G. -K., Allen S. K., Tignor M. and Midgley, P. M. (2012) Managing The Risks of Extreme Events
and Disasters to Advance Climate Change Adaptation: A Special Report of Working Groups I and II of
the Intergonvernmental Panel on Climate Change, Cambridge University Press, New York.
Frosch, Dan and Timothy Williams (2013). ―Colorado Towns are Left Stranded in Deadly Floods,‖ The
New York Times, September 12, http://www.nytimes.com/2013/09/13/us/colorado-towns-are-left-
stranded-in-deadly-floods.html?_r=0. Viewed October 14, 2015.
International Navigation Association (2002b), Seismic Design Guidelines for Port Structures, CRC Press,
Brussels.
International Navigation Association (2002a) Guidelines for The Design of Fender Systems: 2002, Report
of Working Group 33 of the Maritime Navigation Commission, PIANC.
ITS International (ITS 2012) Success of Kuala Lumpur's dual purpose tunnel, ITS International, 2012.
Johnson, Karl (2012) Abutments, MnDOT Bridge Office LRFD Workshop.
Kentucky Public Service Commission (2009) Ike and Ice: The Kentucky Public Service Commission
Report on the September 2008 Wind Storm and the January 2009 Ice Storm, November 19,
https://psc.ky.gov/IkeIce/Report.pdf.
Kruse, C. J.; A. Protopapas, L.E. Olson; and D.H. Bierling (2007) A Modal Comparison of Domestic
Freight Transportation Effects on the General Public, Prepared by Center for Ports and Waterways,
Texas Transportation Institute for United States Department of Transportation Maritime Administration
(MARAD) and National Waterways Foundation, December,
http://www.marad.dot.gov/documents/Phase_II_Report_Final_121907.pdf.
Lazo, L. (2013) ―Upgrading D.C.‘s Virginia Avenue tunnel is key to growing East Coast rail freight,
officials say,‖ The Washington Post, p. 1, 16 Februrary.

Community Resilience Planning Guide for Buildings and Infrastructure Systems - Volume II
Transportation Systems
126
Mardorf, Christopher (2014) Federal Emergency Management Agency (FEMA) August 30,. Napa, CA,
http://www.fema.gov/media-library-data/1409613757983-
e7cfcdc60d36a0bc2aabef089f34d080/Napa_CA_Earthquake_V0A6397.jpg. Viewed October 1, 2014.
Meng Q. and Qu, X. (2010) Quantitative Risk Assessment Model for Fire in Road Tunnels, University of
Singapore, Singapore, 2010.
Meyer, M., Flood, M., Keller, J., Lennon , J., McVoy, G., Dorney, C., Leonard, K., Hyman R. and Smith,
J. (2014) ―Climate Change, Extreme Weather Events, and the Highway System: A Practitioner's Guide
and Research Report,‖ Strategic Issues Facing Transportation, Volume 2 NCHRP Report 750,
Transportation Research Board (TRB), Washington, DC.
Monroe County Climate Change Advisory Committee (2013) Monroe County Climate Action Plan,
Monroe County, FL, March.
Moritz, H., White, K., Langlois, H., Simm, J., Schrader, M., Engle, J., Smith, T., Harper, B., and Gill, S.
(2012) Procedures to Evaluate Sea Level Change; Impacts; Responses and Adaption: U.S. Army Corps of
Engineers‘ Approach, prepared by HR Wallingford Lts. Oxon, UK, January.
National Association of Pipeline Safety Representatives (NAPSR 2013) Compendium of State Pipeline
Safety Requirements & Initiatives Providing Increased Public Safety Levels Compared to Code of
Federal Regulations, Second Edition. Washington, DC.
National Institute of Building Sciences (NIBS 2015) ―Unified Facilities Criteria (UFC),‖ WBDG: Whole
Building Design Guide, National Institute of Building Sciences (NIBS), Washington, DC,
https://www.wbdg.org/ccb/browse_cat.php?c=4.
National Oceanic and Atmospheric Administration (NOAA 2014) Coastal Services Center (NOAA 2014)
Port Tomorrow: Resilience Planning Tool. NOAA, 2014, http://coast.noaa.gov/digitalcoast/tools/port.
Viewed 15 June 2014.
New York City Department of Transportation (NYC DOT 2015) Ferries & Buses: Staten Island Ferry,‖
NYC Resources, The City of New York, http://www.nyc.gov/html/dot/html/ferrybus/staten-island-
ferry.shtml.
New York City Panel on Climate Change. (NPCC 2010) Climate Change Adaptation in New York City:
Building a Risk Management Response, C. Rosenzweig and W. Solecki, eds, Prepared for use by the New
York City Climate Change Adaptation Task Force, Annals of the New York Academy of Science, New
York, NY.
Pipelines and Hazardous Materials Safety Administration (PHMSA 2013) Pipelines and Hazard
Mitigation for Emergency Managers, Draft, February 8, Pipelines and Hazardous Materials Safety
Administration (PHMSA), Washington, DC.
PWC (2013) Rebuilding for resilience: Fortifying insfrastructure to withstand disaster, September.
RITA (2009) (USDOT Bureau of Transportation Statistics),
http://www.rita.dot.gov/bts/sites/rita.dot.gov.bts/files/subject_areas/ncfo/highlights.
Roll, Liz (2012), FEMA, November 1, 2012. Long Beach Island, NJ. http://www.fema.gov/media-
library/assets/images/65917. Viewed October 1, 2014.
Rosenzweig, C.; A. DeGaetano; W. Solecki; R. Horton; M. O‘Grady; and D. Bader (2011) Climate
Adaption Guidebook for New York State, State of New York. Albany, NY.
Savonis, Mike (2009) ―Association of State and Territorial Soid Waste Management Officials,‖ The Guld
Coast Study, April 16, http://www.astswmo.org/Files/Meetings/2009/2009MidYearMtg/SAVONIS-
2009mym.pdf. Viewed April 24, 2015. FHWA
Community Resilience Planning Guide for Buildings and Infrastructure Systems - Volume II
Transportation Systems
127
Sustainable Cities International (SCI 2010) Sustainable Cities: Our Cities are Our Future, Sustainable
Cities International (SCI) http://sustainablecities.net/. Viewed July 22, 2015.
The City of New York (2013) A Stronger, More Resilient New York, The City of New York, New York.
The International Organization for Standardization (ISO 2009) ISO 31000:2009, Risk Management –
Principles and Guidelines, The International Organization for Standardization (ISO) Geneva,
Switzerland.
The Port Authority of NY & NJ (PANYNJ 2011) Sustainable Infrastructure Guidelines Sustainable
Infrastructure Guidelines, The Port Authority of NY & NJ (PANYNJ),
https://www.panynj.gov/about/pdf/Sustainable-infrastructure-guidelines.pdf.
The World Bank (2012) Building Urban Resilience: Principles, Tools and Practice, The World Bank,
Washington, DC, 2012.
Transportation Research Board (TRB 2014) Critical Issues in Aviation and the Environment,
Transportation Research Board (TRB), Washington, DC, 2014.
Transportation Research Board (TRB 2015a) Critical Transportation Infrastructure Protection (ABR10),
Transportation Research Board (TRB), Washington, DC, http://www.trb.org/ABE40/ABE40.aspx.
Viewed Apirl 24, 2015.
Transportation Research Board (TRB 2015b) Special Task Force on Climate Change and Energy,
Transportation Research Board (TRB), Washington, DC, http://www.trb.org/A0020T/A0020T.aspx.
Viewed April 24, 2015.
United States Army Corps of Engineers (USACE 2002) Coastal Engineering Manual, Engineer Manual
1110-2-1100, United States Army Corps of Engineers (USACE), Washington, DC.
United States Army Corps of Engineers (USACE 2015) Flood Risk Management Program, United States
Army Cops of Engineers (USACE), Alexandria, VA,
http://www.iwr.usace.army.mil/Contact/ContactUs.aspx. Viewed October 27, 2015.
United States Department of Homeland Security (DHS 2013) 35,000 Gallons of Prevention: Containing a
Tunnel Flood with an Inflatable Stopper, United States Department of Homeland Security (DHS),
http://www.dhs.gov/science-and-technology/35000-gallons-prevention.
United States Department of Transportation (DOT 2012) Climate Adaption Plan: Ensuring
Transportation Infrastructure and System Resilience,
https://www.transportation.gov/sites/dot.dev/files/docs/DOT%20Adaptation%20Plan.pdf.
United States Department of Transportation (DOT 2014) ―Facts & Stats,‖ Pipeline Safety Awareness,
United States Department of Transportation (DOT)/Pipeline & Hazardous Materials Safety
Administration, https://opsweb.phmsa.dot.gov/pipelineforum/facts-and-stats/pipeline-101/. Viewed
October 1, 2014.
United States Energy Information Administration (EIA 2012) New York/New Jersey Intra Harbor
Petroleum Supplies Following Hurricane Sandy: Summary of Impacts Through November 13, 2012,
United States Department of Energy (DOE), Washington, DC,
http://www.eia.gov/special/disruptions/hurricane/sandy/pdf/petroleum_terminal_survey.pdf. Viewed
October 1, 2014.
United States Federal Energy Regulatory Commission (FERC 2004) Presentation to the Association of
Oil Pipe Lines, April, Washington, D.C., http://www.ferc.gov/industries/oil/gen-info.asp. Viewed
October 1, 2014.

Community Resilience Planning Guide for Buildings and Infrastructure Systems - Volume II
Transportation Systems
128
United States Federal Transit Administration (USFTA 2013) 2013 Status Report of the Nation‘s
Highways, Bridges, and Transit: Conditions and Performance, Report to Congress by the United States
Department of Transportation (DOT), Federal Highway Admnistration (FHWA), and Federal Transit
Administration, https://www.fhwa.dot.gov/policy/2013cpr/pdfs/cp2013.pdf.
United States Maritime Administration (MARAD 2015) Inland Waterways Gateway (St. Louis), United
States Department of Transportation (DOT), United States Maritime Administration (MARAD),
http://www.marad.dot.gov/about-us/gateway-offices/inland-waterways-gateway/.
URS Corporation (URS 2012) Port of Houston Authority Bayport Climate Change Study, URS and
AECOM, http://www.urs.com/projects/port-of-houston-authority-greenhouse-gas-and-climate-change/.
Wakeman, T. H. (2013) Final Report: Lessons from Hurricane Sandy for Port Resilience, The City
College of New York, New York.
World Association for Waterborne Transport Infrastructure (PIANC 2012) PIANC USA, World
Association for Waterborne Transport Infrastructure (PIANC), Alexandria, VA, http://www.pianc.us/.
Viewed on October 28, 2015.

Community Resilience Planning Guide for Buildings and Infrastructure Systems - Volume II
Energy Systems
129
14. Energy Systems
Energy Systems Executive Summary
This chapter discusses electric power systems, natural gas and liquid fuels systems as they relate to
electric power, and emergency and standby power systems. Pipelines that transport natural gas and liquid
fuels are discussed as part of the Transportation System (Chapter 13) because the engineering standards
for pipeline safety and design are administered by the U.S. DOT.
The energy performance expectations and needs of society have increased dramatically over the past 35
years. However, the aging U.S. infrastructure is a major issue for all communities. Electrical grid and
pipeline distribution systems have evolved considerably since they were first constructed in the late
1800s. The energy system continues to be upgraded to improve the existing electric power and fuel
pipeline infrastructure systems, with focused efforts on energy efficiency, reliability, and reduced
vulnerability to hazard events. However, permitting issues for new construction, weather events, and
limited maintenance have contributed to power interruptions and failures. Demands for energy are
expected to increase in the near future as the population increases.
The reliance of communities on energy systems leads to public expectations of readily available and
reliable services. The electric utility and liquid fuel industries are highly regulated to ensure energy
availability with the goals of low consumer costs, safe delivery and use, and reliable service. Regulations,
codes, and standards can help improve the performance of new and existing energy systems during storms
and hazard events. Moving forward, the new challenge is to balance the goals of low pricing and safe
delivery with energy systems that are both reliable and resilient.
To build resilient and flexible energy systems there needs to be understanding by all stakeholders of the
options and constraints that need to be balanced to achieve the desired level of community resilience, the
expected benefits resilience may bring, and the estimated costs associated with improving and replacing
the energy infrastructure.
Achieving resilient energy systems within a community will not happen overnight. As part of the broader
six-step planning process for resilience, community leaders, energy system representatives, and other
stakeholders need to discuss what performance levels are desired, the current condition of the existing
infrastructure systems, and what gaps exist between the desired performance and the anticipated
performance of the various electric power and fuel systems.
Working together to achieve resilience, each stakeholder group within the community (consumers,
regulators, providers, and others) can identify meaningful solutions to address the resilience gaps. This
Guide is focused on how the buildings and infrastructure systems support social needs and institutions
within the community. This chapter is focused on improving the performance and hazard resistance of
energy infrastructure systems while not adversely affecting service reliability and costs.
Energy facilities and infrastructure systems for generation, transmission, and distribution functions can be
sited, designed, and constructed to provide improved performance during hazard events. However, many
of the codes and standards first used to ensure the safety and reliability of the infrastructure systems did
not consider hazards, as modern codes and standards do now, leaving the physical infrastructure with
some vulnerabilities. Codes and standards are being updated to address hazard events and are expected to
also significantly improve resilience.
A community that is successful in improving its resilience will likely do so through a combination of
changes to the built environment as well as through adoption and implementation of regulatory, planning,
and maintenance programs that are developed with buy in from all stakeholders.

Community Resilience Planning Guide for Buildings and Infrastructure Systems - Volume II
Energy Systems
130
14.1. Introduction
Societal expectations and needs for electric power and fuels has increased dramatically over the past 35
years. In fact, the U.S. Energy Information Administration (EIA) found that the total demand for
residential electricity has increased by approximately 57 % since 1980 [EIA 2015]. However, as demand
has increased, the condition of the energy infrastructure systems has become an issue for all communities.
The electric power system includes power generation, transmission, and distribution facilities, some of
which date back to the early 1800s. This system of generating plants, power lines, and substations is a
mix of new and older systems and technologies that needs to operate cohesively. There are thousands of
plants and systems across the U.S. and almost 400,000 miles of electric transmission lines. With the
addition of new gas-fired and renewable generation, the need to add new transmission lines has become
even greater [ASCE 2013].
Many transmission and distribution system outages have been attributed to system operations failures,
although weather-related events have been the main cause of major electrical outages in the United States
from 2007 to 2012. Reliability issues are also emerging as new energy sources replace older infrastructure
[ASCE 2013].
The fuel industry includes oil and gas wells, processing plants (e.g., refineries), and pipeline systems.
There are nominally 150,000 miles of crude oil and product pipelines and over 1,500,000 miles of natural
gas transmission and distribution pipelines in the United States. Fuel infrastructure systems are primarily
owned by private industry. Since 2008, a series of oil and gas pipeline failures led to new federal safety
requirements in 2011 to address the increase in the number of incidents due to aging infrastructure and
maintenance concerns [ASCE 2013].
Energy capacity is forecast to be a potential problem after 2020, particularly power generation capacity.
The adequacy of energy pipelines and related operations is also a growing concern, partially due to
capacity constraints in refineries and oil and gas transmission systems [ASCE 2013].
Electricity and fuel are essential, and cross-cutting services for community resilience. They support
society‘s most basic human needs for food, water, and shelter. In a hazard event, electricity and fuel
supply are critical to supporting human life and restoration of services. Having available fuel is essential
for local generators in managing recovery and for emergency service and supply vehicles.
The energy industry is making progress in upgrading the existing electric infrastructure with focused
efforts on energy efficiency and reliability, and to reduce system vulnerability to hazard events. Grid
modernization is a major effort nationwide that is projected to continue for years to come. For example,
many utility providers are installing smart grid technologies.
This chapter discusses electric power systems, natural gas and liquid fuels systems as they relate to
electric power, and emergency and standby power systems. Pipelines that transport natural gas and liquid
fuels are discussed as part of the transportation system (Chapter 13) because the engineering standards for
pipeline safety and design are administered by the U.S. DOT.
14.1.1. Social Needs and System Performance Goals
Reliable, inexpensive power has become a basic societal necessity. Even in day-to-day power delivery,
utilities may struggle to meet consumer expectations. Preparing for and responding to hazard events can
be challenging when utilities are repairing infrastructure while experiencing revenue losses when electric
power delivery is suspended. Regulatory authorities consider such issues when addressing utility rate
recovery cases and setting public expectations for post-event recovery timelines and quality of service.
As communities address issues related to energy system performance and improving grid resilience, it is
important that they prioritize and balance end user needs, public safety, and restoration requirements

Community Resilience Planning Guide for Buildings and Infrastructure Systems - Volume II
Energy Systems
131
relative to community resilience goals. Designers and operators of energy systems need to adapt to ever-
changing technologies and applications, as well as minimize vulnerabilities in the system and incorporate
the ability to rapidly restore the system after hazard events. Communities and utility operators should
consider options that protect, maintain, and recover the system while controlling costs.
When events occur and recovery efforts are required, emergency-related societal needs are addressed
first, and other priorities are addressed through a tiered response. Although details of recovery planning
can be complex, the general sequence of recovery is often organized as critical facilities and services,
emergency housing, housing and neighborhoods, and community. Section 14.3 discusses performance
goals for energy infrastructure systems based on these restoration stages. Recovery levels for new and
existing infrastructure are discussed in Section 14.5.1.2.
14.1.2. Reliability, Resilience, and Energy Assurance
Reliability and resilience are related but distinct concepts with different performance goals and metrics. In
many cases, projects and investments that improve day-to-day reliability contribute to resilience.
In August 2013, the President‘s Council of Economic Advisers released a study on the benefits of
investing in grid resilience. The study [Executive Office of the President 2013] explained the difference
between resilience and reliability as:
―A more resilient grid is one that is better able to sustain and recover from adverse
events like severe weather – a more reliable grid is one with fewer and shorter power
interruptions.‖
In September 2012, Maryland‘s Grid Resiliency Task Force [Office of Governor Martin O‘Malley 2012]
adopted similar definitions for resilience and reliability.
―[R]eliability refers to the ability of the bulk power and distribution systems to deliver
electricity to customers during normal ‗blue sky‘ operations…Resiliency refers to the
ability of the distribution system to absorb stresses without experiencing a sustained
outage.‖
The electric power industry is beginning to address resilience and the recovery of service after hazard
events in addition to reliability of service during normal operations. The Public Service Enterprise Group
[PSEG 2014] in New Jersey states in its Energy Strong Program that:
―Reliability remains fundamental but is no longer enough now that extreme storms have
become increasingly common and people are more dependent on electricity than ever
before.‖
An analysis of the stakeholder input gathered at the California Local Energy Assurance Planning
[CaLEAP 2015] workshops concluded that a resilient energy system would include the followings goals
and steps:
Includes planned, modeled, and prepared infrastructure; ready for immediate and reliable
deployment; robust (hardened) where appropriate
Supports emergency response, life safety, restoration effectiveness, and socio-economic
continuity during a major event
Recovers rapidly after hazard events
Incorporates redundancy and spare capacity
Supports a diversity of energy sources

Community Resilience Planning Guide for Buildings and Infrastructure Systems - Volume II
Energy Systems
132
Includes modular or loosely-coupled architecture
Is aware and responsive to electrical and environmental conditions
Is actively monitored and maintained
Operates efficiently in non-emergency conditions
Provides economic and societal benefits to the communities and stakeholders served
In addition to reliability and resilience, the energy industry has
developed energy assurance concepts, which also align with resilience
concepts. A report (Figure 14-1) by the National Association of State
Energy Officials, the State Energy Assurance Guideline [NASEO
2009], refers to the ―4 Rs‖ of resilient qualities for infrastructure
systems:
Robustness – the inherent strength or resistance in a system to
withstand external demands without degradation or loss of
functionality
Redundancy – system properties that allow for alternate
options, choices, and substitutions when the system is under
stress
Resourcefulness – the capacity to mobilize needed resources
and services in emergencies
Rapidity – the speed with which disruption can be overcome
and safety, services, and financial stability restored
A resilience strategy may address each of these qualities to achieve the desired performance of an energy
system. In addition, resilience of an energy system may be evaluated according to physical,
organizational, social, and economic systems, where:
Physical – the ability of physical systems (including all interconnected components) to perform
to acceptable/desired levels when subject to hazard events
Organizational – the capacity of organizations - especially those managing critical facilities and
hazard event-related functions - to make decisions and take actions that contribute to resilience
Social – consisting of measures specifically designed to support social institutions and lessen the
extent to which communities and governmental jurisdictions suffer negative consequences due to
loss of critical services due to a hazard event
Economic – the capacity to reduce both direct and indirect economic losses resulting from a
hazard event
Reliability of energy systems refers to providing uninterrupted service during normal operations and is a
core goal of electric power operators. As energy systems have become essential to daily life, resilient
energy systems that can recovery rapidly from hazard events are also needed.
14.1.3. Dependencies
In general, buildings and infrastructure systems depend on electric power to conduct business and provide
their services. For example, although a hospital or emergency operations center may not be physically
damaged by a hurricane, flood, or earthquake, loss of power largely equates to loss of services.
Figure 14-1: NASEO [2009]
Energy Assurance
Guidelines

Community Resilience Planning Guide for Buildings and Infrastructure Systems - Volume II
Energy Systems
133
Emergency power may be used to support critical services until commercial power is restored if fuel is
available for standby systems.
Energy systems depend on other systems as well. Some examples are:
Operation and control centers of utilities rely on communication and information systems to send
and receive operational information to the generation, transmission, and distribution components
of the grid. Operational control needs to be maintained or the performance of the grid will be
affected.
Liquid fuels rely on the transportation system to distribute liquid and natural gas by truck and rail.
Disruptions to the transportation system can affect the supply chain and resilience of the energy
system (see 13.2.5 Pipelines for additional information).
The ability to restore infrastructure in the electric power system can be seriously hampered if
plant facilities or roads are damaged, and staff cannot perform response and recovery activities.
14.2. Energy Infrastructure
Energy infrastructure systems nationwide are designed for reliable service. While they are designed to
meet National Electric Safety Codes [IEEE 2012] requirements (and often beyond the minimum criteria),
the level or magnitude of hazard events that these systems can withstand without damage is not clearly
defined. Over the years, improvements in technology have addressed some vulnerabilities or risks in the
system, but may also have inadvertently introduced some new ones.
The electric power industry has primarily focused on energy assurance goals and reliability of service for
normal operations. The energy infrastructure continues to be improved, with some improvement
following hazard events.
As communities and energy providers begin to address resilience, guidelines are needed for design of
energy systems – generation, transmission and distribution - and understanding of improvements needed
to meet desired performance goals. Some questions to consider when evaluating existing systems might
include:
Why did previous failures occur?
Were the design criteria adequate for the hazard event?
Was the extent and impact of the failures disproportionate to the magnitude of the event that
occurred?
If so, was the failure or impact due to the design and construction or a poor operational response?
Can other technologies or approaches be used to improve performance and recovery?
This section describes the electric power system and its generation, transmission, and distribution systems
and emerging technologies in these systems. Liquid fuel systems and natural gas systems, with a focus on
how they are used to support electric power systems, are presented. The use of emergency and standby
power systems for recovery of services after hazard events are also discussed.
14.2.1. Electric Power
The electric power system produces and delivers electricity through a grid connection to customers.
Electric power can be generated by central power stations or by distributed generation. Once generated,
power is delivered to customers through transmission and distribution systems. The electric power system
is illustrated in Figure 14-2 [NIST 2014].
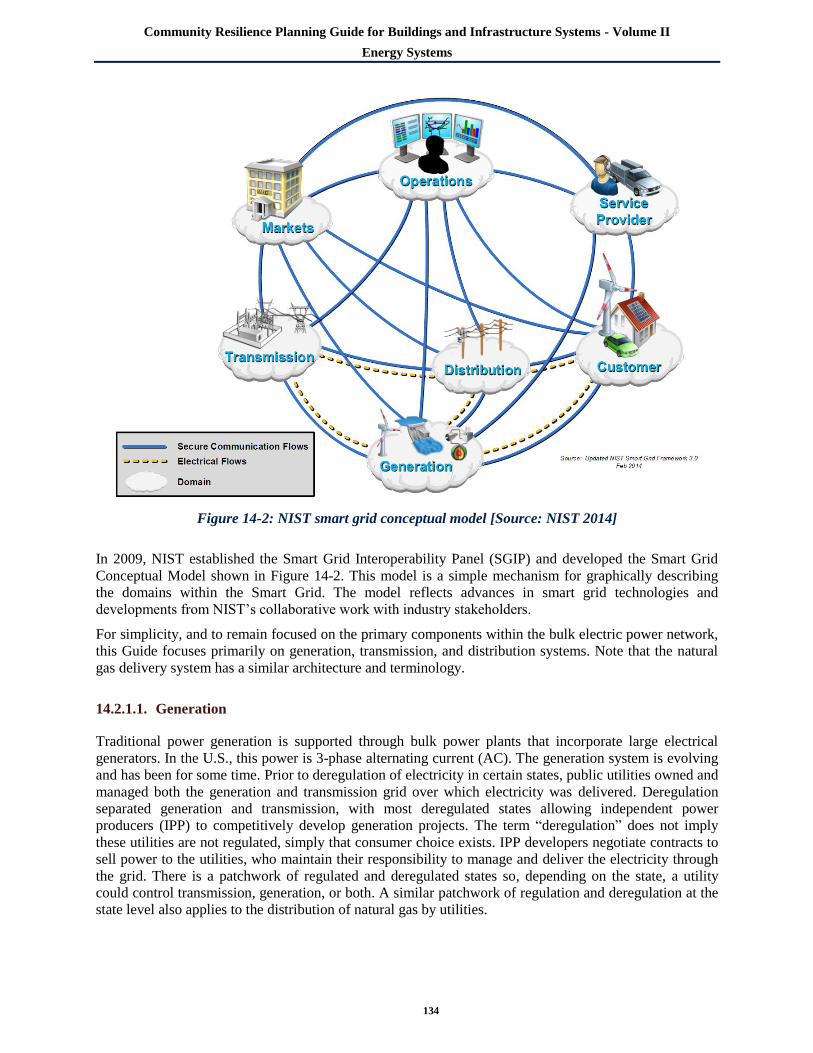
Community Resilience Planning Guide for Buildings and Infrastructure Systems - Volume II
Energy Systems
134
Figure 14-2: NIST smart grid conceptual model [Source: NIST 2014]
In 2009, NIST established the Smart Grid Interoperability Panel (SGIP) and developed the Smart Grid
Conceptual Model shown in Figure 14-2. This model is a simple mechanism for graphically describing
the domains within the Smart Grid. The model reflects advances in smart grid technologies and
developments from NIST‘s collaborative work with industry stakeholders.
For simplicity, and to remain focused on the primary components within the bulk electric power network,
this Guide focuses primarily on generation, transmission, and distribution systems. Note that the natural
gas delivery system has a similar architecture and terminology.
14.2.1.1. Generation
Traditional power generation is supported through bulk power plants that incorporate large electrical
generators. In the U.S., this power is 3-phase alternating current (AC). The generation system is evolving
and has been for some time. Prior to deregulation of electricity in certain states, public utilities owned and
managed both the generation and transmission grid over which electricity was delivered. Deregulation
separated generation and transmission, with most deregulated states allowing independent power
producers (IPP) to competitively develop generation projects. The term ―deregulation‖ does not imply
these utilities are not regulated, simply that consumer choice exists. IPP developers negotiate contracts to
sell power to the utilities, who maintain their responsibility to manage and deliver the electricity through
the grid. There is a patchwork of regulated and deregulated states so, depending on the state, a utility
could control transmission, generation, or both. A similar patchwork of regulation and deregulation at the
state level also applies to the distribution of natural gas by utilities.

Community Resilience Planning Guide for Buildings and Infrastructure Systems - Volume II
Energy Systems
135
Renewable power projects, distributed generation by commercial entities, and demand-side management
(such as demand response, energy efficiency, and energy storage) are alternate methods available to the
traditional energy systems. The term ―generation‖ increasingly includes virtual generation, resulting from
load-reduction to offset power demand or the use of energy storage rather than developing new generation
capacity. Additionally, alternate methods are evolving behind the meter at homes and businesses, such as
rooftop solar panels and smart meters.
Renewable power comes in many forms – wind, solar, biomass, hydropower. In some states energy-from-
waste plants also meets the definition of renewable power. Renewable power has rules that vary from
state to state in the same way the Renewable Portfolio Standards (RPS), with goals for the percentage of
power to be generated from renewables, vary by state.
―Distributed generation‖ is an umbrella term typically describing power plants developed for a specific
company or industrial location, also known as ―in-the-fence‖ power, that serve the needs of a particular
commercial plant, manufacturing facility or industrial park. These plants must be developed in
accordance with requirements for their particular state, but are typically single or small group load-
serving entities. An example might be an industrial facility that builds its own on-site power plant to serve
its electric power needs. Often these generating plants are also cogeneration facilities, providing steam for
heat or another industrial process use. Many of these smaller facilities are also referred to as ―Combined-
Heat and Power‖ or CHP plants.
In regulated states, Demand Side Management (DSM) is defined by the Energy Information
Administration as ―the planning, implementation, and monitoring of utility activities designed to
encourage consumers to modify patterns of electricity usage, including the timing and level of electricity
demand.‖ Thus, DSM includes both energy efficiency (EE) and demand response (DR) to reduce electric
power demand.
Energy efficiency at the utility level is a method or program by which the utility manages or reduces the
demand for power. Otherwise, a utility may need to build or contract for new generation plants or
purchase additional power on the spot market, which can be expensive. These programs can be state-wide
improvements to public buildings (efficient light bulbs, improved insulation, etc.) or can entail energy
efficiency programs for residential users, which may include advanced meters and thermostats.
Demand Response (DR) is sometimes implemented by a non-utility company that enters into a contract
with electric power users, usually large users such as universities, high-rise office buildings, or chains of
retail stores. The DR company pays the contracted users to lower their electric use during times of peak
demand, such as hot summer days. The DR company then sells the reduced-load to the utility during peak
demand periods. Large users of electricity can lower their annual electric power costs through the DR
payment and the utility can avoid brown-outs or black-outs, spot market purchases, or the need to develop
new generation capacity.
Energy storage comes in many forms, from large batteries to pump storage, fly wheels, and compressed
air. In the case of pump storage, which has a long history in electrical power systems, water is pumped up
to a dam or holding basin during periods of low demand (non-peak periods) and is released during periods
of high demand to meet the energy load. The use of pump storage is being expanded to use compressed
air and other methods, such as flywheels, that can delay release of energy.
Traditionally, power generation was the primary means of meeting electric power demand. Today,
alternative methods reduce, offset, or delay peak demand and play a larger role in the grid. Traditional
and alternate methods need to be considered as a part of the system that delivers reliable and efficient
power.
Community Resilience Planning Guide for Buildings and Infrastructure Systems - Volume II
Energy Systems
136
14.2.1.2. Transmission
In the traditional bulk power system, 3-phase power exits the generator and enters a transmission
substation. Voltages are transformed to travel long distances along three separate transmission lines, each
carrying a single phase. The transmission infrastructure is primarily wire and towers carrying high voltage
power from generators to distribution substations. It is the middle-man of the electric power delivery
network.
The vulnerability of the transmission infrastructure primarily stems from aging physical assets. As
customer load requirements grow and the various federal and state regulations change, there is a need for
more robust and flexible electric power delivery systems to keep up with demand. The emergence of the
renewable generation market and the transition from coal generation to natural gas generation has stressed
the power grid beyond its original design. Electrical flows that were designed to be in one direction are
now in multiple directions, depending on the location of the power generation at any particular time of
day. Transmission constraints, which affect cost and reliability, have become common in operations.
Over the last 10 years, transmission planning has evolved from relatively few new transmission lines
being built nationwide to many new transmission lines being planned by most major utilities. The cost
and time to build new transmission lines has increased significantly due to acquisition of new routes, and
meeting regulatory and environmental requirements.
Electric power demands impact transmission system reliability. Cyber-based monitoring systems are
being developed to reduce the impact of hazards. As new systems are engineered and constructed, there is
also a need to evaluate current performance and maintenance. The performance of transmission lines has
improved with NERC‘s FAC-003-3 Transmission Vegetation Management Program. The purpose of
FAC 003-3 is to provide the guidance needed ―to maintain a reliable electric transmission system by
using a defense-in-depth strategy to manage vegetation located on transmission rights of way (ROW) and
minimize encroachments from vegetation located adjacent to the ROW, thus preventing the risk of those
vegetation-related outages that could lead to Cascading.‖
Many efforts are underway to strengthen the nation‘s transmission systems, including over 170
transmission projects by members of the Edison Electrical Institute that are anticipated to occur in the
next decade [EEI 2015]. Several major Smart Grid transmission projects have been initiated and, in some
cases, recently completed to improve power supply across the nation. Other efforts to increase grid
resilience and efficiency include developing and deploying new technologies (e.g., Demand Response,
Micro-grid/Islanding, Synchrophasers (PMU), Dynamic Transfer, Energy Imbalance Markets (EIM) and
Dynamic Line Rating (DLR)). FERC also issued Order 1000 [FERC 2011] to help reduce capital costs of
transmission by introducing competition between utilities and transmission developers.
Transmission infrastructure is vulnerable to hazards. Flooding can damage low-lying electrical
infrastructure, such as substations, as was the case with Hurricanes Sandy and Irene [DOE 2013]. Flowing
water can scour pole foundations and expose underground cables. Flood hazards can also inundate
underground electrical conduits, vaults, substations, and splices.
Wind events, such as tornadoes, hurricanes, and thunderstorms, can damage electrical infrastructure.
Thunderstorms can topple trees and damage structures. Ice may form around transmission lines and
increase the loads on the transmission systems, particularly when accompanied by high winds, sometimes
leads to failure of the system. Lightning and geo-magnetically induced currents in transmission lines are
additional hazards to be managed.
Depending upon the wildfire risk, communities may need measures to protect transmission systems for
exposure to fire. Every year, wildfires burn thousands of acres and destroy homes and other structures.
Alternatively, electrical lines have been implicated in starting wildfires, as was the case in the 2007 San
Diego Witch Creek, Guejito and Rice wildfires [SDUT 2007].

Community Resilience Planning Guide for Buildings and Infrastructure Systems - Volume II
Energy Systems
137
14.2.1.3. Distribution
In the traditional power delivery system, the distribution system begins at the distribution substation. The
substation takes high voltage power and transforms it to less than 10 000 volts (typically 7200 volts). The
distribution substation is critical to the power delivery system and is a focus area for mitigation and rapid
recovery. It supports a variety of operations technology (OT) and information technology (IT) equipment
and systems that connect the utility operation center to the endpoint loads. The distribution system is by
far the largest component of the electric power system. During post-event recovery, the majority of
repairs are normally within the distribution network. Distribution systems are typically located along
roadsides but may also go through less accessible lots and other right-of-ways.
Maintaining distribution systems can be challenging. The poles and key equipment are subject to
overloading by addition of other wires and system components by local service providers. These additions
may overload electrical system components or increase their vulnerability to wind and ice loads. High
ambient temperatures can also reduce cable lifetimes and insulation integrity.
The distribution system is vulnerable to a number of hazard events. Overhead distribution lines are
particularly vulnerable to tree-related damage during wind events. Trees often fall and damage the
distribution network. Therefore, vegetation management is critical to minimizing vulnerability of
distribution lines to high wind events [EPRI 2013]. Most utilities have tree management programs, but
failure to adequately implement these programs has been a leading cause of outages [FERC 2013, NERC
2015a]. The reason for this failure is not always simple. Even though the utility may have a vegetation
management program, public and private land owners may not allow removal of trees or limbs on their
private property. Other jurisdictions and environmental organizations have stopped tree trimming and
clearing programs. The aggregate impact of these actions results in failed implementation of tree
trimming programs, which can increase distribution system vulnerability.
Winds that change direction throughout a storm, such as hurricanes and tornadoes, can cause extensive
damage, including failure of poles. As a result of observations after the 2004 and 2005 hurricane seasons,
Florida now requires inspections to look for poles that are overloaded from mounted equipment, are
degraded at the ground interface, or have other weakness [Florida Public Service Commission 2007,
NextEra Energy Inc. 2013]. Instead of a 15-year pole inspection cycle, Florida has implemented an 8-year
inspection cycle [NextEra Energy Inc. 2013]. Poles that look perfectly fine from a visual inspection may
not be fine internally or underground. Therefore, new inspection tools and techniques have been
developed to help with pole inspection.
Lightning is a particular concern for the electrical power infrastructure. When a transformer is
overloaded, either by a lightning strike or by an overload on the circuit, it typically catches on fire. The
resulting blaze can consume the transformer, the pole to which it is attached, and nearby vegetation as
flaming oil falls to the ground. Poles that have filled with water can explode when the water inside flashes
to steam.
Lightning can travel along conductors, even when a line is down and de-energized. Lightning can strike a
downed line and travel along it, until it reaches a lightning arrestor or a fusible link. Damage to home
appliances and consumer electronics can occur when lightning strikes a line beyond an outage point.
Surge protectors, uninterruptible power supply (UPS) systems, and other protection equipment can help
protect equipment, but only unplugging equipment from power sources ensures that a lightning strike will
not disable it.
Earthquakes may cause widespread damage to distribution systems, with little or no warning, through
strong ground shaking, landslides, liquefaction, or ground shifting. Additionally, they can lead to other
failures and cascading events, such as fires and ruptured water mains, which in turn may damage
electrical infrastructure systems. These events may damage poles or break electrical lines. Unless
carefully designed for potential earthquake ground movement, distribution lines may fail if there is
Community Resilience Planning Guide for Buildings and Infrastructure Systems - Volume II
Energy Systems
138
insufficient slack in the lines to allow them to accommodate the ground movement, particularly near fault
lines. Overhead lines tend to perform better than underground lines near fault lines because the lines have
some slack and their supporting structures flex as well. Top loaded poles (those with transformers,
voltage regulators, etc.) tend to fail first in an earthquake.
Many efforts are underway to improve distribution systems. There are mitigation programs and projects
underway across the nation, such as lightning arresters. Some utilities are encasing fuses so hot metal
pieces will not fall and potentially cause fires. There has also been a movement away from wood poles.
Where wood poles are still being used, some utilities are increasing the size and class to meet design
criteria.
14.2.1.4. Emerging Technologies
Many smart grid technologies available today are targeted to help electric utilities improve reliability,
operating efficiency, and power quality, and to identify potential opportunities to improve circuits. Many
utilities are working on smart grid integration to support better prediction of performance, as well as
identify corrective actions.
Technology has also helped utilities rapidly correct power outages. Many utilities have implemented
some form of distribution automation, and other technologies to improve the reliability and resilience of
the electric power system.
This section examines the potential role of microgrids, renewable energy, fuel cells/energy storage, and
demand side management in improving resilience in communities and the electric power system.
Microgrids. With regards to energy resilience, microgrids are one of the most profound emerging
technology opportunities. Microgrids connect customer loads with distributed energy resources (DERs)
within a defined boundary. The electric grid, or macro grid, treats the DER as a single entity; the
microgrid manages the DERs and loads independently. Microgrids can be connected or disconnected
from the grid and can operate independently in an island mode. They can help meet organizational
mission requirements, participate in electric power markets, increase energy reliability and resilience, and
incorporate renewable energy resources.
Microgrids can be implemented at numerous points in the electric power system. The most fundamental
division is customer-side or utility-side implementation. Customer-side microgrids can be designed and
implemented for specific operational and business requirements, and may even be designed to operate as
an extension of an emergency generator backup system. The difference is that a microgrid is designed to
provide full energy services for an extended period of time. A customer-side microgrid can be
implemented to ensure business continuity during a disruptive hazard event. Recently, a major Fortune
100 corporation included a microgrid as part of its new company campus headquarters to allow full
operation of the facility for an unlimited time after an earthquake. A clear business case could be made
for implementing a microgrid by extracting value from the technology during normal operations.
In contrast, a utility-side microgrid has the challenge of balancing utility regulatory requirements with the
technology investment. Many stakeholders are involved in such decisions. Microgrids have been studied
as a potential solution by New York, Connecticut, and California, as well as the U.S. Department of
Energy. These studies consider how some of the regulatory frameworks may influence the ability to
incorporate microgrids.
Microgrids are not simple, interchangeable systems. They should operate and provide value when the grid
is operational, but require long-term operational expertise and maintenance commitment. However, in
some cases the value for microgrids may occur when loss of critical operations poses a significant risk to
public safety or security. Facilities essential to community recovery that may benefit from considering or
implementing microgrid solutions include:

Community Resilience Planning Guide for Buildings and Infrastructure Systems - Volume II
Energy Systems
139
Critical facilities (City Hall, Police, Fire, 911, etc.)
Hospitals and medical centers
Government facilities
Key businesses for recovery, such as grocery stores, drug stores, large employers, gas stations
Renewable energy generation. Renewable energy comes from natural sources that are frequently and
sustainably replenished. When power is interrupted, renewable energy generation can support
uninterrupted or reduced capacity service to energy consumers. The use of renewable energy is not new,
but emerging technology, equipment, software, and systems are evolving at a fast pace. The two primary
emerging renewable energy generation resources are solar and wind power generation systems.
Solar photovoltaic (PV). The photovoltaic process converts light into direct current (DC)
electricity. Solar cell modules supply DC electricity at a certain voltage (e.g. 12 VDC). The
amount of current depends on the amount of light that enters the module. When multiple modules
are strung together, a solar PV array is constructed that can produce more electricity. PV arrays
are configured in series or in parallel to provide different voltage and current combinations. PV
systems are being used in a variety of scenarios, ranging from small rooftop units that provide
supplemental power to large solar farms that provide megawatts (MW) of power. The technology
continues to improve with better efficiency conversions of light into electricity and improved
materials. A high percentage of PV systems in the local distribution system needs to be
coordinated with and managed by the utility as variable distributed resources.
Wind power. Wind power is one of the oldest forms of renewable energy and has been harnessed
by man for many centuries. The basic process uses turbines to capture the wind‘s energy and
convert it into mechanical power. The mechanical power has been used to pump and move water,
and to grind grain and corn in mills. It can also be used to create electricity through a generator.
Although the same basic principles apply, wind generation today occurs on a large scale. Farms
of wind turbines and generators are found throughout the Midwest, Texas, the coasts, offshore,
and deserts. Some wind farms produce many megawatts (MW) of power.
Fuel cells and energy storage. Fuel cells and batteries are two new technologies being developed to
increase the number of methods available for energy storage.
Fuel cells. Fuel cells create electricity through chemical reactions. The reaction is controllable
and can be tuned to manage the amount of electricity produced. The types of fuels vary, but
require oxygen and hydrogen in their chemistry. The waste from fuel cells is clean, producing
water. Fuel cells have a variety of uses and have been popular concepts in the automotive
industry to support environmentally-friendly hydrogen vehicles. The technology continues to
evolve with different fuel sources, cheaper solutions, and higher capacities.
Battery energy storage. Battery storage systems are the next innovation for energy resiliency,
power quality, and energy efficiency. The concept is simple: when demand is low, charge the
batteries; when demand is high, use battery power. Batteries are often big, expensive, and do not
last as long as desired. Also, there are very few incentives for investment in battery technology.
The landscape is slowly changing and states like California and New York are performing battery
studies and pilots. This emerging technology could have an enormous impact on how the grid is
managed and combined with renewable energy generation.
Demand side management. Demand side management (DSM) systems can modify patterns of customer
electricity usage, including the timing and level of demand. The ability for customer loads to respond to
external controls during an energy system emergency supports energy system performance during the
event and afterwards when restorative actions are underway. This is especially important when microgrids

Community Resilience Planning Guide for Buildings and Infrastructure Systems - Volume II
Energy Systems
140
are used on either the customer side or utility side of the meter. A key challenge in managing a microgrid
is maintaining load and generation balance to keep the system stable.
Customer side backup generation solutions, which are not intended for long term operation or support of
normal business operations, typically only meet emergency loads. More sophisticated systems may
integrate renewable energy sources, fuel cells, and energy storage and interact with building automation
systems to control building loads and optimize the performance of the system for short or long term
operation.
Utility-side microgrids may also use DSM to effectively manage local feeder and substation level
microgrids to ensure system stability and maximize the number of customers that can be served by
systems that remain intact after a hazard event or are restored. DSM techniques can also be used at the
bulk level to manage transmission loading constraints that may exist during or after a hazard event.
14.2.2. Liquid Fuel
The most common liquid fuels are gasoline, diesel, and kerosene-based products, such as jet fuels, that are
produced from petroleum. Other liquid fuels include compressed natural gas, liquefied petroleum gas
(LPG), synthetic fuels produced from natural gas or coal, biodiesel, and alcohols. For resilience, liquid
fuels are critical to back-up power generation and nearly all modes of transportation. In addition, 11 % of
U.S. homes rely on heating oil or propane, with heating oil usage concentrated in the Northeast and
propane usage concentrated in rural areas [USEIA 2009].
Although less than 1 % of all electricity in the U.S. is generated in oil-fired plants, there are some isolated
markets in which petroleum remains the primary fuel. The leading example is Hawaii, where more than
70 % of electricity generation is fueled by petroleum [USEIA 2014a].
U.S. refineries tend to be geographically concentrated and operate at 90 % or more of capacity during
periods of strong economic growth [USEIA 2014b]. The reliability and resilience of U.S. refinery
capacity is both a national security issue and a major regional economic issue in those areas of the U.S.
where refinery capacity is concentrated.
Liquid fuel production, storage, and distribution systems include:
Production fields
Transport systems between production sites, refineries, and regional distribution centers, which
may include ports, pipelines, and rail
Refineries, which may include storage vessels, facilities, equipment, and power supplies.
Regional distribution systems, including storage facilities such as tank farms, pipelines, trucks,
and pumping stations
Regardless of where production and refinery capacity are located, all communities need to understand
their fuel systems, including transport, storage, and distribution of fuel products. Damage to ports, tank
farms, pipelines, railways or roadways can cause serious delays to the distribution of liquid fuels which,
in turn, can lead to loss of backup power generation when onsite fuel supplies are exhausted. During cold
weather periods, disruption to heating fuel supplies also has the potential of becoming a significant issue.
An example of vulnerabilities associated with the transport, storage, and distribution of fuel product can
be seen in the energy portion of the Oregon Resilience Plan, which was developed for a magnitude 9.0
earthquake event on the Cascadia subduction zone. The Oregon study identifies the northwest industrial
area of Portland as Oregon‘s Critical Energy Infrastructure (CEI) Hub. More than 90 % of Oregon‘s
refined petroleum products pass through this area before being distributed throughout the state. Potential
hazards to liquid fuel storage and distribution networks include ground shaking, sloshing, liquefaction,

Community Resilience Planning Guide for Buildings and Infrastructure Systems - Volume II
Energy Systems
141
lateral spreading, landslides, settlement, bearing capacity failures, fire, seiches in the CEI Hub area, and
tsunami damage along the coast. Fuel is transported to the site via a liquid fuel transmission pipeline from
the north and marine vessels. Alternative modes of transporting fuel from the east or south or by air are
limited. Key recommendations for improving the resilience of the Oregon energy system include
conducting vulnerability assessments, developing mitigation plans, diversifying transportation corridors
and storage locations, providing alternate means fuel delivery to end users, and coordinated planning for
future systems and recovery [OSSPAC 2013].
The American Lifelines Association [ALA 2005] identified the performance measures and metrics for
pipeline systems shown in Table 14-1.
A qualitative ranking of typical pipeline system components and facilities vulnerability to hazards from
the ALA [2005] study is reproduced in Table 14-2.
Table 14-1: The American Lifelines Association high-level performance measures and performance
metrics for pipeline systems [Adapted from ALA 2005]
Desired Outcomes
(Performance Targets)
System Performance Metrics
Capital
Losses
($)
Revenue
Losses
($)
Service Disruption
(% service
population)
Downtime
(hours)
Casualties
(deaths,
injuries)
Lost
Product
Protect public and utility
personnel safety
X X
Maintain system
reliability
X X
Prevent monetary loss X X X X X
Prevent environmental
damage
X

Community Resilience Planning Guide for Buildings and Infrastructure Systems - Volume II
Energy Systems
142
Table 14-2: Qualitative ranking of typical pipeline system components and facilities
vulnerability to hazards to [Adapted from ALA 2005]
Hazards
Degree of Vulnerability
Tra
nsm
issi
on
Pip
elin
es
Pu
mp
Sta
tio
ns
Co
mp
ress
or
Sta
tio
ns
Pro
cess
ing
Fa
cili
ties
Sto
rag
e T
an
ks
Co
ntr
ol
Sy
stem
s
Ma
inte
na
nce
Op
era
tio
ns
Bu
ild
ing
s &
Eq
uip
men
t
Pre
ssu
re R
egu
lati
on
s /
Met
erin
g S
tati
on
s
Dis
trib
uti
on
Pip
elin
es
Ser
vic
e L
ines
or
Co
nn
ecti
on
s
Natural Hazards
Earthquake shaking L M M M H M H L L M
Earthquake permanent ground deformations (fault
rupture, liquefaction, landslide and settlement)
H - - - L - - L H
(Buried)
M
Ground movements (landslide, frost heave,
settlement)
H - - - L - - L H
(Buried)
M
Flooding (riverine, storm surge, tsunami and seiche) L H H H M H H H L M
Wind (hurricane, tornado) L (Aerial) - - - - L L - - -
Icing L - - - - - - - L -
Collateral hazard: blast or fire M H H H H M L L L M
Collateral hazard: dam inundation L H H H M H H H L M
Collateral hazard: nearby collapse - L L L - L L L M L
Human Threats
Physical attack (biological, chemical, radiological
and blast)
M M M M - M M - M -
Cyber attack - L L L - H L - L -
Note: Degrees of vulnerability: H = High, M = Moderate, L = Low. For a component or system located within a
building, the vulnerability of both the building and component should be considered. For example, where there is a
potential building collapse or mandatory evacuation, the equipment housed within is at risk. The Table 14-2 entries
assume the component is of recent vintage, i.e., post 1945.

Community Resilience Planning Guide for Buildings and Infrastructure Systems - Volume II
Energy Systems
143
14.2.3. Natural Gas
Natural gas pipelines and storage facilities comprise a vast infrastructure that services 65 million homes, 5
million businesses, 193,000 factories and 5,500 electric generating facilities [McDonough 2013]. There
are nominally over 3.9 million km (2.4 million miles) of natural gas pipelines in the continental U.S., with
pipelines running along roads and private easements under both urban and rural lands [McDonough
2013].
Natural gas pipelines are buried structures and, therefore, predominantly damaged by events that affect
the soil, such as ground shaking, liquefaction, and ground rupture. Specific points of failure may be
predicted when rupture or liquefaction occurs, but the most damaging event on a wide scale is ground
shaking [Nadeau 2007]. Existing weaknesses or aging effects, which may be the first points of failure, can
include corrosion, poor welds, and weak or strained material. Regular maintenance can have a beneficial
effect, as can upgrading piping from iron (used in older pipeline) to plastic (for low-pressure distribution
lines) or steel pipe.
Fuel cells are being use as a power source to achieve a more resilient natural gas infrastructure. Fuel cells
provide a decentralized, reliable source of power that has proven useful in hazard events. They are
considered a distributed resource by IEEE. For example, during Hurricane Sandy, one manufacturer put
60 fuel cells in place to provide backup power to cell phone towers. These were the only cell towers that
remained operational during and after the storm [Fuel Cell and Hydrogen Energy Association 2014].
Aboveground facilities that support processes such as compressor stations, processing plants, meter
stations, and wells are the most vulnerable parts of the natural gas system. For example, unusually cold
weather in 2011 caused interruptions in natural gas service in the Southwest, which, in turn, caused
outages at gas-fired electric generating facilities that were experiencing high demand for electricity. A
joint report by FERC and NERC [FERC and NERC 2011) concluded these outages and disruptions of
service were caused by weather-related mechanical problems such as frozen sensing lines, equipment,
water lines and valves. The report recommended adopting minimum winterization standards for natural
gas production and processing facilities, and suggested that additional underground natural gas storage
capacity in the region could have ameliorated the impacts of natural gas supply shortages.
14.2.4. Emergency and Standby Power
Emergency and standby power are often used to improve recovery of functions and community resilience.
Some infrastructure elements are required by code provisions to have emergency or standby power. For
others, it is a non-mandated option available to provide a service.
IEEE [1995] defines an emergency power system as ―an independent reserve source of electric energy
that, upon failure or outage of the normal source, automatically provides reliable electric power within a
specified time to critical devices and equipment whose failure to operate satisfactorily would jeopardize
the health and safety of personnel or result in damage to property.‖
The National Electric Code, or NEC [NFPA 2014], defines emergency systems as ―those systems legally
required and classed as emergency by municipal, state, federal, or other codes, or by any governmental
agency having jurisdiction. These systems are intended to automatically supply illumination, power, or
both, to designated areas and equipment in the event of failure of the normal supply or in the event of
accident to elements of a system intended to supply, distribute, and control power and illumination
essential for safety to human life.‖
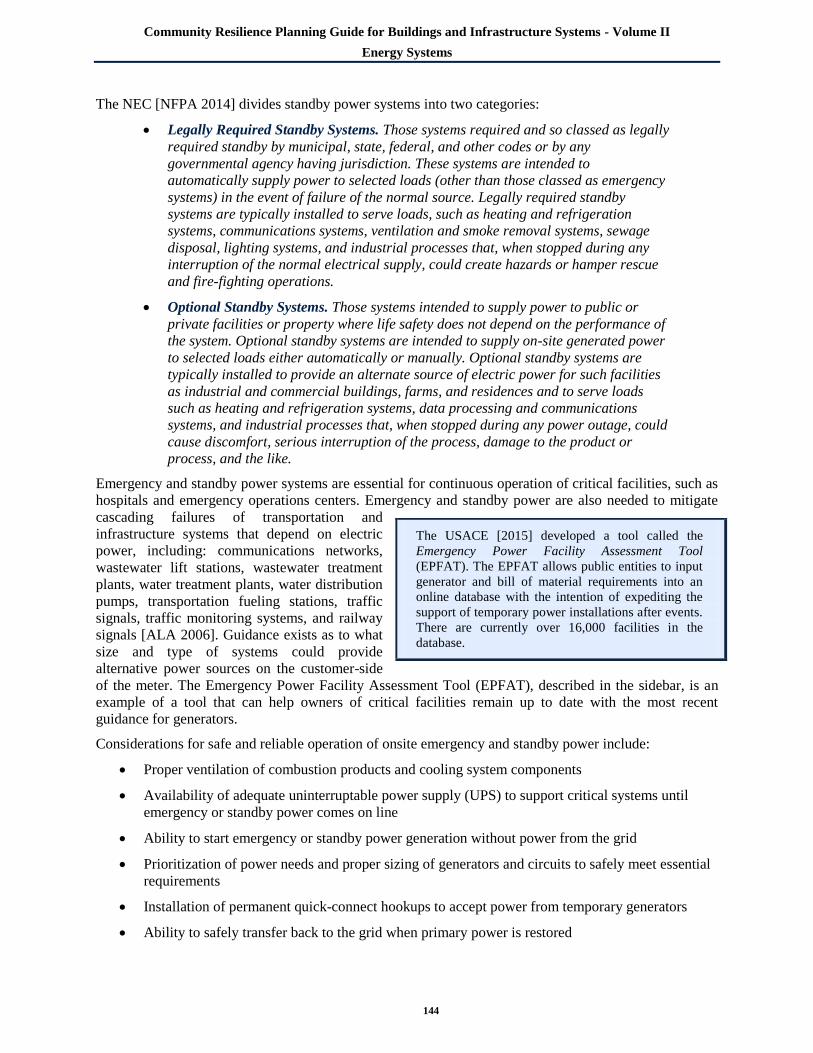
Community Resilience Planning Guide for Buildings and Infrastructure Systems - Volume II
Energy Systems
144
The NEC [NFPA 2014] divides standby power systems into two categories:
Legally Required Standby Systems. Those systems required and so classed as legally
required standby by municipal, state, federal, and other codes or by any
governmental agency having jurisdiction. These systems are intended to
automatically supply power to selected loads (other than those classed as emergency
systems) in the event of failure of the normal source. Legally required standby
systems are typically installed to serve loads, such as heating and refrigeration
systems, communications systems, ventilation and smoke removal systems, sewage
disposal, lighting systems, and industrial processes that, when stopped during any
interruption of the normal electrical supply, could create hazards or hamper rescue
and fire-fighting operations.
Optional Standby Systems. Those systems intended to supply power to public or
private facilities or property where life safety does not depend on the performance of
the system. Optional standby systems are intended to supply on-site generated power
to selected loads either automatically or manually. Optional standby systems are
typically installed to provide an alternate source of electric power for such facilities
as industrial and commercial buildings, farms, and residences and to serve loads
such as heating and refrigeration systems, data processing and communications
systems, and industrial processes that, when stopped during any power outage, could
cause discomfort, serious interruption of the process, damage to the product or
process, and the like.
Emergency and standby power systems are essential for continuous operation of critical facilities, such as
hospitals and emergency operations centers. Emergency and standby power are also needed to mitigate
cascading failures of transportation and
infrastructure systems that depend on electric
power, including: communications networks,
wastewater lift stations, wastewater treatment
plants, water treatment plants, water distribution
pumps, transportation fueling stations, traffic
signals, traffic monitoring systems, and railway
signals [ALA 2006]. Guidance exists as to what
size and type of systems could provide
alternative power sources on the customer-side
of the meter. The Emergency Power Facility Assessment Tool (EPFAT), described in the sidebar, is an
example of a tool that can help owners of critical facilities remain up to date with the most recent
guidance for generators.
Considerations for safe and reliable operation of onsite emergency and standby power include:
Proper ventilation of combustion products and cooling system components
Availability of adequate uninterruptable power supply (UPS) to support critical systems until
emergency or standby power comes on line
Ability to start emergency or standby power generation without power from the grid
Prioritization of power needs and proper sizing of generators and circuits to safely meet essential
requirements
Installation of permanent quick-connect hookups to accept power from temporary generators
Ability to safely transfer back to the grid when primary power is restored
The USACE [2015] developed a tool called the
Emergency Power Facility Assessment Tool
(EPFAT). The EPFAT allows public entities to input
generator and bill of material requirements into an
online database with the intention of expediting the
support of temporary power installations after events.
There are currently over 16,000 facilities in the
database.

Community Resilience Planning Guide for Buildings and Infrastructure Systems - Volume II
Energy Systems
145
National Fire Protection Association Standards 110 and 111 provide performance standards for
Emergency and Standby Power Systems [NFPA 2013a] and Stored Electrical Energy Emergency and
Standby Power Systems [NFPA 2013b], respectively. NPFA 110 recognizes two classification levels:
critical to life and safety (Level 1) and less critical (Level 2). Level 1 applications include life safety
illumination, fire detection and alarm systems, elevators, fire pumps, public safety communications
systems, industrial processes where current interruption would produce serious life safety or health
hazards, and essential ventilating and smoke removal systems. Level 2 applications include heating and
refrigerating systems, other communications systems, other ventilating and smoke removal systems,
sewage disposal, lighting, and industrial processes.
Key considerations for having adequate fuel for emergency and standby power system include an on-site
fuel supply to support essential power loads and a fuel that can be delivered by truck. Alternative fuel
sources, such as solar arrays, can be considered for functions such as maintaining lighting for emergency
exit paths, providing water pressure in buildings, or operating transportation signals or pumps at fueling
stations [Andrews et al. 2013].
Diesel generators range from small mobile generators to larger permanently installed systems. Small
generators can be easily deployed to power traffic signals, rail crossing signals, or critical circuits in
residential or small commercial buildings, but they require frequent refueling, pose safety hazards to
inexperienced operators, and may not be reliable if poorly maintained or used infrequently. Permanently
installed generators have more substantial fuel capacities and may be safer to operate and more reliable if
tested and maintained on a regular schedule.
Following Hurricane Sandy, the State of New Jersey used FEMA HMGP funds to establish a Retail Fuel
Station Energy Resiliency Program [NJOEM 2014]. Eligibility requirements for the program include:
Stations must be located within ¼-mile of an identified evacuation route
Stations with gasoline storage capacity of 30,000 to 35,000 gallons were eligible for up to a
$15,000 grant to purchase quick-connect technology or to offset a portion of the cost of
purchasing a generator
Stations with gasoline storage capacity of more than 35,000 gallons were eligible for up to a
$65,000 grant toward the purchase and installation of an onsite generator
Stations must sell both gasoline and diesel fuel (except in limited instances)
The program requires a maintenance contract be in place for at least five years from the date of final
approval of municipal building inspector.
Combined Heat and Power (CHP) is a highly efficient method of providing uninterrupted power and
thermal (heating or cooling) services to a host facility. CHP systems are typically powered by natural gas
fueled turbines or reciprocating engines. Over a dozen case studies of successful CHP system
performance during Hurricane Sandy and other recent large scale power outages have been documented
by Hampson et al. [2013]. Key advantages of CHP systems over conventional diesel generators include
better reliability, lower fuel costs, lower emissions, and the ability to address thermal demands in addition
to power demands. Texas and Louisiana now require that all state and local government entities identify
which government-owned buildings are critical in an emergency and that a feasibility study on CHP is
conducted prior to constructing or extensively renovating a critical government facility. In New York, the
State Energy Research and Development Authority (NYSERDA) and the State Office of Emergency
Management have partnered to educate emergency managers about the benefits of CHP systems in
emergency facilities; and the governor has announced a $20 million investment towards CHP projects,
with added incentives for projects serving critical infrastructure, including facilities of refuge [Hampson
et al. 2013].
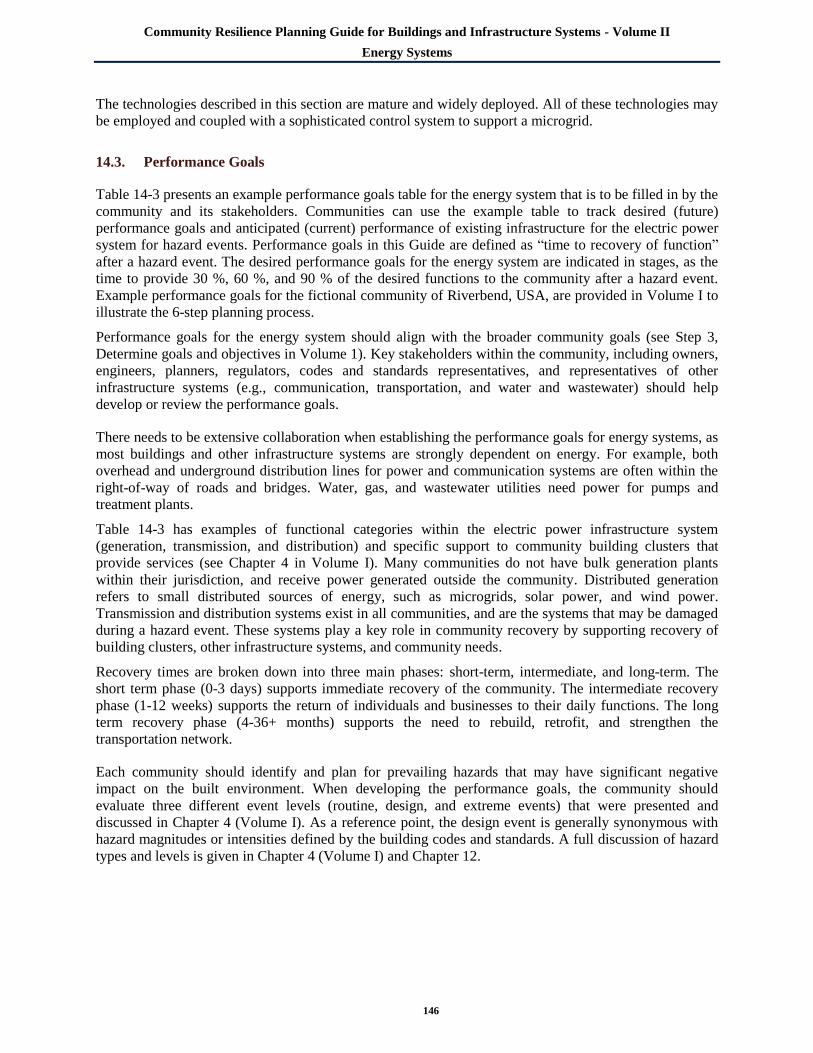
Community Resilience Planning Guide for Buildings and Infrastructure Systems - Volume II
Energy Systems
146
The technologies described in this section are mature and widely deployed. All of these technologies may
be employed and coupled with a sophisticated control system to support a microgrid.
14.3. Performance Goals
Table 14-3 presents an example performance goals table for the energy system that is to be filled in by the
community and its stakeholders. Communities can use the example table to track desired (future)
performance goals and anticipated (current) performance of existing infrastructure for the electric power
system for hazard events. Performance goals in this Guide are defined as ―time to recovery of function‖
after a hazard event. The desired performance goals for the energy system are indicated in stages, as the
time to provide 30 %, 60 %, and 90 % of the desired functions to the community after a hazard event.
Example performance goals for the fictional community of Riverbend, USA, are provided in Volume I to
illustrate the 6-step planning process.
Performance goals for the energy system should align with the broader community goals (see Step 3,
Determine goals and objectives in Volume 1). Key stakeholders within the community, including owners,
engineers, planners, regulators, codes and standards representatives, and representatives of other
infrastructure systems (e.g., communication, transportation, and water and wastewater) should help
develop or review the performance goals.
There needs to be extensive collaboration when establishing the performance goals for energy systems, as
most buildings and other infrastructure systems are strongly dependent on energy. For example, both
overhead and underground distribution lines for power and communication systems are often within the
right-of-way of roads and bridges. Water, gas, and wastewater utilities need power for pumps and
treatment plants.
Table 14-3 has examples of functional categories within the electric power infrastructure system
(generation, transmission, and distribution) and specific support to community building clusters that
provide services (see Chapter 4 in Volume I). Many communities do not have bulk generation plants
within their jurisdiction, and receive power generated outside the community. Distributed generation
refers to small distributed sources of energy, such as microgrids, solar power, and wind power.
Transmission and distribution systems exist in all communities, and are the systems that may be damaged
during a hazard event. These systems play a key role in community recovery by supporting recovery of
building clusters, other infrastructure systems, and community needs.
Recovery times are broken down into three main phases: short-term, intermediate, and long-term. The
short term phase (0-3 days) supports immediate recovery of the community. The intermediate recovery
phase (1-12 weeks) supports the return of individuals and businesses to their daily functions. The long
term recovery phase (4-36+ months) supports the need to rebuild, retrofit, and strengthen the
transportation network.
Each community should identify and plan for prevailing hazards that may have significant negative
impact on the built environment. When developing the performance goals, the community should
evaluate three different event levels (routine, design, and extreme events) that were presented and
discussed in Chapter 4 (Volume I). As a reference point, the design event is generally synonymous with
hazard magnitudes or intensities defined by the building codes and standards. A full discussion of hazard
types and levels is given in Chapter 4 (Volume I) and Chapter 12.

Community Resilience Planning Guide for Buildings and Infrastructure Systems - Volume II
Energy Systems
147
Table 14-3: Example electrical energy infrastructure performance goals table to be filled out by
community and its stakeholders
Disturbance 1 Restoration Levels 2,3
Hazard Type Any 30% Function Restored
Hazard Level Routine, Design, Extreme 60% Function Restored
Affected Area Localized, Community, Regional 90% Function Restored
Disruption Level Usual, Moderate, Severe X Anticipated Performance
Communications Infrastructure Support
Needed4
Design Hazard Performance
Phase 1
Short-Term
Phase 2
Intermediate
Phase 3
Long-Term
Days Weeks Months
0 1 1-3 1-4 4-8 8-12 4 4-24 24+
Power - Electric Utilities
Community Owned or Operated Bulk Generation
Generation Requiring Fuel Transport (Coal, Gas, Oil fired)
In Place Fueled Generation (Hydro, solar, wind,
wave, compressed air)
Storage (Thermal, Chemical, Mechanical)
Community Owned or Operated Distributed Generation
Generation Requiring Fuel Transport (Coal, Gas, Oil fired)
In Place Fueled Generation (Hydro, solar, wind,
wave, compressed air)
Storage (Thermal, Chemical, Mechanical)
Transmission and Distribution (including Substations)
Critical Facilities
Hospitals, Police and Fire Stations / Emergency
Operations Centers
Debris / recycling centers/ Related lifeline
systems
Emergency Housing
Public Shelters / Nursing Homes / Food Distribution Centers
Emergency shelter for response / recovery
workforce/ Key Commercial and Finance
Housing/Neighborhood
Essential city services facilities / schools / Medical offices
Houses of worship/meditation/ exercise
Buildings/space for social services (e.g., child
services) and prosecution activities
Community Recovery
Commercial and industrial businesses / Non-emergency city services
Residential housing restoration
Footnotes:
1 Specify hazard type being considered
Specify hazard level – Routine, Design, Extreme
Specify the anticipated size of the area affected – Local, Community, Regional
Specify anticipated severity of disruption – Minor, Moderate, Severe
2 30% 60% 90% Desired restoration times for percentage of elements within the cluster
3 X Anticipated performance for 90 % restoration of cluster for existing buildings and infrastructure systems
Cluster recovery times will be shown on the Summary Matrix
4 Indicate levels of support anticipated by plan
R = Regional; S= State; MS=Multi-State; C = Civil (Corporate/Local)
The affected area of a given hazard event, which often depends on the type and intensity of the hazard,
helps define the area that may need resilience planning. The affected area indicates the extent of potential
damage by the hazard event, including surrounding communities, which will impact the duration of the

Community Resilience Planning Guide for Buildings and Infrastructure Systems - Volume II
Energy Systems
148
recovery process. The disruption level, on the other hand, is a general estimate of potential disruption to
the existing transportation infrastructure system as a whole, and should be specified as minor, moderate,
or severe.
Community stakeholders, including representatives from the utility providers, need to work together to
determine the functions needed during recovery and the performance goals tailored to their community
needs and energy systems. This process will guide the resilience conversation between the users and
providers and help to establish common vocabulary and expectations of system performance both in the
current state and in the desired, future resilient community.
Note that for energy systems, the local owner operator (e.g. investor owned electric utility (IOU),
municipal electric utility, cooperative electric utility, gas utility) has responsibility for the prioritization of
service restoration based on federal, state and local laws and regulations, as well as ensuring the safe,
reliable operation of the power system. The local community and owner operators can develop restoration
priorities outside of those required by regulation for safety and reliability.
To develop performance goals for Table 14-3, community stakeholders should identify desired
performance of the energy systems to support a community in a manner that is considered resilient. The
desired (future) performance goals should be based on the needs of social institutions after a hazard event.
The anticipated performance (i.e., the ―X‖) should be based on the expected performance of the existing
infrastructure system, which may include data and response times from recent hazard events.
As such, much of the current infrastructure and response efforts managed by larger utilities may meet the
90 % restored metric identified and therefore the blue shaded box can be marked with the 90 % to show
that they are overlapping. However, the target performance levels proposed may not currently be achieved
by utilities and providers.
Community performance goals cannot address the restoration of the generation or transmission
capabilities when these infrastructure assets are heavily damaged by an event. For hazard events, it is
generally expected that the grid will be able to respond and absorb some level of infrastructure failure.
Short- and long-term solutions to disruptions, outages, and interruptions need to be part of the recovery
planning process. The ability of the sub elements and functions to be operational soon after an event may
be achieved through a variety of solutions, including deployment of distributed generation and microgrids
on both utility and consumer sides of the meter. Restoration prioritization and solutions chosen to work
around restoration time constraints are highly dependent on the nature of the event, level and location of
the damage, geography, and electrical characteristics of the affected systems. Some may require capital
investments, while others are operational responses that are labor and personnel dependent.
The percentage of the electric power infrastructure the utilities can quickly restore will vary from
community to community. The sub elements presented in the table are a representative set. Communities
may have a greater or smaller number of elements and functions than depicted here. The local planning
process should evaluate and establish the sub elements and functions that should have desired
performance goals.
As examples, previous work to establish performance goals can be found in the efforts undertaken by
SPUR [SPUR 2009], the California Energy Assurance Planning [CaLEAP 2015] program, and the State
of Oregon Resilience Plan [OSSPAC 2013].
14.4. Regulatory Environment
The electric utility and liquid fuel industries are highly regulated with the goals of keeping prices low,
keeping delivery safe, and providing reliable, quality products to consumers. Regulation occurs at the
federal and state levels. Regulations, codes, and standards can help improve new and existing
infrastructure performance and recovery from hazard events, while addressing these societal goals.
Community Resilience Planning Guide for Buildings and Infrastructure Systems - Volume II
Energy Systems
149
14.4.1. Federal
The Federal Energy Regulatory Commission (FERC) is the U.S. national regulatory body responsible for
interstate transmission of oil, natural gas, and electricity [FERC 2015]. They are also responsible for
reviewing interstate gas pipeline proposals, licensing hydropower plants, and reviewing proposals for
developing liquefied natural gas terminals. FERC regulates the interstate wholesale sales and transmission
of electricity, reviews and makes decisions on utility mergers and acquisitions, monitors and investigates
energy markets, and provides rulings on transmission siting applications. FERC has the authority to
impose civil penalties and fines for non-compliance to regulatory rules.
The Western Energy Crisis, the Enron scandal, and a historic East Coast blackout, led Congress to grant
broad new authority to the FERC in 2005. A joint U.S.-Canada task force studied the causes and effects
of the 2003 blackout and identified the need to make reliability standards mandatory and enforceable with
penalties for noncompliance. The Energy Policy Act of 2005 [EPAct 2005] entrusted FERC with a new
responsibility to oversee mandatory, enforceable reliability standards for the nation‘s Bulk Power
System—that is, the wholesale power grid. The business of reliability became not just a set of industry
best practices; it became a matter of national policy importance.
Through Section 215 of the Federal Power Act [1920], Congress authorized FERC to certify a national
Electric Reliability Organization (ERO), which is the North American Electric Reliability Corporation
(NERC). NERC is a non-profit entity whose mission is to ensure the reliability of the Bulk Power System
in North America. NERC develops and enforces reliability standards and annually assess seasonal and
long-term reliability, monitor the BPS through system awareness, and educate, train, and certify industry
personnel. NERC‘s area of responsibility spans the continental United States, Canada, and the northern
portion of Baja California, Mexico. NERC is subject to oversight by FERC and governmental authorities
in Canada [NERC 2015b].
The Nuclear Regulatory Commission (NRC), another federal regulator, is responsible for licensing and
inspecting nuclear reactors, and providing regulations, guidelines, and best practices for their operation.
They are also responsible for any nuclear fuel manufacturing oversight and for coordinating and
participating in nuclear energy research and development.
Each of the various state and federal authorities regulates different and overlapping aspects of the electric
system. The requirements, standards and codes for each are lengthy, complex, evolving and are part of the
process seeking refinements to facilitate reliability and resilience improvements.
14.4.2. State
Each state has a regulatory commission with responsibility to represent the electric power consumers in
their jurisdiction. State commissions regulate retail electricity and gas, approve physical construction of
infrastructure projects, rule on local distribution of electricity and gas, and provide general regulatory
oversight of local utilities and gas distribution companies. The commission meets regularly with state
utilities and conducts performance assessments. If performance metrics are not met, utilities may be
punished or fined.
Utilities and state public service commissions (PSC) work to balance regulations and rules governing
utility roles and responsibilities. For instance, there is evolving regulation of rooftop solar systems and
behind the meter load, and the ability of solar companies to sell power back to the utility. This is referred
to as ―net metering‖ and the rules vary from state to state. Utilities need to account for the additional
operating costs associated with planning, maintaining, and operating the infrastructure system as well as
ensuring that failure of one customer‘s equipment does not cause other service disruptions.
The rules and regulations are primarily administered by state PSCs and utilities, but the oversight roles of
the regional Independent System Operators (ISOs) and the Regional Transmission Organizations (RTOs)

Community Resilience Planning Guide for Buildings and Infrastructure Systems - Volume II
Energy Systems
150
are also important, particularly with respect to cost and reliability. The ISOs and RTOs have similar
functions, though the RTOs have greater responsibility for the regional transmission network, as
established by FERC. However, both the ISOs and RTOs operate regional electricity grids, administer the
wholesale electricity markets, and provide reliability planning for the bulk electric system. Some of these
systems such as the New York ISO (NYISO) are single state systems, and some are more regional such as
the ISO New England (ISO-NE) system and the Southwest Power Pool (SPP). Due to the inter-
relatedness of the North American grid, the ISO/RTO systems may be international and include for
example, the Alberta Electric System Operator.
14.4.3. Local
At the State and Local levels, codes and standards are adopted by the cities, municipalities, counties, other
local government entities, state PSCs, PUCs, ISOs, and RTOs to govern design and construction of the
infrastructure. There is a wide variation in the level of design guidance that is provided by the codes and
standards adopted by these entities. While some have best-practices, others reference ANSI-approved,
consensus codes and standards.
14.5. Codes and Standards
A variety of codes and standards are used in the electric power industry for the design and construction of
generation, transmission, and distribution systems. While ASCE 7 is now incorporated by reference and
used more frequently than in the past, most of the Transmission and Distribution assets are designed to
the National Electric Safety Code (NESC) or the Rural Utilities Service (RUS) design manuals/standards,
respectively. There are many variables related to design and construction of these assets. Not all elements
may be addressed here or will require additional cross checking with additional codes, standards, and
regulations.
In 2009, NIST established the Smart Grid Interoperability Panel (SGIP). The SGIP is a private-public
partnership that identifies electricity delivery standards gaps, fills the gaps through requirements analysis,
and coordinates with Standards Setting Organizations (SSOs) to create or modify interoperability
standards and guidelines. The SGIP maintains a Catalog of Standards (SGIP 2015) that lists many
standards that have been vetted through a regimented process with regards to cybersecurity and
architectural integrity.
The National Electric Safety Code (NESC) is the electric code that is adhered to by the Investor-Owned
Utilities (IOUs) who design and construct the Transmission assets; Sections 24 (Grades of Construction),
25 (Loading Requirements) and 26 (Strength Requirements). NESC Rules 215 (grounding) and 218
(trees) present information important to vegetation management. While this is a safety code, it is used as
an engineering design code in lieu of other guidance. Each utility also has a standards department that
evaluates the various codes and standards that are applied during design and construction of their assets.
They evaluate any new equipment to ensure it meets or exceeds these standards. From the baseline set
forth in the NESC, it is important to note that all IOUs have developed their own standards for their
respective systems. While most of these standards exceed the minimums set forth by the NESC,
performance desired for resilience may exceed the baseline set forth when considering hazards (e.g.,
flood, wind, seismic, ice, and other natural hazards and human-caused threats).
In a similar fashion, the co-operatives and municipalities responsible for distribution assets use the design
manuals and standards from the Rural Utilities Service (RUS). The RUS distribution line design manuals
consist of RUS bulletins 1724-150 [USDA 2014] through 1724-154 [USDA 2003]. These refer to the
identification of critical loads and customers and of poles and equipment.
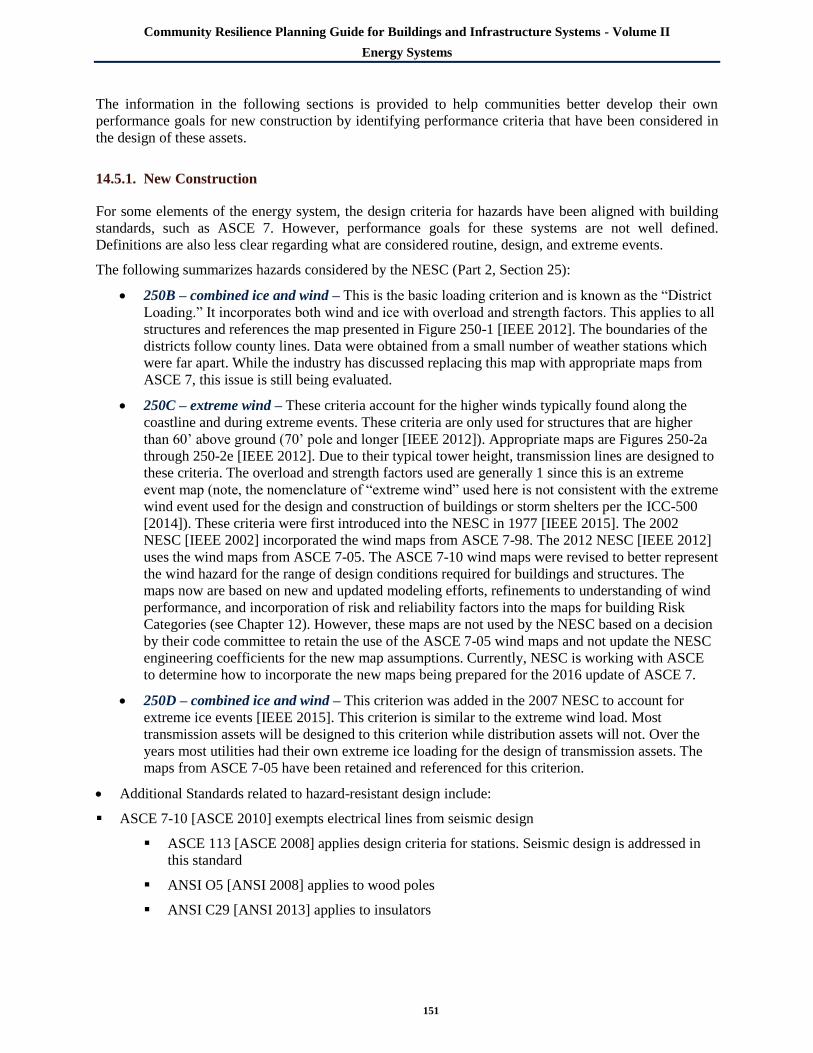
Community Resilience Planning Guide for Buildings and Infrastructure Systems - Volume II
Energy Systems
151
The information in the following sections is provided to help communities better develop their own
performance goals for new construction by identifying performance criteria that have been considered in
the design of these assets.
14.5.1. New Construction
For some elements of the energy system, the design criteria for hazards have been aligned with building
standards, such as ASCE 7. However, performance goals for these systems are not well defined.
Definitions are also less clear regarding what are considered routine, design, and extreme events.
The following summarizes hazards considered by the NESC (Part 2, Section 25):
250B – combined ice and wind – This is the basic loading criterion and is known as the ―District
Loading.‖ It incorporates both wind and ice with overload and strength factors. This applies to all
structures and references the map presented in Figure 250-1 [IEEE 2012]. The boundaries of the
districts follow county lines. Data were obtained from a small number of weather stations which
were far apart. While the industry has discussed replacing this map with appropriate maps from
ASCE 7, this issue is still being evaluated.
250C – extreme wind – These criteria account for the higher winds typically found along the
coastline and during extreme events. These criteria are only used for structures that are higher
than 60‘ above ground (70‘ pole and longer [IEEE 2012]). Appropriate maps are Figures 250-2a
through 250-2e [IEEE 2012]. Due to their typical tower height, transmission lines are designed to
these criteria. The overload and strength factors used are generally 1 since this is an extreme
event map (note, the nomenclature of ―extreme wind‖ used here is not consistent with the extreme
wind event used for the design and construction of buildings or storm shelters per the ICC-500
[2014]). These criteria were first introduced into the NESC in 1977 [IEEE 2015]. The 2002
NESC [IEEE 2002] incorporated the wind maps from ASCE 7-98. The 2012 NESC [IEEE 2012]
uses the wind maps from ASCE 7-05. The ASCE 7-10 wind maps were revised to better represent
the wind hazard for the range of design conditions required for buildings and structures. The
maps now are based on new and updated modeling efforts, refinements to understanding of wind
performance, and incorporation of risk and reliability factors into the maps for building Risk
Categories (see Chapter 12). However, these maps are not used by the NESC based on a decision
by their code committee to retain the use of the ASCE 7-05 wind maps and not update the NESC
engineering coefficients for the new map assumptions. Currently, NESC is working with ASCE
to determine how to incorporate the new maps being prepared for the 2016 update of ASCE 7.
250D – combined ice and wind – This criterion was added in the 2007 NESC to account for
extreme ice events [IEEE 2015]. This criterion is similar to the extreme wind load. Most
transmission assets will be designed to this criterion while distribution assets will not. Over the
years most utilities had their own extreme ice loading for the design of transmission assets. The
maps from ASCE 7-05 have been retained and referenced for this criterion.
Additional Standards related to hazard-resistant design include:
ASCE 7-10 [ASCE 2010] exempts electrical lines from seismic design
ASCE 113 [ASCE 2008] applies design criteria for stations. Seismic design is addressed in
this standard
ANSI O5 [ANSI 2008] applies to wood poles
ANSI C29 [ANSI 2013] applies to insulators

Community Resilience Planning Guide for Buildings and Infrastructure Systems - Volume II
Energy Systems
152
Most distribution structures are shorter than the 18 m (60 ft) height limitation. Therefore, most utilities
will not design their distribution lines to the ASCE 7 criteria. This criterion may need to be reconsidered
given the performance of electric power systems during hurricanes and tornadoes. Utilities can consider
additional design criteria beyond the required minimums to meet desired performance goals.
14.5.1.1. Implied or Stated Performance Levels for Design Hazard Level
As discussed in the previous section, structures greater than 18 m (60 ft) tall are designed for ASCE 7
wind and ice hazards. Though the NESC defines this as an extreme loading case, these loads are
consistent with the design event as defined in this Guide. Therefore, future energy infrastructure greater
than 18 m (60 ft) tall should have very few failures in a design event. However, energy infrastructure less
than 18 m (60 ft) tall (i.e., most distribution structures) is not required to be designed to the NESC
extreme loads. Rather, they can be designed to Rule 250B criteria, which is less than a design event as
defined in Chapter 4 (Volume I). Therefore, failures in the energy distribution system are more likely to
occur in a design ice or wind event than for buildings and structures designed according to ASCE 7
criteria. For instance, some failures in the distribution system may occur during routine wind or ice
events, depending on the system design criteria relative to the event magnitude. Designing and
constructing distribution system elements to standards used for buildings and other structures to which
they provide service, as well as an effective tree-trimming program, would improve the performance of
the distribution system when a hazard event does occur.
Overhead structures and their supporting foundations that are designed to take into account local soil
characteristics would be anticipated to perform well during earthquakes due to their flexibility. However,
actual performance during a design earthquake event for these systems is not well characterized. Buried
distribution lines may fail due to liquefaction or if there is not enough slack in the lines to resist the
displacements and forces from design earthquake events. Flooding may also lead to failure of
underground infrastructure, if not adequately designed for inundation or protected from scour or
landslides.
14.5.1.2. Recovery Levels
The time to recover and restore service of energy infrastructure less than 18 m (60 ft) in height will
depend on a number of factors, such as whether distribution lines are overhead or underground, mobility
of emergency repair crews, availability of resources for repair, and extent of the affected area. Overhead
distribution lines may fail more frequently due to wind or ice events. However, these failures are easier to
access and repair than underground lines, which may fail during flood or earthquake events.
Underground infrastructure damage is more difficult to access and repair. Therefore, while overhead
distribution infrastructure may have more widespread failures that will likely take days to weeks to
recover, a few underground failures may result in the same recovery time. However, widespread
underground failures may result in a number of weeks to restore full functionality of the system.
14.5.2. Existing Construction
For existing infrastructure elements of the energy system, the design criteria used for performance and
hazards varies greatly. In many cases, little to no consideration was given to the forces and loads imparted
to the infrastructure by hazard events because the design pre-dated design standards, such as ASCE 7
[ASCE 2010], that provide criteria to calculate and apply such loads. In some instances, hazard resistance
was incorporated through anecdotal information, such as siting of critical infrastructure based on past
storms or through conservative design approaches and use of materials that provide some level of
resilience. Further, performance goals for these systems were likely never considered or defined. As a

Community Resilience Planning Guide for Buildings and Infrastructure Systems - Volume II
Energy Systems
153
result, older infrastructure may have vulnerabilities. This section discusses the anticipated or implied
performance for existing infrastructure elements to help develop better estimates of anticipated
performance during hazard events.
Examples of these vulnerabilities may include:
Clustered, below grade transformers. Transformers tightly clustered in underground vaults and
small substation yards, many at or below grade, often fill with water and debris during floods,
mud slides, and earthquakes. System redundancy can mitigate the loss of service provided or time
to restore service.
Single pole substation high and low voltage feeds. Using single poles to take both the incoming
and outgoing lines from substations creates a potential single point of failure. If the lines are
separated and the incoming high voltage pole or tower fails, distributed generation may still be
able to feed the station. If a low side feeder exit pole fails, the incoming high voltage feed
remains functional as do other low voltage feeder poles.
Fuses, not breakers in many locations. Using fuses rather than breakers or reclosers in different
parts of a distribution system is largely a cost based decision. Using more breakers and reclosers
may be a new best practice when considering resilience. Also, the lack of sectionalizers in many
utility systems can mean that a single fault results in a loss of service to all customers while the
damaged circuit is being repaired.
Underground ducts run close together and crossing in many shallow manholes. The proximity
of many ducts is a potential common failure mode not generally considered in existing design
practices.
Lack of automation. Most switching in the distribution grid today is local and manual, such that
restoration of power using alternate configurations requires a person to physically access the gear.
Vulnerabilities in existing communications and control equipment used to support the energy system may
include:
Single communications card/frequency in devices. A single communication card or frequency
can create a point of failure and potential interference issue with increased radio traffic during
event response.
Single encryption key or default passwords for all devices in a system. Encryption and password
issues are a well-known security issue being addressed in critical infrastructure, but this issue is
not considered for most distribution systems.
Very small batteries and super capacitors in devices. Small energy storage devices have a short
communications windows on a few channels which can progress to a number of dropped or
missed communications during outages, limiting the ability to optimize crew dispatch.
Mesh networks performance on cold start. Some mesh network implementation plans being used
for field area networks may be fragile when the system starts to have outages. It takes time to
reform an implementation plan after an outage, and plans may be limited by small batteries, deep
mesh designs, lack of stored cold start parameters, etc.
Common right of ways. Fiber and other communication circuits tend to run in the same rights of
ways (on the same poles) as the electrical service – breaking one normally breaks both.
Telecommunications Route Diversity. Diversity of routes may not exist because of a small
number of telecomm switches or central offices.

Community Resilience Planning Guide for Buildings and Infrastructure Systems - Volume II
Energy Systems
154
Cellular Communications Emergency Operating Practices. While cellular towers offer coverage
in many locations, without adequate emergency or standby power, the towers revert to emergency
calling only when the grid goes down, and can affect electric power communications that rely on
cellular systems for backhaul.
Digital Phone System Powering Requirements. Unlike the Plain Old Telephone Service (POTS)
system, digital phone systems require power at each street box.
Most of these issues do not have explicit codes and regulations, but some do. Most come under the
category of best practices on both the customer and utility sides of the meter. These vulnerabilities will
remain until new construction (undertaken using new codes and best practices that consider resilience)
replaces the older infrastructure.
Some utilities on the east coast are starting to look at protection or mitigation of stations after Hurricane
Sandy. Design or retrofit options might include elevating structures and control buildings above design
flood levels, or relocating the station outside the flood zone. While NESC rules address vegetation
management, there is a lack of best management practices to guide the industry.
14.5.2.1. Implied or Stated Performance Levels for Design Hazard Level
As discussed in Section 14.3, the 90 % desired performance goals may already be met by the anticipated
performance of some electric utilities. For routine hazard events, most consumers of electricity and fuel
expect restoration within minutes or hours, not days.
Some existing utility infrastructure is up to 30 years in age, and most infrastructure systems 10 years or
newer are highly dependent on communications and control networks to operate effectively in adverse
conditions. This is especially true for those systems with some level of automation that permit automatic
or remote controlled circuit switching, sectionalizing, and reconfiguration. The availability and
operational state of field assets is also directly impacted by the availability of communications equipment.
There are multiple failure modes for communications and control equipment. One that is addressed by
codes and standards for new construction is the ability of electronic equipment to operate correctly in
harsh environmental conditions. Early implementations of network gear in substations were based on
consumer gear that had very low tolerance for temperature, humidity, shock, vibration, and the
electromagnetic environment. Even first generation industrial quality gear intended for utility applications
did not consider the environment found in substation and feeder applications. New standards, such IEC
61850-3 [IEC 2013] and IEEE 1613 [IEEE 2009], address some of these issues. The IEC standard that is
used around the world, but especially in Europe, has good environmental (temperature, shock, and
vibration) guidelines, but the equivalent IEEE standard used primarily in North America does not. In
North America there is presently no code or regulation that requires communications and control
equipment to comply with any standard, and best practices are still emerging. Standards defined for
communication facilities, as described in Chapter 15, do not apply to other industries or utilities who may
implement or utilize similar equipment to support the functioning of their business. These systems may be
vulnerable to communication and control failures until they are updated or replaced.
14.5.2.2. Recovery Levels
When events do occur and recovery efforts are required, the priorities and restoration efforts should
address emergency-related societal needs first and progress through a tiered response. The example
performance goals table lists the following tiers: critical facilities, emergency housing, housing and
neighborhoods including essential services, and then the systematic restoration of the community at large.
Factors that may affect time to recovery of function are listed below:

Community Resilience Planning Guide for Buildings and Infrastructure Systems - Volume II
Energy Systems
155
Emergency Facilities and Services Restoration. When planning for recovery of service, consider
communication infrastructure that links critical emergency resources (wire line communications,
cellular radio, and third party managed radio systems). Technologies and systems that address
core emergency services should be properly planned, tested, maintained, and restored first.
Critical Rights of Way and Infrastructure Restoration. Recovery of systems functions depends
on the ability to effectively dispatch and manage road and right of way clearing crews, electric
repair crews, and other non-emergency yet vital restoration related organizations and services.
Emergency power may be needed for utility crew dispatch centers, key city buildings such as city
hall, public works crew facilities.
Community Restoration. Full restoration can require days, weeks, or even months depending on
the type and level of hazard event. This aspect of restoration may be unplanned if the extent of
damage has not been previously experienced. This element should be carefully prioritized and
integrated into the plan for community resilience.
Mitigation Projects or Resiliency Efforts. Mitigation projects may constructed during recovery to
improve energy system performance for future events, and may employ technologies such as
backup generation, renewable energy, or microgrids.
14.6. Strategies for Implementation of Plans for Community Resilience
The objectives of this section are to provide guidance on how a community should work through the
process of defining solutions to address the gaps in desired energy system performance following a
hazard event.
14.6.1. Available Guidance
Energy assurance is a relatively new concept for energy system. Energy assurance addresses systems
planning for normal operations and for effects from all hazards. It addresses energy delivery and
reliability and the effects of aging infrastructure and effects of all hazards on the system. An energy
assurance plan has elements similar to the Guide‘s six-step planning process, although it does not focus
on community performance goals as the organizing concept for design and recovery plans.
Energy assurance focuses on assisting local governments to prepare for, respond to, recover from, and
mitigate against potential emergencies that impact energy systems while minimizing economic loss and
protecting public health and safety. For the purposes of this Guide, energy assurance is about:
Ensuring key assets are functional when needed
Fostering public-private partnerships before incidents happen
Gaining awareness of energy dependencies
Identifying actions and projects to move toward increased energy reliability and resilience
Examples of how energy assurance has been applied can be found in the DOE‘s Energy Assurance
program [DOE 2015], The NASEO State Energy Assurance Guidelines [NASEO 2009], and the
California Local Energy Assurance Planning (CaLEAP) process http://www.caleap.org/ [CaLEAP 2015].
Energy assurance is about assuring that essential services are maintained in the event of an energy
disruption. Key steps include:
Identify the key assets of the essential services in the community and determine their
vulnerabilities

Community Resilience Planning Guide for Buildings and Infrastructure Systems - Volume II
Energy Systems
156
Build relationships and partnerships to clarify roles and responsibilities prior to events
Gain awareness and understanding of energy dependencies on other systems
With a good understanding of the key assets and dependencies, a local government, working with the
local energy provider, can identify actions and projects to become more energy resilient.
Because resilience is new, there is a significant need for tools to help both the community and the
industry assess resilience. The flowchart (Figure 14-3), developed by the CaLEAP program, illustrates the
overall approach for developing such a plan including forming an EAP team. Notice that this flowchart is
similar to the Guide‘s six-step planning process (Volume I) to achieve community resilience, but there are
some differences that will need to be addressed for compatibility with the six-step process being used by
all building and infrastructure systems in a community.
Figure 14-3: Energy assurance flowchart developed by CaLEAP [Source: CaLEAP 2015[
The length of time to restore electric service is a traditional metric of grid reliability. Similarly, the grid‘s
ability to ride through minor disturbances or avoid cascading outages is already considered within
existing grid reliability metrics. While these metrics exist – such as System Average Interruption Duration
Index (SAIDI), the Customer Average Interruption Duration Index (CAIDI), the System Average
Interruption Frequency Index (SAIFI), the Customer Average Interruption Frequency Index (CAIFI), and
others – most reliability metrics are for normal operating conditions. The standards that define these
indices specifically exclude major storms and events.
Also, the metrics do not differentiate between customer types (residential, commercial, industrial) nor
their relationship to critical functions (hospitals, police and fire facility, etc.). Communities and utility
providers can use performance goals tables, such as those in Section 14.3, to set goals for recovery times
during hazard events. However, these tables can also be used to determine the anticipated performance of
the infrastructure (i.e., the ―X‖ in the performance goals tables) for a given event. The community or
utility can then define the resilience gaps (i.e., the difference between the 90 % and X in the performance
goals tables) and prioritize solutions for enhancing the resilience of the energy infrastructure system.

Community Resilience Planning Guide for Buildings and Infrastructure Systems - Volume II
Energy Systems
157
14.6.2. Solutions for Future Construction
In general, when identifying equipment, and other components within the energy system, one of the
qualifying criteria should focus on resiliency. When evaluating different vendors and system components,
check their track records and references, and collaborate with others.
Construction Solutions. There are several construction solutions that may help improve the resilience of
energy infrastructure from hazard events include:
Strengthen and reinforce critical lines leading to population centers or other critical loads. For
instance, adding reinforcements to lines that serve a hospital or fire station makes them more
resilient to wind, ice, and branch loads.
Establish pole depth standards based on local soil conditions for pole heights. Ensure poles are
planted to the correct depth and that the foundation will support the loads.
Determine capacity of poles for and do not overload poles with additional equipment.
Consider using NESC [IEEE 2012] Grade B construction standards for critical distribution lines.
This grade of construction is commonly used in the utility industry and utility surveys show that
using Grade B is a popular and effective construction solution.
Consider underground placement of lines and system components. There are definite pros and
cons to underground placement. Underground systems are less vulnerable to weather, fire, and
human-caused hazards, but not to flood or earthquake hazards. They are more expensive to
construct and repair. For an event like Hurricane Sandy or the ice storms of 2012 and 2013,
underground cables would have dramatically reduced the amount of damage and restoration
times. For an earthquake in California, it could have the opposite effect in some locations.
Consider covered aerial medium-voltage (CAMV) systems. This hardware attaches to poles and
overhead wires to add strength and stability to the wires. The added stability makes the
distribution network more resilient to contact with trees and debris, and is especially useful in
narrow rights of way with large concentrations of trees.
Provide redundant service to critical buildings, using local generation or an independent line.
Other potential solutions include various pole line configurations that can help minimize
restoration efforts.
Consider elevating overhead equipment to reduce damage by wildfire.
In fire prone areas, consider using concrete, heavy steel, or other non-flammable and warp
resistant materials and structures for overhead conductors and equipment. This improves
performance of the poles and lines but they may need to be located further from the road rights-
of-way to reduce the likelihood of automobile impacts.
Administrative Solutions. Some possible administrative solutions for improving the resilience of energy
infrastructure from hazard events include the following:
Trim trees and other potential obstructions within the right of way. Comply with the NESC, FAC,
and EPRI rules and guidance on vegetation management.
Use submersible equipment in underground substations.
Minimize the number of splices in conductors and in ducts that carry the splices. Where possible,
position splices in conductors and ducts as far away from water mains as possible and in easily
accessible locations. Note: in high volume rain areas, storm drains can be as significant an issue
as water mains.

Community Resilience Planning Guide for Buildings and Infrastructure Systems - Volume II
Energy Systems
158
Consider heavy wall insulation cables (e.g., type TC cables and type MC cables). Heavy wall
insulation cables are more resistant to physical damage and moisture and provide better resilience
to severe weather conditions.
Electrical Infrastructure in Buildings. Specific to energy infrastructure in buildings, the National
Institute of Building Sciences [NIBS 2015] recommends that during the facility design or retrofit process,
building projects have a comprehensive, integrated perspective that seeks to minimize the amount of
energy that must be supplied and provides control methods that can more readily allocate the available
supply as appropriate for a buildings required mode of operation at any given point in time. The CaLEAP
[2015] organization identified additional recommendations for building and retail owners to facilitate a
high degree of local, intelligent energy management that can take advantage of distributed resources,
including:
Ensuring emergency, life safety, high priority, and general building circuits are well segregated in
building wiring design and breaker panel layouts
Ensuring building automation systems take advantage of segregated load grouping mentioned
above, are standards based (e.g. BACNet), and are capable of accepting utility load control
signals (e.g. OpenADR)
Key community facilities necessary to ensure socio-economic continuity without internal backup
generation capability are configured to permit easy, safe connection to external mobile generation
(e.g. through standardized connectors at the outside service entrance)
14.6.3. Solutions for Existing Construction
Most ideas for new construction may also apply to existing construction solutions. However, in new
construction, there is a larger set of opportunities for energy efficiency and resilience.
In general, when replacing equipment and other components within the energy system, each component
should be considered and, where better choices are available, communities and owner operators should
make improvements when practical.
Construction Solutions. The following solution may be useful to enhance the resilience of existing
infrastructure systems:
Design retrofits for design hazard events by applying design and construction standards that exist
but may not have been adopted within the utility industry
Strengthen and reinforce critical lines leading to population centers or other critical loads
Perform loading assessment to ensure that the pole is not over-stressed when adding new
equipment to poles
Consider covered aerial medium-voltage (CAMV) systems
Consider replacing overhead lines with underground systems
Consider elevating overhead equipment to reduce damage by wildfire
Provide redundant service to critical buildings, using local generation or an independent line
Make sure the soil types and insulation properties of the soils are known when burying a line.
Perform regular pole inspections for excessive loads, corrosion or decay, and pole and foundation
stability. If there is erosion around the footing or the pole is leaning, add guy wires or
reset/replace the pole

Community Resilience Planning Guide for Buildings and Infrastructure Systems - Volume II
Energy Systems
159
Consider heavy wall insulation cables, type TC cables, and type MC cables. Proper grounding
and inspections of grounding equipment greatly minimizes the possibility for transformer fires
from lightning
Install and maintain lightning arrestors or other equipment in the distribution grid to minimize the
area that a single lightning strike can affect
Retrofit existing construction, on the customer side of the meter, with external generation support
connectors. If an existing facility is considering adding any form of self-generation systems,
consider upgrading building circuits at the same time to segregate load types
Consider using the USACE Emergency Power Facility Assessment Tool (EPFAT), which allows
public entities to input generator and bill of material requirements to expedite temporary power
installation support services
Administrative Solutions. In many cases, improving the resilience of existing infrastructure may be more
easily accomplished through administrative solutions. Some possible administrative solutions for
improving the resilience of existing energy infrastructure include:
Trim trees and other potential obstructions within the right of way
Perform regular line inspections
Inspect underground splices and equipment on a scheduled basis to make sure seals and the
waterproof capability of the connections are intact
Have an adequate stock of spares (poles, transformers, line, etc.) on hand for fire prone areas, and
do not use them for routine work.
If possible, cut off power before a wildfire reaches the line. This allows equipment and lines time
to cool and may save the system from further damage. If people have been evacuated, turn off
power before the fire reaches the area and allow equipment to cool. This proactive action can also
prevent fires starting if a power line falls or equipment overheats.
Establish mutual aid agreements. The Edison Electric Institute (EEI) and its members have
implemented a voluntary mutual assistance program for Investor Owned Utilities (IOUs) that
allows utilities to request and coordinate support from others in their region not affected by a
major event [EEI 2014].
The American Public Power Association (APPA) has a similar mutual aid process to facilitate regional
coordination. Like EEI, the APPA has defined procedures for coordinating mutual aid [APPA 2015].
Rural Electric Cooperatives are also included in this mutual aid process through an agreement between
the APPA and the National Rural Electric Cooperative Association [NRECA 2015].
Although processes exist among utilities to provide mutual aid, the relationships between local
communities and other agencies involved in recovery are not always as well defined. Local resilience
planning groups can coordinate with their local utility and become aware of the mutual aid processes in
their region so that realistic estimates of resources and restoration time can be made.
14.7. References
American Lifelines Alliance (ALA 2005) Draft Guideline for Assessing the Performance of Oil and
Natural Gas Pipeline Systems in Natural Hazard and Human Threat Events, American Lifelines
Alliance(ALA), Washington, DC,
http://www.americanlifelinesalliance.com/pdf/PipeguideFinalPosted061705.pdf.

Community Resilience Planning Guide for Buildings and Infrastructure Systems - Volume II
Energy Systems
160
American Lifelines Alliance (ALA 2006) Power Systems, Water, Transportation and Communications
Lifeline Interdependencies, American Lifelines Alliance (ALA) draft report to the Federal Emergency
Management Agency (FEMA) and the National Institute of Building Sciences (NIBS), Washington, DC,
March,
http://www.cimap.vt.edu/sites/www.cimap.vt.edu/files/docs/ALA%20Lifeline%20Report%20Final%20D
raft%20030606.pdf.
American National Standards Institute (ANSI 2008) ANSI O5.1: Wood Poles – Specifications and
Dimensions, American National Standards Institute (ANSI), New York, NY.
American National Standards Institute (ANSI 2013) ANSI C29.1: Test Methods for Electrical Power
Insulators, American National Standards Institute (ANSI) National Electric Manufacturers Association
(NEMA), Rosslyn, VA.
American Public Power Association (APPA 2015) Public Power‘s Mutual Aid Network: Electric Utilities
Helping One another for Disaster Response and Recovery, Arlington, VA, http://appanet.files.cms-
plus.com/PDFs/Mutual%20Aid%20Playbook%20Executive%20Summary.pdf. Viewed April 20, 2015.
American Society of Civil Engineers (ASCE 1998) ASCE 7-98: Minimum Design Loads for Buildings
and Other Structures, American Society of Civil Engineers (ASCE), Reston, VA.
American Society of Civil Engineers (ASCE 2005) ASCE 7-05: Minimum Design Loads for Buildings
and Other Structures, American Society of Civil Engineers (ASCE), Reston, VA.
American Society of Civil Engineers (ASCE 2008) ASCE Manual 113: Substation Structure Design
Guide, American Society of Civil Engineers (ASCE), Reston, VA.
American Society of Civil Engineers (ASCE 2010) ASCE 7-10: Minimum Design Loads for Buildings
and Other Structures, Second Edition, American Society of Civil Engineers (ASCE) Structural
Engineering Institute (SEI), Reston, VA.
American Society of Civil Engineers (ASCE 2013) 2013 Report Card for America's Infrastructure,
American Society of Civil Engineers (ASCE), Reston, VA, http://www.infrastructurereportcard.org/.
Andrews, E.; M.A. Lazurus; and J. Aliberti (2013) Community Resilience: Reliable Back-up Power, Saint
Louis University Center for Sustainability, 2013 SDRC.
https://www.slu.edu/Documents/sustainability/SDRC/2013 SDRC
Presentations/2013_SDRC_Aliberti_John.pptx.
California Local Energy Assurance Planning (CaLEAP 2015) http://www.caleap.org/. Viewed April 19,
2015.
Clark, Tony and Robin Z. Meidhof (2013) ―Ensuring Reliability and a Fair Energy Marketplace,‖ Energy
Innovation Series and Sixth Annual Schultz Lecture, University of Colorado, Boulder, CO, October 22,
2013, https://www.ferc.gov/media/statements-speeches/clark/2014/07-02-14-clark.pdf.
Department of Energy (DOE 2013) Comparing the Impacts of Northeast Hurricanes on Energy
Infrastructure, United States Department of Energy (DOE), Washington, DC.
Department of Energy (DOE 2015) Energy Assurance, United States Department of Energy (DOE),
Washington, DC, http://energy.gov/oe/services/energy-assurance. Viewed April 19, 2015.
Edison Electrical Institute (EEI 2014) Understanding the Electric Power Industry‘s Response and
Restoration Process, Edison Electrical Institute (EEI), Washington, DC.
Edison Electrical Institute (EEI 2015) Transmission Projects: At a Glance, Edison Electrical Institute
(EEI), Washington, DC.

Community Resilience Planning Guide for Buildings and Infrastructure Systems - Volume II
Energy Systems
161
Electric Power Research Institute (EPRI 2013) Enhancing Distribution Resiliency: Opportunities for
Applying Innovative Technologies, Electric Power Research Institute (EPRI), Palo Alto, CA.
Energy Policy Act (EPAct 2005) Energy Policy Act of 2005, 109th Congress, Washington, DC.
Executive Office of the President (EOP 2013) Economic Benefits of Increasing Electric Grid Resilience
to Weather Outages, Executive Office of the President, Washington, DC.
Federal Energy Regulatory Commission (FERC 2011) Order 1000: Transmission Planning and Cost
Allocation by Transmission Owning and Operating Public Utilities, Federal Energy Regulatory
Commission (FERC), Washington, DC, http://www.ferc.gov/industries/electric/indus-act/trans-plan.asp.
Federal Energy Regulatory Commission (FERC 2013) Tree Trimming & Vegetation Management,
Federal Energy Regulatory Commission (FERC), Washington, DC,
http://www.ferc.gov/industries/electric/indus-act/reliability/vegetation-mgt.asp. Viewed April 20, 2015.
FERC.
Federal Energy Regulatory Commission (FERC 2015) FERC - Federal Energy Regulatory Commission:
What FERC Does, Federal Energy Regulatory Commission (FERC), Washington, DC,
http://www.ferc.gov/about/ferc-does.asp. Viewed April 8, 2015.
Federal Energy Regulatory Commission and North American Electric Reliability Corporation
(FERC/NERC 2011) Report on Outages and Curtailments During the Southwest Cold Weather Event of
February 1-5, 2011: Causes and Recommendations, Federal Energy Regulatory Commission (FERC) and
North American Electric Reliability Corporation (NERC), Washington, DC,
https://www.ferc.gov/legal/staff-reports/08-16-11-report.pdf.
Federal Power Act (1920) Federal Power Act: The Act of June 10, 1920, Chapter 285,
https://legcounsel.house.gov/Comps/Federal%20Power%20Act.pdf.
Florida Public Service Commission (2007) Report to the Legislature on Enhancing the Reliability of
Florida‘s Distribution and Transmission Grids During Extreme Weather, Florida Public Service
Commission, FL, http://www.psc.state.fl.us/publications/pdf/electricgas/stormhardening2007.pdf.
Fuel Cell and Hydrogen Energy Association (2014) ―Resiliency of Stationary Fuel Cells and the Natural
Gas Grid,‖ WBDG: a Program of the National Institute of Building Sciences, Washington, DC.
Hampson, A.; T. Bourgeois; G. Dillingham; and I. Panzarella (2013) Combined Heat and Power:
Enabling Resilient Energy Infrastructure for Critical Facilities, ONRL/TM-2013/100, Oak Ridge
National Laboratory (ORNL).
Institute of Electrical and Electronics Engineers (IEEE 1995) Recommended Practice for Emergency and
Standby Power Systems for Industrial and Commercial Applications, IEEE Std, 446-1995.
Institute of Electrical and Electronics Engineers (IEEE 2002) National Electrical Safety Code, IEEE, New
York, NY.
Institute of Electrical and Electronics Engineers (IEEE 2009) IEEE Standards 1613, Standard
Environmental and Testing Requirements for Communications Networking Devices Installed in Electric
Power Substations, Institute of Electrical and Electronics Engineers (IEEE), New York, NY.
Institute of Electrical and Electronics Engineers (IEEE 2012) National Electrical Safety Code, Institute of
Electrical and Electronics Engineers (IEEE), New York, NY.
Institute of Electrical and Electronics Engineers (IEEE 2015) History of the National Electrical Safety
Code ANSI C2, http://standards.ieee.org/about/nesc/100/. Viewed January 26, 2015.
International Code Council (ICC 2014) ICC 2014: Standard for the Design and Construction of Storm
Shelters, International Code Council (ICC), Washington, DC.

Community Resilience Planning Guide for Buildings and Infrastructure Systems - Volume II
Energy Systems
162
International Electrotechnical Commission (IEC 2013) Communication Networks and Systems in
Substations – Part 3: General Requirements, International Electrotechnical Commission. Geneva,
Switzerland.
Keogh, Miles and Cody, Christina (2013) Resilience in Regulated Utilities, National Association of
Regulatory Utility Commissioners (NARUC) Grants and Research Department, with support from the
United States Department of Energy (DOE), November,
http://www.naruc.org/Grants/Documents/Resilience%20in%20Regulated%20Utilities%20ONLINE%201
1_12.pdf.
McDonough, P. W (2013) Post-Earthquake Checklist for Natural Gas Systems, American Society of
Civil Engineers.
Nadeau, J. P (2007) Improving the Resiliency of the Natural Gas Supply and Distribution Network, Naval
Postgraduate School, Monterey, CA, March, http://www.dtic.mil/dtic/tr/fulltext/u2/a467387.pdf.
National Association of State Energy Officials (NASEO 2009) State Energy Assurance Guidelines,
Version 3.1, National Association of State Energy Officials (NASEO), Arlington, VA.
National Fire Protection Association (NFPA 2013a) NFPA 110: Standard for Emergency and Standby
Power Systems, National Fire Protection Association (NFPA), Quincy, MA.
National Fire Protection Association (NFPA 2013b) NFPA 111: Standard on Stored Electrical Energy
Emergency and Standby Power Systems, National Fire Protection Association (NFPA), Quincy, MA.
National Fire Protection Association (NFPA 2014) NFPA 70: The National Electrical Code, National
Fire Protection Association (NFPA), Quincy, MA.
National Institute of Building Sciences (NIBS 2015) ―Optimize Energy Use Whole Building Design
Guide,‖ WBDG: a Program of the National Institute of Building Sciences, National Institute of Building
Sciences (NIBS), Washington, DC, http://www.wbdg.org/design/minimize_consumption.php. Viewed
April 18, 2015.
National Institute of Standards and Technology (NIST 2014) NIST Special Publication 1108R2: NIST
Framework and Roadmap for Smart Grid Interoperability Standards, Release 3.0, National Institute of
Standards and Technology (NIST), Gaithersburg, MD.
National Rural Electric Cooperative Association (NRECA 2015) APPA/NRECA Mutual Aid Agreement,
National Rural Electric Cooperative Association (NRECA), Arlington, VA,
http://www.mpua.org/_lib/files/appa_fema_mutual_aid_agrmt.pdf. Viewed April 20, 2015.
New Jersey Office of Emergency Management (NJOEM 2014) Retail Fuel Station Energy Resiliency
Program, New Jersey Office of Emergency Management, http://www.ready.nj.gov/programs/retail-fuel-
station.html.
NextEra Energy, Inc. (2013) FPL Inspects One-Millionth Pole as Part of Storm and Reliability
Preparations, NextEra Energy, Inc., FL.
North American Electric Reliability Council (NERC 2015a) ―Vegetation Management: Vegetation
Management Grow-In Data,‖ NERC: North American Electric Reliability Corporation,
http://www.nerc.com/pa/RAPA/PA/Pages/VegetationManagement.aspx. Viewed April 20.
North American Electric Reliability Council (NERC 2015b) NERC: North American Electric Reliability
Corporation, http://www.nerc.com. Viewed April 8, 2015.
Office of Governor Martin O‘Malley (2012) Weathering the Storm: Report of the Grid Resiliency Task
Force, Office of Governor Martin O‘Malley,

Community Resilience Planning Guide for Buildings and Infrastructure Systems - Volume II
Energy Systems
163
Oregon Seismic Safety Policy Advisory Commission (OSSPAC 2013) The Oregon Resilience Plan,
Salem, Oregon.
Pentland, William (2013) Rethinking Grid Resilience: Are we Gold Plating the Electric Grid? October
11, http:/www.forbes.com/sites/williampentland/2013/10/18/rethinking-grid-resilience-are-we-gold-
plating-the-electric-grid/.
PPD-21 (2013) Presidential Policy Directive/PPD-21, The White House, February 12, 2013,
http://www.whitehouse.gov/the-press-office/2013/02/12/presidential-policy-directive-critical-
infrastructure-security-and-resil.
PPD-8 (2011) Presidential Policy Directive, PPD-8 – National Preparedness, The White House, March
30, 2011, http://www.dhs.gov/presidential-policy-directive-8-national-preparedness.
Public Service Enterprise Group (PSEG 2014) Resiliency Matters for an Energy Strong Future, New
Jersey, https://www.pseg.com/info/media/advertorial/pdf/2013/resiliency.pdf. Viewed April 18, 2015.
San Diego Union-Tribune (SDUT 2007) Power Lines Cited as Cause of Largest Wildfires.
http://legacy.utsandiego.com/news/metro/20071116-1750-bn16cause2.html. Viewed July 27, 2013.
Smart Grid Interoperability Panel (SGIP 2015) Catalog of Standards Quick Table,
http://www.sgip.org/Catalog-of-Standards-Quick-Table.
San Francisco Planning and Urban Research Association (SPUR 2009) The Resilient City: What San
Francisco Needs from its Seismic Mitigation Policies, San Francisco Planning and Urban Research
Association (SPUR), San Francisco, CA.
United States Army Corps of Engineers (USACE 2015) Welcome to Emergency Power Facility
Assessment Tool, United States Army Corps of Engineers (USACE) Fort Worth District,
http://epfat.swf.usace.army.mil/. Viewed April 18, 2015)
United States Department of Agriculture (USDA 2003) Rural Utilities Services Bulletin 1724E-154:
Distribution Conductor Clearances and Span Limitations, United States Department of Agriculture
(USDA), Washington, DC.
United States Department of Agriculture (USDA 2014) Rural Utilities Service Bulletin 1724E-150:
Unguyed Distribution Poles – Strength Requirements, United States Department of Agriculture (USDA),
Washington, DC.
United States Energy Information Administration (EIA 2015) Drivers of U.S. Household Energy
Consumption, 1980-2009, United States Department of Energy (DOE), Washington, DC.
United States Energy Information Administration (USEIA 2009) Residential Energy Consumption
Survey: Space Heating by Type of Housing Unit (HC6.1), United States Energy Information
Administration (USEIA), http://www.eia.gov/consumption/residential/data/ 2009/index.cfm#undefined.
United States Energy Information Administration (USEIA 2014a) High cost, oil-fired generation crates
potential for shift in Hawaiian electric sources, United States Energy Information Administration
(USEIA), http://www.eia.gov/todayinenergy/detail.cfm?id=15091.
United States Energy Information Administration (USEIA 2014b) U.S. Percent Utilization of Refinery
Operable Capacity, United States Energy Information Administration (USEIA),
http://www.eia.gov/dnav/pet/hist/LeafHandler.ashx?n=PET&s=MOPUEUS2&f=A.

Community Resilience Planning Guide for Buildings and Infrastructure Systems - Volume II
Communication Systems
164
15. Communication Systems
Communication Systems Executive Summary
Presidential Policy Directive-21 [2013] identifies ―energy and communications systems as uniquely
critical due to the enabling functions they provide across all critical infrastructure sectors.‖
Communications systems are continually evolving with rapid changes in technology, increased demand
and consumer expectations, and increased dependencies on other infrastructure systems, most notably
energy systems.
Various means of two-way communication (wireline telephone, cellular/mobile systems, internet
including VoIP) and one-way communication (cable, broadcast) are used daily and are often relied upon
in the aftermath of a hazard event. During and after hazard events, the ability to contact emergency
responders via 9-1-1 is critical. However, communication systems have experienced extended service
disruptions due to failure of the physical infrastructure components supporting these services, or due to
increased demand that exceeds the capacity of the infrastructure system.
Communications infrastructure systems can fail in multiple ways, as was demonstrated by the events of
Hurricane Sandy, the 2012 derecho in the National Capital Region, and the 2009 Kentucky ice storm.
Physical damage, flooding or toppling of critical equipment, along with failure of other infrastructure
systems (e.g., electric power, water, transportation) can result in cascading failures of communications
infrastructure service disruptions. Ice, fallen trees, and debris can make transportation routes temporarily
impassible, slowing repair crews from accessing inoperable cell sites and other components. Providing
adequate standby power when external electric power is disrupted is one of the biggest challenges faced
by service providers. Communities can work with service providers and other stakeholders to prioritize
where service is needed most before a hazard event occurs.
Communities should use this Guide‘s six-step process to form a team of stakeholders that can establish
and achieve performance goals for the communications infrastructure as part of a broader community
resilience planning effort. Like the planning efforts for other infrastructure systems, stakeholders should
include each service provider serving the community, local businesses, critical facility representatives,
customers, and representatives from industries on which communications systems depend.
This chapter supports the six-step resilience planning process by providing the following guidance to
communities and their stakeholders to consider: 1) potential vulnerabilities to communications
infrastructure, illustrated with examples of damage observed during past hazard events; 2) community
performance goals for communications infrastructure; 3) anticipated performance of existing
communications infrastructure and resilience gaps; and 4) mitigation and recovery solutions.
Performance goals can be set for any community, type of hazard event, and hazard level. Once desired
performance goals and anticipated system performance are determined, communities can work with their
stakeholders to identify, prioritize, and close resilience gaps. For example, central offices, internet
exchange points, and cell sites may be designed to resist hazards, or critical equipment may be located to
reduce vulnerability to hazards.
Communities can enhance public safety and communication for critical facilities with Governmental
Emergency Telecommunications Service and/or Wireless Priority Service to obtain priority access after a
hazard event when voice call user demand often exceeds capacity. Communities can also apply for the
FCC mandated Telecommunications Service Priority to receive service restoration priority treatment
when disruptions occur or to provide additional lines when needed. In the community resilience planning
process, communities should work with their stakeholders, particularly service providers, to determine
what mitigation and recovery strategies will be most effective so they can become more resilient and
achieve their performance goals.

Community Resilience Planning Guide for Buildings and Infrastructure Systems - Volume II
Communication Systems
165
15.1. Introduction
Communication systems are integral to how our society functions, including broad societal reliance on
mobile devices and the internet for communication. People use computers, smart phones, and tablets to
read news and to watch movies and television shows.
Communication systems play a critical role during and after a hazard event. The community‘s citizens
rely on communication systems (landline telephone, cellular/mobile systems, internet/VoIP, cable
television, and broadcast) to be informed and to contact loved ones, schools, employers, businesses,
health care providers, and emergency responders. In addition, government and other public agencies
disseminate information to the public through one-way communication systems (broadcast and cable).
Unfortunately, communications systems have failed in multiple ways in past hazard events. Physical
damage to infrastructure and critical equipment, and failure of dependent infrastructure systems (e.g.,
electric power and transportation) have caused service disruptions. Increased user demand of
communication services in the aftermath of hazard events can also result in service disruptions due to
exceeding capacity of the existing system.
To address the resilience of communications infrastructure, communities should use the Guide‘s six-step
process to form a team of stakeholders, including service providers, critical facilities representatives, local
businesses, and interdependent system representatives.
This chapter provides guidance to support the six-step resilience planning process on the following topics:
1) potential vulnerabilities to communications infrastructure with examples of damage observed during
past hazard events; 2) community performance goals for communications infrastructure; 3) anticipated
performance of existing communications infrastructure and resilience gaps; and 4) mitigation and
recovery solutions. Some solutions may include alternatives to existing communications methods that
allow temporary measures to enable service while more permanent solutions are undertaken.
An example of a performance goals table to be filled out by the community and its stakeholders is
presented in Table 15-1 (page 180). The example is used to illustrate the process by which a community
and its stakeholders can set performance goals, evaluate anticipated performance of their existing
communication infrastructure systems, identify resilience gaps, and prioritize upgrades to improve
resilience of the network. Though there are many options for improving resilience of the communications
infrastructure system, communities should work directly with service providers to identify their priorities
and determine the best solutions to achieve their performance goals.
15.1.1. Social Needs and System Performance Goals
As discussed in Chapter 10, the social needs of the community drive performance goals that are to be
defined by each community and its stakeholders. Social needs of the community include those of
individuals, businesses (both small/local and large/multi-national), industry, and government. For
example, the banking system needs internet for financial transactions, transferring documents between
businesses, and e-mail as a primary means of communication. When internet is not available, commerce
is directly affected and economic output is reduced.
Each community should define its performance goals in terms of the time it takes for its critical
infrastructure to be restored following a hazard event for three levels of event: routine, design, and
extreme, as defined in Chapter 4 (Volume I).
The community has short (0-3 days), intermediate (1-12 weeks), and long-term (4-36+ months) recovery
needs. Specific to communication systems, communities traditionally think about short term (0-3 days)
recovery needs in terms of emergency response and management goals, which include:
Relaying emergency and safety information to the public

Community Resilience Planning Guide for Buildings and Infrastructure Systems - Volume II
Communication Systems
166
Coordinating recovery plans among first responders and community leaders
Communication between civilians and emergency responders via 9-1-1
Communication between family members and loved ones to check on each other‘s safety
Continued operation of private emergency response networks that support community recovery
Although reaching family members is a high priority, communities may agree to focus their social needs
on critical facilities so family members can communicate with emergency responders via 9-1-1. However,
when addressing resilience, communities should also think about the longer term and improve
performance of the built environment wherever possible in preparation for the next hazard event.
Intermediate (1-12 weeks) and long-term (4-36+ months) communications infrastructure needs of
communities include:
The ability to communicate with employers, schools, and other aspects of individuals‘ daily lives
Re-establishing data and voice communication operations of businesses, banks, etc., to resume
commerce and serve clients
Restoring, retrofitting, and improving infrastructure components to avoid failing in the same way
during future events (i.e., implement changes to make infrastructure more resilient).
15.1.2. Availability, Reliability, and Resilience
Availability and reliability are terms often used by industry when referring to communications networks.
Availability refers to the amount or percentage of time a communications system is accessible for use.
The best communications networks have 99.999 percent availability, which is referred to as ―five 9‘s
availability‖ [CPNI 2006]. This indicates a communications network would be unavailable for only
approximately five minutes/year. Availability drives the communications industry and, thus, service
providers continually invest to improve their systems.
Reliability is the probability of successfully performing an intended function over a given time period
[Department of the Army 2007], which is measured as the frequency of downtime. Though reliability and
availability are related, they are different. A communications network may have a high availability with
multiple short downtimes or failure during a year. Network reliability over that one year time period is
reduced by disruptions in service (i.e., increased frequency of service failure).
Resilience includes the ability of a system to prepare for anticipated hazards, adapt to changing
conditions, and withstand and recover rapidly from disruptions. Recovery from a hazard event may
include plans to rebuild infrastructure to improve performance. Consequently, by enhancing the resilience
of communications infrastructure when rebuilding, network availability (amount of downtime) and
network reliability (frequency of downtime) can be improved.
Capacity of a communications network is the volume of calls, texts, and other transmissions that can be
reliably transmitted. After hazard events, there is an increased demand on communication systems [Jrad et
al. 2005 and 2006]. This level of demand can sometimes exceed the capacity of the system, resulting in
blocked calls or website pages loading very slowly or not at all.
Unfortunately, system capacity cannot be immediately increased for hazards. During or immediately after
hazard events, cellular phones or internet services, for example, may not function properly due to a higher
than normal volume of usage. This is especially true in densely populated areas, such as New York City,
or around emergency shelters or evacuation areas.
For example, the Superdome in New Orleans, LA was used as emergency shelter during Hurricane
Katrina. Although this was an exceptionally large facility used for sporting and entertainment events, such

Community Resilience Planning Guide for Buildings and Infrastructure Systems - Volume II
Communication Systems
167
facilities can be overwhelmed prior to, during, and after hazard events with an influx of civilians seeking
shelter. This results in increased demand on the wireless network serving the facility. Therefore,
emergency shelters may want to consider methods or means for providing supplemental communication
capacity during hazard events.
Alternate means of communication, such as two-way radios or satellite telephones, can be used by critical
facilities operators and emergency response personnel immediately after a hazard event. Many first
responders use these systems for this purpose.
Historically, network availability and reliability of service have been a primary focus for communications
providers. However, because of the increased multiuse functionality of mobile communications devices
(e.g., cellular phones, smart devices and tablets), communications network resilience also needs to
consider the capacity of both the data and voice networks. Additional network capacity is being added to
support service growth for high-volume functions of mobile devices such as sharing photographs and
watching videos or movies. Changes in consumer usage have challenged service providers‘ ability to
provide adequate network capacity during normal operating conditions, and demands after hazard events
often challenge system capacity. Some 9-1-1 centers have the ability to receive photo submissions, which
may require more capacity than a phone call. On the other hand, if 9-1-1 call centers can receive text
messages, this may be a useful alternative in an emergency as text transmissions have a reduced demand
on system capacity.
15.1.3. Dependencies
Chapter 11 provides information and examples on dependencies between and among infrastructure
systems in a community. Specific to the communication systems, communities should consider the
following dependencies on other infrastructure systems and dependencies of those systems on the
communication network:
Energy. The communication system is highly dependent on the energy system. For current technology
services, loss of electric power typically results in loss of communications services, such as wireline
(including internet), and cable communications, unless the service provider and end user have standby
power. If cell towers have standby power, cellular phones will likely function until their battery drains in
the absence of standby power (e.g., car charger, charging station) or until an external power source
becomes available.
It is not uncommon for distribution lines for communication and electric power services to be co-located
(e.g., wires traveling along utility poles). Failure of these systems can occur simultaneously due to
environmental factors such as a tree fall that severs both types of lines.
In the wake of a hazard event where external power is lost, communications infrastructure and end users
supporting critical services need sufficient redundant power sources to ensure continued functionality.
Power sources may be needed for terminal equipment connected to communications systems. Air
conditioning systems, de-watering pumps, power supplies, security systems, computer networking and
SCADA systems all need to remain operational. For example, air conditioning systems, which keep
critical equipment from overheating, are not typically connected to batteries. Critical communication
equipment may become overheated and shut down if standby power is not available [Kwasinski 2009].

Community Resilience Planning Guide for Buildings and Infrastructure Systems - Volume II
Communication Systems
168
Transportation. Roadways and other parts of the
transportation system needed during the recovery of
infrastructure systems often become impassible after
hazard events. Fallen trees and other debris resulting
from high wind events (e.g., hurricanes and
tornadoes), storm surge and flooding, and ice storms
(see Figure 15-1) can prevent or inhibit emergency
repair crews from reaching the areas with damaged
communications infrastructure. Refueling of standby
generators becomes more challenging when roads
are impassible. When communities declare a state of
emergency, the ability to transport equipment into
the affected areas for restoration is an important
consideration. Trip permitting, limiting weigh
station requirements, and working with neighboring
states not impacted by the hazard event can
contribute to an improved recovery time.
Transportation systems need communication
systems to dispatch repair crews and monitor repair
status during the recovery phase. Traffic signals and transportation hubs also rely on communications
systems. Traffic signals may use communication systems for timing and synchronization of green lights
to ensure safety and smooth flow of traffic. Transportation hubs may need to communicate schedules for
inbound and outbound passenger traffic before or after a hazard event.
Building/Facilities. Buildings and facilities – and their occupants – need communications systems to
function properly. Communication systems in buildings may be used to run elevators, security systems,
heating and lighting systems, sensors for lights, or other operational functions. Occupants rely on data
systems within the building and telephone, internet, and e-mail services.
In large urban centers, service providers often place antennas or cell towers on top of buildings. If the
building is damaged or collapses, the tower may fail or service may be interrupted.
Water and Wastewater. Water and wastewater utilities rely on SCADA communication systems to
operate their systems, and use radios or wireless systems to communicate with staff and emergency
workers in the recovery phase. If the communications network is down for an extended period of time
following a hazard event, the recovery process can take longer since coordination may be slowed.
Similar to energy, water may be needed for sprinklers and to cool systems in buildings that house critical
equipment for communications systems. Water and wastewater systems are also needed for staff to work
in those buildings that house critical communications equipment.
15.2. Communication Infrastructure
This section discusses communication system infrastructure for central offices (Section 15.2.1), wireline
(Section 15.2.1), wireless (Section 15.2.2), cable and broadcasting systems (Section 15.2.3), and
emergency communications (Section 15.2.4). Satellite communication is not addressed.
Each subsection reviews key components, potential vulnerabilities, and mitigation solutions used in the
past. Figure 15-2 presents an overview of the services and applications provided to customers by
communications systems, and the core and access networks which support these services. The national
communications infrastructure consists of many network components owned by different companies that
provide diverse services, applications, routes, and connectivity to communication systems. The core
network is the central part of a communication system that provides services to customers that are
Figure 15-1: Trees fallen across roads due to
ice storm in Kentucky slowed down recovery
efforts [Source: Kentucky Public Service
Commission 2009]
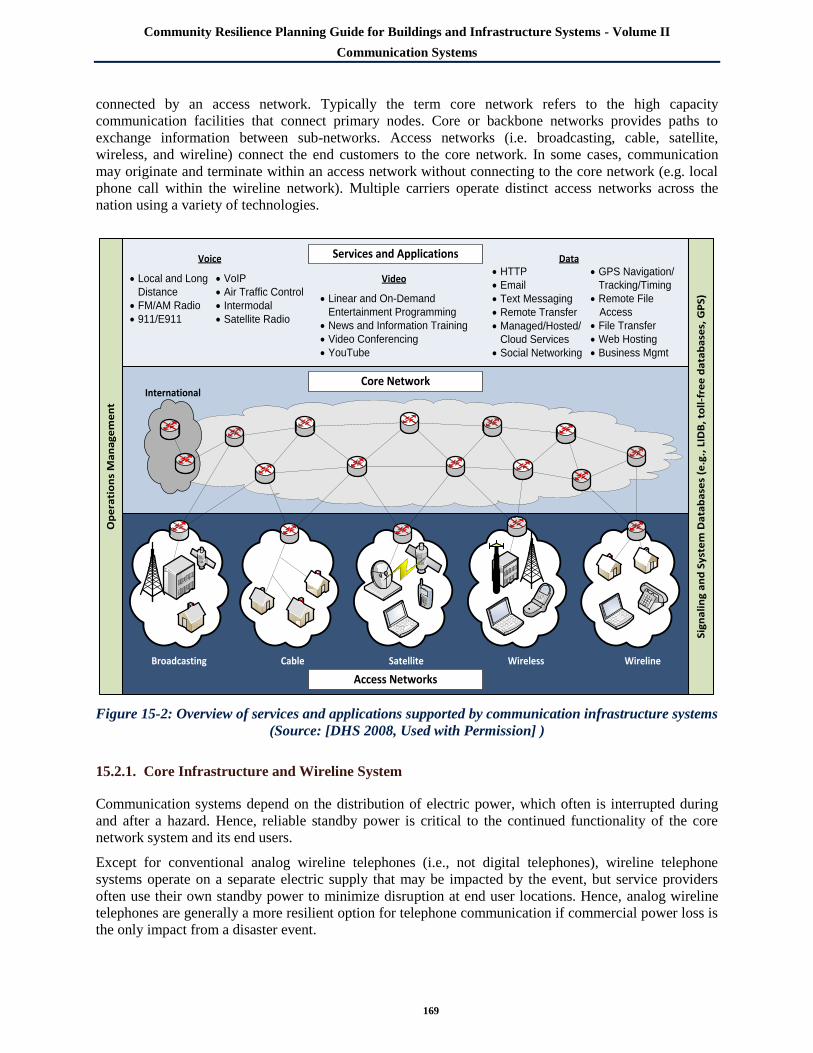
Community Resilience Planning Guide for Buildings and Infrastructure Systems - Volume II
Communication Systems
169
connected by an access network. Typically the term core network refers to the high capacity
communication facilities that connect primary nodes. Core or backbone networks provides paths to
exchange information between sub-networks. Access networks (i.e. broadcasting, cable, satellite,
wireless, and wireline) connect the end customers to the core network. In some cases, communication
may originate and terminate within an access network without connecting to the core network (e.g. local
phone call within the wireline network). Multiple carriers operate distinct access networks across the
nation using a variety of technologies.
Figure 15-2: Overview of services and applications supported by communication infrastructure systems
(Source: [DHS 2008, Used with Permission] )
15.2.1. Core Infrastructure and Wireline System
Communication systems depend on the distribution of electric power, which often is interrupted during
and after a hazard. Hence, reliable standby power is critical to the continued functionality of the core
network system and its end users.
Except for conventional analog wireline telephones (i.e., not digital telephones), wireline telephone
systems operate on a separate electric supply that may be impacted by the event, but service providers
often use their own standby power to minimize disruption at end user locations. Hence, analog wireline
telephones are generally a more resilient option for telephone communication if commercial power loss is
the only impact from a disaster event.
Op
era
tio
ns
Ma
na
ge
me
nt
International
Wireless WirelineSatelliteCable
Core Network
Access Networks
Local and Long
Distance
FM/AM Radio
911/E911
Linear and On-Demand
Entertainment Programming
News and Information Training
Video Conferencing
YouTube
HTTP
Text Messaging
Remote Transfer
Managed/Hosted/
Cloud Services
Social Networking
GPS Navigation/
Tracking/Timing
Remote File
Access
File Transfer
Web Hosting
Business Mgmt
Services and Applications Data
Video
Voice
Sig
na
lin
g a
nd
Sy
ste
m D
ata
ba
ses
(e.g
., L
IDB
, to
ll-f
ree
da
tab
ase
s, G
PS
)
VoIP
Air Traffic Control
Intermodal
Satellite Radio
Broadcasting
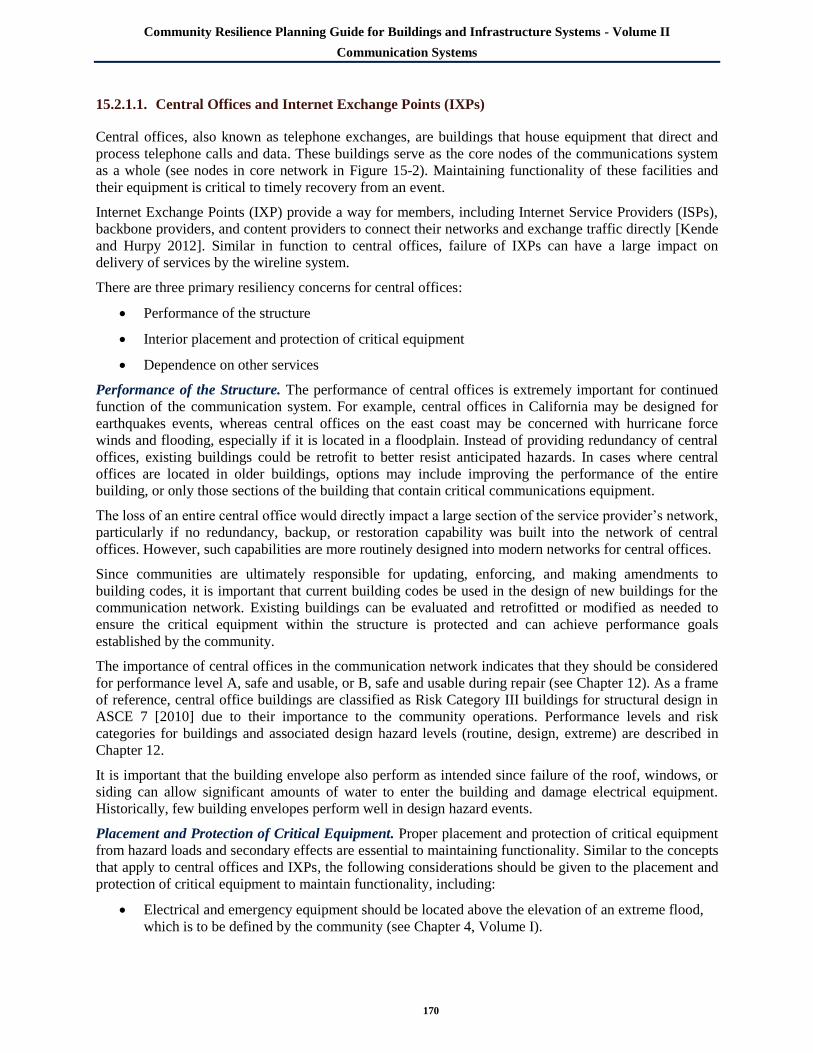
Community Resilience Planning Guide for Buildings and Infrastructure Systems - Volume II
Communication Systems
170
15.2.1.1. Central Offices and Internet Exchange Points (IXPs)
Central offices, also known as telephone exchanges, are buildings that house equipment that direct and
process telephone calls and data. These buildings serve as the core nodes of the communications system
as a whole (see nodes in core network in Figure 15-2). Maintaining functionality of these facilities and
their equipment is critical to timely recovery from an event.
Internet Exchange Points (IXP) provide a way for members, including Internet Service Providers (ISPs),
backbone providers, and content providers to connect their networks and exchange traffic directly [Kende
and Hurpy 2012]. Similar in function to central offices, failure of IXPs can have a large impact on
delivery of services by the wireline system.
There are three primary resiliency concerns for central offices:
Performance of the structure
Interior placement and protection of critical equipment
Dependence on other services
Performance of the Structure. The performance of central offices is extremely important for continued
function of the communication system. For example, central offices in California may be designed for
earthquakes events, whereas central offices on the east coast may be concerned with hurricane force
winds and flooding, especially if it is located in a floodplain. Instead of providing redundancy of central
offices, existing buildings could be retrofit to better resist anticipated hazards. In cases where central
offices are located in older buildings, options may include improving the performance of the entire
building, or only those sections of the building that contain critical communications equipment.
The loss of an entire central office would directly impact a large section of the service provider‘s network,
particularly if no redundancy, backup, or restoration capability was built into the network of central
offices. However, such capabilities are more routinely designed into modern networks for central offices.
Since communities are ultimately responsible for updating, enforcing, and making amendments to
building codes, it is important that current building codes be used in the design of new buildings for the
communication network. Existing buildings can be evaluated and retrofitted or modified as needed to
ensure the critical equipment within the structure is protected and can achieve performance goals
established by the community.
The importance of central offices in the communication network indicates that they should be considered
for performance level A, safe and usable, or B, safe and usable during repair (see Chapter 12). As a frame
of reference, central office buildings are classified as Risk Category III buildings for structural design in
ASCE 7 [2010] due to their importance to the community operations. Performance levels and risk
categories for buildings and associated design hazard levels (routine, design, extreme) are described in
Chapter 12.
It is important that the building envelope also perform as intended since failure of the roof, windows, or
siding can allow significant amounts of water to enter the building and damage electrical equipment.
Historically, few building envelopes perform well in design hazard events.
Placement and Protection of Critical Equipment. Proper placement and protection of critical equipment
from hazard loads and secondary effects are essential to maintaining functionality. Similar to the concepts
that apply to central offices and IXPs, the following considerations should be given to the placement and
protection of critical equipment to maintain functionality, including:
Electrical and emergency equipment should be located above the elevation of an extreme flood,
which is to be defined by the community (see Chapter 4, Volume I).

Community Resilience Planning Guide for Buildings and Infrastructure Systems - Volume II
Communication Systems
171
Critical equipment should be designed and mounted such that shaking does not cause equipment
failure or loss of function.
Critical equipment should be designed to resist extreme hazard loads anticipated to occur in the
community. Fire often follows other hazard events.
Where possible, redundancy and standby power for critical equipment should be provided.
Flooding produced by Hurricane Sandy exposed vulnerabilities in a central office. Generators and other
critical electrical equipment located in multiple basement levels were inundated and failed due to flooding
[FEMA 2013].
If hazard events might occur before remediation or
relocation plans can be implemented and standby
power systems are at risk of failure, a community
can develop more immediate plans for using
portable units to bring facilities back online until
electric power is restored. For example, Figure 15-3
shows a portable generator unit used to replace
basement generators that failed due to flooding after
Hurricane Sandy [FEMA 2013].
Dependencies between Services. Dependencies play
a big role in the overall performance of
communications infrastructure, as discussed in
Section 15.1.3 and Chapter 11.
Central offices and IXPs rely on electric power for
critical equipment, electrical switchgear, and HVAC
units. Although critical equipment is typically
connected to backup batteries or standby generators,
HVAC units may not be as they require substantial
power to operate. However, when there is a loss of electric power, critical communications equipment can
overheat and shut down as a result [Kwasinski 2009]. Water may also be needed to cool the electronic
components of HVAC and other conditioning systems.
The transportation system is needed to bring in generators and fuel, other supplies and equipment, and
workers to restore the functionality of system. Consideration for short- and long-term staging of mobile
support infrastructure such as generators, chillers, and trailered water, should be considered in the
planning process so that accommodations can be made before a hazard event occurs. These
accommodations may include facility connection and support requirements, such as fuel delivery.
15.2.1.2. Distribution Systems
Distribution systems have the following components and factors that affect continued functionality of the
communication system:
First/last mile
Type of cable (copper wires, coaxial cables, fiber optic cables), overhead vs. underground wires
Distributed loop carrier remote terminals (DLC RTs)
First/Last Mile. The ―first/last mile‖ refers to the final leg of delivering services, via network cables,
from a service provider to a customer. The use of the term ―first mile‖ indicates the first leg of cables
carrying data from the customer to the world (e.g., downloading websites or uploading data onto the
Figure 15-3: Large standby portable power unit
used when basement generators failed [Source:
FEMA 2013]

Community Resilience Planning Guide for Buildings and Infrastructure Systems - Volume II
Communication Systems
172
internet); whereas ―last mile‖ implies the last leg of network cables delivering service to a customer.
Although the name implies it is one mile long, this is not always the case, especially in rural communities
where it may be much longer [WV Broadband 2013]. The first/last mile is where most failures occur due
to the increased exposure to hazards as compared with individual buildings housing critical equipment for
the communication system.
Path diversity can be built into the system with nodes that connect to the network backbone. However, if
the first/last mile does not connect to the network backbone, it is vulnerable to single-point failures.
Furthermore, a node failure may also impact service. If a failed node is between a central office and the
building it services (i.e., first/last mile), those customers will be out of service.
There is likely to be less redundancy in the communication systems for rural communities. Historically,
rural communities have not used these communication services as frequently or relied as heavily on them
as suburban and urban communities. There have been two reasons for this:
In the past, feasible technology methods to send large amounts of data over a long distance had
not been available
The economic investment required for service providers to expand into remote communities has
been too high, resulting in a low benefit-cost ratio
As a result of the lack of redundancy in rural and remote communities, a failure of a single node may
result in an outage that affects most, or all, of the community. Therefore, it may not be economically
practical for rural communities to establish the same communications performance goals as urban
communities. As communications technology continues to develop, the level of redundancy (or path
diversity) in communications infrastructure delivering services to rural communities may improve. In the
case where the reason for the loss of telecommunication services was a direct result of a loss of external
power, however, restoration of services may be quicker for rural communities because, in densely
populated areas, power generation and distribution components tend to be packed together tightly and
other systems often need to be repaired before one is able access to the power supply.
Types of Cable for Last/First Mile. There are three types of cables typically used communication
distribution systems:
Copper Wires. Copper wires work by transmitting signals through electric pulses and carry the low power
needed to operate a traditional wireline telephone. The service provider that owns the wire provides the
power rather than an electric company. Therefore, the use of traditional analog (i.e., plain old telephone
service or POTS) wirelines that use copper wire lessens the dependency on external power [ALA 2006].
As a result, when there is loss of electric power, communication may still be possible through analog
wirelines (though this is not guaranteed) when the handset is physically connected to the telephone unit
(not a wireless portable phone). However, copper wire has some drawbacks, such as being susceptible to
saltwater flooding [City of New York 2013]. Service providers are retiring their copper wires due to high
cost of maintenance and their limited ability to support today‘s high capacity/speed services [Lower
Manhattan Telecommunications Users‘ Working Group 2002]. For example, Verizon reported its
operating expenses have been reduced by approximately 70 percent in areas where it installed its FiOS
(fiber optic) network and retired its copper plant in central offices [FTTH Council 2013].
Coaxial Cables. Coaxial cable is a more modern material that is commonly used for distribution systems.
It offers more resistance to water and is, therefore, not as susceptible to flood damage as copper wires.
After Hurricane Sandy, coaxial wires generally performed well with failures typically associated with loss
of electrical power to equipment to which they were connected [City of New York 2013]. Coaxial cable is
primarily used for cable television and internet services. This technology relies more heavily on power
provided by a power utility instead of the communications provider.

Community Resilience Planning Guide for Buildings and Infrastructure Systems - Volume II
Communication Systems
173
Fiber Optic Cables. Fiber optic cables are more resistant to water damage than either coaxial cable or
copper wire [City of New York 2013]. Fiber optic cables are now commonly used to bundle home
services (television, high-speed internet, and telephone) into one system. The use of fiber optic cables
allows for transmission of large amounts of data on a single fiber. Similar to coaxial cable, this
technology relies more heavily on power provided by a power utility instead of the communications
provider. Consequently, during and after a natural hazard event where power is interrupted, wireline
communications services using fiber optic cables would be lost without end user standby power
equipment [ALA 2006].
Overhead vs. Underground Wires. Distribution wire
can be strung overhead using utility poles, or run
underground. There are advantages and
disadvantages for both options. Overhead wire
failures are relatively easily located and repaired in
the wake of a natural hazard event. However, their
exposure makes them especially susceptible to high
wind (e.g., hurricanes, tornadoes, derechos), falling
debris, and ice hazards. In high wind events,
overhead wires may fail due to wind effects on the
cables, pole failures, or when trees fall on the cables.
Figure 15-4 shows an example of a failed cable
television (CATV) line due to wind effects during
Hurricane Katrina.
Widespread failure of the overhead lines is common during high wind events and ice storms. Some
improvement in performance can be achieved with trimming of trees and branches to reduce both the
likelihood of branches falling on lines and falling trees. The electric utility or service provider that owns
the poles performs the tree trimming, often sharing costs with other pole users. Chapter 13 discusses
challenges associated with tree removal and trimming.
Installing underground wires eliminates impacts from wind, ice, and tree fall, but underground wires may
be more susceptible to flood, earthquake damage, and liquefaction. Communities in parts of the United
States have debated converting their overhead wires to underground wires to eliminate the impacts from
wind, ice, and tree fall. However, converting overhead to underground wires can be both challenging and
expensive [City of Urbana Public Works Department 2001]. The main challenges and issues associated
with converting overhead wires to underground wires were noted in the City of Urbana‘s Public Works
Department Report [2001] as:
Shorter design life of the underground system
Lack of maintenance and repair accessibility of the underground facilities
Underground installation costs
Converting customer wiring to underground services
The cost associated with maintaining a dedicated tree trimming program is significantly less than
converting from overhead to underground wires because the effort includes removing the existing system,
lost cost resulting from not using the existing system for its design life, underground installation costs,
and rewiring each building to accommodate underground utilities [City of Urbana Public Works
Department 2001]. However, factors other than cost also impact whether overhead or underground wires
should be used, including permitting challenges, rights-of-way, and geology and terrain of the area. Since
communications service providers and electric power utilities share much infrastructure, their common
interests need to be considered to decide what is best for their distribution systems.
Figure 15-4: Failure of CATV cable due to
wind effects

Community Resilience Planning Guide for Buildings and Infrastructure Systems - Volume II
Communication Systems
174
Digital Loop Carrier Remote Terminals. Digital Loop Carrier Remote Terminals (DLC RTs) are nodes
in the communications network that allow service to be distributed beyond the range of a given central
office or exchange. Historically, copper wires provide service from a central office to customers within
approximately 4 kilometers (2.5 miles) of that central office [Kwasinski et al. 2006]. The use of fiber
optic cables and curbside DLC RTs can extend this range of service to approximately 10 km (6.2 miles)
[Kwasinski et al. 2006]. Therefore, DLC RTs provide a possible last mile solution for service providers to
reach customers farther from their existing central offices or exchanges without having to invest in the
construction of additional central offices.
DLC RTs can be used to rapidly replace smaller central offices or nodes, as was done after Hurricane
Katrina when less capacity after the event was needed [Kwasinski 2011]. This can help limit downtime of
the network, but appropriate planning is needed to ensure the DLC RTs do not fail after the next hazard
event. Perhaps the two most important things for service providers to consider when implementing DLC
RTs (and any communications infrastructure) are construction standards that limit vulnerability to hazards
and that address standby power.
A key lesson learned for DLC RTs from Hurricane
Katrina was that nodes should be elevated in storm
surge areas so they are not impacted in future hazard
events [Kwasinski 2011]. A utility implemented this
practice in New Orleans and the surrounding region
after Hurricane Katrina. Figure 15-5 shows a DLC
RT elevated on a platform. The building in the
background of the figure was a small central office in
which all equipment was damaged during Hurricane
Katrina, but never replaced [Kwasinski 2011]. When
the next set of storms (i.e., Hurricanes Gustav and
Ike) passed through the region in 2008, many of the
DLC RTs were not physically damaged by the storm
surge.
Like cell towers, DLC RTs need standby power to
function when external power is disrupted (see
Section 15.2.2.2). Standby power generators can
either be installed permanently, or deployed after a
disruption in service.
Whether generators are permanent or temporarily deployed, the main challenge is ensuring they have
enough fuel to provide a continuous power supply. This may include the need for refueling, depending on
the length of the commercial power outage. However, there are challenges associated with both options.
For example, waiting until after an event to deploy standby generators can be difficult for a number of
reasons, such as:
Mobilizing a large number of standby generators may require significant labor support and
logistics
Standby generators require refueling during extended outages, which is problematic if there is a
lack of access to fuel
Transportation routes to reach nodes may be impassible due to fallen trees or other debris
Permanent generators, in contrast, can be expensive to install and maintain for a large number of sites,
and require periodic testing and maintenance to ensure they function when needed. Permanent generators
should also be placed so that they are less vulnerable to the anticipated hazards (e.g., raised above
anticipated flood levels). As an example, installing permanent standby generators and elevating the DLC
Figure 15-5: Elevated DLC RT with natural
gas standby generator installed after Hurricane
Katrina

Community Resilience Planning Guide for Buildings and Infrastructure Systems - Volume II
Communication Systems
175
RTs after Hurricane Katrina helped reduce communications outages during the 2008 hurricanes that
struck the same region [Kwasinski 2011].
There are several fuel options for standby generators (see Chapter 13). Fuel may not be available
immediately after a hazard event, which may make refueling challenging if electric power outages extend
for a long period of time. Natural gas standby generators performed well during Hurricane Gustav
[Kwasinski 2011]. However, natural gas generators may not be the best option for use as standby
generators because natural gas distribution lines are often shut down prior to a hazard event to prevent fire
and explosions.
15.2.2. Wireless Systems
The wireless telephone system has similar vulnerabilities to the wireline system. In addition, other
possible failure points unique to the wireless network include the cell site (tower and electronics), Mobile
Switching Centers (MSCs), and backhaul (transport) facilities. Backhaul facilities carry traffic from cell
sites to MSCs. Loss of power can disable these facilities, resulting in failure of cell sites.
Figure 15-2 (page 169) shows a schematic of how the wireless phone network fits within the
communication network. At the base of a cell tower is cellular terminal equipment, network switching
and routing equipment, and an interconnection to a voice and data network (also known as Cell Site
Electronics) and standby power. Damage to any of the equipment at the base of the tower can impact the
cell site‘s ability to operate.
15.2.2.1. Mobile Switching Centers (MSCs)
MSCs, similar to central offices and IXPs, are key components of the wireless network switching system.
MSCs also serve an interfacing role with the wireline network so calls can be completed between the two
systems. As such, MSCs should be designed to meet the same protections and performance goals as
central offices and IXPs, including proper design of standby power.
15.2.2.2. Cell Towers
Cell tower function can be impacted by physical damage, loss of power, or loss of backhaul (i.e.,
transport) facilities. Cell towers may be considered for performance level A or B, as they typically
support essential emergency equipment or are located at a central emergency hub. Consequently, the
towers and equipment located at the base of the tower should not incur any damage during both routine
and design events.
Cell towers are typically designed to meet the criteria of TIA-222-G [2006]. Cell towers designed to meet
the criteria of TIA-222-G should perform well in a design wind, ice, or earthquake event. However, older
cell towers that have not been retrofitted or upgraded to meet TIA-222-G may not perform as well.
Specifically, cell towers in earthquake-prone regions may have been designed and built without guidance
on seismic effects.
Physical Damage. When using these design standards, design magnitude earthquakes, high wind events,
or flood events should not cause cell phone towers to collapse. This was not the case in Hurricane Katrina
(2005) where cell phone towers were reported to have failed [DHS 2006] after being impacted by flood-
borne debris (e.g., large boats, etc.), which had momentum that likely well beyond a typical design flood
impact. Failed towers can be replaced by temporary portable towers. Similarly, the January 2009
Kentucky ice storm had cell phone tower failures due to the combination of ice accumulation and winds
over 40 mph [Kentucky Public Service Commission 2009]. In the event that a tower incurs physical
damage, it can be replaced by a temporary portable tower.

Community Resilience Planning Guide for Buildings and Infrastructure Systems - Volume II
Communication Systems
176
Loss of External Power. Some cell towers are equipped with batteries designed to provide four to eight
hours of standby power after loss of external power [City of New York 2013]. In the past, the FCC has
attempted to mandate a minimum of eight hours of battery standby power, but the requirement was
removed by the courts. However, adequate standby power based on community resilience plans should be
considered for cell towers, particularly in areas that serve critical facilities. Installation of permanent
generators can be impacted by numerous factors including building codes, space requirements, landlord
negotiations and financial considerations.
There is a general expectation by the public that the 9-1-1 emergency call system will remain functional
during and after hazard events. Considering the observed performance of the electric grid during recent
hurricanes (which produced wind speeds less than the nominal 50 to 100-year values as specified in
ASCE 7 [ASCE 1993, 1995, 2002 and 2005]), the availability of commercial power may present the
greatest challenge to continued functionality of communications systems during the design, or even
routine event. Consequently, adequate standby power is critical to ensure functionality. Recent experience
with hurricanes and other hazard events suggest that the standby power needs to last longer than the
typical current practice of four to eight hours at cell sites, for these types of events [City of New York
2013].
Permanently located diesel electric standby power may pose significant difficulties due to initial and
ongoing maintenance costs. In the case of events such as hurricanes and major ice storms where advanced
warning is available, portable generators can be staged and deployed before or after the storm. However,
after regional hazard events occur, the demand often exceeds the availability of portable generators. When
they are deployed, the portable generators usually require refueling about once per day. Permanent
generators also require refueling, but the frequency depends on the capacities of the generators. In events
where there is little to no warning, such as earthquakes and tornadoes, portable generators cannot be
staged ahead of time. However, portable generators may be the best approach for rapid recovery of
critical aspects of a system‘s functionality.
In highly urbanized areas, such as New York City, cell towers are frequently located on top of buildings,
preventing the placement of permanent diesel standby generators and making it difficult to supply power
from portable generators because of impeded access.
15.2.3. Cable and Broadcast Systems
One-way communication systems, such as cable and broadcast systems, are needed to disseminate
important information to the public using a one-to-many model, particularly before and after a hazard
event. Broadcasting, in particular, can be used to provide information to the public when external power
is lost and if the members of the community have battery-powered radio or television. In the case of the
2012 derecho (see Section 15.2.4), public safety answering points (PSAP) worked with broadcasters to
provide updates on 9-1-1 service disruptions to provide information on other ways to obtain emergency
assistance [FCC 2013]. Cellular broadcasting is also being used to disseminate one-to-many information
updates, which is especially helpful in unanticipated hazard events.
The Emergency Alert System (EAS) uses broadcasting and cable to alert the public of important
information during and after hazard events. EAS alerts may address events that impact the entire nation or
only a small area affected by severe weather [FCC 2015b].
Broadcast Towers. The main infrastructure for broadcasting is broadcast towers that transmit signals over
air waves. These towers are designed following the same standard, TIA-222-G, as cell towers (see Section
15.2.2.2). Existing towers that were designed to standards earlier than TIA-222-G, particularly in
earthquake prone regions, should be reviewed to determine whether updates are needed to meet the latest
standard. Broadcast towers face many of the same challenges as cell towers to maintain functionality
during and after a hazard event, including ensuring critical equipment is not vulnerable to damage.

Community Resilience Planning Guide for Buildings and Infrastructure Systems - Volume II
Communication Systems
177
Cable Head End Facilities. Cable head end facilities are typically located at a local cable TV office and
provide cable TV and modem services to subscribers. These facilities serve a similar purpose to central
offices, IXPs, and MSCs. Therefore, they should be designed to meet the same performance goals,
including the proper design of the standby power system.
Cable Television (CATV)
Uninterruptible Power Supply
(UPS). Much of the infrastructure for
cable is similar to that of wireline
telephones. In fact, many people
receive wireline telephone, internet,
and cable television through the same
service provider. These services are
bundled and distributed to the
customers in a manner similar to
wireline systems. UPS systems are
used to inject power into the cable so
cable services can be delivered to
customers [Kwasinski et al. 2006].
UPS systems may be placed on a
pedestal on the ground or on a utility
pole. Like other critical equipment, it
is important to place UPS systems to
minimize their vulnerability to
hazards [Kwasinski 2011]. Figure
15-6 (left) shows two UPS systems after Hurricane Katrina. The unit mounted on a pedestal at ground
level was destroyed due to storm surge; the unit mounted to a utility pole was not damaged. However,
Figure 15-6 (right) also shows that placing UPS systems too high on utility poles can interfere with
regular maintenance [Kwasinksi 2011]. Providing adequate standby power can be a challenge,
particularly for a pole-mounted UPS, because the additional load may be more than the pole can
withstand.
15.2.4. Emergency Communications
9-1-1 Services. The ability to call 9-1-1 for help in an emergency situation is critical on a daily basis and
especially after a hazard event. Current 9-1-1 architecture typically uses wireline switching and routing
capability of a service provider in the community to connect 9-1-1 call centers (known as Public Safety
Answering Points or PSAPs) to people who need help, regardless of whether the call is made from a
wireline or cellular phone [FCC 2013]. Therefore, wireline infrastructure failures of selective routers or
End-Offices that service PSAPs, and resulting service disruptions, may more significantly impact 9-1-1
service than individual wireless service outages.
As seen in past hazard events, wireline infrastructure failure can result in lost 9-1-1 service. For example,
the 2012 Derecho that impacted 11 states from the Ohio Valley to Mid-Atlantic and D.C. caused
widespread loss of 9-1-1 services [FCC 2013]. The FCC [2013] report on the failures of the
communications infrastructure showed that seventy-seven PSAPs across six states had some degree of
lost service, and seventeen PSAPs in three states (Virginia, West Virginia, and Ohio) lost service
completely, potentially impacting more than two million people.
As discussed in Section 15.2.1, standby power is critical to ensure continued service when external power
is lost. Unfortunately, standby power failures in Virginia central offices led to extended 9-1-1 service
disruptions in northern Virginia. One central office lost external power and ran on battery power for
Figure 15-6: Placement of UPS systems is an important
consideration for resilience and periodic maintenance.

Community Resilience Planning Guide for Buildings and Infrastructure Systems - Volume II
Communication Systems
178
approximately six hours until the batteries were exhausted. Although the battery backup system included
standby generators, the system was configured to use two standby generators in tandem to provide the
power required by the facility. When one generator failed to start, the other was overloaded and failed.
The FCC [2013] found that the generator had also failed in routine testing prior to the derecho, and the
problem should have been fixed then. The failure of the standby power system lasted eight hours. As a
result, the central office and local 9-1-1 services experienced a service disruption for that time period
[FCC 2013].
Service providers have learned from these events and are continuing to make improvements to the 9-1-1
service system in the National Capital Region (NCR) as well as in other parts of the country.
Additionally, the FCC has initiated an annual program to have service providers certify their diversity of
circuit to PSAPs, diversity of telemetry links, and their minimum standby power requirements (e.g.,
duration, testing, and maintenance) for all locations servicing a PSAP or hosting a selective router. The
certification requires that all network central office locations directly serving a PSAP have 24 hours
backup power, along with a 72 hour requirement for those central office locations hosting selective
routers. Communities can also take steps to improve the resilience of their 9-1-1 service by considering
purchase of diverse circuits and redundancy in End-Offices serving PSAPs when possible.
Other Emergency Communication. Communities should consider implementing the Integrated Public
Alert and Warning System (IPAWS) to enhance public safety and update the public with important
information in the immediate aftermath of a hazard event. The IPAWS includes several alerts systems,
such as:
Wireless Emergency Alerts (WEA) used to broadcast alerts/warnings to cell phones and other
mobile devices
Emergency Alert System (EAS) used to disseminate warnings via broadcast, cable, satellite, and
wireline services
Private Entry Point (PEP) stations used for private or commercial radio broadcast stations that
participate with FEMA to provide emergency alert and warning information to the public before,
during, and after incidents and hazard events
15.3. Performance Goals
Although the goal of communities, infrastructure owners (e.g., service providers), and businesses is to
have continued operation at all times, the time required to restore functionality after a hazard event will
depend on the magnitude and type of event, levels of damage, and plans for community recovery and
resilience. Performance goals for communication infrastructure systems will vary from community to
community based upon their needs. Performance goals should be defined by the community and its
stakeholders, as part of the six-step planning process described in Volume 1.
Stakeholders. Following this Guide‘s six-step process, communities can form a team of stakeholders to
establish and achieve performance goals for the communications infrastructure as part of a broader
community resilience planning effort. Like the planning efforts for other infrastructure systems,
stakeholders need to establish performance goals for their communications systems and evaluate the
current state of its infrastructure systems. The communications infrastructure has owners and stakeholders
from multiple industries that have important perspectives to consider when establishing performance
goals to improve resilience of the communication system and the community. Stakeholders may include
each of the service providers, local businesses, critical facility representatives, and representatives from
industries that depend on communications systems, such as electric utilities, liquid fuel providers, and
transportation officials.
Community Resilience Planning Guide for Buildings and Infrastructure Systems - Volume II
Communication Systems
179
The City of San Francisco provides an excellent example of what bringing stakeholders together can
accomplish. San Francisco has a lifelines council [The Lifelines Council of the City and County of San
Francisco 2014] that brings together stakeholders to get input regarding the current state of infrastructure
systems and needed improvements. The lifelines council performs studies and provides recommendations
as to where enhancements in infrastructure resilience and coordination are needed. Their work has led to
additional redundancy being implemented into the communication network in the Bay Area.
Performance Goals Table. Performance goals are defined in terms of how quickly the infrastructure‘s
functionality is recovered after a hazard event. Table 15-1 presents an example performance goals table
that communities can fill out to evaluate the strengths and weaknesses of their communication
infrastructure systems and how they support community resilience. Considerations for setting
performance goals for communication infrastructure systems are presented here.
The performance tables can be used by any community for any type of hazard event and hazard level
(routine, design and extreme). The disturbance criteria and restoration levels shown at the top of the table
summarize the anticipated overall impact on the community. See Chapter 4 of Volume 1 for a more
detailed discussion of the performance goal table and the process for establishing performance goals.
The communications infrastructure has two major categories in Table 15-1: 1) core and communications
buildings and 2) first/last mile distribution systems that support building clusters. The building clusters
listed in the left column of the table are grouped as critical facilities, emergency housing,
housing/neighborhoods, and community recovery (see Chapter 12). These groups are intended to reflect a
typical sequence for recovery of function following a hazard event.
Communities are constructed for prevailing hazards, so the design hazard level provides the foundation
for resilience planning. Examining the response of buildings and infrastructure systems to multiple levels
of a hazard (e.g., routine, design, and extreme) can provide insight about the integrated performance of
buildings and infrastructure systems. For example, a system may not perform well at the routine level,
especially older systems that are not well maintained. If the system has an important role in the
community, its failure may trigger cascading effects in buildings or other systems. These types of
dependencies may indicate that mitigation or retrofit options may be required to improve community
functionality for routine events.
The table provides a visual summary of desired (future) performance goals and anticipated (current)
performance of the existing communication infrastructure systems based on social needs during recovery.
Performance goals are established by the community and its stakeholders and expressed in terms of time
to recovery of function, depending on the community‘s social needs following a hazard event and the role
of the communication infrastructure systems.
The desired rate of recovery is indicated by percentages, 30 %, 60 %, and 90 %, to indicate how much of
the supporting communication system for the cluster is recovered and functioning during the three
recovery phases (short-term, intermediate, and long-term). Anticipated performance of the existing
construction for each building cluster is estimated (at the 90 % level) for the selected hazard event and
also recorded in the table. The difference between the desired 90 % restoration level and the anticipated
90 % performance level indicates the gap that needs to be addressed to meet the community resilience
objective.
In Phase 1 of recovery, community functions may initially be restored at a minimum or interim level to
support essential tasks that start the recovery process. For example, an emergency operations center
(EOC) may have enough power, phones, and computers to continue critical operations, but not to
maintain all functions.

Community Resilience Planning Guide for Buildings and Infrastructure Systems - Volume II
Communication Systems
180
Table 15-1: Example communications infrastructure performance goals table to be filled out by
community and its stakeholders
Disturbance 1 Restoration Levels 2,3
Hazard Type Earthquake 30% Function Restored
Hazard Level Routine 60% Function Restored
Affected Area Localized 90% Function Restored
Disruption Level Usual X Anticipated Performance
Communications Infrastructure Support
Needed4
Design Hazard Performance
Phase 1
Short-Term
Phase 2
Intermediate
Phase 3
Long-Term
Days Weeks Months
0 1 1-3 1-4 4-8 8-12 4 4-24 24+
Core and Communications Buildings
Communications Hub (e.g., Central Office, IXP,
Data Centers, etc.)
First/Last Mile
Critical Facilities
Hospitals
Police and fire stations
Emergency Operation Center
Emergency Housing
Residences
Emergency responder housing
Public Shelters
Housing/Neighborhoods
Essential city service facilities
Schools
Medical provider offices
Retail
Community Recovery Infrastructure
Residences
Neighborhood retail
Offices and work places
Non-emergency city services
Businesses
Footnotes:
1 Specify hazard type being considered
Specify hazard level – Routine, Design, Extreme
Specify the anticipated size of the area affected – Local, Community, Regional
Specify anticipated severity of disruption – Minor, Moderate, Severe
2 30% 60% 90% Desired restoration times for percentage of elements within the cluster
3 X Anticipated performance for 90 % restoration of cluster for existing buildings and infrastructure systems
Cluster recovery times will be shown on the Summary Matrix
4 Indicate levels of support anticipated by plan
R = Regional; S= State; MS=Multi-State; C = Civil (Corporate/Local)
It is important that communities work with service providers when developing performance goals to
understand the level of service that can be anticipated (now and in the future) from communication
networks. Communication hubs (e.g., central offices, IXPs, MSCs) may or may not be located in
communities. Accordingly, their role in community resilience and the recovery sequence depends on
whether such facilities are expected to be damaged during a hazard event, and whether there is
redundancy within the communication system if such facilities are damaged. Similarly, plans for recovery
of the first/last mile and communication functions across the community should be developed with
service providers and affected stakeholders. The core and communication buildings may be split into
different functional categories by national service providers. The core refers to the backbone of service
provider networks and includes facilities that store customer data and information. For larger service

Community Resilience Planning Guide for Buildings and Infrastructure Systems - Volume II
Communication Systems
181
providers, these facilities may have redundancy within an area so that a regional event, such as a
hurricane or earthquake, cannot disrupt the entire network. Communications hubs, including central
offices, IXPs, MSCs, and other centralized nodes, are regional nodes whose failure would result in
widespread service disruptions. A community does not have control over the infrastructure of the service
providers‘ networks, so it is important for communities to be aware of the anticipated performance of
these systems and any vulnerabilities that could affect delivery of services through the first/last mile of
the distribution system.
The first/last mile for wireline, internet, and cable is impacted by the performance of the distribution
wires in a given hazard event. While wireless technology, such as cellular phones, operates using
transmitted signals rather than physical infrastructure for distribution, backhaul facilities use wirelines to
transmit signals between cell tower base stations and Mobile Switching Centers. Although all system
components (e.g., underground cables, overhead cables) are not specifically included in the table, they
should be considered when setting performance goals for the community or communication systems.
Establishing Community Goals. Communities and service providers may have different goals and
priorities for recovery of function following a hazard event. Communities with a resilience plan will have
desired performance goals that address a planned sequence of recovery to minimize disruption to their
economy and daily life. A service provider will have prioritized plans for recovery of their system
functionality, including compliance with regulations, which may address several communities or a larger
region. Therefore, communities and stakeholders need to understand the capabilities of the
communications industry and the level of service that may be anticipated during and after a given hazard
event.
It is also important for communities and service providers to each communicate their performance and
recovery expectations, acceptable risks, prioritization, and business continuity and functionality
objectives. Discussions between communities and service providers may help identify impediments that
can unintentionally slow down recovery, such as slow permitting processes. Identifying such barriers may
allow service providers to clearly understand required coordination, what will be permitted, and how to
work around potential barriers prior to an event.
Completing Performance Goals Tables. Desired performance goals are established first for three levels
of functionality. In Table 15-1, the orange shaded boxes indicate the desired time to reach 30 percent
functionality of the component, yellow indicates the time frame in which 60 percent functionality is
desired, and green indicates greater than 90 percent functionality. A goal is not set for 100 percent
operability because it may take significantly longer to reach this target and may not be necessary for
communities to return to their normal daily lives. Desired performance goals are independent of any
hazard. For instance, 9-1-1 service in a community is desired to be continually available - how that might
be accomplished depends on the prevailing hazards.
Anticipated performance for existing infrastructure systems are determined for the selected hazard type
and level, which is recorded at the top of the table. The anticipated performance of existing
communication systems that support each building cluster is estimated at the 90 % recovery of function
level and indicated by placing an ―X‖ in the each row of the table. The performance of many components
in the communication network, such as towers and buildings housing equipment are expected to perform
according to their design criteria. Recent events, however, suggest that this is not always the case.
The affected area for a given hazard is characterized as local, community, or regional, depending on the
type and intensity of the hazard. For example, earthquakes and hurricanes may have large (i.e., regional)
affected areas, whereas tornadoes may have relatively small (i.e., local) affected areas. The affected area
helps a community consider the potential extent of infrastructure systems that may be damaged, which
may impact the recovery process. The disruption level is a measure of the loss of functionality across the
community based on the current state of the built environment, and is estimated as usual (minimal loss),
moderate or severe.

Community Resilience Planning Guide for Buildings and Infrastructure Systems - Volume II
Communication Systems
182
Evaluating Existing Communications Infrastructure and Closing Resilience Gaps. The performance
goals table can help identify gaps between desired and anticipated performance. The difference between
the anticipated 90 % performance (X) and the desired 90 % performance indicates a gap in community
resilience.
Once a community and its stakeholders identify resilience gaps, the gaps are prioritized relative to
community goals. Solutions are developed by the community and stakeholders to address prioritized gaps.
Section 15.6.1 discusses potential methods to evaluate the anticipated performance of existing
communications infrastructure. Sections 15.6.2 and 15.6.3 provide mitigation and recovery solutions that
can be used to achieve the performance goals set by the community or service provider. The solutions in
these sections also recognize it will take time and money to invest in solutions for resilience, and provides
possible long and short term solutions.
Given recovery times for shelters, hospitals, police stations, and other critical facilities in a community,
communities and service providers should work together so that the appropriate planning, engineering,
and service agreements are crafted for the desired recovery times. Some solutions will be more expensive
than others. For example, communities may need to add redundancy or diversity as part of their solution,
while for others it may be sufficient to obtain Telecommunications Service Priority (TSP) prioritization
on impacted circuits (see Section 15.6.3 for discussion of TSP). In some cases, a community may need to
enact administrative strategies to ensure resiliency (e.g., right of ways, permitting of cell towers).
Emergency Responder and Critical Facility Communication Systems. The example performance goals
table includes distribution infrastructure to critical facilities such as hospitals, fire and police stations, and
emergency operation centers. However, communication systems between emergency responders
(fire/police/paramedics) are not listed, which have their own communications networks and devices.
Community emergency response providers‘ networks and devices need to remain functional during and
after a hazard event (i.e., there should not be any downtime). After a hazard event, functionality of critical
services communication networks is essential to coordinating response to people who are injured, and fire
or other hazard suppression. Two-way radios may be one solution if other means of communication are
not functional. However, fire, police, and paramedic radios are often not compatible with one another.
Therefore, communities should consider how first responders can ensure that radios are compatible to
help with coordination. Similarly, other critical facilities, such as hospitals and police stations, often have
their own private communications systems that need to be operational after a hazard event to ensure that
they can serve the community.
15.4. Regulatory Environment
There are multiple regulatory bodies at the various levels of government (federal, state, and local) that
have authority over communication infrastructure systems. No single regulatory body oversees all
communications infrastructure or is responsible for enforcing of all codes and standards. The rapidly
evolving technologies over the past 30 years have led to changes in regulatory jurisdiction, which adds
complexity to the regulatory environment. This section discusses regulatory bodies of communications
infrastructure at the federal, state, and local levels.
15.4.1. Federal
The regulatory body of communication services and, thus, infrastructure is the Federal Communications
Commission (FCC). The FCC is a government agency that regulates interstate and international
communications of telephone, cable, radio, and other forms of communication. It has jurisdiction over
wireless, wireline, and internet (including VoIP).

Community Resilience Planning Guide for Buildings and Infrastructure Systems - Volume II
Communication Systems
183
The FCC has an advisory group called the Communications Security, Reliability, and Interoperability
Council (CSRIC) that promotes best practices as well as industry recommendations for improved
reliability and resilience for many types of communications providers. The council performs studies of
hazard events (e.g., Hurricane Katrina, 2012 Derecho), and recommends ways to improve preparedness,
network reliability, and communication among first responders [Victory et. al 2006]. There are no
requirements for recommended best practices to be adopted and enforced since they are not developed to
the rigor of standards. However, the industry voluntarily considers implementing best practices under
appropriate circumstances. Service providers use best practices to implement mitigation strategies
applicable to their network, and effectively prioritize network resiliency improvements. Furthermore,
implementing best practices enables service providers to remain competitive in business and improve the
reputation of their brand.
15.4.2. State
State government agencies have authority over local wireline telephone service. Most commonly, the
agency responsible for overseeing communications infrastructure at the state level is known as the Public
Service Commission (PSC). However, other state agencies have jurisdiction over communications
infrastructure as well. For example, s state Departments of Transportation (DOTs). State DOTs have
jurisdiction over the right-of-way and, therefore, oversee construction of roads and highways where utility
poles and wires are installed. Utility poles and wires are commonly placed within the right-of-way of
roads, whether above ground or underground. The DOT has the ability to permit or deny planned paths of
the utilities.
State DOTs also have weight restrictions on vehicles to ensure the stability and safety of highway
systems, particularly bridges. However, in the aftermath of a hazard event, weight restrictions can be a
challenge for service providers because support from other states may include vehicles over the specified
maximum weight. Communities can work with states and service providers in their planning efforts to
resolve this challenge so bridges are not subjected to excessive vehicle loads, and service providers are
able to plan routes for emergency repair crew support after hazard events.
15.4.3. Local
Local government has jurisdiction over the communication infrastructure through a number of agencies.
The Department of Buildings (DOB), or its equivalent, is responsible for enforcing the local building
code. The DOB regulates placement of electrical equipment, standby power, and fuel storage at critical
communications facilities, such as central offices and IXPs [City of New York 2013].
Large cities, such as New York City, Chicago, Los Angeles, and Seattle, have their own DOTs. These
local DOTs oversee road construction and the associated right-of-way for utilities (including
communications infrastructure). Many smaller municipalities have an Office of Transportation Planning,
which serves a similar function.
Local governments also regulate zoning policies and land use. Zoning policies can impact the
performance of the communication infrastructure system because they can prohibit service providers from
placing cell towers, standby generators, or distribution lines in locations that are needed to provide
redundancy in their systems. Communities and service providers can work together to understand how
zoning policies and other local regulation can impact resilience strategies and to resolve some of the
conflicts that may currently exist.

Community Resilience Planning Guide for Buildings and Infrastructure Systems - Volume II
Communication Systems
184
15.4.4. Overlapping Jurisdiction
A number of regulatory bodies have jurisdiction over the various services provided in the complex
bundling packages service providers now offer customers. For example, a bundled telephone, internet and
cable package functions under the jurisdiction of both local (cable) and federal (internet and VoIP)
agencies [City of New York 2013]. Furthermore, changing from traditional wirelines to VoIP shifts a
customer‘s services from regulation by state agencies to federal agencies. As technology continues to
evolve, jurisdiction over services may continue to shift from one level of government to another.
Following the current trend of more and more services becoming internet based, an increasing proportion
of services may continue to move toward being under federal agency regulations.
15.5. Codes and Standards
Codes and standards are used by the communication industry to establish minimum acceptable criteria for
design and construction. Many standards have been developed for communications infrastructure, such as
those of the American National Standards Institute/Telecommunications Industry Association
(ANSI/TIA) and Network Equipment Building Standards (NEBS). Table 15-2 shows the standards
discussed in this chapter: TIA-222-G for cell and broadcast towers; ASCE 7 for communications
buildings (central offices, IXPs, etc.); and NESC for distribution lines.
Table 15-2: Example communication codes and standards discussed in this chapter
Code/Standard Description
TIA-222-G Structural Standards for
Antennae Supporting Structures and
Antennas
Specifies loading and strength requirements for antennas and their
supporting structures (e.g., cell and broadcast towers). [Erichsen 2014]
ASCE 7-10 Minimum Design Loads
for Buildings and Other Structures
Provides minimum loading criteria for buildings housing critical
communications equipment (i.e., communications buildings). Also
provides loading criteria for towers.
IEEE National Electrical Safety Code
(NESC)
United States Standard providing requirements for safe installation,
operation and maintenance of electrical power, standby power and
communication systems (both overhead and underground wiring).
15.5.1. New Construction
The TIA-222-G standard [2006] is used for design of new cell and broadcast towers. This version of the
TIA-222 standard includes the biggest set of changes since it was first developed in 1959 [TIA 2014],
These major changes include:
Using limits state design rather than allowable stress design
Changing the design wind speeds from fastest-mile to 3-second gust, consistent with ASCE 7,
and using the wind maps from ASCE 7
Addressing earthquake loading for the first time in the TIA-222 standard [Wahba 2003]
Note that wind, ice, and storm surge are the predominant concerns for towers. However, earthquake
loading was added so it could be addressed in highly seismic regions [Wahba 2003].

Community Resilience Planning Guide for Buildings and Infrastructure Systems - Volume II
Communication Systems
185
New communications buildings (central offices, IXPs, etc.) should be designed to be consistent with
ASCE 7-10 Risk Category III criteria and performance level A or B (see Chapter 12). Consequently, the
design of equipment and standby power within communication buildings should be consistent with the
building performance. At a minimum, buildings should be designed in accordance with ASCE load
criteria for the prevailing hazards of the community, which may include flood, snow/ice, earthquake, and
wind. Wind loading criteria used by ASCE 7-10 has been developed using hurricane and extratropical
winds. Other natural hazards that can cause significant damage, such as wildfire, tsunami, and tornadoes,
are not explicitly addressed in ASCE 7-10. However, as discussed in Chapter 12, fire protection standards
are available and are used to mitigate potential building fire damage.
Distribution lines for communication system are subject to the design criteria in the National Electric
Safety Code (NESC). As discussed in Chapter 13, Rule 250 contains the hazard load criteria for
communication and electric power lines as well as their supporting structures (e.g., utility poles).
Specifically, these criteria address combined ice and wind loads for three districts of the United States
defined as: 1) heavy; 2) medium; and 3) light, as defined in Rule 250B. Rule 250C addresses extreme
wind loading and Rule 250D provides design criteria for extreme ice with concurrent wind.
The definition of the term ―extreme‖ by NESC does not correspond to that used in this Guide. Rather,
NESC-2012 uses ―extreme‖ to indicate use of the ASCE 7-05 maps for the 50 year return period, which,
if used with the appropriate ASCE 7-05 load and resistance factors, corresponds to a design event as
defined in Chapter 4 (Volume I) of this Guide. However, NESC extreme loads only apply to structures at
least 18 m (60 ft) above ground. Since most communication distribution lines in the last mile are below
18 m (60 ft), the lines would be designed for Rule 250B, which has lower loading requirements than
Rules 250C and D.
For communication distribution wires, the designer could use either the NESC or ASCE 7. Malmedal and
Sen [2003] showed that past ASCE 7 loading standards have been more conservative than those of NESC,
particularly for ice loading. ASCE 7 design criteria will provide a more conservative design, but may
have a higher cost that is not desirable to utilities, service providers, or customers. When considering
resilience, using a more conservative design for communication distribution lines in the last-mile to
critical facilities may be a more effective means of meeting community resilience goals.
In the communication industry, codes and standards provide baseline loading and design for
infrastructure. However, the industry heavily relies on development and implementation of best practices,
rather than regulations, to improve their infrastructure resilience. The FCC‘s CSRIC provides an excellent
example of a body that supplements existing codes and standards by developing and publishing best
practices for various network types (internet/data, wireless and wireline telephone) and provides an
articulation of industry roles, including service providers, network operators, equipment suppliers,
property managers, and government [CSRIC 2014]. Service providers often adapt these practices or
develop their own best practices to help improve the infrastructure on which their business relies. Best
practices developed by the CSRIC cover a wide array of topics ranging from training and awareness to
cybersecurity and network operations. For the purposes of this document, only a handful of the best
practices developed by the CSRIC (see Table 15-3) that relate to physical communications infrastructure
are listed.
As shown in Table 15-3, the best practices include many suggestions discussed in this chapter: 1) Standby
power for critical equipment and cell sites; 2) Backup solutions for cooling critical equipment in
Communication Buildings; 3) Limiting exposure of distribution lines, critical equipment, and standby
generators to hazards; and 4) Minimizing single points of failure in communications buildings, and
distribution network. The best practices [CSRIC 2014] emphasize ensuring a power supply because
communications systems depend on power systems to function. Innovative technologies and solutions for
maintaining external power infrastructure continue to be developed and are discussed in Chapter 13.

Community Resilience Planning Guide for Buildings and Infrastructure Systems - Volume II
Communication Systems
186
Table 15-3: Example best practices for communications infrastructure
Best Practice Description [CSRIC 2014] Applicable
Infrastructure
Network operators, service providers, equipment suppliers, and property managers should ensure the
inclusion of fire stair returns in their physical security designs. Further, they should ensure there are
no fire tower or stair re-entries into areas of critical infrastructure, where permitted by code.
Central offices, nodes,
critical equipment
Network operators and service providers should prepare for HVAC or cabinet fan failures by ensuring
conventional fans are available to cool heat-sensitive equipment, as appropriate.
Critical equipment
Network operators and service providers should consult National Fire Protection Association
Standards (e.g., NFPA 75 and 76) for guidance in the design of fire suppression systems. When
zoning regulations require sprinkler systems, an exemption should be sought for the use of non-
destructive systems.
Central offices, nodes,
critical equipment
Network operators should provide back-up power (e.g., some combination of batteries, generator, fuel
cells) at cell sites and remote equipment locations, consistent with the site specific constraints,
criticality of the site, design load, and reliability of primary power.
Cell sites and DLC RTs
Network operators and property managers should consider alternative measures for cooling network
equipment facilities (e.g., powering HVAC on generator, deploying mobile HVAC units) in the event
of a power outage.
Central offices, nodes,
critical equipment
Network operators, service providers, and property managers together with the power company and
other tenants in the location, should verify that aerial power lines are not in conflict with hazards that
could produce a loss of service during high winds or icy conditions.
Distribution lines
Back-up power: network operators, service providers, equipment suppliers, and property managers
should ensure all critical infrastructure facilities, including security equipment, devices, and
appliances protecting it are supported by backup power systems (e.g., batteries, generators, fuel cells).
Central offices, nodes,
critical equipment
Network operators, service providers, and property managers should consider placing all power and
network equipment in a location to increase reliability in case of hazard (e.g., floods, broken water
mains, fuel spillage). In storm surge areas, consider placing all power related equipment above the
highest predicted or recorded storm surge levels.
Central offices, nodes,
cell sites, DLC RTs,
critical equipment
Network operators, service providers, equipment suppliers, property managers, and public safety
should design standby systems (e.g., power) to withstand harsh environmental conditions.
Critical equipment
Network operators, service providers, public safety, and property managers, when feasible, should
provide multiple cable entry points at critical facilities (e.g., copper or fiber conduit) avoiding single
points of failure (SPOF).
Distribution lines
Service providers, network operators, public safety, and property managers should ensure availability
of emergency/backup power (e.g., batteries, generators, fuel cells) to maintain critical
communications services during times of commercial power failures, including natural and human-
caused occurrences (e.g., earthquakes, floods, fires, power brown/black outs, terrorism).
Emergency/backup power generators should be located onsite, when appropriate.
Critical equipment
Network operators and service providers should minimize single points of failure (SPOF) in paths
linking network elements deemed critical to the operations of a network (with this design, two or
more simultaneous failures or errors need to occur at the same time to cause a service interruption).
Distribution
Back-up power fuel supply: network operators, service providers, and property managers should
consider use of fixed alternate fuel generators (e.g., natural gas) connected to public utility supplies to
reduce the strain on refueling.
Central offices/nodes,
cell sites, DLC RTs,
critical equipment.
Network operators and public safety should identify primary and alternate transportation (e.g., air,
rail, highway, boat) for emergency mobile units and other equipment and personnel.
Cell sites, DLC RTs,
critical equipment

Community Resilience Planning Guide for Buildings and Infrastructure Systems - Volume II
Communication Systems
187
15.5.1.1. Implied or Stated Performance Levels for Design Hazard Levels
For wind events, buildings and other structures are typically designed for serviceability, which focuses on
lateral displacement of tall buildings, floor vibration, and measures related to building function or
occupant comfort. Therefore, in a design wind event, the expectation is that neither the building structure
nor envelope will fail. The ability of the building envelope to perform well (i.e., stay intact) is imperative
for high wind events because they are typically associated with heavy rainfall events (e.g., thunderstorms,
hurricanes, tornadoes). Therefore, even if the building frame was to perform well, but the envelope failed,
rain infiltration could damage the contents, critical equipment, and induce enough water related damage
that the building may have to be replaced. The design expectation is that a communications building
would not have any significant damage for a design wind event, and would be fully operational within 24
hours. The 24 hours of downtime should only be required for a high wind event to allow time to bring
standby generators online if needed and to ensure all switches and critical electrical equipment are not
damaged.
Similarly, for a design flood event, a communications building would not be anticipated to fail. There is
likely to be some damage to the building and its contents at lower elevations, particularly the basement.
However, if the critical electrical equipment, switchgear, and standby power are located well above the
inundation levels, the design expectation would be for communications buildings to be fully operational
within 24 hours of the event.
For earthquakes, buildings are designed for life safety through structural stability, but damage may occur.
Therefore, communications buildings in highly seismic regions are likely to be damaged during the
design earthquake. As a result, it is likely that there will be some, and possibly significant, loss of
functionality of a central office following a design earthquake event. If the critical equipment and
switchgear were designed and mounted to resist anticipated ground accelerations, downtime may be
limited (e.g., less than one week). However, if the critical equipment and switchgear were not mounted to
resist ground accelerations, it could be much longer before the communications building is fully
functional again.
For cell and broadcast towers, the primary hazard considered for design in TIA-222-G is wind. However,
ice and earthquake are also considered. TIA-222-G provides three classes of tower structures [Wahba
2003]:
Category I Structures – Used for structures where a delay in recovering services would be
acceptable. Ice and earthquake are not considered for these structures, and wind speeds are based
on the ASCE 7-05 Risk Category I.
Category II Structures – This is the standard category that represents hazard to human life and
property if failure occurs. The ASCE 7-05 Risk Category II wind, ice, and seismic loads are used.
Category III Structures – Used for critical and emergency services. The ASCE 7-05 Risk
Category III wind, ice, and seismic loads are used.
For the design event, failures would only be anticipated for a small percentage of cell towers (e.g., less
than five percent). It is noted that, as discussed in the previous section, the loading in TIA-222-G is based
on that of ASCE 7-05. Cell towers are configured such that there is an overlap in service between towers
so the signal can be transmitted as the user moves from one area to another without a disruption in
service. Therefore, if one tower fails, other towers will cover most of the service since their service areas
overlap.
Communication distribution wires would likely experience some failures in the design event, particularly
for wind and ice storms. As discussed in the previous section, most distribution lines in the last-mile are
below 18 m (60 ft) above the ground and, hence, are not designed to meet what Chapter 4 (Volume I)
defines as the design event if Rule 250B in NESC is followed for design. For lines designed to meet the

Community Resilience Planning Guide for Buildings and Infrastructure Systems - Volume II
Communication Systems
188
NESC Rules 250C and 250D, it would be anticipated that only a small percentage of failure of the
overhead wire would fail in a design ice or wind event. However, as discussed earlier in this chapter and
in Chapter 13, tree fall onto distribution lines causes many failures rather than the loading of the natural
hazard itself. Therefore, service providers should work with the electric power utility to ensure their tree-
trimming programs are maintained. Service providers and electric power utilities should also work with
communities to ensure their residents understand the risks of not maintaining an aggressive tree-trimming
program.
15.5.1.2. Recovery Levels
For distribution lines, the location of the cables is a key factor in performance during hazard events.
However, some damage to the distribution lines may be expected for a design event.
If the distribution lines are underground, failures and recovery time should be limited for a high wind or
ice event, though underground distribution lines may be damaged by uprooting of trees. During a flood, if
the distribution lines are not properly protected or there has been degradation of the cable material,
failures could occur. During earthquakes, underground line failures may be due to ground movement or
liquefaction. As discussed in Section 15.2.1, although underground lines may be less susceptible to
damage, they are more difficult to access for repair and failures could result in recovery times of weeks
rather than days.
If the distribution lines are overhead, high wind and ice events may result in failures, primarily due to tree
fall or other debris impacts on the lines. The debris impact on distribution lines is a factor that varies
locally due to the surroundings and tree trimming programs that are intended to limit these disruptions.
Although overhead lines are more likely to fail during high winds and ice events, recovery and repair time
for a design event may range from a few days to a few weeks. Recovery time may be affected by the size
of the area impacted, resources available, and accessibility to transportation routes. Note that this only
accounts for repair of the communication distribution lines. Another major consideration is the recovery
of external power lines so the end user is able to use their communications devices. Chapter 13 addresses
the standards and codes, and their implied performance levels for an design event.
15.5.2. Existing Construction
Communication buildings designed and constructed within the past 20 years may have been designed
with minimum load criteria from ASCE 7-88 to ASCE 7-05. Prior to that, ANSI standards may have been
used. There have been many changes in design load criteria and methodology over the design life of
existing central offices. However, additional factors need to be considered when evaluating the expected
time for recovery of function following a hazard event, such as materials of construction, maintenance,
and resources required to support repair and recovery of function.
As discussed in Section 15.5.1, TIA-222-G is the current version of the standard used for cell and
broadcast towers. However, the 1996 standard, ANSI/TIA-222-F, was used during the largest growth and
construction of towers in the United States [TIA 2014]. As noted in Section 15.5.1, earthquake was not
considered in this version of the standard and allowable stress design was used rather than limit state
design, which is based on reliability theory [Wahba 2003].
Historically, communication distribution lines have been designed to NESC standards. The following
items list some of the most significant changes to NESC Rule 250 that have occurred over the past couple
of decades [IEEE 2015]:
Prior to 1997, NESC did not have an extreme wind load. Rule 250C adopted the ASCE 7 wind
maps.
Community Resilience Planning Guide for Buildings and Infrastructure Systems - Volume II
Communication Systems
189
In 2002, Rule 250A4 was introduced to state that earthquakes are not anticipated to govern design
since electric and communication wires and their supporting structures are flexible.
In 2007, Rule 250D was introduced for design of extreme ice from freezing rain combined with
wind.
These changes and their timeframes indicate that older distribution lines may be more vulnerable to
failures from wind and ice events than newer systems. However, the NESC adoption of the new standards
should support improved performance of overhead distribution lines.
15.5.2.1. Implied or Stated Performance Levels for Design Hazard Levels
As discussed in the previous section, ANSI/TIA-222-F (the 1996 standard) was in effect when the largest
growth and construction of cell towers took place [TIA 2014]. For wind and ice, the towers designed
according to this standard should be anticipated to only have a small percentage of failures for the design
event as discussed in Section 15.5.1.1. However, earthquake loads were not included in cell tower
standards prior to TIA-222-G [Wahba 2003]. Although earthquakes do not typically govern the design of
cell towers, those located in highly seismic regions may be susceptible to failure if a design earthquake
occurred. For existing towers designed to standards other than TIA-222-G in highly seismic regions, the
design should be evaluated to see if earthquake loads govern and necessary retrofits should be identified if
necessary to meet performance goals. Existing towers in seismic zones with electronics should also be
updated to meet requirements of TIA-222-G. Despite the lack of earthquake load criteria in TIA-222-F,
and older versions of this standard, designers in highly seismic regions may have considered earthquake
load using other standards, such as ASCE 7.
In large urban centers, cell towers may be located on buildings. Some of these buildings may be older and
of unknown condition. As a result, failure of the building could lead to loss of the cell tower. Thus, when
placing cell towers on top of buildings, the overall condition of these buildings should be considered.
As discussed in Section 15.5.1.2, some communication distribution lines are anticipated to fail during an
design event. Given that extreme ice loading was not included in the NESC standard until 2007,
distribution lines designed to prior codes may be vulnerable to ice storms.
15.5.2.2. Recovery Levels
For wind loads, many communications buildings and cell and broadcast towers may be expected to
perform reasonably well for a design event, and have a short recovery period. However, given that older
standards of TIA-222 did not include earthquake load criteria, a large number of failures may occur
during a seismic event and, hence, significant recovery time may be needed to repair or replace towers.
To replace a large number of towers would take weeks, months, or even years depending on the size of
the affected area.
Service providers have the ability to provide cell-on-light trucks (COLTs) as interim measures so
essential wireless communications can be brought online quickly after a hazard event in which the
network experiences significant disruptions [AT&T 2014]. However, the COLTs are only intended for
temporary or emergency situations. Furthermore, service providers may have alternative methods and
solutions to restore service. For cell tower owners in earthquake prone regions, resilience in the
communication infrastructure system should consider approaches to ensure that cell towers can perform
as needed for design earthquake events.
With respect to performance of distribution lines, performance and recovery time largely depends on the
placement of cables (i.e., overhead versus underground) as discussed in Section 15.5.1.2.
Community Resilience Planning Guide for Buildings and Infrastructure Systems - Volume II
Communication Systems
190
15.6. Strategies for Implementing Plans for Community Resilience
15.6.1. Available Guidance
There are three levels, or tiers, at which the communication infrastructure can be assessed, based on
industry practices:
Tier 1. A high level assessment of the anticipated performance of the components of the communication
infrastructure system can be completed by those with knowledge and experience of how the components
and system will behave in a hazard event. For communications buildings, this may include structural and
electrical engineers and designers. For wires (both overhead and underground), and cell towers, this may
include engineers, utility operators, service providers, and technical staff. As a minimum, each
community should complete a high level (Tier 1) assessment of its infrastructure. The community can
then decide whether additional investment is warranted for completing a more detailed assessment. The
SPUR Framework [SPUR 2009] took this high level approach in assessing their infrastructure for the City
of San Francisco, and is highly regarded as a good example for the work completed to date.
Tier 2. A more detailed assessment can be conducted, based on an inventory of typical features within the
communication infrastructure system, to develop generalized features for various components. To do this,
the community would need to assess the performance of common components of their infrastructure
system for a specific magnitude of event (i.e., model and analyze a scenario event and its resulting
impacts). Alternatively, the community could assess a hazard event scenario to compute loads and effects
(wind speeds and pressures, ground accelerations, flood elevations) and use expert judgment to estimate
the anticipated performance of various components of the communications infrastructure.
A Tier 2 communication infrastructure assessment includes the response of typical components
independent of dependencies within the infrastructure system. The Oregon Resilience Plan [OSSPAC
2013] provides a good example of modeling a hazard event to assess the resulting impacts on the current
infrastructure. It used Hazus [FEMA 2015] to model and determine the impacts of a Cascadia earthquake
on the infrastructure systems and used the losses output by the Hazus tool to back-calculate the current
state of the infrastructure.
Tier 3. For the most detailed assessment, Tier 3 would include all components in the communications
infrastructure system, intra-dependencies within the system, and dependencies on other infrastructure
systems. A probabilistic approach, such as fragilities, could be developed for each component of the
communications infrastructure system. A Tier 3 assessment would use models and tools to determine both
the load effects on infrastructure due to the hazard and the resulting performance, including dependencies.
Currently, there are no publicly available tools that can be used to model the dependencies between
infrastructure systems.
15.6.2. Solutions for Future Construction
For future construction, designers are encouraged to consider how to best achieve community resilience
goals rather than designing to minimum code requirements. It is important to consider the communication
infrastructure because a failure of one part may impact the rest of the system. Therefore, if a critical
component is non-redundant (e.g., a lone central office, or a single point of entry for telephone wires into
a critical facility), solutions could include future redundancy or improved performance of the component
through retrofit or replacement.
Throughout this chapter, there are examples of success stories and failures of communications
infrastructure due to different types of hazards (wind, flood, earthquake, ice storms). Designers, planners,
and decision makers should consider these examples, as well as other relevant examples, when planning
for and constructing new communication infrastructure. There are several construction and administrative

Community Resilience Planning Guide for Buildings and Infrastructure Systems - Volume II
Communication Systems
191
solutions that can be used to successfully improve the resilience of communications infrastructure
systems within a community.
Construction Solutions for Future Communications Buildings. With respect to communications
buildings that are owned by service providers, the service provider can incorporate design requirements
for the desired performance of critical building during a hazard event. If a community or region faces
multiple hazards, different failure modes may occur and have varying levels of anticipated damage and
recovery time.
Sections of buildings are often leased by service providers to store their equipment for maintenance and
repairs. Evaluation of leased buildings will support availability of necessary equipment after a hazard
event. If a building is in the design phase, the service provider could potentially work with the building
owner and designers to ensure their section(s) of the building will perform as desired. There may be
additional initial costs with this approach. However, a cost-to-benefit ratio of the investment versus losing
critical equipment needed to restore services can be considered.
Administrative Solutions for Future Communications Buildings. Although the design and construction
of buildings that house critical equipment for the communications network is an important consideration,
administrative solutions can also be effective. Service providers who own or lease buildings for
communications services should consider how to reduce vulnerabilities to hazards. For example, central
offices vulnerable to flooding can locate critical electrical equipment or standby generators above design
flood levels. Similarly, for earthquake prone areas, service providers can isolate or mount critical
equipment to ensure it is functional after a hazard event.
An alternative to raising all critical equipment is to protect it so
water does not enter the central office during a flood event.
Sandbags are often used in North America to temporarily protect
buildings or openings of buildings from flooding. However,
sandbag barriers are not always effective. After the magnitude 9.0
earthquake and tsunami in the Great Tohoku region of Japan 2011,
Kwasinksi [2011] observed that watertight doors performed well
in areas that experienced significant damage and were effective in
preventing flooding of critical electronic equipment in central
offices. Watertight doors, such as that shown in Figure 15-7, can
be used to prevent water from entering a central office during a
flood. Other openings, such as windows, may also need to be
sealed effectively [Kwasinski 2011].
Construction Solutions for Future Cell and Broadcast Towers.
To meet desired performance goals, design criteria for future cell
and broadcast towers may include requirements in accordance with
the TIA-222-G standard, as well as other criteria needed to meet
the desired performance. For wind and ice, it is expected that if the
towers are designed and constructed in accordance with the
appropriate standards, only a small percentage of cell towers
would be damaged or fail in a design event. With respect to an earthquake event, where the design
philosophy is life safety, it may be necessary to consider designing beyond the standard criteria.
Administrative Solutions for Future Cell and Broadcast Towers. Historically, the predominant cause of
outages of cell towers has been the loss of electrical power. As discussed in Section 15.2.2, the FCC‘s
attempt to mandate a minimum of eight hours of battery standby power to overcome this problem was
removed by the courts. However, service providers should consider how to provide adequate standby
power and ensure backhaul availability to maintain functionality following a hazard event.
Figure 15-7: Watertight door used
on central office in Kamaishi,
Japan

Community Resilience Planning Guide for Buildings and Infrastructure Systems - Volume II
Communication Systems
192
Standby generators for towers need to be designed and placed appropriately. Standby generators for cell
towers that are elevated above the design flood level or to withstand ground accelerations will be
available to support recovery efforts.
Additional protection may need to be implemented for cell and broadcast towers. As discussed in Section
15.2.2, storm surge debris impacts from boats resulted in failure of cell towers. Impacts from uprooted
trees or branches during flood or wind events could also result in failure of these towers. Therefore, the
topography and surroundings (e.g., relative distance from trees or harbors to cell towers) may need to be
considered to ensure cell towers are protected from debris impact.
Solutions for Future Distribution Line to End User. There are a number of factors to consider regarding
whether underground or overhead wires are the best way to distribute services to the end user. For future
distribution lines, the following factors may help identify which method to use:
Building cluster to which the services are being distributed
Prevailing hazards
Topography and terrain for distribution lines
Redundancy or path diversity of distribution lines
Cost/benefit of distribution methods
The typical utility access of the building cluster to which the services are being delivered is a key
consideration. The hazards the community faces can help determine how to reduce interruption of service
to the building. For example, in regions that are susceptible to high winds events, overhead wires would
likely result in poorer performance during wind events because of failures due to wind loading or debris
impact. Redundancy or path diversity of communications distribution lines to end users can improve the
likelihood of continuation of services after a hazard event. For example, single points of failure in the last
mile of distribution can result in longer outages.
15.6.3. Solutions for Existing Construction
Similar to future systems, there are several construction and administrative solutions that can improve the
resilience of existing communication infrastructure systems within a community. However, existing
components need to be evaluated to understand any vulnerabilities. If it is determined that a component is
vulnerable to a hazard event, solutions can be developed to address the vulnerability and the desired
performance goals for community resilience.
Communication infrastructure systems are large, distributed systems, with much of the existing
infrastructure owned by service providers or third party owners (e.g., building owners). Resilience is
achieved over time by communities and service providers. It is not reasonable to expect that capital is
available for service providers (or third parties) to upgrade all infrastructure within a short period of time.
Prioritization of solutions and development of resilience strategies by the community and its stakeholders
can provide steady progress to improving community and infrastructure system performance. By
evaluating the inventory of existing infrastructure, service providers can identify weaknesses and
implement solutions for future construction that avoid the same weaknesses.
Construction Solutions for Existing Communications Buildings. Existing buildings may need to be
assessed to determine if the building and critical equipment will be able to meet desired performance
goals. If the building is a non-redundant node in the infrastructure network, a higher level of performance
than that provided by the design event may be considered, such as the extreme hazard level. However, if
the building is a redundant node, and its failure would not cause significant service interruptions, the
design event may provide adequate performance.
Community Resilience Planning Guide for Buildings and Infrastructure Systems - Volume II
Communication Systems
193
If the service provider finds its communications building will not be able to withstand the loading for the
appropriate level of hazard event, steps may be taken to retrofit the building or to relocate the services to a
better location. Although retrofit options may be expensive, if the building is critical to performance
following a hazard event, the investment may be worthwhile.
Administrative Solutions for Existing Communications Buildings. Assessment of critical equipment in
communications building or other nodes/exchanges in the network can help determine whether the
desired performance will be achieved. Critical equipment can be elevated for flood events, or watertight
doors are a possible alternative to protecting critical equipment in communications buildings from water
infiltration.
Construction Solutions for Existing Cell and Broadcast Towers. Existing cell and broadcast towers
should be evaluated to determine whether they can resist the loading from the prevailing design events the
community faces.
Administrative Solutions for Existing Cell and Broadcast Towers. Assessment of required standby
power for individual or a group of towers can help balance the desired performance against the available
resources. Although it may not be economically feasible to provide standby generators for all towers
immediately, a program can be developed to accomplish this over time. The immediate surroundings of
cell or broadcast tower sites should be assessed to determine vulnerabilities to airborne and waterborne
debris. If the site is located such that it is vulnerable to tree fall or other debris in a high wind or flood
event, additional protection should be provided to protect the cell or broadcast tower.
Solutions for Existing Distribution Line to End User. For existing distribution lines to the end user, an
inventory of wires, including the type, age, and condition should be recorded. When wires are damaged or
have deteriorated due to age, they should be retired and/or replaced.
If a service provider is considering switching from overhead wires to underground wires to avoid possible
outages due to ice storms or high wind events, a cost-benefit ratio can support the assessment and
decision making process. If cost is much greater than projected benefits, the service provider may want to
consider other priorities to make the infrastructure more resilient. For instance, the service provider may
find it more economical to add redundancy. Such a solution would not reduce the vulnerability of existing
overhead wires, but would reduce the risk of service interruptions.
Administrative Solutions for Critical Facilities/Users – Prioritized Calls within Congested Network.
Communications network congestion often occurs during and immediately after a hazard event. The
following programs have been implemented to help critical users in communities have priority when
networks are congested due to a hazard event [DHS 2015]:
Government Emergency Telecommunications Service (GETS)
Wireless Priority Service (WPS)
GETS works through a series of enhancements to the wireline network. It is intended for use in the
immediate aftermath of hazard events to support national security and emergency response. Cell phones
can also use the GETS network; however, they will not receive priority treatment until the call reaches the
wireline system. In contrast, WPS is used to prioritize cell phone calls of users who support national
security and emergency response when the wireless network is congested or partially damaged. WPS is
supported by nine service providers: AT&T, C Spire, Cellcom, Southern LINC, Sprint, T-Mobile, GCI,
US Cellular, and Verizon Wireless [DHS 2015]. The GETS card has no cost and a small charge of 7-10
cents per minute depending upon the carrier. WPS requires a one-time setup fee of $10, a monthly fee of
$2 to $4 depending on the carrier, and approximately 75 cents per minute when making a priority call.
The GETS and WPS programs are helpful in coordinating recovery efforts in the wake of a hazard event.
However, the main goal of these programs is to provide priority service when there is congestion due to

Community Resilience Planning Guide for Buildings and Infrastructure Systems - Volume II
Communication Systems
194
limited damage and overloaded capacity. If a significant amount of the infrastructure fails, these services
may not be available.
Administrative Solutions for Critical Facilities/Users – Prioritized Recovery. Telecommunications
Service Priority (TSP) is an FCC program that enables service providers to give service priority to users
enrolled in the program when they need additional lines or need service to be restored after a disruption
[FCC 2015a]. Like GETS and WPS, eligible entities for TSP include police departments, fire
departments, 9-1-1 call centers, emergency responders, and essential health care providers (e.g.,
hospitals).
Short-Term Solutions for Restoring Service. Service providers can budget for necessary short-term
changes (0-5 years), which may include solutions such as placement and security of critical equipment
and standby generators. For the long term (5+ years), service providers can address more expensive
resilience gaps that include retrofitting existing communications buildings and improving the
performance of distribution lines. However, it is important to understand that unlike utilities that have the
ability to fund infrastructure upgrades through approved rate increases (e.g., through a Public Utilities
Commission), service providers are part of the private sector.
Although not all resilience gaps can be addressed in the short term through investment in infrastructure,
service providers can use other solutions to address these gaps. Ensuring there is a recovery plan in place
so service to customers is not lost for an extended period of time helps minimize downtime. For example,
AT&T‘s Network Disaster Recovery (NDR) team uses temporary deployments to minimize service
disruptions that focus on central office and recovery of technology [AT&T 2005]. It also has a special
operations function that would navigate in hazardous materials (hazmat) environment to maintain
functionality of the network.
Following hazard events, service providers might deploy charging stations so that everyone in the
community can maintain functionality of their cell phones. Communities may also choose to invest in
charging stations that could be deployed after hazard events so that the community would have these
stations prepositioned in areas the communities feel are most critical or will have the largest percentage of
need.
Using satellite telephones can be an alternative for critical facilities or emergency responders in the
immediate aftermath of a hazard event. Satellite phones are almost the only type of electronic
communications system that will work when cell towers are damaged and central offices or
exchanges/nodes have failed [Stephan 2007]. Unfortunately, satellite phones are used infrequently,
especially with the continuing growth of cellular phones. In 1999, the State of Louisiana used Federal
funds to provide the state‘s parishes with a satellite phone to use in the event of an emergency, but the
state stopped providing the funding to cover a monthly $65 access fee one year before Hurricane Katrina
occurred [Stephan 2009]. As a result, only a handful of churches kept the satellite phones. However, even
for those parishes that did keep their satellite phones, they did little to alleviate the communications
problem because nobody else had them when Hurricane Katrina occurred. In general, people do not own
satellite telephones so this is not the best solution for an entire community. However, for critical facilities
and communications between emergency responders or within critical facilities (e.g., hospitals), satellite
telephones may be a viable option to ensure that the ability to communicate is preserved.

Community Resilience Planning Guide for Buildings and Infrastructure Systems - Volume II
Communication Systems
195
15.7. References
American Lifelines Alliance (ALA 2006) Power Systems, Water, Transportation and Communications
Lifeline Interdependencies, American Lifelines Alliance (ALA) draft report to the Federal Emergency
Management Agency (FEMA) and the National Institute of Building Sciences (NIBS), Washington, DC,
March,
http://www.cimap.vt.edu/sites/www.cimap.vt.edu/files/docs/ALA%20Lifeline%20Report%20Final%20D
raft%20030606.pdf.
American Society of Civil Engineers (ASCE 1993) ASCE 7-93: Minimum Design Loads for Buildings
and Other Structures, American Society of Civil Engineers (ASCE) Structural Engineering Institute
(SEI), Reston, VA.
American Society of Civil Engineers (ASCE 1995) ASCE 7-95: Minimum Design Loads for Buildings
and Other Structures, American Society of Civil Engineers (ASCE) Structural Engineering Institute
(SEI), Reston, VA.
American Society of Civil Engineers (ASCE 2002) ASCE 7-02: Minimum Design Loads for Buildings
and Other Structures, American Society of Civil Engineers (ASCE) Structural Engineering Institute
(SEI), Reston, VA.
American Society of Civil Engineers (ASCE 2005) ASCE 7-05: Minimum Design Loads for Buildings
and Other Structures, American Society of Civil Engineers (ASCE) Structural Engineering Institute
(SEI), Reston, VA.
American Society of Civil Engineers (ASCE 2010) ASCE 7-10: Minimum Design Loads for Buildings
and Other Structures, Second Edition, American Society of Civil Engineers (ASCE) Structural
Engineering Institute (SEI), Reston, VA.
AT&T (2005) Best Practices: AT&T Network Continuity Overview,
http://www.corp.att.com/ndr/pdf/cpi_5181.pdf.
AT&T (2014) http://www.corp.att.com/ndr/deployment1.html, Viewed August 28, 2014.
Centre for the Protection of National Infrastructure (CPNI 2006) Telecommunications Resilience Good
Practice Guide, Version 4, United Kingdom, March.
City of Urbana Public Works Department (2001) Overhead to Underground Utility Conversion, Urbana,
Illinois, http://www2.city.urbana.il.us/_Agendas_-_Packets_-_Minutes/Agendas_2002/01-14-
2002/Overhead_Utility_Report.pdf.
Communications Security, Reliability, and Interoperability Council (CSRIC 2014) CSRIC Best Practices,
Communications Security, Reliability, and Interoperability Council (CSRIC), Public Safety & Homeland
Security Bureau, https://www.fcc.gov/nors/outage/bestpractice/BestPractice.cfm. Viewed December 16,
2014.
Department of Homeland Security (DHS 2006) A performance Review of FEMA‘s Disaster Management
Activities in Response to Hurricane Katrina, Department of Homeland Security (DHS), Washington, DC.
Department of Homeland Security (DHS 2015) GETS/WPS Documents, Washington, DC,
http://www.dhs.gov/publication/getswps-documents#. Viewed January 13, 2015. DHS,
Department of the Army (2007) Reliability/Availability of Electrical & Mechanical Systems for
Command, Control, Communications, Computer, Intelligence, Surveillance and Reconnaissance (C4ISR)
Facilities. January 19, 2007.
Erichsen, John R. (2014) ANSI/TIA-222-G Explained, Tower Numerics, Inc. Lexington, MA ,
http://www.towernx.com/downloads/TIA-222-G_Explained.pdf. Viewed July 5, 2014.

Community Resilience Planning Guide for Buildings and Infrastructure Systems - Volume II
Communication Systems
196
Federal Communications Commission (FCC 2011) Telecommunications Act of 1996,
www.fcc.gov/telecom.html. Viewed July 5, 2014.
Federal Communications Commission (FCC 2013) Impact of the June 2012 Derecho on Communications
Networks and Services – Report and Recommendations, Washington, DC.
Federal Communications Commission (FCC 2015a) Telecommunications Service Provider,
http://www.fcc.gov/encyclopedia/telecommunications-service-priority. Viewed January 13, 2015.
Federal Communications Commission (FCC 2015b) Emergency Alert System (EAS)
http://www.fcc.gov/encyclopedia/emergency-alert-system-eas. Viewed March 20, 2015.
Federal Emergency Management Agency (FEMA 2002) World Trade Center Building Performance
Study: Data Collection, Preliminary Observations, and Recommendations, Federal Emergency
Management Agency (FEMA), New York, New York.
Federal Emergency Management Agency (FEMA 2013) Mitigation Assessment Team Report: Hurricane
Sandy in New Jersey and New York. Federal Emergency Management Agency (FEMA), Washington, DC.
Fiber-to-the-Home Council (FTTH Council 2013) Comments of the Fiber-to-the Home Council on
Request to Refresh Record and Amend the Commission‘s Copper Retirement Rules. Washington, DC.
Federal Emergency Management Agency (FEMA 2015) Hazus: FEMA‘s Methodology for Estimating
Potential Losses from Disasters. https://msc.fema.gov/portal/resources/hazus. Viewed April 19, 2015.
FEMA, Washington, DC/
Institute of Electrical and Electronics Engineers (IEEE 2015) History of the National Electrical Safety
Code ANSI C2, Institute of Electrical and Electronics Engineers (IEEE),
http://standards.ieee.org/about/nesc/100/. Viewed January 26, 2015.
Jrad, Ahman et al. (2005) ―Wireless and Wireline Network Interactions in Disaster Scenarios,‖ Military
Communications Conference, Washington, DC.
Jrad, Ahman et al. (2006) ―Dynamic Changes in Subscriber Behavior and their Impact on the Telecom
Network in Cases of Emergency,‖ Military Communications Conference, Washington, DC.
Kende, Michael and Charles Hurpy (2012) Assessment of the Impact of Internet Exchange Points –
Empirical Study of Kenya and Nigeria, Analysys Mason Limited, Washington, DC, April.
Kentucky Public Service Commission (2009) Ike and Ice: The Kentucky Public Service Commission
Report on the September 2008 Wind Storm and the January 2009 Ice Storm, November 19,
https://psc.ky.gov/IkeIce/Report.pdf.
Kwasinski, Alexis (2009) Telecom Power Planning for Natural Disasters: Technology Implications and
Alternatives to U.S. Federal Communications Commission‘s ―Katrina Order‖ in View of the Effects of
2008 Atlantic Hurricane Season, 31st International Telecommunications Energy Conference (INTELEC).
Kwasinski, Alexis (2011) Effect of Notable Natural Disasters from 2005 to 2011 on Telecommunications
Infrastructure: Lessons from on-site Damage Assessments, 2011 IEEE International Telecommunications
Energy Conference (INTELEC).
Kwasinski, Alexis; Wayne Weaver; Philip Krein; and Patrick Chapman (2006) Hurricane Katrina:
Damage Assessment of Power Infrastructure for Distribution, Telecommunication, and Backup,
University of Illinois at Urbana-Champaign. Urbana-Champaign, IL.
Lower Manhattan Telecommunications Users‘ Working Group (2002) Lower Manhattan
Telecommunications Users‘ Working Group Findings and Recommendations: Building a 21st Century
Telecom Infrastructure, New York City, NY, August, http://www.nexxcomwireless.com/wp/wp-
content/uploads/2013/10/Building-a-21st-Century-Telecom-Infrastructure-Lower-Manhattan.pdf.

Community Resilience Planning Guide for Buildings and Infrastructure Systems - Volume II
Communication Systems
197
Malmedal, Keith and P.K. Sen (2003) Structural Loading Calculations of Wood Transmission Structures,
IEEE Rural Electric Power Conference.
Mehta, Kishor (2010) Wind Load History ANSI A58.1-1972 to ASCE 7-05. Structures Congress,
American Society of Civil Engineers.
National Oceanic and Atmospheric Administration (NOAA 2013) Service Assessment: The Historic
Derecho of June 29, 2012, National Weather Service (NWS), Silver Spring, MD, January,
http://www.nws.noaa.gov/os/assessments/pdfs/derecho12.pdf.
Oregon Seismic Safety Policy Advisory Commission (OSSPAC 2013) The Oregon Resilience Plan:
Reducing Risk and Improving Recovery for the Next Cascadia Earthquake and Tsunami, Salem, Oregon.
PPD-21 (2013) Presidential Policy Directive/PPD-21, The White House, February 12, 2013,
http://www.whitehouse.gov/the-press-office/2013/02/12/presidential-policy-directive-critical-
infrastructure-security-and-resil.
San Francisco Planning and Urban Research Association (SPUR 2009) The Resilient City: What San
Francisco Needs from its Seismic Mitigation Policies, San Francisco Planning and Urban Research
Association (SPUR), San Francisco, CA.
Stephan, Karl D. (2007) ―We‘ve got to Talk: Emergency Communications and Engineering Ethics,‖
Technology and Society Magazine, Institute of Electrical and Electronics Engineers (IEEE) Society on
Social Implications of Technology, 26(3), pp. 42-48, 10 September .
Telecommunications Industry Association (TIA 2006) Structural Standards for Antenna Supporting
Structures and Antennas, TIA -222-G, Telecommunications Industry Association (TIA), Arlington, VA.
Telecommunications Industry Association (TIA 2014) TR-14 Structural Standards for Communication
and Small Wind Turbine Support Structures, http://www.tiaonline.org/all-standards/committees/tr-14.
Viewed September 22, 2014.
The City of New York (2013) A Stronger, More Resilient New York, The City of New York, New York.
The Lifelines Council of the City and County of San Francisco (2014) Lifelines Interdependency Study 1
Report, San Francisco, California,
http://www.sfgsa.org/modules/showdocument.aspx?documentid=12025.
Victory, Nancy et al. (2006) Report and Recommendations of the Interdependent Panel Reviewing the
Impact of Hurricane Katrina on Communications Networks, Washington, DC.
Wahba, John; D. Brinker; M. Malouf; and J. Erichsen (2003) New Standards for Broadcast Structures
ANSI/EIA/TIA-222-G, http://www.mei1inc.com/NAB-2003presentation.pdf.
West Virginia Broadband, Broadband Glossary,
http://www.westvirginia.com/broadband/mediaroom/BroadbandGlossary.pdf. Viewed July 15, 2014.

Community Resilience Planning Guide for Buildings and Infrastructure Systems - Volume II
Water and Wastewater Systems
198
16. Water and Wastewater Systems
Water and Wastewater Systems Executive Summary
Water and wastewater infrastructure systems are essential for sustaining the economic and social viability
of a community. The average consumption of water across the U.S. has been calculated to be 98 gallons
per person per day for activities such as drinking, cooking, personal hygiene, flushing toilets, and laundry
[Aubuchon & Morley 2012]. Similarly most businesses and industries are dependent on water and
wastewater disposal. Communities can generally accommodate short-term disruptions in water and
wastewater services resulting from hazard events. However, longer-term outages are highly disruptive to
community recovery and functions.
Water systems are supplied by either surface or ground water. Water systems treat and store the water,
and move it to the end user through a system of pipelines. Wastewater systems operate in the reverse,
collecting wastewater, and moving it through a system of pipelines and pump stations to a treatment plant
where it is discharged into a receiving water (e.g., river or bay) or, if adequately treated, into an aquifer.
These systems are vulnerable to natural and human-caused events. Supplies can be disrupted due to
floods, spills, wildfires, and landslides. Transmission pipelines may be damaged by landslides, floods and
earthquakes. Treatment plants can be submerged when levees are overtopped, sometimes requiring weeks
or months to restore service. Earthquakes can damage treatment plant structures and equipment as a result
of lateral loading (due to shaking) and failure of foundations (due to liquefaction). Storage reservoirs are
subjected to seismically-induced forces on their contents, buckling tank walls. Buried pipelines, both
water and sewer, may suffer failures caused by ground movement in earthquakes and floods.
Communities have experienced myriad incidents that have resulted in impacts to water and wastewater
systems requiring weeks or months to restore.
The large and distributed nature of water and wastewater systems, combined with their dependence on
other infrastructure systems, limits the practicality of maintaining a 100 % operational capacity after a
major natural hazard. Desired performance goals need to be developed with stakeholders, including
individual utilities. It is important to consider the uniqueness of the infrastructure of individual utilities
and the specific needs of their customers when adopting system performance goals for a community.
Water and wastewater stakeholder engagement is critical in establishing a community-specific level of
service performance goals for each of the three different hazard levels (routine, design, and extreme).
Dependencies of water and wastewater systems on other infrastructure also needs to be considered when
developing performance goals. For instance, availability of a reliable supply of liquid fuel impacts how
long systems can run on standby generators. The available supply of liquid fuel also impacts repair crews‘
vehicles and equipment. In turn, local delivery of liquid fuels depends on the status of the highway and
bridge transportation network. Electric power is required for pumping, communication, and control
systems.
Focusing on major system components that form a backbone network capable of supplying key health and
safety-related community needs shortly after a hazard event is one way to focus priorities for community
recovery. Less costly short-term solutions combined with longer term improvements to infrastructure
systems can increase community resilience and help with the cost of implementing solutions.
Performance goals for critical water and wastewater system functions should be developed for short
(days), intermediate (weeks), and long (months) duration outages. It is important that performance goals
take into account the community‘s social and infrastructure needs.
Federal and state governments set requirements for water and wastewater system performance on a day to
day, or year to year basis, but are generally silent on performance when subjected to catastrophic events.
Community Resilience Planning Guide for Buildings and Infrastructure Systems - Volume II
Water and Wastewater Systems
199
Over the years, codes and standards have been developed to address the performance of system structures
for various hazards, e.g., wind and earthquake loads. While most modern buildings and structures are
expected to perform well during design events, older structures may not be as robust. However, buried
pipelines may be vulnerable to ground disturbances caused by flooding or earthquakes.
Water and wastewater facilities often contain both older and newer components constructed to different
specifications. Assessments to evaluate the anticipated performance of these system components and the
overall system during hazard events will help predict whether they will meet the desired performance
goals. The process should include an assessment of the time it would take to restore service given the
damage state of the various facilities. For example, how long will it take a water treatment plant to restore
operation? How long will it take to repair all of the pipelines?
Bringing a utility to the desired level of performance, to be able to meet the desired goals, may take
decades. Even so, it is important to develop performance goals, evaluate the system‘s ability to meet those
performance goals when tested by a hazard event, and identify the gaps. Plans should be developed to
address those gaps and implement the solutions to enhance community resilience over a selected time
frame.
16.1. Introduction
This chapter addresses community resilience of public drinking water and wastewater systems, which are
essential for sustaining the economic and social viability of a community [Hoover, 1941]. Although these
systems provide basic public health and safety to homes, businesses, and industry, they are often taken for
granted because of the high level of service and reliability provided daily by water and wastewater
utilities. The importance of these systems is not recognized until a water main break or other disruptions
in service occurs.
Some utilities may develop targeted capital improvement plans to improve the resilience of their systems,
and other utilities may only perform emergency repairs. Demands on water and wastewater systems
include sustaining system capacity while meeting population growth, or making system improvements to
maintain public health and satisfy environmental regulations. Communities have an opportunity to
improve resilience through planned retrofits or replacements to improve the resilience of water and
wastewater infrastructure systems.
However, the water and wastewater systems face challenges beyond infrastructure performance. Drinking
water quality and environmental impact are two key issues. For example, if drinking water of poor quality
is delivered to customers, there is significant risk that the public may become ill from consumption.
Wastewater utilities operate within strict environmental constraints to prevent excessive pollution that
contributes to environmental damage and, ultimately, impacts the health of the humans and animals.
Although this chapter touches on such issues, its main focus is how to develop a more resilient
infrastructure system that delivers water and wastewater services with fewer disruptions.
16.1.1. Social Needs and Systems Performance Goals
Water services are essential to our daily lives. Using USGS data, Aubuchon & Morley [2012] calculated
the average consumption of water across all U.S. states to be 371 liters (98 gallons) per person per day.
However, water consumption varies by community and by customer. Personal uses include water for
drinking and cooking, personal hygiene, flushing toilets, laundry, landscape irrigation, and many others.
Many businesses and industries depend on a continual supply of potable water and wastewater collection
services. Absent functioning drinking water and wastewater systems, the operation of restaurants, child
care facilities, hotels, medical offices, food processing plants, paper mills, etc., would be significantly
compromised. Additionally, drinking water systems are often the primary source of water for fire

Community Resilience Planning Guide for Buildings and Infrastructure Systems - Volume II
Water and Wastewater Systems
200
suppression in many communities. Chapter 10 discusses societal dependence on water and wastewater
systems and other infrastructure systems in more detail.
In the United States, communities can generally accommodate short-term (on the order of a few days)
disruptions in water and wastewater services resulting from human-caused or natural hazard events.
However, longer-term events can be highly disruptive to the entire community. The Oregon Resilience
Plan [OSSPAC, 2013] indicated that if a business cannot reoccupy its facilities within one month, it may
be forced to move or dissolve. Such timelines vary depending on the community and the severity of the
event. Development of realistic desired performance goals for post-event level of service by water and
wastewater utility providers can provide a direct long-term benefit to the community they serve. This
includes evaluating the systems status in relation to those goals, and developing solutions to close the
identified resilience gaps. Water flow, pressure, and quality should be considered in the performance
goals.
16.1.2. Dependencies
As discussed in Chapter 11, water system operations depend on other infrastructure systems, both for day-
to-day operation and for restoration following a hazard event. System dependencies (e.g., loss of
commercial electrical power in a high wind event) can have a significant impact on the operations of
water and wastewater systems [Elliott and Tang 2009]. Electric power is necessary for maintaining
pumping and treatment operations. Transportation systems allow access for inspection and repairs after
the event, as well as supplying necessary chemicals and equipment for operation. However, many of these
systems also have dependencies on the water systems. Figure 16-1 presents some dependencies of the
water infrastructure system with other infrastructure systems.
Figure 16-1: Water dependencies with other infrastructure systems

Community Resilience Planning Guide for Buildings and Infrastructure Systems - Volume II
Water and Wastewater Systems
201
Some of the most important dependencies for the water and wastewater infrastructure systems are
explained as follows:
1. Energy (electric and fuel). Water and wastewater utilities rely on commercial electricity to run
pumps, treatment processes, and lab and office operations. Some of these functions may have
standby power, but overall power demands make it impractical for most water and wastewater
systems to operate entirely on standby generators. However, short-term power loss events are
often mitigated by use of standby generators for critical equipment to maintain basic water and
wastewater operations. These emergency conditions depend on a sustained fuel supply for
standby generators, utility vehicles, and equipment. Disruption in fuel production, storage, or
delivery may severely impact a water utility‘s ability to sustain operations on standby generator
power and to perform repairs.
2. Transportation (staff, supplies, pipelines). Staff at water and wastewater facilities depend on
roadway and bridge transportation systems for facility access. Damage to transportation
infrastructure potentially complicates and lengthens repair times or even prevents repairs until
roadways and bridges are usable. Water and wastewater utilities may have a limited stock of
pipes, fittings, and other repair materials to use in response and recovery operations. Depending
on the size of the event, this stock may be quickly depleted due to supply chain disruptions. Such
disruptions may also impact the available equipment and personnel support from mutual aid, such
as the Water/Wastewater Agency Response Network (WARN). Utilities also rely on a semi-
regular delivery of treatment process chemicals that are essential for meeting water quality
regulations that ensure public and environmental health.
3. Water and wastewater distribution and conveyance. Water and wastewater distribution and
conveyance networks are often under or adjacent to roadways, and in many instances are co-
located with other buried infrastructure. Failure of underground utilities may result in damage to
the roadway (e.g., sinkhole from water main break or collapsed sewer) and significantly impact
traffic. In addition, damage to the road or bridge systems can also compromise the functionality
of underground utilities.
4. Communications and information. Water and wastewater utilities often rely on radio,
microwave, cellular and related networks to communicate to operations staff and contractors. If
these networks are down for an extended period, complications and delays in operations and
repairs can occur. Additionally, supervisory control and data acquisition (SCADA) networks are
used extensively within both water and wastewater systems to monitor and control various
processes and equipment.
The communications system infrastructure also depends on water infrastructure. For example, air
conditioning system cooling towers that support communications require water to keep sensitive
electronic equipment in central offices at safe operating temperatures. Furthermore, fire
ordinances may prohibit occupancy if water and wastewater systems are not functioning.
5. Buildings (critical, commercial, general public). Water and wastewater utilities rely on
administrative buildings. New Orleans water and sewer operations (e.g., treatment, distribution,
collection, and administrative) were severely impacted following Hurricane Katrina, and included
the loss of customer billing and other records due to significant flooding. During this same event,
a hospital in New Orleans was forced to evacuate when the hospital lost water pressure and was
unable to maintain the HVAC system needed by patients in critical care units [Randon, 2006].
Buildings need water supply with adequate flow and pressure for fire suppression, as well as
sanitation. Industrial facilities need functional water and wastewater systems for developing,
processing, and manufacturing materials and products. The public relies on water and wastewater
services for overall health of the community.

Community Resilience Planning Guide for Buildings and Infrastructure Systems - Volume II
Water and Wastewater Systems
202
Water and wastewater utilities rely on customers (e.g., commercial and residential) as a continued
source of capital. Utilities may have significant capital expenditures after a hazard event and loss
of service may lead to displacement of customers or the event may result in customer loss of
personal income or inability to send payments.
16.2. Water and Wastewater Infrastructure
This section describes basic components of water and wastewater systems. Performance observations
from past hazard events characterize some key hazard vulnerabilities in water and wastewater systems.
Water and wastewater infrastructure are vulnerable to a number of hazards: buried pipelines are
vulnerable to breaks during earthquakes, and water and wastewater treatment facilities are vulnerable to
flood hazards. Facilities are often placed in or near flood hazard areas, which is consistent with their
functional dependency on natural water resources.
16.2.1. Water Infrastructure
Drinking water is treated to satisfy public health standards and distributed to consumers by a network of
pipelines. Some water utilities have their own supply and treatment infrastructure, while others buy
wholesale water from neighboring utilities.
Drinking water systems are composed of six general infrastructure categories: 1) supply, 2) transmission,
3) treatment, 4) pumping, 5) storage, and 6) distribution. The basic function of each category and
infrastructure system (electric power, transportation, communication) can be impacted by a variety of
hazards, as shown in Table 16-1 and discussed in Section 16.1.2. Some examples of hazard related
impacts on water infrastructure seen in past events are discussed in the following sections.
16.2.1.1. Supply
Drinking water supply can come from groundwater or surface water, as described below. In some cases,
utilities may have both groundwater and surface water supplies.
Groundwater. Rainfall and snowmelt recharge groundwater aquifers. Groundwater wells tap aquifers and
supply water to individual households or public water systems. A well system consists of the groundwater
aquifer, well casing and screen, pump and motor, power supply, electrical equipment and controls,
connecting piping, and possibly a well house structure. Typically, wells are cased with a steel pipe.
Screens in the well casing at the depth of the aquifer allow water to enter the casing. A submersible or
surface-mounted pump conveys water to the transmission system.
Surface Water. Rainfall and snowmelt collects in streams, rivers, and lakes, and is sometimes impounded
by dams for a drinking water supply. Water intake structures in lakes or rivers and dams then convey the
source water to treatment facility. Intake structures generally include some type of bar screens to keep
large debris and aquatic life from entering the treatment plant.
Contamination of surface and groundwater sources may occur during or after natural and human-caused
hazards. In flood conditions, groundwater well heads can be inundated. If contaminants enter well
systems they will require extensive flushing to recover, and in some cases may not be recoverable. In
surface water systems, flooding can increase turbidity and contaminants like petroleum and nutrient or
organic matter can overwhelm treatment operations and pose a public health risk.
Contamination can also result from accidental releases from industrial sources in the watershed. In 2014,
in West Virginia, 4-methylcyclohexanemethanol (MCHM) was released into the Elk River, contaminating
water serving 300,000 people. It took months to restore full water service [Rosen et al., 2014].

Community Resilience Planning Guide for Buildings and Infrastructure Systems - Volume II
Water and Wastewater Systems
203
Table 16-1: Common hazards and their potential related consequences [Adapted from Preparedness,
Emergency Response, and Recovery CIPAC Workgroup 2009]
Potential Related Consequences
Flo
od
Ex
trem
e W
ind
s
Lig
htn
ing
Dro
ug
ht/
Wa
ter S
up
ply
Lo
ss
Hu
rric
an
e, T
orn
ad
o
Ea
rth
qu
ak
e
Sev
ere
Wea
ther
(e.
g.,
ice/
sno
w/s
torm
s)
Fir
e/W
ild
fire
Po
wer
or
Co
mm
un
ica
tio
n F
ail
ure
Wea
po
ns
of
Ma
ss D
est
ruct
ion
Cy
ber
Att
ack
Infr
ast
ruct
ure
Fa
ilu
re
Ha
zard
ou
s M
ate
ria
l R
elea
se
Va
nd
ali
sm/S
ab
ota
ge/
Ter
rori
sm
Eco
no
mic
Dis
ru
pti
on
Su
pp
ly C
ha
in D
isru
pti
on
Pa
nd
emic
Flu
Per
ceiv
ed I
nci
den
ts
Service disruption of source water,
water or wastewater treatment
system, storage system,
distribution system, collection
system, communications, and
electric power
● ● ● ● ● ● ● ● ● ● ● ● ● ● ● ● ● ●
System contamination, including
chemical, radiological, and
biological, and problems
associated with threatened
contamination, actual
contamination, and perceived
contamination.
● ● ● ● ● ● ● ● ● ● ● ●
Damage to infrastructure systems ● ● ● ● ● ● ● ● ● ● ● ●
Environmental impacts to
community ● ● ● ● ● ● ● ● ● ● ●
Loss of revenue, other serious
economic disruption in the
community, or loss of essential
supplies because contracts are
voided or delivery is interrupted
● ● ● ● ● ● ● ● ● ● ● ● ● ●
Denied or limited access to utility
facilities and infrastructure; for
example, if facilities are unsafe or
unreachable
● ● ● ● ● ● ● ● ● ●
Loss of employees/contractors; for
example, if roads are impassable,
they are sick, or they are taking
care of their family
● ● ● ● ● ● ● ●
Loss of public confidence ● ● ● ● ● ● ● ● ● ●
Loss of SCADA systems ● ● ● ● ● ● ● ● ● ● ● ● ●
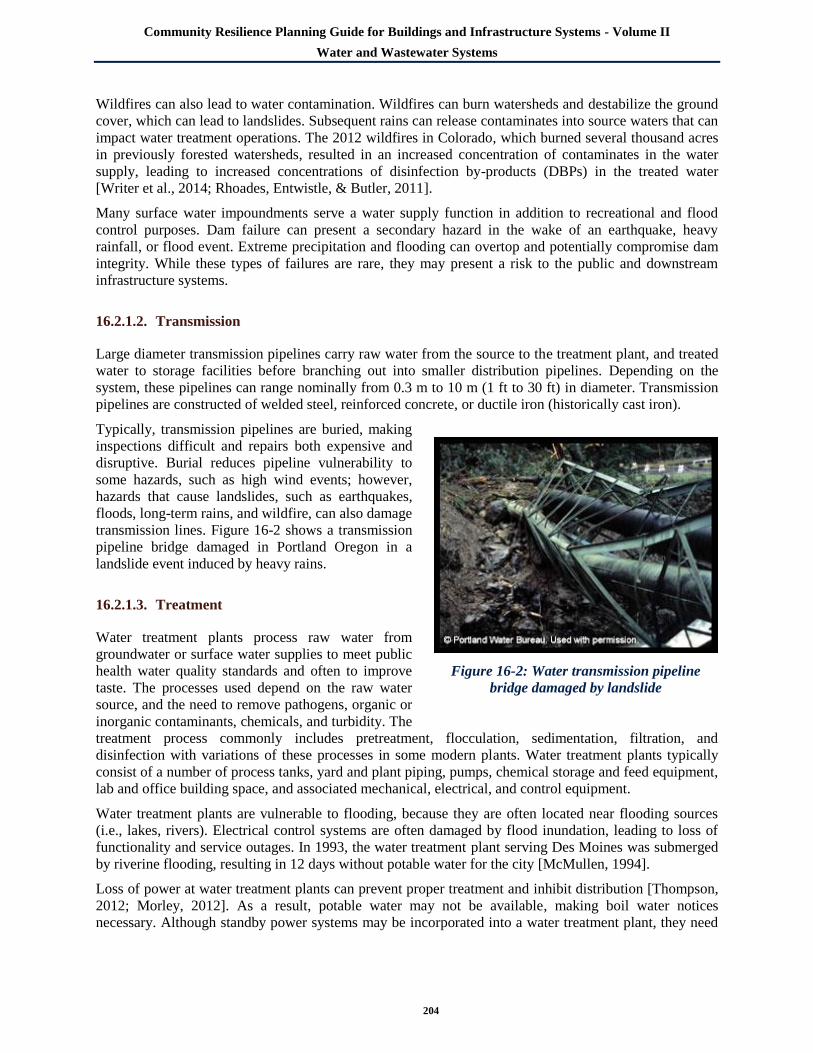
Community Resilience Planning Guide for Buildings and Infrastructure Systems - Volume II
Water and Wastewater Systems
204
Wildfires can also lead to water contamination. Wildfires can burn watersheds and destabilize the ground
cover, which can lead to landslides. Subsequent rains can release contaminates into source waters that can
impact water treatment operations. The 2012 wildfires in Colorado, which burned several thousand acres
in previously forested watersheds, resulted in an increased concentration of contaminates in the water
supply, leading to increased concentrations of disinfection by-products (DBPs) in the treated water
[Writer et al., 2014; Rhoades, Entwistle, & Butler, 2011].
Many surface water impoundments serve a water supply function in addition to recreational and flood
control purposes. Dam failure can present a secondary hazard in the wake of an earthquake, heavy
rainfall, or flood event. Extreme precipitation and flooding can overtop and potentially compromise dam
integrity. While these types of failures are rare, they may present a risk to the public and downstream
infrastructure systems.
16.2.1.2. Transmission
Large diameter transmission pipelines carry raw water from the source to the treatment plant, and treated
water to storage facilities before branching out into smaller distribution pipelines. Depending on the
system, these pipelines can range nominally from 0.3 m to 10 m (1 ft to 30 ft) in diameter. Transmission
pipelines are constructed of welded steel, reinforced concrete, or ductile iron (historically cast iron).
Typically, transmission pipelines are buried, making
inspections difficult and repairs both expensive and
disruptive. Burial reduces pipeline vulnerability to
some hazards, such as high wind events; however,
hazards that cause landslides, such as earthquakes,
floods, long-term rains, and wildfire, can also damage
transmission lines. Figure 16-2 shows a transmission
pipeline bridge damaged in Portland Oregon in a
landslide event induced by heavy rains.
16.2.1.3. Treatment
Water treatment plants process raw water from
groundwater or surface water supplies to meet public
health water quality standards and often to improve
taste. The processes used depend on the raw water
source, and the need to remove pathogens, organic or
inorganic contaminants, chemicals, and turbidity. The
treatment process commonly includes pretreatment, flocculation, sedimentation, filtration, and
disinfection with variations of these processes in some modern plants. Water treatment plants typically
consist of a number of process tanks, yard and plant piping, pumps, chemical storage and feed equipment,
lab and office building space, and associated mechanical, electrical, and control equipment.
Water treatment plants are vulnerable to flooding, because they are often located near flooding sources
(i.e., lakes, rivers). Electrical control systems are often damaged by flood inundation, leading to loss of
functionality and service outages. In 1993, the water treatment plant serving Des Moines was submerged
by riverine flooding, resulting in 12 days without potable water for the city [McMullen, 1994].
Loss of power at water treatment plants can prevent proper treatment and inhibit distribution [Thompson,
2012; Morley, 2012]. As a result, potable water may not be available, making boil water notices
necessary. Although standby power systems may be incorporated into a water treatment plant, they need
Figure 16-2: Water transmission pipeline
bridge damaged by landslide
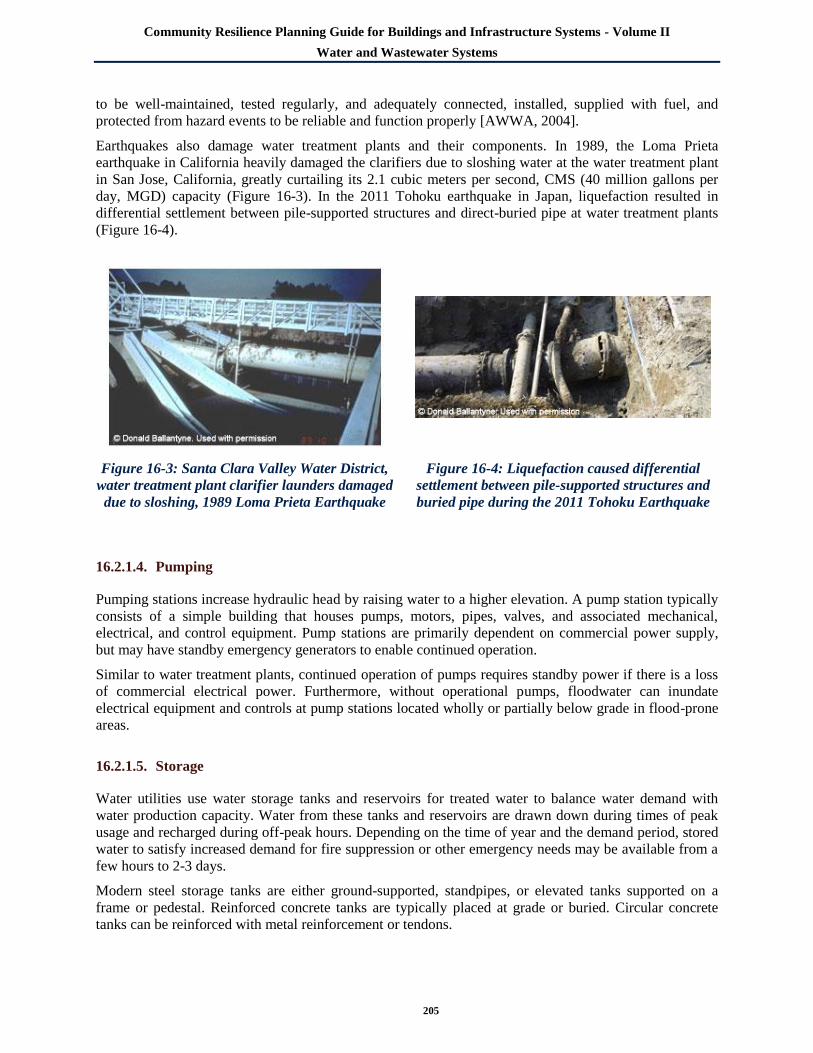
Community Resilience Planning Guide for Buildings and Infrastructure Systems - Volume II
Water and Wastewater Systems
205
to be well-maintained, tested regularly, and adequately connected, installed, supplied with fuel, and
protected from hazard events to be reliable and function properly [AWWA, 2004].
Earthquakes also damage water treatment plants and their components. In 1989, the Loma Prieta
earthquake in California heavily damaged the clarifiers due to sloshing water at the water treatment plant
in San Jose, California, greatly curtailing its 2.1 cubic meters per second, CMS (40 million gallons per
day, MGD) capacity (Figure 16-3). In the 2011 Tohoku earthquake in Japan, liquefaction resulted in
differential settlement between pile-supported structures and direct-buried pipe at water treatment plants
(Figure 16-4).
Figure 16-3: Santa Clara Valley Water District,
water treatment plant clarifier launders damaged
due to sloshing, 1989 Loma Prieta Earthquake
Figure 16-4: Liquefaction caused differential
settlement between pile-supported structures and
buried pipe during the 2011 Tohoku Earthquake
16.2.1.4. Pumping
Pumping stations increase hydraulic head by raising water to a higher elevation. A pump station typically
consists of a simple building that houses pumps, motors, pipes, valves, and associated mechanical,
electrical, and control equipment. Pump stations are primarily dependent on commercial power supply,
but may have standby emergency generators to enable continued operation.
Similar to water treatment plants, continued operation of pumps requires standby power if there is a loss
of commercial electrical power. Furthermore, without operational pumps, floodwater can inundate
electrical equipment and controls at pump stations located wholly or partially below grade in flood-prone
areas.
16.2.1.5. Storage
Water utilities use water storage tanks and reservoirs for treated water to balance water demand with
water production capacity. Water from these tanks and reservoirs are drawn down during times of peak
usage and recharged during off-peak hours. Depending on the time of year and the demand period, stored
water to satisfy increased demand for fire suppression or other emergency needs may be available from a
few hours to 2-3 days.
Modern steel storage tanks are either ground-supported, standpipes, or elevated tanks supported on a
frame or pedestal. Reinforced concrete tanks are typically placed at grade or buried. Circular concrete
tanks can be reinforced with metal reinforcement or tendons.

Community Resilience Planning Guide for Buildings and Infrastructure Systems - Volume II
Water and Wastewater Systems
206
Storage tanks are vulnerable to a number of hazards. Elevated storage tanks are more susceptible to
hazards from high winds than structures located at grade and can be damaged to the point of structural
failure during wind or storm surge events. Figure 16-5 shows a collapsed water tank in Louisiana near
Hurricane Katrina‘s landfall. The failure was likely caused by a combination of wind and storm surge
effects.
At-grade or partially-buried storage tanks may be susceptible to flood damage (from hurricane storm
surge, riverine flooding, or tsunamis), particularly if located in or near flood-prone areas. Tank damage or
failure can be caused by both hydrostatic forces from standing or slow moving water, or hydrodynamic
forces imposed by higher velocity flows or wave action. Buoyancy forces can cause uplift of empty
subgrade tanks if the soil becomes saturated. Figure 16-6 shows two liquid fuel tanks in the foreground
that floated and were toppled by tsunami wave inundation after the 2011 Tohoku, Japan tsunami. The
tank in the background was on higher ground and does not appear to have been damaged.
Figure 16-5: Collapsed water tank in Buras, LA near
Hurricane Katrina landfall location [Source: FEMA]
Figure 16-6: Steel tanks damaged due to
Tohoku, Japan Tsunami in 2011
Lateral loads from shaking and permanent ground deformation due to ground liquefaction and landslides
during earthquakes can damage storage tanks. Water sloshing in storage and process tanks during
earthquakes can fail tank walls and baffles. In the 1994 Northridge earthquake, a Los Angeles water tank
moved, severing piping, as shown in Figure 16-7. The utility north of Los Angeles suffered elephant‘s
foot buckling in a steel tank as shown in Figure 16-8.
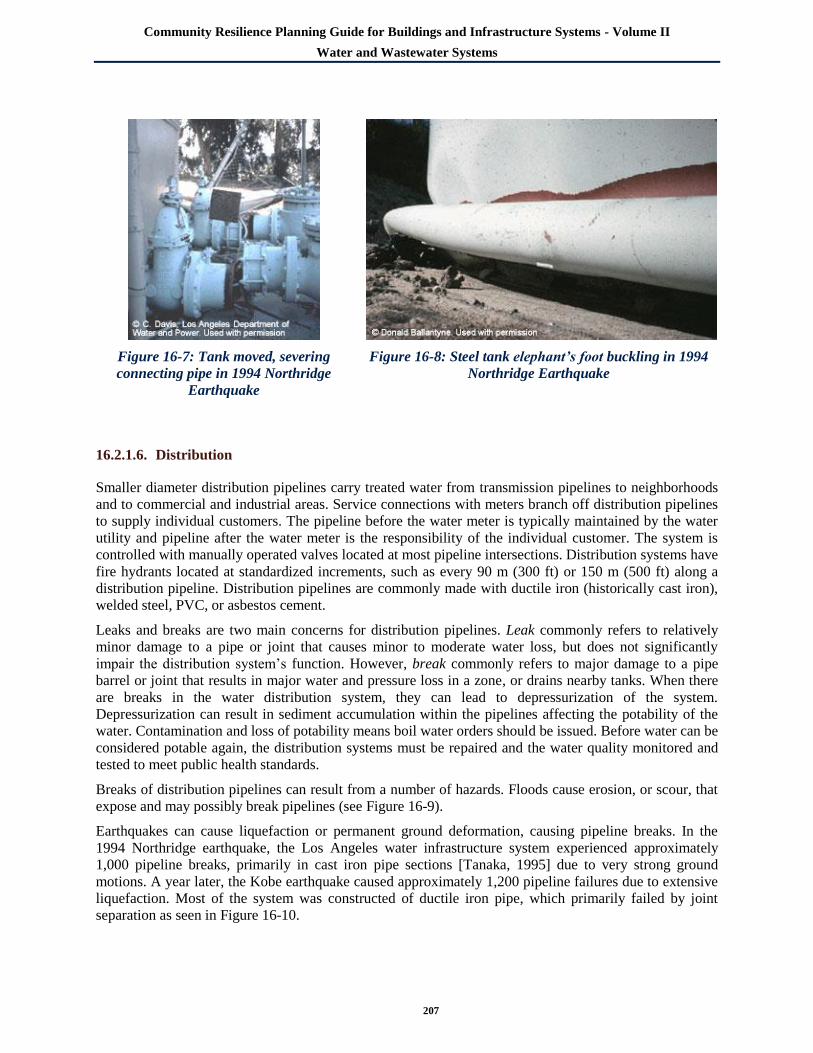
Community Resilience Planning Guide for Buildings and Infrastructure Systems - Volume II
Water and Wastewater Systems
207
Figure 16-7: Tank moved, severing
connecting pipe in 1994 Northridge
Earthquake
Figure 16-8: Steel tank elephant’s foot buckling in 1994
Northridge Earthquake
16.2.1.6. Distribution
Smaller diameter distribution pipelines carry treated water from transmission pipelines to neighborhoods
and to commercial and industrial areas. Service connections with meters branch off distribution pipelines
to supply individual customers. The pipeline before the water meter is typically maintained by the water
utility and pipeline after the water meter is the responsibility of the individual customer. The system is
controlled with manually operated valves located at most pipeline intersections. Distribution systems have
fire hydrants located at standardized increments, such as every 90 m (300 ft) or 150 m (500 ft) along a
distribution pipeline. Distribution pipelines are commonly made with ductile iron (historically cast iron),
welded steel, PVC, or asbestos cement.
Leaks and breaks are two main concerns for distribution pipelines. Leak commonly refers to relatively
minor damage to a pipe or joint that causes minor to moderate water loss, but does not significantly
impair the distribution system‘s function. However, break commonly refers to major damage to a pipe
barrel or joint that results in major water and pressure loss in a zone, or drains nearby tanks. When there
are breaks in the water distribution system, they can lead to depressurization of the system.
Depressurization can result in sediment accumulation within the pipelines affecting the potability of the
water. Contamination and loss of potability means boil water orders should be issued. Before water can be
considered potable again, the distribution systems must be repaired and the water quality monitored and
tested to meet public health standards.
Breaks of distribution pipelines can result from a number of hazards. Floods cause erosion, or scour, that
expose and may possibly break pipelines (see Figure 16-9).
Earthquakes can cause liquefaction or permanent ground deformation, causing pipeline breaks. In the
1994 Northridge earthquake, the Los Angeles water infrastructure system experienced approximately
1,000 pipeline breaks, primarily in cast iron pipe sections [Tanaka, 1995] due to very strong ground
motions. A year later, the Kobe earthquake caused approximately 1,200 pipeline failures due to extensive
liquefaction. Most of the system was constructed of ductile iron pipe, which primarily failed by joint
separation as seen in Figure 16-10.

Community Resilience Planning Guide for Buildings and Infrastructure Systems - Volume II
Water and Wastewater Systems
208
Figure 16-9: Exposed (left) and broken(right) distribution lines resulting from flooding in Jamestown,
CO [Source: Environmental Protection Agency]
Figure 16-10: Ground cracking (left) and joint separation in ductile iron pipe (right) due to
liquefaction during 1995 Kobe Earthquake
Figure 16-10a (left) shows ground cracking due to liquefaction/lateral spreading in the Kobe Earthquake,
1995. Figure 16-10b (right) shows separation of a ductile iron pipe joint in the ground crack.
Wind events can result in damage to distribution lines by uprooted trees. For example, during Hurricane
Andrew, there was extensive damage to the water distribution systems in Southern Florida primarily
caused by tree roots that had grown around the water mains and service lines [Murphy, 1994]. When
these trees were uprooted by hurricane force winds (Hurricane Andrew was a Category 5 on the Saffir-
Sampson scale when it made landfall in Dade County, Florida), the distribution system was damaged.
Similar damage to water transmission and distribution systems occurred during Hurricanes Katrina and
Rita in Louisiana [Allouche et al. 2006]. As stated above, no matter the cause of damage, pipeline breaks
that depressurize the water system can lead to contamination through the pipelines and affect the
potability of the water. One approach to address contamination concerns during the recovery process is to
repair the pipelines; then, as pressure zone repairs are completed, disinfect the entire zone at one time.

Community Resilience Planning Guide for Buildings and Infrastructure Systems - Volume II
Water and Wastewater Systems
209
16.2.2. Wastewater Systems
Wastewater systems collect domestic and industrial liquid waste products and convey them to treatment
plants through collection and conveyance systems and pump stations. After separation of solids and
biological processing and disinfection, treated wastewater is discharged as effluent into a receiving body
of water or may be reused for irrigation or other purposes. Some utilities have separate collection systems
for wastewater and storm water; other utilities have collection systems that combine collected wastewater
and storm water in the same pipelines.
Pipeline system failure can discharge raw sewage into basements, onto city streets, and into receiving
waters, resulting in public health issues and environmental contamination. Standard wastewater systems
are composed of five general categories of infrastructure: 1) collection, 2) conveyance, 3) pumping, 4)
treatment, and 5) discharge. The subsections below briefly describe the basic function of each category.
16.2.2.1. Collection and Conveyance
The collection pipeline network for wastewater systems is similar to that for water systems. The
wastewater collection system conveys liquid and other waste products away from customers to a
treatment facility, instead of delivering water to individual customers. This is usually accomplished using
gravity flows in sewers. The elevation and grade of the pipelines in the system need to be carefully
controlled to maintain gravity flow in the system. In some instances, pumps convey wastewater through
pressurized mains. Infiltration and inflow of groundwater into the collection system through cracks and
breaks in the pipe can significantly increase the volume of wastewater that arrives at the treatment plant.
A variety of pipe materials are commonly found in collection systems, including vitrified clay, reinforced
concrete, PVC, brick and steel.
Collection systems have manholes at regular intervals, allowing access for cleaning and maintenance.
Manholes are usually constructed with concrete, although historically manholes were often constructed
with brick.
The conveyance system for the wastewater network is similar to the transmission system for a water
system. Conveyance pipelines are larger in diameter, and are often deeper underground. The conveyance
systems are designed to collect sewage from the collection system and move it to the wastewater
treatment plant. Like collection systems, they may include pump stations. In many instances, these
conveyance systems were installed in the early to mid-1900s as the United States began to clean up its
waterways. Many cities installed sewers that carried both sewage and storm water. Recently, the EPA is
encouraging wastewater utilities to minimize discharge of raw sewage and to receive water runoff during
heavy rain events. As a result, many conveyance systems now have storage capacity, taking the form of a
wide point in the line and, in some cases, simplified wastewater treatment facilities.
Wastewater collection and conveyance pipes have similar causes of damage to those of water distribution
and transmission pipelines. Wastewater collection pipelines can be exposed and damaged because of
landslides, erosion, or scour, which damages or breaks the pipelines. Furthermore, wastewater collection
pipelines can be damaged in wind events by uprooted trees when root systems have grown around the
pipelines.
In the collection and conveyance system, pipelines can be damaged by earthquake effects of ground
shaking, liquefaction, and lateral spreading. Sewer pipes can be damaged by shaking, which can cause
joints to crack, but the system may remain operable. These cracks will ultimately have to be repaired to
control infiltration. Liquefaction can result in separated joints and displaced pipe. Another cause of failure
is pipe flotation, occurring when a partially-filled gravity sewer is surrounded by liquefied soil.

Community Resilience Planning Guide for Buildings and Infrastructure Systems - Volume II
Water and Wastewater Systems
210
In general, tunnels are resistant to earthquake damage as they are typically below the region where ground
movement occurs. However, there have been instances where interior concrete tunnel liners have spalled
as a result of earthquake forces. Tunnel portals are also vulnerable to damage by landslides.
Flooding can also damage wastewater collection pipelines in a number of ways. Pipelines that are co-
located on bridges can experience damage caused by flood inundation and flood-borne debris impact.
Hydrodynamic forces associated with coastal flooding or high velocity flows are more likely to damage
structures and attached pipelines than inundation alone. In the New Orleans area after Hurricane Katrina,
the most common damage to buried wastewater pipelines observed by clean-up crews was separation of
pipe joints, leaks, and breaks. This damage was believed to be the result of floodwaters supersaturating
soils, followed by drainage that led to soil shrinkage and subsidence. Without support of the surrounding
soils, the pipelines broke and fractured [Chisolm and Matthews 2012]. Increased flow and pressurization
of the wastewater collection systems can occur during flood events. Inflow and water infiltration through
cracks may damage pipelines, particularly in cases where pipes are composed of materials such as
vitrified clay. For example, during the 1997 Red River Flood in Grand Forks, North Dakota,
pressurization caused breaking of vitrified clay pipe and hairline cracks increased the rate of overall pipe
deterioration [Chisolm and Matthews 2012].
16.2.2.2. Pumping
Gravity feed systems use pump stations to transfer wastewater to a higher elevation. The pump station
may discharge wastewater at the higher elevation to another section of a gravity pipeline, or the
wastewater may remain in a pressurized main pipeline and be discharged at another location, such as a
treatment plant. A pump station typically consists of a simple building that houses pumps, motors, pipes,
and associated mechanical, electrical, and control equipment. The pumps can be located in a building
(typically a wetwell-drywell layout) or a large manhole (submersible). Many pump stations have standby
generators, and plugs for quick connection of portable generators to enable continued operation when the
commercial power supply is interrupted.
Pump stations are vulnerable to a number of hazards, including earthquakes and flooding. Unless
designed to be submersible, floodwater that inundates the pumps can disable and damage them and their
motors. This was a common cause of pump station failure in New York City during flood inundation
from Hurricane Sandy [NYCDEP 2013]. Damage can be worse with salt water flooding, as it leads to
widespread corrosion.
Loss of commercial electrical power prevents operation of pumps if adequate standby power is not
provided or the generators are not refueled in a timely manner. Earthquakes can cause liquefaction,
causing buried wastewater collection wells at pump stations to float and tilt. This movement damages
connected piping and renders the pump station inoperable. Manholes and pump stations are also
susceptible to floating if surrounding soils are liquefied. Displacements that change the grade can make
the pump station unusable or difficult to maintain.
16.2.2.3. Treatment
Wastewater treatment plants process raw sewage from residential, commercial sources, and in some cases
specialized treatment operations for industrial sources. The wastewater facility effluent (e.g., treated or
untreated wastewater that flows out of a treatment plant), must meet public health and environmental
standards. The typical process is:
1. Pretreatment using screens and grit chambers
2. Primary treatment in a sedimentation tank

Community Resilience Planning Guide for Buildings and Infrastructure Systems - Volume II
Water and Wastewater Systems
211
3. Secondary treatment using biological treatment and clarifiers
4. Disinfection using chlorine or other disinfectants.
In some cases, the effluent is further treated for irrigation uses. Solids drawn off from the four processes
are treated in digesters and solidified using presses or centrifuges. These processes require an extensive
mechanical and electrical equipment and piping.
Wastewater treatment plants are susceptible to damage from several natural hazards, particularly flooding.
With the projected sea level rise continuing through the 21st century, the frequency of flooding in
treatment plants will likely increase. Wastewater treatment plants are often located in or near flood-prone
areas because they return treated water to naturally occurring bodies of water. Therefore, they can be
vulnerable to flood inundation or storm surge and wave action from coastal sources that may cause
damage and loss of functionality to buildings, equipment, and electrical and mechanical systems. The
New York City Department of Environmental Protection (NYCDEP) noted in a recent study that all 14 of
the wastewater treatment plants (WWTP) it owns and operates are at risk of flood damage [NYCDEP
2013].
WWTPs in non-coastal regions of the United States are often located adjacent to rivers, which has
resulted in recent examples of WWTP riverine flooding: 1) nine days of lost functionality due to flooding
of Valdosta, Georgia WWTP in 2009; 2) flooding of the Pawtuxet River WWTP in Warwick, Rhode
Island in 2010; and 3) shut down of the Palmyra, Indiana WWTP in 2011 due to rising water levels.
In areas where wastewater treatment facilities are elevated or protected by levees, flooding can still lead
to access issues. While the treatment facility itself may not be inundated, flooding around the facility can
limit both ingress and egress of vital staff. For several WWTPs along the Missouri and Mississippi Rivers
during 1993 floods, personnel access was only possible by boat and roads inundated by the flood were not
considered stable enough for larger vehicles, such as those carrying supplies for the plants [Sanders,
1997].
Release of untreated sewage is relatively common during major flood events when inflow and infiltration
can overtax wastewater collection systems or when there are combined sewer overflows. During
Hurricane Sandy, over 560 million gallons of untreated and diluted sewage, mixed with storm water and
seawater, was released into waterways. This sewage release was caused by infiltration of floodwaters into
the sewer system, flood inundation of plant facilities, and power outages [NYCDEP 2013]. Electronic
controls were inundated and damaged in many wastewater treatment facilities, which significantly
delayed the facilities‘ recovery times [FEMA 2013]. Similarly, after Hurricane Rita in 2005, the City of
Lake Charles had a citywide power loss that affected the wastewater treatment plant serving two-thirds of
the city. Raw sewage was released into a nearby lake for over a week, until power was restored.
While discharge or raw sewage contaminates the receiving water, chemical contamination of sewage can
impact the WWTP treatment process itself. For example, in the 1989 Loma Prieta earthquake in
California, the East Bay Municipal Utility District (EBMUD) WWTP biological treatment process failed
when a spill in the collection system contaminated the treatment plant influent. Coupled with the spill, the
plant lost power and was unable to pump oxygen into the treatment system, resulting in the secondary
treatment system being inoperable for several weeks.
WWTPs are typically at a low point in the elevation of the system. Though flooding from hazard events is
a primary concern, earthquakes can damage facilities through ground shaking, permanent ground
deformation, and liquefaction. Ground shaking is particularly problematic for process tanks and digesters
when sloshing sewage impacts the tank walls. Permanent ground deformation induced by liquefaction
often causes joint separation in process tanks and damage to pipelines and pipe racks. Even if treatment
structures are pile-supported, buried piping can settle differentially and break. In the 2011 Christchurch
earthquake in New Zealand, clarifiers settled differentially, rendering them inoperable. In the 1995 Kobe
Earthquake, the Higashinada WWTP site settled differentially up to one meter and moved laterally up to

Community Resilience Planning Guide for Buildings and Infrastructure Systems - Volume II
Water and Wastewater Systems
212
two meters due to liquefaction that heavily damaging non-pile-supported structures. The resulting damage
is shown in Figure 16-11. Figure 16-12 shows the Higashinada influent channel that was offset one meter
by liquefaction during the 1995 Kobe earthquake.
Figure 16-11: Non-pile supported structures failed due
to liquefaction in 1995 Kobe Earthquake.
Figure 16-12: Higashinda WWTP Channel
offset by liquefaction in 1995 Kobe
Earthquake
Strong earthquakes can produce tsunamis that can inundate facilities, structurally damage treatment plant
facilities by lateral hydraulic loading, and damage electrical gear. The 2011 Tohoku earthquake in Japan
caused heavy damage to the Sendai WWTP Effluent Pump Station‘s east wall, as shown in Figure 16-13.
Much of the process tank equipment required replacement because of the large amount of damage, as
shown in Figure 16-14.
Figure 16-13: Sendai WWTP Effluent
Pump Station damaged by Tsunami in 2011
Tohoku Earthquake
Figure 16-14: Sendai WWTP equipment and piping
damage from the 2011 earthquake
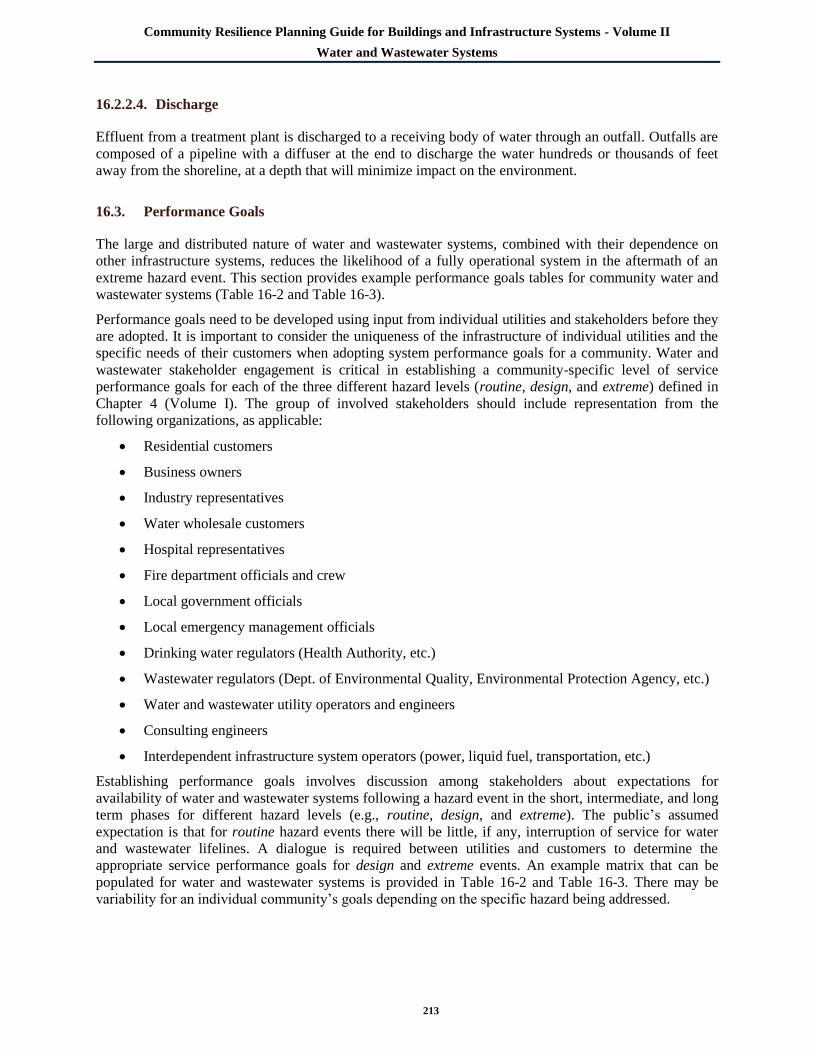
Community Resilience Planning Guide for Buildings and Infrastructure Systems - Volume II
Water and Wastewater Systems
213
16.2.2.4. Discharge
Effluent from a treatment plant is discharged to a receiving body of water through an outfall. Outfalls are
composed of a pipeline with a diffuser at the end to discharge the water hundreds or thousands of feet
away from the shoreline, at a depth that will minimize impact on the environment.
16.3. Performance Goals
The large and distributed nature of water and wastewater systems, combined with their dependence on
other infrastructure systems, reduces the likelihood of a fully operational system in the aftermath of an
extreme hazard event. This section provides example performance goals tables for community water and
wastewater systems (Table 16-2 and Table 16-3).
Performance goals need to be developed using input from individual utilities and stakeholders before they
are adopted. It is important to consider the uniqueness of the infrastructure of individual utilities and the
specific needs of their customers when adopting system performance goals for a community. Water and
wastewater stakeholder engagement is critical in establishing a community-specific level of service
performance goals for each of the three different hazard levels (routine, design, and extreme) defined in
Chapter 4 (Volume I). The group of involved stakeholders should include representation from the
following organizations, as applicable:
Residential customers
Business owners
Industry representatives
Water wholesale customers
Hospital representatives
Fire department officials and crew
Local government officials
Local emergency management officials
Drinking water regulators (Health Authority, etc.)
Wastewater regulators (Dept. of Environmental Quality, Environmental Protection Agency, etc.)
Water and wastewater utility operators and engineers
Consulting engineers
Interdependent infrastructure system operators (power, liquid fuel, transportation, etc.)
Establishing performance goals involves discussion among stakeholders about expectations for
availability of water and wastewater systems following a hazard event in the short, intermediate, and long
term phases for different hazard levels (e.g., routine, design, and extreme). The public‘s assumed
expectation is that for routine hazard events there will be little, if any, interruption of service for water
and wastewater lifelines. A dialogue is required between utilities and customers to determine the
appropriate service performance goals for design and extreme events. An example matrix that can be
populated for water and wastewater systems is provided in Table 16-2 and Table 16-3. There may be
variability for an individual community‘s goals depending on the specific hazard being addressed.

Community Resilience Planning Guide for Buildings and Infrastructure Systems - Volume II
Water and Wastewater Systems
214
Table 16-2: Example water infrastructure performance goals table to be filled out by community and
its stakeholders
Disturbance 1 Restoration Levels 2,3
Hazard Type Any 30% Function Restored
Hazard Level Routine, Design, Extreme 60% Function Restored
Affected Area Localized, Community, Regional 90% Function Restored
Disruption Level Usual, Moderate, Severe X Anticipated Performance
Functional Category: Cluster Support
Needed4
Overall Recovery Time for Hazard – Routine, Expected or Extreme
Phase 1 – Short-
Term
Phase 2 --
Intermediate
Phase 3 – Long-
Term
Days Wks Mos
0 1 1-3 1-4 4-8 8-12 4 4-24 24+
Source
Raw or source water and terminal reservoirs
Raw water conveyance (pump stations and piping
to WTP)
Water Production
Well and/or Treatment operations functional
Transmission (including Booster Stations)
Backbone transmission facilities (pipelines, pump
stations, and tanks)
Water for fire suppression at key supply points (to
promote redundancy)
Control Systems
SCADA or other control systems
Distribution
Critical Facilities
Wholesale Users (other communities, rural water
districts)
Hospitals, EOC, Police Station, Fire Stations
Emergency Housing
Emergency Shelters
Housing/Neighborhoods
Potable water available at community distribution
centers
Water for fire suppression at fire hydrants
Community Recovery Infrastructure
All other clusters
Footnotes:
1 Specify hazard type being considered
Specify hazard level – Routine, Design, Extreme
Specify the anticipated size of the area affected – Local, Community, Regional
Specify anticipated severity of disruption – Minor, Moderate, Severe
2 30% 60% 90% Desired restoration times for percentage of elements within the cluster
3 X Anticipated performance for 90 % restoration of cluster for existing buildings and infrastructure systems
Cluster recovery times will be shown on the Summary Matrix
4 Indicate levels of support anticipated by plan
R = Regional; S= State; MS=Multi-State; C = Civil (Corporate/Local)

Community Resilience Planning Guide for Buildings and Infrastructure Systems - Volume II
Water and Wastewater Systems
215
Table 16-3: Example wastewater infrastructure performance goals table to be filled out by community
and its stakeholders
Disturbance 1 Restoration Levels 2,3
Hazard Type Any 30% Function Restored
Hazard Level Routine, Design, Extreme 60% Function Restored
Affected Area Localized, Community, Regional 90% Function Restored
Disruption Level Usual, Moderate, Severe X Anticipated Performance
Functional Category: Cluster Support
Needed4
Design Hazard Performance
Phase 1
Short-Term
Phase 2
Intermediate
Phase 3
Long-Term
Days Weeks Months
0 1 1-3 1-4 4-8 8-12 4 4-24 24+
Treatment Plants
Treatment plants operating with primary
treatment and disinfection
Treatment plants operating to meet regulatory
requirements
Trunk Lines
Backbone collection facilities (major trunk line,
pump stations, siphons, relief mains, aerial crossings)
Flow equalization basins
Control Systems
SCADA and other control systems
Collection Lines
Critical Facilities
Hospitals, EOC, Police Station, Fire Stations
Emergency Housing
Emergency Shelters
Housing/Neighborhoods
Threats to public health and safety controlled by
containing & routing raw sewage away from
public
Community Recovery Infrastructure
All other clusters
Footnotes:
1 Specify hazard type being considered
Specify hazard level – Routine, Design, Extreme
Specify the anticipated size of the area affected – Local, Community, Regional
Specify anticipated severity of disruption – Minor, Moderate, Severe
2 30% 60% 90% Desired restoration times for percentage of elements within the cluster
3 X Anticipated performance for 90 % restoration of cluster for existing buildings and infrastructure systems
Cluster recovery times will be shown on the Summary Matrix
4 Indicate levels of support anticipated by plan
R = Regional; S= State; MS=Multi-State; C = Civil (Corporate/Local)
The community may or may not have control over the post-hazard event performance of its water and
wastewater infrastructure systems. If the community owns the systems, it has direct control and can make
improvements as it sees fit. If a community has partial ownership (e.g., a regional system), performance
goals for the facilities could be developed and negotiated with the other owners. If the system is privately
owned, the community can include the owner as a stakeholder and work to develop performance goals
and solutions that are acceptable to both. System resilience improvements may require consideration of
increased rates.
There may be elements in a system so critical to public safety that they need to be designed to remain
operational after an extreme event. For example, failure of a water supply impoundment dam might
present a significant life-safety hazard to downstream residents.
Community Resilience Planning Guide for Buildings and Infrastructure Systems - Volume II
Water and Wastewater Systems
216
Dependencies of water and wastewater systems on other infrastructure systems also need to be considered
when developing performance goals. For instance, availability of a reliable supply of liquid fuel is
essential for standby generators and vehicles and equipment used by repair crews. In turn, delivery of
liquid fuels depends on the status of the highway and bridge transportation network.
Performance goals are developed for water and wastewater systems as functional categories (i.e., water
for fire suppression at key supply points, treatment plants operating to meet regulatory requirements). The
desired performance goals are recorded as target timelines to restore the system function in stages,
indicated by 30 %, 60 %, and 90 % operational status.
Service quality is a key aspect for drinking water service, given tradeoffs between quantity and quality
during emergency situations. A utility may be able to distribute water to support fire suppression, but may
need to issue a boil water advisory to protect public health. Water quality is always desired, but can be
compromised under emergency conditions. Anticipated performance of these systems needs to account
for their existing condition and operational procedures of the treatment plants and distribution systems.
Water quality is typically communicated to the public [CDC/EPA/AWWA 2013] as follows:
Boil Water Notice – Okay for contact, but boil before consumption and cooking
Do Not Drink – Okay for contact, but no consumption
Do Not Use – No contact or consumption, fire protection may be compromised
The infrastructure components in the example performance goals tables are not intended to be an
exhaustive list. Some system components may not exist in a community. For instance, some communities
may have the ability to distinguish between the general water supply and distribution and water supply for
fire suppression. However, most community water systems are integrated and do not separate general
supply and distribution from a water supply for fire suppression. Additionally, some community water
systems might supply treated water to wholesale users, such as a nearby suburban or rural community.
Wholesale users are treated as a critical part of the distribution system within the example, but are not a
consideration for all communities. Each community will need to review these components to determine
which ones to incorporate into their systems, or if other functions and components need to be added, such
as planning options for providing emergency water supply to the community and for specific functions,
such as hospitals and health care facilities [CDC/AWWA 2012; EPA 2011].
Community resilience is developed over time, according to the desired performance goals and
implementation plans of each community. Community plans that include the following considerations are
more likely to satisfy all stakeholders:
Prioritize potential solutions to be implemented over years to limit disruptions and recovery time
rather than planning to implement them all at once
Recognize that both short- and long-term solutions may improve recovery times
Balance societal needs with realistic expectations of system performance
Focusing on major system components that form a backbone network capable of supplying key health and
safety-related community needs shortly after a hazard event is one way to focus priorities. When the
community begins to estimate the cost of implementation for short and long term solutions, it may decide
to reassess the desired performance goals.

Community Resilience Planning Guide for Buildings and Infrastructure Systems - Volume II
Water and Wastewater Systems
217
16.4. Regulatory Environment
16.4.1. Federal and State Primacy
The U.S. Environmental Protection Agency (EPA) establishes requirements for drinking water quality
under authority of the Safe Drinking Water Act (SDWA [42 U.S.C. et seq. 300f-300j]) and for wastewater
effluent quality under authority of the Federal Water Pollution Control Act or Clean Water Act (33 U.S.C.
et seq. 1251-1387). A state agency that meets certain criteria may be granted primacy to oversee and
implement these requirements.
SDWA Example Requirements
Filtration of surface water supplies, except in some cases special treatment of particularly clean
surface water supplies
Disinfection of supplies (except a few groundwater supplies)
Covering of treated water storage
Community water systems serving population greater than 3300 are required to perform
vulnerability assessment and develop emergency response plans
State primacy agencies are to develop and implement plans for the provision of safe drinking
water under emergency circumstances including earthquakes, floods, hurricanes, and other
natural hazards, as appropriate
Clean Water Act Example Requirements
Secondary treatment of wastewater discharges
Disinfection of wastewater discharges
Systems critical to maintaining discharge compliance are required to have emergency power
16.4.2. Other State
Emergency Planning and Community Right-to-Know Act (EPCRA [42 USC §§ 11001-11050]).
Facilities that store, use, or release certain chemicals may be subject to reporting requirements to state
and/or local agencies through EPCRA. Information in reports becomes publically available. Treatment
chemicals stored and used at water treatment plants often require this type of reporting.
Planning Requirements. Water and wastewater planning and design requirements are generally
controlled by states and local governments. States typically require that comprehensive plans for water
and wastewater system be prepared on a regular basis to assess future system needs (e.g., capacity) and
how those needs will be met. The elements of those comprehensive plans are defined by the state. Often,
these plans include requirements to identify the hazards that the system could be subjected and how the
utility will address those hazards. These are typically quite general in nature and do not include detailed
design criteria.
16.5. Codes and Standards
State and local governments adopt model building codes, such as the International Building Code (IBC).
Model building codes rely heavily on standards, such ASCE-7, Minimum Design Loads for Buildings and
Other Structures. In many cases, a state will adopt these model codes; in some cases, local jurisdictions
adopt and modify them to suit their needs. The IBC and ASCE-7 focus on buildings and structures. State

Community Resilience Planning Guide for Buildings and Infrastructure Systems - Volume II
Water and Wastewater Systems
218
and local agencies may also have special requirements for high-risk facilities, such as dams. The Federal
Energy Regulatory Commission (FERC) controls designs of hydroelectric generating dams.
Design codes, such as the IBC, are updated regularly, taking into account performance of facilities since
the last code was issued, research, and other developments in the building industry. Once finalized, they
are voted on by the code committee and can be adopted by state or local jurisdictions.
The following subsections discuss some codes, standards, and guidelines that are important to the
resilience of water and wastewater infrastructure, the anticipated performance of the infrastructure after a
design hazard event, and the long-term recovery levels of the infrastructure when damage occurs.
16.5.1. New Construction
Design Standards. Design standards are often developed according to an ANSI-based consensus process
and voluntarily adopted by various organizations. Committee membership includes representation from
key stakeholders. In some cases design standards are referenced by the building code. In other cases, they
can be used by utilities on a project-by-project basis. There are two organizations with design standards
that are relevant to natural hazard impacts on the water and wastewater industry:
American Concrete Institute – standards addressing concrete process tanks, such as ACI 350-06
American Water Works Association (AWWA) –
Standards addressing design of water storage tanks, such as AWWA D100 [2011], D110
(2013), D115 (2006), addressing seismic design of water storage tanks
Standard AWWA-J100, Risk and Resilience Management of Water and Wastewater Systems
[AWWA 2010], addressing performance of water and wastewater systems when subjected to
natural and human-caused hazards
AWWA has other standards addressing pipeline design and water quality, but none of these standards
addresses natural hazards.
There are no design standards for underground pipelines in water and wastewater systems, or standards
that address design for earthquake, landslide, or flood hazards. Often the Chief Engineer of a utility is
responsible for establishing its design practices and criteria. While agency-specific design practices may
follow industry recommendations, they are not consistent between systems and may have varying levels
of reliability.
For example, the San Francisco Public Utilities Commission (SFPUC) developed its own internal
standard that outlines performance goals for the desired level of service following a major Bay Area
earthquake and identifies specific requirements for the design and retrofit of aboveground and
underground infrastructure. The SFPUC Engineering Standard, General Seismic Requirements for Design
of New Facilities and Upgrade of Existing Facilities [SFPUC, 2006], establishes design criteria that, in
many cases, are more stringent than building codes or industry standards. The design standard supports
the SFPUC performance goal to achieve a basic level of service to their wholesale customers within 24
hours after a design earthquake.
Guidelines and Manuals of Practice. A number of organizations have developed guidelines for use by
the industry. Guidelines often offer examples of how a standard may be applied or present operational
context for a given best practice. Guidelines and manuals may not receive the same level of consensus or
public review as a standard, but are generally representative of industry norms. Table 16-4 lists some
codes, standards, and guidance documents applicable to water and wastewater infrastructure systems with
regard to community resilience. The table includes a matrix of system components addressed in the
reference. This list is not intended to be exhaustive.

Community Resilience Planning Guide for Buildings and Infrastructure Systems - Volume II
Water and Wastewater Systems
219
Table 16-4: Codes, standards, and guidelines related to resilience at drinking water and wastewater
facilities
Org
Ca
teg
ory
(1
)
Name
Gen
era
l
Pip
elin
es
Pu
mp
ing
Sto
rag
e
Tre
atm
ent
IBC C 2012 International Building Code or applicable jurisdictional building code ●
ASCE S ASCE 7 Minimum Design Loads for Buildings and Other Structures ●
ACI S 350 Code Requirements for Environmental Engineering Concrete Structures ● ●
ACI S 371R-08 Guide for the Analysis, Design, and Construction of Elevated Concrete and
Composite Steel-Concrete Water Storage Tanks ●
ACI S 372R-03 Design and Construction of Circular Wire- and Strand-Wrapped
Prestressed Concrete Structures ● ●
AWWA S D100-11 Welded Carbon Steel Tanks for Water Storage ●
AWWA S D110-13 Wire- and Strand-Wound, Circular, Prestressed Concrete Tanks ●
AWWA S D115-06 Tendon-Prestressed Concrete Water Tanks ●
AWWA S G100-11 Water Treatment Plant Operation and Management ●
AWWA S G430-14 Security Practices for Operation and Management ●
AWWA S G440-11 Emergency Preparedness Practices ●
AWWA S J100-10 Risk and Resilience Management of Water and Wastewater Systems ●
ALA G Guidelines for Implementing Performance Assessments of Water Systems ●
ALA G Guidelines for the Design of Buried Steel Pipe (2001) ●
ALA G Seismic Design and Retrofit of Piping Systems (2002) ● ●
ALA G Seismic Fragility Formulations for Water Systems (2001) ●
ALA G Seismic Guidelines for Water Pipelines (2005) ●
ALA G Wastewater System Performance Assessment Guideline (2004) ●
ASCE G Guidelines for Seismic Design of Oil and Gas Pipeline Systems (1984) ●
AWWA G Emergency Power Source Planning for Water and Wastewater ●
AWWA G M9 Concrete Pressure Pipe ●
AWWA G M11 Steel Pipe: A Guide for Design and Installation ●
AWWA G M19 Emergency Planning for Water Utilities (2001) ●
AWWA G M60 Drought Preparedness and Response ●
AWWA G Minimizing Earthquake Damage, A Guide for Water Utilities (1994) ●
EPA / AWWA G Planning for an Emergency Drinking Water Supply ●
MCEER G MCEER-08-0009 Fragility Analysis of Water Supply Systems (2008) ●
MCEER G Monograph Series No. 3 Response of Buried Pipelines Subject to Earthquakes ●
MCEER G Monograph Series No. 4 Seismic Design of Buried and Offshore Pipelines ●
TCLEE G Monograph 15 Guidelines for the Seismic Evaluation and Upgrade of Water
Transmission Facilities (1999) ●
TCLEE G Monograph 22 Seismic Screening Checklists for Water and Wastewater Facilities
(2002) ●
WEF G Emergency Planning, Response, and Recovery ●
WEF G Guide for Municipal Wet Weather Strategies ●
WEF G MOP 28 Upgrading and Retrofitting Water and Wastewater Treatment Plants ●
WEF G MOP 8 Design of Municipal Wastewater Treatment Plants ●
WEF G MOP FD-17 Prevention and Control of Sewer System Overflows ●
WRF / AWWA /
EPA G Business Continuity Planning for Water Utilities ●
(1) C – Code; S – Standard; G – Guideline or Manual of Practice (MOP)

Community Resilience Planning Guide for Buildings and Infrastructure Systems - Volume II
Water and Wastewater Systems
220
16.5.1.1. Implied or Stated Performance Levels for Expected Hazard Levels
Design of new aboveground structures (treatment plant office and lab buildings, pump stations, process
tanks, water storage tanks and reservoirs, etc.) is typically governed by local building codes or design
standards. Design loads are prescribed by a consensus-based standard, ASCE Standard 7 Minimum
Design Loads for Buildings and Other Structures [ASCE 2010]. This standard uses the concept of Risk
Category to increase the design loads for important structures. Typical buildings are designed for Risk
Category II. Water and wastewater treatment facilities are assigned to Risk Category III, which includes
facilities that may disrupt civilian life or potentially cause public health risks. Water storage facilities and
pump stations required to maintain water pressure for fire suppression systems are assigned to the highest
category, Risk Category IV.
The building code intends that structures designed as Risk Category III or IV remain operational or
require only minor repairs to remain operational following a design level hazard event. By designing for a
design level event, water and wastewater systems should remain operational under a routine level event
but may experience moderate to major damage during an extreme level event.
16.5.2. Existing Construction
16.5.2.1. Implied or Stated Performance Levels for Expected Hazard Levels
Design criteria for seismic hazards continue to be refined as the engineering and seismology community‘s
understanding of U.S. seismicity improves. A significant portion of water and wastewater system
components in the high seismicity regions of the western and central U.S. were designed and constructed
for a lower seismic hazard than specified by current codes and standards.
Anticipated performance of water and wastewater system components during earthquakes is dependent on
the hazard level, codes and standards used in the original design, and the type of structure. System
components built prior to the mid-1970s may perform poorly in earthquakes because our understanding of
structures‘ behaviors during earthquakes was not as advanced as it is now. However, some categories of
structures, such as single story concrete shear wall-type structures, are inherently robust and are likely to
perform well during a design event. Performance of system components built between the mid-1970s and
early 2000s is dependent on the code/standard edition, the seismic loads used in design, and the type of
structure. Structures that satisfy the benchmark building criteria of ASCE 41-13 and are in areas that have
not seen significant increases in seismic loads are generally anticipated to perform similarly to new
construction as previously described. System components built after the early 2000s are also generally
anticipated to perform similarly to new construction as previously described.
Anticipated performance of nonstructural components should be evaluated on a case-by-case basis, as
engineers now pay closer attention to seismic design and construction of nonstructural components.
Anticipated performance of pipelines should be evaluated on a system-by-system basis because
performance of pipelines is dependent on pipe type, joint type, and earthquake ground movement
parameters. Even today, there is no code or standard for seismic design of pipelines.
16.5.2.2. Recovery Levels
There are a number of hazard events that have rendered utilities non-functional for weeks that have
illustrated the importance of considering the dependencies of water and wastewater systems on other
systems of the built environment. A few notable events and their recovery levels are given in the
following:

Community Resilience Planning Guide for Buildings and Infrastructure Systems - Volume II
Water and Wastewater Systems
221
Great Flood of 1993. In the Great Flood of 1993, the Raccoon River overtopped its banks and submerged
the Des Moines, Iowa WTP [McMullen 1994]. The water receded and the plant restored non-potable
water within 12 days and potable water within 19 days [McMullen 1994]. The water outage disrupted
restaurant and hotel operations. The Principal Insurance Company headquarters had trucks deliver water
and pumped it into the building to cool computers. AT&T‘s regional central office nearly lost phone
service because of computer cooling issues.
Northridge and Kobe Earthquakes. In the 1994 Northridge earthquake, the Los Angeles water
distribution system suffered approximately 1000 pipeline failures, primarily in the San Fernando Valley
(Davis 2014). With mutual aid, they were able to fully restore potable water service to everyone within 12
days. A year later, the 1995 Kobe Japan earthquake caused 1200 pipeline failures resulting in lost service
to all households for up to 60 days [NIST 1996].
Hurricane Katrina. The August 29, 2005 Category 4 storm caused levee failures that resulted in
inundation of approximately 80 % of New Orleans, including flood damage to their water and wastewater
treatment plants [Black & Veatch Corporation 2006]. The interruption of water and sewage service, and
reduced demand due to evacuated customers who never returned, resulted in a substantial reduction in
revenues. In 2012 it was estimated that the population of New Orleans was only 76 % of its population in
2000. Water for fire suppression was restored in one week. Potable water was restored by city blocks: 1
month plus to restore service to the East Bank west of the Industrial Canal, three months plus to restore
service the East Bank east of the Industrial Canal, and over nine months to restore service to a portion of
the Lower 9th Ward [Black & Veatch Corporation 2006].
Christchurch, New Zealand and Tohoku, Japan Earthquakes. The recent 2011 Christchurch New
Zealand, and Tohoku Japan earthquakes both resulted in outages of potable water lasting in excess of 40
days [G&E Engineering Systems Inc., 2012]. Impacted Japanese cities were assisted by mutual aid from
cities in western Japan.
16.6. Strategies for Implementing Plans for Community Resilience
This section uses information from Sections 16.2 through 16.5 to provide guidance on the process of
assessing water and wastewater infrastructure, defining solutions to improve infrastructure resilience, and
narrowing resilience gaps.
16.6.1. System Assessment Approaches
The purpose of the assessment is to quantify the anticipated performance and recovery of the overall
system and determine whether it meets the performance goals (Section 16.3). If the system does not meet
the desired performance objectives, the assessment may identify system deficiencies that, if improved,
may help achieve the desired performance goals. The assessment will likely require coordination and
collaboration with other infrastructure systems to address dependencies.
Section 16.2 described the basic components of water and wastewater systems and gave examples of
observed failures in past hazards. System performance is highly dependent on the existing condition of
the system and the design criteria, including codes and standards. Information about past performance of
similar systems, combined with knowledge of the existing condition and design basis, help a utility
estimate the anticipated level of service that could be provided after a hazard event.
There may be a gap between the level of service a system can provide if a hazard event occurred today
and the desired community performance goals. It is likely the capital expenditure required to close this
performance gap exceeds the short-term capital improvement project budgets of the utility. However, the
resilience of any system can be improved incrementally over time by appropriately considering design
criteria to reduce the impact of hazards in new and upgraded infrastructure systems. To estimate the level

Community Resilience Planning Guide for Buildings and Infrastructure Systems - Volume II
Water and Wastewater Systems
222
of service a water or wastewater system could provide after a given hazard event, an assessment of
anticipated damage to the system and restoration sequences and times is required. Several methodologies
and tools are available to conduct these assessments, a few of which are described below. While loss
estimation has progressed over the past 20 years, the results are still estimates. These estimates can be
useful for comparison of alternatives.
Hazus-MH. Hazus-MH is a multi-hazard (flood, earthquake, and hurricane) loss estimation tool
developed by the Federal Emergency Management Agency (FEMA) for use in mitigation, emergency
preparedness, and response and recovery planning [FEMA 2012]. Communities can use this tool to
characterize their hazard exposure, estimate losses to the water and wastewater systems, and estimate
repair costs and duration. It may also be used to inform an AWWA J100 analysis, as discussed below.
ANSI/AWWA J100-10. The Standard for Risk and Resilience Management of Water and Wastewater
Systems [AWWA 2010] provides a methodology for conducting a multi-hazard system risk and resilience
assessments. The J100 standard aligns the national homeland security objectives in Homeland Security
Presidential Directive/HSPD-5 [DHS 2003], PPD-8 [2011], PPD-21 [2013] and Executive Order (EO)
13636 [the White House 2013b]. The J100-10 standard consists of a seven-step process for analyzing and
supporting management decisions that maximize risk reduction and/or enhance resilience at the utility and
the community it serves.
1. Asset characterization
2. Threat characterization
3. Consequence analysis
4. Vulnerability analysis
5. Threat analysis
6. Risk/Resilience analysis
7. Risk/Resilience management
Determining asset level resilience for specific threats is part of the assessment methodology, and may
support a community‘s process for determining desired performance goals and anticipated performance
(Section 16.3). The J100 standard also includes a Utility Resilience Index (URI), a system-level
assessment of operational and financial indicators. The URI can serve as a benchmark to evaluate
potential resilience improvement projects and as a measure to track a utility‘s progress over time towards
achieving resilience performance goals.
One approach to assess financial impacts is to quantify loss of function in terms of value per unit of
service, dollars per person per day. This can be estimated by quantifying the number of customers in the
area without service and the time it takes to restore service to the area. For example, if a pressure zone
serving 1,000 people loses service for 5 days, the result is 5 days × 1,000 people or 5,000 person days.
FEMA currently allows $103/day per person for loss of service. So 5,000 person days × $103/day/person
= $515,000. If applying for a FEMA Hazard Mitigation Grant, this can be used as an avoided loss in a
benefit/cost analysis for a project that would reduce the outage time to zero days.
VSAT, PARRE, and WHEAT. Several tools have been developed to support water utility assessment of
risks. The Vulnerability Self-Assessment Tool (VSAT [EPA 2014]) and the Program for Analysis of Risk
and Resiliency Evaluation (PARRE [Binning, 2014]) have been designed to assist water and wastewater
utilities‘ application of the J100 standard. VSAT is complemented by the Water Health and Economic
Analysis Tool (WHEAT), which quantifies three consequences associated with a hazard event: 1) public
health impact, 2) utility-level financial impact, and 3) direct and indirect regional economic impact [EPA
2014]. WHEAT is specifically aligned with step 3 (consequence analysis) of the J100 standard.

Community Resilience Planning Guide for Buildings and Infrastructure Systems - Volume II
Water and Wastewater Systems
223
EPA. The EPA‘s National Homeland Security Research Center (NHSRC) also supports efforts to
enhance utility resilience. Collaboration with AWWA resulted in the development of Planning for an
Emergency Drinking Water Supply [EPA 2011], which directly supports a capability assessment based on
threats in the J100 standard to maintain service.
These resilience assessment approaches need to be evaluated and refined into a consistent methodology
prior to implementation. An example of an earthquake resilience assessment procedure for a water system
is outlined in the following section.
16.6.1.1. Example Earthquake Resilience Assessment
Identify the appropriate earthquake scenario or scenarios. Develop or obtain ground motion
information for each. The USGS has scenarios available for a suite of earthquakes in the U.S.
Obtain liquefaction and landslide hazard maps available from the state department of geology.
Use GIS for all mapping.
For buried pipelines:
Compile an inventory of system pipelines including pipe material, joint type, and length.
In GIS, superimpose the pipeline distribution system onto maps of the scenario hazard (peak
ground velocity, liquefaction potential, and landslide potential).
Use empirical relationships developed by the American Lifelines Alliance (ALA) to predict the
number of breaks and leaks in the pipeline system.
Estimate the time required to repair the predicted number of breaks and leaks based on historical
crew productivity data and restore system functionality. Consider the anticipated damage states of
dependent systems (transportation, liquid fuel, etc.).
For aboveground infrastructure:
Compile an inventory of system components (tanks, pump stations, treatment plants, etc.),
including type of construction, date of original construction, and any subsequent retrofits.
Estimate the level of damage predicted for the aboveground water system components based on
observations from past earthquakes, the seismic hazard used at the time of original construction
or retrofit, and the professional judgment of engineers knowledgeable in the seismic performance
of water systems. Use fragility curves found in Hazus-MH to determine the anticipated
performance for a particular facility type for a given ground motion.
Estimate the time required to repair the predicted damage to aboveground infrastructure and
restore system functionality. Consider the anticipated damage states of dependent systems
(transportation, liquid fuel, etc.).
For the system:
Determine the anticipated system performance based on the damage to pipelines and facilities.
Determine the anticipated time for recovery of function for the system, including buried pipelines
and aboveground infrastructure.
Compare the estimate of time for recovery of function to the desired performance goals
established by the community.
Note that recovery time for utilities that purchase water from wholesale suppliers is highly dependent on
the recovery time of the supplying utility. Wholesale water suppliers need to work with their customers to
assess the anticipated damage and restorations times from the source to the final individual customers. In

Community Resilience Planning Guide for Buildings and Infrastructure Systems - Volume II
Water and Wastewater Systems
224
this case, water and wastewater system resilience assessments may require a regional approach to
characterize the anticipated performance of the system of systems in a hazard event appropriately.
16.6.2. Solutions to Improve System Performance
16.6.2.1. General Considerations
The system assessment described in the previous section may identify system deficiencies, inadequate
performance of system components, loss of system function, or extended recovery periods following a
hazard event. Mitigation of all deficiencies could be a daunting task. The community and system owner
need to identify a time frame for achieving community resilience. In the case of the Oregon Resilience
Plan [OSSPAC 2013], a 50-year time frame was proposed.
There are a number of approaches to assist in system mitigation. However, a starting point could be to
establish an overall strategy, such as:
Retrofit sole treatment plants to achieve the desired performance
Replace the most vulnerable or least reliable pipe over time
Achieve full supply and treatment redundancy by building additional treatment plants
Improve transmission system resilience by retrofit of existing infrastructure and adding
redundancy
System component mitigation projects can be integrated into the capital improvement plan (CIP). The
CIP is typically made up of projects required to address aging facilities and facilities required to meet
increased system demands. In general, facilities such as treatment plants and tanks are built with a 50-year
design life, equipment in those facilities with a 20-year design life, and buried pipe with a 100-year
design life. Of course there are exceptions to these design life numbers, but the point is that over a 50-
year time frame, many of the system facilities will be replaced as they reach their design life. When that
happens, they should be replaced with facilities and infrastructure that meet the desired performance
criteria. The need for resilient facilities may only be one of the drivers pushing for replacement of a
facility, with others being increased demand, high maintenance, and low reliability.
Many communities are growing. New facilities will be required to meet those demands. Those new
facilities can be designed to meet the desired performance criteria. In some cases, the new facilities may
supplement existing facilities. Both the existing and new facilities may be required to meet peak day
demands, but the community could recover following a catastrophic hazard event with the reduced
service based on the new facility.
Some critical facilities might be vulnerable to the hazards being evaluated. They may be essential to
continued operation, but they may be expensive or time consuming to repair. In these cases, the
community may consider redirecting some of their capital budget to focus on these critical facilities.
In some cases, there may be solutions that allow quick repair of critical facilities that cost much less than
full replacement or upgrade. Installing a new transmission pipeline to cross an earthquake fault could be
very expensive. A community may instead decide to acquire large diameter hose to bridge the earthquake
fault if it ruptures.
The water distribution systems or wastewater collection system is a valuable asset for most water utilities.
While the value of any single pipe run is less than a treatment plant or storage tank, the total length of the
pipeline system has a high value. Unfortunately, in many communities, much of the pipe is at or beyond
its design life and is expensive to replace. Pipelines of cast iron pipe, in particular, are vulnerable to
earthquakes.

Community Resilience Planning Guide for Buildings and Infrastructure Systems - Volume II
Water and Wastewater Systems
225
There are some reasonable approaches for communities to pursue. Communities can initially focus on
pipelines serving critical functions. Having a functional backbone system can provide benefits
immediately after a hazard event. The backbone system consists of the transmission system and key
distribution lines serving critical facilities such as hospitals. Once the backbone system is selected, the
most vulnerable segments along that backbone system can be identified based on, for example, the pipe
material, condition, and soil environment in which it is located. For earthquakes, pipelines in liquefiable
soils are particularly vulnerable. The utility can step through this process and prioritize the pipelines that
are at pose the highest risk and are critical to providing essential services.
Utilities with an asset management program can lay out a pipeline replacement program that is
coordinated with the desired time horizon for community resilience. The utility can plan emergency
response and recovery procedures to speed recovery. Installation of isolation valves in key locations can
allow isolation of heavily damaged portions of a system. Maintaining a significant inventory of repair
parts can enhance the restoration process. Having mutual aid agreements in place, such as the
Water/Wastewater Agency Network or WARN program [AWWA 2015], can also enhance the utility‘s
ability to quickly make system repairs.
Resilience enhancements may be coupled with other infrastructure system improvements to maximize the
benefit of limited financial resources. For instance, it can be difficult to justify replacing hundreds of
miles of water pipelines based on earthquake resilience considerations alone, but coupled with
replacement of aging and failing pipelines, the incremental cost of using more earthquake-resistant pipe
materials and joints is relatively minor. Significant improvements over a shorter timeline may require a
more extensive campaign of public outreach and education.
16.6.2.2. Solutions for New Construction
Water and wastewater providers should consider desired performance goals in all new construction
projects. Projects can be designed to satisfy or exceed code requirements, where code minimum standards
are not anticipated to meet the community resilience goals. If no codes exist for a particular category of
structure or facility, the designer may consider available guidelines and best practices (see Table 10-3).
The incremental cost of designing and constructing for resilience may be a relatively small percentage of
total project costs.
16.6.2.3. Solutions for Existing Construction
Water and wastewater providers can integrate resilience improvements to existing infrastructure as part of
the capital improvement planning process. The process of conducting system resilience assessments may
identify pipelines and facilities that are critical to the overall resilience of the system and its function.
Critical components need to be evaluated and a number of potential solutions considered, including
retrofit or replacement of existing components or building redundant components. Retrofit of existing
infrastructure or new redundant components can improve the anticipated system performance. In some
cases, redundant systems can be justified based on increasing demand requirements. A new redundant
system could provide an adequate supply to meet basic demands until the damaged system was repaired.
Whatever is done needs to be a part of the day-to-day functions of the utility. Special features that are
added to increase resilience, but are never used until a hazard occurs, may not be functional when they are
needed.

Community Resilience Planning Guide for Buildings and Infrastructure Systems - Volume II
Water and Wastewater Systems
226
16.7. References
Allouche, E.N.; R. Sterline; E. Chisolm; D. Hill; and D. Hall (2006) ―Assessment of Damage to Urban
Buried Infrastructure in the Aftermath of Hurricanes Katrina and Rita,‖ Pipelines 2006, American Society
of Civil Engineers (ASCE), pp. 1-8.
American Concrete Institute (ACI 2006) ACI 350-06: Code Requirements for Environmental Engineering
Concrete Structures, American Concrete Institute (ACI), Farmington Hills, MI.
American Society of Civil Engineers (ASCE 2010) ASCE 7-10: Minimum Design Loads for Buildings
and Other Structures, Second Edition, American Society of Civil Engineers (ASCE) Structural
Engineering Institute (SEI), Reston, VA.
American Society of Civil Engineers (ASCE 2013) ASCE 41-13: Seismic Evaluation and Retrofit of
Existing Buildings, American Society of Civil Engineers (ASCE) Structural Engineering Institute (SEI),
Reston, VA.
American Water Works Association (AWWA 2001) M19 Emergency Planning for Water Utilities, Fourth
Edition, American Water Works Association (AWWA) , Denver, CO.
American Water Works Association (AWWA 2006) AWWA D115-06 Tendon-Prestressed Concrete
Water Tanks, American Water Works Association (AWWA), Denver, CO.
American Water Works Association (AWWA 2010) AWWA J100-10 Risk and Resilience Management of
Water and Wastewater Systems, American Water Works Association (AWWA), Denver, CO.
American Water Works Association (AWWA 2011) ANSI/AWWA D100-11 Welded Carbon Steel Tanks
for Water Storage, American Water Works Association (AWWA), Denver, CO.
American Water Works Association (AWWA 2013) ANSI/AWWA D110-13 Wire- and Strand-Wound,
Circular, Prestressed Concrete Water Tanks, American Water Works Association (AWWA), Denver,
CO.
American Water Works Association (AWWA 2014) ANSI/AWWA G430-14 Security Practices for
Operation and Management, American Water Works Association (AWWA), Denver, CO.
American Water Works Association (AWWA 2015) Water/Wastewater Agency Response Network
(WARN), American Water Works Association (AWWA), Denver, CO, http://www.awwa.org/resources-
tools/water-knowledge/emergency-preparedness/water-wastewater-agency-response-network.aspx.
Viewed April 18, 2015.
Aubuchon, C.P. and K.M. Morley (2013) ―The Economic Value of Water: Providing Confidence and
Context to FEMA‘s Methodology,‖ Journal of Homeland Security and Emergency Management, April,
10(1), 245-265.
Ballantyne, D.B. (1994) Minimizing Earthquake Damage, A Guide for Water Utilities, American Water
Works Association (AWWA), Denver, CO.
Ballantyne, D.B. and C.B. Crouse. (1997) Reliability and Restoration of Water Supply Systems for Fire
Suppression and Drinking Following Earthquakes, NIST GCR 97-730, National Institute of Standards
and Technology (NIST) Building and Fire Research Laboratory, Gaithersburg, MD.
Binning, D. (2014) ―J100 and the Safety Act - What's in It for Me?‖ Journal - American Water Works
Association, 106(12): 22-24, http://dx.doi.org/10.5942/jawwa.2014.106.0167.
Black & Veatch Corporation (2006) Report on Operations for 2005: Sewage & Water Board of New
Orleans, Louisiana. Sewage & Water Board of New Orleans, Overland Park, KS.

Community Resilience Planning Guide for Buildings and Infrastructure Systems - Volume II
Water and Wastewater Systems
227
Centers for Disease Control and Prevention and American Water Works Association (CDC/AWWA
2012) Emergency water supply planning guide for hospitals and health care facilities, United States
Department of Health and Human Services (DHHS), Atlanta, GA,
http://www.cdc.gov/healthywater/pdf/emergency/emergency-water-supply-planning-guide.pdf.
Chisolm, E.I. and J.C. Matthews (2012) ―Impact of Hurricanes and Flooding on Buried Infrastructure,‖
Leadership and Management in Engineering, July, Vol. 12, Issue 3, 151-156.
Davis, Craig A. (2014) ―Water System Service Categories, Post-Earthquake Interaction, and Restoration
Strategies,‖ Earthquake Spectra, November, Vol. 30, No. 4, pp. 1487-1509.
Department of Homeland Security (DHS 2003) Homeland Security Presidential Directive-5:
Management of Domestic Incidents, DHS, Washington, DC
http://www.dhs.gov/sites/default/files/publications/Homeland%20Security%20Presidential%20Directive
%205.pdf. Viewed April 19, 2015.
Eidinger, J. (2012) ―Performance of Water Systems during the Maule Mw 8.8 Earthquake 27 February
2010,‖ Earthquake Spectra, Vol 28, No. S1, S605-S620.
Eidinger, J.M. and A.K. Tang (2012) Christchurch, New Zealand Earthquake Sequence of Mw 7.1
September 04, 2010 Mw 6.3 February 22, 2011 Mw 6.0 June 13, 2011: Lifeline Performance, American
Society of Civil Engineers (ASCE), Reston, VA,
http://static1.squarespace.com/static/5006875e24ac21f35d8de8d2/t/51734da0e4b08db71071600f/136651
1008778/Lifelines_Compendium.pdf.
Eidinger, John and Craig A. Davis (2012) Recent Earthquakes Implications for US Water Utilities, Web
Report #4408, G&E Engineering Systems Inc. for Water Research Foundation, Denver, CO,
https://static1.squarespace.com/static/5006875e24ac21f35d8de8d2/t/51622bd9e4b0b72aa94f503b/136538
8249527/4408+WRF+Recent+Eqs+Aug+29+2012.pdf.
Elliott, T. and A.K. Tang (2009) Pacific Northwest Storms of December 1-4, 2007 Lifeline Performance,
American Society of Civil Engineers (ASCE), Reston, VA.
Environmental Protection Agency (EPA 2010) VSAT – Risk Assessment Tool for Water Sector Utilities,
Environmental Protection Agency (EPA), Washington, D.C.
Environmental Protection Agency (EPA 2011) Planning for an Emergency Drinking Water Supply, EPA
600/R-11/054, Prepared for U.S. Environmental Protection Agency‘s National Homeland Security
Research Center by the American Water Works Association (AWWA) and CDM, Environmental
Protection Agency (EPA), Washington, D.C, June.
Environmental Protection Agency (EPA 2014) Water Health and Economic Analysis Tool, Version 3.0,
Consequence Analysis Tool for Water Utilities, Environmental Protection Agency (EPA), Washington,
D.C.
Federal Emergency Management Agency (FEMA 2012) Hazus-MH 2.1 User Manual, Federal
Emergency Management Agency (FEMA), Washington, DC.
Federal Emergency Management Agency (FEMA 2013) Mitigation Assessment Team Report Hurricane
Sandy in New Jersey and New York Building Performance Observations, Recommendations, and
Technical Guidance, Federal Emergency Management Agency (FEMA), Washington, DC.
Hoover, J.E. (1941) ―Water supply facilities and national defense,‖ Journal - American Water Works
Association, 33(11), 1861-1865.
McMullen, L.D. (1994) ―Surviving the Flood: Teamwork Pays Off in Des Moines,‖ Journal - American
Water Works Association, 86(1): 68-72.
Community Resilience Planning Guide for Buildings and Infrastructure Systems - Volume II
Water and Wastewater Systems
228
Morley, K.M. (2012) ―A lesson in resilience from derecho,‖ Journal - American Water Works
Association, 104(9), 20, 22-23. http://www.awwa.org/publications/journal-
awwa/abstract/articleid/33135246.aspx.
Murphy, M. (1994) ―Weathering the Storm: Water Systems Versus Hurricanes,‖ Journal - American
Water Works Association, 86(1): 74-83.
National Institute of Standards and Technology (NIST 1996) The January 17, 1995 Hyogoken-Nanbu
(Kobe) Earthquake: Performance of Structures, Lifelines, and Fire Protection Systems, Gaithersburg,
MD: National Institute of Standards and Technology.
New York City Department of Environmental Protection (NYCDEP 2013) New York City Wastewater
Resiliency Plan: Climate Risk Assessment and Adaptation Study, New York City Department of
Environmental Protection, October,
http://www.nyc.gov/html/dep/html/about_dep/wastewater_resiliency_plan.shtml.
Oregon Seismic Safety Policy Advisory Commission (OSSPAC 2013) The Oregon Resilience Plan,
Reducing Risk and Improving Recovery for the Next Cascadia Earthquake and Tsunami, Salem, OR:
Oregon Seismic Safety Policy Advisory Commission.
PPD-21 (2013) Presidential Policy Directive/PPD-21, The White House, February 12, 2013,
http://www.whitehouse.gov/the-press-office/2013/02/12/presidential-policy-directive-critical-
infrastructure-security-and-resil.
PPD-8 (2011) Presidential Policy Directive, PPD-8 – National Preparedness, The White House, March
30, 2011, http://www.dhs.gov/presidential-policy-directive-8-national-preparedness.
Preparedness, Emergency Response, and Recovery CIPAC Workgroup (2009) All-Hazard Consequence
Management Planning for the Water Sector, November.
Randon, C. (2006) ―Employees fight to keep infants safe,‖ PR Tactics, September, www.prsa.org.
Rhoades, C.C.; D. Entwistle,; and D. Butler (2011) ―The Influence of Wildfire Extent and Severity on
Streamwater Chemistry, Sediment and Temperature Following the Hayman Fire, Colorado,‖
International Journal of Wildland Fire, 20:3:430. http://dx.doi.org/10.1071/WF09086.
Rosen, J.S.; A.J. Whelton; M.J. McGuire; J.L. Clancy; T. Bartrand; A. Eaton; J. Patterson; M. Dourson;
P. Nance; C. Adams (2014) ―The crude MCHM chemical spill in Charleston, W.Va.,‖ Journal - American
Water Works Association, 106 (9): 65-74. http://dx.doi.org/10.5942/jawwa.2014.106.0134.
Sanders, D.A. (1997) ―Damage to Wastewater Treatment Facilities from Great Flood of 1993,‖ Journal of
Environmental Engineering, January, Vol. 123, Issue 1.
SFPUC (2006) General Seismic Requirements for Design of New Facilities and Upgrade of Existing
Facilities, San Francisco Public Utilities Commission, San Francisco, CA.
Stevens, D.R. and L.D. Pittman (2004) Emergency Power Source Planning for Water and Wastewater,
American Water Works Association (AWWA), Denver, CO.
Tanaka, S.S. (1995) ―Shaken into action,‖ Journal - American Water Works Association, 87(5): 71-75.
The White House (2013b) Executive Order 13636 – Improving Critical Infrastructure Cybersecurity, the
White House, Washington, DC, http://www.gpo.gov/fdsys/pkg/FR-2013-02-19/pdf/2013-03915.pdf.
Viewed April 19, 2015.
Thompson, Phil (2012) ―Standby Power Generation: A Key Part of an Emergency Plan,‖ Journal -
American Water Works Association, 104(1): 34-36, http://dx.doi.org/10.5942/jawwa.2012.104.0019.
Community Resilience Planning Guide for Buildings and Infrastructure Systems - Volume II
Water and Wastewater Systems
229
United States Centers for Disease Control and Prevention, United States Environmental Protection
Agency, and American Water Works Association (CDC/EPA/AWWA 2013) Drinking Water Advisory
Communication Toolbox, United States Department of Health and Human Services (DHHS), Atlanta,
GA, http://www.cdc.gov/healthywater/emergency/dwa-comm-toolbox/index.html?s_cid=cs_001,
http://www.cdc.gov/healthywater/pdf/emergency/drinking-water-advisory-communication-toolbox.pdf.
Writer, J.H.; A. Hohner; J. Oropeza; A. Schmidt; K.M. Cawley; F.L. and Rosario-Ortiz (2014) ―Water
treatment implications after the High Park Wildfire, Colorado,‖ Journal - American Water Works
Association, 106:4, E189-E199, http://dx.doi.org/10.5942/jawwa.2014.106.0055.

Community Resilience Planning Guide for Buildings and Infrastructure Systems - Volume II
Community Resilience Metrics
230
17. Community Resilience Metrics
Community Resilience Metrics Executive Summary
Metrics help communities assess their current level of resilience and the potential benefits of actions to
improve its resilience. To be of value, metrics selected by the planning team should be indicators of the
community‘s capacity to respond to and recover from hazard events. The primary metrics used
throughout this Guide are times for recovery of function (recovery times) for building clusters and
supporting infrastructure systems identified as being critical to the economic vitality and social well-being
of the community.
Recovery times are estimated for the prevailing hazards that are expected to impact the community. Given
a set of physical impacts to the built environment and recovery times, it then becomes possible to estimate
the associated economic, social, and environmental impacts. Selecting metrics to measure community-
level economic, social, and environmental impacts and predicting how they will be affected by specific
community planning and implementation decisions is a challenging and ongoing area of research.
The sections below review examples of economic, social and environmental metrics suggested in the
research literature and summarize several representative resilience assessment methodologies. While the
economic dimension is just one of three main community-level dimensions to be assessed along with the
social and environmental dimensions, it is perhaps the most tractable and well-developed of the three.
17.1. Background
Community resilience metrics come in a wide variety of types. They can be descriptive or quantitative;
they can be based on interviews, expert opinion, engineering analysis, or pre-existing datasets. They can
also be presented as an overall score or as a set of separately reported scores across physical, economic,
social, and environmental dimensions. Regardless of the methodologies used to develop and summarize
the results, effective community resilience metrics must address two questions [National Academies
2012a]:
How can community leaders know how resilient their community is?
And how can they know if their decisions and investments to improve resilience are making a
significant difference?3
In 2012, the National Academies Committee on Increasing National Resilience to Hazards and Disasters
and the Committee on Science, Engineering, and Public Policy evaluated seventeen approaches to
measuring various aspects of resilience. The authors concluded that none of the seventeen existing
methodologies satisfactorily addressed both of the two basic questions posed above. As a result, one of
the six main recommendations from the report was development of a ―national resilience scorecard, from
which communities can then develop their own, tailored scorecards‖ [National Academies 2012b].
Similar recommendations are in other recent reviews of hazard risk reduction and resilience [U.K.
Government Office for Science 2012; UNISDR 2012]. A tailorable or locally relevant scorecard indicates
that a single prescriptive scorecard may not be appropriate for a wide range of communities (e.g., from
small agriculture communities to large industrial cities).
3As stated in (National Academies 2012b), ―measuring resilience is challenging but essential if communities want to track their
progress toward resilience and prioritize their actions accordingly.‖
Community Resilience Planning Guide for Buildings and Infrastructure Systems - Volume II
Community Resilience Metrics
231
17.2. Desirable Characteristics for Community Resilience Metrics
From the community perspective, effective community resilience metrics should be accurate, reliable,
comprehensive, scalable, affordable, and actionable metrics of the community‘s capacity to respond to
and recover from hazard events. Cutter [2014] suggests that communities seek resilience metrics that are
open and transparent and align with the community‘s goals and vision. Further, community resilience
metrics need to be simple and well-documented, address multiple hazards, be replicated by others,
characterize geographic extent, physical dimensions, and community members, and be adaptable and
scalable to different communities and changing circumstances.
This chapter focuses on community resilience metrics and methodologies that can reliably predict the
physical, economic, social, and environmental implications (positive or negative) of community decisions
(active or passive) made with respect to planning, siting, design, construction, operation, protection,
maintenance, repair, and restoration of the built environment.
17.3. Types of Metrics
As defined in PPD-21 [2013] and emphasized throughout this Guide, the concept of resilience extends
beyond the magnitude of direct physical damage sustained by the various components of the built
environment for a hazard event. The concept of community resilience requires metrics that can evaluated
and measure performance at a community scale, rather than, for example, that of a single building,
infrastructure system, or social dimension.
Looking beyond direct physical damage and repair costs for the built environment, at least four broad
categories of metrics might be considered by communities: (1) recovery of community function metrics
(recovery time), (2) economic vitality metrics, (3) social well-being metrics, and (4) environmental
resilience metrics. A community can use metrics to measure improvements over time, or predict the
effectiveness of proposed solutions. However, predicting how these metrics will be impacted by specific
community planning and implementation decisions is a challenging and ongoing area of research.
Community resilience metrics may have a direct and quantifiable cause-and-effect influence on resilience;
whereas others may either have some postulated influence on resilience or simply be correlated with
resilience. Examples of metrics that may influence or correlate with recovery times, economic vitality,
social well-being, and environmental resilience appear below.
17.3.1. Time to Recovery of Function
A metric based on time to recovery of function for the built environment is easy to grasp, but difficult to
predict with precision or confidence. Estimates of recovery times might be affected by:
Design criteria used for components of the built environment and their condition immediately
prior to the hazard event
Hazard loads and effects applied to the built environment during and after the event
Spatial distribution and extent of physical damage to the built environment
Availability of resources and leadership to improve or repair the built environment
Critical dependencies among the built environment and social structures within a community
Recovery times directly impact economic, social and environmental processes in a community. As such,
estimates of system recovery times become a prerequisite for most, if not all, other measures of
community resilience. Due to the large volume of data required and the complexity of modeling the built

Community Resilience Planning Guide for Buildings and Infrastructure Systems - Volume II
Community Resilience Metrics
232
environment at a community scale, recovery times are likely to be estimates based on some combination
of simplified modeling, past experience, and expert judgment.
An example of recovery times for building cluster and infrastructure systems of a hypothetical community
appears in Chapter 9 in Volume I. The recovery times are based on the buildings and infrastructure
system examples discussed in Chapters 12 through 16. Each community will have its own set of building
clusters, infrastructure systems, and desired performance levels that reflect its goals and priorities.
17.3.2. Economic Vitality
Economic health and development are major concerns for communities. Economic development concerns
include attracting and retaining businesses and jobs, building the tax base, addressing poverty and
inequality, enhancing local amenities, and economic sustainability. These factors are discussed below.
Further background on economic modeling approaches and issues is given in Section 17.5.
17.3.2.1. Attracting and Retaining Businesses and Jobs
Generally, a community that cannot attract and retain businesses and jobs is in decline. Therefore,
attracting and retaining businesses and jobs is a major concern of most communities; in particular
communities prefer businesses that produce high-paying jobs. Metrics for economic vitality might include
the employment rate, per capita income, per capital gross domestic or regional product, and education
attainment rate.
Metrics indicative of a community‘s ability to continue attracting and retaining businesses and jobs
depend on the resilience of building clusters and infrastructure systems. For example, the availability of
safe and affordable housing after a hazard event, along with supporting infrastructure services, are key
requirements for employees and the economic health of the community.
17.3.2.2. Tax Base
For most cities, local revenue sources consist of some combination of property and sales tax. A sales tax
revenue base is maintained by attracting commercial businesses and jobs. The property tax revenue base
depends on property values.
Tax base metrics include real-estate prices, rents, and tourism revenue (e.g., hotel tax). Metrics indicative
of how a community‘s tax base would be affected by a hazard event might include the extent of property
insurance coverage across the community, the percent of property in areas susceptible to hazards (like
flood plains), and the number of building permits issued.
17.3.2.3. Poverty and Income Distribution
Poverty and income distribution are a major concern of local communities. Many communities have
programs to decrease poverty in their neighborhoods, and a significant amount of external funding is
available to alleviate poverty in communities. This concern intersects with community resilience because
the disadvantaged are often the most vulnerable after hazard events. Metrics of poverty and income
distribution include the poverty rate and the Gini coefficient, a measure of income dispersion [The World
Bank 2015].
Community Resilience Planning Guide for Buildings and Infrastructure Systems - Volume II
Community Resilience Metrics
233
17.3.2.4. Local Services and Amenities
Local services and amenities include a variety of other services, such as public transportation, parks,
museums, restaurants, and theaters. Local services and amenities improve the quality of life for local
residents. In addition, improving local amenities may indirectly help attract and retain businesses and
jobs. Amenities are provided by multiple sources. Some are provided by local governments, some are
privately provided, and some are based on the natural environment. Metrics for amenities will depend on
the community, and may be indirectly measured through economic vitality, social well-being, or
environmental metrics.
17.3.2.5. Economic Sustainability
Local communities are interested in ensuring they develop and maintain a vibrant and thriving economy,
even amid hazard events. Metrics of economic sustainability include growth rates of gross domestic or
regional product.
Factors that might affect a community‘s economic sustainability after hazard events include the degree to
which the local economy depends on a single industry. Metrics could include percent of jobs in each
service industry, such as agriculture or mining.
17.3.2.6. Other Economic Metrics
A number of economic metrics are associated with or affect non-economic aspects of community
resilience. For example, debt ratios are a measure of a community‘s ability to deal with hazard events.
Poverty levels may impact the ability of people to rebound from a hazard event, as well as car and phone
ownership. Similarly, economic sustainability will strongly influence social capital.
17.3.3. Social Well-Being
Based on the hierarchy of human needs presented in Section 10.3, social metrics should address:
Survival – preservation of life and availability of water, food, clothing and shelter
Safety and security – personal safety, financial security, health and well-being
Sense of belonging – belonging and acceptance among family, friends, neighborhoods, and
organizations
Growth and achievement – opportunities for recognition and fulfillment
The resilience of a community following a hazard event depends on how well these needs are met.
Examples of metrics for each of the human needs are provided below. The Canterbury Wellbeing Index
[CERA 2014] is an example of a resilience plan that includes several of these metrics.
17.3.3.1. Survival
Survival depends on the ability of residents, employees and visitors in a community to meet basic
physical requirements, including water, food, shelter, and clothing. Renters may be more vulnerable in
event recovery since they may lack access to financial aid information or sufficient options for shelter in
extreme cases [Cutter et al. 2003].
The ability to meet these requirements depends on the functionality of buildings and infrastructure
systems, supply systems, and system personnel. These needs may be supplied by governmental
organizations, non-governmental aid organizations, or the private sector.

Community Resilience Planning Guide for Buildings and Infrastructure Systems - Volume II
Community Resilience Metrics
234
Metrics for survival during or after a hazard event may include:
Housing availability and affordability
Poverty rates
Homeless rates
Building code adoption and enforcement history
Effectiveness of warning systems
Comprehensive emergency operations plans (mutual aid agreements, emergency response resources,
urban search and rescue teams, public shelters)
Capacity of community service organizations that assist in distributing water, food, or clothing or
providing shelter after a hazard event
Level of household hazard preparation
Percentage of homes that are owner occupied or rentals
Percentage of insured homes and businesses
Availability of short- and medium-term accommodation
Distance to family and friends unaffected by the hazard event
17.3.3.2. Safety and Security
Safety and security includes all aspects of personal and financial security, and health and well-being.
People require safety and security in their personal lives from situations of violence, physical or verbal
abuse, etc., as well as knowing that their family and friends are safe. Individuals also require financial
security, which can include job security, a consistent income, savings accounts, insurance policies, and
other safety nets. Finally, people require safety from poor health conditions, so that they can enjoy life
and consistent well-being.
Examples of metrics for personal safety evaluated before and after a hazard event could include
community statistics on assaults, property offenses, re-offending rates, and reports on child abuse or
neglect.
Examples of metrics for financial security include employment rates (also under economic metrics in
Section 17.3.2.1). Additionally, metrics on how employment may be affected by a hazard event may
include occupation type, education levels, percentage of residents that commute outside the communities
for work, and gender. For instance, women may have a more difficult time than men retaining
employment due to employment type, lower wages, or family care responsibilities. Some occupations,
such as those based on tourism, may be more severely affected by a hazard event [Cutter et al., 2003].
Examples of metrics for health and well-being could include acute medical admissions, immunization
rates, cancer admissions, substance abuse rates, and blood donor rates. Additionally, metrics for
community health and well-being may include the percentage of the population with health insurance,
access to health services, and community demographics. Health service metrics include health system
demand and capacity for emergency rooms, in-patient beds, out-patient clinics, community health centers,
and mental health services. Community demographics include age distribution, number of individuals
with disabilities, or those with access and functional needs.
17.3.3.3. Sense of Belonging
Social metrics can also address belonging and acceptance among various groups of people (e.g., family,
friends, school groups, sports teams, work colleagues, religious congregation) or belonging to a place or
location. Examples of metrics related to sense of belonging include [Foxton and Jones, 2011]:

Community Resilience Planning Guide for Buildings and Infrastructure Systems - Volume II
Community Resilience Metrics
235
Civic participation:
Voter registration or voter participation rates
Involvement in local action groups
Perception of being well-informed of local affairs
Social networks:
Frequency of contact with friends, family, neighbors, etc.
Number of geographically close friends and family
Social participation:
Membership and involvement in community social, cultural, and leisure groups, including sports
clubs
Membership and involvement in religious organizations and other belief systems
Volunteers in social organizations
Trust
Confidence in leadership, such as government, businesses, and social organizations at various
levels
Trust in community members
17.3.3.4. Growth and Achievement
Humans need to feel a sense of achievement and respect in society, accompanied by the need for
continual growth and exploration. Activities related to growth and achievement include education and
participation in arts and recreation. Examples of metrics related to educational growth and achievement
include: educational system capacity and demand for teachers, classrooms, books, graduation rates,
memberships in public libraries, and education levels.
17.3.4. Environmental Resilience
In addition to promoting economic vitality and social well-being, there is a growing interest in protecting
and improving natural environments (e.g., being green and maintaining a small ecological footprint). The
U.S. Environmental Protection Agency [EPA 2014] defines environmental community resilience as
―minimizing environmental risks associated with hazards, quickly returning critical environmental and
ecological services to functionality after a hazard, and applying this learning process to reduce
vulnerabilities and risks to future incidents.‖
Environmental resilience metrics include air, water and soil quality; degree of development within
floodplains or other environmentally sensitive areas; waste treatment level and disposal capacities;
average daily water usage; percent impervious surfaces; erosion rates; wetlands loss; and many others
[e.g., EPA 2014; Cutter et al. 2014; UNISDR 2014].

Community Resilience Planning Guide for Buildings and Infrastructure Systems - Volume II
Community Resilience Metrics
236
17.3.5. Hybrid Metrics
Some metrics combine other metrics into an overall score. Additional types of metrics, beyond the four
broad categories discussed above, may be included. Metrics for buildings or infrastructure systems are
discussed in Section 17.3.6.
Due to the sparsity of data, the unique aspects of how each hazard event affects a community, and the
lack of generally applicable community resilience models, the scaling and weighting schemes used to
aggregate disparate metrics into an overall score are largely based on the reasoning and judgment of those
developing the overall metric. Scaling and weighting schemes need to avoid the use of overlapping or
closely correlated metrics, as they can bias resilience plans with an over-weighted metrics or by double
counting benefits. One widely used technique is to monetize all of the metrics, such as the statistical value
of lost lives, lost jobs, lost business revenue, and increased health care costs. However, this approach
cannot adequately address all of the social or environmental dimensions of community resilience.
17.3.6. Other Metrics
Examples of building or infrastructure system metrics include:
Housing occupancy, business property occupancy, temporary shelter demand
Water system pressure level, water quality, or average daily demand
Transportation system demand and capacity, such as vehicles per hour or shipping tonnage
capacities
Communications systems availability and reliability for phone, internet, etc.
Energy systems availability and reliability for electric power, natural gas, liquid fuels
17.4. Examples of Existing Community Resilience Assessment Methodologies
Many community-wide resilience assessment methodologies have been proposed in the research
literature, as discussed in Section 17.1. This section presents a brief overview of nine methodologies and
their applicability as tools for assessing community resilience. The nine methodologies represent a cross-
section of community assessment sources and techniques. Not all of the nine methodologies were
developed specifically for assessing community resilience, but they are considered as relevant and
potentially applicable in whole or part.
There are a number of other resilience assessment tools that are not addressed here. The methodology
review is intended to help communities consider the variety of tools available for obtaining the
information and community involvement needed to develop a community resilience plan.
17.4.1. SPUR Methodology
SPUR is a member-supported nonprofit organization that brings various stakeholders together to develop
solutions to problems faced by cities in the San Francisco Bay Area. As a part of its work, SPUR
developed a methodology that provides ―a framework for improving San Francisco‘s resilience through
seismic mitigation policies.‖ The stated goals of the SPUR report [2009] are:
1. Define the concept of ―resilience‖ in the context of disaster planning,
2. Establish performance goals for the expected earthquake that supports our definition
of resilience,

Community Resilience Planning Guide for Buildings and Infrastructure Systems - Volume II
Community Resilience Metrics
237
3. Define transparent performance measures that help us reach our performance goals;
and
4. Suggest next steps for San Francisco‘s new buildings, existing buildings and lifelines.
The SPUR methodology focuses on establishing performance goals for several building clusters (i.e.,
groups of buildings that provide a community service, such as critical response facilities, emergency
housing, or neighborhood services) and establishing target recovery times for a specified earthquake event
in the San Francisco area. While economic and social metrics are not direct outputs of the SPUR
methodology, the building clusters selected and recovery time goals provided are clearly intended to
improve both the economic and social resilience of San Francisco. Similarly, although SPUR focuses on
earthquakes as the primary hazard, the underlying methodology is applicable to other communities and
hazards.
17.4.2. Oregon Resilience Plan
In 2011, the Oregon Seismic Safety Policy Advisory Commission (OSSPAC) was directed by Oregon
House Resolution 3 ―to lead and coordinate preparation of an Oregon Resilience Plan that reviews policy
options, summarizes relevant reports and studies by state agencies, and makes recommendations on
policy direction to protect lives and keep commerce flowing during and after a Cascadia earthquake and
tsunami.‖ The OSSPAC assembled eight task groups (earthquake and tsunami, business and work force
continuity, coastal communities, critical buildings, transportation, energy, information and
communications, water and wastewater) and assigned tasks to each group:
1. Determine the likely impacts of a magnitude 9.0 Cascadia earthquake and tsunami
on its assigned social and physical systems, and estimate the time required to restore
functions if the earthquake were to strike under present conditions;
2. Define acceptable timeframes to restore functions after a future Cascadia
earthquake to fulfill expected resilient performance; and
3. Recommend changes in practice and policies that, if implemented during the next 50
years, will allow Oregon to reach the desired resilience targets.
The Oregon Resilience Plan [OSSPAC 2013] built on the SPUR methodology and the Resilient
Washington State initiative [Washington State Seismic Safety Committee Emergency Management
Council 2012] to produce a statewide projection of the impacts of a single earthquake and tsunami event.
The Resilient Washington State initiative is a framework developed based on the methodology developed
by SPUR, similar to the Oregon Resilience Plan. The Resilient Washington State framework uses
performance goals table and criteria similar to that in the Oregon Resilience Plan. Predicted impacts
include lives lost, buildings destroyed or damaged, and households displaced. A particular statewide
vulnerability identified in the study is Oregon‘s liquid fuel supply and the cascade of impacts induced by
a long-term disruption of the liquid fuel supply. The study includes recommended actions to improve
resilience for the selected hazard event and shorten the state‘s recovery time.
17.4.3. UNISDR Disaster Resilience Scorecard for Cities
The United Nations International Strategy for Disaster Risk Reduction (UNISDR) Disaster Resilience
Scorecard for Cities ―provides a set of assessments that will allow cities to understand how resilient they
are to natural disasters‖ [UNISDR 2014]. The Scorecard is ―intended to enable cities to establish a
baseline measurement of their current level of disaster resilience, to identify priorities for investment and
action, and to track their progress in improving their disaster resilience over time.‖ There are 85 disaster
resilience evaluation criteria grouped into the following areas:

Community Resilience Planning Guide for Buildings and Infrastructure Systems - Volume II
Community Resilience Metrics
238
Research including evidence-based compilation and communication of threats and needed
responses
Organization including policy, planning, coordination and financing
Infrastructure including critical and social infrastructure and systems and appropriate
development
Response capability including information provision and enhancing capacity
Environment including maintaining and enhancing ecosystem services
Recovery including triage, support services and event planning
Each evaluation criterion addresses an aspect of disaster resilience and has a qualitative measurement
(from 0 to 5, where 5 is best practice).
The formal checklist is organized around ―10 Essentials for Making Cities Resilient,‖ which were
developed to align with the five priorities of the Hyogo Framework [UNISDR 2005]. The overall score is
the percentage of possible points from each of the 85 measures. UNISDR suggests that cities plan on 2 to
3 people working for a minimum of 1 week to complete an assessment, ranging up to 2 months for a more
detailed and comprehensive assessment.
17.4.4. CARRI Community Resilience System
The Community and Regional Resilience Institute (CARRI) developed the Community Resilience System
(CRS) [CARRI 2013] to be ―an action-oriented, web-enabled process that helps communities to assess,
measure, and improve their resilience to … threats and disruptions of all kinds, and ultimately be
rewarded for their efforts. The Community Resilience System (CRS) brings together people, process and
technology to improve resilience in individual communities. The system includes not only a knowledge
base to help inform communities on their resilience path but also a process guide that provides a
systematic approach to moving from interest and analysis to visioning and action planning. It also
provides a collaborative mechanism for other interested stakeholders to support community efforts.‖
The CRS is a DHS/FEMA funded initiative. It began in 2010, convening three working groups:
researchers (Subject Matter Group), community leaders (Community Leaders Group), and government
and private sector representatives (Resilience Benefits Group). The findings of these working groups
culminated in the development of the CRS web-based tool along with pilot implementations in eight
communities commencing in the summer of 2011.
The CRS addresses 18 distinct Community Service Areas (CSAs) and is designed specifically for use by
community leaders. The web process is a checklist driven approach, with questions tailored for each of
the CSAs. The answer to a question may trigger additional questions. For many of the questions,
comment fields are provided so that communities may answer the questions as specifically as possible.
The CARRI team notes that a facilitated approach (i.e., an outside group working with the community,
such as CARRI), is most effective. ―The CRS process works more productively as a ‗partially facilitated‘
model where some supportive expertise assists communities in applying aspects of resilience to and
embedding them within their community circumstances and processes.‖
17.4.5. Communities Advancing Resilience Toolkit (CART)
The Communities Advancing Resilience Toolkit or CART [TDC 2012] was developed by the Terrorism
and Disaster Center at the University of Oklahoma Health Sciences Center. It was funded by the
Substance Abuse and Mental Health Services Administration, U.S. Department of Health and Human

Community Resilience Planning Guide for Buildings and Infrastructure Systems - Volume II
Community Resilience Metrics
239
Services, and the National Consortium for the Study of Terrorism and Responses to Terrorism, U.S.
Department of Homeland Security, and by the Centers for Disease Control and Prevention.
CART is designed to enhance community resilience through planning and action. It engages community
organizations in collecting and using assessment data to develop and implement solutions for building
community resilience for hazard prevention, preparedness, response, and recovery. The CART process
uses a combination of qualitative and quantitative approaches, and it involves these steps:
1. Generating a community profile (CART Team and Partners)
2. Refine the community profile (Community Work Groups)
3. Develop a strategic plan (Community Planning Groups)
4. Implement the plan (Community Leaders and Groups)
The CART approach is not hazard specific, and is applicable across communities of varying size and
type. It is innovative, providing a complete set of tools and guidelines for communities to assess their
resilience across a number of domains. The toolkit includes the CART assessment survey, key informant
interviews, data collection framework, community conversations, neighborhood infrastructure maps,
community ecological maps, stakeholder analysis, SWOT analysis, and capacity and vulnerability
assessment. The focus of the approach is to provide a process that engages communities in thinking about
resilience and to provide a foundation for more advanced resilience activities.
17.4.6. Baseline Resilience Indicators for Communities (BRIC)
The Baseline Resilience Indicators for Communities (BRIC [Cutter et al. 2014]) process builds on prior
work by Cutter et al. [2010], and is based on empirical research with a conceptual and theoretical
framework. BRIC measures overall community resilience. The approach provides a resilience metric for
use in a policy decisions. Using data from 30 public and freely available sources, BRIC comprises 49
indicators (metrics) associated with six domains:
Social (10 indicators)
Economic (8 indicators)
Housing and infrastructure (9 indicators)
Institutional (10 indicators)
Community Capital (7 indicators)
Environmental (5 indicators)
BRIC is not hazard specific, and has been implemented at the county level. The 49 indicators were
selected through conceptual, theoretical, and empirical justifications as capturing qualities associated with
community resilience. Indicators in the six domains identify potential areas that policy makers may
consider for investment and intervention strategies to improve resilience.
17.4.7. Rockefeller Foundation City Resilience Framework
The City Resilience Framework (CRF) is a framework ―for articulating city resilience‖ developed by
Arup [2014] with support from the Rockefeller Foundation 100 Resilient Cities initiative. This framework
is based on an extensive literature review, including cities with varying characteristics and a substantial
amount of fieldwork to collect data and develop case studies. The framework organizes 12 indicators into
4 categories:

Community Resilience Planning Guide for Buildings and Infrastructure Systems - Volume II
Community Resilience Metrics
240
Leadership and strategy
Health and wellbeing
Infrastructure and environment
Economy and social
This organization integrates social and physical aspects, and it considers human-driven processes as
components of the community. Economic constraints are also considered in an integral way for planning
purposes. The 12 indicators span seven qualities identified as characteristic of a resilient city: being
reflective, resourceful, robust, inclusive, redundant, integrated, and flexible.
The CRF serves as the basis for a City Resilience Index (CRI) being developed in 2015. The CRI will
further refine the 4 categories and 12 indicators of the framework into 48 to 54 sub-indicators and 130 to
150 variables or metrics.
17.4.8. NOAA Coastal Community Resilience Index
The National Oceanic and Atmospheric Administration‘s Coastal Community Resilience Index [Sempier
et al. 2010] was developed to provide a simple and inexpensive self-assessment tool to give community
leaders a method of predicting whether their community will reach and maintain an acceptable level of
functioning after a hazard event. The tool is to be completed by experienced local planners, engineers,
floodplain managers, and administrators in less than three hours using readily available, existing sources
of information, in a yes/no question format.
The Coastal Community Resilience Index (CCRI) primarily addresses coastal storms, particularly
hurricanes and storm surge or rain induced flooding events. More specifically, it focuses on immediate
and short-term restoration of basic services and how long a community will take to recover after a hazard
event. The eight page assessment form addresses six broad areas:
1. Critical facilities and infrastructure
2. Transportation issues
3. Community plans and agreements
4. Mitigation measures
5. Business plans
6. Social systems
The resulting assessment is meant to identify vulnerabilities that should be addressed before the next
hazard event, including areas in which a community should become more resilient and where resources
should be allocated. It also estimates the adaptability of a community to a hazard, but is not meant to
replace a detailed study. The authors note that ―The Resilience Index and methodology does not replace a
detailed study…. But, the Resilience Index resulting from this Community Self-Assessment may
encourage your community to seek further consultation.‖
The authors also state that the tool should not be used to compare one community to another. Rather, they
recommend using it as an approach to internal evaluation to identify areas in which a given community
might increase its resilience. As part of its development process the NOAA CRI was pilot tested in 17
communities in five states (Alabama, Florida, Louisiana, Mississippi, and Texas). In addition to
developing their community indices, these pilot tests were also used to further refine and improve the
assessment methodology.

Community Resilience Planning Guide for Buildings and Infrastructure Systems - Volume II
Community Resilience Metrics
241
17.4.9. FEMA Hazus Methodology
The Federal Emergency Management Agency‘s Hazus tool [FEMA 2015] ―is a nationally applicable
standardized methodology that contains models for estimating potential losses from earthquakes, floods
and hurricanes. Hazus uses Geographic Information Systems (GIS) technology to estimate physical,
economic and social impacts of hazards. It graphically illustrates the boundaries of high-risk locations due
to earthquake, hurricane and floods. Users can visualize the spatial relationships between populations and
other fixed geographic assets or resources for the specific hazard being modeled – a crucial function in
the pre-disaster planning process.‖
The Hazus methodology and associated data sets cover the entire U.S. The study region can be defined as
any combination of U.S. Census tracts. The specific hazard models included are earthquake (including
fire following), flood (riverine or coastal) and hurricane (wind and storm surge). The focus of the model
is on immediate physical and economic impacts, and social impacts to a lesser degree. The model
produces outputs on expected loss of use for buildings and infrastructure systems (earthquake and flood
only), shelter requirements, casualties (earthquake only), building contents and inventory losses, lost
wages and income, and indirect economic losses (earthquake and flood only). Estimated repair times are
explicitly considered in economic loss estimates produced by the model, but the economic outputs are not
tabulated or viewable as a function of time. While Hazus can be used to assess losses avoided through
some mitigation measures, it does not estimate mitigation costs and, therefore, does not output estimates
of return on investment.
Some information required for a community-level resilience assessment is not addressed, such as system
dependencies, social impacts, and recovery of community functions. However, the Hazus methodology
and the types of results produced could support more comprehensive methodologies.
17.4.10. Comparison Matrix
Figure 17-1 provides a summary comparison of the nine example methodologies discussed in the
preceding sections. As noted earlier, not all of these methodologies were originally developed specifically
for the purpose of assessing community resilience, but each is thought to offer relevant and potentially
applicable methods, metrics, or processes.
Each methodology was assessed on three broad dimensions: (1) scope, (2) utility, and (3) impacts
assessed. Scope includes the breath of community sizes, hazard types and intensities, recovery time scales
(e.g., short, medium, and long-term), systems (i.e., different components of the built environment), and
system dependencies covered by the methodology. Utility addresses the clarity and ease-of-use of the
methodology, the extent of subject matter expert (SME) support required to implement the methodology,
the value of the methodology outputs for planning, and how well the methodology and its outputs align
with the definition of resilience given in PPD-21. Impacts assessed addresses the extent to which the
methodology addresses each of the first three types of metrics discussed in this chapter (i.e., recovery
times, economic vitality and social well-being). A fourth dimension is included in Figure 17-1 to
summarize the data collection and analysis techniques that are either a core or optional element of the
methodology. Assessments were made in the context of community resilience, specifically as it pertains
to the built environment.

Community Resilience Planning Guide for Buildings and Infrastructure Systems - Volume II
Community Resilience Metrics
242
Figure 17-1: Preliminary summary assessment of nine existing community resilience methodologies
Consistent with the findings of previously published assessments, none of the nine methods reviewed is
uniformly strong in each of the three dimensions. However, it may be possible to combine the best
features of several existing and emerging methodologies to produce a new community resilience
assessment methodology that addresses the measurement needs of a community.
17.5. Economic Evaluation of Community Resilience Investment Portfolio
While economic vitality is just one of the three community-level dimensions to be assessed (along with
the social and environmental dimensions), it is perhaps the most tractable and well-developed of the three.
This section briefly summarizes existing economic concepts related to the evaluation of investments to
improve community resilience. The focus is on development of a portfolio of investments that maximize
the social net benefits to the community, recognizing constraints, uncertainty, and dependencies that may
affect the mix of investments.

Community Resilience Planning Guide for Buildings and Infrastructure Systems - Volume II
Community Resilience Metrics
243
17.5.1. Portfolio Considerations
Economic Efficiency. Economic efficiency refers to obtaining the maximum benefit from the resources
available, or more simply, it means not wasting resources.
Maximization of Net Benefits. Improved community resilience can increase the net benefits associated
with a level of service. Net benefits are the increased value of the improved level of service minus the
cost of obtaining that level of service. For instance, one of several alternatives may maximize the net
benefits to the community. While improved levels of service are typically more costly, this type of
analysis can help identify a level of service where the net benefits are maximized.
Minimization of Cost and Loss. From an economic perspective, this is an equivalent formulation to
maximizing net benefits. Since the level of service is defined in terms of minimizing costs and losses, it
may be a more convenient format for analysis. Expressing the results of this analysis in terms of net
benefits is straightforward.
First-Cost vs. Life-Cycle Cost. Effort to identify alternatives that maximize net benefits depends on an
accurate estimate of benefits and costs. When estimating the costs of attaining a desired level of service,
all life-cycle costs need to be accounted for. It is not sufficient to include first costs or construction costs
only. Operational costs, maintenance costs, replacement costs and end-of-life costs, among others, need to
be included.
Multiple Objectives. When there are several complementary and overlapping objectives, the analysis
needs to account for the type of losses that a community wishes to avoid. In any analysis of avoided
losses, care needs to be taken not to double-count savings.
Minimize Economic Losses. The simplest evaluation may be that of minimizing economic losses. This
approach examines the difference between economic gain (in terms of avoided losses) and costs of the
desired level of service.
Minimize Loss of Life. The objectives all relate to economic losses, but the most important consideration
is avoiding loss of life and other casualties. If loss of life is included in the optimization, the benefits are
measured in terms of lives saved (or deaths avoided), while the costs are typically measured in dollars by
assigning a value to the benefits. For lives saved, the Value of a Statistical Life is a standard approach.
However, some form of Lexicographic Preferences could be used as an alternative to directly valuing a
statistical life or other non-economic amenities. Here each objective is strictly ranked, and then optimized
in order. For example, an assessment could optimize for loss of life and then for economic losses. This
ranking approach would ensure the selection of an alternative that minimizes loss of life (irrespective of
costs). Next, the minimum cost alternative that maintained the minimum loss of life would be found.
Minimize Other Losses. Other losses a jurisdiction might wish to avoid include disruption of key
government services, disruption of social networks, and damage to the environment. Including non-
economic factors such as these in the optimization is difficult, as benefits and costs are measured in
different terms. For other benefits, a number of techniques are available to determine the value a
community places on those benefits.
Economic Dependencies. The economy, in general, is affected by the resilience of the built environment.
The reverse also holds – the resilience of the community depends on the health and resilience of the
economy.

Community Resilience Planning Guide for Buildings and Infrastructure Systems - Volume II
Community Resilience Metrics
244
17.5.2. Economic Decision-Making Involving Risk and Uncertainty
Expected Utility Theory. Economists often approach decision-making with expected utility theory. The
basic idea is that people will choose the alternative that has the best ‗utility‘ or value for them. The value
is adjusted to account for both time preference and risk preference.
Time Preference. The value of consumption depends on when it occurs. Typically, future consumption is
discounted [Mankiw 2011].
Risk Preferences. Risk averse individuals prefer to avoid risk. For people who are risk averse, a large
potential loss has more perceived risk than a number of small losses, even though they add up to the same
risk value as the single large loss. Someone who is risk neutral would weigh the two equally.
Risk aversion is handled in economic theory by weighting the large losses more heavily or, equivalently,
by weighting large gains less heavily. The simplest approach, which is used often in net benefit analyses,
is to assume the community is risk neutral, and the present expected value is computed. However, when it
comes to the consequences of disruptive hazard events, it seems unlikely that communities will be risk
neutral.
To account for risk preferences, it is necessary to measure those risk preferences. A number of widely-
accepted methods for measuring risk preferences exist [Mankiw 2011].
Behavioral Economics and Cognitive Bias. Expected utility maximization [Savage 1972] is a difficult
problem and, typically, insufficient resources are available to use this approach. Of the several approaches
available, the most widely accepted is the Heuristics and Biases method. It is based on the idea that
people use standard shortcuts—heuristics—that work well. However, in cases where they do not work
well, they will be biased. The biases are generally used to try and identify the heuristics.
There are a number of identified biases, some of which are relevant here. These include uncertainty, risk,
overconfidence, and small probability events [Mankiw 2011].
Uncertainties. Uncertainties regarding estimates of expected damages and recovery times from hazard
events fall into two categories. First, there are factors that cannot be known with certainty in advance,
such as the timing and magnitude of future hazard events. Second, there are parameters, such as costs,
that are in principal knowable, but are not currently known with certainty. For example, while the cost of
a particular project can be estimated, the level of uncertainty associated with the estimate can vary and
will likely increase with the scope of the project.
Estimates of mitigation costs, recovery costs, and losses all have uncertainty. As plans for community
resilience are developed and refined, the level of uncertainty may reduce.
Uncertainty for indirect costs, such as business interruption losses, may be quite significant. In cases
where estimates have been made, such losses are often as large or larger than direct economic losses.
However, they are difficult to estimate, due to the lack of data from past events to support estimates.
17.6. References
Arup (2014) City Resilience Framework, April The Rockefeller Foundation and Ove Arup & Partners
International Limited, April,
http://www.arup.com/~/media/Publications/Files/Publications/C/City_Resilience_Framework_pdf.ashx.
Canterbury Earthquake Recovery Authority (CERA 2014) Canterbury Wellbeing Index, June 2014,
Canterbury Earthquake Recovery Authority, Christchurch, New Zealand, http://cera.govt.nz/recovery-
strategy/social/canterbury-wellbeing-index.

Community Resilience Planning Guide for Buildings and Infrastructure Systems - Volume II
Community Resilience Metrics
245
Community & Regional Resilience Institute, Community Resilience Team (CARRI 2013) Building
Resilience in America‘s Communities: Observations and Implications of the CRS Pilots, Community &
Regional Resilience Institute (CARRI), Washington, DC, http://www.resilientus.org/wp-
content/uploads/2013/05/CRS-Final-Report.pdf.
Cutter, S.L. (2014) ―The Landscape of Resilience Measures,‖ Presentation at the Resilient America
Roundtable Workshop on Measures of Community Resilience,
http://sites.nationalacademies.org/cs/groups/pgasite/documents/webpage/pga_152239.pdf. Viewed
January 25, 2015.
Cutter, S.L.; B.J. Boruff; and W.L. Shirley (2003) ―Social vulnerability to environmental hazards,‖ Social
Science Quarterly, 84 (1):242-261.
Cutter, S.L.; C.G. Burton; C.T. Emrich (2010) ―Disaster resilience indicators for benchmarking baseline
conditions,‖ Journal of Homeland Security and Emergency Management, 7, Article 51, pp. 1–22.
Cutter, S.L.; K.D. Ash; and C.T. Emrich (2014) ―The geographies of community disaster resilience,‖
Global Environmental Change, 29:65-77.
Environmental Protection Agency (EPA 2014) EPA Explores Interest in Developing Community
Environmental Resilience Indicators and Indices, EPA Technical Brief, Community Environmental
Resiliency Index (CERI) Workshop I, May 6-7.
Federal Emergency Management Agency (FEMA 2015) Hazus: FEMA‘s Methodology for Estimating
Potential Losses from Disasters. https://msc.fema.gov/portal/resources/hazus. Viewed April 19, 2015.
FEMA, Washington, DC/
Foxton, F. and R. Jones (2011) Social Capital Indicators Review, Office for National Statistics
http://www.ons.gov.uk/ons/dcp171766_233738.pdf. Viewed April 19, 2015
Government Office for Science (2012) Reducing Risks of Future Disasters: Priorities for Decision
Makers, Final Project Report – Foresight Project, London, England.
Mankiw, G. (2011) Principles of Economics, Sixth Edition, Cengage Learning.
National Academies (2012a) Disaster Resilience: A National Imperative, Committee on Increasing
National Resilience to Hazards and Disasters and Committee on Science, Engineering, and Public
Policy. Viewed January 25, 2015.
National Academies (2012b) Disaster Resilience: A National Imperative, Committee on Increasing
National Resilience to Hazards and Disasters and Committee on Science, Engineering, and Public
Policy. Viewed January 25, 2015.
Oregon Seismic Safety Policy Advisory Commission (OSSPAC 2013) The Oregon Resilience Plan:
Reducing Risk and Improving Recovery for the Next Cascadia Earthquake and Tsunami, OSSPAC,
Salem, OR.
PPD-21 (2013) Presidential Policy Directive/PPD-21, The White House, February 12, 2013,
http://www.whitehouse.gov/the-press-office/2013/02/12/presidential-policy-directive-critical-
infrastructure-security-and-resil.
San Francisco Planning and Urban Research Association (SPUR 2009) The Resilient City: What San
Francisco Needs from its Seismic Mitigation Policies, San Francisco Planning and Urban Research
Association (SPUR), San Francisco, CA.
Sempier, T.T., D.L. Swann, R. Emmer, S.H. Sempier, and M. Schneider (2010) Coastal Community
Resilience Index: A Community Self-Assessment, MAGSP-08-014, November,
http://www.gulfofmexicoalliance.org/projects/files/83Community_Resilience_Index.pdf.
Community Resilience Planning Guide for Buildings and Infrastructure Systems - Volume II
Community Resilience Metrics
246
Terrorism and Disaster Center at the University of Oklahoma Health Sciences Center (TDC 2012)
Communities Advancing Resilience Toolkit (CART), University of Oklahoma, Norman, OK.
The United Nations Office for Disaster Risk Reduction (UNISDR 2005) Hyogo Framework for Action
2005-2015: Building the Resilience of Nations and Communities to Disasters, World Conference on
Disaster Reduction, Kobe, Hyogo, Japan,
http://www.unisdr.org/files/1037_hyogoframeworkforactionenglish.pdf.
The World Bank (2015) GINI index (World Bank estimate), The World Bank Group,
http://data.worldbank.org/indicator/SI.POV.GINI. Viewed January 15, 2015.
United Nations Office for Disaster Risk Reduction (UNISDR 2012) Making Cities Resilient Report 2012:
My City is Getting Ready! A Global Snapshot of How Local Governments Reduce Disaster Risk, Second
Edition, October, The United Nations Office for Disaster Risk Reduction (UNISDR).
United Nations Office for Disaster Risk Reduction (UNISDR 2014) Disaster Resilience Scorecard for
Cities, The United Nations Office for Disaster Risk Reduction (UNISDR), Geneva, Switzerland.
Washington State Seismic Safety Committee Emergency Management Council (2012) Resilient
Washington State: A Framework for Minimizing Loss and Improving Statewide Recovery after an
Earthquake, Washington State Seismic Safety Committee Emergency Management Council, Olympia,
WA.

Community Resilience Planning Guide for Buildings and Infrastructure Systems - Volume II
Glossary
247
18. Glossary
18.1. List of Terms
Term/Acronym Definition
Buildings Individual structures, including its equipment and contents, that house people and
support social institutions.
Built Capital Buildings and infrastructure systems, including transportation, energy, water,
wastewater, and communication and information systems.
Built Environment All buildings and infrastructure systems. Also referred to as built capital.
Business Continuity The capability of an organization or business to continue delivery of products or
services at acceptable predefined levels following a disruptive incident. (ISO 22301,
2012).
An ongoing process to ensure that the necessary steps are taken to identify the
impacts of potential losses and maintain viable recovery strategies, recovery plans,
and continuity of services (NFPA 1600, 2013).
Clusters A set of buildings and supporting infrastructure systems, not necessarily geographically
co-located, that serve a common function such as housing, healthcare, retail, etc.
Communication and
Information Systems
Equipment and systems that facilitate communication services, including Internet,
cellular and phone services.
Community In the NPG, the term ‗community‘ refers to groups with common goals, values, or
purposes (e.g., local businesses, neighborhood groups).
In this Guide, however, the term ‗community‘ refers to a place designated by
geographical boundaries that functions under the jurisdiction of a governance
structure, such as a town, city, or county. It is within these places that people live,
work, play, and build their futures.
Community Resilience ―The ability to adapt to changing conditions and withstand and rapidly recover from
disruption due to emergencies‖ (PPD-8, 2011).
―The ability to prepare for and adapt to changing conditions and to withstand and
recover rapidly from disruptions. Resilience includes the ability to withstand and
recover from deliberate attacks, accidents, or naturally occurring threats or incidents‖
(PPD-21, 2013).
Community Social
Institutions
A complex, organized pattern of beliefs and behavior that meets basic individual,
household, and community needs, including family/kinship, government, economy,
health, education, community service organizations, religious and cultural groups (and
other belief systems), and the media.
Critical Facilities Buildings that are intended to remain operational during hazard events and support
functions and services needed during the short-term phase of recovery. These facilities
are sometimes referred to as essential buildings.

Community Resilience Planning Guide for Buildings and Infrastructure Systems - Volume II
Glossary
248
Term/Acronym Definition
Critical Infrastructure ―Systems and assets, whether physical or virtual, so vital to the United States that the
incapacity or destruction of such systems and assets would have a debilitating impact on
security, national economic security, national public health or safety, or any
combination of those matters‖ (PPD-21, 2013).
Dependency The reliance of physical and/or social systems on other physical and/or social systems to
function or provide services.
Disaster A serious disruption of the functioning of a community or a society causing widespread
human, material, economic or environmental losses which exceed the ability of the
affected community or society to cope using its own resources (National Science and
Technology Council, 2005).
Disruption The consequences of a hazard event that results in loss of services or functions in a
community.
Emergency Responders Official and volunteer workers during the short-term phase of recovery, also referred to
as the response phase.
Energy Systems Electric power, liquid fuel, and natural gas generation, transmission, and distribution.
Financial Capital Financial savings, income, investments, and available credit.
Function The role or purpose of a particular institution (e.g., education, finance, healthcare)
within a community.
Functionality Capability of serving the intended function, where the built environment provides an
operational level that allows a social institution to provide services.
General Plan A document designed to guide the future actions of a community, with long-range goals
and objectives for the local government, including land development, expenditure of
public funds, tax policy (tax incentives), cooperative efforts, and other issues of interest
(such as farmland preservation, or the rehabilitation of older neighborhoods areas). Also
referred to as a comprehensive plan, master plan, or land use plan (eXtension, 2015).
Governance Structures The governing body of a community.
Hazard A potential threat or an incident, natural or human-caused, that warrants action to
protect life, property, the environment, and public health or safety, and to minimize
disruptions of government, social, or economic activities (PPD-21 2013).
Hazard Event The occurrence of a hazard.
Hazard Impact The quantification of the community consequences of a hazard through affected area
and level of disruption measures
Hazard Level The quantification of the size, magnitude, or intensity of a hazard, such as wind speed,
seismic ground acceleration, flood elevation, etc.
Human Caused
Disaster
A hazard event caused by human error or a deliberate action including a terrorist
activity.

Community Resilience Planning Guide for Buildings and Infrastructure Systems - Volume II
Glossary
249
Term/Acronym Definition
Implementation
Strategies
A planned set of actions that taken together will help meet a goal. To achieve
community resilience, a set of solutions may include land use planning, codes and
standards for new construction, and specific retrofit requirements.
Infrastructure System Physical networks, systems and structures that make up transportation, energy,
communications, water and wastewater, and other systems that support the functionality
of community social institutions.
Life Safety Life safety in the built environment refers to buildings and other structures designed to
protect and evacuate populations in emergencies and during hazard events.
Mitigation Activities and actions taken to reduce loss of life and property by lessening the impact
of hazard events.
Performance Goals Metrics or specific objectives that define successful performance. For the built
environment, performance goals include objectives related to desirable features, such as
occupant protection or time for repairs and return to function.
Redundancy The use of multiple critical components in a system to increase reliability of system
performance and function, particularly when one of the multiple components is
damaged.
Retrofitting Improving the expected performance of existing buildings and infrastructure systems
through remedial repairs and measures that often improve system resistance or strength.
Robustness The ability of a structure or system to continue operating or functioning under a variety
of demands or conditions.
Shelter-in-place Safely remaining in a building, e.g., a residence, during or after a hazard event.
Social Capital Although there is no single definition of social capital, broadly the term refers to ―social
networks, the reciprocities that arise from them, and the value of these for achieving
mutual goals‖ (Schuller, Baron, and Field 2000).
Stakeholders All parties that have an interest or concern in an operation, enterprise, or undertaking.
For community resilience, stakeholders may include representatives from the local
government, such as community development, public works, and building departments;
public and private owners and operators of buildings and infrastructure systems; local
business and industry representatives; representatives of the community‘s social
institutions (e.g., community organizations, nongovernmental organizations,
business/industry groups, health, education, etc.); and any other stakeholders or
interested community groups.
Technological Hazard A human-caused event due to an accident or human error.
Transportation Systems Buildings, structures, and networks that move people and goods, including roads,
bridges, rail systems, airports, coastal or riverine ports, and trucking hubs.
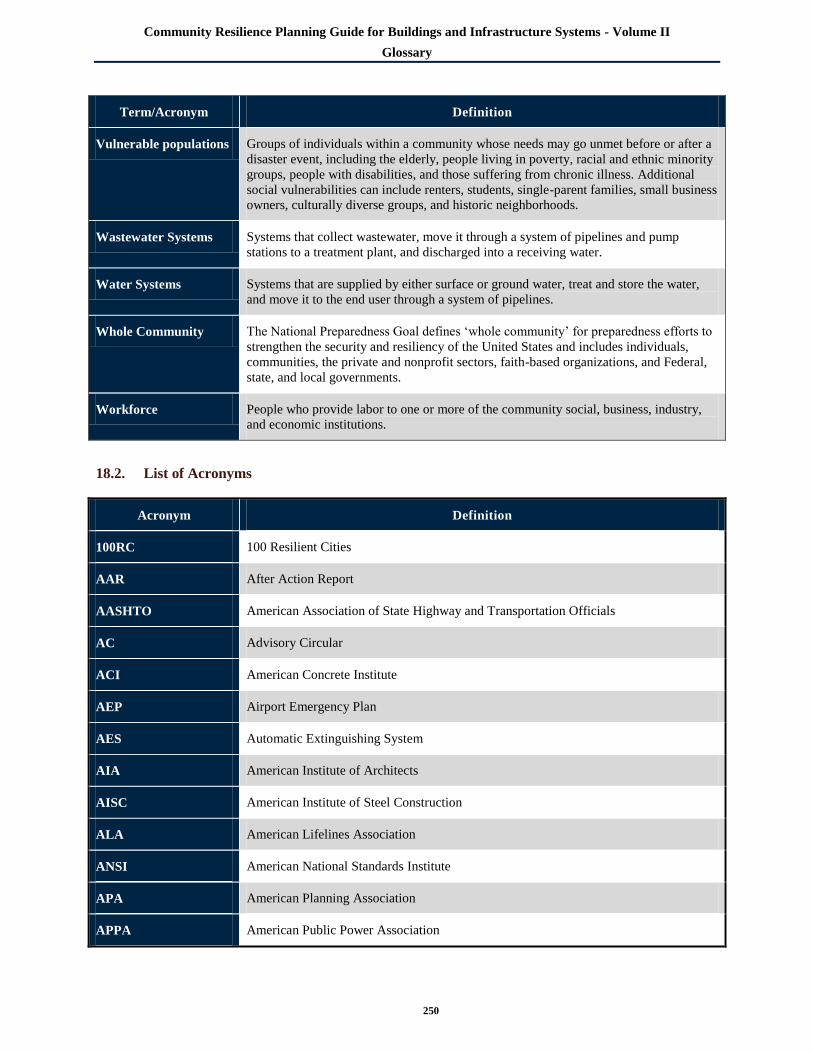
Community Resilience Planning Guide for Buildings and Infrastructure Systems - Volume II
Glossary
250
Term/Acronym Definition
Vulnerable populations Groups of individuals within a community whose needs may go unmet before or after a
disaster event, including the elderly, people living in poverty, racial and ethnic minority
groups, people with disabilities, and those suffering from chronic illness. Additional
social vulnerabilities can include renters, students, single-parent families, small business
owners, culturally diverse groups, and historic neighborhoods.
Wastewater Systems Systems that collect wastewater, move it through a system of pipelines and pump
stations to a treatment plant, and discharged into a receiving water.
Water Systems Systems that are supplied by either surface or ground water, treat and store the water,
and move it to the end user through a system of pipelines.
Whole Community The National Preparedness Goal defines ‗whole community‘ for preparedness efforts to
strengthen the security and resiliency of the United States and includes individuals,
communities, the private and nonprofit sectors, faith-based organizations, and Federal,
state, and local governments.
Workforce People who provide labor to one or more of the community social, business, industry,
and economic institutions.
18.2. List of Acronyms
Acronym Definition
100RC 100 Resilient Cities
AAR After Action Report
AASHTO American Association of State Highway and Transportation Officials
AC Advisory Circular
ACI American Concrete Institute
AEP Airport Emergency Plan
AES Automatic Extinguishing System
AIA American Institute of Architects
AISC American Institute of Steel Construction
ALA American Lifelines Association
ANSI American National Standards Institute
APA American Planning Association
APPA American Public Power Association

Community Resilience Planning Guide for Buildings and Infrastructure Systems - Volume II
Glossary
251
Acronym Definition
AREMA American Railway Engineering and Maintenance-of-Way Association
ASCE American Society of Civil Engineers
ASTM American Society for Testing and Materials
ATC Applied Technology Council
AWWA American Water Works Association
BART Bay Area Rapid Transit
BPS Bulk Power System
BRIC Baseline Resilience Indicators for Communities
BSI British Standards Institute
CAIDI Customer Average Interruption Duration Index
CAIFI Customer Average Interruption Duration Index
CaLEAP California Energy Assurance Planning
CAMV Covered Aerial Medium Voltage
CARRI Community and Regional Resilience Institute
CART Communities Advancing Resilience Toolkit
CATV Cable Television
CCSF City and County of San Francisco
CEI Critical Energy Infrastructure
CIP Capital Improvement Plan
CHP Combined Heat and Power
CSA Community Service Area
COLTs Cell on Light Trucks
CPG Comprehensive Preparedness Guide
CRF Community Resilience Framework
CRI Coastal Community Resilience Index

Community Resilience Planning Guide for Buildings and Infrastructure Systems - Volume II
Glossary
252
Acronym Definition
CRS Community Rating System
CSO Community Service Organization
CSRIC Communications Security, Reliability, and Interoperability Council
DLC RT Digital Loop Carrier Remote Terminal
DLR Dynamic Line Rating
DOB Department of Buildings
DOC Department of Commerce
DoD Department of Defense
DOE Department of Energy
DOGAMI Oregon Department of Geology and Mineral Industries
DOT Department of Transportation
DR Demand Response
DSM Demand Side Management
EA Environmental Assessment
EAS Emergency Alert System
EBMUD East Bay Municipal Utility District
EE Energy Efficiency
EF Enhanced Fujita (scale)
EIA Energy Information Administration
EIM Energy Imbalance Markets
EIS Environmental Impact Statement
EMS Emergency Medical Services
EOC Emergency Operations Center
EOP Executive Office of the President
EPCRA Emergency Planning and Community Right-to-Know Act

Community Resilience Planning Guide for Buildings and Infrastructure Systems - Volume II
Glossary
253
Acronym Definition
EPA Environmental Protection Agency
EPFAT Emergency Power Facility Assessment Tool
EPRI Electric Power Research Institute
ERO Electric Reliability Organization
FAA Federal Aviation Administration
FCC Federal Communications Commission
FEMA Federal Emergency Management Agency
FERC Federal Energy Regulatory Commission
FHWA Federal Highway Administration
FRA Federal Railroad Administration
FTA Federal Transit Administration
GDP Gross Domestic Product
GETS Government Emergency Telecommunications Service
GIS Geographic Information System
GTAA Greater Toronto Airports Authority
HAZMAT Hazardous Materials
HVAC Heating, Ventilation, and Air Conditioning
IA Iowa
IBC International Building Code
IBHS Institute for Business and Home Safety
ICC International Code Council
ICLEI Local Governments for Sustainability
IEBC International Existing Building Code
IEEE Institute of Electrical and Electronics Engineers
IOU Investor-Owned Utility

Community Resilience Planning Guide for Buildings and Infrastructure Systems - Volume II
Glossary
254
Acronym Definition
IPAWS Integrated Public Alert and Warning System
IPP Independent Power Producer
IRC International Residential Code
ISO International Organization for Standardization
ISP Internet Service Provider
ITS Intelligent Transportation Systems
IWUIC International Wildland-Urban Interface Code
IXP Internet Exchange Points
LADWP Los Angeles Department of Water and Power
LAWA Los Angeles World Airports
LRFD Load Factor and Resistance Design
MAP-21 Moving Ahead for Progress in the 21 Century Act
MARAD United States Maritime Administration
MCEER Multidisciplinary Center for Earthquake Engineering Reduction
MSC Mobile Switching Center
MPO Metropolitan Planning Organization
MRE Manual for Railway Engineering
NAPSR National Association of Pipeline Safety Representatives
NARUC National Association of Regulatory Utility Commissioners
NASEO National Association of State Energy Officials
NCHRP National Cooperative Highway Research Program
NDRF National Disaster Recovery Framework
NEBS Network Equipment Building Standards
NEC National Electric Code
NEPA National Environmental Protection Act

Community Resilience Planning Guide for Buildings and Infrastructure Systems - Volume II
Glossary
255
Acronym Definition
NERC North American Electric Reliability Corporation
NESC National Electric Safety Code
NFIP National Flood Insurance Program
NFPA National Fire Protection Association
NGO Nongovernment Organization
NHSRC National Homeland Security Research Center
NIBS National Institute of Building Sciences
NIPP National Infrastructure Protection Plan
NIST National Institute of Standards and Technology
NOAA National Oceanic and Atmospheric Administration
NPG National Preparedness Goal
NRC Nuclear Regulatory Commission
NRECA National Rural Electric Cooperative Association
NWS National Weather Service
NYCC New York Panel on Climate Change
NYCDEP New York City Department of Environmental Protection
NYSERDA New York State Energy Research and Development Authority
OCDI Overseas Coastal Area Development Institute of Japan
OSSPAC Oregon Seismic Safety Policy Advisory Commission
PANYNJ Port Authority of New York and New Jersey
PARRE Program for Risk and Resiliency Evaluation
PDM Pre-Disaster Mitigation
PEP Private Entry Point
PHMSA Pipeline and Hazardous Materials Administration
PIANC World Association for Waterborne Transport Infrastructure

Community Resilience Planning Guide for Buildings and Infrastructure Systems - Volume II
Glossary
256
Acronym Definition
PIEVC Public Infrastructure Engineering Vulnerability Committee
PMU Phasor Measurement Unit
POTS Plain Old Telephone Service
PPD-8 Presidential Policy Directive 8
PPD-21 Presidential Policy Directive 21
PSAP Public-Safety Answering Point
PSEG Public Service Enterprise Group
PV Photovoltaic
ROW Right of Way
RPS Renewable Portfolio Standards
RUS Rural Utilities Service
SAFETEA-LU Safe Accountable Flexible Efficient Transportation Equity Act
SAIDI System Average Interruption Duration Index
SAIFI System Average Interruption Frequency Index
SCADA Supervisory Control Data Acquisition
SDWA Safe Drinking Water Act
SEI Structural Engineering Institute
SFPUC San Francisco Public Utilities Commission
SGIP Smart Grid Interoperability Panel
SLOSH Sea, Lake, and Overland Surges from Hurricanes
SLR Sea Level Rise
SPUR San Francisco Planning and Urban Research Association
SSO Standards Setting Organizations
THIRA Threat and Hazard Identification and Risk Assessment
TIA Telecommunications Industry Association

Community Resilience Planning Guide for Buildings and Infrastructure Systems - Volume II
Glossary
257
Acronym Definition
TRB Transportation Research Board
TSP Telecommunications Service Priority
TVA Tennessee Valley Authority
UFC United Facilities Criteria
UN United Nations
UNIDSR United Nations International Strategy for Disaster Reduction
UPS Uninterruptible Power Supply
URI Utility Resilience Index
US United States
USA United States of America
USACE United States Army Corps of Engineers
USGC United States Coast Guard
VOAD Voluntary Organizations Active in Disaster
VSAT Vulnerability Self-Assessment Tool
WARN Water/Wastewater Agency Response Network
WEA Wireless Emergency Alerts
WHEAT Water Health and Economic Analysis Tool
WPS Wireless Priority Service
WWTP Wastewater Treatment Plant
18.3. References
eXtension (2015) The Purpose of the Comprehensive Land Use Plan, eXtension Foundation,
Centreville, AL, http://www.extension.org/pages/26677/the-purpose-of-the-comprehensive-land-
use-plan#.VTAtaGXD9aQ.
International Organization for Standardization (ISO 2012) Societal security - Business continuity
management systems – Requirements, ISO 22301:2012, International Organization for Standardization,
Geneva, Switzerland.

Community Resilience Planning Guide for Buildings and Infrastructure Systems - Volume II
Glossary
258
National Fire Protection Association (NFPA 2013) NFPA 1600: Standard on Disaster/Emergency
Management and Business Continuity Programs, 2013 Edition, National Fire Protection Association
(NFPA), Quincy, MA.
National Science and Technology Council (2005) Grand Challenges for Disaster Reduction – A Report of
the Subcommittee on Disaster Reduction, National Science and Technology Council, Executive Office of
the President, Washington, DC.
PPD-21 (2013) Presidential Policy Directive/PPD-21, The White House, February 12, 2013,
http://www.whitehouse.gov/the-press-office/2013/02/12/presidential-policy-directive-critical-
infrastructure-security-and-resil.
PPD-8 (2011) Presidential Policy Directive, PPD-8 – National Preparedness, The White House, March
30, 2011, http://www.dhs.gov/presidential-policy-directive-8-national-preparedness.
Schuller, T.; S. Baron; and J. Field (2000) ―Social Capital: A Review and Critique.‖ Social Capital:
Critical Perspectives, edited by Stephen Baron, John Field, and Tom Schuller, Oxford: Oxford University
Press, pp. 1-38.