National Family Health Survey (NFHS-4) India
181
Assam National Family Health Survey (NFHS-4) India 2015-16 International Institute for Population Sciences Deonar, Mumbai 400 088 Ministry of Health and Family Welfare Government of India
-
Upload
khangminh22 -
Category
Documents
-
view
1 -
download
0
Transcript of National Family Health Survey (NFHS-4) India
Assam
National Family Health Survey (NFHS-4)
India
2015-16A
ssamNational Fam
ily Health Survey 2015-16
International Institute for Population SciencesDeonar, Mumbai 400 088
Ministry of Health and Family Welfare
Technical assistance for NFHS-4 was provided by the USAID-supported DHS Program at ICF, and assistance for the HIV components was provided by NACO and NARI. Funding assistance was provided by Ministry of Health and Family Welfare, Government of India and:
The opinions in this publication do not necessarily refl ect the views of the funding agencies.For additional information on NFHS-4, visit http://www.rchiips.org/nfhsFor related information, visit http://www.iipsindia.org or http://www.mohfw.nic.in
Government of India

NATIONAL FAMILY HEALTH SURVEY (NFHS-4)
INDIA
2015-16
ASSAM
MARCH 2018
Suggested citation: International Institute for Population Sciences (IIPS) and ICF. 2018. National Family Health Survey (NFHS-4), India, 2015-16: Assam. Mumbai: IIPS.
For additional information about the 2015-16 National Family Health Survey (NFHS-4), please contact:
International Institute for Population Sciences, Govandi Station Road, Deonar, Mumbai-400088 Telephone: 022-4237 2442 Fax: 022-2556 3257 E-mail: [email protected], [email protected] For related information, visit http://www.rchiips.org/nfhs or http://www.iipsindia.org
CONTRIBUTORS
H. Lhungdim Manas R. Pradhan
Laxmi Kant Dwivedi Alex Izmukhambetov

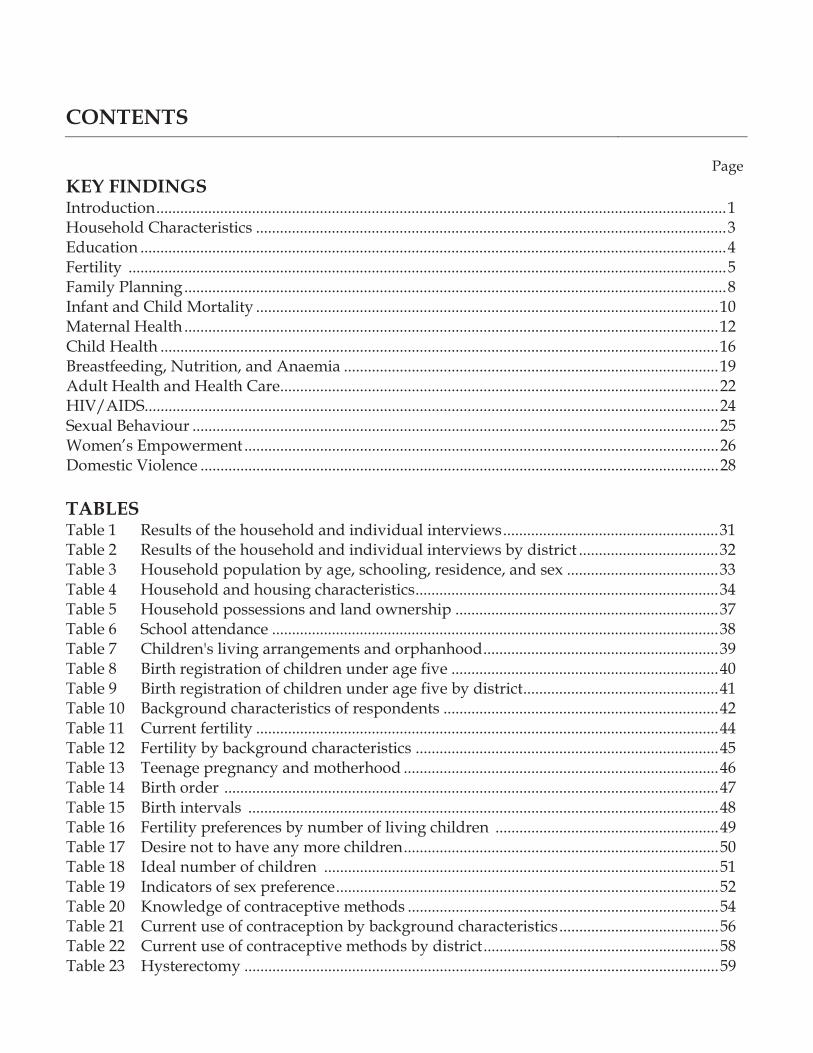
CONTENTS
Page KEY FINDINGS Introduction ............................................................................................................................................... 1 Household Characteristics ...................................................................................................................... 3 Education ................................................................................................................................................... 4 Fertility ...................................................................................................................................................... 5 Family Planning ........................................................................................................................................ 8 Infant and Child Mortality .................................................................................................................... 10 Maternal Health ...................................................................................................................................... 12 Child Health ............................................................................................................................................ 16 Breastfeeding, Nutrition, and Anaemia .............................................................................................. 19 Adult Health and Health Care .............................................................................................................. 22 HIV/AIDS................................................................................................................................................ 24 Sexual Behaviour .................................................................................................................................... 25 Women’s Empowerment ....................................................................................................................... 26 Domestic Violence .................................................................................................................................. 28 TABLES Table 1 Results of the household and individual interviews ...................................................... 31 Table 2 Results of the household and individual interviews by district ................................... 32 Table 3 Household population by age, schooling, residence, and sex ...................................... 33 Table 4 Household and housing characteristics ............................................................................ 34 Table 5 Household possessions and land ownership .................................................................. 37 Table 6 School attendance ................................................................................................................ 38 Table 7 Children's living arrangements and orphanhood ........................................................... 39 Table 8 Birth registration of children under age five ................................................................... 40 Table 9 Birth registration of children under age five by district ................................................. 41 Table 10 Background characteristics of respondents ..................................................................... 42 Table 11 Current fertility .................................................................................................................... 44 Table 12 Fertility by background characteristics ............................................................................ 45 Table 13 Teenage pregnancy and motherhood ............................................................................... 46 Table 14 Birth order ............................................................................................................................ 47 Table 15 Birth intervals ...................................................................................................................... 48 Table 16 Fertility preferences by number of living children ........................................................ 49 Table 17 Desire not to have any more children ............................................................................... 50 Table 18 Ideal number of children ................................................................................................... 51 Table 19 Indicators of sex preference ................................................................................................ 52 Table 20 Knowledge of contraceptive methods .............................................................................. 54 Table 21 Current use of contraception by background characteristics ........................................ 56 Table 22 Current use of contraceptive methods by district ........................................................... 58 Table 23 Hysterectomy ....................................................................................................................... 59
RESEARCH STAFF
Y. Vaidehi Dnyaneshwar B. Kale
Savita V. Raste
Page
Table 24 Contraceptive use by men at last sexual intercourse ...................................................... 60 Table 25 Source of modern contraceptive methods ........................................................................ 62 Table 26 Informed choice .................................................................................................................... 65 Table 27 Twelve-month contraceptive discontinuation rates ....................................................... 66 Table 28 Men's contraception-related perceptions and knowledge ............................................. 67 Table 29 Need and demand for family planning among currently married women.................68 Table 30 Unmet need for family planning by district .................................................................... 70 Table 31 Pregnancy outcome ............................................................................................................. 71 Table 32 Characteristics of abortions ................................................................................................ 72 Table 33 Age at first marriage ............................................................................................................ 73 Table 34 Early childhood mortality rates ......................................................................................... 74 Table 35 Early childhood mortality rates by background characteristics ................................... 75 Table 36 High-risk fertility behaviour .............................................................................................. 76 Table 37 Antenatal care ....................................................................................................................... 77 Table 38 Antenatal care services and information received .......................................................... 78 Table 39 Antenatal care indicators .................................................................................................... 79 Table 40 Antenatal care indicators by district ................................................................................. 80 Table 41 Advice received during pregnancy ................................................................................... 81 Table 42 Pregnancies for which an ultrasound test was done ...................................................... 82 Table 43 Pregnancy registration and Mother and Child Protection Card ................................... 84 Table 44 Delivery and postnatal care ................................................................................................ 85 Table 45 Delivery and postnatal care by background characteristics .......................................... 87 Table 46 Delivery and postnatal care by district ............................................................................. 88 Table 47 Delivery costs and financial assistance ............................................................................. 89 Table 48 Birth order and delivery characteristics by district ........................................................ 90 Table 49 Timing of first health check after birth for the newborn ................................................ 91 Table 50 Trends in maternal care indicators .................................................................................... 92 Table 51 Male involvement in maternal care: Men's report .......................................................... 93 Table 52 Vaccinations by background characteristics .................................................................... 94 Table 53 Selected vaccinations by district ........................................................................................ 96 Table 54 Prevalence and treatment of symptoms of ARI and fever ............................................. 97 Table 55 Prevalence and treatment of diarrhoea ............................................................................ 98 Table 56 Feeding practices during diarrhoea ................................................................................ 100 Table 57 Knowledge of ORS packets .............................................................................................. 101 Table 58 ICDS coverage and utilization of ICDS services .................................................. .........102 Table 59 Utilization of ICDS services during pregnancy and while breastfeeding.................104 Table 60 Nutritional status of children ........................................................................................... 105 Table 61 Initial breastfeeding ........................................................................................................... 108 Table 62 Breastfeeding status by age .............................................................................................. 109 Table 63 Median duration of breastfeeding and infant and young child feeding (IYCF)
practices .................................................... ..........................................................................110 Table 64 Child feeding practices and nutritional status of children by district ....................... 112
Page
Table 65 Prevalence of anaemia in children................................................................................... 113 Table 66 Micronutrient intake among children ............................................................................. 115 Table 67 Presence of iodized salt in household ............................................................................. 117 Table 68 Presence of iodized salt in household by district .......................................................... 118 Table 69 Women's and men's food consumption ......................................................................... 119 Table 70 Nutritional status of adults............................................................................................... 120 Table 71 Prevalence of anaemia in adults ...................................................................................... 121 Table 72 Nutritional status and anaemia among children and women by district ................. 122 Table 73 Knowledge and prevention of HIV/AIDS ..................................................................... 123 Table 74 Accepting attitudes toward those living with HIV/AIDS .......................................... 125 Table 75 Sexual behaviour, HIV testing, blood transfusion, and injections ............................. 127 Table 76 Knowledge of HIV/AIDS and sexual behaviour among youth ................................. 128 Table 77 Prevalence of tuberculosis ................................................................................................ 129 Table 78 Knowledge and attitudes toward tuberculosis ............................................................. 130 Table 79 Health insurance coverage among women and men ................................................... 131 Table 80 Source of health care and health insurance coverage among households ................ 132 Table 81 Health problems ................................................................................................................. 133 Table 82 Health examinations .......................................................................................................... 135 Table 83.1 Blood pressure status: Women ........................................................................................ 136 Table 83.2 Blood pressure status: Men .............................................................................................. 137 Table 84.1 Random blood glucose levels: Women ........................................................................... 138 Table 84.2 Random blood glucose levels: Men................................................................................. 139 Table 85 Tobacco and alcohol use by women and men ............................................................... 140 Table 86 Methods of menstrual protection .................................................................................... 141 Table 87 Employment and cash earnings of women and men ................................................... 142 Table 88 Control over and magnitude of women's cash earnings ............................................. 143 Table 89 Decision making ................................................................................................................. 144 Table 90 Decision making by background characteristics ........................................................... 145 Table 91 Women's access to money and credit ............................................................................. 147 Table 92 Ownership of assets ........................................................................................................... 149 Table 93 Gender role attitudes ......................................................................................................... 150 Table 94 Gender role attitudes by background characteristics ................................................... 151 Table 95 Experience of physical and sexual violence ................................................................... 153 Table 96 Experience of violence during pregnancy ...................................................................... 154 Table 97 Forms of spousal violence ................................................................................................ 155 Table 98 Spousal violence by background characteristics ........................................................... 156 Table 99 Spousal violence by husband's characteristics and empowerment indicators ......... 158 Table 100 Injuries to women due to spousal violence .................................................................... 160 Table 101 Help seeking.......................................................................................................................161
APPENDIX Estimates of sampling errors ............................................................................................................... 163
Page
Table 24 Contraceptive use by men at last sexual intercourse ...................................................... 60 Table 25 Source of modern contraceptive methods ........................................................................ 62 Table 26 Informed choice .................................................................................................................... 65 Table 27 Twelve-month contraceptive discontinuation rates ....................................................... 66 Table 28 Men's contraception-related perceptions and knowledge ............................................. 67 Table 29 Need and demand for family planning among currently married women.................68 Table 30 Unmet need for family planning by district .................................................................... 70 Table 31 Pregnancy outcome ............................................................................................................. 71 Table 32 Characteristics of abortions ................................................................................................ 72 Table 33 Age at first marriage ............................................................................................................ 73 Table 34 Early childhood mortality rates ......................................................................................... 74 Table 35 Early childhood mortality rates by background characteristics ................................... 75 Table 36 High-risk fertility behaviour .............................................................................................. 76 Table 37 Antenatal care ....................................................................................................................... 77 Table 38 Antenatal care services and information received .......................................................... 78 Table 39 Antenatal care indicators .................................................................................................... 79 Table 40 Antenatal care indicators by district ................................................................................. 80 Table 41 Advice received during pregnancy ................................................................................... 81 Table 42 Pregnancies for which an ultrasound test was done ...................................................... 82 Table 43 Pregnancy registration and Mother and Child Protection Card ................................... 84 Table 44 Delivery and postnatal care ................................................................................................ 85 Table 45 Delivery and postnatal care by background characteristics .......................................... 87 Table 46 Delivery and postnatal care by district ............................................................................. 88 Table 47 Delivery costs and financial assistance ............................................................................. 89 Table 48 Birth order and delivery characteristics by district ........................................................ 90 Table 49 Timing of first health check after birth for the newborn ................................................ 91 Table 50 Trends in maternal care indicators .................................................................................... 92 Table 51 Male involvement in maternal care: Men's report .......................................................... 93 Table 52 Vaccinations by background characteristics .................................................................... 94 Table 53 Selected vaccinations by district ........................................................................................ 96 Table 54 Prevalence and treatment of symptoms of ARI and fever ............................................. 97 Table 55 Prevalence and treatment of diarrhoea ............................................................................ 98 Table 56 Feeding practices during diarrhoea ................................................................................ 100 Table 57 Knowledge of ORS packets .............................................................................................. 101 Table 58 ICDS coverage and utilization of ICDS services .................................................. .........102 Table 59 Utilization of ICDS services during pregnancy and while breastfeeding.................104 Table 60 Nutritional status of children ........................................................................................... 105 Table 61 Initial breastfeeding ........................................................................................................... 108 Table 62 Breastfeeding status by age .............................................................................................. 109 Table 63 Median duration of breastfeeding and infant and young child feeding (IYCF)
practices .................................................... ..........................................................................110 Table 64 Child feeding practices and nutritional status of children by district ....................... 112
Page
Table 65 Prevalence of anaemia in children................................................................................... 113 Table 66 Micronutrient intake among children ............................................................................. 115 Table 67 Presence of iodized salt in household ............................................................................. 117 Table 68 Presence of iodized salt in household by district .......................................................... 118 Table 69 Women's and men's food consumption ......................................................................... 119 Table 70 Nutritional status of adults............................................................................................... 120 Table 71 Prevalence of anaemia in adults ...................................................................................... 121 Table 72 Nutritional status and anaemia among children and women by district ................. 122 Table 73 Knowledge and prevention of HIV/AIDS ..................................................................... 123 Table 74 Accepting attitudes toward those living with HIV/AIDS .......................................... 125 Table 75 Sexual behaviour, HIV testing, blood transfusion, and injections ............................. 127 Table 76 Knowledge of HIV/AIDS and sexual behaviour among youth ................................. 128 Table 77 Prevalence of tuberculosis ................................................................................................ 129 Table 78 Knowledge and attitudes toward tuberculosis ............................................................. 130 Table 79 Health insurance coverage among women and men ................................................... 131 Table 80 Source of health care and health insurance coverage among households ................ 132 Table 81 Health problems ................................................................................................................. 133 Table 82 Health examinations .......................................................................................................... 135 Table 83.1 Blood pressure status: Women ........................................................................................ 136 Table 83.2 Blood pressure status: Men .............................................................................................. 137 Table 84.1 Random blood glucose levels: Women ........................................................................... 138 Table 84.2 Random blood glucose levels: Men................................................................................. 139 Table 85 Tobacco and alcohol use by women and men ............................................................... 140 Table 86 Methods of menstrual protection .................................................................................... 141 Table 87 Employment and cash earnings of women and men ................................................... 142 Table 88 Control over and magnitude of women's cash earnings ............................................. 143 Table 89 Decision making ................................................................................................................. 144 Table 90 Decision making by background characteristics ........................................................... 145 Table 91 Women's access to money and credit ............................................................................. 147 Table 92 Ownership of assets ........................................................................................................... 149 Table 93 Gender role attitudes ......................................................................................................... 150 Table 94 Gender role attitudes by background characteristics ................................................... 151 Table 95 Experience of physical and sexual violence ................................................................... 153 Table 96 Experience of violence during pregnancy ...................................................................... 154 Table 97 Forms of spousal violence ................................................................................................ 155 Table 98 Spousal violence by background characteristics ........................................................... 156 Table 99 Spousal violence by husband's characteristics and empowerment indicators ......... 158 Table 100 Injuries to women due to spousal violence .................................................................... 160 Table 101 Help seeking.......................................................................................................................161
APPENDIX Estimates of sampling errors ............................................................................................................... 163

1
INTRODUCTION The 2015-16 National Family Health Survey (NFHS-4), the fourth in the NFHS series, provides information on population, health, and nutrition for India and each state and union territory. For the first time, NFHS-4 provides district-level estimates for many important indicators. All four NFHS surveys have been conducted under the stewardship of the Ministry of Health and Family Welfare (MoHFW), Government of India. MoHFW designated the International Institute for Population Sciences (IIPS), Mumbai, as the nodal agency for the surveys. Funding for NFHS-4 was provided by the United States Agency for International Development (USAID), the United Kingdom Department for International Development (DFID), the Bill and Melinda Gates Foundation (BMGF), UNICEF, UNFPA, the MacArthur Foundation, and the Government of India. Technical assistance for NFHS-4 was provided by ICF, Maryland, USA. Assistance for the HIV component of the survey was provided by the National AIDS Control Organization (NACO) and the National AIDS Research Institute (NARI), Pune. Four survey questionnaires—household, woman’s, man’s, and biomarker—were used to collect information in 19 languages using Computer Assisted Personal Interviewing (CAPI). All women age 15-49 and men age 15-54 in the selected sample households were eligible for interviewing. In the household questionnaire, basic information was collected on all usual members of the household and visitors who stayed in the household the previous night, as well as socioeconomic characteristics of the household, water and sanitation, health insurance, and number of deaths in the household in the three years preceding the survey. Two versions of the woman’s questionnaire were used in NFHS-4. The first version (district module), which collected information on woman’s characteristics, marriage, fertility, contraception, reproductive health, children’s immunizations, and treatment of childhood illnesses, was fielded in the entire sample of NFHS-4 households. Information on these topics is available at the district, state, and national levels. In the second version of the questionnaire (state module), four additional topics, namely, sexual behaviour, HIV/AIDS, husband’s background and women’s work, and domestic violence, were also included. This version was fielded in a subsample of NFHS-4 households designed to provide information only at the state and national levels. The man’s questionnaire covered the man’s characteristics, marriage, number of children, contraception, fertility preferences, nutrition, sexual behaviour, attitudes towards gender roles, HIV/AIDS, and lifestyle. The biomarker questionnaire covered measurements of height, weight, and haemoglobin levels for children; height, weight, haemoglobin, blood pressure, and random blood glucose for women age 15-49 years and men age 15-54 years, and the collection of finger-stick blood for HIV testing in a laboratory. Questionnaire information and biomarkers were collected only with informed consent from the respondents.
The NFHS-4 sample was designed to provide estimates of all key indicators at the national and state levels, as well as estimates for most key indicators at the district level (for all 640 districts in India, as of the 2011 Census). The total sample size of approximately 572,000 households for India was based on the size needed to produce reliable indicator estimates for each district and for urban and rural areas in districts in which the urban population accounted for 30-70 percent of the total district population. The rural sample was selected
1
1
INTRODUCTION The 2015-16 National Family Health Survey (NFHS-4), the fourth in the NFHS series, provides information on population, health, and nutrition for India and each state and union territory. For the first time, NFHS-4 provides district-level estimates for many important indicators. All four NFHS surveys have been conducted under the stewardship of the Ministry of Health and Family Welfare (MoHFW), Government of India. MoHFW designated the International Institute for Population Sciences (IIPS), Mumbai, as the nodal agency for the surveys. Funding for NFHS-4 was provided by the United States Agency for International Development (USAID), the United Kingdom Department for International Development (DFID), the Bill and Melinda Gates Foundation (BMGF), UNICEF, UNFPA, the MacArthur Foundation, and the Government of India. Technical assistance for NFHS-4 was provided by ICF, Maryland, USA. Assistance for the HIV component of the survey was provided by the National AIDS Control Organization (NACO) and the National AIDS Research Institute (NARI), Pune. Four survey questionnaires—household, woman’s, man’s, and biomarker—were used to collect information in 19 languages using Computer Assisted Personal Interviewing (CAPI). All women age 15-49 and men age 15-54 in the selected sample households were eligible for interviewing. In the household questionnaire, basic information was collected on all usual members of the household and visitors who stayed in the household the previous night, as well as socioeconomic characteristics of the household, water and sanitation, health insurance, and number of deaths in the household in the three years preceding the survey. Two versions of the woman’s questionnaire were used in NFHS-4. The first version (district module), which collected information on woman’s characteristics, marriage, fertility, contraception, reproductive health, children’s immunizations, and treatment of childhood illnesses, was fielded in the entire sample of NFHS-4 households. Information on these topics is available at the district, state, and national levels. In the second version of the questionnaire (state module), four additional topics, namely, sexual behaviour, HIV/AIDS, husband’s background and women’s work, and domestic violence, were also included. This version was fielded in a subsample of NFHS-4 households designed to provide information only at the state and national levels. The man’s questionnaire covered the man’s characteristics, marriage, number of children, contraception, fertility preferences, nutrition, sexual behaviour, attitudes towards gender roles, HIV/AIDS, and lifestyle. The biomarker questionnaire covered measurements of height, weight, and haemoglobin levels for children; height, weight, haemoglobin, blood pressure, and random blood glucose for women age 15-49 years and men age 15-54 years, and the collection of finger-stick blood for HIV testing in a laboratory. Questionnaire information and biomarkers were collected only with informed consent from the respondents.
The NFHS-4 sample was designed to provide estimates of all key indicators at the national and state levels, as well as estimates for most key indicators at the district level (for all 640 districts in India, as of the 2011 Census). The total sample size of approximately 572,000 households for India was based on the size needed to produce reliable indicator estimates for each district and for urban and rural areas in districts in which the urban population accounted for 30-70 percent of the total district population. The rural sample was selected
22
through a two-stage sample design with villages as the Primary Sampling Units (PSUs) at the first stage (selected with probability proportional to size), followed by a random selection of 22 households in each PSU at the second stage. In urban areas, there was also a two-stage sample design with Census Enumeration Blocks (CEB) selected at the first stage and a random selection of 22 households in each CEB at the second stage. At the second stage in both urban and rural areas, households were selected after conducting a complete mapping and household listing operation in the selected first-stage units. The figures of NFHS-4 and earlier rounds may not be strictly comparable due to differences in sample size, and NFHS-4 will be a benchmark for future surveys. NFHS-4 fieldwork for Assam was conducted in all 27 districts of the state from 6 November 2015 to 31 March 2016 by Nielsen (India) Private Limited, and collected information from 24,542 households, 28,447 women age 15-49 (including 4,590 women interviewed in PSUs in the state module), and 4,191 men age 15-54. Survey response rates were 98 percent for households, 96 percent for women, and 90 percent for men. This report presents the key findings of the NFHS-4 survey in Assam, followed by detailed tables and an appendix on sampling errors. At the time of finalization of this report, wealth quintile for the country as a whole was not ready. Therefore, on finalization of the national report breakup of key indicators by wealth quintile for all states will be provided as an additional document and uploaded on the official website of MoHFW and IIPS.
3
HOUSEHOLD CHARACTERISTICS
Household compositionOne-sixth (16%) of Assam's households are in urban areas. On average, households in Assam are comprised of 5 members. Fourteen percent of households are headed by women, with 11 percent of the population living in female-headed households. More than three-fifths (64%) of households in Assam have household heads who are Hindu. One-third of households have household heads who are Muslim and 3 percent of households have Christian household heads. Eleven percent of households in Assam have household heads who belong to a scheduled caste, 13 percent belong to a scheduled tribe, and 27 percent belong to an other backward class. About half (48%) of household heads in Assam do not belong to scheduled castes, scheduled tribes, or other backward classes. Thirty percent of Assam’s population is under age 15; only 5 percent is age 65 and over. The overall sex ratio of the population is 993 females per 1,000 males, and the sex ratio of the population under seven years of age is 923 females per 1,000 males. Among children below 18 years of age, 6 percent have experienced the death of one or both parents. In all, 88 percent of children below 18 years of age live with both parents, 9 percent live with one parent (mostly with their mother), and the remaining 3 percent live with neither parent. Births of almost all (94%) children under five years of age were registered with the civil authorities, and 86 percent of children have a birth certificate. Housing characteristicsOne-fourth of households in Assam live in a pucca house and more than three-fourths (78%) of households have electricity. Only 11 percent of households do not use a sanitation facility, which means that household members practice open defecation, an improvement from 24 percent at the time of NFHS-3. Open defecation is more common among rural households (13%) than urban households (1%).
Only 9 percent of households in Assam have water piped into their dwelling, yard, or plot.
Eighty-four percent of households use an improved source of drinking water, but only 9 percent have water piped into their dwelling, yard, or plot. Urban households (31%) are more likely than rural households (4%) to have water piped into their dwelling, yard, or plot. Forty-eight percent of households treat their drinking water to make it potable (mostly using ceramic, sand, or other water filters). One-fourth of households use a clean fuel for cooking.

32
through a two-stage sample design with villages as the Primary Sampling Units (PSUs) at the first stage (selected with probability proportional to size), followed by a random selection of 22 households in each PSU at the second stage. In urban areas, there was also a two-stage sample design with Census Enumeration Blocks (CEB) selected at the first stage and a random selection of 22 households in each CEB at the second stage. At the second stage in both urban and rural areas, households were selected after conducting a complete mapping and household listing operation in the selected first-stage units. The figures of NFHS-4 and earlier rounds may not be strictly comparable due to differences in sample size, and NFHS-4 will be a benchmark for future surveys. NFHS-4 fieldwork for Assam was conducted in all 27 districts of the state from 6 November 2015 to 31 March 2016 by Nielsen (India) Private Limited, and collected information from 24,542 households, 28,447 women age 15-49 (including 4,590 women interviewed in PSUs in the state module), and 4,191 men age 15-54. Survey response rates were 98 percent for households, 96 percent for women, and 90 percent for men. This report presents the key findings of the NFHS-4 survey in Assam, followed by detailed tables and an appendix on sampling errors. At the time of finalization of this report, wealth quintile for the country as a whole was not ready. Therefore, on finalization of the national report breakup of key indicators by wealth quintile for all states will be provided as an additional document and uploaded on the official website of MoHFW and IIPS.
3
HOUSEHOLD CHARACTERISTICS
Household compositionOne-sixth (16%) of Assam's households are in urban areas. On average, households in Assam are comprised of 5 members. Fourteen percent of households are headed by women, with 11 percent of the population living in female-headed households. More than three-fifths (64%) of households in Assam have household heads who are Hindu. One-third of households have household heads who are Muslim and 3 percent of households have Christian household heads. Eleven percent of households in Assam have household heads who belong to a scheduled caste, 13 percent belong to a scheduled tribe, and 27 percent belong to an other backward class. About half (48%) of household heads in Assam do not belong to scheduled castes, scheduled tribes, or other backward classes. Thirty percent of Assam’s population is under age 15; only 5 percent is age 65 and over. The overall sex ratio of the population is 993 females per 1,000 males, and the sex ratio of the population under seven years of age is 923 females per 1,000 males. Among children below 18 years of age, 6 percent have experienced the death of one or both parents. In all, 88 percent of children below 18 years of age live with both parents, 9 percent live with one parent (mostly with their mother), and the remaining 3 percent live with neither parent. Births of almost all (94%) children under five years of age were registered with the civil authorities, and 86 percent of children have a birth certificate. Housing characteristicsOne-fourth of households in Assam live in a pucca house and more than three-fourths (78%) of households have electricity. Only 11 percent of households do not use a sanitation facility, which means that household members practice open defecation, an improvement from 24 percent at the time of NFHS-3. Open defecation is more common among rural households (13%) than urban households (1%).
Only 9 percent of households in Assam have water piped into their dwelling, yard, or plot.
Eighty-four percent of households use an improved source of drinking water, but only 9 percent have water piped into their dwelling, yard, or plot. Urban households (31%) are more likely than rural households (4%) to have water piped into their dwelling, yard, or plot. Forty-eight percent of households treat their drinking water to make it potable (mostly using ceramic, sand, or other water filters). One-fourth of households use a clean fuel for cooking.
44
Selected household possessionsAlmost all (96%) urban households and 86 percent of rural households in Assam have a mobile phone. Eighty-four percent of households have a bank or post office account. BPL cards are held by 42 percent of households, up from 19 percent in NFHS-3. Agricultural land is owned by 48 percent of rural households and 16 percent of urban households. Overall, less than half (43%) of all households in Assam own agricultural land. EDUCATION
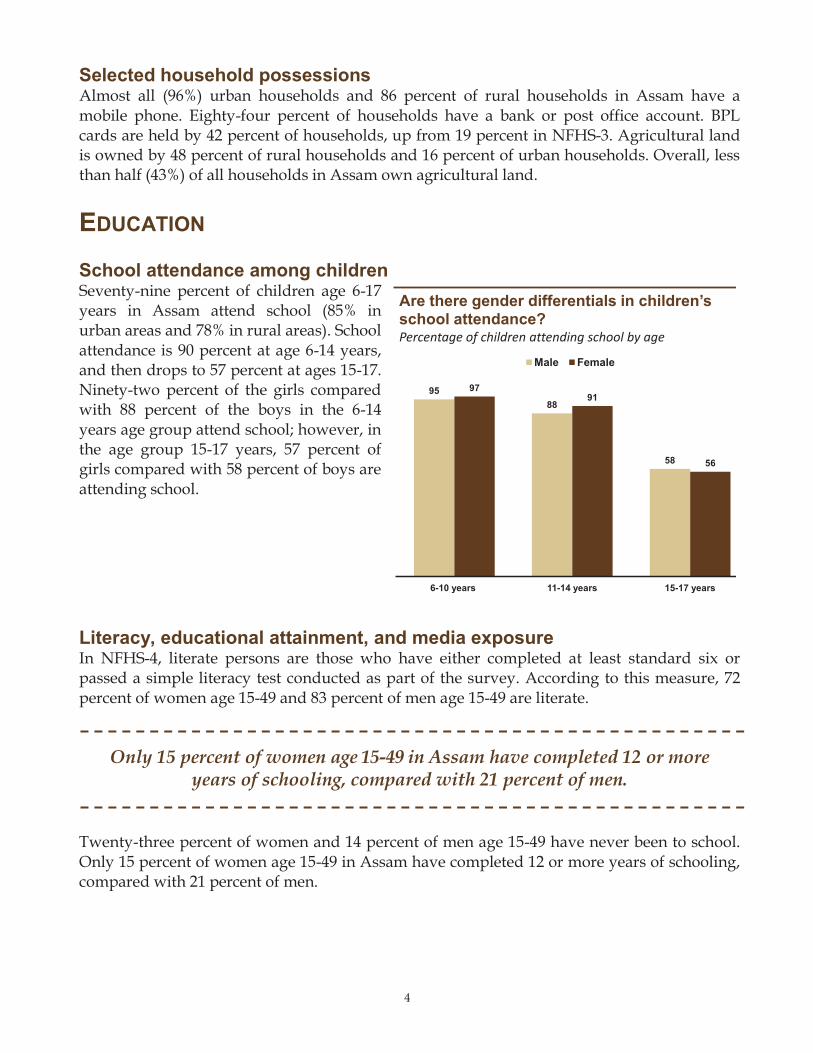
School attendance among childrenSeventy-nine percent of children age 6-17 years in Assam attend school (85% in urban areas and 78% in rural areas). School attendance is 90 percent at age 6-14 years, and then drops to 57 percent at ages 15-17. Ninety-two percent of the girls compared with 88 percent of the boys in the 6-14 years age group attend school; however, in the age group 15-17 years, 57 percent of girls compared with 58 percent of boys are attending school.
Literacy, educational attainment, and media exposureIn NFHS-4, literate persons are those who have either completed at least standard six or passed a simple literacy test conducted as part of the survey. According to this measure, 72 percent of women age 15-49 and 83 percent of men age 15-49 are literate.
Only 15 percent of women age 15-49 in Assam have completed 12 or more years of schooling, compared with 21 percent of men.
Twenty-three percent of women and 14 percent of men age 15-49 have never been to school. Only 15 percent of women age 15-49 in Assam have completed 12 or more years of schooling, compared with 21 percent of men.
5
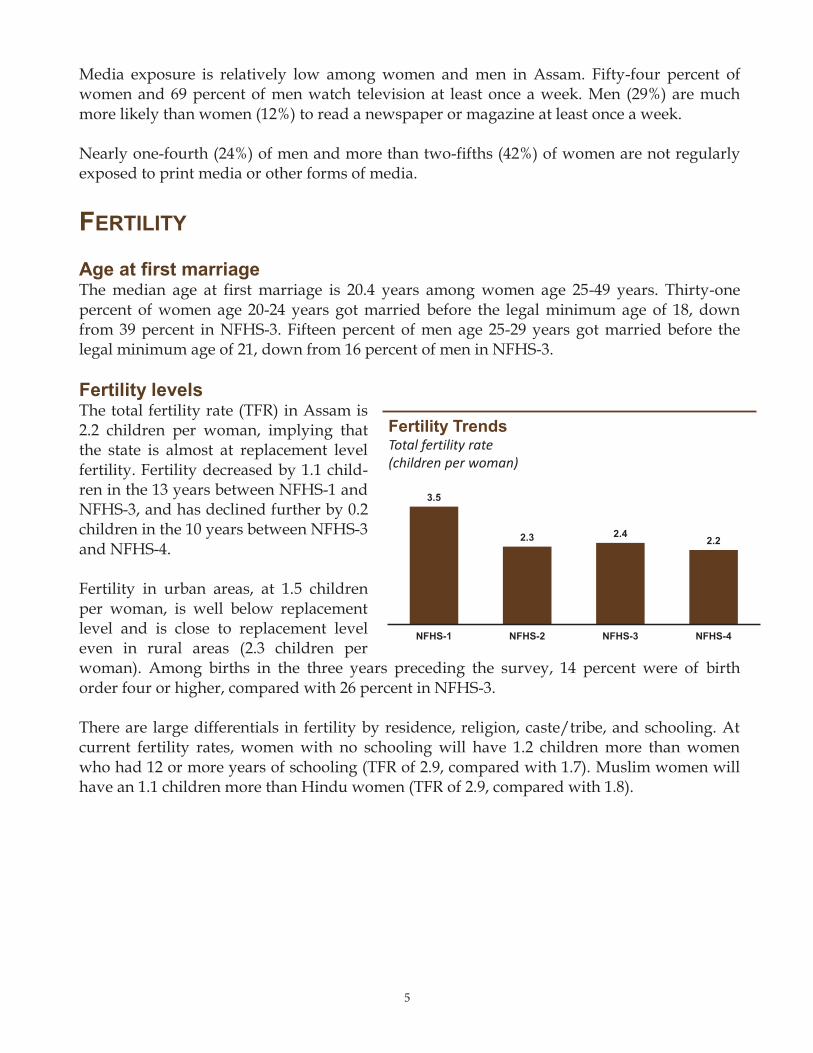
Media exposure is relatively low among women and men in Assam. Fifty-four percent of women and 69 percent of men watch television at least once a week. Men (29%) are much more likely than women (12%) to read a newspaper or magazine at least once a week. Nearly one-fourth (24%) of men and more than two-fifths (42%) of women are not regularly exposed to print media or other forms of media. FERTILITY Age at first marriageThe median age at first marriage is 20.4 years among women age 25-49 years. Thirty-one percent of women age 20-24 years got married before the legal minimum age of 18, down from 39 percent in NFHS-3. Fifteen percent of men age 25-29 years got married before the legal minimum age of 21, down from 16 percent of men in NFHS-3. Fertility levelsThe total fertility rate (TFR) in Assam is 2.2 children per woman, implying that the state is almost at replacement level fertility. Fertility decreased by 1.1 child-ren in the 13 years between NFHS-1 and NFHS-3, and has declined further by 0.2 children in the 10 years between NFHS-3 and NFHS-4.
Fertility in urban areas, at 1.5 children per woman, is well below replacement level and is close to replacement level even in rural areas (2.3 children per woman). Among births in the three years preceding the survey, 14 percent were of birth order four or higher, compared with 26 percent in NFHS-3.
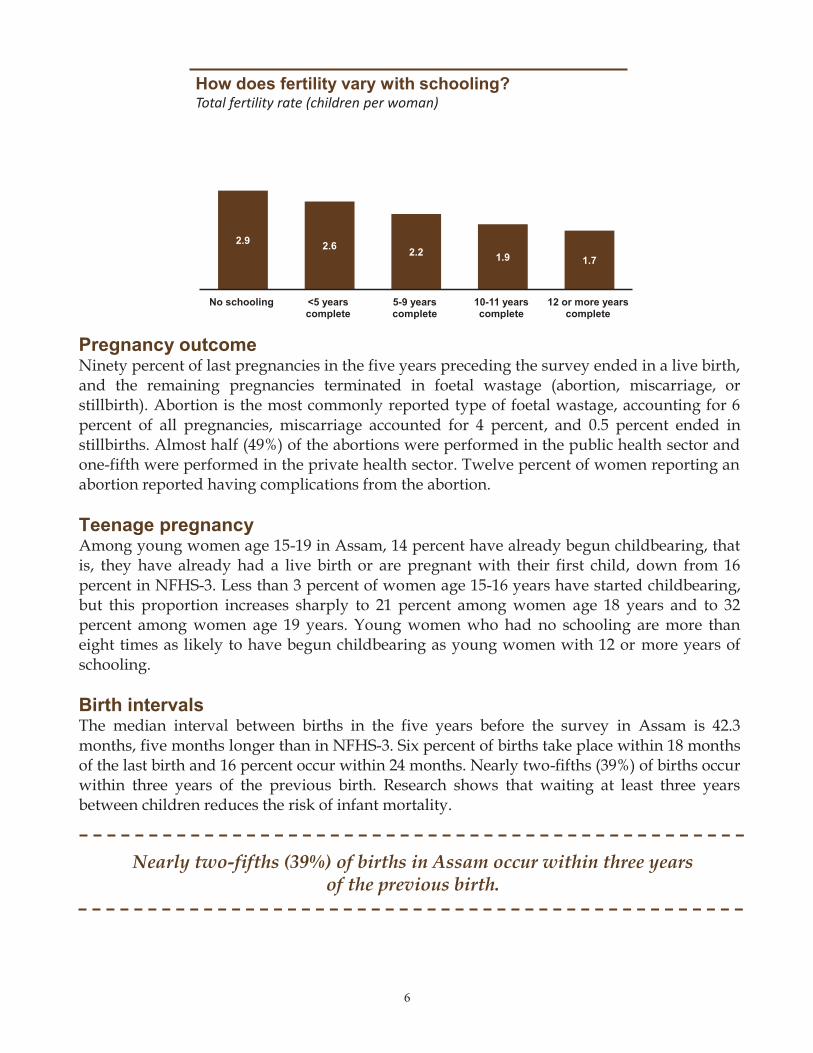
There are large differentials in fertility by residence, religion, caste/tribe, and schooling. At current fertility rates, women with no schooling will have 1.2 children more than women who had 12 or more years of schooling (TFR of 2.9, compared with 1.7). Muslim women will have an 1.1 children more than Hindu women (TFR of 2.9, compared with 1.8).
9588
58
9791
56
6-10 years 11-14 years 15-17 years
Male Female
Are there gender differentials in children’s school attendance? Percentage of children attending school by age
54
Selected household possessionsAlmost all (96%) urban households and 86 percent of rural households in Assam have a mobile phone. Eighty-four percent of households have a bank or post office account. BPL cards are held by 42 percent of households, up from 19 percent in NFHS-3. Agricultural land is owned by 48 percent of rural households and 16 percent of urban households. Overall, less than half (43%) of all households in Assam own agricultural land. EDUCATION
School attendance among childrenSeventy-nine percent of children age 6-17 years in Assam attend school (85% in urban areas and 78% in rural areas). School attendance is 90 percent at age 6-14 years, and then drops to 57 percent at ages 15-17. Ninety-two percent of the girls compared with 88 percent of the boys in the 6-14 years age group attend school; however, in the age group 15-17 years, 57 percent of girls compared with 58 percent of boys are attending school.
Literacy, educational attainment, and media exposureIn NFHS-4, literate persons are those who have either completed at least standard six or passed a simple literacy test conducted as part of the survey. According to this measure, 72 percent of women age 15-49 and 83 percent of men age 15-49 are literate.
Only 15 percent of women age 15-49 in Assam have completed 12 or more years of schooling, compared with 21 percent of men.
Twenty-three percent of women and 14 percent of men age 15-49 have never been to school. Only 15 percent of women age 15-49 in Assam have completed 12 or more years of schooling, compared with 21 percent of men.
5
Media exposure is relatively low among women and men in Assam. Fifty-four percent of women and 69 percent of men watch television at least once a week. Men (29%) are much more likely than women (12%) to read a newspaper or magazine at least once a week. Nearly one-fourth (24%) of men and more than two-fifths (42%) of women are not regularly exposed to print media or other forms of media. FERTILITY Age at first marriageThe median age at first marriage is 20.4 years among women age 25-49 years. Thirty-one percent of women age 20-24 years got married before the legal minimum age of 18, down from 39 percent in NFHS-3. Fifteen percent of men age 25-29 years got married before the legal minimum age of 21, down from 16 percent of men in NFHS-3. Fertility levelsThe total fertility rate (TFR) in Assam is 2.2 children per woman, implying that the state is almost at replacement level fertility. Fertility decreased by 1.1 child-ren in the 13 years between NFHS-1 and NFHS-3, and has declined further by 0.2 children in the 10 years between NFHS-3 and NFHS-4.
Fertility in urban areas, at 1.5 children per woman, is well below replacement level and is close to replacement level even in rural areas (2.3 children per woman). Among births in the three years preceding the survey, 14 percent were of birth order four or higher, compared with 26 percent in NFHS-3.
There are large differentials in fertility by residence, religion, caste/tribe, and schooling. At current fertility rates, women with no schooling will have 1.2 children more than women who had 12 or more years of schooling (TFR of 2.9, compared with 1.7). Muslim women will have an 1.1 children more than Hindu women (TFR of 2.9, compared with 1.8).
3.5
2.3 2.42.2
NFHS-1 NFHS-2 NFHS-3 NFHS-4
Fertility TrendsT otal fertility rate ( children p er w om an)
6 7
Fertility preferencesSixty-one percent of currently married women and 59 percent of currently married men want no more children, are already sterilized, or have a spouse who is sterilized. Among those who want another child, almost half (47%) of women and half of men would like to wait at least two years before the next birth. Seventy-six percent of women and 72 percent of men consider the ideal family size to be two or fewer children. In Assam there is a strong preference for sons. Eighteen percent each of women and men want more sons than daughters, but only 3-4 percent of women and men want more daughters than sons. However, most men and women would like to have at least one son and at least one daughter. Women’s desire for more children is strongly affected by their current number of sons. For example, among women with two children, 83 percent with either two sons or one son want no more children, compared with only 62 percent with two daughters who want no more children. The proportion of currently married women with two children who want no more children irrespective of their number of sons has decreased by 4 percentage points in the 10 years since NFHS-3.
In Assam, unplanned pregnancies are relatively common. If all women were to have only the number of children they wanted, the total fertility rate would have been considerably below replacement level, at 1.8 children per woman, instead of the current level of 2.2 children per woman.
6
Pregnancy outcome Ninety percent of last pregnancies in the five years preceding the survey ended in a live birth, and the remaining pregnancies terminated in foetal wastage (abortion, miscarriage, or stillbirth). Abortion is the most commonly reported type of foetal wastage, accounting for 6 percent of all pregnancies, miscarriage accounted for 4 percent, and 0.5 percent ended in stillbirths. Almost half (49%) of the abortions were performed in the public health sector and one-fifth were performed in the private health sector. Twelve percent of women reporting an abortion reported having complications from the abortion. Teenage pregnancyAmong young women age 15-19 in Assam, 14 percent have already begun childbearing, that is, they have already had a live birth or are pregnant with their first child, down from 16 percent in NFHS-3. Less than 3 percent of women age 15-16 years have started childbearing, but this proportion increases sharply to 21 percent among women age 18 years and to 32 percent among women age 19 years. Young women who had no schooling are more than eight times as likely to have begun childbearing as young women with 12 or more years of schooling. Birth intervalsThe median interval between births in the five years before the survey in Assam is 42.3 months, five months longer than in NFHS-3. Six percent of births take place within 18 months of the last birth and 16 percent occur within 24 months. Nearly two-fifths (39%) of births occur within three years of the previous birth. Research shows that waiting at least three years between children reduces the risk of infant mortality.
Nearly two-fifths (39%) of births in Assam occur within three years of the previous birth.
How does fertility vary with schooling?T otal fertility rate ( children p er w om an)
2.9 2.6 2.2 1.9 1.7
No schooling <5 years complete
5-9 years complete
10-11 years complete
12 or more years complete
How does fertility vary with schooling?T otal fertility rate ( children p er w om an)
2.9 2.6 2.2 1.9 1.7
No schooling <5 years complete
5-9 years complete
10-11 years complete
12 or more years complete
7
Fertility preferencesSixty-one percent of currently married women and 59 percent of currently married men want no more children, are already sterilized, or have a spouse who is sterilized. Among those who want another child, almost half (47%) of women and half of men would like to wait at least two years before the next birth. Seventy-six percent of women and 72 percent of men consider the ideal family size to be two or fewer children. In Assam there is a strong preference for sons. Eighteen percent each of women and men want more sons than daughters, but only 3-4 percent of women and men want more daughters than sons. However, most men and women would like to have at least one son and at least one daughter. Women’s desire for more children is strongly affected by their current number of sons. For example, among women with two children, 83 percent with either two sons or one son want no more children, compared with only 62 percent with two daughters who want no more children. The proportion of currently married women with two children who want no more children irrespective of their number of sons has decreased by 4 percentage points in the 10 years since NFHS-3.
In Assam, unplanned pregnancies are relatively common. If all women were to have only the number of children they wanted, the total fertility rate would have been considerably below replacement level, at 1.8 children per woman, instead of the current level of 2.2 children per woman.

77
Fertility preferencesSixty-one percent of currently married women and 59 percent of currently married men want no more children, are already sterilized, or have a spouse who is sterilized. Among those who want another child, almost half (47%) of women and half of men would like to wait at least two years before the next birth. Seventy-six percent of women and 72 percent of men consider the ideal family size to be two or fewer children. In Assam there is a strong preference for sons. Eighteen percent each of women and men want more sons than daughters, but only 3-4 percent of women and men want more daughters than sons. However, most men and women would like to have at least one son and at least one daughter. Women’s desire for more children is strongly affected by their current number of sons. For example, among women with two children, 83 percent with either two sons or one son want no more children, compared with only 62 percent with two daughters who want no more children. The proportion of currently married women with two children who want no more children irrespective of their number of sons has decreased by 4 percentage points in the 10 years since NFHS-3.
In Assam, unplanned pregnancies are relatively common. If all women were to have only the number of children they wanted, the total fertility rate would have been considerably below replacement level, at 1.8 children per woman, instead of the current level of 2.2 children per woman.
6
Pregnancy outcome Ninety percent of last pregnancies in the five years preceding the survey ended in a live birth, and the remaining pregnancies terminated in foetal wastage (abortion, miscarriage, or stillbirth). Abortion is the most commonly reported type of foetal wastage, accounting for 6 percent of all pregnancies, miscarriage accounted for 4 percent, and 0.5 percent ended in stillbirths. Almost half (49%) of the abortions were performed in the public health sector and one-fifth were performed in the private health sector. Twelve percent of women reporting an abortion reported having complications from the abortion. Teenage pregnancyAmong young women age 15-19 in Assam, 14 percent have already begun childbearing, that is, they have already had a live birth or are pregnant with their first child, down from 16 percent in NFHS-3. Less than 3 percent of women age 15-16 years have started childbearing, but this proportion increases sharply to 21 percent among women age 18 years and to 32 percent among women age 19 years. Young women who had no schooling are more than eight times as likely to have begun childbearing as young women with 12 or more years of schooling. Birth intervalsThe median interval between births in the five years before the survey in Assam is 42.3 months, five months longer than in NFHS-3. Six percent of births take place within 18 months of the last birth and 16 percent occur within 24 months. Nearly two-fifths (39%) of births occur within three years of the previous birth. Research shows that waiting at least three years between children reduces the risk of infant mortality.
Nearly two-fifths (39%) of births in Assam occur within three years of the previous birth.
63 66
23
6673
44
8590
67
83 83
62
2 boys and no girls 1 boy and 1 girl 2 girls and no boys
Current family size
NFHS-1 NFHS-2 NFHS-3 NFHS-4
How does son preference affect women’s desire for children? Percentage of currently married women with two children who want no more children
7
Fertility preferencesSixty-one percent of currently married women and 59 percent of currently married men want no more children, are already sterilized, or have a spouse who is sterilized. Among those who want another child, almost half (47%) of women and half of men would like to wait at least two years before the next birth. Seventy-six percent of women and 72 percent of men consider the ideal family size to be two or fewer children. In Assam there is a strong preference for sons. Eighteen percent each of women and men want more sons than daughters, but only 3-4 percent of women and men want more daughters than sons. However, most men and women would like to have at least one son and at least one daughter. Women’s desire for more children is strongly affected by their current number of sons. For example, among women with two children, 83 percent with either two sons or one son want no more children, compared with only 62 percent with two daughters who want no more children. The proportion of currently married women with two children who want no more children irrespective of their number of sons has decreased by 4 percentage points in the 10 years since NFHS-3.
In Assam, unplanned pregnancies are relatively common. If all women were to have only the number of children they wanted, the total fertility rate would have been considerably below replacement level, at 1.8 children per woman, instead of the current level of 2.2 children per woman.
8 9
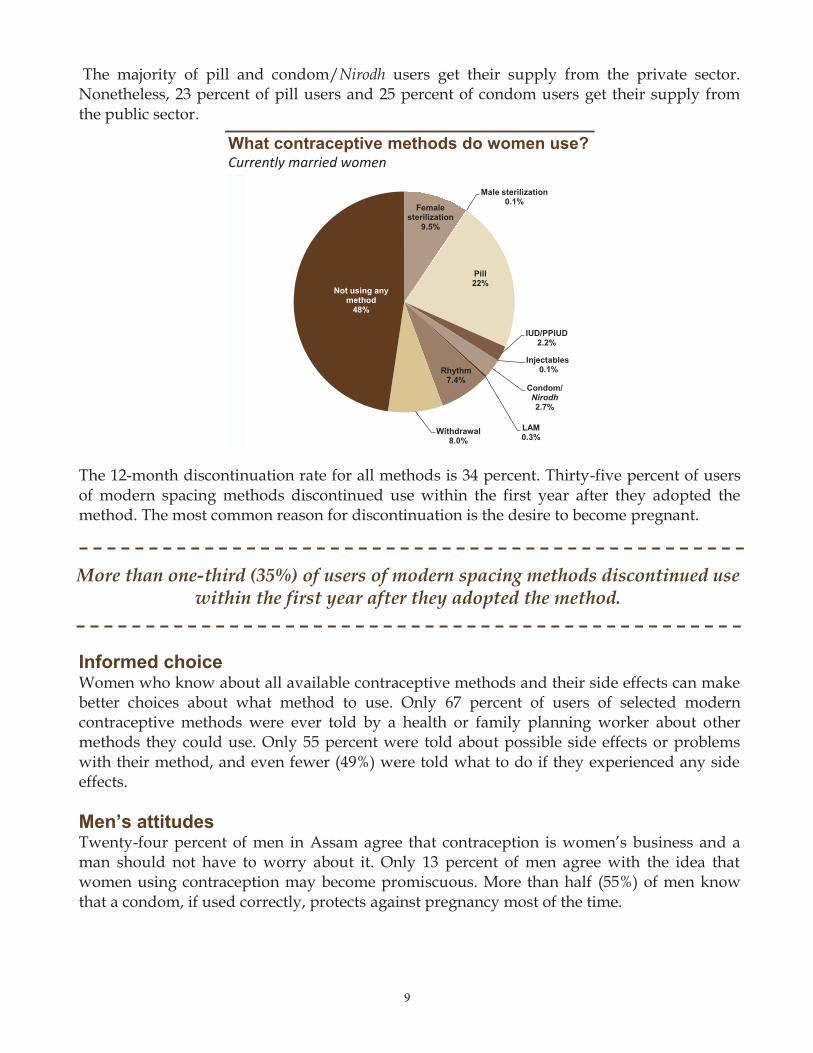
The majority of pill and condom/ users get their supply from the private sector. Nonetheless, 23 percent of pill users and 25 percent of condom users get their supply from the public sector.
The 12-month discontinuation rate for all methods is 34 percent. Thirty-five percent of users of modern spacing methods discontinued use within the first year after they adopted the method. The most common reason for discontinuation is the desire to become pregnant.
More than one-third (35%) of users of modern spacing methods discontinued use within the first year after they adopted the method.
Informed choiceWomen who know about all available contraceptive methods and their side effects can make better choices about what method to use. Only 67 percent of users of selected modern contraceptive methods were ever told by a health or family planning worker about other methods they could use. Only 55 percent were told about possible side effects or problems with their method, and even fewer (49%) were told what to do if they experienced any side effects. Men’s attitudesTwenty-four percent of men in Assam agree that contraception is women’s business and a man should not have to worry about it. Only 13 percent of men agree with the idea that women using contraception may become promiscuous. More than half (55%) of men know that a condom, if used correctly, protects against pregnancy most of the time.
8
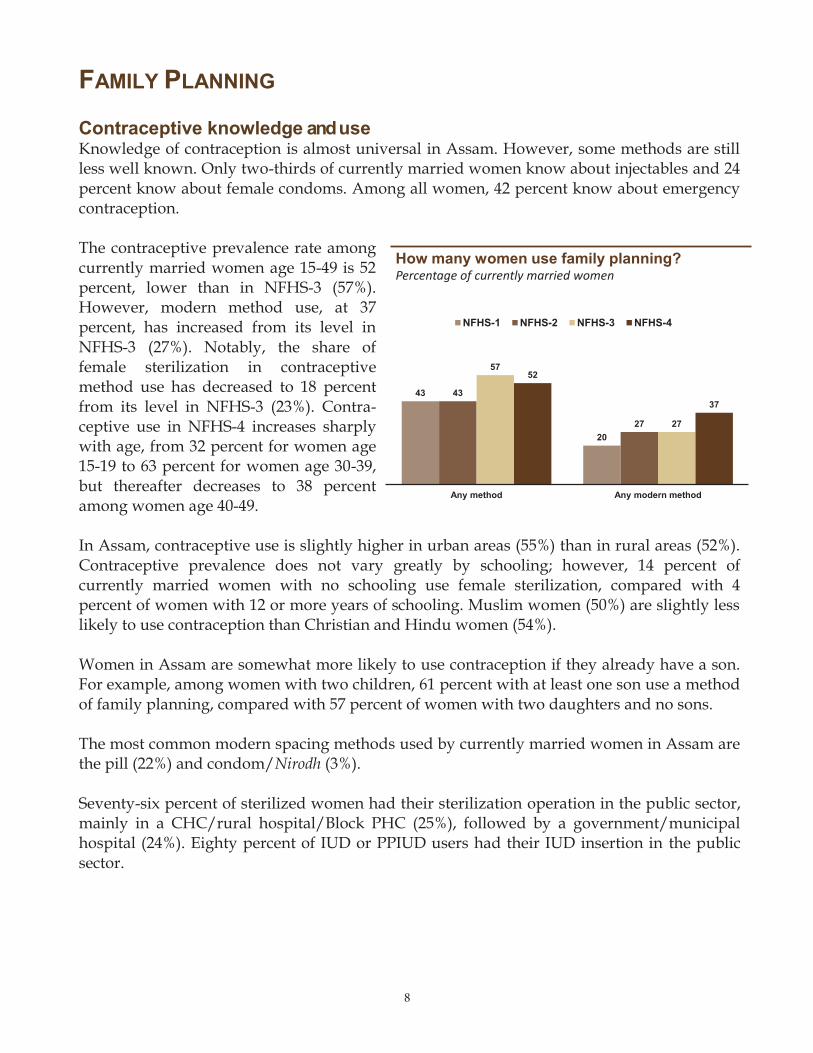
FAMILY PLANNING Contraceptive knowledge and useKnowledge of contraception is almost universal in Assam. However, some methods are still less well known. Only two-thirds of currently married women know about injectables and 24 percent know about female condoms. Among all women, 42 percent know about emergency contraception. The contraceptive prevalence rate among currently married women age 15-49 is 52 percent, lower than in NFHS-3 (57%). However, modern method use, at 37 percent, has increased from its level in NFHS-3 (27%). Notably, the share of female sterilization in contraceptive method use has decreased to 18 percent from its level in NFHS-3 (23%). Contra-ceptive use in NFHS-4 increases sharply with age, from 32 percent for women age 15-19 to 63 percent for women age 30-39, but thereafter decreases to 38 percent among women age 40-49.
In Assam, contraceptive use is slightly higher in urban areas (55%) than in rural areas (52%). Contraceptive prevalence does not vary greatly by schooling; however, 14 percent of currently married women with no schooling use female sterilization, compared with 4 percent of women with 12 or more years of schooling. Muslim women (50%) are slightly less likely to use contraception than Christian and Hindu women (54%). Women in Assam are somewhat more likely to use contraception if they already have a son. For example, among women with two children, 61 percent with at least one son use a method of family planning, compared with 57 percent of women with two daughters and no sons. The most common modern spacing methods used by currently married women in Assam are the pill (22%) and condom/ (3%).
Seventy-six percent of sterilized women had their sterilization operation in the public sector, mainly in a CHC/rural hospital/Block PHC (25%), followed by a government/municipal hospital (24%). Eighty percent of IUD or PPIUD users had their IUD insertion in the public sector.
43
20
43
27
57
27
52
37
Any method Any modern method
NFHS-1 NFHS-2 NFHS-3 NFHS-4
How many women use family planning?Percentage of cu rrently m arried w om en
43
20
43
27
57
27
52
37
Any method Any modern method
NFHS-1 NFHS-2 NFHS-3 NFHS-4
How many women use family planning?Percentage of cu rrently m arried w om en
99
The majority of pill and condom/ users get their supply from the private sector. Nonetheless, 23 percent of pill users and 25 percent of condom users get their supply from the public sector.
The 12-month discontinuation rate for all methods is 34 percent. Thirty-five percent of users of modern spacing methods discontinued use within the first year after they adopted the method. The most common reason for discontinuation is the desire to become pregnant.
More than one-third (35%) of users of modern spacing methods discontinued use within the first year after they adopted the method.
Informed choiceWomen who know about all available contraceptive methods and their side effects can make better choices about what method to use. Only 67 percent of users of selected modern contraceptive methods were ever told by a health or family planning worker about other methods they could use. Only 55 percent were told about possible side effects or problems with their method, and even fewer (49%) were told what to do if they experienced any side effects. Men’s attitudesTwenty-four percent of men in Assam agree that contraception is women’s business and a man should not have to worry about it. Only 13 percent of men agree with the idea that women using contraception may become promiscuous. More than half (55%) of men know that a condom, if used correctly, protects against pregnancy most of the time.
8
FAMILY PLANNING Contraceptive knowledge and useKnowledge of contraception is almost universal in Assam. However, some methods are still less well known. Only two-thirds of currently married women know about injectables and 24 percent know about female condoms. Among all women, 42 percent know about emergency contraception. The contraceptive prevalence rate among currently married women age 15-49 is 52 percent, lower than in NFHS-3 (57%). However, modern method use, at 37 percent, has increased from its level in NFHS-3 (27%). Notably, the share of female sterilization in contraceptive method use has decreased to 18 percent from its level in NFHS-3 (23%). Contra-ceptive use in NFHS-4 increases sharply with age, from 32 percent for women age 15-19 to 63 percent for women age 30-39, but thereafter decreases to 38 percent among women age 40-49.
In Assam, contraceptive use is slightly higher in urban areas (55%) than in rural areas (52%). Contraceptive prevalence does not vary greatly by schooling; however, 14 percent of currently married women with no schooling use female sterilization, compared with 4 percent of women with 12 or more years of schooling. Muslim women (50%) are slightly less likely to use contraception than Christian and Hindu women (54%). Women in Assam are somewhat more likely to use contraception if they already have a son. For example, among women with two children, 61 percent with at least one son use a method of family planning, compared with 57 percent of women with two daughters and no sons. The most common modern spacing methods used by currently married women in Assam are the pill (22%) and condom/ (3%).
Seventy-six percent of sterilized women had their sterilization operation in the public sector, mainly in a CHC/rural hospital/Block PHC (25%), followed by a government/municipal hospital (24%). Eighty percent of IUD or PPIUD users had their IUD insertion in the public sector.
Female sterilization
9.5%
Male sterilization0.1%
Pill 22%
IUD/PPIUD 2.2%
Injectables0.1%
Condom/Nirodh2.7%
LAM 0.3%
Rhythm7.4%
Withdrawal 8.0%
Not using any method
48%
What contraceptive methods do women use?C urrently married women
Female sterilization
9.5%
Male sterilization0.1%
Pill 22%
IUD/PPIUD 2.2%
Injectables0.1%
Condom/Nirodh2.7%
LAM 0.3%
Rhythm7.4%
Withdrawal 8.0%
Not using any method
48%
What contraceptive methods do women use?C urrently married women
1010
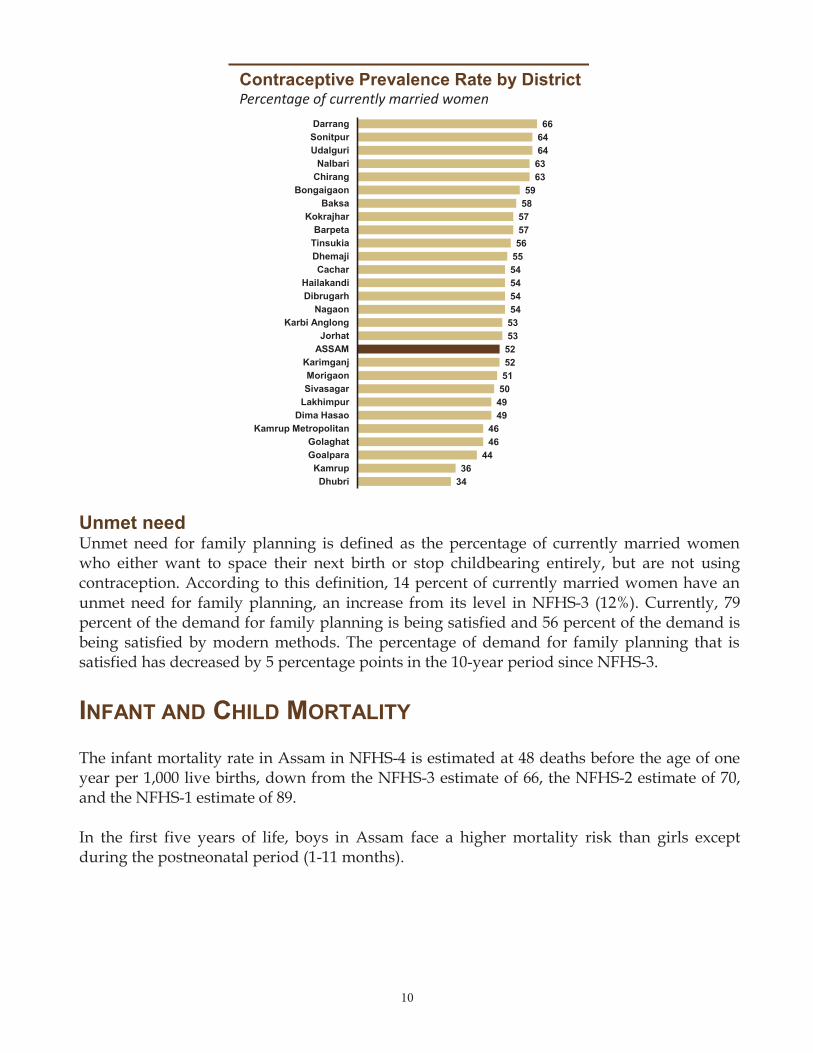
Unmet needUnmet need for family planning is defined as the percentage of currently married women who either want to space their next birth or stop childbearing entirely, but are not using contraception. According to this definition, 14 percent of currently married women have an unmet need for family planning, an increase from its level in NFHS-3 (12%). Currently, 79 percent of the demand for family planning is being satisfied and 56 percent of the demand is being satisfied by modern methods. The percentage of demand for family planning that is satisfied has decreased by 5 percentage points in the 10-year period since NFHS-3. INFANT AND CHILD MORTALITY The infant mortality rate in Assam in NFHS-4 is estimated at 48 deaths before the age of one year per 1,000 live births, down from the NFHS-3 estimate of 66, the NFHS-2 estimate of 70, and the NFHS-1 estimate of 89. In the first five years of life, boys in Assam face a higher mortality risk than girls except during the postneonatal period (1-11 months).
11
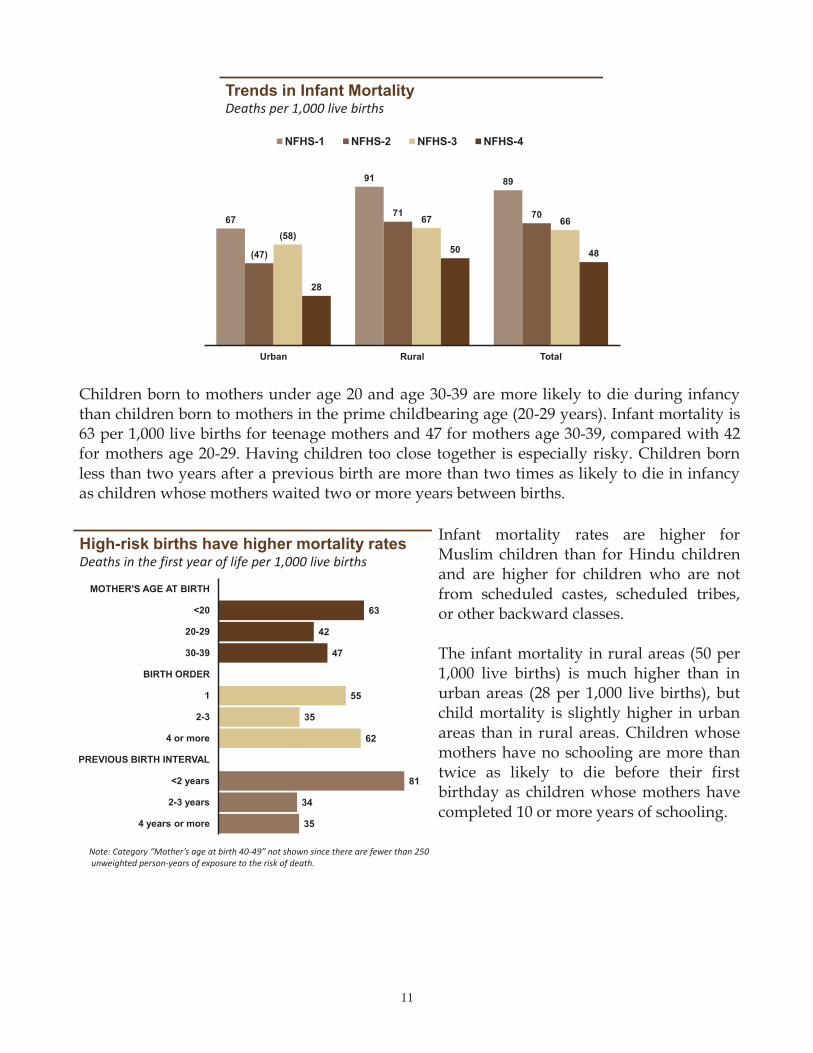
Children born to mothers under age 20 and age 30-39 are more likely to die during infancy than children born to mothers in the prime childbearing age (20-29 years). Infant mortality is 63 per 1,000 live births for teenage mothers and 47 for mothers age 30-39, compared with 42 for mothers age 20-29. Having children too close together is especially risky. Children born less than two years after a previous birth are more than two times as likely to die in infancy as children whose mothers waited two or more years between births.
Infant mortality rates are higher for Muslim children than for Hindu children and are higher for children who are not from scheduled castes, scheduled tribes, or other backward classes. The infant mortality in rural areas (50 per 1,000 live births) is much higher than in urban areas (28 per 1,000 live births), but child mortality is slightly higher in urban areas than in rural areas. Children whose mothers have no schooling are more than twice as likely to die before their first birthday as children whose mothers have completed 10 or more years of schooling.
Contraceptive Prevalence Rate by DistrictPercentage of cu rrently m arried w om en
3436
444646
494950515252535354545454555657575859
6363646466
DhubriKamrup
GoalparaGolaghat
Kamrup MetropolitanDima Hasao
LakhimpurSivasagarMorigaon
KarimganjASSAMJorhat
Karbi AnglongNagaon
DibrugarhHailakandi
CacharDhemajiTinsukiaBarpeta
KokrajharBaksa
BongaigaonChirangNalbari
UdalguriSonitpurDarrang
1110
Unmet needUnmet need for family planning is defined as the percentage of currently married women who either want to space their next birth or stop childbearing entirely, but are not using contraception. According to this definition, 14 percent of currently married women have an unmet need for family planning, an increase from its level in NFHS-3 (12%). Currently, 79 percent of the demand for family planning is being satisfied and 56 percent of the demand is being satisfied by modern methods. The percentage of demand for family planning that is satisfied has decreased by 5 percentage points in the 10-year period since NFHS-3. INFANT AND CHILD MORTALITY The infant mortality rate in Assam in NFHS-4 is estimated at 48 deaths before the age of one year per 1,000 live births, down from the NFHS-3 estimate of 66, the NFHS-2 estimate of 70, and the NFHS-1 estimate of 89. In the first five years of life, boys in Assam face a higher mortality risk than girls except during the postneonatal period (1-11 months).
11
Children born to mothers under age 20 and age 30-39 are more likely to die during infancy than children born to mothers in the prime childbearing age (20-29 years). Infant mortality is 63 per 1,000 live births for teenage mothers and 47 for mothers age 30-39, compared with 42 for mothers age 20-29. Having children too close together is especially risky. Children born less than two years after a previous birth are more than two times as likely to die in infancy as children whose mothers waited two or more years between births.
Infant mortality rates are higher for Muslim children than for Hindu children and are higher for children who are not from scheduled castes, scheduled tribes, or other backward classes. The infant mortality in rural areas (50 per 1,000 live births) is much higher than in urban areas (28 per 1,000 live births), but child mortality is slightly higher in urban areas than in rural areas. Children whose mothers have no schooling are more than twice as likely to die before their first birthday as children whose mothers have completed 10 or more years of schooling.
67
91 89
(47)
71 70
(58)67 66
28
50 48
Urban Rural Total
NFHS-1 NFHS-2 NFHS-3 NFHS-4
Trends in Infant MortalityD eaths p er 1 , 0 0 0 liv e births
67
91 89
(47)
71 70
(58)67 66
28
50 48
Urban Rural Total
NFHS-1 NFHS-2 NFHS-3 NFHS-4
Trends in Infant MortalityD eaths p er 1 , 0 0 0 liv e births
63
42
47
55
35
62
81
34
35
MOTHER'S AGE AT BIRTH
<20
20-29
30-39
BIRTH ORDER
1
2-3
4 or more
PREVIOUS BIRTH INTERVAL
<2 years
2-3 years
4 years or more
High-risk births have higher mortality ratesD eaths in the first year of life p er 1 , 0 0 0 liv e births
N ote: C ategory “ M other’ s age at birth 4 0 - 4 9 ” not show n since there are few er than 2 5 0 u nw eighted p erson- years of ex p osu re to the risk of death.
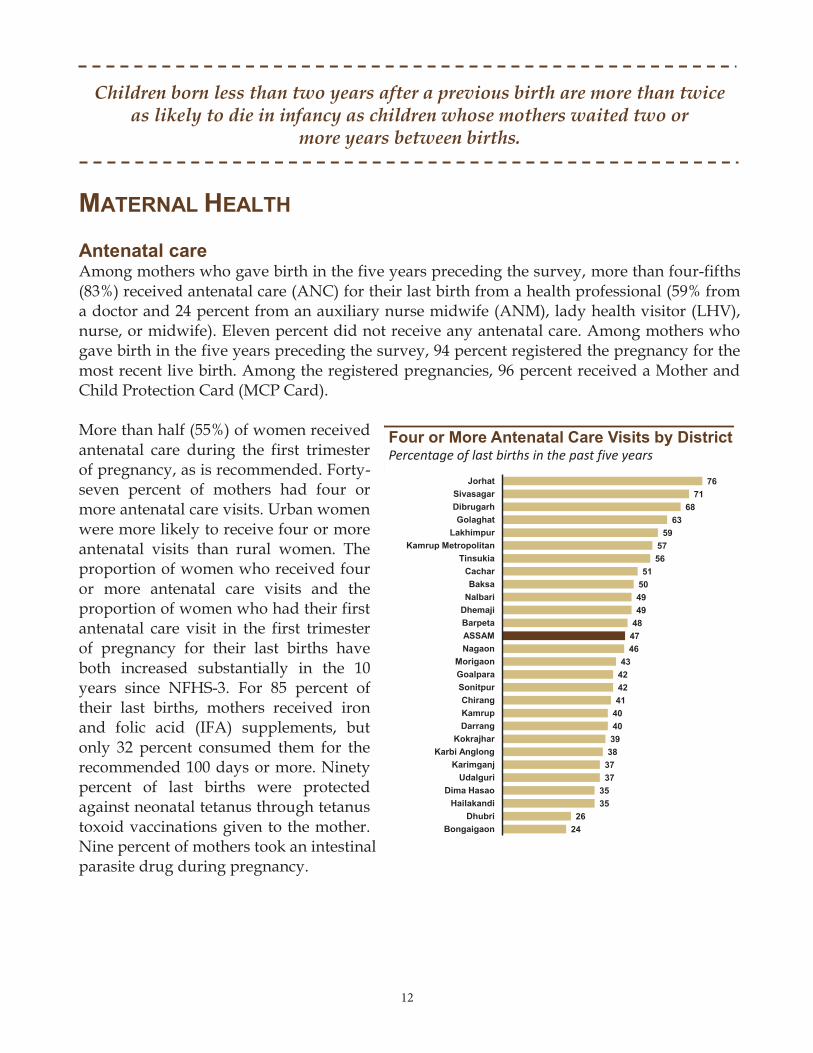
12 13
Only 47 percent of mothers in Assam received at least four antenatal care visits for their last birth.
Among women with a live birth in the five years preceding the survey who met with a community health worker in the last three months of pregnancy for their most recent live birth, at least two-thirds received advice on each of five different areas (76% received advice on keeping the baby warm, 75% on breastfeeding, 67% each on cord care and family planning, and 66% on the importance of institutional delivery).
Even when women receive antenatal care, sometimes they do not receive all the services needed to monitor their pregnancy. In Assam, at least 89 percent of women who received antenatal care for their last birth received each of the services needed to monitor their pregnancy: having their weight taken (98%), having their blood pressure measured (97%), having their abdomen examined (89%), and having urine and blood samples taken (89-90%). An ultrasound test was performed during 47 percent of pregnancies in the five years preceding the survey. Women with at least 12 years of schooling were much more likely to have an ultrasound test than women with no schooling. Seventy-five percent of women with at least 12 years of schooling had an ultrasound test, compared with 30 percent of women with no schooling. Forty-four percent of scheduled tribe women and the same proportion of women who are not from scheduled tribes, scheduled castes, or other backward classes had an ultrasound test, compared with 53 percent of women from other backward classes and 55 percent of scheduled caste women. Pregnant women with no son were more likely to have an ultrasound test than those with at least one son.
12
Children born less than two years after a previous birth are more than twice as likely to die in infancy as children whose mothers waited two or
more years between births.
MATERNAL HEALTH Antenatal careAmong mothers who gave birth in the five years preceding the survey, more than four-fifths (83%) received antenatal care (ANC) for their last birth from a health professional (59% from a doctor and 24 percent from an auxiliary nurse midwife (ANM), lady health visitor (LHV), nurse, or midwife). Eleven percent did not receive any antenatal care. Among mothers who gave birth in the five years preceding the survey, 94 percent registered the pregnancy for the most recent live birth. Among the registered pregnancies, 96 percent received a Mother and Child Protection Card (MCP Card). More than half (55%) of women received antenatal care during the first trimester of pregnancy, as is recommended. Forty-seven percent of mothers had four or more antenatal care visits. Urban women were more likely to receive four or more antenatal visits than rural women. The proportion of women who received four or more antenatal care visits and the proportion of women who had their first antenatal care visit in the first trimester of pregnancy for their last births have both increased substantially in the 10 years since NFHS-3. For 85 percent of their last births, mothers received iron and folic acid (IFA) supplements, but only 32 percent consumed them for the recommended 100 days or more. Ninety percent of last births were protected against neonatal tetanus through tetanus toxoid vaccinations given to the mother. Nine percent of mothers took an intestinal parasite drug during pregnancy.
2426
3535
37373839404041424243
46474849495051
5657
5963
6871
76
BongaigaonDhubri
HailakandiDima Hasao
UdalguriKarimganj
Karbi AnglongKokrajhar
DarrangKamrupChirang
SonitpurGoalparaMorigaon
NagaonASSAMBarpetaDhemajiNalbariBaksa
CacharTinsukia
Kamrup MetropolitanLakhimpur
GolaghatDibrugarhSivasagar
Jorhat
Four or More Antenatal Care Visits by DistrictPercentage of last births in the p ast fiv e years
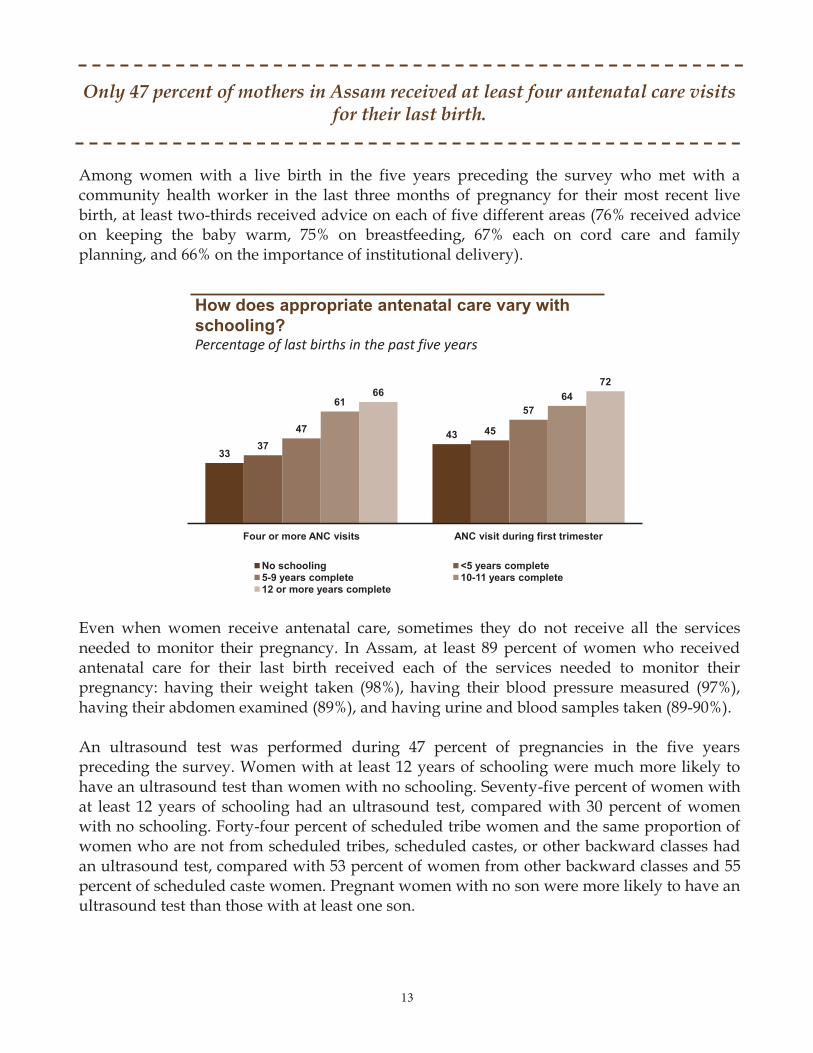
1313
Only 47 percent of mothers in Assam received at least four antenatal care visits for their last birth.
Among women with a live birth in the five years preceding the survey who met with a community health worker in the last three months of pregnancy for their most recent live birth, at least two-thirds received advice on each of five different areas (76% received advice on keeping the baby warm, 75% on breastfeeding, 67% each on cord care and family planning, and 66% on the importance of institutional delivery).
Even when women receive antenatal care, sometimes they do not receive all the services needed to monitor their pregnancy. In Assam, at least 89 percent of women who received antenatal care for their last birth received each of the services needed to monitor their pregnancy: having their weight taken (98%), having their blood pressure measured (97%), having their abdomen examined (89%), and having urine and blood samples taken (89-90%). An ultrasound test was performed during 47 percent of pregnancies in the five years preceding the survey. Women with at least 12 years of schooling were much more likely to have an ultrasound test than women with no schooling. Seventy-five percent of women with at least 12 years of schooling had an ultrasound test, compared with 30 percent of women with no schooling. Forty-four percent of scheduled tribe women and the same proportion of women who are not from scheduled tribes, scheduled castes, or other backward classes had an ultrasound test, compared with 53 percent of women from other backward classes and 55 percent of scheduled caste women. Pregnant women with no son were more likely to have an ultrasound test than those with at least one son.
33
4337
4547
5761 6466
72
Four or more ANC visits ANC visit during first trimester
No schooling <5 years complete 5-9 years complete 10-11 years complete 12 or more years complete
How does appropriate antenatal care vary withschooling?Percentage of last births in the p ast fiv e years
33
4337
4547
5761 6466
72
Four or more ANC visits ANC visit during first trimester
No schooling <5 years complete 5-9 years complete 10-11 years complete 12 or more years complete
How does appropriate antenatal care vary withschooling?Percentage of last births in the p ast fiv e years
12
Children born less than two years after a previous birth are more than twice as likely to die in infancy as children whose mothers waited two or
more years between births.
MATERNAL HEALTH Antenatal careAmong mothers who gave birth in the five years preceding the survey, more than four-fifths (83%) received antenatal care (ANC) for their last birth from a health professional (59% from a doctor and 24 percent from an auxiliary nurse midwife (ANM), lady health visitor (LHV), nurse, or midwife). Eleven percent did not receive any antenatal care. Among mothers who gave birth in the five years preceding the survey, 94 percent registered the pregnancy for the most recent live birth. Among the registered pregnancies, 96 percent received a Mother and Child Protection Card (MCP Card). More than half (55%) of women received antenatal care during the first trimester of pregnancy, as is recommended. Forty-seven percent of mothers had four or more antenatal care visits. Urban women were more likely to receive four or more antenatal visits than rural women. The proportion of women who received four or more antenatal care visits and the proportion of women who had their first antenatal care visit in the first trimester of pregnancy for their last births have both increased substantially in the 10 years since NFHS-3. For 85 percent of their last births, mothers received iron and folic acid (IFA) supplements, but only 32 percent consumed them for the recommended 100 days or more. Ninety percent of last births were protected against neonatal tetanus through tetanus toxoid vaccinations given to the mother. Nine percent of mothers took an intestinal parasite drug during pregnancy.
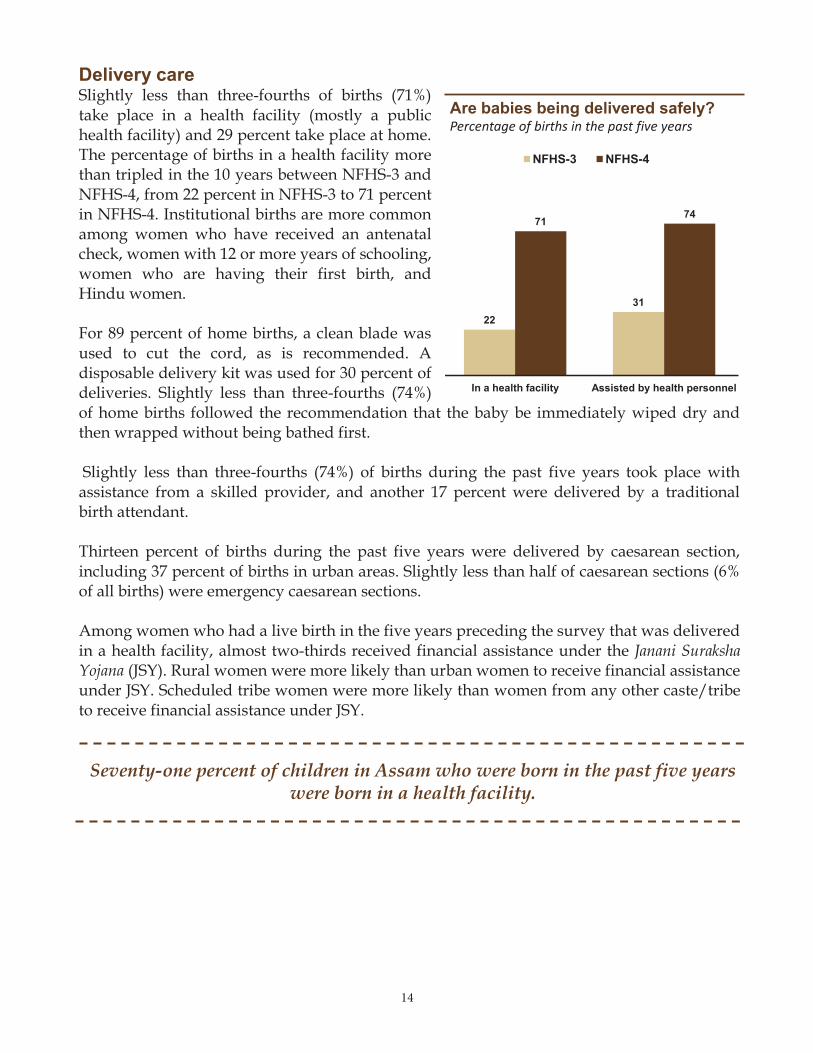
1414
Delivery care Slightly less than three-fourths of births (71%) take place in a health facility (mostly a public health facility) and 29 percent take place at home. The percentage of births in a health facility more than tripled in the 10 years between NFHS-3 and NFHS-4, from 22 percent in NFHS-3 to 71 percent in NFHS-4. Institutional births are more common among women who have received an antenatal check, women with 12 or more years of schooling, women who are having their first birth, and Hindu women. For 89 percent of home births, a clean blade was used to cut the cord, as is recommended. A disposable delivery kit was used for 30 percent of deliveries. Slightly less than three-fourths (74%) of home births followed the recommendation that the baby be immediately wiped dry and then wrapped without being bathed first. Slightly less than three-fourths (74%) of births during the past five years took place with assistance from a skilled provider, and another 17 percent were delivered by a traditional birth attendant. Thirteen percent of births during the past five years were delivered by caesarean section, including 37 percent of births in urban areas. Slightly less than half of caesarean sections (6% of all births) were emergency caesarean sections. Among women who had a live birth in the five years preceding the survey that was delivered in a health facility, almost two-thirds received financial assistance under the
(JSY). Rural women were more likely than urban women to receive financial assistance under JSY. Scheduled tribe women were more likely than women from any other caste/tribe to receive financial assistance under JSY.
Seventy-one percent of children in Assam who were born in the past five years were born in a health facility.
15
Postnatal care Early postnatal care for a mother helps safeguard her health and can reduce maternal mortality. In Assam, slightly less than two-thirds (65%) of mothers had a postnatal check after their last birth and 58 percent of mothers had a postnatal check within two days of the birth, as is recommended. Postnatal care is most common following births in a health facility; 71 percent of births in public health facilities and 83 percent of births in private health facilities were followed by postnatal checks for the mother within the two days of birth, compared with only 17 percent of home births. Slightly more than one-fourth (27%) of last births in the five years preceding the survey received a health check in the first two days after birth. Thirteen percent of home births received a health check in the first two days after birth. Male involvement in maternal careNinety-two percent of men with a child under three years of age said that the youngest child’s mother received antenatal care. Two-thirds of men w ith a child under three years said they were present during at least one antenatal check received by the child’s mother (76% in urban areas and 65% in rural areas). Sixty-nine percent were told by a health provider or health worker what to do if the mother had a pregnancy complication. Only 51-67 percent of men were told about the signs of specific pregnancy complications (convulsions, vaginal bleeding, high blood pressure, prolonged labour, and severe abdominal pain).
2231
7174
In a health facility Assisted by health personnel
NFHS-3 NFHS-4
Are babies being delivered safely?Percentage of births in the p ast fiv e years
2231
7174
In a health facility Assisted by health personnel
NFHS-3 NFHS-4
Are babies being delivered safely?Percentage of births in the p ast fiv e years
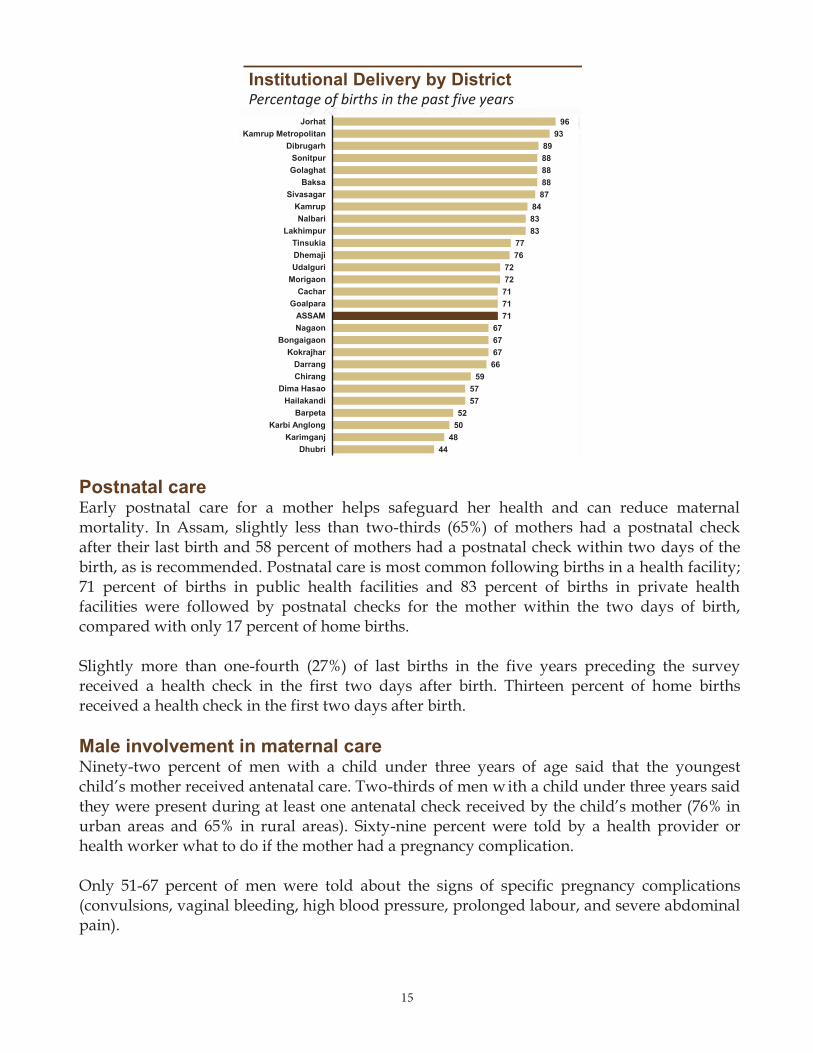
1514
Delivery care Slightly less than three-fourths of births (71%) take place in a health facility (mostly a public health facility) and 29 percent take place at home. The percentage of births in a health facility more than tripled in the 10 years between NFHS-3 and NFHS-4, from 22 percent in NFHS-3 to 71 percent in NFHS-4. Institutional births are more common among women who have received an antenatal check, women with 12 or more years of schooling, women who are having their first birth, and Hindu women. For 89 percent of home births, a clean blade was used to cut the cord, as is recommended. A disposable delivery kit was used for 30 percent of deliveries. Slightly less than three-fourths (74%) of home births followed the recommendation that the baby be immediately wiped dry and then wrapped without being bathed first. Slightly less than three-fourths (74%) of births during the past five years took place with assistance from a skilled provider, and another 17 percent were delivered by a traditional birth attendant. Thirteen percent of births during the past five years were delivered by caesarean section, including 37 percent of births in urban areas. Slightly less than half of caesarean sections (6% of all births) were emergency caesarean sections. Among women who had a live birth in the five years preceding the survey that was delivered in a health facility, almost two-thirds received financial assistance under the
(JSY). Rural women were more likely than urban women to receive financial assistance under JSY. Scheduled tribe women were more likely than women from any other caste/tribe to receive financial assistance under JSY.
Seventy-one percent of children in Assam who were born in the past five years were born in a health facility.
15
Postnatal care Early postnatal care for a mother helps safeguard her health and can reduce maternal mortality. In Assam, slightly less than two-thirds (65%) of mothers had a postnatal check after their last birth and 58 percent of mothers had a postnatal check within two days of the birth, as is recommended. Postnatal care is most common following births in a health facility; 71 percent of births in public health facilities and 83 percent of births in private health facilities were followed by postnatal checks for the mother within the two days of birth, compared with only 17 percent of home births. Slightly more than one-fourth (27%) of last births in the five years preceding the survey received a health check in the first two days after birth. Thirteen percent of home births received a health check in the first two days after birth. Male involvement in maternal careNinety-two percent of men with a child under three years of age said that the youngest child’s mother received antenatal care. Two-thirds of men w ith a child under three years said they were present during at least one antenatal check received by the child’s mother (76% in urban areas and 65% in rural areas). Sixty-nine percent were told by a health provider or health worker what to do if the mother had a pregnancy complication. Only 51-67 percent of men were told about the signs of specific pregnancy complications (convulsions, vaginal bleeding, high blood pressure, prolonged labour, and severe abdominal pain).
4448
5052
5757
5966676767
7171717272
7677
838384
8788888889
9396
DhubriKarimganj
Karbi AnglongBarpeta
HailakandiDima Hasao
ChirangDarrang
KokrajharBongaigaon
NagaonASSAM
GoalparaCachar
MorigaonUdalguriDhemajiTinsukia
LakhimpurNalbari
KamrupSivasagar
BaksaGolaghatSonitpur
DibrugarhKamrup Metropolitan
Jorhat
Institutional Delivery by DistrictPercentage of births in the p ast fiv e years
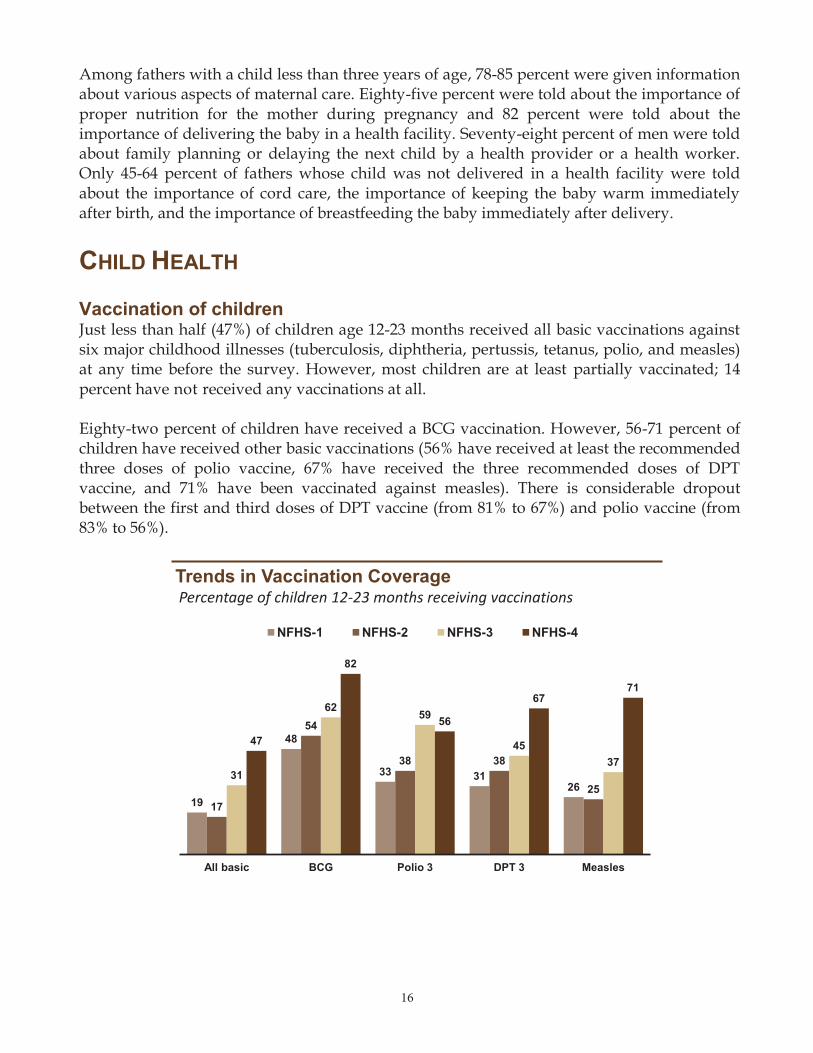
16 17
Between NFHS-3 and NFHS-4, there was a larger increase in vaccination coverage for BCG (from 62% to 82%), three doses of DPT (from 45% to 67%), and measles (from 37% to 71%) but coverage for three doses of polio vaccine declined from 59 percent to 56 percent. Overall, there was an increase in the coverage of all basic vaccinations (from 31% to 47%). In addition, three-fourths of children have received at least one dose of hepatitis B vaccine, but just over half (52%) of children have received all three recommended doses of hepatitis B vaccine. Coverage with all basic vaccinations is higher in urban areas than in rural areas (71% versus 44%) and is highest for children whose mothers have 12 or more years of schooling (60%) and for first births (53%). There is not much difference in vaccination coverage by the sex of the child. Muslim children and children whose mothers have not attended school have the lowest vaccination coverage compared with any group in the table.
Coverage with all basic vaccinations is highest for children whose mothers have 12 or more years of schooling.
Childhood illnessesIn the two weeks before the survey, 1 percent of children under age five years had symptoms of an acute respiratory infection (cough and short, rapid breathing or difficult breathing that was chest related and not due to a blocked or runny nose). Of these children, 63 percent were taken to a health facility or health provider. Nine percent of children under age five were reported to have had fever in the two weeks preceding the survey; 47 percent of these children were taken to a health facility or provider for treatment. Overall, 3 percent of children under age five years had diarrhoea in the two weeks preceding the survey. Just over half (51%) of these children were taken to a health facility or health provider. Nine out of 10 mothers of young children have heard of oral rehydration salt (ORS) packets for the treatment of diarrhoea, but only 52 percent of children with diarrhoea were given ORS.
16
Among fathers with a child less than three years of age, 78-85 percent were given information about various aspects of maternal care. Eighty-five percent were told about the importance of proper nutrition for the mother during pregnancy and 82 percent were told about the importance of delivering the baby in a health facility. Seventy-eight percent of men were told about family planning or delaying the next child by a health provider or a health worker. Only 45-64 percent of fathers whose child was not delivered in a health facility were told about the importance of cord care, the importance of keeping the baby warm immediately after birth, and the importance of breastfeeding the baby immediately after delivery. CHILD HEALTH Vaccination of childrenJust less than half (47%) of children age 12-23 months received all basic vaccinations against six major childhood illnesses (tuberculosis, diphtheria, pertussis, tetanus, polio, and measles) at any time before the survey. However, most children are at least partially vaccinated; 14 percent have not received any vaccinations at all. Eighty-two percent of children have received a BCG vaccination. However, 56-71 percent of children have received other basic vaccinations (56% have received at least the recommended three doses of polio vaccine, 67% have received the three recommended doses of DPT vaccine, and 71% have been vaccinated against measles). There is considerable dropout between the first and third doses of DPT vaccine (from 81% to 67%) and polio vaccine (from 83% to 56%).
19
48
33 3126
17
54
38 38
2531
62 59
4537
47
82
56
6771
All basic BCG Polio 3 DPT 3 Measles
NFHS-1 NFHS-2 NFHS-3 NFHS-4
Trends in Vaccination Coverage Percentage of children 1 2 - 2 3 m onths receiv ing v accinations
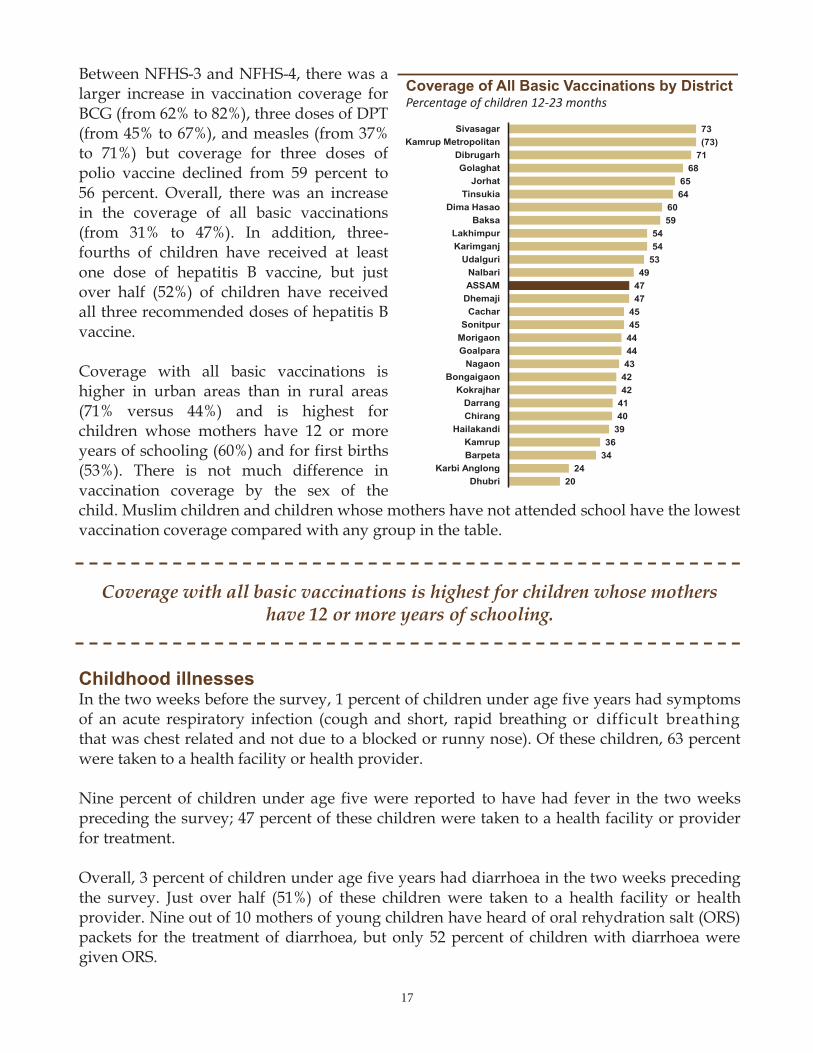
1717
Between NFHS-3 and NFHS-4, there was a larger increase in vaccination coverage for BCG (from 62% to 82%), three doses of DPT (from 45% to 67%), and measles (from 37% to 71%) but coverage for three doses of polio vaccine declined from 59 percent to 56 percent. Overall, there was an increase in the coverage of all basic vaccinations (from 31% to 47%). In addition, three-fourths of children have received at least one dose of hepatitis B vaccine, but just over half (52%) of children have received all three recommended doses of hepatitis B vaccine. Coverage with all basic vaccinations is higher in urban areas than in rural areas (71% versus 44%) and is highest for children whose mothers have 12 or more years of schooling (60%) and for first births (53%). There is not much difference in vaccination coverage by the sex of the child. Muslim children and children whose mothers have not attended school have the lowest vaccination coverage compared with any group in the table.
Coverage with all basic vaccinations is highest for children whose mothers have 12 or more years of schooling.
Childhood illnessesIn the two weeks before the survey, 1 percent of children under age five years had symptoms of an acute respiratory infection (cough and short, rapid breathing or difficult breathing that was chest related and not due to a blocked or runny nose). Of these children, 63 percent were taken to a health facility or health provider. Nine percent of children under age five were reported to have had fever in the two weeks preceding the survey; 47 percent of these children were taken to a health facility or provider for treatment. Overall, 3 percent of children under age five years had diarrhoea in the two weeks preceding the survey. Just over half (51%) of these children were taken to a health facility or health provider. Nine out of 10 mothers of young children have heard of oral rehydration salt (ORS) packets for the treatment of diarrhoea, but only 52 percent of children with diarrhoea were given ORS.
16
Among fathers with a child less than three years of age, 78-85 percent were given information about various aspects of maternal care. Eighty-five percent were told about the importance of proper nutrition for the mother during pregnancy and 82 percent were told about the importance of delivering the baby in a health facility. Seventy-eight percent of men were told about family planning or delaying the next child by a health provider or a health worker. Only 45-64 percent of fathers whose child was not delivered in a health facility were told about the importance of cord care, the importance of keeping the baby warm immediately after birth, and the importance of breastfeeding the baby immediately after delivery. CHILD HEALTH Vaccination of childrenJust less than half (47%) of children age 12-23 months received all basic vaccinations against six major childhood illnesses (tuberculosis, diphtheria, pertussis, tetanus, polio, and measles) at any time before the survey. However, most children are at least partially vaccinated; 14 percent have not received any vaccinations at all. Eighty-two percent of children have received a BCG vaccination. However, 56-71 percent of children have received other basic vaccinations (56% have received at least the recommended three doses of polio vaccine, 67% have received the three recommended doses of DPT vaccine, and 71% have been vaccinated against measles). There is considerable dropout between the first and third doses of DPT vaccine (from 81% to 67%) and polio vaccine (from 83% to 56%).
Coverage of All Basic Vaccinations by DistrictPercentage of children 1 2 - 2 3 m onths
73(73)
7168
6564
6059
5454
5349
4747
4545444443
4242
4140
3936
3424
20
SivasagarKamrup Metropolitan
DibrugarhGolaghat
JorhatTinsukia
Dima HasaoBaksa
LakhimpurKarimganj
UdalguriNalbariASSAM
DhemajiCachar
SonitpurMorigaonGoalpara
NagaonBongaigaon
KokrajharDarrangChirang
HailakandiKamrupBarpeta
Karbi AnglongDhubri
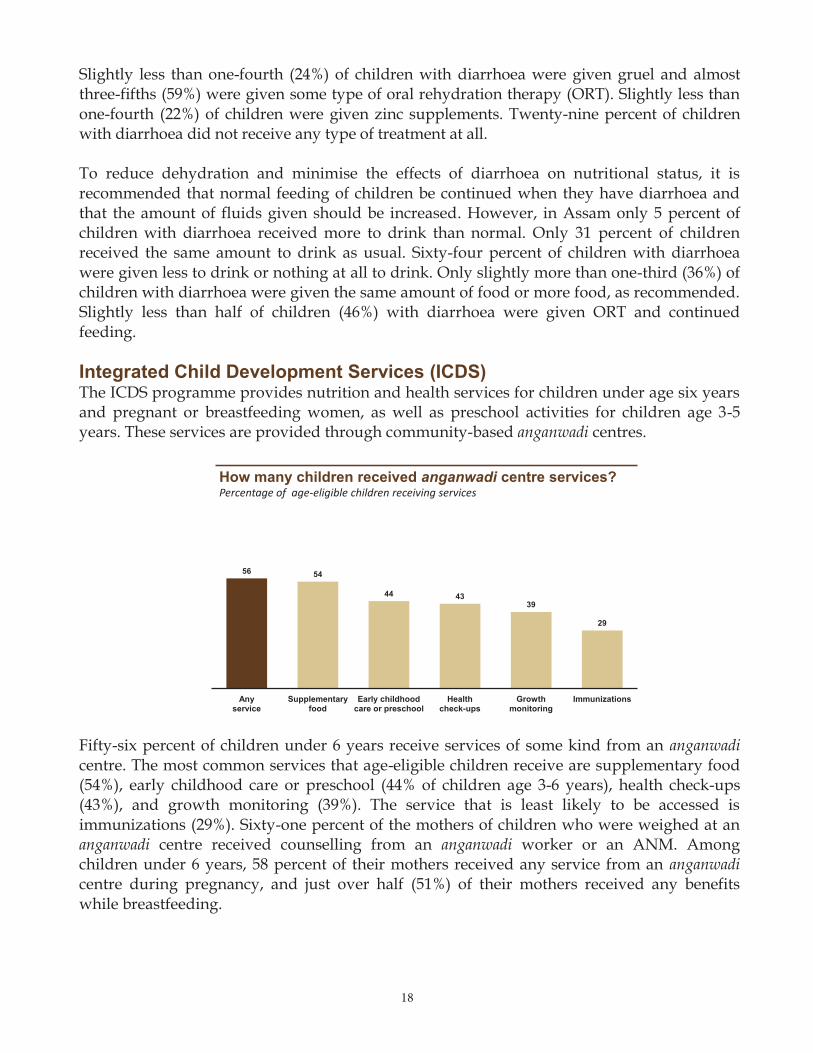
1818
Slightly less than one-fourth (24%) of children with diarrhoea were given gruel and almost three-fifths (59%) were given some type of oral rehydration therapy (ORT). Slightly less than one-fourth (22%) of children were given zinc supplements. Twenty-nine percent of children with diarrhoea did not receive any type of treatment at all. To reduce dehydration and minimise the effects of diarrhoea on nutritional status, it is recommended that normal feeding of children be continued when they have diarrhoea and that the amount of fluids given should be increased. However, in Assam only 5 percent of children with diarrhoea received more to drink than normal. Only 31 percent of children received the same amount to drink as usual. Sixty-four percent of children with diarrhoea were given less to drink or nothing at all to drink. Only slightly more than one-third (36%) of children with diarrhoea were given the same amount of food or more food, as recommended. Slightly less than half of children (46%) with diarrhoea were given ORT and continued feeding. Integrated Child Development Services (ICDS)The ICDS programme provides nutrition and health services for children under age six years and pregnant or breastfeeding women, as well as preschool activities for children age 3-5 years. These services are provided through community-based anganwadi centres.
Fifty-six percent of children under 6 years receive services of some kind from an anganwadi centre. The most common services that age-eligible children receive are supplementary food (54%), early childhood care or preschool (44% of children age 3-6 years), health check-ups (43%), and growth monitoring (39%). The service that is least likely to be accessed is immunizations (29%). Sixty-one percent of the mothers of children who were weighed at an anganwadi centre received counselling from an anganwadi worker or an ANM. Among children under 6 years, 58 percent of their mothers received any service from an anganwadi centre during pregnancy, and just over half (51%) of their mothers received any benefits while breastfeeding.
19
BREASTFEEDING, NUTRITION, AND ANAEMIA
Infant feedingAlthough breastfeeding is nearly universal in Assam, only 64 percent of children under 6 months are exclusively breastfed, as the World Health Organization (WHO) recommends. Ninety-two percent are put to the breast within the first day of life, but only 65 percent started breastfeeding in the first hour of life (as recommended). While the initiation of breastfeeding indicators shows substantial improvement since NFHS-3, many infants are still deprived of the highly nutritious first milk (colostrum) and the antibodies it contains. It is recommended that nothing be given to children other than breastmilk even in the first three days when the milk has not begun to flow regularly because prelacteal feeds limit the frequency of suckling by the infant and expose the baby to the risk of infection. However, 6 percent of children are given something other than breastmilk during the first three days. Overall, 95 percent of children continue breastfeeding at 1 year and 91 percent continue breastfeeding at 2 years. The median duration of breastfeeding is ≥36.0 months. After the first 6 months, breastmilk is no longer enough to meet the nutritional needs of infants. Therefore, complementary foods should be added to the diet of the child. However, at age 6-8 months only about half (49%) of children in Assam receive breastmilk and complementary foods. WHO has several recommendations for infant and young child feeding (IYCF) practices for children age 6-23 months. The key IYCF indicators measure the adequacy of dietary diversity and meal frequency for breastfed and nonbreastfed children. Only slightly more than one-fourth (27%) of children age 6-23 months are fed the recommended minimum number of times per day and slightly more than one-fourth of (28%) children are fed from the appropriate number of food groups. Only 9 percent are fed according to all three recommended practices. Micronutrient deficiency is a major contributor to childhood morbidity and mortality. Vitamin A is an essential nutrient for the immune system. Severe vitamin A deficiency (VAD) can cause eye damage and a higher risk of dying from measles and diarrhoeal disease. The Government of India recommends that children under 5 years of age receive vitamin A supplements every six months, starting at age 9 months. In Assam, slightly more than half (51%) of children age 9-59 months were given a vitamin A supplement in the past six months, and 59 percent of children age 9-23 months ate vitamin A-rich foods during the day or night before the survey. Iron deficiency is a primary cause of anaemia. Eating foods rich in iron and taking iron supplements can help prevent anaemia. Only 30 percent of children age 9-23 months ate iron-rich foods during the day or night before the survey, and only 21 percent of children age 6-59 months were given iron supplements in the week before the survey.
56 54
44 4339
29
Any service
Supplementary food
Early childhood care or preschool
Health check-ups
Growth monitoring
Immunizations
How many children received anganwadi centre services?Percentage of age- eligible children receiv ing serv ices
56 54
44 4339
29
Any service
Supplementary food
Early childhood care or preschool
Health check-ups
Growth monitoring
Immunizations
How many children received anganwadi centre services?Percentage of age- eligible children receiv ing serv ices
1918
Slightly less than one-fourth (24%) of children with diarrhoea were given gruel and almost three-fifths (59%) were given some type of oral rehydration therapy (ORT). Slightly less than one-fourth (22%) of children were given zinc supplements. Twenty-nine percent of children with diarrhoea did not receive any type of treatment at all. To reduce dehydration and minimise the effects of diarrhoea on nutritional status, it is recommended that normal feeding of children be continued when they have diarrhoea and that the amount of fluids given should be increased. However, in Assam only 5 percent of children with diarrhoea received more to drink than normal. Only 31 percent of children received the same amount to drink as usual. Sixty-four percent of children with diarrhoea were given less to drink or nothing at all to drink. Only slightly more than one-third (36%) of children with diarrhoea were given the same amount of food or more food, as recommended. Slightly less than half of children (46%) with diarrhoea were given ORT and continued feeding. Integrated Child Development Services (ICDS)The ICDS programme provides nutrition and health services for children under age six years and pregnant or breastfeeding women, as well as preschool activities for children age 3-5 years. These services are provided through community-based anganwadi centres.
Fifty-six percent of children under 6 years receive services of some kind from an anganwadi centre. The most common services that age-eligible children receive are supplementary food (54%), early childhood care or preschool (44% of children age 3-6 years), health check-ups (43%), and growth monitoring (39%). The service that is least likely to be accessed is immunizations (29%). Sixty-one percent of the mothers of children who were weighed at an anganwadi centre received counselling from an anganwadi worker or an ANM. Among children under 6 years, 58 percent of their mothers received any service from an anganwadi centre during pregnancy, and just over half (51%) of their mothers received any benefits while breastfeeding.
19
BREASTFEEDING, NUTRITION, AND ANAEMIA
Infant feedingAlthough breastfeeding is nearly universal in Assam, only 64 percent of children under 6 months are exclusively breastfed, as the World Health Organization (WHO) recommends. Ninety-two percent are put to the breast within the first day of life, but only 65 percent started breastfeeding in the first hour of life (as recommended). While the initiation of breastfeeding indicators shows substantial improvement since NFHS-3, many infants are still deprived of the highly nutritious first milk (colostrum) and the antibodies it contains. It is recommended that nothing be given to children other than breastmilk even in the first three days when the milk has not begun to flow regularly because prelacteal feeds limit the frequency of suckling by the infant and expose the baby to the risk of infection. However, 6 percent of children are given something other than breastmilk during the first three days. Overall, 95 percent of children continue breastfeeding at 1 year and 91 percent continue breastfeeding at 2 years. The median duration of breastfeeding is ≥36.0 months. After the first 6 months, breastmilk is no longer enough to meet the nutritional needs of infants. Therefore, complementary foods should be added to the diet of the child. However, at age 6-8 months only about half (49%) of children in Assam receive breastmilk and complementary foods. WHO has several recommendations for infant and young child feeding (IYCF) practices for children age 6-23 months. The key IYCF indicators measure the adequacy of dietary diversity and meal frequency for breastfed and nonbreastfed children. Only slightly more than one-fourth (27%) of children age 6-23 months are fed the recommended minimum number of times per day and slightly more than one-fourth of (28%) children are fed from the appropriate number of food groups. Only 9 percent are fed according to all three recommended practices. Micronutrient deficiency is a major contributor to childhood morbidity and mortality. Vitamin A is an essential nutrient for the immune system. Severe vitamin A deficiency (VAD) can cause eye damage and a higher risk of dying from measles and diarrhoeal disease. The Government of India recommends that children under 5 years of age receive vitamin A supplements every six months, starting at age 9 months. In Assam, slightly more than half (51%) of children age 9-59 months were given a vitamin A supplement in the past six months, and 59 percent of children age 9-23 months ate vitamin A-rich foods during the day or night before the survey. Iron deficiency is a primary cause of anaemia. Eating foods rich in iron and taking iron supplements can help prevent anaemia. Only 30 percent of children age 9-23 months ate iron-rich foods during the day or night before the survey, and only 21 percent of children age 6-59 months were given iron supplements in the week before the survey.
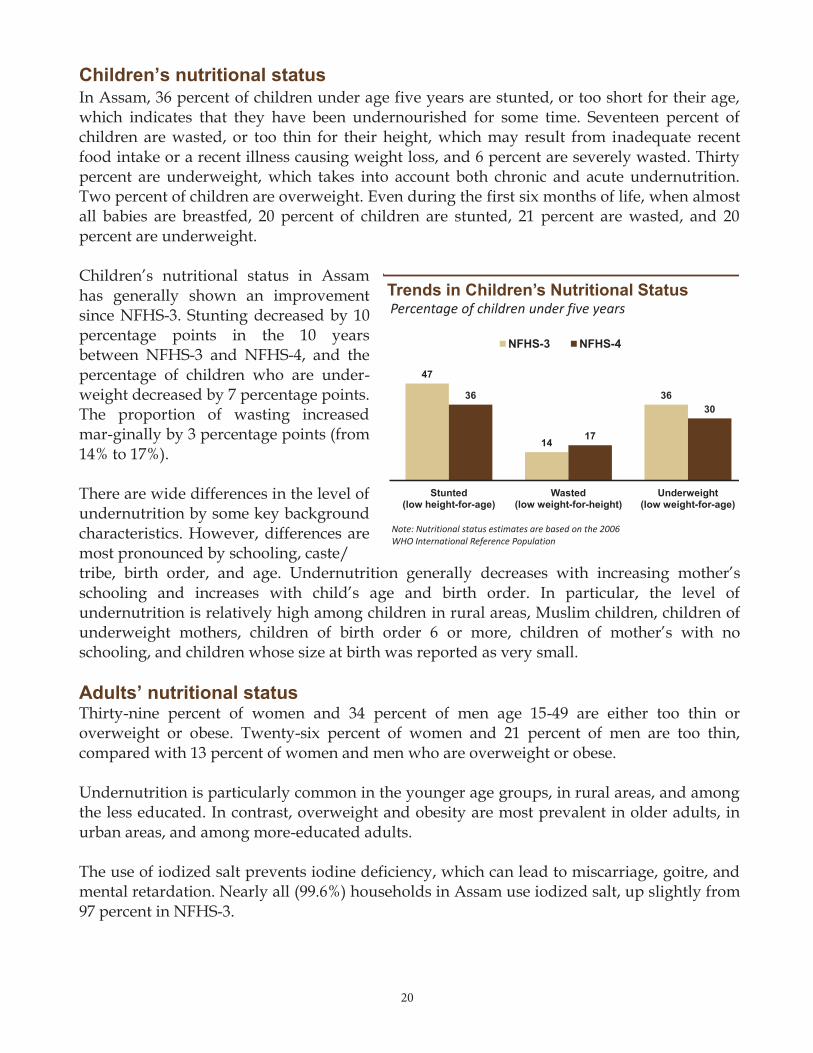
20 21
Anaemia Anaemia is a condition that is marked by low levels of haemoglobin in the blood. Iron deficiency is estimated to be responsible for about half of all anaemia globally, but anaemia can also be caused by malaria, hookworm and other helminths, other nutritional deficiencies, chronic infections, and genetic conditions. Anaemia can result in maternal mortality, weakness, diminished physical and mental capacity, increased morbidity from infectious diseases, perinatal mortality, premature delivery, low birth weight, and (in children) impaired cognitive performance, motor development, and scholastic achievement. Anaemia is a health problem in Assam, especially among women and children.
Among children 6-59 months, a substantial proportion (36%) are anaemic. This includes 24 percent who are mildly anaemic, 11 percent who are moderately anaemic, and 0.4 percent who are severely anaemic. Children of mothers who have anaemia are much more likely to be anaemic. Although anaemia levels vary somewhat according to background characteristics, anaemia among children is widespread in every group. Thirty-one percent of children are anaemic even if their mother has 12 or more years of schooling, and 30 percent are anaemic even if their mothers are not anaemic.
20
Children’s nutritional statusIn Assam, 36 percent of children under age five years are stunted, or too short for their age, which indicates that they have been undernourished for some time. Seventeen percent of children are wasted, or too thin for their height, which may result from inadequate recent food intake or a recent illness causing weight loss, and 6 percent are severely wasted. Thirty percent are underweight, which takes into account both chronic and acute undernutrition. Two percent of children are overweight. Even during the first six months of life, when almost all babies are breastfed, 20 percent of children are stunted, 21 percent are wasted, and 20 percent are underweight. Children’s nutritional status in Assam has generally shown an improvement since NFHS-3. Stunting decreased by 10 percentage points in the 10 years between NFHS-3 and NFHS-4, and the percentage of children who are under-weight decreased by 7 percentage points. The proportion of wasting increased mar-ginally by 3 percentage points (from 14% to 17%). There are wide differences in the level of undernutrition by some key background characteristics. However, differences are most pronounced by schooling, caste/ tribe, birth order, and age. Undernutrition generally decreases with increasing mother’s schooling and increases with child’s age and birth order. In particular, the level of undernutrition is relatively high among children in rural areas, Muslim children, children of underweight mothers, children of birth order 6 or more, children of mother’s with no schooling, and children whose size at birth was reported as very small. Adults’ nutritional statusThirty-nine percent of women and 34 percent of men age 15-49 are either too thin or overweight or obese. Twenty-six percent of women and 21 percent of men are too thin, compared with 13 percent of women and men who are overweight or obese. Undernutrition is particularly common in the younger age groups, in rural areas, and among the less educated. In contrast, overweight and obesity are most prevalent in older adults, in urban areas, and among more-educated adults. The use of iodized salt prevents iodine deficiency, which can lead to miscarriage, goitre, and mental retardation. Nearly all (99.6%) households in Assam use iodized salt, up slightly from 97 percent in NFHS-3.
47
14
3636
17
30
Stunted (low height-for-age)
Wasted (low weight-for-height)
Underweight (low weight-for-age)
Note: Nutritional status estimates are based on the 2006 WHO International Reference Population
NFHS-3 NFHS-4
Trends in Children’s Nutritional Status Percentage of children under five years
47
14
3636
17
30
Stunted (low height-for-age)
Wasted (low weight-for-height)
Underweight (low weight-for-age)
Note: Nutritional status estimates are based on the 2006 WHO International Reference Population
NFHS-3 NFHS-4
Trends in Children’s Nutritional Status Percentage of children under five years
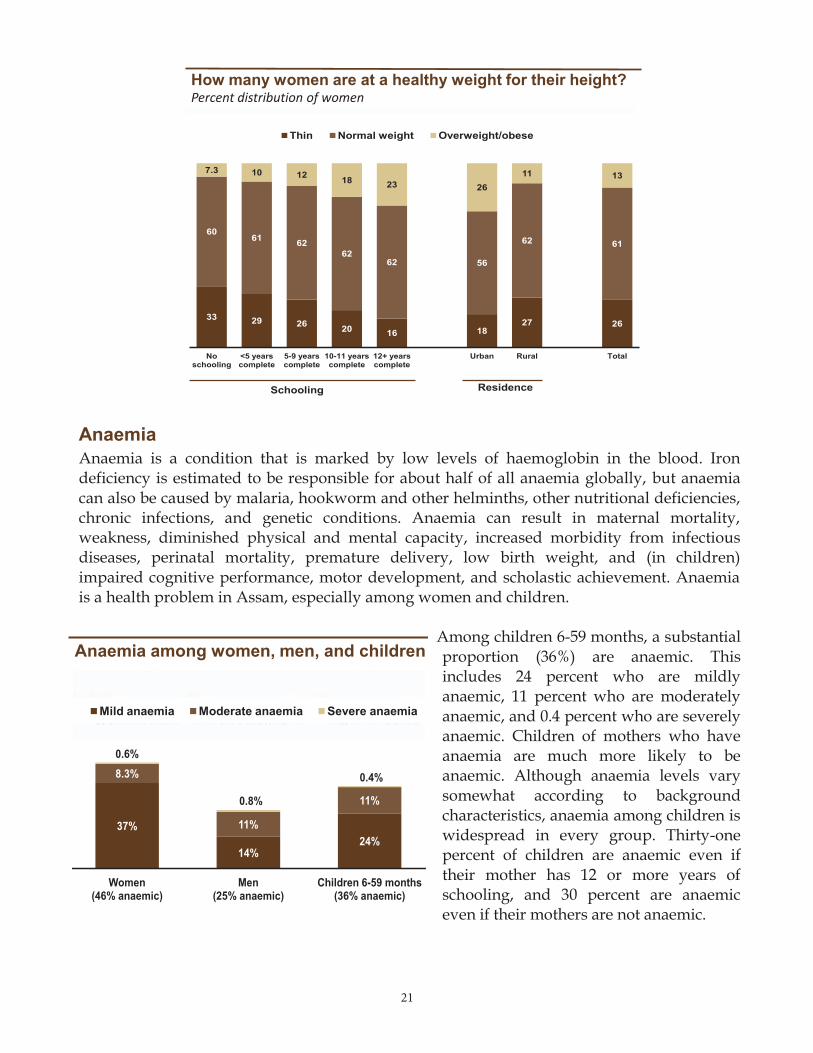
2121
Anaemia Anaemia is a condition that is marked by low levels of haemoglobin in the blood. Iron deficiency is estimated to be responsible for about half of all anaemia globally, but anaemia can also be caused by malaria, hookworm and other helminths, other nutritional deficiencies, chronic infections, and genetic conditions. Anaemia can result in maternal mortality, weakness, diminished physical and mental capacity, increased morbidity from infectious diseases, perinatal mortality, premature delivery, low birth weight, and (in children) impaired cognitive performance, motor development, and scholastic achievement. Anaemia is a health problem in Assam, especially among women and children.
Among children 6-59 months, a substantial proportion (36%) are anaemic. This includes 24 percent who are mildly anaemic, 11 percent who are moderately anaemic, and 0.4 percent who are severely anaemic. Children of mothers who have anaemia are much more likely to be anaemic. Although anaemia levels vary somewhat according to background characteristics, anaemia among children is widespread in every group. Thirty-one percent of children are anaemic even if their mother has 12 or more years of schooling, and 30 percent are anaemic even if their mothers are not anaemic.
20
Children’s nutritional statusIn Assam, 36 percent of children under age five years are stunted, or too short for their age, which indicates that they have been undernourished for some time. Seventeen percent of children are wasted, or too thin for their height, which may result from inadequate recent food intake or a recent illness causing weight loss, and 6 percent are severely wasted. Thirty percent are underweight, which takes into account both chronic and acute undernutrition. Two percent of children are overweight. Even during the first six months of life, when almost all babies are breastfed, 20 percent of children are stunted, 21 percent are wasted, and 20 percent are underweight. Children’s nutritional status in Assam has generally shown an improvement since NFHS-3. Stunting decreased by 10 percentage points in the 10 years between NFHS-3 and NFHS-4, and the percentage of children who are under-weight decreased by 7 percentage points. The proportion of wasting increased mar-ginally by 3 percentage points (from 14% to 17%). There are wide differences in the level of undernutrition by some key background characteristics. However, differences are most pronounced by schooling, caste/ tribe, birth order, and age. Undernutrition generally decreases with increasing mother’s schooling and increases with child’s age and birth order. In particular, the level of undernutrition is relatively high among children in rural areas, Muslim children, children of underweight mothers, children of birth order 6 or more, children of mother’s with no schooling, and children whose size at birth was reported as very small. Adults’ nutritional statusThirty-nine percent of women and 34 percent of men age 15-49 are either too thin or overweight or obese. Twenty-six percent of women and 21 percent of men are too thin, compared with 13 percent of women and men who are overweight or obese. Undernutrition is particularly common in the younger age groups, in rural areas, and among the less educated. In contrast, overweight and obesity are most prevalent in older adults, in urban areas, and among more-educated adults. The use of iodized salt prevents iodine deficiency, which can lead to miscarriage, goitre, and mental retardation. Nearly all (99.6%) households in Assam use iodized salt, up slightly from 97 percent in NFHS-3.
33 29 26 20 16 1827 26
6061 62
6262 56
62 61
7.3 10 12 18 23 2611 13
No schooling
<5 years complete
5-9 years complete
10-11 years complete
12+ years complete
Urban Rural Total
Schooling
Thin Normal weight Overweight/obese
Residence
How many women are at a healthy weight for their height?Percent distribu tion of w om en
37%
14%24%
8.3%
11%
11%
0.6%
0.8%
0.4%
Women (46% anaemic)
Men (25% anaemic)
Children 6-59 months (36% anaemic)
Mild anaemia Moderate anaemia Severe anaemia
Anaemia among women, men, and children
37%
14%24%
8.3%
11%
11%
0.6%
0.8%
0.4%
Women (46% anaemic)
Men (25% anaemic)
Children 6-59 months (36% anaemic)
Mild anaemia Moderate anaemia Severe anaemia
Anaemia among women, men, and children
37%
14%24%
8.3%
11%
11%
0.6%
0.8%
0.4%
Women (46% anaemic)
Men (25% anaemic)
Children 6-59 months (36% anaemic)
Mild anaemia Moderate anaemia Severe anaemia
Anaemia among women, men, and children
33 29 26 20 16 1827 26
6061 62
6262 56
62 61
7.3 10 12 18 23 2611 13
No schooling
<5 years complete
5-9 years complete
10-11 years complete
12+ years complete
Urban Rural Total
Schooling
Thin Normal weight Overweight/obese
Residence
How many women are at a healthy weight for their height?Percent distribu tion of w om en
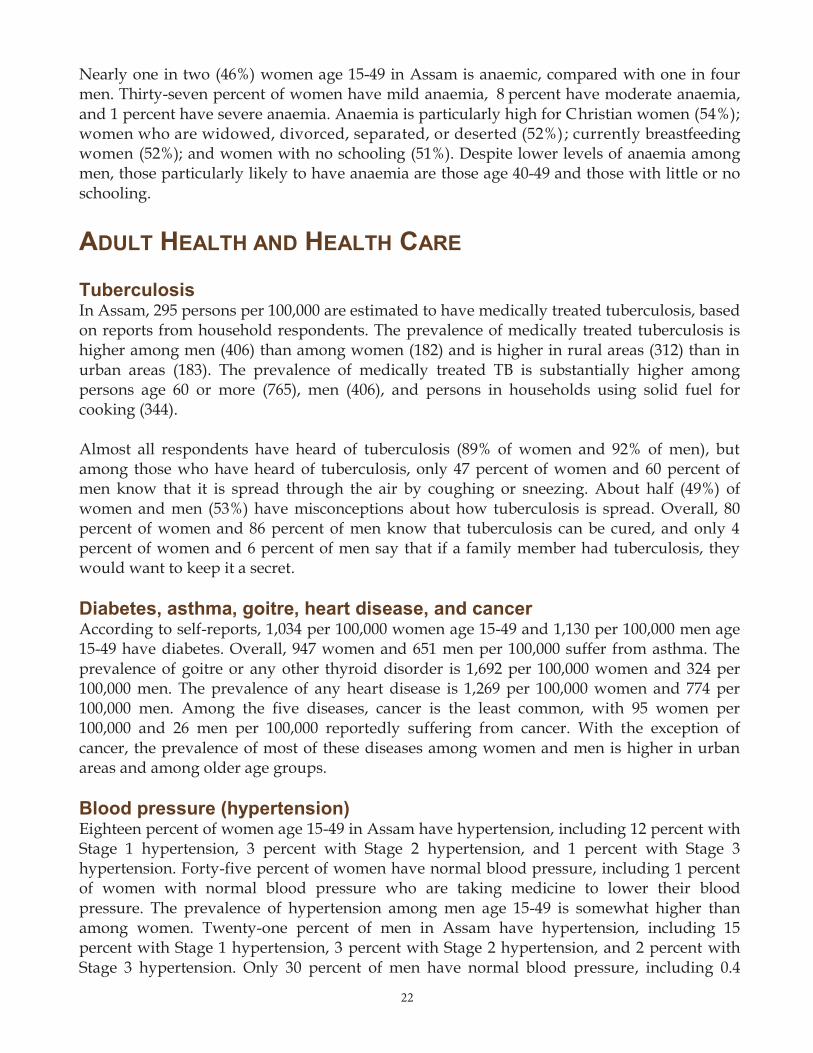
2222
Nearly one in two (46%) women age 15-49 in Assam is anaemic, compared with one in four men. Thirty-seven percent of women have mild anaemia, 8 percent have moderate anaemia, and 1 percent have severe anaemia. Anaemia is particularly high for Christian women (54%); women who are widowed, divorced, separated, or deserted (52%); currently breastfeeding women (52%); and women with no schooling (51%). Despite lower levels of anaemia among men, those particularly likely to have anaemia are those age 40-49 and those with little or no schooling.
ADULT HEALTH AND HEALTH CARE TuberculosisIn Assam, 295 persons per 100,000 are estimated to have medically treated tuberculosis, based on reports from household respondents. The prevalence of medically treated tuberculosis is higher among men (406) than among women (182) and is higher in rural areas (312) than in urban areas (183). The prevalence of medically treated TB is substantially higher among persons age 60 or more (765), men (406), and persons in households using solid fuel for cooking (344). Almost all respondents have heard of tuberculosis (89% of women and 92% of men), but among those who have heard of tuberculosis, only 47 percent of women and 60 percent of men know that it is spread through the air by coughing or sneezing. About half (49%) of women and men (53%) have misconceptions about how tuberculosis is spread. Overall, 80 percent of women and 86 percent of men know that tuberculosis can be cured, and only 4 percent of women and 6 percent of men say that if a family member had tuberculosis, they would want to keep it a secret. Diabetes, asthma, goitre, heart disease, and cancerAccording to self-reports, 1,034 per 100,000 women age 15-49 and 1,130 per 100,000 men age 15-49 have diabetes. Overall, 947 women and 651 men per 100,000 suffer from asthma. The prevalence of goitre or any other thyroid disorder is 1,692 per 100,000 women and 324 per 100,000 men. The prevalence of any heart disease is 1,269 per 100,000 women and 774 per 100,000 men. Among the five diseases, cancer is the least common, with 95 women per 100,000 and 26 men per 100,000 reportedly suffering from cancer. With the exception of cancer, the prevalence of most of these diseases among women and men is higher in urban areas and among older age groups. Blood pressure (hypertension)Eighteen percent of women age 15-49 in Assam have hypertension, including 12 percent with Stage 1 hypertension, 3 percent with Stage 2 hypertension, and 1 percent with Stage 3 hypertension. Forty-five percent of women have normal blood pressure, including 1 percent of women with normal blood pressure who are taking medicine to lower their blood pressure. The prevalence of hypertension among men age 15-49 is somewhat higher than among women. Twenty-one percent of men in Assam have hypertension, including 15 percent with Stage 1 hypertension, 3 percent with Stage 2 hypertension, and 2 percent with Stage 3 hypertension. Only 30 percent of men have normal blood pressure, including 0.4
23
percent of men with normal blood pressure who are taking medicine to lower their blood pressure. Half of men are considered to be pre-hypertensive. For both women and men, hypertension tends to increase with age and is higher among those in urban areas.
Blood glucoseNFHS-4 included measurement of random blood glucose among women age 15-49 and men age 15-54. Three percent of women age 15-49 in Assam have high blood glucose levels, and another 2 percent have very high blood glucose levels. In comparison, 3 percent of men age 15-49 have high blood glucose levels, and an additional 3 percent have very high blood glucose levels. Older women and men have relatively high blood glucose levels. Health examinations In Assam, only 5 percent of women have ever undergone an examination of the cervix, 5 percent have ever undergone a breast examination, and 6 percent have ever undergone an examination of the oral cavity. Tobacco and alcohol use Sixty-four percent of men and 20 percent of women age 15-49 use any type of tobacco. Women in Assam are much more likely to chew paan with tobacco (16%) than to use other types of tobacco. Among men, the most popular types of tobacco used are khaini (28%), paan with tobacco (24%), cigarettes (21%), and bidis (17%). Among women, the use of any form of tobacco is higher in rural areas than in urban areas. Most men who smoke cigarettes or bidis smoked 1-5 cigarettes or bidis in the past 24 hours, but 23 percent smoked 10 or more. In Assam, men (36%) and women (7%) are less likely to drink alcohol than to use tobacco. Among those who drink alcohol, 14 percent of women and 23 percent of men drink alcohol almost every day, and a much larger proportion say they drink alcohol at least once a week, but not every day (45% of women and 52% of men). Source of health care In Assam, the public medical sector is the main source of health care for almost four-fifths (79%) of households, with coverage higher in rural households (83%) than in urban households (61%). Within the public health sector, most household members (33%) go to primary health centres (PHC) or additional PHCs, followed by CHCs/rural hospitals/Block PHCs (23%). Health insuranceDespite the emergence of a number of health insurance programmes and health schemes, only 10 percent of households in Assam have any kind of health insurance that covers at least one member of the household. Health insurance coverage is higher in urban areas (13%) than in rural areas (10%). In Assam, the dominant programme is Rashtriya Swasthya Bima Yojana (56%), with coverage higher in rural areas (67%) than in urban areas (13%). Other privately purchased commercial health insurance plans account for 10 percent of coverage and the Central Government Health Scheme (CGHS) covers 9 percent of households.

2322
Nearly one in two (46%) women age 15-49 in Assam is anaemic, compared with one in four men. Thirty-seven percent of women have mild anaemia, 8 percent have moderate anaemia, and 1 percent have severe anaemia. Anaemia is particularly high for Christian women (54%); women who are widowed, divorced, separated, or deserted (52%); currently breastfeeding women (52%); and women with no schooling (51%). Despite lower levels of anaemia among men, those particularly likely to have anaemia are those age 40-49 and those with little or no schooling.
ADULT HEALTH AND HEALTH CARE TuberculosisIn Assam, 295 persons per 100,000 are estimated to have medically treated tuberculosis, based on reports from household respondents. The prevalence of medically treated tuberculosis is higher among men (406) than among women (182) and is higher in rural areas (312) than in urban areas (183). The prevalence of medically treated TB is substantially higher among persons age 60 or more (765), men (406), and persons in households using solid fuel for cooking (344). Almost all respondents have heard of tuberculosis (89% of women and 92% of men), but among those who have heard of tuberculosis, only 47 percent of women and 60 percent of men know that it is spread through the air by coughing or sneezing. About half (49%) of women and men (53%) have misconceptions about how tuberculosis is spread. Overall, 80 percent of women and 86 percent of men know that tuberculosis can be cured, and only 4 percent of women and 6 percent of men say that if a family member had tuberculosis, they would want to keep it a secret. Diabetes, asthma, goitre, heart disease, and cancerAccording to self-reports, 1,034 per 100,000 women age 15-49 and 1,130 per 100,000 men age 15-49 have diabetes. Overall, 947 women and 651 men per 100,000 suffer from asthma. The prevalence of goitre or any other thyroid disorder is 1,692 per 100,000 women and 324 per 100,000 men. The prevalence of any heart disease is 1,269 per 100,000 women and 774 per 100,000 men. Among the five diseases, cancer is the least common, with 95 women per 100,000 and 26 men per 100,000 reportedly suffering from cancer. With the exception of cancer, the prevalence of most of these diseases among women and men is higher in urban areas and among older age groups. Blood pressure (hypertension)Eighteen percent of women age 15-49 in Assam have hypertension, including 12 percent with Stage 1 hypertension, 3 percent with Stage 2 hypertension, and 1 percent with Stage 3 hypertension. Forty-five percent of women have normal blood pressure, including 1 percent of women with normal blood pressure who are taking medicine to lower their blood pressure. The prevalence of hypertension among men age 15-49 is somewhat higher than among women. Twenty-one percent of men in Assam have hypertension, including 15 percent with Stage 1 hypertension, 3 percent with Stage 2 hypertension, and 2 percent with Stage 3 hypertension. Only 30 percent of men have normal blood pressure, including 0.4
23
percent of men with normal blood pressure who are taking medicine to lower their blood pressure. Half of men are considered to be pre-hypertensive. For both women and men, hypertension tends to increase with age and is higher among those in urban areas.
Blood glucoseNFHS-4 included measurement of random blood glucose among women age 15-49 and men age 15-54. Three percent of women age 15-49 in Assam have high blood glucose levels, and another 2 percent have very high blood glucose levels. In comparison, 3 percent of men age 15-49 have high blood glucose levels, and an additional 3 percent have very high blood glucose levels. Older women and men have relatively high blood glucose levels. Health examinations In Assam, only 5 percent of women have ever undergone an examination of the cervix, 5 percent have ever undergone a breast examination, and 6 percent have ever undergone an examination of the oral cavity. Tobacco and alcohol use Sixty-four percent of men and 20 percent of women age 15-49 use any type of tobacco. Women in Assam are much more likely to chew paan with tobacco (16%) than to use other types of tobacco. Among men, the most popular types of tobacco used are khaini (28%), paan with tobacco (24%), cigarettes (21%), and bidis (17%). Among women, the use of any form of tobacco is higher in rural areas than in urban areas. Most men who smoke cigarettes or bidis smoked 1-5 cigarettes or bidis in the past 24 hours, but 23 percent smoked 10 or more. In Assam, men (36%) and women (7%) are less likely to drink alcohol than to use tobacco. Among those who drink alcohol, 14 percent of women and 23 percent of men drink alcohol almost every day, and a much larger proportion say they drink alcohol at least once a week, but not every day (45% of women and 52% of men). Source of health care In Assam, the public medical sector is the main source of health care for almost four-fifths (79%) of households, with coverage higher in rural households (83%) than in urban households (61%). Within the public health sector, most household members (33%) go to primary health centres (PHC) or additional PHCs, followed by CHCs/rural hospitals/Block PHCs (23%). Health insuranceDespite the emergence of a number of health insurance programmes and health schemes, only 10 percent of households in Assam have any kind of health insurance that covers at least one member of the household. Health insurance coverage is higher in urban areas (13%) than in rural areas (10%). In Assam, the dominant programme is Rashtriya Swasthya Bima Yojana (56%), with coverage higher in rural areas (67%) than in urban areas (13%). Other privately purchased commercial health insurance plans account for 10 percent of coverage and the Central Government Health Scheme (CGHS) covers 9 percent of households.
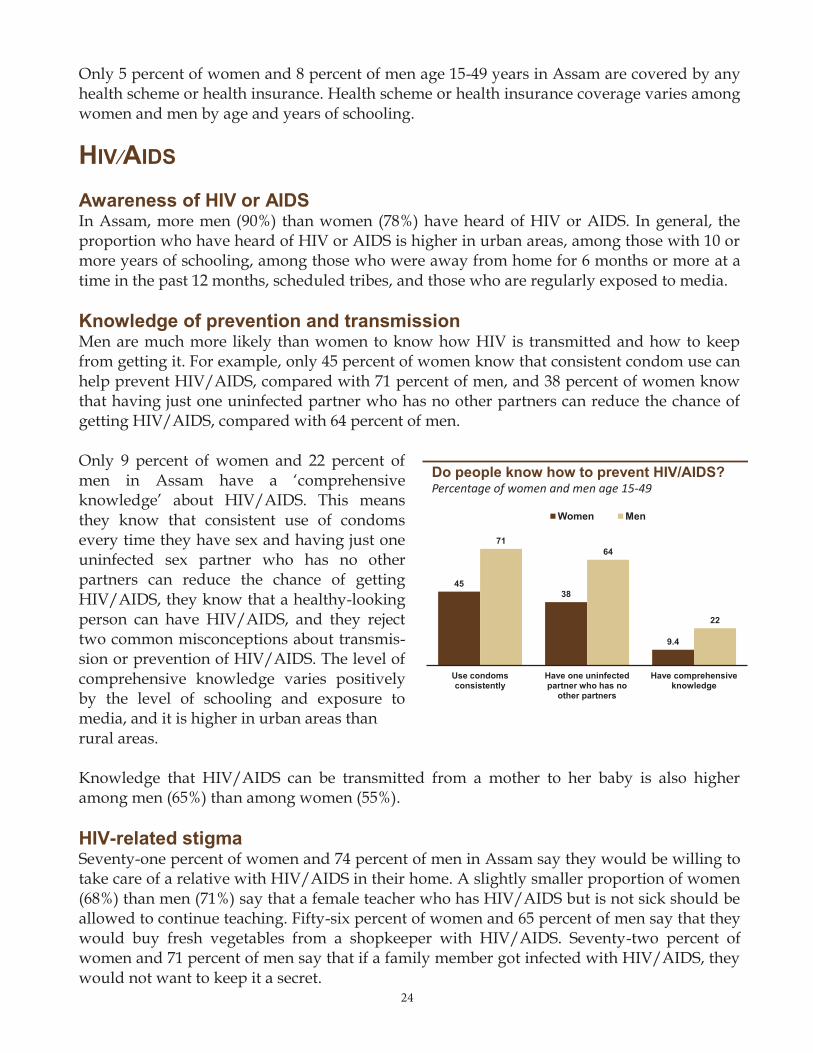
2424
Only 5 percent of women and 8 percent of men age 15-49 years in Assam are covered by any health scheme or health insurance. Health scheme or health insurance coverage varies among women and men by age and years of schooling.
HIV/AIDS Awareness of HIV or AIDS In Assam, more men (90%) than women (78%) have heard of HIV or AIDS. In general, the proportion who have heard of HIV or AIDS is higher in urban areas, among those with 10 or more years of schooling, among those who were away from home for 6 months or more at a time in the past 12 months, scheduled tribes, and those who are regularly exposed to media. Knowledge of prevention and transmissionMen are much more likely than women to know how HIV is transmitted and how to keep from getting it. For example, only 45 percent of women know that consistent condom use can help prevent HIV/AIDS, compared with 71 percent of men, and 38 percent of women know that having just one uninfected partner who has no other partners can reduce the chance of getting HIV/AIDS, compared with 64 percent of men. Only 9 percent of women and 22 percent of men in Assam have a ‘comprehensive knowledge’ about HIV/AIDS. This means they know that consistent use of condoms every time they have sex and having just one uninfected sex partner who has no other partners can reduce the chance of getting HIV/AIDS, they know that a healthy-looking person can have HIV/AIDS, and they reject two common misconceptions about transmis-sion or prevention of HIV/AIDS. The level of comprehensive knowledge varies positively by the level of schooling and exposure to media, and it is higher in urban areas than rural areas. Knowledge that HIV/AIDS can be transmitted from a mother to her baby is also higher among men (65%) than among women (55%). HIV-related stigmaSeventy-one percent of women and 74 percent of men in Assam say they would be willing to take care of a relative with HIV/AIDS in their home. A slightly smaller proportion of women (68%) than men (71%) say that a female teacher who has HIV/AIDS but is not sick should be allowed to continue teaching. Fifty-six percent of women and 65 percent of men say that they would buy fresh vegetables from a shopkeeper with HIV/AIDS. Seventy-two percent of women and 71 percent of men say that if a family member got infected with HIV/AIDS, they would not want to keep it a secret.
25
Overall, more than one-third (34%) of women and men (38%) express accepting attitudes towards people living with HIV/AIDS on all four indicators in Assam.
HIV testing prior to NFHS-4, blood transfusions, and safe injectionsOnly 5 percent of women and 2 percent of men age 15-49 had ever been tested for HIV prior to NFHS-4. Women in urban areas are somewhat more likely to have ever been tested for HIV prior to NFHS-4 than rural women. Only 8 percent of women who had a live birth in the past five years and received antenatal care (ANC) during pregnancy were tested for HIV during ANC. Urban women (17%) are more likely than rural women (7%) to have been tested for HIV during ANC.
Only 8 percent of women who had a live birth in the past five years and received ANC during pregnancy were tested for HIV during ANC.
In Assam, 5 percent of women and men have ever had a blood transfusion. Women and men are also equally likely to have received an injection in the past 12 months (32%). For more than nine in 10 men (92%) and 80 percent of women who received an injection in the past 12 months, a disposable syringe was used. SEXUAL BEHAVIOUR NFHS-4 included questions on respondents’ sexual behaviour. Respondents were asked about their age at first sex, their current and previous sexual partners, higher-risk intercourse, and condom use. In addition, men were asked whether they had paid for sex in the past year. These questions are sensitive and subject to reporting bias, so the results should be interpreted with caution.
Higher-risk behaviourHigher-risk sex is sexual intercourse with someone who is neither a spouse nor a cohabiting partner. Among those who had sex in the past 12 months, 2 percent of men and only 0.2 percent of women in Assam reported having had higher-risk sex in the past 12 months. The percentage of men who had higher-risk sexual intercourse in the past 12 months is about the same in urban and rural areas. Less than 1 percent of men said they had paid for sex in the past year.
4538
9.4
7164
22
Use condoms consistently
Have one uninfected partner who has no
other partners
Have comprehensive knowledge
Women Men
Do people know how to prevent HIV/AIDS?Percentage of w om en and m en age 1 5 - 4 9

2524
Only 5 percent of women and 8 percent of men age 15-49 years in Assam are covered by any health scheme or health insurance. Health scheme or health insurance coverage varies among women and men by age and years of schooling.
HIV/AIDS Awareness of HIV or AIDS In Assam, more men (90%) than women (78%) have heard of HIV or AIDS. In general, the proportion who have heard of HIV or AIDS is higher in urban areas, among those with 10 or more years of schooling, among those who were away from home for 6 months or more at a time in the past 12 months, scheduled tribes, and those who are regularly exposed to media. Knowledge of prevention and transmissionMen are much more likely than women to know how HIV is transmitted and how to keep from getting it. For example, only 45 percent of women know that consistent condom use can help prevent HIV/AIDS, compared with 71 percent of men, and 38 percent of women know that having just one uninfected partner who has no other partners can reduce the chance of getting HIV/AIDS, compared with 64 percent of men. Only 9 percent of women and 22 percent of men in Assam have a ‘comprehensive knowledge’ about HIV/AIDS. This means they know that consistent use of condoms every time they have sex and having just one uninfected sex partner who has no other partners can reduce the chance of getting HIV/AIDS, they know that a healthy-looking person can have HIV/AIDS, and they reject two common misconceptions about transmis-sion or prevention of HIV/AIDS. The level of comprehensive knowledge varies positively by the level of schooling and exposure to media, and it is higher in urban areas than rural areas. Knowledge that HIV/AIDS can be transmitted from a mother to her baby is also higher among men (65%) than among women (55%). HIV-related stigmaSeventy-one percent of women and 74 percent of men in Assam say they would be willing to take care of a relative with HIV/AIDS in their home. A slightly smaller proportion of women (68%) than men (71%) say that a female teacher who has HIV/AIDS but is not sick should be allowed to continue teaching. Fifty-six percent of women and 65 percent of men say that they would buy fresh vegetables from a shopkeeper with HIV/AIDS. Seventy-two percent of women and 71 percent of men say that if a family member got infected with HIV/AIDS, they would not want to keep it a secret.
25
Overall, more than one-third (34%) of women and men (38%) express accepting attitudes towards people living with HIV/AIDS on all four indicators in Assam.
HIV testing prior to NFHS-4, blood transfusions, and safe injectionsOnly 5 percent of women and 2 percent of men age 15-49 had ever been tested for HIV prior to NFHS-4. Women in urban areas are somewhat more likely to have ever been tested for HIV prior to NFHS-4 than rural women. Only 8 percent of women who had a live birth in the past five years and received antenatal care (ANC) during pregnancy were tested for HIV during ANC. Urban women (17%) are more likely than rural women (7%) to have been tested for HIV during ANC.
Only 8 percent of women who had a live birth in the past five years and received ANC during pregnancy were tested for HIV during ANC.
In Assam, 5 percent of women and men have ever had a blood transfusion. Women and men are also equally likely to have received an injection in the past 12 months (32%). For more than nine in 10 men (92%) and 80 percent of women who received an injection in the past 12 months, a disposable syringe was used. SEXUAL BEHAVIOUR NFHS-4 included questions on respondents’ sexual behaviour. Respondents were asked about their age at first sex, their current and previous sexual partners, higher-risk intercourse, and condom use. In addition, men were asked whether they had paid for sex in the past year. These questions are sensitive and subject to reporting bias, so the results should be interpreted with caution.
Higher-risk behaviourHigher-risk sex is sexual intercourse with someone who is neither a spouse nor a cohabiting partner. Among those who had sex in the past 12 months, 2 percent of men and only 0.2 percent of women in Assam reported having had higher-risk sex in the past 12 months. The percentage of men who had higher-risk sexual intercourse in the past 12 months is about the same in urban and rural areas. Less than 1 percent of men said they had paid for sex in the past year.
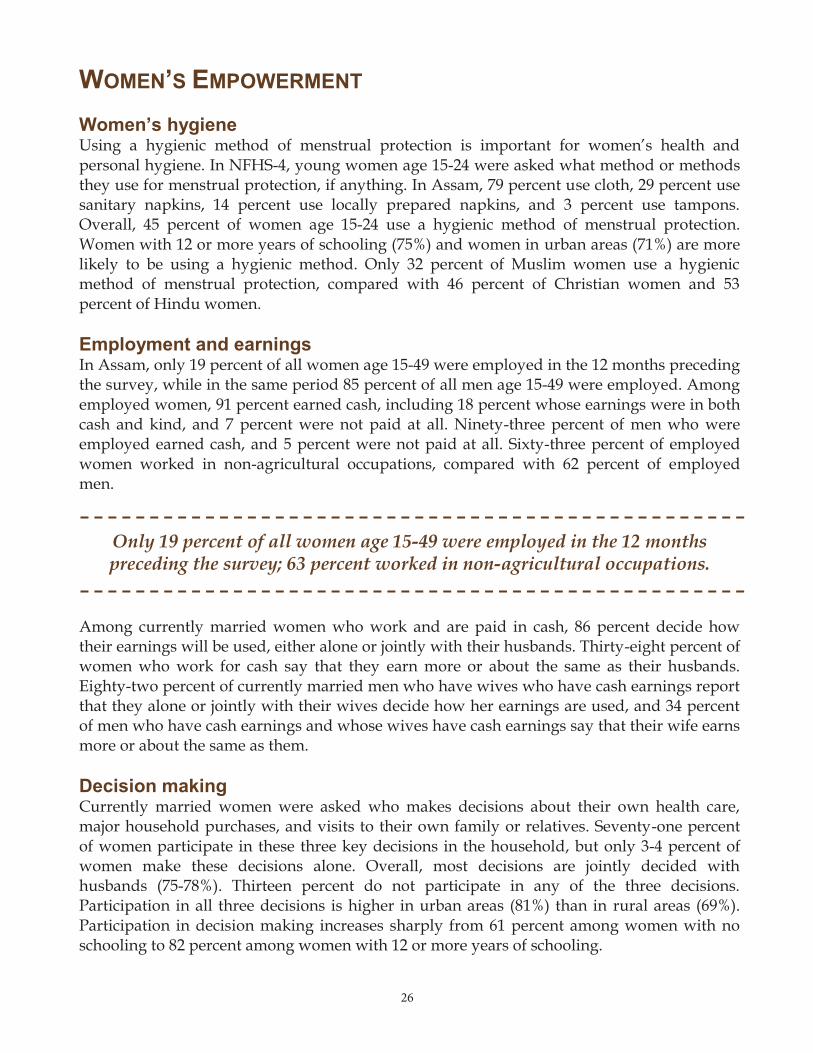
2626
WOMEN’S EMPOWERMENT Women’s hygiene Using a hygienic method of menstrual protection is important for women’s health and personal hygiene. In NFHS-4, young women age 15-24 were asked what method or methods they use for menstrual protection, if anything. In Assam, 79 percent use cloth, 29 percent use sanitary napkins, 14 percent use locally prepared napkins, and 3 percent use tampons. Overall, 45 percent of women age 15-24 use a hygienic method of menstrual protection. Women with 12 or more years of schooling (75%) and women in urban areas (71%) are more likely to be using a hygienic method. Only 32 percent of Muslim women use a hygienic method of menstrual protection, compared with 46 percent of Christian women and 53 percent of Hindu women. Employment and earningsIn Assam, only 19 percent of all women age 15-49 were employed in the 12 months preceding the survey, while in the same period 85 percent of all men age 15-49 were employed. Among employed women, 91 percent earned cash, including 18 percent whose earnings were in both cash and kind, and 7 percent were not paid at all. Ninety-three percent of men who were employed earned cash, and 5 percent were not paid at all. Sixty-three percent of employed women worked in non-agricultural occupations, compared with 62 percent of employed men.
Only 19 percent of all women age 15-49 were employed in the 12 monthspreceding the survey; 63 percent worked in non-agricultural occupations.
Among currently married women who work and are paid in cash, 86 percent decide how their earnings will be used, either alone or jointly with their husbands. Thirty-eight percent of women who work for cash say that they earn more or about the same as their husbands. Eighty-two percent of currently married men who have wives who have cash earnings report that they alone or jointly with their wives decide how her earnings are used, and 34 percent of men who have cash earnings and whose wives have cash earnings say that their wife earns more or about the same as them. Decision makingCurrently married women were asked who makes decisions about their own health care, major household purchases, and visits to their own family or relatives. Seventy-one percent of women participate in these three key decisions in the household, but only 3-4 percent of women make these decisions alone. Overall, most decisions are jointly decided with husbands (75-78%). Thirteen percent do not participate in any of the three decisions. Participation in all three decisions is higher in urban areas (81%) than in rural areas (69%). Participation in decision making increases sharply from 61 percent among women with no schooling to 82 percent among women with 12 or more years of schooling.
27
Currently married men were also asked who makes decisions about their own health care and major household purchases. Men were much more likely than women to report that they alone or jointly with their wife participate in both these decisions: 86 percent in making decisions about their own health care and 97 percent in making decisions about major household purchases, while 2 percent did not participate in either of these decisions. Other indicators of women’s empowermentOne-fourth of women in Assam say they have some money that they can decide how to use. The proportion of women with money which they control is higher among urban (31%) than rural (24%) women, increases sharply with age, and is highest among women with 12 or more years of schooling (36%) and women who are employed for cash (54%) than any other group of women.
Forty-five percent of women have a bank or savings account that they themselves use.
Forty-five percent of women have a bank or savings account that they themselves use. This percentage is highest, at 73 percent, among women who have 12 or more years of schooling. Women’s knowledge and use of microcredit programmes is not very widespread; only 37 percent of women know of a microcredit programme in the area and just 6 percent have ever taken a loan from a microcredit programme. Only 35 percent of women are allowed to go by themselves to all three of the following places: the market, a health facility, and places outside the village/community. Women are more likely to be allowed to go to all three places alone if they are age 40-49 (47%), employed (49%), and especially if they are employed for cash (51%). Ownership of assetsAbout half (52%) of women and 84 percent of men in Assam own a house alone or jointly with someone else, and 45 percent of women and 78 percent of men own land alone or jointly with someone else. Ownership of both a house and land is higher in rural than urban areas, and it increases with age.
Fifty-two percent of women own a house alone or jointly with someone else, and 45 percent own land alone or jointly with someone else.
Forty-six percent of women have a mobile phone that they themselves use, and among women who have a mobile phone that they themselves use, 76 percent can read SMS messages. Seventy-one percent of urban women have a mobile phone they themselves use, compared with 41 percent of rural women. Having a mobile phone that they themselves use is more common among women age 20-34 (more than 50%), Hindus (51%), and those with 12
2726
WOMEN’S EMPOWERMENT Women’s hygiene Using a hygienic method of menstrual protection is important for women’s health and personal hygiene. In NFHS-4, young women age 15-24 were asked what method or methods they use for menstrual protection, if anything. In Assam, 79 percent use cloth, 29 percent use sanitary napkins, 14 percent use locally prepared napkins, and 3 percent use tampons. Overall, 45 percent of women age 15-24 use a hygienic method of menstrual protection. Women with 12 or more years of schooling (75%) and women in urban areas (71%) are more likely to be using a hygienic method. Only 32 percent of Muslim women use a hygienic method of menstrual protection, compared with 46 percent of Christian women and 53 percent of Hindu women. Employment and earningsIn Assam, only 19 percent of all women age 15-49 were employed in the 12 months preceding the survey, while in the same period 85 percent of all men age 15-49 were employed. Among employed women, 91 percent earned cash, including 18 percent whose earnings were in both cash and kind, and 7 percent were not paid at all. Ninety-three percent of men who were employed earned cash, and 5 percent were not paid at all. Sixty-three percent of employed women worked in non-agricultural occupations, compared with 62 percent of employed men.
Only 19 percent of all women age 15-49 were employed in the 12 monthspreceding the survey; 63 percent worked in non-agricultural occupations.
Among currently married women who work and are paid in cash, 86 percent decide how their earnings will be used, either alone or jointly with their husbands. Thirty-eight percent of women who work for cash say that they earn more or about the same as their husbands. Eighty-two percent of currently married men who have wives who have cash earnings report that they alone or jointly with their wives decide how her earnings are used, and 34 percent of men who have cash earnings and whose wives have cash earnings say that their wife earns more or about the same as them. Decision makingCurrently married women were asked who makes decisions about their own health care, major household purchases, and visits to their own family or relatives. Seventy-one percent of women participate in these three key decisions in the household, but only 3-4 percent of women make these decisions alone. Overall, most decisions are jointly decided with husbands (75-78%). Thirteen percent do not participate in any of the three decisions. Participation in all three decisions is higher in urban areas (81%) than in rural areas (69%). Participation in decision making increases sharply from 61 percent among women with no schooling to 82 percent among women with 12 or more years of schooling.
27
Currently married men were also asked who makes decisions about their own health care and major household purchases. Men were much more likely than women to report that they alone or jointly with their wife participate in both these decisions: 86 percent in making decisions about their own health care and 97 percent in making decisions about major household purchases, while 2 percent did not participate in either of these decisions. Other indicators of women’s empowermentOne-fourth of women in Assam say they have some money that they can decide how to use. The proportion of women with money which they control is higher among urban (31%) than rural (24%) women, increases sharply with age, and is highest among women with 12 or more years of schooling (36%) and women who are employed for cash (54%) than any other group of women.
Forty-five percent of women have a bank or savings account that they themselves use.
Forty-five percent of women have a bank or savings account that they themselves use. This percentage is highest, at 73 percent, among women who have 12 or more years of schooling. Women’s knowledge and use of microcredit programmes is not very widespread; only 37 percent of women know of a microcredit programme in the area and just 6 percent have ever taken a loan from a microcredit programme. Only 35 percent of women are allowed to go by themselves to all three of the following places: the market, a health facility, and places outside the village/community. Women are more likely to be allowed to go to all three places alone if they are age 40-49 (47%), employed (49%), and especially if they are employed for cash (51%). Ownership of assetsAbout half (52%) of women and 84 percent of men in Assam own a house alone or jointly with someone else, and 45 percent of women and 78 percent of men own land alone or jointly with someone else. Ownership of both a house and land is higher in rural than urban areas, and it increases with age.
Fifty-two percent of women own a house alone or jointly with someone else, and 45 percent own land alone or jointly with someone else.
Forty-six percent of women have a mobile phone that they themselves use, and among women who have a mobile phone that they themselves use, 76 percent can read SMS messages. Seventy-one percent of urban women have a mobile phone they themselves use, compared with 41 percent of rural women. Having a mobile phone that they themselves use is more common among women age 20-34 (more than 50%), Hindus (51%), and those with 12
28 29
Nearly one-fourth (24%) of women age 15-49 Assam have experienced physical or sexual violence.
Violence during pregnancy In Assam, 2 percent of women who have ever been pregnant had ever experienced physical violence during one or more of their pregnancies. Spousal violence Twenty-one percent of ever-married women report having been slapped by their husband; from 5-11 percent report being pushed, shaken, or having something thrown at them; having their arm twisted or hair pulled; being punched; or being kicked, dragged, or beaten up. One percent each have experienced being choked or burned on purpose and being threatened or attacked with a knife, gun, or any other weapon. Four percent report that their husbands have physically forced them to have sex even when they did not want to, and 3 percent report that their husband forced them with threats or other ways to perform sexual acts they did not want to perform. Overall, 25 percent of ever-married women have experienced spousal physical or sexual violence. Eleven percent report having ever experienced spousal emotional violence, and 9 percent report having experienced emotional violence often or sometimes in the past 12 months. Few ever-married women (3%) say they have ever initiated violence against their husband. Although the prevalence of spousal violence is lower among more educated women, 10 percent of women who have at least 12 years of schooling have experienced physical or sexual spousal violence. Spousal violence is more common in rural areas (26%) than in urban areas (16%). The contextual and intergenerational aspects of spousal violence are clear from the fact that women whose mothers were beaten by their fathers are more than three times as likely to be in abusive marriages themselves. Women whose husbands consume alcohol are much more likely than women whose husbands do not consume alcohol to experience spousal violence, especially if the husband often gets drunk (55%). However, even among women whose husbands do not drink alcohol, 19 per-cent have experienced physical or sexual violence. In fact, more than half (54%) of ever-married women who experienced spousal violence (emotional, physical, or sexual) are afraid of their husbands most of the time.
28
or more years of schooling (87%). Nearly all (99%) women with a mobile phone that they themselves use who have 12 or more years of schooling can read SMS messages, compared with only 9 percent of women with no schooling who have a mobile phone. Seventy-three percent of women with mobile phones in rural areas can read SMS messages.
Less than half (46%) of women in Assam have a mobile phone that they themselves use.
Gender-role attitudesIn Assam, a substantial proportion (40%) of women believe it is justifiable for a husband to beat his wife under some circumstances, more so among ever-married women (42%) than never married women (33%). Women are most likely to believe that wife beating is justified if a woman shows disrespect for her in-laws (27%), if she neglects the house or children (25%), and if she argues with her husband (24%). Thirty-seven percent of men say that wife beating is justified in some circumstances, especially if the wife argues with her husband (23%), he suspects her of being unfaithful (22%), or she neglects the house or children (20%). Even among women and men who have completed at least 12 years of schooling, 27 percent of women and 29 percent of men say that a husband is justified in beating his wife for one or more of the specified reasons. Nearly three-fifths (59%) of women and 56 percent of men believe that a woman is justified in refusing to have sex with her husband if she knows he has a sexually transmitted disease, if she knows the husband has sex with other women, and if she is tired or not in the mood. Women and men are equally likely to justify a woman refusing to have sex with her husband (71%) if she knows her husband has an STD. Women and men also closely agree that a woman is justified in refusing to have sex with her husband if she knows he has intercourse with other women (70% of women and 65% of men) or if she is tired or not in the mood (63% of women and 64% of men). A large majority of men, 74 percent, agree that if a wife refuses to have sex with her husband he does not have a right to get angry and reprimand her, refuse to give her financial support, use force to have sex even if she doesn’t want to, or have sex with another woman.
DOMESTIC VIOLENCE Among women age 15-49 in Assam, 23 percent have ever experienced physical violence and 5 percent have ever experienced sexual violence. In all, 24 percent of women have experienced physical or sexual violence. Among those who have experienced physical violence since age 15, the most common perpetrator for ever-married women was the husband and for never-married women, it was the mother/step-mother, the father/step-father, or a sister/brother.
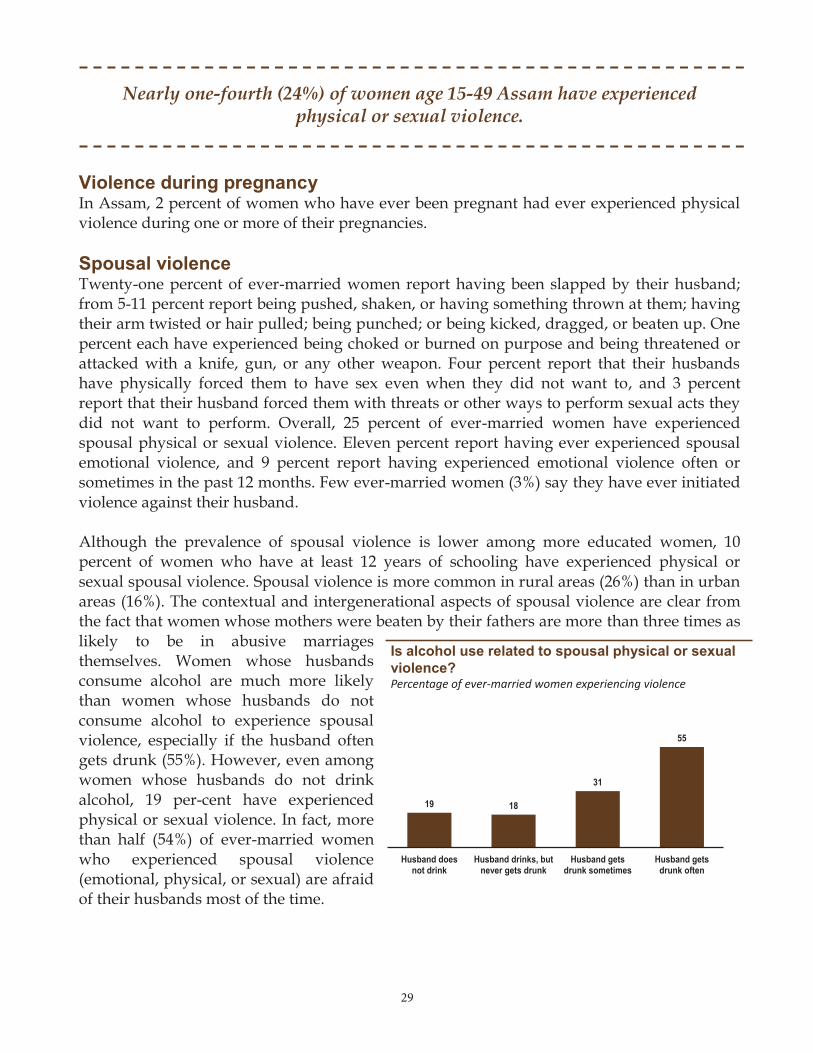
2929
Nearly one-fourth (24%) of women age 15-49 Assam have experienced physical or sexual violence.
Violence during pregnancy In Assam, 2 percent of women who have ever been pregnant had ever experienced physical violence during one or more of their pregnancies. Spousal violence Twenty-one percent of ever-married women report having been slapped by their husband; from 5-11 percent report being pushed, shaken, or having something thrown at them; having their arm twisted or hair pulled; being punched; or being kicked, dragged, or beaten up. One percent each have experienced being choked or burned on purpose and being threatened or attacked with a knife, gun, or any other weapon. Four percent report that their husbands have physically forced them to have sex even when they did not want to, and 3 percent report that their husband forced them with threats or other ways to perform sexual acts they did not want to perform. Overall, 25 percent of ever-married women have experienced spousal physical or sexual violence. Eleven percent report having ever experienced spousal emotional violence, and 9 percent report having experienced emotional violence often or sometimes in the past 12 months. Few ever-married women (3%) say they have ever initiated violence against their husband. Although the prevalence of spousal violence is lower among more educated women, 10 percent of women who have at least 12 years of schooling have experienced physical or sexual spousal violence. Spousal violence is more common in rural areas (26%) than in urban areas (16%). The contextual and intergenerational aspects of spousal violence are clear from the fact that women whose mothers were beaten by their fathers are more than three times as likely to be in abusive marriages themselves. Women whose husbands consume alcohol are much more likely than women whose husbands do not consume alcohol to experience spousal violence, especially if the husband often gets drunk (55%). However, even among women whose husbands do not drink alcohol, 19 per-cent have experienced physical or sexual violence. In fact, more than half (54%) of ever-married women who experienced spousal violence (emotional, physical, or sexual) are afraid of their husbands most of the time.
28
or more years of schooling (87%). Nearly all (99%) women with a mobile phone that they themselves use who have 12 or more years of schooling can read SMS messages, compared with only 9 percent of women with no schooling who have a mobile phone. Seventy-three percent of women with mobile phones in rural areas can read SMS messages.
Less than half (46%) of women in Assam have a mobile phone that they themselves use.
Gender-role attitudesIn Assam, a substantial proportion (40%) of women believe it is justifiable for a husband to beat his wife under some circumstances, more so among ever-married women (42%) than never married women (33%). Women are most likely to believe that wife beating is justified if a woman shows disrespect for her in-laws (27%), if she neglects the house or children (25%), and if she argues with her husband (24%). Thirty-seven percent of men say that wife beating is justified in some circumstances, especially if the wife argues with her husband (23%), he suspects her of being unfaithful (22%), or she neglects the house or children (20%). Even among women and men who have completed at least 12 years of schooling, 27 percent of women and 29 percent of men say that a husband is justified in beating his wife for one or more of the specified reasons. Nearly three-fifths (59%) of women and 56 percent of men believe that a woman is justified in refusing to have sex with her husband if she knows he has a sexually transmitted disease, if she knows the husband has sex with other women, and if she is tired or not in the mood. Women and men are equally likely to justify a woman refusing to have sex with her husband (71%) if she knows her husband has an STD. Women and men also closely agree that a woman is justified in refusing to have sex with her husband if she knows he has intercourse with other women (70% of women and 65% of men) or if she is tired or not in the mood (63% of women and 64% of men). A large majority of men, 74 percent, agree that if a wife refuses to have sex with her husband he does not have a right to get angry and reprimand her, refuse to give her financial support, use force to have sex even if she doesn’t want to, or have sex with another woman.
DOMESTIC VIOLENCE Among women age 15-49 in Assam, 23 percent have ever experienced physical violence and 5 percent have ever experienced sexual violence. In all, 24 percent of women have experienced physical or sexual violence. Among those who have experienced physical violence since age 15, the most common perpetrator for ever-married women was the husband and for never-married women, it was the mother/step-mother, the father/step-father, or a sister/brother.
19 18
31
55
Husband does not drink
Husband drinks, but never gets drunk
Husband gets drunk sometimes
Husband gets drunk often
Is alcohol use related to spousal physical or sexual violence?Percentage of ev er- m arried w om en ex p eriencing v iolence
19 18
31
55
Husband does not drink
Husband drinks, but never gets drunk
Husband gets drunk sometimes
Husband gets drunk often
Is alcohol use related to spousal physical or sexual violence?Percentage of ev er- m arried w om en ex p eriencing v iolence
3030
Nearly one-fifth (19%) of women who have ever experienced spousal physical or sexual violence have suffered injuries as a result of the violence, and among women who have experienced both physical and sexual violence, this proportion rises to 34 percent. The most common type of injury is cuts, bruises, or aches. Help seekingOnly 7 percent of women who have ever experienced physical or sexual violence by anyone have sought help. Over three-fourths (79%) of ever-married women and 74 percent of never married women have neither sought help nor told anyone about the violence. Fifty-seven percent of abused women who have sought help most often seek help from their own families. Only 9 percent of abused women who sought help for the violence sought help from the police and 1 percent from social service organizations.
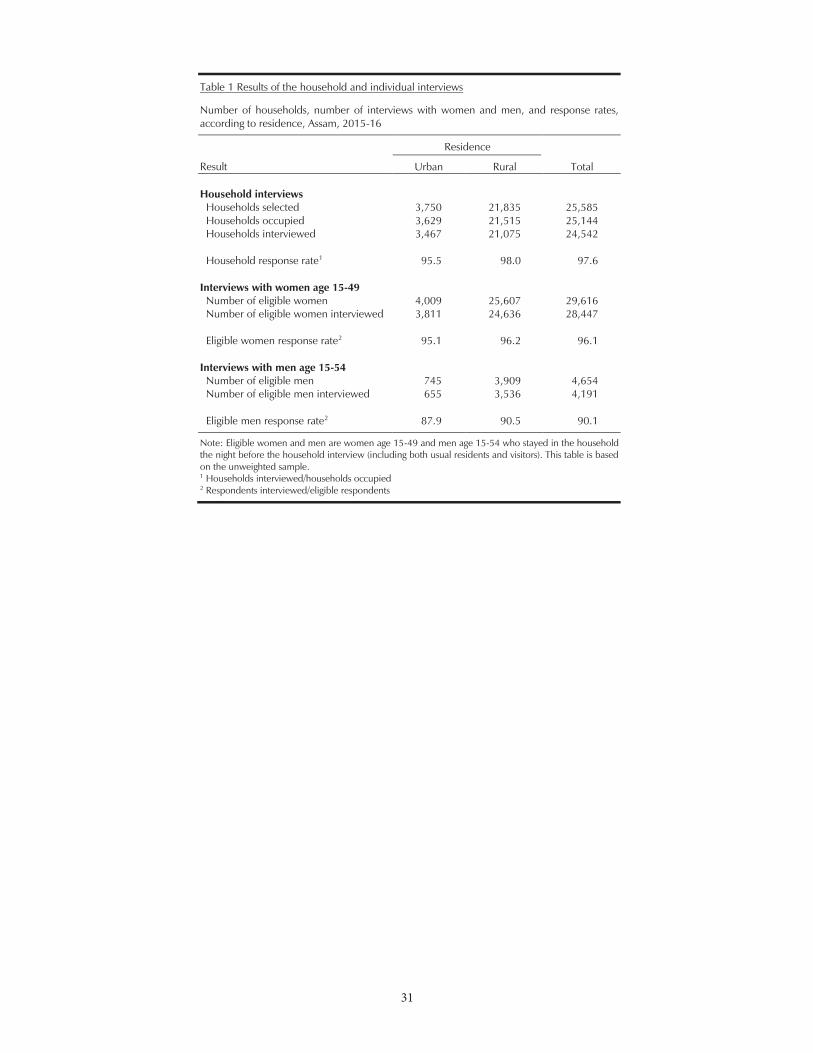
3130
Nearly one-fifth (19%) of women who have ever experienced spousal physical or sexual violence have suffered injuries as a result of the violence, and among women who have experienced both physical and sexual violence, this proportion rises to 34 percent. The most common type of injury is cuts, bruises, or aches. Help seekingOnly 7 percent of women who have ever experienced physical or sexual violence by anyone have sought help. Over three-fourths (79%) of ever-married women and 74 percent of never married women have neither sought help nor told anyone about the violence. Fifty-seven percent of abused women who have sought help most often seek help from their own families. Only 9 percent of abused women who sought help for the violence sought help from the police and 1 percent from social service organizations.
31
Table 1 Results of the household and individual interviews
Number of households, number of interviews with women and men, and response rates, according to residence, Assam, 2015-16
Result
Residence
Total Urban Rural Household interviews
Households selected 3,750 21,835 25,585 Households occupied 3,629 21,515 25,144 Households interviewed 3,467 21,075 24,542 Household response rate1 95.5 98.0 97.6
Interviews with women age 15-49 Number of eligible women 4,009 25,607 29,616 Number of eligible women interviewed 3,811 24,636 28,447 Eligible women response rate2 95.1 96.2 96.1
Interviews with men age 15-54 Number of eligible men 745 3,909 4,654 Number of eligible men interviewed 655 3,536 4,191 Eligible men response rate2 87.9 90.5 90.1
Note: Eligible women and men are women age 15-49 and men age 15-54 who stayed in the household the night before the household interview (including both usual residents and visitors). This table is based on the unweighted sample. 1 Households interviewed/households occupied 2 Respondents interviewed/eligible respondents
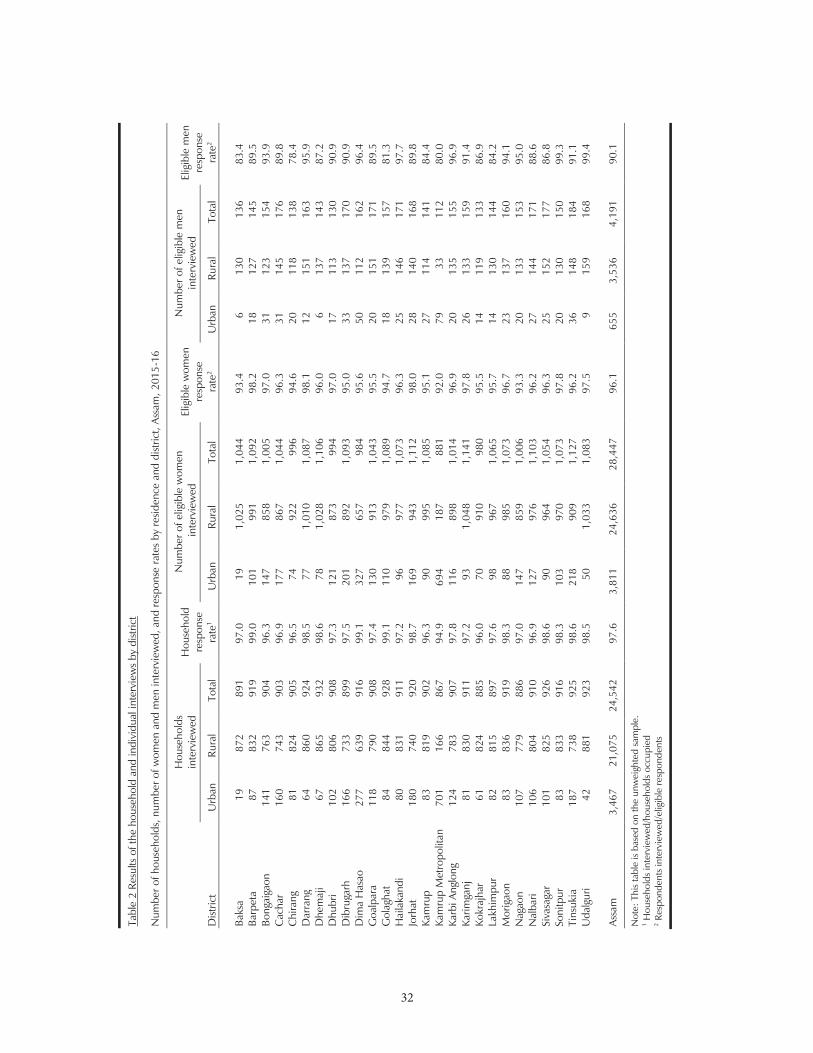
32
32
Tabl
e 2
Resu
lts o
f the
hou
seho
ld a
nd in
divi
dual
inte
rvie
ws
by d
istric
t
Num
ber o
f hou
seho
lds,
num
ber o
f wom
en a
nd m
en in
terv
iew
ed, a
nd re
spon
se ra
tes
by re
siden
ce a
nd d
istric
t, As
sam
, 201
5-16
Dist
rict
Hou
seho
lds
in
terv
iew
ed
Hou
seho
ld
resp
onse
ra
te1
Num
ber o
f elig
ible
wom
en
inte
rvie
wed
Elig
ible
wom
en
resp
onse
ra
te2
Num
ber o
f elig
ible
men
in
terv
iew
ed
Elig
ible
men
re
spon
se
rate
2 U
rban
Ru
ral
Tota
l U
rban
Ru
ral
Tota
l U
rban
Ru
ral
Tota
l
Baks
a 19
87
2 89
1 97
.0
19
1,02
5 1,
044
93.4
6
130
136
83.4
Ba
rpet
a 87
83
2 91
9 99
.0
101
991
1,09
2 98
.2
18
127
145
89.5
Bo
ngai
gaon
14
1 76
3 90
4 96
.3
147
858
1,00
5 97
.0
31
123
154
93.9
C
acha
r 16
0 74
3 90
3 96
.9
177
867
1,04
4 96
.3
31
145
176
89.8
C
hira
ng
81
824
905
96.5
74
92
2 99
6 94
.6
20
118
138
78.4
D
arra
ng
64
860
924
98.5
77
1,
010
1,08
7 98
.1
12
151
163
95.9
D
hem
aji
67
865
932
98.6
78
1,
028
1,10
6 96
.0
6 13
7 14
3 87
.2
Dhu
bri
102
806
908
97.3
12
1 87
3 99
4 97
.0
17
113
130
90.9
D
ibru
garh
16
6 73
3 89
9 97
.5
201
892
1,09
3 95
.0
33
137
170
90.9
D
ima
Has
ao
277
639
916
99.1
32
7 65
7 98
4 95
.6
50
112
162
96.4
G
oalp
ara
118
790
908
97.4
13
0 91
3 1,
043
95.5
20
15
1 17
1 89
.5
Gol
agha
t 84
84
4 92
8 99
.1
110
979
1,08
9 94
.7
18
139
157
81.3
H
aila
kand
i 80
83
1 91
1 97
.2
96
977
1,07
3 96
.3
25
146
171
97.7
Jo
rhat
18
0 74
0 92
0 98
.7
169
943
1,11
2 98
.0
28
140
168
89.8
Ka
mru
p 83
81
9 90
2 96
.3
90
995
1,08
5 95
.1
27
114
141
84.4
Ka
mru
p M
etro
polit
an
701
166
867
94.9
69
4 18
7 88
1 92
.0
79
33
112
80.0
Ka
rbi A
nglo
ng
124
783
907
97.8
11
6 89
8 1,
014
96.9
20
13
5 15
5 96
.9
Karim
ganj
81
83
0 91
1 97
.2
93
1,04
8 1,
141
97.8
26
13
3 15
9 91
.4
Kokr
ajha
r 61
82
4 88
5 96
.0
70
910
980
95.5
14
11
9 13
3 86
.9
Lakh
impu
r 82
81
5 89
7 97
.6
98
967
1,06
5 95
.7
14
130
144
84.2
M
orig
aon
83
836
919
98.3
88
98
5 1,
073
96.7
23
13
7 16
0 94
.1
Nag
aon
107
779
886
97.0
14
7 85
9 1,
006
93.3
20
13
3 15
3 95
.0
Nal
bari
106
804
910
96.9
12
7 97
6 1,
103
96.2
27
14
4 17
1 88
.6
Siva
saga
r 10
1 82
5 92
6 98
.6
90
964
1,05
4 96
.3
25
152
177
86.8
So
nitp
ur
83
833
916
98.3
10
3 97
0 1,
073
97.8
20
13
0 15
0 99
.3
Tins
ukia
18
7 73
8 92
5 98
.6
218
909
1,12
7 96
.2
36
148
184
91.1
U
dalg
uri
42
881
923
98.5
50
1,
033
1,08
3 97
.5
9 15
9 16
8 99
.4
As
sam
3,
467
21,0
75
24,5
42
97.6
3,
811
24,6
36
28,4
47
96.1
65
5 3,
536
4,19
1 90
.1
Not
e: T
his
tabl
e is
base
d on
the
unw
eigh
ted
sam
ple.
1 H
ouse
hold
s in
terv
iew
ed/h
ouse
hold
s oc
cupi
ed
2 Res
pond
ents
inte
rvie
wed
/elig
ible
resp
onde
nts
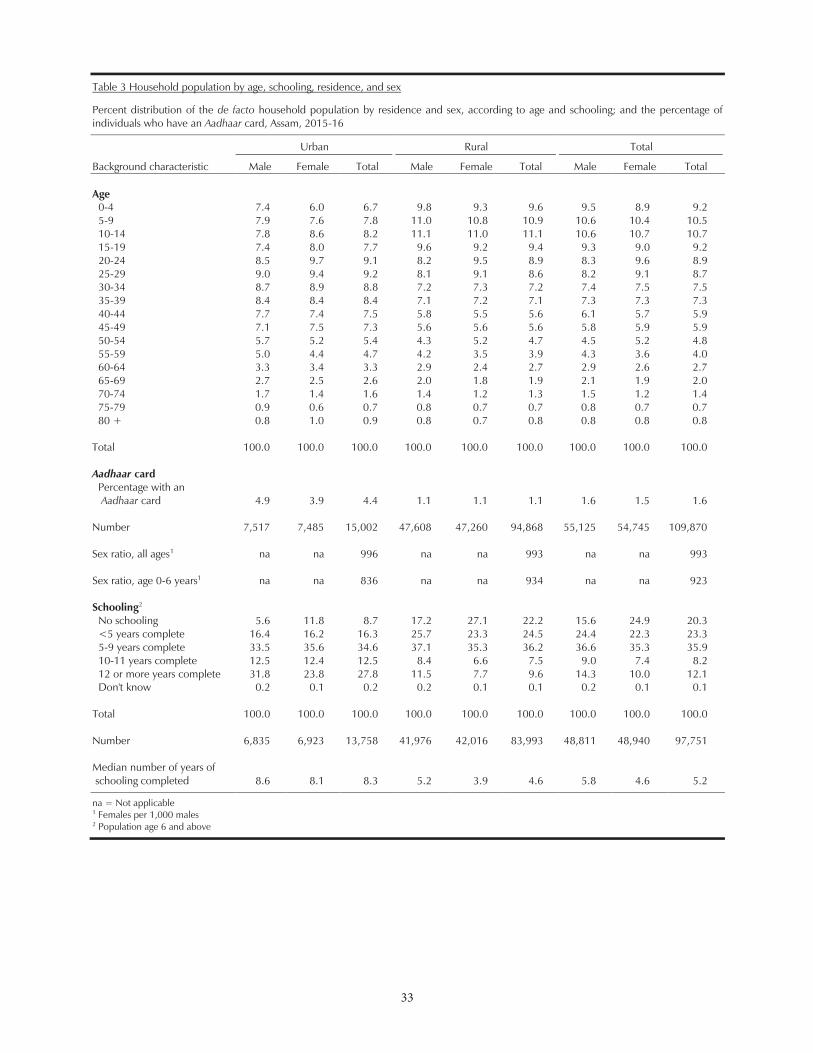
33
33
Table 3 Household population by age, schooling, residence, and sex
Percent distribution of the de facto household population by residence and sex, according to age and schooling; and the percentage of individuals who have an Aadhaar card, Assam, 2015-16
Background characteristic
Urban
Rural
Total
Male Female Total Male Female Total Male Female Total Age
0-4 7.4 6.0 6.7 9.8 9.3 9.6 9.5 8.9 9.2 5-9 7.9 7.6 7.8 11.0 10.8 10.9 10.6 10.4 10.5 10-14 7.8 8.6 8.2 11.1 11.0 11.1 10.6 10.7 10.7 15-19 7.4 8.0 7.7 9.6 9.2 9.4 9.3 9.0 9.2 20-24 8.5 9.7 9.1 8.2 9.5 8.9 8.3 9.6 8.9 25-29 9.0 9.4 9.2 8.1 9.1 8.6 8.2 9.1 8.7 30-34 8.7 8.9 8.8 7.2 7.3 7.2 7.4 7.5 7.5 35-39 8.4 8.4 8.4 7.1 7.2 7.1 7.3 7.3 7.3 40-44 7.7 7.4 7.5 5.8 5.5 5.6 6.1 5.7 5.9 45-49 7.1 7.5 7.3 5.6 5.6 5.6 5.8 5.9 5.9 50-54 5.7 5.2 5.4 4.3 5.2 4.7 4.5 5.2 4.8 55-59 5.0 4.4 4.7 4.2 3.5 3.9 4.3 3.6 4.0 60-64 3.3 3.4 3.3 2.9 2.4 2.7 2.9 2.6 2.7 65-69 2.7 2.5 2.6 2.0 1.8 1.9 2.1 1.9 2.0 70-74 1.7 1.4 1.6 1.4 1.2 1.3 1.5 1.2 1.4 75-79 0.9 0.6 0.7 0.8 0.7 0.7 0.8 0.7 0.7 80 + 0.8 1.0 0.9 0.8 0.7 0.8 0.8 0.8 0.8
Total 100.0 100.0 100.0 100.0 100.0 100.0 100.0 100.0 100.0 Aadhaar card
Percentage with an Aadhaar card 4.9 3.9 4.4 1.1 1.1 1.1 1.6 1.5 1.6
Number 7,517 7,485 15,002 47,608 47,260 94,868 55,125 54,745 109,870 Sex ratio, all ages1 na na 996 na na 993 na na 993 Sex ratio, age 0-6 years1 na na 836 na na 934 na na 923 Schooling2
No schooling 5.6 11.8 8.7 17.2 27.1 22.2 15.6 24.9 20.3 <5 years complete 16.4 16.2 16.3 25.7 23.3 24.5 24.4 22.3 23.3 5-9 years complete 33.5 35.6 34.6 37.1 35.3 36.2 36.6 35.3 35.9 10-11 years complete 12.5 12.4 12.5 8.4 6.6 7.5 9.0 7.4 8.2 12 or more years complete 31.8 23.8 27.8 11.5 7.7 9.6 14.3 10.0 12.1 Don't know 0.2 0.1 0.2 0.2 0.1 0.1 0.2 0.1 0.1
Total 100.0 100.0 100.0 100.0 100.0 100.0 100.0 100.0 100.0 Number 6,835 6,923 13,758 41,976 42,016 83,993 48,811 48,940 97,751 Median number of years of schooling completed 8.6 8.1 8.3 5.2 3.9 4.6 5.8 4.6 5.2
na = Not applicable 1 Females per 1,000 males 2 Population age 6 and above
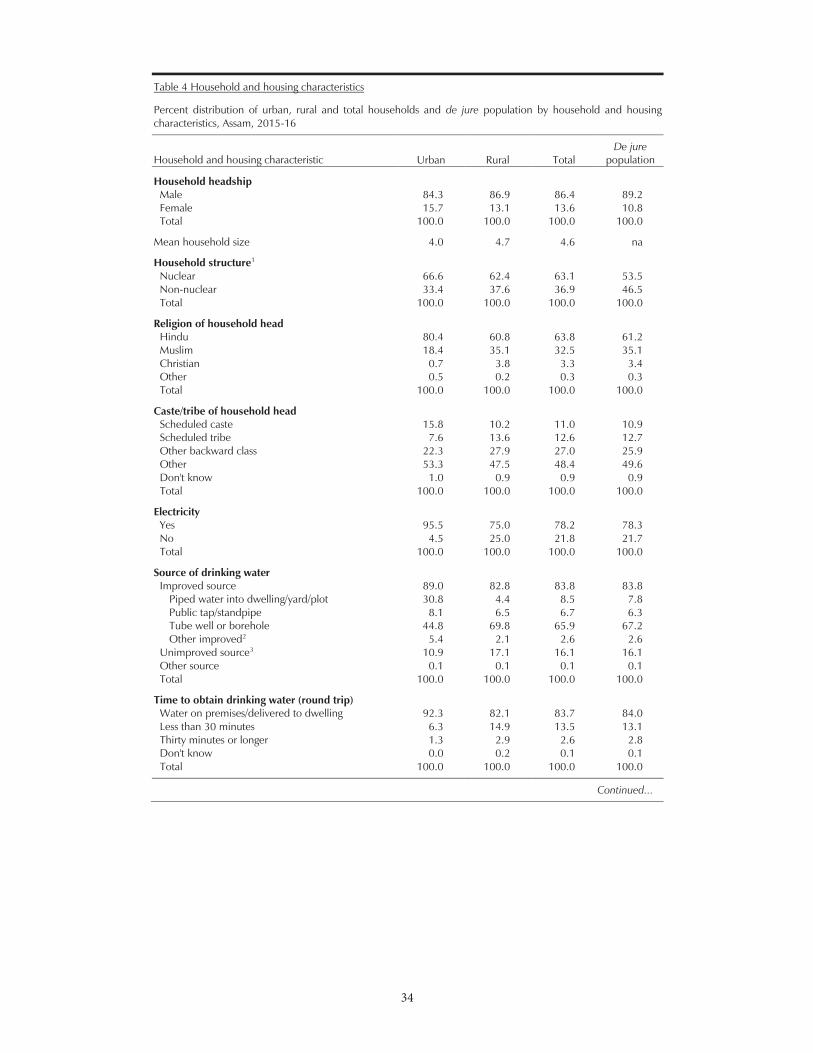
34
34
Table 4 Household and housing characteristics
Percent distribution of urban, rural and total households and de jure population by household and housing characteristics, Assam, 2015-16
Household and housing characteristic Urban Rural Total De jure
population
Household headship Male 84.3 86.9 86.4 89.2 Female 15.7 13.1 13.6 10.8 Total 100.0 100.0 100.0 100.0
Mean household size 4.0 4.7 4.6 na
Household structure1 Nuclear 66.6 62.4 63.1 53.5 Non-nuclear 33.4 37.6 36.9 46.5 Total 100.0 100.0 100.0 100.0
Religion of household head Hindu 80.4 60.8 63.8 61.2 Muslim 18.4 35.1 32.5 35.1 Christian 0.7 3.8 3.3 3.4 Other 0.5 0.2 0.3 0.3 Total 100.0 100.0 100.0 100.0
Caste/tribe of household head Scheduled caste 15.8 10.2 11.0 10.9 Scheduled tribe 7.6 13.6 12.6 12.7 Other backward class 22.3 27.9 27.0 25.9 Other 53.3 47.5 48.4 49.6 Don't know 1.0 0.9 0.9 0.9 Total 100.0 100.0 100.0 100.0
Electricity Yes 95.5 75.0 78.2 78.3 No 4.5 25.0 21.8 21.7 Total 100.0 100.0 100.0 100.0
Source of drinking water Improved source 89.0 82.8 83.8 83.8
Piped water into dwelling/yard/plot 30.8 4.4 8.5 7.8 Public tap/standpipe 8.1 6.5 6.7 6.3 Tube well or borehole 44.8 69.8 65.9 67.2 Other improved2 5.4 2.1 2.6 2.6
Unimproved source3 10.9 17.1 16.1 16.1 Other source 0.1 0.1 0.1 0.1 Total 100.0 100.0 100.0 100.0
Time to obtain drinking water (round trip) Water on premises/delivered to dwelling 92.3 82.1 83.7 84.0 Less than 30 minutes 6.3 14.9 13.5 13.1 Thirty minutes or longer 1.3 2.9 2.6 2.8 Don't know 0.0 0.2 0.1 0.1 Total 100.0 100.0 100.0 100.0
Continued...
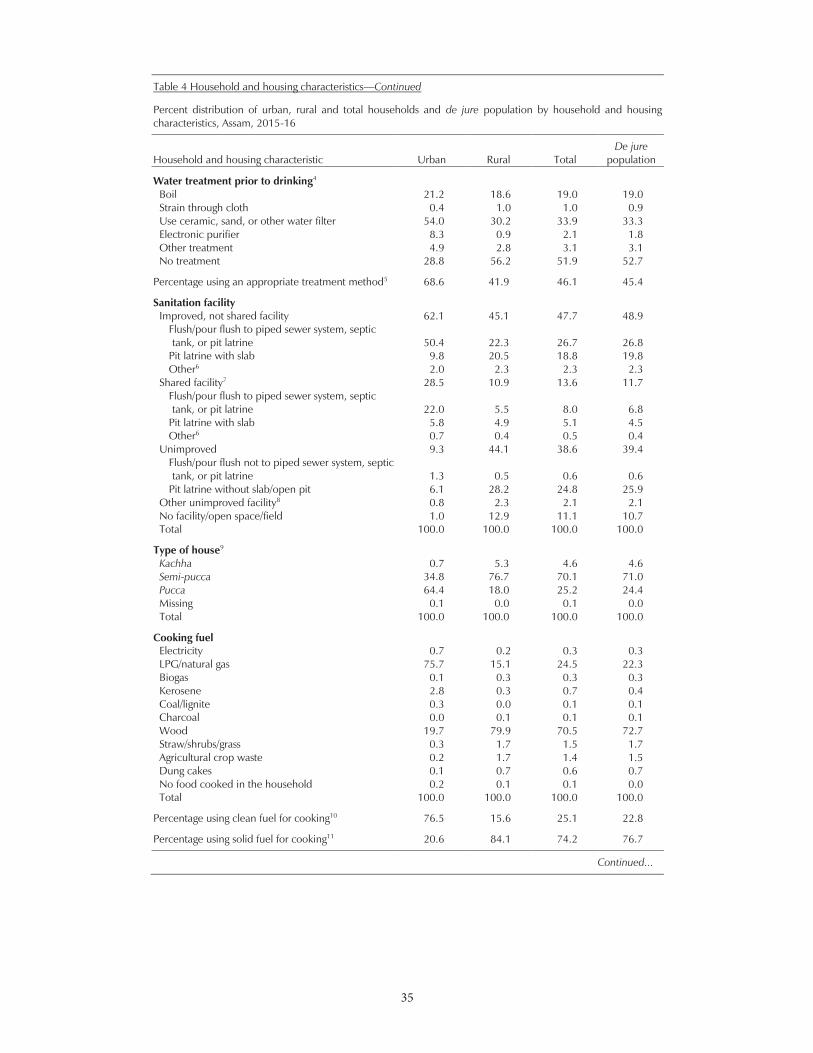
35
35
Table 4 Household and housing characteristics—Continued
Percent distribution of urban, rural and total households and de jure population by household and housing characteristics, Assam, 2015-16
Household and housing characteristic Urban Rural Total De jure
population
Water treatment prior to drinking4 Boil 21.2 18.6 19.0 19.0 Strain through cloth 0.4 1.0 1.0 0.9 Use ceramic, sand, or other water filter 54.0 30.2 33.9 33.3 Electronic purifier 8.3 0.9 2.1 1.8 Other treatment 4.9 2.8 3.1 3.1 No treatment 28.8 56.2 51.9 52.7
Percentage using an appropriate treatment method5 68.6 41.9 46.1 45.4
Sanitation facility Improved, not shared facility 62.1 45.1 47.7 48.9
Flush/pour flush to piped sewer system, septic tank, or pit latrine 50.4 22.3 26.7 26.8
Pit latrine with slab 9.8 20.5 18.8 19.8 Other6 2.0 2.3 2.3 2.3
Shared facility7 28.5 10.9 13.6 11.7 Flush/pour flush to piped sewer system, septic tank, or pit latrine 22.0 5.5 8.0 6.8
Pit latrine with slab 5.8 4.9 5.1 4.5 Other6 0.7 0.4 0.5 0.4
Unimproved 9.3 44.1 38.6 39.4 Flush/pour flush not to piped sewer system, septic tank, or pit latrine 1.3 0.5 0.6 0.6
Pit latrine without slab/open pit 6.1 28.2 24.8 25.9 Other unimproved facility8 0.8 2.3 2.1 2.1 No facility/open space/field 1.0 12.9 11.1 10.7 Total 100.0 100.0 100.0 100.0
Type of house9 Kachha 0.7 5.3 4.6 4.6 Semi-pucca 34.8 76.7 70.1 71.0 Pucca 64.4 18.0 25.2 24.4 Missing 0.1 0.0 0.1 0.0 Total 100.0 100.0 100.0 100.0
Cooking fuel Electricity 0.7 0.2 0.3 0.3 LPG/natural gas 75.7 15.1 24.5 22.3 Biogas 0.1 0.3 0.3 0.3 Kerosene 2.8 0.3 0.7 0.4 Coal/lignite 0.3 0.0 0.1 0.1 Charcoal 0.0 0.1 0.1 0.1 Wood 19.7 79.9 70.5 72.7 Straw/shrubs/grass 0.3 1.7 1.5 1.7 Agricultural crop waste 0.2 1.7 1.4 1.5 Dung cakes 0.1 0.7 0.6 0.7 No food cooked in the household 0.2 0.1 0.1 0.0 Total 100.0 100.0 100.0 100.0
Percentage using clean fuel for cooking10 76.5 15.6 25.1 22.8
Percentage using solid fuel for cooking11 20.6 84.1 74.2 76.7
Continued...
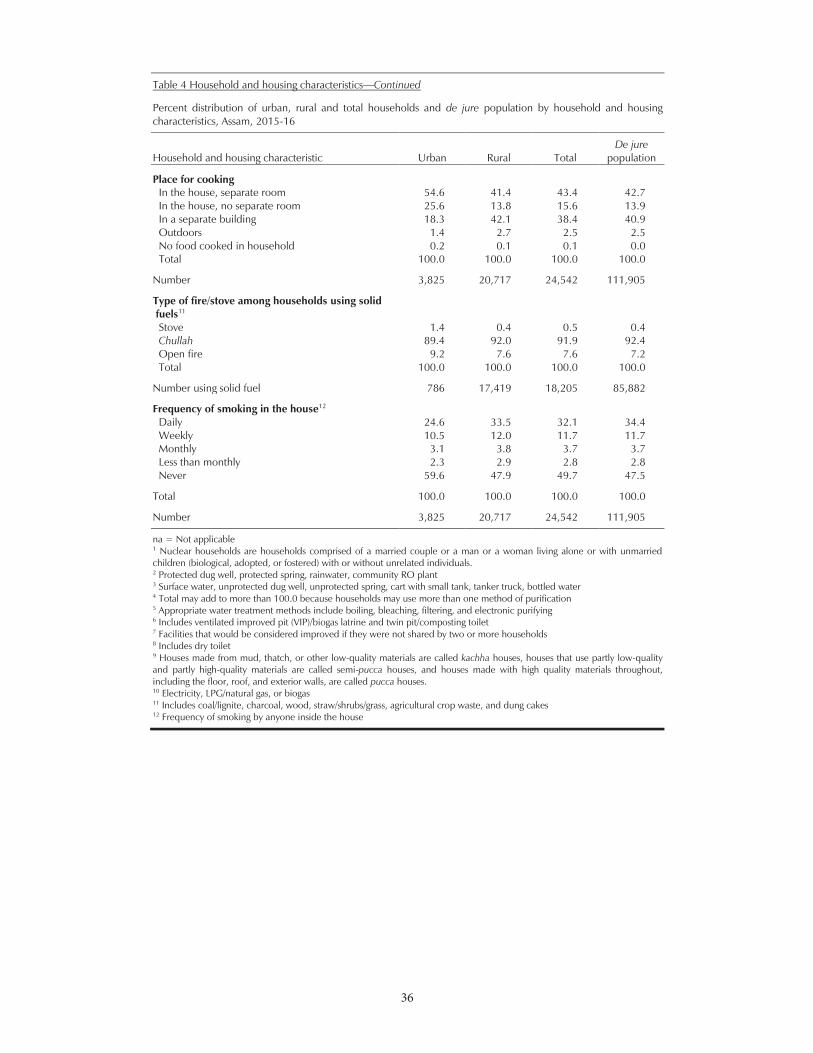
36
36
Table 4 Household and housing characteristics—Continued
Percent distribution of urban, rural and total households and de jure population by household and housing characteristics, Assam, 2015-16
Household and housing characteristic Urban Rural Total De jure
population
Place for cooking In the house, separate room 54.6 41.4 43.4 42.7 In the house, no separate room 25.6 13.8 15.6 13.9 In a separate building 18.3 42.1 38.4 40.9 Outdoors 1.4 2.7 2.5 2.5 No food cooked in household 0.2 0.1 0.1 0.0 Total 100.0 100.0 100.0 100.0
Number 3,825 20,717 24,542 111,905
Type of fire/stove among households using solid fuels11
Stove 1.4 0.4 0.5 0.4 Chullah 89.4 92.0 91.9 92.4 Open fire 9.2 7.6 7.6 7.2 Total 100.0 100.0 100.0 100.0
Number using solid fuel 786 17,419 18,205 85,882
Frequency of smoking in the house12 Daily 24.6 33.5 32.1 34.4 Weekly 10.5 12.0 11.7 11.7 Monthly 3.1 3.8 3.7 3.7 Less than monthly 2.3 2.9 2.8 2.8 Never 59.6 47.9 49.7 47.5
Total 100.0 100.0 100.0 100.0
Number 3,825 20,717 24,542 111,905
na = Not applicable 1 Nuclear households are households comprised of a married couple or a man or a woman living alone or with unmarried children (biological, adopted, or fostered) with or without unrelated individuals. 2 Protected dug well, protected spring, rainwater, community RO plant 3 Surface water, unprotected dug well, unprotected spring, cart with small tank, tanker truck, bottled water 4 Total may add to more than 100.0 because households may use more than one method of purification 5 Appropriate water treatment methods include boiling, bleaching, filtering, and electronic purifying 6 Includes ventilated improved pit (VIP)/biogas latrine and twin pit/composting toilet 7 Facilities that would be considered improved if they were not shared by two or more households 8 Includes dry toilet 9 Houses made from mud, thatch, or other low-quality materials are called kachha houses, houses that use partly low-quality and partly high-quality materials are called semi-pucca houses, and houses made with high quality materials throughout, including the floor, roof, and exterior walls, are called pucca houses. 10 Electricity, LPG/natural gas, or biogas 11 Includes coal/lignite, charcoal, wood, straw/shrubs/grass, agricultural crop waste, and dung cakes 12 Frequency of smoking by anyone inside the house

37
37
Table 5 Household possessions and land ownership
Percentage of urban, rural, and total households and de jure population possessing various household goods, means of transport, agricultural land, a house and farm animals and having a bank/post office account, health scheme/health insurance, a BPL card, and a long-lasting insecticide-treated (LLIN) mosquito net, Assam, 2015-16
Household possessions Urban Rural Total De jure
population
Household goods Mattress 95.2 79.2 81.7 81.5 Pressure cooker 83.0 36.1 43.4 43.0 Chair 96.4 93.6 94.1 94.7 Cot or bed 97.7 93.0 93.7 94.0 Table 95.0 89.0 89.9 90.9 Electric fan 91.2 58.4 63.6 64.1 Radio or transistor 6.9 4.3 4.7 4.8 Television (black and white) 2.0 1.3 1.4 1.5 Television (colour) 80.3 37.6 44.3 44.9 Any television 81.1 38.5 45.2 45.8 Sewing machine 20.8 6.8 9.0 9.5 Mobile telephone 96.1 85.9 87.4 89.5 Landline telephone 3.4 0.4 0.8 0.9 Internet 32.3 7.0 11.0 11.0 Computer 21.2 3.4 6.2 6.1 Refrigerator 36.1 6.0 10.7 10.8 Air conditioner/cooler 4.2 0.3 0.9 0.8 Washing machine 13.2 1.2 3.1 2.9 Watch or clock 87.3 67.9 71.0 72.1 Water pump 13.5 5.7 7.0 7.4 Thresher 0.2 0.3 0.3 0.3 Tractor 0.5 1.1 1.0 1.3 None of the above 0.1 1.0 0.9 0.7
Means of transport Bicycle 50.3 73.9 70.2 74.1 Motorcycle or scooter 37.8 16.5 19.8 21.0 Animal-drawn cart 0.5 0.4 0.5 0.5 Car 15.4 3.7 5.5 5.7 None of the above 27.2 23.1 23.7 20.6
Agricultural land No agricultural land 84.2 51.9 57.0 54.1 Agricultural land 15.8 48.1 43.0 45.9
Irrigated land only 0.9 4.7 4.1 4.6 Non-irrigated land only 13.4 39.6 35.5 37.5 Both irrigated and non-irrigated land 0.3 2.5 2.2 2.6 Irrigation not determined 1.2 1.2 1.2 1.2
Total 100.0 100.0 100.0 100.0
Percentage owning a house 85.2 87.5 87.2 87.7 Percentage owning farm animals1 17.2 76.0 66.8 71.5 Percentage having a bank account/post office account2 91.1 82.2 83.6 84.6 Percentage covered by a health scheme/health insurance3 12.5 10.0 10.4 10.8 Percentage having a BPL card 20.3 46.5 42.4 44.2 Percentage with an LLIN mosquito net 0.7 1.0 1.0 1.0
Number 3,825 20,717 24,542 111,905
BPL = Below poverty line 1 Cows, bulls, buffaloes, camels, horses, donkeys, mules, goats, sheep, chickens, or ducks 2 Percentage of households in which any usual member of the household has a bank account/post office account 3 Percentage of households in which any usual member of the household is covered by a health scheme/health insurance
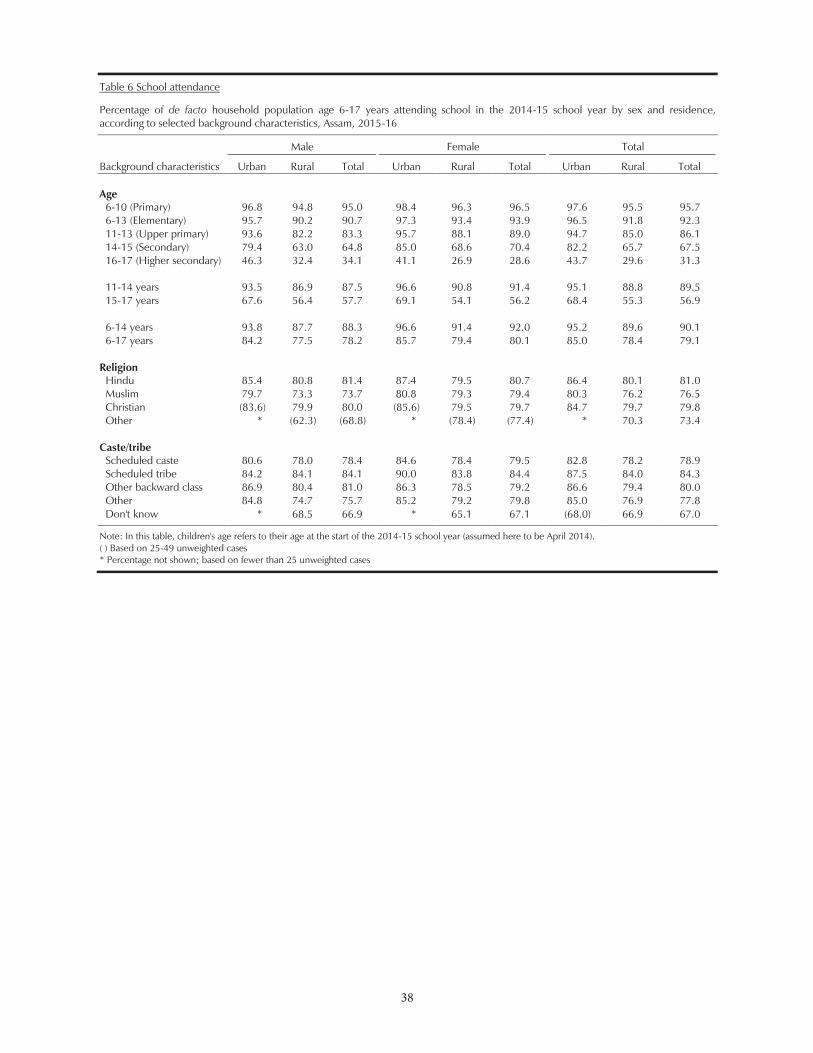
38
38
Table 6 School attendance
Percentage of de facto household population age 6-17 years attending school in the 2014-15 school year by sex and residence, according to selected background characteristics, Assam, 2015-16
Background characteristics
Male
Female
Total
Urban Rural Total Urban Rural Total Urban Rural Total Age
6-10 (Primary) 96.8 94.8 95.0 98.4 96.3 96.5 97.6 95.5 95.7 6-13 (Elementary) 95.7 90.2 90.7 97.3 93.4 93.9 96.5 91.8 92.3 11-13 (Upper primary) 93.6 82.2 83.3 95.7 88.1 89.0 94.7 85.0 86.1 14-15 (Secondary) 79.4 63.0 64.8 85.0 68.6 70.4 82.2 65.7 67.5 16-17 (Higher secondary) 46.3 32.4 34.1 41.1 26.9 28.6 43.7 29.6 31.3 11-14 years 93.5 86.9 87.5 96.6 90.8 91.4 95.1 88.8 89.5 15-17 years 67.6 56.4 57.7 69.1 54.1 56.2 68.4 55.3 56.9 6-14 years 93.8 87.7 88.3 96.6 91.4 92.0 95.2 89.6 90.1 6-17 years 84.2 77.5 78.2 85.7 79.4 80.1 85.0 78.4 79.1
Religion
Hindu 85.4 80.8 81.4 87.4 79.5 80.7 86.4 80.1 81.0 Muslim 79.7 73.3 73.7 80.8 79.3 79.4 80.3 76.2 76.5 Christian (83.6) 79.9 80.0 (85.6) 79.5 79.7 84.7 79.7 79.8 Other * (62.3) (68.8) * (78.4) (77.4) * 70.3 73.4
Caste/tribe Scheduled caste 80.6 78.0 78.4 84.6 78.4 79.5 82.8 78.2 78.9 Scheduled tribe 84.2 84.1 84.1 90.0 83.8 84.4 87.5 84.0 84.3 Other backward class 86.9 80.4 81.0 86.3 78.5 79.2 86.6 79.4 80.0 Other 84.8 74.7 75.7 85.2 79.2 79.8 85.0 76.9 77.8 Don't know * 68.5 66.9 * 65.1 67.1 (68.0) 66.9 67.0
Note: In this table, children's age refers to their age at the start of the 2014-15 school year (assumed here to be April 2014). ( ) Based on 25-49 unweighted cases * Percentage not shown; based on fewer than 25 unweighted cases
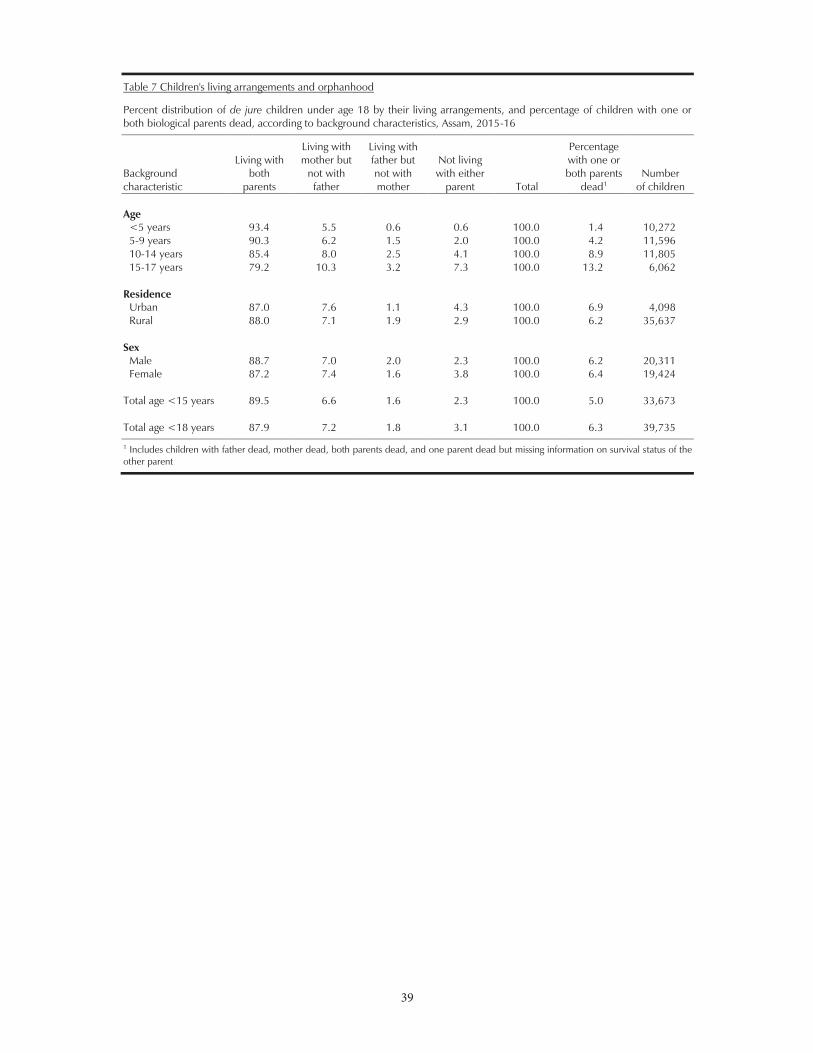
39
39
Table 7 Children's living arrangements and orphanhood
Percent distribution of de jure children under age 18 by their living arrangements, and percentage of children with one or both biological parents dead, according to background characteristics, Assam, 2015-16
Background characteristic
Living with both
parents
Living with mother but
not with father
Living with father but not with mother
Not living with either
parent Total
Percentage with one or both parents
dead1 Number
of children Age
<5 years 93.4 5.5 0.6 0.6 100.0 1.4 10,272 5-9 years 90.3 6.2 1.5 2.0 100.0 4.2 11,596 10-14 years 85.4 8.0 2.5 4.1 100.0 8.9 11,805 15-17 years 79.2 10.3 3.2 7.3 100.0 13.2 6,062
Residence Urban 87.0 7.6 1.1 4.3 100.0 6.9 4,098 Rural 88.0 7.1 1.9 2.9 100.0 6.2 35,637
Sex Male 88.7 7.0 2.0 2.3 100.0 6.2 20,311 Female 87.2 7.4 1.6 3.8 100.0 6.4 19,424
Total age <15 years 89.5 6.6 1.6 2.3 100.0 5.0 33,673 Total age <18 years 87.9 7.2 1.8 3.1 100.0 6.3 39,735
1 Includes children with father dead, mother dead, both parents dead, and one parent dead but missing information on survival status of the other parent
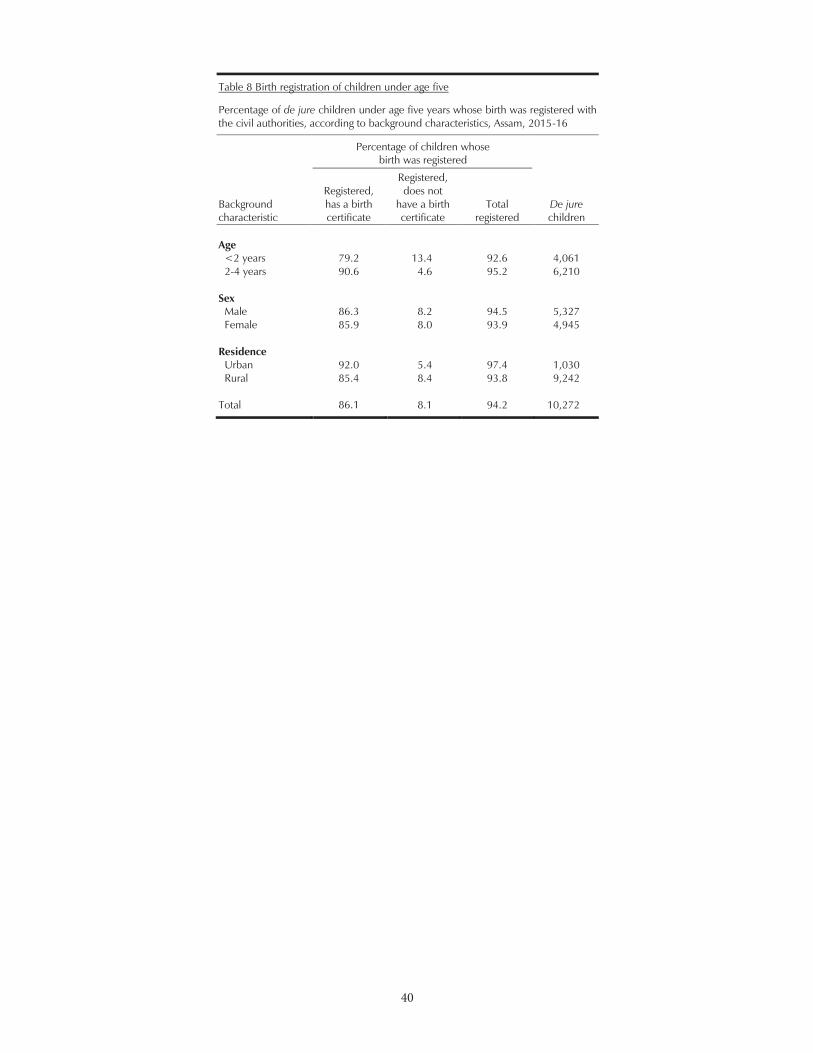
40
40
Table 8 Birth registration of children under age five
Percentage of de jure children under age five years whose birth was registered with the civil authorities, according to background characteristics, Assam, 2015-16
Background characteristic
Percentage of children whose birth was registered
De jure children
Registered, has a birth certificate
Registered, does not
have a birth certificate
Total registered
Age
<2 years 79.2 13.4 92.6 4,061 2-4 years 90.6 4.6 95.2 6,210
Sex Male 86.3 8.2 94.5 5,327 Female 85.9 8.0 93.9 4,945
Residence Urban 92.0 5.4 97.4 1,030 Rural 85.4 8.4 93.8 9,242
Total 86.1 8.1 94.2 10,272
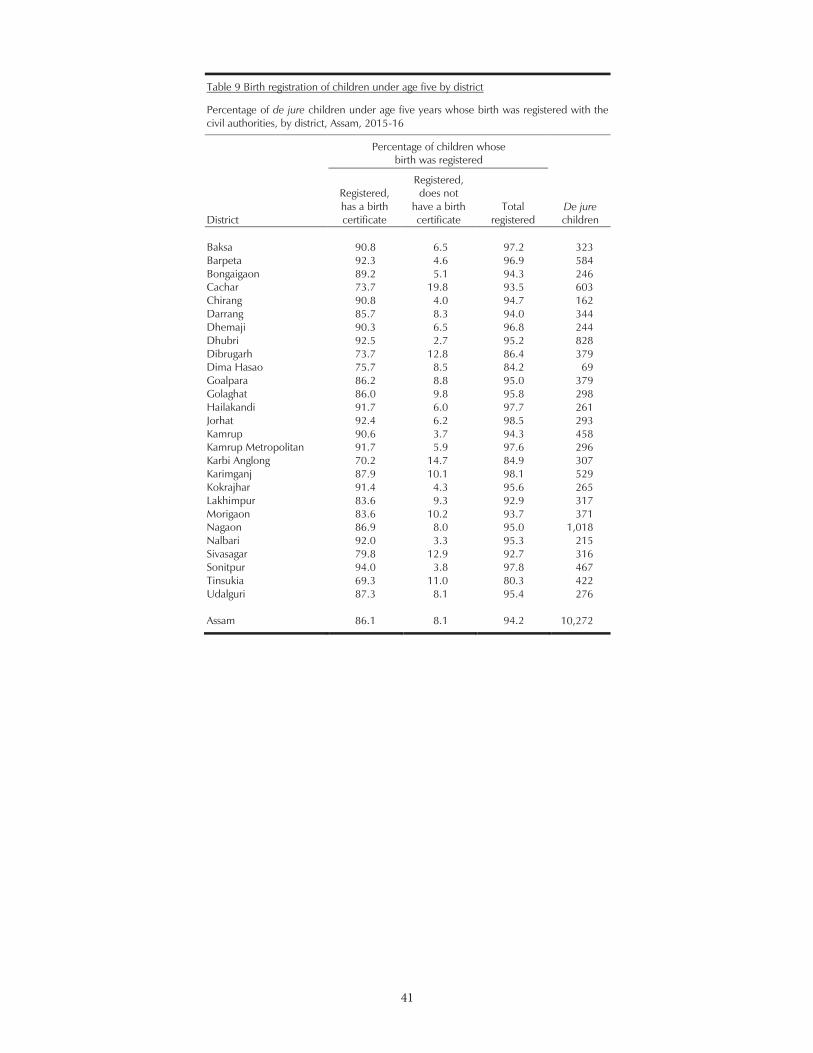
41
41
Table 9 Birth registration of children under age five by district
Percentage of de jure children under age five years whose birth was registered with the civil authorities, by district, Assam, 2015-16
District
Percentage of children whose birth was registered
De jure children
Registered, has a birth certificate
Registered, does not
have a birth certificate
Total registered
Baksa 90.8 6.5 97.2 323 Barpeta 92.3 4.6 96.9 584 Bongaigaon 89.2 5.1 94.3 246 Cachar 73.7 19.8 93.5 603 Chirang 90.8 4.0 94.7 162 Darrang 85.7 8.3 94.0 344 Dhemaji 90.3 6.5 96.8 244 Dhubri 92.5 2.7 95.2 828 Dibrugarh 73.7 12.8 86.4 379 Dima Hasao 75.7 8.5 84.2 69 Goalpara 86.2 8.8 95.0 379 Golaghat 86.0 9.8 95.8 298 Hailakandi 91.7 6.0 97.7 261 Jorhat 92.4 6.2 98.5 293 Kamrup 90.6 3.7 94.3 458 Kamrup Metropolitan 91.7 5.9 97.6 296 Karbi Anglong 70.2 14.7 84.9 307 Karimganj 87.9 10.1 98.1 529 Kokrajhar 91.4 4.3 95.6 265 Lakhimpur 83.6 9.3 92.9 317 Morigaon 83.6 10.2 93.7 371 Nagaon 86.9 8.0 95.0 1,018 Nalbari 92.0 3.3 95.3 215 Sivasagar 79.8 12.9 92.7 316 Sonitpur 94.0 3.8 97.8 467 Tinsukia 69.3 11.0 80.3 422 Udalguri 87.3 8.1 95.4 276 Assam 86.1 8.1 94.2 10,272
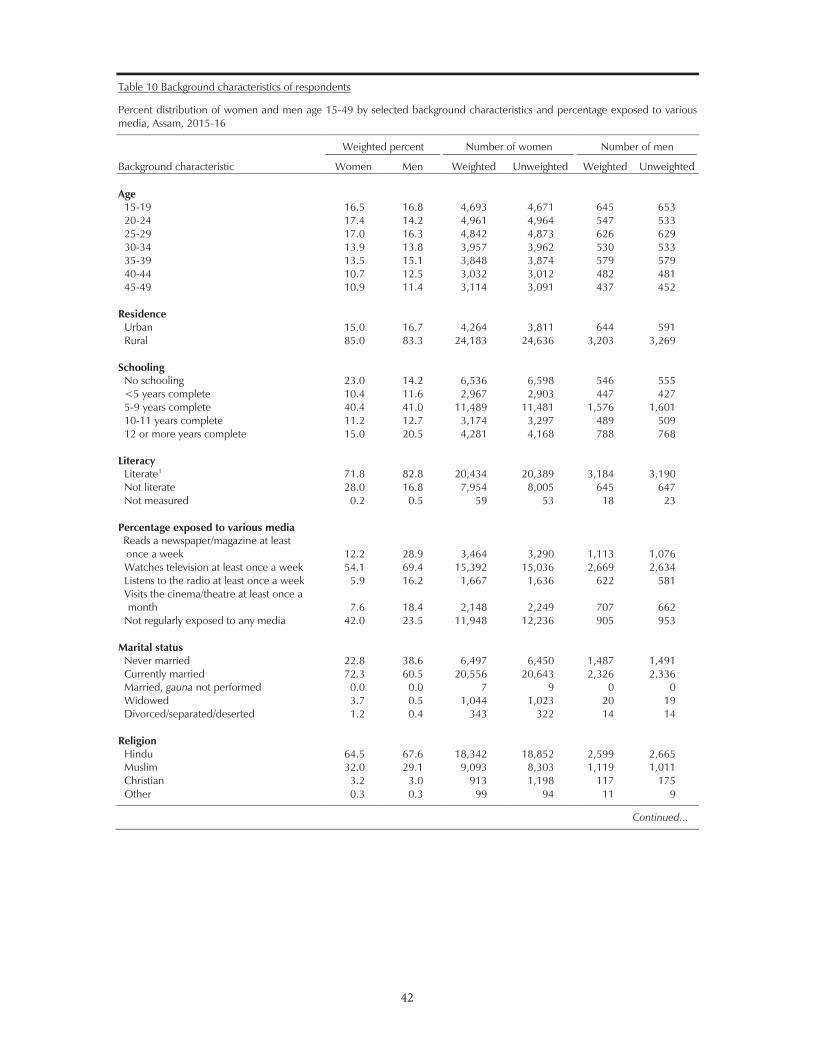
42
42
Table 10 Background characteristics of respondents
Percent distribution of women and men age 15-49 by selected background characteristics and percentage exposed to various media, Assam, 2015-16
Background characteristic
Weighted percent
Number of women
Number of men
Women Men Weighted Unweighted Weighted Unweighted Age
15-19 16.5 16.8 4,693 4,671 645 653 20-24 17.4 14.2 4,961 4,964 547 533 25-29 17.0 16.3 4,842 4,873 626 629 30-34 13.9 13.8 3,957 3,962 530 533 35-39 13.5 15.1 3,848 3,874 579 579 40-44 10.7 12.5 3,032 3,012 482 481 45-49 10.9 11.4 3,114 3,091 437 452
Residence Urban 15.0 16.7 4,264 3,811 644 591 Rural 85.0 83.3 24,183 24,636 3,203 3,269
Schooling No schooling 23.0 14.2 6,536 6,598 546 555 <5 years complete 10.4 11.6 2,967 2,903 447 427 5-9 years complete 40.4 41.0 11,489 11,481 1,576 1,601 10-11 years complete 11.2 12.7 3,174 3,297 489 509 12 or more years complete 15.0 20.5 4,281 4,168 788 768
Literacy Literate1 71.8 82.8 20,434 20,389 3,184 3,190 Not literate 28.0 16.8 7,954 8,005 645 647 Not measured 0.2 0.5 59 53 18 23
Percentage exposed to various media Reads a newspaper/magazine at least once a week 12.2 28.9 3,464 3,290 1,113 1,076 Watches television at least once a week 54.1 69.4 15,392 15,036 2,669 2,634 Listens to the radio at least once a week 5.9 16.2 1,667 1,636 622 581 Visits the cinema/theatre at least once a month 7.6 18.4 2,148 2,249 707 662
Not regularly exposed to any media 42.0 23.5 11,948 12,236 905 953
Marital status Never married 22.8 38.6 6,497 6,450 1,487 1,491 Currently married 72.3 60.5 20,556 20,643 2,326 2,336 Married, gauna not performed 0.0 0.0 7 9 0 0 Widowed 3.7 0.5 1,044 1,023 20 19 Divorced/separated/deserted 1.2 0.4 343 322 14 14
Religion Hindu 64.5 67.6 18,342 18,852 2,599 2,665 Muslim 32.0 29.1 9,093 8,303 1,119 1,011 Christian 3.2 3.0 913 1,198 117 175 Other 0.3 0.3 99 94 11 9
Continued...
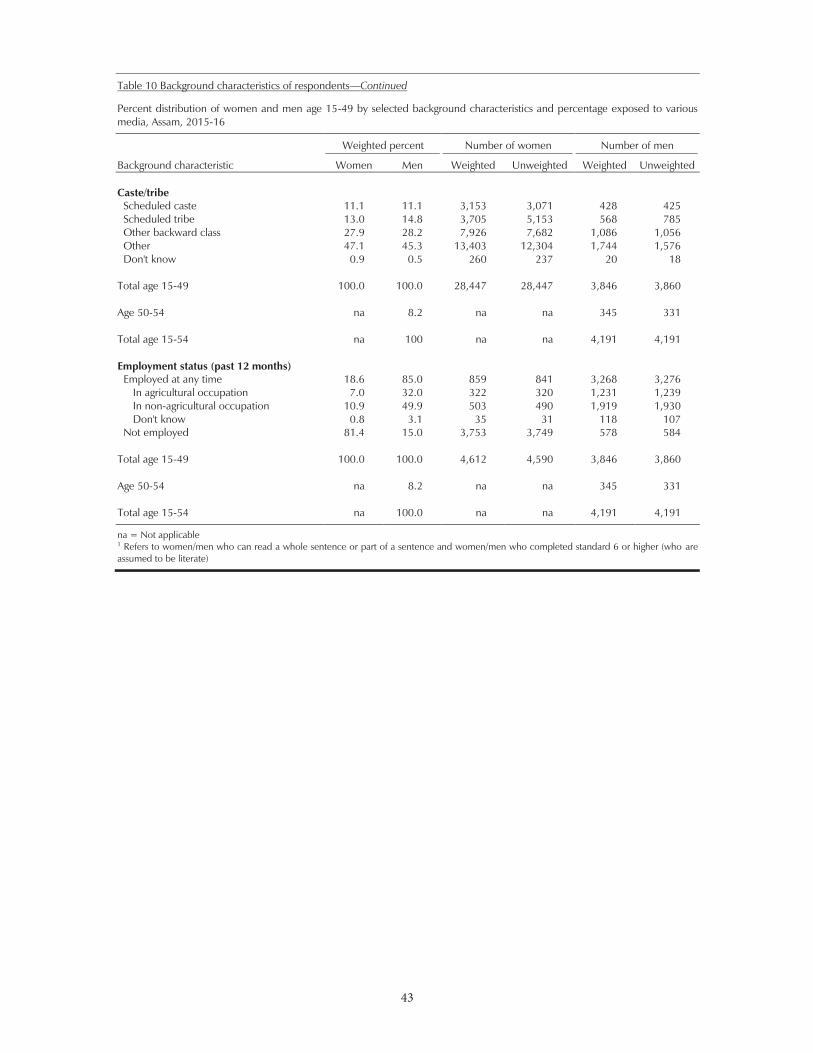
43
43
Table 10 Background characteristics of respondents—Continued
Percent distribution of women and men age 15-49 by selected background characteristics and percentage exposed to various media, Assam, 2015-16
Background characteristic
Weighted percent
Number of women
Number of men
Women Men Weighted Unweighted Weighted Unweighted
Caste/tribe Scheduled caste 11.1 11.1 3,153 3,071 428 425 Scheduled tribe 13.0 14.8 3,705 5,153 568 785 Other backward class 27.9 28.2 7,926 7,682 1,086 1,056 Other 47.1 45.3 13,403 12,304 1,744 1,576 Don't know 0.9 0.5 260 237 20 18
Total age 15-49 100.0 100.0 28,447 28,447 3,846 3,860 Age 50-54 na 8.2 na na 345 331 Total age 15-54 na 100 na na 4,191 4,191 Employment status (past 12 months)
Employed at any time 18.6 85.0 859 841 3,268 3,276 In agricultural occupation 7.0 32.0 322 320 1,231 1,239 In non-agricultural occupation 10.9 49.9 503 490 1,919 1,930 Don't know 0.8 3.1 35 31 118 107
Not employed 81.4 15.0 3,753 3,749 578 584
Total age 15-49 100.0 100.0 4,612 4,590 3,846 3,860 Age 50-54 na 8.2 na na 345 331 Total age 15-54 na 100.0 na na 4,191 4,191
na = Not applicable 1 Refers to women/men who can read a whole sentence or part of a sentence and women/men who completed standard 6 or higher (who are assumed to be literate)

44
44
Table 11 Current fertility
Age-specific and total fertility rates and crude birth rates from NFHS-4, NFHS-3, NFHS-2, and NFHS-1 by residence, Assam
Age
NFHS-4
NFHS-3
NFHS-2
NFHS-1
Urban Rural Total Urban Rural Total Urban Rural Total Urban Rural Total 15-19 0.036 0.078 0.072 0.049 0.094 0.086 0.040 0.094 0.089 0.070 0.122 0.116 20-24 0.089 0.161 0.151 0.096 0.167 0.154 0.110 0.152 0.149 0.167 0.205 0.200 25-29 0.095 0.124 0.119 0.077 0.138 0.127 0.084 0.119 0.116 0.159 0.200 0.195 30-34 0.050 0.068 0.066 0.050 0.076 0.071 0.052 0.072 0.070 0.054 0.128 0.117 35-39 0.015 0.027 0.025 0.014 0.046 0.039 0.014 0.033 0.031 0.046 0.057 0.055 40-44 0.003 0.008 0.007 0.000 0.010 0.007 0.000 0.008 0.007 0.011 0.023 0.021 45-49 0.000 0.002 0.002 (0.000) 0.000 0.000 0.000 0.000 0.000 0.000 0.000 0.000 TFR (15-49) 1.45 2.34 2.21 1.43 2.65 2.42 1.50 2.39 2.31 2.53 3.68 3.53 CBR 13.2 20.5 19.5 13.6 23.9 22.1 15.8 22.3 21.8 23.2 31.4 30.4
Note: Rates are for the period 1-36 months preceding the survey (approximately 1990-92 for NFHS-1, 1996-98 for NFHS-2, 2003-05 for NFHS-3, and 2013-15 for NFHS-4). Age-specific fertility rates are expressed per woman. Rates for the age group 45-49 might be slightly biased due to truncation. TFR = Total fertility rate, expressed per woman CBR = Crude birth rate, expressed per 1,000 population ( ) Based on 125-249 unweighted woman-years of exposure
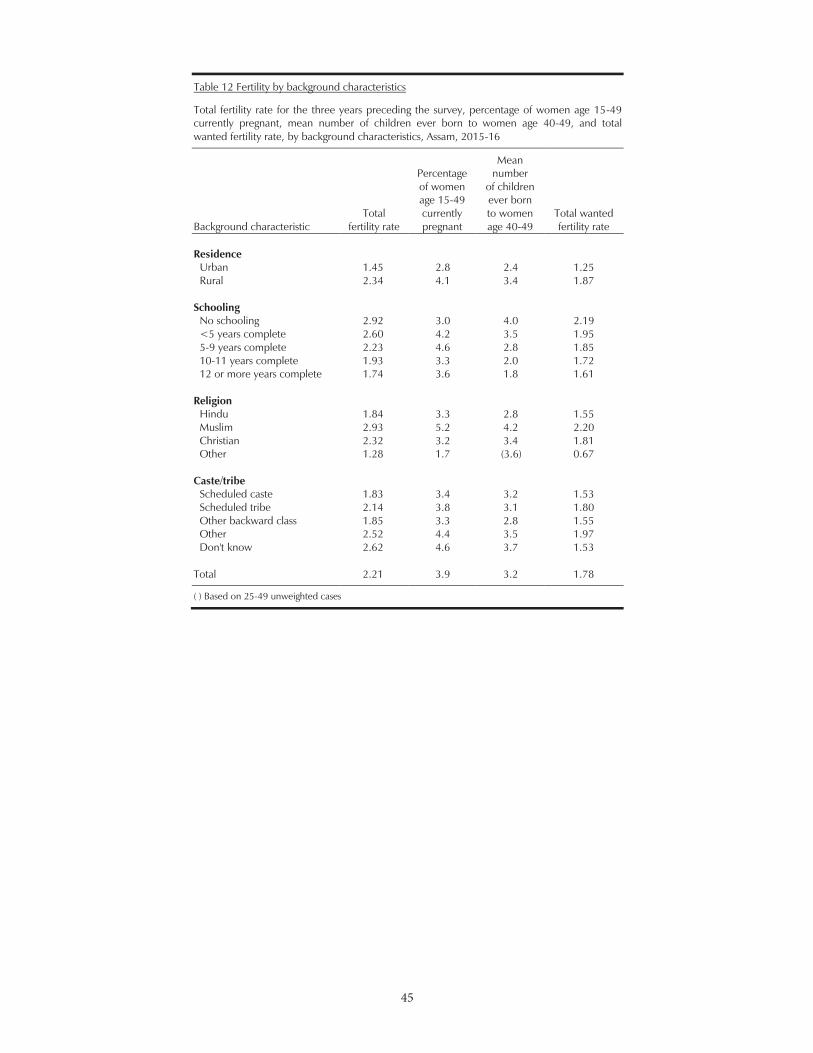
45
45
Table 12 Fertility by background characteristics
Total fertility rate for the three years preceding the survey, percentage of women age 15-49 currently pregnant, mean number of children ever born to women age 40-49, and total wanted fertility rate, by background characteristics, Assam, 2015-16
Background characteristic Total
fertility rate
Percentage of women age 15-49 currently pregnant
Mean number
of children ever born to women age 40-49
Total wanted fertility rate
Residence
Urban 1.45 2.8 2.4 1.25 Rural 2.34 4.1 3.4 1.87
Schooling No schooling 2.92 3.0 4.0 2.19 <5 years complete 2.60 4.2 3.5 1.95 5-9 years complete 2.23 4.6 2.8 1.85 10-11 years complete 1.93 3.3 2.0 1.72 12 or more years complete 1.74 3.6 1.8 1.61
Religion Hindu 1.84 3.3 2.8 1.55 Muslim 2.93 5.2 4.2 2.20 Christian 2.32 3.2 3.4 1.81 Other 1.28 1.7 (3.6) 0.67
Caste/tribe Scheduled caste 1.83 3.4 3.2 1.53 Scheduled tribe 2.14 3.8 3.1 1.80 Other backward class 1.85 3.3 2.8 1.55 Other 2.52 4.4 3.5 1.97 Don't know 2.62 4.6 3.7 1.53
Total 2.21 3.9 3.2 1.78
( ) Based on 25-49 unweighted cases

46
46
Table 13 Teenage pregnancy and motherhood
Percentage of women age 15-19 who have had a live birth or who are pregnant with their first child, and percentage who have begun childbearing, by background characteristics, Assam, 2015-16
Background characteristic
Percentage of women age 15-19 who:
Percentage of women age 15-19 who have
begun childbearing
Number of women
Have had
a live birth
Are pregnant
with first child
Age
15 0.5 0.6 1.1 862 16 1.4 1.2 2.6 925 17 5.9 2.3 8.2 862 18 15.0 6.2 21.2 1,135 19 25.8 6.3 32.1 909
Residence Urban 6.5 1.5 8.1 580 Rural 10.6 3.8 14.4 4,113
Schooling No schooling 27.7 5.5 33.1 250 <5 years complete 18.3 5.5 23.8 290 5-9 years complete 10.5 4.0 14.5 2,818 10-11 years complete 4.9 1.6 6.5 898 12 or more years complete 2.6 1.4 4.0 436
Marital status Never married 0.0 0.0 0.0 3,648 Currently married 45.4 16.0 61.4 1,024
Religion Hindu 6.9 2.6 9.5 2,778 Muslim 15.6 5.2 20.8 1,748 Christian 4.7 0.8 5.5 150
Caste/tribe Scheduled caste 8.2 1.7 9.9 501 Scheduled tribe 7.8 3.5 11.3 575 Other backward class 6.5 2.7 9.2 1,258 Other 13.1 4.4 17.4 2,319 Don't know (4.2) (1.9) (6.1) 41
Total 10.1 3.5 13.6 4,693
Note: Total includes widowed/divorced/separated/deserted women and women belonging
( ) Based on 25-49 unweighted cases
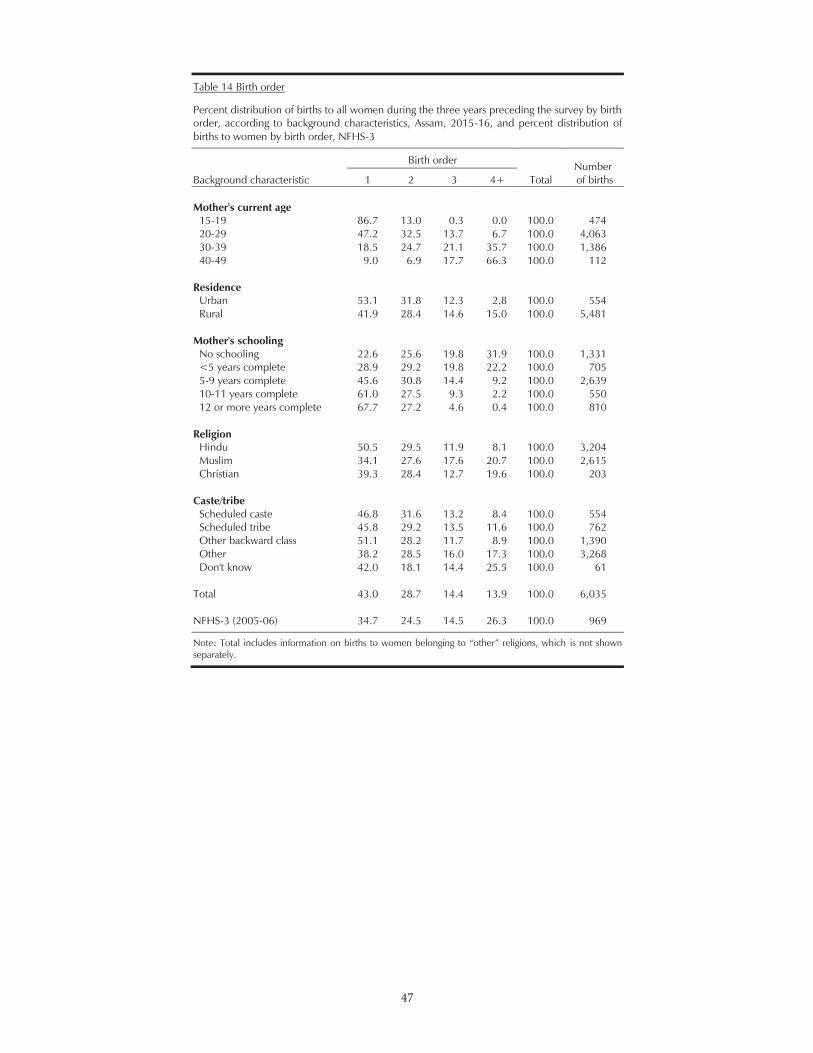
47
47
Table 14 Birth order
Percent distribution of births to all women during the three years preceding the survey by birth order, according to background characteristics, Assam, 2015-16, and percent distribution of births to women by birth order, NFHS-3
Background characteristic
Birth order
Total Number of births 1 2 3 4+
Mother's current age
15-19 86.7 13.0 0.3 0.0 100.0 474 20-29 47.2 32.5 13.7 6.7 100.0 4,063 30-39 18.5 24.7 21.1 35.7 100.0 1,386 40-49 9.0 6.9 17.7 66.3 100.0 112
Residence Urban 53.1 31.8 12.3 2.8 100.0 554 Rural 41.9 28.4 14.6 15.0 100.0 5,481
Mother's schooling No schooling 22.6 25.6 19.8 31.9 100.0 1,331 <5 years complete 28.9 29.2 19.8 22.2 100.0 705 5-9 years complete 45.6 30.8 14.4 9.2 100.0 2,639 10-11 years complete 61.0 27.5 9.3 2.2 100.0 550 12 or more years complete 67.7 27.2 4.6 0.4 100.0 810
Religion Hindu 50.5 29.5 11.9 8.1 100.0 3,204 Muslim 34.1 27.6 17.6 20.7 100.0 2,615 Christian 39.3 28.4 12.7 19.6 100.0 203
Caste/tribe Scheduled caste 46.8 31.6 13.2 8.4 100.0 554 Scheduled tribe 45.8 29.2 13.5 11.6 100.0 762 Other backward class 51.1 28.2 11.7 8.9 100.0 1,390 Other 38.2 28.5 16.0 17.3 100.0 3,268 Don't know 42.0 18.1 14.4 25.5 100.0 61
Total 43.0 28.7 14.4 13.9 100.0 6,035 NFHS-3 (2005-06) 34.7 24.5 14.5 26.3 100.0 969
Note: is not shown separately.
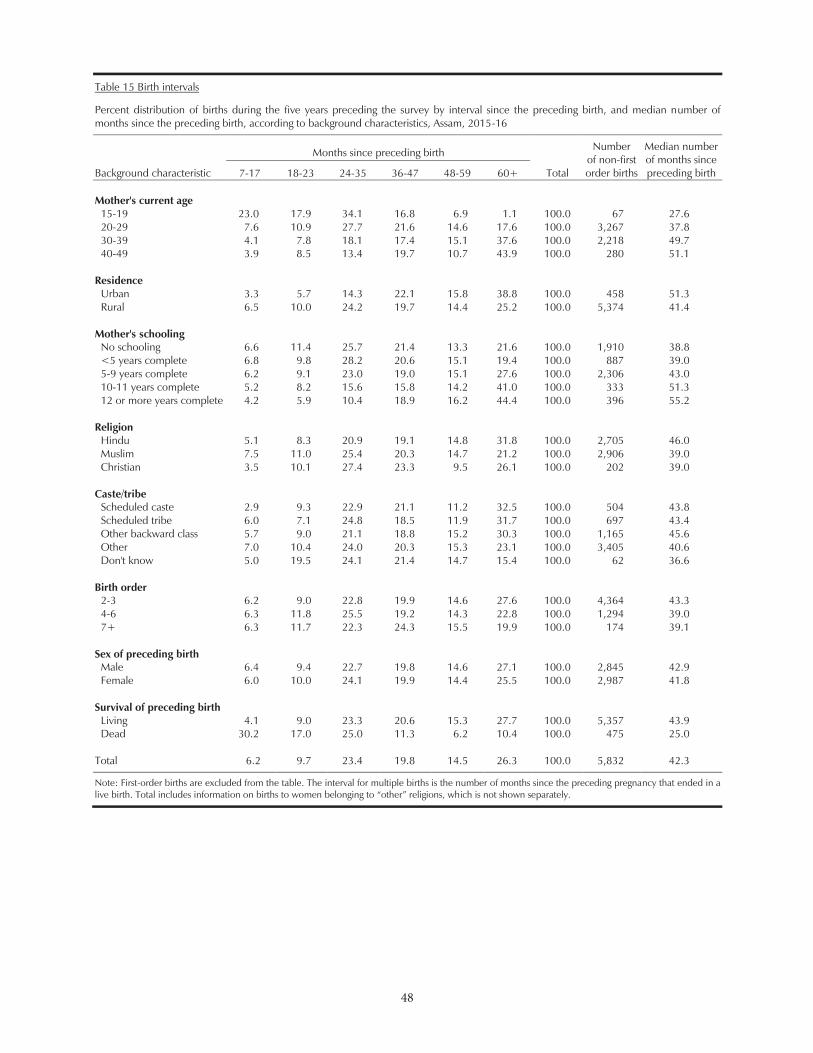
48
48
Table 15 Birth intervals
Percent distribution of births during the five years preceding the survey by interval since the preceding birth, and median number of months since the preceding birth, according to background characteristics, Assam, 2015-16
Background characteristic
Months since preceding birth
Total
Number of non-first order births
Median number of months since preceding birth 7-17 18-23 24-35 36-47 48-59 60+
Mother's current age
15-19 23.0 17.9 34.1 16.8 6.9 1.1 100.0 67 27.6 20-29 7.6 10.9 27.7 21.6 14.6 17.6 100.0 3,267 37.8 30-39 4.1 7.8 18.1 17.4 15.1 37.6 100.0 2,218 49.7 40-49 3.9 8.5 13.4 19.7 10.7 43.9 100.0 280 51.1
Residence Urban 3.3 5.7 14.3 22.1 15.8 38.8 100.0 458 51.3 Rural 6.5 10.0 24.2 19.7 14.4 25.2 100.0 5,374 41.4
Mother's schooling No schooling 6.6 11.4 25.7 21.4 13.3 21.6 100.0 1,910 38.8 <5 years complete 6.8 9.8 28.2 20.6 15.1 19.4 100.0 887 39.0 5-9 years complete 6.2 9.1 23.0 19.0 15.1 27.6 100.0 2,306 43.0 10-11 years complete 5.2 8.2 15.6 15.8 14.2 41.0 100.0 333 51.3 12 or more years complete 4.2 5.9 10.4 18.9 16.2 44.4 100.0 396 55.2
Religion Hindu 5.1 8.3 20.9 19.1 14.8 31.8 100.0 2,705 46.0 Muslim 7.5 11.0 25.4 20.3 14.7 21.2 100.0 2,906 39.0 Christian 3.5 10.1 27.4 23.3 9.5 26.1 100.0 202 39.0
Caste/tribe Scheduled caste 2.9 9.3 22.9 21.1 11.2 32.5 100.0 504 43.8 Scheduled tribe 6.0 7.1 24.8 18.5 11.9 31.7 100.0 697 43.4 Other backward class 5.7 9.0 21.1 18.8 15.2 30.3 100.0 1,165 45.6 Other 7.0 10.4 24.0 20.3 15.3 23.1 100.0 3,405 40.6 Don't know 5.0 19.5 24.1 21.4 14.7 15.4 100.0 62 36.6
Birth order 2-3 6.2 9.0 22.8 19.9 14.6 27.6 100.0 4,364 43.3 4-6 6.3 11.8 25.5 19.2 14.3 22.8 100.0 1,294 39.0 7+ 6.3 11.7 22.3 24.3 15.5 19.9 100.0 174 39.1
Sex of preceding birth Male 6.4 9.4 22.7 19.8 14.6 27.1 100.0 2,845 42.9 Female 6.0 10.0 24.1 19.9 14.4 25.5 100.0 2,987 41.8
Survival of preceding birth Living 4.1 9.0 23.3 20.6 15.3 27.7 100.0 5,357 43.9 Dead 30.2 17.0 25.0 11.3 6.2 10.4 100.0 475 25.0
Total 6.2 9.7 23.4 19.8 14.5 26.3 100.0 5,832 42.3
Note: First-order births are excluded from the table. The interval for multiple births is the number of months since the preceding pregnancy that ended in a live birth. ich is not shown separately.
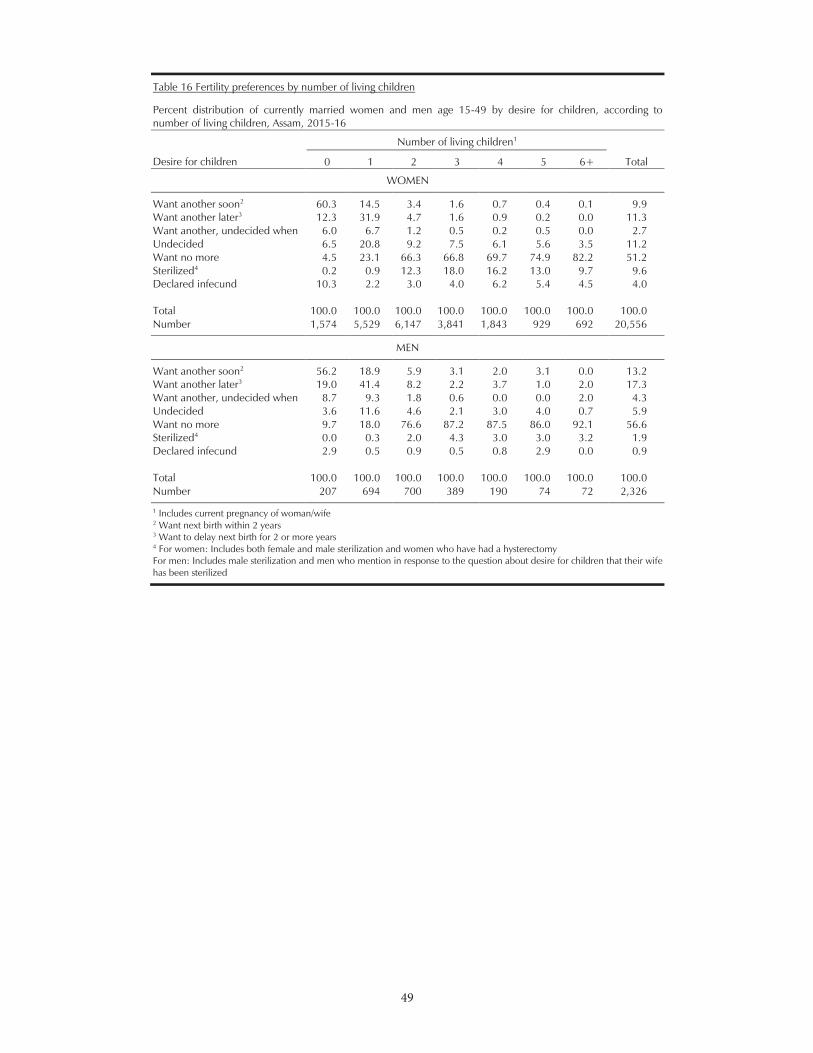
49
49
Table 16 Fertility preferences by number of living children
Percent distribution of currently married women and men age 15-49 by desire for children, according to number of living children, Assam, 2015-16
Desire for children
Number of living children1
Total 0 1 2 3 4 5 6+
WOMEN
Want another soon2 60.3 14.5 3.4 1.6 0.7 0.4 0.1 9.9 Want another later3 12.3 31.9 4.7 1.6 0.9 0.2 0.0 11.3 Want another, undecided when 6.0 6.7 1.2 0.5 0.2 0.5 0.0 2.7 Undecided 6.5 20.8 9.2 7.5 6.1 5.6 3.5 11.2 Want no more 4.5 23.1 66.3 66.8 69.7 74.9 82.2 51.2 Sterilized4 0.2 0.9 12.3 18.0 16.2 13.0 9.7 9.6 Declared infecund 10.3 2.2 3.0 4.0 6.2 5.4 4.5 4.0 Total 100.0 100.0 100.0 100.0 100.0 100.0 100.0 100.0 Number 1,574 5,529 6,147 3,841 1,843 929 692 20,556
MEN
Want another soon2 56.2 18.9 5.9 3.1 2.0 3.1 0.0 13.2 Want another later3 19.0 41.4 8.2 2.2 3.7 1.0 2.0 17.3 Want another, undecided when 8.7 9.3 1.8 0.6 0.0 0.0 2.0 4.3 Undecided 3.6 11.6 4.6 2.1 3.0 4.0 0.7 5.9 Want no more 9.7 18.0 76.6 87.2 87.5 86.0 92.1 56.6 Sterilized4 0.0 0.3 2.0 4.3 3.0 3.0 3.2 1.9 Declared infecund 2.9 0.5 0.9 0.5 0.8 2.9 0.0 0.9 Total 100.0 100.0 100.0 100.0 100.0 100.0 100.0 100.0 Number 207 694 700 389 190 74 72 2,326
1 Includes current pregnancy of woman/wife 2 Want next birth within 2 years 3 Want to delay next birth for 2 or more years 4 For women: Includes both female and male sterilization and women who have had a hysterectomy For men: Includes male sterilization and men who mention in response to the question about desire for children that their wife has been sterilized
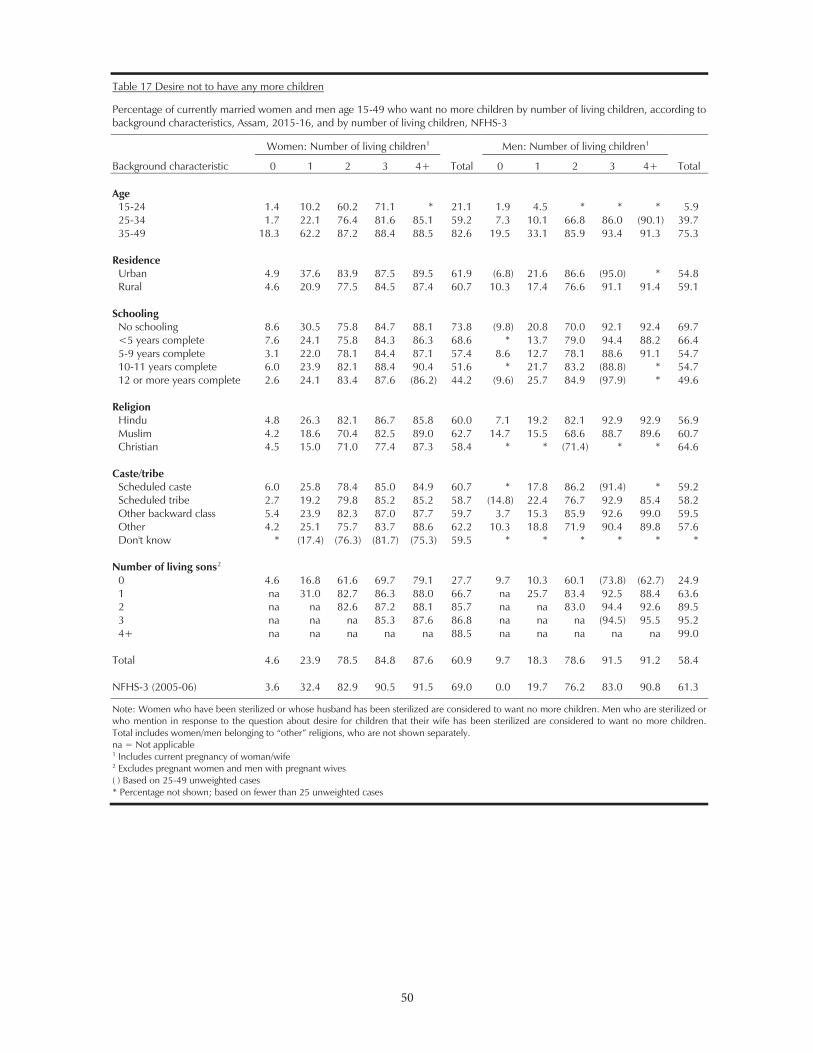
50
50
Table 17 Desire not to have any more children
Percentage of currently married women and men age 15-49 who want no more children by number of living children, according to background characteristics, Assam, 2015-16, and by number of living children, NFHS-3
Background characteristic
Women: Number of living children1
Total
Men: Number of living children1
Total 0 1 2 3 4+ 0 1 2 3 4+ Age
15-24 1.4 10.2 60.2 71.1 * 21.1 1.9 4.5 * * * 5.9 25-34 1.7 22.1 76.4 81.6 85.1 59.2 7.3 10.1 66.8 86.0 (90.1) 39.7 35-49 18.3 62.2 87.2 88.4 88.5 82.6 19.5 33.1 85.9 93.4 91.3 75.3
Residence Urban 4.9 37.6 83.9 87.5 89.5 61.9 (6.8) 21.6 86.6 (95.0) * 54.8 Rural 4.6 20.9 77.5 84.5 87.4 60.7 10.3 17.4 76.6 91.1 91.4 59.1
Schooling No schooling 8.6 30.5 75.8 84.7 88.1 73.8 (9.8) 20.8 70.0 92.1 92.4 69.7 <5 years complete 7.6 24.1 75.8 84.3 86.3 68.6 * 13.7 79.0 94.4 88.2 66.4 5-9 years complete 3.1 22.0 78.1 84.4 87.1 57.4 8.6 12.7 78.1 88.6 91.1 54.7 10-11 years complete 6.0 23.9 82.1 88.4 90.4 51.6 * 21.7 83.2 (88.8) * 54.7 12 or more years complete 2.6 24.1 83.4 87.6 (86.2) 44.2 (9.6) 25.7 84.9 (97.9) * 49.6
Religion Hindu 4.8 26.3 82.1 86.7 85.8 60.0 7.1 19.2 82.1 92.9 92.9 56.9 Muslim 4.2 18.6 70.4 82.5 89.0 62.7 14.7 15.5 68.6 88.7 89.6 60.7 Christian 4.5 15.0 71.0 77.4 87.3 58.4 * * (71.4) * * 64.6
Caste/tribe Scheduled caste 6.0 25.8 78.4 85.0 84.9 60.7 * 17.8 86.2 (91.4) * 59.2 Scheduled tribe 2.7 19.2 79.8 85.2 85.2 58.7 (14.8) 22.4 76.7 92.9 85.4 58.2 Other backward class 5.4 23.9 82.3 87.0 87.7 59.7 3.7 15.3 85.9 92.6 99.0 59.5 Other 4.2 25.1 75.7 83.7 88.6 62.2 10.3 18.8 71.9 90.4 89.8 57.6 Don't know * (17.4) (76.3) (81.7) (75.3) 59.5 * * * * * *
Number of living sons2 0 4.6 16.8 61.6 69.7 79.1 27.7 9.7 10.3 60.1 (73.8) (62.7) 24.9 1 na 31.0 82.7 86.3 88.0 66.7 na 25.7 83.4 92.5 88.4 63.6 2 na na 82.6 87.2 88.1 85.7 na na 83.0 94.4 92.6 89.5 3 na na na 85.3 87.6 86.8 na na na (94.5) 95.5 95.2 4+ na na na na na 88.5 na na na na na 99.0
Total 4.6 23.9 78.5 84.8 87.6 60.9 9.7 18.3 78.6 91.5 91.2 58.4 NFHS-3 (2005-06) 3.6 32.4 82.9 90.5 91.5 69.0 0.0 19.7 76.2 83.0 90.8 61.3
Note: Women who have been sterilized or whose husband has been sterilized are considered to want no more children. Men who are sterilized or who mention in response to the question about desire for children that their wife has been sterilized are considered to want no more children.
na = Not applicable 1 Includes current pregnancy of woman/wife 2 Excludes pregnant women and men with pregnant wives ( ) Based on 25-49 unweighted cases * Percentage not shown; based on fewer than 25 unweighted cases
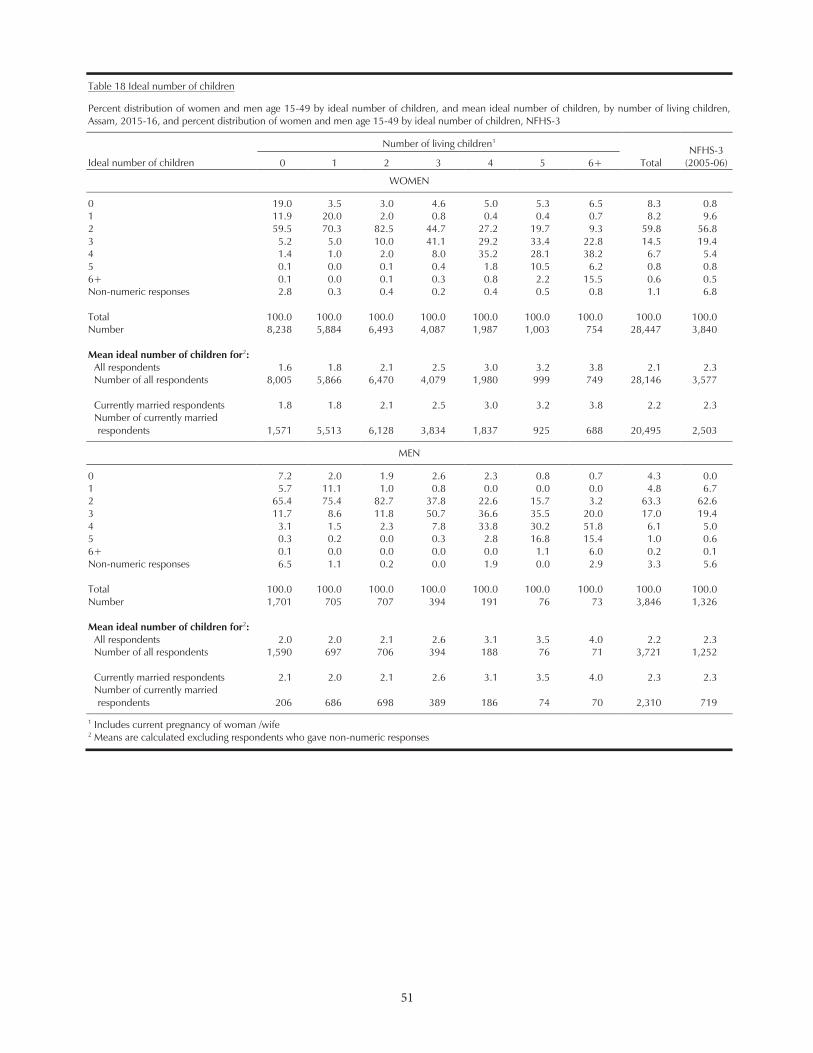
51
51
Table 18 Ideal number of children
Percent distribution of women and men age 15-49 by ideal number of children, and mean ideal number of children, by number of living children, Assam, 2015-16, and percent distribution of women and men age 15-49 by ideal number of children, NFHS-3
Ideal number of children
Number of living children1
Total NFHS-3
(2005-06) 0 1 2 3 4 5 6+
WOMEN
0 19.0 3.5 3.0 4.6 5.0 5.3 6.5 8.3 0.8 1 11.9 20.0 2.0 0.8 0.4 0.4 0.7 8.2 9.6 2 59.5 70.3 82.5 44.7 27.2 19.7 9.3 59.8 56.8 3 5.2 5.0 10.0 41.1 29.2 33.4 22.8 14.5 19.4 4 1.4 1.0 2.0 8.0 35.2 28.1 38.2 6.7 5.4 5 0.1 0.0 0.1 0.4 1.8 10.5 6.2 0.8 0.8 6+ 0.1 0.0 0.1 0.3 0.8 2.2 15.5 0.6 0.5 Non-numeric responses 2.8 0.3 0.4 0.2 0.4 0.5 0.8 1.1 6.8 Total 100.0 100.0 100.0 100.0 100.0 100.0 100.0 100.0 100.0 Number 8,238 5,884 6,493 4,087 1,987 1,003 754 28,447 3,840 Mean ideal number of children for2:
All respondents 1.6 1.8 2.1 2.5 3.0 3.2 3.8 2.1 2.3 Number of all respondents 8,005 5,866 6,470 4,079 1,980 999 749 28,146 3,577 Currently married respondents 1.8 1.8 2.1 2.5 3.0 3.2 3.8 2.2 2.3 Number of currently married respondents 1,571 5,513 6,128 3,834 1,837 925 688 20,495 2,503
MEN
0 7.2 2.0 1.9 2.6 2.3 0.8 0.7 4.3 0.0 1 5.7 11.1 1.0 0.8 0.0 0.0 0.0 4.8 6.7 2 65.4 75.4 82.7 37.8 22.6 15.7 3.2 63.3 62.6 3 11.7 8.6 11.8 50.7 36.6 35.5 20.0 17.0 19.4 4 3.1 1.5 2.3 7.8 33.8 30.2 51.8 6.1 5.0 5 0.3 0.2 0.0 0.3 2.8 16.8 15.4 1.0 0.6 6+ 0.1 0.0 0.0 0.0 0.0 1.1 6.0 0.2 0.1 Non-numeric responses 6.5 1.1 0.2 0.0 1.9 0.0 2.9 3.3 5.6
Total 100.0 100.0 100.0 100.0 100.0 100.0 100.0 100.0 100.0 Number 1,701 705 707 394 191 76 73 3,846 1,326 Mean ideal number of children for2:
All respondents 2.0 2.0 2.1 2.6 3.1 3.5 4.0 2.2 2.3 Number of all respondents 1,590 697 706 394 188 76 71 3,721 1,252 Currently married respondents 2.1 2.0 2.1 2.6 3.1 3.5 4.0 2.3 2.3 Number of currently married respondents 206 686 698 389 186 74 70 2,310 719
1 Includes current pregnancy of woman /wife 2 Means are calculated excluding respondents who gave non-numeric responses
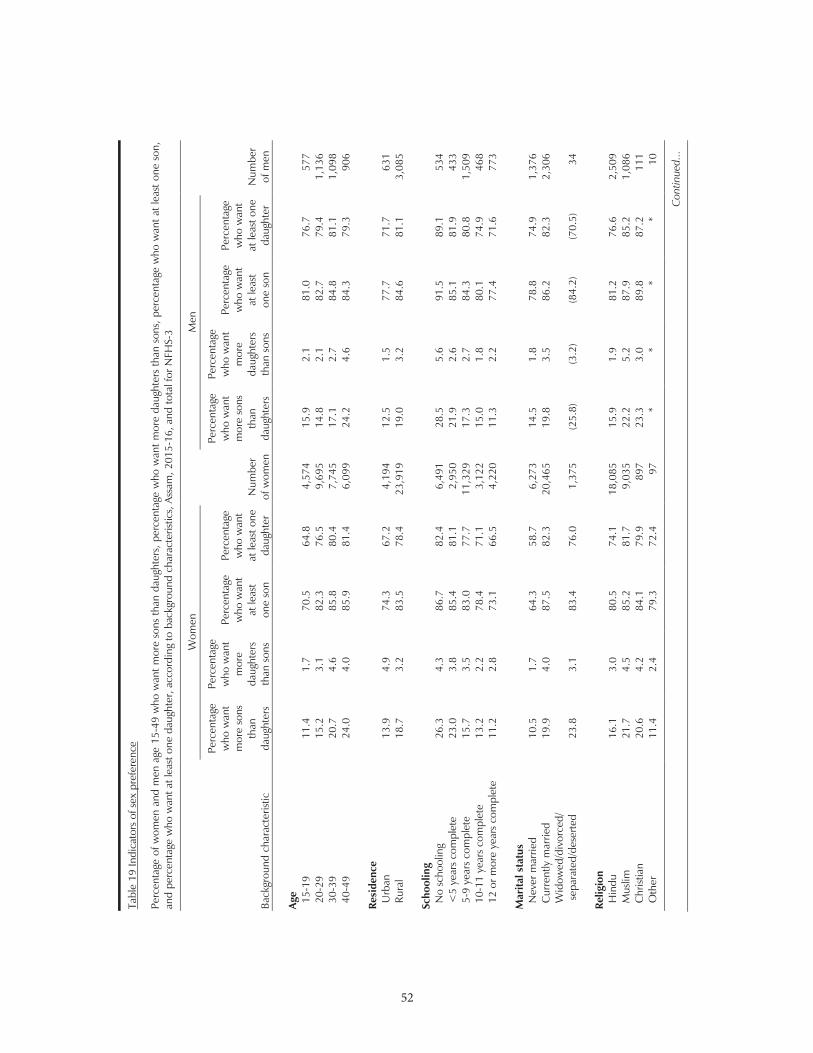
52
52
Tabl
e 19
Indi
cato
rs o
f sex
pre
fere
nce
Perc
enta
ge o
f wom
en a
nd m
en a
ge 1
5-49
who
wan
t mor
e so
ns th
an d
augh
ters
, per
cent
age
who
wan
t mor
e da
ught
ers
than
son
s, p
erce
ntag
e w
ho w
ant a
t lea
st o
ne s
on,
and
perc
enta
ge w
ho w
ant a
t lea
st o
ne d
augh
ter,
acco
rdin
g to
bac
kgro
und
char
acte
ristic
s, A
ssam
, 201
5-16
, and
tota
l for
NFH
S-3
Back
grou
nd c
hara
cter
istic
Wom
en
Num
ber
of w
omen
Men
Num
ber
of m
en
Perc
enta
ge
who
wan
t m
ore
sons
th
an
daug
hter
s
Perc
enta
ge
who
wan
t m
ore
daug
hter
s th
an s
ons
Perc
enta
ge
who
wan
t at
leas
t on
e so
n
Perc
enta
ge
who
wan
t at
leas
t one
da
ught
er
Perc
enta
ge
who
wan
t m
ore
sons
th
an
daug
hter
s
Perc
enta
ge
who
wan
t m
ore
daug
hter
s th
an s
ons
Perc
enta
ge
who
wan
t at
leas
t on
e so
n
Perc
enta
ge
who
wan
t at
leas
t one
da
ught
er
Ag
e
15
-19
11
.4
1.7
70.5
64
.8
4,57
4 15
.9
2.1
81.0
76
.7
577
20-2
9
15.2
3.
1 82
.3
76.5
9,
695
14.8
2.
1 82
.7
79.4
1,
136
30-3
9
20.7
4.
6 85
.8
80.4
7,
745
17.1
2.
7 84
.8
81.1
1,
098
40-4
9
24.0
4.
0 85
.9
81.4
6,
099
24.2
4.
6 84
.3
79.3
90
6
Resi
denc
e
U
rban
13
.9
4.9
74.3
67
.2
4,19
4 12
.5
1.5
77.7
71
.7
631
Rura
l 18
.7
3.2
83.5
78
.4
23,9
19
19.0
3.
2 84
.6
81.1
3,
085
Sc
hool
ing
No
scho
olin
g
26.3
4.
3 86
.7
82.4
6,
491
28.5
5.
6 91
.5
89.1
53
4 <
5 ye
ars
com
plet
e
23.0
3.
8 85
.4
81.1
2,
950
21.9
2.
6 85
.1
81.9
43
3 5-
9 ye
ars
com
plet
e
15.7
3.
5 83
.0
77.7
11
,329
17
.3
2.7
84.3
80
.8
1,50
9 10
-11
year
s co
mpl
ete
13
.2
2.2
78.4
71
.1
3,12
2 15
.0
1.8
80.1
74
.9
468
12 o
r mor
e ye
ars
com
plet
e
11.2
2.
8 73
.1
66.5
4,
220
11.3
2.
2 77
.4
71.6
77
3
Mar
ital s
tatu
s
N
ever
mar
ried
10
.5
1.7
64.3
58
.7
6,27
3 14
.5
1.8
78.8
74
.9
1,37
6 C
urre
ntly
mar
ried
19
.9
4.0
87.5
82
.3
20,4
65
19.8
3.
5 86
.2
82.3
2,
306
Wid
owed
/div
orce
d/
sep
arat
ed/d
eser
ted
23
.8
3.1
83.4
76
.0
1,37
5 (2
5.8)
(3
.2)
(84.
2)
(70.
5)
34
Re
ligio
n
H
indu
16
.1
3.0
80.5
74
.1
18,0
85
15.9
1.
9 81
.2
76.6
2,
509
Mus
lim
21.7
4.
5 85
.2
81.7
9,
035
22.2
5.
2 87
.9
85.2
1,
086
Chr
istia
n
20.6
4.
2 84
.1
79.9
89
7 23
.3
3.0
89.8
87
.2
111
Oth
er
11.4
2.
4 79
.3
72.4
97
*
* *
* 10
Con
tinue
d...
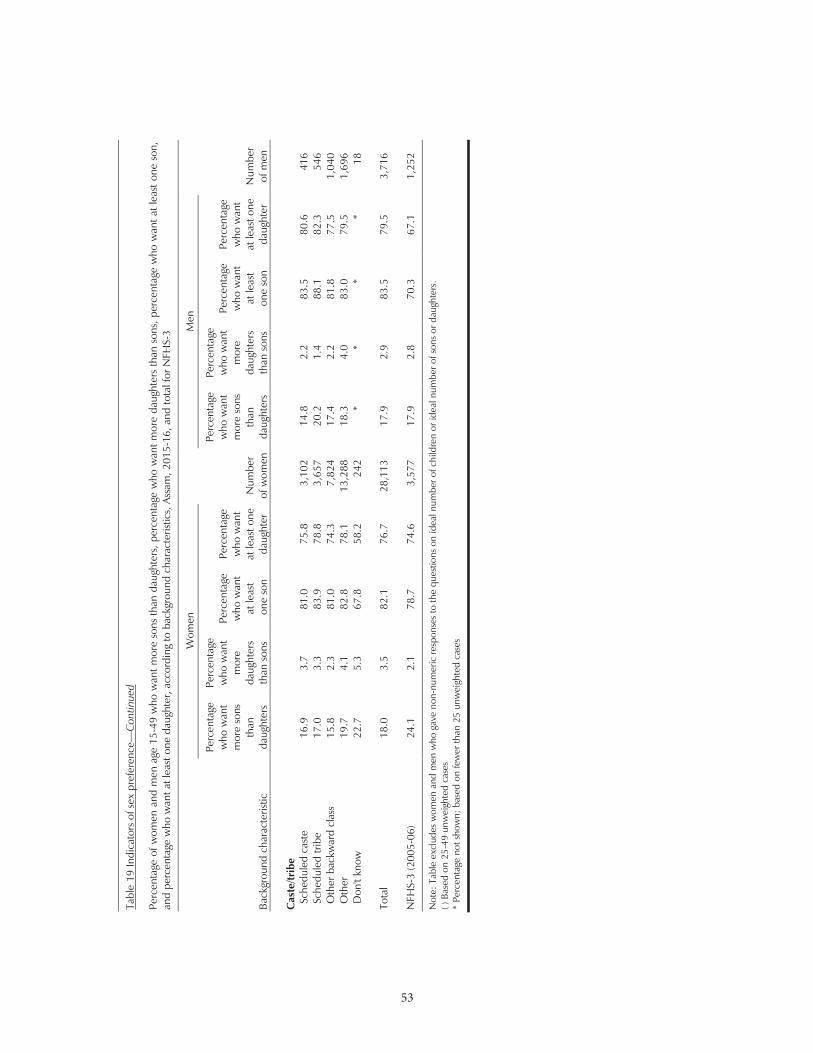
53
53
Tabl
e 19
Indi
cato
rs o
f sex
pre
fere
nce—
Con
tinue
d
Perc
enta
ge o
f wom
en a
nd m
en a
ge 1
5-49
who
wan
t mor
e so
ns th
an d
augh
ters
, per
cent
age
who
wan
t mor
e da
ught
ers
than
son
s, p
erce
ntag
e w
ho w
ant a
t lea
st o
ne s
on,
and
perc
enta
ge w
ho w
ant a
t lea
st o
ne d
augh
ter,
acco
rdin
g to
bac
kgro
und
char
acte
ristic
s, A
ssam
, 201
5-16
, and
tota
l for
NFH
S-3
Back
grou
nd c
hara
cter
istic
Wom
en
Num
ber
of w
omen
Men
Num
ber
of m
en
Perc
enta
ge
who
wan
t m
ore
sons
th
an
daug
hter
s
Perc
enta
ge
who
wan
t m
ore
daug
hter
s th
an s
ons
Perc
enta
ge
who
wan
t at
leas
t o
ne s
on
Perc
enta
ge
who
wan
t at
leas
t one
da
ught
er
Perc
enta
ge
who
wan
t m
ore
sons
th
an
daug
hter
s
Perc
enta
ge
who
wan
t m
ore
daug
hter
s th
an s
ons
Perc
enta
ge
who
wan
t at
leas
t on
e so
n
Perc
enta
ge
who
wan
t at
leas
t one
da
ught
er
C
aste
/trib
e
Sc
hedu
led
cast
e
16.9
3.
7 81
.0
75.8
3,
102
14.8
2.
2 83
.5
80.6
41
6 Sc
hedu
led
tribe
17
.0
3.3
83.9
78
.8
3,65
7 20
.2
1.4
88.1
82
.3
546
Oth
er b
ackw
ard
clas
s
15.8
2.
3 81
.0
74.3
7,
824
17.4
2.
2 81
.8
77.5
1,
040
Oth
er
19.7
4.
1 82
.8
78.1
13
,288
18
.3
4.0
83.0
79
.5
1,69
6 D
on't
know
22
.7
5.3
67.8
58
.2
242
* *
* *
18
To
tal
18.0
3.
5 82
.1
76.7
28
,113
17
.9
2.9
83.5
79
.5
3,71
6
NFH
S-3
(200
5-06
) 24
.1
2.1
78.7
74
.6
3,57
7 17
.9
2.8
70.3
67
.1
1,25
2
Not
e: T
able
exc
lude
s w
omen
and
men
who
gav
e no
n-nu
mer
ic re
spon
ses
to th
e qu
estio
ns o
n id
eal n
umbe
r of c
hild
ren
or id
eal n
umbe
r of s
ons o
r dau
ghte
rs.
( ) B
ased
on
25-4
9 un
wei
ghte
d ca
ses
* Pe
rcen
tage
not
sho
wn;
bas
ed o
n fe
wer
than
25
unw
eigh
ted
case
s
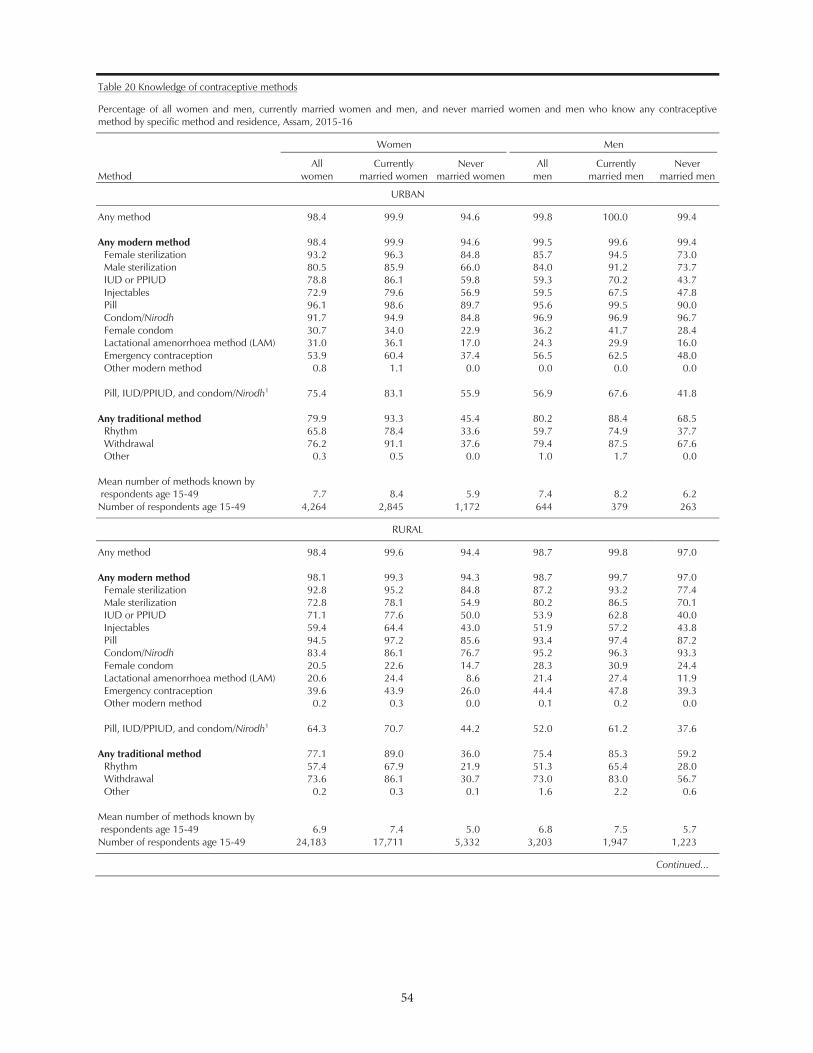
54
54
Table 20 Knowledge of contraceptive methods
Percentage of all women and men, currently married women and men, and never married women and men who know any contraceptive method by specific method and residence, Assam, 2015-16
Method
Women
Men
All women
Currently married women
Never married women
All men
Currently married men
Never married men
URBAN
Any method 98.4 99.9 94.6 99.8 100.0 99.4 Any modern method 98.4 99.9 94.6 99.5 99.6 99.4
Female sterilization 93.2 96.3 84.8 85.7 94.5 73.0 Male sterilization 80.5 85.9 66.0 84.0 91.2 73.7 IUD or PPIUD 78.8 86.1 59.8 59.3 70.2 43.7 Injectables 72.9 79.6 56.9 59.5 67.5 47.8 Pill 96.1 98.6 89.7 95.6 99.5 90.0 Condom/Nirodh 91.7 94.9 84.8 96.9 96.9 96.7 Female condom 30.7 34.0 22.9 36.2 41.7 28.4 Lactational amenorrhoea method (LAM) 31.0 36.1 17.0 24.3 29.9 16.0 Emergency contraception 53.9 60.4 37.4 56.5 62.5 48.0 Other modern method 0.8 1.1 0.0 0.0 0.0 0.0
Pill, IUD/PPIUD, and condom/Nirodh1 75.4 83.1 55.9 56.9 67.6 41.8
Any traditional method 79.9 93.3 45.4 80.2 88.4 68.5
Rhythm 65.8 78.4 33.6 59.7 74.9 37.7 Withdrawal 76.2 91.1 37.6 79.4 87.5 67.6 Other 0.3 0.5 0.0 1.0 1.7 0.0
Mean number of methods known by respondents age 15-49 7.7 8.4 5.9 7.4 8.2 6.2 Number of respondents age 15-49 4,264 2,845 1,172 644 379 263
RURAL
Any method 98.4 99.6 94.4 98.7 99.8 97.0 Any modern method 98.1 99.3 94.3 98.7 99.7 97.0
Female sterilization 92.8 95.2 84.8 87.2 93.2 77.4 Male sterilization 72.8 78.1 54.9 80.2 86.5 70.1 IUD or PPIUD 71.1 77.6 50.0 53.9 62.8 40.0 Injectables 59.4 64.4 43.0 51.9 57.2 43.8 Pill 94.5 97.2 85.6 93.4 97.4 87.2 Condom/Nirodh 83.4 86.1 76.7 95.2 96.3 93.3 Female condom 20.5 22.6 14.7 28.3 30.9 24.4 Lactational amenorrhoea method (LAM) 20.6 24.4 8.6 21.4 27.4 11.9 Emergency contraception 39.6 43.9 26.0 44.4 47.8 39.3 Other modern method 0.2 0.3 0.0 0.1 0.2 0.0
Pill, IUD/PPIUD, and condom/Nirodh1 64.3 70.7 44.2 52.0 61.2 37.6
Any traditional method 77.1 89.0 36.0 75.4 85.3 59.2
Rhythm 57.4 67.9 21.9 51.3 65.4 28.0 Withdrawal 73.6 86.1 30.7 73.0 83.0 56.7 Other 0.2 0.3 0.1 1.6 2.2 0.6
Mean number of methods known by respondents age 15-49 6.9 7.4 5.0 6.8 7.5 5.7 Number of respondents age 15-49 24,183 17,711 5,332 3,203 1,947 1,223
Continued...
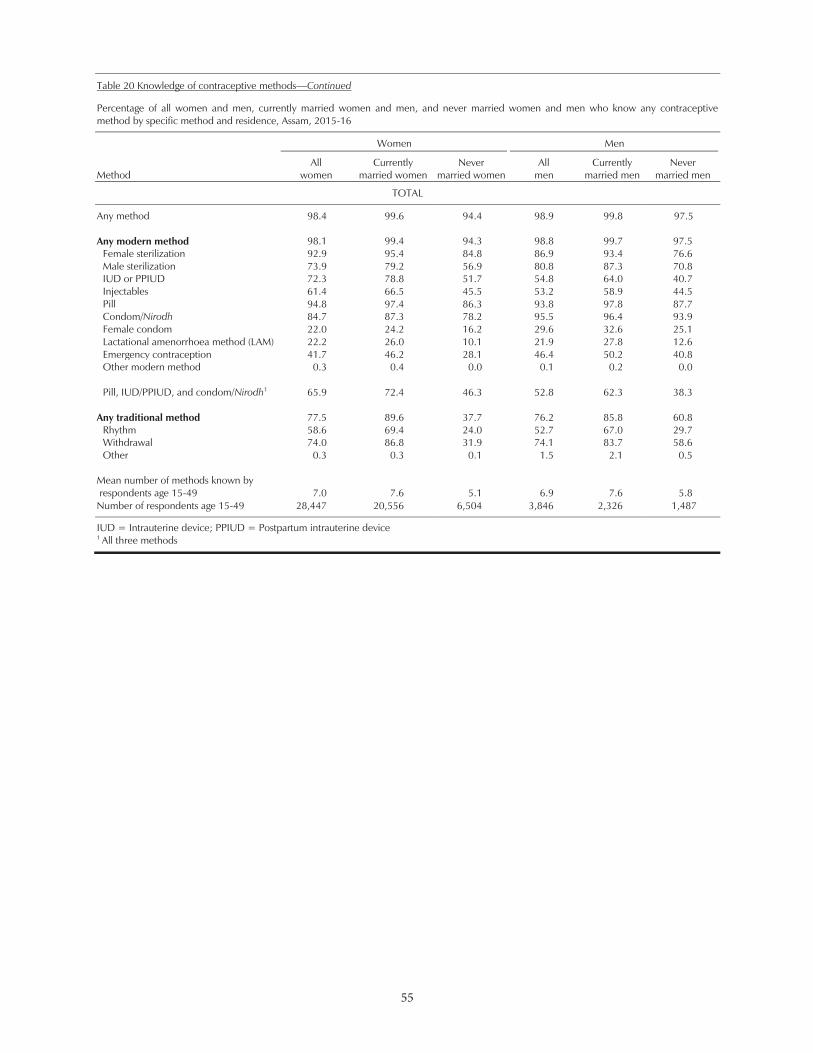
55
55
Table 20 Knowledge of contraceptive methods—Continued
Percentage of all women and men, currently married women and men, and never married women and men who know any contraceptive method by specific method and residence, Assam, 2015-16
Method
Women
Men
All women
Currently married women
Never married women
All men
Currently married men
Never married men
TOTAL
Any method 98.4 99.6 94.4 98.9 99.8 97.5 Any modern method 98.1 99.4 94.3 98.8 99.7 97.5
Female sterilization 92.9 95.4 84.8 86.9 93.4 76.6 Male sterilization 73.9 79.2 56.9 80.8 87.3 70.8 IUD or PPIUD 72.3 78.8 51.7 54.8 64.0 40.7 Injectables 61.4 66.5 45.5 53.2 58.9 44.5 Pill 94.8 97.4 86.3 93.8 97.8 87.7 Condom/Nirodh 84.7 87.3 78.2 95.5 96.4 93.9 Female condom 22.0 24.2 16.2 29.6 32.6 25.1 Lactational amenorrhoea method (LAM) 22.2 26.0 10.1 21.9 27.8 12.6 Emergency contraception 41.7 46.2 28.1 46.4 50.2 40.8 Other modern method 0.3 0.4 0.0 0.1 0.2 0.0
Pill, IUD/PPIUD, and condom/Nirodh1 65.9 72.4 46.3 52.8 62.3 38.3
Any traditional method 77.5 89.6 37.7 76.2 85.8 60.8
Rhythm 58.6 69.4 24.0 52.7 67.0 29.7 Withdrawal 74.0 86.8 31.9 74.1 83.7 58.6 Other 0.3 0.3 0.1 1.5 2.1 0.5
Mean number of methods known by respondents age 15-49 7.0 7.6 5.1 6.9 7.6 5.8 Number of respondents age 15-49 28,447 20,556 6,504 3,846 2,326 1,487
IUD = Intrauterine device; PPIUD = Postpartum intrauterine device
1 All three methods
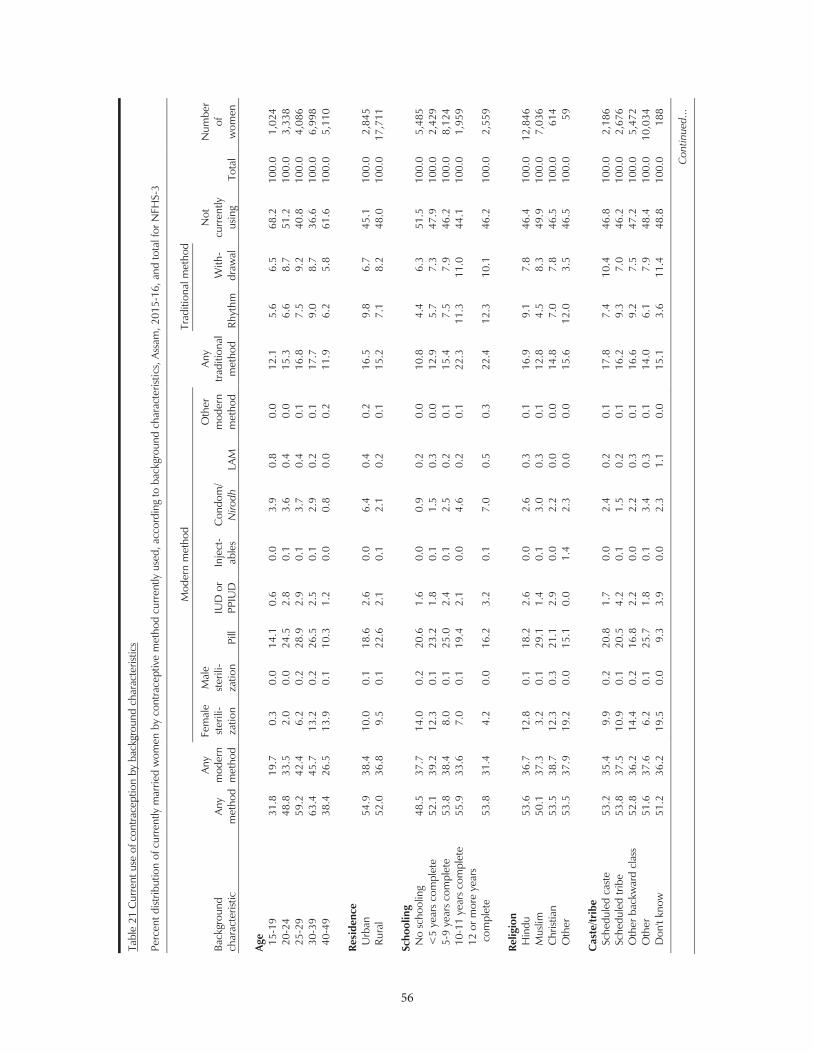
56
56
Tabl
e 21
Cur
rent
use
of c
ontra
cept
ion
by b
ackg
roun
d ch
arac
teris
tics
Perc
ent d
istrib
utio
n of
cur
rent
ly m
arrie
d w
omen
by
cont
race
ptiv
e m
etho
d cu
rren
tly u
sed,
acc
ordi
ng to
bac
kgro
und
char
acte
ristic
s, A
ssam
, 201
5-16
, and
tota
l for
NFH
S-3
Back
grou
nd
char
acte
ristic
An
y m
etho
d
Any
mod
ern
met
hod
Mod
ern
met
hod
Any
trad
ition
al
met
hod
Trad
ition
al m
etho
d
Not
cu
rren
tly
usin
g To
tal
Num
ber
of
wom
en
Fem
ale
ster
ili-
zatio
n
Mal
e st
erili
- za
tion
Pill
IUD
or
PPIU
D
Inje
ct-
able
s C
ondo
m/
Niro
dh
LAM
Oth
er
mod
ern
met
hod
Rhyt
hm
With
- dr
awal
Age
15
-19
31
.8
19.7
0.
3 0.
0 14
.1
0.6
0.0
3.9
0.8
0.0
12.1
5.
6 6.
5 68
.2
100.
0 1,
024
20-2
4
48.8
33
.5
2.0
0.0
24.5
2.
8 0.
1 3.
6 0.
4 0.
0 15
.3
6.6
8.7
51.2
10
0.0
3,33
8 25
-29
59
.2
42.4
6.
2 0.
2 28
.9
2.9
0.1
3.7
0.4
0.1
16.8
7.
5 9.
2 40
.8
100.
0 4,
086
30-3
9
63.4
45
.7
13.2
0.
2 26
.5
2.5
0.1
2.9
0.2
0.1
17.7
9.
0 8.
7 36
.6
100.
0 6,
998
40-4
9
38.4
26
.5
13.9
0.
1 10
.3
1.2
0.0
0.8
0.0
0.2
11.9
6.
2 5.
8 61
.6
100.
0 5,
110
Re
side
nce
U
rban
54
.9
38.4
10
.0
0.1
18.6
2.
6 0.
0 6.
4 0.
4 0.
2 16
.5
9.8
6.7
45.1
10
0.0
2,84
5 Ru
ral
52.0
36
.8
9.5
0.1
22.6
2.
1 0.
1 2.
1 0.
2 0.
1 15
.2
7.1
8.2
48.0
10
0.0
17,7
11
Sc
hool
ing
N
o sc
hool
ing
48
.5
37.7
14
.0
0.2
20.6
1.
6 0.
0 0.
9 0.
2 0.
0 10
.8
4.4
6.3
51.5
10
0.0
5,48
5 <
5 ye
ars
com
plet
e
52.1
39
.2
12.3
0.
1 23
.2
1.8
0.1
1.5
0.3
0.0
12.9
5.
7 7.
3 47
.9
100.
0 2,
429
5-9
year
s co
mpl
ete
53
.8
38.4
8.
0 0.
1 25
.0
2.4
0.1
2.5
0.2
0.1
15.4
7.
5 7.
9 46
.2
100.
0 8,
124
10-1
1 ye
ars
com
plet
e
55.9
33
.6
7.0
0.1
19.4
2.
1 0.
0 4.
6 0.
2 0.
1 22
.3
11.3
11
.0
44.1
10
0.0
1,95
9 12
or m
ore
year
s co
mpl
ete
53
.8
31.4
4.
2 0.
0 16
.2
3.2
0.1
7.0
0.5
0.3
22.4
12
.3
10.1
46
.2
100.
0 2,
559
Re
ligio
n
Hin
du
53.6
36
.7
12.8
0.
1 18
.2
2.6
0.0
2.6
0.3
0.1
16.9
9.
1 7.
8 46
.4
100.
0 12
,846
M
uslim
50
.1
37.3
3.
2 0.
1 29
.1
1.4
0.1
3.0
0.3
0.1
12.8
4.
5 8.
3 49
.9
100.
0 7,
036
Chr
istia
n
53.5
38
.7
12.3
0.
3 21
.1
2.9
0.0
2.2
0.0
0.0
14.8
7.
0 7.
8 46
.5
100.
0 61
4 O
ther
53
.5
37.9
19
.2
0.0
15.1
0.
0 1.
4 2.
3 0.
0 0.
0 15
.6
12.0
3.
5 46
.5
100.
0 59
Cas
te/tr
ibe
Sc
hedu
led
cast
e
53.2
35
.4
9.9
0.2
20.8
1.
7 0.
0 2.
4 0.
2 0.
1 17
.8
7.4
10.4
46
.8
100.
0 2,
186
Sche
dule
d tri
be
53.8
37
.5
10.9
0.
1 20
.5
4.2
0.1
1.5
0.2
0.1
16.2
9.
3 7.
0 46
.2
100.
0 2,
676
Oth
er b
ackw
ard
clas
s 52
.8
36.2
14
.4
0.2
16.8
2.
2 0.
0 2.
2 0.
3 0.
1 16
.6
9.2
7.5
47.2
10
0.0
5,47
2 O
ther
51
.6
37.6
6.
2 0.
1 25
.7
1.8
0.1
3.4
0.3
0.1
14.0
6.
1 7.
9 48
.4
100.
0 10
,034
D
on't
know
51
.2
36.2
19
.5
0.0
9.3
3.9
0.0
2.3
1.1
0.0
15.1
3.
6 11
.4
48.8
10
0.0
188
Con
tinue
d...
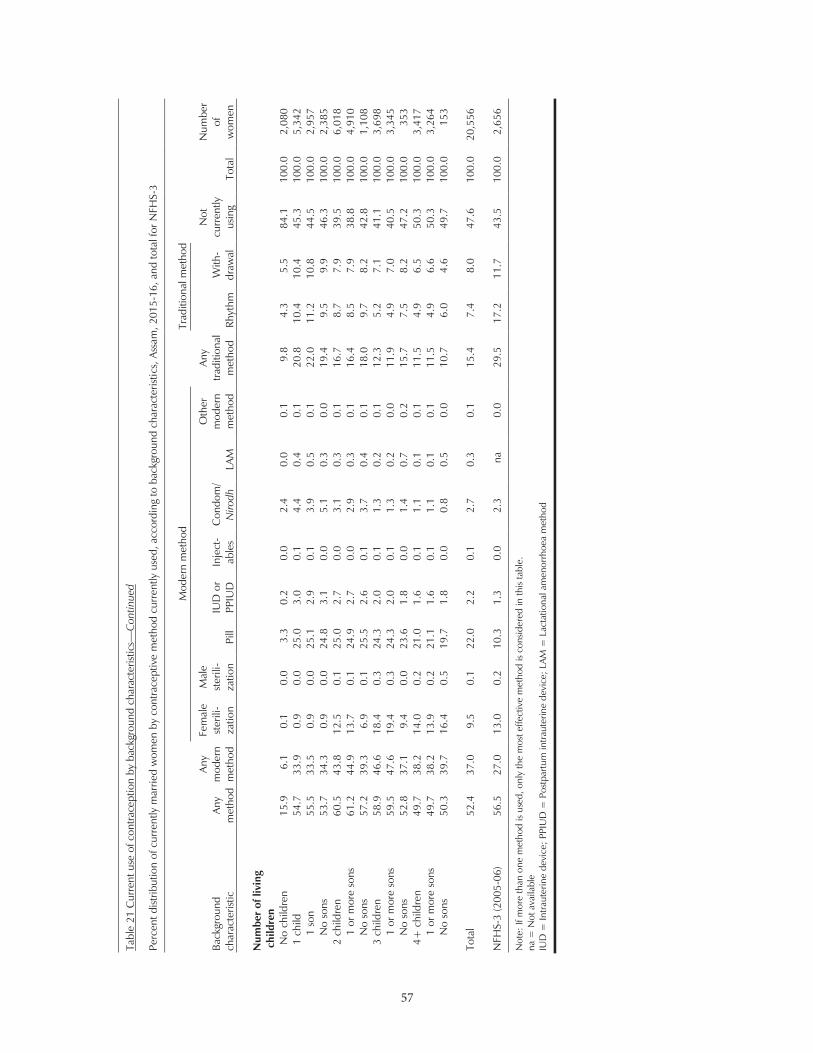
57
57
Tabl
e 21
Cur
rent
use
of c
ontra
cept
ion
by b
ackg
roun
d ch
arac
teris
tics—
Con
tinue
d
Perc
ent d
istrib
utio
n of
cur
rent
ly m
arrie
d w
omen
by
cont
race
ptiv
e m
etho
d cu
rren
tly u
sed,
acc
ordi
ng to
bac
kgro
und
char
acte
ristic
s, A
ssam
, 201
5-16
, and
tota
l for
NFH
S-3
Back
grou
nd
char
acte
ristic
An
y m
etho
d
Any
mod
ern
met
hod
Mod
ern
met
hod
Any
trad
ition
al
met
hod
Trad
ition
al m
etho
d
Not
cu
rren
tly
usin
g To
tal
Num
ber
of
wom
en
Fem
ale
ster
ili-
zatio
n
Mal
e st
erili
- za
tion
Pill
IUD
or
PPIU
D
Inje
ct-
able
s C
ondo
m/
Niro
dh
LAM
Oth
er
mod
ern
met
hod
Rhyt
hm
With
- dr
awal
Num
ber
of li
ving
c
hild
ren
No
child
ren
15
.9
6.1
0.1
0.0
3.3
0.2
0.0
2.4
0.0
0.1
9.8
4.3
5.5
84.1
10
0.0
2,08
0 1
child
54
.7
33.9
0.
9 0.
0 25
.0
3.0
0.1
4.4
0.4
0.1
20.8
10
.4
10.4
45
.3
100.
0 5,
342
1 so
n
55.5
33
.5
0.9
0.0
25.1
2.
9 0.
1 3.
9 0.
5 0.
1 22
.0
11.2
10
.8
44.5
10
0.0
2,95
7 N
o so
ns
53.7
34
.3
0.9
0.0
24.8
3.
1 0.
0 5.
1 0.
3 0.
0 19
.4
9.5
9.9
46.3
10
0.0
2,38
5 2
child
ren
60
.5
43.8
12
.5
0.1
25.0
2.
7 0.
0 3.
1 0.
3 0.
1 16
.7
8.7
7.9
39.5
10
0.0
6,01
8 1
or m
ore
sons
61
.2
44.9
13
.7
0.1
24.9
2.
7 0.
0 2.
9 0.
3 0.
1 16
.4
8.5
7.9
38.8
10
0.0
4,91
0 N
o so
ns
57.2
39
.3
6.9
0.1
25.5
2.
6 0.
1 3.
7 0.
4 0.
1 18
.0
9.7
8.2
42.8
10
0.0
1,10
8 3
child
ren
58
.9
46.6
18
.4
0.3
24.3
2.
0 0.
1 1.
3 0.
2 0.
1 12
.3
5.2
7.1
41.1
10
0.0
3,69
8 1
or m
ore
sons
59
.5
47.6
19
.4
0.3
24.3
2.
0 0.
1 1.
3 0.
2 0.
0 11
.9
4.9
7.0
40.5
10
0.0
3,34
5 N
o so
ns
52.8
37
.1
9.4
0.0
23.6
1.
8 0.
0 1.
4 0.
7 0.
2 15
.7
7.5
8.2
47.2
10
0.0
353
4+ c
hild
ren
49
.7
38.2
14
.0
0.2
21.0
1.
6 0.
1 1.
1 0.
1 0.
1 11
.5
4.9
6.5
50.3
10
0.0
3,41
7 1
or m
ore
sons
49
.7
38.2
13
.9
0.2
21.1
1.
6 0.
1 1.
1 0.
1 0.
1 11
.5
4.9
6.6
50.3
10
0.0
3,26
4 N
o so
ns
50.3
39
.7
16.4
0.
5 19
.7
1.8
0.0
0.8
0.5
0.0
10.7
6.
0 4.
6 49
.7
100.
0 15
3
Tota
l 52
.4
37.0
9.
5 0.
1 22
.0
2.2
0.1
2.7
0.3
0.1
15.4
7.
4 8.
0 47
.6
100.
0 20
,556
NFH
S-3
(200
5-06
) 56
.5
27.0
13
.0
0.2
10.3
1.
3 0.
0 2.
3 na
0.
0 29
.5
17.2
11
.7
43.5
10
0.0
2,65
6
Not
e: If
mor
e th
an o
ne m
etho
d is
used
, onl
y th
e m
ost e
ffect
ive
met
hod
is co
nsid
ered
in th
is ta
ble.
na
= N
ot a
vaila
ble
IUD
= In
traut
erin
e de
vice
; PPI
UD
= P
ostp
artu
m in
traut
erin
e de
vice
; LAM
= L
acta
tiona
l am
enor
rhoe
a m
etho
d
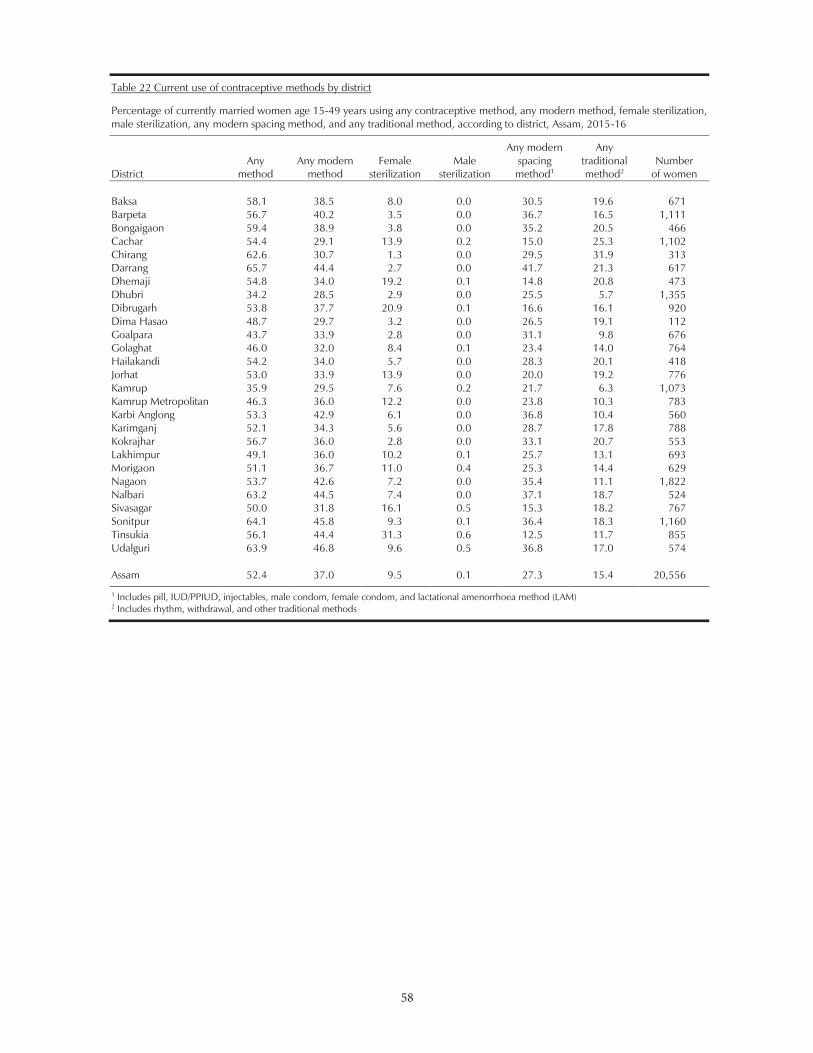
58
58
Table 22 Current use of contraceptive methods by district
Percentage of currently married women age 15-49 years using any contraceptive method, any modern method, female sterilization, male sterilization, any modern spacing method, and any traditional method, according to district, Assam, 2015-16
District Any
method Any modern
method Female
sterilization Male
sterilization
Any modern spacing method1
Any traditional method2
Number of women
Baksa 58.1 38.5 8.0 0.0 30.5 19.6 671 Barpeta 56.7 40.2 3.5 0.0 36.7 16.5 1,111 Bongaigaon 59.4 38.9 3.8 0.0 35.2 20.5 466 Cachar 54.4 29.1 13.9 0.2 15.0 25.3 1,102 Chirang 62.6 30.7 1.3 0.0 29.5 31.9 313 Darrang 65.7 44.4 2.7 0.0 41.7 21.3 617 Dhemaji 54.8 34.0 19.2 0.1 14.8 20.8 473 Dhubri 34.2 28.5 2.9 0.0 25.5 5.7 1,355 Dibrugarh 53.8 37.7 20.9 0.1 16.6 16.1 920 Dima Hasao 48.7 29.7 3.2 0.0 26.5 19.1 112 Goalpara 43.7 33.9 2.8 0.0 31.1 9.8 676 Golaghat 46.0 32.0 8.4 0.1 23.4 14.0 764 Hailakandi 54.2 34.0 5.7 0.0 28.3 20.1 418 Jorhat 53.0 33.9 13.9 0.0 20.0 19.2 776 Kamrup 35.9 29.5 7.6 0.2 21.7 6.3 1,073 Kamrup Metropolitan 46.3 36.0 12.2 0.0 23.8 10.3 783 Karbi Anglong 53.3 42.9 6.1 0.0 36.8 10.4 560 Karimganj 52.1 34.3 5.6 0.0 28.7 17.8 788 Kokrajhar 56.7 36.0 2.8 0.0 33.1 20.7 553 Lakhimpur 49.1 36.0 10.2 0.1 25.7 13.1 693 Morigaon 51.1 36.7 11.0 0.4 25.3 14.4 629 Nagaon 53.7 42.6 7.2 0.0 35.4 11.1 1,822 Nalbari 63.2 44.5 7.4 0.0 37.1 18.7 524 Sivasagar 50.0 31.8 16.1 0.5 15.3 18.2 767 Sonitpur 64.1 45.8 9.3 0.1 36.4 18.3 1,160 Tinsukia 56.1 44.4 31.3 0.6 12.5 11.7 855 Udalguri 63.9 46.8 9.6 0.5 36.8 17.0 574 Assam 52.4 37.0 9.5 0.1 27.3 15.4 20,556
1 Includes pill, IUD/PPIUD, injectables, male condom, female condom, and lactational amenorrhoea method (LAM) 2 Includes rhythm, withdrawal, and other traditional methods
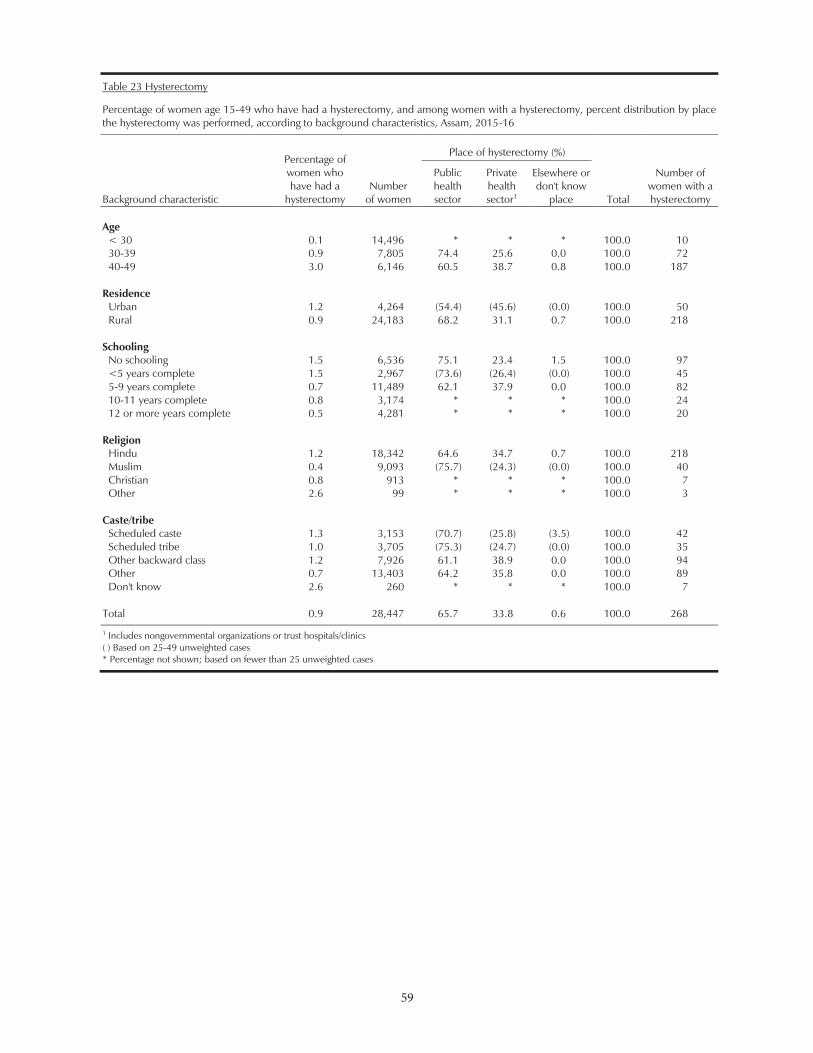
59
59
Table 23 Hysterectomy
Percentage of women age 15-49 who have had a hysterectomy, and among women with a hysterectomy, percent distribution by place the hysterectomy was performed, according to background characteristics, Assam, 2015-16
Background characteristic
Percentage of women who have had a
hysterectomy Number
of women
Place of hysterectomy (%)
Total
Number of women with a hysterectomy
Public health sector
Private health sector1
Elsewhere or don't know
place Age
< 30 0.1 14,496 * * * 100.0 10 30-39 0.9 7,805 74.4 25.6 0.0 100.0 72 40-49 3.0 6,146 60.5 38.7 0.8 100.0 187
Residence Urban 1.2 4,264 (54.4) (45.6) (0.0) 100.0 50 Rural 0.9 24,183 68.2 31.1 0.7 100.0 218
Schooling No schooling 1.5 6,536 75.1 23.4 1.5 100.0 97 <5 years complete 1.5 2,967 (73.6) (26.4) (0.0) 100.0 45 5-9 years complete 0.7 11,489 62.1 37.9 0.0 100.0 82 10-11 years complete 0.8 3,174 * * * 100.0 24 12 or more years complete 0.5 4,281 * * * 100.0 20
Religion Hindu 1.2 18,342 64.6 34.7 0.7 100.0 218 Muslim 0.4 9,093 (75.7) (24.3) (0.0) 100.0 40 Christian 0.8 913 * * * 100.0 7 Other 2.6 99 * * * 100.0 3
Caste/tribe Scheduled caste 1.3 3,153 (70.7) (25.8) (3.5) 100.0 42 Scheduled tribe 1.0 3,705 (75.3) (24.7) (0.0) 100.0 35 Other backward class 1.2 7,926 61.1 38.9 0.0 100.0 94 Other 0.7 13,403 64.2 35.8 0.0 100.0 89 Don't know 2.6 260 * * * 100.0 7
Total 0.9 28,447 65.7 33.8 0.6 100.0 268
1 Includes nongovernmental organizations or trust hospitals/clinics ( ) Based on 25-49 unweighted cases * Percentage not shown; based on fewer than 25 unweighted cases
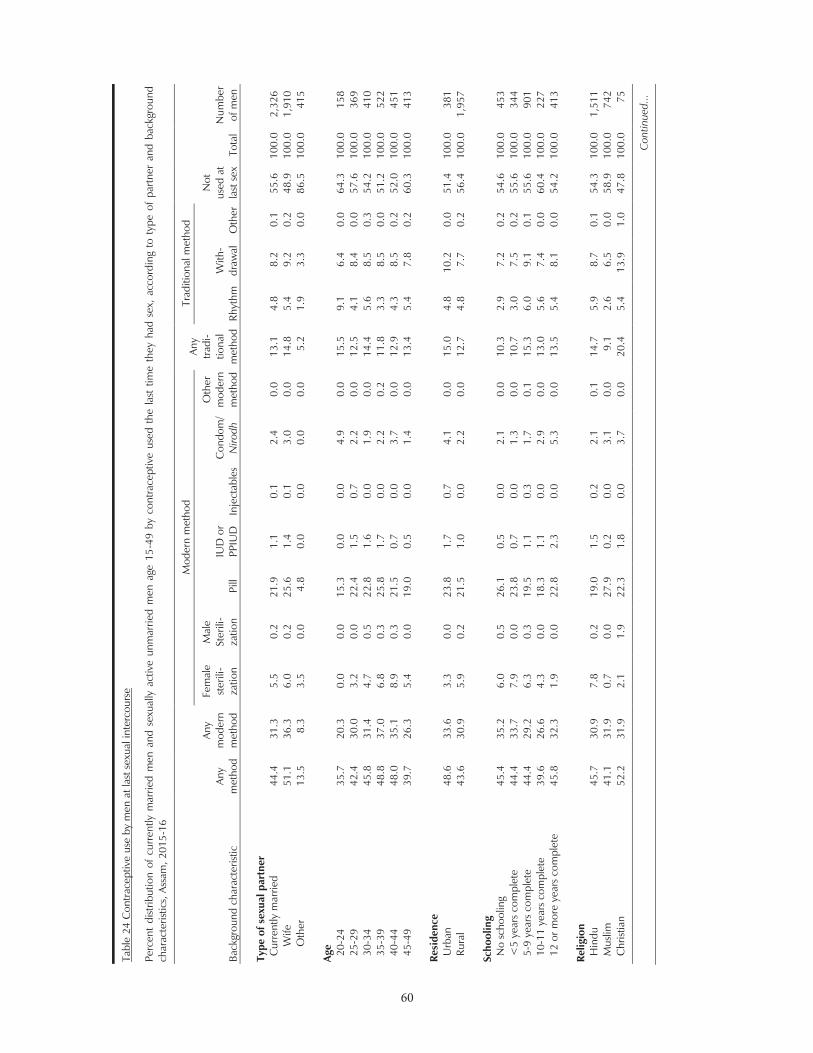
60
60
Tabl
e 24
Con
trac
eptiv
e us
e by
men
at l
ast s
exua
l int
erco
urse
Perc
ent
dist
ribut
ion
of c
urre
ntly
mar
ried
men
and
sex
ually
act
ive
unm
arrie
d m
en a
ge 1
5-49
by
cont
race
ptiv
e us
ed t
he la
st t
ime
they
had
sex
, ac
cord
ing
to t
ype
of p
artn
er a
nd b
ackg
roun
d ch
arac
teris
tics,
Ass
am, 2
015-
16
Back
grou
nd c
hara
cter
istic
An
y m
etho
d
Any
mod
ern
met
hod
Mod
ern
met
hod
Any
trad
i-tio
nal
met
hod
Trad
ition
al m
etho
d
Not
us
ed a
t la
st s
ex
Tota
l N
umbe
r of
men
Fem
ale
ster
ili-
zatio
n
Mal
e
Ster
ili-
zatio
n Pi
ll IU
D o
r PP
IUD
In
ject
able
s C
ondo
m/
Niro
dh
Oth
er
mod
ern
met
hod
Rhyt
hm
With
- dr
awal
O
ther
Type
of s
exua
l par
tner
C
urre
ntly
mar
ried
44
.4
31.3
5.
5 0.
2 21
.9
1.1
0.1
2.4
0.0
13.1
4.
8 8.
2 0.
1 55
.6
100.
0 2,
326
Wife
51
.1
36.3
6.
0 0.
2 25
.6
1.4
0.1
3.0
0.0
14.8
5.
4 9.
2 0.
2 48
.9
100.
0 1,
910
Oth
er
13.5
8.
3 3.
5 0.
0 4.
8 0.
0 0.
0 0.
0 0.
0 5.
2 1.
9 3.
3 0.
0 86
.5
100.
0 41
5
Age
20-2
4
35.7
20
.3
0.0
0.0
15.3
0.
0 0.
0 4.
9 0.
0 15
.5
9.1
6.4
0.0
64.3
10
0.0
158
25-2
9
42.4
30
.0
3.2
0.0
22.4
1.
5 0.
7 2.
2 0.
0 12
.5
4.1
8.4
0.0
57.6
10
0.0
369
30-3
4
45.8
31
.4
4.7
0.5
22.8
1.
6 0.
0 1.
9 0.
0 14
.4
5.6
8.5
0.3
54.2
10
0.0
410
35-3
9
48.8
37
.0
6.8
0.3
25.8
1.
7 0.
0 2.
2 0.
2 11
.8
3.3
8.5
0.0
51.2
10
0.0
522
40-4
4
48.0
35
.1
8.9
0.3
21.5
0.
7 0.
0 3.
7 0.
0 12
.9
4.3
8.5
0.2
52.0
10
0.0
451
45-4
9
39.7
26
.3
5.4
0.0
19.0
0.
5 0.
0 1.
4 0.
0 13
.4
5.4
7.8
0.2
60.3
10
0.0
413
Re
side
nce
Urb
an
48.6
33
.6
3.3
0.0
23.8
1.
7 0.
7 4.
1 0.
0 15
.0
4.8
10.2
0.
0 51
.4
100.
0 38
1 Ru
ral
43.6
30
.9
5.9
0.2
21.5
1.
0 0.
0 2.
2 0.
0 12
.7
4.8
7.7
0.2
56.4
10
0.0
1,95
7
Scho
olin
g
N
o sc
hool
ing
45
.4
35.2
6.
0 0.
5 26
.1
0.5
0.0
2.1
0.0
10.3
2.
9 7.
2 0.
2 54
.6
100.
0 45
3 <
5 ye
ars
com
plet
e
44.4
33
.7
7.9
0.0
23.8
0.
7 0.
0 1.
3 0.
0 10
.7
3.0
7.5
0.2
55.6
10
0.0
344
5-9
year
s co
mpl
ete
44
.4
29.2
6.
3 0.
3 19
.5
1.1
0.3
1.7
0.1
15.3
6.
0 9.
1 0.
1 55
.6
100.
0 90
1 10
-11
year
s co
mpl
ete
39
.6
26.6
4.
3 0.
0 18
.3
1.1
0.0
2.9
0.0
13.0
5.
6 7.
4 0.
0 60
.4
100.
0 22
7 12
or m
ore
year
s co
mpl
ete
45
.8
32.3
1.
9 0.
0 22
.8
2.3
0.0
5.3
0.0
13.5
5.
4 8.
1 0.
0 54
.2
100.
0 41
3
Relig
ion
Hin
du
45.7
30
.9
7.8
0.2
19.0
1.
5 0.
2 2.
1 0.
1 14
.7
5.9
8.7
0.1
54.3
10
0.0
1,51
1 M
uslim
41
.1
31.9
0.
7 0.
0 27
.9
0.2
0.0
3.1
0.0
9.1
2.6
6.5
0.0
58.9
10
0.0
742
Chr
istia
n
52.2
31
.9
2.1
1.9
22.3
1.
8 0.
0 3.
7 0.
0 20
.4
5.4
13.9
1.
0 47
.8
100.
0 75
Con
tinue
d...
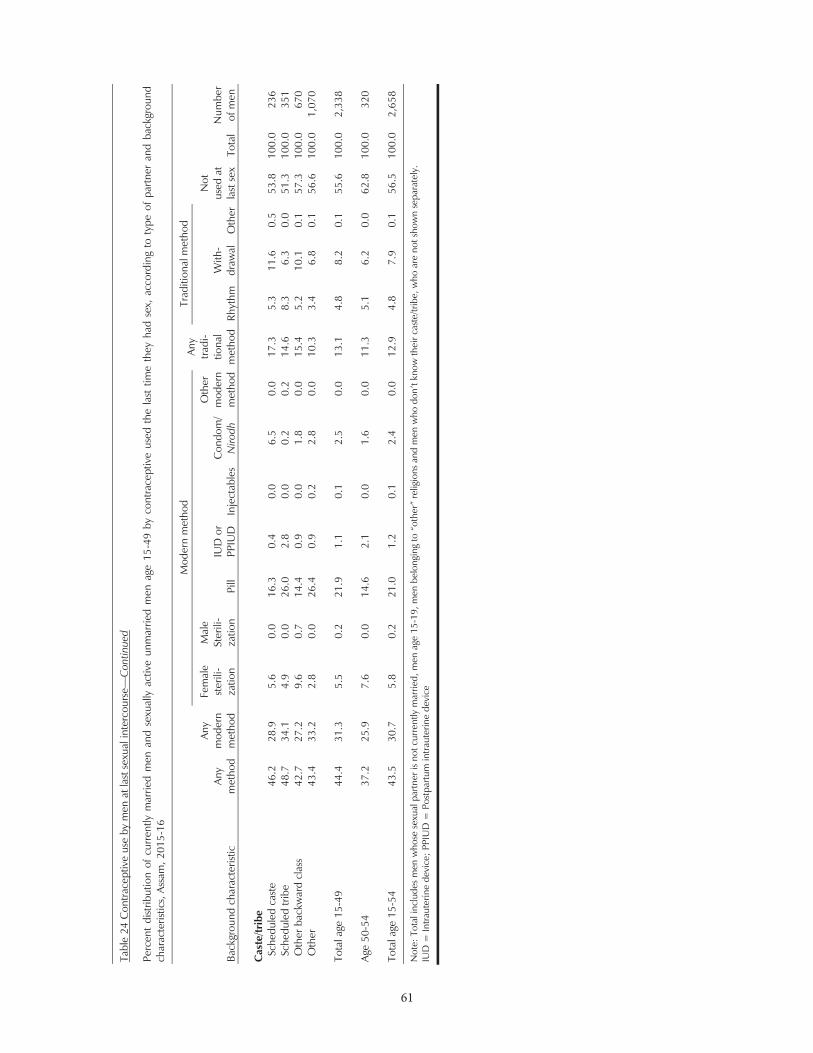
61
Tabl
e 24
Con
trac
eptiv
e us
e by
men
at l
ast s
exua
l int
erco
urse—
Con
tinue
d
Perc
ent
dist
ribut
ion
of c
urre
ntly
mar
ried
men
and
sex
ually
act
ive
unm
arrie
d m
en a
ge 1
5-49
by
cont
race
ptiv
e us
ed t
he la
st t
ime
they
had
sex
, ac
cord
ing
to t
ype
of p
artn
er a
nd b
ackg
roun
d ch
arac
teris
tics,
Ass
am, 2
015-
16
Back
grou
nd c
hara
cter
istic
An
y m
etho
d
Any
mod
ern
met
hod
Mod
ern
met
hod
Any
trad
i-tio
nal
met
hod
Trad
ition
al m
etho
d
Not
us
ed a
t la
st s
ex
Tota
l N
umbe
r of
men
Fem
ale
ster
ili-
zatio
n
Mal
e
Ster
ili-
zatio
n Pi
ll IU
D o
r PP
IUD
In
ject
able
s C
ondo
m/
Niro
dh
Oth
er
mod
ern
met
hod
Rhyt
hm
With
- dr
awal
O
ther
Caste/tribe
Sc
hedu
led
cast
e
46.2
28
.9
5.6
0.0
16.3
0.
4 0.
0 6.
5 0.
0 17
.3
5.3
11.6
0.
5 53
.8
100.
0 23
6 Sc
hedu
led
tribe
48
.7
34.1
4.
9 0.
0 26
.0
2.8
0.0
0.2
0.2
14.6
8.
3 6.
3 0.
0 51
.3
100.
0 35
1 O
ther
bac
kwar
d cl
ass
42
.7
27.2
9.
6 0.
7 14
.4
0.9
0.0
1.8
0.0
15.4
5.
2 10
.1
0.1
57.3
10
0.0
670
Oth
er
43.4
33
.2
2.8
0.0
26.4
0.
9 0.
2 2.
8 0.
0 10
.3
3.4
6.8
0.1
56.6
10
0.0
1,07
0
Tota
l age
15-
49
44.4
31
.3
5.5
0.2
21.9
1.
1 0.
1 2.
5 0.
0 13
.1
4.8
8.2
0.1
55.6
10
0.0
2,33
8
Age
50-5
4
37.2
25
.9
7.6
0.0
14.6
2.
1 0.
0 1.
6 0.
0 11
.3
5.1
6.2
0.0
62.8
10
0.0
320
To
tal a
ge 1
5-54
43
.5
30.7
5.
8 0.
2 21
.0
1.2
0.1
2.4
0.0
12.9
4.
8 7.
9 0.
1 56
.5
100.
0 2,
658
Not
e: T
otal
incl
udes
men
who
se s
exua
l par
tner
is n
ot c
urre
ntly
mar
ried,
men
age
15-
19,
IU
D =
Intra
uter
ine
devi
ce; P
PIU
D =
Pos
tpar
tum
intra
uter
ine
devi
ce
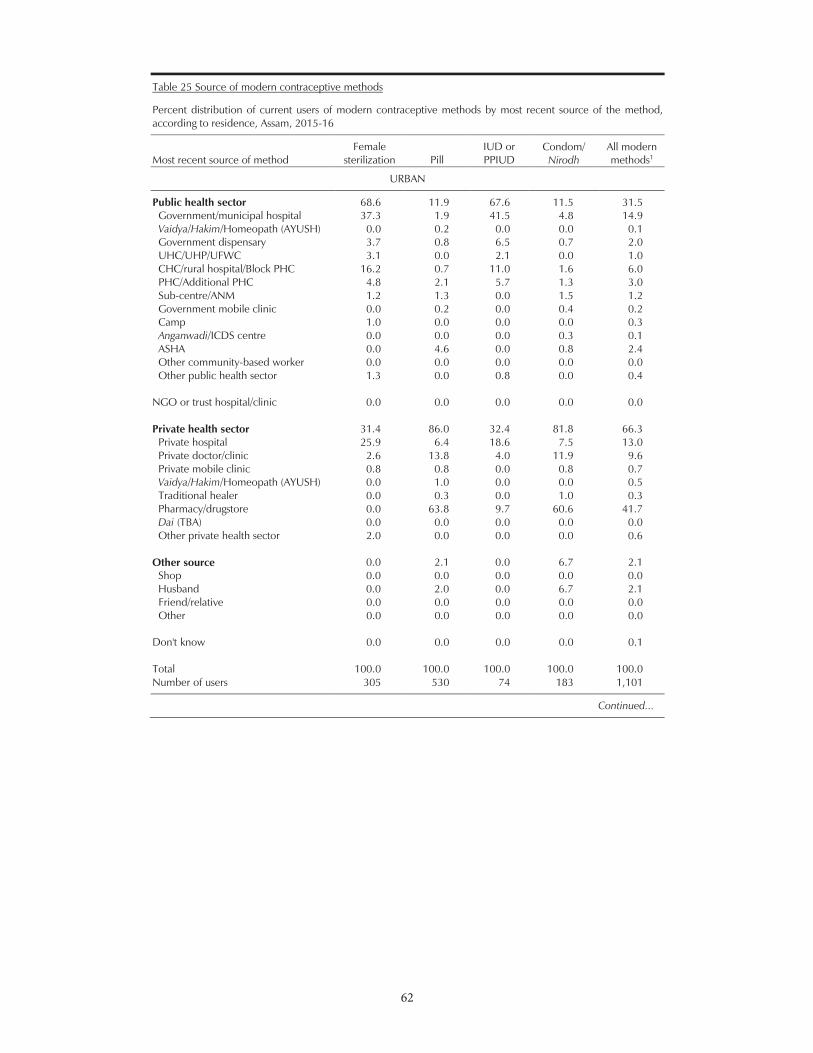
62
62
Table 25 Source of modern contraceptive methods
Percent distribution of current users of modern contraceptive methods by most recent source of the method, according to residence, Assam, 2015-16
Most recent source of method Female
sterilization Pill IUD or PPIUD
Condom/ Nirodh
All modern methods1
URBAN
Public health sector 68.6 11.9 67.6 11.5 31.5 Government/municipal hospital 37.3 1.9 41.5 4.8 14.9 Vaidya/Hakim/Homeopath (AYUSH) 0.0 0.2 0.0 0.0 0.1 Government dispensary 3.7 0.8 6.5 0.7 2.0 UHC/UHP/UFWC 3.1 0.0 2.1 0.0 1.0 CHC/rural hospital/Block PHC 16.2 0.7 11.0 1.6 6.0 PHC/Additional PHC 4.8 2.1 5.7 1.3 3.0 Sub-centre/ANM 1.2 1.3 0.0 1.5 1.2 Government mobile clinic 0.0 0.2 0.0 0.4 0.2 Camp 1.0 0.0 0.0 0.0 0.3 Anganwadi/ICDS centre 0.0 0.0 0.0 0.3 0.1 ASHA 0.0 4.6 0.0 0.8 2.4 Other community-based worker 0.0 0.0 0.0 0.0 0.0 Other public health sector 1.3 0.0 0.8 0.0 0.4
NGO or trust hospital/clinic 0.0 0.0 0.0 0.0 0.0 Private health sector 31.4 86.0 32.4 81.8 66.3
Private hospital 25.9 6.4 18.6 7.5 13.0 Private doctor/clinic 2.6 13.8 4.0 11.9 9.6 Private mobile clinic 0.8 0.8 0.0 0.8 0.7 Vaidya/Hakim/Homeopath (AYUSH) 0.0 1.0 0.0 0.0 0.5 Traditional healer 0.0 0.3 0.0 1.0 0.3 Pharmacy/drugstore 0.0 63.8 9.7 60.6 41.7 Dai (TBA) 0.0 0.0 0.0 0.0 0.0 Other private health sector 2.0 0.0 0.0 0.0 0.6
Other source 0.0 2.1 0.0 6.7 2.1
Shop 0.0 0.0 0.0 0.0 0.0 Husband 0.0 2.0 0.0 6.7 2.1 Friend/relative 0.0 0.0 0.0 0.0 0.0 Other 0.0 0.0 0.0 0.0 0.0
Don't know 0.0 0.0 0.0 0.0 0.1 Total 100.0 100.0 100.0 100.0 100.0 Number of users 305 530 74 183 1,101
Continued...
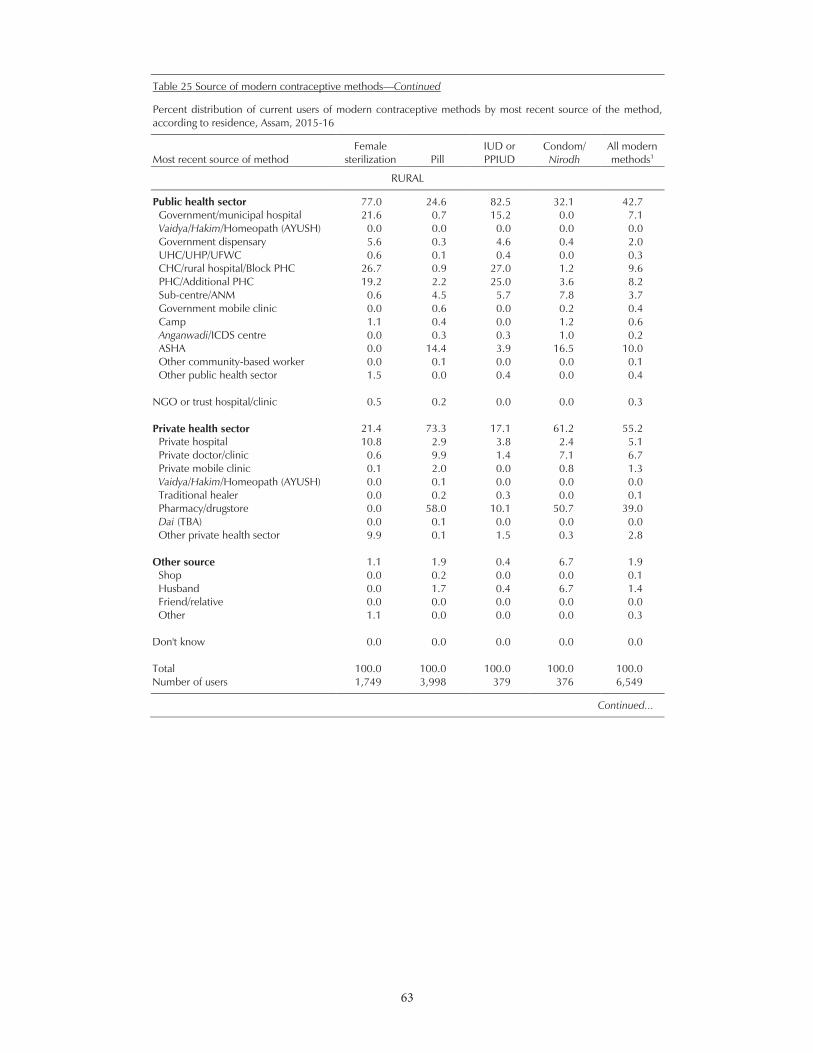
63
63
Table 25 Source of modern contraceptive methods—Continued
Percent distribution of current users of modern contraceptive methods by most recent source of the method, according to residence, Assam, 2015-16
Most recent source of method Female
sterilization Pill IUD or PPIUD
Condom/ Nirodh
All modern methods1
RURAL
Public health sector 77.0 24.6 82.5 32.1 42.7 Government/municipal hospital 21.6 0.7 15.2 0.0 7.1 Vaidya/Hakim/Homeopath (AYUSH) 0.0 0.0 0.0 0.0 0.0 Government dispensary 5.6 0.3 4.6 0.4 2.0 UHC/UHP/UFWC 0.6 0.1 0.4 0.0 0.3 CHC/rural hospital/Block PHC 26.7 0.9 27.0 1.2 9.6 PHC/Additional PHC 19.2 2.2 25.0 3.6 8.2 Sub-centre/ANM 0.6 4.5 5.7 7.8 3.7 Government mobile clinic 0.0 0.6 0.0 0.2 0.4 Camp 1.1 0.4 0.0 1.2 0.6 Anganwadi/ICDS centre 0.0 0.3 0.3 1.0 0.2 ASHA 0.0 14.4 3.9 16.5 10.0 Other community-based worker 0.0 0.1 0.0 0.0 0.1 Other public health sector 1.5 0.0 0.4 0.0 0.4
NGO or trust hospital/clinic 0.5 0.2 0.0 0.0 0.3 Private health sector 21.4 73.3 17.1 61.2 55.2
Private hospital 10.8 2.9 3.8 2.4 5.1 Private doctor/clinic 0.6 9.9 1.4 7.1 6.7 Private mobile clinic 0.1 2.0 0.0 0.8 1.3 Vaidya/Hakim/Homeopath (AYUSH) 0.0 0.1 0.0 0.0 0.0 Traditional healer 0.0 0.2 0.3 0.0 0.1 Pharmacy/drugstore 0.0 58.0 10.1 50.7 39.0 Dai (TBA) 0.0 0.1 0.0 0.0 0.0 Other private health sector 9.9 0.1 1.5 0.3 2.8
Other source 1.1 1.9 0.4 6.7 1.9
Shop 0.0 0.2 0.0 0.0 0.1 Husband 0.0 1.7 0.4 6.7 1.4 Friend/relative 0.0 0.0 0.0 0.0 0.0 Other 1.1 0.0 0.0 0.0 0.3
Don't know 0.0 0.0 0.0 0.0 0.0 Total 100.0 100.0 100.0 100.0 100.0 Number of users 1,749 3,998 379 376 6,549
Continued...
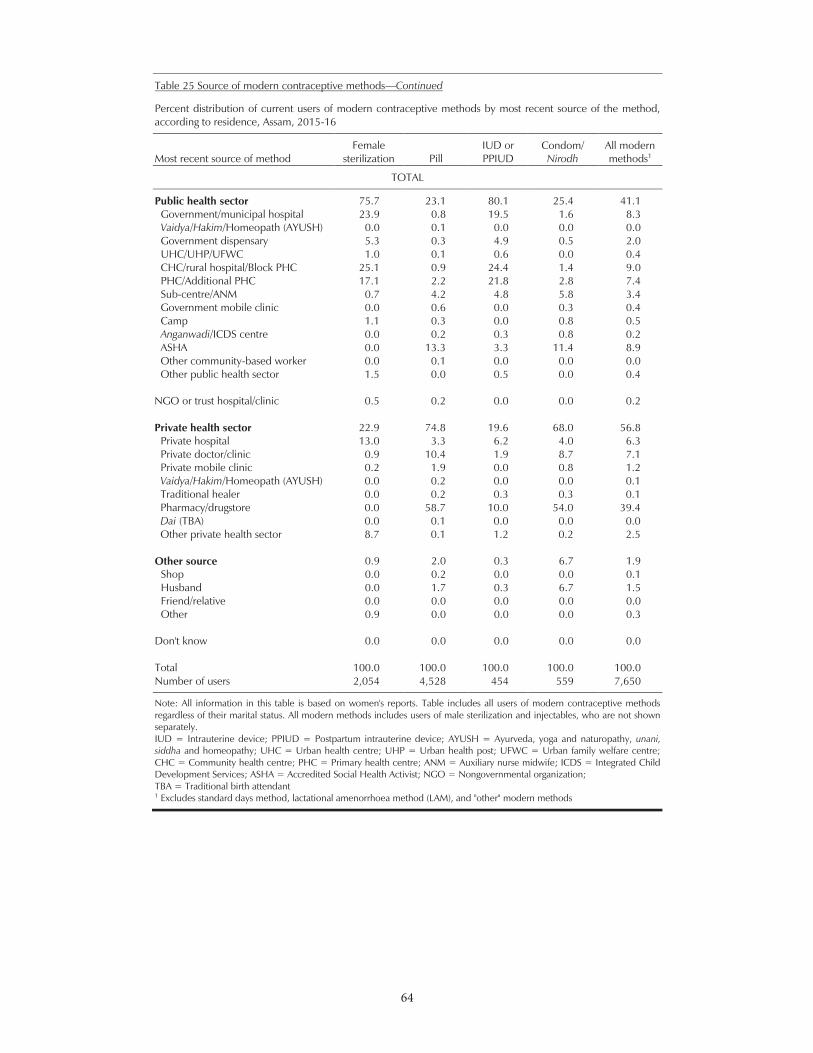
64
64
Table 25 Source of modern contraceptive methods—Continued
Percent distribution of current users of modern contraceptive methods by most recent source of the method, according to residence, Assam, 2015-16
Most recent source of method Female
sterilization Pill IUD or PPIUD
Condom/ Nirodh
All modern methods1
TOTAL
Public health sector 75.7 23.1 80.1 25.4 41.1 Government/municipal hospital 23.9 0.8 19.5 1.6 8.3 Vaidya/Hakim/Homeopath (AYUSH) 0.0 0.1 0.0 0.0 0.0 Government dispensary 5.3 0.3 4.9 0.5 2.0 UHC/UHP/UFWC 1.0 0.1 0.6 0.0 0.4 CHC/rural hospital/Block PHC 25.1 0.9 24.4 1.4 9.0 PHC/Additional PHC 17.1 2.2 21.8 2.8 7.4 Sub-centre/ANM 0.7 4.2 4.8 5.8 3.4 Government mobile clinic 0.0 0.6 0.0 0.3 0.4 Camp 1.1 0.3 0.0 0.8 0.5 Anganwadi/ICDS centre 0.0 0.2 0.3 0.8 0.2 ASHA 0.0 13.3 3.3 11.4 8.9 Other community-based worker 0.0 0.1 0.0 0.0 0.0 Other public health sector 1.5 0.0 0.5 0.0 0.4
NGO or trust hospital/clinic 0.5 0.2 0.0 0.0 0.2 Private health sector 22.9 74.8 19.6 68.0 56.8
Private hospital 13.0 3.3 6.2 4.0 6.3 Private doctor/clinic 0.9 10.4 1.9 8.7 7.1 Private mobile clinic 0.2 1.9 0.0 0.8 1.2 Vaidya/Hakim/Homeopath (AYUSH) 0.0 0.2 0.0 0.0 0.1 Traditional healer 0.0 0.2 0.3 0.3 0.1 Pharmacy/drugstore 0.0 58.7 10.0 54.0 39.4 Dai (TBA) 0.0 0.1 0.0 0.0 0.0 Other private health sector 8.7 0.1 1.2 0.2 2.5
Other source 0.9 2.0 0.3 6.7 1.9
Shop 0.0 0.2 0.0 0.0 0.1 Husband 0.0 1.7 0.3 6.7 1.5 Friend/relative 0.0 0.0 0.0 0.0 0.0 Other 0.9 0.0 0.0 0.0 0.3
Don't know 0.0 0.0 0.0 0.0 0.0 Total 100.0 100.0 100.0 100.0 100.0 Number of users 2,054 4,528 454 559 7,650
Note: All information in this table is based on women's reports. Table includes all users of modern contraceptive methods regardless of their marital status. All modern methods includes users of male sterilization and injectables, who are not shown separately. IUD = Intrauterine device; PPIUD = Postpartum intrauterine device; AYUSH = Ayurveda, yoga and naturopathy, unani, siddha and homeopathy; UHC = Urban health centre; UHP = Urban health post; UFWC = Urban family welfare centre; CHC = Community health centre; PHC = Primary health centre; ANM = Auxiliary nurse midwife; ICDS = Integrated Child Development Services; ASHA = Accredited Social Health Activist; NGO = Nongovernmental organization; TBA = Traditional birth attendant 1 Excludes standard days method, lactational amenorrhoea method (LAM), and "other" modern methods
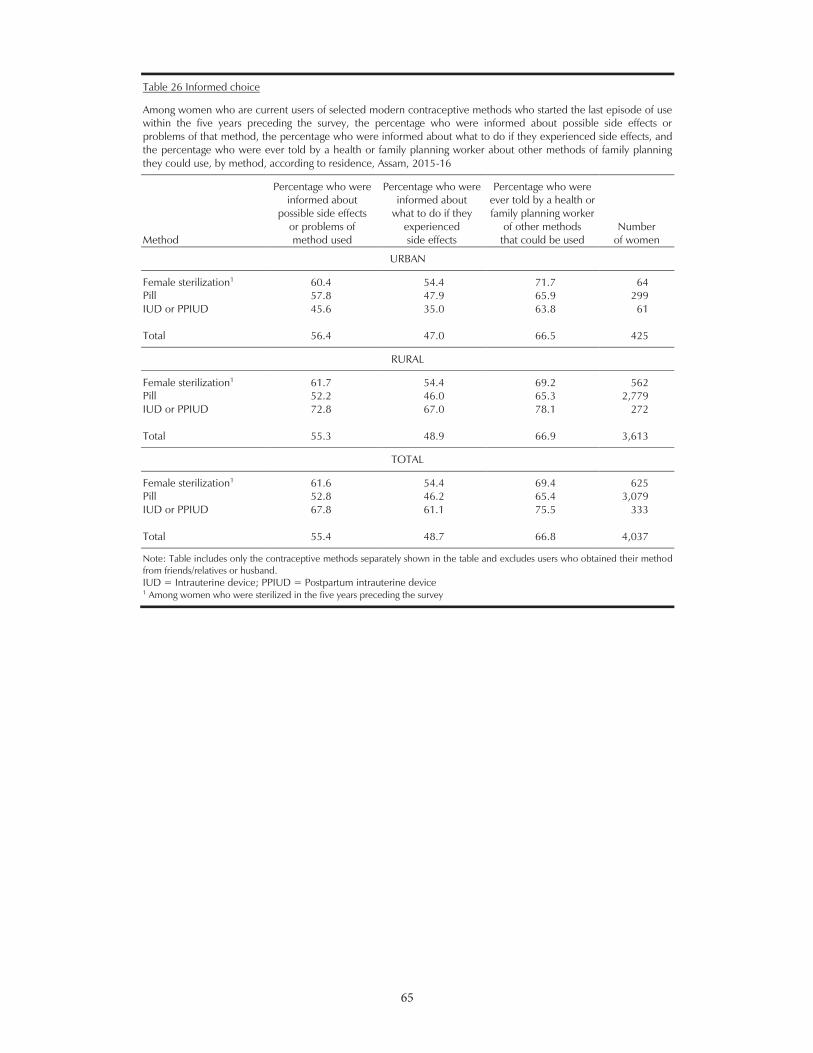
65
65
Table 26 Informed choice
Among women who are current users of selected modern contraceptive methods who started the last episode of use within the five years preceding the survey, the percentage who were informed about possible side effects or problems of that method, the percentage who were informed about what to do if they experienced side effects, and the percentage who were ever told by a health or family planning worker about other methods of family planning they could use, by method, according to residence, Assam, 2015-16
Method
Percentage who were informed about
possible side effects or problems of method used
Percentage who were informed about
what to do if they experienced side effects
Percentage who were ever told by a health or family planning worker
of other methods that could be used
Number of women
URBAN
Female sterilization1 60.4 54.4 71.7 64 Pill 57.8 47.9 65.9 299 IUD or PPIUD 45.6 35.0 63.8 61
Total 56.4 47.0 66.5 425
RURAL
Female sterilization1 61.7 54.4 69.2 562 Pill 52.2 46.0 65.3 2,779 IUD or PPIUD 72.8 67.0 78.1 272
Total 55.3 48.9 66.9 3,613
TOTAL
Female sterilization1 61.6 54.4 69.4 625 Pill 52.8 46.2 65.4 3,079 IUD or PPIUD 67.8 61.1 75.5 333
Total 55.4 48.7 66.8 4,037
Note: Table includes only the contraceptive methods separately shown in the table and excludes users who obtained their method from friends/relatives or husband. IUD = Intrauterine device; PPIUD = Postpartum intrauterine device 1 Among women who were sterilized in the five years preceding the survey
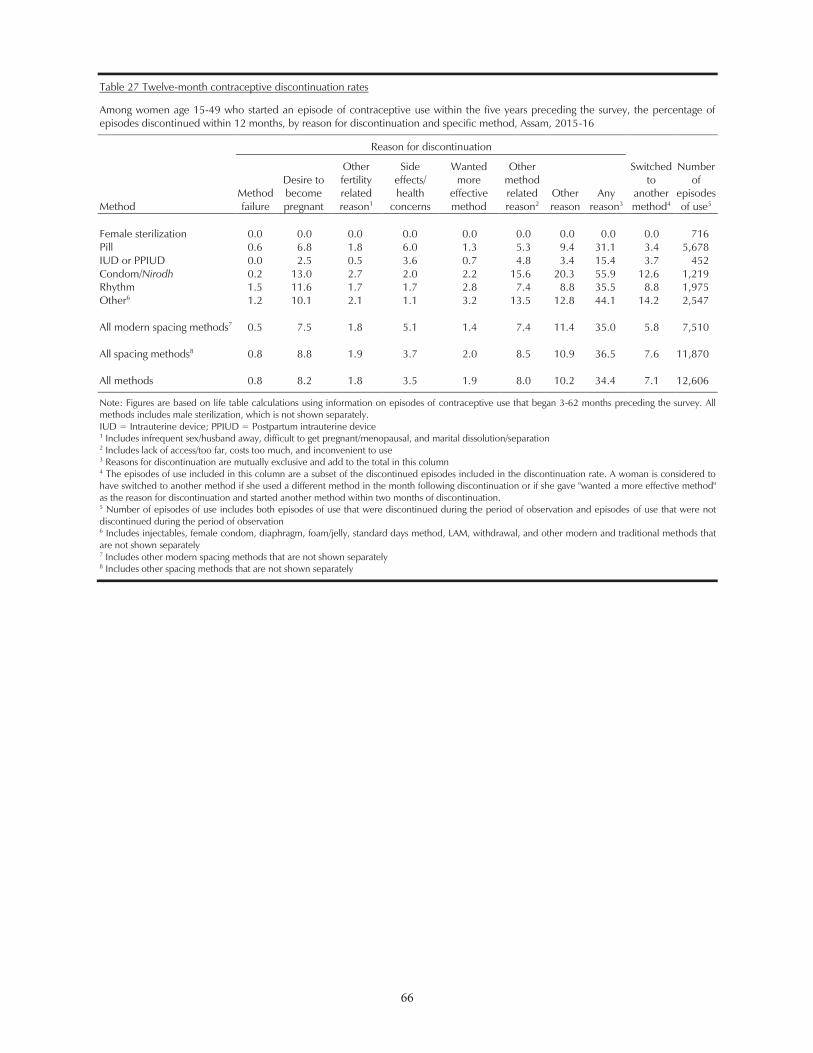
66
66
Table 27 Twelve-month contraceptive discontinuation rates
Among women age 15-49 who started an episode of contraceptive use within the five years preceding the survey, the percentage of episodes discontinued within 12 months, by reason for discontinuation and specific method, Assam, 2015-16
Method
Reason for discontinuation
Switched to
another method4
Number of
episodes of use5
Method failure
Desire to become pregnant
Other fertility related reason1
Side effects/ health
concerns
Wanted more
effective method
Other method related reason2
Other reason
Any reason3
Female sterilization 0.0 0.0 0.0 0.0 0.0 0.0 0.0 0.0 0.0 716 Pill 0.6 6.8 1.8 6.0 1.3 5.3 9.4 31.1 3.4 5,678 IUD or PPIUD 0.0 2.5 0.5 3.6 0.7 4.8 3.4 15.4 3.7 452 Condom/Nirodh 0.2 13.0 2.7 2.0 2.2 15.6 20.3 55.9 12.6 1,219 Rhythm 1.5 11.6 1.7 1.7 2.8 7.4 8.8 35.5 8.8 1,975 Other6 1.2 10.1 2.1 1.1 3.2 13.5 12.8 44.1 14.2 2,547 All modern spacing methods7 0.5 7.5 1.8 5.1 1.4 7.4 11.4 35.0 5.8 7,510 All spacing methods8 0.8 8.8 1.9 3.7 2.0 8.5 10.9 36.5 7.6 11,870 All methods 0.8 8.2 1.8 3.5 1.9 8.0 10.2 34.4 7.1 12,606
Note: Figures are based on life table calculations using information on episodes of contraceptive use that began 3-62 months preceding the survey. All methods includes male sterilization, which is not shown separately. IUD = Intrauterine device; PPIUD = Postpartum intrauterine device
1 Includes infrequent sex/husband away, difficult to get pregnant/menopausal, and marital dissolution/separation 2 Includes lack of access/too far, costs too much, and inconvenient to use 3 Reasons for discontinuation are mutually exclusive and add to the total in this column 4 The episodes of use included in this column are a subset of the discontinued episodes included in the discontinuation rate. A woman is considered to have switched to another method if she used a different method in the month following discontinuation or if she gave "wanted a more effective method" as the reason for discontinuation and started another method within two months of discontinuation. 5 Number of episodes of use includes both episodes of use that were discontinued during the period of observation and episodes of use that were not discontinued during the period of observation 6 Includes injectables, female condom, diaphragm, foam/jelly, standard days method, LAM, withdrawal, and other modern and traditional methods that are not shown separately 7 Includes other modern spacing methods that are not shown separately 8 Includes other spacing methods that are not shown separately
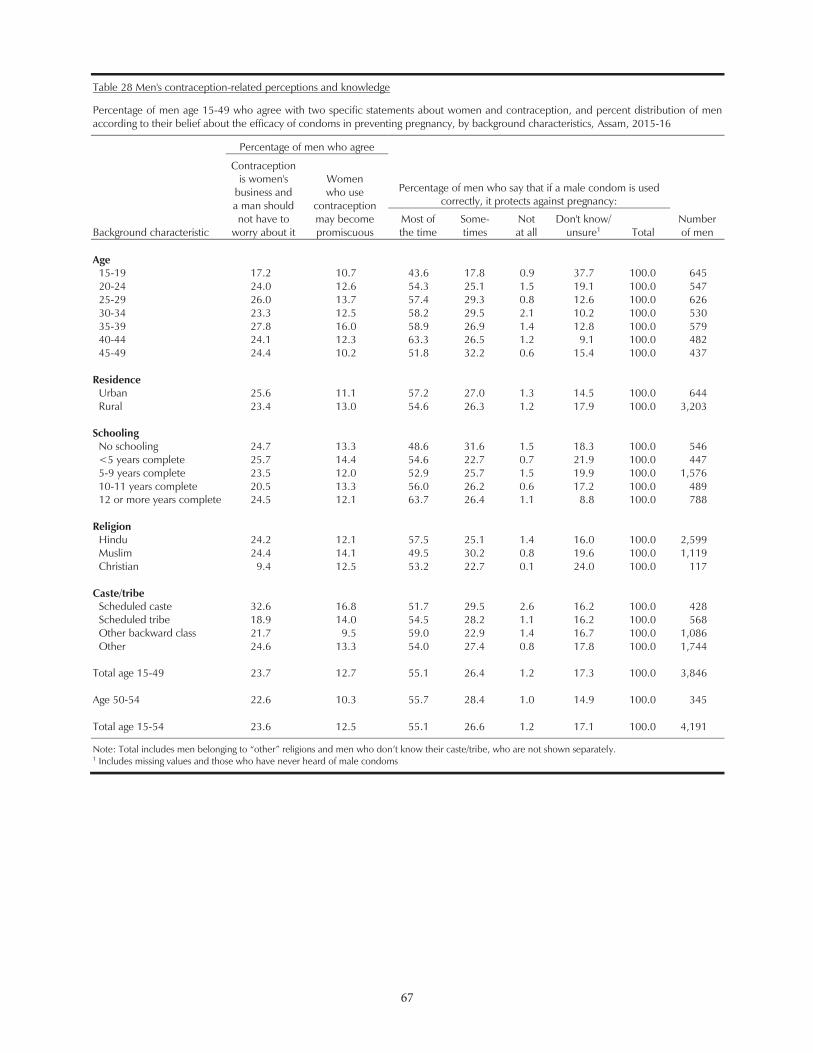
67
Table 28 Men's contraception-related perceptions and knowledge
Percentage of men age 15-49 who agree with two specific statements about women and contraception, and percent distribution of men according to their belief about the efficacy of condoms in preventing pregnancy, by background characteristics, Assam, 2015-16
Background characteristic
Percentage of men who agree
Percentage of men who say that if a male condom is used correctly, it protects against pregnancy:
Number of men
Contraception is women's
business and a man should not have to
worry about it
Women who use
contraception may become promiscuous
Most of the time
Some- times
Not at all
Don't know/ unsure1 Total
Age
15-19 17.2 10.7 43.6 17.8 0.9 37.7 100.0 645 20-24 24.0 12.6 54.3 25.1 1.5 19.1 100.0 547 25-29 26.0 13.7 57.4 29.3 0.8 12.6 100.0 626 30-34 23.3 12.5 58.2 29.5 2.1 10.2 100.0 530 35-39 27.8 16.0 58.9 26.9 1.4 12.8 100.0 579 40-44 24.1 12.3 63.3 26.5 1.2 9.1 100.0 482 45-49 24.4 10.2 51.8 32.2 0.6 15.4 100.0 437
Residence
Urban 25.6 11.1 57.2 27.0 1.3 14.5 100.0 644 Rural 23.4 13.0 54.6 26.3 1.2 17.9 100.0 3,203
Schooling
No schooling 24.7 13.3 48.6 31.6 1.5 18.3 100.0 546 <5 years complete 25.7 14.4 54.6 22.7 0.7 21.9 100.0 447 5-9 years complete 23.5 12.0 52.9 25.7 1.5 19.9 100.0 1,576 10-11 years complete 20.5 13.3 56.0 26.2 0.6 17.2 100.0 489 12 or more years complete 24.5 12.1 63.7 26.4 1.1 8.8 100.0 788
Religion
Hindu 24.2 12.1 57.5 25.1 1.4 16.0 100.0 2,599 Muslim 24.4 14.1 49.5 30.2 0.8 19.6 100.0 1,119 Christian 9.4 12.5 53.2 22.7 0.1 24.0 100.0 117
Caste/tribe
Scheduled caste 32.6 16.8 51.7 29.5 2.6 16.2 100.0 428 Scheduled tribe 18.9 14.0 54.5 28.2 1.1 16.2 100.0 568 Other backward class 21.7 9.5 59.0 22.9 1.4 16.7 100.0 1,086 Other 24.6 13.3 54.0 27.4 0.8 17.8 100.0 1,744
Total age 15-49 23.7 12.7 55.1 26.4 1.2 17.3 100.0 3,846
Age 50-54 22.6 10.3 55.7 28.4 1.0 14.9 100.0 345
Total age 15-54 23.6 12.5 55.1 26.6 1.2 17.1 100.0 4,191
y. 1 Includes missing values and those who have never heard of male condoms
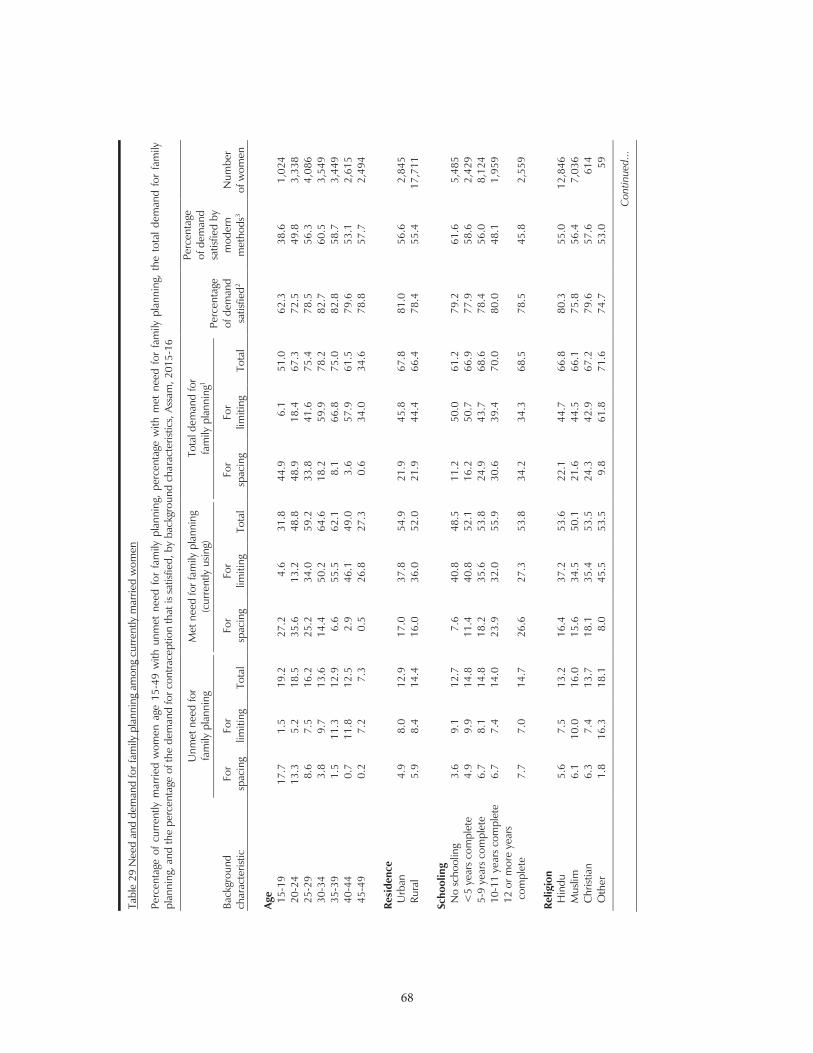
68
68
Tabl
e 29
Nee
d an
d de
man
d fo
r fam
ily p
lann
ing
amon
g cu
rren
tly m
arrie
d w
omen
Perc
enta
ge o
f cu
rren
tly m
arrie
d w
omen
age
15-
49 w
ith u
nmet
nee
d fo
r fa
mily
pla
nnin
g, p
erce
ntag
e w
ith m
et n
eed
for
fam
ily p
lann
ing,
the
tot
al d
eman
d fo
r fa
mily
pl
anni
ng, a
nd th
e pe
rcen
tage
of t
he d
eman
d fo
r con
trac
eptio
n th
at is
sat
isfie
d, b
y ba
ckgr
ound
cha
ract
erist
ics,
Ass
am, 2
015-
16
Back
grou
nd
char
acte
ristic
Unm
et n
eed
for
fam
ily p
lann
ing
Met
nee
d fo
r fam
ily p
lann
ing
(cur
rent
ly u
sing)
Tota
l dem
and
for
fam
ily p
lann
ing1
Perc
enta
ge
of d
eman
d sa
tisfie
d2
Perc
enta
ge
of d
eman
d sa
tisfie
d by
m
oder
n m
etho
ds3
Num
ber
of w
omen
Fo
r sp
acin
g Fo
r lim
iting
To
tal
For
spac
ing
For
limiti
ng
Tota
l Fo
r sp
acin
g Fo
r lim
iting
To
tal
Ag
e
15
-19
17
.7
1.5
19.2
27
.2
4.6
31.8
44
.9
6.1
51.0
62
.3
38.6
1,
024
20-2
4
13.3
5.
2 18
.5
35.6
13
.2
48.8
48
.9
18.4
67
.3
72.5
49
.8
3,33
8 25
-29
8.
6 7.
5 16
.2
25.2
34
.0
59.2
33
.8
41.6
75
.4
78.5
56
.3
4,08
6 30
-34
3.
8 9.
7 13
.6
14.4
50
.2
64.6
18
.2
59.9
78
.2
82.7
60
.5
3,54
9 35
-39
1.
5 11
.3
12.9
6.
6 55
.5
62.1
8.
1 66
.8
75.0
82
.8
58.7
3,
449
40-4
4
0.7
11.8
12
.5
2.9
46.1
49
.0
3.6
57.9
61
.5
79.6
53
.1
2,61
5 45
-49
0.
2 7.
2 7.
3 0.
5 26
.8
27.3
0.
6 34
.0
34.6
78
.8
57.7
2,
494
Re
side
nce
Urb
an
4.9
8.0
12.9
17
.0
37.8
54
.9
21.9
45
.8
67.8
81
.0
56.6
2,
845
Rura
l 5.
9 8.
4 14
.4
16.0
36
.0
52.0
21
.9
44.4
66
.4
78.4
55
.4
17,7
11
Sc
hool
ing
No
scho
olin
g
3.6
9.1
12.7
7.
6 40
.8
48.5
11
.2
50.0
61
.2
79.2
61
.6
5,48
5 <
5 ye
ars
com
plet
e
4.9
9.9
14.8
11
.4
40.8
52
.1
16.2
50
.7
66.9
77
.9
58.6
2,
429
5-9
year
s co
mpl
ete
6.
7 8.
1 14
.8
18.2
35
.6
53.8
24
.9
43.7
68
.6
78.4
56
.0
8,12
4 10
-11
year
s co
mpl
ete
6.
7 7.
4 14
.0
23.9
32
.0
55.9
30
.6
39.4
70
.0
80.0
48
.1
1,95
9 12
or m
ore
year
s
com
plet
e
7.7
7.0
14.7
26
.6
27.3
53
.8
34.2
34
.3
68.5
78
.5
45.8
2,
559
Re
ligio
n
H
indu
5.
6 7.
5 13
.2
16.4
37
.2
53.6
22
.1
44.7
66
.8
80.3
55
.0
12,8
46
Mus
lim
6.1
10.0
16
.0
15.6
34
.5
50.1
21
.6
44.5
66
.1
75.8
56
.4
7,03
6 C
hrist
ian
6.
3 7.
4 13
.7
18.1
35
.4
53.5
24
.3
42.9
67
.2
79.6
57
.6
614
Oth
er
1.8
16.3
18
.1
8.0
45.5
53
.5
9.8
61.8
71
.6
74.7
53
.0
59
Con
tinue
d...
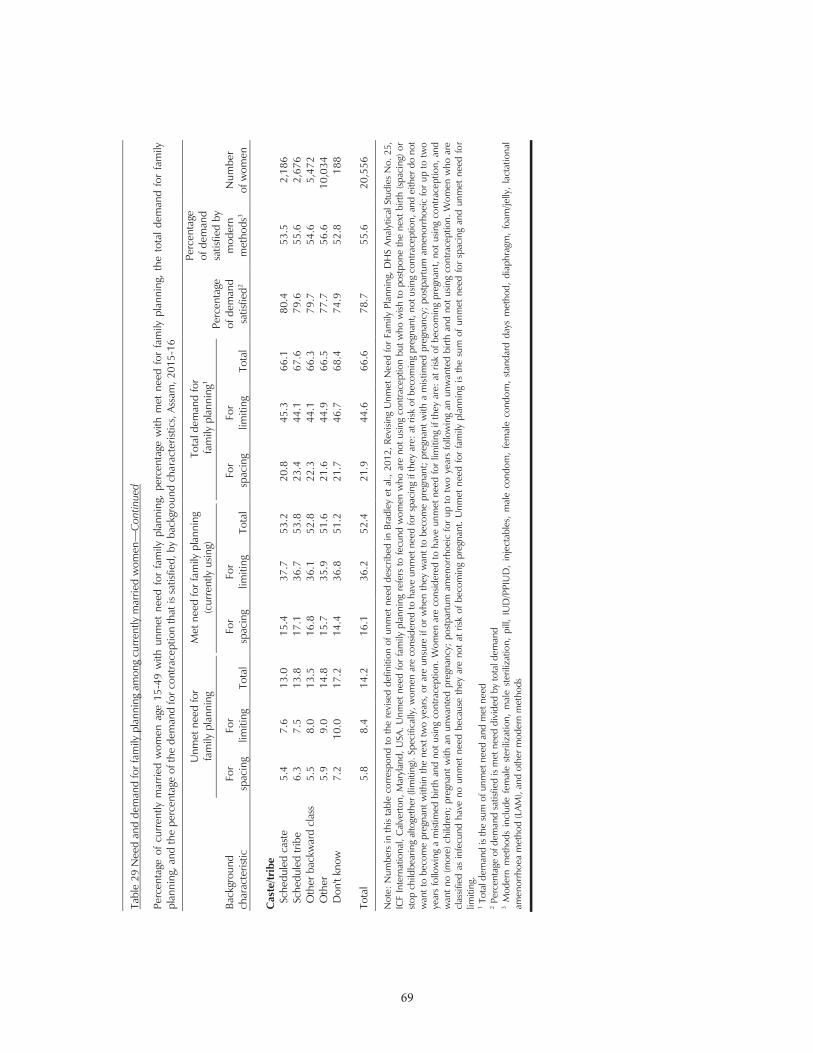
69
69
Ta
ble
29 N
eed
and
dem
and
for f
amily
pla
nnin
g am
ong
curr
ently
mar
ried
wom
en—
Con
tinue
d
Perc
enta
ge o
f cu
rren
tly m
arrie
d w
omen
age
15-
49 w
ith u
nmet
nee
d fo
r fa
mily
pla
nnin
g, p
erce
ntag
e w
ith m
et n
eed
for
fam
ily p
lann
ing,
the
tot
al d
eman
d fo
r fa
mily
pl
anni
ng, a
nd th
e pe
rcen
tage
of t
he d
eman
d fo
r con
trac
eptio
n th
at is
sat
isfie
d, b
y ba
ckgr
ound
cha
ract
erist
ics,
Ass
am, 2
015-
16
Back
grou
nd
char
acte
ristic
Unm
et n
eed
for
fam
ily p
lann
ing
Met
nee
d fo
r fam
ily p
lann
ing
(cur
rent
ly u
sing)
Tota
l dem
and
for
fam
ily p
lann
ing1
Perc
enta
ge
of d
eman
d sa
tisfie
d2
Perc
enta
ge
of d
eman
d sa
tisfie
d by
m
oder
n m
etho
ds3
Num
ber
of w
omen
Fo
r sp
acin
g Fo
r lim
iting
To
tal
For
spac
ing
For
limiti
ng
Tota
l Fo
r sp
acin
g Fo
r lim
iting
To
tal
C
aste
/trib
e
Sc
hedu
led
cast
e
5.4
7.6
13.0
15
.4
37.7
53
.2
20.8
45
.3
66.1
80
.4
53.5
2,
186
Sche
dule
d tri
be
6.3
7.5
13.8
17
.1
36.7
53
.8
23.4
44
.1
67.6
79
.6
55.6
2,
676
Oth
er b
ackw
ard
clas
s
5.5
8.0
13.5
16
.8
36.1
52
.8
22.3
44
.1
66.3
79
.7
54.6
5,
472
Oth
er
5.9
9.0
14.8
15
.7
35.9
51
.6
21.6
44
.9
66.5
77
.7
56.6
10
,034
D
on't
know
7.
2 10
.0
17.2
14
.4
36.8
51
.2
21.7
46
.7
68.4
74
.9
52.8
18
8
To
tal
5.8
8.4
14.2
16
.1
36.2
52
.4
21.9
44
.6
66.6
78
.7
55.6
20
,556
N
ote:
Num
bers
in th
is ta
ble
corr
espo
nd to
the
revi
sed
defin
ition
of u
nmet
nee
d de
scrib
ed in
Bra
dley
et a
l., 2
012,
Rev
ising
Unm
et N
eed
for
Fam
ily P
lann
ing,
DH
S An
alyt
ical
Stu
dies
No.
25,
IC
F In
tern
atio
nal,
Cal
verto
n, M
aryl
and,
USA
. Unm
et n
eed
for
fam
ily p
lann
ing
refe
rs to
fecu
nd w
omen
who
are
not
usin
g co
ntra
cept
ion
but w
ho w
ish to
pos
tpon
e th
e ne
xt b
irth
(spac
ing)
or
stop
chi
ldbe
arin
g al
toge
ther
(lim
iting
). Sp
ecifi
cally
, wom
en a
re c
onsid
ered
to h
ave
unm
et n
eed
for s
paci
ng if
they
are
: at r
isk
of b
ecom
ing
preg
nant
, not
usin
g co
ntra
cept
ion,
and
eith
er d
o no
t w
ant t
o be
com
e pr
egna
nt w
ithin
the
next
two
year
s, o
r ar
e un
sure
if o
r w
hen
they
wan
t to
beco
me
preg
nant
; pr
egna
nt w
ith a
mis
timed
pre
gnan
cy;
post
partu
m a
men
orrh
oeic
for
up to
two
year
s fo
llow
ing
a m
istim
ed b
irth
and
not u
sing
cont
race
ptio
n. W
omen
are
con
sider
ed to
hav
e un
met
nee
d fo
r lim
iting
if th
ey a
re:
at r
isk o
f bec
omin
g pr
egna
nt, n
ot u
sing
cont
race
ptio
n, a
nd
wan
t no
(mor
e) c
hild
ren;
pre
gnan
t with
an
unw
ante
d pr
egna
ncy;
pos
tpar
tum
am
enor
rhoe
ic fo
r up
to tw
o ye
ars
follo
win
g an
unw
ante
d bi
rth a
nd n
ot u
sing
cont
race
ptio
n. W
omen
who
are
cl
assif
ied
as in
fecu
nd h
ave
no u
nmet
nee
d be
caus
e th
ey a
re n
ot a
t ris
k of
bec
omin
g pr
egna
nt.
Unm
et n
eed
for
fam
ily p
lann
ing
is t
he s
um o
f un
met
nee
d fo
r sp
acin
g an
d un
met
nee
d fo
r lim
iting
. 1 T
otal
dem
and
is th
e su
m o
f unm
et n
eed
and
met
nee
d 2 P
erce
ntag
e of
dem
and
satis
fied
is m
et n
eed
divi
ded
by to
tal d
eman
d 3
Mod
ern
met
hods
inc
lude
fem
ale
ster
iliza
tion,
mal
e st
erili
zatio
n, p
ill,
IUD
/PPI
UD
, in
ject
able
s, m
ale
cond
om,
fem
ale
cond
om,
stan
dard
day
s m
etho
d, d
iaph
ragm
, fo
am/je
lly,
lact
atio
nal
amen
orrh
oea
met
hod
(LAM
), an
d ot
her m
oder
n m
etho
ds
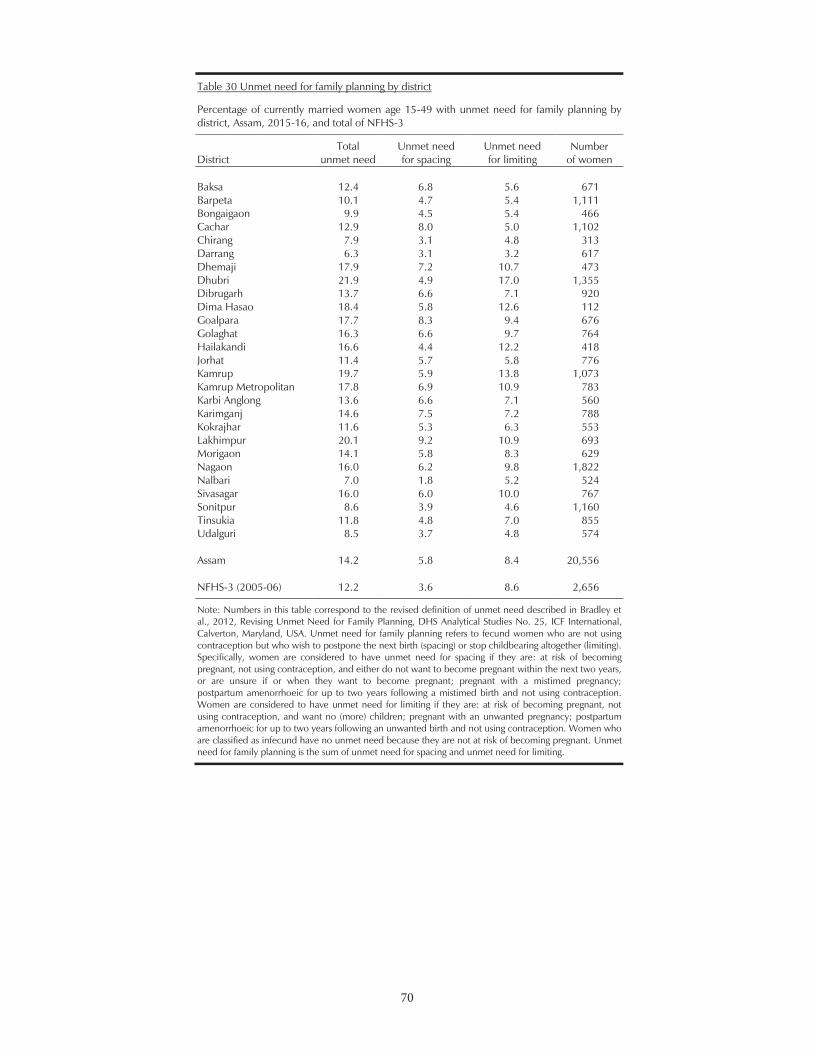
70
70
Table 30 Unmet need for family planning by district
Percentage of currently married women age 15-49 with unmet need for family planning by district, Assam, 2015-16, and total of NFHS-3
District Total
unmet need Unmet need for spacing
Unmet need for limiting
Number of women
Baksa 12.4 6.8 5.6 671 Barpeta 10.1 4.7 5.4 1,111 Bongaigaon 9.9 4.5 5.4 466 Cachar 12.9 8.0 5.0 1,102 Chirang 7.9 3.1 4.8 313 Darrang 6.3 3.1 3.2 617 Dhemaji 17.9 7.2 10.7 473 Dhubri 21.9 4.9 17.0 1,355 Dibrugarh 13.7 6.6 7.1 920 Dima Hasao 18.4 5.8 12.6 112 Goalpara 17.7 8.3 9.4 676 Golaghat 16.3 6.6 9.7 764 Hailakandi 16.6 4.4 12.2 418 Jorhat 11.4 5.7 5.8 776 Kamrup 19.7 5.9 13.8 1,073 Kamrup Metropolitan 17.8 6.9 10.9 783 Karbi Anglong 13.6 6.6 7.1 560 Karimganj 14.6 7.5 7.2 788 Kokrajhar 11.6 5.3 6.3 553 Lakhimpur 20.1 9.2 10.9 693 Morigaon 14.1 5.8 8.3 629 Nagaon 16.0 6.2 9.8 1,822 Nalbari 7.0 1.8 5.2 524 Sivasagar 16.0 6.0 10.0 767 Sonitpur 8.6 3.9 4.6 1,160 Tinsukia 11.8 4.8 7.0 855 Udalguri 8.5 3.7 4.8 574 Assam 14.2 5.8 8.4 20,556 NFHS-3 (2005-06) 12.2 3.6 8.6 2,656
Note: Numbers in this table correspond to the revised definition of unmet need described in Bradley et al., 2012, Revising Unmet Need for Family Planning, DHS Analytical Studies No. 25, ICF International, Calverton, Maryland, USA. Unmet need for family planning refers to fecund women who are not using contraception but who wish to postpone the next birth (spacing) or stop childbearing altogether (limiting). Specifically, women are considered to have unmet need for spacing if they are: at risk of becoming pregnant, not using contraception, and either do not want to become pregnant within the next two years, or are unsure if or when they want to become pregnant; pregnant with a mistimed pregnancy; postpartum amenorrhoeic for up to two years following a mistimed birth and not using contraception. Women are considered to have unmet need for limiting if they are: at risk of becoming pregnant, not using contraception, and want no (more) children; pregnant with an unwanted pregnancy; postpartum amenorrhoeic for up to two years following an unwanted birth and not using contraception. Women who are classified as infecund have no unmet need because they are not at risk of becoming pregnant. Unmet need for family planning is the sum of unmet need for spacing and unmet need for limiting.
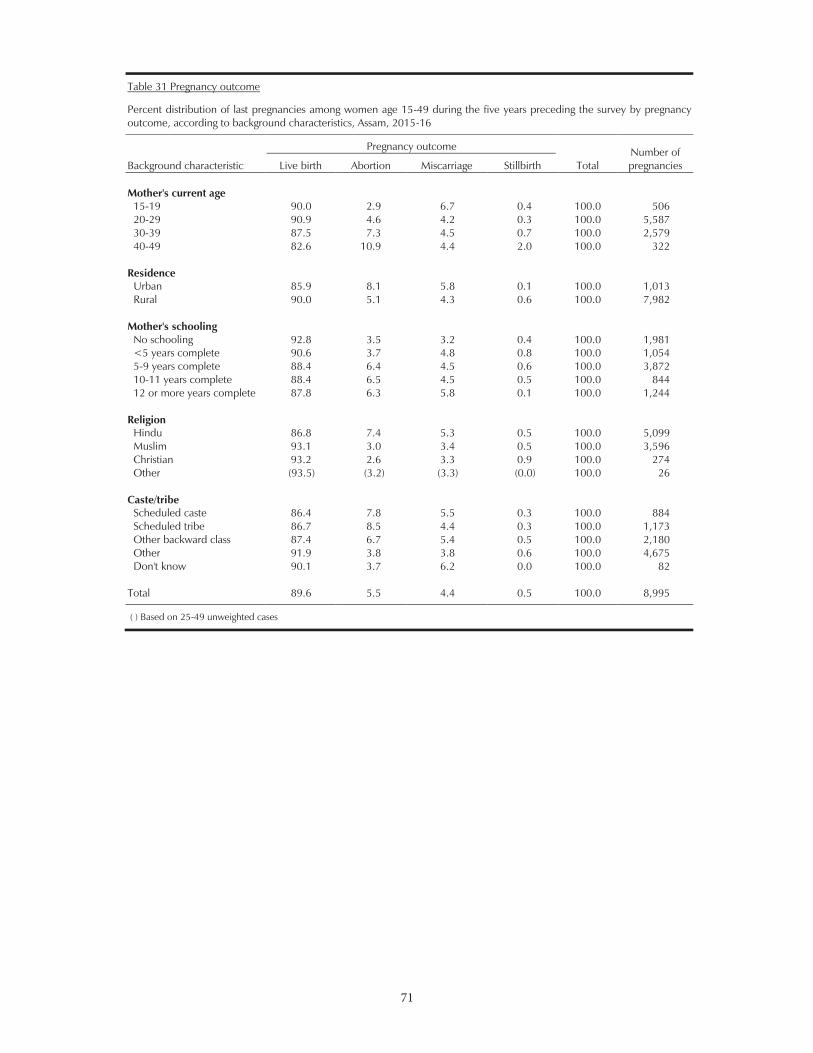
71
71
Table 31 Pregnancy outcome
Percent distribution of last pregnancies among women age 15-49 during the five years preceding the survey by pregnancy outcome, according to background characteristics, Assam, 2015-16
Background characteristic
Pregnancy outcome
Total Number of pregnancies Live birth Abortion Miscarriage Stillbirth
Mother's current age
15-19 90.0 2.9 6.7 0.4 100.0 506 20-29 90.9 4.6 4.2 0.3 100.0 5,587 30-39 87.5 7.3 4.5 0.7 100.0 2,579 40-49 82.6 10.9 4.4 2.0 100.0 322
Residence Urban 85.9 8.1 5.8 0.1 100.0 1,013 Rural 90.0 5.1 4.3 0.6 100.0 7,982
Mother's schooling No schooling 92.8 3.5 3.2 0.4 100.0 1,981 <5 years complete 90.6 3.7 4.8 0.8 100.0 1,054 5-9 years complete 88.4 6.4 4.5 0.6 100.0 3,872 10-11 years complete 88.4 6.5 4.5 0.5 100.0 844 12 or more years complete 87.8 6.3 5.8 0.1 100.0 1,244
Religion Hindu 86.8 7.4 5.3 0.5 100.0 5,099 Muslim 93.1 3.0 3.4 0.5 100.0 3,596 Christian 93.2 2.6 3.3 0.9 100.0 274 Other (93.5) (3.2) (3.3) (0.0) 100.0 26
Caste/tribe Scheduled caste 86.4 7.8 5.5 0.3 100.0 884 Scheduled tribe 86.7 8.5 4.4 0.3 100.0 1,173 Other backward class 87.4 6.7 5.4 0.5 100.0 2,180 Other 91.9 3.8 3.8 0.6 100.0 4,675 Don't know 90.1 3.7 6.2 0.0 100.0 82
Total 89.6 5.5 4.4 0.5 100.0 8,995
( ) Based on 25-49 unweighted cases
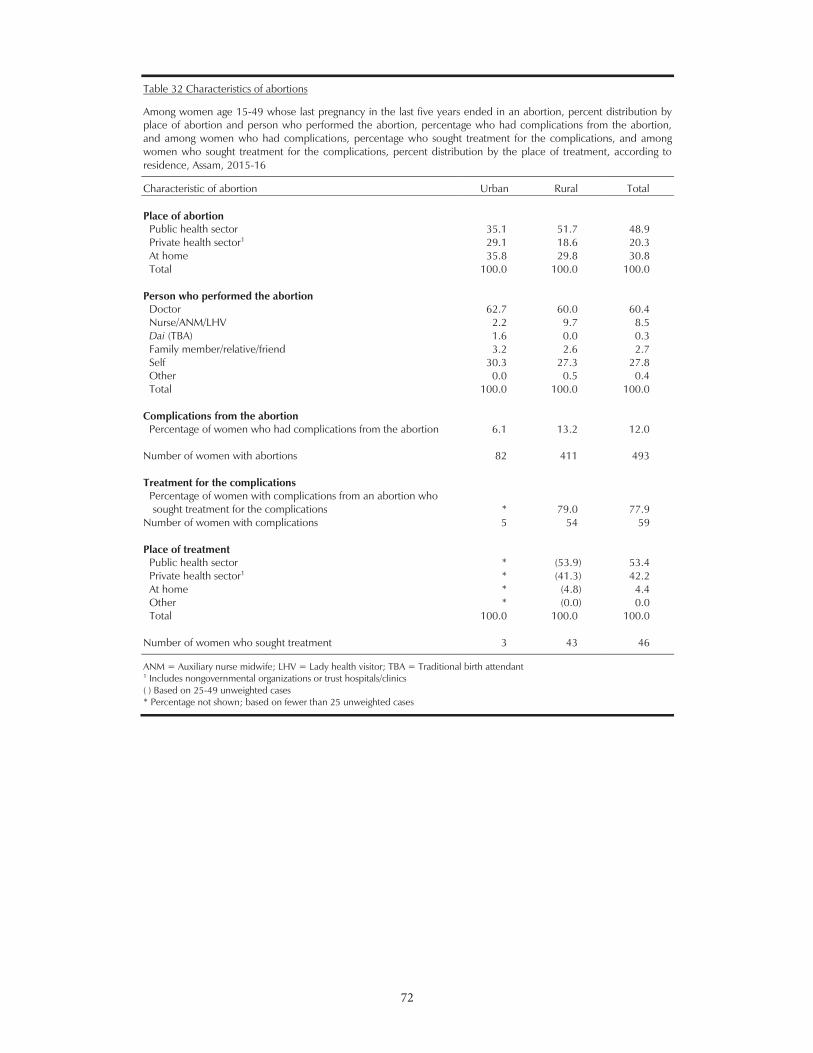
72
Table 32 Characteristics of abortions
Among women age 15-49 whose last pregnancy in the last five years ended in an abortion, percent distribution by place of abortion and person who performed the abortion, percentage who had complications from the abortion, and among women who had complications, percentage who sought treatment for the complications, and among women who sought treatment for the complications, percent distribution by the place of treatment, according to residence, Assam, 2015-16
Characteristic of abortion Urban Rural Total a e ab rti Public health sector 35.1 51.7 48.9 Private health sector1 29.1 18.6 20.3 At home 35.8 29.8 30.8 Total 100.0 100.0 100.0
ers er r e t e ab rti Doctor 62.7 60.0 60.4 Nurse/ANM/LHV 2.2 9.7 8.5
i (TBA) 1.6 0.0 0.3 Family member/relative/friend 3.2 2.6 2.7 Self 30.3 27.3 27.8 Other 0.0 0.5 0.4 Total 100.0 100.0 100.0
C i ati s r t e ab rti
Percentage of women who had complications from the abortion 6.1 13.2 12.0
Number of women with abortions 82 411 493
reat e t r t e i ati s Percentage of women with complications from an abortion who sought treatment for the complications * 79.0 77.9
Number of women with complications 5 54 59
a e treat e t Public health sector * (53.9) 53.4 Private health sector1 * (41.3) 42.2 At home * (4.8) 4.4 Other * (0.0) 0.0 Total 100.0 100.0 100.0
Number of women who sought treatment 3 43 46
ANM = Auxiliary nurse midwife; LHV = Lady health visitor; TBA = Traditional birth attendant 1 Includes nongovernmental organizations or trust hospitals/clinics ( ) Based on 25-49 unweighted cases * Percentage not shown; based on fewer than 25 unweighted cases
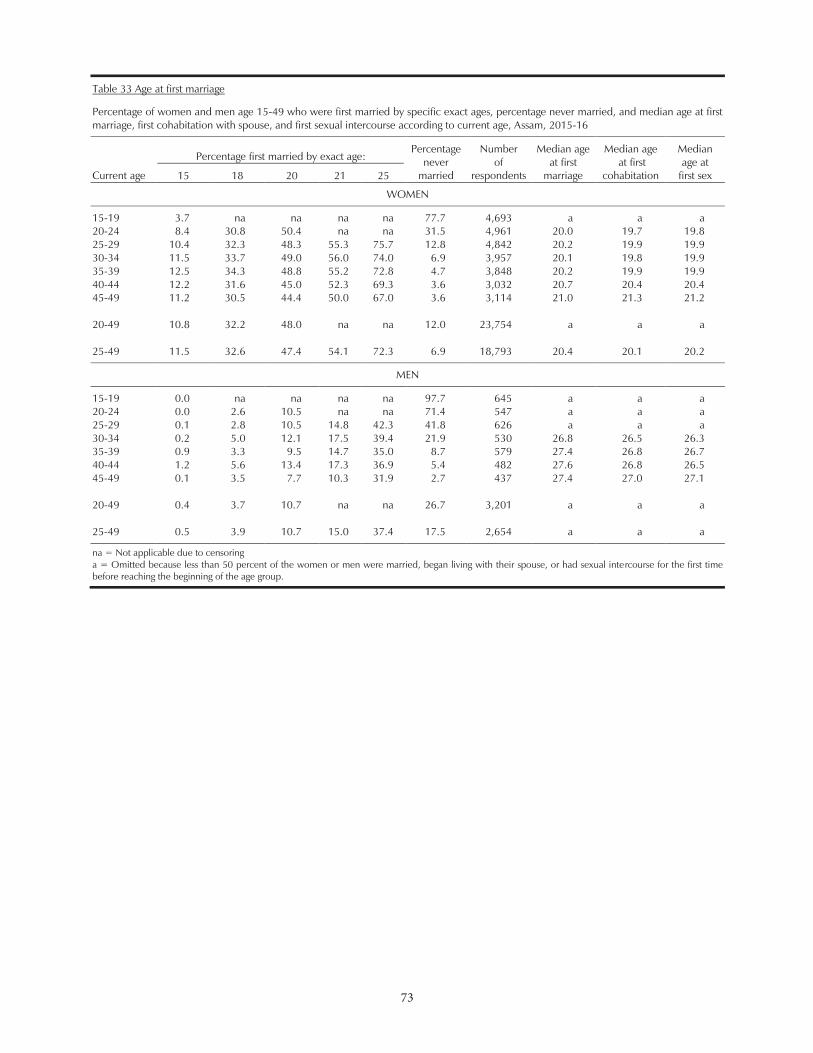
73
73
Table 33 Age at first marriage
Percentage of women and men age 15-49 who were first married by specific exact ages, percentage never married, and median age at first marriage, first cohabitation with spouse, and first sexual intercourse according to current age, Assam, 2015-16
Current age
Percentage first married by exact age:
Percentage never
married
Number of
respondents
Median age at first
marriage
Median age at first
cohabitation
Median age at
first sex 15 18 20 21 25
WOMEN
15-19 3.7 na na na na 77.7 4,693 a a a 20-24 8.4 30.8 50.4 na na 31.5 4,961 20.0 19.7 19.8 25-29 10.4 32.3 48.3 55.3 75.7 12.8 4,842 20.2 19.9 19.9 30-34 11.5 33.7 49.0 56.0 74.0 6.9 3,957 20.1 19.8 19.9 35-39 12.5 34.3 48.8 55.2 72.8 4.7 3,848 20.2 19.9 19.9 40-44 12.2 31.6 45.0 52.3 69.3 3.6 3,032 20.7 20.4 20.4 45-49 11.2 30.5 44.4 50.0 67.0 3.6 3,114 21.0 21.3 21.2 20-49 10.8 32.2 48.0 na na 12.0 23,754 a a a 25-49 11.5 32.6 47.4 54.1 72.3 6.9 18,793 20.4 20.1 20.2
MEN
15-19 0.0 na na na na 97.7 645 a a a 20-24 0.0 2.6 10.5 na na 71.4 547 a a a 25-29 0.1 2.8 10.5 14.8 42.3 41.8 626 a a a 30-34 0.2 5.0 12.1 17.5 39.4 21.9 530 26.8 26.5 26.3 35-39 0.9 3.3 9.5 14.7 35.0 8.7 579 27.4 26.8 26.7 40-44 1.2 5.6 13.4 17.3 36.9 5.4 482 27.6 26.8 26.5 45-49 0.1 3.5 7.7 10.3 31.9 2.7 437 27.4 27.0 27.1 20-49 0.4 3.7 10.7 na na 26.7 3,201 a a a 25-49 0.5 3.9 10.7 15.0 37.4 17.5 2,654 a a a
na = Not applicable due to censoring a = Omitted because less than 50 percent of the women or men were married, began living with their spouse, or had sexual intercourse for the first time before reaching the beginning of the age group.
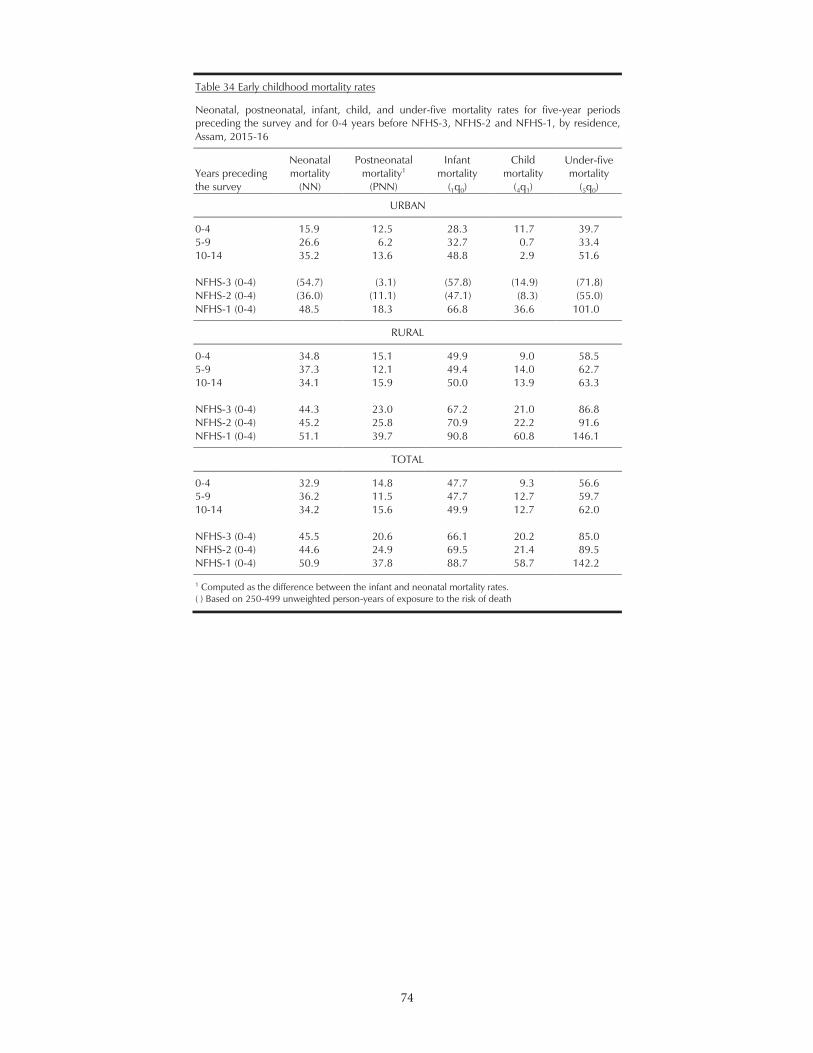
74
74
Table 34 Early childhood mortality rates
Neonatal, postneonatal, infant, child, and under-five mortality rates for five-year periods preceding the survey and for 0-4 years before NFHS-3, NFHS-2 and NFHS-1, by residence, Assam, 2015-16
Years preceding the survey
Neonatal mortality
(NN)
Postneonatal mortality1
(PNN)
Infant mortality
(1q0)
Child mortality
(4q1)
Under-five mortality
(5q0)
URBAN
0-4 15.9 12.5 28.3 11.7 39.7 5-9 26.6 6.2 32.7 0.7 33.4 10-14 35.2 13.6 48.8 2.9 51.6 NFHS-3 (0-4) (54.7) (3.1) (57.8) (14.9) (71.8) NFHS-2 (0-4) (36.0) (11.1) (47.1) (8.3) (55.0) NFHS-1 (0-4) 48.5 18.3 66.8 36.6 101.0
RURAL
0-4 34.8 15.1 49.9 9.0 58.5 5-9 37.3 12.1 49.4 14.0 62.7 10-14 34.1 15.9 50.0 13.9 63.3 NFHS-3 (0-4) 44.3 23.0 67.2 21.0 86.8 NFHS-2 (0-4) 45.2 25.8 70.9 22.2 91.6 NFHS-1 (0-4) 51.1 39.7 90.8 60.8 146.1
TOTAL
0-4 32.9 14.8 47.7 9.3 56.6 5-9 36.2 11.5 47.7 12.7 59.7 10-14 34.2 15.6 49.9 12.7 62.0 NFHS-3 (0-4) 45.5 20.6 66.1 20.2 85.0 NFHS-2 (0-4) 44.6 24.9 69.5 21.4 89.5 NFHS-1 (0-4) 50.9 37.8 88.7 58.7 142.2 1 Computed as the difference between the infant and neonatal mortality rates. ( ) Based on 250-499 unweighted person-years of exposure to the risk of death
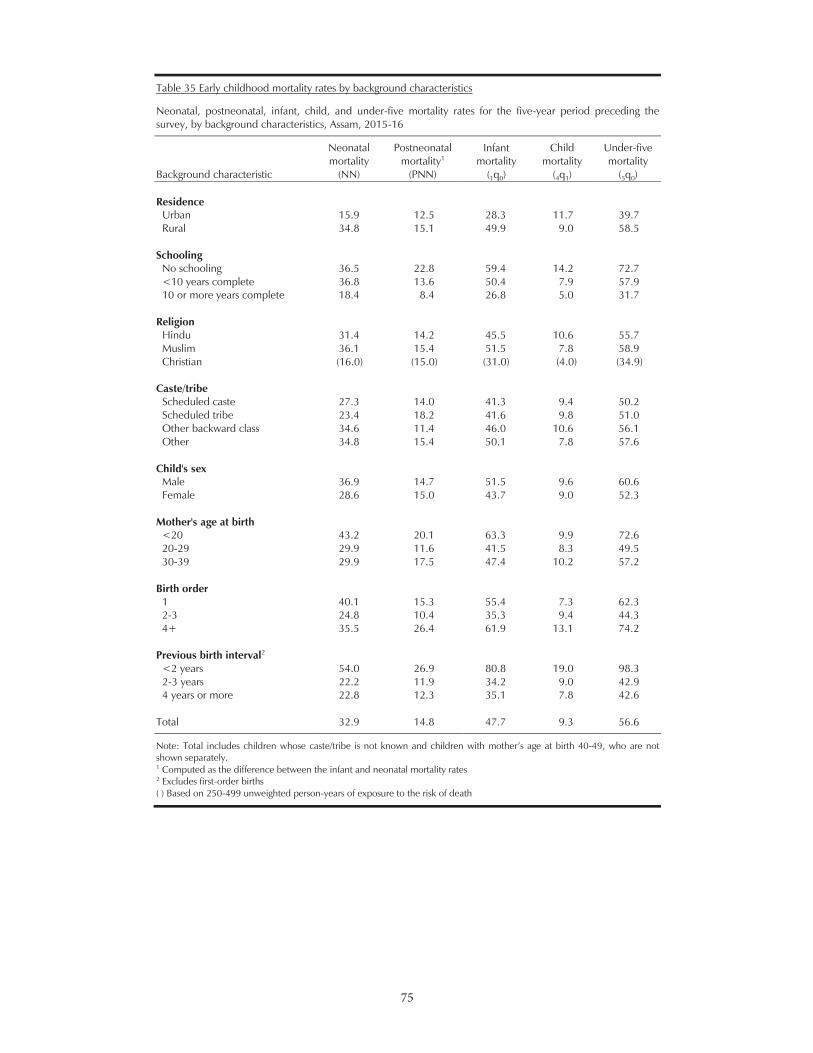
75
5
Table 35 Early childhood mortality rates by background characteristics
Neonatal, postneonatal, infant, child, and under-five mortality rates for the five-year period preceding the survey, by background characteristics, Assam, 2015-16
Background characteristic
Neonatal mortality
(NN)
Postneonatal mortality1
(PNN)
Infant mortality
(1q0)
Child mortality
(4q1)
Under-five mortality
(5q0) esi e e Urban 15.9 12.5 28.3 11.7 39.7 Rural 34.8 15.1 49.9 9.0 58.5
i
No schooling 36.5 22.8 59.4 14.2 72.7 <10 years complete 36.8 13.6 50.4 7.9 57.9 10 or more years complete 18.4 8.4 26.8 5.0 31.7
e i i Hindu 31.4 14.2 45.5 10.6 55.7 Muslim 36.1 15.4 51.5 7.8 58.9 Christian (16.0) (15.0) (31.0) (4.0) (34.9)
Caste/tribe
Scheduled caste 27.3 14.0 41.3 9.4 50.2 Scheduled tribe 23.4 18.2 41.6 9.8 51.0 Other backward class 34.6 11.4 46.0 10.6 56.1 Other 34.8 15.4 50.1 7.8 57.6
C i s se
Male 36.9 14.7 51.5 9.6 60.6 Female 28.6 15.0 43.7 9.0 52.3
t er s a e at birt
<20 43.2 20.1 63.3 9.9 72.6 20-29 29.9 11.6 41.5 8.3 49.5 30-39 29.9 17.5 47.4 10.2 57.2
irt r er 1 40.1 15.3 55.4 7.3 62.3 2-3 24.8 10.4 35.3 9.4 44.3 4+ 35.5 26.4 61.9 13.1 74.2
re i s birt i ter a 2 <2 years 54.0 26.9 80.8 19.0 98.3 2-3 years 22.2 11.9 34.2 9.0 42.9 4 years or more 22.8 12.3 35.1 7.8 42.6
Total 32.9 14.8 47.7 9.3 56.6
Note: Total includes children whose caste/tribe is not known and children -49, who are not shown separately. 1 Computed as the difference between the infant and neonatal mortality rates 2 Excludes first-order births ( ) Based on 250-499 unweighted person-years of exposure to the risk of death
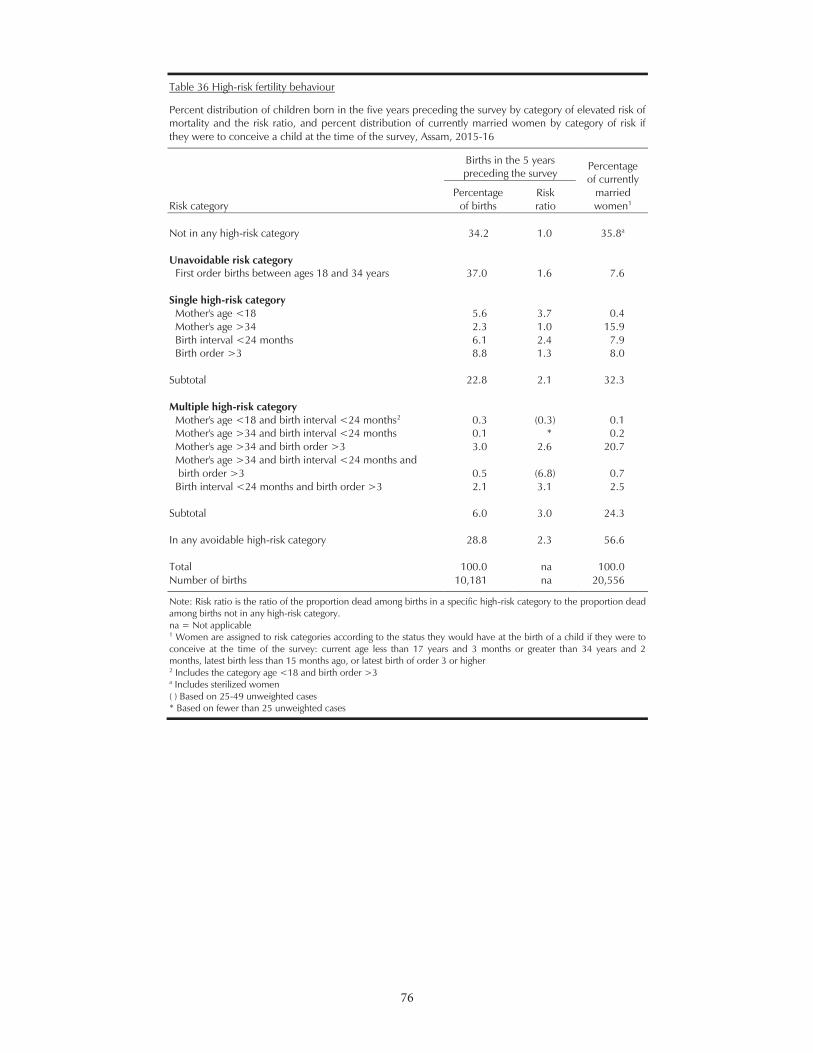
76
76
Table 36 High-risk fertility behaviour
Percent distribution of children born in the five years preceding the survey by category of elevated risk of mortality and the risk ratio, and percent distribution of currently married women by category of risk if they were to conceive a child at the time of the survey, Assam, 2015-16
Risk category
Births in the 5 years preceding the survey
Percentage of currently
married women1
Percentage of births
Risk ratio
Not in any high-risk category 34.2 1.0 35.8a Unavoidable risk category
First order births between ages 18 and 34 years 37.0 1.6 7.6
Single high-risk category Mother's age <18 5.6 3.7 0.4 Mother's age >34 2.3 1.0 15.9 Birth interval <24 months 6.1 2.4 7.9 Birth order >3 8.8 1.3 8.0
Subtotal 22.8 2.1 32.3
Multiple high-risk category Mother's age <18 and birth interval <24 months2 0.3 (0.3) 0.1 Mother's age >34 and birth interval <24 months 0.1 * 0.2 Mother's age >34 and birth order >3 3.0 2.6 20.7 Mother's age >34 and birth interval <24 months and birth order >3 0.5 (6.8) 0.7 Birth interval <24 months and birth order >3 2.1 3.1 2.5
Subtotal 6.0 3.0 24.3
In any avoidable high-risk category 28.8 2.3 56.6
Total 100.0 na 100.0 Number of births 10,181 na 20,556
Note: Risk ratio is the ratio of the proportion dead among births in a specific high-risk category to the proportion dead among births not in any high-risk category. na = Not applicable 1 Women are assigned to risk categories according to the status they would have at the birth of a child if they were to conceive at the time of the survey: current age less than 17 years and 3 months or greater than 34 years and 2 months, latest birth less than 15 months ago, or latest birth of order 3 or higher 2 Includes the category age <18 and birth order >3 a Includes sterilized women ( ) Based on 25-49 unweighted cases * Based on fewer than 25 unweighted cases
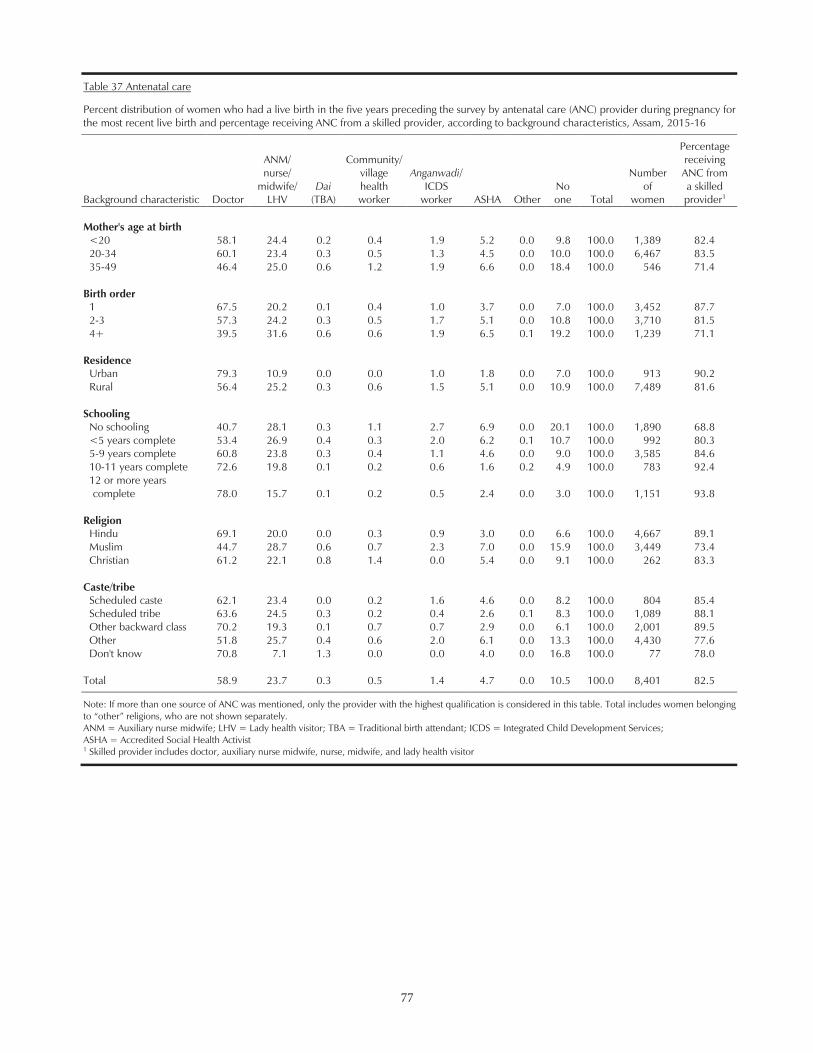
77
77
Table 37 Antenatal care
Percent distribution of women who had a live birth in the five years preceding the survey by antenatal care (ANC) provider during pregnancy for the most recent live birth and percentage receiving ANC from a skilled provider, according to background characteristics, Assam, 2015-16
Background characteristic Doctor
ANM/ nurse/
midwife/ LHV
Dai (TBA)
Community/ village health worker
Anganwadi/ ICDS
worker ASHA Other No one Total
Number of
women
Percentage receiving ANC from a skilled provider1
Mother's age at birth
<20 58.1 24.4 0.2 0.4 1.9 5.2 0.0 9.8 100.0 1,389 82.4 20-34 60.1 23.4 0.3 0.5 1.3 4.5 0.0 10.0 100.0 6,467 83.5 35-49 46.4 25.0 0.6 1.2 1.9 6.6 0.0 18.4 100.0 546 71.4
Birth order 1 67.5 20.2 0.1 0.4 1.0 3.7 0.0 7.0 100.0 3,452 87.7 2-3 57.3 24.2 0.3 0.5 1.7 5.1 0.0 10.8 100.0 3,710 81.5 4+ 39.5 31.6 0.6 0.6 1.9 6.5 0.1 19.2 100.0 1,239 71.1
Residence Urban 79.3 10.9 0.0 0.0 1.0 1.8 0.0 7.0 100.0 913 90.2 Rural 56.4 25.2 0.3 0.6 1.5 5.1 0.0 10.9 100.0 7,489 81.6
Schooling No schooling 40.7 28.1 0.3 1.1 2.7 6.9 0.0 20.1 100.0 1,890 68.8 <5 years complete 53.4 26.9 0.4 0.3 2.0 6.2 0.1 10.7 100.0 992 80.3 5-9 years complete 60.8 23.8 0.3 0.4 1.1 4.6 0.0 9.0 100.0 3,585 84.6 10-11 years complete 72.6 19.8 0.1 0.2 0.6 1.6 0.2 4.9 100.0 783 92.4 12 or more years complete 78.0 15.7 0.1 0.2 0.5 2.4 0.0 3.0 100.0 1,151 93.8
Religion Hindu 69.1 20.0 0.0 0.3 0.9 3.0 0.0 6.6 100.0 4,667 89.1 Muslim 44.7 28.7 0.6 0.7 2.3 7.0 0.0 15.9 100.0 3,449 73.4 Christian 61.2 22.1 0.8 1.4 0.0 5.4 0.0 9.1 100.0 262 83.3
Caste/tribe Scheduled caste 62.1 23.4 0.0 0.2 1.6 4.6 0.0 8.2 100.0 804 85.4 Scheduled tribe 63.6 24.5 0.3 0.2 0.4 2.6 0.1 8.3 100.0 1,089 88.1 Other backward class 70.2 19.3 0.1 0.7 0.7 2.9 0.0 6.1 100.0 2,001 89.5 Other 51.8 25.7 0.4 0.6 2.0 6.1 0.0 13.3 100.0 4,430 77.6 Don't know 70.8 7.1 1.3 0.0 0.0 4.0 0.0 16.8 100.0 77 78.0
Total 58.9 23.7 0.3 0.5 1.4 4.7 0.0 10.5 100.0 8,401 82.5
Note: If more than one source of ANC was mentioned, only the provider with the highest qualification is considered in this table. Total includes women belonging s, who are not shown separately.
ANM = Auxiliary nurse midwife; LHV = Lady health visitor; TBA = Traditional birth attendant; ICDS = Integrated Child Development Services; ASHA = Accredited Social Health Activist 1 Skilled provider includes doctor, auxiliary nurse midwife, nurse, midwife, and lady health visitor
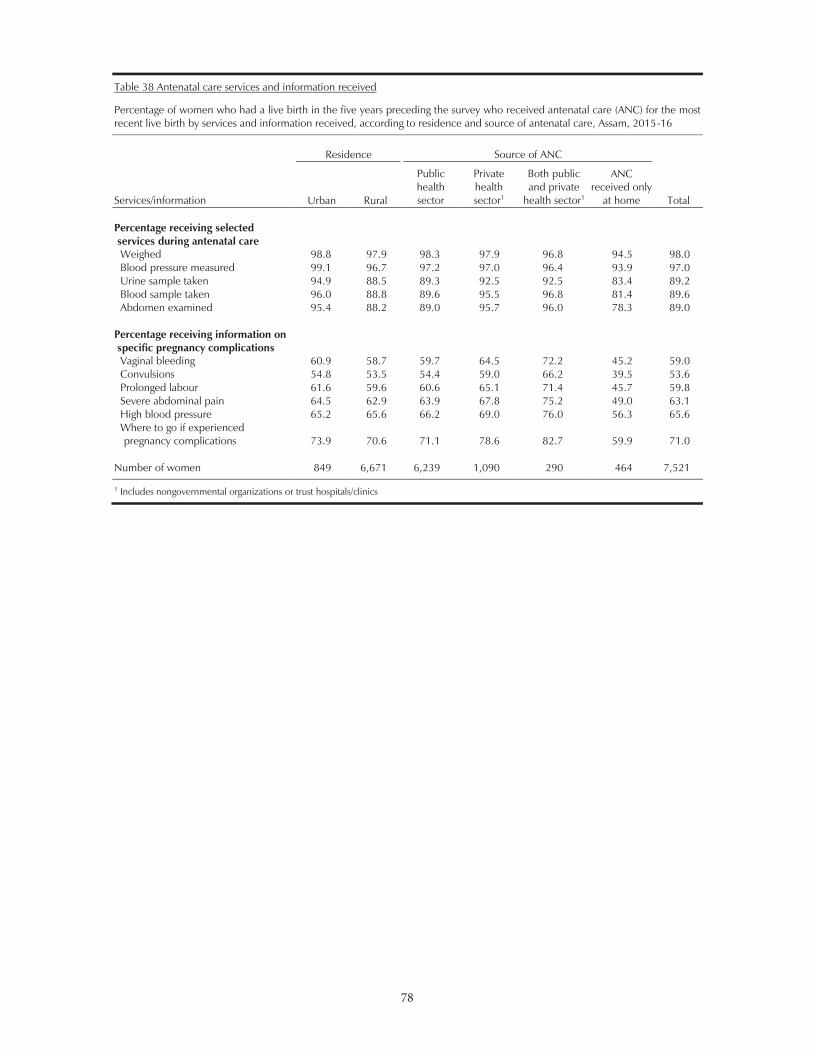
78
78
Table 38 Antenatal care services and information received
Percentage of women who had a live birth in the five years preceding the survey who received antenatal care (ANC) for the most recent live birth by services and information received, according to residence and source of antenatal care, Assam, 2015-16
Services/information
Residence
Source of ANC
Total Urban Rural
Public health sector
Private health sector1
Both public and private
health sector1
ANC received only
at home Percentage receiving selected services during antenatal care
Weighed 98.8 97.9 98.3 97.9 96.8 94.5 98.0 Blood pressure measured 99.1 96.7 97.2 97.0 96.4 93.9 97.0 Urine sample taken 94.9 88.5 89.3 92.5 92.5 83.4 89.2 Blood sample taken 96.0 88.8 89.6 95.5 96.8 81.4 89.6 Abdomen examined 95.4 88.2 89.0 95.7 96.0 78.3 89.0
Percentage receiving information on specific pregnancy complications
Vaginal bleeding 60.9 58.7 59.7 64.5 72.2 45.2 59.0 Convulsions 54.8 53.5 54.4 59.0 66.2 39.5 53.6 Prolonged labour 61.6 59.6 60.6 65.1 71.4 45.7 59.8 Severe abdominal pain 64.5 62.9 63.9 67.8 75.2 49.0 63.1 High blood pressure 65.2 65.6 66.2 69.0 76.0 56.3 65.6 Where to go if experienced pregnancy complications 73.9 70.6 71.1 78.6 82.7 59.9 71.0
Number of women 849 6,671 6,239 1,090 290 464 7,521 1 Includes nongovernmental organizations or trust hospitals/clinics
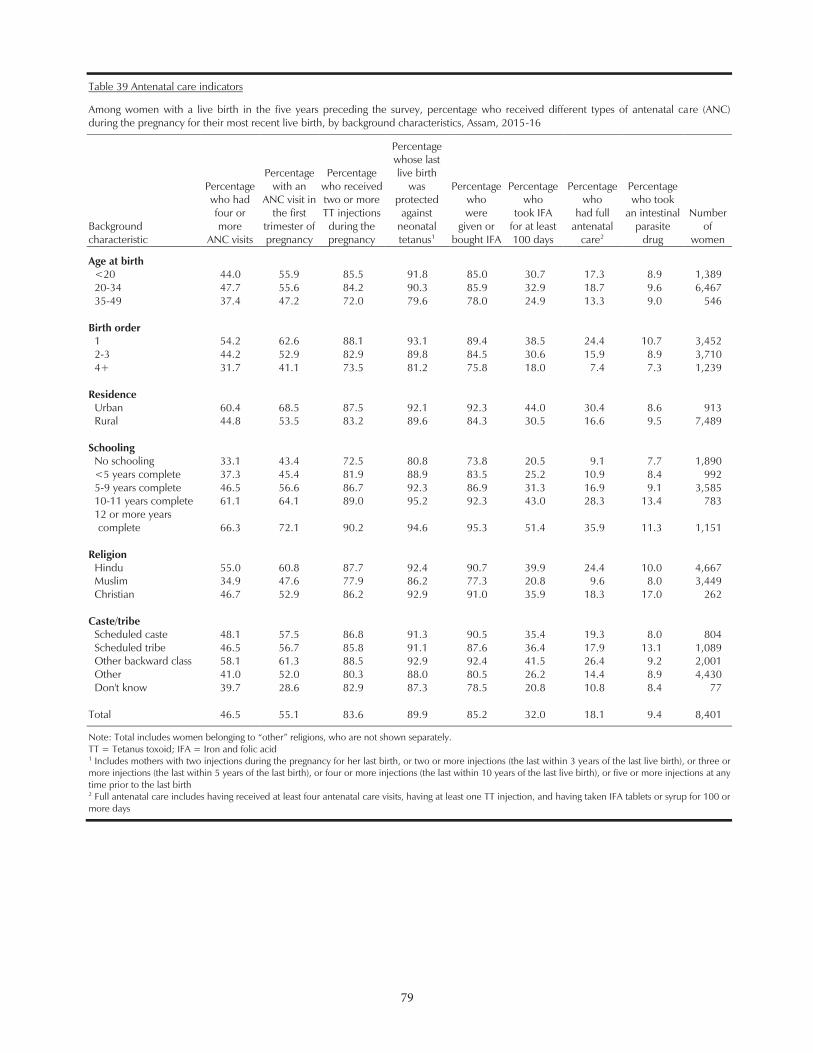
79
79
Table 39 Antenatal care indicators
Among women with a live birth in the five years preceding the survey, percentage who received different types of antenatal care (ANC) during the pregnancy for their most recent live birth, by background characteristics, Assam, 2015-16
Background characteristic
Percentage who had four or more
ANC visits
Percentage with an
ANC visit in the first
trimester of pregnancy
Percentage who received two or more TT injections during the pregnancy
Percentage whose last live birth
was protected
against neonatal tetanus1
Percentage who were
given or bought IFA
Percentage who
took IFA for at least 100 days
Percentage who
had full antenatal
care2
Percentage who took
an intestinal parasite
drug
Number of
women
Age at birth <20 44.0 55.9 85.5 91.8 85.0 30.7 17.3 8.9 1,389 20-34 47.7 55.6 84.2 90.3 85.9 32.9 18.7 9.6 6,467 35-49 37.4 47.2 72.0 79.6 78.0 24.9 13.3 9.0 546
Birth order 1 54.2 62.6 88.1 93.1 89.4 38.5 24.4 10.7 3,452 2-3 44.2 52.9 82.9 89.8 84.5 30.6 15.9 8.9 3,710 4+ 31.7 41.1 73.5 81.2 75.8 18.0 7.4 7.3 1,239
Residence Urban 60.4 68.5 87.5 92.1 92.3 44.0 30.4 8.6 913 Rural 44.8 53.5 83.2 89.6 84.3 30.5 16.6 9.5 7,489
Schooling No schooling 33.1 43.4 72.5 80.8 73.8 20.5 9.1 7.7 1,890 <5 years complete 37.3 45.4 81.9 88.9 83.5 25.2 10.9 8.4 992 5-9 years complete 46.5 56.6 86.7 92.3 86.9 31.3 16.9 9.1 3,585 10-11 years complete 61.1 64.1 89.0 95.2 92.3 43.0 28.3 13.4 783 12 or more years complete 66.3 72.1 90.2 94.6 95.3 51.4 35.9 11.3 1,151
Religion Hindu 55.0 60.8 87.7 92.4 90.7 39.9 24.4 10.0 4,667 Muslim 34.9 47.6 77.9 86.2 77.3 20.8 9.6 8.0 3,449 Christian 46.7 52.9 86.2 92.9 91.0 35.9 18.3 17.0 262
Caste/tribe Scheduled caste 48.1 57.5 86.8 91.3 90.5 35.4 19.3 8.0 804 Scheduled tribe 46.5 56.7 85.8 91.1 87.6 36.4 17.9 13.1 1,089 Other backward class 58.1 61.3 88.5 92.9 92.4 41.5 26.4 9.2 2,001 Other 41.0 52.0 80.3 88.0 80.5 26.2 14.4 8.9 4,430 Don't know 39.7 28.6 82.9 87.3 78.5 20.8 10.8 8.4 77
Total 46.5 55.1 83.6 89.9 85.2 32.0 18.1 9.4 8,401
Note: TT = Tetanus toxoid; IFA = Iron and folic acid 1 Includes mothers with two injections during the pregnancy for her last birth, or two or more injections (the last within 3 years of the last live birth), or three or more injections (the last within 5 years of the last birth), or four or more injections (the last within 10 years of the last live birth), or five or more injections at any time prior to the last birth 2 Full antenatal care includes having received at least four antenatal care visits, having at least one TT injection, and having taken IFA tablets or syrup for 100 or more days
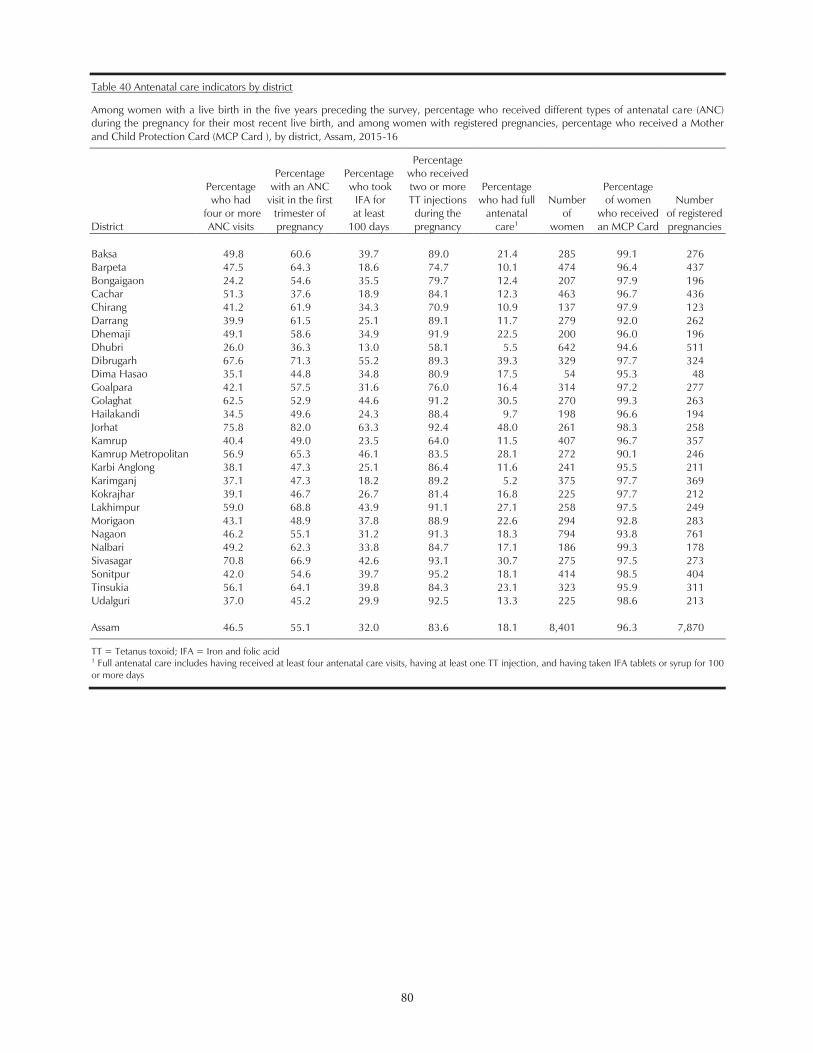
80
80
Table 40 Antenatal care indicators by district
Among women with a live birth in the five years preceding the survey, percentage who received different types of antenatal care (ANC) during the pregnancy for their most recent live birth, and among women with registered pregnancies, percentage who received a Mother and Child Protection Card (MCP Card ), by district, Assam, 2015-16
District
Percentage who had
four or more ANC visits
Percentage with an ANC
visit in the first trimester of pregnancy
Percentage who took
IFA for at least
100 days
Percentage who received two or more TT injections during the pregnancy
Percentage who had full
antenatal care1
Number of
women
Percentage of women
who received an MCP Card
Number of registered pregnancies
Baksa 49.8 60.6 39.7 89.0 21.4 285 99.1 276 Barpeta 47.5 64.3 18.6 74.7 10.1 474 96.4 437 Bongaigaon 24.2 54.6 35.5 79.7 12.4 207 97.9 196 Cachar 51.3 37.6 18.9 84.1 12.3 463 96.7 436 Chirang 41.2 61.9 34.3 70.9 10.9 137 97.9 123 Darrang 39.9 61.5 25.1 89.1 11.7 279 92.0 262 Dhemaji 49.1 58.6 34.9 91.9 22.5 200 96.0 196 Dhubri 26.0 36.3 13.0 58.1 5.5 642 94.6 511 Dibrugarh 67.6 71.3 55.2 89.3 39.3 329 97.7 324 Dima Hasao 35.1 44.8 34.8 80.9 17.5 54 95.3 48 Goalpara 42.1 57.5 31.6 76.0 16.4 314 97.2 277 Golaghat 62.5 52.9 44.6 91.2 30.5 270 99.3 263 Hailakandi 34.5 49.6 24.3 88.4 9.7 198 96.6 194 Jorhat 75.8 82.0 63.3 92.4 48.0 261 98.3 258 Kamrup 40.4 49.0 23.5 64.0 11.5 407 96.7 357 Kamrup Metropolitan 56.9 65.3 46.1 83.5 28.1 272 90.1 246 Karbi Anglong 38.1 47.3 25.1 86.4 11.6 241 95.5 211 Karimganj 37.1 47.3 18.2 89.2 5.2 375 97.7 369 Kokrajhar 39.1 46.7 26.7 81.4 16.8 225 97.7 212 Lakhimpur 59.0 68.8 43.9 91.1 27.1 258 97.5 249 Morigaon 43.1 48.9 37.8 88.9 22.6 294 92.8 283 Nagaon 46.2 55.1 31.2 91.3 18.3 794 93.8 761 Nalbari 49.2 62.3 33.8 84.7 17.1 186 99.3 178 Sivasagar 70.8 66.9 42.6 93.1 30.7 275 97.5 273 Sonitpur 42.0 54.6 39.7 95.2 18.1 414 98.5 404 Tinsukia 56.1 64.1 39.8 84.3 23.1 323 95.9 311 Udalguri 37.0 45.2 29.9 92.5 13.3 225 98.6 213 Assam 46.5 55.1 32.0 83.6 18.1 8,401 96.3 7,870
TT = Tetanus toxoid; IFA = Iron and folic acid 1 Full antenatal care includes having received at least four antenatal care visits, having at least one TT injection, and having taken IFA tablets or syrup for 100 or more days
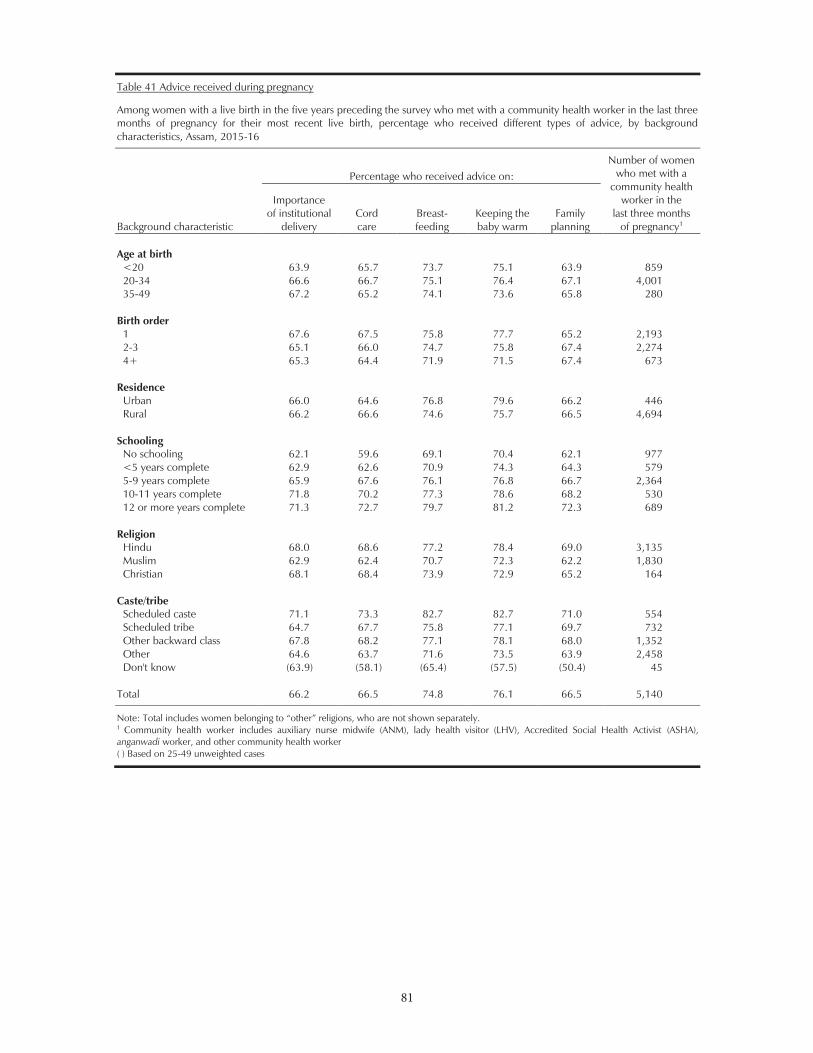
81
81
Table 41 Advice received during pregnancy
Among women with a live birth in the five years preceding the survey who met with a community health worker in the last three months of pregnancy for their most recent live birth, percentage who received different types of advice, by background characteristics, Assam, 2015-16
Background characteristic
Percentage who received advice on:
Number of women who met with a
community health worker in the
last three months of pregnancy1
Importance of institutional
delivery Cord care
Breast- feeding
Keeping the baby warm
Family planning
Age at birth
<20 63.9 65.7 73.7 75.1 63.9 859 20-34 66.6 66.7 75.1 76.4 67.1 4,001 35-49 67.2 65.2 74.1 73.6 65.8 280
Birth order 1 67.6 67.5 75.8 77.7 65.2 2,193 2-3 65.1 66.0 74.7 75.8 67.4 2,274 4+ 65.3 64.4 71.9 71.5 67.4 673
Residence Urban 66.0 64.6 76.8 79.6 66.2 446 Rural 66.2 66.6 74.6 75.7 66.5 4,694
Schooling No schooling 62.1 59.6 69.1 70.4 62.1 977 <5 years complete 62.9 62.6 70.9 74.3 64.3 579 5-9 years complete 65.9 67.6 76.1 76.8 66.7 2,364 10-11 years complete 71.8 70.2 77.3 78.6 68.2 530 12 or more years complete 71.3 72.7 79.7 81.2 72.3 689
Religion Hindu 68.0 68.6 77.2 78.4 69.0 3,135 Muslim 62.9 62.4 70.7 72.3 62.2 1,830 Christian 68.1 68.4 73.9 72.9 65.2 164
Caste/tribe Scheduled caste 71.1 73.3 82.7 82.7 71.0 554 Scheduled tribe 64.7 67.7 75.8 77.1 69.7 732 Other backward class 67.8 68.2 77.1 78.1 68.0 1,352 Other 64.6 63.7 71.6 73.5 63.9 2,458 Don't know (63.9) (58.1) (65.4) (57.5) (50.4) 45
Total 66.2 66.5 74.8 76.1 66.5 5,140
1 Community health worker includes auxiliary nurse midwife (ANM), lady health visitor (LHV), Accredited Social Health Activist (ASHA), anganwadi worker, and other community health worker ( ) Based on 25-49 unweighted cases
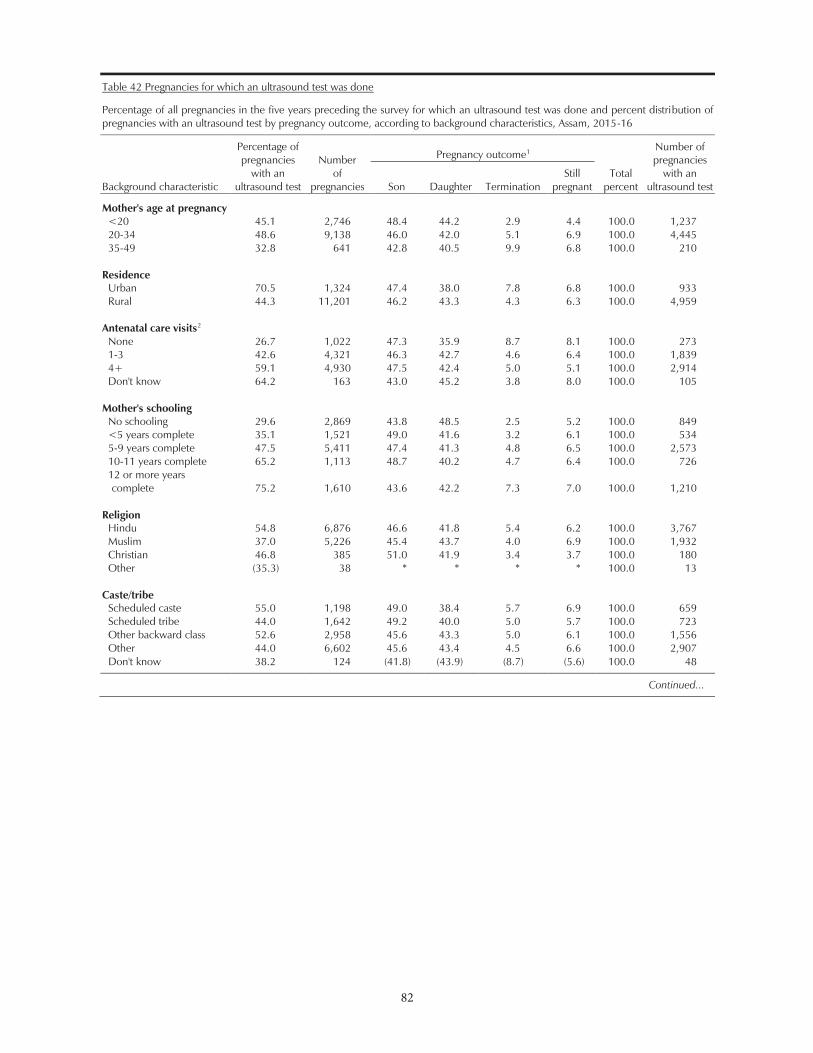
82
82
Table 42 Pregnancies for which an ultrasound test was done
Percentage of all pregnancies in the five years preceding the survey for which an ultrasound test was done and percent distribution of pregnancies with an ultrasound test by pregnancy outcome, according to background characteristics, Assam, 2015-16
Background characteristic
Percentage of pregnancies
with an ultrasound test
Number of
pregnancies
Pregnancy outcome1
Total percent
Number of pregnancies
with an ultrasound test Son Daughter Termination
Still pregnant
Mother's age at pregnancy <20 45.1 2,746 48.4 44.2 2.9 4.4 100.0 1,237 20-34 48.6 9,138 46.0 42.0 5.1 6.9 100.0 4,445 35-49 32.8 641 42.8 40.5 9.9 6.8 100.0 210
Residence Urban 70.5 1,324 47.4 38.0 7.8 6.8 100.0 933 Rural 44.3 11,201 46.2 43.3 4.3 6.3 100.0 4,959
Antenatal care visits2 None 26.7 1,022 47.3 35.9 8.7 8.1 100.0 273 1-3 42.6 4,321 46.3 42.7 4.6 6.4 100.0 1,839 4+ 59.1 4,930 47.5 42.4 5.0 5.1 100.0 2,914 Don't know 64.2 163 43.0 45.2 3.8 8.0 100.0 105
Mother's schooling No schooling 29.6 2,869 43.8 48.5 2.5 5.2 100.0 849 <5 years complete 35.1 1,521 49.0 41.6 3.2 6.1 100.0 534 5-9 years complete 47.5 5,411 47.4 41.3 4.8 6.5 100.0 2,573 10-11 years complete 65.2 1,113 48.7 40.2 4.7 6.4 100.0 726 12 or more years complete 75.2 1,610 43.6 42.2 7.3 7.0 100.0 1,210
Religion Hindu 54.8 6,876 46.6 41.8 5.4 6.2 100.0 3,767 Muslim 37.0 5,226 45.4 43.7 4.0 6.9 100.0 1,932 Christian 46.8 385 51.0 41.9 3.4 3.7 100.0 180 Other (35.3) 38 * * * * 100.0 13
Caste/tribe Scheduled caste 55.0 1,198 49.0 38.4 5.7 6.9 100.0 659 Scheduled tribe 44.0 1,642 49.2 40.0 5.0 5.7 100.0 723 Other backward class 52.6 2,958 45.6 43.3 5.0 6.1 100.0 1,556 Other 44.0 6,602 45.6 43.4 4.5 6.6 100.0 2,907 Don't know 38.2 124 (41.8) (43.9) (8.7) (5.6) 100.0 48
Continued...
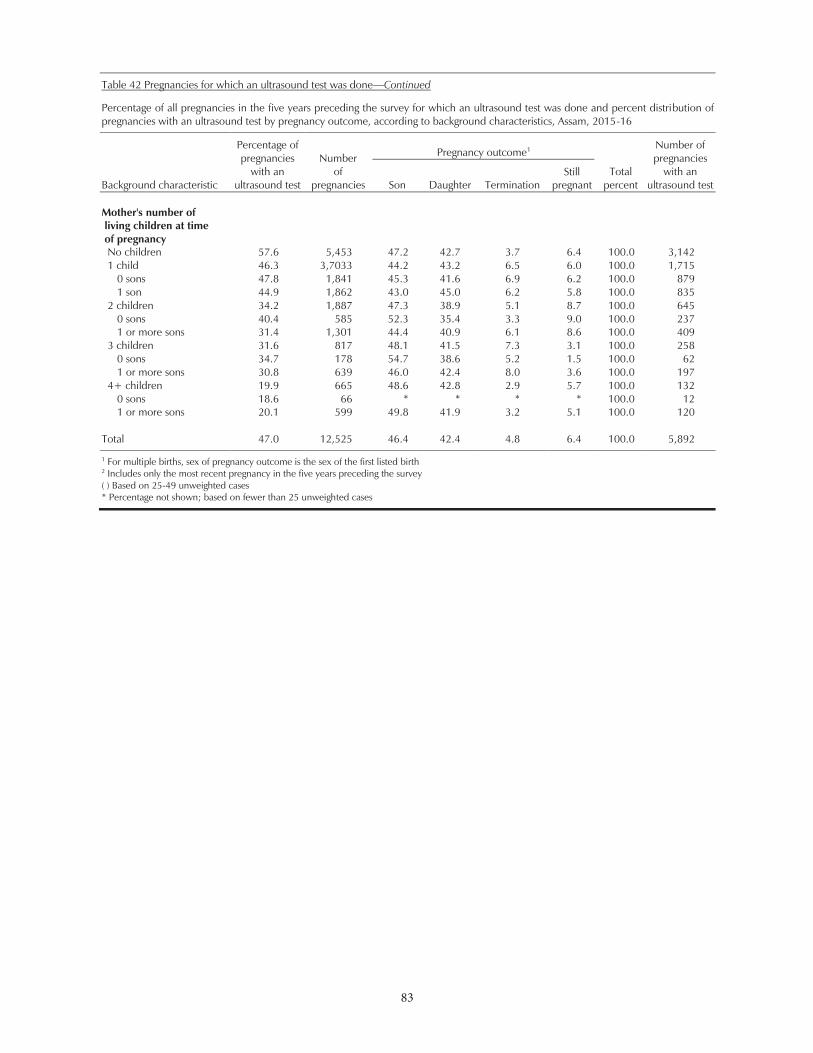
83
83
Table 42 Pregnancies for which an ultrasound test was done—Continued
Percentage of all pregnancies in the five years preceding the survey for which an ultrasound test was done and percent distribution of pregnancies with an ultrasound test by pregnancy outcome, according to background characteristics, Assam, 2015-16
Background characteristic
Percentage of pregnancies
with an ultrasound test
Number of
pregnancies
Pregnancy outcome1
Total percent
Number of pregnancies
with an ultrasound test Son Daughter Termination
Still pregnant
Mother's number of living children at time of pregnancy
No children 57.6 5,453 47.2 42.7 3.7 6.4 100.0 3,142 1 child 46.3 3,7033 44.2 43.2 6.5 6.0 100.0 1,715
0 sons 47.8 1,841 45.3 41.6 6.9 6.2 100.0 879 1 son 44.9 1,862 43.0 45.0 6.2 5.8 100.0 835
2 children 34.2 1,887 47.3 38.9 5.1 8.7 100.0 645 0 sons 40.4 585 52.3 35.4 3.3 9.0 100.0 237 1 or more sons 31.4 1,301 44.4 40.9 6.1 8.6 100.0 409
3 children 31.6 817 48.1 41.5 7.3 3.1 100.0 258 0 sons 34.7 178 54.7 38.6 5.2 1.5 100.0 62 1 or more sons 30.8 639 46.0 42.4 8.0 3.6 100.0 197
4+ children 19.9 665 48.6 42.8 2.9 5.7 100.0 132 0 sons 18.6 66 * * * * 100.0 12 1 or more sons 20.1 599 49.8 41.9 3.2 5.1 100.0 120
Total 47.0 12,525 46.4 42.4 4.8 6.4 100.0 5,892
1 For multiple births, sex of pregnancy outcome is the sex of the first listed birth 2 Includes only the most recent pregnancy in the five years preceding the survey ( ) Based on 25-49 unweighted cases * Percentage not shown; based on fewer than 25 unweighted cases
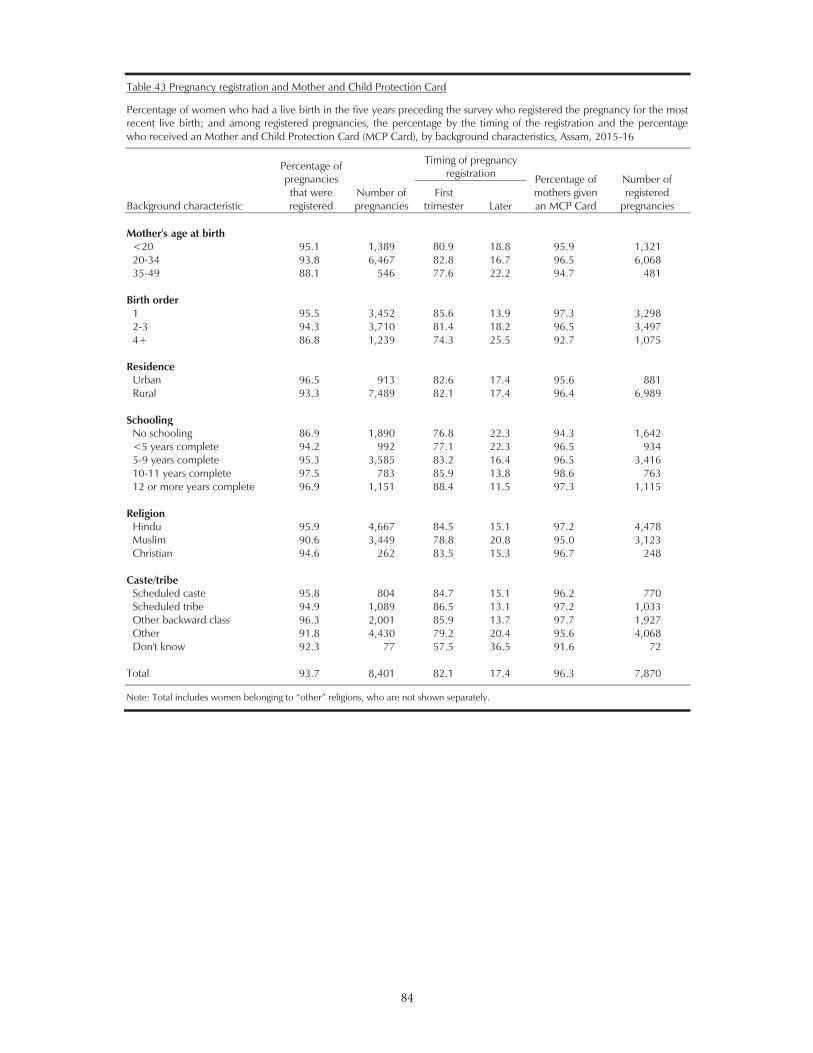
84
84
Table 43 Pregnancy registration and Mother and Child Protection Card
Percentage of women who had a live birth in the five years preceding the survey who registered the pregnancy for the most recent live birth; and among registered pregnancies, the percentage by the timing of the registration and the percentage who received an Mother and Child Protection Card (MCP Card), by background characteristics, Assam, 2015-16
Background characteristic
Percentage of pregnancies that were registered
Number of pregnancies
Timing of pregnancy registration
Percentage of mothers given an MCP Card
Number of registered
pregnancies First
trimester Later Mother's age at birth
<20 95.1 1,389 80.9 18.8 95.9 1,321 20-34 93.8 6,467 82.8 16.7 96.5 6,068 35-49 88.1 546 77.6 22.2 94.7 481
Birth order 1 95.5 3,452 85.6 13.9 97.3 3,298 2-3 94.3 3,710 81.4 18.2 96.5 3,497 4+ 86.8 1,239 74.3 25.5 92.7 1,075
Residence Urban 96.5 913 82.6 17.4 95.6 881 Rural 93.3 7,489 82.1 17.4 96.4 6,989
Schooling No schooling 86.9 1,890 76.8 22.3 94.3 1,642 <5 years complete 94.2 992 77.1 22.3 96.5 934 5-9 years complete 95.3 3,585 83.2 16.4 96.5 3,416 10-11 years complete 97.5 783 85.9 13.8 98.6 763 12 or more years complete 96.9 1,151 88.4 11.5 97.3 1,115
Religion Hindu 95.9 4,667 84.5 15.1 97.2 4,478 Muslim 90.6 3,449 78.8 20.8 95.0 3,123 Christian 94.6 262 83.5 15.3 96.7 248
Caste/tribe Scheduled caste 95.8 804 84.7 15.1 96.2 770 Scheduled tribe 94.9 1,089 86.5 13.1 97.2 1,033 Other backward class 96.3 2,001 85.9 13.7 97.7 1,927 Other 91.8 4,430 79.2 20.4 95.6 4,068 Don't know 92.3 77 57.5 36.5 91.6 72
Total 93.7 8,401 82.1 17.4 96.3 7,870
shown separately.
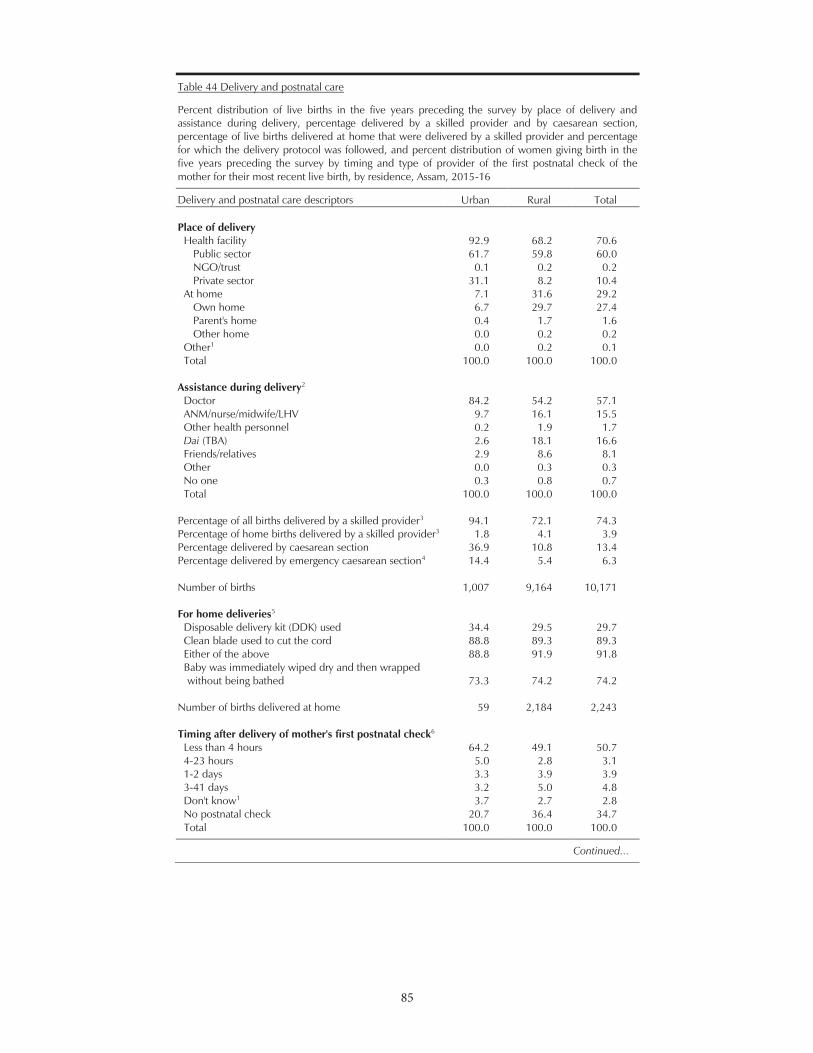
85
85
Table 44 Delivery and postnatal care
Percent distribution of live births in the five years preceding the survey by place of delivery and assistance during delivery, percentage delivered by a skilled provider and by caesarean section, percentage of live births delivered at home that were delivered by a skilled provider and percentage for which the delivery protocol was followed, and percent distribution of women giving birth in the five years preceding the survey by timing and type of provider of the first postnatal check of the mother for their most recent live birth, by residence, Assam, 2015-16
Delivery and postnatal care descriptors Urban Rural Total Place of delivery
Health facility 92.9 68.2 70.6 Public sector 61.7 59.8 60.0 NGO/trust 0.1 0.2 0.2 Private sector 31.1 8.2 10.4
At home 7.1 31.6 29.2 Own home 6.7 29.7 27.4 Parent's home 0.4 1.7 1.6 Other home 0.0 0.2 0.2
Other1 0.0 0.2 0.1 Total 100.0 100.0 100.0
Assistance during delivery2 Doctor 84.2 54.2 57.1 ANM/nurse/midwife/LHV 9.7 16.1 15.5 Other health personnel 0.2 1.9 1.7 Dai (TBA) 2.6 18.1 16.6 Friends/relatives 2.9 8.6 8.1 Other 0.0 0.3 0.3 No one 0.3 0.8 0.7 Total 100.0 100.0 100.0
Percentage of all births delivered by a skilled provider3 94.1 72.1 74.3 Percentage of home births delivered by a skilled provider3 1.8 4.1 3.9 Percentage delivered by caesarean section 36.9 10.8 13.4 Percentage delivered by emergency caesarean section4 14.4 5.4 6.3
Number of births 1,007 9,164 10,171
For home deliveries5 Disposable delivery kit (DDK) used 34.4 29.5 29.7 Clean blade used to cut the cord 88.8 89.3 89.3 Either of the above 88.8 91.9 91.8 Baby was immediately wiped dry and then wrapped without being bathed 73.3 74.2 74.2
Number of births delivered at home 59 2,184 2,243
Timing after delivery of mother's first postnatal check6 Less than 4 hours 64.2 49.1 50.7 4-23 hours 5.0 2.8 3.1 1-2 days 3.3 3.9 3.9 3-41 days 3.2 5.0 4.8 Don't know1 3.7 2.7 2.8 No postnatal check 20.7 36.4 34.7 Total 100.0 100.0 100.0
Continued...
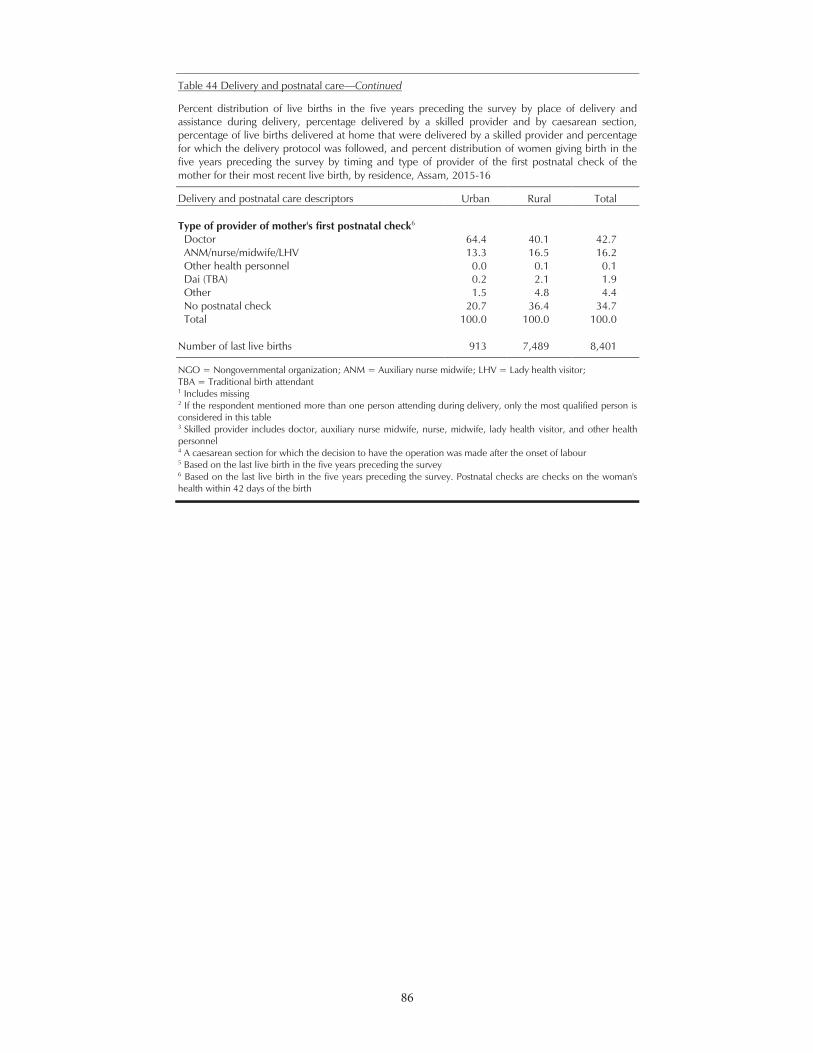
86
86
Table 44 Delivery and postnatal care—Continued
Percent distribution of live births in the five years preceding the survey by place of delivery and assistance during delivery, percentage delivered by a skilled provider and by caesarean section, percentage of live births delivered at home that were delivered by a skilled provider and percentage for which the delivery protocol was followed, and percent distribution of women giving birth in the five years preceding the survey by timing and type of provider of the first postnatal check of the mother for their most recent live birth, by residence, Assam, 2015-16
Delivery and postnatal care descriptors Urban Rural Total
Type of provider of mother's first postnatal check6 Doctor 64.4 40.1 42.7 ANM/nurse/midwife/LHV 13.3 16.5 16.2 Other health personnel 0.0 0.1 0.1 Dai (TBA) 0.2 2.1 1.9 Other 1.5 4.8 4.4 No postnatal check 20.7 36.4 34.7 Total 100.0 100.0 100.0
Number of last live births 913 7,489 8,401
NGO = Nongovernmental organization; ANM = Auxiliary nurse midwife; LHV = Lady health visitor; TBA = Traditional birth attendant 1 Includes missing 2 If the respondent mentioned more than one person attending during delivery, only the most qualified person is considered in this table 3 Skilled provider includes doctor, auxiliary nurse midwife, nurse, midwife, lady health visitor, and other health personnel 4 A caesarean section for which the decision to have the operation was made after the onset of labour 5 Based on the last live birth in the five years preceding the survey 6 Based on the last live birth in the five years preceding the survey. Postnatal checks are checks on the woman's health within 42 days of the birth
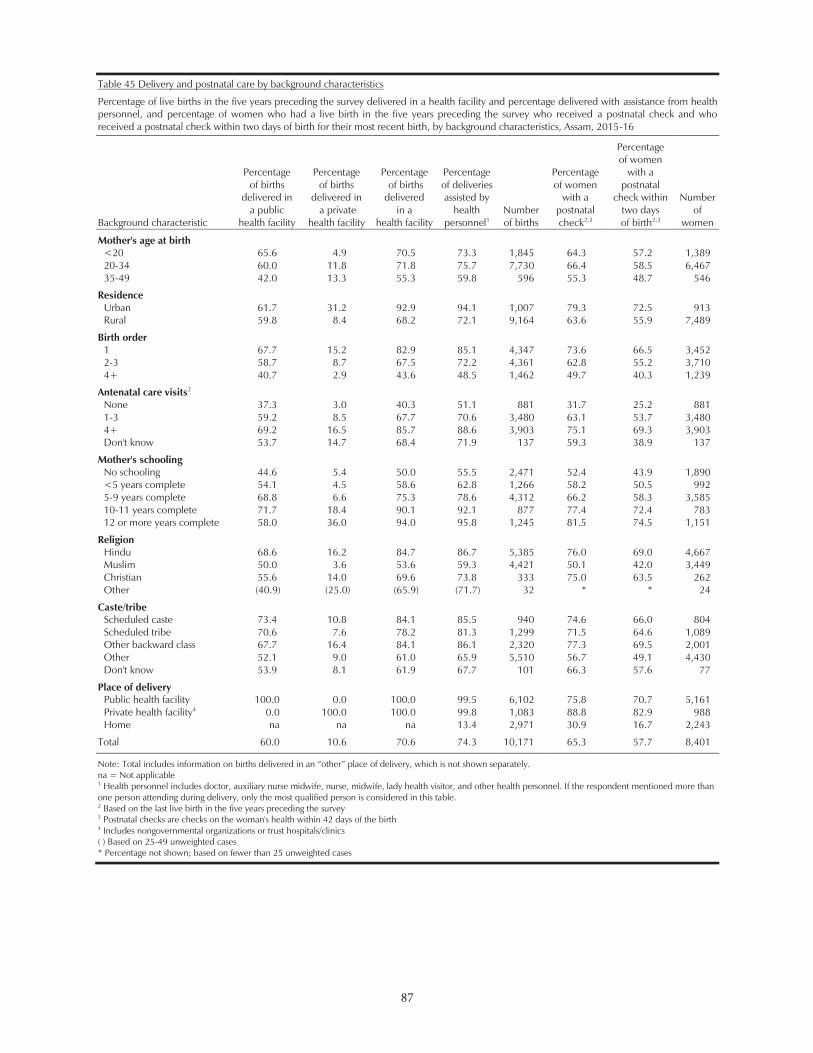
87
87
Table 45 Delivery and postnatal care by background characteristics
Percentage of live births in the five years preceding the survey delivered in a health facility and percentage delivered with assistance from health personnel, and percentage of women who had a live birth in the five years preceding the survey who received a postnatal check and who received a postnatal check within two days of birth for their most recent birth, by background characteristics, Assam, 2015-16
Background characteristic
Percentage of births
delivered in a public
health facility
Percentage of births
delivered in a private
health facility
Percentage of births delivered
in a health facility
Percentage of deliveries assisted by
health personnel1
Number of births
Percentage of women
with a postnatal check2,3
Percentage of women
with a postnatal
check within two days of birth2,3
Number of
women
Mother's age at birth <20 65.6 4.9 70.5 73.3 1,845 64.3 57.2 1,389 20-34 60.0 11.8 71.8 75.7 7,730 66.4 58.5 6,467 35-49 42.0 13.3 55.3 59.8 596 55.3 48.7 546
Residence Urban 61.7 31.2 92.9 94.1 1,007 79.3 72.5 913 Rural 59.8 8.4 68.2 72.1 9,164 63.6 55.9 7,489
Birth order 1 67.7 15.2 82.9 85.1 4,347 73.6 66.5 3,452 2-3 58.7 8.7 67.5 72.2 4,361 62.8 55.2 3,710 4+ 40.7 2.9 43.6 48.5 1,462 49.7 40.3 1,239
Antenatal care visits2 None 37.3 3.0 40.3 51.1 881 31.7 25.2 881 1-3 59.2 8.5 67.7 70.6 3,480 63.1 53.7 3,480 4+ 69.2 16.5 85.7 88.6 3,903 75.1 69.3 3,903 Don't know 53.7 14.7 68.4 71.9 137 59.3 38.9 137
Mother's schooling No schooling 44.6 5.4 50.0 55.5 2,471 52.4 43.9 1,890 <5 years complete 54.1 4.5 58.6 62.8 1,266 58.2 50.5 992 5-9 years complete 68.8 6.6 75.3 78.6 4,312 66.2 58.3 3,585 10-11 years complete 71.7 18.4 90.1 92.1 877 77.4 72.4 783 12 or more years complete 58.0 36.0 94.0 95.8 1,245 81.5 74.5 1,151
Religion Hindu 68.6 16.2 84.7 86.7 5,385 76.0 69.0 4,667 Muslim 50.0 3.6 53.6 59.3 4,421 50.1 42.0 3,449 Christian 55.6 14.0 69.6 73.8 333 75.0 63.5 262 Other (40.9) (25.0) (65.9) (71.7) 32 * * 24
Caste/tribe Scheduled caste 73.4 10.8 84.1 85.5 940 74.6 66.0 804 Scheduled tribe 70.6 7.6 78.2 81.3 1,299 71.5 64.6 1,089 Other backward class 67.7 16.4 84.1 86.1 2,320 77.3 69.5 2,001 Other 52.1 9.0 61.0 65.9 5,510 56.7 49.1 4,430 Don't know 53.9 8.1 61.9 67.7 101 66.3 57.6 77
Place of delivery Public health facility 100.0 0.0 100.0 99.5 6,102 75.8 70.7 5,161 Private health facility4 0.0 100.0 100.0 99.8 1,083 88.8 82.9 988 Home na na na 13.4 2,971 30.9 16.7 2,243
Total 60.0 10.6 70.6 74.3 10,171 65.3 57.7 8,401
Note: is not shown separately. na = Not applicable 1 Health personnel includes doctor, auxiliary nurse midwife, nurse, midwife, lady health visitor, and other health personnel. If the respondent mentioned more than one person attending during delivery, only the most qualified person is considered in this table. 2 Based on the last live birth in the five years preceding the survey 3 Postnatal checks are checks on the woman's health within 42 days of the birth 4 Includes nongovernmental organizations or trust hospitals/clinics ( ) Based on 25-49 unweighted cases * Percentage not shown; based on fewer than 25 unweighted cases
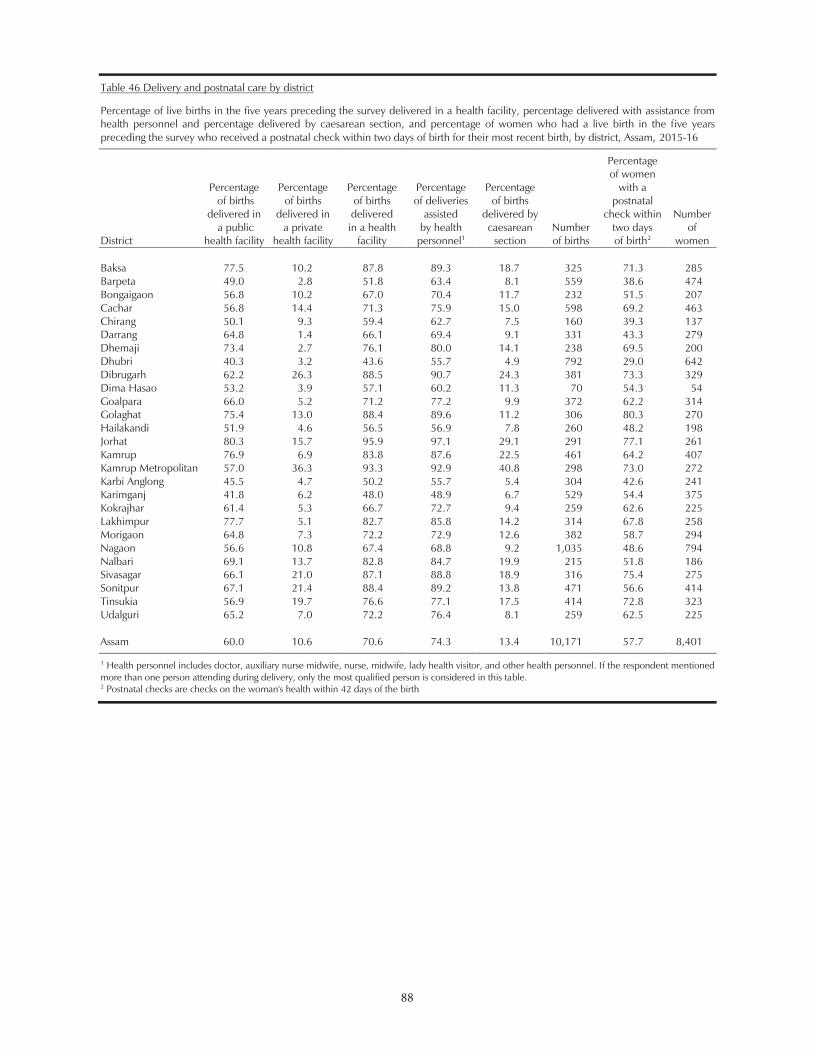
88
88
Table 46 Delivery and postnatal care by district
Percentage of live births in the five years preceding the survey delivered in a health facility, percentage delivered with assistance from health personnel and percentage delivered by caesarean section, and percentage of women who had a live birth in the five years preceding the survey who received a postnatal check within two days of birth for their most recent birth, by district, Assam, 2015-16
District
Percentage of births
delivered in a public
health facility
Percentage of births
delivered in a private
health facility
Percentage of births delivered in a health
facility
Percentage of deliveries
assisted by health
personnel1
Percentage of births
delivered by caesarean
section Number of births
Percentage of women
with a postnatal
check within two days of birth2
Number of
women Baksa 77.5 10.2 87.8 89.3 18.7 325 71.3 285 Barpeta 49.0 2.8 51.8 63.4 8.1 559 38.6 474 Bongaigaon 56.8 10.2 67.0 70.4 11.7 232 51.5 207 Cachar 56.8 14.4 71.3 75.9 15.0 598 69.2 463 Chirang 50.1 9.3 59.4 62.7 7.5 160 39.3 137 Darrang 64.8 1.4 66.1 69.4 9.1 331 43.3 279 Dhemaji 73.4 2.7 76.1 80.0 14.1 238 69.5 200 Dhubri 40.3 3.2 43.6 55.7 4.9 792 29.0 642 Dibrugarh 62.2 26.3 88.5 90.7 24.3 381 73.3 329 Dima Hasao 53.2 3.9 57.1 60.2 11.3 70 54.3 54 Goalpara 66.0 5.2 71.2 77.2 9.9 372 62.2 314 Golaghat 75.4 13.0 88.4 89.6 11.2 306 80.3 270 Hailakandi 51.9 4.6 56.5 56.9 7.8 260 48.2 198 Jorhat 80.3 15.7 95.9 97.1 29.1 291 77.1 261 Kamrup 76.9 6.9 83.8 87.6 22.5 461 64.2 407 Kamrup Metropolitan 57.0 36.3 93.3 92.9 40.8 298 73.0 272 Karbi Anglong 45.5 4.7 50.2 55.7 5.4 304 42.6 241 Karimganj 41.8 6.2 48.0 48.9 6.7 529 54.4 375 Kokrajhar 61.4 5.3 66.7 72.7 9.4 259 62.6 225 Lakhimpur 77.7 5.1 82.7 85.8 14.2 314 67.8 258 Morigaon 64.8 7.3 72.2 72.9 12.6 382 58.7 294 Nagaon 56.6 10.8 67.4 68.8 9.2 1,035 48.6 794 Nalbari 69.1 13.7 82.8 84.7 19.9 215 51.8 186 Sivasagar 66.1 21.0 87.1 88.8 18.9 316 75.4 275 Sonitpur 67.1 21.4 88.4 89.2 13.8 471 56.6 414 Tinsukia 56.9 19.7 76.6 77.1 17.5 414 72.8 323 Udalguri 65.2 7.0 72.2 76.4 8.1 259 62.5 225 Assam 60.0 10.6 70.6 74.3 13.4 10,171 57.7 8,401 1 Health personnel includes doctor, auxiliary nurse midwife, nurse, midwife, lady health visitor, and other health personnel. If the respondent mentioned more than one person attending during delivery, only the most qualified person is considered in this table. 2 Postnatal checks are checks on the woman's health within 42 days of the birth
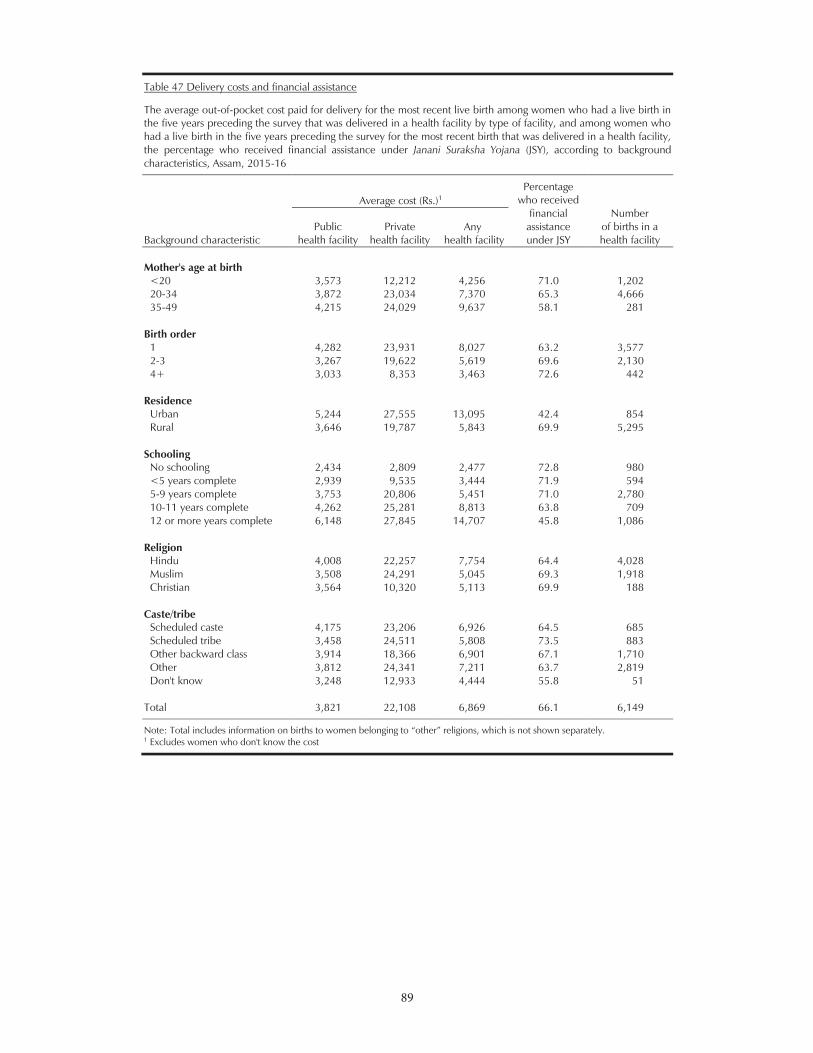
89
89
Table 47 Delivery costs and financial assistance
The average out-of-pocket cost paid for delivery for the most recent live birth among women who had a live birth in the five years preceding the survey that was delivered in a health facility by type of facility, and among women who had a live birth in the five years preceding the survey for the most recent birth that was delivered in a health facility, the percentage who received financial assistance under Janani Suraksha Yojana (JSY), according to background characteristics, Assam, 2015-16
Background characteristic
Average cost (Rs.)1
Percentage who received
financial assistance under JSY
Number of births in a health facility
Public health facility
Private health facility
Any health facility
Mother's age at birth
<20 3,573 12,212 4,256 71.0 1,202 20-34 3,872 23,034 7,370 65.3 4,666 35-49 4,215 24,029 9,637 58.1 281
Birth order 1 4,282 23,931 8,027 63.2 3,577 2-3 3,267 19,622 5,619 69.6 2,130 4+ 3,033 8,353 3,463 72.6 442
Residence Urban 5,244 27,555 13,095 42.4 854 Rural 3,646 19,787 5,843 69.9 5,295
Schooling No schooling 2,434 2,809 2,477 72.8 980 <5 years complete 2,939 9,535 3,444 71.9 594 5-9 years complete 3,753 20,806 5,451 71.0 2,780 10-11 years complete 4,262 25,281 8,813 63.8 709 12 or more years complete 6,148 27,845 14,707 45.8 1,086
Religion Hindu 4,008 22,257 7,754 64.4 4,028 Muslim 3,508 24,291 5,045 69.3 1,918 Christian 3,564 10,320 5,113 69.9 188
Caste/tribe Scheduled caste 4,175 23,206 6,926 64.5 685 Scheduled tribe 3,458 24,511 5,808 73.5 883 Other backward class 3,914 18,366 6,901 67.1 1,710 Other 3,812 24,341 7,211 63.7 2,819 Don't know 3,248 12,933 4,444 55.8 51
Total 3,821 22,108 6,869 66.1 6,149
Note: ich is not shown separately. 1 Excludes women who don't know the cost
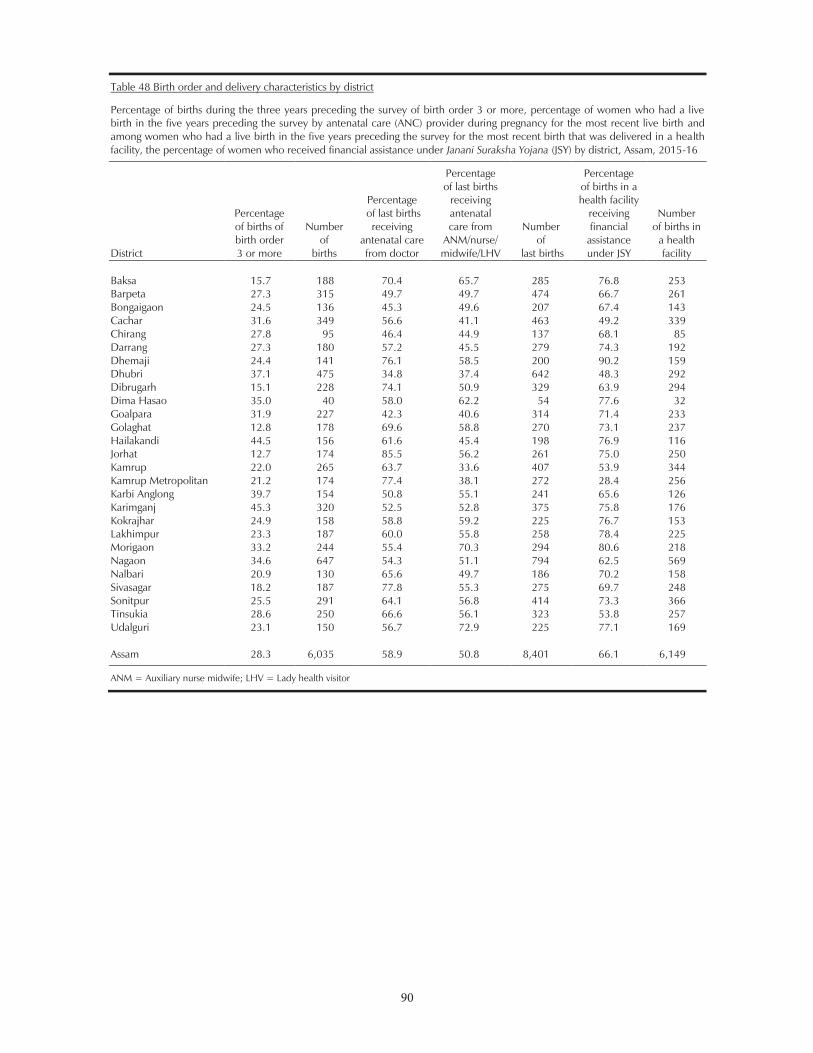
90
90
Table 48 Birth order and delivery characteristics by district
Percentage of births during the three years preceding the survey of birth order 3 or more, percentage of women who had a live birth in the five years preceding the survey by antenatal care (ANC) provider during pregnancy for the most recent live birth and among women who had a live birth in the five years preceding the survey for the most recent birth that was delivered in a health facility, the percentage of women who received financial assistance under Janani Suraksha Yojana (JSY) by district, Assam, 2015-16
District
Percentage of births of birth order 3 or more
Number of
births
Percentage of last births
receiving antenatal care from doctor
Percentage of last births
receiving antenatal care from
ANM/nurse/ midwife/LHV
Number of
last births
Percentage of births in a health facility
receiving financial
assistance under JSY
Number of births in
a health facility
Baksa 15.7 188 70.4 65.7 285 76.8 253 Barpeta 27.3 315 49.7 49.7 474 66.7 261 Bongaigaon 24.5 136 45.3 49.6 207 67.4 143 Cachar 31.6 349 56.6 41.1 463 49.2 339 Chirang 27.8 95 46.4 44.9 137 68.1 85 Darrang 27.3 180 57.2 45.5 279 74.3 192 Dhemaji 24.4 141 76.1 58.5 200 90.2 159 Dhubri 37.1 475 34.8 37.4 642 48.3 292 Dibrugarh 15.1 228 74.1 50.9 329 63.9 294 Dima Hasao 35.0 40 58.0 62.2 54 77.6 32 Goalpara 31.9 227 42.3 40.6 314 71.4 233 Golaghat 12.8 178 69.6 58.8 270 73.1 237 Hailakandi 44.5 156 61.6 45.4 198 76.9 116 Jorhat 12.7 174 85.5 56.2 261 75.0 250 Kamrup 22.0 265 63.7 33.6 407 53.9 344 Kamrup Metropolitan 21.2 174 77.4 38.1 272 28.4 256 Karbi Anglong 39.7 154 50.8 55.1 241 65.6 126 Karimganj 45.3 320 52.5 52.8 375 75.8 176 Kokrajhar 24.9 158 58.8 59.2 225 76.7 153 Lakhimpur 23.3 187 60.0 55.8 258 78.4 225 Morigaon 33.2 244 55.4 70.3 294 80.6 218 Nagaon 34.6 647 54.3 51.1 794 62.5 569 Nalbari 20.9 130 65.6 49.7 186 70.2 158 Sivasagar 18.2 187 77.8 55.3 275 69.7 248 Sonitpur 25.5 291 64.1 56.8 414 73.3 366 Tinsukia 28.6 250 66.6 56.1 323 53.8 257 Udalguri 23.1 150 56.7 72.9 225 77.1 169 Assam 28.3 6,035 58.9 50.8 8,401 66.1 6,149
ANM = Auxiliary nurse midwife; LHV = Lady health visitor

91
91
Table 49 Timing of first health check after birth for the newborn
Percent distribution of last births in the five years preceding the survey by time after birth of first health check, and the percentage of births with a health check in the first two days after birth, according to background characteristics, Assam, 2015-16
Background characteristic
Time after birth of newborn's first health check
No health check1 Total
Percentage of births with a health check
in the first two days afterbirth
Number of
births
Less than
1 hour 1-3
hours 4-23 hours
1-2 days
3-6 days
Don't know
Mother's age at birth <20 7.6 14.0 0.6 3.4 2.6 1.3 70.5 100.0 25.6 1,669 20-34 9.0 14.6 1.4 3.2 2.4 1.2 68.2 100.0 28.1 6,238 35-49 7.6 11.9 0.6 3.9 2.0 0.9 73.2 100.0 24.0 494
Birth order 1 10.1 15.8 1.2 2.5 2.2 1.4 66.7 100.0 29.6 3,452 2-3 7.8 13.9 1.2 3.6 2.6 1.2 69.5 100.0 26.6 3,710 4-5 7.7 11.0 0.8 4.3 2.2 1.0 73.0 100.0 23.8 946 6+ 5.6 12.3 0.8 3.5 2.9 0.0 74.9 100.0 22.3 293
Place of delivery Public health facility 10.9 17.7 1.2 3.0 2.1 1.3 64.0 100.0 32.7 5,161 Private health facility2 14.0 14.5 1.0 1.6 1.5 1.4 66.0 100.0 31.2 988 Home 1.1 6.5 1.2 4.6 3.6 1.1 81.9 100.0 13.4 2,243
Residence Urban 10.3 12.4 1.1 2.4 1.0 2.1 70.7 100.0 26.2 913 Rural 8.5 14.5 1.2 3.4 2.6 1.1 68.8 100.0 27.5 7,489
Religion Hindu 10.9 17.0 1.2 3.2 2.1 1.3 64.3 100.0 32.3 4,667 Muslim 5.9 10.3 1.3 3.3 2.8 1.1 75.3 100.0 20.8 3,449 Christian 6.5 18.3 0.0 1.9 1.3 2.2 69.8 100.0 26.7 262
Caste/tribe Scheduled caste 9.3 16.8 2.0 2.6 2.6 0.6 66.1 100.0 30.7 804 Scheduled tribe 9.4 18.5 0.6 3.0 1.5 1.5 65.6 100.0 31.4 1,089 Other backward class 10.2 18.2 0.8 3.4 2.2 1.2 64.0 100.0 32.6 2,001 Other 7.7 11.3 1.3 3.3 2.7 1.2 72.4 100.0 23.6 4,430 Don't know 4.8 4.7 0.9 6.6 1.5 2.7 78.7 100.0 17.1 77
Mother's schooling No schooling 6.5 11.5 1.0 4.2 2.6 1.1 73.1 100.0 23.2 1,890 <5 years complete 7.4 12.9 0.7 3.5 2.1 1.2 72.2 100.0 24.5 992 5-9 years complete 8.4 15.6 1.3 2.7 2.7 1.0 68.2 100.0 28.2 3,585 10-11 years complete 11.3 15.1 1.5 3.1 1.4 1.4 66.1 100.0 31.0 783 12 or more years complete 12.2 15.4 1.1 3.3 2.2 2.1 63.8 100.0 31.9 1,151
Total 8.7 14.3 1.2 3.3 2.4 1.2 69.0 100.0 27.4 8,401
Note: Total includes information on births to women who delivered in an onging to is not shown separately.
1 Includes newborns who received a health check after the first week 2 Includes nongovernmental organizations or trust hospitals/clinics
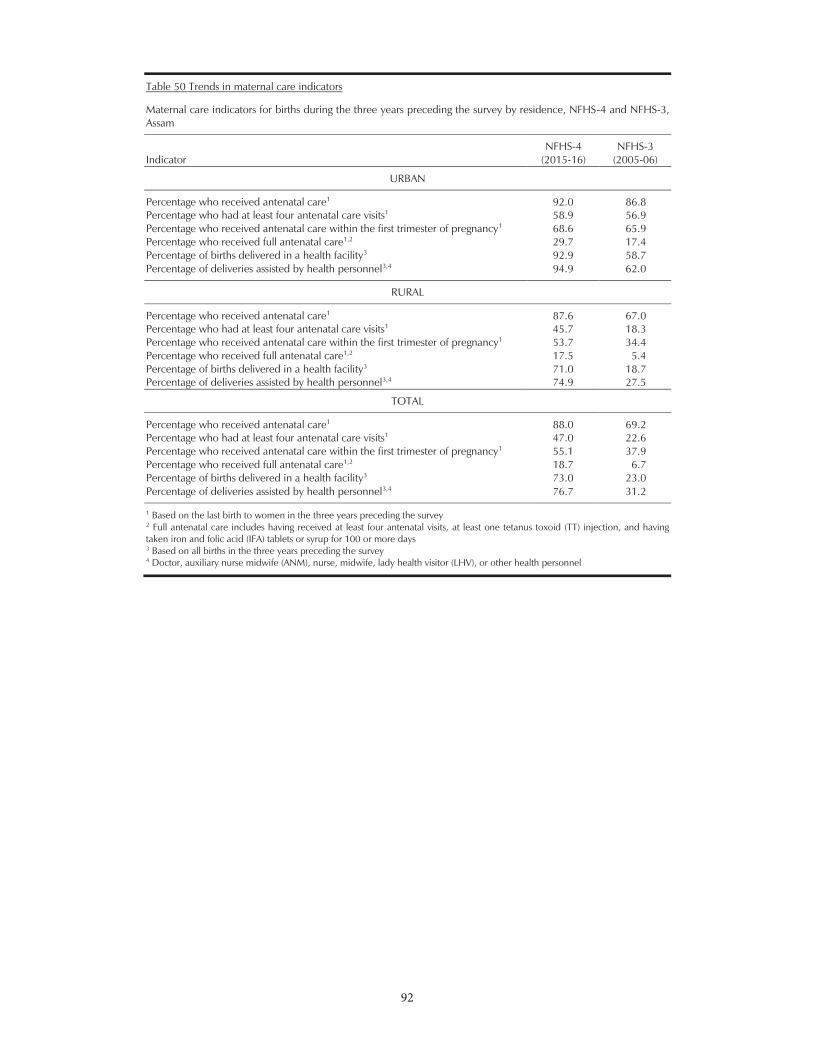
92
92
Table 50 Trends in maternal care indicators
Maternal care indicators for births during the three years preceding the survey by residence, NFHS-4 and NFHS-3, Assam
Indicator NFHS-4
(2015-16) NFHS-3
(2005-06)
URBAN
Percentage who received antenatal care1 92.0 86.8 Percentage who had at least four antenatal care visits1 58.9 56.9 Percentage who received antenatal care within the first trimester of pregnancy1 68.6 65.9 Percentage who received full antenatal care1,2 29.7 17.4 Percentage of births delivered in a health facility3 92.9 58.7 Percentage of deliveries assisted by health personnel3,4 94.9 62.0
RURAL
Percentage who received antenatal care1 87.6 67.0 Percentage who had at least four antenatal care visits1 45.7 18.3 Percentage who received antenatal care within the first trimester of pregnancy1 53.7 34.4 Percentage who received full antenatal care1,2 17.5 5.4 Percentage of births delivered in a health facility3 71.0 18.7 Percentage of deliveries assisted by health personnel3,4 74.9 27.5
TOTAL
Percentage who received antenatal care1 88.0 69.2 Percentage who had at least four antenatal care visits1 47.0 22.6 Percentage who received antenatal care within the first trimester of pregnancy1 55.1 37.9 Percentage who received full antenatal care1,2 18.7 6.7 Percentage of births delivered in a health facility3 73.0 23.0 Percentage of deliveries assisted by health personnel3,4 76.7 31.2 1 Based on the last birth to women in the three years preceding the survey 2 Full antenatal care includes having received at least four antenatal visits, at least one tetanus toxoid (TT) injection, and having taken iron and folic acid (IFA) tablets or syrup for 100 or more days 3 Based on all births in the three years preceding the survey 4 Doctor, auxiliary nurse midwife (ANM), nurse, midwife, lady health visitor (LHV), or other health personnel
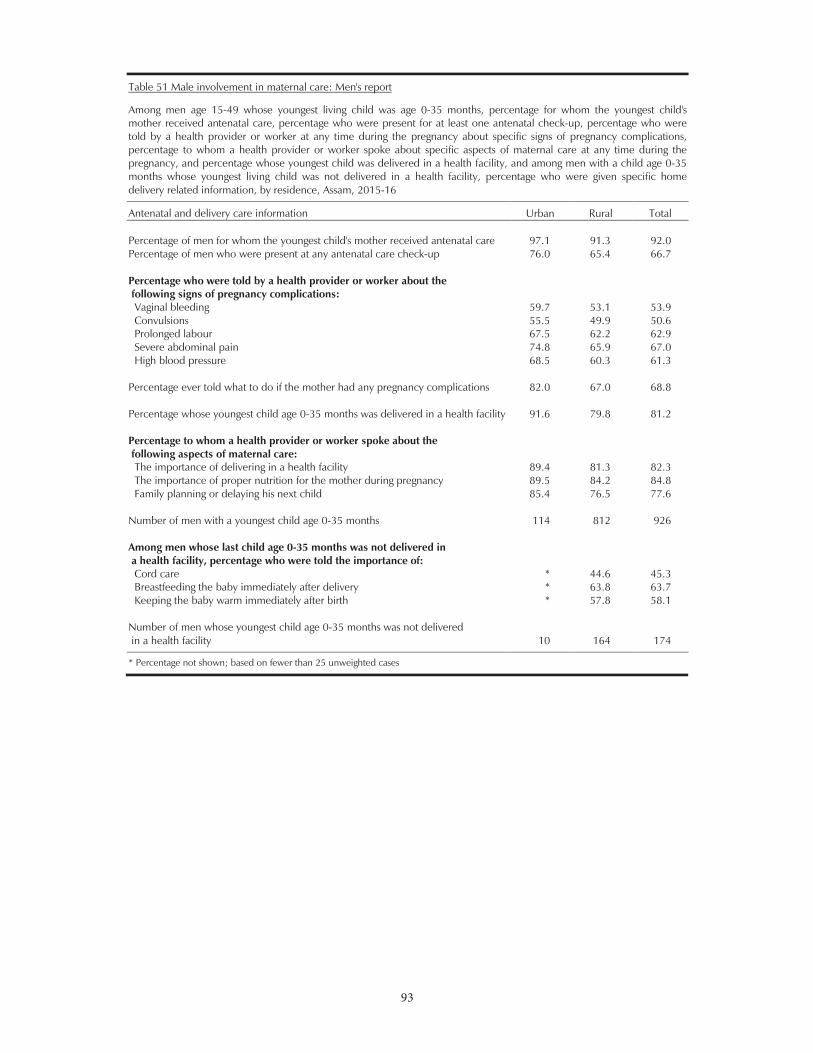
93
93
Table 51 Male involvement in maternal care: Men's report
Among men age 15-49 whose youngest living child was age 0-35 months, percentage for whom the youngest child's mother received antenatal care, percentage who were present for at least one antenatal check-up, percentage who were told by a health provider or worker at any time during the pregnancy about specific signs of pregnancy complications, percentage to whom a health provider or worker spoke about specific aspects of maternal care at any time during the pregnancy, and percentage whose youngest child was delivered in a health facility, and among men with a child age 0-35 months whose youngest living child was not delivered in a health facility, percentage who were given specific home delivery related information, by residence, Assam, 2015-16
Antenatal and delivery care information Urban Rural Total Percentage of men for whom the youngest child's mother received antenatal care 97.1 91.3 92.0 Percentage of men who were present at any antenatal care check-up 76.0 65.4 66.7 Percentage who were told by a health provider or worker about the following signs of pregnancy complications:
Vaginal bleeding 59.7 53.1 53.9 Convulsions 55.5 49.9 50.6 Prolonged labour 67.5 62.2 62.9 Severe abdominal pain 74.8 65.9 67.0 High blood pressure 68.5 60.3 61.3
Percentage ever told what to do if the mother had any pregnancy complications 82.0 67.0 68.8
Percentage whose youngest child age 0-35 months was delivered in a health facility 91.6 79.8 81.2 Percentage to whom a health provider or worker spoke about the following aspects of maternal care:
The importance of delivering in a health facility 89.4 81.3 82.3 The importance of proper nutrition for the mother during pregnancy 89.5 84.2 84.8 Family planning or delaying his next child 85.4 76.5 77.6
Number of men with a youngest child age 0-35 months 114 812 926 Among men whose last child age 0-35 months was not delivered in a health facility, percentage who were told the importance of:
Cord care * 44.6 45.3 Breastfeeding the baby immediately after delivery * 63.8 63.7 Keeping the baby warm immediately after birth * 57.8 58.1
Number of men whose youngest child age 0-35 months was not delivered in a health facility 10 164 174
* Percentage not shown; based on fewer than 25 unweighted cases

94
94
Tabl
e 52
Vac
cina
tions
by
back
grou
nd c
hara
cter
istic
s
Perc
enta
ge o
f ch
ildre
n ag
e 12
-23
mon
ths
who
rec
eive
d sp
ecifi
c va
ccin
es a
t an
y tim
e be
fore
the
sur
vey
(acc
ordi
ng t
o a
vacc
inat
ion
card
or
the
mot
her's
rep
ort)
and
perc
enta
ge w
ith a
va
ccin
atio
n ca
rd s
een
by th
e in
terv
iew
er, b
y ba
ckgr
ound
cha
ract
erist
ics,
Ass
am, 2
015-
16, a
nd to
tal f
or N
FHS-
3
Back
grou
nd
char
acte
ristic
Hep
atiti
s B1
BCG
DPT
Polio
1
Mea
sles
All
basic
va
cci-
natio
ns2
No
va
cci-
natio
ns3
Perc
enta
ge
with
a
vacc
inat
ion
card
see
n
Num
ber
of
child
ren
0 1
2 3
1 2
3 0
1 2
3
Se
x
Mal
e
46.1
77
.0
69.6
53
.7
83.7
83
.2
78.9
67
.7
58.0
83
.5
75.6
56
.4
72.5
48
.0
12.7
55
.4
1,01
5 Fe
mal
e
44.6
72
.5
66.6
50
.2
80.8
79
.5
74.8
65
.2
55.0
82
.4
74.3
55
.7
70.2
46
.0
15.0
55
.2
924
Birt
h or
der
1
55.6
77
.8
73.2
57
.4
86.4
85
.6
81.0
73
.4
67.1
86
.6
78.5
61
.7
77.1
53
.4
10.2
59
.8
786
2-3
40
.8
76.0
67
.5
50.3
81
.2
80.8
77
.3
64.5
51
.3
82.2
74
.7
53.4
69
.6
43.9
14
.2
53.8
90
4 4-
5
32.7
61
.3
53.9
41
.6
73.5
71
.7
63.3
53
.5
42.6
74
.2
64.9
48
.7
60.7
40
.2
23.2
48
.3
205
6+
(16.
3)
(61.
0)
(58.
5)
(39.
6)
(72.
4)
(65.
1)
(59.
3)
(43.
9)
(42.
4)
(74.
7)
(66.
2)
(42.
1)
(57.
0)
(32.
7)
(25.
3)
(39.
5)
44
Resi
denc
e
U
rban
62
.7
92.4
83
.6
70.0
94
.3
94.3
90
.5
82.8
75
.3
91.4
86
.2
76.4
86
.1
70.9
4.
3 74
.1
197
Rura
l 43
.4
72.9
66
.4
50.0
81
.0
79.9
75
.4
64.6
54
.5
82.0
73
.7
53.7
69
.7
44.4
14
.9
53.2
1,
741
Mot
her's
sch
oolin
g
N
o sc
hool
ing
33
.9
63.6
57
.4
40.0
73
.4
71.3
64
.7
52.9
42
.2
73.8
64
.8
44.6
60
.5
36.2
21
.5
45.5
42
8 <
5 ye
ars
com
plet
e
36.1
77
.9
69.7
52
.0
84.3
82
.4
76.5
65
.1
50.8
86
.6
77.4
55
.0
70.8
47
.8
13.0
55
.8
228
5-9
year
s co
mpl
ete
46
.6
77.0
70
.0
53.3
83
.1
83.8
78
.9
69.4
58
.7
84.4
77
.0
57.4
72
.5
46.3
11
.6
55.4
81
8 10
-11
year
s co
mpl
ete
58
.8
82.0
77
.2
60.0
87
.1
85.6
85
.0
74.6
68
.9
87.0
82
.7
62.0
82
.9
55.5
11
.3
58.3
18
3 12
or m
ore
year
s co
mpl
ete
57
.8
78.6
72
.2
61.2
88
.7
86.4
85
.0
74.5
69
.1
87.0
77
.7
66.3
77
.8
59.6
10
.7
67.7
28
2
Re
ligio
n
H
indu
54
.3
82.6
76
.1
61.2
87
.5
87.8
84
.2
75.1
65
.8
88.2
80
.6
63.7
79
.1
55.4
9.
5 63
.3
1,03
3 M
uslim
32
.5
65.0
57
.8
40.2
75
.2
72.8
67
.2
55.0
43
.9
75.8
67
.5
46.4
61
.3
36.2
19
.7
45.7
84
6 C
hrist
ian
74
.8
83.1
78
.9
61.7
95
.7
94.9
91
.8
83.0
79
.0
95.3
85
.9
61.5
83
.1
58.0
2.
2 53
.8
58
Con
tinue
d...
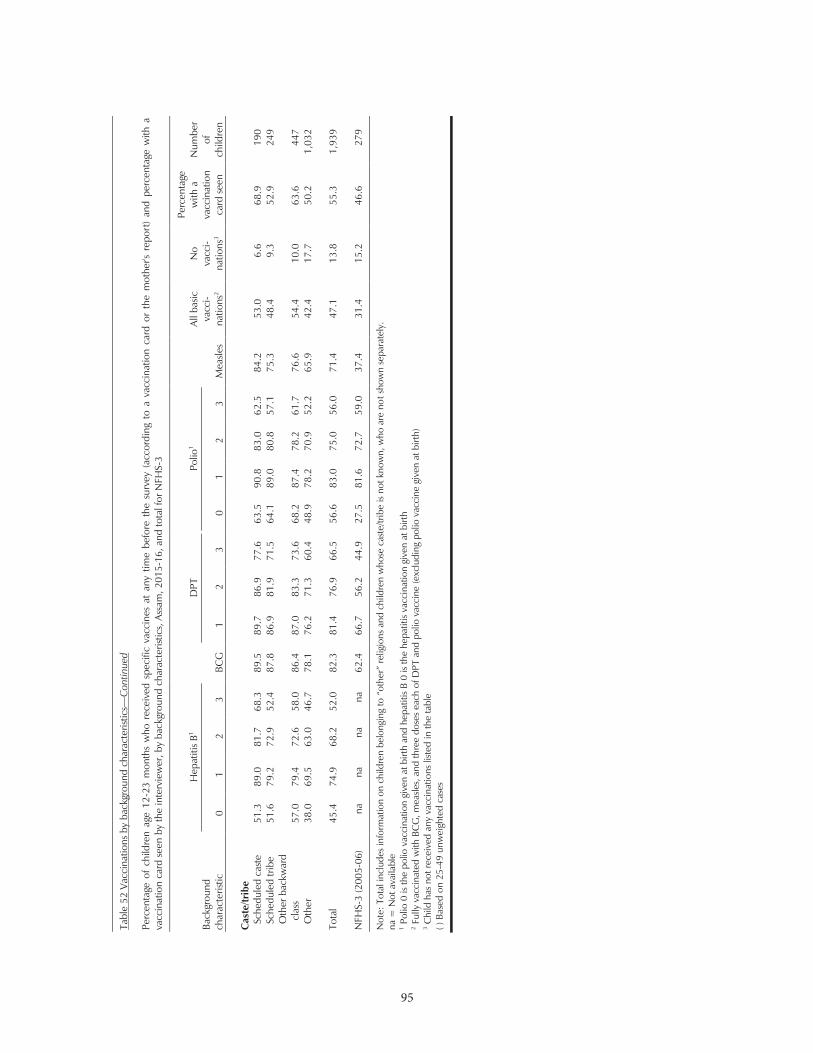
95
95
Tabl
e 52
Vac
cina
tions
by
back
grou
nd c
hara
cter
istic
s—C
ontin
ued
Perc
enta
ge o
f ch
ildre
n ag
e 12
-23
mon
ths
who
rec
eive
d sp
ecifi
c va
ccin
es a
t an
y tim
e be
fore
the
sur
vey
(acc
ordi
ng t
o a
vacc
inat
ion
card
or
the
mot
her's
rep
ort)
and
perc
enta
ge w
ith a
va
ccin
atio
n ca
rd s
een
by th
e in
terv
iew
er, b
y ba
ckgr
ound
cha
ract
erist
ics,
Ass
am, 2
015-
16, a
nd to
tal f
or N
FHS-
3
Back
grou
nd
char
acte
ristic
Hep
atiti
s B1
BCG
DPT
Polio
1
Mea
sles
All
basic
va
cci-
natio
ns2
No
va
cci-
natio
ns3
Perc
enta
ge
with
a
vacc
inat
ion
card
see
n
Num
ber
of
child
ren
0 1
2 3
1 2
3 0
1 2
3
C
aste
/trib
e
Sche
dule
d ca
ste
51
.3
89.0
81
.7
68.3
89
.5
89.7
86
.9
77.6
63
.5
90.8
83
.0
62.5
84
.2
53.0
6.
6 68
.9
190
Sche
dule
d tri
be
51.6
79
.2
72.9
52
.4
87.8
86
.9
81.9
71
.5
64.1
89
.0
80.8
57
.1
75.3
48
.4
9.3
52.9
24
9 O
ther
bac
kwar
d cl
ass
57
.0
79.4
72
.6
58.0
86
.4
87.0
83
.3
73.6
68
.2
87.4
78
.2
61.7
76
.6
54.4
10
.0
63.6
44
7 O
ther
38
.0
69.5
63
.0
46.7
78
.1
76.2
71
.3
60.4
48
.9
78.2
70
.9
52.2
65
.9
42.4
17
.7
50.2
1,
032
Tota
l 45
.4
74.9
68
.2
52.0
82
.3
81.4
76
.9
66.5
56
.6
83.0
75
.0
56.0
71
.4
47.1
13
.8
55.3
1,
939
NFH
S-3
(200
5-06
) na
na
na
na
62
.4
66.7
56
.2
44.9
27
.5
81.6
72
.7
59.0
37
.4
31.4
15
.2
46.6
27
9
Not
e:
t sho
wn
sepa
rate
ly.
na =
Not
ava
ilabl
e 1 P
olio
0 is
the
polio
vac
cina
tion
give
n at
birt
h an
d he
patit
is B
0 is
the
hepa
titis
vacc
inat
ion
give
n at
birt
h 2 F
ully
vac
cina
ted
with
BC
G, m
easle
s, a
nd th
ree
dose
s ea
ch o
f DPT
and
pol
io v
acci
ne (e
xclu
ding
pol
io v
acci
ne g
iven
at b
irth)
3 C
hild
has
not
rece
ived
any
vac
cina
tions
list
ed in
the
tabl
e ( )
Bas
ed o
n 25
-49
unw
eigh
ted
case
s
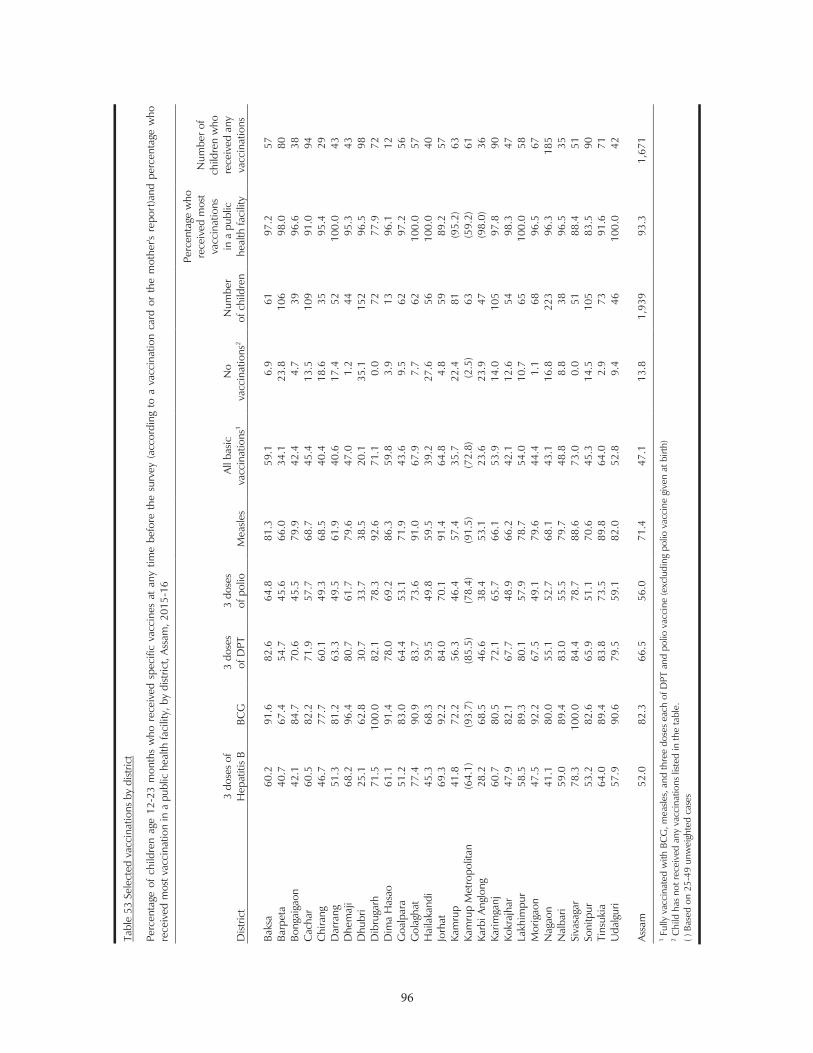
96
96
Tabl
e 53
Sel
ecte
d va
ccin
atio
ns b
y di
stric
t
Perc
enta
ge o
f ch
ildre
n ag
e 12
-23
mon
ths
who
rec
eive
d sp
ecifi
c va
ccin
es a
t an
y tim
e be
fore
the
sur
vey
(acc
ordi
ng t
o a
vacc
inat
ion
card
or
the
mot
her's
rep
ort)a
nd p
erce
ntag
e w
ho
rece
ived
mos
t vac
cina
tion
in a
pub
lic h
ealth
faci
lity,
by
dist
rict,
Assa
m, 2
015-
16
Dist
rict
3 do
ses
of
Hep
atiti
s B
BCG
3
dose
s
of D
PT
3 do
ses
of
pol
io
Mea
sles
All b
asic
va
ccin
atio
ns1
No
va
ccin
atio
ns2
Num
ber
of c
hild
ren
Perc
enta
ge w
ho
rece
ived
mos
t va
ccin
atio
ns
in a
pub
lic
heal
th fa
cilit
y
Num
ber o
f ch
ildre
n w
ho
rece
ived
any
va
ccin
atio
ns
Ba
ksa
60.2
91
.6
82.6
64
.8
81.3
59
.1
6.9
61
97.2
57
Ba
rpet
a 40
.7
67.4
54
.7
45.6
66
.0
34.1
23
.8
106
98.0
80
Bo
ngai
gaon
42
.1
84.7
70
.6
45.5
79
.9
42.4
4.
7 39
96
.6
38
Cac
har
60.5
82
.2
71.9
57
.7
68.7
45
.4
13.5
10
9 91
.0
94
Chi
rang
46
.7
77.7
60
.1
49.3
68
.5
40.4
18
.6
35
95.4
29
D
arra
ng
51.3
81
.2
63.3
49
.5
61.9
40
.6
17.4
52
10
0.0
43
Dhe
maj
i 68
.2
96.4
80
.7
61.7
79
.6
47.0
1.
2 44
95
.3
43
Dhu
bri
25.1
62
.8
30.7
33
.7
38.5
20
.1
35.1
15
2 96
.5
98
Dib
ruga
rh
71.5
10
0.0
82.1
78
.3
92.6
71
.1
0.0
72
77.9
72
D
ima
Has
ao
61.1
91
.4
78.0
69
.2
86.3
59
.8
3.9
13
96.1
12
G
oalp
ara
51.2
83
.0
64.4
53
.1
71.9
43
.6
9.5
62
97.2
56
G
olag
hat
77.4
90
.9
83.7
73
.6
91.0
67
.9
7.7
62
100.
0 57
H
aila
kand
i 45
.3
68.3
59
.5
49.8
59
.5
39.2
27
.6
56
100.
0 40
Jo
rhat
69
.3
92.2
84
.0
70.1
91
.4
64.8
4.
8 59
89
.2
57
Kam
rup
41.8
72
.2
56.3
46
.4
57.4
35
.7
22.4
81
(9
5.2)
63
Ka
mru
p M
etro
polit
an
(64.
1)
(93.
7)
(85.
5)
(78.
4)
(91.
5)
(72.
8)
(2.5
) 63
(5
9.2)
61
Ka
rbi A
nglo
ng
28.2
68
.5
46.6
38
.4
53.1
23
.6
23.9
47
(9
8.0)
36
Ka
rimga
nj
60.7
80
.5
72.1
65
.7
66.1
53
.9
14.0
10
5 97
.8
90
Kokr
ajha
r 47
.9
82.1
67
.7
48.9
66
.2
42.1
12
.6
54
98.3
47
La
khim
pur
58.5
89
.3
80.1
57
.9
78.7
54
.0
10.7
65
10
0.0
58
Mor
igao
n 47
.5
92.2
67
.5
49.1
79
.6
44.4
1.
1 68
96
.5
67
Nag
aon
41.1
80
.0
55.1
52
.7
68.1
43
.1
16.8
22
3 96
.3
185
Nal
bari
59.0
89
.4
83.0
55
.5
79.7
48
.8
8.8
38
96.5
35
Si
vasa
gar
78.3
10
0.0
84.4
78
.7
88.6
73
.0
0.0
51
88.4
51
So
nitp
ur
53.2
82
.6
65.9
51
.1
70.6
45
.3
14.5
10
5 83
.5
90
Tins
ukia
64
.0
89.4
83
.8
73.5
89
.8
64.0
2.
9 73
91
.6
71
Uda
lgur
i 57
.9
90.6
79
.5
59.1
82
.0
52.8
9.
4 46
10
0.0
42
As
sam
52
.0
82.3
66
.5
56.0
71
.4
47.1
13
.8
1,93
9 93
.3
1,67
1
1 Ful
ly v
acci
nate
d w
ith B
CG
, mea
sles,
and
thre
e do
ses
each
of D
PT a
nd p
olio
vac
cine
(exc
ludi
ng p
olio
vac
cine
giv
en a
t birt
h)
2 Chi
ld h
as n
ot re
ceiv
ed a
ny v
acci
natio
ns li
sted
in th
e ta
ble.
( )
Bas
ed o
n 25
-49
unw
eigh
ted
case
s
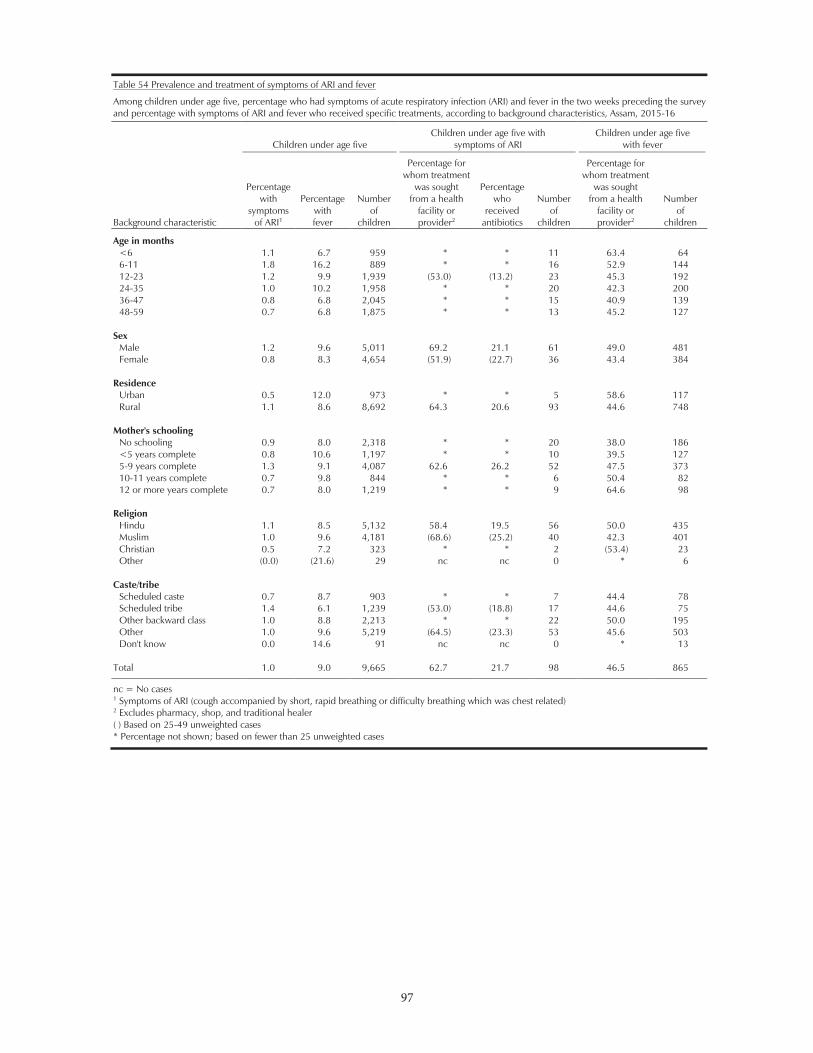
97
97
Table 54 Prevalence and treatment of symptoms of ARI and fever
Among children under age five, percentage who had symptoms of acute respiratory infection (ARI) and fever in the two weeks preceding the survey and percentage with symptoms of ARI and fever who received specific treatments, according to background characteristics, Assam, 2015-16
Background characteristic
Children under age five
Children under age five with symptoms of ARI
Children under age five with fever
Percentage with
symptoms of ARI1
Percentage with fever
Number of
children
Percentage for whom treatment
was sought from a health
facility or provider2
Percentage who
received antibiotics
Number of
children
Percentage for whom treatment
was sought from a health
facility or provider2
Number of
children
Age in months <6 1.1 6.7 959 * * 11 63.4 64 6-11 1.8 16.2 889 * * 16 52.9 144 12-23 1.2 9.9 1,939 (53.0) (13.2) 23 45.3 192 24-35 1.0 10.2 1,958 * * 20 42.3 200 36-47 0.8 6.8 2,045 * * 15 40.9 139 48-59 0.7 6.8 1,875 * * 13 45.2 127
Sex Male 1.2 9.6 5,011 69.2 21.1 61 49.0 481 Female 0.8 8.3 4,654 (51.9) (22.7) 36 43.4 384
Residence Urban 0.5 12.0 973 * * 5 58.6 117 Rural 1.1 8.6 8,692 64.3 20.6 93 44.6 748
Mother's schooling No schooling 0.9 8.0 2,318 * * 20 38.0 186 <5 years complete 0.8 10.6 1,197 * * 10 39.5 127 5-9 years complete 1.3 9.1 4,087 62.6 26.2 52 47.5 373 10-11 years complete 0.7 9.8 844 * * 6 50.4 82 12 or more years complete 0.7 8.0 1,219 * * 9 64.6 98
Religion Hindu 1.1 8.5 5,132 58.4 19.5 56 50.0 435 Muslim 1.0 9.6 4,181 (68.6) (25.2) 40 42.3 401 Christian 0.5 7.2 323 * * 2 (53.4) 23 Other (0.0) (21.6) 29 nc nc 0 * 6
Caste/tribe Scheduled caste 0.7 8.7 903 * * 7 44.4 78 Scheduled tribe 1.4 6.1 1,239 (53.0) (18.8) 17 44.6 75 Other backward class 1.0 8.8 2,213 * * 22 50.0 195 Other 1.0 9.6 5,219 (64.5) (23.3) 53 45.6 503 Don't know 0.0 14.6 91 nc nc 0 * 13
Total 1.0 9.0 9,665 62.7 21.7 98 46.5 865
nc = No cases 1 Symptoms of ARI (cough accompanied by short, rapid breathing or difficulty breathing which was chest related) 2 Excludes pharmacy, shop, and traditional healer ( ) Based on 25-49 unweighted cases * Percentage not shown; based on fewer than 25 unweighted cases
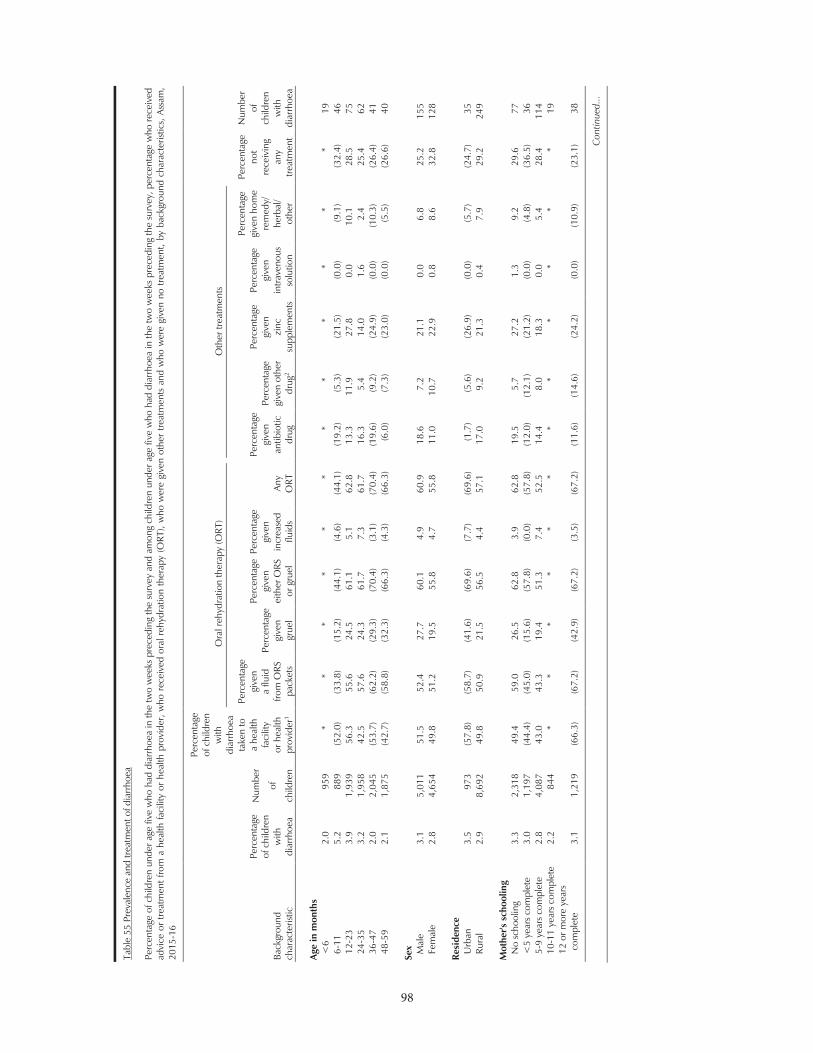
98
98
Tabl
e 55
Pre
vale
nce
and
treat
men
t of d
iarr
hoea
Perc
enta
ge o
f chi
ldre
n un
der a
ge fi
ve w
ho h
ad d
iarr
hoea
in th
e tw
o w
eeks
pre
cedi
ng th
e su
rvey
and
am
ong
child
ren
unde
r age
five
who
had
dia
rrho
ea in
the
two
wee
ks p
rece
ding
the
surv
ey, p
erce
ntag
e w
ho re
ceiv
ed
advi
ce o
r tre
atm
ent f
rom
a h
ealth
faci
lity
or h
ealth
pro
vide
r, w
ho r
ecei
ved
oral
reh
ydra
tion
ther
apy
(ORT
), w
ho w
ere
give
n ot
her
treat
men
ts a
nd w
ho w
ere
give
n no
trea
tmen
t, by
bac
kgro
und
char
acte
ristic
s, A
ssam
, 20
15-1
6
Back
grou
nd
char
acte
ristic
Perc
enta
ge
of c
hild
ren
with
di
arrh
oea
Num
ber
of
child
ren
Perc
enta
ge
of c
hild
ren
with
di
arrh
oea
take
n to
a
heal
th
faci
lity
or
hea
lth
prov
ider
1
Ora
l reh
ydra
tion
ther
apy
(ORT
)
Oth
er tr
eatm
ents
Perc
enta
ge
not
rece
ivin
g an
y tre
atm
ent
Num
ber
of
child
ren
with
di
arrh
oea
Perc
enta
ge
give
n
a flu
id
from
ORS
pa
cket
s
Perc
enta
ge
give
n
grue
l
Perc
enta
ge
give
n
eith
er O
RS
or g
ruel
Perc
enta
ge
give
n in
crea
sed
fluid
s An
y
ORT
Perc
enta
ge
give
n an
tibio
tic
drug
Perc
enta
ge
give
n ot
her
drug
2
Perc
enta
ge
give
n
zinc
su
pple
men
ts
Perc
enta
ge
give
n in
trave
nous
so
lutio
n
Perc
enta
ge
give
n ho
me
re
med
y/
herb
al/
othe
r
Ag
e in
mon
ths
<
6
2.0
959
* *
* *
* *
* *
* *
* *
19
6-11
5.
2 88
9 (5
2.0)
(3
3.8)
(1
5.2)
(4
4.1)
(4
.6)
(44.
1)
(19.
2)
(5.3
) (2
1.5)
(0
.0)
(9.1
) (3
2.4)
46
12
-23
3.
9 1,
939
56.3
55
.6
24.5
61
.1
5.1
62.8
13
.3
11.9
27
.8
0.0
10.1
28
.5
75
24-3
5
3.2
1,95
8 42
.5
57.6
24
.3
61.7
7.
3 61
.7
16.3
5.
4 14
.0
1.6
2.4
25.4
62
36
-47
2.
0 2,
045
(53.
7)
(62.
2)
(29.
3)
(70.
4)
(3.1
) (7
0.4)
(1
9.6)
(9
.2)
(24.
9)
(0.0
) (1
0.3)
(2
6.4)
41
48
-59
2.
1 1,
875
(42.
7)
(58.
8)
(32.
3)
(66.
3)
(4.3
) (6
6.3)
(6
.0)
(7.3
) (2
3.0)
(0
.0)
(5.5
) (2
6.6)
40
Se
x
Mal
e
3.1
5,01
1 51
.5
52.4
27
.7
60.1
4.
9 60
.9
18.6
7.
2 21
.1
0.0
6.8
25.2
15
5 Fe
mal
e
2.8
4,65
4 49
.8
51.2
19
.5
55.8
4.
7 55
.8
11.0
10
.7
22.9
0.
8 8.
6 32
.8
128
Resi
denc
e
Urb
an
3.5
973
(57.
8)
(58.
7)
(41.
6)
(69.
6)
(7.7
) (6
9.6)
(1
.7)
(5.6
) (2
6.9)
(0
.0)
(5.7
) (2
4.7)
35
Ru
ral
2.9
8,69
2 49
.8
50.9
21
.5
56.5
4.
4 57
.1
17.0
9.
2 21
.3
0.4
7.9
29.2
24
9
M
othe
r's s
choo
ling
N
o sc
hool
ing
3.
3 2,
318
49.4
59
.0
26.5
62
.8
3.9
62.8
19
.5
5.7
27.2
1.
3 9.
2 29
.6
77
<5
year
s co
mpl
ete
3.
0 1,
197
(44.
4)
(45.
0)
(15.
6)
( 57.
8)
(0.0
) (5
7.8)
(1
2.0)
(1
2.1)
(2
1.2)
(0
.0)
(4.8
) (3
6.5)
36
5-
9 ye
ars
com
plet
e
2.8
4,08
7 43
.0
43.3
19
.4
51.3
7.
4 52
.5
14.4
8.
0 18
.3
0.0
5.4
28.4
11
4 10
-11
year
s co
mpl
ete
2.
2 84
4 *
* *
* *
* *
* *
* *
* 19
12
or m
ore
year
s co
mpl
ete
3.
1 1,
219
(66.
3)
(67.
2)
(42.
9)
(67.
2)
(3.5
) (6
7.2)
(1
1.6)
(1
4.6)
(2
4.2)
(0
.0)
(10.
9)
(23.
1)
38
Con
tinue
d...
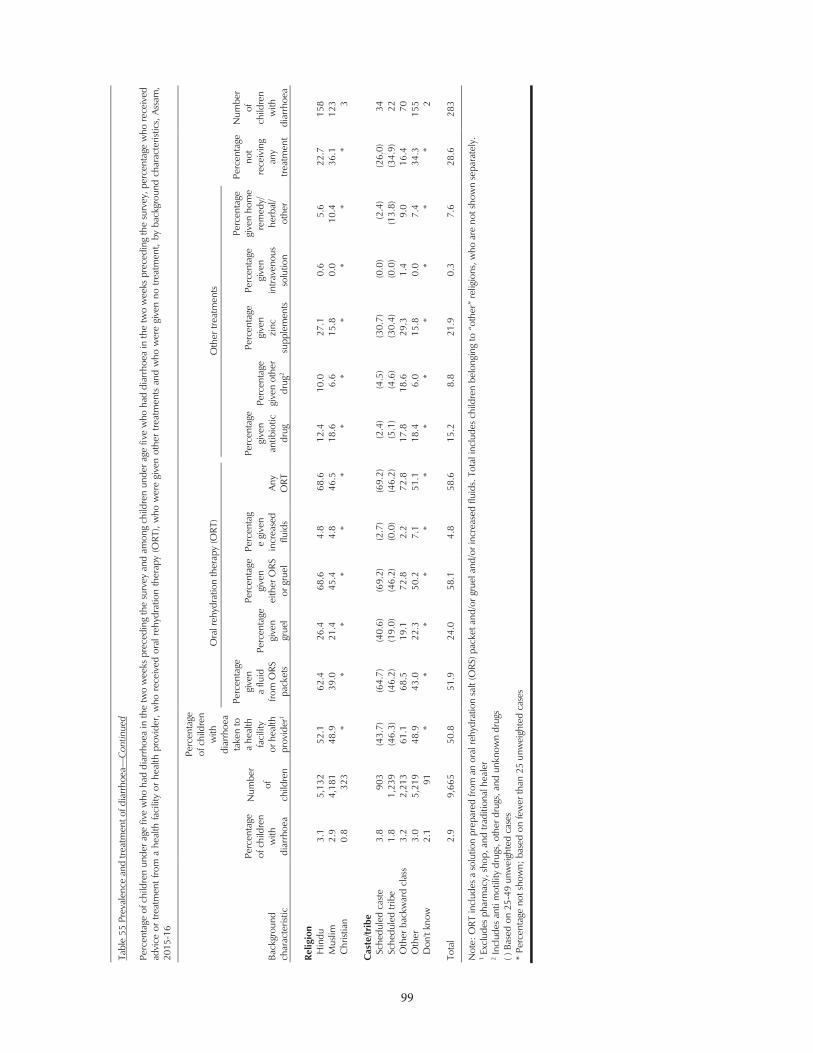
99
99
Tabl
e 55
Pre
vale
nce
and
treat
men
t of d
iarr
hoea—
Con
tinue
d
Perc
enta
ge o
f chi
ldre
n un
der a
ge fi
ve w
ho h
ad d
iarr
hoea
in th
e tw
o w
eeks
pre
cedi
ng th
e su
rvey
and
am
ong
child
ren
unde
r age
five
who
had
dia
rrho
ea in
the
two
wee
ks p
rece
ding
the
surv
ey, p
erce
ntag
e w
ho re
ceiv
ed
advi
ce o
r tre
atm
ent f
rom
a h
ealth
faci
lity
or h
ealth
pro
vide
r, w
ho r
ecei
ved
oral
reh
ydra
tion
ther
apy
(ORT
), w
ho w
ere
give
n ot
her
treat
men
ts a
nd w
ho w
ere
give
n no
trea
tmen
t, by
bac
kgro
und
char
acte
ristic
s, A
ssam
, 20
15-1
6
Back
grou
nd
char
acte
ristic
Perc
enta
ge
of c
hild
ren
with
di
arrh
oea
Num
ber
of
child
ren
Perc
enta
ge
of c
hild
ren
with
di
arrh
oea
take
n to
a
heal
th
faci
lity
or
hea
lth
prov
ider
1
Ora
l reh
ydra
tion
ther
apy
(ORT
)
Oth
er tr
eatm
ents
Perc
enta
ge
not
rece
ivin
g an
y tre
atm
ent
Num
ber
of
child
ren
with
di
arrh
oea
Perc
enta
ge
give
n
a flu
id
from
ORS
pa
cket
s
Perc
ent a
ge
give
n
grue
l
Perc
enta
ge
give
n
eith
er O
RS
or g
ruel
Perc
enta
ge
give
n in
crea
sed
fluid
s An
y
ORT
Perc
enta
ge
give
n an
tibio
tic
drug
Perc
enta
ge
give
n ot
her
drug
2
Perc
enta
ge
give
n
zinc
su
pple
men
ts
Perc
enta
ge
give
n in
trave
nous
so
lutio
n
Perc
enta
ge
give
n ho
me
re
med
y/
herb
al/
othe
r
Re
ligio
n
Hin
du
3.1
5,13
2 52
.1
62.4
26
.4
68.6
4.
8 68
.6
12.4
10
.0
27.1
0.
6 5.
6 22
.7
158
Mus
lim
2.9
4,18
1 48
.9
39.0
21
.4
45.4
4.
8 46
.5
18.6
6.
6 15
.8
0.0
10.4
36
.1
123
Chr
istia
n
0.8
323
* *
* *
* *
* *
* *
* *
3
C
aste
/trib
e
Sche
dule
d ca
ste
3.
8 90
3 (4
3.7)
(6
4.7)
(4
0.6)
(6
9.2)
(2
.7)
(69.
2)
(2.4
) (4
.5)
(30.
7)
(0.0
) (2
.4)
(26.
0)
34
Sche
dule
d tri
be
1.8
1,23
9 (4
6.3)
(4
6.2)
(1
9.0)
(4
6.2)
(0
.0)
(46.
2)
(5.1
) (4
.6)
(30.
4)
(0.0
) (1
3.8)
(3
4.9)
22
O
ther
bac
kwar
d cl
ass
3.
2 2,
213
61.1
68
.5
19.1
72
.8
2.2
72.8
17
.8
18.6
29
.3
1.4
9.0
16.4
70
O
ther
3.
0 5,
219
48.9
43
.0
22.3
50
.2
7.1
51.1
18
.4
6.0
15.8
0.
0 7.
4 34
.3
155
Don
't kn
ow
2.1
91
* *
* *
* *
* *
* *
* *
2
To
tal
2.9
9,66
5 50
.8
51.9
24
.0
58.1
4.
8 58
.6
15.2
8.
8 21
.9
0.3
7.6
28.6
28
3
Not
e: O
RT in
clud
es a
sol
utio
n pr
epar
ed fr
om a
n or
al re
hydr
atio
n sa
lt (O
RS) p
acke
t and
/or g
ruel
and
/or i
ncre
ased
flui
ds. T
otal
incl
udes
chi
ldre
n , w
ho a
re n
ot sh
own
sepa
rate
ly.
1 Exc
lude
s ph
arm
acy,
sho
p, a
nd tr
aditi
onal
hea
ler
2 Inc
lude
s an
ti m
otili
ty d
rugs
, oth
er d
rugs
, and
unk
now
n dr
ugs
( )
Bas
ed o
n 25
-49
unw
eigh
ted
case
s *
Perc
enta
ge n
ot s
how
n; b
ased
on
few
er th
an 2
5 un
wei
ghte
d ca
ses
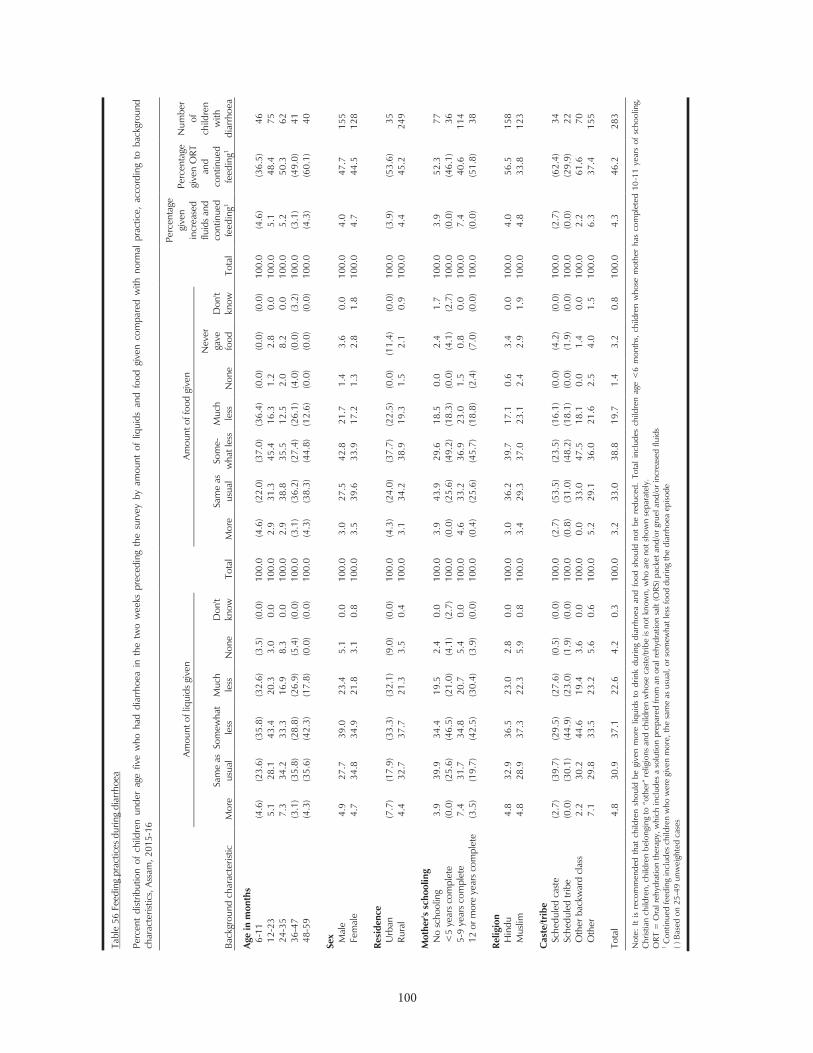
100
100
Tabl
e 56
Fee
ding
pra
ctic
es d
urin
g di
arrh
oea
Perc
ent
dist
ribut
ion
of c
hild
ren
unde
r ag
e fiv
e w
ho h
ad d
iarr
hoea
in
the
two
wee
ks p
rece
ding
the
sur
vey
by a
mou
nt o
f liq
uids
and
foo
d gi
ven
com
pare
d w
ith n
orm
al p
ract
ice,
acc
ordi
ng t
o ba
ckgr
ound
ch
arac
teris
tics,
Ass
am, 2
015-
16
Back
grou
nd c
hara
cter
istic
Amou
nt o
f liq
uids
giv
en
Tota
l
Amou
nt o
f foo
d gi
ven
Tota
l
Perc
enta
ge
give
n in
crea
sed
fluid
s an
d co
ntin
ued
feed
ing1
Perc
enta
ge
give
n O
RT
and
cont
inue
d fe
edin
g1
Num
ber
of
child
ren
with
di
arrh
oea
Mor
e Sa
me
as
usua
l So
mew
hat
less
M
uch
less
N
one
Don
't kn
ow
Mor
e Sa
me
as
usua
l So
me-
wha
t les
s M
uch
less
N
one
Nev
er
gave
fo
od
Don
't kn
ow
Age
in m
onth
s
6-
11
(4.6
) (2
3.6)
(3
5.8)
(3
2.6)
(3
.5)
(0.0
) 10
0.0
(4.6
) (2
2.0)
(3
7.0)
(3
6.4)
(0
.0)
(0.0
) (0
.0)
100.
0 (4
.6)
(36.
5)
46
12-2
3
5.1
28.1
43
.4
20.3
3.
0 0.
0 10
0.0
2.9
31.3
45
.4
16.3
1.
2 2.
8 0.
0 10
0.0
5.1
48.4
75
24
-35
7.
3 34
.2
33.3
16
.9
8.3
0.0
100.
0 2.
9 38
.8
35.5
12
.5
2.0
8.2
0.0
100.
0 5.
2 50
.3
62
36-4
7
(3.1
) (3
5.8)
(2
8.8)
(2
6.9)
(5
.4)
(0.0
) 10
0.0
(3.1
) (3
6.2)
(2
7.4)
(2
6.1)
(4
.0)
(0.0
) (3
.2)
100.
0 (3
.1)
(49.
0)
41
48-5
9
(4.3
) (3
5.6)
(4
2.3)
(1
7.8)
(0
.0)
(0.0
) 10
0.0
(4.3
) (3
8.3)
(4
4.8)
(1
2.6)
(0
.0)
(0.0
) (0
.0)
100.
0 (4
.3)
(60.
1)
40
Sex
Mal
e
4.9
27.7
39
.0
23.4
5.
1 0.
0 10
0.0
3.0
27.5
42
.8
21.7
1.
4 3.
6 0.
0 10
0.0
4.0
47.7
15
5 Fe
mal
e
4.7
34.8
34
.9
21.8
3.
1 0.
8 10
0.0
3.5
39.6
33
.9
17.2
1.
3 2.
8 1.
8 10
0.0
4.7
44.5
12
8
Resi
denc
e
U
rban
(7
.7)
(17.
9)
(33.
3)
(32.
1)
(9.0
) (0
.0)
100.
0 (4
.3)
(24.
0)
(37.
7)
(22.
5)
(0.0
) (1
1.4)
(0
.0)
100.
0 (3
.9)
(53.
6)
35
Rura
l 4.
4 32
.7
37.7
21
.3
3.5
0.4
100.
0 3.
1 34
.2
38.9
19
.3
1.5
2.1
0.9
100.
0 4.
4 45
.2
249
Mot
her's
sch
oolin
g
N
o sc
hool
ing
3.
9 39
.9
34.4
19
.5
2.4
0.0
100.
0 3.
9 43
.9
29.6
18
.5
0.0
2.4
1.7
100.
0 3.
9 52
.3
77
<5
year
s co
mpl
ete
(0
.0)
(25.
6)
(46.
5)
(21.
0)
(4.1
) (2
.7)
100.
0 (0
.0)
(25.
6)
(49.
2)
(18.
3)
(0.0
) (4
.1)
(2.7
) 10
0.0
(0.0
) (4
6.1)
36
5-
9 ye
ars
com
plet
e
7.4
31.7
34
.8
20.7
5.
4 0.
0 10
0.0
4.6
33.2
36
.9
23.0
1.
5 0.
8 0.
0 10
0.0
7.4
40.6
11
4 12
or m
ore
year
s co
mpl
ete
(3
.5)
(19.
7)
(42.
5)
(30.
4)
(3.9
) (0
.0)
100.
0 (0
.4)
(25.
6)
(45.
7)
(18.
8)
(2.4
) (7
.0)
(0.0
) 10
0.0
(0.0
) (5
1.8)
38
Relig
ion
Hin
du
4.8
32.9
36
.5
23.0
2.
8 0.
0 10
0.0
3.0
36.2
39
.7
17.1
0.
6 3.
4 0.
0 10
0.0
4.0
56.5
15
8 M
uslim
4.
8 28
.9
37.3
22
.3
5.9
0.8
100.
0 3.
4 29
.3
37.0
23
.1
2.4
2.9
1.9
100.
0 4.
8 33
.8
123
Cas
te/tr
ibe
Sche
dule
d ca
ste
(2
.7)
(39.
7)
(29.
5)
(27.
6)
(0.5
) (0
.0)
100.
0 (2
.7)
(53.
5)
(23.
5)
(16.
1)
(0.0
) (4
.2)
(0.0
) 10
0.0
(2.7
) (6
2.4)
34
Sc
hedu
led
tribe
(0
.0)
(30.
1)
(44.
9)
(23.
0)
(1.9
) (0
.0)
100.
0 (0
.8)
(31.
0)
(48.
2)
(18.
1)
(0.0
) (1
.9)
(0.0
) 10
0.0
(0.0
) (2
9.9)
22
O
ther
bac
kwar
d cl
ass
2.
2 30
.2
44.6
19
.4
3.6
0.0
100.
0 0.
0 33
.0
47.5
18
.1
0.0
1.4
0.0
100.
0 2.
2 61
.6
70
Oth
er
7.1
29.8
33
.5
23.2
5.
6 0.
6 10
0.0
5.2
29.1
36
.0
21.6
2.
5 4.
0 1.
5 10
0.0
6.3
37.4
15
5
Tota
l 4.
8 30
.9
37.1
22
.6
4.2
0.3
100.
0 3.
2 33
.0
38.8
19
.7
1.4
3.2
0.8
100.
0 4.
3 46
.2
283
Not
e: I
t is
reco
mm
ende
d th
at c
hild
ren
shou
ld b
e gi
ven
mor
e liq
uids
to
drin
k du
ring
diar
rhoe
a an
d fo
od s
houl
d no
t be
red
uced
. To
tal
incl
udes
chi
ldre
n ag
e <
6 m
onth
s, c
hild
ren
who
se m
othe
r ha
s co
mpl
eted
10
-11
year
s of
sch
oolin
g,
Chr
istia
n ch
ildre
n, c
hild
ren
b
ORT
= O
ral r
ehyd
ratio
n th
erap
y, w
hich
incl
udes
a s
olut
ion
prep
ared
from
an
oral
reh
ydra
tion
salt
(ORS
) pac
ket a
nd/o
r gru
el a
nd/o
r inc
reas
ed fl
uids
1 C
ontin
ued
feed
ing
incl
udes
chi
ldre
n w
ho w
ere
give
n m
ore,
the
sam
e as
usu
al, o
r som
ewha
t les
s fo
od d
urin
g th
e di
arrh
oea
episo
de
( ) B
ased
on
25-4
9 un
wei
ghte
d ca
ses
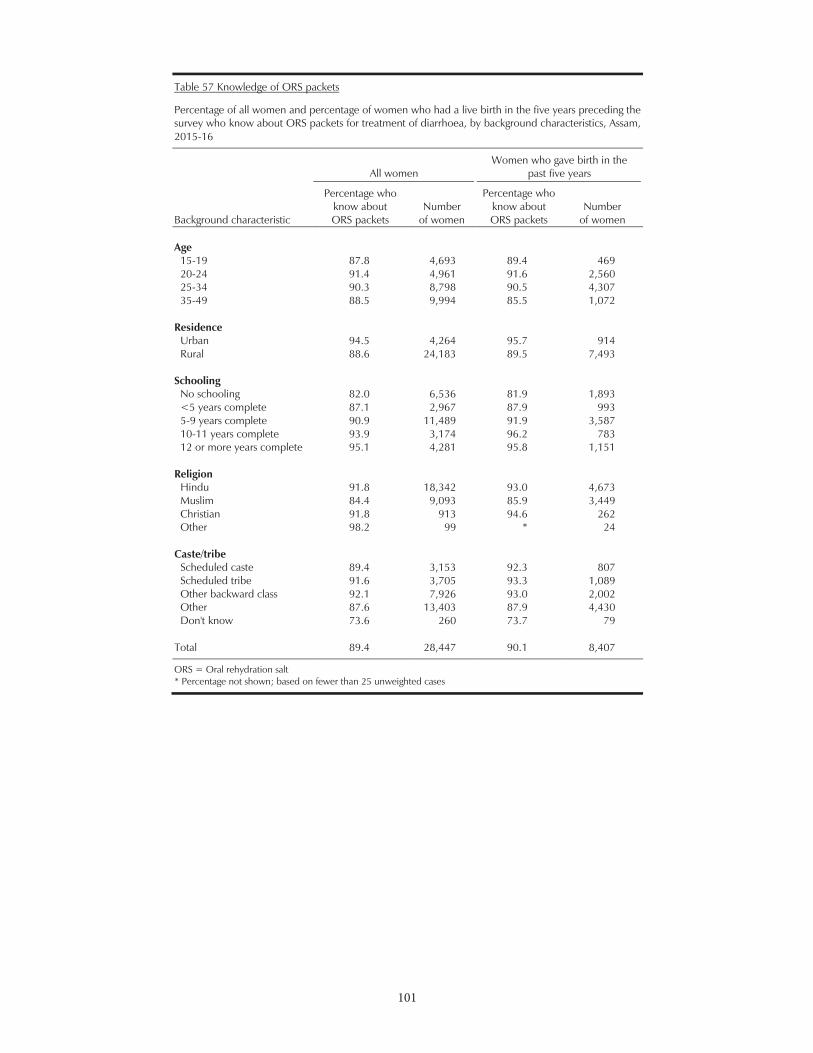
101
101
Table 57 Knowledge of ORS packets
Percentage of all women and percentage of women who had a live birth in the five years preceding the survey who know about ORS packets for treatment of diarrhoea, by background characteristics, Assam, 2015-16
Background characteristic
All women
Women who gave birth in the past five years
Percentage who know about ORS packets
Number of women
Percentage who know about ORS packets
Number of women
Age
15-19 87.8 4,693 89.4 469 20-24 91.4 4,961 91.6 2,560 25-34 90.3 8,798 90.5 4,307 35-49 88.5 9,994 85.5 1,072
Residence Urban 94.5 4,264 95.7 914 Rural 88.6 24,183 89.5 7,493
Schooling No schooling 82.0 6,536 81.9 1,893 <5 years complete 87.1 2,967 87.9 993 5-9 years complete 90.9 11,489 91.9 3,587 10-11 years complete 93.9 3,174 96.2 783 12 or more years complete 95.1 4,281 95.8 1,151
Religion Hindu 91.8 18,342 93.0 4,673 Muslim 84.4 9,093 85.9 3,449 Christian 91.8 913 94.6 262 Other 98.2 99 * 24
Caste/tribe Scheduled caste 89.4 3,153 92.3 807 Scheduled tribe 91.6 3,705 93.3 1,089 Other backward class 92.1 7,926 93.0 2,002 Other 87.6 13,403 87.9 4,430 Don't know 73.6 260 73.7 79
Total 89.4 28,447 90.1 8,407
ORS = Oral rehydration salt * Percentage not shown; based on fewer than 25 unweighted cases

102
102
Tabl
e 58
ICD
S co
vera
ge a
nd u
tiliz
atio
n of
ICD
S se
rvic
es
Perc
enta
ge o
f chi
ldre
n un
der
age
six y
ears
who
rec
eive
d an
y se
rvic
e an
d re
ceiv
ed s
peci
fic s
ervi
ces
from
an
anga
nwad
i cen
tre
(AW
C) i
n th
e 12
mon
ths
prec
edin
g th
e su
rvey
, by
back
grou
nd c
hara
cter
istic
s, A
ssam
, 201
5-16
Back
grou
nd
char
acte
ristic
Perc
enta
ge o
f chi
ldre
n ag
e 0-
71 m
onth
s w
ho re
ceiv
ed fr
om a
n AW
C
Num
ber
of
child
ren
Chi
ldre
n ag
e 36
-71
mon
ths
Chi
ldre
n ag
e 0-
59
mon
ths
Chi
ldre
n ag
e 0-
59 m
onth
s w
ho w
ere
wei
ghed
at a
n AW
C
Any
bene
fits1
Supp
lem
enta
ry
food
2 An
y im
mun
izat
ions
H
ealth
ch
eck-
ups
Perc
enta
ge
who
wen
t fo
r ear
ly
child
hood
ca
re/p
resc
hool
to
an
AWC
Num
ber
of
child
ren
Perc
enta
ge
of c
hild
ren
who
wer
e w
eigh
ed a
t an
AW
C
Num
ber
of
child
ren
Perc
enta
ge
who
se m
othe
rs
rece
ived
co
unse
lling
fro
m a
n AW
C
afte
r chi
ld
was
wei
ghed
Num
ber
of
child
ren
Age
in m
onth
s
<12
51
.9
49.6
28
.4
37.7
1,
848
na
na
28.4
1,
848
57.8
52
4 12
-23
62
.7
61.2
34
.3
48.3
1,
939
na
na
42.8
1,
939
63.6
83
1 24
-35
62
.3
60.3
32
.7
48.6
1,
958
na
na
43.0
1,
958
61.7
84
2 36
-47
57
.1
56.0
29
.2
45.2
2,
045
47.6
2,
045
40.9
2,
045
59.9
83
7 48
-59
52
.8
51.3
27
.4
40.7
1,
875
46.1
1,
875
37.4
1,
875
61.9
70
2 60
-71
45
.6
44.3
24
.2
35.7
1,
939
38.4
1,
939
na
na
na
na
0-35
59
.1
57.1
31
.8
45.0
5,
745
na
na
38.2
5,
745
61.4
2,
197
36-7
1
51.9
50
.6
27.0
40
.6
5,85
9 44
.1
5,85
9 na
na
na
na
Se
x
Mal
e
55.3
53
.7
29.3
42
.5
6,03
3 44
.1
3,06
3 39
.0
5,01
1 62
.0
1,95
3 Fe
mal
e
55.7
54
.0
29.5
43
.2
5,57
1 44
.1
2,79
6 38
.3
4,65
4 60
.3
1,78
3
Re
side
nce
U
rban
35
.2
34.1
16
.9
26.4
1,
210
25.4
67
5 25
.6
973
57.7
24
9 Ru
ral
57.8
56
.2
30.8
44
.7
10,3
94
46.5
5,
184
40.1
8,
692
61.4
3,
487
Mot
her's
sch
oolin
g
No
scho
olin
g
50.7
49
.2
26.0
38
.1
2,86
0 40
.6
1,61
0 33
.5
2,31
8 58
.1
776
<5
year
s co
mpl
ete
55
.6
53.8
29
.8
41.5
1,
489
45.2
82
1 36
.8
1,19
7 60
.0
440
5-9
year
s co
mpl
ete
58
.4
56.4
31
.4
45.6
4,
828
47.6
2,
319
41.1
4,
087
61.6
1,
681
10-1
1 ye
ars
com
plet
e
59.1
58
.2
30.9
46
.0
1,00
6 45
.3
481
44.6
84
4 64
.1
376
12 o
r mor
e ye
ars
com
plet
e
52.6
51
.5
27.9
41
.9
1,42
1 37
.4
627
38.0
1,
219
63.5
46
3
Con
tinue
d...
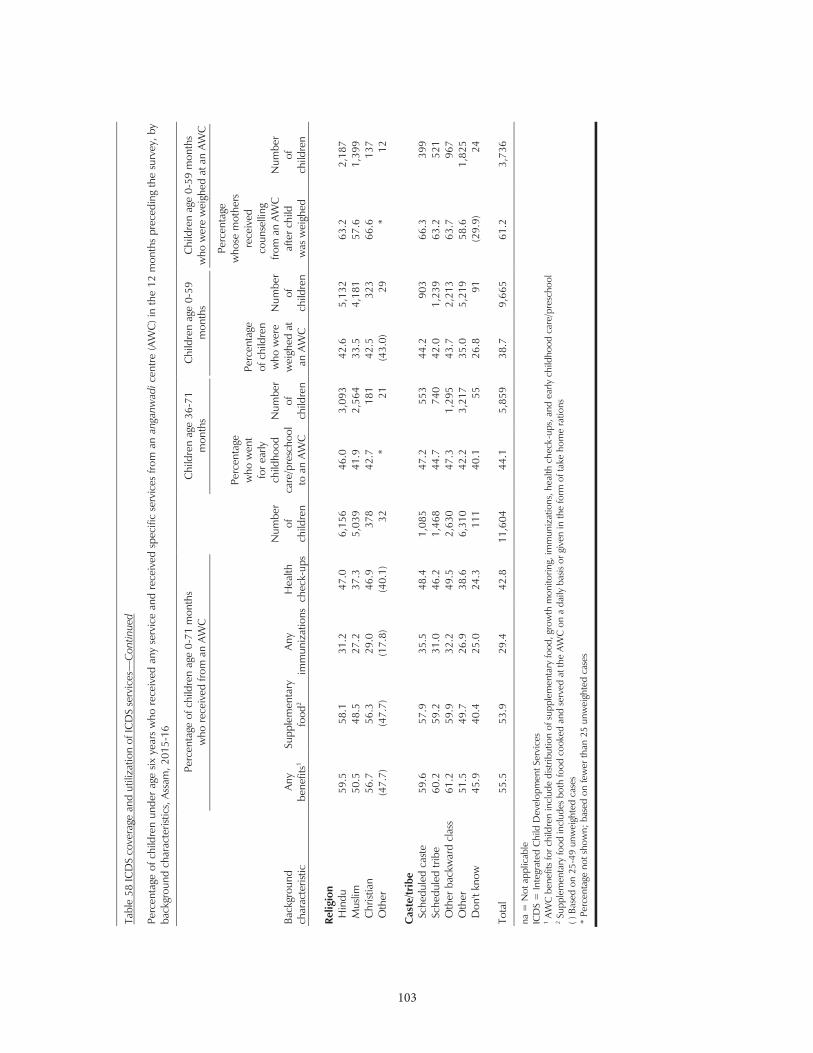
103
103
Ta
ble
58 IC
DS
cove
rage
and
util
izat
ion
of IC
DS
serv
ices—
Con
tinue
d
Perc
enta
ge o
f chi
ldre
n un
der
age
six y
ears
who
rec
eive
d an
y se
rvic
e an
d re
ceiv
ed s
peci
fic s
ervi
ces
from
an
anga
nwad
i cen
tre (A
WC
) in
the
12 m
onth
s pr
eced
ing
the
surv
ey, b
y ba
ckgr
ound
cha
ract
erist
ics,
Ass
am, 2
015-
16
Back
grou
nd
char
acte
ristic
Perc
enta
ge o
f chi
ldre
n ag
e 0-
71 m
onth
s w
ho re
ceiv
ed fr
om a
n AW
C
Num
ber
of
child
ren
Chi
ldre
n ag
e 36
-71
mon
ths
Chi
ldre
n ag
e 0-
59
mon
ths
Chi
ldre
n ag
e 0-
59 m
onth
s w
ho w
ere
wei
ghed
at a
n AW
C
Any
bene
fits1
Supp
lem
enta
ry
food
2 An
y im
mun
izat
ions
H
ealth
ch
eck-
ups
Perc
enta
ge
who
wen
t fo
r ear
ly
child
hood
ca
re/p
resc
hool
to
an
AWC
Num
ber
of
child
ren
Perc
enta
ge
of c
hild
ren
who
wer
e w
eigh
ed a
t an
AW
C
Num
ber
of
child
ren
Perc
enta
ge
who
se m
othe
rs
rece
ived
co
unse
lling
fro
m a
n AW
C
afte
r chi
ld
was
wei
ghed
Num
ber
of
child
ren
Relig
ion
H
indu
59
.5
58.1
31
.2
47.0
6,
156
46.0
3,
093
42.6
5,
132
63.2
2,
187
Mus
lim
50.5
48
.5
27.2
37
.3
5,03
9 41
.9
2,56
4 33
.5
4,18
1 57
.6
1,39
9 C
hrist
ian
56
.7
56.3
29
.0
46.9
37
8 42
.7
181
42.5
32
3 66
.6
137
Oth
er
(47.
7)
(47.
7)
(17.
8)
(40.
1)
32
* 21
(4
3.0)
29
*
12
Cas
te/tr
ibe
Sc
hedu
led
cast
e
59.6
57
.9
35.5
48
.4
1,08
5 47
.2
553
44.2
90
3 66
.3
399
Sche
dule
d tri
be
60.2
59
.2
31.0
46
.2
1,46
8 44
.7
740
42.0
1,
239
63.2
52
1 O
ther
bac
kwar
d cl
ass
61
.2
59.9
32
.2
49.5
2,
630
47.3
1,
295
43.7
2,
213
63.7
96
7 O
ther
51
.5
49.7
26
.9
38.6
6,
310
42.2
3,
217
35.0
5,
219
58.6
1,
825
Don
't kn
ow
45.9
40
.4
25.0
24
.3
111
40.1
55
26
.8
91
(29.
9)
24
Tota
l 55
.5
53.9
29
.4
42.8
11
,604
44
.1
5,85
9 38
.7
9,66
5 61
.2
3,73
6 na
= N
ot a
pplic
able
IC
DS
= In
tegr
ated
Chi
ld D
evel
opm
ent S
ervi
ces
1 AW
C b
enef
its fo
r chi
ldre
n in
clud
e di
strib
utio
n of
sup
plem
enta
ry fo
od, g
row
th m
onito
ring,
imm
uniz
atio
ns, h
ealth
che
ck-u
ps, a
nd e
arly
chi
ldho
od c
are/
pres
choo
l 2 S
uppl
emen
tary
food
incl
udes
bot
h fo
od c
ooke
d an
d se
rved
at t
he A
WC
on
a da
ily b
asis
or g
iven
in th
e fo
rm o
f tak
e ho
me
ratio
ns
( ) B
ased
on
25-4
9 un
wei
ghte
d ca
ses
* Pe
rcen
tage
not
sho
wn;
bas
ed o
n fe
wer
than
25
unw
eigh
ted
case
s
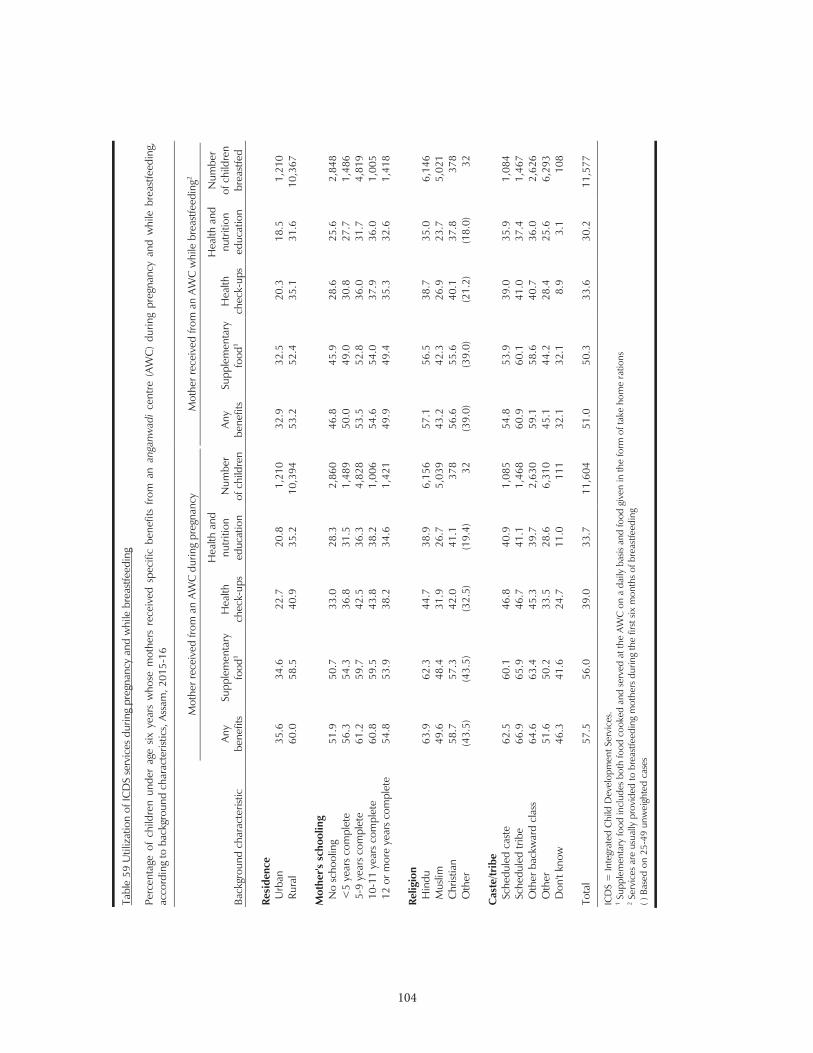
104
104
Tabl
e 59
Util
izat
ion
of IC
DS
serv
ices
dur
ing
preg
nanc
y an
d w
hile
bre
astfe
edin
g
Perc
enta
ge o
f ch
ildre
n un
der
age
six y
ears
who
se m
othe
rs r
ecei
ved
spec
ific
bene
fits
from
an
anga
nwad
i ce
ntre
(AW
C)
durin
g pr
egna
ncy
and
whi
le b
reas
tfeed
ing,
ac
cord
ing
to b
ackg
roun
d ch
arac
teris
tics,
Ass
am, 2
015-
16
Back
grou
nd c
hara
cter
istic
Mot
her r
ecei
ved
from
an
AWC
dur
ing
preg
nanc
y
Mot
her r
ecei
ved
from
an
AWC
whi
le b
reas
tfeed
ing2
Any
bene
fits
Supp
lem
enta
ry
food
1 H
ealth
ch
eck-
ups
Hea
lth a
nd
nutr
ition
ed
ucat
ion
Num
ber
of c
hild
ren
Any
bene
fits
Supp
lem
enta
ry
food
1 H
ealth
ch
eck-
ups
Hea
lth a
nd
nutr
ition
ed
ucat
ion
Num
ber
of c
hild
ren
brea
stfe
d
Resi
denc
e
U
rban
35
.6
34.6
22
.7
20.8
1,
210
32.9
32
.5
20.3
18
.5
1,21
0 Ru
ral
60.0
58
.5
40.9
35
.2
10,3
94
53.2
52
.4
35.1
31
.6
10,3
67
M
othe
r's s
choo
ling
N
o sc
hool
ing
51
.9
50.7
33
.0
28.3
2,
860
46.8
45
.9
28.6
25
.6
2,84
8 <
5 ye
ars
com
plet
e
56.3
54
.3
36.8
31
.5
1,48
9 50
.0
49.0
30
.8
27.7
1,
486
5-9
year
s co
mpl
ete
61
.2
59.7
42
.5
36.3
4,
828
53.5
52
.8
36.0
31
.7
4,81
9 10
-11
year
s co
mpl
ete
60
.8
59.5
43
.8
38.2
1,
006
54.6
54
.0
37.9
36
.0
1,00
5 12
or m
ore
year
s co
mpl
ete
54
.8
53.9
38
.2
34.6
1,
421
49.9
49
.4
35.3
32
.6
1,41
8
Relig
ion
H
indu
63
.9
62.3
44
.7
38.9
6,
156
57.1
56
.5
38.7
35
.0
6,14
6 M
uslim
49
.6
48.4
31
.9
26.7
5,
039
43.2
42
.3
26.9
23
.7
5,02
1 C
hrist
ian
58
.7
57.3
42
.0
41.1
37
8 56
.6
55.6
40
.1
37.8
37
8 O
ther
(4
3.5)
(4
3.5)
(3
2.5)
(1
9.4)
32
(3
9.0)
(3
9.0)
(2
1.2)
(1
8.0)
32
Cas
te/tr
ibe
Sc
hedu
led
cast
e
62.5
60
.1
46.8
40
.9
1,08
5 54
.8
53.9
39
.0
35.9
1,
084
Sche
dule
d tri
be
66.9
65
.9
46.7
41
.1
1,46
8 60
.9
60.1
41
.0
37.4
1,
467
Oth
er b
ackw
ard
clas
s
64.6
63
.4
45.3
39
.7
2,63
0 59
.1
58.6
40
.7
36.0
2,
626
Oth
er
51.6
50
.2
33.5
28
.6
6,31
0 45
.1
44.2
28
.4
25.6
6,
293
Don
't kn
ow
46.3
41
.6
24.7
11
.0
111
32.1
32
.1
8.9
3.1
108
To
tal
57.5
56
.0
39.0
33
.7
11,6
04
51.0
50
.3
33.6
30
.2
11,5
77
ICD
S =
Inte
grat
ed C
hild
Dev
elop
men
t Ser
vice
s.
1 Sup
plem
enta
ry fo
od in
clud
es b
oth
food
coo
ked
and
serv
ed a
t the
AW
C o
n a
daily
bas
is an
d fo
od g
iven
in th
e fo
rm o
f tak
e ho
me
ratio
ns
2 Ser
vice
s ar
e us
ually
pro
vide
d to
bre
astfe
edin
g m
othe
rs d
urin
g th
e fir
st s
ix m
onth
s of
bre
astfe
edin
g
( ) B
ased
on
25-4
9 un
wei
ghte
d ca
ses
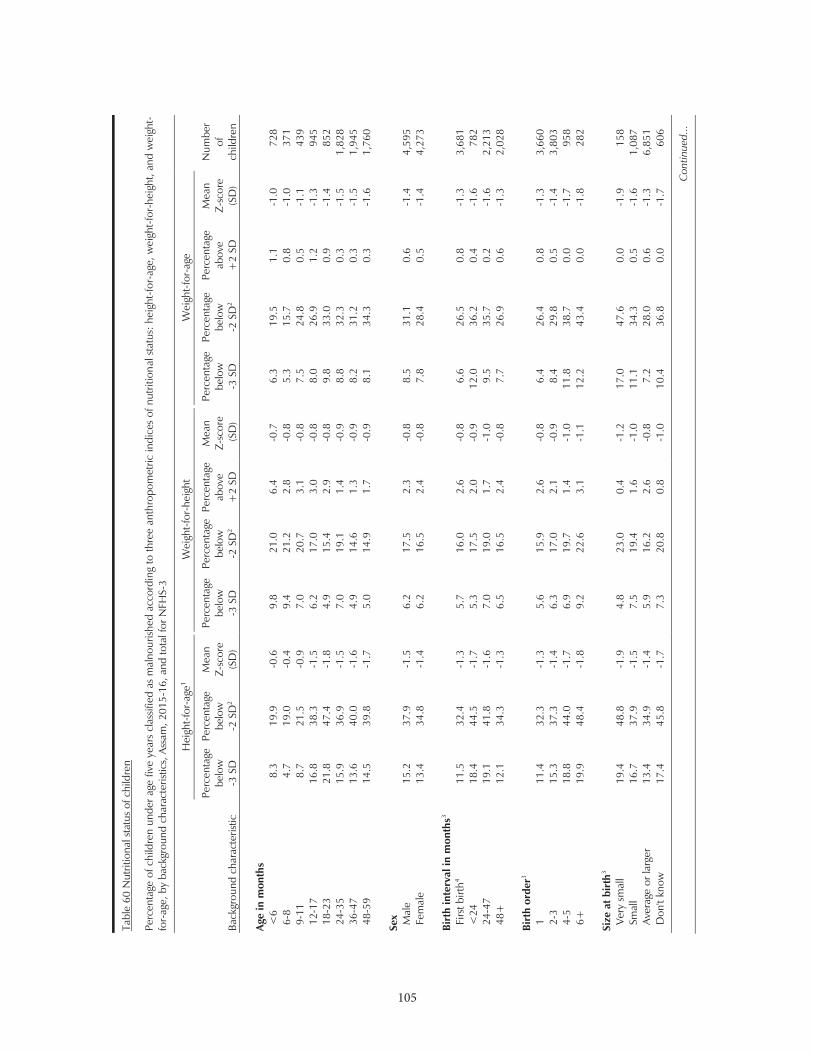
105
5
Tabl
e 60
Nut
ritio
nal s
tatu
s of
chi
ldre
n
Perc
enta
ge o
f chi
ldre
n un
der
age
five
year
s cl
assif
ied
as m
alno
urish
ed a
ccor
ding
to th
ree
anth
ropo
met
ric in
dice
s of
nut
ritio
nal s
tatu
s: h
eigh
t-fo
r-ag
e, w
eigh
t-fo
r-he
ight
, and
wei
ght-
for-
age,
by
back
grou
nd c
hara
cter
istic
s, A
ssam
, 201
5-16
, and
tota
l for
NFH
S-3
Back
grou
nd c
hara
cter
istic
Hei
ght-
for-
age1
Wei
ght-
for-
heig
ht
Wei
ght-
for-
age
Num
ber
of
child
ren
Perc
enta
ge
belo
w
-3 S
D
Perc
enta
ge
belo
w
-2 S
D2
Mea
n
Z-sc
ore
(S
D)
Perc
enta
ge
belo
w
-3 S
D
Perc
enta
ge
belo
w
-2 S
D2
Perc
enta
ge
abov
e
+2
SD
Mea
n
Z-sc
ore
(SD
)
Perc
enta
ge
belo
w
-3 S
D
Perc
enta
ge
belo
w
-2 S
D2
Perc
enta
ge
abov
e
+2
SD
Mea
n
Z-sc
ore
(S
D)
Ag
e in
mon
ths
<6
8.
3 19
.9
-0.6
9.
8 21
.0
6.4
-0.7
6.
3 19
.5
1.1
-1.0
72
8 6-
8
4.7
19.0
-0
.4
9.4
21.2
2.
8 -0
.8
5.3
15.7
0.
8 -1
.0
371
9-11
8.
7 21
.5
-0.9
7.
0 20
.7
3.1
-0.8
7.
5 24
.8
0.5
-1.1
43
9 12
-17
16
.8
38.3
-1
.5
6.2
17.0
3.
0 -0
.8
8.0
26.9
1.
2 -1
.3
945
18-2
3
21.8
47
.4
-1.8
4.
9 15
.4
2.9
-0.8
9.
8 33
.0
0.9
-1.4
85
2 24
-35
15
.9
36.9
-1
.5
7.0
19.1
1.
4 -0
.9
8.8
32.3
0.
3 -1
.5
1,82
8 36
-47
13
.6
40.0
-1
.6
4.9
14.6
1.
3 -0
.9
8.2
31.2
0.
3 -1
.5
1,94
5 48
-59
14
.5
39.8
-1
.7
5.0
14.9
1.
7 -0
.9
8.1
34.3
0.
3 -1
.6
1,76
0
Sex
Mal
e
15.2
37
.9
-1.5
6.
2 17
.5
2.3
-0.8
8.
5 31
.1
0.6
-1.4
4,
595
Fem
ale
13
.4
34.8
-1
.4
6.2
16.5
2.
4 -0
.8
7.8
28.4
0.
5 -1
.4
4,27
3
Birt
h in
terv
al in
mon
ths3
Firs
t birt
h4 11
.5
32.4
-1
.3
5.7
16.0
2.
6 -0
.8
6.6
26.5
0.
8 -1
.3
3,68
1 <
24
18.4
44
.5
-1.7
5.
3 17
.5
2.0
-0.9
12
.0
36.2
0.
4 -1
.6
782
24-4
7
19.1
41
.8
-1.6
7.
0 19
.0
1.7
-1.0
9.
5 35
.7
0.2
-1.6
2,
213
48+
12
.1
34.3
-1
.3
6.5
16.5
2.
4 -0
.8
7.7
26.9
0.
6 -1
.3
2,02
8
Birt
h or
der3
1
11.4
32
.3
-1.3
5.
6 15
.9
2.6
-0.8
6.
4 26
.4
0.8
-1.3
3,
660
2-3
15
.3
37.3
-1
.4
6.3
17.0
2.
1 -0
.9
8.4
29.8
0.
5 -1
.4
3,80
3 4-
5
18.8
44
.0
-1.7
6.
9 19
.7
1.4
-1.0
11
.8
38.7
0.
0 -1
.7
958
6+
19.9
48
.4
-1.8
9.
2 22
.6
3.1
-1.1
12
.2
43.4
0.
0 -1
.8
282
Si
ze a
t bir
th3
Very
sm
all
19.4
48
.8
-1.9
4.
8 23
.0
0.4
-1.2
17
.0
47.6
0.
0 -1
.9
158
Smal
l 16
.7
37.9
-1
.5
7.5
19.4
1.
6 -1
.0
11.1
34
.3
0.5
-1.6
1,
087
Aver
age
or la
rger
13
.4
34.9
-1
.4
5.9
16.2
2.
6 -0
.8
7.2
28.0
0.
6 -1
.3
6,85
1 D
on't
know
17
.4
45.8
-1
.7
7.3
20.8
0.
8 -1
.0
10.4
36
.8
0.0
-1.7
60
6
Con
tinue
d...
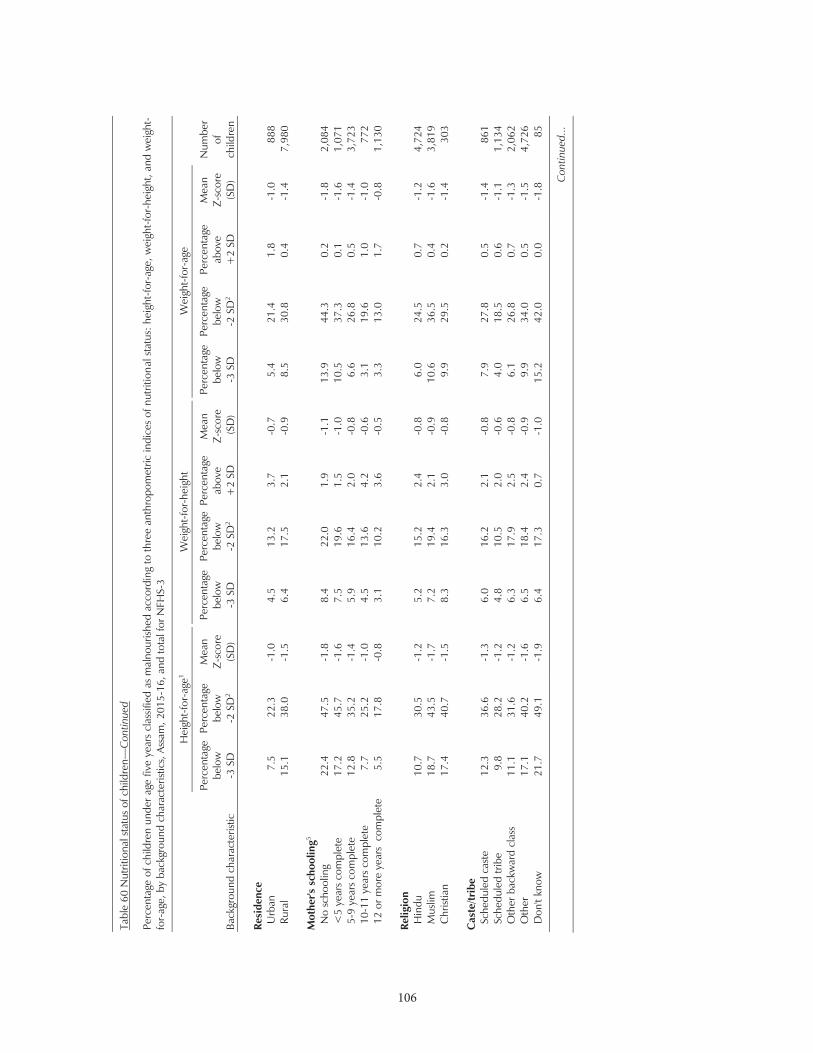
106
Tabl
e 60
Nut
ritio
nal s
tatu
s of
chi
ldre
n—C
ontin
ued
Perc
enta
ge o
f chi
ldre
n un
der
age
five
year
s cl
assif
ied
as m
alno
urish
ed a
ccor
ding
to th
ree
anth
ropo
met
ric in
dice
s of
nut
ritio
nal s
tatu
s: h
eigh
t-fo
r-ag
e, w
eigh
t-fo
r-he
ight
, and
wei
ght-
for-
age,
by
back
grou
nd c
hara
cter
istic
s, A
ssam
, 201
5-16
, and
tota
l for
NFH
S-3
Back
grou
nd c
hara
cter
istic
Hei
ght-
for-
age1
Wei
ght-
for-
heig
ht
Wei
ght-
for-
age
Num
ber
of
child
ren
Perc
enta
ge
belo
w
-3 S
D
Perc
enta
ge
belo
w
-2 S
D2
Mea
n
Z-sc
ore
(S
D)
Perc
enta
ge
belo
w
-3 S
D
Perc
enta
ge
belo
w
-2 S
D2
Perc
enta
ge
abov
e
+2
SD
Mea
n
Z-sc
ore
(SD
)
Perc
enta
ge
belo
w
-3 S
D
Perc
enta
ge
belo
w
-2 S
D2
Perc
enta
ge
abov
e
+2
SD
Mea
n
Z-sc
ore
(S
D)
Re
side
nce
Urb
an
7.5
22.3
-1
.0
4.5
13.2
3.
7 -0
.7
5.4
21.4
1.
8 -1
.0
888
Rura
l 15
.1
38.0
-1
.5
6.4
17.5
2.
1 -0
.9
8.5
30.8
0.
4 -1
.4
7,98
0
Mot
her's
sch
oolin
g5
N
o sc
hool
ing
22
.4
47.5
-1
.8
8.4
22.0
1.
9 -1
.1
13.9
44
.3
0.2
-1.8
2,
084
<5
year
s co
mpl
ete
17
.2
45.7
-1
.6
7.5
19.6
1.
5 -1
.0
10.5
37
.3
0.1
-1.6
1,
071
5-9
year
s co
mpl
ete
12
.8
35.2
-1
.4
5.9
16.4
2.
0 -0
.8
6.6
26.8
0.
5 -1
.4
3,72
3 10
-11
year
s co
mpl
ete
7.
7 25
.2
-1.0
4.
5 13
.6
4.2
-0.6
3.
1 19
.6
1.0
-1.0
77
2 12
or m
ore
year
s c
ompl
ete
5.
5 17
.8
-0.8
3.
1 10
.2
3.6
-0.5
3.
3 13
.0
1.7
-0.8
1,
130
Re
ligio
n
H
indu
10
.7
30.5
-1
.2
5.2
15.2
2.
4 -0
.8
6.0
24.5
0.
7 -1
.2
4,72
4 M
uslim
18
.7
43.5
-1
.7
7.2
19.4
2.
1 -0
.9
10.6
36
.5
0.4
-1.6
3,
819
Chr
istia
n
17.4
40
.7
-1.5
8.
3 16
.3
3.0
-0.8
9.
9 29
.5
0.2
-1.4
30
3
Cas
te/tr
ibe
Sche
dule
d ca
ste
12
.3
36.6
-1
.3
6.0
16.2
2.
1 -0
.8
7.9
27.8
0.
5 -1
.4
861
Sche
dule
d tri
be
9.8
28.2
-1
.2
4.8
10.5
2.
0 -0
.6
4.0
18.5
0.
6 -1
.1
1,13
4 O
ther
bac
kwar
d cl
ass
11
.1
31.6
-1
.2
6.3
17.9
2.
5 -0
.8
6.1
26.8
0.
7 -1
.3
2,06
2 O
ther
17
.1
40.2
-1
.6
6.5
18.4
2.
4 -0
.9
9.9
34.0
0.
5 -1
.5
4,72
6 D
on't
know
21
.7
49.1
-1
.9
6.4
17.3
0.
7 -1
.0
15.2
42
.0
0.0
-1.8
85
Con
tinue
d...
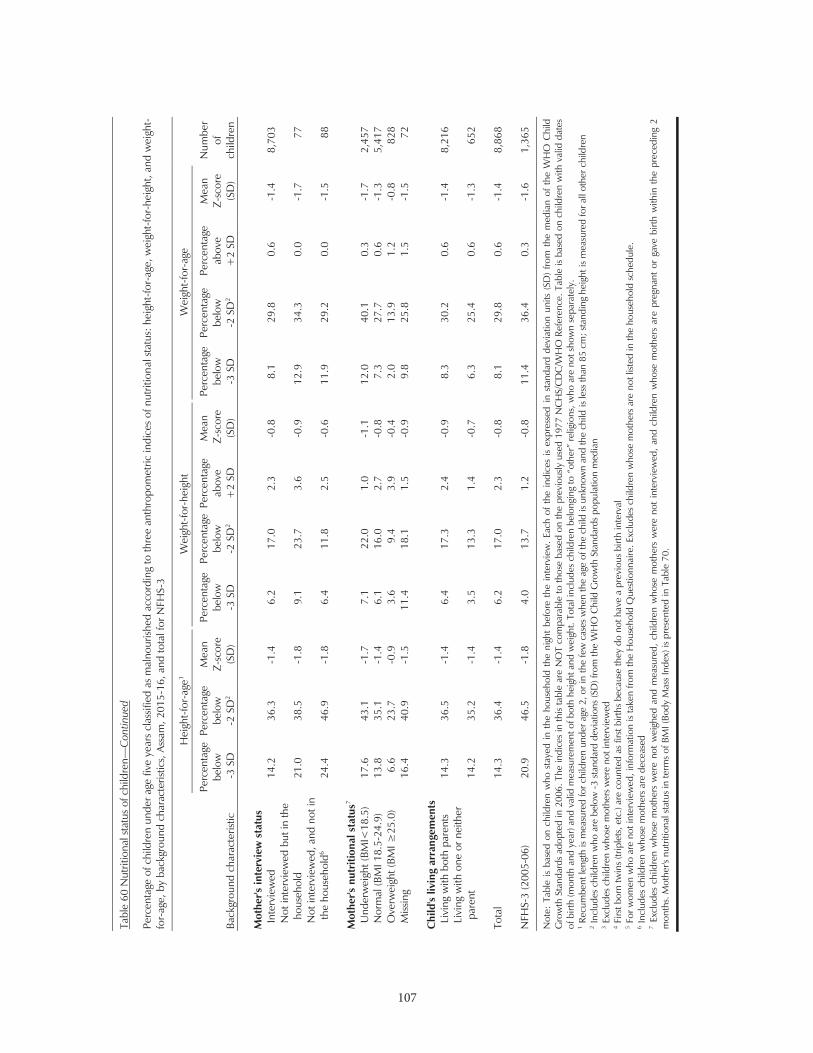
107
Tabl
e 60
Nut
ritio
nal s
tatu
s of
chi
ldre
n—C
ontin
ued
Perc
enta
ge o
f chi
ldre
n un
der a
ge fi
ve y
ears
cla
ssifi
ed a
s m
alno
urish
ed a
ccor
ding
to th
ree
anth
ropo
met
ric in
dice
s of
nut
ritio
nal s
tatu
s: h
eigh
t-fo
r-ag
e, w
eigh
t-fo
r-he
ight
, and
wei
ght-
for-
age,
by
back
grou
nd c
hara
cter
istic
s, A
ssam
, 201
5-16
, and
tota
l for
NFH
S-3
Back
grou
nd c
hara
cter
istic
Hei
ght-
for-
age1
Wei
ght-
for-
heig
ht
Wei
ght-
for-
age
Num
ber
of
child
ren
Perc
enta
ge
belo
w
-3 S
D
Perc
enta
ge
belo
w
-2 S
D2
Mea
n
Z-sc
ore
(SD
)
Perc
enta
ge
belo
w
-3 S
D
Perc
enta
ge
belo
w
-2 S
D2
Perc
enta
ge
abov
e
+2
SD
Mea
n Z
-sco
re
(SD
)
Perc
enta
ge
belo
w
-3 S
D
Perc
enta
ge
belo
w
-2 S
D2
Perc
enta
ge
abov
e
+2
SD
Mea
n
Z-sc
ore
(SD
)
Mot
her's
inte
rvie
w s
tatu
s In
terv
iew
ed
14.2
36
.3
-1.4
6.
2 17
.0
2.3
-0.8
8.
1 29
.8
0.6
-1.4
8,
703
Not
inte
rvie
wed
but
in th
e ho
useh
old
21
.0
38.5
-1
.8
9.1
23.7
3.
6 -0
.9
12.9
34
.3
0.0
-1.7
77
N
ot in
terv
iew
ed, a
nd n
ot in
th
e ho
useh
old6
24.4
46
.9
-1.8
6.
4 11
.8
2.5
-0.6
11
.9
29.2
0.
0 -1
.5
88
M
othe
r's n
utri
tiona
l sta
tus7
Und
erw
eigh
t (BM
I<18
.5)
17.6
43
.1
-1.7
7.
1 22
.0
1.0
-1.1
12
.0
40.1
0.
3 -1
.7
2,45
7 N
orm
al (B
MI 1
8.5-
24.9
) 13
.8
35.1
-1
.4
6.1
16.0
2.
7 -0
.8
7.3
27.7
0.
6 -1
.3
5,41
7 25
.0)
6.6
23.7
-0
.9
3.6
9.4
3.9
-0.4
2.
0 13
.9
1.2
-0.8
82
8 M
issin
g
16.4
40
.9
-1.5
11
.4
18.1
1.
5 -0
.9
9.8
25.8
1.
5 -1
.5
72
C
hild
's liv
ing
arra
ngem
ents
Li
ving
with
bot
h pa
rent
s
14.3
36
.5
-1.4
6.
4 17
.3
2.4
-0.9
8.
3 30
.2
0.6
-1.4
8,
216
Livi
ng w
ith o
ne o
r nei
ther
pa
rent
14
.2
35.2
-1
.4
3.5
13.3
1.
4 -0
.7
6.3
25.4
0.
6 -1
.3
652
To
tal
14.3
36
.4
-1.4
6.
2 17
.0
2.3
-0.8
8.
1 29
.8
0.6
-1.4
8,
868
N
FHS-
3 (2
005-
06)
20.9
46
.5
-1.8
4.
0 13
.7
1.2
-0.8
11
.4
36.4
0.
3 -1
.6
1,36
5
Not
e: T
able
is b
ased
on
child
ren
who
sta
yed
in t
he h
ouse
hold
the
nig
ht b
efor
e th
e in
terv
iew
. Ea
ch o
f th
e in
dice
s is
expr
esse
d in
sta
ndar
d de
viat
ion
units
(SD
) fro
m t
he m
edia
n of
the
WH
O C
hild
G
row
th S
tand
ards
ado
pted
in 2
006.
The
indi
ces
in th
is ta
ble
are
NO
T co
mpa
rabl
e to
thos
e ba
sed
on th
e pr
evio
usly
use
d 19
77 N
CH
S/C
DC
/WH
O R
efer
ence
. Tab
le is
bas
ed o
n ch
ildre
n w
ith v
alid
dat
es
of b
irth
(mon
th a
nd y
ear)
and
valid
mea
sure
men
t of b
oth
heig
ht a
nd w
eigh
t. w
ho a
re n
ot s
how
n se
para
tely
. 1 R
ecum
bent
leng
th is
mea
sure
d fo
r chi
ldre
n un
der a
ge 2
, or i
n th
e fe
w c
ases
whe
n th
e ag
e of
the
child
is u
nkno
wn
and
the
child
is le
ss th
an 8
5 cm
; sta
ndin
g he
ight
is m
easu
red
for a
ll ot
her c
hild
ren
2 Inc
lude
s ch
ildre
n w
ho a
re b
elow
-3 s
tand
ard
devi
atio
ns (S
D) f
rom
the
WH
O C
hild
Gro
wth
Sta
ndar
ds p
opul
atio
n m
edia
n 3 E
xclu
des
child
ren
who
se m
othe
rs w
ere
not i
nter
view
ed
4 Firs
t bor
n tw
ins
(trip
lets
, etc
.) ar
e co
unte
d as
firs
t birt
hs b
ecau
se th
ey d
o no
t hav
e a
prev
ious
birt
h in
terv
al
5 For
wom
en w
ho a
re n
ot in
terv
iew
ed, i
nfor
mat
ion
is ta
ken
from
the
Hou
seho
ld Q
uest
ionn
aire
. Exc
lude
s ch
ildre
n w
hose
mot
hers
are
not
list
ed in
the
hous
ehol
d sc
hedu
le.
6 Inc
lude
s ch
ildre
n w
hose
mot
hers
are
dec
ease
d 7
Excl
udes
chi
ldre
n w
hose
mot
hers
wer
e no
t w
eigh
ed a
nd m
easu
red,
chi
ldre
n w
hose
mot
hers
wer
e no
t in
terv
iew
ed,
and
child
ren
who
se m
othe
rs a
re p
regn
ant
or g
ave
birth
with
in t
he p
rece
ding
2
mon
ths.
Mot
her's
nut
ritio
nal s
tatu
s in
term
s of
BM
I (Bo
dy M
ass
Inde
x) is
pre
sent
ed in
Tab
le 7
0.
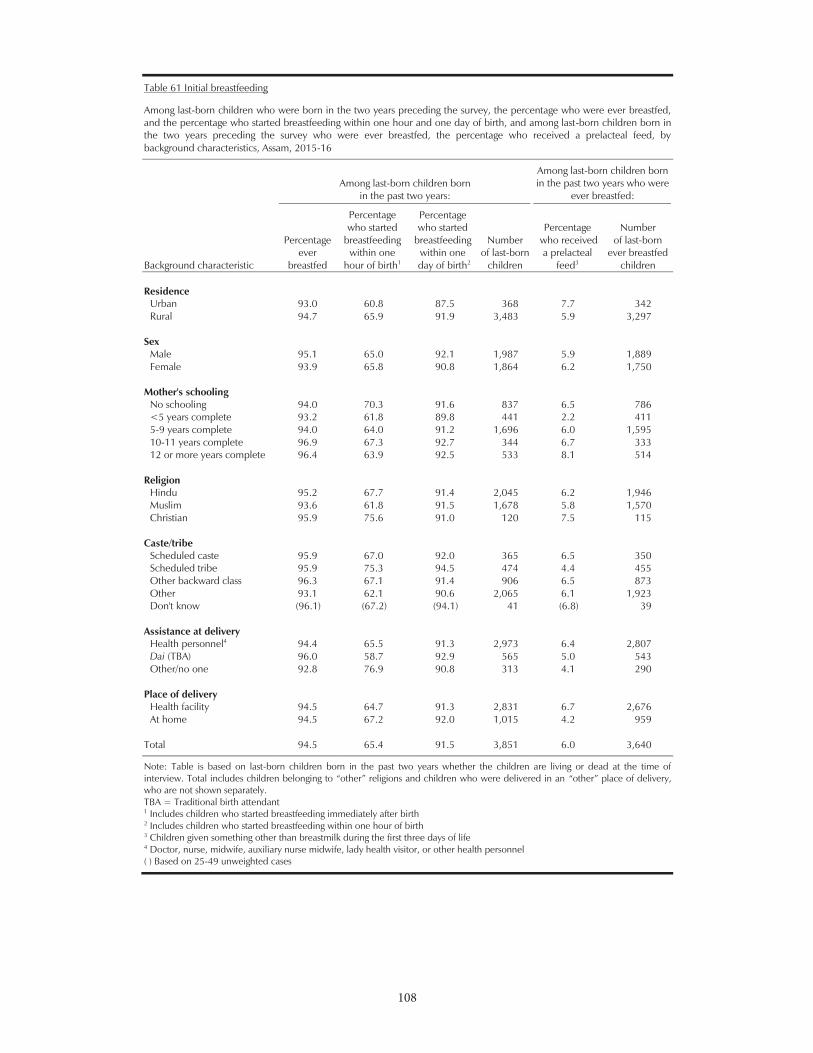
108
108
Table 61 Initial breastfeeding
Among last-born children who were born in the two years preceding the survey, the percentage who were ever breastfed, and the percentage who started breastfeeding within one hour and one day of birth, and among last-born children born in the two years preceding the survey who were ever breastfed, the percentage who received a prelacteal feed, by background characteristics, Assam, 2015-16
Background characteristic
Among last-born children born in the past two years:
Among last-born children born in the past two years who were
ever breastfed:
Percentage ever
breastfed
Percentage who started
breastfeeding within one
hour of birth1
Percentage who started
breastfeeding within one
day of birth2
Number of last-born
children
Percentage who received
a prelacteal feed3
Number of last-born
ever breastfed children
Residence
Urban 93.0 60.8 87.5 368 7.7 342 Rural 94.7 65.9 91.9 3,483 5.9 3,297
Sex Male 95.1 65.0 92.1 1,987 5.9 1,889 Female 93.9 65.8 90.8 1,864 6.2 1,750
Mother's schooling No schooling 94.0 70.3 91.6 837 6.5 786 <5 years complete 93.2 61.8 89.8 441 2.2 411 5-9 years complete 94.0 64.0 91.2 1,696 6.0 1,595 10-11 years complete 96.9 67.3 92.7 344 6.7 333 12 or more years complete 96.4 63.9 92.5 533 8.1 514
Religion Hindu 95.2 67.7 91.4 2,045 6.2 1,946 Muslim 93.6 61.8 91.5 1,678 5.8 1,570 Christian 95.9 75.6 91.0 120 7.5 115
Caste/tribe Scheduled caste 95.9 67.0 92.0 365 6.5 350 Scheduled tribe 95.9 75.3 94.5 474 4.4 455 Other backward class 96.3 67.1 91.4 906 6.5 873 Other 93.1 62.1 90.6 2,065 6.1 1,923 Don't know (96.1) (67.2) (94.1) 41 (6.8) 39
Assistance at delivery Health personnel4 94.4 65.5 91.3 2,973 6.4 2,807 Dai (TBA) 96.0 58.7 92.9 565 5.0 543 Other/no one 92.8 76.9 90.8 313 4.1 290
Place of delivery Health facility 94.5 64.7 91.3 2,831 6.7 2,676 At home 94.5 67.2 92.0 1,015 4.2 959
Total 94.5 65.4 91.5 3,851 6.0 3,640
Note: Table is based on last-born children born in the past two years whether the children are living or dead at the time of interview. who are not shown separately. TBA = Traditional birth attendant 1 Includes children who started breastfeeding immediately after birth 2 Includes children who started breastfeeding within one hour of birth 3 Children given something other than breastmilk during the first three days of life 4 Doctor, nurse, midwife, auxiliary nurse midwife, lady health visitor, or other health personnel ( ) Based on 25-49 unweighted cases
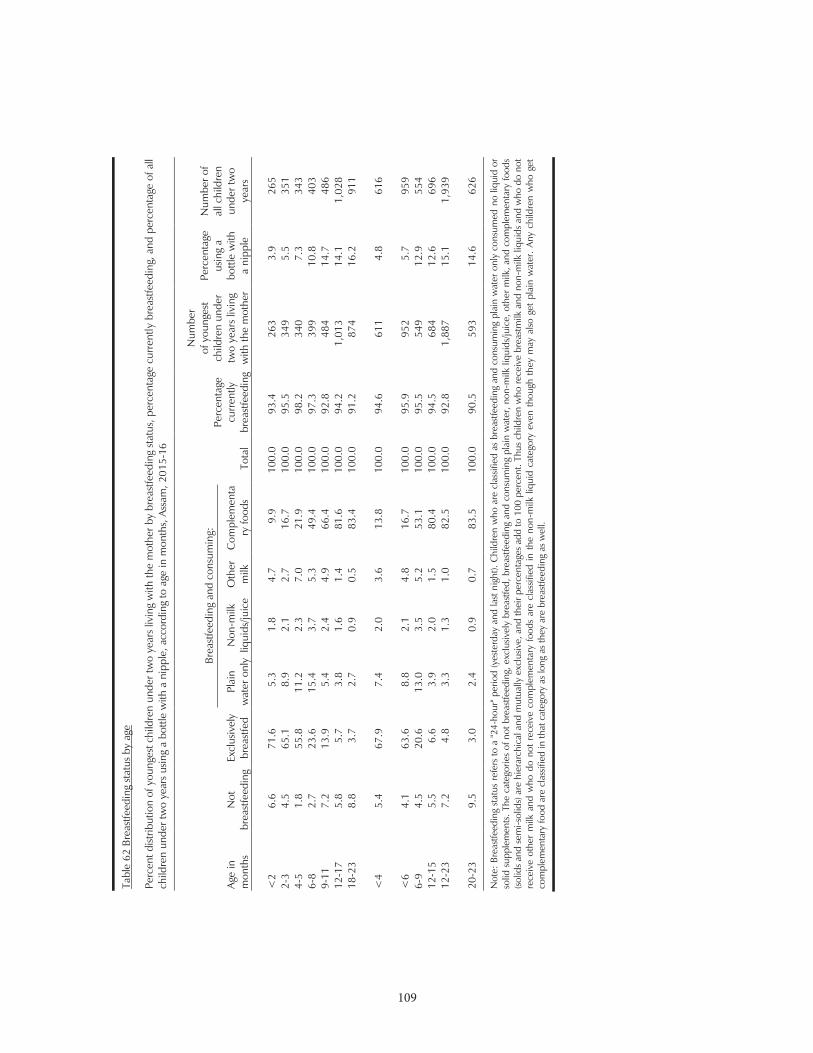
109
109
Tabl
e 62
Bre
astfe
edin
g st
atus
by
age
Perc
ent d
istrib
utio
n of
you
nges
t chi
ldre
n un
der t
wo
year
s liv
ing
with
the
mot
her b
y br
east
feed
ing
stat
us, p
erce
ntag
e cu
rren
tly b
reas
tfeed
ing,
and
per
cent
age
of a
ll ch
ildre
n un
der t
wo
year
s us
ing
a bo
ttle
with
a n
ippl
e, a
ccor
ding
to a
ge in
mon
ths,
Ass
am, 2
015-
16
Age
in
mon
ths
Not
br
east
feed
ing
Excl
usiv
ely
br
east
fed
Brea
stfe
edin
g an
d co
nsum
ing:
Tota
l
Perc
enta
ge
curr
ently
br
east
feed
ing
Num
ber
of y
oung
est
child
ren
unde
r tw
o ye
ars
livin
g w
ith th
e m
othe
r
Perc
enta
ge
usin
g a
bottl
e w
ith
a ni
pple
Num
ber o
f al
l chi
ldre
n un
der t
wo
year
s Pl
ain
w
ater
onl
y N
on-m
ilk
liqui
ds/ju
ice
Oth
er
milk
C
ompl
emen
tary
food
s
<
2 6.
6 71
.6
5.3
1.8
4.7
9.9
100.
0 93
.4
263
3.9
265
2-3
4.5
65.1
8.
9 2.
1 2.
7 16
.7
100.
0 95
.5
349
5.5
351
4-5
1.8
55.8
11
.2
2.3
7.0
21.9
10
0.0
98.2
34
0 7.
3 34
3 6-
8 2.
7 23
.6
15.4
3.
7 5.
3 49
.4
100.
0 97
.3
399
10.8
40
3 9-
11
7.2
13.9
5.
4 2.
4 4.
9 66
.4
100.
0 92
.8
484
14.7
48
6 12
-17
5.8
5.7
3.8
1.6
1.4
81.6
10
0.0
94.2
1,
013
14.1
1,
028
18-2
3 8.
8 3.
7 2.
7 0.
9 0.
5 83
.4
100.
0 91
.2
874
16.2
91
1
<
4 5.
4 67
.9
7.4
2.0
3.6
13.8
10
0.0
94.6
61
1 4.
8 61
6
<
6 4.
1 63
.6
8.8
2.1
4.8
16.7
10
0.0
95.9
95
2 5.
7 95
9 6-
9 4.
5 20
.6
13.0
3.
5 5.
2 53
.1
100.
0 95
.5
549
12.9
55
4 12
-15
5.5
6.6
3.9
2.0
1.5
80.4
10
0.0
94.5
68
4 12
.6
696
12-2
3 7.
2 4.
8 3.
3 1.
3 1.
0 82
.5
100.
0 92
.8
1,88
7 15
.1
1,93
9
20
-23
9.5
3.0
2.4
0.9
0.7
83.5
10
0.0
90.5
59
3 14
.6
626
Not
e: B
reas
tfeed
ing
stat
us r
efer
s to
a "2
4-ho
ur" p
erio
d (y
este
rday
and
last
nig
ht).
Chi
ldre
n w
ho a
re c
lass
ified
as
brea
stfe
edin
g an
d co
nsum
ing
plai
n w
ater
onl
y co
nsum
ed n
o liq
uid
or
solid
sup
plem
ents
. The
cat
egor
ies
of n
ot b
reas
tfeed
ing,
exc
lusiv
ely
brea
stfe
d, b
reas
tfeed
ing
and
cons
umin
g pl
ain
wat
er, n
on-m
ilk li
quid
s/ju
ice,
oth
er m
ilk, a
nd c
ompl
emen
tary
food
s (s
olid
s an
d se
mi-s
olid
s) a
re h
iera
rchi
cal a
nd m
utua
lly e
xclu
sive,
and
thei
r per
cent
ages
add
to 1
00 p
erce
nt. T
hus
child
ren
who
rece
ive
brea
stm
ilk a
nd n
on-m
ilk li
quid
s an
d w
ho d
o no
t re
ceiv
e ot
her
milk
and
who
do
not
rece
ive
com
plem
enta
ry f
oods
are
cla
ssifi
ed in
the
non
-milk
liqu
id c
ateg
ory
even
tho
ugh
they
may
also
get
pla
in w
ater
. An
y ch
ildre
n w
ho g
et
com
plem
enta
ry fo
od a
re c
lass
ified
in th
at c
ateg
ory
as lo
ng a
s th
ey a
re b
reas
tfeed
ing
as w
ell.
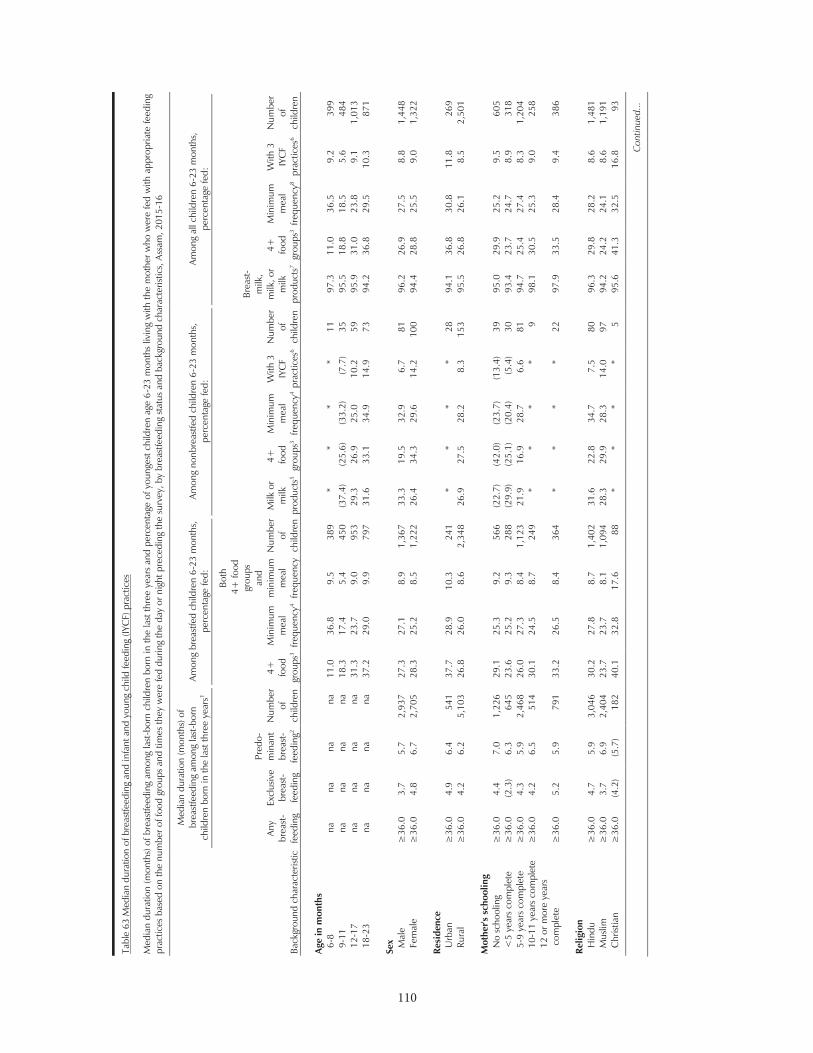
110
110
Tabl
e 63
Med
ian
dura
tion
of b
reas
tfeed
ing
and
infa
nt a
nd y
oung
chi
ld fe
edin
g (IY
CF)
pra
ctic
es
Med
ian
dura
tion
(mon
ths)
of b
reas
tfeed
ing
amon
g la
st-b
orn
child
ren
born
in th
e la
st th
ree
year
s an
d pe
rcen
tage
of y
oung
est c
hild
ren
age
6-23
mon
ths
livin
g w
ith th
e m
othe
r who
wer
e fe
d w
ith a
ppro
pria
te fe
edin
g pr
actic
es b
ased
on
the
num
ber o
f foo
d gr
oups
and
tim
es th
ey w
ere
fed
durin
g th
e da
y or
nig
ht p
rece
ding
the
surv
ey, b
y br
east
feed
ing
stat
us a
nd b
ackg
roun
d ch
arac
teris
tics,
Ass
am, 2
015-
16
Back
grou
nd c
hara
cter
istic
Med
ian
dura
tion
(mon
ths)
of
brea
stfe
edin
g am
ong
last
-bor
n
child
ren
born
in th
e la
st th
ree
year
s1
Amon
g br
east
fed
child
ren
6-23
mon
ths,
pe
rcen
tage
fed:
Amon
g no
nbre
astfe
d ch
ildre
n 6-
23 m
onth
s,
perc
enta
ge fe
d:
Amon
g al
l chi
ldre
n 6-
23 m
onth
s,
perc
enta
ge fe
d:
An
y br
east
-fe
edin
g
Excl
usiv
e br
east
- fe
edin
g
Pred
o-m
inan
t br
east
- fe
edin
g2
Num
ber
of
child
ren
4+
food
gr
oups
3
Min
imum
m
eal
frequ
ency
4
Both
4
+ fo
od
grou
ps
and
min
imum
m
eal
frequ
ency
Num
ber
of
child
ren
Milk
or
milk
pr
oduc
ts5
4+
food
gr
oups
3
Min
imum
m
eal
frequ
ency
4
With
3
IYC
F pr
actic
es6
Num
ber
of
child
ren
Brea
st-
milk
, m
ilk, o
r m
ilk
prod
ucts
7
4+
food
gr
oups
3
Min
imum
m
eal
frequ
ency
8
With
3
IYC
F pr
actic
es6
Num
ber
of
child
ren
Ag
e in
mon
ths
6-8
na
na
na
na
11
.0
36.8
9.
5 38
9 *
* *
* 11
97
.3
11.0
36
.5
9.2
399
9-11
na
na
na
na
18
.3
17.4
5.
4 45
0 (3
7.4)
(2
5.6)
(3
3.2)
(7
.7)
35
95.5
18
.8
18.5
5.
6 48
4 12
-17
na
na
na
na
31
.3
23.7
9.
0 95
3 29
.3
26.9
25
.0
10.2
59
95
.9
31.0
23
.8
9.1
1,01
3 18
-23
na
na
na
na
37
.2
29.0
9.
9 79
7 31
.6
33.1
34
.9
14.9
73
94
.2
36.8
29
.5
10.3
87
1
Sex
Mal
e
3.
7 5.
7 2,
937
27.3
27
.1
8.9
1,36
7 33
.3
19.5
32
.9
6.7
81
96.2
26
.9
27.5
8.
8 1,
448
Fem
ale
4.8
6.7
2,70
5 28
.3
25.2
8.
5 1,
222
26.4
34
.3
29.6
14
.2
100
94.4
28
.8
25.5
9.
0 1,
322
Re
side
nce
Urb
an
4.
9 6.
4 54
1 37
.7
28.9
10
.3
241
* *
* *
28
94.1
36
.8
30.8
11
.8
269
Rura
l
4.2
6.2
5,10
3 26
.8
26.0
8.
6 2,
348
26.9
27
.5
28.2
8.
3 15
3 95
.5
26.8
26
.1
8.5
2,50
1
Mot
her's
sch
oolin
g
N
o sc
hool
ing
4.4
7.0
1,22
6 29
.1
25.3
9.
2 56
6 (2
2.7)
(4
2.0)
(2
3.7)
(1
3.4)
39
95
.0
29.9
25
.2
9.5
605
<5
year
s co
mpl
ete
(2.3
) 6.
3 64
5 23
.6
25.2
9.
3 28
8 (2
9.9)
(2
5.1)
(2
0.4)
(5
.4)
30
93.4
23
.7
24.7
8.
9 31
8 5-
9 ye
ars
com
plet
e
4.
3 5.
9 2,
468
26.0
27
.3
8.4
1,12
3 21
.9
16.9
28
.7
6.6
81
94.7
25
.4
27.4
8.
3 1,
204
10-1
1 ye
ars
com
plet
e
4.
2 6.
5 51
4 30
.1
24.5
8.
7 24
9 *
* *
* 9
98.1
30
.5
25.3
9.
0 25
8 12
or m
ore
year
s c
ompl
ete
5.2
5.9
791
33.2
26
.5
8.4
364
* *
* *
22
97.9
33
.5
28.4
9.
4 38
6
Relig
ion
Hin
du
4.
7 5.
9 3,
046
30.2
27
.8
8.7
1,40
2 31
.6
22.8
34
.7
7.5
80
96.3
29
.8
28.2
8.
6 1,
481
Mus
lim
3.
7 6.
9 2,
404
23.7
23
.7
8.1
1,09
4 28
.3
29.9
28
.3
14.0
97
94
.2
24.2
24
.1
8.6
1,19
1 C
hrist
ian
(4.2
) (5
.7)
182
40.1
32
.8
17.6
88
*
* *
* 5
95.6
41
.3
32.5
16
.8
93
Con
tinue
d...
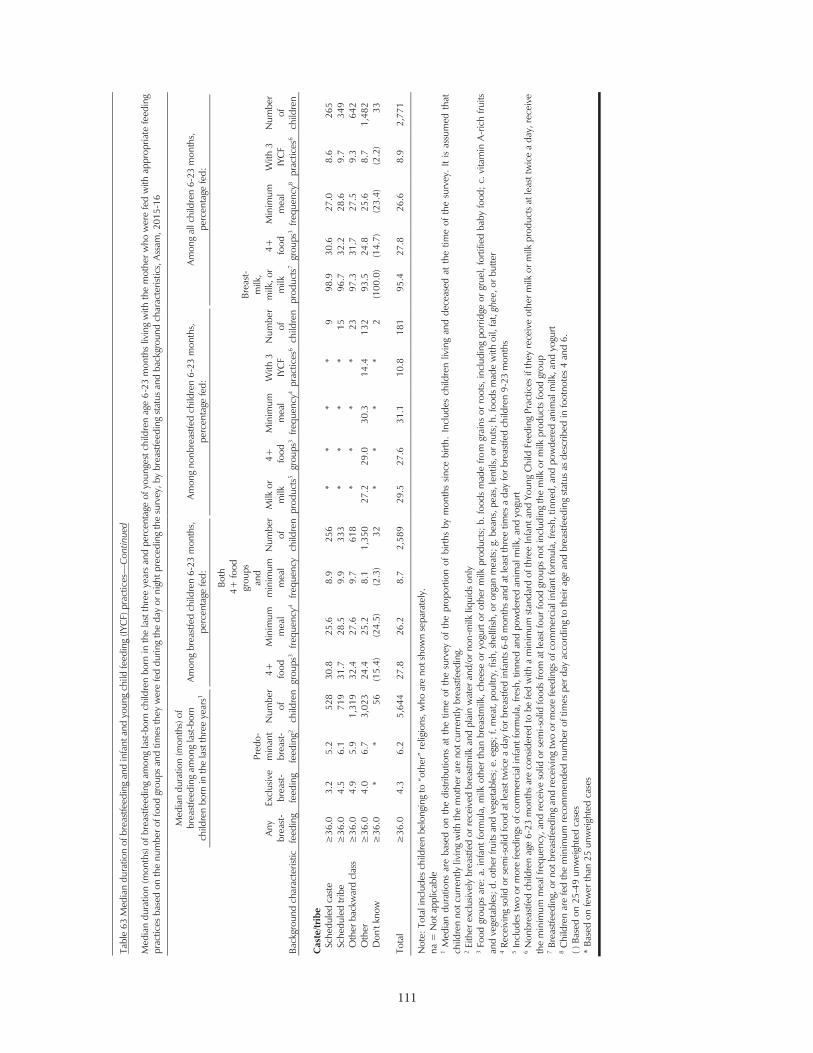
111
111
Ta
ble
63 M
edia
n du
ratio
n of
bre
astfe
edin
g an
d in
fant
and
you
ng c
hild
feed
ing
(IYC
F) p
ract
ices—
Con
tinue
d
Med
ian
dura
tion
(mon
ths)
of b
reas
tfeed
ing
amon
g la
st-b
orn
child
ren
born
in th
e la
st th
ree
year
s an
d pe
rcen
tage
of y
oung
est c
hild
ren
age
6-23
mon
ths
livin
g w
ith th
e m
othe
r who
wer
e fe
d w
ith a
ppro
pria
te fe
edin
g pr
actic
es b
ased
on
the
num
ber o
f foo
d gr
oups
and
tim
es th
ey w
ere
fed
durin
g th
e da
y or
nig
ht p
rece
ding
the
surv
ey, b
y br
east
feed
ing
stat
us a
nd b
ackg
roun
d ch
arac
teris
tics,
Ass
am, 2
015-
16
Back
grou
nd c
hara
cter
istic
Med
ian
dura
tion
(mon
ths)
of
brea
stfe
edin
g am
ong
last
-bor
n
child
ren
born
in th
e la
st th
ree
year
s1
Amon
g br
east
fed
child
ren
6-23
mon
ths,
pe
rcen
tage
fed:
Amon
g no
nbre
astfe
d ch
ildre
n 6-
23 m
onth
s,
perc
enta
ge fe
d:
Amon
g al
l chi
ldre
n 6-
23 m
onth
s,
perc
enta
ge fe
d:
An
y br
east
-fe
edin
g
Excl
usiv
e br
east
- fe
edin
g
Pred
o-m
inan
t br
east
- fe
edin
g2
Num
ber
of
child
ren
4+
food
gr
oups
3
Min
imum
m
eal
frequ
ency
4
Both
4
+ fo
od
grou
ps
and
min
imum
m
eal
frequ
ency
Num
ber
of
child
ren
Milk
or
milk
pr
oduc
ts5
4+
food
gr
oups
3
Min
imum
m
eal
frequ
ency
4
With
3
IYC
F pr
actic
es6
Num
ber
of
child
ren
Brea
st-
milk
, m
ilk, o
r m
ilk
prod
ucts
7
4+
food
gr
oups
3
Min
imum
m
eal
frequ
ency
8
With
3
IYC
F pr
actic
es6
Num
ber
of
child
ren
C
aste
/trib
e
Sc
hedu
led
cast
e
3.
2 5.
2 52
8 30
.8
25.6
8.
9 25
6 *
* *
* 9
98.9
30
.6
27.0
8.
6 26
5 Sc
hedu
led
tribe
4.5
6.1
719
31.7
28
.5
9.9
333
* *
* *
15
96.7
32
.2
28.6
9.
7 34
9 O
ther
bac
kwar
d cl
ass
4.9
5.9
1,31
9 32
.4
27.6
9.
7 61
8 *
* *
* 23
97
.3
31.7
27
.5
9.3
642
Oth
er
4.
0 6.
7 3,
023
24.4
25
.2
8.1
1,35
0 27
.2
29.0
30
.3
14.4
13
2 93
.5
24.8
25
.6
8.7
1,48
2 D
on't
know
* *
56
(15.
4)
(24.
5)
(2.3
) 32
*
* *
* 2
(100
.0)
(14.
7)
(23.
4)
(2.2
) 33
Tota
l
4.3
6.2
5,64
4 27
.8
26.2
8.
7 2,
589
29.5
27
.6
31.1
10
.8
181
95.4
27
.8
26.6
8.
9 2,
771
na =
Not
app
licab
le
1 M
edia
n du
ratio
ns a
re b
ased
on
the
dist
ribut
ions
at
the
time
of t
he s
urve
y of
the
pro
porti
on o
f bi
rths
by m
onth
s sin
ce b
irth.
Inc
lude
s ch
ildre
n liv
ing
and
dece
ased
at
the
time
of t
he s
urve
y. I
t is
assu
med
tha
t ch
ildre
n no
t cur
rent
ly li
ving
with
the
mot
her a
re n
ot c
urre
ntly
bre
astfe
edin
g.
2 Eith
er e
xclu
sivel
y br
east
fed
or re
ceiv
ed b
reas
tmilk
and
pla
in w
ater
and
/or n
on-m
ilk li
quid
s on
ly
3 Fo
od g
roup
s ar
e: a
. inf
ant f
orm
ula,
milk
oth
er th
an b
reas
tmilk
, che
ese
or y
ogur
t or
othe
r m
ilk p
rodu
cts;
b. f
oods
mad
e fro
m g
rain
s or
roo
ts, i
nclu
ding
por
ridge
or
grue
l, fo
rtifie
d ba
by fo
od;
c. v
itam
in A
-ric
h fru
its
and
vege
tabl
es; d
. oth
er fr
uits
and
veg
etab
les;
e. e
ggs;
f. m
eat,
poul
try, f
ish, s
hellf
ish, o
r org
an m
eats
; g. b
eans
, pea
s, le
ntils
, or n
uts;
h. f
oods
mad
e w
ith o
il, fa
t, gh
ee, o
r but
ter
4 Rec
eivi
ng so
lid o
r sem
i-sol
id fo
od a
t lea
st tw
ice
a da
y fo
r bre
astfe
d in
fant
s 6-
8 m
onth
s an
d at
leas
t thr
ee ti
mes
a d
ay fo
r bre
astfe
d ch
ildre
n 9-
23 m
onth
s 5 I
nclu
des
two
or m
ore
feed
ings
of c
omm
erci
al in
fant
form
ula,
fres
h, ti
nned
and
pow
dere
d an
imal
milk
, and
yog
urt
6 Non
brea
stfe
d ch
ildre
n ag
e 6-
23 m
onth
s ar
e co
nsid
ered
to b
e fe
d w
ith a
min
imum
sta
ndar
d of
thre
e In
fant
and
You
ng C
hild
Fee
ding
Pra
ctic
es if
they
rece
ive
othe
r milk
or m
ilk p
rodu
cts
at le
ast t
wic
e a
day,
rece
ive
the
min
imum
mea
l fre
quen
cy, a
nd re
ceiv
e so
lid o
r sem
i-sol
id fo
ods
from
at l
east
four
food
gro
ups
not i
nclu
ding
the
milk
or m
ilk p
rodu
cts
food
gro
up
7 Bre
astfe
edin
g, o
r not
bre
astfe
edin
g an
d re
ceiv
ing
two
or m
ore
feed
ings
of c
omm
erci
al in
fant
form
ula,
fres
h, ti
nned
, and
pow
dere
d an
imal
milk
, and
yog
urt
8 Chi
ldre
n ar
e fe
d th
e m
inim
um re
com
men
ded
num
ber o
f tim
es p
er d
ay a
ccor
ding
to th
eir a
ge a
nd b
reas
tfeed
ing
stat
us a
s de
scrib
ed in
foot
note
s 4
and
6.
( ) B
ased
on
25-4
9 un
wei
ghte
d ca
ses
* Ba
sed
on fe
wer
than
25
unw
eigh
ted
case
s
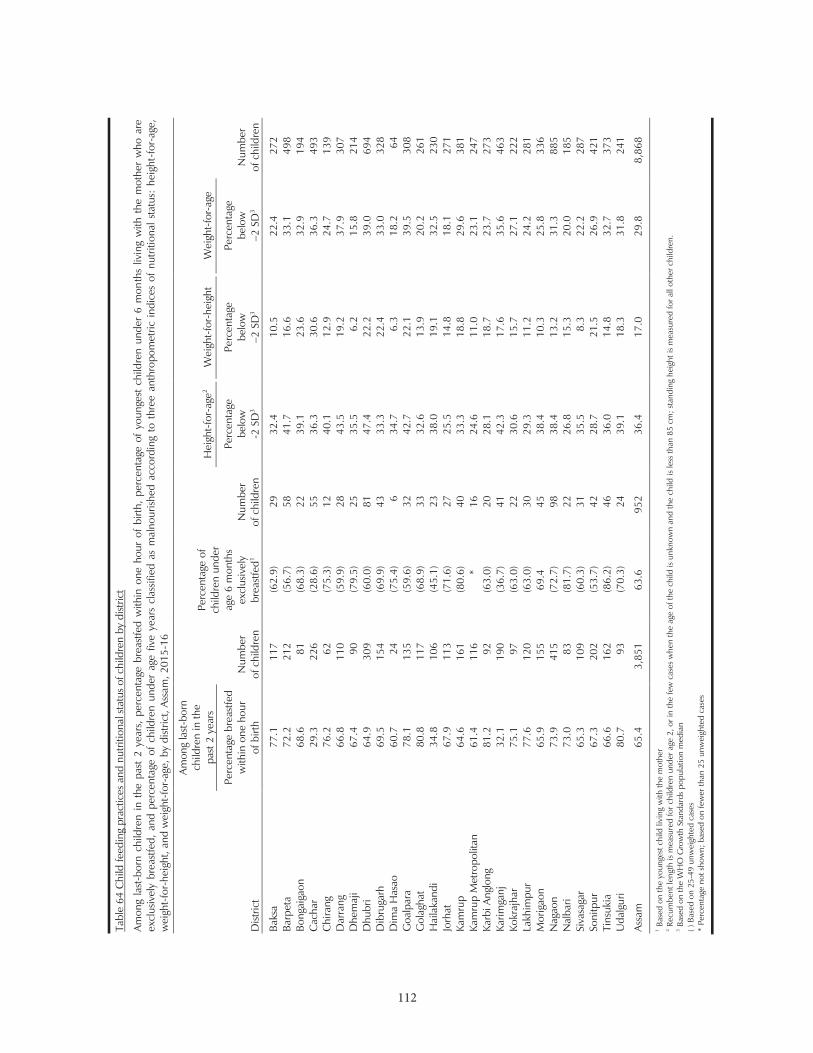
112
112
Tabl
e 64
Chi
ld fe
edin
g pr
actic
es a
nd n
utrit
iona
l sta
tus
of c
hild
ren
by d
istric
t
Amon
g la
st-b
orn
child
ren
in t
he p
ast
2 ye
ars,
per
cent
age
brea
stfe
d w
ithin
one
hou
r of
birt
h, p
erce
ntag
e of
you
nges
t ch
ildre
n un
der
6 m
onth
s liv
ing
with
the
mot
her
who
are
ex
clus
ivel
y br
east
fed,
and
per
cent
age
of c
hild
ren
unde
r ag
e fiv
e ye
ars
clas
sifie
d as
mal
nour
ished
acc
ordi
ng t
o th
ree
anth
ropo
met
ric i
ndic
es o
f nu
triti
onal
sta
tus:
hei
ght-
for-
age,
w
eigh
t-fo
r-he
ight
, and
wei
ght-
for-
age,
by
dist
rict,
Assa
m, 2
015-
16
Dist
rict
Amon
g la
st-b
orn
child
ren
in th
e pa
st 2
yea
rs
Num
ber
of c
hild
ren
Perc
enta
ge o
f ch
ildre
n un
der
age
6 m
onth
s ex
clus
ivel
y br
east
fed1
Num
ber
of c
hild
ren
Hei
ght-
for-
age2
Wei
ght-
for-
heig
ht
Wei
ght-
for-
age
Num
ber
of c
hild
ren
Perc
enta
ge b
reas
tfed
with
in o
ne h
our
of b
irth
Perc
enta
ge
belo
w
-2 S
D3
Perc
enta
ge
belo
w
2 SD
3
Perc
enta
ge
belo
w
2 SD
3
Baks
a 77
.1
117
(62.
9)
29
32.4
10
.5
22.4
27
2 Ba
rpet
a 72
.2
212
(56.
7)
58
41.7
16
.6
33.1
49
8 Bo
ngai
gaon
68
.6
81
(68.
3)
22
39.1
23
.6
32.9
19
4 C
acha
r 29
.3
226
(28.
6)
55
36.3
30
.6
36.3
49
3 C
hira
ng
76.2
62
(7
5.3)
12
40
.1
12.9
24
.7
139
Dar
rang
66
.8
110
(59.
9)
28
43.5
19
.2
37.9
30
7 D
hem
aji
67.4
90
(7
9.5)
25
35
.5
6.2
15.8
21
4 D
hubr
i 64
.9
309
(60.
0)
81
47.4
22
.2
39.0
69
4 D
ibru
garh
69
.5
154
(69.
9)
43
33.3
22
.4
33.0
32
8 D
ima
Has
ao
60.7
24
(7
5.4)
6
34.7
6.
3 18
.2
64
Goa
lpar
a 78
.1
135
(59.
6)
32
42.7
22
.1
39.5
30
8 G
olag
hat
80.8
11
7 (6
8.9)
33
32
.6
13.9
20
.2
261
Hai
laka
ndi
34.8
10
6 (4
5.1)
23
38
.0
19.1
32
.5
230
Jorh
at
67.9
11
3 (7
1.6)
27
25
.5
14.8
18
.1
271
Kam
rup
64.6
16
1 (8
0.6)
40
33
.3
18.8
29
.6
381
Kam
rup
Met
ropo
litan
61
.4
116
* 16
24
.6
11.0
23
.1
247
Karb
i Ang
long
81
.2
92
(63.
0)
20
28.1
18
.7
23.7
27
3 Ka
rimga
nj
32.1
19
0 (3
6.7)
41
42
.3
17.6
35
.6
463
Kokr
ajha
r 75
.1
97
(63.
0)
22
30.6
15
.7
27.1
22
2 La
khim
pur
77.6
12
0 (6
3.0)
30
29
.3
11.2
24
.2
281
Mor
igao
n 65
.9
155
69.4
45
38
.4
10.3
25
.8
336
Nag
aon
73.9
41
5 (7
2.7)
98
38
.4
13.2
31
.3
885
Nal
bari
73.0
83
(8
1.7)
22
26
.8
15.3
20
.0
185
Siva
saga
r 65
.3
109
(60.
3)
31
35.5
8.
3 22
.2
287
Soni
tpur
67
.3
202
(53.
7)
42
28.7
21
.5
26.9
42
1 Ti
nsuk
ia
66.6
16
2 (8
6.2)
46
36
.0
14.8
32
.7
373
Uda
lgur
i 80
.7
93
(70.
3)
24
39.1
18
.3
31.8
24
1
Assa
m
65.4
3,
851
63.6
95
2 36
.4
17.0
29
.8
8,86
8
1 Bas
ed o
n th
e yo
unge
st c
hild
livi
ng w
ith th
e m
othe
r 2 R
ecum
bent
leng
th is
mea
sure
d fo
r chi
ldre
n un
der a
ge 2
, or i
n th
e fe
w c
ases
whe
n th
e ag
e of
the
child
is u
nkno
wn
and
the
child
is le
ss th
an 8
5 cm
; sta
ndin
g he
ight
is m
easu
red
for a
ll ot
her c
hild
ren.
3 B
ased
on
the
WH
O G
row
th S
tand
ards
pop
ulat
ion
med
ian
( )
Bas
ed o
n 25
-49
unw
eigh
ted
case
s *
Perc
enta
ge n
ot s
how
n; b
ased
on
few
er th
an 2
5 un
wei
ghte
d ca
ses
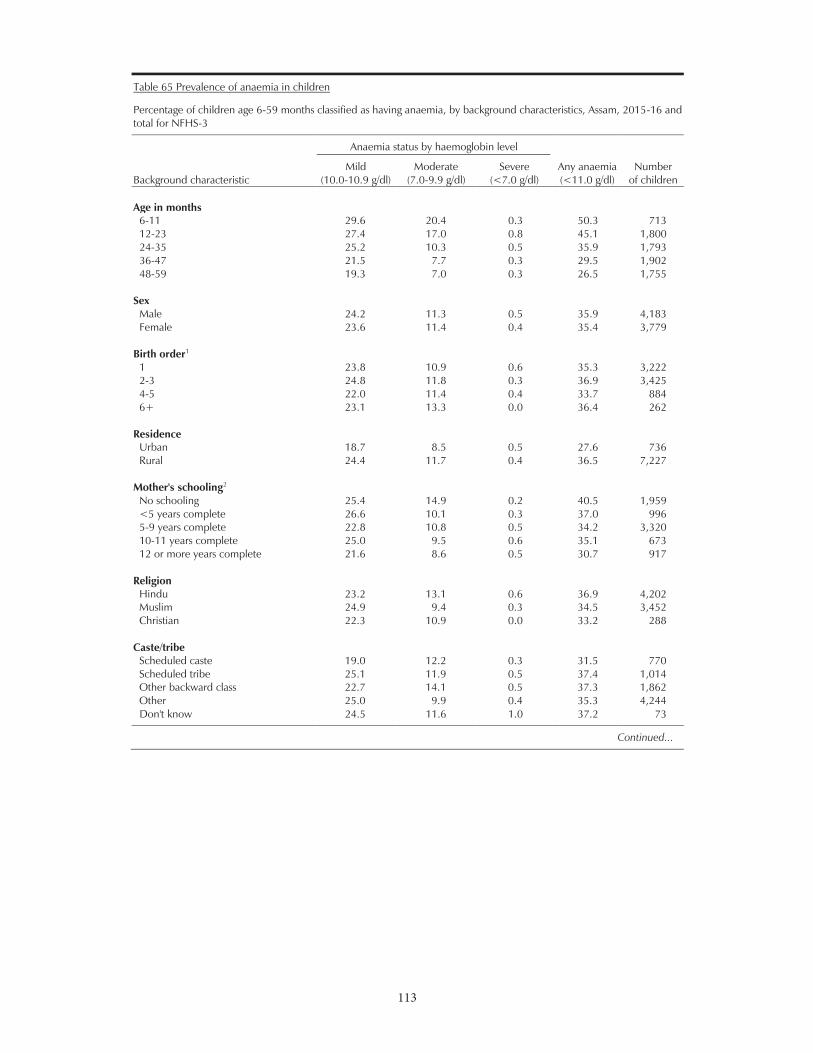
113
113
Table 65 Prevalence of anaemia in children
Percentage of children age 6-59 months classified as having anaemia, by background characteristics, Assam, 2015-16 and total for NFHS-3
Background characteristic
Anaemia status by haemoglobin level
Any anaemia (<11.0 g/dl)
Number of children
Mild (10.0-10.9 g/dl)
Moderate (7.0-9.9 g/dl)
Severe (<7.0 g/dl)
Age in months
6-11 29.6 20.4 0.3 50.3 713 12-23 27.4 17.0 0.8 45.1 1,800 24-35 25.2 10.3 0.5 35.9 1,793 36-47 21.5 7.7 0.3 29.5 1,902 48-59 19.3 7.0 0.3 26.5 1,755
Sex Male 24.2 11.3 0.5 35.9 4,183 Female 23.6 11.4 0.4 35.4 3,779
Birth order1 1 23.8 10.9 0.6 35.3 3,222 2-3 24.8 11.8 0.3 36.9 3,425 4-5 22.0 11.4 0.4 33.7 884 6+ 23.1 13.3 0.0 36.4 262
Residence Urban 18.7 8.5 0.5 27.6 736 Rural 24.4 11.7 0.4 36.5 7,227
Mother's schooling2 No schooling 25.4 14.9 0.2 40.5 1,959 <5 years complete 26.6 10.1 0.3 37.0 996 5-9 years complete 22.8 10.8 0.5 34.2 3,320 10-11 years complete 25.0 9.5 0.6 35.1 673 12 or more years complete 21.6 8.6 0.5 30.7 917
Religion Hindu 23.2 13.1 0.6 36.9 4,202 Muslim 24.9 9.4 0.3 34.5 3,452 Christian 22.3 10.9 0.0 33.2 288
Caste/tribe Scheduled caste 19.0 12.2 0.3 31.5 770 Scheduled tribe 25.1 11.9 0.5 37.4 1,014 Other backward class 22.7 14.1 0.5 37.3 1,862 Other 25.0 9.9 0.4 35.3 4,244 Don't know 24.5 11.6 1.0 37.2 73
Continued...
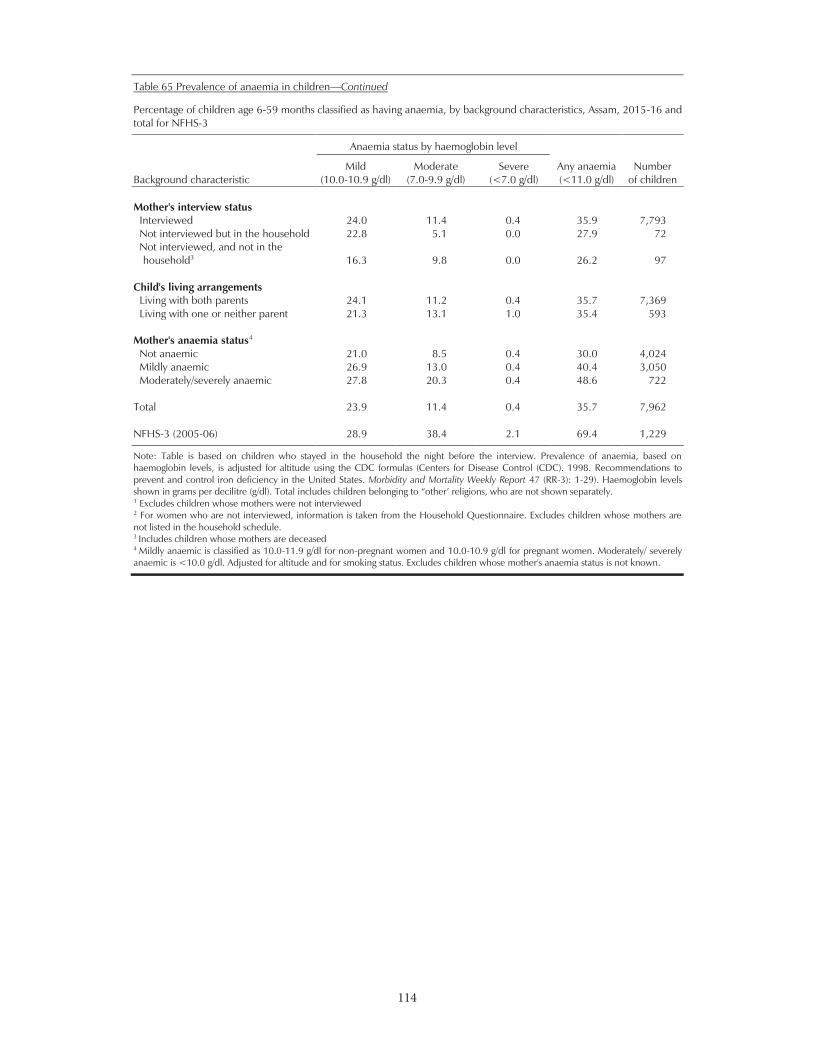
114
114
Table 65 Prevalence of anaemia in children—Continued
Percentage of children age 6-59 months classified as having anaemia, by background characteristics, Assam, 2015-16 and total for NFHS-3
Background characteristic
Anaemia status by haemoglobin level
Any anaemia (<11.0 g/dl)
Number of children
Mild (10.0-10.9 g/dl)
Moderate (7.0-9.9 g/dl)
Severe (<7.0 g/dl)
Mother's interview status
Interviewed 24.0 11.4 0.4 35.9 7,793 Not interviewed but in the household 22.8 5.1 0.0 27.9 72 Not interviewed, and not in the household3 16.3 9.8 0.0 26.2 97
Child's living arrangements
Living with both parents 24.1 11.2 0.4 35.7 7,369 Living with one or neither parent 21.3 13.1 1.0 35.4 593
Mother's anaemia status4 Not anaemic 21.0 8.5 0.4 30.0 4,024 Mildly anaemic 26.9 13.0 0.4 40.4 3,050 Moderately/severely anaemic 27.8 20.3 0.4 48.6 722
Total 23.9 11.4 0.4 35.7 7,962 NFHS-3 (2005-06) 28.9 38.4 2.1 69.4 1,229
Note: Table is based on children who stayed in the household the night before the interview. Prevalence of anaemia, based on haemoglobin levels, is adjusted for altitude using the CDC formulas (Centers for Disease Control (CDC). 1998. Recommendations to prevent and control iron deficiency in the United States. Morbidity and Mortality Weekly Report 47 (RR-3): 1-29). Haemoglobin levels shown in grams per decilitre (g/dl). 1 Excludes children whose mothers were not interviewed 2 For women who are not interviewed, information is taken from the Household Questionnaire. Excludes children whose mothers are not listed in the household schedule. 3 Includes children whose mothers are deceased 4 Mildly anaemic is classified as 10.0-11.9 g/dl for non-pregnant women and 10.0-10.9 g/dl for pregnant women. Moderately/ severely anaemic is <10.0 g/dl. Adjusted for altitude and for smoking status. Excludes children whose mother's anaemia status is not known.

115
115
Tabl
e 66
Mic
ronu
trien
t int
ake
amon
g ch
ildre
n
Perc
enta
ge o
f yo
unge
st c
hild
ren
age
9-23
mon
ths
livin
g w
ith t
he m
othe
r w
ho c
onsu
med
vita
min
A-r
ich
and
iron-
rich
food
s in
the
day
or
nigh
t pr
eced
ing
the
surv
ey,
perc
enta
ge o
f ch
ildre
n ag
e 9-
59 m
onth
s w
ho w
ere
give
n vi
tam
in A
sup
plem
ents
in th
e six
mon
ths
prec
edin
g th
e su
rvey
and
per
cent
age
of c
hild
ren
age
6-59
mon
ths
who
wer
e gi
ven
iron
supp
lem
ents
in
the
pas
t se
ven
days
, w
ho w
ere
give
n de
wor
min
g m
edic
atio
n in
the
six
mon
ths
prec
edin
g th
e su
rvey
, an
d w
ho li
ve i
n ho
useh
old
s us
ing
iodi
zed
salt,
by
back
grou
nd c
hara
cter
istic
s, As
sam
, 201
5-16
, and
tota
l for
NFH
S-3
Back
grou
nd
char
acte
ristic
Youn
gest
chi
ldre
n ag
e 9-
23 m
onth
s
livin
g w
ith th
eir m
othe
r
Chi
ldre
n ag
e 9-
59 m
onth
s
Chi
ldre
n ag
e 6-
59 m
onth
s
Chi
ldre
n ag
e 6-
59 m
onth
s in
ho
useh
olds
with
sal
t tes
ted
Perc
enta
ge w
ho
cons
umed
food
s ric
h in
vita
min
A
in p
ast 2
4 ho
urs1
Perc
enta
ge w
ho
cons
umed
food
s ric
h in
iron
in
pas
t 24
hour
s2
Num
ber
of
child
ren
Perc
enta
ge
give
n vi
tam
in A
su
pple
men
ts in
pa
st 6
mon
ths
Num
ber
of
child
ren
Perc
enta
ge
give
n iro
n su
pple
men
ts
in p
ast 7
day
s
Perc
enta
ge g
iven
de
wor
min
g m
edic
atio
n in
pa
st 6
mon
ths3
Num
ber
of
child
ren
Perc
enta
ge
livin
g in
ho
useh
olds
usin
g io
dize
d sa
lt4
Num
ber
of
child
ren
Age
in m
onth
s
6-
8
na
na
na
na
na
15.9
15
.2
403
100.
0 42
1 9-
11
36.3
14
.5
484
63.7
48
6 21
.1
19.7
48
6 99
.5
506
12-1
7
59.7
28
.9
1,01
3 62
.8
1,02
8 21
.0
23.7
1,
028
99.6
1,
073
18-2
3
69.7
38
.7
874
63.5
91
1 23
.4
32.5
91
1 99
.5
944
24-3
5
na
na
na
51.5
1,
958
20.3
33
.3
1,95
8 99
.8
2,02
7 36
-47
na
na
na
44
.5
2,04
5 20
.4
32.6
2,
045
99.4
2,
111
48-5
9
na
na
na
43.5
1,
875
19.8
32
.7
1,87
5 99
.6
1,93
0
Sex
Mal
e
57.5
28
.4
1,24
4 51
.7
4,33
3 20
.5
30.7
4,
541
99.5
4,
708
Fem
ale
59
.9
30.8
1,
128
51.1
3,
970
20.4
29
.6
4,16
5 99
.7
4,30
2
Birt
h or
der
1
54.5
25
.4
985
54.4
3,
523
20.1
31
.8
3,69
5 99
.7
3,63
6 2-
3
61.6
33
.2
1,07
5 50
.8
3,59
8 21
.0
29.8
3,
775
99.6
3,
757
4-5
63
.2
30.5
26
3 45
.5
915
20.5
26
.7
960
99.7
95
9 6+
(5
1.6)
(2
8.9)
49
40
.3
267
16.7
25
.4
277
98.3
27
6
Brea
stfe
edin
g st
atus
Br
east
feed
ing
58
.6
29.7
2,
201
58.2
4,
533
21.2
29
.3
4,92
1 99
.7
4,91
0 N
ot b
reas
tfeed
ing
59
.4
27.2
17
1 43
.3
3,77
0 19
.5
31.3
3,
785
99.4
3,
717
Resi
denc
e
U
rban
58
.4
29.1
23
2 58
.5
845
19.3
31
.1
883
99.9
90
6 Ru
ral
58.6
29
.6
2,14
0 50
.6
7,45
8 20
.6
30.1
7,
823
99.6
8,
105
Con
tinue
d...
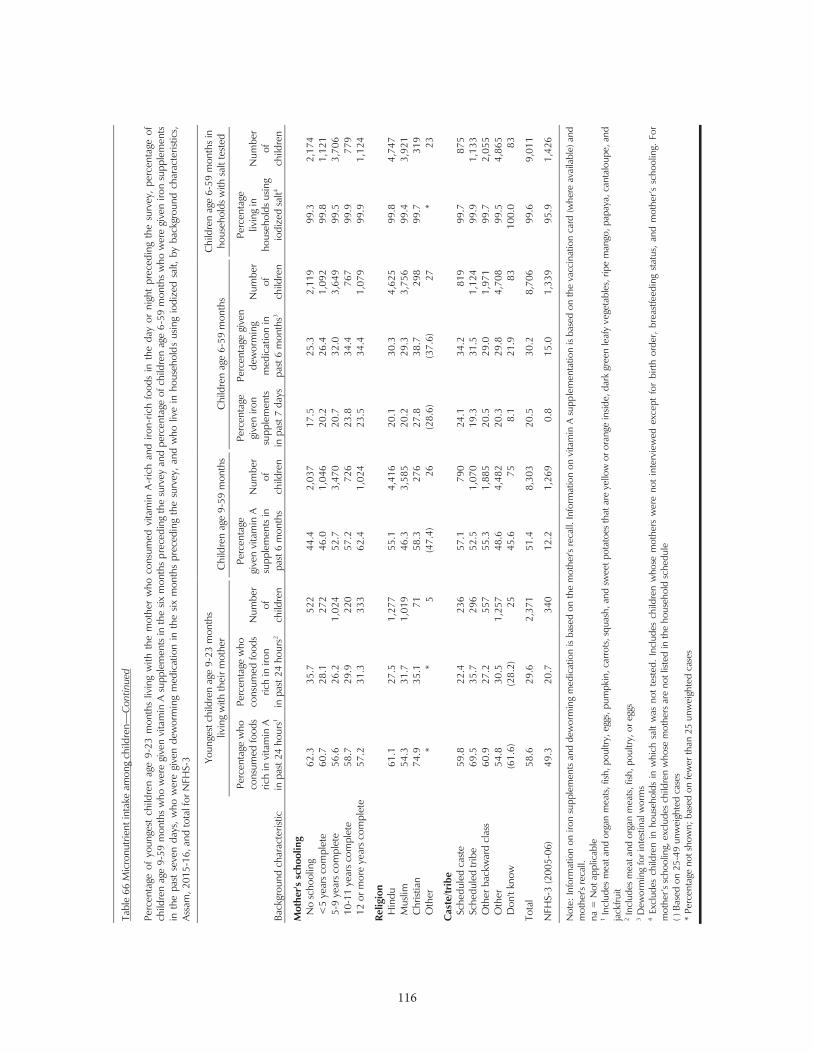
116
116
Tabl
e 66
Mic
ronu
trien
t int
ake
amon
g ch
ildre
n—C
ontin
ued
Perc
enta
ge o
f yo
unge
st c
hild
ren
age
9-23
mon
ths
livin
g w
ith t
he m
othe
r w
ho c
onsu
med
vita
min
A-r
ich
and
iron-
rich
food
s in
the
day
or
nigh
t pr
eced
ing
the
surv
ey,
perc
enta
ge o
f ch
ildre
n ag
e 9-
59 m
onth
s w
ho w
ere
give
n vi
tam
in A
sup
plem
ents
in th
e six
mon
ths
prec
edin
g th
e su
rvey
and
per
cent
age
of c
hild
ren
age
6-59
mon
ths
who
wer
e gi
ven
iron
supp
lem
ents
in
the
pas
t se
ven
days
, w
ho w
ere
give
n de
wor
min
g m
edic
atio
n in
the
six
mon
ths
prec
edin
g th
e su
rvey
, an
d w
ho li
ve i
n ho
useh
old
s us
ing
iodi
zed
salt,
by
back
grou
nd c
hara
cter
istic
s,
Assa
m, 2
015-
16, a
nd to
tal f
or N
FHS-
3
Back
grou
nd c
hara
cter
istic
Youn
gest
chi
ldre
n ag
e 9-
23 m
onth
s
livin
g w
ith th
eir m
othe
r
Chi
ldre
n ag
e 9-
59 m
onth
s
Chi
ldre
n ag
e 6-
59 m
onth
s ]]
Chi
ldre
n ag
e 6-
59 m
onth
s in
ho
useh
olds
with
sal
t tes
ted
Perc
enta
ge w
ho
cons
umed
food
s ric
h in
vita
min
A
in p
ast 2
4 ho
urs1
Perc
enta
ge w
ho
cons
umed
food
s ric
h in
iron
in
pas
t 24
hour
s2
Num
ber
of
child
ren
Perc
enta
ge
give
n vi
tam
in A
su
pple
men
ts in
pa
st 6
mon
ths
Num
ber
of
child
ren
Perc
enta
ge
give
n iro
n su
pple
men
ts
in p
ast 7
day
s
Perc
enta
ge g
iven
de
wor
min
g m
edic
atio
n in
pa
st 6
mon
ths3
Num
ber
of
child
ren
Perc
enta
ge
livin
g in
ho
useh
olds
usin
g io
dize
d sa
lt4
Num
ber
of
child
ren
Mot
her's
sch
oolin
g
N
o sc
hool
ing
62
.3
35.7
52
2 44
.4
2,03
7 17
.5
25.3
2,
119
99.3
2,
174
<5
year
s co
mpl
ete
60
.7
28.1
27
2 46
.0
1,04
6 20
.2
26.4
1,
092
99.8
1,
121
5-9
year
s co
mpl
ete
56
.6
26.2
1,
024
52.7
3,
470
20.7
32
.0
3,64
9 99
.5
3,70
6 10
-11
year
s co
mpl
ete
58
.7
29.9
22
0 57
.2
726
23.8
34
.4
767
99.9
77
9 12
or m
ore
year
s co
mpl
ete
57
.2
31.3
33
3 62
.4
1,02
4 23
.5
34.4
1,
079
99.9
1,
124
Relig
ion
H
indu
61
.1
27.5
1,
277
55.1
4,
416
20.1
30
.3
4,62
5 99
.8
4,74
7 M
uslim
54
.3
31.7
1,
019
46.3
3,
585
20.2
29
.3
3,75
6 99
.4
3,92
1 C
hrist
ian
74
.9
35.1
71
58
.3
276
27.8
38
.7
298
99.7
31
9 O
ther
*
* 5
(47.
4)
26
(28.
6)
(37.
6)
27
* 23
Cas
te/tr
ibe
Sc
hedu
led
cast
e
59.8
22
.4
236
57.1
79
0 24
.1
34.2
81
9 99
.7
875
Sche
dule
d tri
be
69.5
35
.7
296
52.5
1,
070
19.3
31
.5
1,12
4 99
.9
1,13
3 O
ther
bac
kwar
d cl
ass
60
.9
27.2
55
7 55
.3
1,88
5 20
.5
29.0
1,
971
99.7
2,
055
Oth
er
54.8
30
.5
1,25
7 48
.6
4,48
2 20
.3
29.8
4,
708
99.5
4,
865
Don
't kn
ow
(61.
6)
(28.
2)
25
45.6
75
8.
1 21
.9
83
100.
0 83
Tota
l 58
.6
29.6
2,
371
51.4
8,
303
20.5
30
.2
8,70
6 99
.6
9,01
1
NFH
S-3
(200
5-06
) 49
.3
20.7
34
0 12
.2
1,26
9 0.
8 15
.0
1,33
9 95
.9
1,42
6
Not
e: In
form
atio
n on
iron
sup
plem
ents
and
dew
orm
ing
med
icat
ion
is ba
sed
on th
e m
othe
r's re
call.
Info
rmat
ion
on v
itam
in A
sup
plem
enta
tion
is ba
sed
on th
e va
ccin
atio
n ca
rd (w
here
ava
ilabl
e) a
nd
mot
her's
reca
ll.
na =
Not
app
licab
le
1 In
clud
es m
eat a
nd o
rgan
mea
ts, f
ish, p
oultr
y, e
ggs,
pum
pkin
, car
rots
, squ
ash,
and
sw
eet p
otat
oes
that
are
yel
low
or o
rang
e in
side,
dar
k gr
een
leaf
y ve
geta
bles
, rip
e m
ango
, pap
aya,
can
talo
upe,
and
ja
ckfru
it 2 I
nclu
des
mea
t and
org
an m
eats
, fish
, pou
ltry,
or e
ggs
3 Dew
orm
ing
for i
ntes
tinal
wor
ms
4 Ex
clud
es c
hild
ren
in h
ouse
hold
s in
whi
ch s
alt
was
not
tes
ted.
Inc
lude
s ch
ildre
n w
hose
mot
hers
wer
e no
t in
terv
iew
ed e
xcep
t fo
r bi
rth o
rder
, br
east
feed
ing
stat
us,
s ar
e no
t list
ed in
the
hous
ehol
d sc
hedu
le
( ) B
ased
on
25-4
9 un
wei
ghte
d ca
ses
* Pe
rcen
tage
not
sho
wn;
bas
ed o
n fe
wer
than
25
unw
eigh
ted
case
s
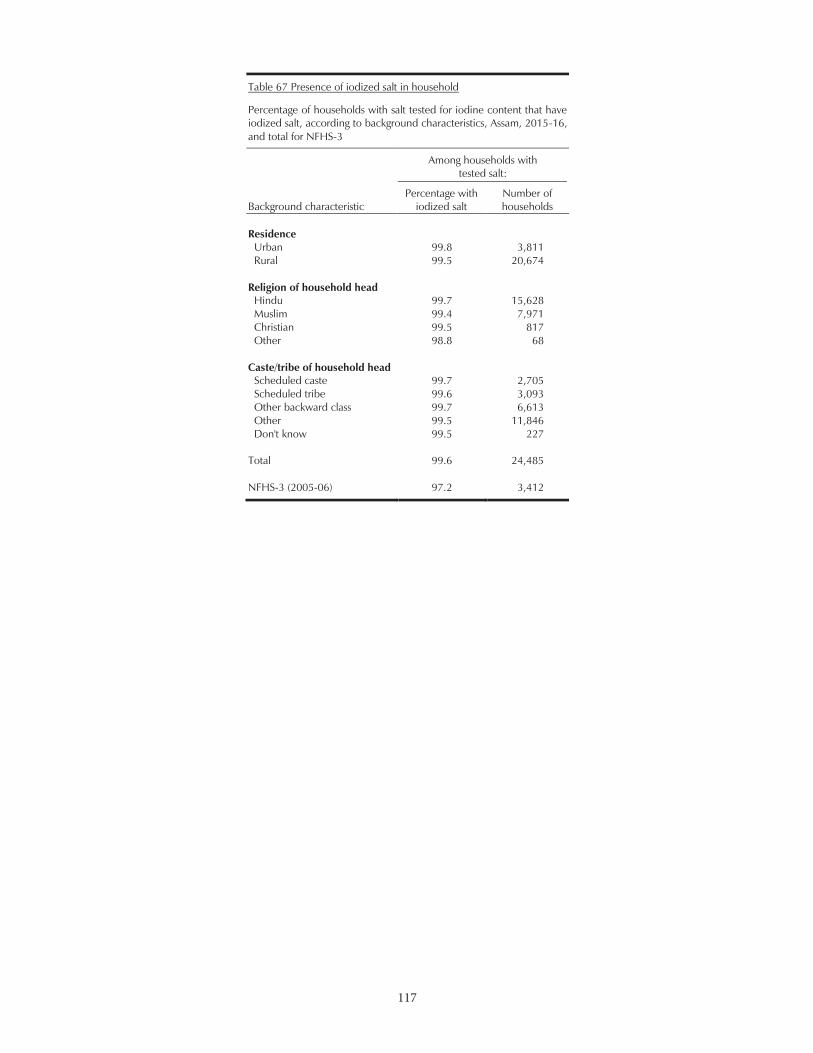
117
117
Table 67 Presence of iodized salt in household
Percentage of households with salt tested for iodine content that have iodized salt, according to background characteristics, Assam, 2015-16, and total for NFHS-3
Background characteristic
Among households with tested salt:
Percentage with iodized salt
Number of households
Residence
Urban 99.8 3,811 Rural 99.5 20,674
Religion of household head Hindu 99.7 15,628 Muslim 99.4 7,971 Christian 99.5 817 Other 98.8 68
Caste/tribe of household head Scheduled caste 99.7 2,705 Scheduled tribe 99.6 3,093 Other backward class 99.7 6,613 Other 99.5 11,846 Don't know 99.5 227
Total 99.6 24,485 NFHS-3 (2005-06) 97.2 3,412
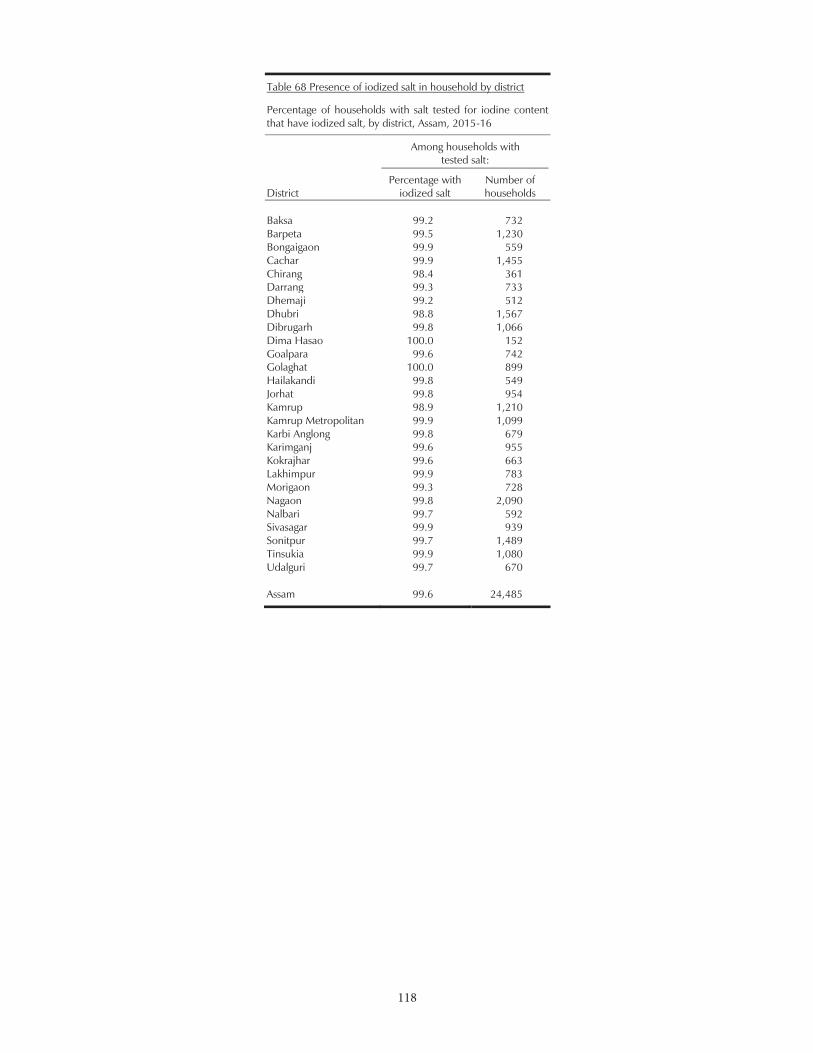
118
118
Table 68 Presence of iodized salt in household by district
Percentage of households with salt tested for iodine content that have iodized salt, by district, Assam, 2015-16
District
Among households with tested salt:
Percentage with iodized salt
Number of households
Baksa 99.2 732 Barpeta 99.5 1,230 Bongaigaon 99.9 559 Cachar 99.9 1,455 Chirang 98.4 361 Darrang 99.3 733 Dhemaji 99.2 512 Dhubri 98.8 1,567 Dibrugarh 99.8 1,066 Dima Hasao 100.0 152 Goalpara 99.6 742 Golaghat 100.0 899 Hailakandi 99.8 549 Jorhat 99.8 954 Kamrup 98.9 1,210 Kamrup Metropolitan 99.9 1,099 Karbi Anglong 99.8 679 Karimganj 99.6 955 Kokrajhar 99.6 663 Lakhimpur 99.9 783 Morigaon 99.3 728 Nagaon 99.8 2,090 Nalbari 99.7 592 Sivasagar 99.9 939 Sonitpur 99.7 1,489 Tinsukia 99.9 1,080 Udalguri 99.7 670 Assam 99.6 24,485
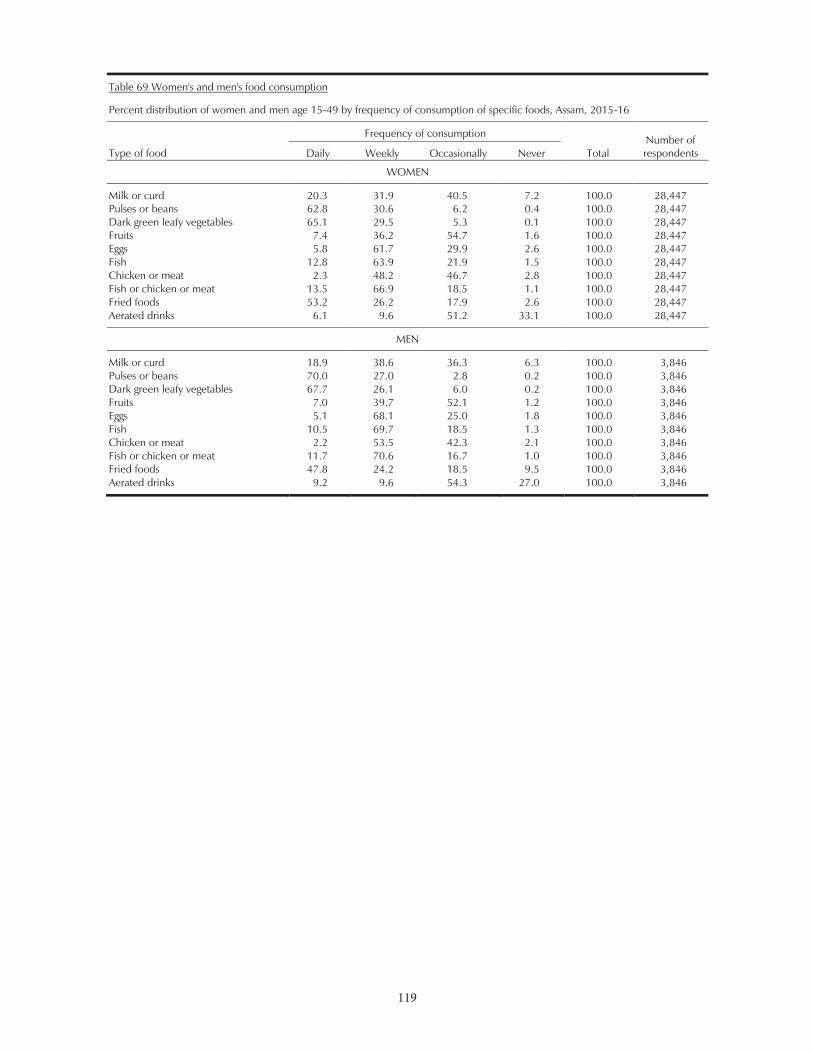
119
119
Table 69 Women's and men's food consumption
Percent distribution of women and men age 15-49 by frequency of consumption of specific foods, Assam, 2015-16
Type of food
Frequency of consumption
Total Number of respondents Daily Weekly Occasionally Never
WOMEN
Milk or curd 20.3 31.9 40.5 7.2 100.0 28,447 Pulses or beans 62.8 30.6 6.2 0.4 100.0 28,447 Dark green leafy vegetables 65.1 29.5 5.3 0.1 100.0 28,447 Fruits 7.4 36.2 54.7 1.6 100.0 28,447 Eggs 5.8 61.7 29.9 2.6 100.0 28,447 Fish 12.8 63.9 21.9 1.5 100.0 28,447 Chicken or meat 2.3 48.2 46.7 2.8 100.0 28,447 Fish or chicken or meat 13.5 66.9 18.5 1.1 100.0 28,447 Fried foods 53.2 26.2 17.9 2.6 100.0 28,447 Aerated drinks 6.1 9.6 51.2 33.1 100.0 28,447
MEN
Milk or curd 18.9 38.6 36.3 6.3 100.0 3,846 Pulses or beans 70.0 27.0 2.8 0.2 100.0 3,846 Dark green leafy vegetables 67.7 26.1 6.0 0.2 100.0 3,846 Fruits 7.0 39.7 52.1 1.2 100.0 3,846 Eggs 5.1 68.1 25.0 1.8 100.0 3,846 Fish 10.5 69.7 18.5 1.3 100.0 3,846 Chicken or meat 2.2 53.5 42.3 2.1 100.0 3,846 Fish or chicken or meat 11.7 70.6 16.7 1.0 100.0 3,846 Fried foods 47.8 24.2 18.5 9.5 100.0 3,846 Aerated drinks 9.2 9.6 54.3 27.0 100.0 3,846
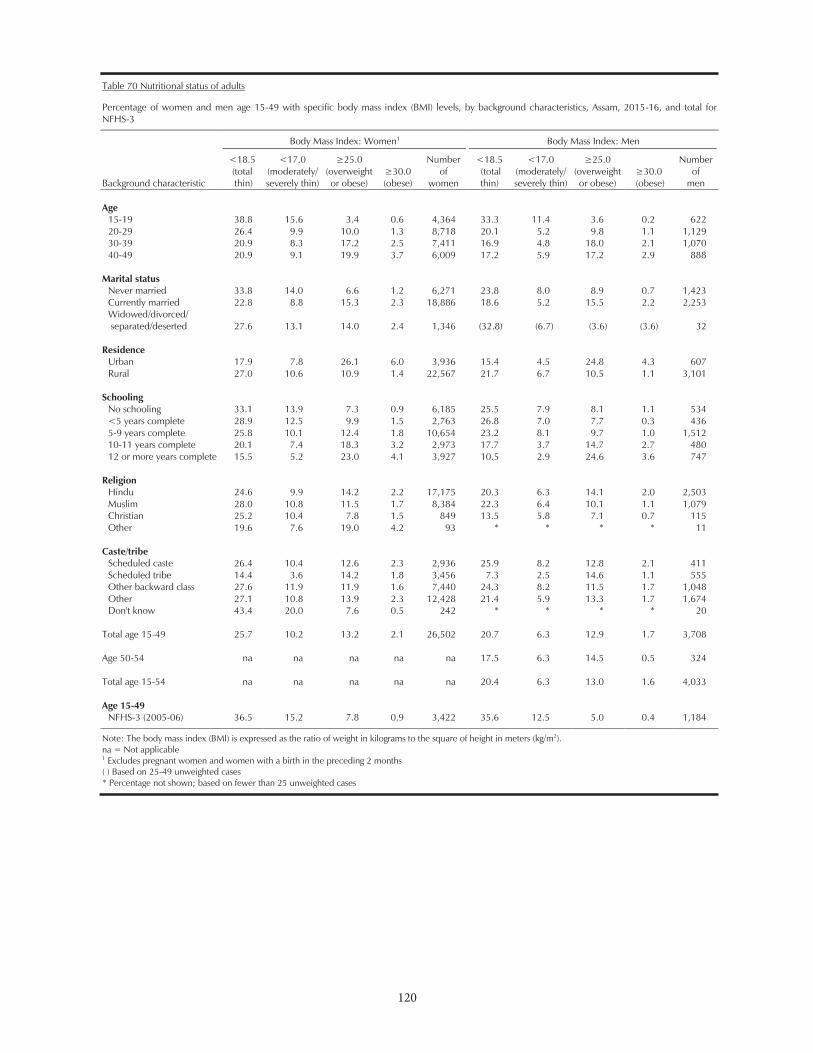
120
120
Table 70 Nutritional status of adults
Percentage of women and men age 15-49 with specific body mass index (BMI) levels, by background characteristics, Assam, 2015-16, and total for NFHS-3
Background characteristic
Body Mass Index: Women1
Body Mass Index: Men
<18.5 (total thin)
<17.0 (moderately/ severely thin)
(overweight or obese) (obese)
Number of
women
<18.5 (total thin)
<17.0 (moderately/ severely thin)
(overweight or obese)
(obese)
Number of
men Age
15-19 38.8 15.6 3.4 0.6 4,364 33.3 11.4 3.6 0.2 622 20-29 26.4 9.9 10.0 1.3 8,718 20.1 5.2 9.8 1.1 1,129 30-39 20.9 8.3 17.2 2.5 7,411 16.9 4.8 18.0 2.1 1,070 40-49 20.9 9.1 19.9 3.7 6,009 17.2 5.9 17.2 2.9 888
Marital status Never married 33.8 14.0 6.6 1.2 6,271 23.8 8.0 8.9 0.7 1,423 Currently married 22.8 8.8 15.3 2.3 18,886 18.6 5.2 15.5 2.2 2,253 Widowed/divorced/ separated/deserted 27.6 13.1 14.0 2.4 1,346 (32.8) (6.7) (3.6) (3.6) 32
Residence Urban 17.9 7.8 26.1 6.0 3,936 15.4 4.5 24.8 4.3 607 Rural 27.0 10.6 10.9 1.4 22,567 21.7 6.7 10.5 1.1 3,101
Schooling No schooling 33.1 13.9 7.3 0.9 6,185 25.5 7.9 8.1 1.1 534 <5 years complete 28.9 12.5 9.9 1.5 2,763 26.8 7.0 7.7 0.3 436 5-9 years complete 25.8 10.1 12.4 1.8 10,654 23.2 8.1 9.7 1.0 1,512 10-11 years complete 20.1 7.4 18.3 3.2 2,973 17.7 3.7 14.7 2.7 480 12 or more years complete 15.5 5.2 23.0 4.1 3,927 10.5 2.9 24.6 3.6 747
Religion Hindu 24.6 9.9 14.2 2.2 17,175 20.3 6.3 14.1 2.0 2,503 Muslim 28.0 10.8 11.5 1.7 8,384 22.3 6.4 10.1 1.1 1,079 Christian 25.2 10.4 7.8 1.5 849 13.5 5.8 7.1 0.7 115 Other 19.6 7.6 19.0 4.2 93 * * * * 11
Caste/tribe Scheduled caste 26.4 10.4 12.6 2.3 2,936 25.9 8.2 12.8 2.1 411 Scheduled tribe 14.4 3.6 14.2 1.8 3,456 7.3 2.5 14.6 1.1 555 Other backward class 27.6 11.9 11.9 1.6 7,440 24.3 8.2 11.5 1.7 1,048 Other 27.1 10.8 13.9 2.3 12,428 21.4 5.9 13.3 1.7 1,674 Don't know 43.4 20.0 7.6 0.5 242 * * * * 20
Total age 15-49 25.7 10.2 13.2 2.1 26,502 20.7 6.3 12.9 1.7 3,708 Age 50-54 na na na na na 17.5 6.3 14.5 0.5 324 Total age 15-54 na na na na na 20.4 6.3 13.0 1.6 4,033 Age 15-49
NFHS-3 (2005-06) 36.5 15.2 7.8 0.9 3,422 35.6 12.5 5.0 0.4 1,184
Note: The body mass index (BMI) is expressed as the ratio of weight in kilograms to the square of height in meters (kg/m2). na = Not applicable 1 Excludes pregnant women and women with a birth in the preceding 2 months ( ) Based on 25-49 unweighted cases * Percentage not shown; based on fewer than 25 unweighted cases
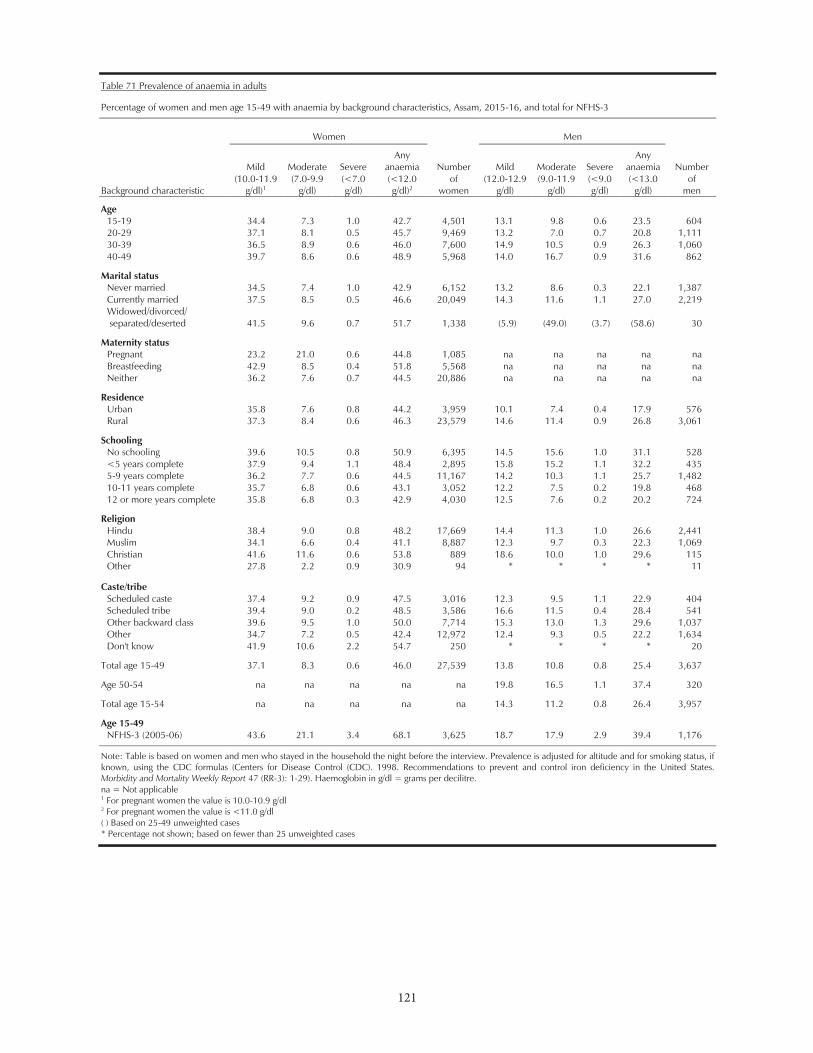
121
121
Table 71 Prevalence of anaemia in adults
Percentage of women and men age 15-49 with anaemia by background characteristics, Assam, 2015-16, and total for NFHS-3
Background characteristic
Women
Number of
women
Men
Number of
men
Mild (10.0-11.9
g/dl)1
Moderate (7.0-9.9
g/dl)
Severe (<7.0 g/dl)
Any anaemia (<12.0 g/dl)2
Mild (12.0-12.9
g/dl)
Moderate (9.0-11.9
g/dl)
Severe (<9.0 g/dl)
Any anaemia (<13.0
g/dl)
Age 15-19 34.4 7.3 1.0 42.7 4,501 13.1 9.8 0.6 23.5 604 20-29 37.1 8.1 0.5 45.7 9,469 13.2 7.0 0.7 20.8 1,111 30-39 36.5 8.9 0.6 46.0 7,600 14.9 10.5 0.9 26.3 1,060 40-49 39.7 8.6 0.6 48.9 5,968 14.0 16.7 0.9 31.6 862
Marital status Never married 34.5 7.4 1.0 42.9 6,152 13.2 8.6 0.3 22.1 1,387 Currently married 37.5 8.5 0.5 46.6 20,049 14.3 11.6 1.1 27.0 2,219 Widowed/divorced/ separated/deserted 41.5 9.6 0.7 51.7 1,338 (5.9) (49.0) (3.7) (58.6) 30
Maternity status Pregnant 23.2 21.0 0.6 44.8 1,085 na na na na na Breastfeeding 42.9 8.5 0.4 51.8 5,568 na na na na na Neither 36.2 7.6 0.7 44.5 20,886 na na na na na
Residence Urban 35.8 7.6 0.8 44.2 3,959 10.1 7.4 0.4 17.9 576 Rural 37.3 8.4 0.6 46.3 23,579 14.6 11.4 0.9 26.8 3,061
Schooling No schooling 39.6 10.5 0.8 50.9 6,395 14.5 15.6 1.0 31.1 528 <5 years complete 37.9 9.4 1.1 48.4 2,895 15.8 15.2 1.1 32.2 435 5-9 years complete 36.2 7.7 0.6 44.5 11,167 14.2 10.3 1.1 25.7 1,482 10-11 years complete 35.7 6.8 0.6 43.1 3,052 12.2 7.5 0.2 19.8 468 12 or more years complete 35.8 6.8 0.3 42.9 4,030 12.5 7.6 0.2 20.2 724
Religion Hindu 38.4 9.0 0.8 48.2 17,669 14.4 11.3 1.0 26.6 2,441 Muslim 34.1 6.6 0.4 41.1 8,887 12.3 9.7 0.3 22.3 1,069 Christian 41.6 11.6 0.6 53.8 889 18.6 10.0 1.0 29.6 115 Other 27.8 2.2 0.9 30.9 94 * * * * 11
Caste/tribe Scheduled caste 37.4 9.2 0.9 47.5 3,016 12.3 9.5 1.1 22.9 404 Scheduled tribe 39.4 9.0 0.2 48.5 3,586 16.6 11.5 0.4 28.4 541 Other backward class 39.6 9.5 1.0 50.0 7,714 15.3 13.0 1.3 29.6 1,037 Other 34.7 7.2 0.5 42.4 12,972 12.4 9.3 0.5 22.2 1,634 Don't know 41.9 10.6 2.2 54.7 250 * * * * 20
Total age 15-49 37.1 8.3 0.6 46.0 27,539 13.8 10.8 0.8 25.4 3,637
Age 50-54 na na na na na 19.8 16.5 1.1 37.4 320
Total age 15-54 na na na na na 14.3 11.2 0.8 26.4 3,957
Age 15-49 NFHS-3 (2005-06) 43.6 21.1 3.4 68.1 3,625 18.7 17.9 2.9 39.4 1,176
Note: Table is based on women and men who stayed in the household the night before the interview. Prevalence is adjusted for altitude and for smoking status, if known, using the CDC formulas (Centers for Disease Control (CDC). 1998. Recommendations to prevent and control iron deficiency in the United States. Morbidity and Mortality Weekly Report 47 (RR-3): 1-29). Haemoglobin in g/dl = grams per decilitre. na = Not applicable 1 For pregnant women the value is 10.0-10.9 g/dl 2 For pregnant women the value is <11.0 g/dl ( ) Based on 25-49 unweighted cases * Percentage not shown; based on fewer than 25 unweighted cases
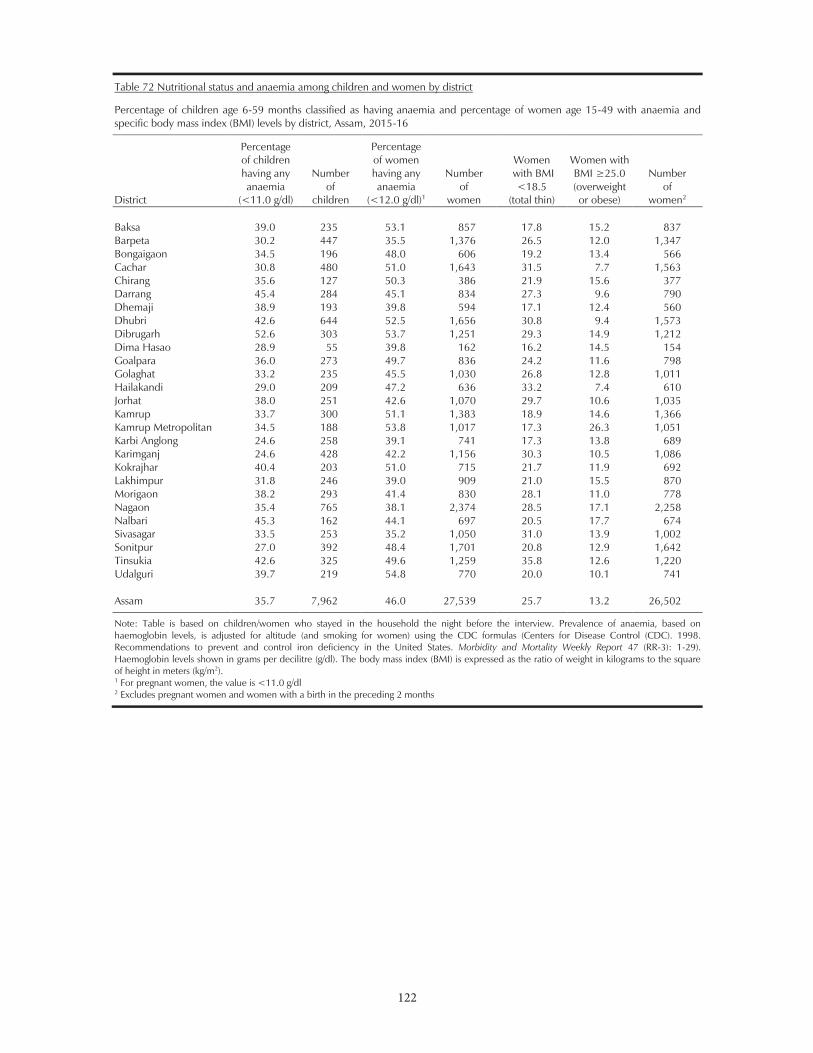
122
122
Table 72 Nutritional status and anaemia among children and women by district
Percentage of children age 6-59 months classified as having anaemia and percentage of women age 15-49 with anaemia and specific body mass index (BMI) levels by district, Assam, 2015-16
District
Percentage of children having any anaemia
(<11.0 g/dl)
Number of
children
Percentage of women having any anaemia
(<12.0 g/dl)1
Number of
women
Women with BMI
<18.5 (total thin)
Women with
(overweight or obese)
Number of
women2 Baksa 39.0 235 53.1 857 17.8 15.2 837 Barpeta 30.2 447 35.5 1,376 26.5 12.0 1,347 Bongaigaon 34.5 196 48.0 606 19.2 13.4 566 Cachar 30.8 480 51.0 1,643 31.5 7.7 1,563 Chirang 35.6 127 50.3 386 21.9 15.6 377 Darrang 45.4 284 45.1 834 27.3 9.6 790 Dhemaji 38.9 193 39.8 594 17.1 12.4 560 Dhubri 42.6 644 52.5 1,656 30.8 9.4 1,573 Dibrugarh 52.6 303 53.7 1,251 29.3 14.9 1,212 Dima Hasao 28.9 55 39.8 162 16.2 14.5 154 Goalpara 36.0 273 49.7 836 24.2 11.6 798 Golaghat 33.2 235 45.5 1,030 26.8 12.8 1,011 Hailakandi 29.0 209 47.2 636 33.2 7.4 610 Jorhat 38.0 251 42.6 1,070 29.7 10.6 1,035 Kamrup 33.7 300 51.1 1,383 18.9 14.6 1,366 Kamrup Metropolitan 34.5 188 53.8 1,017 17.3 26.3 1,051 Karbi Anglong 24.6 258 39.1 741 17.3 13.8 689 Karimganj 24.6 428 42.2 1,156 30.3 10.5 1,086 Kokrajhar 40.4 203 51.0 715 21.7 11.9 692 Lakhimpur 31.8 246 39.0 909 21.0 15.5 870 Morigaon 38.2 293 41.4 830 28.1 11.0 778 Nagaon 35.4 765 38.1 2,374 28.5 17.1 2,258 Nalbari 45.3 162 44.1 697 20.5 17.7 674 Sivasagar 33.5 253 35.2 1,050 31.0 13.9 1,002 Sonitpur 27.0 392 48.4 1,701 20.8 12.9 1,642 Tinsukia 42.6 325 49.6 1,259 35.8 12.6 1,220 Udalguri 39.7 219 54.8 770 20.0 10.1 741 Assam 35.7 7,962 46.0 27,539 25.7 13.2 26,502
Note: Table is based on children/women who stayed in the household the night before the interview. Prevalence of anaemia, based on haemoglobin levels, is adjusted for altitude (and smoking for women) using the CDC formulas (Centers for Disease Control (CDC). 1998. Recommendations to prevent and control iron deficiency in the United States. Morbidity and Mortality Weekly Report 47 (RR-3): 1-29). Haemoglobin levels shown in grams per decilitre (g/dl). The body mass index (BMI) is expressed as the ratio of weight in kilograms to the square of height in meters (kg/m2). 1 For pregnant women, the value is <11.0 g/dl 2 Excludes pregnant women and women with a birth in the preceding 2 months
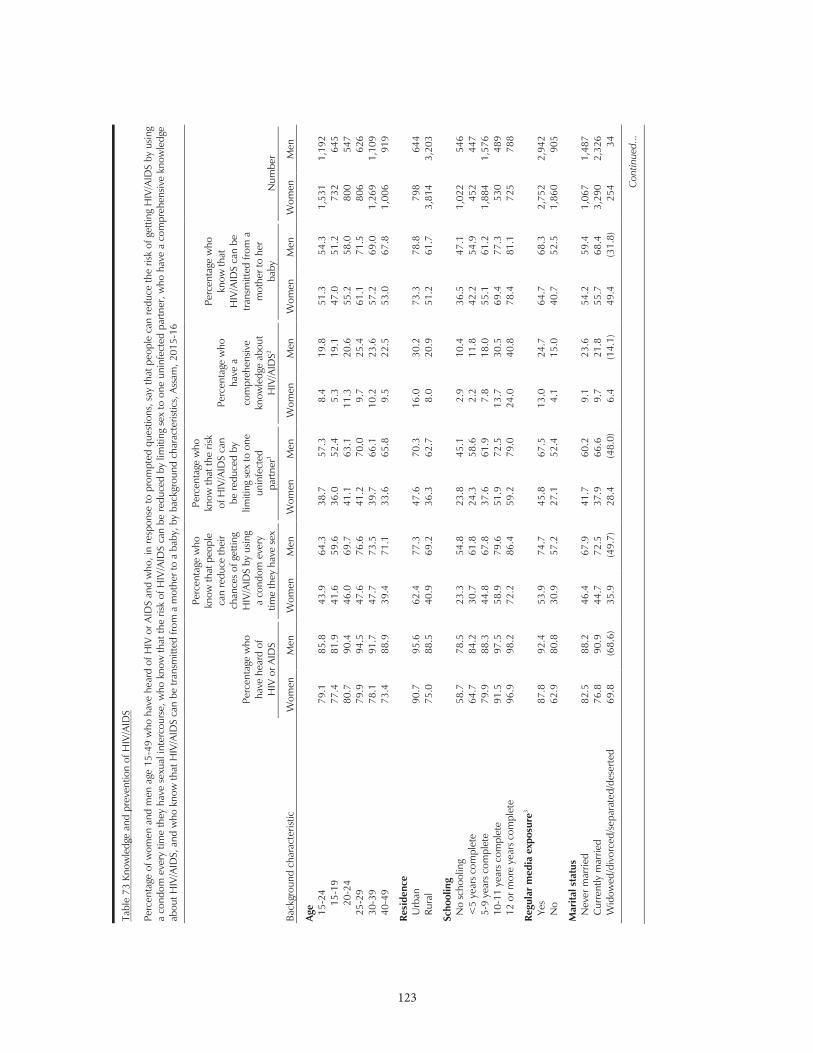
123
123
Tabl
e 73
Kno
wle
dge
and
prev
entio
n of
HIV
/AID
S
Perc
enta
ge o
f wom
en a
nd m
en a
ge 1
5-49
who
hav
e he
ard
of H
IV o
r AID
S an
d w
ho, i
n re
spon
se to
pro
mpt
ed q
uest
ions
, say
that
peo
ple
can
redu
ce th
e ris
k of
get
ting
HIV
/AID
S by
usin
g a
cond
om e
very
tim
e th
ey h
ave
sexu
al in
terc
ours
e, w
ho k
now
that
the
risk
of H
IV/A
IDS
can
be re
duce
d by
lim
iting
sex
to o
ne u
ninf
ecte
d pa
rtner
, who
hav
e a
com
preh
ensiv
e kn
owle
dge
abou
t HIV
/AID
S, a
nd w
ho k
now
that
HIV
/AID
S ca
n be
tran
smitt
ed fr
om a
mot
her t
o a
baby
, by
back
grou
nd c
hara
cter
istic
s, A
ssam
, 201
5-16
Back
grou
nd c
hara
cter
istic
Perc
enta
ge w
ho
have
hea
rd o
f H
IV o
r AID
S
Perc
enta
ge w
ho
know
that
peo
ple
can
redu
ce th
eir
chan
ces
of g
ettin
g H
IV/A
IDS
by u
sing
a co
ndom
eve
ry
time
they
hav
e se
x
Perc
enta
ge w
ho
know
that
the
risk
of H
IV/A
IDS
can
be re
duce
d by
lim
iting
sex
to o
ne
unin
fect
ed
partn
er1
Perc
enta
ge w
ho
have
a
com
preh
ensiv
e kn
owle
dge
abou
t H
IV/A
IDS2
Perc
enta
ge w
ho
know
that
H
IV/A
IDS
can
be
trans
mitt
ed fr
om a
m
othe
r to
her
baby
Num
ber
Wom
en
Men
W
omen
M
en
Wom
en
Men
W
omen
M
en
Wom
en
Men
W
omen
M
en
Age
15-2
4
79.1
85
.8
43.9
64
.3
38.7
57
.3
8.4
19.8
51
.3
54.3
1,
531
1,19
2 15
-19
77
.4
81.9
41
.6
59.6
36
.0
52.4
5.
3 19
.1
47.0
51
.2
732
645
20-2
4
80.7
90
.4
46.0
69
.7
41.1
63
.1
11.3
20
.6
55.2
58
.0
800
547
25-2
9
79.9
94
.5
47.6
76
.6
41.2
70
.0
9.7
25.4
61
.1
71.5
80
6 62
6 30
-39
78
.1
91.7
47
.7
73.5
39
.7
66.1
10
.2
23.6
57
.2
69.0
1,
269
1,10
9 40
-49
73
.4
88.9
39
.4
71.1
33
.6
65.8
9.
5 22
.5
53.0
67
.8
1,00
6 91
9
Resi
denc
e
U
rban
90
.7
95.6
62
.4
77.3
47
.6
70.3
16
.0
30.2
73
.3
78.8
79
8 64
4 Ru
ral
75.0
88
.5
40.9
69
.2
36.3
62
.7
8.0
20.9
51
.2
61.7
3,
814
3,20
3
Scho
olin
g
N
o sc
hool
ing
58
.7
78.5
23
.3
54.8
23
.8
45.1
2.
9 10
.4
36.5
47
.1
1,02
2 54
6 <
5 ye
ars
com
plet
e
64.7
84
.2
30.7
61
.8
24.3
58
.6
2.2
11.8
42
.2
54.9
45
2 44
7 5-
9 ye
ars
com
plet
e
79.9
88
.3
44.8
67
.8
37.6
61
.9
7.8
18.0
55
.1
61.2
1,
884
1,57
6 10
-11
year
s co
mpl
ete
91
.5
97.5
58
.9
79.6
51
.9
72.5
13
.7
30.5
69
.4
77.3
53
0 48
9 12
or m
ore
year
s co
mpl
ete
96
.9
98.2
72
.2
86.4
59
.2
79.0
24
.0
40.8
78
.4
81.1
72
5 78
8
Regu
lar
med
ia e
xpos
ure3
Yes
87
.8
92.4
53
.9
74.7
45
.8
67.5
13
.0
24.7
64
.7
68.3
2,
752
2,94
2 N
o
62.9
80
.8
30.9
57
.2
27.1
52
.4
4.1
15.0
40
.7
52.5
1,
860
905
Mar
ital s
tatu
s
N
ever
mar
ried
82
.5
88.2
46
.4
67.9
41
.7
60.2
9.
1 23
.6
54.2
59
.4
1,06
7 1,
487
Cur
rent
ly m
arrie
d
76.8
90
.9
44.7
72
.5
37.9
66
.6
9.7
21.8
55
.7
68.4
3,
290
2,32
6 W
idow
ed/d
ivor
ced/
sepa
rate
d/de
sert
ed
69.8
(6
8.6)
35
.9
(49.
7)
28.4
(4
8.0)
6.
4 (1
4.1)
49
.4
(31.
8)
254
34
Con
tinue
d...
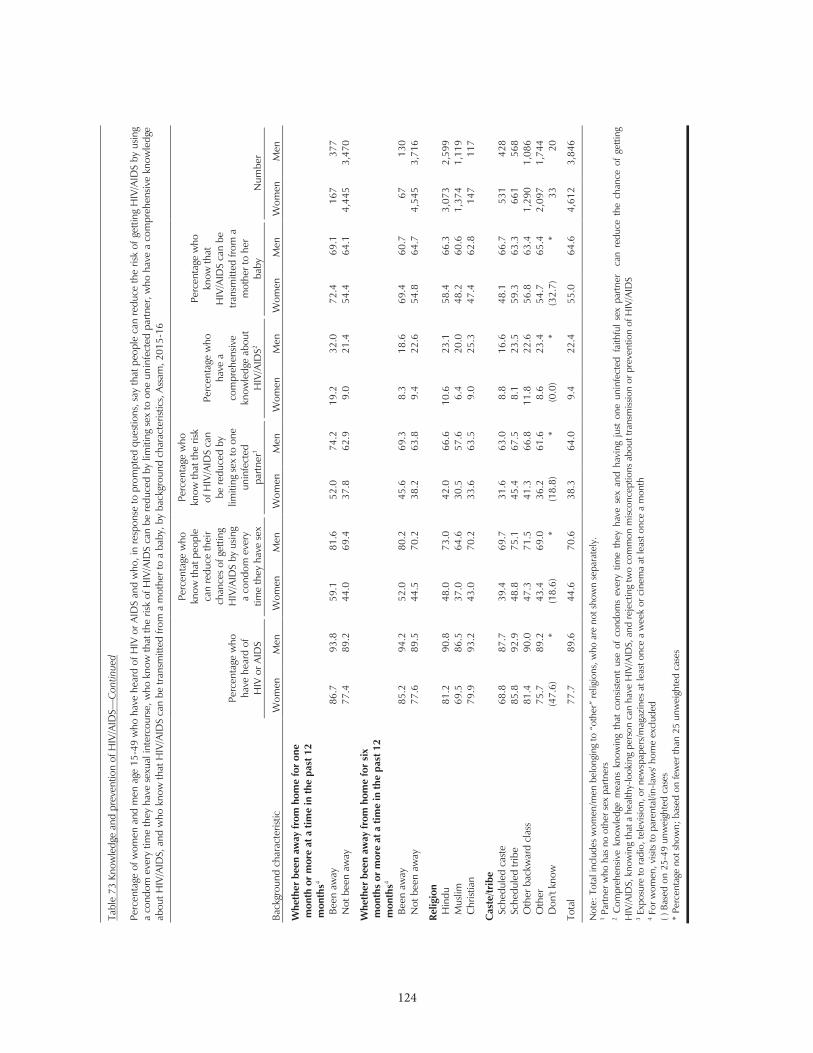
124
124
Tabl
e 73
Kno
wle
dge
and
prev
entio
n of
HIV
/AID
S—C
ontin
ued
Perc
enta
ge o
f wom
en a
nd m
en a
ge 1
5-49
who
hav
e he
ard
of H
IV o
r AID
S an
d w
ho, i
n re
spon
se to
pro
mpt
ed q
uest
ions
, say
that
peo
ple
can
redu
ce th
e ris
k of
get
ting
HIV
/AID
S by
usin
g a
cond
om e
very
tim
e th
ey h
ave
sexu
al in
terc
ours
e, w
ho k
now
that
the
risk
of H
IV/A
IDS
can
be re
duce
d by
lim
iting
sex
to o
ne u
ninf
ecte
d pa
rtner
, who
hav
e a
com
preh
ensiv
e kn
owle
dge
abou
t HIV
/AID
S, a
nd w
ho k
now
that
HIV
/AID
S ca
n be
tran
smitt
ed fr
om a
mot
her t
o a
baby
, by
back
grou
nd c
hara
cter
istic
s, A
ssam
, 201
5-16
Back
grou
nd c
hara
cter
istic
Perc
enta
ge w
ho
have
hea
rd o
f H
IV o
r AID
S
Perc
enta
ge w
ho
know
that
peo
ple
can
redu
ce th
eir
chan
ces
of g
ettin
g H
IV/A
IDS
by u
sing
a co
ndom
eve
ry
time
they
hav
e se
x
Perc
enta
ge w
ho
know
that
the
risk
of H
IV/A
IDS
can
be re
duce
d by
lim
iting
sex
to o
ne
unin
fect
ed
partn
er1
Perc
enta
ge w
ho
have
a
com
preh
ensiv
e kn
owle
dge
abou
t H
IV/A
IDS2
Perc
enta
ge w
ho
know
that
H
IV/A
IDS
can
be
trans
mitt
ed fr
om a
m
othe
r to
her
baby
Num
ber
Wom
en
Men
W
omen
M
en
Wom
en
Men
W
omen
M
en
Wom
en
Men
W
omen
M
en
Whe
ther
bee
n aw
ay fr
om h
ome
for
one
mon
th o
r m
ore
at a
tim
e in
the
past
12
mon
ths4
Been
aw
ay
86.7
93
.8
59.1
81
.6
52.0
74
.2
19.2
32
.0
72.4
69
.1
167
377
Not
bee
n aw
ay
77.4
89
.2
44.0
69
.4
37.8
62
.9
9.0
21.4
54
.4
64.1
4,
445
3,47
0
Whe
ther
bee
n aw
ay fr
om h
ome
for
six
mon
ths
or m
ore
at a
tim
e in
the
past
12
mon
ths4
Been
aw
ay
85.2
94
.2
52.0
80
.2
45.6
69
.3
8.3
18.6
69
.4
60.7
67
13
0 N
ot b
een
away
77
.6
89.5
44
.5
70.2
38
.2
63.8
9.
4 22
.6
54.8
64
.7
4,54
5 3,
716
Relig
ion
Hin
du
81.2
90
.8
48.0
73
.0
42.0
66
.6
10.6
23
.1
58.4
66
.3
3,07
3 2,
599
Mus
lim
69.5
86
.5
37.0
64
.6
30.5
57
.6
6.4
20.0
48
.2
60.6
1,
374
1,11
9 C
hrist
ian
79
.9
93.2
43
.0
70.2
33
.6
63.5
9.
0 25
.3
47.4
62
.8
147
117
Cas
te/tr
ibe
Sche
dule
d ca
ste
68
.8
87.7
39
.4
69.7
31
.6
63.0
8.
8 16
.6
48.1
66
.7
531
428
Sche
dule
d tri
be
85.8
92
.9
48.8
75
.1
45.4
67
.5
8.1
23.5
59
.3
63.3
66
1 56
8 O
ther
bac
kwar
d cl
ass
81
.4
90.0
47
.3
71.5
41
.3
66.8
11
.8
22.6
56
.8
63.4
1,
290
1,08
6 O
ther
75
.7
89.2
43
.4
69.0
36
.2
61.6
8.
6 23
.4
54.7
65
.4
2,09
7 1,
744
Don
't kn
ow
(47.
6)
* (1
8.6)
*
(18.
8)
* (0
.0)
* (3
2.7)
*
33
20
Tota
l 77
.7
89.6
44
.6
70.6
38
.3
64.0
9.
4 22
.4
55.0
64
.6
4,61
2 3,
846
Not
e:
1 P
artn
er w
ho h
as n
o ot
her s
ex p
artn
ers
2 C
ompr
ehen
sive
know
ledg
e m
eans
kno
win
g th
at c
onsis
tent
use
of
cond
oms
ever
y tim
e th
ey h
ave
sex
and
havi
ng j
ust
one
unin
fect
ed f
aith
ful
sex
partn
er
can
redu
ce t
he c
hanc
e of
get
ting
HIV
/AID
S, k
now
ing
that
a h
ealth
y-lo
okin
g pe
rson
can
hav
e H
IV/A
IDS,
and
reje
ctin
g tw
o co
mm
on m
iscon
cept
ions
abo
ut tr
ansm
issio
n or
pre
vent
ion
of H
IV/A
IDS
3 Exp
osur
e to
radi
o, te
levi
sion,
or n
ewsp
aper
s/m
agaz
ines
at l
east
onc
e a
wee
k or
cin
ema
at le
ast o
nce
a m
onth
4 F
or w
omen
, visi
ts to
par
enta
l/in-
law
s' ho
me
excl
uded
( )
Bas
ed o
n 25
-49
unw
eigh
ted
case
s *
Perc
enta
ge n
ot s
how
n; b
ased
on
few
er th
an 2
5 un
wei
ghte
d ca
ses

125
125
Tabl
e 74
Acc
eptin
g at
titud
es to
war
d th
ose
livin
g w
ith H
IV/A
IDS
Amon
g w
omen
and
men
age
15-
49 w
ho h
ave
hear
d of
HIV
/AID
S, p
erce
ntag
e ex
pres
sing
spec
ific
acce
ptin
g at
titud
es to
war
d pe
ople
with
HIV
/AID
S, b
y ba
ckgr
ound
cha
ract
erist
ics,
Ass
am, 2
015-
16
Back
grou
nd c
hara
cter
istic
Perc
enta
ge o
f wom
en w
ho:
Num
ber
of w
omen
w
ho h
ave
hear
d of
H
IV/ A
IDS
Perc
enta
ge o
f men
who
:
Num
ber
of m
en
who
hav
e he
ard
of
HIV
/AID
S
Are
will
ing
to
car
e fo
r a
rela
tive
w
ith
HIV
/AID
S
in o
wn
hom
e
Wou
ld b
uy
fresh
ve
geta
bles
fro
m a
sh
opke
eper
or
vend
or w
ho
has
HIV
/AID
S
Say
that
a
fem
ale
teac
her
who
has
H
IV/A
IDS
but i
s no
t sic
k sh
ould
be
allo
wed
to
con
tinue
te
achi
ng
Wou
ld
not w
ant
to k
eep
secr
et th
at
a fa
mily
m
embe
r go
t inf
ecte
d w
ith
HIV
/AID
S
Expr
ess
acce
ptin
g at
titud
es
on a
ll fo
ur
indi
cato
rs
Are
will
ing
to c
are
for
a re
lativ
e w
ith
HIV
/AID
S in
ow
n ho
me
Wou
ld
buy
fresh
ve
geta
bles
fro
m a
sh
opke
eper
or
ven
dor
who
has
H
IV/A
IDS
Say
that
a
fem
ale
teac
her
who
has
H
IV/A
IDS
bu
t is
not
sick
shou
ld
be a
llow
ed
to c
ontin
ue
teac
hing
Wou
ld n
ot
wan
t to
keep
sec
ret
that
a fa
mily
m
embe
r got
in
fect
ed
with
H
IV/A
IDS
Expr
ess
acce
ptin
g at
titud
es
on a
ll fo
ur
indi
cato
rs
Ag
e
15
-24
70
.2
55.6
67
.1
72.7
34
.2
1,21
2 73
.2
63.5
70
.5
67.4
36
.4
1,02
3 15
-19
68
.4
55.4
68
.2
69.8
32
.1
566
73.5
62
.8
69.7
69
.6
36.1
52
8 20
-24
71
.8
55.7
66
.2
75.3
36
.1
645
72.9
64
.4
71.3
65
.1
36.8
49
5 25
-29
70
.8
56.1
70
.6
70.8
34
.3
643
71.4
67
.2
70.5
73
.1
38.2
59
2 30
-39
69
.5
54.8
68
.6
72.3
33
.6
992
76.6
65
.8
73.2
71
.8
38.7
1,
016
40-4
9
72.2
55
.6
65.3
73
.4
33.5
73
8 74
.2
64.4
69
.7
73.6
40
.1
817
Re
side
nce
Urb
an
73.4
64
.2
75.9
73
.9
43.1
72
3 83
.7
76.5
83
.6
69.2
46
.7
615
Rura
l 69
.8
53.3
65
.7
72.0
31
.6
2,86
1 72
.0
62.6
68
.4
71.6
36
.5
2,83
3
Sc
hool
ing
No
scho
olin
g
66.1
48
.0
60.8
68
.0
27.1
60
0 62
.5
51.1
56
.3
69.0
28
.8
429
<5
year
s co
mpl
ete
66
.7
39.4
51
.0
70.7
18
.7
292
68.6
58
.2
66.6
73
.5
30.6
37
7 5-
9 ye
ars
com
plet
e
68.8
53
.6
65.3
72
.4
31.9
1,
505
72.1
60
.7
67.5
68
.8
34.5
1,
392
10-1
1 ye
ars
com
plet
e
73.0
60
.9
73.5
72
.9
37.6
48
5 80
.9
71.5
79
.3
75.0
46
.3
477
12 o
r mor
e ye
ars
com
plet
e
77.8
68
.7
82.1
76
.6
47.8
70
2 82
.8
79.9
82
.9
73.1
49
.2
774
Re
gula
r m
edia
exp
osur
e1
Ye
s 72
.9
58.6
70
.6
73.4
37
.5
2,41
5 75
.2
66.7
73
.2
71.1
39
.2
2,71
7 N
o
65.6
49
.0
61.9
70
.4
26.6
1,
169
69.9
58
.9
63.1
71
.4
34.9
73
1
M
arita
l sta
tus
N
ever
mar
ried
71
.9
59.5
72
.9
71.2
35
.9
881
74.2
67
.6
73.6
70
.0
39.4
1,
311
Cur
rent
ly m
arrie
d
70.6
54
.9
66.4
72
.9
34.0
2,
526
74.1
63
.5
69.5
71
.8
37.6
2,
114
Wid
owed
/div
orce
d/
sep
arat
ed/d
eser
ted
61
.4
43.0
62
.1
70.8
23
.2
178
(77.
6)
(62.
5)
(70.
4)
(75.
5)
(34.
7)
23
Con
tinue
d...

126
126
Tabl
e 74
Acc
eptin
g at
titud
es to
war
d th
ose
livin
g w
ith H
IV/A
IDS—
Con
tinue
d
Amon
g w
omen
and
men
age
15-
49 w
ho h
ave
hear
d of
HIV
/AID
S, p
erce
ntag
e ex
pres
sing
spec
ific
acce
ptin
g at
titud
es to
war
d pe
ople
with
HIV
/AID
S, b
y ba
ckgr
ound
cha
ract
erist
ics,
Ass
am, 2
015-
16
Back
grou
nd c
hara
cter
istic
Perc
enta
ge o
f wom
en w
ho:
Num
ber
of w
omen
w
ho h
ave
hear
d of
H
IV/ A
IDS
Perc
enta
ge o
f men
who
:
Num
ber
of m
en
who
hav
e he
ard
of
HIV
/AID
S
Are
will
ing
to
car
e fo
r a
rela
tive
w
ith
HIV
/AID
S
in o
wn
hom
e
Wou
ld b
uy
fresh
ve
geta
bles
fro
m a
sh
opke
eper
or
vend
or w
ho
has
HIV
/AID
S
Say
that
a
fem
ale
teac
her
who
has
H
IV/A
IDS
but i
s no
t sic
k sh
ould
be
allo
wed
to
con
tinue
te
achi
ng
Wou
ld
not w
ant
to k
eep
secr
et th
at
a fa
mily
m
embe
r go
t inf
ecte
d w
ith
HIV
/AID
S
Expr
ess
acce
ptin
g at
titud
es
on a
ll fo
ur
indi
cato
rs
Are
will
ing
to c
are
for
a re
lativ
e w
ith
HIV
/AID
S in
ow
n ho
me
Wou
ld
buy
fresh
ve
geta
bles
fro
m a
sh
opke
eper
or
ven
dor
who
has
H
IV/A
IDS
Say
that
a
fem
ale
teac
her
who
has
H
IV/A
IDS
bu
t is
not
sick
shou
ld
be a
llow
ed
to c
ontin
ue
teac
hing
Wou
ld n
ot
wan
t to
keep
sec
ret
that
a fa
mily
m
embe
r got
in
fect
ed
with
H
IV/A
IDS
Expr
ess
acce
ptin
g at
titud
es
on a
ll fo
ur
indi
cato
rs
Re
ligio
n
H
indu
73
.2
58.2
69
.8
72.2
36
.3
2,49
6 75
.2
66.6
73
.9
70.9
39
.1
2,36
0 M
uslim
62
.8
47.7
61
.6
72.7
26
.0
955
71.2
60
.7
64.7
71
.5
35.9
96
8 C
hrist
ian
78
.1
59.8
75
.0
76.2
46
.3
117
75.9
65
.9
66.8
70
.5
40.9
10
9
C
aste
/trib
e
Sc
hedu
led
cast
e
68.3
54
.1
64.6
68
.1
31.8
36
5 73
.4
68.0
74
.5
73.2
39
.6
376
Sche
dule
d tri
be
72.7
56
.7
66.8
73
.4
37.3
56
7 73
.0
60.2
68
.3
72.4
39
.9
528
Oth
er b
ackw
ard
clas
s
74.1
56
.5
69.5
72
.8
35.8
1,
050
74.7
65
.8
73.2
69
.2
37.6
97
7 O
ther
67
.9
54.5
67
.9
73.1
32
.1
1,58
7 74
.3
65.5
70
.0
71.3
38
.0
1,55
6
To
tal
70.5
55
.5
67.8
72
.4
33.9
3,
585
74.1
65
.0
71.1
71
.1
38.3
3,
448
wn
sepa
rate
ly.
1 Exp
osur
e to
radi
o, te
levi
sion,
or n
ewsp
aper
s/m
agaz
ines
at l
east
onc
e a
wee
k or
cin
ema
at le
ast o
nce
a m
onth
( )
Bas
ed o
n 25
-49
unw
eigh
ted
case
s
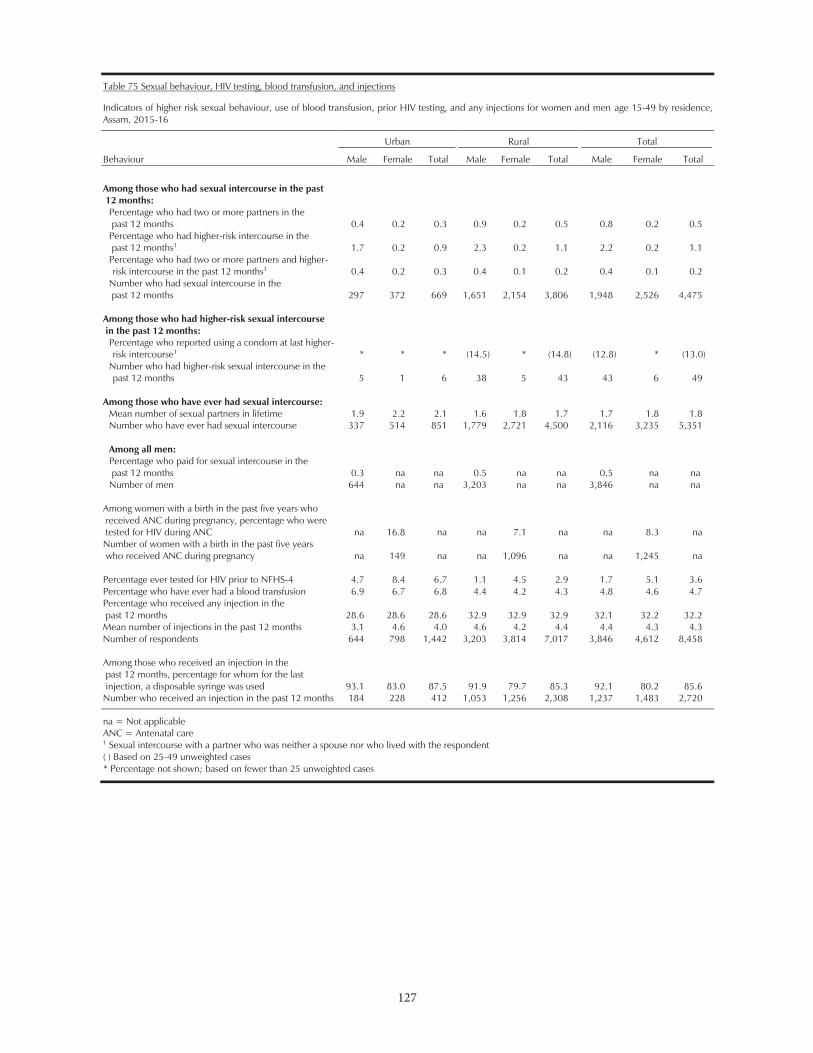
127
127
Table 75 Sexual behaviour, HIV testing, blood transfusion, and injections
Indicators of higher risk sexual behaviour, use of blood transfusion, prior HIV testing, and any injections for women and men age 15-49 by residence, Assam, 2015-16
Behaviour
Urban
Rural
Total
Male Female Total Male Female Total Male Female Total
Among those who had sexual intercourse in the past 12 months:
Percentage who had two or more partners in the past 12 months 0.4 0.2 0.3 0.9 0.2 0.5 0.8 0.2 0.5 Percentage who had higher-risk intercourse in the past 12 months1 1.7 0.2 0.9 2.3 0.2 1.1 2.2 0.2 1.1 Percentage who had two or more partners and higher-risk intercourse in the past 12 months1 0.4 0.2 0.3 0.4 0.1 0.2 0.4 0.1 0.2
Number who had sexual intercourse in the past 12 months 297 372 669 1,651 2,154 3,806 1,948 2,526 4,475
Among those who had higher-risk sexual intercourse in the past 12 months:
Percentage who reported using a condom at last higher-risk intercourse1 * * * (14.5) * (14.8) (12.8) * (13.0)
Number who had higher-risk sexual intercourse in the past 12 months 5 1 6 38 5 43 43 6 49
Among those who have ever had sexual intercourse: Mean number of sexual partners in lifetime 1.9 2.2 2.1 1.6 1.8 1.7 1.7 1.8 1.8 Number who have ever had sexual intercourse 337 514 851 1,779 2,721 4,500 2,116 3,235 5,351 Among all men: Percentage who paid for sexual intercourse in the past 12 months 0.3 na na 0.5 na na 0.5 na na Number of men 644 na na 3,203 na na 3,846 na na
Among women with a birth in the past five years who received ANC during pregnancy, percentage who were tested for HIV during ANC na 16.8 na na 7.1 na na 8.3 na Number of women with a birth in the past five years who received ANC during pregnancy na 149 na na 1,096 na na 1,245 na
Percentage ever tested for HIV prior to NFHS-4 4.7 8.4 6.7 1.1 4.5 2.9 1.7 5.1 3.6 Percentage who have ever had a blood transfusion 6.9 6.7 6.8 4.4 4.2 4.3 4.8 4.6 4.7 Percentage who received any injection in the past 12 months 28.6 28.6 28.6 32.9 32.9 32.9 32.1 32.2 32.2 Mean number of injections in the past 12 months 3.1 4.6 4.0 4.6 4.2 4.4 4.4 4.3 4.3 Number of respondents 644 798 1,442 3,203 3,814 7,017 3,846 4,612 8,458
Among those who received an injection in the past 12 months, percentage for whom for the last injection, a disposable syringe was used 93.1 83.0 87.5 91.9 79.7 85.3 92.1 80.2 85.6 Number who received an injection in the past 12 months 184 228 412 1,053 1,256 2,308 1,237 1,483 2,720
na = Not applicable ANC = Antenatal care 1 Sexual intercourse with a partner who was neither a spouse nor who lived with the respondent ( ) Based on 25-49 unweighted cases * Percentage not shown; based on fewer than 25 unweighted cases
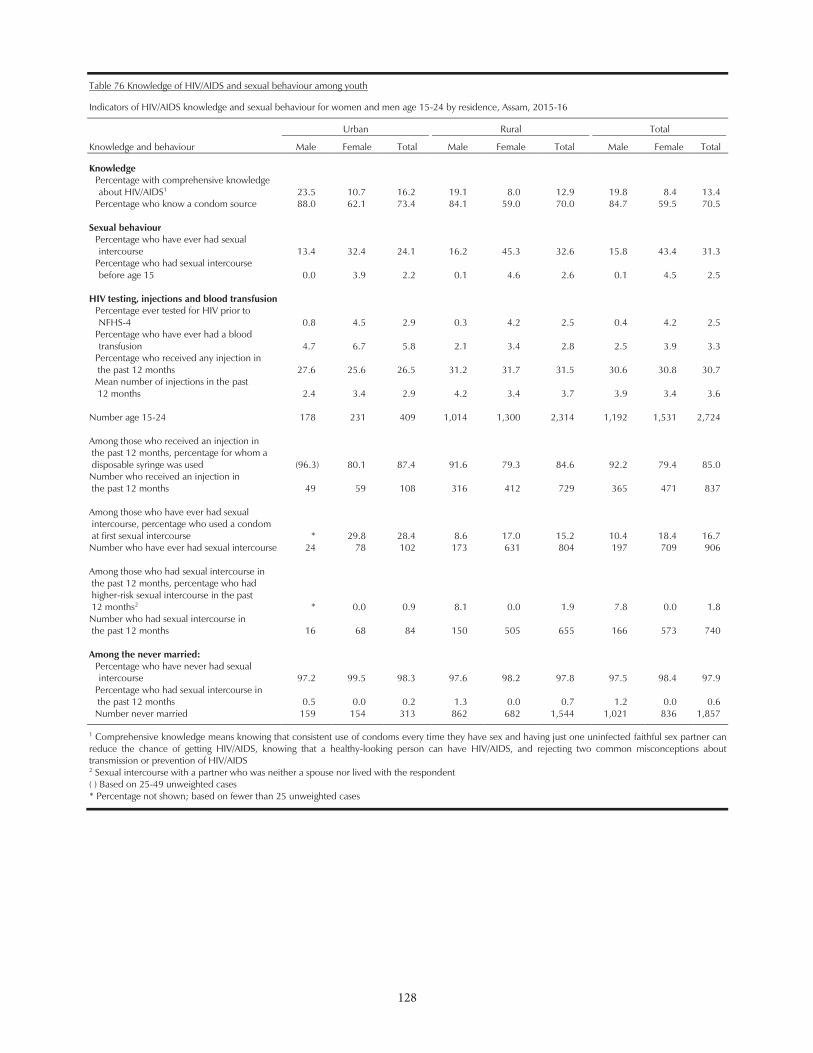
128
128
Table 76 Knowledge of HIV/AIDS and sexual behaviour among youth
Indicators of HIV/AIDS knowledge and sexual behaviour for women and men age 15-24 by residence, Assam, 2015-16
Knowledge and behaviour
Urban
Rural
Total
Male Female Total Male Female Total Male Female Total
Knowledge Percentage with comprehensive knowledge about HIV/AIDS1 23.5 10.7 16.2 19.1 8.0 12.9 19.8 8.4 13.4
Percentage who know a condom source 88.0 62.1 73.4 84.1 59.0 70.0 84.7 59.5 70.5
Sexual behaviour Percentage who have ever had sexual intercourse 13.4 32.4 24.1 16.2 45.3 32.6 15.8 43.4 31.3
Percentage who had sexual intercourse before age 15 0.0 3.9 2.2 0.1 4.6 2.6 0.1 4.5 2.5
HIV testing, injections and blood transfusion Percentage ever tested for HIV prior to NFHS-4 0.8 4.5 2.9 0.3 4.2 2.5 0.4 4.2 2.5
Percentage who have ever had a blood transfusion 4.7 6.7 5.8 2.1 3.4 2.8 2.5 3.9 3.3
Percentage who received any injection in the past 12 months 27.6 25.6 26.5 31.2 31.7 31.5 30.6 30.8 30.7 Mean number of injections in the past 12 months 2.4 3.4 2.9 4.2 3.4 3.7 3.9 3.4 3.6
Number age 15-24 178 231 409 1,014 1,300 2,314 1,192 1,531 2,724
Among those who received an injection in the past 12 months, percentage for whom a disposable syringe was used (96.3) 80.1 87.4 91.6 79.3 84.6 92.2 79.4 85.0 Number who received an injection in the past 12 months 49 59 108 316 412 729 365 471 837
Among those who have ever had sexual intercourse, percentage who used a condom at first sexual intercourse * 29.8 28.4 8.6 17.0 15.2 10.4 18.4 16.7 Number who have ever had sexual intercourse 24 78 102 173 631 804 197 709 906
Among those who had sexual intercourse in the past 12 months, percentage who had higher-risk sexual intercourse in the past 12 months2 * 0.0 0.9 8.1 0.0 1.9 7.8 0.0 1.8 Number who had sexual intercourse in the past 12 months 16 68 84 150 505 655 166 573 740
Among the never married: Percentage who have never had sexual intercourse 97.2 99.5 98.3 97.6 98.2 97.8 97.5 98.4 97.9
Percentage who had sexual intercourse in the past 12 months 0.5 0.0 0.2 1.3 0.0 0.7 1.2 0.0 0.6 Number never married 159 154 313 862 682 1,544 1,021 836 1,857
1 Comprehensive knowledge means knowing that consistent use of condoms every time they have sex and having just one uninfected faithful sex partner can reduce the chance of getting HIV/AIDS, knowing that a healthy-looking person can have HIV/AIDS, and rejecting two common misconceptions about transmission or prevention of HIV/AIDS 2 Sexual intercourse with a partner who was neither a spouse nor lived with the respondent ( ) Based on 25-49 unweighted cases * Percentage not shown; based on fewer than 25 unweighted cases
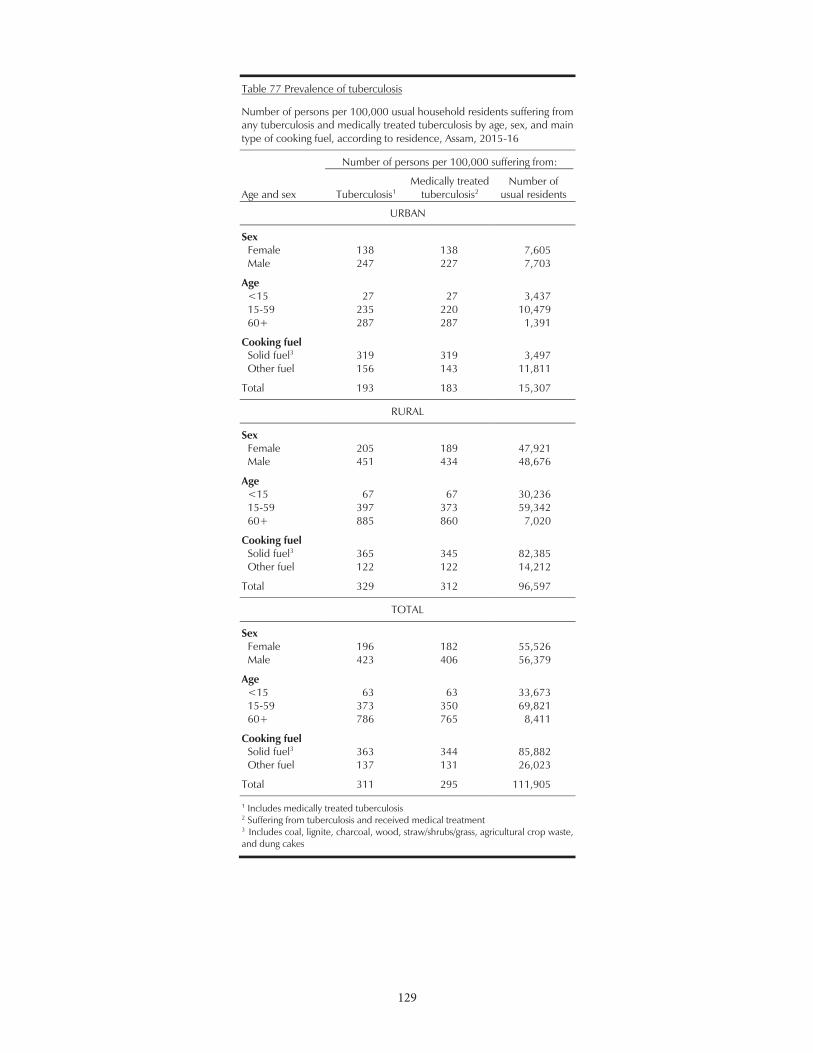
129
Table 77 Prevalence of tuberculosis
Number of persons per 100,000 usual household residents suffering from any tuberculosis and medically treated tuberculosis by age, sex, and main type of cooking fuel, according to residence, Assam, 2015-16
Age and sex
Number of persons per 100,000 suffering from:
Tuberculosis1 Medically treated
tuberculosis2 Number of
usual residents
URBAN
Sex Female 138 138 7,605 Male 247 227 7,703
Age <15 27 27 3,437 15-59 235 220 10,479 60+ 287 287 1,391
Cooking fuel Solid fuel3 319 319 3,497 Other fuel 156 143 11,811
Total 193 183 15,307
RURAL
Sex Female 205 189 47,921 Male 451 434 48,676
Age <15 67 67 30,236 15-59 397 373 59,342 60+ 885 860 7,020
Cooking fuel Solid fuel3 365 345 82,385 Other fuel 122 122 14,212
Total 329 312 96,597
TOTAL
Sex Female 196 182 55,526 Male 423 406 56,379
Age <15 63 63 33,673 15-59 373 350 69,821 60+ 786 765 8,411
Cooking fuel Solid fuel3 363 344 85,882 Other fuel 137 131 26,023
Total 311 295 111,905 1 Includes medically treated tuberculosis 2 Suffering from tuberculosis and received medical treatment 3 Includes coal, lignite, charcoal, wood, straw/shrubs/grass, agricultural crop waste, and dung cakes
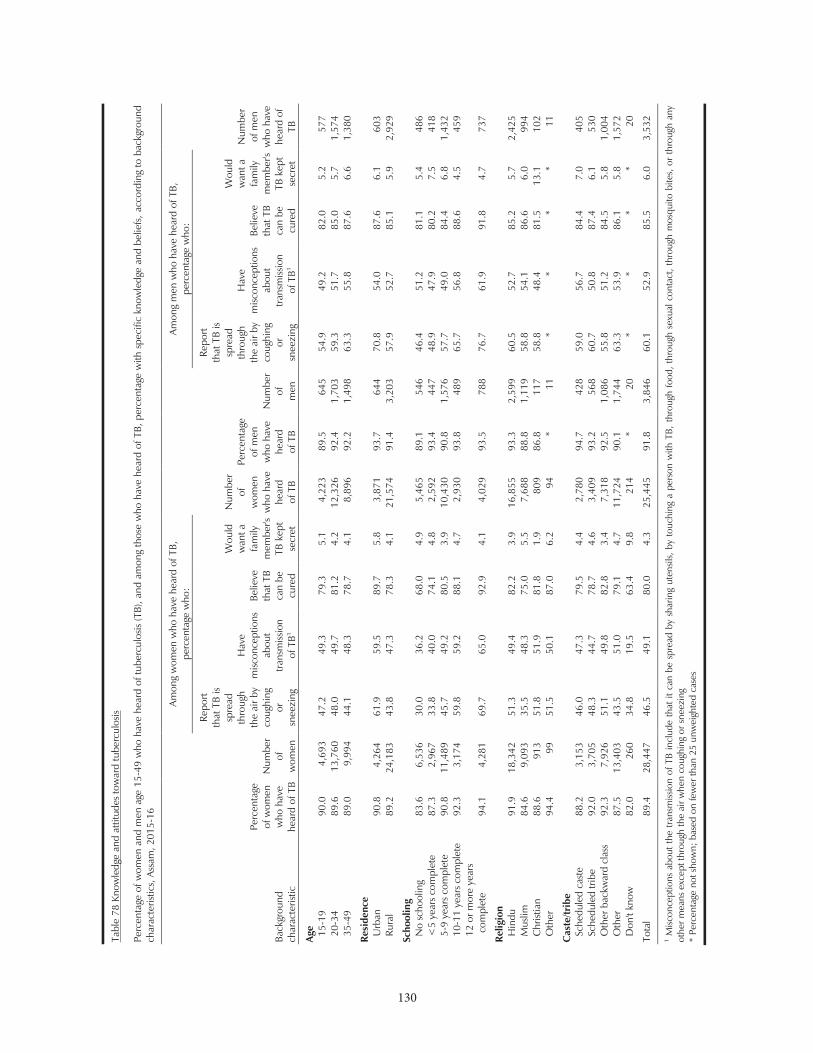
130
130
Tabl
e 78
Kno
wle
dge
and
attit
udes
tow
ard
tube
rcul
osis
Perc
enta
ge o
f wom
en a
nd m
en a
ge 1
5-49
who
hav
e he
ard
of tu
berc
ulos
is (T
B), a
nd a
mon
g th
ose
who
hav
e he
ard
of T
B, p
erce
ntag
e w
ith s
peci
fic k
now
ledg
e an
d be
liefs
, ac
cord
ing
to b
ackg
roun
d ch
arac
teris
tics,
Ass
am, 2
015-
16
Back
grou
nd
char
acte
ristic
Perc
enta
ge
of w
omen
w
ho h
ave
hear
d of
TB
Num
ber
of
wom
en
Amon
g w
omen
who
hav
e he
ard
of T
B,
perc
enta
ge w
ho:
Num
ber
of
wom
en
who
hav
e he
ard
of
TB
Perc
enta
ge
of m
en
who
hav
e
hear
d
of T
B
Num
ber
of
men
Am
ong
men
who
hav
e he
ard
of T
B,
perc
enta
ge w
ho:
Num
ber
of m
en
who
hav
e he
ard
of
TB
Repo
rt th
at T
B is
spre
ad
thro
ugh
the
air b
y co
ughi
ng
or
snee
zing
Hav
e m
iscon
cept
ions
ab
out
tran
smiss
ion
of
TB1
Belie
ve
that
TB
can
be
cure
d
Wou
ld
wan
t a
fam
ily
mem
ber's
TB
kep
t se
cret
Repo
rt th
at T
B is
spre
ad
thro
ugh
the
air b
y co
ughi
ng
or
snee
zing
Hav
e m
iscon
cept
ions
ab
out
trans
miss
ion
of
TB1
Belie
ve
that
TB
can
be
cure
d
Wou
ld
wan
t a
fam
ily
mem
ber's
TB
kep
t se
cret
Age
15-1
9
90.0
4,
693
47.2
49
.3
79.3
5.
1 4,
223
89.5
64
5 54
.9
49.2
82
.0
5.2
577
20-3
4
89.6
13
,760
48
.0
49.7
81
.2
4.2
12,3
26
92.4
1,
703
59.3
51
.7
85.0
5.
7 1,
574
35-4
9
89.0
9,
994
44.1
48
.3
78.7
4.
1 8,
896
92.2
1,
498
63.3
55
.8
87.6
6.
6 1,
380
Resi
denc
e
U
rban
90
.8
4,26
4 61
.9
59.5
89
.7
5.8
3,87
1 93
.7
644
70.8
54
.0
87.6
6.
1 60
3 Ru
ral
89.2
24
,183
43
.8
47.3
78
.3
4.1
21,5
74
91.4
3,
203
57.9
52
.7
85.1
5.
9 2,
929
Scho
olin
g
N
o sc
hool
ing
83
.6
6,53
6 30
.0
36.2
68
.0
4.9
5,46
5 89
.1
546
46.4
51
.2
81.1
5.
4 48
6 <
5 ye
ars
com
plet
e
87.3
2,
967
33.8
40
.0
74.1
4.
8 2,
592
93.4
44
7 48
.9
47.9
80
.2
7.5
418
5-9
year
s co
mpl
ete
90
.8
11,4
89
45.7
49
.2
80.5
3.
9 10
,430
90
.8
1,57
6 57
.7
49.0
84
.4
6.8
1,43
2 10
-11
year
s co
mpl
ete
92
.3
3,17
4 59
.8
59.2
88
.1
4.7
2,93
0 93
.8
489
65.7
56
.8
88.6
4.
5 45
9 12
or m
ore
year
s co
mpl
ete
94
.1
4,28
1 69
.7
65.0
92
.9
4.1
4,02
9 93
.5
788
76.7
61
.9
91.8
4.
7 73
7
Relig
ion
Hin
du
91.9
18
,342
51
.3
49.4
82
.2
3.9
16,8
55
93.3
2,
599
60.5
52
.7
85.2
5.
7 2,
425
Mus
lim
84.6
9,
093
35.5
48
.3
75.0
5.
5 7,
688
88.8
1,
119
58.8
54
.1
86.6
6.
0 99
4 C
hrist
ian
88
.6
913
51.8
51
.9
81.8
1.
9 80
9 86
.8
117
58.8
48
.4
81.5
13
.1
102
Oth
er
94.4
99
51
.5
50.1
87
.0
6.2
94
* 11
*
* *
* 11
Cas
te/tr
ibe
Sche
dule
d ca
ste
88
.2
3,15
3 46
.0
47.3
79
.5
4.4
2,78
0 94
.7
428
59.0
56
.7
84.4
7.
0 40
5 Sc
hedu
led
tribe
92
.0
3,70
5 48
.3
44.7
78
.7
4.6
3,40
9 93
.2
568
60.7
50
.8
87.4
6.
1 53
0 O
ther
bac
kwar
d cl
ass
92
.3
7,92
6 51
.1
49.8
82
.8
3.4
7,31
8 92
.5
1,08
6 55
.8
51.2
84
.5
5.8
1,00
4 O
ther
87
.5
13,4
03
43.5
51
.0
79.1
4.
7 11
,724
90
.1
1,74
4 63
.3
53.9
86
.1
5.8
1,57
2 D
on't
know
82
.0
260
34.8
19
.5
63.4
9.
8 21
4 *
20
* *
* *
20
Tota
l 89
.4
28,4
47
46.5
49
.1
80.0
4.
3 25
,445
91
.8
3,84
6 60
.1
52.9
85
.5
6.0
3,53
2 1
Misc
once
ptio
ns a
bout
the
tra
nsm
issio
n of
TB
incl
ude
that
it c
an b
e sp
read
by
shar
ing
uten
sils,
by to
uchi
ng a
per
son
with
TB,
thr
ough
food
, thr
ough
sex
ual c
onta
ct, t
hrou
gh m
osqu
ito b
ites,
or t
hrou
gh a
ny
othe
r mea
ns e
xcep
t thr
ough
the
air w
hen
coug
hing
or s
neez
ing
*
Perc
enta
ge n
ot s
how
n; b
ased
on
few
er th
an 2
5 un
wei
ghte
d ca
ses
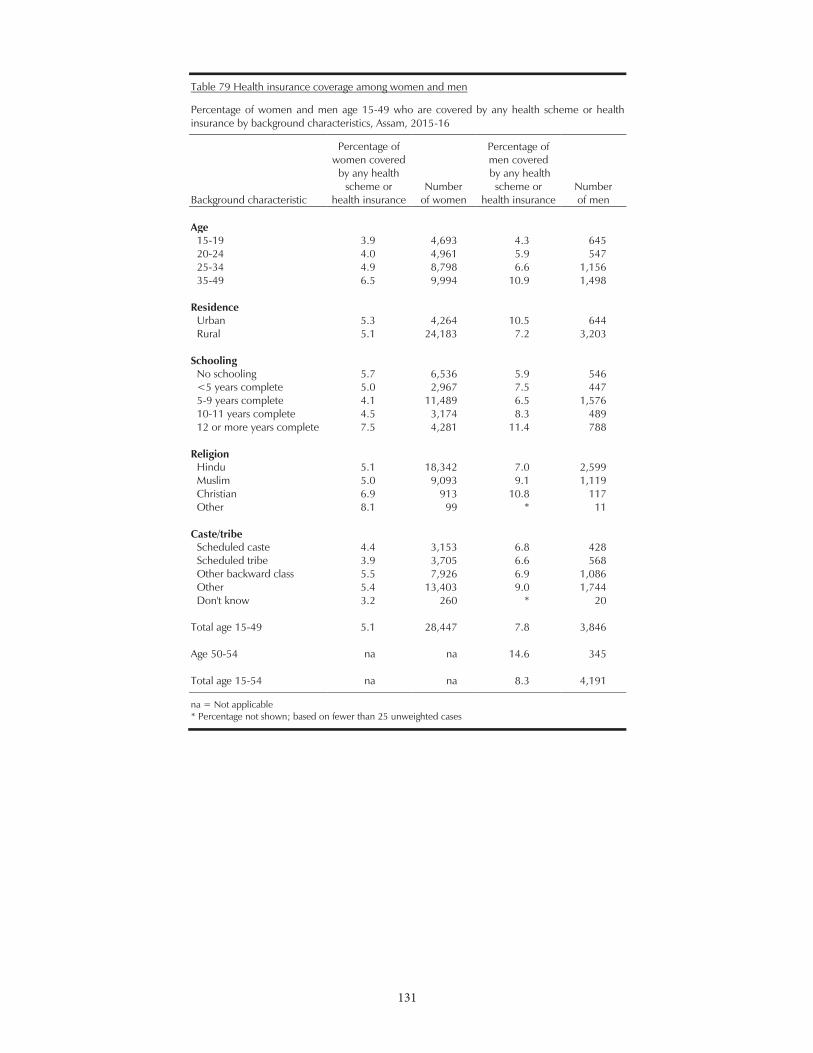
131
131
Table 79 Health insurance coverage among women and men
Percentage of women and men age 15-49 who are covered by any health scheme or health insurance by background characteristics, Assam, 2015-16
Background characteristic
Percentage of women covered
by any health scheme or
health insurance Number
of women
Percentage of men covered by any health
scheme or health insurance
Number of men
Age
15-19 3.9 4,693 4.3 645 20-24 4.0 4,961 5.9 547 25-34 4.9 8,798 6.6 1,156 35-49 6.5 9,994 10.9 1,498
Residence Urban 5.3 4,264 10.5 644 Rural 5.1 24,183 7.2 3,203
Schooling No schooling 5.7 6,536 5.9 546 <5 years complete 5.0 2,967 7.5 447 5-9 years complete 4.1 11,489 6.5 1,576 10-11 years complete 4.5 3,174 8.3 489 12 or more years complete 7.5 4,281 11.4 788
Religion Hindu 5.1 18,342 7.0 2,599 Muslim 5.0 9,093 9.1 1,119 Christian 6.9 913 10.8 117 Other 8.1 99 * 11
Caste/tribe Scheduled caste 4.4 3,153 6.8 428 Scheduled tribe 3.9 3,705 6.6 568 Other backward class 5.5 7,926 6.9 1,086 Other 5.4 13,403 9.0 1,744 Don't know 3.2 260 * 20
Total age 15-49 5.1 28,447 7.8 3,846
Age 50-54 na na 14.6 345
Total age 15-54 na na 8.3 4,191
na = Not applicable * Percentage not shown; based on fewer than 25 unweighted cases
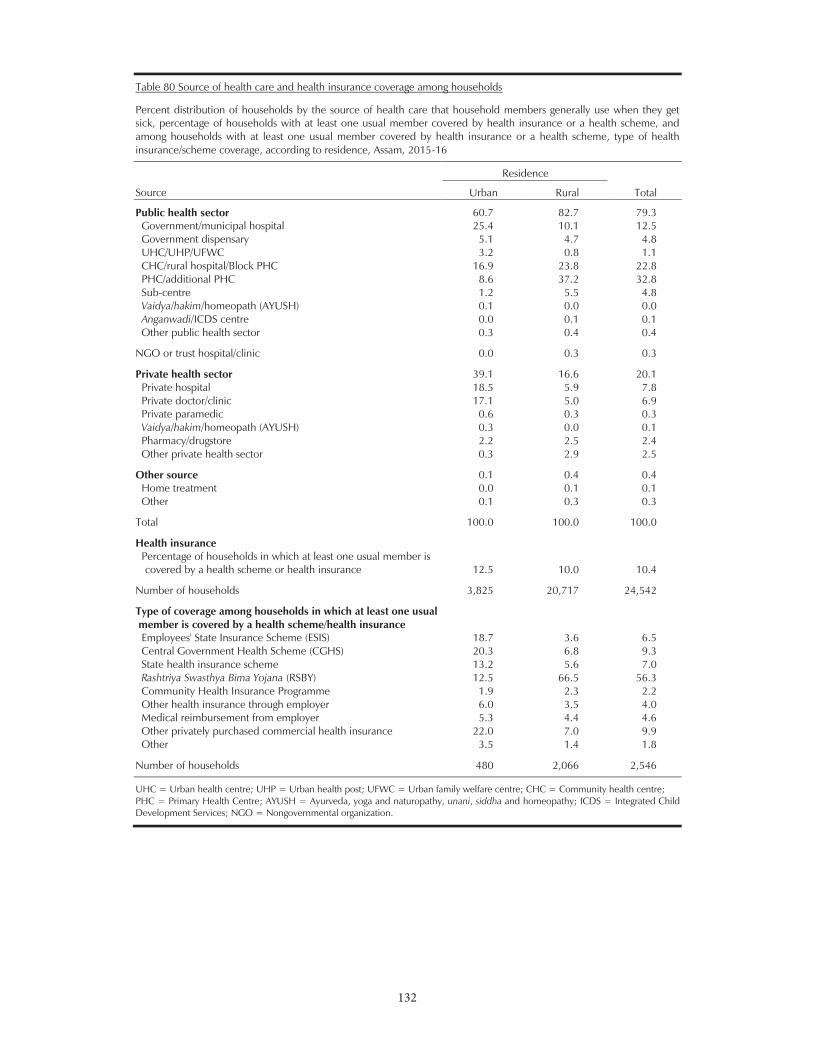
132
132
Table 80 Source of health care and health insurance coverage among households
Percent distribution of households by the source of health care that household members generally use when they get sick, percentage of households with at least one usual member covered by health insurance or a health scheme, and among households with at least one usual member covered by health insurance or a health scheme, type of health insurance/scheme coverage, according to residence, Assam, 2015-16
Source
Residence
Total Urban Rural
Public health sector 60.7 82.7 79.3 Government/municipal hospital 25.4 10.1 12.5 Government dispensary 5.1 4.7 4.8 UHC/UHP/UFWC 3.2 0.8 1.1 CHC/rural hospital/Block PHC 16.9 23.8 22.8 PHC/additional PHC 8.6 37.2 32.8 Sub-centre 1.2 5.5 4.8 Vaidya/hakim/homeopath (AYUSH) 0.1 0.0 0.0 Anganwadi/ICDS centre 0.0 0.1 0.1 Other public health sector 0.3 0.4 0.4
NGO or trust hospital/clinic 0.0 0.3 0.3
Private health sector 39.1 16.6 20.1 Private hospital 18.5 5.9 7.8 Private doctor/clinic 17.1 5.0 6.9 Private paramedic 0.6 0.3 0.3 Vaidya/hakim/homeopath (AYUSH) 0.3 0.0 0.1 Pharmacy/drugstore 2.2 2.5 2.4 Other private health sector 0.3 2.9 2.5
Other source 0.1 0.4 0.4 Home treatment 0.0 0.1 0.1 Other 0.1 0.3 0.3
Total 100.0 100.0 100.0
Health insurance Percentage of households in which at least one usual member is covered by a health scheme or health insurance 12.5 10.0 10.4
Number of households 3,825 20,717 24,542
Type of coverage among households in which at least one usual member is covered by a health scheme/health insurance
Employees' State Insurance Scheme (ESIS) 18.7 3.6 6.5 Central Government Health Scheme (CGHS) 20.3 6.8 9.3 State health insurance scheme 13.2 5.6 7.0 Rashtriya Swasthya Bima Yojana (RSBY) 12.5 66.5 56.3 Community Health Insurance Programme 1.9 2.3 2.2 Other health insurance through employer 6.0 3.5 4.0 Medical reimbursement from employer 5.3 4.4 4.6 Other privately purchased commercial health insurance 22.0 7.0 9.9 Other 3.5 1.4 1.8
Number of households 480 2,066 2,546
UHC = Urban health centre; UHP = Urban health post; UFWC = Urban family welfare centre; CHC = Community health centre; PHC = Primary Health Centre; AYUSH = Ayurveda, yoga and naturopathy, unani, siddha and homeopathy; ICDS = Integrated Child Development Services; NGO = Nongovernmental organization.
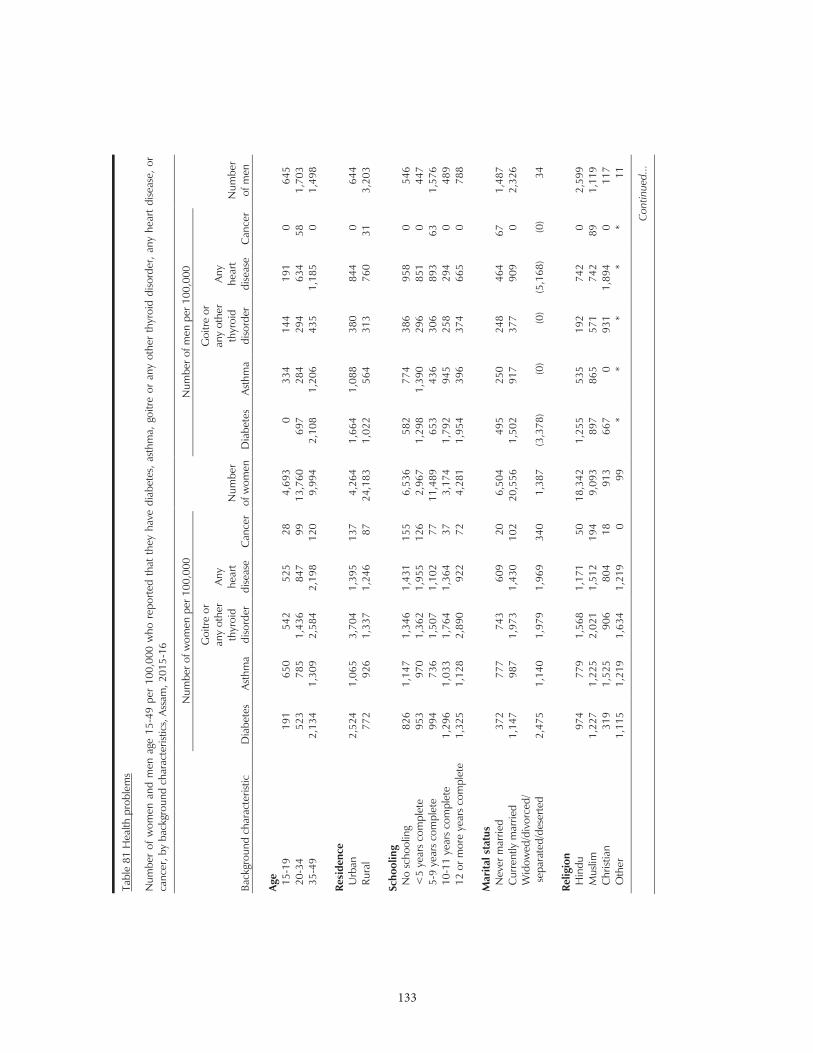
133
133
Tabl
e 81
Hea
lth p
robl
ems
Num
ber
of w
omen
and
men
age
15-
49 p
er 1
00,0
00 w
ho r
epor
ted
that
the
y ha
ve d
iabe
tes,
ast
hma,
goi
tre o
r an
y ot
her
thyr
oid
diso
rder
, an
y he
art
dise
ase,
or
canc
er, b
y ba
ckgr
ound
cha
ract
erist
ics,
Ass
am, 2
015-
16
Back
grou
nd c
hara
cter
istic
Num
ber o
f wom
en p
er 1
00,0
00
Num
ber
of w
omen
Num
ber o
f men
per
100
,000
Num
ber
of m
en
Dia
bete
s As
thm
a
Goi
tre
or
any
othe
r th
yroi
d di
sord
er
Any
hear
t di
seas
e C
ance
r D
iabe
tes
Asth
ma
Goi
tre
or
any
othe
r th
yroi
d di
sord
er
Any
hear
t di
seas
e C
ance
r
Age
15-1
9
191
650
542
525
28
4,69
3 0
334
144
191
0 64
5 20
-34
52
3 78
5 1,
436
847
99
13,7
60
697
284
294
634
58
1,70
3 35
-49
2,
134
1,30
9 2,
584
2,19
8 12
0 9,
994
2,10
8 1,
206
435
1,18
5 0
1,49
8
Re
side
nce
Urb
an
2,52
4 1,
065
3,70
4 1,
395
137
4,26
4 1,
664
1,08
8 38
0 84
4 0
644
Rura
l 77
2 92
6 1,
337
1,24
6 87
24
,183
1,
022
564
313
760
31
3,20
3
Sc
hool
ing
No
scho
olin
g
826
1,14
7 1,
346
1,43
1 15
5 6,
536
582
774
386
958
0 54
6 <
5 ye
ars
com
plet
e
953
970
1,36
2 1,
955
126
2,96
7 1,
298
1,39
0 29
6 85
1 0
447
5-9
year
s co
mpl
ete
99
4 73
6 1,
507
1,10
2 77
11
,489
65
3 43
6 30
6 89
3 63
1,
576
10-1
1 ye
ars
com
plet
e
1,29
6 1,
033
1,76
4 1,
364
37
3,17
4 1,
792
945
258
294
0 48
9 12
or m
ore
year
s co
mpl
ete
1,
325
1,12
8 2,
890
922
72
4,28
1 1,
954
396
374
665
0 78
8
M
arita
l sta
tus
Nev
er m
arrie
d
372
777
743
609
20
6,50
4 49
5 25
0 24
8 46
4 67
1,
487
Cur
rent
ly m
arrie
d
1,14
7 98
7 1,
973
1,43
0 10
2 20
,556
1,
502
917
377
909
0 2,
326
Wid
owed
/div
orce
d/
sep
arat
ed/d
eser
ted
2,
475
1,14
0 1,
979
1,96
9 34
0 1,
387
(3,3
78)
(0)
(0)
(5,1
68)
(0)
34
Re
ligio
n
H
indu
97
4 77
9 1,
568
1,17
1 50
18
,342
1,
255
535
192
742
0 2,
599
Mus
lim
1,22
7 1,
225
2,02
1 1,
512
194
9,09
3 89
7 86
5 57
1 74
2 89
1,
119
Chr
istia
n
319
1,52
5 90
6 80
4 18
91
3 66
7 0
931
1,89
4 0
117
Oth
er
1,11
5 1,
219
1,63
4 1,
219
0 99
*
* *
* *
11
Con
tinue
d...
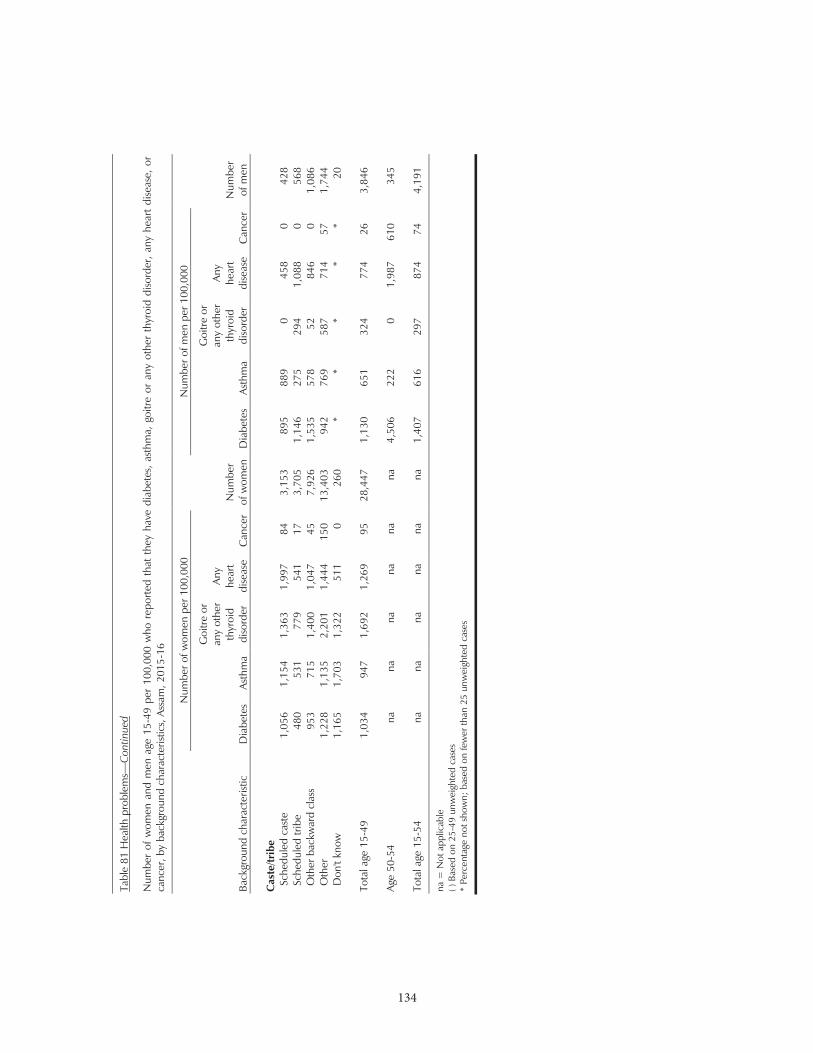
134
134
Tabl
e 81
Hea
lth p
robl
ems—
Con
tinue
d
Num
ber
of w
omen
and
men
age
15-
49 p
er 1
00,0
00 w
ho r
epor
ted
that
the
y ha
ve d
iabe
tes,
ast
hma,
goi
tre o
r an
y ot
her
thyr
oid
diso
rder
, an
y he
art
dise
ase,
or
canc
er, b
y ba
ckgr
ound
cha
ract
erist
ics,
Ass
am, 2
015-
16
Back
grou
nd c
hara
cter
istic
Num
ber o
f wom
en p
er 1
00,0
00
Num
ber
of w
omen
Num
ber o
f men
per
100
,000
Num
ber
of m
en
Dia
bete
s As
thm
a
Goi
tre
or
any
othe
r th
yroi
d di
sord
er
Any
hear
t di
seas
e C
ance
r D
iabe
tes
Asth
ma
Goi
tre
or
any
othe
r th
yroi
d di
sord
er
Any
hear
t di
seas
e C
ance
r
C
aste
/trib
e
Sc
hedu
led
cast
e
1,05
6 1,
154
1,36
3 1,
997
84
3,15
3 89
5 88
9 0
458
0 42
8 Sc
hedu
led
tribe
48
0 53
1 77
9 54
1 17
3,
705
1,14
6 27
5 29
4 1,
088
0 56
8 O
ther
bac
kwar
d cl
ass
95
3 71
5 1,
400
1,04
7 45
7,
926
1,53
5 57
8 52
84
6 0
1,08
6 O
ther
1,
228
1,13
5 2,
201
1,44
4 15
0 13
,403
94
2 76
9 58
7 71
4 57
1,
744
Don
't kn
ow
1,16
5 1,
703
1,32
2 51
1 0
260
* *
* *
* 20
To
tal a
ge 1
5-49
1,
034
947
1,69
2 1,
269
95
28,4
47
1,13
0 65
1 32
4 77
4 26
3,
846
Ag
e 50
-54
na
na
na
na
na
na
4,
506
222
0 1,
987
610
345
To
tal a
ge 1
5-54
na
na
na
na
na
na
1,
407
616
297
874
74
4,19
1 na
= N
ot a
pplic
able
( )
Bas
ed o
n 25
-49
unw
eigh
ted
case
s *
Perc
enta
ge n
ot s
how
n; b
ased
on
few
er th
an 2
5 un
wei
ghte
d ca
ses
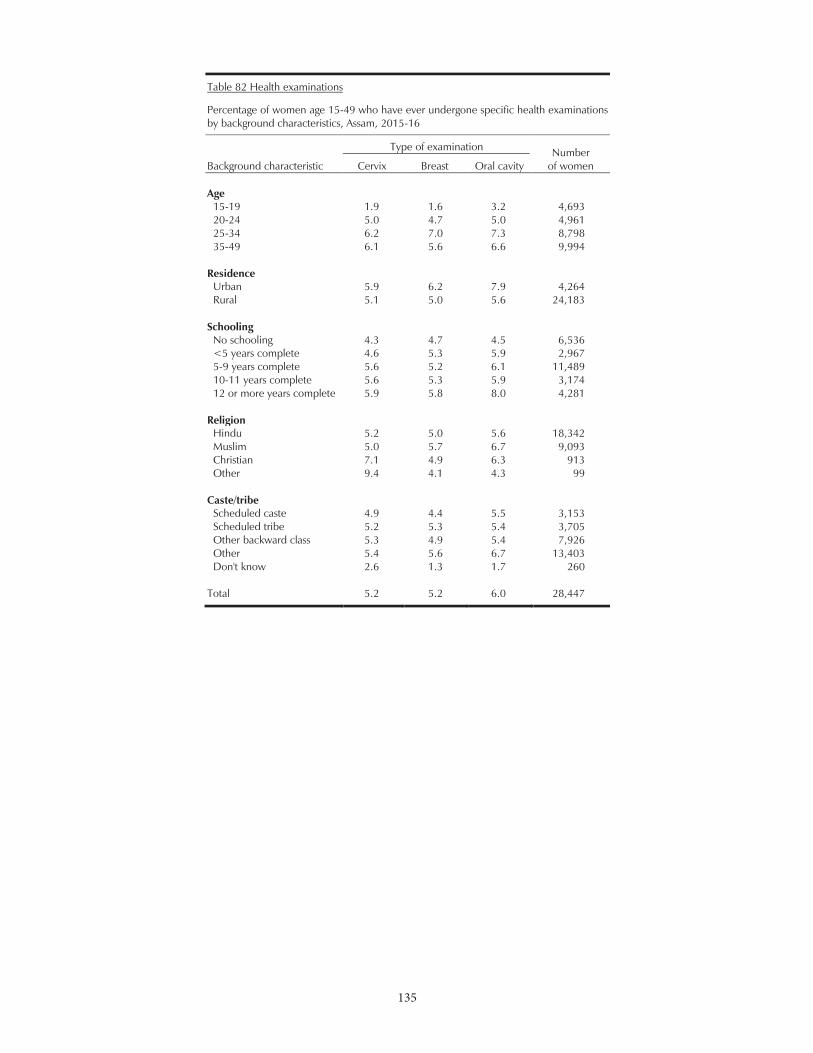
135
135
Table 82 Health examinations
Percentage of women age 15-49 who have ever undergone specific health examinations by background characteristics, Assam, 2015-16
Background characteristic
Type of examination Number
of women Cervix Breast Oral cavity Age
15-19 1.9 1.6 3.2 4,693 20-24 5.0 4.7 5.0 4,961 25-34 6.2 7.0 7.3 8,798 35-49 6.1 5.6 6.6 9,994
Residence Urban 5.9 6.2 7.9 4,264 Rural 5.1 5.0 5.6 24,183
Schooling No schooling 4.3 4.7 4.5 6,536 <5 years complete 4.6 5.3 5.9 2,967 5-9 years complete 5.6 5.2 6.1 11,489 10-11 years complete 5.6 5.3 5.9 3,174 12 or more years complete 5.9 5.8 8.0 4,281
Religion Hindu 5.2 5.0 5.6 18,342 Muslim 5.0 5.7 6.7 9,093 Christian 7.1 4.9 6.3 913 Other 9.4 4.1 4.3 99
Caste/tribe Scheduled caste 4.9 4.4 5.5 3,153 Scheduled tribe 5.2 5.3 5.4 3,705 Other backward class 5.3 4.9 5.4 7,926 Other 5.4 5.6 6.7 13,403 Don't know 2.6 1.3 1.7 260
Total 5.2 5.2 6.0 28,447
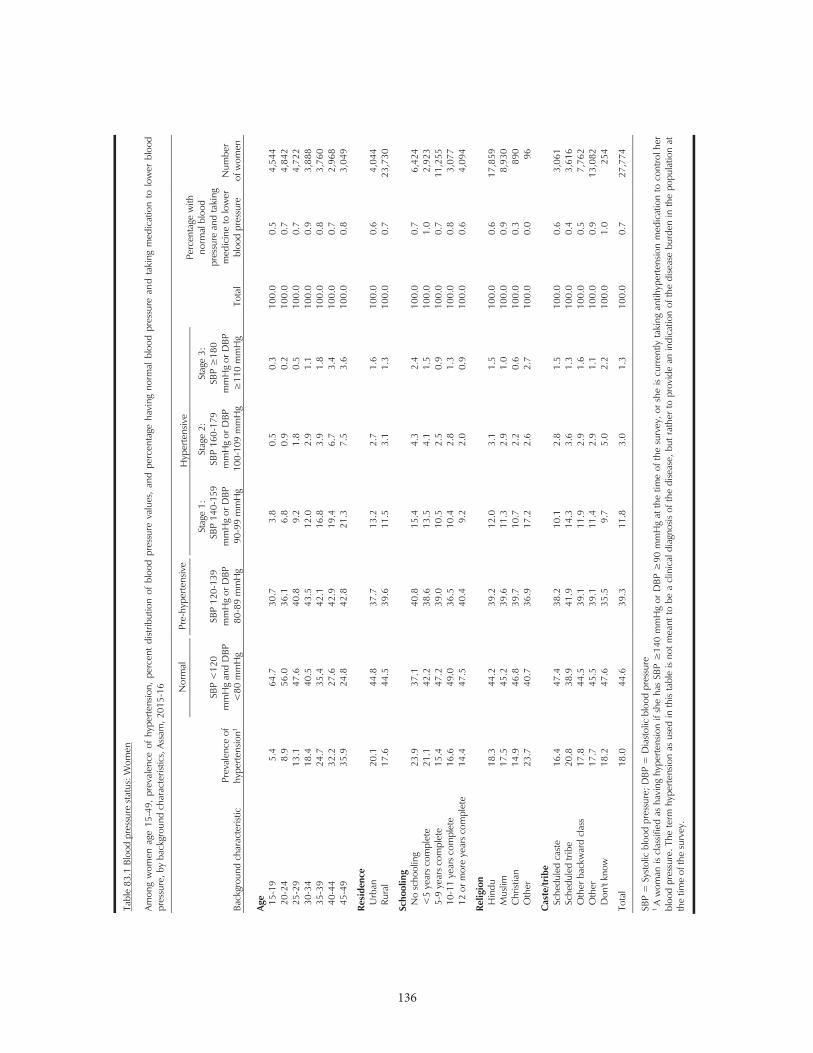
136
Tabl
e 83
.1 B
lood
pre
ssur
e st
atus
: Wom
en
Amon
g w
omen
age
15-
49,
prev
alen
ce o
f hy
pert
ensio
n, p
erce
nt d
istrib
utio
n of
blo
od p
ress
ure
valu
es,
and
perc
enta
ge h
avin
g no
rmal
blo
od p
ress
ure
and
taki
ng m
edic
atio
n to
low
er b
lood
pr
essu
re, b
y ba
ckgr
ound
cha
ract
erist
ics,
Ass
am, 2
015-
16
Back
grou
nd c
hara
cter
istic
Pr
eval
ence
of
hype
rtens
ion1
Nor
mal
Pre-
hype
rtens
ive
Hyp
erte
nsiv
e
Tota
l
Perc
enta
ge w
ith
norm
al b
lood
pr
essu
re a
nd ta
king
m
edic
ine
to lo
wer
bl
ood
pres
sure
N
umbe
r of
wom
en
SB
P <
120
m
mH
g an
d D
BP
<80
mm
Hg
SB
P 12
0-13
9 m
mH
g or
DBP
80
-89
mm
Hg
Stag
e 1:
SBP
140-
159
mm
Hg
or D
BP
90-9
9 m
mH
g
Stag
e 2:
SB
P 16
0-17
9 m
mH
g or
DBP
10
0-10
9 m
mH
g
Stag
e 3:
mm
Hg
or D
BP
Age
15
-19
5.
4 64
.7
30.7
3.
8 0.
5 0.
3 10
0.0
0.5
4,54
4 20
-24
8.
9 56
.0
36.1
6.
8 0.
9 0.
2 10
0.0
0.7
4,84
2 25
-29
13
.1
47.6
40
.8
9.2
1.8
0.5
100.
0 0.
7 4,
722
30-3
4
18.4
40
.5
43.5
12
.0
2.9
1.1
100.
0 0.
9 3,
888
35-3
9
24.7
35
.4
42.1
16
.8
3.9
1.8
100.
0 0.
8 3,
760
40-4
4
32.2
27
.6
42.9
19
.4
6.7
3.4
100.
0 0.
7 2,
968
45-4
9
35.9
24
.8
42.8
21
.3
7.5
3.6
100.
0 0.
8 3,
049
Resi
denc
e
Urb
an
20.1
44
.8
37.7
13
.2
2.7
1.6
100.
0 0.
6 4,
044
Rura
l 17
.6
44.5
39
.6
11.5
3.
1 1.
3 10
0.0
0.7
23,7
30
Scho
olin
g
No
scho
olin
g
23.9
37
.1
40.8
15
.4
4.3
2.4
100.
0 0.
7 6,
424
<5
year
s co
mpl
ete
21
.1
42.2
38
.6
13.5
4.
1 1.
5 10
0.0
1.0
2,92
3 5-
9 ye
ars
com
plet
e
15.4
47
.2
39.0
10
.5
2.5
0.9
100.
0 0.
7 11
,255
10
-11
year
s co
mpl
ete
16
.6
49.0
36
.5
10.4
2.
8 1.
3 10
0.0
0.8
3,07
7 12
or m
ore
year
s co
mpl
ete
14
.4
47.5
40
.4
9.2
2.0
0.9
100.
0 0.
6 4,
094
Relig
ion
H
indu
18
.3
44.2
39
.2
12.0
3.
1 1.
5 10
0.0
0.6
17,8
59
Mus
lim
17.5
45
.2
39.6
11
.3
2.9
1.0
100.
0 0.
9 8,
930
Chr
istia
n
14.9
46
.8
39.7
10
.7
2.2
0.6
100.
0 0.
3 89
0 O
ther
23
.7
40.7
36
.9
17.2
2.
6 2.
7 10
0.0
0.0
96
Cas
te/tr
ibe
Sc
hedu
led
cast
e
16.4
47
.4
38.2
10
.1
2.8
1.5
100.
0 0.
6 3,
061
Sche
dule
d tri
be
20.8
38
.9
41.9
14
.3
3.6
1.3
100.
0 0.
4 3,
616
Oth
er b
ackw
ard
clas
s 17
.8
44.5
39
.1
11.9
2.
9 1.
6 10
0.0
0.5
7,76
2 O
ther
17
.7
45.5
39
.1
11.4
2.
9 1.
1 10
0.0
0.9
13,0
82
Don
't kn
ow
18.2
47
.6
35.5
9.
7 5.
0 2.
2 10
0.0
1.0
254
Tota
l 18
.0
44.6
39
.3
11.8
3.
0 1.
3 10
0.0
0.7
27,7
74
SBP
= S
ysto
lic b
lood
pre
ssur
e; D
BP =
Dia
stol
ic b
lood
pre
ssur
e 1
A w
oman
is c
lass
ified
as
havi
ng h
yper
tens
ion
if sh
e ha
s SB
P D
BP
urre
ntly
taki
ng a
ntih
yper
tens
ion
med
icat
ion
to c
ontro
l her
bl
ood
pres
sure
. The
term
hyp
erte
nsio
n as
use
d in
this
tabl
e is
not m
eant
to
be a
clin
ical
dia
gnos
is of
the
dise
ase,
but
rat
her
to p
rovi
de a
n in
dica
tion
of th
e di
seas
e bu
rden
in th
e po
pula
tion
at
the
time
of th
e su
rvey
.
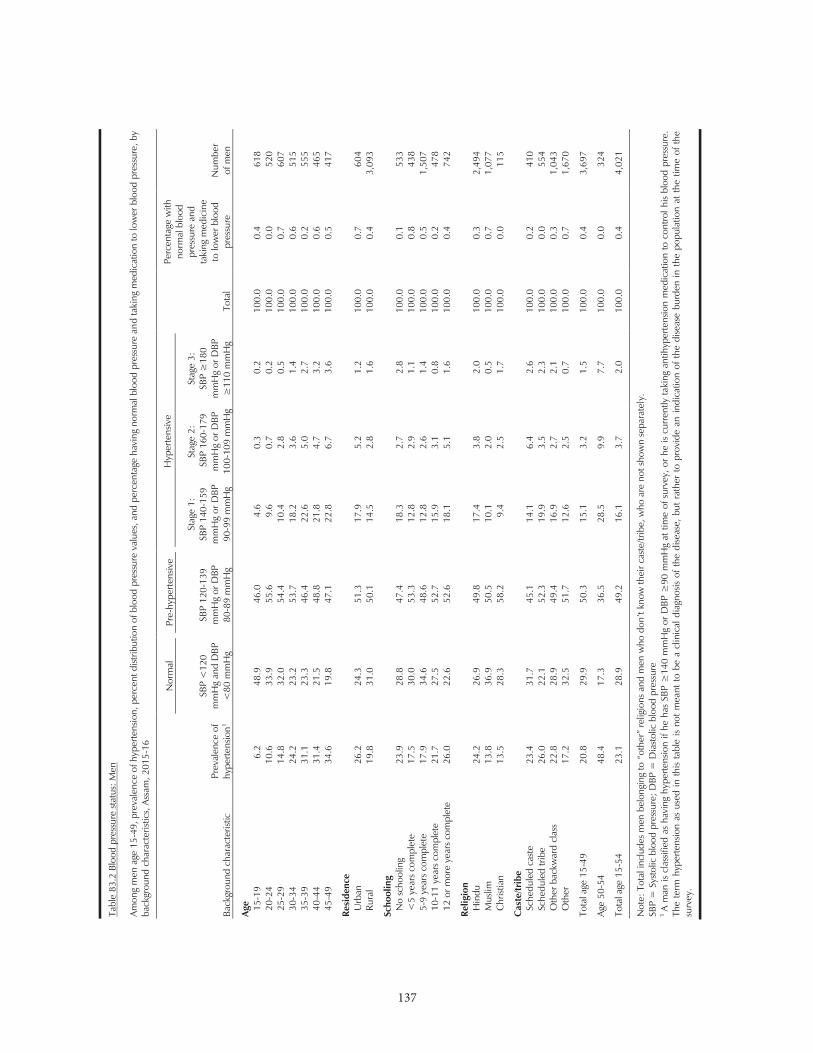
137
137
Tabl
e 83
.2 B
lood
pre
ssur
e st
atus
: Men
Amon
g m
en a
ge 1
5-49
, pre
vale
nce
of h
yper
tens
ion,
per
cent
dist
ribut
ion
of b
lood
pre
ssur
e va
lues
, and
per
cent
age
havi
ng n
orm
al b
lood
pre
ssur
e an
d ta
king
med
icat
ion
to lo
wer
blo
od p
ress
ure,
by
back
grou
nd c
hara
cter
istic
s, A
ssam
, 201
5-16
Back
grou
nd c
hara
cter
istic
Pr
eval
ence
of
hype
rtens
ion1
Nor
mal
Pre-
hype
rtens
ive
Hyp
erte
nsiv
e
Tota
l
Perc
enta
ge w
ith
norm
al b
lood
pr
essu
re a
nd
taki
ng m
edic
ine
to lo
wer
blo
od
pres
sure
N
umbe
r of
men
SB
P <
120
m
mH
g an
d D
BP
<80
mm
Hg
SB
P 12
0-13
9
mm
Hg
or D
BP
80-8
9 m
mH
g
Stag
e 1:
SBP
140-
159
mm
Hg
or D
BP
90-9
9 m
mH
g
Stag
e 2:
SBP
160
-179
m
mH
g or
DBP
10
0-10
9 m
mH
g
Stag
e 3:
m
mH
g or
DBP
11
0 m
mH
g
Age
15
-19
6.
2 48
.9
46.0
4.
6 0.
3 0.
2 10
0.0
0.4
618
20-2
4
10.6
33
.9
55.6
9.
6 0.
7 0.
2 10
0.0
0.0
520
25-2
9
14.8
32
.0
54.4
10
.4
2.8
0.5
100.
0 0.
7 60
7 30
-34
24
.2
23.2
53
.7
18.2
3.
6 1.
4 10
0.0
0.6
515
35-3
9
31.1
23
.3
46.4
22
.6
5.0
2.7
100.
0 0.
2 55
540
-44
31
.4
21.5
48
.8
21.8
4.
7 3.
2 10
0.0
0.6
465
45-4
9
34.6
19
.8
47.1
22
.8
6.7
3.6
100.
0 0.
5 41
7
Resi
denc
e
Urb
an
26.2
24
.3
51.3
17
.9
5.2
1.2
100.
0 0.
7 60
4 Ru
ral
19.8
31
.0
50.1
14
.5
2.8
1.6
100.
0 0.
4 3,
093
Scho
olin
g
N
o sc
hool
ing
23
.9
28.8
47
.4
18.3
2.
7 2.
8 10
0.0
0.1
533
<5
year
s co
mpl
ete
17
.5
30.0
53
.3
12.8
2.
9 1.
1 10
0.0
0.8
438
5-9
year
s co
mpl
ete
17
.9
34.6
48
.6
12.8
2.
6 1.
4 10
0.0
0.5
1,50
7 10
-11
year
s co
mpl
ete
21
.7
27.5
52
.7
15.9
3.
1 0.
8 10
0.0
0.2
478
12 o
r mor
e ye
ars
com
plet
e
26.0
22
.6
52.6
18
.1
5.1
1.6
100.
0 0.
4 74
2
Relig
ion
H
indu
24
.2
26.9
49
.8
17.4
3.
8 2.
0 10
0.0
0.3
2,49
4 M
uslim
13
.8
36.9
50
.5
10.1
2.
0 0.
5 10
0.0
0.7
1,07
7 C
hrist
ian
13
.5
28.3
58
.2
9.4
2.5
1.7
100.
0 0.
0 11
5
Cas
te/tr
ibe
Sc
hedu
led
cast
e
23.4
31
.7
45.1
14
.1
6.4
2.6
100.
0 0.
2 41
0 Sc
hedu
led
tribe
26
.0
22.1
52
.3
19.9
3.
5 2.
3 10
0.0
0.0
554
Oth
er b
ackw
ard
clas
s
22.8
28
.9
49.4
16
.9
2.7
2.1
100.
0 0.
3 1,
043
Oth
er
17.2
32
.5
51.7
12
.6
2.5
0.7
100.
0 0.
7 1,
670
Tota
l age
15-
49
20.8
29
.9
50.3
15
.1
3.2
1.5
100.
0 0.
4 3,
697
Age
50-5
4
48.4
17
.3
36.5
28
.5
9.9
7.7
100.
0 0.
0 32
4
Tota
l age
15-
54
23.1
28
.9
49.2
16
.1
3.7
2.0
100.
0 0.
4 4,
021
y.
SBP
= S
ysto
lic b
lood
pre
ssur
e; D
BP =
Dia
stol
ic b
lood
pre
ssur
e 1
A m
an is
cla
ssifi
ed a
s ha
ving
hyp
erte
nsio
n if
he h
as S
BP
his
bloo
d pr
essu
re.
The
term
hyp
erte
nsio
n as
use
d in
this
tabl
e is
not
mea
nt t
o be
a c
linic
al d
iagn
osis
of t
he d
iseas
e, b
ut r
athe
r to
pro
vide
an
indi
catio
n of
the
dise
ase
burd
en in
the
pop
ulat
ion
at t
he t
ime
of t
he
surv
ey.
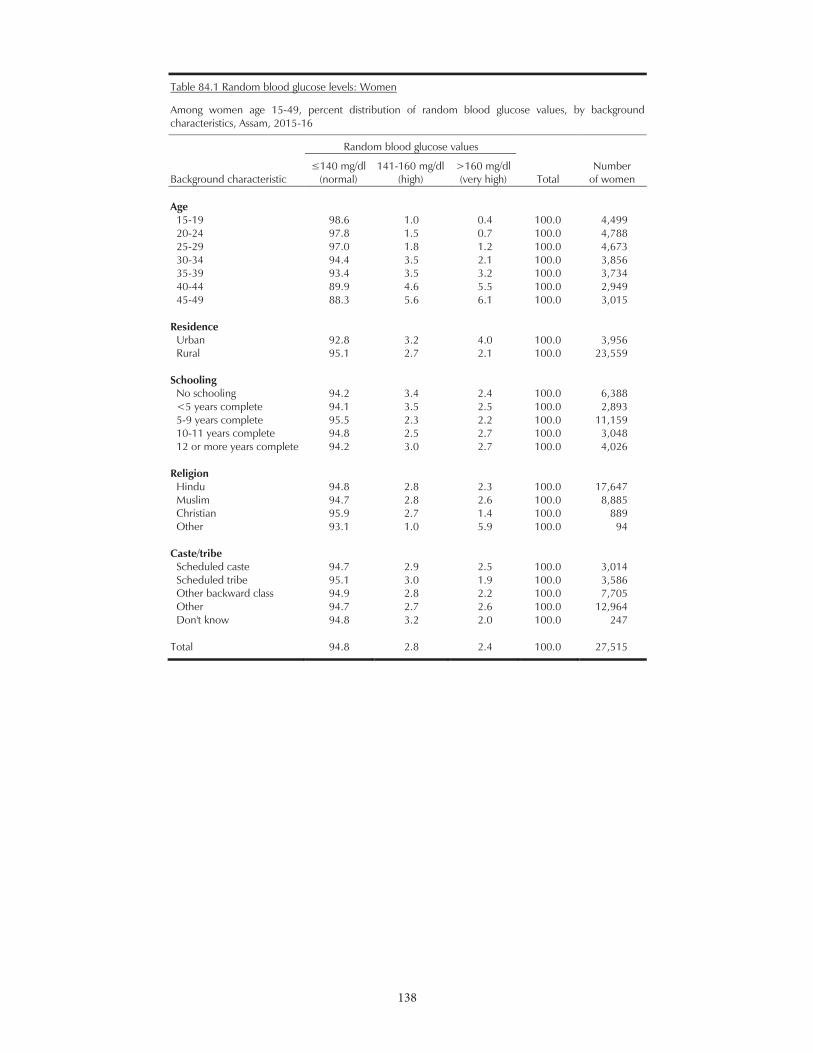
138
138
Table 84.1 Random blood glucose levels: Women
Among women age 15-49, percent distribution of random blood glucose values, by background characteristics, Assam, 2015-16
Background characteristic
Random blood glucose values
Total Number
of women (normal) 141-160 mg/dl
(high) >160 mg/dl (very high)
Age
15-19 98.6 1.0 0.4 100.0 4,499 20-24 97.8 1.5 0.7 100.0 4,788 25-29 97.0 1.8 1.2 100.0 4,673 30-34 94.4 3.5 2.1 100.0 3,856 35-39 93.4 3.5 3.2 100.0 3,734 40-44 89.9 4.6 5.5 100.0 2,949 45-49 88.3 5.6 6.1 100.0 3,015
Residence Urban 92.8 3.2 4.0 100.0 3,956 Rural 95.1 2.7 2.1 100.0 23,559
Schooling No schooling 94.2 3.4 2.4 100.0 6,388 <5 years complete 94.1 3.5 2.5 100.0 2,893 5-9 years complete 95.5 2.3 2.2 100.0 11,159 10-11 years complete 94.8 2.5 2.7 100.0 3,048 12 or more years complete 94.2 3.0 2.7 100.0 4,026
Religion Hindu 94.8 2.8 2.3 100.0 17,647 Muslim 94.7 2.8 2.6 100.0 8,885 Christian 95.9 2.7 1.4 100.0 889 Other 93.1 1.0 5.9 100.0 94
Caste/tribe Scheduled caste 94.7 2.9 2.5 100.0 3,014 Scheduled tribe 95.1 3.0 1.9 100.0 3,586 Other backward class 94.9 2.8 2.2 100.0 7,705 Other 94.7 2.7 2.6 100.0 12,964 Don't know 94.8 3.2 2.0 100.0 247
Total 94.8 2.8 2.4 100.0 27,515
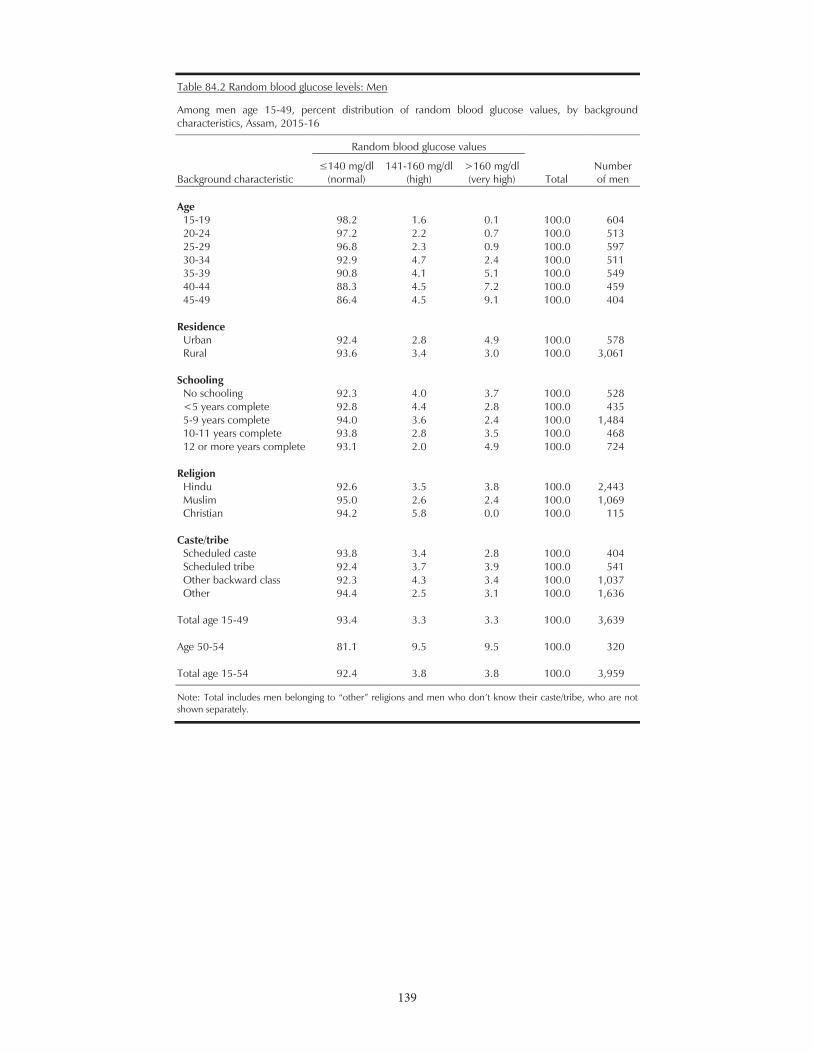
139
139
Table 84.2 Random blood glucose levels: Men
Among men age 15-49, percent distribution of random blood glucose values, by background characteristics, Assam, 2015-16
Background characteristic
Random blood glucose values
Total Number of men (normal)
141-160 mg/dl (high)
>160 mg/dl (very high)
Age
15-19 98.2 1.6 0.1 100.0 604 20-24 97.2 2.2 0.7 100.0 513 25-29 96.8 2.3 0.9 100.0 597 30-34 92.9 4.7 2.4 100.0 511 35-39 90.8 4.1 5.1 100.0 549 40-44 88.3 4.5 7.2 100.0 459 45-49 86.4 4.5 9.1 100.0 404
Residence Urban 92.4 2.8 4.9 100.0 578 Rural 93.6 3.4 3.0 100.0 3,061
Schooling No schooling 92.3 4.0 3.7 100.0 528 <5 years complete 92.8 4.4 2.8 100.0 435 5-9 years complete 94.0 3.6 2.4 100.0 1,484 10-11 years complete 93.8 2.8 3.5 100.0 468 12 or more years complete 93.1 2.0 4.9 100.0 724
Religion Hindu 92.6 3.5 3.8 100.0 2,443 Muslim 95.0 2.6 2.4 100.0 1,069 Christian 94.2 5.8 0.0 100.0 115
Caste/tribe Scheduled caste 93.8 3.4 2.8 100.0 404 Scheduled tribe 92.4 3.7 3.9 100.0 541 Other backward class 92.3 4.3 3.4 100.0 1,037 Other 94.4 2.5 3.1 100.0 1,636
Total age 15-49 93.4 3.3 3.3 100.0 3,639
Age 50-54 81.1 9.5 9.5 100.0 320
Total age 15-54 92.4 3.8 3.8 100.0 3,959
Note: shown separately.
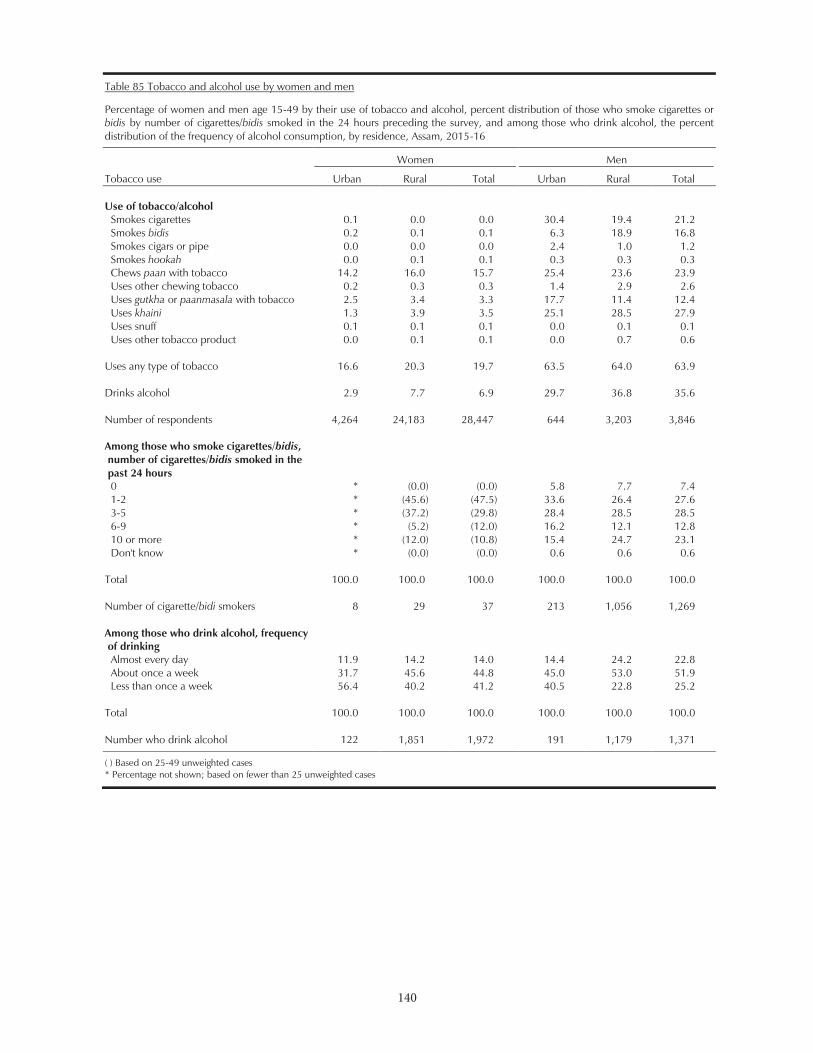
140
140
Table 85 Tobacco and alcohol use by women and men
Percentage of women and men age 15-49 by their use of tobacco and alcohol, percent distribution of those who smoke cigarettes or bidis by number of cigarettes/bidis smoked in the 24 hours preceding the survey, and among those who drink alcohol, the percent distribution of the frequency of alcohol consumption, by residence, Assam, 2015-16
Tobacco use
Women
Men
Urban Rural Total Urban Rural Total Use of tobacco/alcohol
Smokes cigarettes 0.1 0.0 0.0 30.4 19.4 21.2 Smokes bidis 0.2 0.1 0.1 6.3 18.9 16.8 Smokes cigars or pipe 0.0 0.0 0.0 2.4 1.0 1.2 Smokes hookah 0.0 0.1 0.1 0.3 0.3 0.3 Chews paan with tobacco 14.2 16.0 15.7 25.4 23.6 23.9 Uses other chewing tobacco 0.2 0.3 0.3 1.4 2.9 2.6 Uses gutkha or paanmasala with tobacco 2.5 3.4 3.3 17.7 11.4 12.4 Uses khaini 1.3 3.9 3.5 25.1 28.5 27.9 Uses snuff 0.1 0.1 0.1 0.0 0.1 0.1 Uses other tobacco product 0.0 0.1 0.1 0.0 0.7 0.6
Uses any type of tobacco 16.6 20.3 19.7 63.5 64.0 63.9
Drinks alcohol 2.9 7.7 6.9 29.7 36.8 35.6
Number of respondents 4,264 24,183 28,447 644 3,203 3,846
Among those who smoke cigarettes/bidis, number of cigarettes/bidis smoked in the past 24 hours
0 * (0.0) (0.0) 5.8 7.7 7.4 1-2 * (45.6) (47.5) 33.6 26.4 27.6 3-5 * (37.2) (29.8) 28.4 28.5 28.5 6-9 * (5.2) (12.0) 16.2 12.1 12.8 10 or more * (12.0) (10.8) 15.4 24.7 23.1 Don't know * (0.0) (0.0) 0.6 0.6 0.6
Total 100.0 100.0 100.0 100.0 100.0 100.0
Number of cigarette/bidi smokers 8 29 37 213 1,056 1,269
Among those who drink alcohol, frequency of drinking
Almost every day 11.9 14.2 14.0 14.4 24.2 22.8 About once a week 31.7 45.6 44.8 45.0 53.0 51.9 Less than once a week 56.4 40.2 41.2 40.5 22.8 25.2
Total 100.0 100.0 100.0 100.0 100.0 100.0
Number who drink alcohol 122 1,851 1,972 191 1,179 1,371
( ) Based on 25-49 unweighted cases * Percentage not shown; based on fewer than 25 unweighted cases
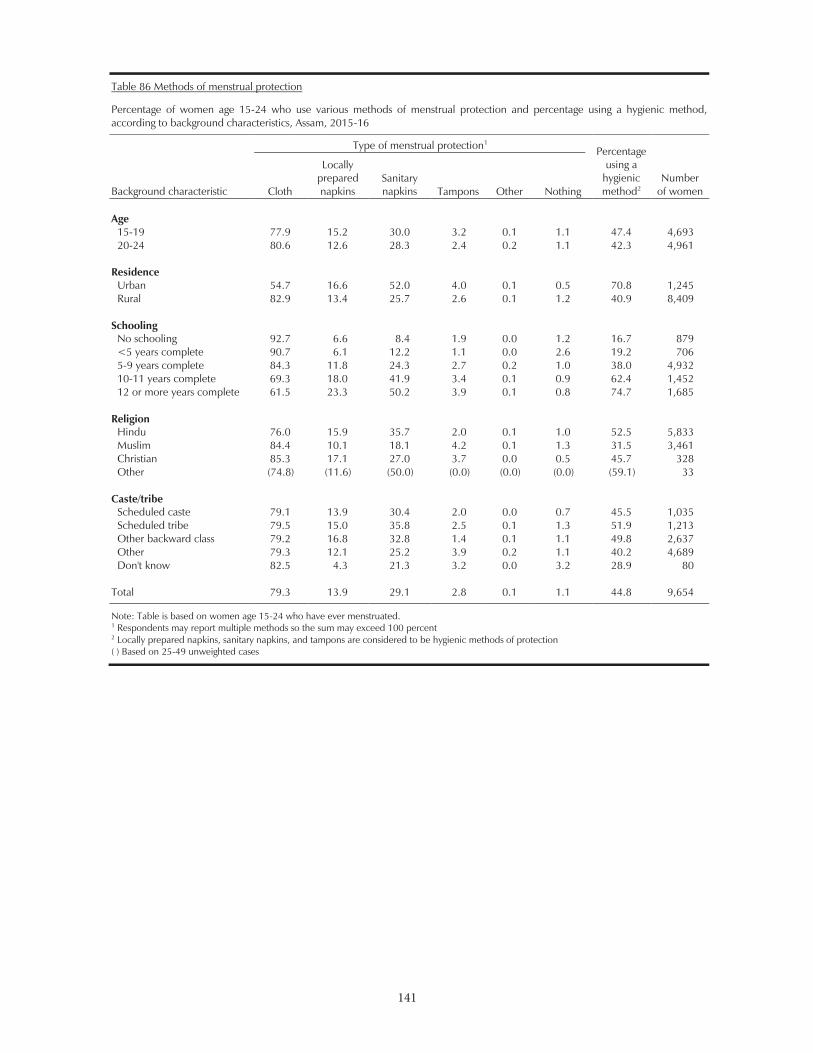
141
141
Table 86 Methods of menstrual protection
Percentage of women age 15-24 who use various methods of menstrual protection and percentage using a hygienic method, according to background characteristics, Assam, 2015-16
Background characteristic
Type of menstrual protection1 Percentage
using a hygienic method2
Number of women Cloth
Locally prepared napkins
Sanitary napkins Tampons Other Nothing
Age
15-19 77.9 15.2 30.0 3.2 0.1 1.1 47.4 4,693 20-24 80.6 12.6 28.3 2.4 0.2 1.1 42.3 4,961
Residence Urban 54.7 16.6 52.0 4.0 0.1 0.5 70.8 1,245 Rural 82.9 13.4 25.7 2.6 0.1 1.2 40.9 8,409
Schooling No schooling 92.7 6.6 8.4 1.9 0.0 1.2 16.7 879 <5 years complete 90.7 6.1 12.2 1.1 0.0 2.6 19.2 706 5-9 years complete 84.3 11.8 24.3 2.7 0.2 1.0 38.0 4,932 10-11 years complete 69.3 18.0 41.9 3.4 0.1 0.9 62.4 1,452 12 or more years complete 61.5 23.3 50.2 3.9 0.1 0.8 74.7 1,685
Religion Hindu 76.0 15.9 35.7 2.0 0.1 1.0 52.5 5,833 Muslim 84.4 10.1 18.1 4.2 0.1 1.3 31.5 3,461 Christian 85.3 17.1 27.0 3.7 0.0 0.5 45.7 328 Other (74.8) (11.6) (50.0) (0.0) (0.0) (0.0) (59.1) 33
Caste/tribe Scheduled caste 79.1 13.9 30.4 2.0 0.0 0.7 45.5 1,035 Scheduled tribe 79.5 15.0 35.8 2.5 0.1 1.3 51.9 1,213 Other backward class 79.2 16.8 32.8 1.4 0.1 1.1 49.8 2,637 Other 79.3 12.1 25.2 3.9 0.2 1.1 40.2 4,689 Don't know 82.5 4.3 21.3 3.2 0.0 3.2 28.9 80
Total 79.3 13.9 29.1 2.8 0.1 1.1 44.8 9,654
Note: Table is based on women age 15-24 who have ever menstruated. 1 Respondents may report multiple methods so the sum may exceed 100 percent 2 Locally prepared napkins, sanitary napkins, and tampons are considered to be hygienic methods of protection ( ) Based on 25-49 unweighted cases

142
142
Tabl
e 87
Em
ploy
men
t and
cas
h ea
rnin
gs o
f wom
en a
nd m
en
Perc
enta
ge o
f wom
en a
nd m
en a
ge 1
5-49
who
wer
e em
ploy
ed a
t any
tim
e in
the
12 m
onth
s pr
eced
ing
the
surv
ey a
nd p
erce
nt d
istrib
utio
n of
wom
en a
nd m
en
empl
oyed
in th
e 12
mon
ths
prec
edin
g th
e su
rvey
by
sect
or o
f ear
ning
s an
d ty
pe o
f em
ploy
men
t, ac
cord
ing
to a
ge, A
ssam
, 201
5-16
Age
Perc
enta
ge
empl
oyed
N
umbe
r of
resp
onde
nts
Perc
ent d
istrib
utio
n of
em
ploy
ed
resp
onde
nts
by ty
pe o
f ear
ning
s
Tota
l
Perc
ent d
istrib
utio
n of
em
ploy
ed
resp
onde
nts
by s
ecto
r
Tota
l
Num
ber o
f em
ploy
ed
resp
onde
nts
Cas
h
only
C
ash
and
in-k
ind
In-k
ind
only
N
ot
paid
Ag
ricul
ture
N
on-a
gric
ultu
re
WO
MEN
15-1
9 9.
4 73
2 62
.0
24.3
1.
6 12
.1
100.
0 56
.6
43.4
10
0.0
69
20-2
4 11
.4
800
64.2
21
.8
6.5
7.5
100.
0 43
.0
57.0
10
0.0
91
25-2
9 21
.6
806
77.6
18
.3
1.8
2.2
100.
0 32
.6
67.4
10
0.0
174
30-3
4 20
.7
634
75.1
15
.6
1.4
7.9
100.
0 37
.1
62.9
10
0.0
131
35-3
9 22
.9
635
78.0
13
.5
3.0
5.4
100.
0 37
.7
62.3
10
0.0
146
40-4
4 23
.4
495
73.0
17
.4
1.8
7.8
100.
0 27
.5
72.5
10
0.0
116
45-4
9 25
.8
511
72.7
19
.4
1.0
6.9
100.
0 38
.7
61.3
10
0.0
132
Tota
l 18
.6
4,61
2 73
.3
18.0
2.
3 6.
5 10
0.0
37.4
62
.6
100.
0 85
9
MEN
15-1
9 42
.5
645
74.8
7.
0 3.
8 14
.4
100.
0 41
.1
58.9
10
0.0
274
20-2
4 77
.7
547
81.6
10
.2
1.5
6.6
100.
0 34
.6
65.4
10
0.0
425
25-2
9 91
.9
626
85.3
9.
5 1.
7 3.
5 10
0.0
35.0
65
.0
100.
0 57
6 30
-34
97.6
53
0 85
.0
8.9
1.8
4.3
100.
0 37
.4
62.6
10
0.0
517
35-3
9 99
.2
579
83.9
9.
8 2.
8 3.
5 10
0.0
37.0
63
.0
100.
0 57
4 40
-44
98.7
48
2 87
.7
8.6
1.4
2.2
100.
0 39
.2
60.8
10
0.0
476
45-4
9 97
.5
437
83.6
10
.8
3.6
1.9
100.
0 41
.8
58.2
10
0.0
426
Tota
l 85
.0
3,84
6 83
.8
9.4
2.3
4.5
100.
0 37
.7
62.3
10
0.0
3,26
8
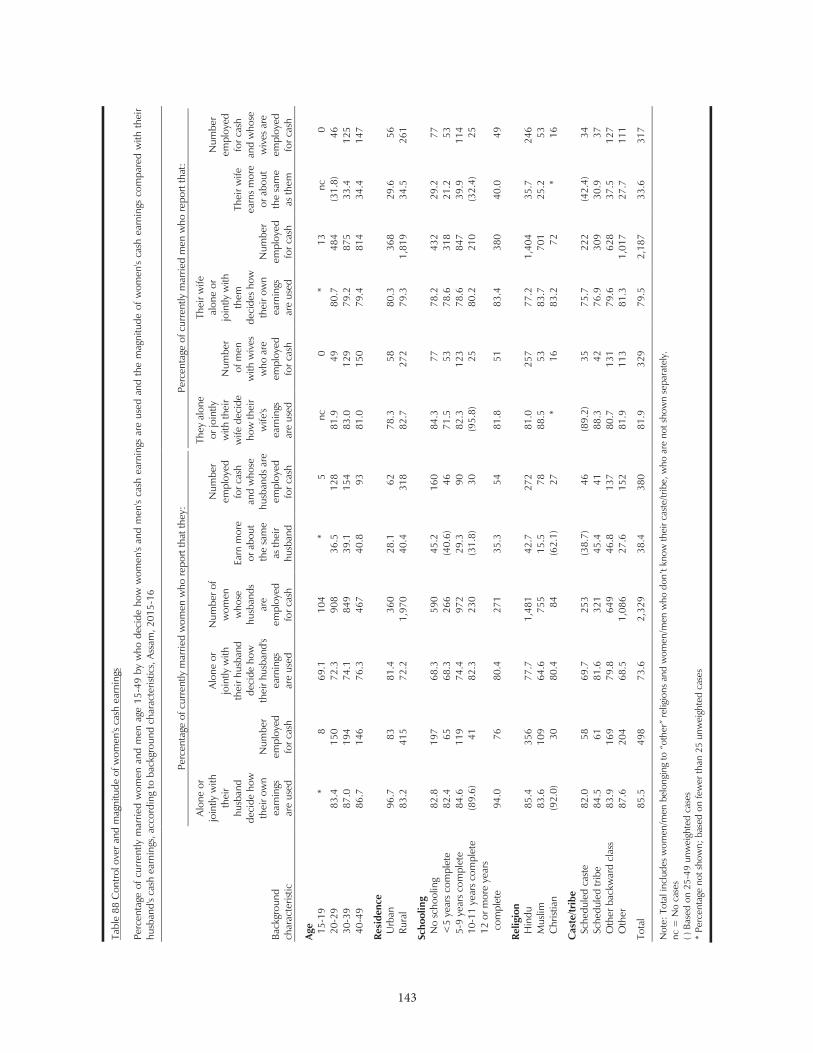
143
143
Tabl
e 88
Con
trol
ove
r and
mag
nitu
de o
f wom
en's
cash
ear
ning
s
Perc
enta
ge o
f cur
rent
ly m
arrie
d w
omen
and
men
age
15-
49 b
y w
ho d
ecid
e ho
w w
omen
's an
d m
en's
cash
ear
ning
s ar
e us
ed a
nd th
e m
agni
tude
of w
omen
's ca
sh e
arni
ngs
com
pare
d w
ith th
eir
husb
and'
s ca
sh e
arni
ngs,
acc
ordi
ng to
bac
kgro
und
char
acte
ristic
s, A
ssam
, 201
5-16
Back
grou
nd
char
acte
ristic
Perc
enta
ge o
f cur
rent
ly m
arrie
d w
omen
who
repo
rt th
at th
ey:
Perc
enta
ge o
f cur
rent
ly m
arrie
d m
en w
ho re
port
that
:
Alon
e or
jo
intly
with
th
eir
husb
and
deci
de h
ow
thei
r ow
n ea
rnin
gs
are
used
Num
ber
empl
oyed
fo
r cas
h
Alon
e or
jo
intly
with
th
eir h
usba
nd
deci
de h
ow
thei
r hus
band
's ea
rnin
gs
are
used
Num
ber o
f w
omen
w
hose
hu
sban
ds
are
em
ploy
ed
for c
ash
Earn
mor
e or
abo
ut
the
sam
e
as th
eir
husb
and
Num
ber
empl
oyed
fo
r cas
h
and
who
se
husb
ands
are
em
ploy
ed
for c
ash
They
alo
ne
or jo
intly
w
ith th
eir
wife
dec
ide
how
thei
r w
ife's
earn
ings
ar
e us
ed
Num
ber
of m
en
with
wiv
es
who
are
em
ploy
ed
for c
ash
Thei
r wife
al
one
or
join
tly w
ith
them
de
cide
s ho
w
thei
r ow
n ea
rnin
gs
are
used
Num
ber
empl
oyed
fo
r cas
h
Thei
r wife
ea
rns
mor
e or
abo
ut
the
sam
e as
them
Num
ber
empl
oyed
fo
r cas
h
and
who
se
wiv
es a
re
empl
oyed
fo
r cas
h
Age
15-1
9
* 8
69.1
10
4 *
5 nc
0
* 13
nc
0
20-2
9
83.4
15
0 72
.3
908
36.5
12
8 81
.9
49
80.7
48
4 (3
1.8)
46
30
-39
87
.0
194
74.1
84
9 39
.1
154
83.0
12
9 79
.2
875
33.4
12
5 40
-49
86
.7
146
76.3
46
7 40
.8
93
81.0
15
0 79
.4
814
34.4
14
7
Resi
denc
e
U
rban
96
.7
83
81.4
36
0 28
.1
62
78.3
58
80
.3
368
29.6
56
Ru
ral
83.2
41
5 72
.2
1,97
0 40
.4
318
82.7
27
2 79
.3
1,81
9 34
.5
261
Scho
olin
g
N
o sc
hool
ing
82
.8
197
68.3
59
0 45
.2
160
84.3
77
78
.2
432
29.2
77
<
5 ye
ars
com
plet
e
82.4
65
68
.3
266
(40.
6)
46
71.5
53
78
.6
318
21.2
53
5-
9 ye
ars
com
plet
e
84.6
11
9 74
.4
972
29.3
90
82
.3
123
78.6
84
7 39
.9
114
10-1
1 ye
ars
com
plet
e
(89.
6)
41
82.3
23
0 (3
1.8)
30
(9
5.8)
25
80
.2
210
(32.
4)
25
12 o
r mor
e ye
ars
com
plet
e
94.0
76
80
.4
271
35.3
54
81
.8
51
83.4
38
0 40
.0
49
Relig
ion
Hin
du
85.4
35
6 77
.7
1,48
1 42
.7
272
81.0
25
7 77
.2
1,40
4 35
.7
246
Mus
lim
83.6
10
9 64
.6
755
15.5
78
88
.5
53
83.7
70
1 25
.2
53
Chr
istia
n
(92.
0)
30
80.4
84
(6
2.1)
27
*
16
83.2
72
*
16
Cas
te/tr
ibe
Sche
dule
d ca
ste
82
.0
58
69.7
25
3 (3
8.7)
46
(8
9.2)
35
75
.7
222
(42.
4)
34
Sche
dule
d tri
be
84.5
61
81
.6
321
45.4
41
88
.3
42
76.9
30
9 30
.9
37
Oth
er b
ackw
ard
clas
s
83.9
16
9 79
.8
649
46.8
13
7 80
.7
131
79.6
62
8 37
.5
127
Oth
er
87.6
20
4 68
.5
1,08
6 27
.6
152
81.9
11
3 81
.3
1,01
7 27
.7
111
Tota
l 85
.5
498
73.6
2,
329
38.4
38
0 81
.9
329
79.5
2,
187
33.6
31
7 N
ote:
Tot
al in
clud
es w
omen
/men
bel
ongi
ng
nc
= N
o ca
ses
( ) B
ased
on
25-4
9 un
wei
ghte
d ca
ses
* Pe
rcen
tage
not
sho
wn;
bas
ed o
n fe
wer
than
25
unw
eigh
ted
case
s
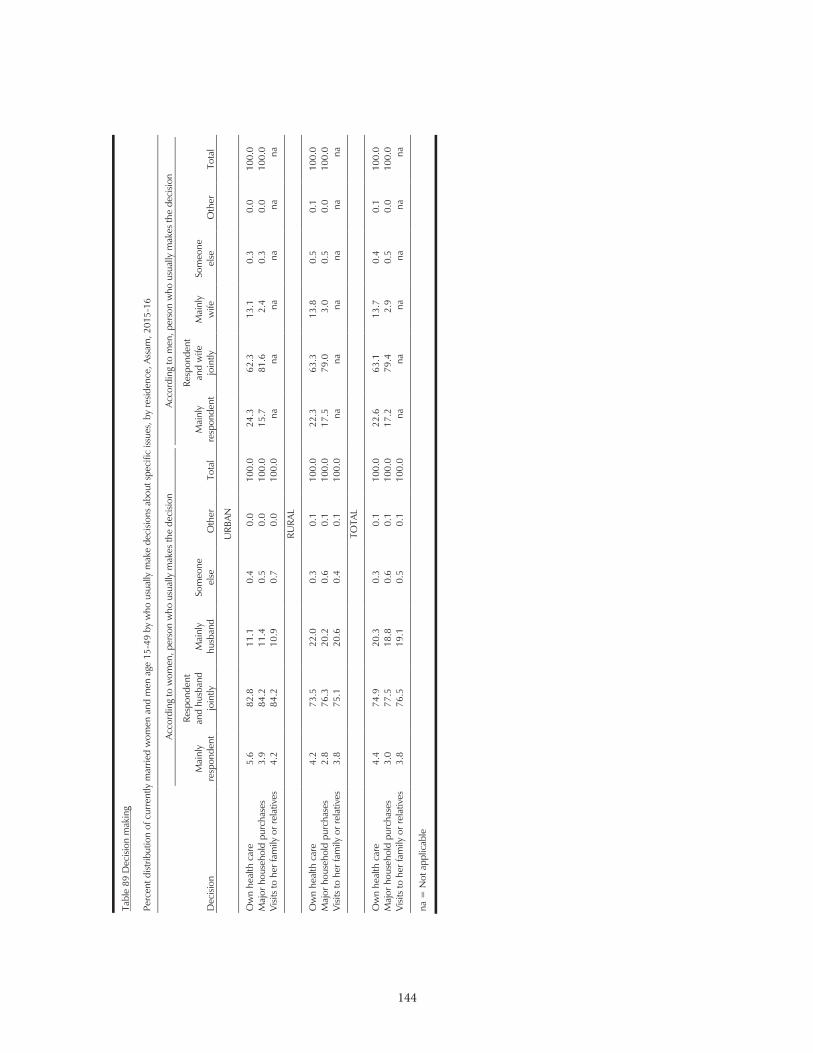
144
144
Tabl
e 89
Dec
ision
mak
ing
Perc
ent d
istrib
utio
n of
cur
rent
ly m
arrie
d w
omen
and
men
age
15-
49 b
y w
ho u
sual
ly m
ake
deci
sions
abo
ut sp
ecifi
c iss
ues,
by
resid
ence
, Ass
am, 2
015-
16
Dec
ision
Acco
rdin
g to
wom
en, p
erso
n w
ho u
sual
ly m
akes
the
deci
sion
Acco
rdin
g to
men
, per
son
who
usu
ally
mak
es th
e de
cisio
n
Mai
nly
resp
onde
nt
Resp
onde
nt
and
husb
and
join
tly
Mai
nly
husb
and
Som
eone
el
se
Oth
er
Tota
l M
ainl
y re
spon
dent
Resp
onde
nt
and
wife
jo
intly
M
ainl
y w
ife
Som
eone
el
se
Oth
er
Tota
l
URB
AN
Ow
n he
alth
car
e 5.
6 82
.8
11.1
0.
4 0.
0 10
0.0
24.3
62
.3
13.1
0.
3 0.
0 10
0.0
Maj
or h
ouse
hold
pur
chas
es
3.9
84.2
11
.4
0.5
0.0
100.
0 15
.7
81.6
2.
4 0.
3 0.
0 10
0.0
Visit
s to
her
fam
ily o
r rel
ativ
es
4.2
84.2
10
.9
0.7
0.0
100.
0 na
na
na
na
na
na
RURA
L
Ow
n he
alth
car
e 4.
2 73
.5
22.0
0.
3 0.
1 10
0.0
22.3
63
.3
13.8
0.
5 0.
1 10
0.0
Maj
or h
ouse
hold
pur
chas
es
2.8
76.3
20
.2
0.6
0.1
100.
0 17
.5
79.0
3.
0 0.
5 0.
0 10
0.0
Visit
s to
her
fam
ily o
r rel
ativ
es
3.8
75.1
20
.6
0.4
0.1
100.
0 na
na
na
na
na
na
TOTA
L
Ow
n he
alth
car
e 4.
4 74
.9
20.3
0.
3 0.
1 10
0.0
22.6
63
.1
13.7
0.
4 0.
1 10
0.0
Maj
or h
ouse
hold
pur
chas
es
3.0
77.5
18
.8
0.6
0.1
100.
0 17
.2
79.4
2.
9 0.
5 0.
0 10
0.0
Visit
s to
her
fam
ily o
r rel
ativ
es
3.8
76.5
19
.1
0.5
0.1
100.
0 na
na
na
na
na
na
na
= N
ot a
pplic
able
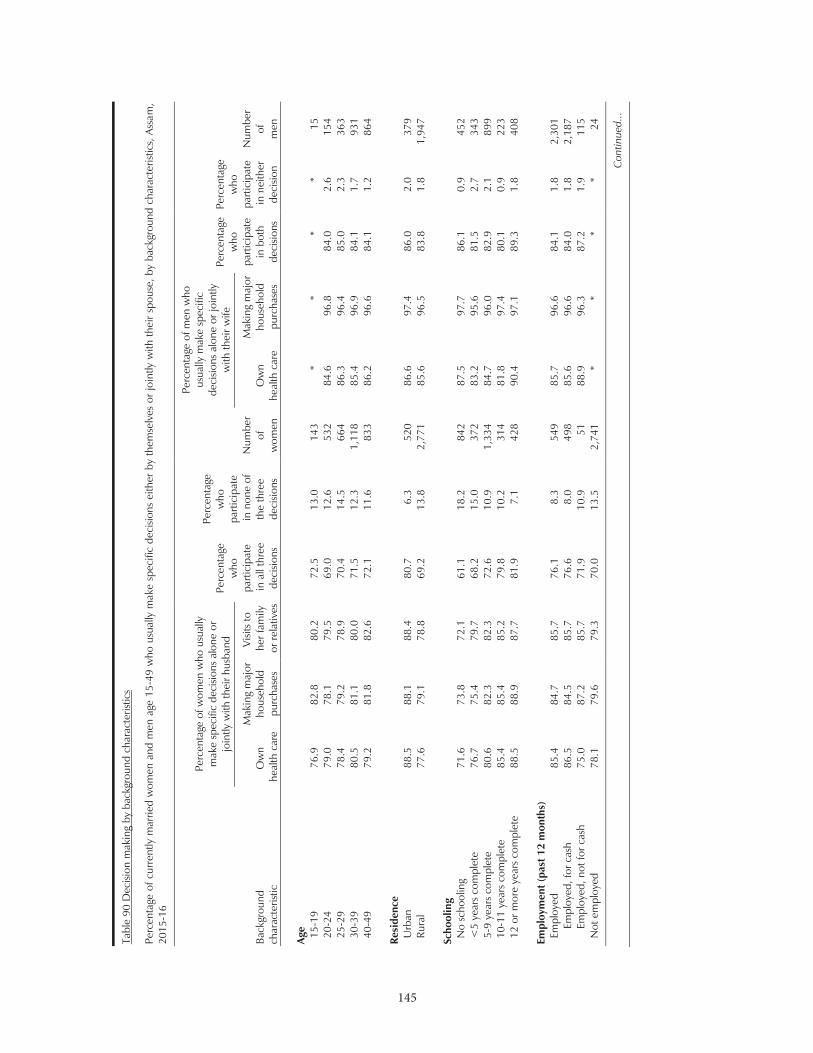
145
45
Tabl
e 90
Dec
ision
mak
ing
by b
ackg
roun
d ch
arac
teris
tics
Perc
enta
ge o
f cur
rent
ly m
arrie
d w
omen
and
men
age
15-
49 w
ho u
sual
ly m
ake
spec
ific
deci
sions
eith
er b
y th
emse
lves
or
join
tly w
ith th
eir
spou
se, b
y ba
ckgr
ound
cha
ract
erist
ics,
Ass
am,
2015
-16
Back
grou
nd
char
acte
ristic
Perc
enta
ge o
f wom
en w
ho u
sual
ly
mak
e sp
ecifi
c de
cisio
ns a
lone
or
join
tly w
ith th
eir h
usba
nd
Perc
enta
ge
who
pa
rtic
ipat
e in
all
thre
e de
cisio
ns
Perc
enta
ge
who
pa
rtic
ipat
e in
non
e of
th
e th
ree
deci
sions
Num
ber
of
wom
en
Perc
enta
ge o
f men
who
us
ually
mak
e sp
ecifi
c de
cisio
ns a
lone
or j
oint
ly
with
thei
r wife
Perc
enta
ge
who
pa
rtic
ipat
e
in b
oth
deci
sions
Perc
enta
ge
who
pa
rtic
ipat
e in
nei
ther
de
cisio
n
Num
ber
of
men
O
wn
hea
lth c
are
Mak
ing
maj
or
hous
ehol
d pu
rcha
ses
Visit
s to
h
er fa
mily
o
r rel
ativ
es
Ow
n
heal
th c
are
Mak
ing
maj
or
hous
ehol
d pu
rcha
ses
Age
15
-19
76
.9
82.8
80
.2
72.5
13
.0
143
* *
* *
15
20-2
4
79.0
78
.1
79.5
69
.0
12.6
53
2 84
.6
96.8
84
.0
2.6
154
25-2
9
78.4
79
.2
78.9
70
.4
14.5
66
4 86
.3
96.4
85
.0
2.3
363
30-3
9
80.5
81
.1
80.0
71
.5
12.3
1,
118
85.4
96
.9
84.1
1.
7 93
1 40
-49
79
.2
81.8
82
.6
72.1
11
.6
833
86.2
96
.6
84.1
1.
2 86
4
Resi
denc
e
Urb
an
88.5
88
.1
88.4
80
.7
6.3
520
86.6
97
.4
86.0
2.
0 37
9 Ru
ral
77.6
79
.1
78.8
69
.2
13.8
2,
771
85.6
96
.5
83.8
1.
8 1,
947
Sc
hool
ing
N
o sc
hool
ing
71
.6
73.8
72
.1
61.1
18
.2
842
87.5
97
.7
86.1
0.
9 45
2 <
5 ye
ars
com
plet
e
76.7
75
.4
79.7
68
.2
15.0
37
2 83
.2
95.6
81
.5
2.7
343
5-9
year
s co
mpl
ete
80
.6
82.3
82
.3
72.6
10
.9
1,33
4 84
.7
96.0
82
.9
2.1
899
10-1
1 ye
ars
com
plet
e
85.4
85
.4
85.2
79
.8
10.2
31
4 81
.8
97.4
80
.1
0.9
223
12 o
r mor
e ye
ars
com
plet
e
88.5
88
.9
87.7
81
.9
7.1
428
90.4
97
.1
89.3
1.
8 40
8
Empl
oym
ent (
past
12
mon
ths)
Empl
oyed
85
.4
84.7
85
.7
76.1
8.
3 54
9 85
.7
96.6
84
.1
1.8
2,30
1 Em
ploy
ed, f
or c
ash
86
.5
84.5
85
.7
76.6
8.
0 49
8 85
.6
96.6
84
.0
1.8
2,18
7 Em
ploy
ed, n
ot fo
r cas
h
75.0
87
.2
85.7
71
.9
10.9
51
88
.9
96.3
87
.2
1.9
115
Not
em
ploy
ed
78.1
79
.6
79.3
70
.0
13.5
2,
741
* *
* *
24
Con
tinue
d...

146
4
Tabl
e 90
Dec
ision
mak
ing
by b
ackg
roun
d ch
arac
teris
tics—
Con
tinue
d
Perc
enta
ge o
f cur
rent
ly m
arrie
d w
omen
and
men
age
15-
49 w
ho u
sual
ly m
ake
spec
ific
deci
sions
eith
er b
y th
emse
lves
or
join
tly w
ith th
eir
spou
se, b
y ba
ckgr
ound
cha
ract
erist
ics,
Ass
am,
2015
-16
Back
grou
nd
char
acte
ristic
Perc
enta
ge o
f wom
en w
ho u
sual
ly
mak
e sp
ecifi
c de
cisio
ns a
lone
or
join
tly w
ith th
eir h
usba
nd
Perc
enta
ge
who
pa
rtic
ipat
e in
all
thre
e de
cisio
ns
Perc
enta
ge
who
pa
rtic
ipat
e in
non
e of
th
e th
ree
deci
sions
Num
ber
of
wom
en
Perc
enta
ge o
f men
who
us
ually
mak
e sp
ecifi
c de
cisio
ns a
lone
or j
oint
ly
with
thei
r wife
Perc
enta
ge
who
pa
rtic
ipat
e
in b
oth
deci
sions
Perc
enta
ge
who
pa
rtic
ipat
e in
nei
ther
de
cisio
n
Num
ber
of
men
O
wn
hea
lth c
are
Mak
ing
maj
or
hous
ehol
d pu
rcha
ses
Visit
s to
h
er fa
mily
o
r rel
ativ
es
Ow
n
heal
th c
are
Mak
ing
maj
or
hous
ehol
d pu
rcha
ses
N
umbe
r of
livi
ng c
hild
ren
0
77
.0
77.2
76
.5
67.5
15
.1
318
85.0
95
.1
83.1
3.
1 27
9 1-
2
81.4
82
.8
83.0
74
.4
10.9
1,
833
86.4
96
.8
84.8
1.
6 1,
343
3-4
78
.2
78.8
78
.8
69.0
13
.7
880
83.1
97
.2
82.1
1.
8 56
1 5+
71
.4
74.1
71
.6
59.0
18
.2
259
92.0
95
.6
88.6
1.
0 14
3
Hou
seho
ld s
truc
ture
1
Nuc
lear
79
.9
81.3
81
.6
71.5
11
.6
1,82
8 86
.0
97.7
85
.0
1.3
1,24
8 N
on-n
ucle
ar
78.6
79
.5
78.8
70
.4
13.9
1,
462
85.5
95
.3
83.3
2.
4 1,
078
Re
ligio
n
Hin
du
82.3
83
.2
83.9
74
.7
10.2
2,
123
83.8
97
.0
82.5
1.
7 1,
500
Mus
lim
72.5
74
.4
72.8
62
.8
18.0
1,
056
90.7
96
.4
89.0
1.
8 74
1 C
hrist
ian
87
.1
86.2
83
.3
78.8
8.
4 10
0 75
.1
90.3
69
.0
3.7
75
C
aste
/trib
e
Sche
dule
d ca
ste
76
.6
77.4
79
.8
66.6
13
.5
371
89.0
97
.9
88.1
1.
3 23
3 Sc
hedu
led
tribe
83
.6
84.5
84
.5
78.6
11
.4
479
87.8
96
.5
85.3
1.
0 35
0 O
ther
bac
kwar
d cl
ass
84
.5
84.6
85
.7
75.2
7.
2 87
6 81
.8
96.6
80
.7
2.2
665
Oth
er
75.8
77
.7
76.1
67
.4
15.9
1,
540
87.0
96
.3
85.3
1.
9 1,
067
To
tal
79.3
80
.5
80.4
71
.0
12.6
3,
290
85.8
96
.6
84.2
1.
8 2,
326
Not
e: T
otal
incl
udes
wom
en/m
en b
elon
ging
1 N
ucle
ar h
ouse
hold
s ar
e ho
useh
olds
com
prise
d of
a m
arrie
d co
uple
or a
man
or a
wom
an li
ving
alo
ne o
r with
unm
arrie
d ch
ildre
n (b
iolo
gica
l, ad
opte
d, o
r fos
tere
d) w
ith o
r with
out u
nrel
ated
indi
vidu
als.
*
Perc
enta
ge n
ot s
how
n; b
ased
on
few
er th
an 2
5 un
wei
ghte
d ca
ses
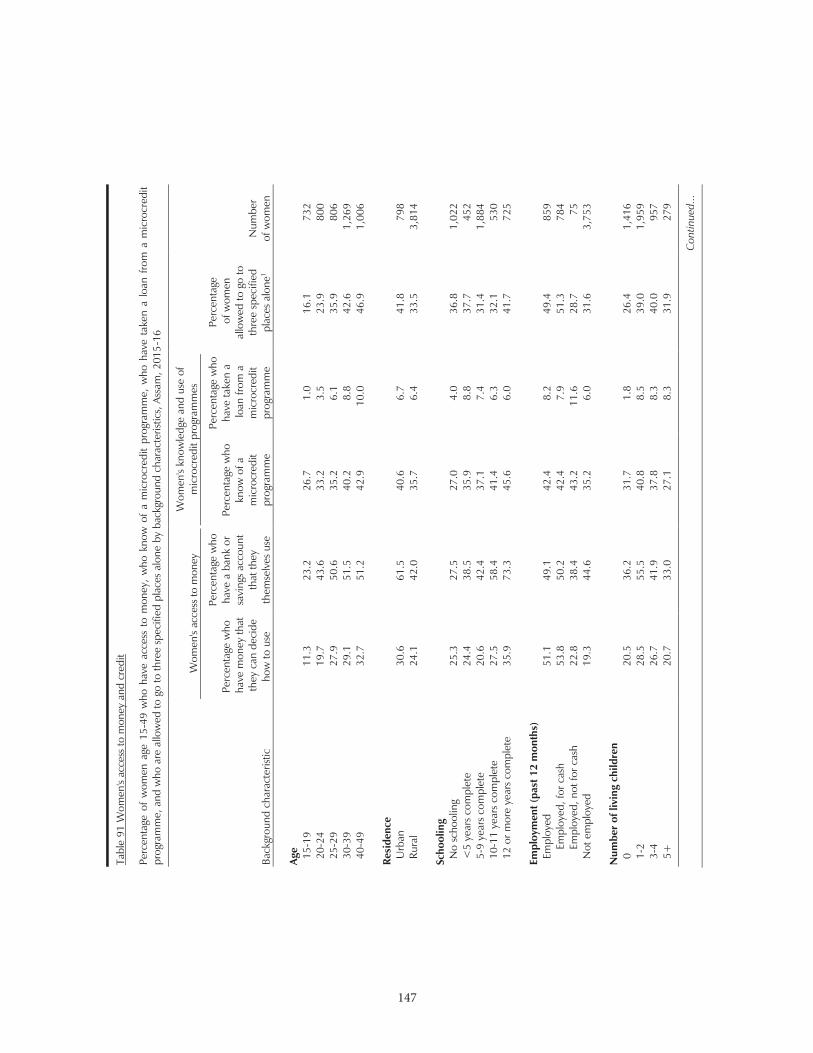
147
147
Tabl
e 91
Wom
en's
acce
ss to
mon
ey a
nd c
redi
t
Perc
enta
ge o
f w
omen
age
15-
49 w
ho h
ave
acce
ss t
o m
oney
, w
ho k
now
of
a m
icro
cred
it pr
ogra
mm
e, w
ho h
ave
take
n a
loan
fro
m a
mic
rocr
edit
prog
ram
me,
and
who
are
allo
wed
to g
o to
thre
e sp
ecifi
ed p
lace
s al
one
by b
ackg
roun
d ch
arac
teris
tics,
Ass
am, 2
015-
16
Back
grou
nd c
hara
cter
istic
Wom
en's
acce
ss to
mon
ey
Wom
en's
know
ledg
e an
d us
e of
m
icro
cred
it pr
ogra
mm
es
Perc
enta
ge
of w
omen
al
low
ed to
go
to
thre
e sp
ecifi
ed
plac
es a
lone
1 N
umbe
r of
wom
en
Perc
enta
ge w
ho
hav
e m
oney
that
th
ey c
an d
ecid
e
how
to u
se
Perc
enta
ge w
ho
have
a b
ank
or
savi
ngs
acco
unt
that
they
th
emse
lves
use
Perc
enta
ge w
ho
know
of a
m
icro
cred
it
prog
ram
me
Perc
enta
ge w
ho
have
take
n a
loan
from
a
mic
rocr
edit
prog
ram
me
Ag
e
15
-19
11
.3
23.2
26
.7
1.0
16.1
73
2 20
-24
19
.7
43.6
33
.2
3.5
23.9
80
0 25
-29
27
.9
50.6
35
.2
6.1
35.9
80
6 30
-39
29
.1
51.5
40
.2
8.8
42.6
1,
269
40-4
9
32.7
51
.2
42.9
10
.0
46.9
1,
006
Re
side
nce
Urb
an
30.6
61
.5
40.6
6.
7 41
.8
798
Rura
l 24
.1
42.0
35
.7
6.4
33.5
3,
814
Sc
hool
ing
No
scho
olin
g
25.3
27
.5
27.0
4.
0 36
.8
1,02
2 <
5 ye
ars
com
plet
e
24.4
38
.5
35.9
8.
8 37
.7
452
5-9
year
s co
mpl
ete
20
.6
42.4
37
.1
7.4
31.4
1,
884
10-1
1 ye
ars
com
plet
e
27.5
58
.4
41.4
6.
3 32
.1
530
12 o
r mor
e ye
ars
com
plet
e
35.9
73
.3
45.6
6.
0 41
.7
725
Em
ploy
men
t (pa
st 1
2 m
onth
s)
Empl
oyed
51
.1
49.1
42
.4
8.2
49.4
85
9 Em
ploy
ed, f
or c
ash
53
.8
50.2
42
.4
7.9
51.3
78
4 Em
ploy
ed, n
ot fo
r cas
h
22.8
38
.4
43.2
11
.6
28.7
75
N
ot e
mpl
oyed
19
.3
44.6
35
.2
6.0
31.6
3,
753
N
umbe
r of
livi
ng c
hild
ren
0
20.5
36
.2
31.7
1.
8 26
.4
1,41
6 1-
2
28.5
55
.5
40.8
8.
5 39
.0
1,95
9 3-
4
26.7
41
.9
37.8
8.
3 40
.0
957
5+
20.7
33
.0
27.1
8.
3 31
.9
279
Con
tinue
d...
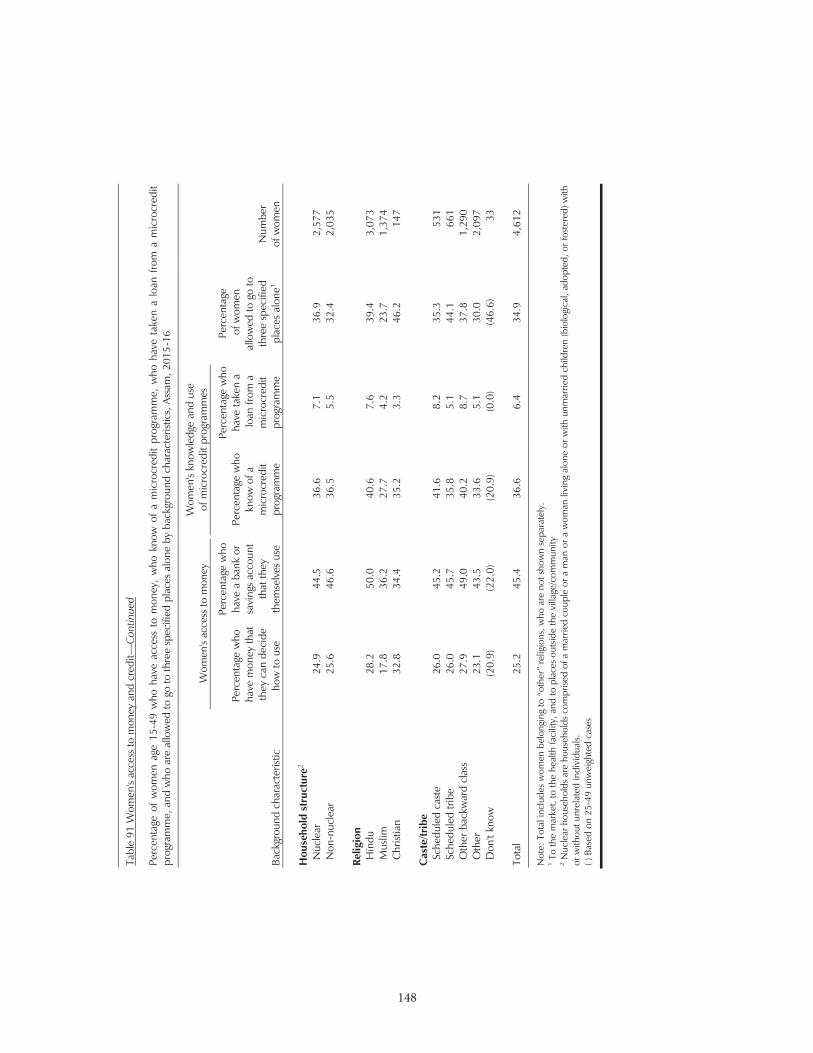
148
148
Tabl
e 91
Wom
en's
acce
ss to
mon
ey a
nd c
redi
t—C
ontin
ued
Perc
enta
ge o
f w
omen
age
15-
49 w
ho h
ave
acce
ss t
o m
oney
, w
ho k
now
of
a m
icro
cred
it pr
ogra
mm
e, w
ho h
ave
take
n a
loan
fro
m a
mic
rocr
edit
prog
ram
me,
and
who
are
allo
wed
to g
o to
thre
e sp
ecifi
ed p
lace
s al
one
by b
ackg
roun
d ch
arac
teris
tics,
Ass
am, 2
015-
16
Back
grou
nd c
hara
cter
istic
Wom
en's
acce
ss to
mon
ey
Wom
en's
know
ledg
e an
d us
e
of m
icro
cred
it pr
ogra
mm
es
Perc
enta
ge
of w
omen
al
low
ed to
go
to
thre
e sp
ecifi
ed
plac
es a
lone
1 N
umbe
r of
wom
en
Perc
enta
ge w
ho
hav
e m
oney
that
th
ey c
an d
ecid
e
how
to u
se
Perc
enta
ge w
ho
have
a b
ank
or
savi
ngs
acco
unt
that
they
th
emse
lves
use
Perc
enta
ge w
ho
know
of a
m
icro
cred
it
prog
ram
me
Perc
enta
ge w
ho
have
take
n a
loan
from
a
mic
rocr
edit
prog
ram
me
H
ouse
hold
str
uctu
re2
Nuc
lear
24
.9
44.5
36
.6
7.1
36.9
2,
577
Non
-nuc
lear
25
.6
46.6
36
.5
5.5
32.4
2,
035
Re
ligio
n
H
indu
28
.2
50.0
40
.6
7.6
39.4
3,
073
Mus
lim
17.8
36
.2
27.7
4.
2 23
.7
1,37
4 C
hrist
ian
32
.8
34.4
35
.2
3.3
46.2
14
7
C
aste
/trib
e
Sc
hedu
led
cast
e
26.0
45
.2
41.6
8.
2 35
.3
531
Sche
dule
d tri
be
26.0
45
.7
35.8
5.
1 44
.1
661
Oth
er b
ackw
ard
clas
s
27.9
49
.0
40.2
8.
7 37
.8
1,29
0 O
ther
23
.1
43.5
33
.6
5.1
30.0
2,
097
Don
't kn
ow
(20.
9)
(22.
0)
(20.
9)
(0.0
) (4
6.6)
33
To
tal
25.2
45
.4
36.6
6.
4 34
.9
4,61
2 N
ote:
1 To
the
mar
ket,
to th
e he
alth
faci
lity,
and
to p
lace
s out
side
the
villa
ge/c
omm
unity
2
Nuc
lear
hou
seho
lds
are
hous
ehol
ds c
ompr
ised
of a
mar
ried
coup
le o
r a m
an o
r a w
oman
livi
ng a
lone
or w
ith u
nmar
ried
child
ren
(bio
logi
cal,
adop
ted,
or f
oste
red)
with
or
with
out u
nrel
ated
indi
vidu
als.
( )
Bas
ed o
n 25
-49
unw
eigh
ted
case
s
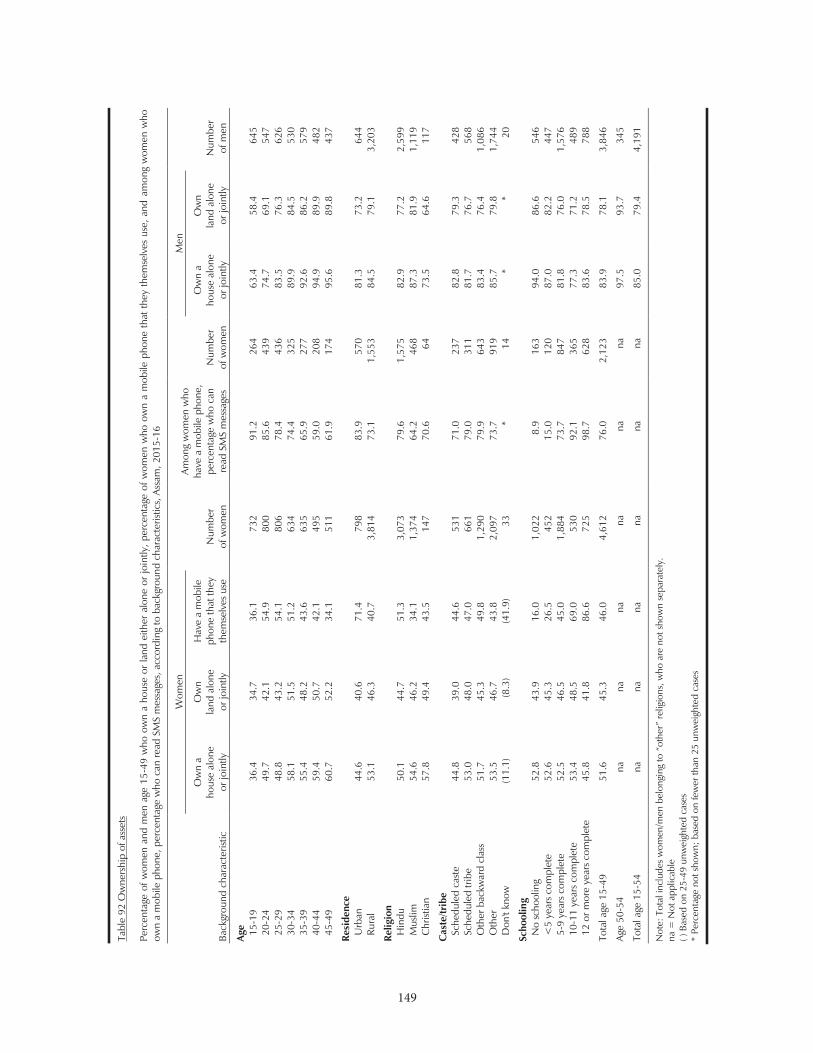
149
149
Tabl
e 92
Ow
ners
hip
of a
sset
s
Perc
enta
ge o
f wom
en a
nd m
en a
ge 1
5-49
who
ow
n a
hous
e or
land
eith
er a
lone
or
join
tly, p
erce
ntag
e of
wom
en w
ho o
wn
a m
obile
pho
ne t
hat t
hey
them
selv
es u
se, a
nd a
mon
g w
omen
who
ow
n a
mob
ile p
hone
, per
cent
age
who
can
read
SM
S m
essa
ges,
acc
ordi
ng to
bac
kgro
und
char
acte
ristic
s, A
ssam
, 201
5-16
Back
grou
nd c
hara
cter
istic
Wom
en
Num
ber
of w
omen
Amon
g w
omen
who
ha
ve a
mob
ile p
hone
, pe
rcen
tage
who
can
re
ad S
MS
mes
sage
s N
umbe
r of
wom
en
Men
Num
ber
of m
en
Ow
n a
ho
use
alon
e
or jo
intly
Ow
n
land
alo
ne
or jo
intly
Hav
e a
mob
ile
phon
e th
at th
ey
them
selv
es u
se
Ow
n a
ho
use
alon
e
or jo
intly
Ow
n
land
alo
ne
or jo
intly
Age
15
-19
36
.4
34.7
36
.1
732
91.2
26
4 63
.4
58.4
64
5 20
-24
49
.7
42.1
54
.9
800
85.6
43
9 74
.7
69.1
54
7 25
-29
48
.8
43.2
54
.1
806
78.4
43
6 83
.5
76.3
62
6 30
-34
58
.1
51.5
51
.2
634
74.4
32
5 89
.9
84.5
53
0 35
-39
55
.4
48.2
43
.6
635
65.9
27
7 92
.6
86.2
57
9 40
-44
59
.4
50.7
42
.1
495
59.0
20
8 94
.9
89.9
48
2 45
-49
60
.7
52.2
34
.1
511
61.9
17
4 95
.6
89.8
43
7
Resi
denc
e
Urb
an
44.6
40
.6
71.4
79
8 83
.9
570
81.3
73
.2
644
Rura
l 53
.1
46.3
40
.7
3,81
4 73
.1
1,55
3 84
.5
79.1
3,
203
Relig
ion
H
indu
50
.1
44.7
51
.3
3,07
3 79
.6
1,57
5 82
.9
77.2
2,
599
Mus
lim
54.6
46
.2
34.1
1,
374
64.2
46
8 87
.3
81.9
1,
119
Chr
istia
n
57.8
49
.4
43.5
14
7 70
.6
64
73.5
64
.6
117
Cas
te/tr
ibe
Sc
hedu
led
cast
e
44.8
39
.0
44.6
53
1 71
.0
237
82.8
79
.3
428
Sche
dule
d tri
be
53.0
48
.0
47.0
66
1 79
.0
311
81.7
76
.7
568
Oth
er b
ackw
ard
clas
s
51.7
45
.3
49.8
1,
290
79.9
64
3 83
.4
76.4
1,
086
Oth
er
53.5
46
.7
43.8
2,
097
73.7
91
9 85
.7
79.8
1,
744
Don
't kn
ow
(11.
1)
(8.3
) (4
1.9)
33
*
14
* *
20
Scho
olin
g
No
scho
olin
g
52.8
43
.9
16.0
1,
022
8.9
163
94.0
86
.6
546
<5
year
s co
mpl
ete
52
.6
45.3
26
.5
452
15.0
12
0 87
.0
82.2
44
7 5-
9 ye
ars
com
plet
e
52.5
46
.5
45.0
1,
884
73.7
84
7 81
.8
76.0
1,
576
10-1
1 ye
ars
com
plet
e
53.4
48
.5
69.0
53
0 92
.1
365
77.3
71
.2
489
12 o
r mor
e ye
ars
com
plet
e
45.8
41
.8
86.6
72
5 98
.7
628
83.6
78
.5
788
Tota
l age
15-
49
51.6
45
.3
46.0
4,
612
76.0
2,
123
83.9
78
.1
3,84
6
Age
50-5
4
na
na
na
na
na
na
97.5
93
.7
345
Tota
l age
15-
54
na
na
na
na
na
na
85.0
79
.4
4,19
1 N
ote:
Tot
al in
clud
es w
omen
/
na =
Not
app
licab
le
( ) B
ased
on
25-4
9 un
wei
ghte
d ca
ses
* Pe
rcen
tage
not
sho
wn;
bas
ed o
n fe
wer
than
25
unw
eigh
ted
case
s
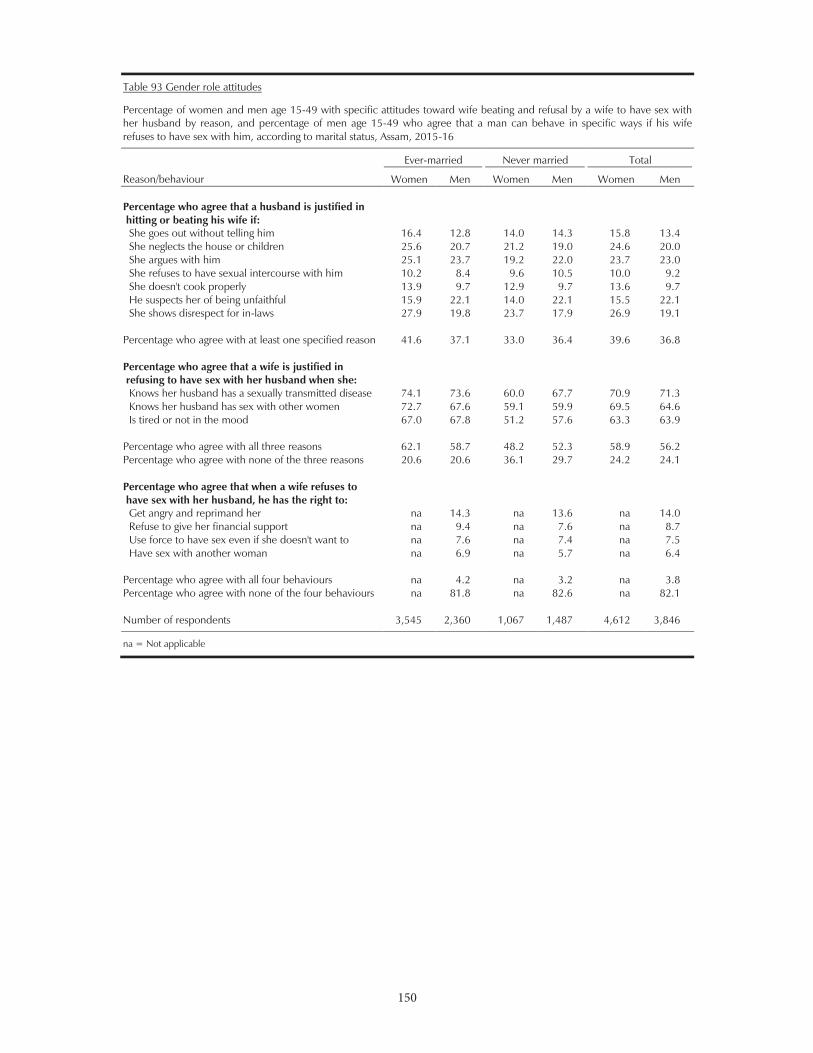
150
150
Table 93 Gender role attitudes
Percentage of women and men age 15-49 with specific attitudes toward wife beating and refusal by a wife to have sex with her husband by reason, and percentage of men age 15-49 who agree that a man can behave in specific ways if his wife refuses to have sex with him, according to marital status, Assam, 2015-16
Reason/behaviour
Ever-married
Never married
Total
Women Men Women Men Women Men Percentage who agree that a husband is justified in hitting or beating his wife if:
She goes out without telling him 16.4 12.8 14.0 14.3 15.8 13.4 She neglects the house or children 25.6 20.7 21.2 19.0 24.6 20.0 She argues with him 25.1 23.7 19.2 22.0 23.7 23.0 She refuses to have sexual intercourse with him 10.2 8.4 9.6 10.5 10.0 9.2 She doesn't cook properly 13.9 9.7 12.9 9.7 13.6 9.7 He suspects her of being unfaithful 15.9 22.1 14.0 22.1 15.5 22.1 She shows disrespect for in-laws 27.9 19.8 23.7 17.9 26.9 19.1
Percentage who agree with at least one specified reason 41.6 37.1 33.0 36.4 39.6 36.8
Percentage who agree that a wife is justified in refusing to have sex with her husband when she:
Knows her husband has a sexually transmitted disease 74.1 73.6 60.0 67.7 70.9 71.3 Knows her husband has sex with other women 72.7 67.6 59.1 59.9 69.5 64.6 Is tired or not in the mood 67.0 67.8 51.2 57.6 63.3 63.9
Percentage who agree with all three reasons 62.1 58.7 48.2 52.3 58.9 56.2 Percentage who agree with none of the three reasons 20.6 20.6 36.1 29.7 24.2 24.1
Percentage who agree that when a wife refuses to have sex with her husband, he has the right to:
Get angry and reprimand her na 14.3 na 13.6 na 14.0 Refuse to give her financial support na 9.4 na 7.6 na 8.7 Use force to have sex even if she doesn't want to na 7.6 na 7.4 na 7.5 Have sex with another woman na 6.9 na 5.7 na 6.4
Percentage who agree with all four behaviours na 4.2 na 3.2 na 3.8 Percentage who agree with none of the four behaviours na 81.8 na 82.6 na 82.1
Number of respondents 3,545 2,360 1,067 1,487 4,612 3,846
na = Not applicable
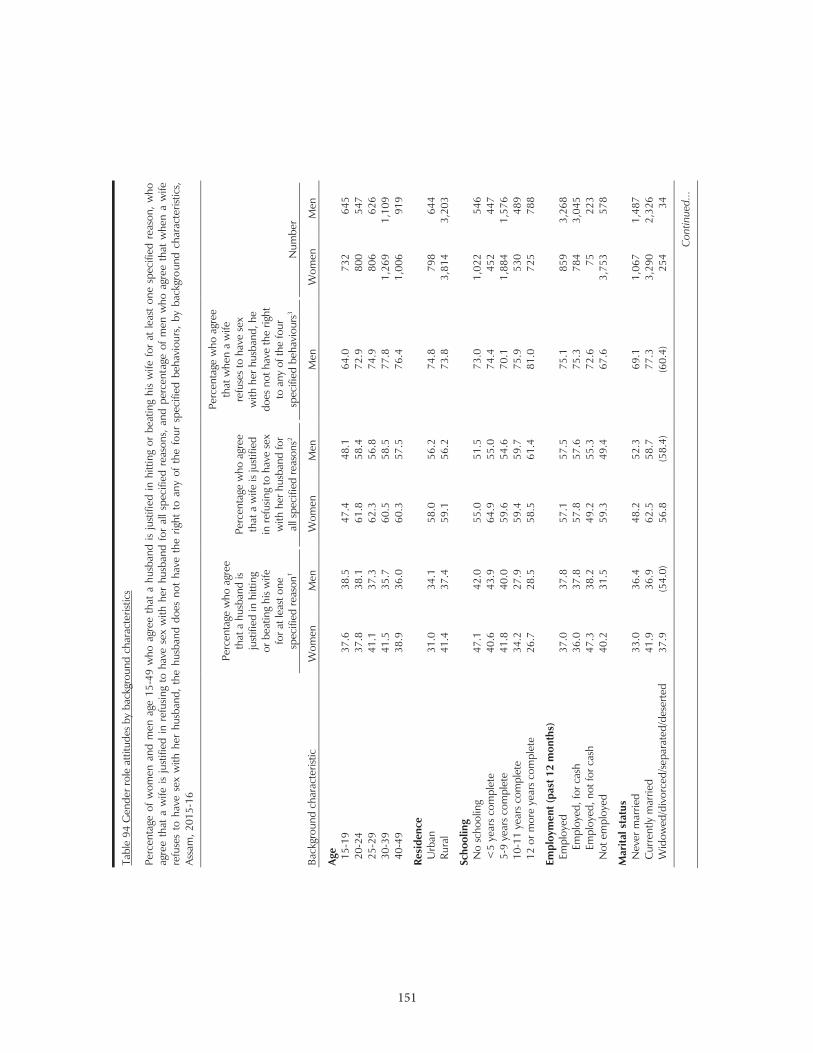
151
151
Tabl
e 94
Gen
der r
ole
attit
udes
by
back
grou
nd c
hara
cter
istic
s
Perc
enta
ge o
f w
omen
and
men
age
15-
49 w
ho a
gree
tha
t a
husb
and
is ju
stifi
ed in
hitt
ing
or b
eatin
g hi
s w
ife f
or a
t le
ast
one
spec
ified
rea
son,
who
ag
ree
that
a w
ife i
s ju
stifi
ed i
n re
fusin
g to
hav
e se
x w
ith h
er h
usba
nd f
or a
ll sp
ecifi
ed r
easo
ns,
and
perc
enta
ge o
f m
en w
ho a
gree
tha
t w
hen
a w
ife
refu
ses
to h
ave
sex
with
her
hus
band
, th
e hu
sban
d do
es n
ot h
ave
the
right
to
any
of t
he f
our
spec
ified
beh
avio
urs,
by
back
grou
nd c
hara
cter
istic
s, As
sam
, 201
5-16
Back
grou
nd c
hara
cter
istic
Perc
enta
ge w
ho a
gree
th
at a
hus
band
is
just
ified
in h
ittin
g
or b
eatin
g hi
s w
ife
for a
t lea
st o
ne
spec
ified
reas
on1
Perc
enta
ge w
ho a
gree
th
at a
wife
is ju
stifi
ed
in re
fusin
g to
hav
e se
x w
ith h
er h
usba
nd fo
r al
l spe
cifie
d re
ason
s2
Perc
enta
ge w
ho a
gree
th
at w
hen
a w
ife
refu
ses
to h
ave
sex
with
her
hus
band
, he
does
not
hav
e th
e rig
ht
to a
ny o
f the
four
sp
ecifi
ed b
ehav
iour
s3
Num
ber
Wom
en
Men
W
omen
M
en
Men
W
omen
M
en
Age
15
-19
37
.6
38.5
47
.4
48.1
64
.0
732
645
20-2
4
37.8
38
.1
61.8
58
.4
72.9
80
0 54
7 25
-29
41
.1
37.3
62
.3
56.8
74
.9
806
626
30-3
9
41.5
35
.7
60.5
58
.5
77.8
1,
269
1,10
9 40
-49
38
.9
36.0
60
.3
57.5
76
.4
1,00
6 91
9
Resi
denc
e
Urb
an
31.0
34
.1
58.0
56
.2
74.8
79
8 64
4 Ru
ral
41.4
37
.4
59.1
56
.2
73.8
3,
814
3,20
3
Scho
olin
g
No
scho
olin
g
47.1
42
.0
55.0
51
.5
73.0
1,
022
546
<5
year
s co
mpl
ete
40
.6
43.9
64
.9
55.0
74
.4
452
447
5-9
year
s co
mpl
ete
41
.8
40.0
59
.6
54.6
70
.1
1,88
4 1,
576
10-1
1 ye
ars
com
plet
e
34.2
27
.9
59.4
59
.7
75.9
53
0 48
9 12
or m
ore
year
s co
mpl
ete
26
.7
28.5
58
.5
61.4
81
.0
725
788
Empl
oym
ent (
past
12
mon
ths)
Empl
oyed
37
.0
37.8
57
.1
57.5
75
.1
859
3,26
8 Em
ploy
ed, f
or c
ash
36
.0
37.8
57
.8
57.6
75
.3
784
3,04
5 Em
ploy
ed, n
ot fo
r cas
h
47.3
38
.2
49.2
55
.3
72.6
75
22
3 N
ot e
mpl
oyed
40
.2
31.5
59
.3
49.4
67
.6
3,75
3 57
8
Mar
ital s
tatu
s
Nev
er m
arrie
d
33.0
36
.4
48.2
52
.3
69.1
1,
067
1,48
7 C
urre
ntly
mar
ried
41
.9
36.9
62
.5
58.7
77
.3
3,29
0 2,
326
Wid
owed
/div
orce
d/se
para
ted/
dese
rted
37
.9
(54.
0)
56.8
(5
8.4)
(6
0.4)
25
4 34
Con
tinue
d...
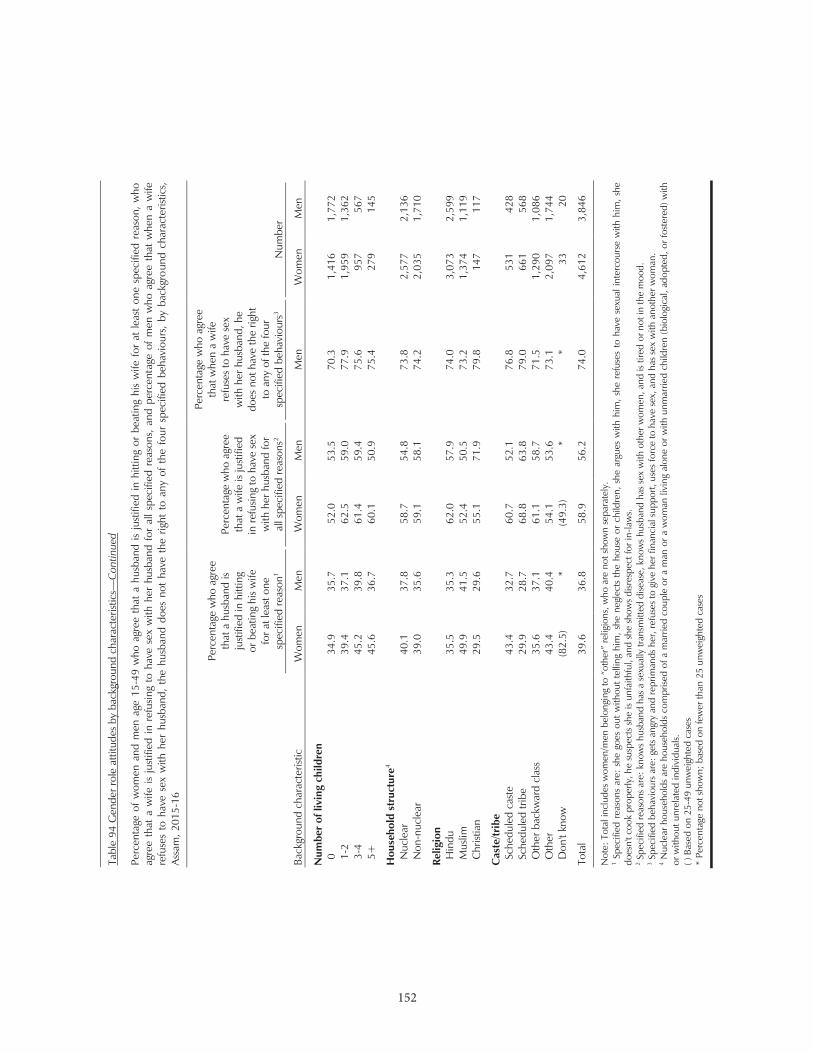
152
152
Tabl
e 94
Gen
der r
ole
attit
udes
by
back
grou
nd c
hara
cter
istic
s—C
ontin
ued
Perc
enta
ge o
f w
omen
and
men
age
15-
49 w
ho a
gree
tha
t a
husb
and
is ju
stifi
ed in
hitt
ing
or b
eatin
g hi
s w
ife f
or a
t le
ast
one
spec
ified
rea
son,
who
ag
ree
that
a w
ife i
s ju
stifi
ed i
n re
fusin
g to
hav
e se
x w
ith h
er h
usba
nd f
or a
ll sp
ecifi
ed r
easo
ns,
and
perc
enta
ge o
f m
en w
ho a
gree
tha
t w
hen
a w
ife
refu
ses
to h
ave
sex
with
her
hus
band
, th
e hu
sban
d do
es n
ot h
ave
the
right
to
any
of t
he f
our
spec
ified
beh
avio
urs,
by
back
grou
nd c
hara
cter
istic
s, As
sam
, 201
5-16
Back
grou
nd c
hara
cter
istic
Perc
enta
ge w
ho a
gree
th
at a
hus
band
is
just
ified
in h
ittin
g
or b
eatin
g hi
s w
ife
for a
t lea
st o
ne
spec
ified
reas
on1
Perc
enta
ge w
ho a
gree
th
at a
wife
is ju
stifi
ed
in re
fusin
g to
hav
e se
x w
ith h
er h
usba
nd fo
r al
l spe
cifie
d re
ason
s2
Perc
enta
ge w
ho a
gree
th
at w
hen
a w
ife
refu
ses
to h
ave
sex
with
her
hus
band
, he
does
not
hav
e th
e rig
ht
to a
ny o
f the
four
sp
ecifi
ed b
ehav
iour
s3
Num
ber
Wom
en
Men
W
omen
M
en
Men
W
omen
M
en
Num
ber
of li
ving
chi
ldre
n
0
34.9
35
.7
52.0
53
.5
70.3
1,
416
1,77
2 1-
2
39.4
37
.1
62.5
59
.0
77.9
1,
959
1,36
2 3-
4
45.2
39
.8
61.4
59
.4
75.6
95
7 56
7 5+
45
.6
36.7
60
.1
50.9
75
.4
279
145
Hou
seho
ld s
truc
ture
4
Nuc
lear
40
.1
37.8
58
.7
54.8
73
.8
2,57
7 2,
136
Non
-nuc
lear
39
.0
35.6
59
.1
58.1
74
.2
2,03
5 1,
710
Relig
ion
H
indu
35
.5
35.3
62
.0
57.9
74
.0
3,07
3 2,
599
Mus
lim
49.9
41
.5
52.4
50
.5
73.2
1,
374
1,11
9 C
hrist
ian
29
.5
29.6
55
.1
71.9
79
.8
147
117
Cas
te/tr
ibe
Sc
hedu
led
cast
e
43.4
32
.7
60.7
52
.1
76.8
53
1 42
8 Sc
hedu
led
tribe
29
.9
28.7
68
.8
63.8
79
.0
661
568
Oth
er b
ackw
ard
clas
s
35.6
37
.1
61.1
58
.7
71.5
1,
290
1,08
6 O
ther
43
.4
40.4
54
.1
53.6
73
.1
2,09
7 1,
744
Don
't kn
ow
(82.
5)
* (4
9.3)
*
* 33
20
Tota
l 39
.6
36.8
58
.9
56.2
74
.0
4,61
2 3,
846
Not
e: T
otal
incl
udes
wom
en/
1
Spec
ified
rea
sons
are
: sh
e go
es o
ut w
ithou
t te
lling
him
, she
neg
lect
s th
e ho
use
or c
hild
ren,
she
arg
ues
with
him
, she
ref
uses
to h
ave
sexu
al in
terc
ours
e w
ith h
im, s
he
does
n't c
ook
prop
erly
, he
susp
ects
she
is un
faith
ful,
and
she
show
s di
sres
pect
for i
n-la
ws.
2 Spe
cifie
d re
ason
s ar
e: k
now
s hus
band
has
a s
exua
lly tr
ansm
itted
dise
ase,
kno
ws
husb
and
has
sex
with
oth
er w
omen
, and
is ti
red
or n
ot in
the
moo
d.
3 Spe
cifie
d be
havi
ours
are
: get
s an
gry
and
repr
iman
ds h
er, r
efus
es to
giv
e he
r fin
anci
al s
uppo
rt, u
ses
forc
e to
hav
e se
x, a
nd h
as s
ex w
ith a
noth
er w
oman
. 4
Nuc
lear
hou
seho
lds
are
hous
ehol
ds c
ompr
ised
of a
mar
ried
coup
le o
r a m
an o
r a
wom
an li
ving
alo
ne o
r with
unm
arrie
d ch
ildre
n (b
iolo
gica
l, ad
opte
d, o
r fos
tere
d) w
ith
or w
ithou
t unr
elat
ed in
divi
dual
s.
( ) B
ased
on
25-4
9 un
wei
ghte
d ca
ses
* Pe
rcen
tage
not
sho
wn;
bas
ed o
n fe
wer
than
25
unw
eigh
ted
case
s
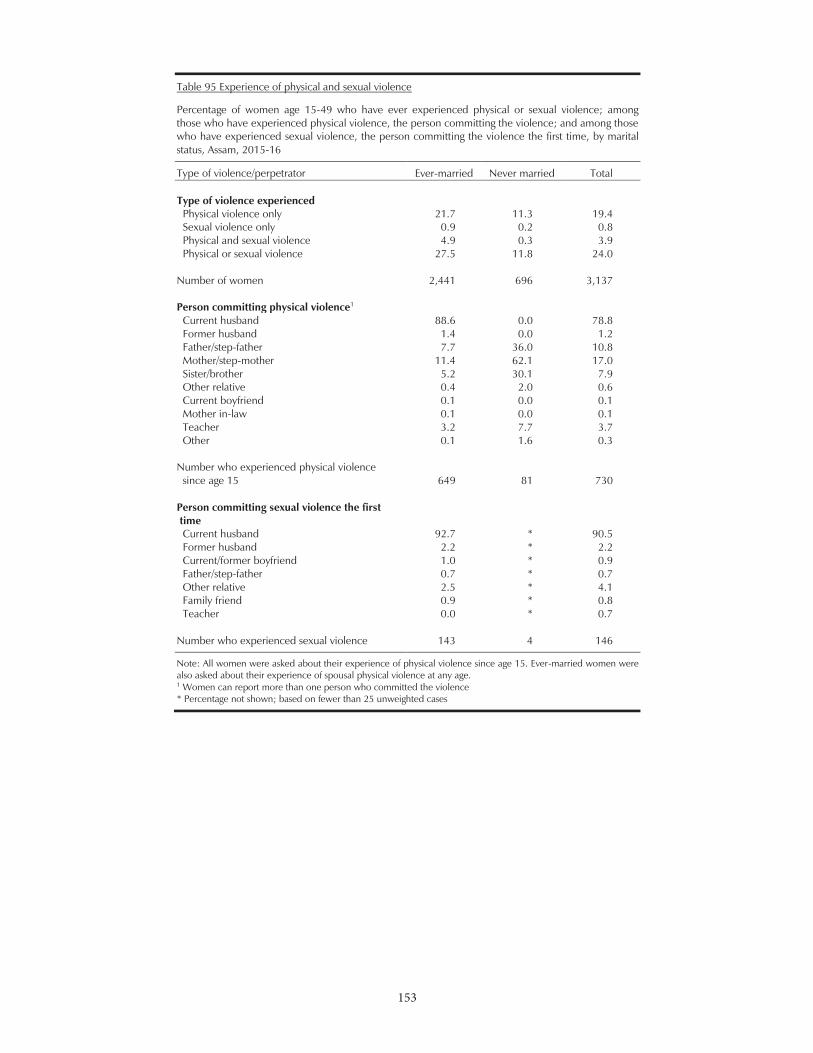
153
153
Table 95 Experience of physical and sexual violence
Percentage of women age 15-49 who have ever experienced physical or sexual violence; among those who have experienced physical violence, the person committing the violence; and among those who have experienced sexual violence, the person committing the violence the first time, by marital status, Assam, 2015-16
Type of violence/perpetrator Ever-married Never married Total Type of violence experienced
Physical violence only 21.7 11.3 19.4 Sexual violence only 0.9 0.2 0.8 Physical and sexual violence 4.9 0.3 3.9 Physical or sexual violence 27.5 11.8 24.0
Number of women 2,441 696 3,137
Person committing physical violence1 Current husband 88.6 0.0 78.8 Former husband 1.4 0.0 1.2 Father/step-father 7.7 36.0 10.8 Mother/step-mother 11.4 62.1 17.0 Sister/brother 5.2 30.1 7.9 Other relative 0.4 2.0 0.6 Current boyfriend 0.1 0.0 0.1 Mother in-law 0.1 0.0 0.1 Teacher 3.2 7.7 3.7 Other 0.1 1.6 0.3
Number who experienced physical violence since age 15 649 81 730
Person committing sexual violence the first time
Current husband 92.7 * 90.5 Former husband 2.2 * 2.2 Current/former boyfriend 1.0 * 0.9 Father/step-father 0.7 * 0.7 Other relative 2.5 * 4.1 Family friend 0.9 * 0.8 Teacher 0.0 * 0.7
Number who experienced sexual violence 143 4 146
Note: All women were asked about their experience of physical violence since age 15. Ever-married women were also asked about their experience of spousal physical violence at any age. 1 Women can report more than one person who committed the violence * Percentage not shown; based on fewer than 25 unweighted cases
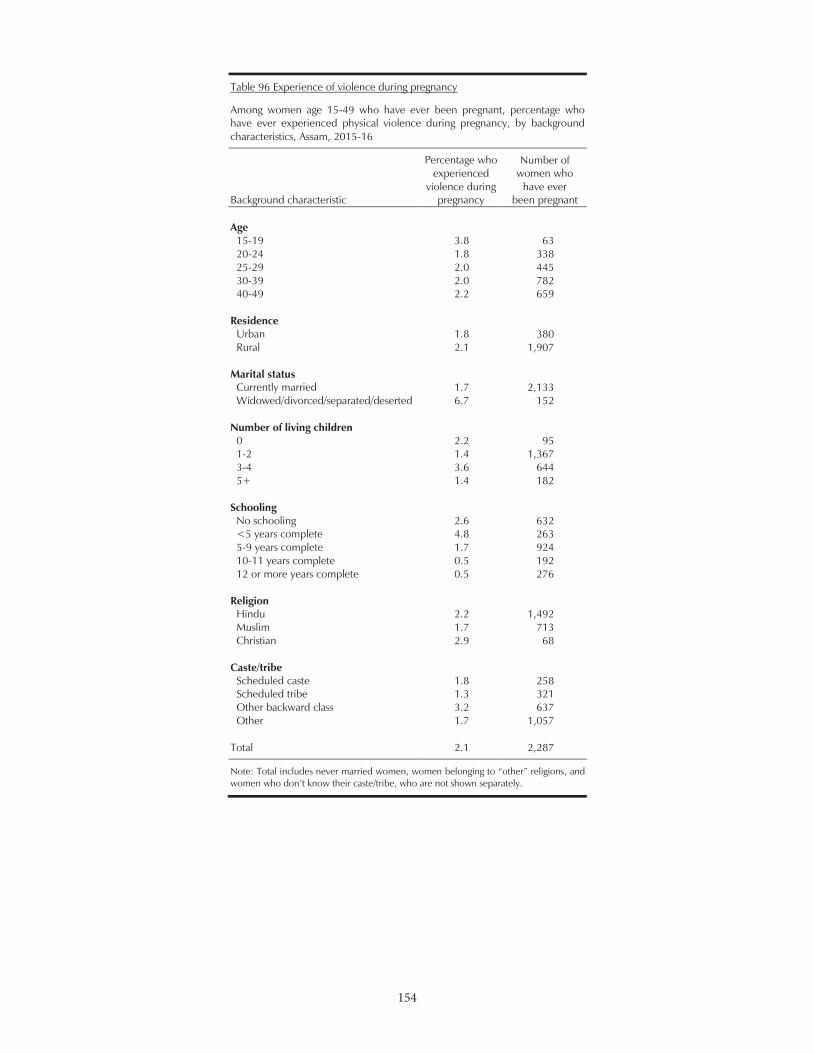
154
154
Table 96 Experience of violence during pregnancy
Among women age 15-49 who have ever been pregnant, percentage who have ever experienced physical violence during pregnancy, by background characteristics, Assam, 2015-16
Background characteristic
Percentage who experienced
violence during pregnancy
Number of women who
have ever been pregnant
Age
15-19 3.8 63 20-24 1.8 338 25-29 2.0 445 30-39 2.0 782 40-49 2.2 659
Residence Urban 1.8 380 Rural 2.1 1,907
Marital status Currently married 1.7 2,133 Widowed/divorced/separated/deserted 6.7 152
Number of living children 0 2.2 95 1-2 1.4 1,367 3-4 3.6 644 5+ 1.4 182
Schooling No schooling 2.6 632 <5 years complete 4.8 263 5-9 years complete 1.7 924 10-11 years complete 0.5 192 12 or more years complete 0.5 276
Religion Hindu 2.2 1,492 Muslim 1.7 713 Christian 2.9 68
Caste/tribe Scheduled caste 1.8 258 Scheduled tribe 1.3 321 Other backward class 3.2 637 Other 1.7 1,057
Total 2.1 2,287
, and
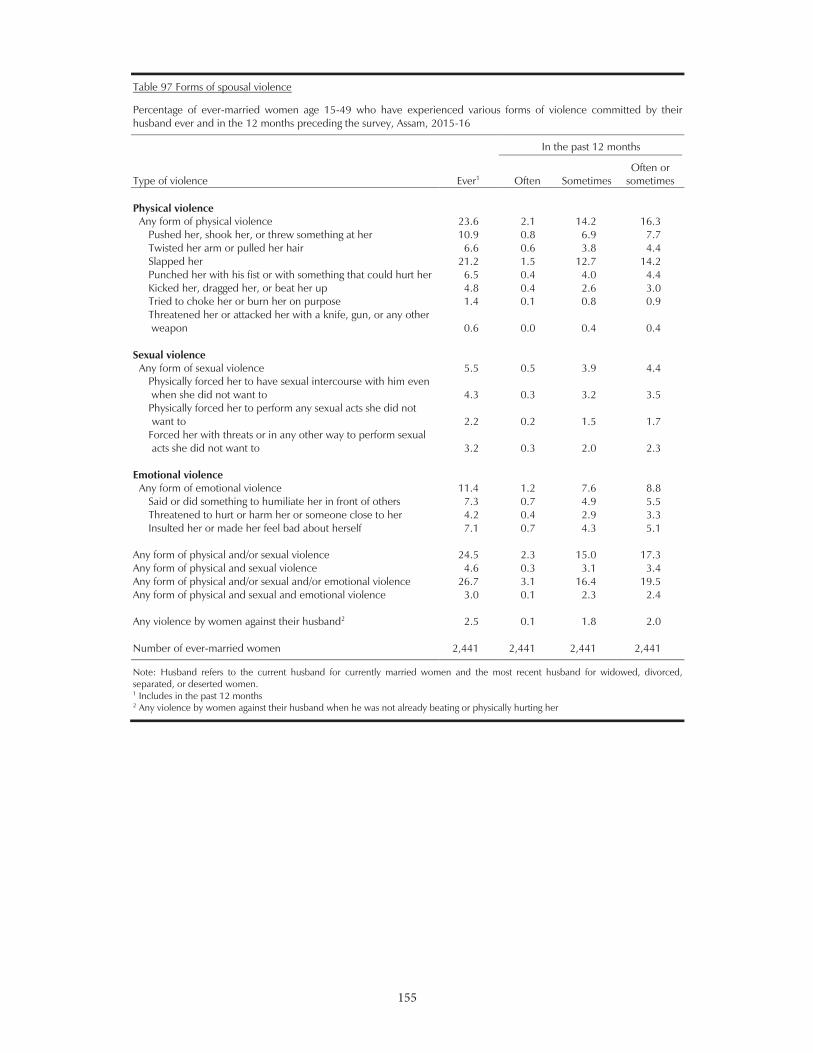
155
155
Table 97 Forms of spousal violence
Percentage of ever-married women age 15-49 who have experienced various forms of violence committed by their husband ever and in the 12 months preceding the survey, Assam, 2015-16
Type of violence Ever1
In the past 12 months
Often Sometimes Often or
sometimes Physical violence
Any form of physical violence 23.6 2.1 14.2 16.3 Pushed her, shook her, or threw something at her 10.9 0.8 6.9 7.7 Twisted her arm or pulled her hair 6.6 0.6 3.8 4.4 Slapped her 21.2 1.5 12.7 14.2 Punched her with his fist or with something that could hurt her 6.5 0.4 4.0 4.4 Kicked her, dragged her, or beat her up 4.8 0.4 2.6 3.0 Tried to choke her or burn her on purpose 1.4 0.1 0.8 0.9 Threatened her or attacked her with a knife, gun, or any other weapon 0.6 0.0 0.4 0.4
Sexual violence Any form of sexual violence 5.5 0.5 3.9 4.4
Physically forced her to have sexual intercourse with him even when she did not want to 4.3 0.3 3.2 3.5 Physically forced her to perform any sexual acts she did not want to 2.2 0.2 1.5 1.7
Forced her with threats or in any other way to perform sexual acts she did not want to 3.2 0.3 2.0 2.3
Emotional violence Any form of emotional violence 11.4 1.2 7.6 8.8
Said or did something to humiliate her in front of others 7.3 0.7 4.9 5.5 Threatened to hurt or harm her or someone close to her 4.2 0.4 2.9 3.3 Insulted her or made her feel bad about herself 7.1 0.7 4.3 5.1
Any form of physical and/or sexual violence 24.5 2.3 15.0 17.3 Any form of physical and sexual violence 4.6 0.3 3.1 3.4 Any form of physical and/or sexual and/or emotional violence 26.7 3.1 16.4 19.5 Any form of physical and sexual and emotional violence 3.0 0.1 2.3 2.4
Any violence by women against their husband2 2.5 0.1 1.8 2.0
Number of ever-married women 2,441 2,441 2,441 2,441
Note: Husband refers to the current husband for currently married women and the most recent husband for widowed, divorced, separated, or deserted women. 1 Includes in the past 12 months 2 Any violence by women against their husband when he was not already beating or physically hurting her

156
156
Table 98 Spousal violence by background characteristics
Percentage of ever-married women age 15-49 who have ever experienced emotional, physical, or sexual violence committed by their husband, according to background characteristics, Assam, 2015-16
Background characteristic Emotional violence
Physical violence
Sexual violence
Physical or sexual violence
Emotional, physical, or sexual violence
Number of women
Age 15-19 17.9 26.2 4.0 27.0 31.3 111 20-24 10.9 23.0 5.9 24.5 25.5 388 25-29 8.8 21.2 2.8 21.7 23.6 463 30-39 12.3 24.9 7.3 26.0 28.3 808 40-49 11.5 23.6 5.4 24.3 26.9 670
Residence Urban 8.7 14.5 5.9 15.8 18.2 404 Rural 12.0 25.4 5.5 26.2 28.4 2,037
Schooling No schooling 18.4 36.6 10.4 38.0 41.3 659 <5 years complete 17.3 33.0 6.5 34.4 38.6 283 5-9 years complete 8.0 19.5 3.5 20.1 21.1 979 10-11 years complete 7.7 10.2 2.8 10.2 14.2 205 12 or more years complete 4.6 9.6 2.8 10.4 11.3 316
Employment (past 12 months) Not employed 10.1 21.7 4.5 22.4 24.6 1,987 Employed for cash 17.6 32.2 10.9 34.2 36.7 418 Employed not for cash (13.8) (26.7) (2.2) (26.7) (29.4) 36
Marital status Currently married 10.3 22.5 4.9 23.4 25.6 2,269 Widowed 13.3 22.6 9.3 23.6 27.2 121 Divorced/separated/deserted (58.6) (76.1) (25.1) (76.1) (76.1) 51
Marital duration1 Married only once 10.2 22.1 4.8 23.0 25.3 2,241
0-4 years 6.3 14.3 3.6 15.0 16.2 496 5-9 years 10.4 24.0 4.7 24.9 26.8 427 10+ years 11.6 24.5 5.2 25.4 28.2 1,318
Married more than once (18.1) (46.7) (12.3) (50.2) (50.2) 32
Number of living children 0 14.2 21.4 5.0 22.3 24.0 250 1-2 8.8 19.5 4.5 20.1 22.1 1,366 3-4 14.9 32.3 7.1 33.4 36.1 643 5+ 15.3 27.1 8.6 29.6 31.8 182
Household structure2 Nuclear 11.8 25.5 6.3 26.6 29.1 1,312 Non-nuclear 11.0 21.4 4.6 22.0 24.0 1,129
Religion Hindu 10.6 22.2 5.1 22.8 25.0 1,594 Muslim 13.8 26.5 5.9 27.3 29.9 761 Christian 7.7 28.4 9.3 34.2 36.0 71
Continued...
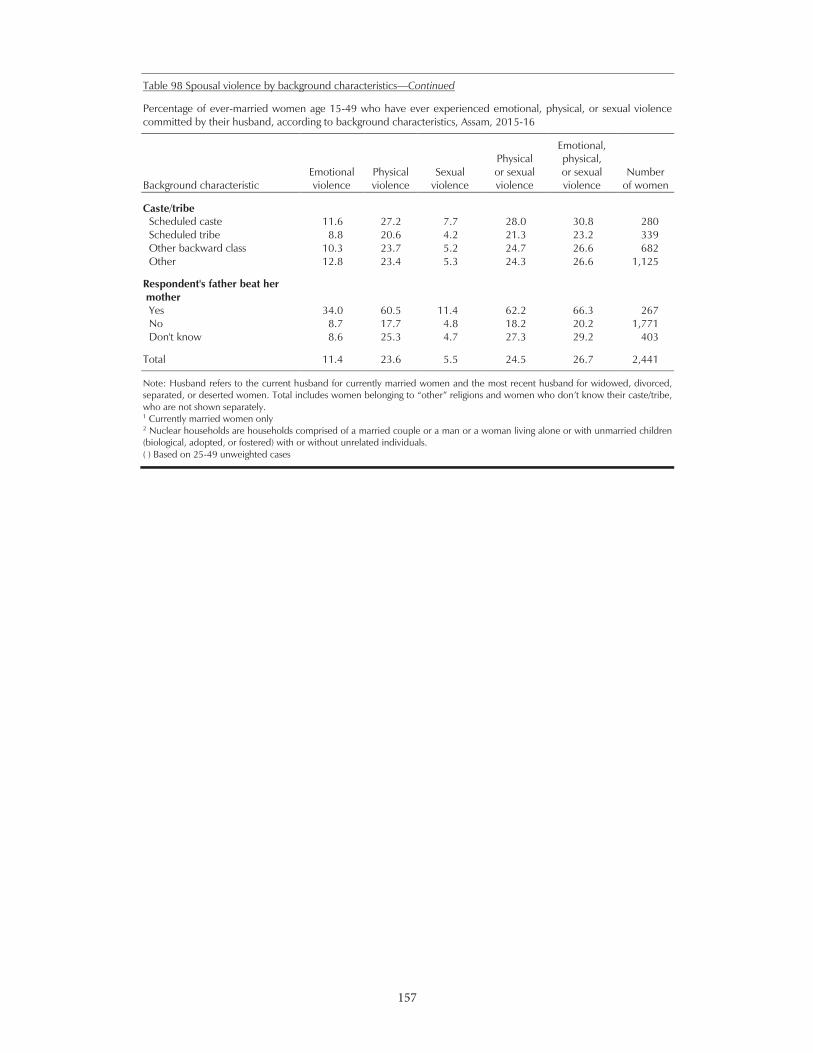
157
157
Table 98 Spousal violence by background characteristics—Continued
Percentage of ever-married women age 15-49 who have ever experienced emotional, physical, or sexual violence committed by their husband, according to background characteristics, Assam, 2015-16
Background characteristic Emotional violence
Physical violence
Sexual violence
Physical or sexual violence
Emotional, physical, or sexual violence
Number of women
Caste/tribe Scheduled caste 11.6 27.2 7.7 28.0 30.8 280 Scheduled tribe 8.8 20.6 4.2 21.3 23.2 339 Other backward class 10.3 23.7 5.2 24.7 26.6 682 Other 12.8 23.4 5.3 24.3 26.6 1,125
Respondent's father beat her mother
Yes 34.0 60.5 11.4 62.2 66.3 267 No 8.7 17.7 4.8 18.2 20.2 1,771 Don't know 8.6 25.3 4.7 27.3 29.2 403
Total 11.4 23.6 5.5 24.5 26.7 2,441
Note: Husband refers to the current husband for currently married women and the most recent husband for widowed, divorced, separated, or deserted women. who are not shown separately. 1 Currently married women only 2 Nuclear households are households comprised of a married couple or a man or a woman living alone or with unmarried children (biological, adopted, or fostered) with or without unrelated individuals. ( ) Based on 25-49 unweighted cases
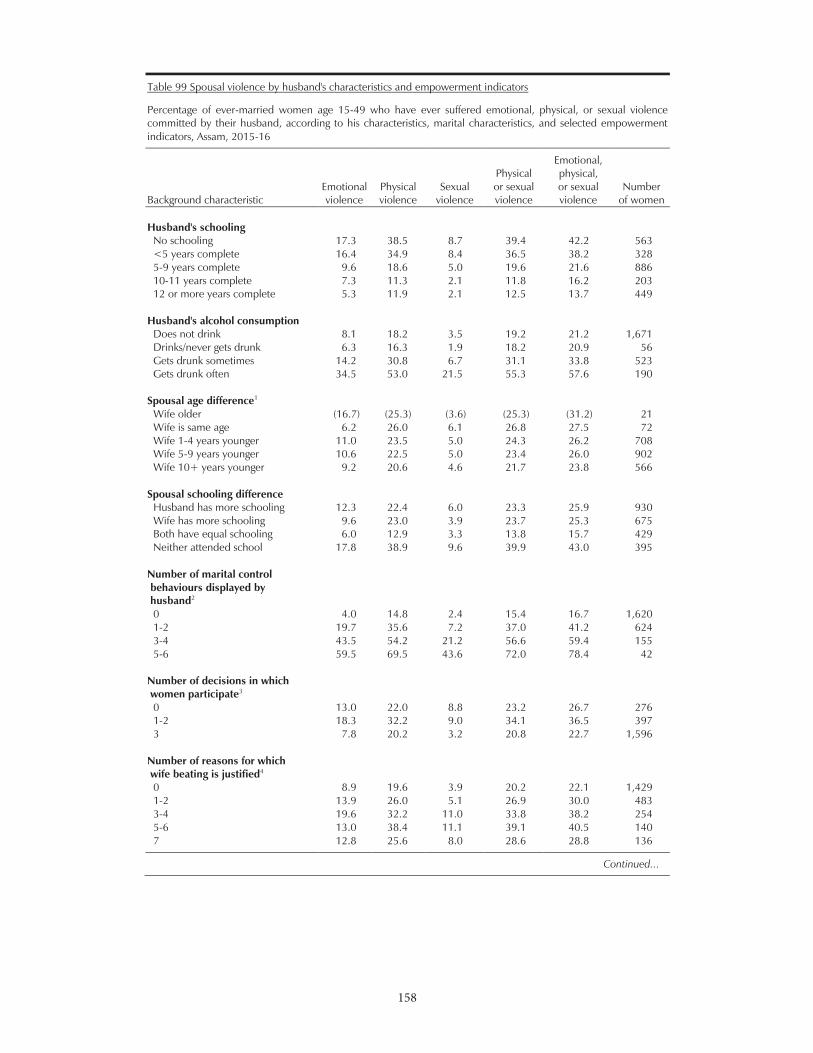
158
158
Table 99 Spousal violence by husband's characteristics and empowerment indicators
Percentage of ever-married women age 15-49 who have ever suffered emotional, physical, or sexual violence committed by their husband, according to his characteristics, marital characteristics, and selected empowerment indicators, Assam, 2015-16
Background characteristic Emotional violence
Physical violence
Sexual violence
Physical or sexual violence
Emotional, physical, or sexual violence
Number of women
Husband's schooling
No schooling 17.3 38.5 8.7 39.4 42.2 563 <5 years complete 16.4 34.9 8.4 36.5 38.2 328 5-9 years complete 9.6 18.6 5.0 19.6 21.6 886 10-11 years complete 7.3 11.3 2.1 11.8 16.2 203 12 or more years complete 5.3 11.9 2.1 12.5 13.7 449
Husband's alcohol consumption Does not drink 8.1 18.2 3.5 19.2 21.2 1,671 Drinks/never gets drunk 6.3 16.3 1.9 18.2 20.9 56 Gets drunk sometimes 14.2 30.8 6.7 31.1 33.8 523 Gets drunk often 34.5 53.0 21.5 55.3 57.6 190
Spousal age difference1 Wife older (16.7) (25.3) (3.6) (25.3) (31.2) 21 Wife is same age 6.2 26.0 6.1 26.8 27.5 72 Wife 1-4 years younger 11.0 23.5 5.0 24.3 26.2 708 Wife 5-9 years younger 10.6 22.5 5.0 23.4 26.0 902 Wife 10+ years younger 9.2 20.6 4.6 21.7 23.8 566
Spousal schooling difference Husband has more schooling 12.3 22.4 6.0 23.3 25.9 930 Wife has more schooling 9.6 23.0 3.9 23.7 25.3 675 Both have equal schooling 6.0 12.9 3.3 13.8 15.7 429 Neither attended school 17.8 38.9 9.6 39.9 43.0 395
Number of marital control behaviours displayed by husband2
0 4.0 14.8 2.4 15.4 16.7 1,620 1-2 19.7 35.6 7.2 37.0 41.2 624 3-4 43.5 54.2 21.2 56.6 59.4 155 5-6 59.5 69.5 43.6 72.0 78.4 42
Number of decisions in which women participate3
0 13.0 22.0 8.8 23.2 26.7 276 1-2 18.3 32.2 9.0 34.1 36.5 397 3 7.8 20.2 3.2 20.8 22.7 1,596
Number of reasons for which wife beating is justified4
0 8.9 19.6 3.9 20.2 22.1 1,429 1-2 13.9 26.0 5.1 26.9 30.0 483 3-4 19.6 32.2 11.0 33.8 38.2 254 5-6 13.0 38.4 11.1 39.1 40.5 140 7 12.8 25.6 8.0 28.6 28.8 136
Continued...
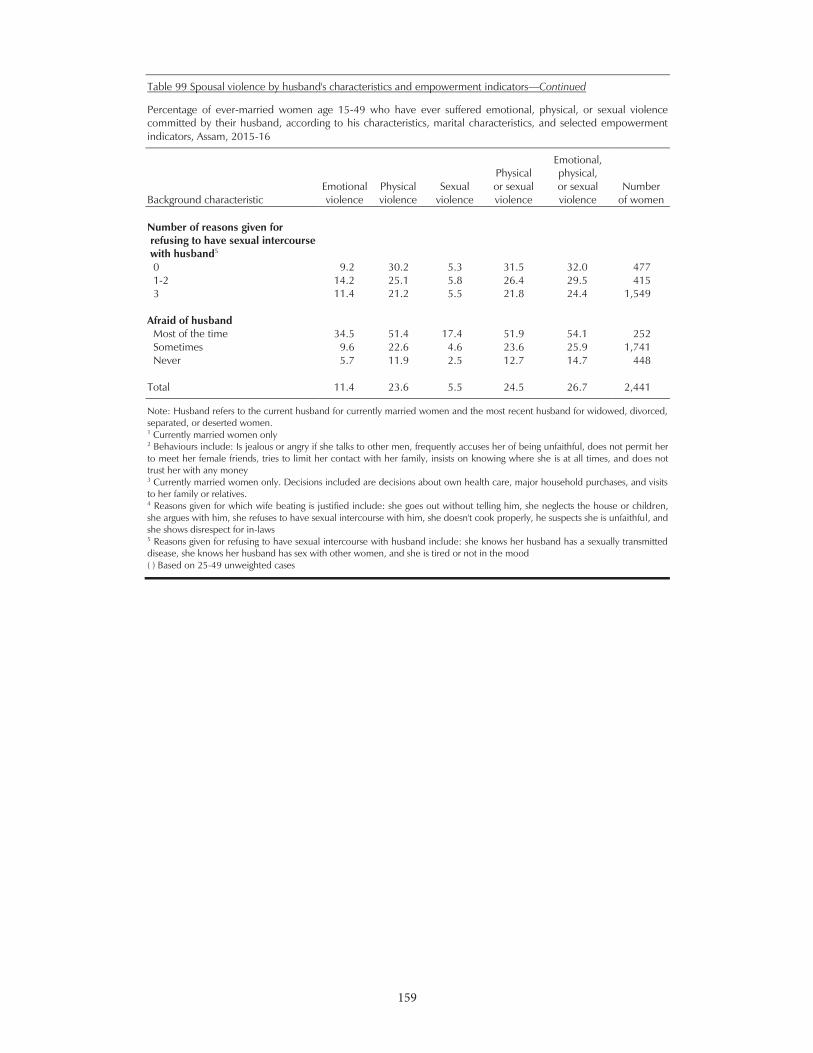
159
5
Table 99 Spousal violence by husband's characteristics and empowerment indicators—Continued
Percentage of ever-married women age 15-49 who have ever suffered emotional, physical, or sexual violence committed by their husband, according to his characteristics, marital characteristics, and selected empowerment indicators, Assam, 2015-16
Background characteristic Emotional violence
Physical violence
Sexual violence
Physical or sexual violence
Emotional, physical, or sexual violence
Number of women
Number of reasons given for refusing to have sexual intercourse with husband5
0 9.2 30.2 5.3 31.5 32.0 477 1-2 14.2 25.1 5.8 26.4 29.5 415 3 11.4 21.2 5.5 21.8 24.4 1,549
Afraid of husband
Most of the time 34.5 51.4 17.4 51.9 54.1 252 Sometimes 9.6 22.6 4.6 23.6 25.9 1,741 Never 5.7 11.9 2.5 12.7 14.7 448
Total 11.4 23.6 5.5 24.5 26.7 2,441
Note: Husband refers to the current husband for currently married women and the most recent husband for widowed, divorced, separated, or deserted women. 1 Currently married women only 2 Behaviours include: Is jealous or angry if she talks to other men, frequently accuses her of being unfaithful, does not permit her to meet her female friends, tries to limit her contact with her family, insists on knowing where she is at all times, and does not trust her with any money 3 Currently married women only. Decisions included are decisions about own health care, major household purchases, and visits to her family or relatives. 4 Reasons given for which wife beating is justified include: she goes out without telling him, she neglects the house or children, she argues with him, she refuses to have sexual intercourse with him, she doesn't cook properly, he suspects she is unfaithful, and she shows disrespect for in-laws 5 Reasons given for refusing to have sexual intercourse with husband include: she knows her husband has a sexually transmitted disease, she knows her husband has sex with other women, and she is tired or not in the mood ( ) Based on 25-49 unweighted cases
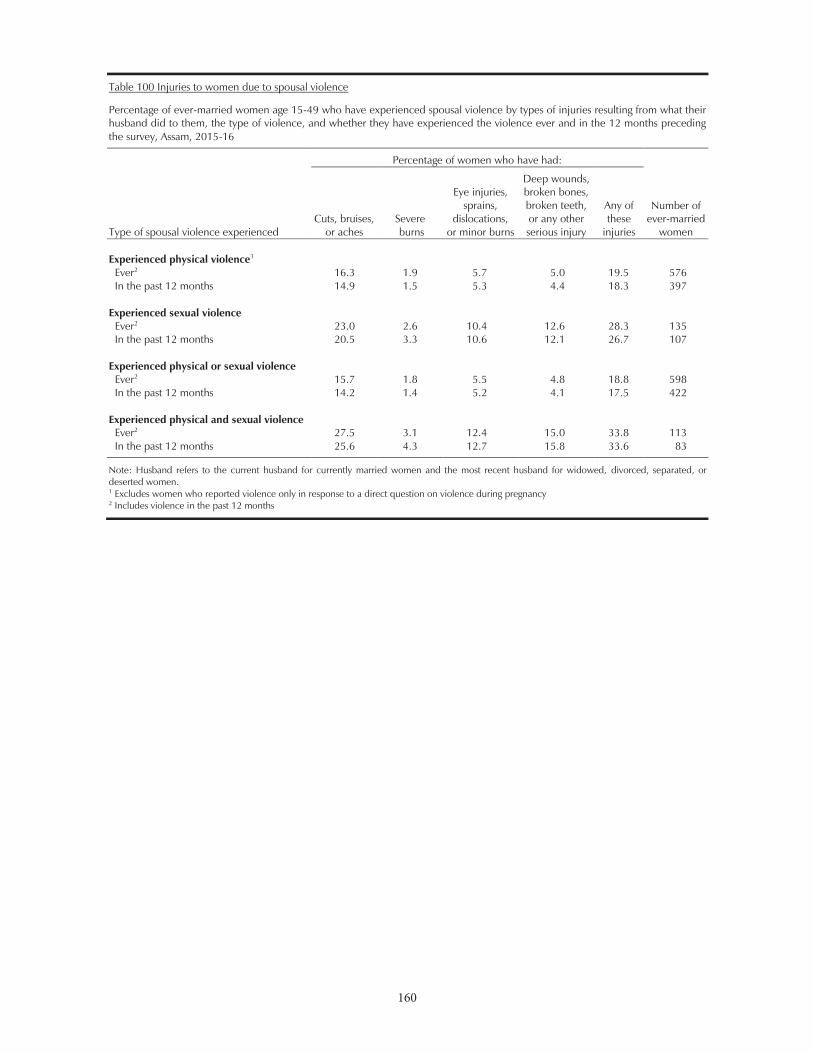
160
160
Table 100 Injuries to women due to spousal violence
Percentage of ever-married women age 15-49 who have experienced spousal violence by types of injuries resulting from what their husband did to them, the type of violence, and whether they have experienced the violence ever and in the 12 months preceding the survey, Assam, 2015-16
Type of spousal violence experienced
Percentage of women who have had:
Number of ever-married
women Cuts, bruises,
or aches Severe burns
Eye injuries, sprains,
dislocations, or minor burns
Deep wounds, broken bones, broken teeth, or any other serious injury
Any of these
injuries Experienced physical violence1
Ever2 16.3 1.9 5.7 5.0 19.5 576 In the past 12 months 14.9 1.5 5.3 4.4 18.3 397
Experienced sexual violence Ever2 23.0 2.6 10.4 12.6 28.3 135 In the past 12 months 20.5 3.3 10.6 12.1 26.7 107
Experienced physical or sexual violence Ever2 15.7 1.8 5.5 4.8 18.8 598 In the past 12 months 14.2 1.4 5.2 4.1 17.5 422
Experienced physical and sexual violence Ever2 27.5 3.1 12.4 15.0 33.8 113 In the past 12 months 25.6 4.3 12.7 15.8 33.6 83
Note: Husband refers to the current husband for currently married women and the most recent husband for widowed, divorced, separated, or deserted women. 1 Excludes women who reported violence only in response to a direct question on violence during pregnancy 2 Includes violence in the past 12 months
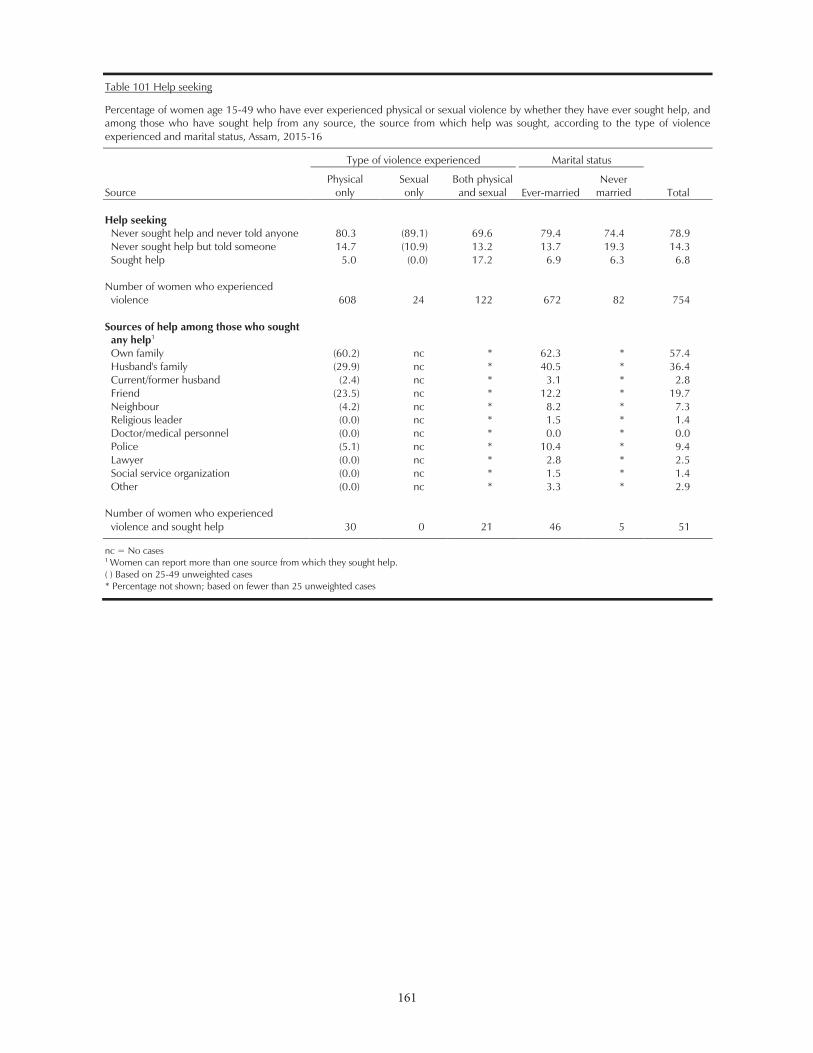
161
161
Table 101 Help seeking
Percentage of women age 15-49 who have ever experienced physical or sexual violence by whether they have ever sought help, and among those who have sought help from any source, the source from which help was sought, according to the type of violence experienced and marital status, Assam, 2015-16
Source
Type of violence experienced
Marital status
Physical only
Sexual only
Both physical and sexual Ever-married
Never married Total
Help seeking
Never sought help and never told anyone 80.3 (89.1) 69.6 79.4 74.4 78.9 Never sought help but told someone 14.7 (10.9) 13.2 13.7 19.3 14.3 Sought help 5.0 (0.0) 17.2 6.9 6.3 6.8
Number of women who experienced violence 608 24 122 672 82 754
Sources of help among those who sought any help1
Own family (60.2) nc * 62.3 * 57.4 Husband's family (29.9) nc * 40.5 * 36.4 Current/former husband (2.4) nc * 3.1 * 2.8 Friend (23.5) nc * 12.2 * 19.7 Neighbour (4.2) nc * 8.2 * 7.3 Religious leader (0.0) nc * 1.5 * 1.4 Doctor/medical personnel (0.0) nc * 0.0 * 0.0 Police (5.1) nc * 10.4 * 9.4 Lawyer (0.0) nc * 2.8 * 2.5 Social service organization (0.0) nc * 1.5 * 1.4 Other (0.0) nc * 3.3 * 2.9
Number of women who experienced violence and sought help 30 0 21 46 5 51
nc = No cases 1 Women can report more than one source from which they sought help. ( ) Based on 25-49 unweighted cases * Percentage not shown; based on fewer than 25 unweighted cases

163
APPENDIX
ESTIMATES OF SAMPLING ERRORS The estimates from a sample survey are affected by two types of errors: (1) non-sampling errors, and (2) sampling errors. Non-sampling errors are the results of mistakes made in implementing data collection and data processing, such as failure to locate and interview the correct household, misunderstanding of the questions on the part of either the interviewer or the respondent, and data entry errors. Although numerous efforts were made during the implementation of the fourth National Family Health Survey (NFHS-4) to minimize this type of error, non-sampling errors are impossible to avoid and difficult to evaluate statistically. Sampling errors, on the other hand, can be evaluated statistically. The sample of respondents selected in NFHS-4 is only one of many samples that could have been selected from the same population, using the same design and expected sample size. Each of these samples would yield results that differ somewhat from the results of the actual sample selected. Sampling errors are a measure of the variability among all possible samples. Although the degree of variability is not known exactly, it can be estimated from the survey results. A sampling error is usually measured in terms of the standard error for a particular statistic (mean, percentage, etc.), which is the square root of the variance. The standard error can be used to calculate confidence intervals within which the true value for the population can reasonably be assumed to fall. For example, for any given statistic calculated from a sample survey, the value of that statistic will fall within a range of plus or minus two times the standard error of that statistic in 95 percent of all possible samples of identical size and design. If the sample of respondents had been selected as a simple random sample, it would have been possible to use straightforward formulas for calculating sampling errors. However, the NFHS-4 sample is the result of a multi-stage stratified design, and, consequently, it was necessary to use more complex formulae. The computer software used to calculate sampling errors for NFHS-4 is programmed in SAS. This procedure uses the Taylor linearization method for variance estimation for survey estimates that are means or proportions. The Jackknife repeated replication method is used for variance estimation of more complex statistics such as total fertility rates and child mortality rates. The Taylor linearization method treats any proportion or mean as a ratio estimate, r = y/x, where y represents the total sample value for variable y, and x represents the total number of cases in the group or subgroup under consideration. The variance of r is computed using the formula given below, with the standard error being the square root of the variance:
163163
APPENDIX
ESTIMATES OF SAMPLING ERRORS The estimates from a sample survey are affected by two types of errors: (1) non-sampling errors, and (2) sampling errors. Non-sampling errors are the results of mistakes made in implementing data collection and data processing, such as failure to locate and interview the correct household, misunderstanding of the questions on the part of either the interviewer or the respondent, and data entry errors. Although numerous efforts were made during the implementation of the fourth National Family Health Survey (NFHS-4) to minimize this type of error, non-sampling errors are impossible to avoid and difficult to evaluate statistically. Sampling errors, on the other hand, can be evaluated statistically. The sample of respondents selected in NFHS-4 is only one of many samples that could have been selected from the same population, using the same design and expected sample size. Each of these samples would yield results that differ somewhat from the results of the actual sample selected. Sampling errors are a measure of the variability among all possible samples. Although the degree of variability is not known exactly, it can be estimated from the survey results. A sampling error is usually measured in terms of the standard error for a particular statistic (mean, percentage, etc.), which is the square root of the variance. The standard error can be used to calculate confidence intervals within which the true value for the population can reasonably be assumed to fall. For example, for any given statistic calculated from a sample survey, the value of that statistic will fall within a range of plus or minus two times the standard error of that statistic in 95 percent of all possible samples of identical size and design. If the sample of respondents had been selected as a simple random sample, it would have been possible to use straightforward formulas for calculating sampling errors. However, the NFHS-4 sample is the result of a multi-stage stratified design, and, consequently, it was necessary to use more complex formulae. The computer software used to calculate sampling errors for NFHS-4 is programmed in SAS. This procedure uses the Taylor linearization method for variance estimation for survey estimates that are means or proportions. The Jackknife repeated replication method is used for variance estimation of more complex statistics such as total fertility rates and child mortality rates. The Taylor linearization method treats any proportion or mean as a ratio estimate, r = y/x, where y represents the total sample value for variable y, and x represents the total number of cases in the group or subgroup under consideration. The variance of r is computed using the formula given below, with the standard error being the square root of the variance:
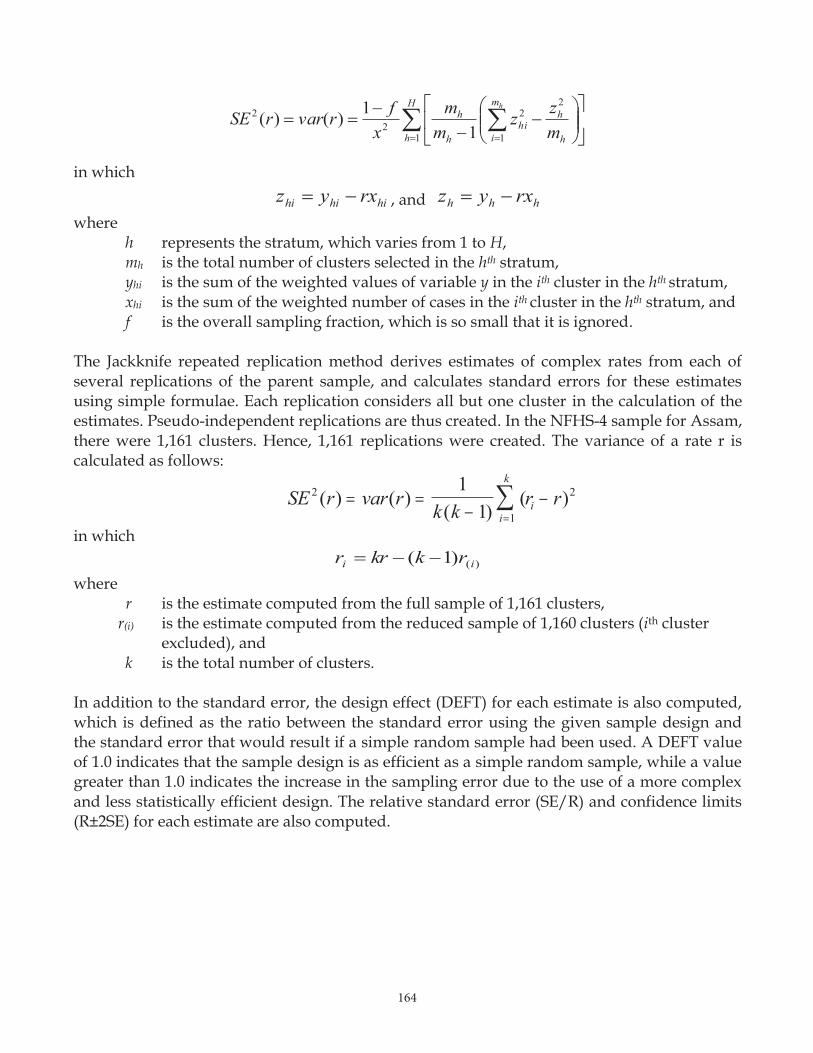
164164
H
h h
hm
ihi
h
h
mzz
mm
xfrvarrSE
h
1
2
1
22
2
11)()(
in which
hihihi rxyz , and hhh rxyz where
h represents the stratum, which varies from 1 to H, mh is the total number of clusters selected in the hth stratum, yhi is the sum of the weighted values of variable y in the ith cluster in the hth stratum, xhi is the sum of the weighted number of cases in the ith cluster in the hth stratum, and f is the overall sampling fraction, which is so small that it is ignored.
The Jackknife repeated replication method derives estimates of complex rates from each of several replications of the parent sample, and calculates standard errors for these estimates using simple formulae. Each replication considers all but one cluster in the calculation of the estimates. Pseudo-independent replications are thus created. In the NFHS-4 sample for Assam, there were 1,161 clusters. Hence, 1,161 replications were created. The variance of a rate r is calculated as follows:
SE r var rk k
r ri
k
i2
1
211
( ) ( )( )
( )
in which )()1( ii rkkrr
where r is the estimate computed from the full sample of 1,161 clusters,
r(i) is the estimate computed from the reduced sample of 1,160 clusters (ith cluster excluded), and
k is the total number of clusters. In addition to the standard error, the design effect (DEFT) for each estimate is also computed, which is defined as the ratio between the standard error using the given sample design and the standard error that would result if a simple random sample had been used. A DEFT value of 1.0 indicates that the sample design is as efficient as a simple random sample, while a value greater than 1.0 indicates the increase in the sampling error due to the use of a more complex and less statistically efficient design. The relative standard error (SE/R) and confidence limits (R±2SE) for each estimate are also computed.
165
Sampling errors for NFHS-4 are calculated for selected variables considered to be of primary interest. The results are presented in this appendix for Assam as a whole and for the urban and rural areas of the state. For each variable, the type of statistic (mean, proportion, rate, or ratio) and the base population are given in Table A.1. Table A.2 presents the value of the statistic (R), its standard error (SE), the number of unweighted (N) and weighted (WN) cases, the design effect (DEFT), the relative standard error (SE/R), and the 95 percent confidence limits (R±2SE); for each variable. The DEFT is considered undefined when the standard error for a simple random sample is zero (when the estimate is close to 0 or 1).
165164
H
h h
hm
ihi
h
h
mzz
mm
xfrvarrSE
h
1
2
1
22
2
11)()(
in which
hihihi rxyz , and hhh rxyz where
h represents the stratum, which varies from 1 to H, mh is the total number of clusters selected in the hth stratum, yhi is the sum of the weighted values of variable y in the ith cluster in the hth stratum, xhi is the sum of the weighted number of cases in the ith cluster in the hth stratum, and f is the overall sampling fraction, which is so small that it is ignored.
The Jackknife repeated replication method derives estimates of complex rates from each of several replications of the parent sample, and calculates standard errors for these estimates using simple formulae. Each replication considers all but one cluster in the calculation of the estimates. Pseudo-independent replications are thus created. In the NFHS-4 sample for Assam, there were 1,161 clusters. Hence, 1,161 replications were created. The variance of a rate r is calculated as follows:
SE r var rk k
r ri
k
i2
1
211
( ) ( )( )
( )
in which )()1( ii rkkrr
where r is the estimate computed from the full sample of 1,161 clusters,
r(i) is the estimate computed from the reduced sample of 1,160 clusters (ith cluster excluded), and
k is the total number of clusters. In addition to the standard error, the design effect (DEFT) for each estimate is also computed, which is defined as the ratio between the standard error using the given sample design and the standard error that would result if a simple random sample had been used. A DEFT value of 1.0 indicates that the sample design is as efficient as a simple random sample, while a value greater than 1.0 indicates the increase in the sampling error due to the use of a more complex and less statistically efficient design. The relative standard error (SE/R) and confidence limits (R±2SE) for each estimate are also computed.
165
Sampling errors for NFHS-4 are calculated for selected variables considered to be of primary interest. The results are presented in this appendix for Assam as a whole and for the urban and rural areas of the state. For each variable, the type of statistic (mean, proportion, rate, or ratio) and the base population are given in Table A.1. Table A.2 presents the value of the statistic (R), its standard error (SE), the number of unweighted (N) and weighted (WN) cases, the design effect (DEFT), the relative standard error (SE/R), and the 95 percent confidence limits (R±2SE); for each variable. The DEFT is considered undefined when the standard error for a simple random sample is zero (when the estimate is close to 0 or 1).
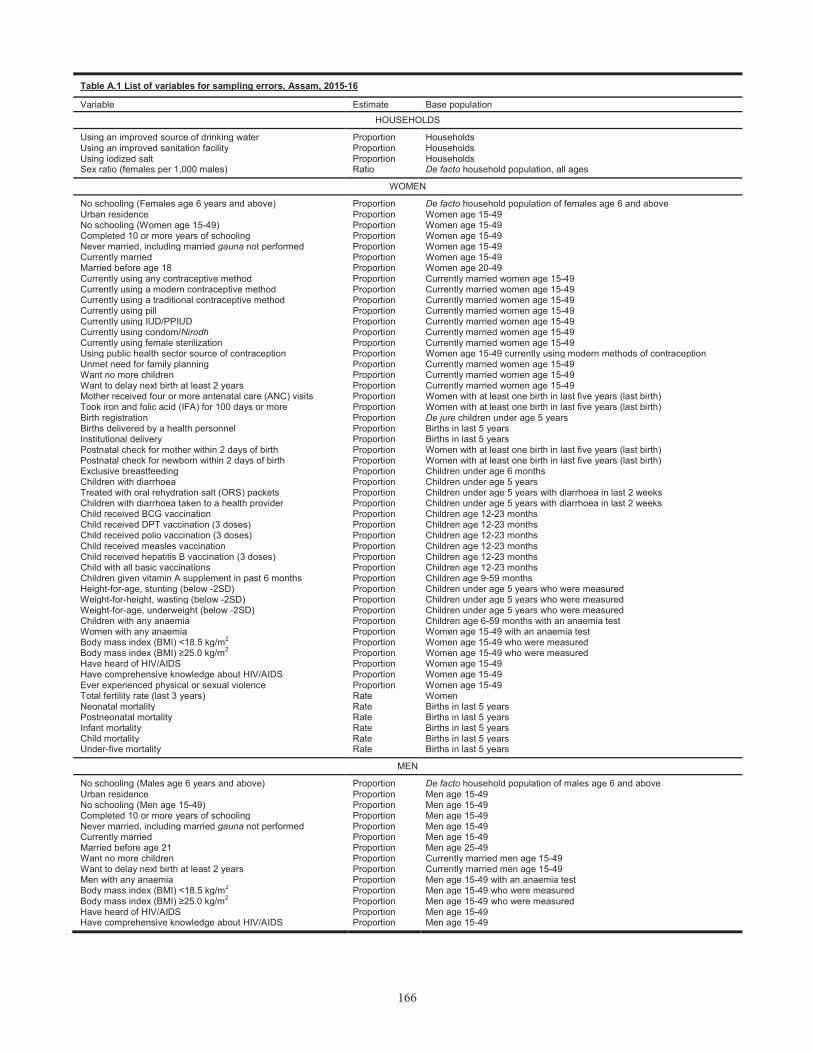
166166
Table A.1 List of variables for sampling errors, Assam, 2015-16
Variable Estimate Base population
HOUSEHOLDS
Using an improved source of drinking water Proportion HouseholdsUsing an improved sanitation facility Proportion HouseholdsUsing iodized salt Proportion HouseholdsSex ratio (females per 1,000 males) Ratio De facto household population, all ages
WOMEN
No schooling (Females age 6 years and above) Proportion De facto household population of females age 6 and aboveUrban residence Proportion Women age 15-49No schooling (Women age 15-49) Proportion Women age 15-49Completed 10 or more years of schooling Proportion Women age 15-49Never married, including married gauna not performed Proportion Women age 15-49Currently married Proportion Women age 15-49Married before age 18 Proportion Women age 20-49Currently using any contraceptive method Proportion Currently married women age 15-49Currently using a modern contraceptive method Proportion Currently married women age 15-49Currently using a traditional contraceptive method Proportion Currently married women age 15-49Currently using pill Proportion Currently married women age 15-49Currently using IUD/PPIUD Proportion Currently married women age 15-49Currently using condom/Nirodh Proportion Currently married women age 15-49Currently using female sterilization Proportion Currently married women age 15-49Using public health sector source of contraception Proportion Women age 15-49 currently using modern methods of contraceptionUnmet need for family planning Proportion Currently married women age 15-49Want no more children Proportion Currently married women age 15-49Want to delay next birth at least 2 years Proportion Currently married women age 15-49Mother received four or more antenatal care (ANC) visits Proportion Women with at least one birth in last five years (last birth)Took iron and folic acid (IFA) for 100 days or more Proportion Women with at least one birth in last five years (last birth)Birth registration Proportion De jure children under age 5 yearsBirths delivered by a health personnel Proportion Births in last 5 yearsInstitutional delivery Proportion Births in last 5 yearsPostnatal check for mother within 2 days of birth Proportion Women with at least one birth in last five years (last birth)Postnatal check for newborn within 2 days of birth Proportion Women with at least one birth in last five years (last birth)Exclusive breastfeeding Proportion Children under age 6 monthsChildren with diarrhoea Proportion Children under age 5 yearsTreated with oral rehydration salt (ORS) packets Proportion Children under age 5 years with diarrhoea in last 2 weeksChildren with diarrhoea taken to a health provider Proportion Children under age 5 years with diarrhoea in last 2 weeksChild received BCG vaccination Proportion Children age 12-23 monthsChild received DPT vaccination (3 doses) Proportion Children age 12-23 monthsChild received polio vaccination (3 doses) Proportion Children age 12-23 monthsChild received measles vaccination Proportion Children age 12-23 monthsChild received hepatitis B vaccination (3 doses) Proportion Children age 12-23 monthsChild with all basic vaccinations Proportion Children age 12-23 monthsChildren given vitamin A supplement in past 6 months Proportion Children age 9-59 monthsHeight-for-age, stunting (below -2SD) Proportion Children under age 5 years who were measuredWeight-for-height, wasting (below -2SD) Proportion Children under age 5 years who were measuredWeight-for-age, underweight (below -2SD) Proportion Children under age 5 years who were measuredChildren with any anaemia Proportion Children age 6-59 months with an anaemia testWomen with any anaemia Proportion Women age 15-49 with an anaemia testBody mass index (BMI) <18.5 kg/m2 Proportion Women age 15-49 who were measured
≥ 2 Proportion Women age 15-49 who were measured Have heard of HIV/AIDS Proportion Women age 15-49Have comprehensive knowledge about HIV/AIDS Proportion Women age 15-49Ever experienced physical or sexual violence Proportion Women age 15-49Total fertility rate (last 3 years) Rate WomenNeonatal mortality Rate Births in last 5 yearsPostneonatal mortality Rate Births in last 5 yearsInfant mortality Rate Births in last 5 yearsChild mortality Rate Births in last 5 yearsUnder-five mortality Rate Births in last 5 years
MEN
No schooling (Males age 6 years and above) Proportion De facto household population of males age 6 and aboveUrban residence Proportion Men age 15-49No schooling (Men age 15-49) Proportion Men age 15-49Completed 10 or more years of schooling Proportion Men age 15-49Never married, including married gauna not performed Proportion Men age 15-49Currently married Proportion Men age 15-49Married before age 21 Proportion Men age 25-49Want no more children Proportion Currently married men age 15-49Want to delay next birth at least 2 years Proportion Currently married men age 15-49Men with any anaemia Proportion Men age 15-49 with an anaemia testBody mass index (BMI) <18.5 kg/m2 Proportion Men age 15-49 who were measured
≥ 2 Proportion Men age 15-49 who were measured Have heard of HIV/AIDS Proportion Men age 15-49Have comprehensive knowledge about HIV/AIDS Proportion Men age 15-49
Ap
Table A.2 Sampling errors: Total sample, Assam, 2015-16
Variable Value
(R)
Standard error (SE)
Number of cases Design effect
(DEFT)
Relative standard
error (SE/R)
Confidence limits Unweighted
(N) Weighted
(WN) R-2SE R+2SE HOUSEHOLDS
Using an improved source of drinking water 0.838 0.008 24,542 24,542 3.395 0.010 0.822 0.854 Using an improved sanitation facility 0.477 0.007 24,542 24,542 2.243 0.015 0.463 0.492 Using iodized salt 0.996 0.001 24,479 24,485 1.258 0.001 0.995 0.997 Sex ratio (females per 1,000 males) 993.102 5.156 55,335 55,125 1.164 0.005 982.789 1003.415
WOMEN
No schooling (Females age 6 years and above) 0.249 0.004 48,991 48,940 2.088 0.017 0.241 0.257 Urban residence 0.150 0.004 28,447 28,447 1.826 0.026 0.142 0.158 No schooling (Women age 15-49) 0.230 0.005 28,447 28,447 2.182 0.024 0.219 0.241 Completed 10 or more years of schooling 0.262 0.006 28,447 28,447 2.211 0.022 0.251 0.274 Never married, including married gauna not performed 0.229 0.003 28,447 28,447 1.372 0.015 0.222 0.235 Currently married 0.723 0.004 28,447 28,447 1.457 0.005 0.715 0.730 Married before age 18 0.322 0.005 23,776 23,754 1.573 0.015 0.313 0.332 Currently using any contraceptive method 0.524 0.007 20,643 20,556 1.872 0.012 0.511 0.537 Currently using a modern contraceptive method 0.370 0.006 20,643 20,556 1.759 0.016 0.358 0.382 Currently using a traditional contraceptive method 0.154 0.005 20,643 20,556 1.818 0.030 0.145 0.163 Currently using pill 0.220 0.006 20,643 20,556 1.908 0.025 0.209 0.231 Currently using IUD/PPIUD 0.022 0.001 20,643 20,556 1.251 0.058 0.020 0.025 Currently using condom/Nirodh 0.027 0.002 20,643 20,556 1.444 0.060 0.024 0.030 Currently using female sterilization 0.095 0.004 20,643 20,556 1.987 0.043 0.087 0.103 Using public health sector source of contraception 0.411 0.010 7,613 7,650 1.748 0.024 0.391 0.430 Unmet need for family planning 0.142 0.004 20,643 20,556 1.561 0.027 0.134 0.149 Want no more children 0.609 0.005 20,643 20,556 1.549 0.009 0.598 0.619 Want to delay next birth at least 2 years 0.113 0.003 20,643 20,556 1.316 0.026 0.107 0.119 Mother received four or more antenatal care (ANC) visits 0.465 0.010 8,531 8,401 1.897 0.022 0.444 0.485 Took iron and folic acid (IFA) for 100 days or more 0.320 0.009 8,531 8,401 1.727 0.027 0.302 0.337 Birth registration 0.942 0.004 10,394 10,272 1.403 0.004 0.934 0.949 Births delivered by a health personnel 0.743 0.011 10,304 10,171 2.146 0.014 0.722 0.764 Institutional delivery 0.706 0.011 10,304 10,171 2.134 0.015 0.685 0.728 Postnatal check for mother within 2 days of birth 0.577 0.011 8,531 8,401 2.028 0.019 0.555 0.599 Postnatal check for newborn within 2 days of birth 0.274 0.009 8,531 8,401 1.819 0.032 0.256 0.292 Exclusive breastfeeding 0.636 0.018 954 951 1.172 0.029 0.600 0.673 Children with diarrhoea 0.029 0.002 9,792 9,666 1.372 0.083 0.024 0.034 Treated with oral rehydration salt (ORS) packets 0.519 0.035 261 283 1.172 0.068 0.448 0.590 Children with diarrhoea taken to a health provider 0.508 0.037 261 283 1.229 0.073 0.434 0.582 Child received BCG vaccination 0.823 0.012 1,935 1,939 1.329 0.014 0.800 0.847 Child received DPT vaccination (3 doses) 0.665 0.015 1,935 1,939 1.366 0.022 0.635 0.694 Child received polio vaccination (3 doses) 0.560 0.015 1,935 1,939 1.319 0.027 0.530 0.590 Child received measles vaccination 0.714 0.014 1,935 1,939 1.349 0.020 0.686 0.742 Child received hepatitis B vaccination (3 doses) 0.520 0.015 1,935 1,939 1.313 0.029 0.490 0.550 Child with all basic vaccinations 0.471 0.015 1,935 1,939 1.333 0.032 0.440 0.501 Children given vitamin A supplement in past 6 months 0.514 0.010 8,426 8,304 1.791 0.020 0.493 0.535 Height-for-age, stunting (below -2SD) 0.364 0.007 9,009 8,868 1.329 0.019 0.350 0.378 Weight-for-height, wasting (below -2SD) 0.170 0.006 9,009 8,868 1.466 0.035 0.158 0.182 Weight-for-age, underweight (below -2SD) 0.298 0.007 9,009 8,868 1.365 0.023 0.284 0.312 Children with any anaemia 0.357 0.008 8,103 7,962 1.415 0.022 0.341 0.372 Women with any anaemia 0.460 0.005 27,610 27,539 1.667 0.011 0.450 0.470 Body mass index (BMI) <18.5 kg/m2 0.257 0.005 26,532 26,502 1.784 0.019 0.247 0.266
≥ 2 0.133 0.003 26,532 26,502 1.628 0.026 0.126 0.140 Have heard of HIV/AIDS 0.777 0.014 4,590 4,612 2.251 0.018 0.750 0.805 Have comprehensive knowledge about HIV/AIDS 0.094 0.007 4,590 4,612 1.567 0.072 0.080 0.107 Ever experienced physical or sexual violence 0.240 0.014 3,137 3,137 1.829 0.058 0.212 0.268 Total fertility rate (last 3 years) 2.213 0.039 81,413 81,419 1.447 0.017 2.136 2.290 Neonatal mortality 32.910 2.167 10,402 10,281 1.165 0.066 28.576 37.243 Postneonatal mortality 14.836 1.466 10,391 10,262 1.099 0.099 11.903 17.769 Infant mortality 47.746 2.617 10,411 10,290 1.154 0.055 42.512 52.981 Child mortality 9.308 1.024 10,445 10,315 1.100 0.110 7.260 11.357 Under-five mortality 56.610 2.762 10,459 10,337 1.142 0.049 51.086 62.134
MEN
No schooling (Males age 6 years and above) 0.156 0.004 48,976 48,811 2.083 0.024 0.149 0.163 Urban residence 0.167 0.009 3,860 3,846 1.440 0.052 0.150 0.185 No schooling (Men age 15-49) 0.142 0.009 3,860 3,846 1.535 0.061 0.125 0.159 Completed 10 or more years of schooling 0.332 0.012 3,860 3,846 1.637 0.037 0.307 0.357 Never married, including married gauna not performed 0.386 0.009 3,860 3,846 1.135 0.023 0.369 0.404 Currently married 0.605 0.009 3,860 3,846 1.163 0.015 0.586 0.623 Married before age 21 0.150 0.009 2,674 2,654 1.311 0.060 0.132 0.169 Want no more children 0.584 0.012 2,336 2,326 1.173 0.020 0.560 0.608 Want to delay next birth at least 2 years 0.173 0.010 2,336 2,326 1.311 0.059 0.152 0.193 Men with any anaemia 0.255 0.010 3,676 3,628 1.394 0.041 0.234 0.275 Body mass index (BMI) <18.5 kg/m2 0.207 0.010 3,737 3,700 1.348 0.046 0.188 0.226
≥ 2 0.129 0.008 3,737 3,700 1.298 0.058 0.114 0.144 Have heard of HIV/AIDS 0.896 0.011 3,860 3,846 2.286 0.013 0.874 0.919 Have comprehensive knowledge about HIV/AIDS 0.224 0.014 3,860 3,846 2.147 0.064 0.196 0.253
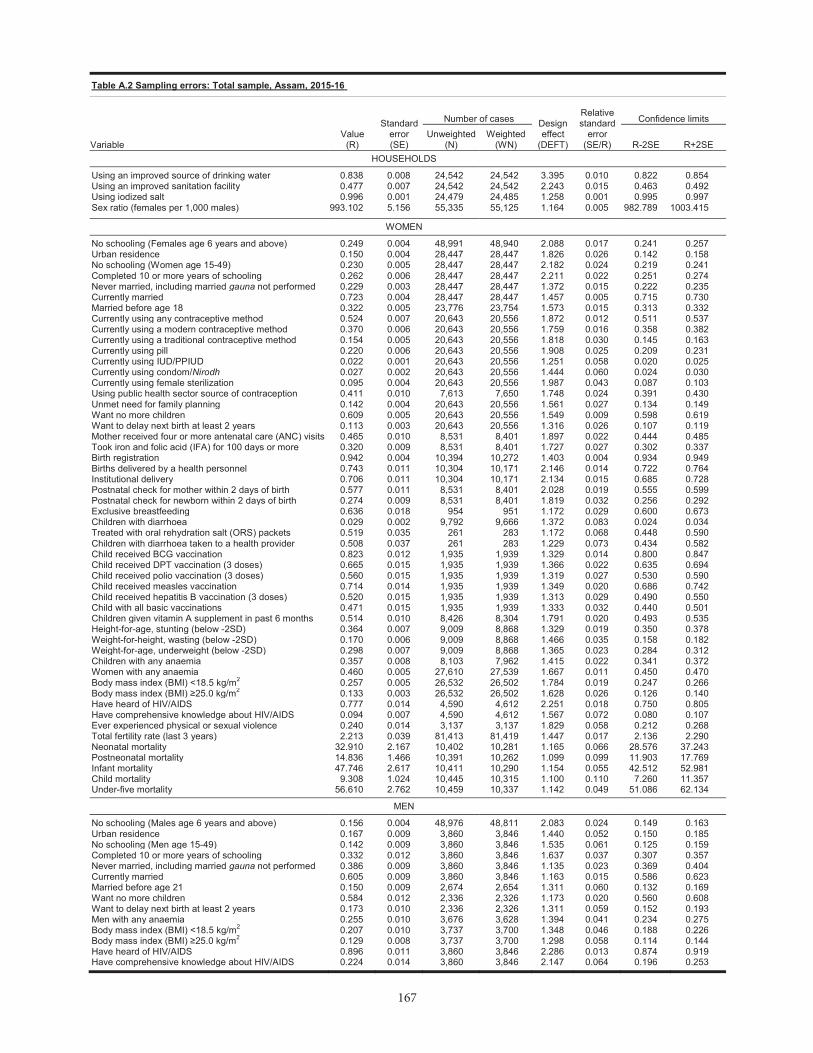
167166
Table A.1 List of variables for sampling errors, Assam, 2015-16
Variable Estimate Base population
HOUSEHOLDS
Using an improved source of drinking water Proportion HouseholdsUsing an improved sanitation facility Proportion HouseholdsUsing iodized salt Proportion HouseholdsSex ratio (females per 1,000 males) Ratio De facto household population, all ages
WOMEN
No schooling (Females age 6 years and above) Proportion De facto household population of females age 6 and aboveUrban residence Proportion Women age 15-49No schooling (Women age 15-49) Proportion Women age 15-49Completed 10 or more years of schooling Proportion Women age 15-49Never married, including married gauna not performed Proportion Women age 15-49Currently married Proportion Women age 15-49Married before age 18 Proportion Women age 20-49Currently using any contraceptive method Proportion Currently married women age 15-49Currently using a modern contraceptive method Proportion Currently married women age 15-49Currently using a traditional contraceptive method Proportion Currently married women age 15-49Currently using pill Proportion Currently married women age 15-49Currently using IUD/PPIUD Proportion Currently married women age 15-49Currently using condom/Nirodh Proportion Currently married women age 15-49Currently using female sterilization Proportion Currently married women age 15-49Using public health sector source of contraception Proportion Women age 15-49 currently using modern methods of contraceptionUnmet need for family planning Proportion Currently married women age 15-49Want no more children Proportion Currently married women age 15-49Want to delay next birth at least 2 years Proportion Currently married women age 15-49Mother received four or more antenatal care (ANC) visits Proportion Women with at least one birth in last five years (last birth)Took iron and folic acid (IFA) for 100 days or more Proportion Women with at least one birth in last five years (last birth)Birth registration Proportion De jure children under age 5 yearsBirths delivered by a health personnel Proportion Births in last 5 yearsInstitutional delivery Proportion Births in last 5 yearsPostnatal check for mother within 2 days of birth Proportion Women with at least one birth in last five years (last birth)Postnatal check for newborn within 2 days of birth Proportion Women with at least one birth in last five years (last birth)Exclusive breastfeeding Proportion Children under age 6 monthsChildren with diarrhoea Proportion Children under age 5 yearsTreated with oral rehydration salt (ORS) packets Proportion Children under age 5 years with diarrhoea in last 2 weeksChildren with diarrhoea taken to a health provider Proportion Children under age 5 years with diarrhoea in last 2 weeksChild received BCG vaccination Proportion Children age 12-23 monthsChild received DPT vaccination (3 doses) Proportion Children age 12-23 monthsChild received polio vaccination (3 doses) Proportion Children age 12-23 monthsChild received measles vaccination Proportion Children age 12-23 monthsChild received hepatitis B vaccination (3 doses) Proportion Children age 12-23 monthsChild with all basic vaccinations Proportion Children age 12-23 monthsChildren given vitamin A supplement in past 6 months Proportion Children age 9-59 monthsHeight-for-age, stunting (below -2SD) Proportion Children under age 5 years who were measuredWeight-for-height, wasting (below -2SD) Proportion Children under age 5 years who were measuredWeight-for-age, underweight (below -2SD) Proportion Children under age 5 years who were measuredChildren with any anaemia Proportion Children age 6-59 months with an anaemia testWomen with any anaemia Proportion Women age 15-49 with an anaemia testBody mass index (BMI) <18.5 kg/m2 Proportion Women age 15-49 who were measured
≥ 2 Proportion Women age 15-49 who were measured Have heard of HIV/AIDS Proportion Women age 15-49Have comprehensive knowledge about HIV/AIDS Proportion Women age 15-49Ever experienced physical or sexual violence Proportion Women age 15-49Total fertility rate (last 3 years) Rate WomenNeonatal mortality Rate Births in last 5 yearsPostneonatal mortality Rate Births in last 5 yearsInfant mortality Rate Births in last 5 yearsChild mortality Rate Births in last 5 yearsUnder-five mortality Rate Births in last 5 years
MEN
No schooling (Males age 6 years and above) Proportion De facto household population of males age 6 and aboveUrban residence Proportion Men age 15-49No schooling (Men age 15-49) Proportion Men age 15-49Completed 10 or more years of schooling Proportion Men age 15-49Never married, including married gauna not performed Proportion Men age 15-49Currently married Proportion Men age 15-49Married before age 21 Proportion Men age 25-49Want no more children Proportion Currently married men age 15-49Want to delay next birth at least 2 years Proportion Currently married men age 15-49Men with any anaemia Proportion Men age 15-49 with an anaemia testBody mass index (BMI) <18.5 kg/m2 Proportion Men age 15-49 who were measured
≥ 2 Proportion Men age 15-49 who were measured Have heard of HIV/AIDS Proportion Men age 15-49Have comprehensive knowledge about HIV/AIDS Proportion Men age 15-49
Ap
Table A.2 Sampling errors: Total sample, Assam, 2015-16
Variable Value
(R)
Standard error (SE)
Number of cases Design effect
(DEFT)
Relative standard
error (SE/R)
Confidence limits Unweighted
(N) Weighted
(WN) R-2SE R+2SE HOUSEHOLDS
Using an improved source of drinking water 0.838 0.008 24,542 24,542 3.395 0.010 0.822 0.854 Using an improved sanitation facility 0.477 0.007 24,542 24,542 2.243 0.015 0.463 0.492 Using iodized salt 0.996 0.001 24,479 24,485 1.258 0.001 0.995 0.997 Sex ratio (females per 1,000 males) 993.102 5.156 55,335 55,125 1.164 0.005 982.789 1003.415
WOMEN
No schooling (Females age 6 years and above) 0.249 0.004 48,991 48,940 2.088 0.017 0.241 0.257 Urban residence 0.150 0.004 28,447 28,447 1.826 0.026 0.142 0.158 No schooling (Women age 15-49) 0.230 0.005 28,447 28,447 2.182 0.024 0.219 0.241 Completed 10 or more years of schooling 0.262 0.006 28,447 28,447 2.211 0.022 0.251 0.274 Never married, including married gauna not performed 0.229 0.003 28,447 28,447 1.372 0.015 0.222 0.235 Currently married 0.723 0.004 28,447 28,447 1.457 0.005 0.715 0.730 Married before age 18 0.322 0.005 23,776 23,754 1.573 0.015 0.313 0.332 Currently using any contraceptive method 0.524 0.007 20,643 20,556 1.872 0.012 0.511 0.537 Currently using a modern contraceptive method 0.370 0.006 20,643 20,556 1.759 0.016 0.358 0.382 Currently using a traditional contraceptive method 0.154 0.005 20,643 20,556 1.818 0.030 0.145 0.163 Currently using pill 0.220 0.006 20,643 20,556 1.908 0.025 0.209 0.231 Currently using IUD/PPIUD 0.022 0.001 20,643 20,556 1.251 0.058 0.020 0.025 Currently using condom/Nirodh 0.027 0.002 20,643 20,556 1.444 0.060 0.024 0.030 Currently using female sterilization 0.095 0.004 20,643 20,556 1.987 0.043 0.087 0.103 Using public health sector source of contraception 0.411 0.010 7,613 7,650 1.748 0.024 0.391 0.430 Unmet need for family planning 0.142 0.004 20,643 20,556 1.561 0.027 0.134 0.149 Want no more children 0.609 0.005 20,643 20,556 1.549 0.009 0.598 0.619 Want to delay next birth at least 2 years 0.113 0.003 20,643 20,556 1.316 0.026 0.107 0.119 Mother received four or more antenatal care (ANC) visits 0.465 0.010 8,531 8,401 1.897 0.022 0.444 0.485 Took iron and folic acid (IFA) for 100 days or more 0.320 0.009 8,531 8,401 1.727 0.027 0.302 0.337 Birth registration 0.942 0.004 10,394 10,272 1.403 0.004 0.934 0.949 Births delivered by a health personnel 0.743 0.011 10,304 10,171 2.146 0.014 0.722 0.764 Institutional delivery 0.706 0.011 10,304 10,171 2.134 0.015 0.685 0.728 Postnatal check for mother within 2 days of birth 0.577 0.011 8,531 8,401 2.028 0.019 0.555 0.599 Postnatal check for newborn within 2 days of birth 0.274 0.009 8,531 8,401 1.819 0.032 0.256 0.292 Exclusive breastfeeding 0.636 0.018 954 951 1.172 0.029 0.600 0.673 Children with diarrhoea 0.029 0.002 9,792 9,666 1.372 0.083 0.024 0.034 Treated with oral rehydration salt (ORS) packets 0.519 0.035 261 283 1.172 0.068 0.448 0.590 Children with diarrhoea taken to a health provider 0.508 0.037 261 283 1.229 0.073 0.434 0.582 Child received BCG vaccination 0.823 0.012 1,935 1,939 1.329 0.014 0.800 0.847 Child received DPT vaccination (3 doses) 0.665 0.015 1,935 1,939 1.366 0.022 0.635 0.694 Child received polio vaccination (3 doses) 0.560 0.015 1,935 1,939 1.319 0.027 0.530 0.590 Child received measles vaccination 0.714 0.014 1,935 1,939 1.349 0.020 0.686 0.742 Child received hepatitis B vaccination (3 doses) 0.520 0.015 1,935 1,939 1.313 0.029 0.490 0.550 Child with all basic vaccinations 0.471 0.015 1,935 1,939 1.333 0.032 0.440 0.501 Children given vitamin A supplement in past 6 months 0.514 0.010 8,426 8,304 1.791 0.020 0.493 0.535 Height-for-age, stunting (below -2SD) 0.364 0.007 9,009 8,868 1.329 0.019 0.350 0.378 Weight-for-height, wasting (below -2SD) 0.170 0.006 9,009 8,868 1.466 0.035 0.158 0.182 Weight-for-age, underweight (below -2SD) 0.298 0.007 9,009 8,868 1.365 0.023 0.284 0.312 Children with any anaemia 0.357 0.008 8,103 7,962 1.415 0.022 0.341 0.372 Women with any anaemia 0.460 0.005 27,610 27,539 1.667 0.011 0.450 0.470 Body mass index (BMI) <18.5 kg/m2 0.257 0.005 26,532 26,502 1.784 0.019 0.247 0.266
≥ 2 0.133 0.003 26,532 26,502 1.628 0.026 0.126 0.140 Have heard of HIV/AIDS 0.777 0.014 4,590 4,612 2.251 0.018 0.750 0.805 Have comprehensive knowledge about HIV/AIDS 0.094 0.007 4,590 4,612 1.567 0.072 0.080 0.107 Ever experienced physical or sexual violence 0.240 0.014 3,137 3,137 1.829 0.058 0.212 0.268 Total fertility rate (last 3 years) 2.213 0.039 81,413 81,419 1.447 0.017 2.136 2.290 Neonatal mortality 32.910 2.167 10,402 10,281 1.165 0.066 28.576 37.243 Postneonatal mortality 14.836 1.466 10,391 10,262 1.099 0.099 11.903 17.769 Infant mortality 47.746 2.617 10,411 10,290 1.154 0.055 42.512 52.981 Child mortality 9.308 1.024 10,445 10,315 1.100 0.110 7.260 11.357 Under-five mortality 56.610 2.762 10,459 10,337 1.142 0.049 51.086 62.134
MEN
No schooling (Males age 6 years and above) 0.156 0.004 48,976 48,811 2.083 0.024 0.149 0.163 Urban residence 0.167 0.009 3,860 3,846 1.440 0.052 0.150 0.185 No schooling (Men age 15-49) 0.142 0.009 3,860 3,846 1.535 0.061 0.125 0.159 Completed 10 or more years of schooling 0.332 0.012 3,860 3,846 1.637 0.037 0.307 0.357 Never married, including married gauna not performed 0.386 0.009 3,860 3,846 1.135 0.023 0.369 0.404 Currently married 0.605 0.009 3,860 3,846 1.163 0.015 0.586 0.623 Married before age 21 0.150 0.009 2,674 2,654 1.311 0.060 0.132 0.169 Want no more children 0.584 0.012 2,336 2,326 1.173 0.020 0.560 0.608 Want to delay next birth at least 2 years 0.173 0.010 2,336 2,326 1.311 0.059 0.152 0.193 Men with any anaemia 0.255 0.010 3,676 3,628 1.394 0.041 0.234 0.275 Body mass index (BMI) <18.5 kg/m2 0.207 0.010 3,737 3,700 1.348 0.046 0.188 0.226
≥ 2 0.129 0.008 3,737 3,700 1.298 0.058 0.114 0.144 Have heard of HIV/AIDS 0.896 0.011 3,860 3,846 2.286 0.013 0.874 0.919 Have comprehensive knowledge about HIV/AIDS 0.224 0.014 3,860 3,846 2.147 0.064 0.196 0.253
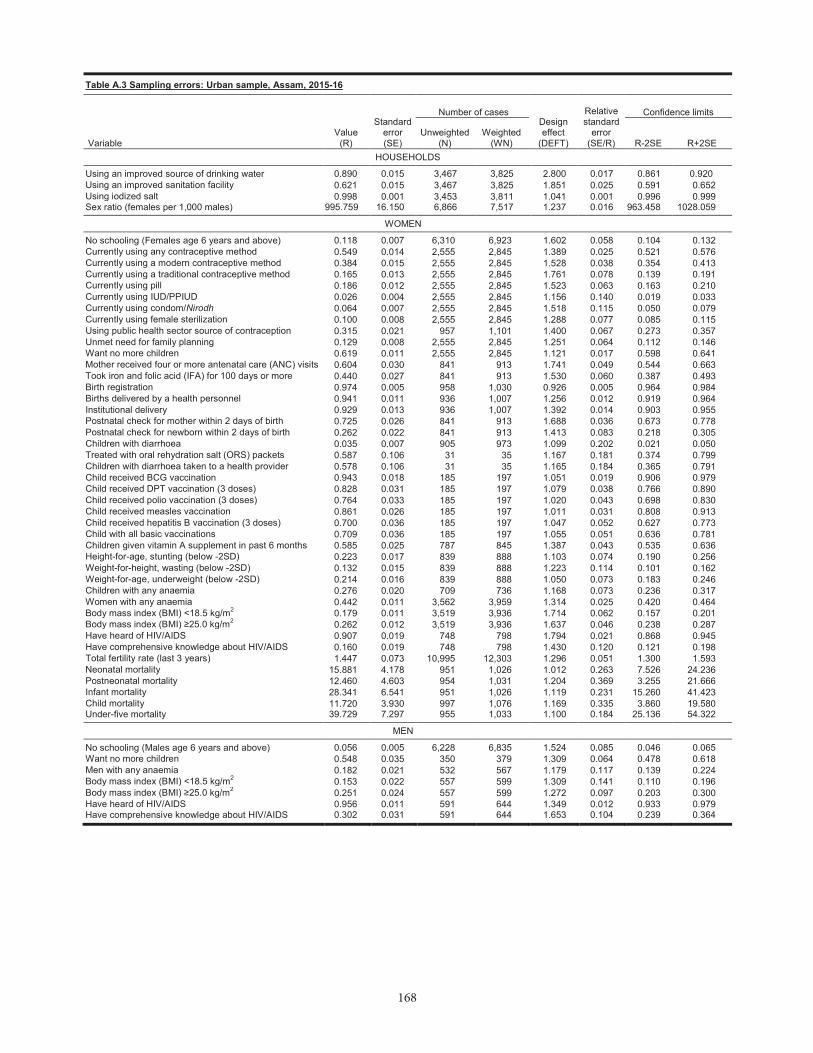
168168
Table A.3 Sampling errors: Urban sample, Assam, 2015-16
Variable
Value
(R)
Standard
error(SE)
Number of cases Design effect
(DEFT)
Relative standard
error(SE/R)
Confidence limits
Unweighted(N)
Weighted (WN) R-2SE R+2SE
HOUSEHOLDS
Using an improved source of drinking water 0.890 0.015 3,467 3,825 2.800 0.017 0.861 0.920Using an improved sanitation facility 0.621 0.015 3,467 3,825 1.851 0.025 0.591 0.652Using iodized salt 0.998 0.001 3,453 3,811 1.041 0.001 0.996 0.999Sex ratio (females per 1,000 males) 995.759 16.150 6,866 7,517 1.237 0.016 963.458 1028.059
WOMEN
No schooling (Females age 6 years and above) 0.118 0.007 6,310 6,923 1.602 0.058 0.104 0.132Currently using any contraceptive method 0.549 0.014 2,555 2,845 1.389 0.025 0.521 0.576Currently using a modern contraceptive method 0.384 0.015 2,555 2,845 1.528 0.038 0.354 0.413Currently using a traditional contraceptive method 0.165 0.013 2,555 2,845 1.761 0.078 0.139 0.191Currently using pill 0.186 0.012 2,555 2,845 1.523 0.063 0.163 0.210Currently using IUD/PPIUD 0.026 0.004 2,555 2,845 1.156 0.140 0.019 0.033Currently using condom/Nirodh 0.064 0.007 2,555 2,845 1.518 0.115 0.050 0.079Currently using female sterilization 0.100 0.008 2,555 2,845 1.288 0.077 0.085 0.115Using public health sector source of contraception 0.315 0.021 957 1,101 1.400 0.067 0.273 0.357Unmet need for family planning 0.129 0.008 2,555 2,845 1.251 0.064 0.112 0.146Want no more children 0.619 0.011 2,555 2,845 1.121 0.017 0.598 0.641Mother received four or more antenatal care (ANC) visits 0.604 0.030 841 913 1.741 0.049 0.544 0.663Took iron and folic acid (IFA) for 100 days or more 0.440 0.027 841 913 1.530 0.060 0.387 0.493Birth registration 0.974 0.005 958 1,030 0.926 0.005 0.964 0.984Births delivered by a health personnel 0.941 0.011 936 1,007 1.256 0.012 0.919 0.964Institutional delivery 0.929 0.013 936 1,007 1.392 0.014 0.903 0.955Postnatal check for mother within 2 days of birth 0.725 0.026 841 913 1.688 0.036 0.673 0.778Postnatal check for newborn within 2 days of birth 0.262 0.022 841 913 1.413 0.083 0.218 0.305Children with diarrhoea 0.035 0.007 905 973 1.099 0.202 0.021 0.050Treated with oral rehydration salt (ORS) packets 0.587 0.106 31 35 1.167 0.181 0.374 0.799Children with diarrhoea taken to a health provider 0.578 0.106 31 35 1.165 0.184 0.365 0.791Child received BCG vaccination 0.943 0.018 185 197 1.051 0.019 0.906 0.979Child received DPT vaccination (3 doses) 0.828 0.031 185 197 1.079 0.038 0.766 0.890Child received polio vaccination (3 doses) 0.764 0.033 185 197 1.020 0.043 0.698 0.830Child received measles vaccination 0.861 0.026 185 197 1.011 0.031 0.808 0.913Child received hepatitis B vaccination (3 doses) 0.700 0.036 185 197 1.047 0.052 0.627 0.773Child with all basic vaccinations 0.709 0.036 185 197 1.055 0.051 0.636 0.781Children given vitamin A supplement in past 6 months 0.585 0.025 787 845 1.387 0.043 0.535 0.636Height-for-age, stunting (below -2SD) 0.223 0.017 839 888 1.103 0.074 0.190 0.256Weight-for-height, wasting (below -2SD) 0.132 0.015 839 888 1.223 0.114 0.101 0.162Weight-for-age, underweight (below -2SD) 0.214 0.016 839 888 1.050 0.073 0.183 0.246Children with any anaemia 0.276 0.020 709 736 1.168 0.073 0.236 0.317Women with any anaemia 0.442 0.011 3,562 3,959 1.314 0.025 0.420 0.464Body mass index (BMI) <18.5 kg/m2 0.179 0.011 3,519 3,936 1.714 0.062 0.157 0.201
≥ 2 0.262 0.012 3,519 3,936 1.637 0.046 0.238 0.287Have heard of HIV/AIDS 0.907 0.019 748 798 1.794 0.021 0.868 0.945Have comprehensive knowledge about HIV/AIDS 0.160 0.019 748 798 1.430 0.120 0.121 0.198Total fertility rate (last 3 years) 1.447 0.073 10,995 12,303 1.296 0.051 1.300 1.593Neonatal mortality 15.881 4.178 951 1,026 1.012 0.263 7.526 24.236Postneonatal mortality 12.460 4.603 954 1,031 1.204 0.369 3.255 21.666Infant mortality 28.341 6.541 951 1,026 1.119 0.231 15.260 41.423Child mortality 11.720 3.930 997 1,076 1.169 0.335 3.860 19.580Under-five mortality 39.729 7.297 955 1,033 1.100 0.184 25.136 54.322
MEN
No schooling (Males age 6 years and above) 0.056 0.005 6,228 6,835 1.524 0.085 0.046 0.065Want no more children 0.548 0.035 350 379 1.309 0.064 0.478 0.618Men with any anaemia 0.182 0.021 532 567 1.179 0.117 0.139 0.224Body mass index (BMI) <18.5 kg/m2 0.153 0.022 557 599 1.309 0.141 0.110 0.196
≥ 2 0.251 0.024 557 599 1.272 0.097 0.203 0.300Have heard of HIV/AIDS 0.956 0.011 591 644 1.349 0.012 0.933 0.979Have comprehensive knowledge about HIV/AIDS 0.302 0.031 591 644 1.653 0.104 0.239 0.364
Table A.4 Sampling errors: Rural sample, Assam, 2015-16
Variable Value
(R)
Standard error (SE)
Number of cases Design effect
(DEFT)
Relative standard
error (SE/R)
Confidence limits Unweighted
(N) Weighted
(WN) R-2SE R+2SE HOUSEHOLDS
Using an improved source of drinking water 0.828 0.009 21,075 20,717 3.493 0.011 0.810 0.847 Using an improved sanitation facility 0.451 0.008 21,075 20,717 2.325 0.018 0.435 0.467 Using iodized salt 0.995 0.001 21,026 20,674 1.283 0.001 0.994 0.997 Sex ratio (females per 1,000 males) 992.682 5.399 48,469 47,608 1.149 0.005 981.885 1003.480
WOMEN
No schooling (Females age 6 years and above) 0.271 0.005 42,681 42,016 2.162 0.017 0.261 0.280 Currently using any contraceptive method 0.520 0.007 18,088 17,711 1.942 0.014 0.506 0.534 Currently using a modern contraceptive method 0.368 0.006 18,088 17,711 1.796 0.018 0.355 0.381 Currently using a traditional contraceptive method 0.152 0.005 18,088 17,711 1.823 0.032 0.143 0.162 Currently using pill 0.226 0.006 18,088 17,711 1.963 0.027 0.213 0.238 Currently using IUD/PPIUD 0.021 0.001 18,088 17,711 1.265 0.064 0.019 0.024 Currently using condom/Nirodh 0.021 0.001 18,088 17,711 1.376 0.069 0.018 0.024 Currently using female sterilization 0.095 0.005 18,088 17,711 2.090 0.048 0.085 0.104 Using public health sector source of contraception 0.427 0.011 6,656 6,549 1.802 0.026 0.405 0.449 Unmet need for family planning 0.144 0.004 18,088 17,711 1.604 0.029 0.135 0.152 Want no more children 0.607 0.006 18,088 17,711 1.612 0.010 0.596 0.619 Mother received four or more antenatal care (ANC) visits 0.448 0.011 7,690 7,489 1.921 0.024 0.426 0.470 Took iron and folic acid (IFA) for 100 days or more 0.305 0.009 7,690 7,489 1.748 0.030 0.287 0.324 Birth registration 0.938 0.004 9,436 9,242 1.432 0.004 0.930 0.946 Births delivered by a health personnel 0.721 0.012 9,368 9,164 2.176 0.016 0.698 0.745 Institutional delivery 0.682 0.012 9,368 9,164 2.165 0.017 0.658 0.706 Postnatal check for mother within 2 days of birth 0.559 0.012 7,690 7,489 2.057 0.021 0.535 0.582 Postnatal check for newborn within 2 days of birth 0.275 0.010 7,690 7,489 1.871 0.035 0.256 0.295 Children with diarrhoea 0.029 0.003 8,887 8,693 1.410 0.090 0.023 0.034 Treated with oral rehydration salt (ORS) packets 0.509 0.037 230 249 1.176 0.074 0.434 0.584 Children with diarrhoea taken to a health provider 0.498 0.039 230 249 1.241 0.079 0.420 0.576 Child received BCG vaccination 0.810 0.013 1,750 1,741 1.343 0.016 0.784 0.835 Child received DPT vaccination (3 doses) 0.646 0.016 1,750 1,741 1.382 0.024 0.615 0.678 Child received polio vaccination (3 doses) 0.537 0.016 1,750 1,741 1.344 0.030 0.505 0.569 Child received measles vaccination 0.697 0.015 1,750 1,741 1.366 0.022 0.667 0.727 Child received hepatitis B vaccination (3 doses) 0.500 0.016 1,750 1,741 1.329 0.032 0.468 0.532 Child with all basic vaccinations 0.444 0.016 1,750 1,741 1.355 0.036 0.412 0.476 Children given vitamin A supplement in past 6 months 0.506 0.011 7,639 7,459 1.833 0.022 0.483 0.528 Height-for-age, stunting (below -2SD) 0.380 0.008 8,170 7,980 1.346 0.020 0.365 0.395 Weight-for-height, wasting (below -2SD) 0.175 0.006 8,170 7,980 1.493 0.037 0.162 0.187 Weight-for-age, underweight (below -2SD) 0.308 0.007 8,170 7,980 1.389 0.024 0.293 0.323 Children with any anaemia 0.365 0.008 7,394 7,227 1.446 0.023 0.348 0.382 Women with any anaemia 0.463 0.006 24,048 23,579 1.726 0.012 0.452 0.474 Body mass index (BMI) <18.5 kg/m2 0.270 0.005 23,013 22,567 1.792 0.019 0.260 0.281
≥ 2 0.111 0.003 23,013 22,567 1.625 0.030 0.104 0.117 Have heard of HIV/AIDS 0.750 0.016 3,842 3,814 2.325 0.022 0.718 0.783 Have comprehensive knowledge about HIV/AIDS 0.080 0.007 3,842 3,814 1.586 0.087 0.066 0.094 Total fertility rate (last 3 years) 2.339 0.042 70,418 69,116 1.462 0.018 2.256 2.422 Neonatal mortality 34.805 2.349 9,451 9,255 1.178 0.067 30.107 39.503 Postneonatal mortality 15.112 1.548 9,437 9,231 1.091 0.102 12.017 18.208 Infant mortality 49.917 2.801 9,460 9,264 1.160 0.056 44.316 55.519 Child mortality 9.014 1.044 9,448 9,239 1.082 0.116 6.926 11.102 Under-five mortality 58.481 2.952 9,504 9,305 1.150 0.050 52.577 64.385
MEN
No schooling (Males age 6 years and above) 0.172 0.004 42,748 41,976 2.128 0.024 0.164 0.181 Want no more children 0.591 0.013 1,986 1,947 1.139 0.021 0.566 0.617 Men with any anaemia 0.268 0.012 3,144 3,061 1.420 0.043 0.245 0.291 Body mass index (BMI) <18.5 kg/m2 0.217 0.011 3,180 3,101 1.357 0.049 0.196 0.239
≥ 2 0.105 0.007 3,180 3,101 1.283 0.070 0.091 0.120 Have heard of HIV/AIDS 0.885 0.013 3,269 3,203 2.357 0.015 0.858 0.911 Have comprehensive knowledge about HIV/AIDS 0.209 0.016 3,269 3,203 2.266 0.077 0.177 0.241
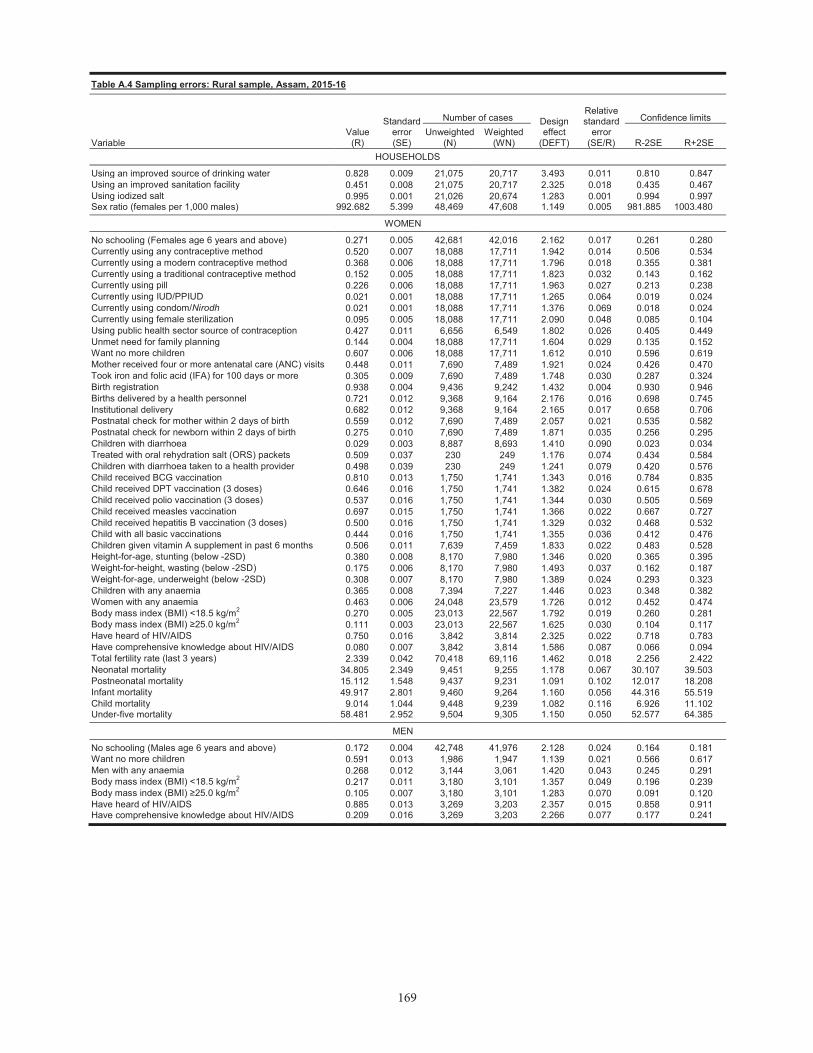
169168
Table A.3 Sampling errors: Urban sample, Assam, 2015-16
VariableValue
(R)
Standard error(SE)
Number of cases Design effect
(DEFT)
Relative standard
error(SE/R)
Confidence limits
Unweighted(N)
Weighted (WN) R-2SE R+2SE
HOUSEHOLDS
Using an improved source of drinking water 0.890 0.015 3,467 3,825 2.800 0.017 0.861 0.920Using an improved sanitation facility 0.621 0.015 3,467 3,825 1.851 0.025 0.591 0.652Using iodized salt 0.998 0.001 3,453 3,811 1.041 0.001 0.996 0.999Sex ratio (females per 1,000 males) 995.759 16.150 6,866 7,517 1.237 0.016 963.458 1028.059
WOMEN
No schooling (Females age 6 years and above) 0.118 0.007 6,310 6,923 1.602 0.058 0.104 0.132Currently using any contraceptive method 0.549 0.014 2,555 2,845 1.389 0.025 0.521 0.576Currently using a modern contraceptive method 0.384 0.015 2,555 2,845 1.528 0.038 0.354 0.413Currently using a traditional contraceptive method 0.165 0.013 2,555 2,845 1.761 0.078 0.139 0.191Currently using pill 0.186 0.012 2,555 2,845 1.523 0.063 0.163 0.210Currently using IUD/PPIUD 0.026 0.004 2,555 2,845 1.156 0.140 0.019 0.033Currently using condom/Nirodh 0.064 0.007 2,555 2,845 1.518 0.115 0.050 0.079Currently using female sterilization 0.100 0.008 2,555 2,845 1.288 0.077 0.085 0.115Using public health sector source of contraception 0.315 0.021 957 1,101 1.400 0.067 0.273 0.357Unmet need for family planning 0.129 0.008 2,555 2,845 1.251 0.064 0.112 0.146Want no more children 0.619 0.011 2,555 2,845 1.121 0.017 0.598 0.641Mother received four or more antenatal care (ANC) visits 0.604 0.030 841 913 1.741 0.049 0.544 0.663Took iron and folic acid (IFA) for 100 days or more 0.440 0.027 841 913 1.530 0.060 0.387 0.493Birth registration 0.974 0.005 958 1,030 0.926 0.005 0.964 0.984Births delivered by a health personnel 0.941 0.011 936 1,007 1.256 0.012 0.919 0.964Institutional delivery 0.929 0.013 936 1,007 1.392 0.014 0.903 0.955Postnatal check for mother within 2 days of birth 0.725 0.026 841 913 1.688 0.036 0.673 0.778Postnatal check for newborn within 2 days of birth 0.262 0.022 841 913 1.413 0.083 0.218 0.305Children with diarrhoea 0.035 0.007 905 973 1.099 0.202 0.021 0.050Treated with oral rehydration salt (ORS) packets 0.587 0.106 31 35 1.167 0.181 0.374 0.799Children with diarrhoea taken to a health provider 0.578 0.106 31 35 1.165 0.184 0.365 0.791Child received BCG vaccination 0.943 0.018 185 197 1.051 0.019 0.906 0.979Child received DPT vaccination (3 doses) 0.828 0.031 185 197 1.079 0.038 0.766 0.890Child received polio vaccination (3 doses) 0.764 0.033 185 197 1.020 0.043 0.698 0.830Child received measles vaccination 0.861 0.026 185 197 1.011 0.031 0.808 0.913Child received hepatitis B vaccination (3 doses) 0.700 0.036 185 197 1.047 0.052 0.627 0.773Child with all basic vaccinations 0.709 0.036 185 197 1.055 0.051 0.636 0.781Children given vitamin A supplement in past 6 months 0.585 0.025 787 845 1.387 0.043 0.535 0.636Height-for-age, stunting (below -2SD) 0.223 0.017 839 888 1.103 0.074 0.190 0.256Weight-for-height, wasting (below -2SD) 0.132 0.015 839 888 1.223 0.114 0.101 0.162Weight-for-age, underweight (below -2SD) 0.214 0.016 839 888 1.050 0.073 0.183 0.246Children with any anaemia 0.276 0.020 709 736 1.168 0.073 0.236 0.317Women with any anaemia 0.442 0.011 3,562 3,959 1.314 0.025 0.420 0.464Body mass index (BMI) <18.5 kg/m2 0.179 0.011 3,519 3,936 1.714 0.062 0.157 0.201
≥ 2 0.262 0.012 3,519 3,936 1.637 0.046 0.238 0.287Have heard of HIV/AIDS 0.907 0.019 748 798 1.794 0.021 0.868 0.945Have comprehensive knowledge about HIV/AIDS 0.160 0.019 748 798 1.430 0.120 0.121 0.198Total fertility rate (last 3 years) 1.447 0.073 10,995 12,303 1.296 0.051 1.300 1.593Neonatal mortality 15.881 4.178 951 1,026 1.012 0.263 7.526 24.236Postneonatal mortality 12.460 4.603 954 1,031 1.204 0.369 3.255 21.666Infant mortality 28.341 6.541 951 1,026 1.119 0.231 15.260 41.423Child mortality 11.720 3.930 997 1,076 1.169 0.335 3.860 19.580Under-five mortality 39.729 7.297 955 1,033 1.100 0.184 25.136 54.322
MEN
No schooling (Males age 6 years and above) 0.056 0.005 6,228 6,835 1.524 0.085 0.046 0.065Want no more children 0.548 0.035 350 379 1.309 0.064 0.478 0.618Men with any anaemia 0.182 0.021 532 567 1.179 0.117 0.139 0.224Body mass index (BMI) <18.5 kg/m2 0.153 0.022 557 599 1.309 0.141 0.110 0.196
≥ 2 0.251 0.024 557 599 1.272 0.097 0.203 0.300Have heard of HIV/AIDS 0.956 0.011 591 644 1.349 0.012 0.933 0.979Have comprehensive knowledge about HIV/AIDS 0.302 0.031 591 644 1.653 0.104 0.239 0.364
Table A.4 Sampling errors: Rural sample, Assam, 2015-16
Variable Value
(R)
Standard error (SE)
Number of cases Design effect
(DEFT)
Relative standard
error (SE/R)
Confidence limits Unweighted
(N) Weighted
(WN) R-2SE R+2SE HOUSEHOLDS
Using an improved source of drinking water 0.828 0.009 21,075 20,717 3.493 0.011 0.810 0.847 Using an improved sanitation facility 0.451 0.008 21,075 20,717 2.325 0.018 0.435 0.467 Using iodized salt 0.995 0.001 21,026 20,674 1.283 0.001 0.994 0.997 Sex ratio (females per 1,000 males) 992.682 5.399 48,469 47,608 1.149 0.005 981.885 1003.480
WOMEN
No schooling (Females age 6 years and above) 0.271 0.005 42,681 42,016 2.162 0.017 0.261 0.280 Currently using any contraceptive method 0.520 0.007 18,088 17,711 1.942 0.014 0.506 0.534 Currently using a modern contraceptive method 0.368 0.006 18,088 17,711 1.796 0.018 0.355 0.381 Currently using a traditional contraceptive method 0.152 0.005 18,088 17,711 1.823 0.032 0.143 0.162 Currently using pill 0.226 0.006 18,088 17,711 1.963 0.027 0.213 0.238 Currently using IUD/PPIUD 0.021 0.001 18,088 17,711 1.265 0.064 0.019 0.024 Currently using condom/Nirodh 0.021 0.001 18,088 17,711 1.376 0.069 0.018 0.024 Currently using female sterilization 0.095 0.005 18,088 17,711 2.090 0.048 0.085 0.104 Using public health sector source of contraception 0.427 0.011 6,656 6,549 1.802 0.026 0.405 0.449 Unmet need for family planning 0.144 0.004 18,088 17,711 1.604 0.029 0.135 0.152 Want no more children 0.607 0.006 18,088 17,711 1.612 0.010 0.596 0.619 Mother received four or more antenatal care (ANC) visits 0.448 0.011 7,690 7,489 1.921 0.024 0.426 0.470 Took iron and folic acid (IFA) for 100 days or more 0.305 0.009 7,690 7,489 1.748 0.030 0.287 0.324 Birth registration 0.938 0.004 9,436 9,242 1.432 0.004 0.930 0.946 Births delivered by a health personnel 0.721 0.012 9,368 9,164 2.176 0.016 0.698 0.745 Institutional delivery 0.682 0.012 9,368 9,164 2.165 0.017 0.658 0.706 Postnatal check for mother within 2 days of birth 0.559 0.012 7,690 7,489 2.057 0.021 0.535 0.582 Postnatal check for newborn within 2 days of birth 0.275 0.010 7,690 7,489 1.871 0.035 0.256 0.295 Children with diarrhoea 0.029 0.003 8,887 8,693 1.410 0.090 0.023 0.034 Treated with oral rehydration salt (ORS) packets 0.509 0.037 230 249 1.176 0.074 0.434 0.584 Children with diarrhoea taken to a health provider 0.498 0.039 230 249 1.241 0.079 0.420 0.576 Child received BCG vaccination 0.810 0.013 1,750 1,741 1.343 0.016 0.784 0.835 Child received DPT vaccination (3 doses) 0.646 0.016 1,750 1,741 1.382 0.024 0.615 0.678 Child received polio vaccination (3 doses) 0.537 0.016 1,750 1,741 1.344 0.030 0.505 0.569 Child received measles vaccination 0.697 0.015 1,750 1,741 1.366 0.022 0.667 0.727 Child received hepatitis B vaccination (3 doses) 0.500 0.016 1,750 1,741 1.329 0.032 0.468 0.532 Child with all basic vaccinations 0.444 0.016 1,750 1,741 1.355 0.036 0.412 0.476 Children given vitamin A supplement in past 6 months 0.506 0.011 7,639 7,459 1.833 0.022 0.483 0.528 Height-for-age, stunting (below -2SD) 0.380 0.008 8,170 7,980 1.346 0.020 0.365 0.395 Weight-for-height, wasting (below -2SD) 0.175 0.006 8,170 7,980 1.493 0.037 0.162 0.187 Weight-for-age, underweight (below -2SD) 0.308 0.007 8,170 7,980 1.389 0.024 0.293 0.323 Children with any anaemia 0.365 0.008 7,394 7,227 1.446 0.023 0.348 0.382 Women with any anaemia 0.463 0.006 24,048 23,579 1.726 0.012 0.452 0.474 Body mass index (BMI) <18.5 kg/m2 0.270 0.005 23,013 22,567 1.792 0.019 0.260 0.281
≥ 2 0.111 0.003 23,013 22,567 1.625 0.030 0.104 0.117 Have heard of HIV/AIDS 0.750 0.016 3,842 3,814 2.325 0.022 0.718 0.783 Have comprehensive knowledge about HIV/AIDS 0.080 0.007 3,842 3,814 1.586 0.087 0.066 0.094 Total fertility rate (last 3 years) 2.339 0.042 70,418 69,116 1.462 0.018 2.256 2.422 Neonatal mortality 34.805 2.349 9,451 9,255 1.178 0.067 30.107 39.503 Postneonatal mortality 15.112 1.548 9,437 9,231 1.091 0.102 12.017 18.208 Infant mortality 49.917 2.801 9,460 9,264 1.160 0.056 44.316 55.519 Child mortality 9.014 1.044 9,448 9,239 1.082 0.116 6.926 11.102 Under-five mortality 58.481 2.952 9,504 9,305 1.150 0.050 52.577 64.385
MEN
No schooling (Males age 6 years and above) 0.172 0.004 42,748 41,976 2.128 0.024 0.164 0.181 Want no more children 0.591 0.013 1,986 1,947 1.139 0.021 0.566 0.617 Men with any anaemia 0.268 0.012 3,144 3,061 1.420 0.043 0.245 0.291 Body mass index (BMI) <18.5 kg/m2 0.217 0.011 3,180 3,101 1.357 0.049 0.196 0.239
≥ 2 0.105 0.007 3,180 3,101 1.283 0.070 0.091 0.120 Have heard of HIV/AIDS 0.885 0.013 3,269 3,203 2.357 0.015 0.858 0.911 Have comprehensive knowledge about HIV/AIDS 0.209 0.016 3,269 3,203 2.266 0.077 0.177 0.241

Assam
National Family Health Survey (NFHS-4)
India
2015-16
Assam
National Family Health Survey 2015-16
International Institute for Population SciencesDeonar, Mumbai 400 088
Ministry of Health and Family Welfare
Technical assistance for NFHS-4 was provided by the USAID-supported DHS Program at ICF, and assistance for the HIV components was provided by NACO and NARI. Funding assistance was provided by Ministry of Health and Family Welfare, Government of India and:
The opinions in this publication do not necessarily refl ect the views of the funding agencies.For additional information on NFHS-4, visit http://www.rchiips.org/nfhsFor related information, visit http://www.iipsindia.org or http://www.mohfw.nic.in
Government of India


![Jordan Population and Family Health Survey 1990 [FR20]](https://static.fdokumen.com/doc/165x107/6338d9d6268c48e54508c558/jordan-population-and-family-health-survey-1990-fr20.jpg)