NATIONAL PUBLIC SURVEY ON ... - Office of Justice Programs
55
THE NATIONAL PUBLIC SURVEY ON WHITE COLLAR CRIME /..: /: . / / i -W, / ! , ' - -, : J l" ~ '~ '~ • - ............ ~_~_': -~ ~ -,, .. NATIONAL WHITE COLLAR CRIME CENTER TRAINING AND RESEARCH INSTITUTE
-
Upload
khangminh22 -
Category
Documents
-
view
0 -
download
0
Transcript of NATIONAL PUBLIC SURVEY ON ... - Office of Justice Programs
THE
NATIONAL PUBLIC SURVEY ON WHITE COLLAR CRIME
/..:
/:
. /
/
i -W, / !
, ' - -, :
J
l"
~ ' ~ '~
• - . . . . . . . . . . . . ~ _ ~ _ ' : - ~ ~ - , , . .
NATIONAL WHITE COLLAR CRIME CENTER TRAINING AND RESEARCH INSTITUTE
THE NATIONAL PUBLIC SURVEY
ON WHITE COLLAR CRIME
by
Donald J. Rebovich, Research Director Jenny Layne, Research Associate
with
Jason Jiandani, Research Assistant Scott Hage, Research Assistant
PROPERTY OF National Criminal Justice Reference Service (NCJRS) Box 6000 Rockville, MD 20849-6000
This document provides readers with a rare glimpse of public attitudes regarding fraudulent and economic related crimes. The findings shed light on how often Americans are victimized by these types of crimes and preventive measures to control white collar crime. Comments, recommendations, or general impressions of the content of the program are encouraged. All suggestions, comments, or feedback regarding this course will be acknowledged but only at the request of the sender and with the submission of a return address. Please be as specific as possible in your comments.
© 2000 National White Collar Crime Center
12 Roush Drive Morgantown, WV 26501
Phone: (877) 693-2874 Fax: (304) 291-2282
Permission is hereby given for this text to be reproduced, with proper attribution, by non-profit and public agencies engaged in training for criminal justice or other personnel. No resale or commercial use may be made of these materials.
Printed in the United States of America February 2000
This project is supported by grant number 99-WC-CX-0002, awarded by the Bureau of Justice Assistance, Office of Justice Programs, US Department of Justice. The Assistant Attorney General, Office of Justice Programs, coordinates the activities of the following program offices and bureaus: Bureau of Justice Assistance, Bureau of Justice Statistics, National Institute of Justice, Office of Juvenile Delinquency Prevention, and Office for Victims of Crime. Points of view in this document are those of the authors and do not necessarily represent the official position or policies of the US Department of Justice.
Acknow|edgments
This research project would not have been possible without the interest and support of many individuals. The research section of the National White Collar Crime Center (NW3C) is deeply grateful to all those who gave their time and expertise to this project and would like to recognize and thank those who served as subject matter experts to determine the key issues in economic crime, recommend a research agenda for the section, and identify topics for this first survey. Their attention to detail, and the direction they provided, was greatly appreciated. These people are:
Jay Albanese - Virginia Commonwealth University, Department of Criminal Justice
John Boyle - Schulman, Ronca & Bucuvalas
Laura Carter - Johnson Zabor Associates
Bruce Keith - USMA at West Point
4, Phil Parrot- Denver District Attorney's Office
O Michael Rand- Bureau of Justice Statistics, Victimization Statistics Unit
Debra Ross - Buffalo State College, Department of Criminal Justice
O Daniel Skel ly- Insurance Fraud Bureau of Massachusetts
O Donna Spencer- Research Triangle Institute
O Elizabeth Szockyj - Southern Illinois University, Center for the Study of Crime
Richard Titus - National Institute of Justice
We would also like to acknowledge the support of the Office of Justice Programs, Bureau of Justice Assistance, the Board of Directors of the NW3C, and the entire cadre of dedicated interviewers for their contributions to this project. Special thanks to Bob Briggs fi'om the Office of Management and Budget for his assistance.
Special Acknowledgments
The authors would like to recognize the
excellent support received from the staff of
the National White Collar Crime Center.
Special thanks go to NW3C Director
Richard Johnston and Deputy Director
Gary Lusher for engineering this ambitious
research effort and guiding it to its
completion.
The work of NW3C Research Section
staff--Research Assistants Jason Jiandani
and Scott Hage, and Resource Coordinator
Brooke Cress proved to be invaluable to the
successful data collection, analysis, and
reporting processes.
We also would like to thank Assistant
Director of Training Lynn A. Dombrowski
and Senior Curriculum Developer Andrea
R. Lucci for the printing and distribution of
this monograph.
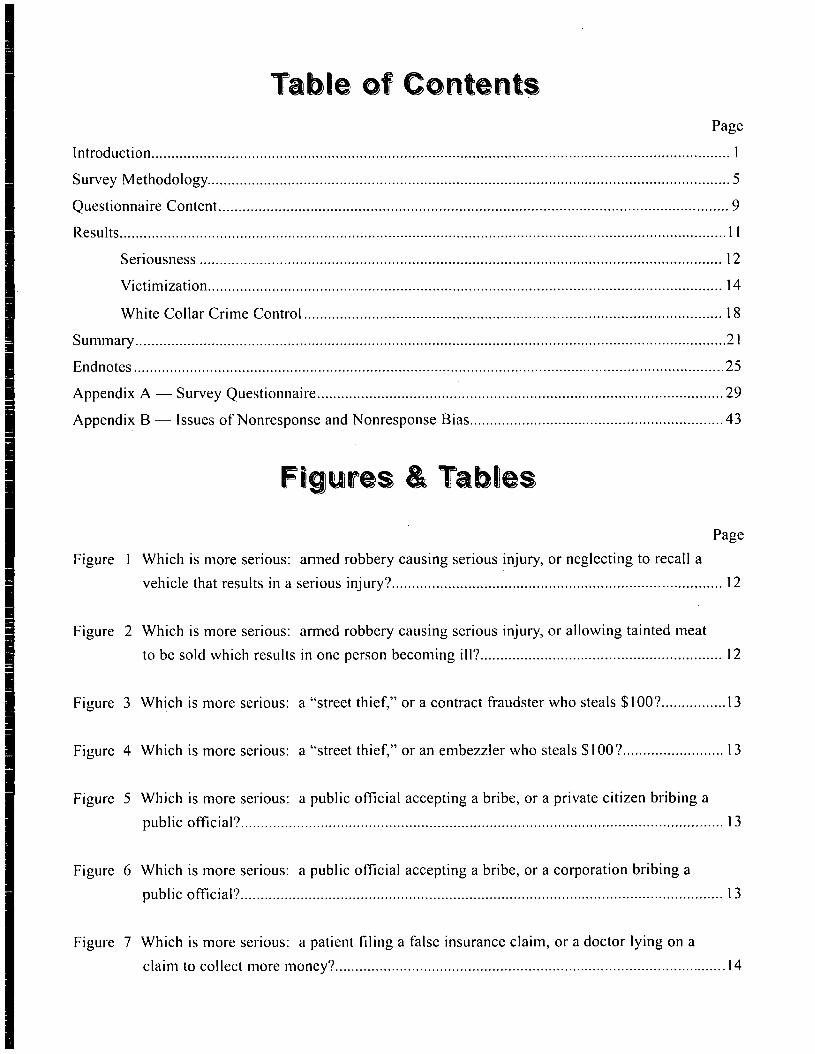
Table of Contents Page
Introduction ............................................................................................................................ i ................... 1
Survey Methodo logy .................................................................................................................................. 5
Quest ionnaire Content ............................................................................................................................... 9
Results ....................................................................................................................................................... 11
Seriousness .................................................................................................................................. 12
Victimization ................................................................................................................................ 14
White Collar Cr ime Control ........................................................................................................ 18
Summary ................................................................................................................................................... 2 !
Endnotes ................................................................................................................................................... 25
Appendix A - - Survey Quest ionnaire ..................................................................................................... 29
Appendix B - - Issues o f Nonresponse and Nonresponse Bias ............................................................... 43
Figures & Tables
Figure 1
Figure 2
Figure 3
Figure 4
Figure 5
Figure 6
Figure 7
Page
Which is more serious: armed robbery causing serious injury, or neglect ing to recall a
vehicle that results in a serious injury? .................................................................................. 12
Which is more serious: armed robbery causing serious injury, or a l lowing tainted meat
to be sold which results in one person becoming ill? ............................................................ 12
Which is more serious: a "street thief," or a contract fraudster who steals $100? ................ 13
Which is more serious: a "street thief," or an embezzler who steals $100? ......................... 13
Which is more serious: a public official accepting a bribe, or a private citizen bribing a
public official? ........................................................................................................................ 13
Which is more serious: a public official accepting a bribe, or a corporat ion bribing a
public official? ........................................................................................................................ 13
Which is more serious: a patient filing a false insurance claim, or a doctor lying on a
claim to collect more money? ................................................................................................. 14
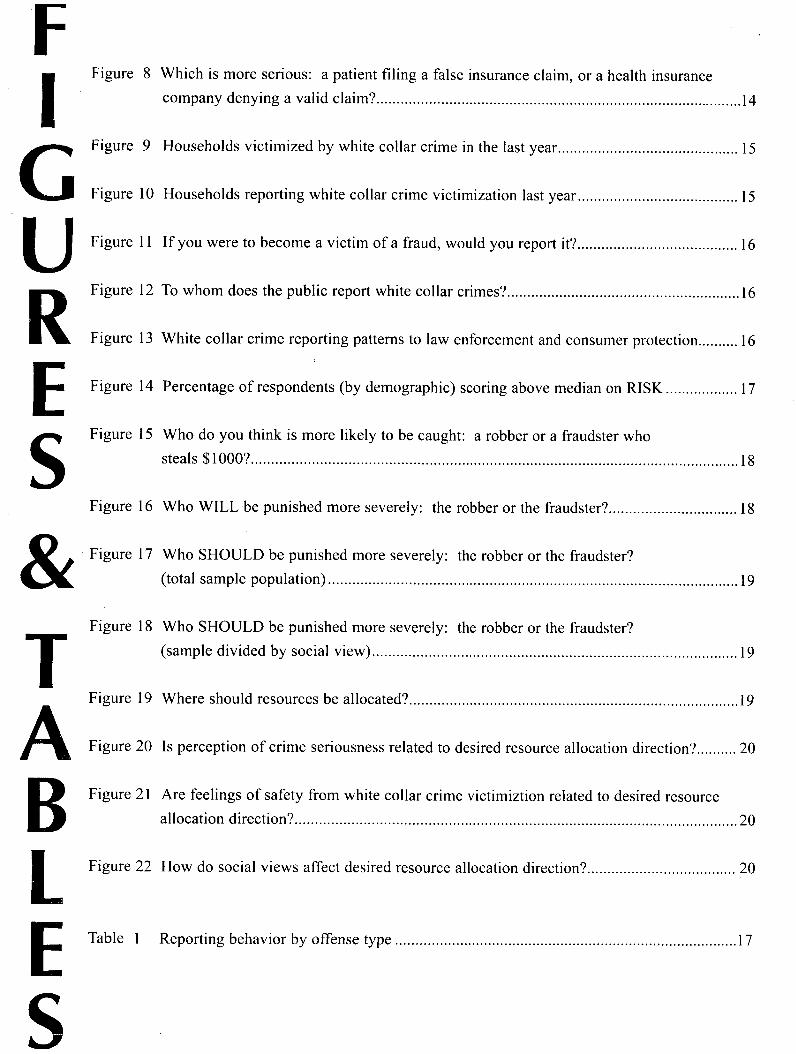
F Figure 8
Figure 9
Figure lO
U Figure 11
R Figure 12
Figure 13
E Figure 14
S Figure 15
& Figure 16
F i g u r e 17
Which is more serious: a patient filing a false insurance claim, or a health insurance
company denying a valid claim? ........................................................................................... 14
Households victimized by white collar crime in the last year ............................................. 15
Households reporting white collar crime victimization last year ........................................ 15
If you were to become a victim of a fraud, would you report it? ........................................ 16
To whom does the public report white collar crimes? .......................................................... 16
White collar crime reporting patterns to law enforcement and consumer protection .......... 16
Percentage of respondents (by demographic) scoring above median on RISK .................. 17
Who do you think is more likely to be caught: a robber or a fraudster who
steals $1000? ......................................................................................................................... 18
Who WILL be punished more severely: the robber or the fraudster? ................................ 18
Who SHOULD be punished more severely: the robber or the fraudster?
(total sample population) ...................................................................................................... 19
T A B L E
Figure 18
Figure 19
Figure 20
Figure 21
Figure 22
Table 1
Who SHOULD be punished more severely: the robber or the fraudster?
(sample divided by social view) ........................................................................................... 19
Where should resources be allocated? .................................................................................. 19
Is perception of crime seriousness related to desired resource allocation direction? .......... 20
Are feelings of safety from white collar crime victimiztion related to desired resource
allocation direction? .............................................................................................................. 20
How do social views affect desired resource allocation direction? ..................................... 20
Reporting behavior by offense type ..................................................................................... 17
I YRO©IJCTIO
: o f X÷ -t: '%.~" , j ' , . t . . . . - .
.... i Li /~
/ / / ~ c r /
.I
(. • ,4/
J
, ( / //"
f.
7..~,#.\ ','-,., ~,> '>" '~?
x~" 6~Z ~".,, ./ f
I
The aim of the National White Collar Crime Center (NW3C) in administering the National Survey on White Collar Crime was to add broader and more current information to that furnished by prior surveys. The survey touched upon several perception dimensions to present a comprehensive picture of what the average American thinks about white collar crime.
iNTRODUCTiON
In January of 1999, The National White Collar Crime Center (NW3C) embarked upon a research project to examine the public's perceptions of and experiences with white collar crime. By April, 1999 the Center had completed a survey of 1,169 U.S. citizens. The results of this survey provide a rare glimpse of public attitudes regarding crimes in which unwilling and unwary customers and consumers are cheated; crimes such as fraud and embezzlement.' The results also tell us how often American households are victimized by these crimes, and what they think the government should do to help control white collar crime. The results of this survey should prove informative to the law enforcement community, consumer protection organizations, and victim advocacy groups, as well as to criminologists. In some instances the results may be surprising, for they uncover a deep concern with white collar crime and how effectively the criminal justice system deals with the offenses.
Considering the amount of government funding allocated to the control of "street crime," there has been relatively little funding set aside for the control of white collar crime. This is due in part to a long-standing belief that the public is apathetic towards white collar offenses and offenders. 2 As far back as 1940, Edwin Sutherland, the renowned sociologist who coined the term "white collar crime," complained that "the general public was, sadly, simply not aroused by white collar crime. ''3 Later, in 1968, the President's Commission on Law Enforcement and the Administration of Justice concluded that the public was indifferent to white collar crime and, in many cases, actually sympathized with white collar offenders. 4
More recently, groups like the National Fraud Center have reported that government funding for the investigation and prosecution of fraud has remained fairly flat over the last 10 years, despite the consistent rise of financial costs and arrests associated with these crimes during the same time period? While it is difficult to precisely measure the sum of the financial losses attributed to white collar crime, criminologists generally agree that white collar crime exacts a cost that dwarfs that incurred from street crime. The Federal Bureau of Investigation's Uniform Crime Reports (UCR) national arrest statistics, for the period from 1988 to 1997, show that while arrests for most index crimes of violence (e.g., murder, nonnegligent manslaughter, rape) and property crimes (e.g., robbery, burglary, motor vehicle theft) have declined, arrests for fraud and embezzlement have risen significantly. ~
Page 2
...there has been In the world of criminal justice research, there has been relatively little attention paid to white collar crime. The
little attention paid number of research studies on white collar crime pales in comparison with the many studies on the commission and
to white collar crime, control of violent crimes and property crimes. Of the white collar crime studies that have been conducted, there has
been a noticeable paucity of studies that question the public on the topic; and most of them have focused almost exclusively on specific aspects, like seriousness or victimization. Others have been couched within more general surveys on crime attitudes.
Several localized surveys on crime seriousness were administered in the 1970s, 7 and one noteworthy national study on general crime severity was conducted in 19857 Some more recent surveys on telemarketing fraud were conducted by Harris and Associates 9 and by the American Association of Retired Persons. t° The most notable recent survey examined fraud victimization and was administered by Titus, Heinzelmann and Boyle in 1991."
The aim of NW3C in administering the National Public Survey on White Collar Crime was to add broader and more current infonnation to the rich insights furnished by prior surveys. Rather than limiting our focus to any one aspect, we decided to touch upon several perception dimensions to present a comprehensive picture of what the average American thinks about white collar crime. We were interested in obtaining answers to questions such as:
I~ Howserious do you believe white collar crime is?
How safe do you feel from white collar crime?
Have you or someone in your household been victimized by white collar crime?
II, Did you report the victimization?
II, What type of person do you believe the average white collar crime victim is?
We also asked questions about participation in risk behaviors associated with white collar crime victimization, perceptions of the control of white collar crime, and opinions on workplace theft. (The tidl text of the questionnaire appears in Appendix A: Survey Questionnaire)
We believe that the many individuals who played a part in the development and administration of the survey have made a meaningful and tirnely contribution to the body of information that already exists on white collar crime. We hope that it draws attention to a crime area that, unfortunately, is playing a part in the lives of many citizens throughout the US.
S Page 3

•/ / /
../
,,?
t / , / "
/ • [.
[ / ./,
All information for this household survey was collected through a randomized telephone survey of U.S. citizens over the age of 18. The sample was stratified by county to afford each county a selection probability proportionate to the share of telephone house- holds within the county. Steps were taken to ensure that the sample was representative of the general population by age, sex, education, and region.
©
t/t~ A committee of Subject Matter Experts (SMEs) helped formulate the focus of this study.
/ ] . . .
\"... jThe committee, whmh met m Morgantown, WV . . . . . m September 1997, was comprised of scholars
(~#----. special izing in white collar crime, practitioners in ----~"~ ~th~ field of white collar crime control, and survey
It . . . . J'C-research specialists. After discussing key issues in L economic crime, they recommended conducting a
j - - - ~ g u b l i c survey specifically to measure the g-" 1J- / f ser iousness of white collar crime, victim ~ p r e v a l e n c e , reporting behavior, and attitudes on
~ '%w~ite collar crime control. After examining a ~i Ii v'a'riety of instruments used in previous surveys
_ _ _ _ _ l l . . . . .
that explored crime and vmtlmlzatlon, our survey 1--questions were drafted and then reviewed by the
/ f S M E committee.
l~or the purposes of this study, we defined white collar crime as "planned crimes that involve
' chleating or lying that usual- A ly~ occur in the course of
, ~ i ,, / ~ - ~ \ / employment. Respondents L / \, / ~ - - - ~ - w e r e told that white collar
i offenses included crimes lille fraud, embezzlement,
[ - - ~ d crimes against public I ~ a l t h and safety.
Data for this study were c~o~llected through a tele- 1/
\~..._____....phone survey of US citizens. The survey was ~ a / d m i n i s t e r e d by trained interviewers over a . - - - - . twTelve-week period beginning in late January
L (".~-.'~/'1-999. We obtained the sample from an [ ( - - - -~ / independent firm specializing in sampling for
_1 . . p
regional and national studms.- The sample was ~ a t i f i e d by county to afford each county a ~-'-Q-~ U"se!ection probability proportionate to the share of
L.telephone households within the county with no ~ . " ~ .
15ias toward listed numbers. '3 Random numbers r-1
~ were created by systematically randomizing the [ ~ L---lJa~t two digits affixed to the area code, prefix, and
~~w~ilock portions of each telephone number.
thm each household an mdlvl ual " " , " " "d was randomly selected to serve as the survey ejspondent. II We employed recognized methods of
~ ge 6
i 1
White collar crime was defined as "planned crimes that involve
cheating or lying that usually occur in the
course of employment."
randomized selection in an effort to achieve satisfactory representation of the total population of the US on such factors as age and sex~ '4 The data were weighted on age, sex, education, and region to transform the sample into proportions representative of the parameters of the larger population. The amount of weighting required was minimal.
The level of public participation in the survey was lower than anticipated and, therefore, necessitates the exercising of caution in the interpretation of results and the degree to which they represent the opinions and experiences of the entire adult population of the US. As explained by past works on survey design and administration, major obstacles to making contact with eligible survey respondents can be the "gatekeepers" and "gatekeeper devices" that prevent such contact. '5
Such was the case for the present survey. A high percentage (50%) of gate- keepers (i.e., individuals answering the telephone) terminated dialogue with interviewers before the interviewers had an opportunity to interact with eligible, randomly selected respondents within the
household. In addition, screening devices for incoming calls (e.g., answering machines, caller ID) also presented hurdles to successfully contacting eligible respondents, leaving the study with a household participation rate of 37%. When interviewers were successful in getting beyond gatekeepers and gatekeeper devices, the participation rate of contacted, eligible respondents was more encouraging. Of 1,582 cases in which eligible respondents were success- fully contacted, 1,169 (74%) completed interviews, 408 (25%) refused to be interviewed, and 5 (<1%) terminated dialogue after the interview began but before the interview could be completed (see Appendix B for discussion).
Data were collected using a Computer Assisted Telephone Interviewing (CATI) system. The CATI system is a valuable tool for compiling data because it strengthens supervision of the survey process and permits continuous and easy examination of the sample database. This system immediately captures the information, allowing the research team to examine emerging trends throughout the data collection process.
The CA TI system... captures the information [in a database], allowing
the research team to examine emerging trends
throughout the data collection process.
The telephone interviewers, who were recruited from an external employment agency, underwent a rigorous three-part training. The first phase involved fourteen hours of training on general interviewing techniques including acceptable interviewing styles and handling difficult respondents. (The instruction was based on the University of Michigan's Institute for Social Research interviewer training program.) The second phase consisted of six hours of training specific to the white collar crime survey being utilized, including review of the survey instrument, fallback and introduction statements, and question- by-question objectives. The third phase of the training involved instruction on operating the CATI software. Interviewer progress and skills were rnonitored using the telephone system that enabled each supervisor to listen to interviews in progress. Additional supervision of the interviewers' work occurred through review of completed interviews.
The instrument was pilot-tested to ensure
clarity and reliability of the questions.
Three criteria were established to select an appropriate respondent: s/he had to be a household member, over the age of 18, and a US citizen. When interviewers were pre- vented from reaching a household member and/or the respondent because of answering machines, temporary disconnects, or gatekeePer refusals, they were instructed to set a callback for two days later and one calling shift forward. The hope was that the respondent would be available at a different time. In most cases, the number of callbacks was
set at a maximum of ten. Households were called more than ten times if we felt it was possible to obtain a completed interview from that household. Calls were made to each time zone along the
following schedule: Monday through Thursday, 10am to 2pro and 4pm to 9pm; Friday, 10am to 2pm; Saturday, 12pm to 6pm; and Sunday, 2pm to 8pro (these refer to destination household times, n o t call center times). To prevent accidental dialing, the CATI software automatically dis- abled telephone numbers in a particular time zone outside
the parameters of these hours. Households that had requested a callback beyond the prescribed limits were, however, accommodated by our call center interviewers.
At the close of the study, we made an attempt to convert respondent refusals into completed interviews. We determined which numbers to call back based on which interviewer had been refused (some interviewers were stronger than others), the circumstances of the refusal, and how "hard" the refusal was. We had moderate success converting refusals: after contacting 28% (n=374) of those households that originally refused, we were able to complete interviews with 14% (n=61) of them.
The instrument was pilot-tested to ensure clarity and the reliability of the questions. When
successful contacts were made, interviewers explained where they were calling from and the purpose of the survey. Interviewers were prepared to answer questions posed by the respondents at any point
during the call. The most commonly asked questions involved the nature of the NW3C, how the respondent's phone number was obtained, and how the collected information would be used.
Page 7

7
J
Y
/ , /
/ /
) : /
; ; - / / //~ ? / -
J / / j :" / , / // , " . " / X ~ /
• ---Q'--._ c; h~ .-3 ,Q-'-C3) c-~- '~ - -
Survey questions were designed to address a wide spectrum of areas related to the public's perception of and experience with white collar crime. Respondents were asked a series of questions on white collar crime seriousness, risk behavior, victimization, offense reporting, and law enforcement response.
\ \ \ \ \'\ / i _ _
\,
\ \,
i
/ /
T he first section of the questionnaire was dedicated to perceptions of white collar crime
seriousness. We asked respondents to compare the seriousness of a series of white collar crime events to "street crime" events. We included white collar crimes that have both direct and indirect impacts on the public. Respondents were asked to compare four different pairs of scenarios and choose which scenario they felt was more serious. Ideas for the seriousness scenarios were drawn from previously used seriousness studies. '~
Eight different scenario pairs were written and divided into two different sets. Half of the sample was asked the scenarios in set 1 and the other half was asked the scenarios in set 2. When the scenarios were divided between the two sets, one scenario was held constant. That is, in set l, scenario A was compared to scenario B; in set 2, scenario A was compared to scenario C. This was done so that we could ask a larger number of seriousness questions and so that the researchers could
All eight victimization questions were recommended by SME members because they best represented some of today's most commonly occurring frauds (Internet fraud, stolen PIN numbers). Interviewers first described the fraud and then asked the respondents if they or others in their household had been victimized in this way in the last twelve months. Following each victimization question, we asked if the crime had been reported, to whom it had been reported, and the outcome. In addition, we asked the respondents how safe they felt from future victimization.
measure if seriousness perceptions changed when comparing one crime to two others or when dif- ferent perpetrators committed a similar crime.
Following this section, respondents were asked three questions on the perceived likelihood of a white collar crime offender being arrested and punished. We then sought to measure attitudes and behavior on reporting occurrences of white collar crime. We asked respondents if they would report white collar victimizations and if so, to whom.
The next section concentrated on participation in risk behaviors. These questions, recommended by the SMEs, were posed in order to determine if respondents were cognizant of behaviors that may be risky. Most of these questions centered on everyday occurrences that may unknowingly put a person at risk.
The victimization section was followed by questions on respondents' perceptions of characteristics of the average victim of consumer
fraud. We chose to use the term "consumer fraud" instead of "white collar crime" because we believed it represented crimes that the average American could more easily relate to and crimes for which the general public would have developed
a clearer picture of victimization. Through the responses to these questions, we sought to compare perceived characteristics with actual characteristics derived from past victimization studies.
The sequence of questions within most of the question sets was randomized to correct for possible response order bias. '7 Specific question sets that were sequentially randomized were the seriousness questions, questions on the causes of workplace theft, the risk questions, victim prevalence questions, and victimization perception questions.
Page 10
'i x . . . . . ' f
~"\ // M
"\ . ;- I \x /;%
\ , , ,
i
Survey results reveal a growing public concern with the seriousness of white collar crime and the criminal justice system's ability to control it. The percentage of households victimized by white collar crime was higher than anticipated, while the reporting of these crimes remained low.
_•( he National Public Survey on White Collar E Crime was designed to measure American
oplmon at the household level. Obviously, it is • / / •
F-----lmpract~cal to survey each member of a chosen ~ h ~ u s e h o l d and we do lose some accuracy in our
jf i f i~ings as a result• However, the corresponding ~ s t r e n g t h m expanding our mformauonal base by ~ [ - ~ u t i l i z i n g the household unit rather than the .-'>-,.,--~... . .
lndlyldual unit is a true advantage• We want to f - " k t c a u t i o n the reader in interpreting results when
J . . . . . . [(___~-~comparmg responses pertaining to mdwlduals
• l l - ~ W l t f i responses that pertain to an entire household•
~ D a t a captured by CATI was imported into SPSS (Sta/tistical Package for the Social Sciences) for
~ t ' a t i s t i c a l analysis. Although the large majority of [ / ~ o u r ' ~ d a t a presentation is descriptive in nature, we (_____dic~ employ nonparametric and multivariate
L-------methods as well These included chi-square and V---- : logis t ic regression analyses to further evaluate
immoXortant intra-categorical and inter-categorical • ~1
differences. v - - J J e ~ ' ~ o u s n e g s
serious does the general public view white r crime? This was a central question that the
J ~ s f e y was designed to answer.
Su~ey research conducted in the 1970s revealed
~ that the general public, at that time, was fairly indifferent toward the commission of white collar cremes. '~ Subsequent surveys demonstrated that a
ing proportion of Americans was viewing in white collar crimes as serious offenses, ly those offenses that resulted in some type ysical harm. '~ Still, these same surveys
sh,pwed that the public was relatively E u~"~ncerned about such crimes as fraud and
e!~c]ezzlement. The seriousness level ratings oJ:~t'ained through the present survey show some
~ signs that the public's perceptions of white r crime seriousness are changing•
es 1 through 4 demonstrate that many now ~ ~ h ~ v e that white collar crime can be as serious or ( ' - - "~m6re serious than certain types of street crimes•
Page 12
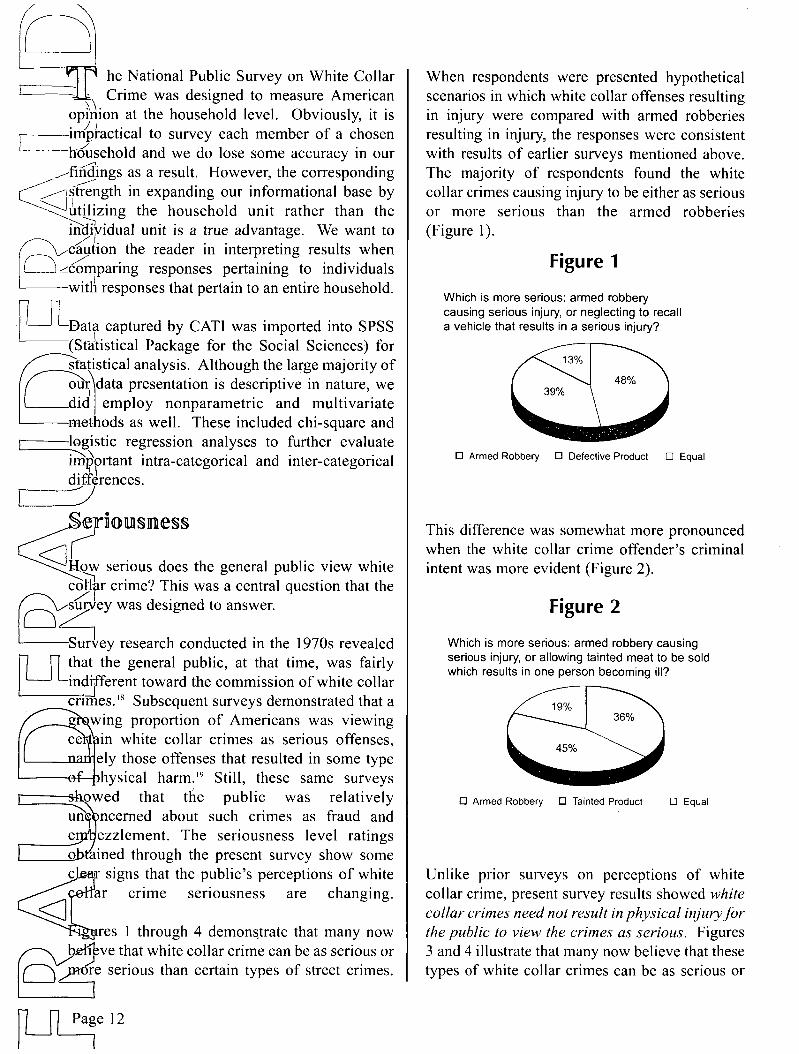
When respondents were presented hypothetical scenarios in which white collar offenses resulting in injury were compared with armed robberies resulting in injury, the responses were consistent with results of earlier surveys mentioned above. The majority of respondents found the white collar crimes causing injury to be either as serious or more serious than the armed robberies (Figure 1).
Figure 1
Which is more serious: armed robbery causing serious injury, or neglecting to recall a vehicle that results in a serious injury?
[] Armed Robbery [] Defective Product [] Equal
This difference was somewhat more pronounced when the white collar crime offender's criminal intent was more evident (Figure 2).
Figure 2
Which is more serious: armed robbery causing serious injury, or allowing tainted meat to be sold which results in one person becoming ill?
[] Armed Robbery [] Tainted Product [] Equal
Unlike prior surveys on perceptions of white collar crime, present survey results showed white collar crimes need not result in physical in jury for the public to view the crimes as serious. Figures 3 and 4 illustrate that many now believe that these types of white collar crimes can be as serious or
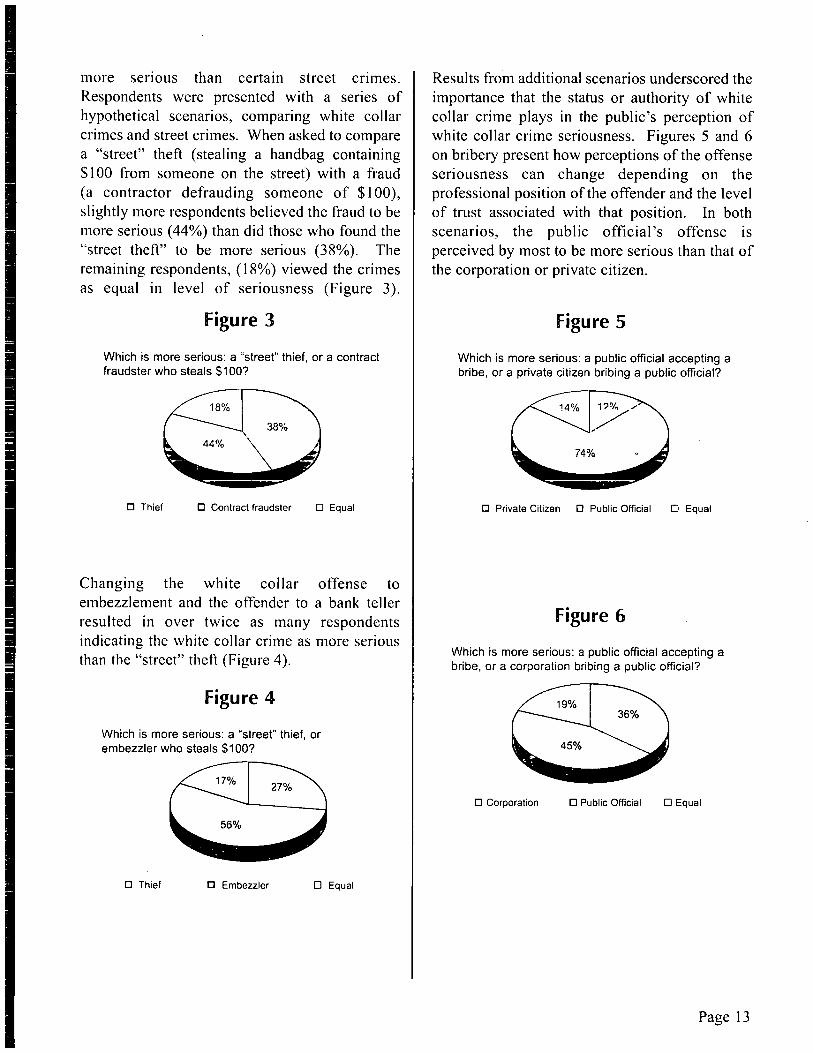
more serious than certain street crimes. Respondents were presented with a series of hypothetical scenarios, comparing white collar crimes and street crimes. When asked to compare a "street" theft (stealing a handbag containing $100 from someone on the street) with a fraud (a contractor defrauding someone of $100), slightly more respondents believed the fraud to be more serious (44%) than did those who found the "street theft" to be more serious (38%). The remaining respondents, (18%) viewed the crimes as equal in level of seriousness (Figure 3).
Figure 3
Which is more serious: a "street" thief, or a contract fraudster who steals $100?
[] Thief [ ] Contract fraudster [ ] Equal
Changing the white collar offense to embezzlement and the offender to a bank teller resulted in over twice as many respondents indicating the white collar crime as more serious than the "street" theft (Figure 4).
Figure 4
Which is more serious: a "street" thief, or embezzler who steals $100?
[] Thief 0 Embezzler D Equal
Results from additional scenarios underscored the importance that the status or authority of white collar crime plays in the public's perception of white collar crime seriousness. Figures 5 and 6 on bribery present how perceptions of the offense seriousness can change depending on the professional position of the offender and the level of trust associated with that position. In both scenarios, the public official's offense is perceived by most to be more serious than that of the corporation or private citizen.
Figure 5
Which is more serious: a public official accepting a bribe, or a private citizen bribing a public official?
[] Private Citizen [] Public Official 0 Equal
Figure 6
Which is more serious: a public official accepting a bribe, or a corporation bribing a public official?
[] Corporation n Public Official [ ] Equal
Page 13
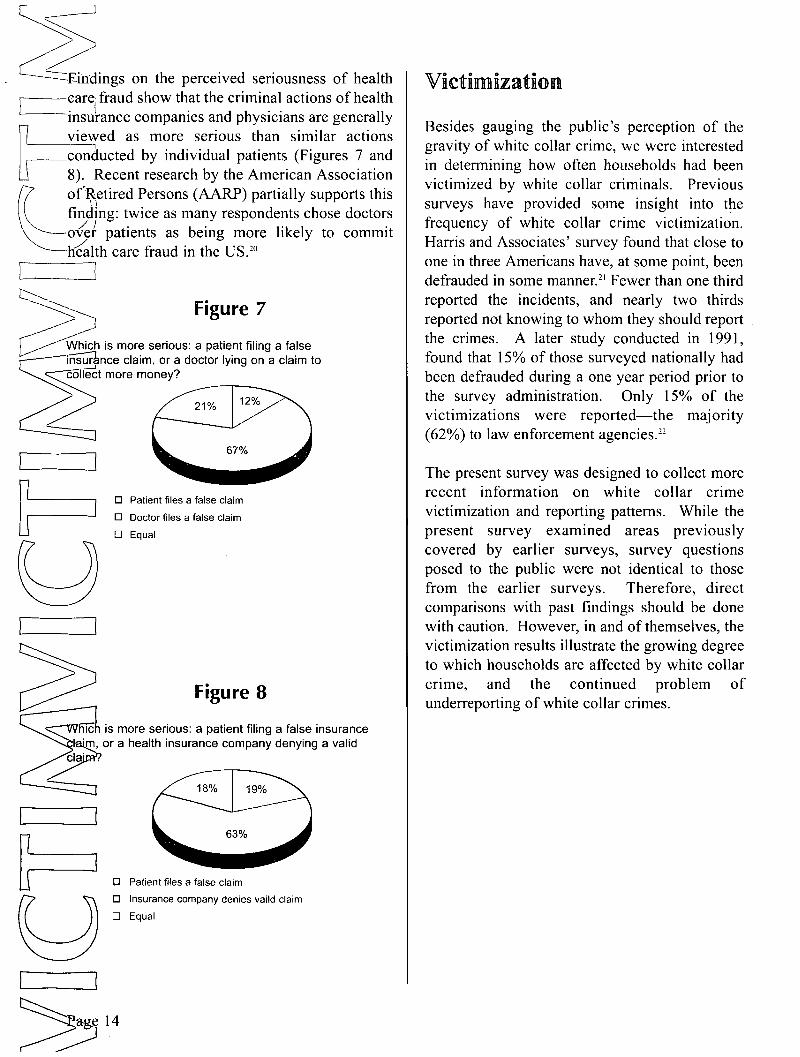
~ F J n - d i n g s on the perceived seriousness of health ------care, fraud show that the criminal actions of health ~ i n s u r a n c e companies and physicians are generally
~__, viewed as more serious than similar actions __conducted by individual patients (Figures 7 and
8). Recent research by the American Association -~ of'Retired Persons (AARP) partially supports this
finding: twice as many respondents chose doctors / / \ ~ o v e r patients as being more likely to commit ~ h e J a l t h care fraud in the US. 2°
~~ Figure 7
I ~ Which is more serious: a patient filing a false r ~-----Lj~ ~"-~alnsur nce claim, or a doctor lying on a claim to ~ t more m o n e y ?
[ (
l [] Patient files a false claim [] Doctor files a false claim [] Equal
Figure 8
i s more serious: a patient filing a false insurance a health insurance company denying a valid
I J [] Patient rites a false claim [] Insurance company denies vaild claim [] Equal
Victimization
Besides gauging the public's perception of the gravity of white collar crime, we were interested in determining how often households had been victimized by white collar criminals. Previous surveys have provided some insight into the frequency of white collar crime victimization. Harris and Associates' survey found that close to one in three Americans have, at some point, been defrauded in some manner. 2] Fewer than one third reported the incidents, and nearly two thirds reported not knowing to whom they should report the crimes. A later study conducted in 1991, found that 15% of those surveyed nationally had been defrauded during a one year period prior to the survey administration. Only 15% of the victimizations were reported--the majority (62%) to law enforcement agencies. 2-~
The present survey was designed to collect more recent information on white collar crime victimization and reporting patterns. While the present survey examined areas previously covered by earlier surveys, survey questions posed to the public were not identical to those from the earlier surveys. Therefore, direct comparisons with past findings should be done with caution. However, in and of themselves, the victimization results illustrate the growing degree to which households are affected by white collar crime, and the continued problem of underreporting of white collar crimes.
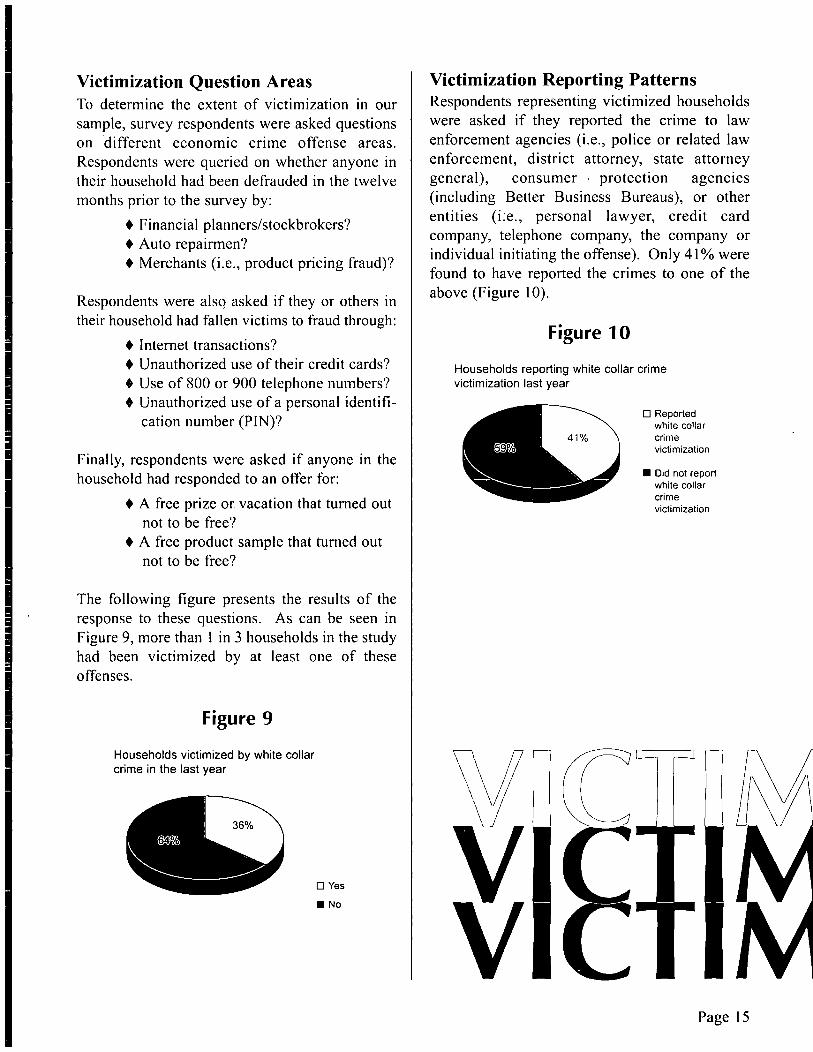
Victimization Question Areas To determine the extent of victimization in our sample, survey respondents were asked questions on different economic crime offense areas. Respondents were queried on whether anyone in their household had been defrauded in the twelve months prior to the survey by:
) Financial planners/stockbrokers? ) Auto repairmen? ) Merchants (i.e., product pricing fraud)?
Respondents were also asked if they or others in their household had fallen victims to fraud through:
Internet transactions? Unauthorized use of their credit cards? Use of 800 or 900 telephone numbers'? Unauthorized use of a personal identifi- cation number (PIN)?
Finally, respondents were asked if anyone in the household had responded to an offer for:
) A free prize or vacation that turned out not to be free? A free product sample that turned out not to be free?
The following figure presents the results of the response to these questions. As can be seen in Figure 9, more than 1 in 3 households in the study had been victimized by at least one of these offenses.
Figure 9
Households victimized by white collar crime in the last year
[] Yes
• No
Victimization Reporting Patterns Respondents representing victimized households were asked if they reported the crime to law enforcement agencies (i.e., police or related law enforcement, district attorney, state attorney general), consumer protection agencies (including Better Business Bureaus), or other entities (i:e., personal lawyer, credit card company, telephone company, the company or individual initiating the offense). Only 41% were found to have reported the crimes to one of the above (Figure 10).
Figure 10
Households reporting white collar cr ime victimization last year
[] Reported white collar crime victimization
• Did not report white collar crime victimization
Page 15
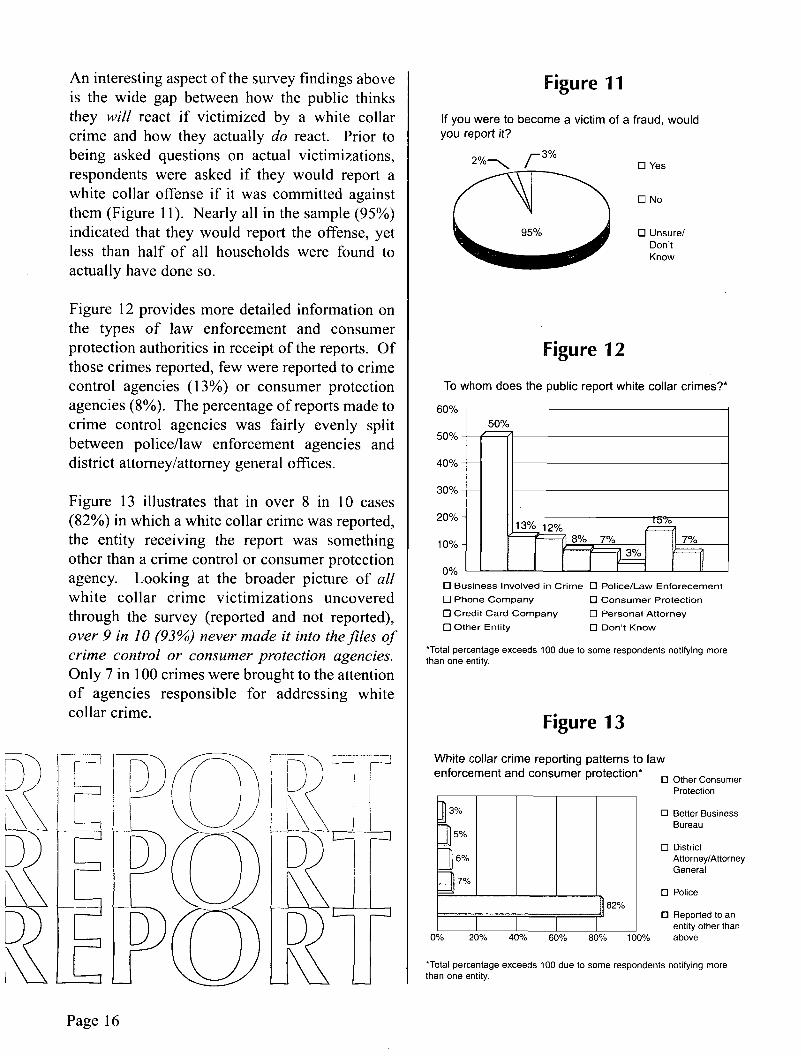
An interesting aspect of the survey findings above is the wide gap between how the public thinks they will react if victimized by a white collar crime and how they actually do react. Prior to being asked questions on actual victimizations, respondents were asked if they would report a white collar offense if it was committed against them (Figure 11). Nearly all in the sample (95%) indicated that they would report the offense, yet less than half of all households were found to actually have done so.
Figure 12 provides more detailed information on the types of law enforcement and consumer protection authorities in receipt of the reports. Of those crimes reported, few were reported to crime control agencies (13%) or consumer protection agencies (8%). The percentage of reports made to crime control agencies was fairly evenly split between police/law enforcement agencies and district attorney/attorney general offices.
Figure 13 illustrates that in over 8 in l0 cases (82%) in which a white collar crime was reported, the entity receiving the report was something other than a crime control or consumer protection agency. Looking at the broader picture of all white collar Crime victimizations uncovered through the survey (reported and not reported), over 9 in 10 (93%) never made it into the files o f crime control or consumer protection agencies. Only 7 in 1 O0 crimes were brought to the attention of agencies responsible for addressing white collar crime.
©
Figure 11
If you were to become a victim of a fraud, would you report it?
2 % ~ / - - 3% [] Yes
[ ] No
[ ] Unsure/ Don't Know
Figure 12
To whom does the public report white collar crimes?*
60%
50%
40% -
30% -
20% -
10% -
5O%
15% 13% 12%
• ~ 3 o / ° I ] =~7°I° 0% [ ] Business Involved in Cr ime [ ] Pol ice/Law Enforecement
[ ] Phone Company [ ] Consumer Protect ion
[ ] Credit Card Company [ ] Personal At torney
[ ] Other Enti ty [ ] Don't Know
*Total percentage exceeds 100 due to some respondents notifying more than one entity.
Figure 13
White collar crime reporting patterns to law enforcement and protect ion*" "" [ ] Other Consumer consumer
Protection
[ ] Better Business i~ Bureau
5 [ ] District 36o o [ ] Police
[ ] Reported to an entity other than
0% 20% 40% 60% 80% 100% above
Attorney/Attorney General
*Total percentage exceeds 100 due to some respondents notifying more than one entity.
Page 16
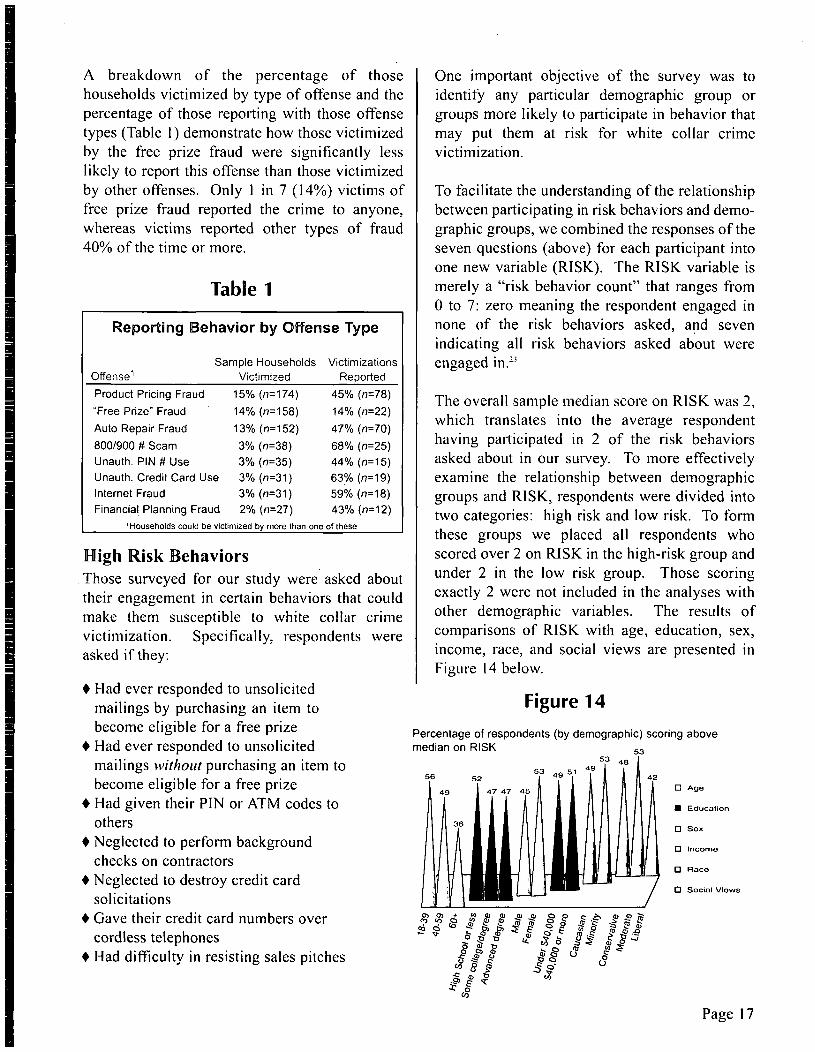
A breakdown of the percentage of those households victimized by type of offense and the percentage of those reporting with those offense types (Table 1) demonstrate how those victimized by the free prize fraud were significantly less likely to report this offense than those victimized by other offenses. Only 1 in 7 (14%) victims of free prize fraud reported the crime to anyone, whereas victims reported other types of fraud 40% of the time or more.
Table 1
Reporting Behavior by Offense Type
Sample Households Victimizations Offense ~ Victimized Reported
Product Pricing Fraud 15% (n=174) 45% (n=78)
"Free Prize" Fraud 14% (n=158) 14% (n=22) Auto Repair Fraud 13% (n=152) 47% (n=70)
800/900 # Scam 3% (n=38) 68% (n=25) Unauth. PIN # Use 3% (n=35) 44% (n=15) Unauth. Credit Card Use 3% (n=31) 63% (n=19) Internet Fraud 3% (n=31) 59% (n=18) Financia! Planning Fraud 2% (n=27) 43% (n=12)
' Households could be victimized by more than one of these
High Risk Behaviors • Those surveyed for our study were asked about their engagement in certain behaviors that could make them susceptible to white collar crime victimization. Specifically, respondents were asked if they:
i Had ever responded to unsolicited mailings by purchasing an item to become eligible for a free prize
i Had ever responded to unsolicited mailings without purchasing an item to become eligible for a free prize
i Had given their PIN or ATM codes to others
i Neglected to perform background checks on contractors
i Neglected to destroy credit card solicitations
i Gave their credit card numbers over cordless telephones
i Had difficulty in resisting sales pitches
One important objective of the survey was to identify any particular demographic group or groups more likely to participate in behavior that may put them at risk for white collar crime victimization.
To facilitate the understanding of the relationship between participating in risk behaviors and demo- graphic groups, we combined the responses of the seven questions (above) for each participant into one new variable (RISK). The RISK variable is merely a "risk behavior count" that ranges from 0 to 7: zero meaning the respondent engaged in none of the risk behaviors asked, and seven indicating all risk behaviors asked about were engaged in. 23
The overall sample median score on RISK was 2, which translates into the average respondent having participated in 2 of the risk behaviors asked about in our survey. To more effectively examine the relationship between demographic groups and RISK, respondents were divided into two categories: high risk and low risk. To form these groups we placed all respondents who scored over 2 on RISK in the high-risk group and under 2 in the low risk group. Those scoring exactly 2 were not included in the analyses with other demographic variables. The results of comparisons of RISK with age, education, sex, income, race, and social views are presented in Figure 14 below.
Figure 14
Percentage of respondents (by demographic) scoring above 53 median on RISK
53 48
53 49 51
49 47 47 1"3 Ago
• Educa t ion
[ ] Sex
[ ] I ncomo
[] Raco
[ ] SocioI Viows
Page 17
~ w 1 ecline in risk behavior seems to be associated aging. Adults (ages 18-39) were somewhat
e likely to engage in risk behaviors than ture adults (ages 40-59), and significantly / /
..more likely to participate in risk behaviors than / - . ( " - ~ s ~ o r s (ages 60+). Mature adults were found to
I ~ b e - s i g n i f i c a n t l y more likely to engage in risky I behaviors than seniors• -~
_A Logistic regression analysis was performed to determine what demographic factors (i.e., age,
E- / s e n social view, education, and race) would have / . . . . . .
. - / / a n y impact m predicting risk behavior. Females f / / were significantly more likely than males to
l engage in risk behavior; however, age seems to be
~ - - - ~ t h e strongest predictor of risk behavior, eclipsing • "Y5 / ~ l l \ b t h e r demographic measures.-
" " p "o s of the Typical Victim A final area of questions on white collar crime
~ {~ victimization was devoted to the respondents
• / I • /k,. imp.resslons of who they believed would be most • Y . . , ~ - S j l i k e l y to be victimized in terms of age and
education level. Regarding age, the majority "of re~ondents (60%) believed that those most likely
I , . ,
to--~e victimized would be over 60 years of age. Whlen asked about education level, nearly half (:4~%) also believed that those with less than a
liege education would be more likely to be . \ ~ . .
((______,victimized than those who had some college ~ . ~ e z ( ~ r i e n c e . These perceptions are inconsistent ~ ~ i t h findings of demographics of victims
U~eyed in earlier victimization surveys (Titus, zelmann and Boyle, 1995), which found that
I younger adults (18-34 years of age) and those . ~ w i t h some college or college degrees were more
1-ikely to be victimized• A
White Collar Crime Control
ides perceptions of white collar crime usness and actual victimization of white
_..----..collar crime, the NW3C was interested in S.------di~covering the most prevalent views on the social
• \
{ # control of white collar crime• Primary questions .
sed on perceptions of the likelihood of
apprehension of fraudsters, how they are sanctioned if convicted, how they should be sanctioned and the level of resources respondents are willing to support to ensure tighter control of white collar crime.
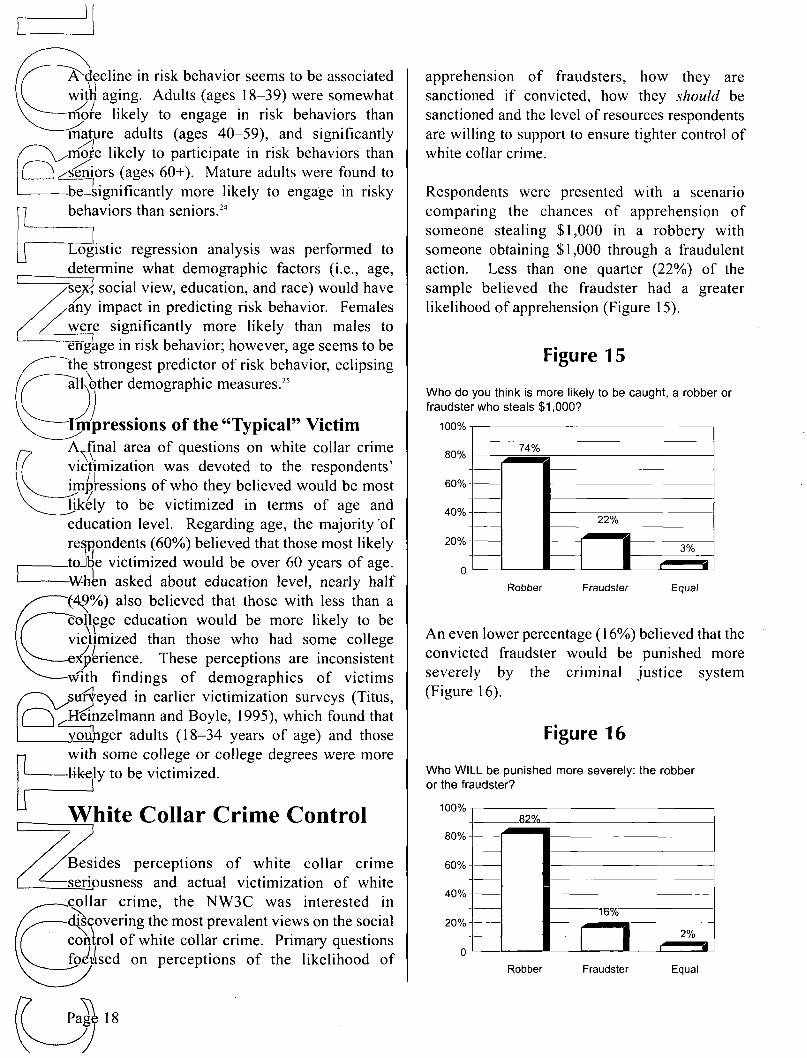
Respondents were presented with a scenario comparing the chances of apprehension of someone stealing $1,000 in a robbery with someone obtaining $1,000 through a fraudulent action• Less than one quarter (22%) of the sample believed the fraudster had a greater likelihood of apprehension (Figure 15).
Figure 15
Who do you think is more likely to be caught, a robber or fraudster who steals $1,000?
100%
80% 74%
60% •
4 0 %
2 0 %
22%
Robber Fraudster
3%
Equal
An even lower percentage (16%) believed that the convicted fraudster would be punished more severely by the criminal justice system (Figure 16).
Figure 16
Who WILL be punished more severely: the robber or the fraudster?
100% ! _ _
80% !
60%-
40%-
20%
82%
Robber Fraudster Equal

A comparison of this result with respondents' beliefs of who should be punished more severely reveals a marked difference. Only slightly more than 30% believe that the robber should be punished more severely, while higher percentages believe the fraudster deserved greater punishment and that both should be punished with equal severity (Figure 17).
Figure 17
Who SHOULD be punished more severely: the robber or the fraudster?
100%
80%
60%
40%-
20%-
38% 31% 31%
Robber Fraudster Equal
While there was some variation in opinions on desired punishment, according to social views (i.e., liberal, moderate, conservative), the variation was not remarkable (Figure 18).
Figure18
Who SHOULD be punished more severely: the robber or the fraudster?
Liberal
Moderate
Conservative
O O
• Robber
• Fraudster
I
~, ~ ° o
rq Robber and Fraudster equally
Respondents were asked if they believed the government should allocate more resources to controlling white collar crime or street crime (Figure 19). Overall, 35% believed more resources should be devoted to white collar crime control, with 35% indicating that more resources should go towards street crime control. Thirty percent believed funding should be equal.
Figure 19
Where should resources be al located?
I More money to street crime • More money to white collar crime El Equal money
In our analysis, we explored the possibilities that these perceptions on white collar crime control resource allocations could be associated with feelings of safety, perception of crime seriousness, and social views.
Page 19
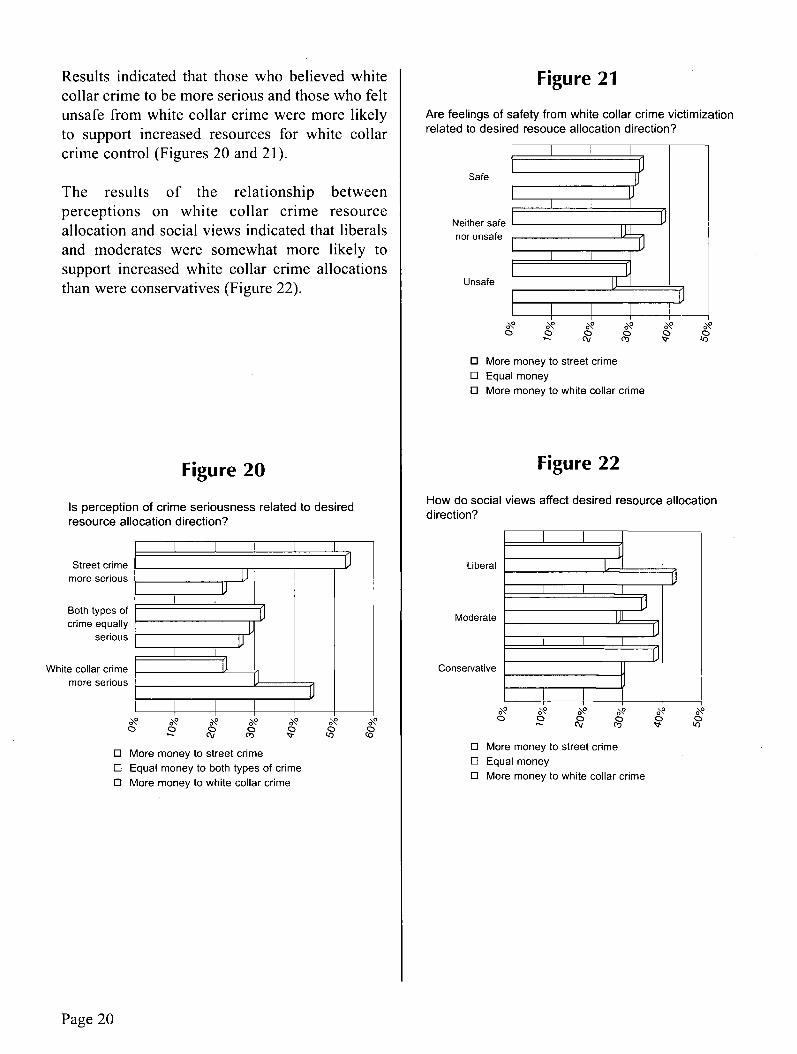
Results indicated that those who bel ieved white collar crime to be more serious and those who felt unsafe from white collar crime were more likely to support increased resources for white collar crime control (Figures 20 and 2 l).
The results o f the relationship between percept ions on white collar crime resource allocation and social views indicated that liberals and moderates were somewhat more likely to support increased white collar crime allocations than were conservatives (Figure 22).
Figure 20
IS percep t ion of cr ime ser iousness related to des i red resource a l locat ion d i rect ion?
Street crime more serious
Both types of crime equally
serious
White collar crime more serious
o~ o~ o~ o~ o~ o o ~/ ° o
[ ] More money to street crime [ ] Equal money to both types of crime [ ] More money to white collar crime
o~ o~
Figure 21
Are feel ings of safety from whi te col lar cr ime v ict imizat ion related to des i red resouce al locat ion di rect ion?
Safe
Neither safe nor unsafe
Unsafe
° ° ~t °
[ ] More money to street crime [] Equal money [ ] More money to white collar crime
o~ o~
Figure 22
How do social v iews affect des i red resource a l locat ion direct ion?
Liberal
Moderate
Conservative
[ ] More money to street crime [] Equal money [ ] More money to white collar crime
o~ o~
Page 20
/
\ ,
\
. /
Survey results dispel some long-held beliefs thatthe general public is ambivalent toward white collar crime. Theresults represent a challenge to agents of white collar crime control, particularly with regard to prevention and reporting.
r•-• hanks to past crime surveys, we have reached a thorough understanding of the American
public's views of and experience with street crime. However, until now, we remained relatively uninformed on public views and experiences related to white collar crime:
• What does the American public think about crimes such as fraud, embezzle- ment, and bribery?
• How often are American households defrauded by unscrupulous offenders?
• To whom and to what extent are white collar crimes reported?
• What does the public want done about these crimes?
The results of the National Public Survey on White Collar Crime provide answers to these questions. Used properly, these answers can play an integral role in improving efforts to prevent and control white collar crime in the future.
Major findings from a survey of 1,169 households throughout the US included the following:
• Over 1 out of 3 households had been victimized by white collar crime in the last year
• Widely held opinions concerning the profile of typical white collar crime victims are divorced from the actual profile of victims found by recent research on victimization
• There is a disparity between how Americans believe they will react if victimized and how they do react when they are actually victimized
• Less than 1 in 10 victimizations were ever reported to law enforcement or consumer protection agencies
• The public has a deep concern with increasing the apprehension and sanctioning of white collar criminals
Upon assessing survey results, a quite provocative, multi-layered picture materializes with regard to perceptions of and experience with white collar crime. As we peel back the layers, we find that the American public is becoming well acquainted with theft by deception (as its victims) and tends to view the commission of such crime with an increasingly jaundiced eye. Using our eight offense categories, we found that over 1 out o f 3 households had been victimized by white collar crime in the past year. This level of victimization is high when compared to earlier studies on white collar crime victimization, even after taking into account definitional differences of victimization.
Relying on the survey results alone, it is difficult to explain the underlying reasons for the high incidence of victimization. The FBI's Uniform Crime Reports (UCR) tell us that arrests for fraud, embezzlement, and forgery have risen nationally over the last several years. -'6 The incidence of white collar crime victimizations culled from our survey may simply be a reflection of a rise in criminal activity in this crime area. On the other hand, the number of victimizations might also be a sign that the public may not be sufficiently aware of their vulnerability to being victimized. Survey results provide some clues here. For example, respondent perceptions of the demographics of average victims (i.e., older and less educated) are quite divorced from actual demographics of victims drawn from victimization studies (i.e., younger, college educated). This misperception may cause some to become complacent, thinking that white collar crime victimization only happens to people unlike them. Clearly, more research is needed to explain the incidence of white collar crime victimizations.
With regard to reporting victimizations, a curious finding of the survey is the wide disparity between how Americans believe they will react when they are victimized and how they do react when they are actually victimized. Once again, it is hard to confidently say why this disparity
Page 22
exists. One possibility is that respondents representing victimized, non-reporting house- holds may have wanted to respond with the politically correct or socially desirable answer to the general question on reporting (i.e., "would you report") and would only concede failures to report when questioned about specific victimiza- tions• Other possibilities are that victimized house- hold members may have not initially considered the offenses crimes, may have been uncertain about which are the most logical agencies to receive the reports, or may have a lack of faith that the offenders would be apprehended. This last explanation gains some support from other findings in the survey that illustrate the public's skepticism with the apprehension capabilities of the enforcement community.
At first blush, survey findings on the incidence of reporting would lead one to believe that victims are now more apt to report white collar victimizations than they have been in the past. Optimism here fades quickly, however, when the data are examined more closely. After considering the entities to which the victims reported the offense, it becomes clear that reports made to appropriate law enforcement agencies are extremely rare. Less than 1 in 10 victimizations described by survey respondents ever made it to the files o f law enforcement or consumer protection agencies• On the distribution of reporting patterns by specific offenses, there is some evidence that victims are less inclined to report the offenses if the victim has played a more active role in enabling the offender to successfully commit the criminal act (e.g., free prize frauds).
The survey's findings on perceptions of white collar crime seriousness and control offer some interesting food for thought• Past studies on perceptions of white collar crime seriousness found a marked difference in the high degree of
/ .- .... ~ \ / / "'\\
J II L\ ; I <'. ~/j
seriousness attached to white collar crimes " ' \ resulting in physical harm. and the lower, degre"e/°-(-I ~. "\~!
seriousness associated With ,, \ . / /
white collar crimes h6t ' / /
resulting in such harm. Our ....... findings suggest that tller-e ; i ; -~ /-
/ . . /
may now be less of a." .'" • . . / / , /
difference in perceptions.of/ seriousness between tl~e~ . . . . " two categories. The level'of \
• / / ~ o o f / ~ - - ~
. \ moral condemnation "q'~
• , ~J i non-violent white co l!ar ),
crimes was higher tEhan . . . . expected, particularly when -_;
the crimes involve both monetary loss and iihe corruption of public trust. Belying past . . . . . . .
/ / i
assumptions on the public's indifference towa'rds - white collar crime, response results 'on sanctioning and financial support of control- programs denlolaStl'ate that the public is far fiom
/ / J " /-~ -~
being apprehensive about advocating a get-tough/ /~\,, approach with white collar offenders• This i~ks.~o / ~/ ~),' regardless of individual social views or experiences with victimization• Within this -! context, the single finding on crime control - \ perceptions that stands out is the d~scovery of 'a ,, serious confidence gap between public demands
' ,\ / /
for just desserts for white collar offenders and,the . . . . . . . ,~ • /
perception of the criminal justice system's abilit'y, . . . . . . . or willingness, to administer adequa- t6- :~- punishment. // /"
/ /
Application of Survey Results ({~ / How can we benefit from the information extracted/ from the survey? The information should be~of j great value to those responsible for preventing and controlling white collar crime. From one perspective, the results should prove encouraging to professionals working in the fields of white collar investigation and prosecution• The public's sensitivity to the threat of white collar crime and the call for strict sanctioning of offenders is strong empirical evidence for the support crime control professionals can expect to receive for effective programs. Such evidence can serve as potent ammunition to help sustain organizational
Page 23
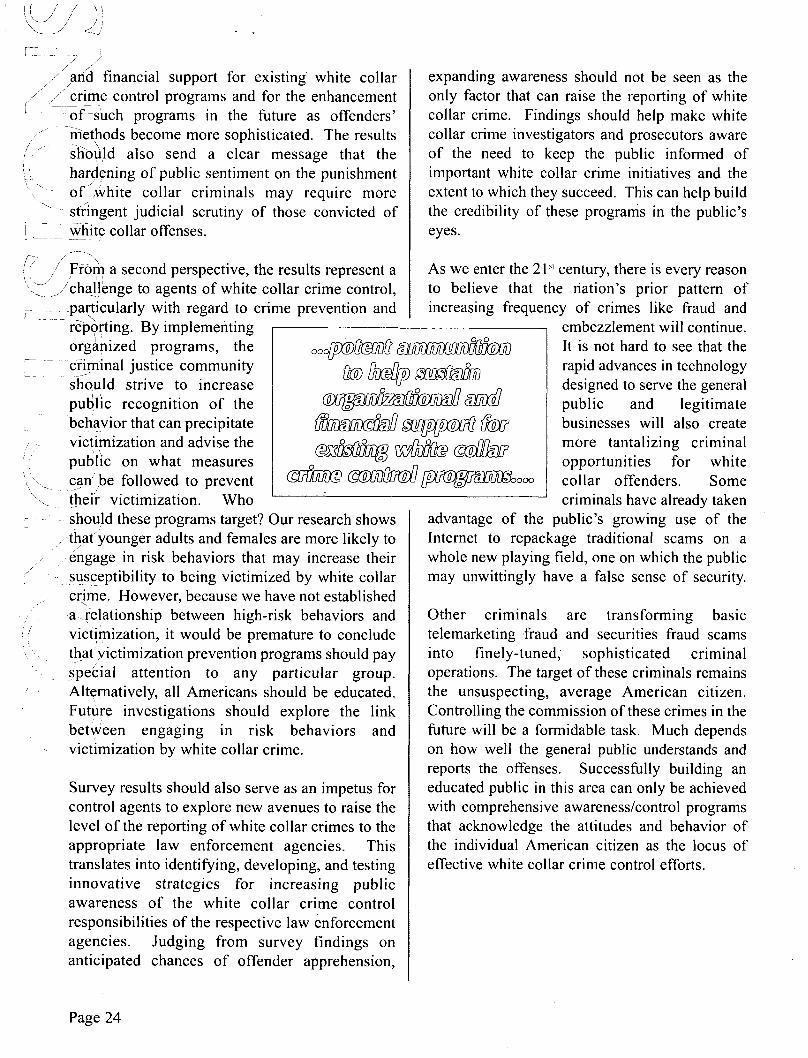
I, Sj" / )!
./and financial support for existing white collar / /" crime control programs and for the enhancement
-of-sUch programs in the future as offenders' ....... - methods become more sophisticated. The results
/ , " Slio~ild also send a clear message that the [ '
!, hardening of public sentiment on the punishment "~..i ..... of),White collar criminals may require more
"~ sti:ingent judicial scrutiny of those convicted of i~._- ~- W.~!~ e collar offenses.
expanding awareness should not be seen as the only factor that can raise the reporting of white collar crime. Findings should help make white collar crime investigators and prosecutors aware of the need to keep the public informed of important white collar crime initiatives and the extent to which they succeed. This can help build the credibility of these programs in the public's eyes.
/,/ / Ff0r~ a second perspective, the results represent a As we enter the 212' century, there is every reason '< -y / cha l l enge to agents of White collar crime control, to believe that the nation's prior pattern of - particularly with regard to crime prevention and increasing frequency of crimes like fraud and
reporting. By implementing . . . . . embezzlement will continue. / '~ • " O O •
orgamzed programs, the ooo~f f~ : :~ ~ / ~ ~ It is not hard to see that the -~- -c-fiminal justice community ~ ~ ~ o rapid advances in technology
should strive to increase designed to serve the general public recognition of the ~ ~ ) f f ~ public and legitimate
_ behavior that can precipitate ~ ~ ~ businesses will also create , , victimization and advise the ( ~ Z ~ / ~ [ E ~ ) / ~ U _ ~ 7 more tantalizing criminal
pub'fie on what measures opportunities for white .. can/be followed to prevent ~ ~ ~ o o o collar offenders. Some ~-~_ their victimization. Who criminals have already taken
?_ - should these programs target? Our research shows advantage of the public's growing use of the • /
/ t h a t younger adults and females are more likely to Internet to repackage traditional scams on a .... engage in risk behaviors that may increase their whole new playing field, one on which the public
" SuscePtibility to being victimized by white collar may unwittingly have a false sense of security. crime. However, because we have not established a~(e!ationshi p between high-risk behaviors and Other criminals are transforming basic
,/ victimization, it would be premature to conclude telemarketing Craud and securities fraud scams ¢' tl:atyictimization prevention programs shouldpay into finely-tuned, sophisticated criminal
. / .
" special attention to any particular group, operations. The target of these criminals remains ' Alternatively, all Americans should be educated, the unsuspecting, average American citizen. . Future investigations should explore the link Controlling the commission of these crimes in the
bet~veen engaging in risk behaviors and future will be a formidable task. Much depends vicnmization by white collar crime, on how well the general public understands and
reports the offenses. Successfully building an Survey results should also serve as an impetus for educated public in this area can only be achieved control agents to explore new avenues to raise the with comprehensive awareness/control programs level of the reporting of white collar crimes to the that acknowledge the attitudes and behavior of appropriate law enforcement agencies. This the individual American citizen as the locus of translates into identifying, developing, and testing effective white collar crime control efforts. innovative strategies for increasing public awareness of the white collar crime control responsibilities of the respective law enforcement agencies. Judging from survey findings on anticipated chances of offender apprehension,
Page 24

1. Gilbert Geis, Robert F. Meier and Lawrence M. Salinger, eds., White Collar Crime: Classics and Contemporary Views. New York: Free Press, 1995.
Geis, Meier and Salinger point out that while the term "white collar crime" has become firmly entrenched in our society, there is no one, agreed upon definition for this term. Geis, Meier and Salinger remind us that the study of this crime area can travel under various criminological identities such as "upperworld crime," "advocational crime," or "economic crime." Upon recommendation of the SME committee for this survey the definition used focused more on characteristics of the particular "act" rather than the status of the "actor." The definition of white collar crime used for this survey is "planned crimes that involve cheating or lying that usually occur in the course of employment."
2. T. David Evans, Francis T. Cullen and Paula J. Dubeck, "Public Perceptions of Corporate Crime," in Michael B. Blankenship, ed., Understanding Corporate Criminality. New York: Garland Publishing, 1993, pp. 85-114.
3. Edwin H. Sutherland, "White Collar Criminality," American Sociological Review, 5 (1940): 1-12.
4. President ' s Commission on Law Enforcement and Administration of Justice. Challenge of Crime in a Free Society. Washington, DC: US Government Printing Office, 1968.
5. National Fraud Investigation Center and Trans Union. Fraud Assessment and Impact Study. Horsham, PA: National Fraud Investigation Center, 1995. Also see, William Cunningham, Private Security Trends 1970 - 2000 : The Halcrest Report II. Oxford: Butterworth - Heinemann, 1991.
6. Federal Bureau of Investigation. Crime in the United States 1998: Uniform Crime Reports. Washington, DC: Federal Bureau of Investigation, US Department of Justice.
7. Peter H. Rossi, J. Simpson and J. Miller, "Beyond Crime Seriousness: Fitting the Punishment to the Crime," Journal of Quantitative Criminology, 1 (1985): 59-90.
8. Evans et al., op. cit.
9. Ronald Bass and Lois Hoeffier, Telephone Based Fraud: A Survey of the American Public. New York: Louis Harris and Associates Inc., 1992.
10. American Association of Retired Persons, Findings from a Baseline Omnibus Survey on Telemarketing Solicitations. Washington, DC: AARP, 1996. American Association of Retired Persons, Telemarketing Fraud and Older Americans. Washington, DC: AARP, 1996.
11. Richard Titus, Fred Heinzeimann and John M. Boyle, "Victimizations of Persons by Fraud," Crime and Delinquency, 41 (1995): 54-72.
Page 26
12. Originally 6,000 numbers were purchased from Survey Sampling, Inc., with the understanding that approximately half of the particular sample we chose would be working household phones. Although this type of sample is less efficient, it is considered scientifically stronger. An additional 3000 numbers were purchased at the end of February when it was clear that a high refusal rate might keep us from reaching our goal. The amount of sample to purchase was determined by using a formula, which takes into account the desired number of completes, the working phone rate, the product and demographic incidence and the desired response rate. Product incidence is the percent of a population or group that qualifies based on one or more criteria and the demographic incidence is the percent of the population that qualifies based on demographic criteria such as age or race. There were no demographic criteria for this study.
13. The sample was drawn from a universe consisting of all persons living in households with a phone in the U.S. Persons who were not U.S. citizens, those under the age of 18, and persons in custodial institutions or other group quarters, were ineligible for participation.
14. Selection tables were designed using a combination of sex, age and number of house- hold members as factors for respondent selection. Eight types of selection tables were randomly assigned to interviewers to ensure even use across the sample.
15. Don Dillman, Mail and Telephone Surveys: The Total Design Method. New York: John Wiley and Sons, 1978.
16. Colin Goff and N. Nason-Clark, "The Seriousness of Crime in Fredrickton, New Brunswick: Perceptions Towards White Collar Crime." Canadian Journal of Criminology, 31 (1989): 19-33. Marrim Wolfgang, Robert Figlio, Paul Tracy and Simon Singer, The National Survev of Crime Severi~. Washington, DC: U.S. Government Printing Office, 1985. Robert F. Meier and James F. Short, "Crime as Hazard: Perceptions of Risk and Seriousness," Criminology, 23 (1985): 389-399.
17. All respondents were asked the same sets of questions, but questions within the sets were asked in differing order.
18. Peter H. Rossi, Emily Waite, Christine E. Rose and Richard E. Berk, "The Seriousness of Crimes: Normative Structure and Individual Differences." American Sociological Review, 39 (1974): 224-37.
19. Wolfgang et al., op. cit.
20. American Association of Retired Persons, America Speaks Out on Health Care Fraud: A Consumer Survey. Washington, DC: AARP, 1999.
21. Bass and Hoeffier, op. cit.
22. Titus et al., op. cit.
Page 27
23. We feel that creating a single variable from this set of questions gives us more information on overall participation in the types of risk behaviors that could increase the chances of being victimized by a white collar crime. In addition, a single measure affords more interpretive power than any of the questions can alone, as it portrays the "bigger picture."
24. Statistical analyses compared adults with mature adults and seniors (¢ =.07, p<. 10 and ~b =. 19, p<.001, respectively). Mature adults participated in significantly more risk behaviors than the seniors did (~b =. 13, p<.05).
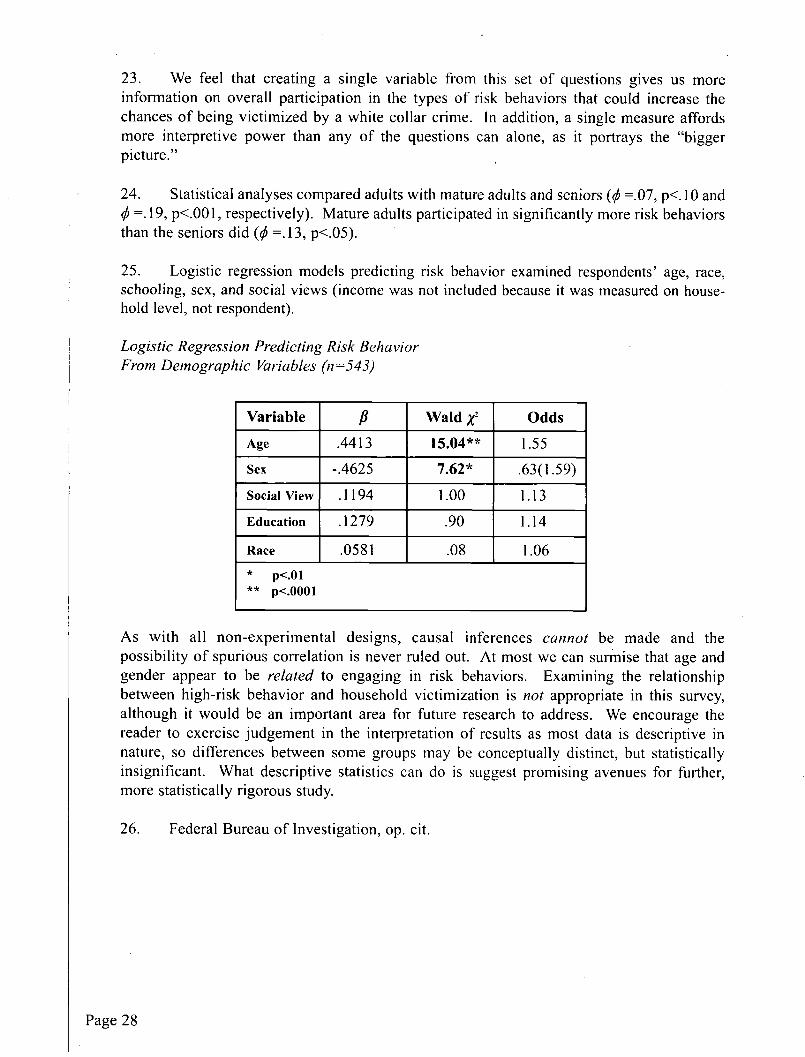
25. Logistic regression models predicting risk behavior examined respondents' age, race, schooling, sex, and social views (income was not included because it was measured on house- hold level, not respondent).
Logistic Regression Predicting Risk Behavior From Demographic Variables 07=543)
Variable ,8 Wald X: Odds
Age .4413 15.04"* 1.55
Sex -.4625 7.62* .63(1.59)
Social View .1194 1.00 1.13
Education .1279 .90 1.14
Race .0581 .08 1.06
* p<.01
** p<.0001
As with all non-experimental designs, causal inferences cannot be made and the possibility of spurious correlation is never ruled out. At most we can surmise that age and gender appear to be related to engaging in risk behaviors. Examining the relationship between high-risk behavior and household victimization is not appropriate in this survey, although it would be an important area for future research to address. We encourage the reader to exercise judgement in the interpretation of results as most data is descriptive in nature, so differences between some groups may be conceptually distinct, but statistically insignificant. What descriptive statistics can do is suggest promising avenues for further, more statistically rigorous study.
26. Federal Bureau of Investigation, op. cit.
Page 28
Survey Questionnaire
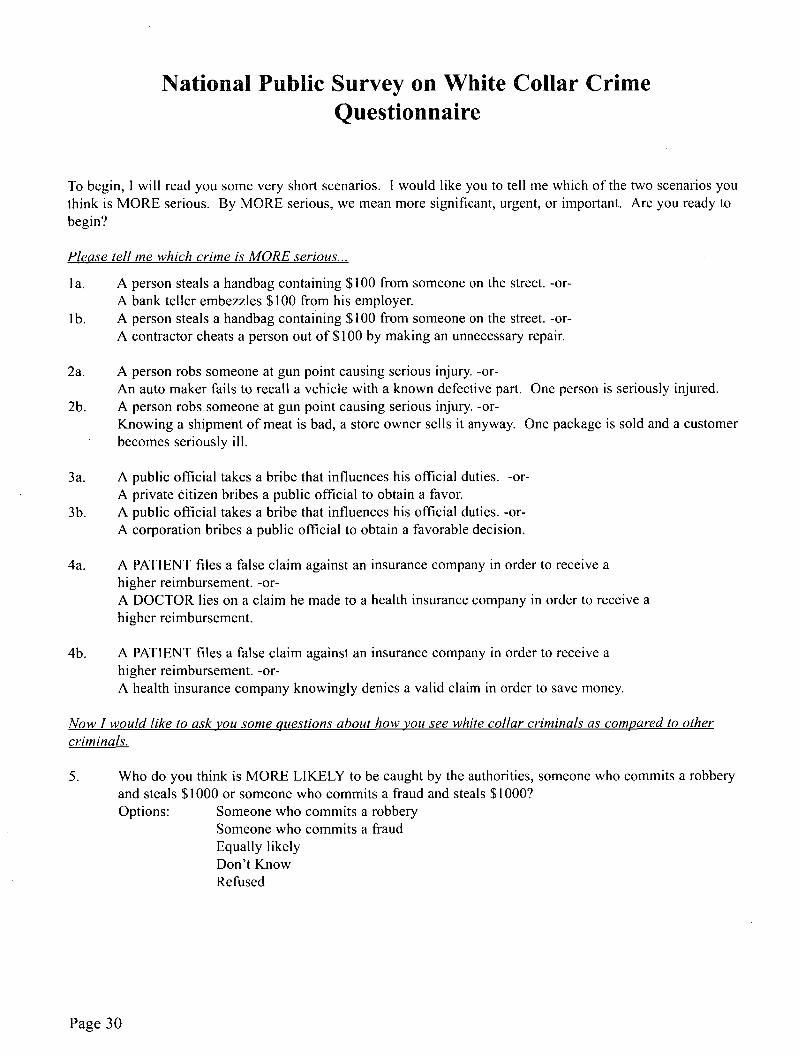
National Public Survey on White Collar Crime Questionnaire
To begin, I will read you some very short scenarios. I would like you to tell me which of the two scenarios you think is MORE serious. By MORE serious, we mean more significant, urgent, or important. Are you ready to begin?
Please tell me which cr ime is M O R E serious...
la.
lb.
A person steals a handbag containing $100 from someone on the street. -or- A bank teller embezzles $100 from his employer. A person steals a handbag containing $100 from someone on the street. -or- A contractor cheats a person out of $100 by making an unnecessary repair.
2a.
2b.
A person robs someone at gun point causing serious injury. -or- An auto maker fails to recall a vehicle with a known defective part. One person is seriously injured. A person robs someone at gun point causing serious injury. -or- Knowing a shipment of meat is bad, a store owner sells it anyway. One package is sold and a customer becomes seriously ill.
3a.
3b.
A public official takes a bribe that influences his official duties. -or- A private citizen bribes a public official to obtain a favor. A public official takes a bribe that influences his official duties. -or- A corporation bribes a public official to obtain a favorable decision.
4a. A PATIENT files a false claim against an insurance company in order to receive a higher reimbursement. -or- A DOCTOR lies on a claim he made to a health insurance company in order to receive a higher reimbursement.
4b. A PATIENT files a false claim against an insurance company in order to receive a higher reimbursement. -or- A health insurance company knowingly denies a valid claim in order to save money.
N o w I would like to ask you some quest ions about how you see white collar criminals as compared to other
criminals.
. Who do you think is MORE LIKELY to be caught by the authorities, someone who commits a robbery and steals $1000 or someone who commits a fraud and steals $1000? Options: Someone who commits a robbery
Someone who commits a fraud Equally likely Don't Know Refused
Page 30
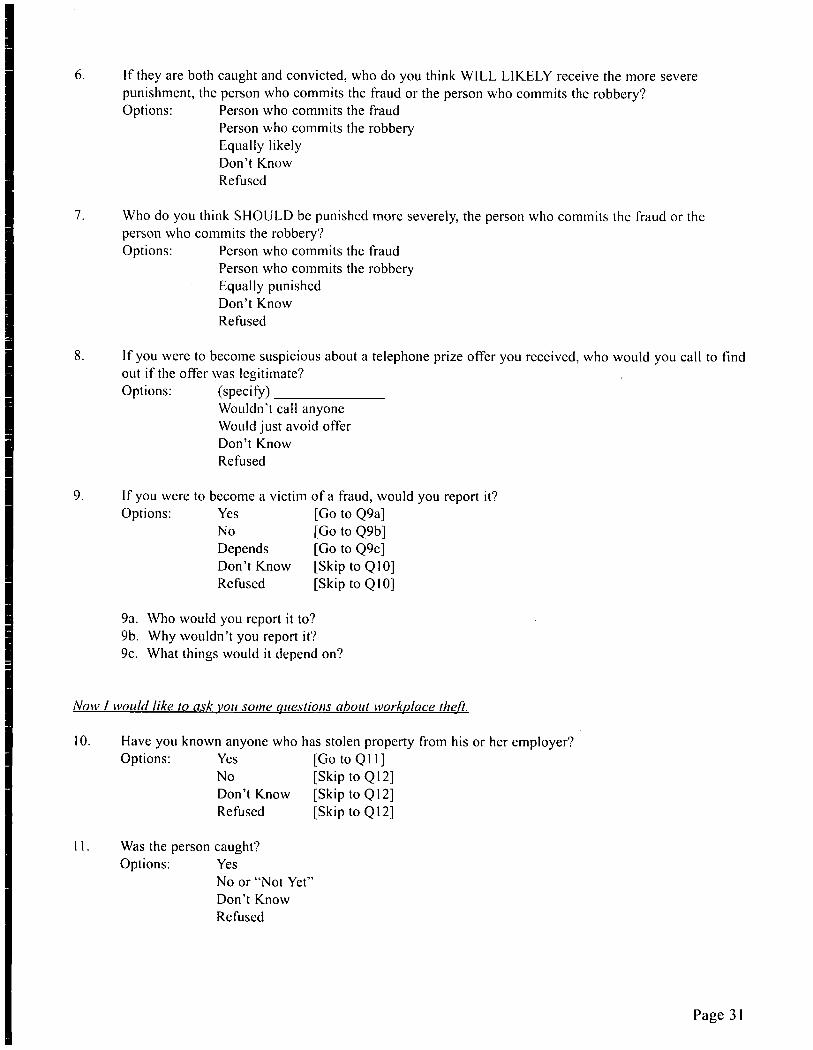
.
.
.
.
If they are both caught and convicted, who do you think WILL LIKELY receive the more severe punishment, the person who commits the fraud or the person who commits the robbery? Options: Person who commits the fraud
Person who commits the robbery Equally likely Don't Know Refused
Who do you think SHOULD be punished more severely, the person who commits the fraud or the person who commits the robbery? Options: Person who commits the fraud
Person who commits the robbery Equally punished Don't Know Refused
If you were to become suspicious about a telephone prize offer you received, who would you call to find out if the offer was legitimate? Options: (specify)
Wouldn't call anyone Would just avoid offer Don't Know Refused
If you were to become a victim of a fraud, would you report it? Options: Yes [Go to Q9a]
No [Go to Q9b] Depends [Go to Q9c] Don't Know [Skip to Q 10] Refused [Skip to QI0]
9a. Who would you report it to? 9b. Why wouldn't you report it'? 9c. What things would it depend on?
Now ! would like to ask you some questions about workplace theft.
I0. Have you known anyone who has stolen property from his or her employer? Options: Yes [Go to Q 11 ]
No [Skip to Q 12] Don't Know [Skip to QI2] Refused [Skip to Q ! 2]
II. Was the person caught? Options: Yes
No or "Not Yet" Don't Know Refused
Page 31
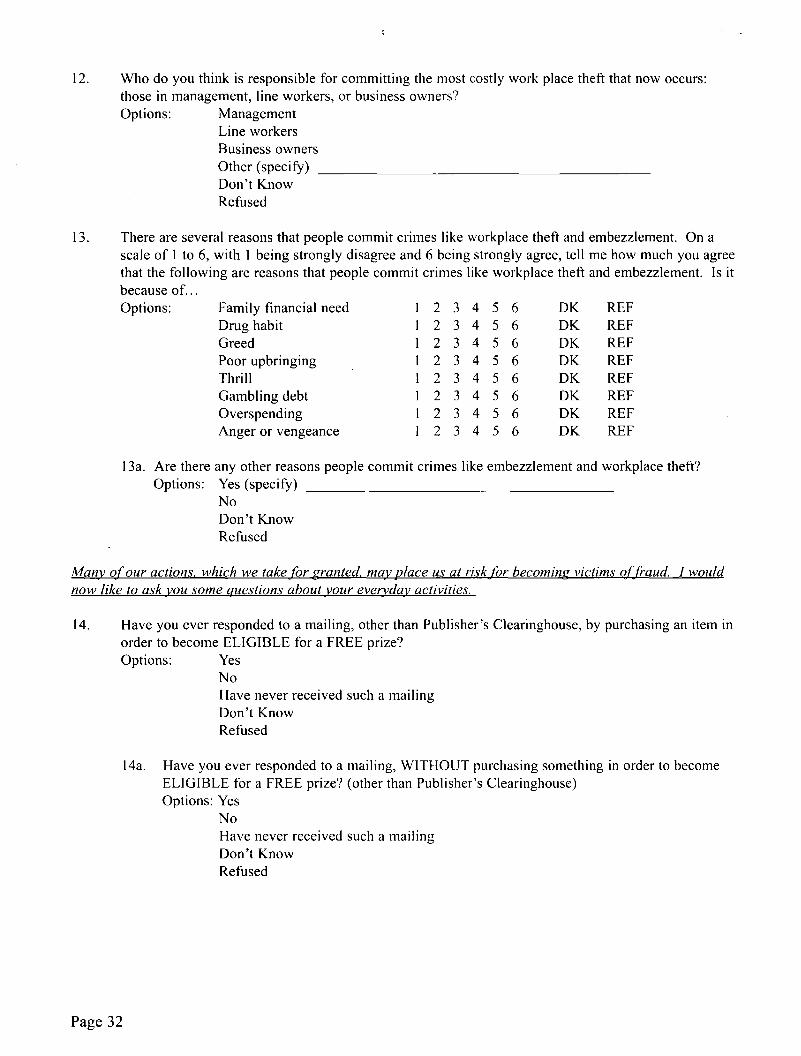
12. Who do you think is responsible for committing the most costly work place theft that now occurs: those in management, line workers, or business owners? Options: Management
Line workers Business owners Other (specify) Don't Know Refused
13. There are several reasons that people commit crimes like workplace theft and embezzlement. On a scale of 1 to 6, with 1 being strongly disagree and 6 being strongly agree, tell me how much you agree that the following are reasons that people commit crimes like workplace theft and embezzlement. Is it because of... Options: Family financialneed 1 2 3 4 5 6 DK REF
Drug habit 1 2 3 4 5 6 DK REF Greed 1 2 3 4 5 6 DK REF Poor upbringing 1 2 3 4 5 6 DK REF Thrill 1 2 3 4 5 6 DK REF Gambling debt 1 2 3 4 5 6 DK REF Overspending 1 2 3 4 5 6 DK REF Anger or vengeance l 2 3 4 5 6 DK REF
13a. Are there any other reasons people commit Options: Yes (specify)
No Don't Know Refused
crimes like embezzlement and workplace theft?
Many o f our actions, which we take for granted, may place us at risk fo r becoming victims o[ fraud. I would now like to ask you some questions about your eve~dav activities.
14. Have you ever responded to a mailing, other than Publisher's Clearinghouse, by purchasing an item in order to become ELIGIBLE for a FREE prize? Options: Yes
No Have never received such a mailing Don't Know Refused
14a. Have you ever responded to a mailing, WITHOUT purchasing something in order to become ELIGIBLE for a FREE prize? (other than Publisher's Clearinghouse) Options: Yes
No Have never received such a mailing Don't Know Refused
Page 32
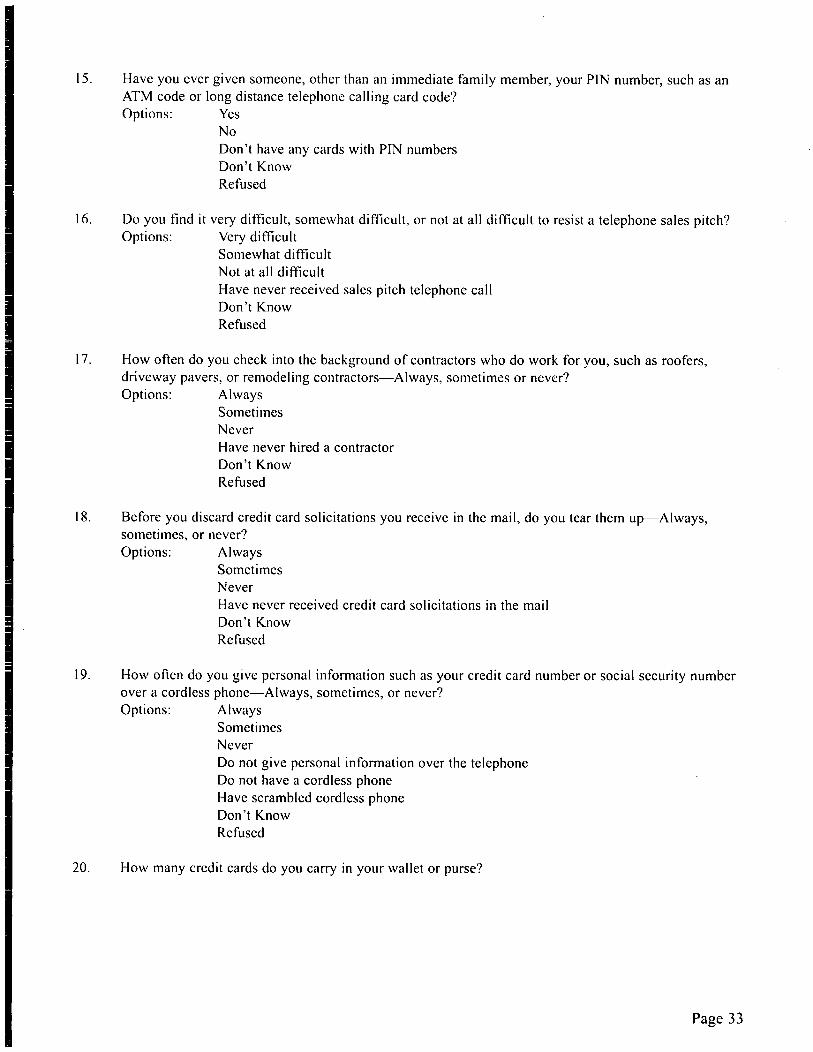
15.
16.
17.
18.
19.
20.
Have you ever given someone, other than an immediate family member, your PIN number, such as an ATM code or long distance telephone calling card code? Options: Yes
No Don't have any cards with PIN numbers Don't Know Refused
Do you find it very difficult, somewhat difficult, or not at all difficult to resist a telephone sales pitch? Options: Very difficult
Somewhat difficult Not at all difficult Have never received sales pitch telephone call Don't Know Refused
How often do you check into the background of contractors who do work for you, such as roofers, driveway pavers, or remodeling contractors--Always, sometimes or never? Options: Always
Sometimes Never Have never hired a contractor Don't Know Refused
Before you discard credit card solicitations you receive in the mail, do you tear them Ul>--Always, sometimes, or never? Options: Always
Sometimes Never Have never received credit card solicitations in the mail Don't Know Refused
How often do you give personal information such as your credit card number or social security number over a cordless phone--Always, sometimes, or never? Options: Always
Sometimes Never Do not give personal information over the telephone Do not have a cordless phone Have scrambled cordless phone Don't Know Refused
How many credit cards do you carry in your wallet or purse?
Page 33
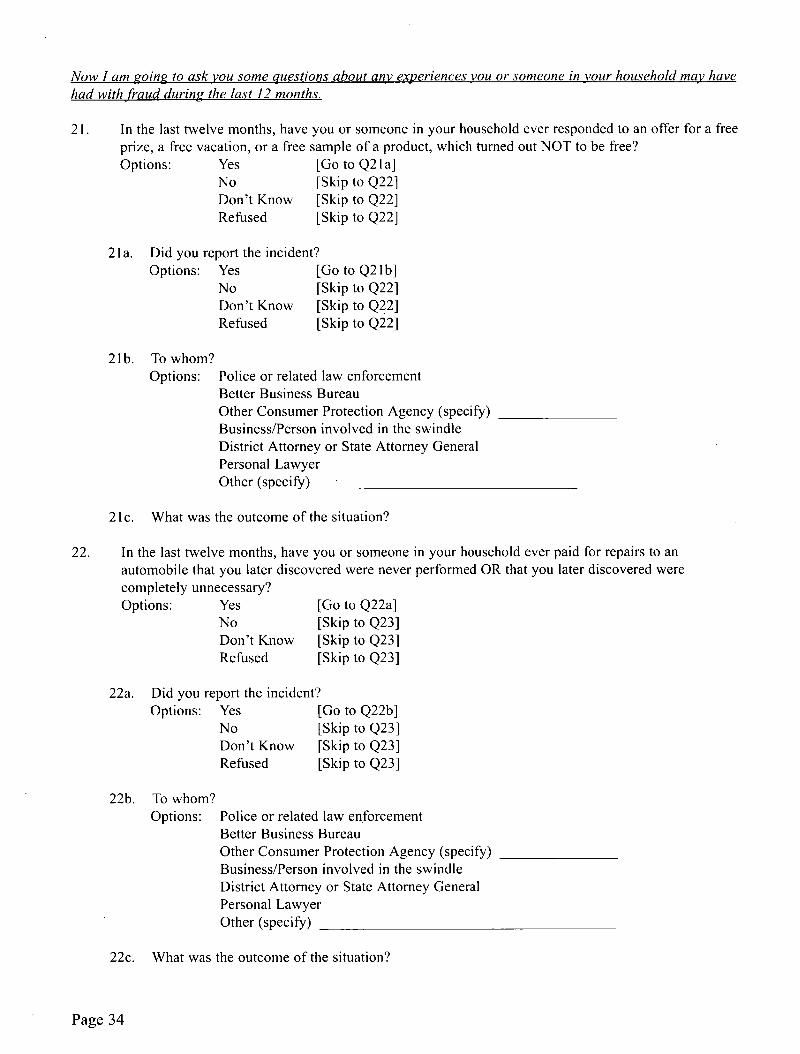
Now I am going to ask you some questions about any experiences you or someone in your household ma)~ have
had with fraud during the last 12 months.
21. In the last twelve months, have you or someone in your household ever responded to an offer for a free prize, a free vacation, or a free sample of a product, which turned out NOT to be free? Options: Yes [Go to Q21 a]
No [Skip to Q22] Don't Know [Skip to Q22] Refused [Skip to Q22]
21a. Did you report the incident? Options: Yes [Go to Q21b]
No [Skip to Q22] Don't Know [Skip to Q22] Refused [Skip to Q22]
2lb. To whom? Options: Police or related law enforcement
Better Business Bureau Other Consumer Protection Agency (specify) Business/Person involved in the swindle District Attorney or State Attorney General Personal Lawyer Other (specify)
21c. What was the outcome of the situation?
22. In the last twelve months, have you or someone in your household ever paid for repairs to an automobile that you later discovered were never performed OR that you later discovered were completely unnecessary? Options: Yes [Go to Q22a]
No [Skip to Q23] Don't Know [Skip to Q23] Refused [Skip to Q23]
22a. Did you report the incident? Options: Yes [Go to Q22b]
No [Skip to Q23] Don't Know [Skip to Q23] Refused [Skip to Q23]
22b. To whom? Options: Police or related law enforcement
Better Business Bureau Other Consumer Protection Agency (specify) Business/Person involved in the swindle District Attorney or State Attorney General Personal Lawyer Other (specify)
22c. What was the outcome of the situation?
Page 34
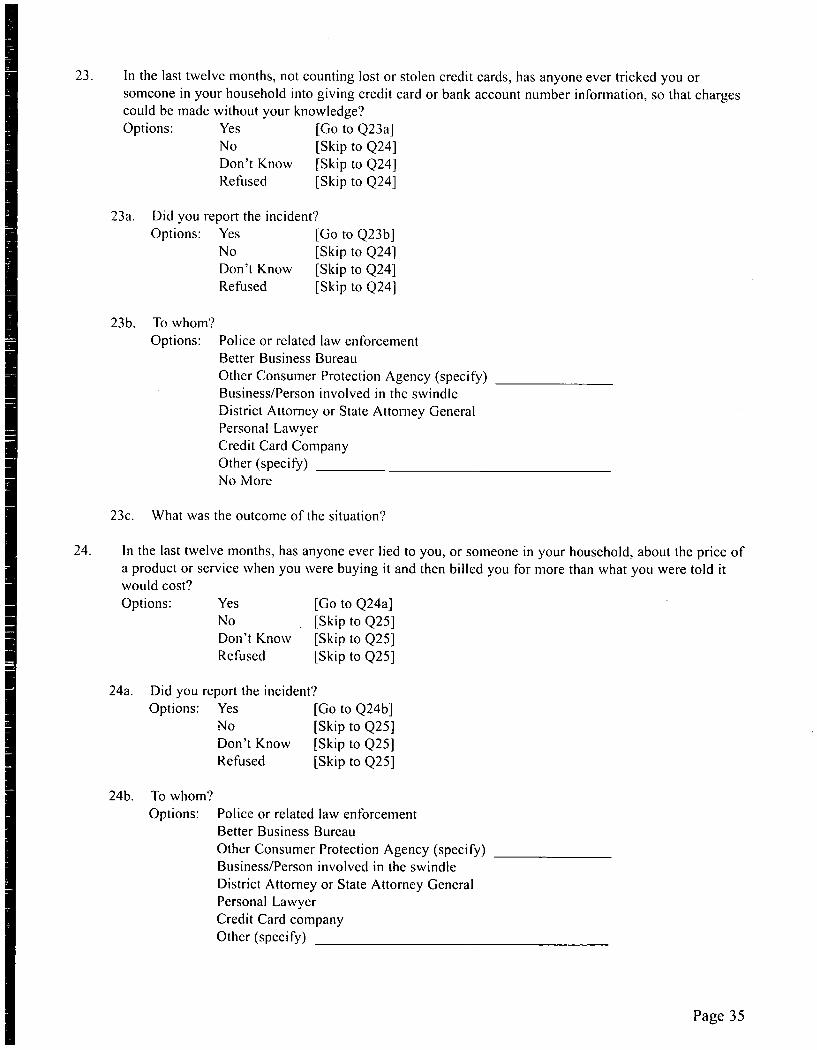
23.
24.
In the last twelve months, not counting lost or stolen credit cards, has anyone ever tricked you or someone in your household into giving credit card or bank account number information, so that charges could be made without your knowledge? Options: Yes [Go to Q23a]
No [Skip to Q24] Don't Know [Skip to Q24] Refused [Skip to Q24]
23a.
23b.
Did you report the incident? Options: Yes [Go to Q23b]
No [Skip to Q24] Don't Know [Skip to Q24] Refused [Skip to Q24]
To whom? Options: Police or related law enforcement
Better Business Bureau Other Consumer Protection Agency (specify) Business/Person involved in the swindle District Attorney or State Attorney General Personal Lawyer Credit Card Company Other (specify) No More
23c. What was the outcome of the situation?
24a.
24b.
In the last twelve months, has anyone ever lied to you, or someone in your household, about the price of a product or service when you were buying it and then billed you for more than what you were told it would cost? Options: Yes [Go to Q24a]
No [Skip to Q25] Don't Know [Skip to Q25] Refused [Skip to Q25]
Did you report the incident? Options: Yes [Go to Q24b]
No [Skip to Q25] Don't Know [Skip to Q25] Refused [Skip to Q25]
To whom? Options: Police or related law enforcement
Better Business Bureau Other Consumer Protection Agency (specify) Business/Person involved in the swindle District Attorney or State Attorney General Personal Lawyer Credit Card company Other (specify)
Page 35
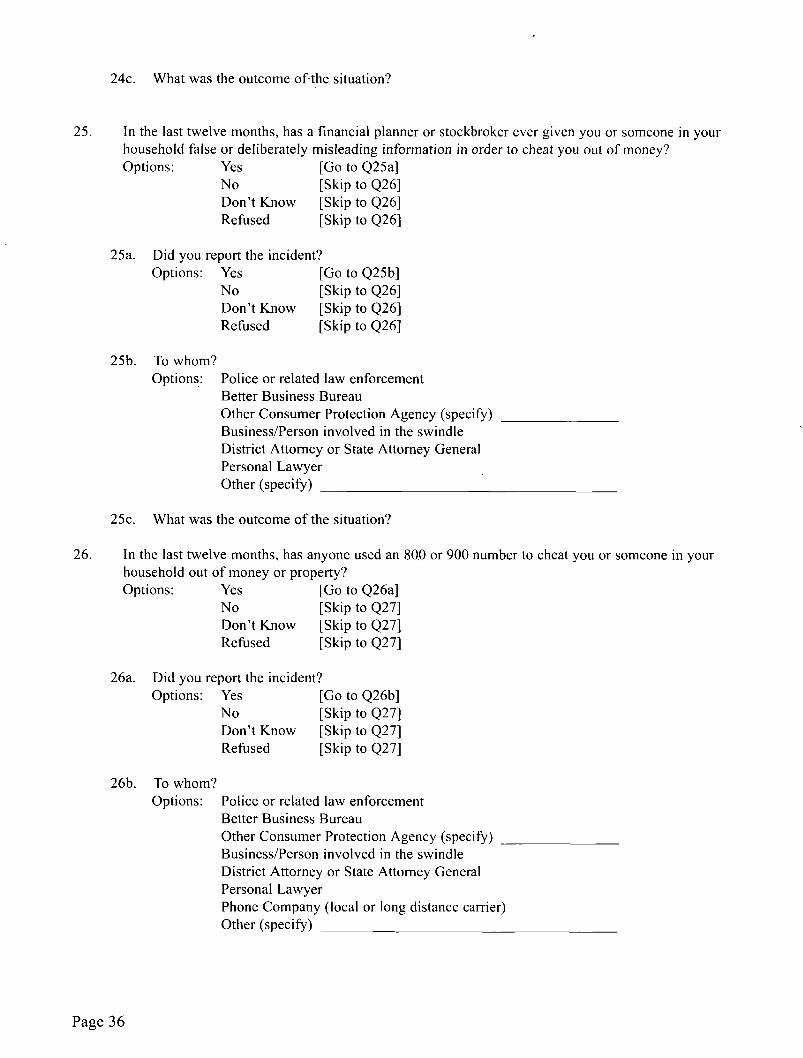
24c. What was the outcome of-the situation?
25.
26.
In the last twelve months, has a financial planner or stockbroker ever given you or someone in your household false or deliberately misleading information in order to cheat you out of money? Options: Yes [Go to Q25a]
No [Skip to Q26] Don't Know [Skip to Q26] Refused [Skip to Q26]
25a. Did you report the incident? Options: Yes [Go to Q25b]
No [Skip to Q26] Don't Know [Skip to Q26] Refused [Skip to Q26]
25b. To whom? Options: Police or related law enforcement
Better BusinessBureau Other Consumer Protection Agency (specify) Business/Person involved in the swindle District Attorney or State Attorney General Personal Lawyer Other (specify)
25c. What was the outcome of the situation?
In the last twelve months, has anyone used an 800 or 900 number to cheat you or someone in your household out of money or property? Options: Yes [Go to Q26a]
No [Skip to Q27] Don't Know [Skip to Q27] Refused [Skip to Q27]
26a. Did you report the incident? Options: Yes [Go to Q26b]
No [Skip to Q27] Don't Know [Skip to Q27] Refused [Skip to Q27]
26b. To whom? Options: Police or related law enforcement
Better Business Bureau Other Consumer Protection Agency (specify) Business/Person involved in the swindle District Attorney or State Attorney General Personal Lawyer Phone Company (local or long distance carrier) Other (specify)
Page 36
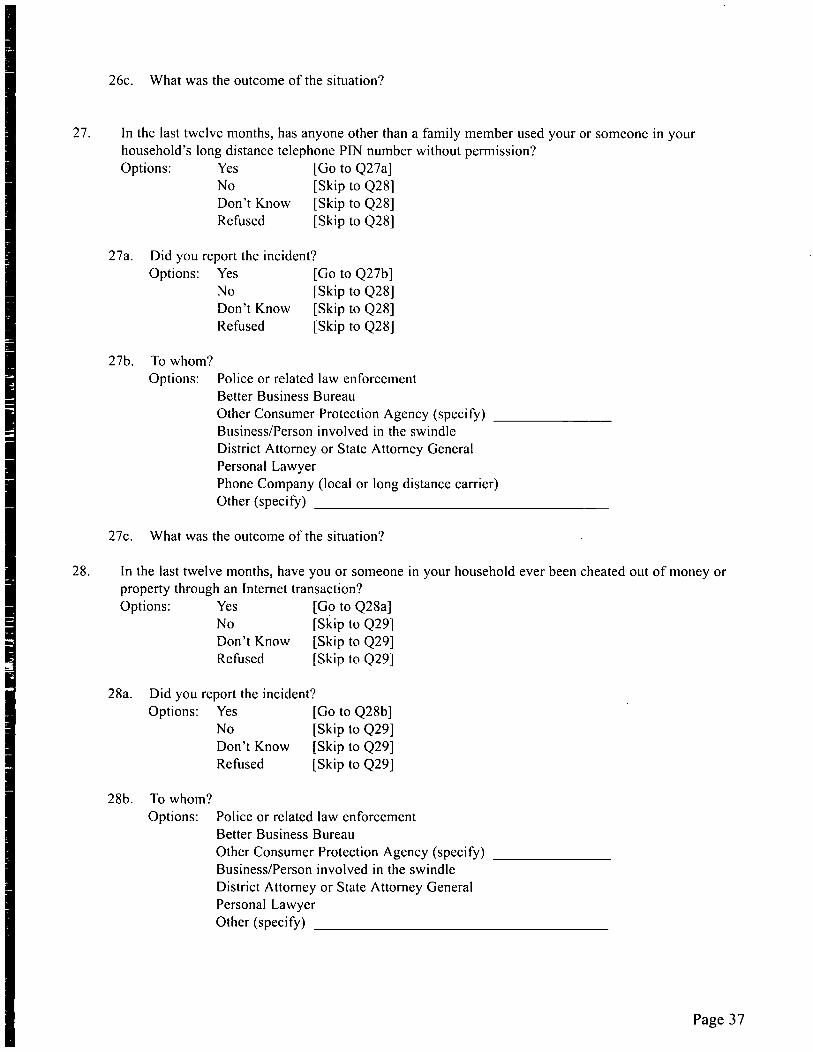
26c. What was the outcome of the situation?
27.
28.
In the last twelve months, has anyone other than a family member used your or someone in your household's long distance telephone PIN number without permission? Options: Yes [Go to Q27a]
No [Skip to Q28] Don't Know [Skip to Q28] Refused [Skip to Q28]
27a. Did you report the incident? Options: Yes [Go to Q27b]
No [Skip to Q28] Don't Know [Skip to Q28] Refused [Skip to Q28]
27b. To whom? Options: Police or related law enforcement
Better Business Bureau Other Consumer Protection Agency (specify) Business/Person involved in the swindle District Attorney or State Attorney General Personal Lawyer Phone Company (local or long distance carrier) Other (specify)
27c. What was the outcome of the situation?
In the last twelve months, have you or someone in your household ever been cheated out of money or property through an Internet transaction? Options: Yes [Go to Q28a]
No [Skip to Q29] Don't Know [Skip to Q29] Refused [Skip to Q29]
28a. Did you report the incident? Options: Yes [Go to Q28b]
No [Skip to Q29] Don't Know [Skip to Q29] Refused [Skip to Q29]
28b. To whom? Options: Police or related law enforcement
Better Business Bureau Other Consumer Protection Agency (specify) Business/Person involved in the swindle District Attorney or State Attorney General Personal Lawyer Other (specify)
Page 37
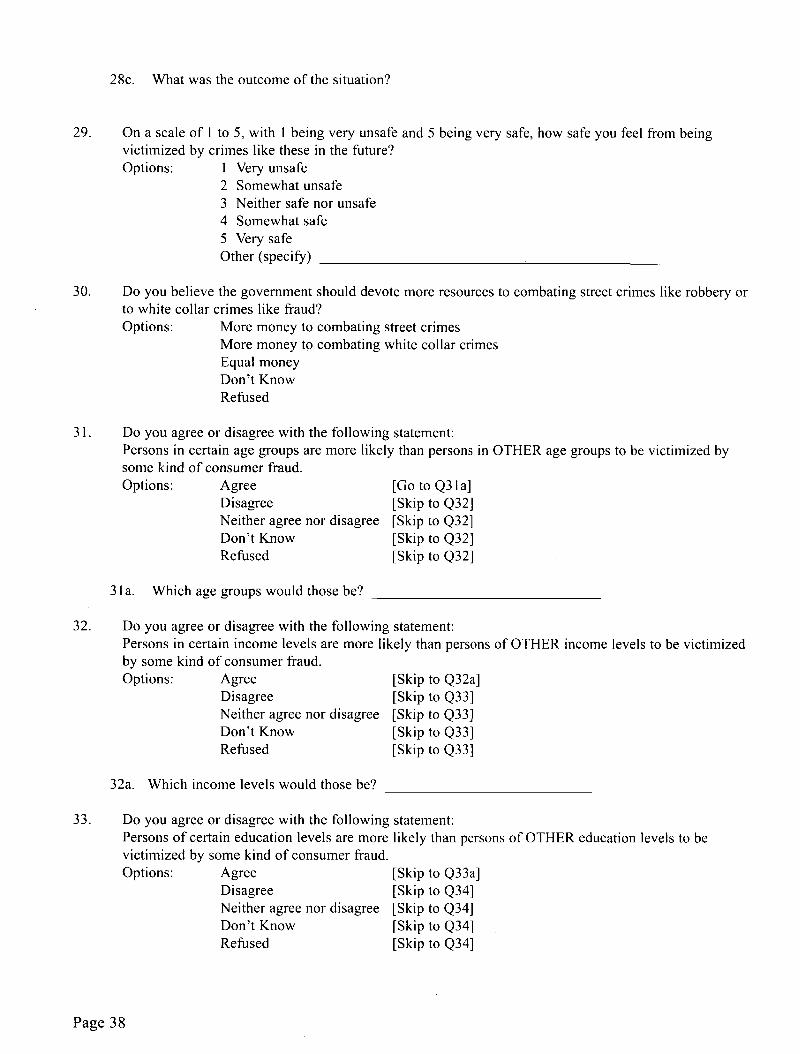
28c. What was the outcome of the situation?
29.
30.
31.
32.
33.
On a scale of l to 5, with l being very unsafe and 5 being very safe, how safe you feel from being victimized by crimes like these in the future? Options: 1 Very unsafe
2 Somewhat unsafe 3 Neither safe nor unsafe 4 Somewhat safe 5 Very safe Other (specify)
Do you believe the government should devote more resources to combating street crimes like robbery or to white collar crimes like fraud? Options: More money to combating street crimes
More money to combating white collar crimes Equal money Don't Know Refused
Do you agree or disagree with the following statement: Persons in certain age groups are more likely than persons in OTHER age groups to be victimized by some kind o f consumer fraud. Options: Agree
Disagree Neither agree nor disagree Don't Know Refused
[Go to Q31 a] [Skip to Q32] [Skip to Q32] [Skip to Q32] [Skip to Q32]
31a. Which age groups would those be?
Do you agree or disagree with the following statement: Persons in certain income levels are more likely than persons of OTHER income levels to be victimized by some kind of consumer fraud. Options: Agree
Disagree Neither agree nor disagree Don't Know Refused
[Skip to Q32a] [Skip to Q33] [Skip to Q33] [Skip to Q33] [Skip to Q33]
32a. Which income levels would those be?
Do you agree or disagree with the following Persons of certain education levels are more victimized by some kind of consumer fraud. Options: Agree
Disagree Neither agree nor disagree Don't Know Refused
statement: likely than persons of OTHER education levels to be
[Skip to Q33a] [Skip to Q34] [Skip to Q34] [Skip to Q34] [Skip to Q34]
Page 38
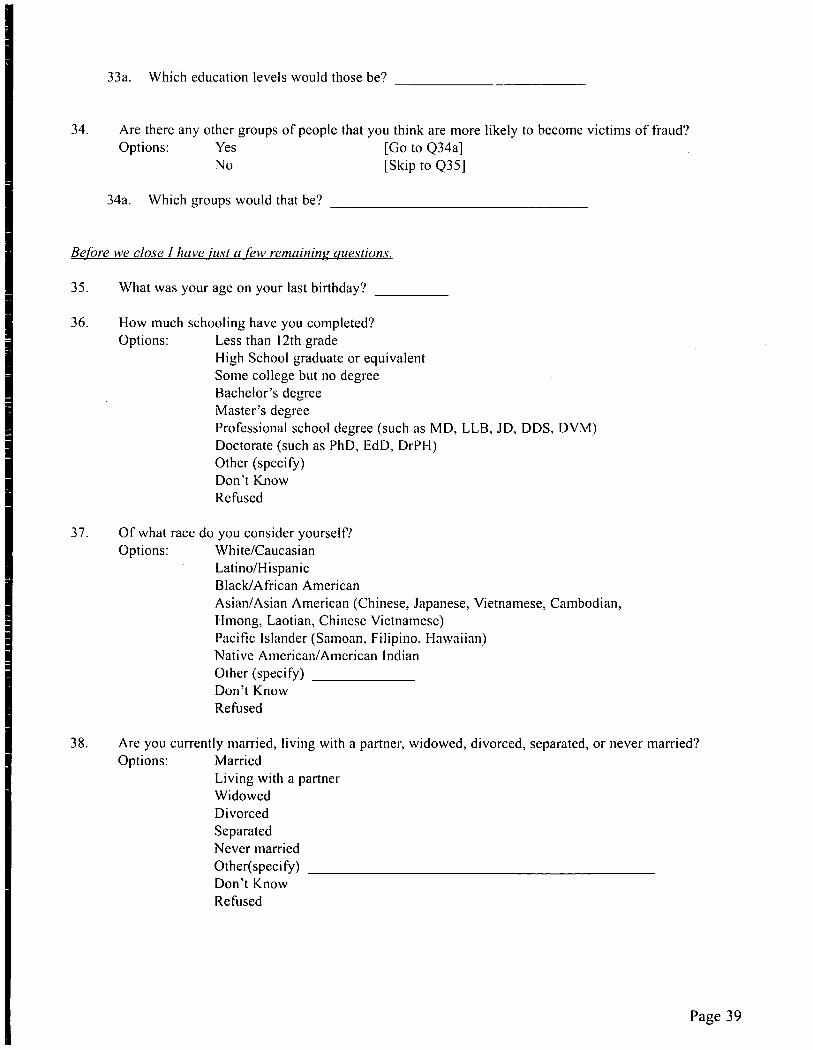
33a. Which education levels would those be?
34. Are there any other groups of people that you think are more likely to become victims of fraud? Options: Yes [Go to Q34a]
No [Skip to Q35]
34a. Which groups would that be?
Before we close I have just a [ew remaining questions.
35. What was your age on your last birthday?
36. How much schooling have you completed? Options: Less than 12th grade
High School graduate or equivalent Some college but no degree Bachelor's degree Master's degree Professional school degree (such as MD, LLB, JD, DDS, DVM) Doctorate (such as PhD, EdD, DrPH) Other (specify) Don't Know Refused
37. Of what race do you consider yourself'? Options: White/Caucasian
Latino/Hispanic Black/African American Asian/Asian American (Chinese, Japanese, Vietnamese, Cambodian, Hmong, Laotian, Chinese Vietnamese) Pacific Islander (Samoan~ Filipino, Hawaiian) Native American/Anlerican Indian Other (specify) Don't Know Refused
38. Are you currently married, living with a partner, widowed, divorced, separated, or never married? Options: Married
Living with a partner Widowed Divorced Separated Never married Other(specify) Don't Know Refused
Page 39
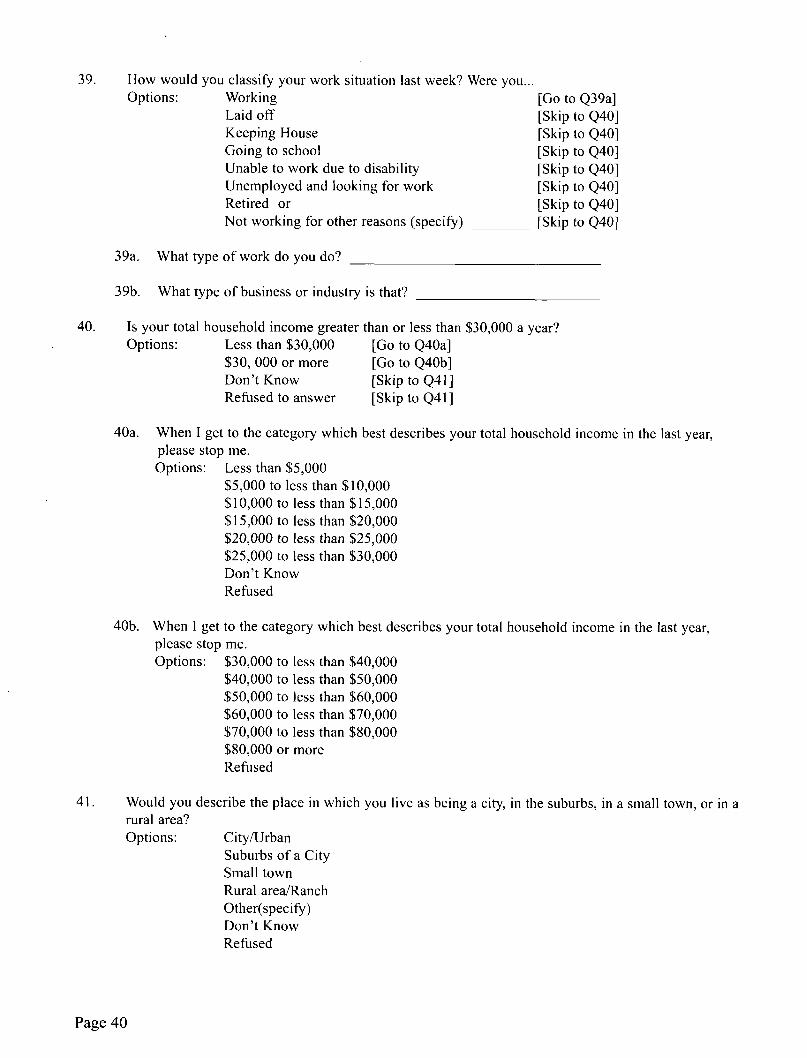
39.
40.
41.
How would you classify your work situation last week? Were you... Options: Working
Laid off Keeping House Going to school Unable to work due to disability Unemployed and looking for work Retired or Not working for other reasons (specify)
[Go to Q39a] [Skip to Q40] [Skip to Q40] [Skip to Q40] [Skip to Q40] [Skip to Q40] [Skip to Q40] [Skip to Q40]
39a. What type of work do you do?
39b. What type of business or industry is that?
Is your total household income greater than or less than $30,000 a year? Options: Less than $30,000 [Go to Q40a]
$30, 000 or more [Go to Q40b] Don't Know [Skip to Q41] Refused to answer [Skip to Q41]
40a. When I get to the category which best describes your total household income in the last year, please stop me. Options: Less than $5,000
$5,000 to less than $10,000 $10,000 to less than $15,000 $15,000 to less than $20,000 $20,000 to less than $25,000 $25,000 to less than $30,000 Don't Know Refused
40b. When I get to the category which best describes your total household income in the last year, please stop me. Options: $30,000 to less than $40,000
$40,000 to less than $50,000 $50,000 to less than $60,000 $60,000 to less than $70,000 $70,000 to less than $80,000 $80,000 or more Refused
Would you describe the place in which you live as being a city, in the suburbs, in a small town, or in a rural area? Options: City/Urban
Suburbs of a City Small town Rural area/Ranch Other(specify) Don't Know Refused
Page 40
42. Would you say that you are conservative,
43.
How would you characterize your views on SOCIAL issues? moderate, or liberal. Options: Conservative
Moderate Liberal Other (specify) Don't Know Refused
Have you ever sat on a jury in a case dealing with any type of fraud? Options: Yes
No Don't Know Refused
Page 41

Page 42
Issues of Nonresponse and Nonresponse Bias
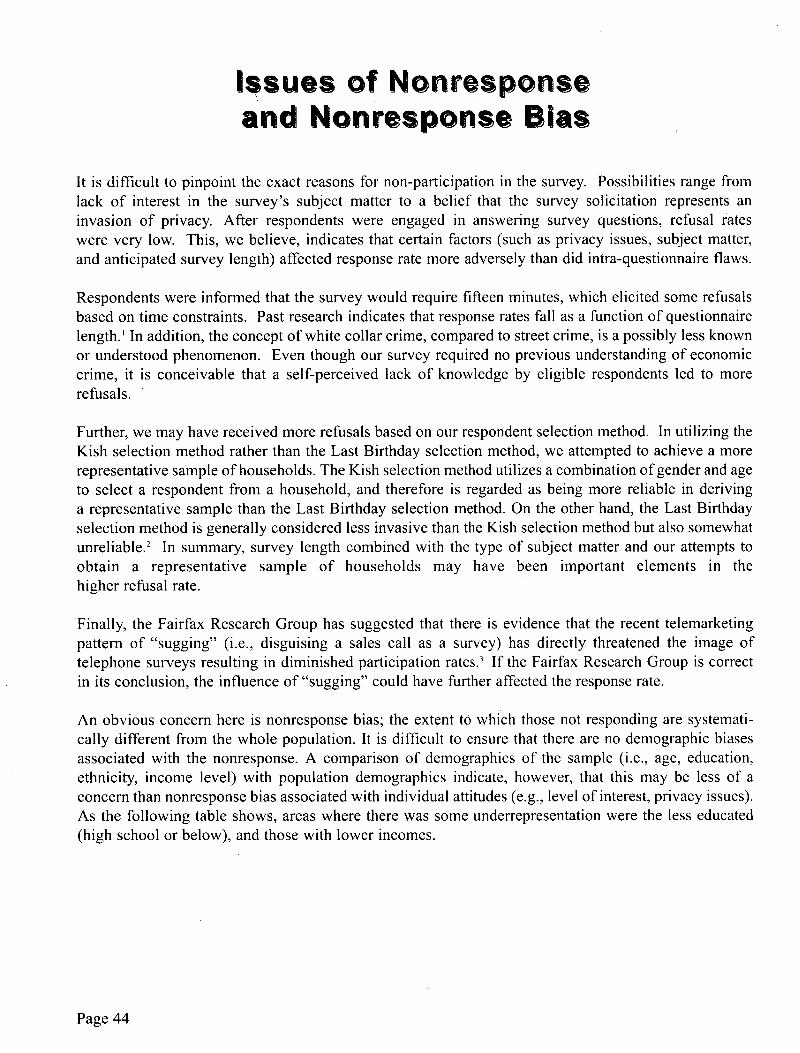
Issues of Nonresponse \
and Nonresponse Bias
It is difficult to pinpoint the exact reasons for non-participation in the survey. Possibilities range from lack of interest in the survey's subject matter to a belief that the survey solicitation represents an invasion of privacy. After respondents were engaged in answering survey questions, refusal rates were very low. This, we believe, indicates that certain factors (such as privacy issues, subject matter, and anticipated survey length) affected response rate more adversely than did intra-questionnaire flaws.
Respondents were informed that the survey would require fifteen minutes, which elicited some refusals based on time constraints. Past research indicates that response rates fall as a function of questionnaire length.' In addition, the concept of white collar crime, compared to street crime, is a possibly less known or understood phenomenon. Even though our survey required no previous understanding of economic crime, it is conceivable that a self-perceived lack of knowledge by eligible respondents led to more refusals.
Further, we may have received more refusals based on our respondent selection method. In utilizing the Kish selection method rather than the Last Birthday selection method, we attempted to achieve a more representative sample of households. The Kish selection method utilizes a combination of gender and age to select a respondent from a household, and therefore is regarded as being more reliable in deriving a representative sample than the Last Birthday selection method. On the other hand, the Last Birthday selection method is generally considered less invasive than the Kish selection method but also somewhat unreliable. 2 In summary, survey length combined with the type of subject matter and our attempts to obtain a representative sample of households may have been important elements in the higher refusal rate.
Finally, the Fairfax Research Group has suggested that there is evidence that the recent telemarketing pattern of "sugging" (i.e., disguising a sales call as a survey) has directly threatened the image of telephone surveys resulting in diminished participation rates. 3 If the Fairfax Research Group is correct in its conclusion, the influence of"sugging" could have further affected the response rate.
An obvious concern here is nonresponse bias; the extent tO which those not responding are systemati- cally different from the whole population. It is difficult to ensure that there are no demographic biases associated with the nonresponse. A comparison of demographics of the sample (i.e., age, education, ethnicity, income level) with population demographics indicate, however, that this may be less of a concern than nonresponse bias associated with individual attitudes (e.g., level of interest, privacy issues). As the following table shows, areas where there was some underrepresentation were the less educated (high school or below), and those with lower incomes.
Page 44
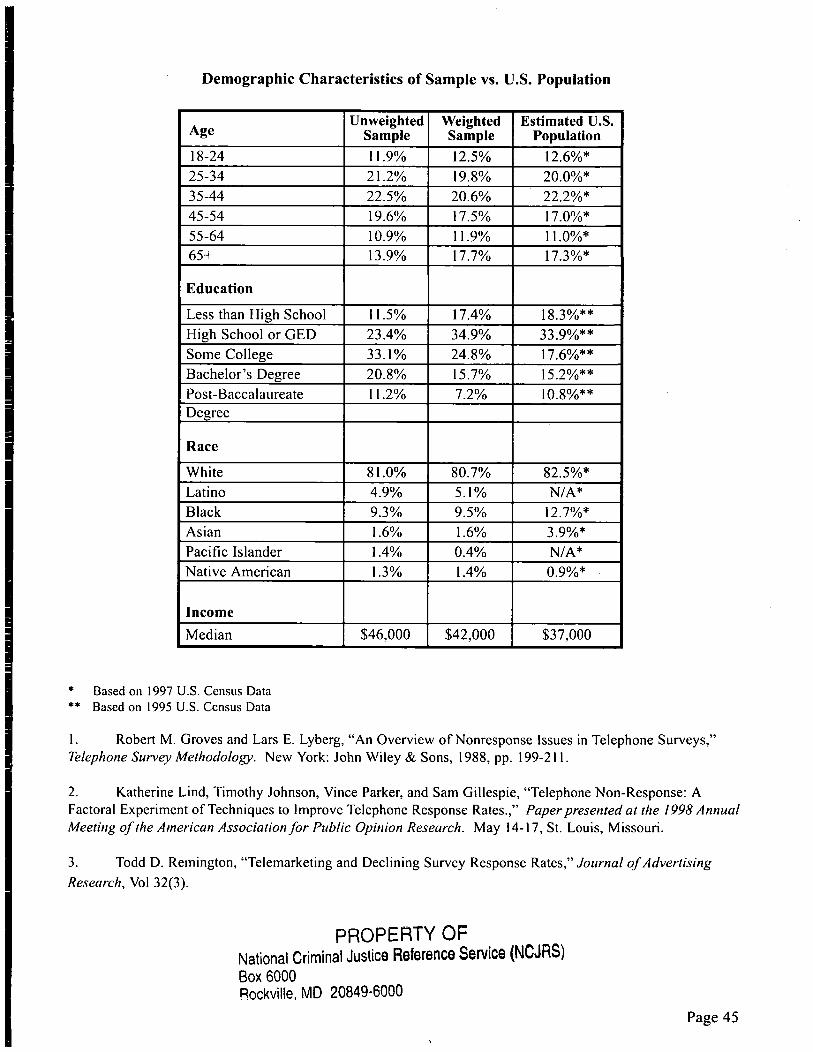
Demographic Characteristics of Sample vs. U.S. Population
Age Unweighted
Sample Weighted Sample
Estimated U.S. Population
18-24 11.9% 12.5% 12.6%*
25-34 21.2% 19.8% 20.0%* 35-44 22.5% 20.6% 22.2%*
45-54 19.6% 17.5% 17.0%* 55-64 10.9% 11.9% 11.0%* 65+ 13.9% 17.7% 17.3%*
Education
Less than High School 11.5% 17.4% 18.3%** High School or GED 23.4% 34.9% 33.9%**
Some College 33.1% 24.8% 17.6%** Bachelor's Degree 20.8% 15.7% 15.2%** Post-Baccalaureate 11.2% 7.2% ! 0.8%** Degree
Race
White 81.0% 80.7% 82.5%* Latino 4.9% 5. 1% N/A*
Black 9.3% 9.5% 12.7%* Asian 1.6% 1.6% 3.9%* Pacific Islander 1.4% 0.4% N/A* Native American 1.3% 1.4% 0.9%*
Income
Median $46,000 $42,000 $37,000
* Based on 1997 U.S. Census Data ** Based on 1995 U.S. Census Data
I. Robert M. Groves and Lars E. Lyberg, "An Overview of Nonresponse Issues in Telephone Surveys," Telephone Survey Methodology. New York: John Wiley & Sons, 1988, pp. 199-21 I.
2. Katherine Lind, Timothy Johnson, Vince Parker, and Sam Gillespie, "Telephone Non-Response: A Factoral Experiment of Techniques to Improve Telephone Response Rates.," Paper presented at the 1998 Annual Meeting of the American Association for Public Opinion Research. May 14-17, St. Louis, Missouri.
3. Todd D. Remington, "Telemarketing and Declining Survey Response Rates," Journal of Advertising Research, Vol 32(3).
PROPERTY OF National Criminal Justice Reference Service (NCJRS) Box 6000 Rockville, MD 20849-6000
Page 45


- . -:- .
L . , a , .
. . . . . . . . . ÷
q
I il-
i i i I'
: i l . i i
I 1-
't
" ' - I
National \Virile Collar Crime Cemcr 12 R o u s h D r i v e
M o r g ~ _ m l o w n . \ \ ! \ / 2 ( i 5 0