1999 National Gun Policy Survey of the National Opinion ...
80
1DWLRQDO*XQ3ROLF\6XUYH\ RIWKH1DWLRQDO2SLQLRQ5HVHDUFK&HQWHU 5HVHDUFK)LQGLQJV 7RP:6PLWK 1DWLRQDO2SLQLRQ5HVHDUFK&HQWHU 8QLYHUVLW\RI&KLFDJR
-
Upload
khangminh22 -
Category
Documents
-
view
2 -
download
0
Transcript of 1999 National Gun Policy Survey of the National Opinion ...

�����1DWLRQDO�*XQ�3ROLF\�6XUYH\RI�WKH�1DWLRQDO�2SLQLRQ�5HVHDUFK�&HQWHU�
5HVHDUFK�)LQGLQJV
�
7RP�:��6PLWK
1DWLRQDO�2SLQLRQ�5HVHDUFK�&HQWHU8QLYHUVLW\�RI�&KLFDJR

1999 National Gun Policy Surveyof the National Opinion Research Center:
Research Findings
Tom W. Smith
National Opinion Research CenterUniversity of Chicago
For Release July, 2000


�
(;(&87,9(�6800$5<
The public supports a wide range of policies designed to regulate firearms, promote gun safety, andkeep guns out of the hands of criminals.
� Regarding the general regulation of firearms, majorities back all measures except those that callfor the outright outlawing of guns or restricting them only to police officers and other authorizedpersons.
� Support for safety measures is even stronger, with large majorities consistently supportingalmost all safety-related policies, including (1) technological measures to make guns safer(childproofing, personalizing, magazine safeties, and load indicators), (2) tougher general safetystandards for the design and manufacture of guns, (3) mandatory safe-storage requirements, (4)the training of all gun owners, and (5) miscellaneous safety-promoting measures, such asholding manufacturers liable for defects in design and production.
� A consensus prevails both in that those convicted of various misdemeanors should be prohibitedfrom purchasing guns and that the illegal use of guns should be severely punished.
� To help deal with school shootings, the majority endorses prohibiting those under 18 years ofage from owning or using firearms, but most reject banning guns from all households withchildren under 18.
� People are ambivalent about cities suing gun manufacturers for the criminal misuse of firearms,with most people opposed to both such suits and laws that would forbid these suits.
� People back both restricting the import of firearms and applying the gun-safety standards thatexist for imported guns to domestically manufactured guns as well.
� Most people oppose permissive, shall-issue, concealed-carry laws.
Attitudes toward gun control are reasonably stable. In part, this is because gun control is a long-debated, political perennial. Also, the stability comes about because views on guns are often deeplyrooted, originating from childhood exposure to firearms and community ties to the gun culture. Eventhe Littleton, Colorado, shootings and other multi-murders did not change attitudes toward guns andgun control, although they did greatly heighten the salience of crime in general and gun violence inparticular.
Viewing the dynamics and politics of gun control indicates that the pro-gun-control side holdsseveral advantages.
� On two of three measures of the depth of opinions, those for more gun control have firmeropinions than those opposed to more regulation.

�
� Counter-arguments on two issues showed that opponents of gun control were more easilyswayed than were advocates.
� Pro-gun-control candidates have a voting edge over anti-gun control politicians.
� A greater number of people favor the more pro-gun-control position of the Democrats over themore anti-gun-control stance of the Republican party.
� By a small margin, there has been more pro-gun-control political action by and aimed at peoplethan anti-gun-control activity.
People are very divided on the advantages and disadvantages of having guns and whether gunsenhance or undermine personal safety.
� People split evenly on whether guns in the home reduce or increase safety (41% believe safervs. 43% less safe). However, when asked about six specific events that might occur if a gun waskept in the home, people thought that the negative occurrences (accidental shootings, domesticviolence, and worry over gun theft and misuse) were more likely than positive outcomes (lesschance of burglary, greater protection from home invaders, a greater sense of security).
� The public is also closely divided on whether more permissive concealed-carry laws enhancesafety (44%) or compromise it (45%). People, however, believe that businesses should be ableto prohibit even permit holders from bringing guns onto their premises and prefer to go to storesand other establishments that ban guns on their premises over those that allowed guns.
� Parents are very concerned about letting their child go to a household that contained a gun. Amajority of parents (70%) approve of a visit only if guns are both locked away and unloaded.Approval falls to 8% if the weapons are not locked away and are loaded.
� Most Americans do not own a gun for the purpose of protection, 60% do not have a gun in theirhome, and 23% have a gun but did not acquire it even partially for protection against crime.Only 17% have a gun obtained at least in part for protection. Likewise, only 10% of Americanshave carried a handgun away from home in the last year and just 6% have carried a weapon forthe purpose of self-protection.

�
,1752'8&7,21
Gun violence exacts a staggering toll on American society. Consider the following:
� The rate of gun deaths from homicides and suicides is much higher in the United States than inany other developed country in the world.33, 34, 41
� The disparity is particularly great in regard to children. The rate of firearm deaths to children14 years and under is 12-times greater in the United States than the average of 25 other high-income countries.13
� In 1994-1997, 32,500-39,500 deaths and 64,000-104,000 non-fatal injuries per annum werecaused by firearms.55, 65, 73, 99
� In recent years gunshots have been the second leading cause of deaths for people 10-24 yearsold and the third leading cause of death for persons 25-34 years old.11, 55
� The death rate from firearms in 1997 for all males 15-24 years of age was 38.9 deaths per100,000 and for black males 15-24 years old, it was 119.9 per 100,000.55
� Annually between 1993 and 1998 65-70% of all murders were committed with a firearm, andfrom 1994 to 1998, 93% of law enforcement officers feloniously killed died from gunshots.4
To explore public opinion on measures dealing with the gun violence problem, this report examines
� The public’s views on the regulation of firearms, including attitudes toward (a) general gun-control measures, (b) measures aimed at promoting gun safety, (c) guns and criminals,(d) violence, guns, and schools, (e) parallels between regulation of tobacco and firearms,(f) imports and firearms, (g) gun-carrying laws and business practices, and (h) the efficacy ofgun control in reducing crime;
� How attitudes have changed over time, with a special focus on the impact of the Littletonshootings;
� Dynamics of public opinion on gun control;
� Gun ownership and use, including (a) prevalence and distribution of firearms, (b) practice ofcarrying weapons away from home, and (c) trends in gun ownership;
� Connection between gun ownership and attitudes toward firearms;
� Socio-demographic differences in attitudes toward firearms, including differences by (a) gender,(b) place of residence, and (c) partisan and ideological preference;

�
� Crime concerns and gun control; and
� Safety issues related to firearms, including (a) the perceived safety that guns provide,(b) concerns about being around guns, (c) children and guns, and (d) buying personalizedhandguns.
This report primarily utilizes data from the (1) 1999 National Gun Policy Survey (NGPS-99);(2) 1998 National Gun Policy Survey (NGPS-98); (3) 1997-1998 National Gun Policy Survey(NGPS-97); (4) 1996 National Gun Policy Survey (NGPS-96); and (5) 1972-1998 General SocialSurvey (GSS) conducted by the National Opinion Research Center (NORC) at the University ofChicago.12, 77-79 The NGPSs were designed in collaboration with the Center for Gun Policy andResearch of Johns Hopkins University with funding from the Joyce Foundation of Chicago.Supplemental data from various state and national polls were also employed and are cited whenused.
The NGPS-96, NGPS-97, NGPS-98, and NGPS-99 are national, random-digit-dial, telephonesurveys of adults living in households with phones. Data were collected from September 13 toNovember 11, 1996; from November 8, 1997 to January 27, 1998; from September 10 toNovember 15, 1998; and from September 9 to December 4, 1999. Data analysis used a post-stratification weight that adjusted for age, gender, race, education, and region, according to UnitedStates Census figures. Full technical details on the NGPSs appear elsewhere. 22, 42, 43, 96 The GSSsare full-probability, in-person interviews of adults living in households in the United States. Thelatest data were collected in February to May 1998. Full technical details appear elsewhere.12
7+(�5(*8/$7,21�2)�),5($506
Public support for the regulation of firearms is high, deep, and widespread (Refs. 1-3, 6, 9, 14, 17,23-24, 26, 31-32, 35-37, 52, 54, 67-69, 72, 74, 77-80, 84-85, 87, 89, 91, 97-98). Large majoritiesback most general measures for controlling guns, policies to increase gun safety, laws to restrictcriminals from acquiring firearms, and measures to reduce school violence. In general, peopleendorse all measures to regulate guns, increase gun safety, and reduce gun violence, except forpolicies that entail a general prohibition on owning guns.
General Gun-Control Measures
As Table 1 indicates, majorities support 16 of 19 general measures to regulate guns:
� 90% favor requiring that serial numbers on guns be tamper resistant;
� 82% support requiring a police permit before a gun can be purchased;

A Support for a ban on manufacturing increases from 54% to 58% when the descriptor “often known as Saturdaynight specials” is added. See Table 1 for full wordings. The difference is not statistically significant at the .05 level.For the meaning and use of the term “Saturday night special,” see ref. 66.
�
� 81% want both a background check and a five-day waiting period before a handgun may bepurchased;
� 80% endorse the mandatory registration of handguns and 61% also want mandatory registrationof longguns (rifles and shotguns);
� 80% also endorse restricting handgun purchases to those 21 and older;
� 79% favor requiring background checks for sales between private individuals;
� 73% believe that the sale of handgun ammunition should be regulated in the same way as thesale of handguns;
� 70% agree that “the government should do everything it can to keep handguns out of the handsof criminals, even if it means that it will be harder for law-abiding citizens to purchasehandguns;”
� 71% are willing to pay more taxes to increase police patrols to reduce gun injuries;
� 69% want imported guns that cannot be bought by citizens in their country of origin to beexcluded from the American market, and 55% favor banning the importation of all civilianfirearms;
� 67% want to ban the sale of all high-capacity gun magazines;
� 66% back the idea that all handgun owners should at least be licensed and trained in the use oftheir weapons;
� 56% favor allowing concealed-carry permits only for those with special needs, such as privatedetectives; and
� 54-58% want a ban on the domestic manufacture of “small, easily concealed, and inexpensivehandguns.”A
A narrow plurality of 45% believe that laws allowing any adult who passes a criminal backgroundcheck and a gun-safety course to carry a concealed gun in public makes things less safe; 44% feelthat such permissive or shall-issue, concealed-carrying laws make things safer (9% answered neithermore nor less safe and 3% don’t know/no answer).

B There are 19 separate percentages in Table 1, but two come from different recodes of the same item (see note ain Table 1). For this item with two entries, we counted only those favoring a total ban on handguns as pro-guncontrol. Also eliminated from the scale were the items that appeared only on the NGPS-97 (2 items), NGPS-98 (4),and GSS-98 (1). See Table 1 for details.
�
Measures that call for the general prohibition of guns are opposed by a majority: only 39% supportrestricting the possession of handguns to “the police and other authorized persons” and only 13%want a “total ban on handguns.”
To examine people’s summary views on general gun-control measures, a scale was devised such thatsomeone who rejected all 11 of the measures in Table 1 scored zero and someone who accepted all11 measures to regulate firearms scored 11.B This scale shows that on average, people approved of7.0 of the 11 general measures to regulate firearms.
Safety-Related, Gun-Control Measures
Support for safety-related, gun-control measures is even stronger than for the general policies.Majorities back 14 of 16 items in Table 2:
� 94% favor having handguns manufactured in the United States meet the same safety and qualitystandards that imported handguns must meet, and 86% endorse this position even if it wouldmake handguns more expensive;
� 86% also back having all new handguns designed so that they “cannot be fired by a youngchild’s small hands;”
� 85% support mandatory “gun-safety training” before a person can buy a gun, 68% want allcurrent gun owners to take such a course, and 49% feel that if current owners would not take thecourse, then they should be required to turn in their weapons;
� 82% support a requirement that pistols have magazine safeties;
� 79% favor making manufacturers liable for any injuries that result from defects in the design ormanufacturing of guns;
� 76% want owners to be liable if a gun is not stored properly and is misused by a child;
� 73-74% back the requirements that guns be stored unloaded, that trigger locks must be used, andthat guns be kept in locked boxes or cabinets;
� 73% favor having all new handguns come with a load indicator to show if the weapon is loaded.
� 66% want the federal government to regulate the safety design of guns;

C There are 16 questions in Table 2, but one is a sub-question of another item. These two items (the first twolisted in the question wording section of Table 2) were combined into a single item to construct the gun-safetyscale. Also, three items appeared only on NGPS-97 and cannot be used in the scale. Finally, the item on paying forenforcing a personalized gun law is part of an experiment (reported below) in which the tax rates were varied, so itcannot be utilized.
D The proposed criminal background check would not be covered by the existing “instant check” system becausethe crimes named are misdemeanors that are not regularly included in this database.
�
� 63% back having all new handguns be personalized so that only the owner of a weapon will beable to fire the gun, and 34% would pay $50 in taxes to enforce a new law that only personalizedguns could be sold.
In sum, substantial majorities consistently support all safety-related policies including:(1) technological measures to make guns safer (childproofing, personalizing, magazine safeties, andload indicators); (2) tougher general safety standards for the design and manufacture of guns;(3) mandatory safe-storage requirements; (4) training of all gun owners; and (5) such miscellaneoussafety-promoting measures as holding manufacturers liable for defects in design and production.
To look at people’s overall view of measures to promote safety, a scale was devised ranging fromzero for someone who opposed all 11 items in Table 2 to a score of 11 for someone who backedeach proposal.C On average, people supported 8.1 of the 11 safety-related measures.
Guns and Criminals
People want to keep guns out of the hands of criminals (Table 3) and to punish the criminal misuseof guns (Table 4). State laws typically restrict convicted felons from legally purchasing guns, butthe majority of states allow most of those convicted of misdemeanors to buy guns. However, thepublic is much less willing to let those convicted of a variety of less serious crimes purchasefirearms (Table 3). Ninety percent want to prevent those convicted of domestic violence frombuying guns and disapproval is 84% for those guilty of being drunk and disorderly, 83% for thosewho illegally carried a concealed weapon without a permit, 82% for simple assault, and 67% forthose who drove a car while intoxicated. In 1999, when these four types of misdemeanors wereasked about, 56% wanted to prohibit all four types of criminals from being able to buy a gun or, onaverage, people supported prohibition for 3.2 of these 4 crimes.
Moreover, people support concrete measures to ensure that those convicted of such crimes areprevented from obtaining handguns. A screening procedure, under which there would be a two-weekwaiting period and a $25 processing fee, for all handgun purchases to allow criminal backgroundchecks is backed by 79%.D
People believe that the criminal misuse of firearms is a serious matter that deserves toughpunishment (Table 4). Eighty-two percent agree that “the illegal possession of a gun should betreated as a serious crime like a robbery or burglary” and 78% think that “if a gun is used during a

E A Gallup poll71 on April 21, 1999, judged the following measures as being very effective “as a way to stopviolence in high schools and middle schools”: stricter gun control laws for teenagers (62%), increased counselingfor teenagers (60%), metal detectors in schools (53%), stricter regulation of violence on TV and in movies (52%),restrictions on what is available to teenagers on the internet (50%), holding parents legally responsible for crimestheir children commit with their parents’ guns (47%), school dress codes (36%), random body searches of students(34%), and stiffer penalties for parents whose children commit crimes (34%).
F The following were blamed a great deal for “causing shootings like the one in Littleton”: availability of guns(60%), parents (51%), TV programs, movies, and music (49%), social pressures on youth (43%), media coverage ofsimilar incidents (34%), the internet (34%), and schools (11%).71 See also ref. 62.
�
crime, the sentence should be twice as long.” (67% agree with both statements and only 5% disagreewith both.)
The concern about controlling the criminal misuse of guns is so strong that 70% agree “thegovernment should do everything it can to keep handguns out of the hands of criminals, even if itmeans that it will be harder for law-abiding citizens to purchase handguns” (Table 1).
Finally, several of the other measures cited in Table 1, such as mandatory background checks forpurchases of guns and ammunition, are based on the desire to restrict the access of criminals to gunsand the strong support for these measures reflects, in part, the public’s desire to deny guns tocriminals.
Violence, Guns, and Schools
In the aftermath of the school shootings at Littleton, Colorado, and other communities, peoplesupport a series of measures to reduce school violence (Table 5). Eighty-one percent favor expellingstudents “making threats, acting violently, or being mentally unstable,” 74% endorse having metaldetectors and security guards in all middle and high schools, 68% support “prohibiting those under18 from owning or using firearms,” and 29% are willing to go as far as “prohibiting guns inhouseholds with anyone under the age of 18.”E People also mentioned the “availability of guns” asthe factor most to blame for the shootings.F
People want to focus their anti-school-violence efforts at protecting schools by removing dangerousstudents and enhancing security measures and by restricting youth access to firearms. Eighty percentwould restrict handgun purchases to those 21 or older (Table 1), and 68% would deny the ownershipand use of firearms to those under age 18 (Table 5). But the public does not favor banning guns fromhouseholds with youths. Instead it favors measures requiring the safe and secure storage of guns,as indicated in Table 2.
Regulating Firearms Like Tobacco
Several cities have sued the firearm industry, attempting to hold gun manufacturers and/or sellersliable for the injuries inflicted by their weapons. In part, these suits are inspired by the success oflitigation against the tobacco industry.7, 28, 48, 86 So far the public is not willing to apply this legal

G The full wording is “All but one of the major American gun manufacturers are private companies that do notfile public reports about their gun business. Foreign companies that export guns to America also do not file publicreports. In the last several years, Congress has conducted several major hearings to investigate the tobacco industry,but Congress has never held similar hearings on the firearms industry. Should or should not Congress hold hearingsto investigate the practices of the gun industry?”
H The item read “Would you be more or less likely to go to those businesses (i.e. move theaters, stores,restaurants) that prohibit people from carrying concealed weapons on the premises?”
�
theory to firearms. Only 40% favor their state or city “suing gun manufacturers for the medical costsof gun victims and gun injuries,” 54% are opposed, and 3% are unsure or don’t know. However, thepublic is also opposed to passing laws barring cities from suing gun manufacturers. Thirty-ninepercent back the outlawing of such suits, 56% oppose these efforts, and 5% are unsure or undecided.
People however are willing to take another page from the tobacco-industry book—74.5% thinkCongress should hold hearings to investigate the practices of the gun industry similar to the hearingsthey held about the tobacco industry; 23% are opposed and 3% are unsure.G
Imports and Firearms
As indicated in Tables 1 and 2, people want to tighten firearms regulations in relation to importedguns. People want to limit the importation of guns (Table 1): 55% want to prohibit the importationof non-military weapons to the United States and 69% want to ban the import of firearms that cannotbe sold to citizens in their country of origin. Considered together this means that 53% want to banimports in general, 15% want to allow only imports that can be sold to citizens in their country oforigin, 27% want no import ban, and 6% are unsure or give other answers.
The public wants domestic guns to follow safety standards now imposed on imported weapons(Table 2): 94% think that handguns made in the United States should meet the same “safety andquality standards” that imports must meet. Eighty-six percent feel these standards should be meteven if that makes handguns more expensive.
Gun-Carrying Laws and Business Practices
Most people are concerned about the carrying of concealed weapons and laws that would encouragethe practice: 56% want to restrict concealed-carry permits to those with special needs, 41% favorpermissive, shall-issue laws, and 3% are unsure (see also ref. 1). Also, 76% believe that “publicplaces, such as stores, movies theaters, and restaurants” should be allowed to prohibit people frombringing guns onto their premises. Putting these two items together shows that 50% want to restrictpermits to those with special needs and allow businesses to exclude even this group from bringingtheir guns along, and only 14% want the permissive issuing of permits and to deny businesses theoption of excluding concealed weapons from their premises. In addition, 67% would be more likelyto patronize businesses that did prohibit concealed guns.H

��
Even those who favor permissive, concealed-carry laws nevertheless have concerns or reservationsabout the actual presence of concealed weapons. Most of those for easy access to conceal-carrypermits also favor allowing businesses to prohibit guns (57.5%); 53% would be more willing to goto a business that prohibited guns and only 17% would be less likely to go there (30% said it wouldnot make a difference or they are unsure).
The Efficacy of Gun Control in Reducing Crime
People’s opinions are quite spread out regarding “how helpful...stricter gun-control measures[would] be to reducing violent crime”: 18% said extremely helpful, 18% very helpful, 30%somewhat helpful, 14% a little helpful, and 19% not helpful. Exposure to guns strongly influencesone’s assessment of the usefulness of gun-control laws in reducing crime. Among those personallyowning guns, 21% see gun-control laws as highly (extremely+very) helpful in reducing violence.Among those living in a household with a gun, 25% view such laws as highly helpful. For those withno guns, 46.5% see gun-control measures as helping to reduce violent crime. Of those who everhave bought a handgun, 22% think gun-control laws would be highly helpful, as compared to 40.5%of those who never bought a handgun.
Also, those who see the presence of guns as increasing safety are less sanguine about the impact oflaws on violent crime. Among those believing that guns make homes safer, 26% think that gun-control regulations would be highly helpful in reducing violence as opposed to 47% of those whofeel that guns make homes less safe. Likewise, 33% of those thinking that permissive, concealed-carry laws improve safety believe gun-control laws would be highly helpful vs. 42% of those whosee easier access to concealed-carry permits as making things less safe.
The perceived helpfulness of stricter, gun-control measures in controlling violent crime is stronglyrelated to support for such laws. Those judging such laws as extremely helpful back 8.3 measureson the general firearms-regulation scale. Those saying such laws would be very helpful back 8.2measures; somewhat helpful, 7.5 measures; a little helpful, 6.4 measures; and as not helpful, 4.5measures. Likewise, if support for stricter laws is correlated with backing for the gun-safety scale,those saying such laws would be extremely helpful support 9.6 measures; very helpful, 9.1measures; somewhat helpful, 8.7 measures; a little helpful, 7.0; and not helpful, 5.5 measures.Similarly, correlation of the deny-guns-to-criminals scale with the helpfulness of stricter gun-controllaws is as follows: extremely helpful, 3.6 measures; very helpful, 3.5 measures; somewhat helpful,3.4 measures; a little helpful, 2.9 measures, and not helpful, 2.5 measures.

I “Apparent” is added because in three of these cases the decline was debatable. Support for the mandatoryregistration of handguns did drop by 1.3 percentage points, but opposition fell by 0.4 percentage points, with theonly gain being a rise of 1.7 percentage points in don’t knows. Also, support for childproofing declined by aminuscule 0.2 percentage point, but this decline consisted of a gain of 6.6 percentage points in those stronglyfavoring and a loss of 6.8 percentage points among those only favoring childproofing. Thus, support marginallydeclined while it significantly strengthened within the favoring side. In addition, those seeing handguns in the homeas making things less safe also dropped by 0.2 percentage points, but the main change was moving from the endstoward the middle. The percent saying it was much safer or much less safe dropped from 30.0% to 21.7% and thepercent saying it was just safer or less safe or depends rose from 66.3% to 76.0%. Thus, an adjusted tally wouldshow one no change, three mixed changes, two gains, and three losses in support.
��
75(1'6�,1�$77,78'(6�72:$5'�7+(�5(*8/$7,21�2)�),5($506
Gun control is a much discussed issue that has been debated at the national level since the mid-sixties. Thus, public opinion on gun control tends to be mature and not subject to large or suddenfluctuations or shifts (Table 6). Moreover, what change has occurred has tended to be movementback-and-forth, rather than clear, long-term trends in one direction.
� For the 13 general regulation items that were repeated between 1996 and 1999, one item showedno statistically significant change, four had gains in support, and eight evidenced decreases. Theaverage change across items from the first to the most recent year was –3.0 percentage points.
� For the 12 safety-related items, there were three trends with no statistically significant change,one increase in support, and eight declines. The average change across years was –3.6percentage points.
� Of the five items relating to criminal prohibition asked over time, one did not show anystatistically significant change, three had a rise in support, and one had less support. The averagechange was –0.3 percentage point.
� Two items on illegal gun use both showed decline in support for gun-control measures. Theaverage change for these items was –3.9 percentage points.
� For four miscellaneous measures, no statistically significant change occurred for one series, oneincreased, and two decreased. The average change was –0.9 percentage point.
Overall, of the 36 time series, support for gun control and related measures did not change for six,nine gained support, and 21 lost support. The average change from first to most recent time pointwas –2.6 percentage points. For the 14 trends that have a time point in 1996 and 1999, nostatistically significant differences occurred in six cases, two gained, and six had apparent declines.I
Among these mixed and moderate changes is a pattern across the years. Of the 13 items asked ineach of the four NGPSs, there was no net change from 1996 to 1997, with six decreases and seven

J These figures refer only to the direction of changes as reported in Table 6, not to whether the changes werestatistically significant.
��
gains in support; a general rise in support from 1997 to 1998 with 3 declines and 10 increases; andan almost uniform fall from 1998 to 1999, with lower support for 12 of 13 items.J
The general decline in support from 1998 to 1999 was surprising given the Littleton shootings onApril 20, 1999, about mid-way between the 1998 and 1999 NGPSs, and the resulting media andpolitical attention given to this and other high-profile, multi-murders (e.g., the Atlanta stockbrokerand the Fort Worth church shootings). Consequently a closer look at attitudes toward gun controlbefore and after Littleton was conducted.
The Littleton shootings attracted a tremendous amount of media and public attention. According tothe Tyndall Report,90 the Columbine High School killings had the third highest number of minutesin evening network news coverage, behind only the war in Kosovo and the Clinton scandal andimpeachment. If anything, the public’s attention was even greater. The Pew Research Center for thePeople and the Press 70 found Littleton to be the third top news event of the 1990s, with 68% of thepublic reporting that they were following the story “very closely,” behind only the Rodney Kingverdict in 1992 (70%) and the crash of TWA flight 800 in 1996 (69%).
However, the idea that the shootings created a surge of support for gun control is not supported bythe evidence. Of the 34 items that were asked in both the 1998 and 1999 NGPSs (Table 6), sixshowed no statistically significant change, two had increases in support, and 26 had decreases inapproval. Nine time series from other sources that measured attitudes toward or beliefs about guncontrol before and after Littleton (Table 7) showed a very mixed response, even looking only at theshort-term impact. Four series showed an increase, four a decrease, and one no change. When thechanges over a somewhat longer time frame are considered, only two gained in support, fourdropped, and three cases showed no change. Likewise, short post-Littleton trends of greater supportin three items showed declines. Thus, there is little indication that Littleton generally increasedsupport for gun control in the short term and no sign that it did so after about six months.18, 59-63
What Littleton did do was increase the salience and importance of crime in general and gun violencein particular in the public’s mind. As Table 8 indicates, in the immediate aftermath of the shootings,mentions of crime in general and gun violence in particular as the most important problems facingthe country and as the matters the government should most address grew several-fold.
Attitudes toward the regulation of firearms have shown great stability over the last 40 years. Exceptfor a period in the late 1980s and early 1990s, when support for gun-control measures rosemoderately, attitudes generally have been stable.77, 80, 85 In the late 1990s, support has shown onlymoderate swings, up a bit in 1998 and down a little in 1999. The stability of these attitudes comesfrom two causes. First, gun control has been a long-debated issue that is familiar to most people andhas been long-discussed in the political arena. Second, attitudes toward guns are shaped by one’sprior experience with firearms, especially by exposure to guns while growing up and by theprominence of the gun culture in one’s local community. These formative experiences tend to fixpeople’s attitudes toward guns and gun control. Even a tragedy as great and shocking as the Littleton

��
shootings did little to change people’s opinions. However, Littleton did bring gun control to the topof people’s minds and notably advance its place on the political agenda.8, 10, 15, 47, 57
7+(�'<1$0,&6�2)�38%/,&�23,1,21�21�*81�&21752/
Public opinion may consist of stable, well-founded attitudes based on considerable information anddeliberation or labile expressions that have little content or consequence, what Phil Converse hascalled “non-attitudes.” To really understand public opinion on an issue, it is necessary to considernot only the direction of opinion, but what weight or substance exists behind the expressed attitudes.
One way to assess the lability of public opinion is to ask people to evaluate their own opinions alongseveral non-affective dimensions.75 In this survey, after having been asked most of the attitude itemsabout firearms, people were asked three questions about their attitudes on this topic:
� “How important is the gun-control issue to you—would you say it is one of the most important,important, not very important, or not at all important?”;
� “How much information do you have about the gun control issue? Do you have all theinformation you need, most of the information, some information, or very little information?”;
� “How firm are you about your opinion on gun control—would you say you are very likely tochange your opinion, somewhat likely to change, somewhat unlikely to change, or very unlikelyto change?”.
Most people said that gun control was one of the most important issues (26%) or an important issue(57%), that they were very unlikely to change their opinion (57%) or somewhat unlikely (25%), butthat they had little (33%) or only some (36%) of the information they needed. People who considerthat an issue is important, who say they are unlikely to change their opinion, and who feel they havethe information they need, have well-organized opinions that tend to remain stable over time andare consistently associated with opinions on related topics.75
To see how these indicators of the quality and rootedness of opinions were related to a respondent’ssubstantive position on gun control, the three gun scales were recoded into pro-, moderate, and anti-gun-control groups. On the general gun-control, gun-safety, and denying-guns-to-criminals scales,those who were for gun control were the most likely to consider the issue as one of the mostimportant and to be very unlikely to consider changing their opinion. For example, on the generalscale, 55% of those opposed to gun control were very unlikely to change, as were 52% of those inthe middle, and 67% of those for gun control (prob.=.000), and on the gun-safety scale, 20% in theanti-gun-control camp, 27% in the middle, and 31% on the pro-gun-control side rated the issue asamong the most important (prob.=.000). On the information scale, the pattern is reversed, with thoseopposed to gun control on all three scales being more likely to say they had the information they

K This is not to say that this side is actually better informed, only that they believe they are. A test of knowledgeabout guns showed that those with anti-gun-control positions were less knowledgeable than those for gun control.79
��
needed. For example, of those less in favor of denying guns to criminals, 22% said they had all theinformation they needed, as did 11% in the middle, and 8.5% on the pro-gun-control side(prob.=.000).K This pattern is somewhat unusual since these three measures would usually all alignin the same direction. While the picture is mixed, the results indicate that pro-gun-control opinionsare at least as firmly held as anti-gun-control sentiments.
Another test of the mettle of public opinion toward gun control comes from two, counter-arguingexperiments. Counter-arguing is a technique in which people are asked their opinion on a topic andthen are given a follow-up question that raises an argument counter to the position they expressedin the initial question. The purpose of counter-arguing is to see which side is more fixed orunswayable in its position. In the first test people were asked whether they were for or against themandatory registration of handguns (Table 1).
� Those who favored mandatory registration of handguns then were asked, “This would mean thatmillions of law-abiding citizens who have owned handguns for years would have to report theirweapons to the government. Taking this into consideration, do you favor or oppose themandatory registration of handguns and pistols?”
� Those who opposed mandatory registration of handguns were asked, “A number of lawenforcement organizations favor the mandatory registration of handguns to help them trace gunsused in crimes and to restrict the illegal ownership and criminal misuse of handguns. Taking thisinto consideration, do you favor or oppose the mandatory registration of handguns and pistols?”
Of those initially in favor of handgun registration, 84% remained in favor after hearing the counter-arguing, follow-up question (2% moved to don’t know and 14% switched sides). Of those initiallyopposed to handgun registration, 69% continued to oppose it after hearing the counter-arguing item(0.5% moved to don’t know and 30% reversed their opinion).
The second set of counter-arguing items followed the item on whether any adult who has passed acriminal background check and taken a gun-safety course should be issued a concealed-carryingpermit or whether concealed carrying should be restricted only to those with special needs (Table 1).
� Those favoring the special-needs-only provisions were asked, “This would mean that most law-abiding people could not carry concealed handguns even if they thought they needed to for self-protection. Taking this into consideration, should licenses to allow people to carry firearms beissued to any adult who has passed a criminal background check and a gun-safety course, or onlyto people with a special need to carry a concealed gun, such as private detectives?”
� Those who favored the permissive or shall-issue position were asked, “This would mean thatanyone with a concealed-carry permit could bring handguns into stores and malls, restaurantsand bars, and other public places. Taking this into consideration, should licenses to allow peopleto carry firearms be issued to any adult who has passed a criminal background check and a gun-

��
safety course, or only to people with a special need to carry a concealed gun, such as privatedetectives?”
Of those initially in favor of restricting concealed carrying permits to those with special needs, 82%remained in favor after hearing the counter-arguing, follow-up question (3.5% moved to don’t knowand 15% switched sides). Of those initially in favor of the more permissive issuing of concealed-carry permits, 61% continued to favor it after hearing the counter-arguing item (9% moved to don’tknow and 30% reversed their opinion). Thus, on both counter-arguing items gun-control advocateswere more likely than opponents to stay with their position after hearing a reason for changing it.
In sum, the counter-arguing experiments and, to a lesser extent, the measures of opinioncrystallization indicate that pro-control attitudes are firmer and more anchored than are anti-controlpositions.
*81�2:1(56+,3�$1'�86(
The Prevalence and Distribution of Firearms
The personal ownership of firearms in the United States is probably more widespread than in anyother developed nation in the world.34 As Table 9A indicates, about 40% of U.S. households havea gun and 22% contain a handgun. Longguns are more common than handguns, with 17% ofhouseholds having only longguns and 6% just handguns. In addition, 18% of households have bothlongguns and handguns. Of the respondents, 27% personally own a gun (as opposed to merely livingin a household with a gun) and 17% personally own a handgun. Also, 21% have bought a handgun.Looking at both handgun purchases and the possession of handguns indicates that 29% of adultshave had contact with handguns (14% have both bought a handgun and have a handgun in theirhousehold; 8% did not buy, but live with a handgun; and 7% have purchased, but do not currently,possess a handgun).
Gun ownership is concentrated among certain socio-demographics groups (Table 9B). The profileof gun owners is as follows:
� Both household and personal ownership is greater among men than women. (See later sectionfor details.)
� Ownership is lowest in large cities and greatest in rural areas. Likewise it is lowest in the moreurban Northeast and higher in more rural regions. (Details in later section.)
� The married are most likely to have guns in general, with the never married the least likely tohave a weapon.

L On the NGPS-97 the rate of carrying guns could be estimated from two items. First, as part of an anti-crimebattery78 11% report that they “carried a gun away from home” during the last year to protect themselves fromcrime. Second, as part of a series on gun carrying per se, 12% said they carried a handgun away from home eitheron their person or in their car or truck during the last year. Comparing these similar, but not matching, itemsindicates that 7% said they carried a gun on both questions and 16% to one or the other question. These can beconsidered as low and high estimates of the annual incidence of carrying guns away from home. The items differ inthat the general protection item includes all guns, but only for the purpose of protection, and the latter item includesonly handguns, but for all purposes, and it is restricted to people currently living in a household with a firearm.Only the second item appears on NGPS-99. See also the Oregon estimates in ref. 58 and national figures in ref. 38.
M For gun carrying by youths see ref. 30.
��
� Gun ownership varies little by educational level.
� Gun ownership initially increases with household income, but then falls off somewhat afterincome exceeds $60,000.
� Gun ownership is highest for the middle-aged, especially those aged 50-64 years. Adults under30 and over 65 are less likely to own guns. The decline among the over-65 age group is partlythe result of the greater proportion of women among the elderly. The lower levels amongyounger adults is partly due to the decline in hunting over the last 25 years.
� Households with 0-1 children under 18 years are somewhat, but not significantly, more likelyto contain guns than households with 2 or more children. (The higher ownership among thosewith 4+ children is based on a small number of cases and is not borne out by research from prioryears.79
� Gun ownership is greater among Republicans and conservatives, lowest among Democrats andliberals, and intermediate for Independents and moderates. (Details discussed below.)
Gun ownership is appreciable among virtually all segments of society, but is highest among socialgroups connected to America’s traditional gun culture and to hunting in particular. This makes oldermen living in rural areas the mostly likely to both have guns in their households and to personallyown a firearm. Women in urban areas and with low incomes are least likely to possess firearms.
Carrying Firearms Away from Home
While about 40% of households contain a gun and 22% have a handgun, only about 10% of adultshave carried a handgun away from home during the last year.L Handgun carrying appears to bepretty stable over time, with 12% reporting carrying in 1997-1998, 9% in 1998, and 10% in 1999.Eighty-six percent of those who carry a gun away from home at least sometimes have it with themin their car or truck. Even among residents of gun-owning households, carrying handguns away fromhome is fairly uncommon, with only 25.5% having done so in the last year.M

N The quantity of new handguns (domestic manufacturing plus net imports) increased in the 1980s and early1990s, then declined.64
��
People carry handguns away from home for various reasons. The most common reason (66% ofthose carrying a gun) was going to a firing range or for target practice. This was followed bypersonal protection (63%), hunting (38%), work-related (17%), and other (8%). Many people carrieda handgun for more than one reason, with people on average mentioning two reasons. Amonghandgun carriers, 51% cited both protection and another reason, 32% mentioned only other reasons,and 17% gave protection as their only reason.
About half (51%) of handgun carriers usually have their weapon loaded when they are carrying it.This level has remained stable over time. Those who carry a gun for protection are also more likelyto have it loaded. For example, 65% of those carrying for protection usually have the gun loaded,while 28% of those who carry it only for other reasons have it loaded.
Fifty-five percent of handgun carriers have a permit for carrying a handgun. This number hassteadily risen in recent years, from 42% in 1997-1998 to 47% in 1998, and 55% in 1999. This mayreflect the increased number of states with permissive, concealed-carry laws. Permits are morecommon among those who carry a handgun for work or for multiple reasons. Contrary to earlierresults,79 permits are not more common among those using the handgun for protection rather thanfor other uses.
Trends in Gun Ownership
The proportion of households with a firearm has been in slow decline over the last quarter century(Table 10).19 In the early 1970s about 50% of adults lived in households that kept a firearm. Thisnow has fallen to 40% or lower. This decline is partly the result of a decrease in household size.From 1980 until 1997 the proportion of adults personally owning a gun held steady at about 29%.However, in 1998 and 1999 even this level showed some evidence of decline to about 25% of adultspersonally owning a gun.
Also the types of firearms that people own has shifted. As hunting has declined as a recreationalpursuit,77 the proportion of adults in households with longguns has decreased from about 42% inthe early 1970s to about 29-33% today. Partly compensating for this drop, the proportion of adultsliving in a household with a handgun rose from about 20% in the early 1970s to 24-25% in the mid-1990s. However, this number may also now be waning, with only 21-23% reporting living in ahousehold with a handgun in 1998/1999. Likewise, the proportion ever having bought a handgunincreased from 21% in 1996 to 25% in 1997-1998 and then fell to 20-21% in 1998/1999.N

O The two exceptions (i.e., the only non-positive difference scores in Table 11) are that (1) there is no differencebetween personal gun owners and those in households without guns in support for federal handgun safety standards(this exception makes sense, since handgun safety standards could benefit gun users) and (2) gun owners are morelikely to favor doubling the sentences of criminals using guns (this position is endorsed by the National RifleAssociation). Neither of these reversals is statistically significant.
��
7+(�&211(&7,21�%(7:((1�*81�2:1(56+,3�
$1'�$77,78'(6�72:$5'�),5($506
The possession of firearms strongly shapes attitudes toward the regulation of firearms, beliefs aboutgun safety, and opinions on other gun-related issues. As Table 11 shows, people’s views vary greatlyaccording to whether they personally own a gun, live in a household with a gun (but do notpersonally own a firearm), or live in a household without guns.
� In all but 3 of the 36 comparisons, there are statistically significant differences. In this sensethere is little consensus between gun owners and non-gun owners on firearms and how theyshould be regulated.
� In 34 cases people who personally own guns are more pro-gun (i.e., less for regulation, lessconcerned about safety issues) than those without guns.O Besides being pervasive, thesedifferences are often quite strong. In 20 cases the gap is 20 percentage points or more.
� In most cases (28 of 36), those living in gun households, but not personally owning guns, haveattitudes intermediate between those who personally own guns and those living in householdswithout guns. In all instances others in gun households are more supportive of the regulation offirearms and more concerned about their safety than are those who personally own guns.O Insix cases they are even marginally more pro-gun control than are those from households withoutguns. This non-linearity occurs mostly because the non-owners tend to be women (see Table 9B)and women tend to be more for gun control than are men (see Gender and Firearms below).
These patterns of course also show up on the three regulation scales. On the general firearmregulation scale, personal owners back 6.9 measures, others in gun households support 8.6 items,and those in non-gun households approve of 9.1 items. Similarly, personal owners favor 7.1 gun-safety measures, others in gun households back 9.0 measures, and those without guns are for 9.2proposals. Likewise, personal owners want to bar 2.8 types of criminals from buying guns comparedto 3.4 for both others in gun households and those in non-gun households.
Despite the large differences by gun ownership and the systematically lower backing for theregulation of firearms among those who personally own guns, support for gun-control policies isactually quite high, even among gun owners. For 6 of the 13 general regulation measures, 10 of the12 safety policies, all 5 of the items about guns and criminals, and 2 of the 4 miscellaneous items,a majority of those who personally own guns favor the restriction of firearms. For example, 52%of those who personally own guns want the sale of handgun ammunition regulated like handguns

��
themselves, 65% favor the mandatory registration of handguns, 75% endorse childproofinghandguns, and 68% want to deny guns to those convicted of a simple assault. Thus, while lesssupportive of gun regulation than non-owners, those who personally own guns are in favor of mostspecific proposals to regulate guns, increase gun safety, and curb the access of criminals to guns.
62&,2�'(02*5$3+,&�',))(5(1&(6
,1�$77,78'(6�72:$5'�),5($506
With the exceptions of the sharp and consistent differences between men and women and by placeof residence, which are discussed in later sections, most demographic groups do not differ greatlyin their attitudes toward the regulation of firearms and/or do not show consistent differences acrossthe three attitude scales (Table 12). The key patterns not discussed in depth later on are as follows:
� Marital status does not make a great difference. The differences tend to be small and are notconsistent across the scales.
� Support for the general regulation of firearms increases with education, but on the denying-guns-to-criminals scale, support wanes with education. The gun-safety scale is unrelated to education.
� Income is not related to attitudes on general firearm regulation, gun safety, or barring guns fromcriminals.
� Support for safety-related measures is highest among the youngest adults, but restrictingcriminals is most backed by the oldest adults. General regulation does not vary by age.
� Number of children in the household has no consistent relationship to firearm attitudes.
Gender and Firearms
Men and women have fundamentally different viewpoints on firearms and their regulation. Ingeneral, women are more opposed to violence and the use of force than are men.76, 95, 16, 77 However,men are much more likely to own and use guns than are women.82, 21, 94, 27, 88, 51 For example, 44%of men and 12% of women personally own a gun and 33% of men and 10% of women have everbought a handgun.
Across all 36 topics women are more concerned about guns and more in favor of their regulation,and 34 of the differences are statistically significant (Table 13). The difference are often quite

P The gender differences on gun control may extend to youths.5
��
pronounced. In 15 cases they range from 10 to 20 percentage points and in 10 instances, over 20percentage points.P
Finally, there are sharp gender differences on having guns in the home. The 1998 NGPS found that16% report there was “a time in your household when there was a disagreement about guns in thehouse.” Fifteen percent (or 95% of those reporting a dispute) said that the disagreement was betweena man and a woman. In 94% of these disagreements, the woman opposed the gun or wanted greatersafety taken; in only 3% of the cases was the woman on the pro-gun side, and 3% of the time thedispute was not pro/anti-gun in nature.
Gun Attitudes and Place of Residence
As Tables 14 and 15 indicate, support for gun-control measures is lowest in rural communities andrural regions and greatest in large metropolitan areas and urban regions. Community type makes thebigger difference of the two residential variables. Of the 35 comparisons, there are statisticallysignificant differences in 26 cases. Rural areas have the least support in 34 of the 35 comparisons(only regarding federal handgun-safety standards are those in towns/small cities less supportive thanthose in rural communities). The most support for gun-control measures is evenly split betweensuburbs (15 cases) and large cities (15 cases), plus one tie between them. Also, in 4 cases the mostsupport occurs among those in towns/small cities. In general, the gulf is greatest between rural areasand the other three, more urban community types. Overall, most differences are moderate to largein magnitude, with the gap between the most and least pro-gun-control areas being 10-20 percentagepoints in 19 cases and over 20 percentage points in 3 cases.
Of course these differences also show up on the three scales. On the general firearms-regulationscale, 6.0 measures are backed in rural areas, 7.2 in towns/small cities, 7.4 in suburbs, and 7.3 inlarge cities (Table 12). Similarly for the gun-safety scale, 7.1 measures are backed in ruralcommunities, 8.2 in towns/small cities, 8.4 in suburbs, and 8.4 in large cities. For barring guns tocriminals, 3.0 crimes are endorsed in rural areas, 3.2 in towns/small cities, and 3.3 in both suburbsand large cities.
Regional differences between the Northeast, Midwest, South, and West are smaller than thevariation across community types. Of the 36 comparisons, only 11 are statistically significant. TheNortheast is the most supportive, being the highest on 23 comparisons and the lowest on only 3. TheSouth is at the other end, being most supportive of only 3 measures and least supportive of 14. TheMidwest (most supportive of 5 and least supportive of 12) and the West (most supportive of 5 andleast supportive of 7) are in the middle.
The magnitudes of the differences are also smaller by region than for community type, with the topand bottom regions apart by 10-20 percentage points in 11 cases and over 20 percentage points onlyonce. On the general firearms-regulation scale, there are no statistically significant differences(Table 12). For the gun-safety measures, support is greatest in the Northeast (8.6), least in the South

Q For more regional breakdowns and some state-level figures, see ref. 81.
��
and Midwest (both 7.9), and intermediate in the West (8.1). On barring criminals from getting guns,support is highest in the Northeast and the South (both 3.3) and lowest in the Midwest and West (3.0and 3.1, respectively).Q
Partisan and Ideological Preferences and Guns
Gun control, like any public policy, exists in a political context. Democrats and Republicans andliberals and conservatives differ on many gun-control issues, and these issues can influence whichparty and candidates people will vote for in elections. Thus, considerable political activity occurson this issue, consisting of both pro- and anti-gun-control actions by individuals and contacts by thetwo camps to shape the public’s beliefs and behaviors.
As Table 16 indicates, Republicans and conservatives are generally less supportive of the regulationof firearms than are Democrats and liberals. Of the 34 comparisons on party identification, there are10 with no statistically significant differences. In 20 comparisons, Republicans are least supportiveof gun control, Democrats most supportive, and Independents in the middle. On three itemsIndependents are least in favor of gun control, Republicans in the middle, and Democrats most infavor. On only one item—on backing federal safety standards if they increased the cost ofhandguns—was the basic pattern marginally reversed, with Republicans being most supportive,Democrats least supportive, and Independents in the middle.
Of the 35 comparisons on political ideology, there are 12 with no statistically significant differences.In 17 comparisons, conservatives are least supportive of gun control, liberals most supportive, andmoderates in the middle. For five items, moderates are least in favor of control, conservatives in themiddle, and liberals most in favor. On two items, conservatives have the lowest support, liberals arein the middle, and moderates have the highest support.
The partisan differences are somewhat larger than the ideological divisions. There are Democratic-Republican gaps of 10-20 percentage points on 16 issues and two exceed 20 percentage points.There are 13 liberal-conservative differences of 10-20 percentage points and none over 20percentage points.
Consistent with these item-by-item comparisons, there are statistically significant differences forthe three gun-control scales. Mean support for the general measures are 6.7 items for Republicans,6.8 for Independents, and 7.6 for Democrats (prob.=.000). For the safety scale, the scores are 7.4items for Republicans, 8.0 for Independents, and 8.7 for Democrats (prob=.000). For denying gunsto criminals, the levels are 3.2 items for Republicans, 3.1 for Independents, and 3.4 for Democrats.
The differences for political ideology are similar. For the general scale, conservatives favor 6.7items, moderates favor 7.2, and liberals favor 7.6 (prob.=.000); for the gun-safety scale,conservatives are for 7.7 items; moderates for 8.2, and liberals for 8.6 (prob.=.000); and for the no-guns-to-criminals scale, conservatives support 3.2 items, moderates support 3.2, and liberals support3.3 (prob.=.396).

R This statement does not deal with the power of organized interest groups or their influence over office holders.On the role of interest groups over legislation and politicians, see refs. 20, 29, 74, and 84.
��
Thus, except for the scale on denying guns to criminals, there are significant and regularly orderedrelationships between political ideology and partisanship and views on the regulation of firearms.Overall, these differences are fairly consistent and moderate in magnitude, but not nearly as largeor widespread as the differences by gun ownership, gender, or locality described above.
In part these partisan and ideological differences come from the greater distrust of government byRepublicans and conservatives. For example, 58% of liberals agree that the “government programsare usually effective” vs. 44% of conservatives, and 44% of liberals vs. 32% of conservativesdisagree with the statement that the “government does too many things already.” Similarly, 59% ofDemocrats vs. 45% of Republicans consider government programs as effective, and 48.5% ofDemocrats vs. 25% of Republicans disagree whether the government is doing too much. In turn,distrust of government is strongly related to opposing gun control. A scale was made from these twoitems and divided into approximately thirds: more trusting toward government, intermediate, andless trusting. As trust declines so does support for the general firearms scale (from 7.9 to 7.3 to 6.2;prob.=.000), the gun-safety scale (from 9.0 to 8.5 to 7.1; prob.=.000), and the denying-guns-to-criminals scale (from 3.4 to 3.3 to 3.0; prob.=.000).
On the GSS a similar pattern emerges: 83% of those with complete confidence in the “courts andlegal system” want to require a police permit before a gun can be purchased, but only 69% of thosewith no confidence back police screening. Similarly, 84% of those who disagree that “most publicofficials are not really interested in the problems of the average man” favor police permits comparedto 79% of those who agree with this statement. Likewise, the National Opinion Survey on Crimeand Justice found that low confidence in the police was related to less support for gun-control laws.1
The partisan and ideological differences on gun-control among the public in general yield morepolitical advantage to the pro-gun-control side than to the anti-gun-control position.R This mightbe inferred from the mostly large pro-gun-control responses to the numerous questions describedin Tables 1-5. Certainly it is apparent from a series of questions that ask about which political partybest shares your views on gun control. As Table 17 shows, in all nine comparisons the pluralityfavors the Democrats over the Republicans. However, the Democratic edge is fairly small, rangingfrom +3 to +8 percentage points and averaging 5.9 percentage points.
When asked two questions about whether one would be more or less likely to vote for (a) aCongressional candidate who “came out for greater regulation of guns” and (b) a Congressionalcandidate who “came out against greater regulation of guns,” people indicated in both instances thata pro-control position by the candidate would increase their likelihood of voting for him or her; 53%said they would be more likely to vote for a pro-gun-control candidate; while only 23% would beless likely to vote for such a candidate. This marks a pro-gun-control gain of 30 percentage points.Likewise, 43% said they would be less likely to vote for an anti-gun-control candidate and only27% would be more likely to support such a candidate. This comes to a pro-gun-control gain of 16percentage points. Thus, both ways of framing the vote-intentions question show the pro-gun-controlposition produces political gains. There appears to be even more positive advantage to a pro-gun-control candidate than negative loss for an anti-gun-control contender.

��
There is a narrow lead in political activism on the pro-gun-control side. People were asked thefollowing six questions:
Have you ever done the following in the past five years...
1. Written a letter to or emailed a public official supporting gun control?
2. Written a letter to or emailed a public official opposing gun control?
3. Given money to an organization which supports gun control?
4. Given money to an organization which opposes gun control?
5. Joined an organization which supports gun control?
6. Joined an organization which opposes gun control?
In answer to these questions, 4.8% reported having written in support of gun control, 6.3% gavemoney, and 3.9% joined an organization; overall 10.4% did one or more of these pro-gun-controlactions. Also, 3.5% wrote against gun control, 5.7% gave money, and 4.6% joined an organization;altogether 9.2% did one or more of these anti-gun-control behaviors. Thus, the segments engagedin political action are about even in size, with a small edge to those for gun control. This pattern isopposed to results from the early 1980s that showed the anti-gun-control camp was more active, butthe pattern is consistent with findings in the 1996 NGPS, which also showed more activism in favorof gun control than opposed to it.77
Political action of course does not only arise from spontaneous, grass-roots initiatives from thebottom-up, but often originates from organized efforts to stimulate mass activity. To measure this,the following item was asked:
In the past year, many groups have been reaching out to citizens to get then involved in effortsconcerning the regulation of firearms. In the past year, have you been contacted to...
1. Join a pro-gun-control group?
2. Join an anti-gun-control group?
3. Express support for gun control to a state legislator or member of Congress?
4. Express opposition to gun control to a state legislator or member of Congress?
5. Sign a pro-gun-control petition?
6. Sign an anti-gun control petition?

��
On the pro-gun-control side, 6.2% report a solicitation to join a group, 4.8% report being urged tocontact a legislator, and 3.3% were requested to sign a petition. Altogether 90% were notapproached in any of these three ways by those for gun control; 6.6% had one contact; 2.5% twocontacts; and 0.9% all three contacts. On the anti-gun-control side, 4.2% report a call to join a group,4.0% a request to contact a legislator, and 3.2% being asked to sign a petition. Altogether 91.8%were not approached in any of these three ways by those opposed to gun control; 5.9% had onecontact; 1.5% two contacts; and 0.8% all three contacts. Regarding attempts by both pro- and anti-gun control groups, 85.5% were not contacted by either side, 7.3% only or more often by the pro-gun-control camp, 5.1% only or more often by the anti-gun-control groups, and 2.1% had equalcontacts by each side. Thus, the contacts efforts were about equal, but the pro-gun-control sidereached somewhat more people more often than those opposed to gun control.
The contacts have not fallen evenly on all segments of the population. Those who are against guncontrol report receiving both more pro- and more anti-gun-control solicitations than those for guncontrol. For example, of those least in favor of gun control on the general scale, 12.7% had a pro-gun-control contact and 13.1% had an anti-gun-control contact. For those most supportive on thegeneral scale, the pro- and anti-gun-control contact rates were 11.3% and 5.1%, respectively . Therealso seems to be some enforced targeting since groups report more concordant contacts thandiscordant ones. For example, of the anti-gun-control group on the safety scale, 9.7% received moreanti-gun-control messages, 83.8% had the same amount of messages (most none of either type), and6.6% got more pro-gun-control messages. Conversely, among the pro-gun-control group, 2.4% hadmostly anti-gun-control contacts, 90.0% a equal number of contacts, and 7.5% had more pro-gun-control contacts.
In sum, moderate, but regular, political differences exist among partisan and ideological groups,with Republicans and conservatives giving less support to the regulation of firearms and Democratsand liberals being more in favor of gun control. Within the arena of public opinion and mass action,the pro-gun-control side holds several advantages. First, on most items, majorities favor the pro-gun-control position. Second, pluralities consistently favor the Democratic position on gun control vs.the Republican position. Third, in hypothetical elections, pro-gun-control candidates fare better thanthose opposed to the regulation of firearms. Fourth, there is slightly more pro-gun-control activismthan actions by the opponents of gun control and organized efforts to reach people are a little morecommon on the pro-gun-control side than among its opponents.
&5,0(�&21&(516�$1'�*81�&21752/��
Concern about crime is associated with more support for gun control. This concern was measuredby an open-ended question in which people were asked what was the most important problem facingthe country. In answer, 27% mentioned crime and violence, 13% drugs, 6% guns; 43% mentionedone or more of these problems. Firearm regulation is more supported by those mentioning thesecrime-related problems. People mentioning no such problems backed 6.7 general regulations, thosementioning one problem favored 7.5 policies, and those citing two or more problems supported 7.2

S There are relatively few cases in the 2+ categories, and this may explain the non-linearity. In earlier NGPSs therelationships were more linear.79
T This scale does not consider how serious or likely each of the six possible outcomes of having a gun are. Itgives equal weight to each possible occurrence.
��
measures. For the safety scale the pattern was similar: no mentions, 7.7 measures; one mention, 8.6;and 2+ mentions, 8.3. For barring criminals from getting guns, the results were no mentions, 3.1measures; one mention, 3.4; 2+ mentions, 3.5.S
6$)(7<�,668(6�5(/$7('�72�),5($506
People have mixed feelings about the safety that guns provide. Many see them as offering protectionfrom crime and other threats (e.g., wild animals), but others see guns as a source of danger involvingaccidents, suicides, family disputes, etc. The balancing of the benefits that guns may provide versusthe risks that they present is a major factor in forming people’s view toward guns and the regulationof firearms.
Perceived Safety that Guns Provide
People are very divided about how much safety guns provide. In the case of whether having a gunin a home usually makes it safer or less safe, 41% consider an armed home as safer, 16% say itdepends or are not sure, and 43% think guns make it less safe. This fairly even split, with neitherthe safer nor less safe position garnering a majority, has prevailed from 1996 to 1999.
To probe people’s beliefs about how guns in the home promote or jeopardize safety, people inNGPS-98 were asked about six statements on gun safety (Table 18). The majority agree that a gunin the home promotes a “sense of security” (73%) and allows people to “better protect themselvesfrom home invaders” (60%), but only 20% agree that a gun “reduced the chances of beingburglarized.” Even more people believe that a gun in the home increases certain problems: 54%agree that it “increases domestic violence,” 71% that “owners always have to worry about it [thegun] being stolen or misused,” and 83% that it “increases the chances of someone accidentally beingshot.”
These six items were made into a net-safety scale that ran from -3 (meaning that one agreed the threenegative consequences would occur and none of the positive outcomes would happen) to +3 (forsomeone who agrees with all three positive occurrences and no negative results). Intermediate scoresmean that people agreed with some mix of positive and negative statements.T The net-safety scoreswere as follows: –3=13%, –2=20%, –1=20%, 0=21%, +1=14%, +2=8%, and +3=4%. That means53% saw more negative than positive consequences, 21% saw it as even, and 26% thought positivelikelihoods outweighed the negative. The net-safety score suggests that public opinion in 1998

U For a debate on the impact of concealed-carry laws on crime rates, see refs. 49, 50, and 92.
V Hemenway and Azrael found that 62% said they would feel less safe and 12% more safe if more people in theircommunity began carrying guns.24
��
leaned more toward the assessment that guns in the home make things less safe (53%) than thesingle item on guns and home safety indicated (46%); that more people are ambivalent or unsure(21% vs. 11%); and that fewer people see guns as making things safer (26% vs. 43%).
Of course, evaluations of the net safety that guns in the house provide strongly influence therespondent’s overall judgement about safety to the single item. The percent thinking that guns makethings less safe rises from almost 0 for those with a net-safety score of +3 to 89% among those witha score of –3 (percent believing less safe: +3=0.3%, +2=7.6%, +1=8.3%, 0= 29.5%, –1=55.2%,–2=80.3%, and –3=89.4%).
Judgments about guns and home safety vary considerably by gun ownership: 15% of thosepersonally owning guns think guns make things less safe, as do 44% of those living in a householdwith a gun and 57.5% of those without any guns in their household. Similarly, on NGPS-98, thosegiving a negative net-safety score rises from 22.5% among those personally owning a gun, to 42.5%among others in gun households, to 69% among those without guns in their households.
People also differ over the safety afforded by allowing widespread concealed carrying: 44% seepermissive concealed-gun-carrying laws as making things safer, 45% as less safe, 9% as neithersafer nor less safe, and 3% are unsure. Safety assessments about concealed carrying have gone back-and-forth over the last several years with no clear trend. In 1996, 56% saw it as making things lesssafe; this fell to 47% in 1997-1998; then rose again to 54% in 1998; and fell again in 1999 to 45%.Among the mostly stable gun attitudes and behaviors, this has been one of the most variable items.U
Gun owners are more likely to believe that permissive concealed-carry laws will increase safety thandid non-gun owners. Of those personally owning guns, 31% thought such laws would make it lesssafe, as did 53.5% of others in gun households and 51% of those without guns. Similarly, 32% ofthose who had ever bought a handgun believed it would be less safe compared to 49% of those whohad never purchased a handgun. Likewise, 31% of those with both a handgun and a longgun in theirhousehold felt things would be less safe, as did 45% of those with only a handgun, and 43% of thosewith only a longgun.
Another factor explaining why people differ on whether permissive concealed-carry laws wouldpromote or hinder safety, is its expected impact on the level of concealed carrying. While such lawsare designed to license more gun carriers and, as a result, would presumably increase the level ofconcealed carrying, only 21.5% of the public thinks gun-carrying would increase, 56% believe thatit would remain the same, 18% that it would decrease, and 5% are unsure. This assessment has alsobeen highly changeable. In 1998, 35% saw permissive concealed-carrying laws as increasing guncarrying, 44% saw no change, 17% saw it decreasing, and 3.5% were unsure. Of those who thinkgun-carrying would increase under permissive carry laws, only 26% believe such laws would makethings safer; for those who think there would be no change in the level of gun-carrying, 47% thinkit would be safer; and for those who see gun-carrying as decreasing, 55% feel safety would increase.V

W These items are not parallel in that the one asks about whether guns in a house makes things safer and the otherasks whether laws permitting concealed carrying makes things safer. A more parallel comparison would ask aboutsafety from concealed guns being carried around.
X On the impact of general gun control and concealed-carry laws on crime and suicide, see refs. 39-40, 44-46,49-50, 53, 92.
Y The National Opinion Survey on Crime and Justice1 found that 45% said sport was the “main reason” forhaving a gun, 20% said protection against crime, 27% both, and 8% neither. A survey of parents67 in 1998 foundthat 52% mentioned hunting, 20% protection, 26% recreational and target shooting, and 15% other (numbers totalto more than 100% due to multiple mentions).
Z On the aggregate-level relationship between crime and gun ownership, see ref. 83.
AA See also ref. 67 on parents and guns. On the safe storage of firearms, see refs. 93 and 25.
��
Looking at these two gun-safety items jointly shows that 25% feel that both a gun in the home andallowing more guns on the streets improves safety;W 26% take the opposite position, that guns inboth cases decrease safety; 12.5% take the intermediate positions that a gun in the home increasessafety, while allowing more carrying of guns decreases safety; and another 14.5% think homes withguns are less safe, but feel that allowing more concealed-carrying would make things safer. Finally,some are unsure about the safety impact of one or both situations (14%) or think that both have noimpact on safety (4%).X
Likewise, people who have not kept or acquired a gun for protection are more likely to believe boththat guns in the home and on the street make things less safe. For example, of those who obtaineda gun at least in part for protection against crime, 19% feel that guns in the home make it less safeand 34% think that allowing more concealed carrying of guns would reduce safety. Among gunowners who did not acquire a gun for protection, 28% think homes are less safe with guns and 42%consider additional guns on the street as being more dangerous. Safety concerns are even less forthose who carried guns for protection during the last year: 15% of gun carriers consider guns in thehome less safe and 24% believe that permissive concealed-carrying laws would decrease safety.
Finally, many gun owners see protection against crime as a reason for having a gun. About two-fifths of people in households with guns have acquired their weapons “at least in part, for protectionagainst crime.”Y This level has varied slightly but shows no clear trend over the last several years(40% in 1996, 43% in 1997-1998, 39% in 1998, 42% in 1999). Personal gun owners are more likelyto report that a gun was obtained for anti-crime purposes than others in households with guns(47.5% vs. 30%; prob.=.000). Anti-crime protection is mentioned by 74% of those in householdswith only a handgun, by 58% in households with both handguns and longguns, and by 15% inhouseholds with only longguns.Z
Concerns about Being Around Guns
Parents are concerned about having their children being around guns.AA People with children under18 years of age were asked if they would let their child “play in or visit” a house having a handgun

��
present: 70% approved if the handgun was both “unloaded and locked away,” 33% if the handgunwas “loaded but is locked away,” and 8% if the handgun was “loaded and not locked way.” Parentalviews on allowing their child to go to a home with an unloaded and locked gun or with a loaded andunlocked gun have not changed over time, but approval of a child going to a home with a loaded,but locked, gun has dropped from 43.5% in 1997-1998, to 38% in 1998, and to 33% in 1999(prob.=.000). In addition, on NGPS-97, 30% of parents would allow “in your house, as a guest,someone who you know is carrying a handgun, that is someone other than a law enforcementofficer.”
Gun-owning parents are less opposed to their children being around guns than parents without guns.Of parents who personally own a gun, 3% do not want their child to visit a household with a lockedand unloaded handgun, 41% object if the handgun is loaded but locked away, and 77% are opposedif the handgun is loaded and unlocked. For parents living with, but not personally owning a gun, therespective objection levels are 14%, 50%, and 94%. For parents without guns in their household,opposition is 42%, 75%, and 95%. Similarly on NGPS-97, having a visitor with a gun in one’s homeis opposed by 44% of those personally owning guns; 68% of those living with, but not personallyowning a gun; and 72% of those without guns.
Those who think that having a gun makes a home safer are also less opposed to having their childrenvisit a household with a gun: 23% of parents who see guns as enhancing safety would object to achild’s visit to a household with a locked and unloaded gun compared to 37% of parents who thinkguns make a household less safe. If the gun is locked but loaded, opposition grows to 45% and 74%,and if the gun is loaded and unlocked, opposition climbs to 86% and 97%. Similarly on NGPS-97,a guest with a gun would be permitted by 49% of those seeing guns as increasing safety and 19%of those who think guns lessen safety.
Children and Guns
The presence of children in the household has only limited impact on how people think about anduse firearms. The presence of children has little association with attitudes toward firearms regulationin general. The general firearms regulation and deny-guns-to-criminals scales are unrelated to thepresence of children, and the gun-safety scale has an irregular association (Table 12). Parents aresomewhat more supportive of childproofing firearms: 63% of those without children in the homestrongly favor mandatory childproofing of handguns compared to 69% of parents (prob.=.000). Butparents and non-parents do not differ on other questions dealing with children, such as gun-ownerliability for misuse by children of unsafely stored guns and measures to restrict the use andownership of guns to those 18 and older and of handguns to those 21 and older. Moreover, thenumber of children in the household does not appreciably alter parents’ attitudes toward support forchild-related, gun-safety measures (i.e., childproofing and owner liability).
Gun ownership itself does not vary by the presence of children. The presence of a firearm in thehousehold and whether the respondent personally owns a gun are unrelated to the presence ofchildren, and having a handgun has an irregular relationship (Table 9B). Also, parental oppositionto having their children visit in households that have guns does not vary by how many children arein the family.

��
Buying Personalized Guns
After informing respondents about what personalized weapons were and asking about support forrequiring that all new handguns be personalized (Table 2), a number of experiments were conductedto see what people’s purchasing plans would be regarding personalized handguns under differentcost and availability scenarios and what their views on various public policies relating topersonalized handguns would be. First, people were asked the following:
It is expected that within three years, several types of personalized handguns will be available forsale from gun shops. It’s expected that the new devices will add about [X dollars] to the price ofhandguns. New handguns now range in price from $125 to more than $1000. If these newpersonalized handguns were now available for sale, which of the following seems most likely:
1. I would not buy a firearm of any type.
2. I would purchase a personalized handgun.
3. I would purchase a handgun that was not personalized.
4. I would purchase a non-personalized rifle or shotgun.
Random thirds of the sample were told that the personalized guns would increase costs by $100,$150, or $200. As the price is raised, three shifts in buying intentions occur. First, people intendingto buy no weapon rose as the personalized guns become more expensive: 59.7% would make nopurchase if personalization increased cost by $100; 60.8% if it was $150; and 64.2% if it cost $200more. Second, the percent purchasing a personalized gun falls as the price rises: 22.8% at $100 costincrease, 18.4% at $150, and 14.0% at $200. Third, purchases of non-personalized handguns roseas the price of personalized guns did: 5.9% if $100 more, 8.7% if $150, and 9.9% if $200. Finally,purchases of longguns showed no clear pattern: 8.1% if $100 more, 10.5% if $150, and 8.8% if$200. Clearly price makes a difference, and lower prices for personalized handguns would bothexpand handgun sales and shift purchases from traditional to personalized handguns.
Next, people’s initial intentions were further tested by varying the likely price of personalized gunsin follow-up questions:
Those indicating that they would purchase a traditional handgun or did not know what they woulddo were asked, “Do you think you would buy a personalized handgun within the next 12 months ifthe personalization devices added only [X dollars] to the price of a handgun?” The additional costmentioned was half the previously mentioned price—$50, $75, or $100. The price decrease moveda small additional group into the personalized gun market, but the absolute discounted price did notseem to matter. Of those who were told that the added price was $50, 13.0% indicated they wouldnow buy a personalized handgun, as would 10.8% of those for $75 more, and 16.3% for $100 more(prob.=.618).

��
Those indicating that they would buy a personalized handgun were asked, “Do you think that youwould be likely to buy a new personalized handgun if the personalization device added about[X dollars] to the price of a new handgun?” Each person was given a new price that was twice thepreviously mentioned price—$200, $300, or $400. This naturally discouraged purchases, althoughit was virtually the same for all prices: 30.2% dropping their purchase if the cost was $200 more,33.1% if $300 more, and 29.4% if $400 more (prob.=.263).
Those indicating they would buy a non-personalized handgun or did not know what they would dowere presented another hypothetical situation. They were asked:
In answering this next question, suppose that in 2 years all new handguns sold in the United Stateswere personalized and that the personalized devices added about [X dollars] to the price of mosthandguns. Under these new conditions, which of the following do you think you would do after youcould no longer buy a new handgun that was not personalized?
1. Buy a new personalized handgun.
2. Buy a used non-personalized handgun.
3. Buy a rifle or shotgun.
4. Not buy any type of firearms.
Each person was told the same price as in the original question ($100, $150, or $200). In this follow-up question the change was not in price, but in the non-availability of new, traditional handguns. Inresponse to the question, the original (and repeated) price did not make a statistically significantdifference. At each price a plurality stuck with their initial preference for a traditional handgun byopting for a used weapon (42.2% overall, 38.7% if $100 more, 43.7% if $150 more, and 44.9% if$200 more). Another 26.4% now would not buy a gun, 12.0% would switch to personalizedhandguns, 8.4% to longguns, and 11.0% were unsure.
The follow-up items confirm that intended purchases of personalized handguns are price-elastic.However, in the follow-up questions the absolute difference in the revised prices has no discernableimpact. The changes in purchasing plans do not vary across prices, presumably because the increasesand decreases were all proportional to the initial price (i.e., halving or doubling it). Also, the no-new-traditional-guns scenario indicates that forced substitution would scatter those who preferredto buy new, non-personalized guns in various directions.
The next questions in the personalized handgun experiments deal with changes in public policyrather than merely with market availability. The first public policy item asks:
Suppose that the government required everyone to pay an extra [X dollars] in taxes each year toenforce a new law requiring that all new guns be sold with personalized handgun technology. Wouldyou favor or oppose the law?

��
Random thirds were told that the taxes would be $25, $50, or $100. Most people opposed such a lawand opposition modestly, but not significantly, increased with the tax burden (59.9% opposed if taxwere $25, 62.8% if $50, and 66.0% if $100; prob.=.162).
Then, people who favored the law were asked if they would support or oppose it if the tax was twiceas much ($50, $100, or $200), and people who were opposed were asked if they would support oroppose it if the tax was only half as much ($12.50, $25, or $50). The doubling of the taxes persuaded25.8% of initial supporters to join the opposition, and this did not vary by the absolute amount ofthe revised tax burden (22.7% if tax were $50, 27.9% if $100, and 27.7% if $200; prob.=.926). Thehalving of the estimated tax moved very few (10.3%) into supporting the law, and this also did notvary by the absolute revised tax figure (12.7% if tax were $12.50, 9.3% if $25, and 8.7% if $50;prob.=.073).
In another follow-up question, those who opposed the taxes were asked:
Suppose the government was going to offer a tax refund of [X dollars] to citizens to compensatethem for implementation of this new law. Would you favor or oppose a law that required that allhandguns be sold with personalized handgun technology if that would mean that you received a[X-dollar] tax refund per year?
Random thirds were told the tax refunds were $25, $50, or $100. This rebate proposal moved almosta third (31.5%) of the opponents into supporting the law. The amount of the tax refund did not makea difference (% favoring: 29.3% at $25 refund, 34.0% at $50, and 31.1% at $100; prob.= .382).
The initial tax refund question was then followed by items in which the amount of the refund washalved for those now supporting the law and doubled for those still opposing the law. Halving thetax refund led 9.9% to drop their support, and this did not vary by absolute amount (% no longersupporting law: 83.9% at $12.50 refund, 93.0% at $25; and 92.2% at $50; prob.=.274). Doublingthe tax refund moved only 6.1% of opponents to support the law, and this did not vary by absoluteamount (% now supporting the law: 3.1% at $50 refund, 11.0% at $100, and 4.1% at $200;prob.=.070).
In response to the various proposed public policies on personalized guns, people showed onlylimited sensitivity to costs. Varying the amount of taxes and tax refunds had no statisticallysignificant impact, although in some instances the pattern did indicate responsiveness to price. Theclearer impact of price was the larger shift toward support when tax refunds were substituted for taxincreases.
Finally, people were asked about how the availability of personalized guns would change their gun-using behavior. Of those who indicated they would purchase a personalized handgun, 54% wouldstore the weapons in the safest of ways, locked away and unloaded; 25.5% would lock it away, butkeep it loaded; 8.5% would keep it unloaded, but not locked away; 9% would have it in the least safecondition, loaded and not locked away; and 3% were unsure.
Of those who already had a handgun and who indicated that they would purchase a personalizedhandgun, few would make changes regarding their non-personalized handguns: 82% said they would

��
keep their handguns and store them as they currently do; 4% would sell or give away their oldhandguns; 12% would give or sell the gun to the police; and 2% are unsure.
&21&/86,216
Americans favor all measures to regulate firearms short of prohibiting guns in general. First, justlike automobiles are registered, drivers are licensed, and car sales are recorded and documented,people, including most gun owners, believe there should be a set of common-sense regulations tocontrol firearms. Second, when it comes to firearms, most people’s motto appears to be “safetyfirst.” Gun safety is a concern of the vast majority of people and safety measures, from technologicalinnovations such as personalized handguns, to requiring safety training, to mandatory safe storageare very popular. Third, people want to keep guns out of the hands of criminals and to punish thosewho misuse guns. Finally, attitudes toward guns and gun control are generally stable, and pro-gun-control opinion is even more firmly grounded in thought and action than is the opposition.

��
7DEOH���6XSSRUW�IRU�*HQHUDO�*XQ�&RQWURO�0HDVXUHVD
Tamper-resistant serial numbers on guns (97-98) 89.6%
Police permit needed before gun may be purchased (GSS) 82.0
Mandatory background check and 5-day waiting period 80.7
Mandatory registration of handguns 80.0
Must be 21+ to buy handgun 79.9
Require background check for private sales 78.6
Restrict handgun ammunition like handguns themselves 73.4
Willing to pay $25 in taxes to reduce gun injuries (97-98) 71.4
Keep guns from criminals, even if harder for law-abiding 69.8
Prohibit import of guns not allowed in country of origin (98) 69.2
Ban all high-capacity ammunition magazines 66.6
Handgun owners must at least be licensed and trained 65.7b
Mandatory registration of rifles/shotguns 61.3
Concealed-carrying only for those with special needs 55.9
Prohibit importing guns (98) 55.1
Ban “Saturday night specials” (98) 54.2-58.2c
General concealed-carrying laws make it less safe 45.2
Ban possession of handguns, except police/authorized (98) 38.5
Total ban on handguns 12.8b
Sources: NGPS-99; NGPS-98; NGPS-97; GSS-98
a All results are from the latest, 1999, survey except as marked otherwise.
b 12.8% wanted a “total ban of handgun ownership” and 52.9% said that“handgun owners should be licensed by the government and completemandatory training.” 65.7% favored licensing or a more stringent measure.
c See alternative wordings below.
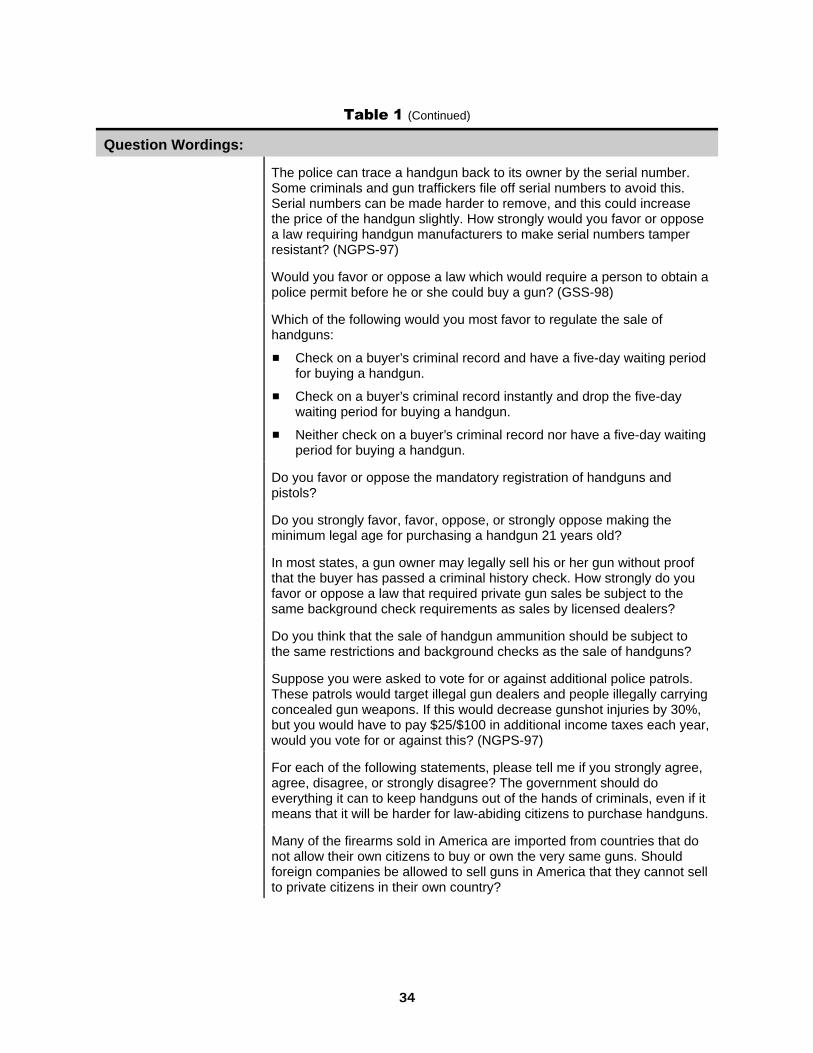
��
7DEOH���(Continued)
Question Wordings:
The police can trace a handgun back to its owner by the serial number.Some criminals and gun traffickers file off serial numbers to avoid this.Serial numbers can be made harder to remove, and this could increasethe price of the handgun slightly. How strongly would you favor or opposea law requiring handgun manufacturers to make serial numbers tamperresistant? (NGPS-97)
Would you favor or oppose a law which would require a person to obtain apolice permit before he or she could buy a gun? (GSS-98)
Which of the following would you most favor to regulate the sale ofhandguns:
� Check on a buyer’s criminal record and have a five-day waiting periodfor buying a handgun.
� Check on a buyer’s criminal record instantly and drop the five-daywaiting period for buying a handgun.
� Neither check on a buyer’s criminal record nor have a five-day waitingperiod for buying a handgun.
Do you favor or oppose the mandatory registration of handguns andpistols?
Do you strongly favor, favor, oppose, or strongly oppose making theminimum legal age for purchasing a handgun 21 years old?
In most states, a gun owner may legally sell his or her gun without proofthat the buyer has passed a criminal history check. How strongly do youfavor or oppose a law that required private gun sales be subject to thesame background check requirements as sales by licensed dealers?
Do you think that the sale of handgun ammunition should be subject tothe same restrictions and background checks as the sale of handguns?
Suppose you were asked to vote for or against additional police patrols.These patrols would target illegal gun dealers and people illegally carryingconcealed gun weapons. If this would decrease gunshot injuries by 30%,but you would have to pay $25/$100 in additional income taxes each year,would you vote for or against this? (NGPS-97)
For each of the following statements, please tell me if you strongly agree,agree, disagree, or strongly disagree? The government should doeverything it can to keep handguns out of the hands of criminals, even if itmeans that it will be harder for law-abiding citizens to purchase handguns.
Many of the firearms sold in America are imported from countries that donot allow their own citizens to buy or own the very same guns. Shouldforeign companies be allowed to sell guns in America that they cannot sellto private citizens in their own country?

��
7DEOH���(Continued)
Question Wordings:
In 1994, Congress banned the manufacture and sale of new, high-capacity magazines or clips that hold more than 10 rounds of ammunition.People can still buy similar magazines, however, if they weremanufactured before the ban. Would you favor or oppose a law that wouldban all high-capacity ammunition magazines?
Which of these views comes closer to your own? Legal restrictions on thesale and ownership of handguns are too strict and should berelaxed/Existing restrictions on the sale and ownership of handguns aresufficient now/Handgun owners should be licensed by the governmentand complete mandatory training/There should be a total ban on handgunownership.
Do you favor or oppose the mandatory registration of rifles and shotguns?
Most states require a special license to allow people to carry a concealedfirearm. Should licenses to carry concealed firearms be issued to anyadult who has passed a criminal background check and a gun safetycourse or only to people with a special need to carry a concealed gunsuch as private detectives?
Many of the civilian firearms sold in America are imported from abroad.For example, about one-third of the handguns sold to Americans areimported. Should foreign countries be allowed to export guns to America?(NGPS-98)
Would you favor or oppose a ban on the manufacture in this country ofsmall, easily concealed, and inexpensive handguns? (Wording for first orlower figure above.)
Would you favor or oppose a ban on the manufacture in this country ofsmall, easily concealed, and inexpensive handguns, often known asSaturday night specials? (Wording for second or higher figure above.)
Do laws allowing any adult to carry a concealed gun in public, providedthey pass a criminal background check and a gun safety course, makeyou feel more or less safe?
Do you think there should be a law that would ban the possession ofhandguns except for the police and other authorized persons?

��
7DEOH���6XSSRUW�IRU�*HQHUDO�*XQ�6DIHW\�0HDVXUHVD
Require federal handgun safety standards 94.1%
Federal handgun safety standards even if more expensive 86.3
Require that all new handguns be childproof 85.6
Gun buyers must take gun-safety course 84.7
Require that new handguns have magazine safety (97-98) 81.9
Manufacturers liable for injuries from defects in guns (97-98) 79.3
Make owners liable for injuries if gun not stored to preventmisuse by children
76.2
Guns must be stored in locked box or cabinet 74.1
Guns must be stored unloaded 73.9
Require that all new handguns have load indicator (97-98) 73.2
Guns must be stored with trigger lock 72.8
Current gun owners must take gun-safety course 68.3
Require federal safety regulations for gun design 66.2
Require that all new handguns be personalized 63.4
Current gun owners who won’t take gun-safety course berequired to turn in their guns
49.3
Pay $50 in taxes to enforce personalized handgun law 34.4
Sources: NGPS-99; NGPS-98; NGPS-97
a All results are from the latest, 1999, survey except as marked otherwise.

��
7DEOH���(Continued)
Question Wordings:
Handguns made in foreign countries and imported into the United Stateshave to meet certain federal government safety and quality standards. Doyou think that handguns made in the United States should or should nothave to meet the same standards?
If applying these safety and quality standards made the handguns moreexpensive, would you still support the standards?
Handguns can be made so that they cannot be fired by a young child’ssmall hands. How strongly would you favor or oppose legislation requiringall new handguns sold in the US to be childproof?
Do you think that mandatory gun-safety training should or should not berequired for anyone to buy a gun?
After an ammunition clip or magazine is removed from a pistol, one bulletmay remain in the handgun which can still be fired. A magazine safety is adevice in some pistols that prevents that bullet from being fired after themagazine or clip is removed.
People favoring magazine safeties see them as a way to preventaccidental deaths; others find these devices expensive and unreliable.How strongly would you favor or oppose legislation requiring that newpistols come equipped with a magazine safety? Would you strongly favor,favor, oppose, or strongly oppose such legislation? (97-98)
Do you think that gun manufacturers should or should not be heldfinancially liable for any death or injury from a defect in the gun’s designor manufacture? (97-98)
Some states have child access prevention laws that subject adults tocriminal or civil penalties if they fail to store their firearm to prevent accessby children who then use the firearm and death or injury results. Wouldyou strongly favor, favor, oppose, or strongly oppose a similar nationalchild access prevention law?
Do you favor or oppose laws requiring...
� That all guns be stored in a locked box or cabinet?
� That all guns be stored unloaded?
� That all guns be kept with a trigger lock? A trigger lock is anattachment that prevents a gun from being fired until the devicearound the trigger is unlocked and removed.
A load indicator is a device in some handguns that shows if the handguncontains ammunition. Some people favor them, believing that they willprevent some accidental deaths caused by people who don’t know theirhandgun is loaded; others oppose load indicators for being expensive andunreliable. How strongly do you favor or oppose legislation requiring thatall new handguns come equipped with a load indicator? Would youstrongly favor, favor, oppose, or strongly oppose such legislation? (97-98)
What about people who already own guns. Do you think they should orshould not be required to take a gun-safety course?

��
7DEOH���(Continued)
Question Wordings:
Would you strongly favor, favor, oppose, or strongly oppose governmentsafety regulations for the design of guns?
Engineers are now designing handguns equipped with devices which canrecognize the owner of a gun and not fire for anyone else. For example,these personalized guns may have a mechanism that prevents the gunfrom firing unless it comes in contact with a special ring that the shootermust wear. The technology is intended to protect a gun owner if anattacker tries to take his gun away and to make the gun less useful tocriminals if it is stolen. Personalized guns are also designed to reduce therisk of a child or teenager shooting themselves or someone else. Butpersonalized guns will cost more than other guns and the chances thatthe gun will not fire when you want it to may be increased slightly. If a newlaw were to require all new handguns to be personalized, how stronglywould you favor or oppose it? Would you strongly favor, favor, oppose, orstrongly oppose?
If a current gun owner won’t take a gun-safety course, should they orshould they not be required to turn their guns in to the police?
Suppose that the government required everyone to pay an extra $50 intaxes each year to enforce a new law requiring that all new guns be soldwith personalized handgun technology. Would you favor or oppose thelaw? (Different tax amounts were inserted in random sub-samples, seesubsequent discussion of these experiments.)

��
7DEOH��$WWLWXGHV�WR�'HQ\LQJ�*XQV�WR�&ULPLQDOV
A. % for Prohibiting Gun Purchases to Criminals
Convicted of...
Domestic violence 90.4
Drunk and disorderly conduct (97-98) 83.6
Carrying a concealed weapon without a permit 82.6
Assault and battery that does not involve a lethalweapon or serious injury
81.8
Driving under the influence of alcohol 66.5
B. % for Wait and $25 Fee to pay forBackground Checks 78.9
Sources: NGPS-99; NGPS-97
Question Wording:
Now I would like to read you a list of crimes. In most states persons whohave been convicted of these crimes can legally purchase firearms. Ineach case, tell me if you think persons who have been convicted of thecrime should or should not be able to purchase firearms.
You said that you felt that people who were convicted of [READWHICHEVER MEASURES THEY JUST ENDORSED] should not be ableto purchase a handgun. To allow checks to ensure that people who wereconvicted of these crimes did not buy handguns, would you support oroppose a requirement that all people wanting to buy a handgun had topay a $25 fee and wait two weeks while a criminal background check wascarried out? [Those who opposed any purchase restrictions aremaintained in the base and counted as opposing this measure.]

��
7DEOH��$WWLWXGHV�7RZDUG�,OOHJDO�*XQ�8VDJHV
��$JUHHLQJ
Double sentence if gun used during crime 78.2
Treat illegal gun possession as a serious crime 81.6
Source: NGPS-99
Question Wording:
For each of the following statements, please tell me if you strongly agree,agree, disagree, or strongly disagree.
a. If a gun is used during a crime, the sentence for the crime should betwice as long.
b. The illegal possession of a gun should be treated as a serious crimelike a robbery or burglary.

��
7DEOH��0HDVXUHV�WR�&XUE�6FKRRO�9LROHQFH
��)DYRULQJ�0HDVXUH
Expelling threatening, violent, and unstable students 81.0
Metal detectors and guards in all schools 73.5
Prohibit ownership/use of firearms if under 18 68.0
Prohibit guns in homes with anyone under 18 29.1
Source: NGPS-99
Question Wording:
Over the last several years, there have been a number of schoolshootings. Do you favor or oppose the following measures to reducethese and other examples of gun violence by youths:
a. Prohibiting those under 18 from owning or using firearms
b. Prohibiting guns in households with anyone under the age of 18
c. Having metal detectors and security guards in all middle schools andhigh schools
d. Screening and expelling any students making threats, acting violently,or being mentally unstable

��
7DEOH��7UHQGV�LQ�$WWLWXGHV�7RZDUGV�*XQV
1996 1997/98 1998 1999
Changea
1999 -First
A. Support for Gun-Control Measures
Police permit before purchaseb 80.3 ---- 82.0 ---- + 1.7*
Mandatory background check and 5-day waiting period
---- ---- 85.3 80.7 - 4.6*
Mandatory registration of handguns 81.3 81.5 85.3 80.0 - 1.3*
Checks on private sales of guns 77.4 ---- 79.5 78.6 + 1.2**
Restrictions on sale of ammunition ---- 77.5 76.8 73.4 - 4.1
Keep guns from criminals, even ifharder for law-abiding
78.3 70.1 75.3 69.8 - 8.5**
Ban all high-capacity ammunitionmagazines
---- ---- 73.2 66.6 - 6.6**
Handgun owners must at least belicensed and trained
69.8 64.1 69.6 65.7 - 4.1*
Mandatory registration ofrifles/shotguns
66.3 62.6 72.3 61.3 - 5.0**
Concealed carrying only for thosewith special needs
53.5 57.9 59.8 55.9 + 2.4*
General concealed carrying lawsmake it less safe
55.7 47.4 53.6 45.2 -10.5**
Ban possession of handguns, exceptpolice/authorized
35.2 36.1 38.5 ---- + 3.3*
Total ban on handguns 16.1 16.5 15.6 12.8 - 3.3*
B. Support for Gun-Safety Measures and Beliefs
Require federal handgun safetystandards
---- 93.6 94.9 94.1 +0.5
Gun buyers must take gun-safetycourse
---- ---- 90.1 84.7 - 5.4**
Federal handgun safety standardseven if more expensive
---- 85.7 89.8 86.3 + 0.6*
Require that all new handguns bechildproof
85.8 87.5 87.9 85.6 - 0.2**
Make owners liable for injuries if gunnot stored to prevent misuse bychildren
---- ---- 79.6 76.2 - 3.4**

��
7DEOH���(Continued)
1996 1997/98 1998 1999
Changea
1999 -First
Guns must be stored in locked box orcabinet
---- ---- 73.7 74.1 +0.4
Guns must be stored unloaded ---- ---- 78.4 73.9 - 4.5
Guns must be stored with trigger lock ---- ---- 76.8 72.8 - 4.0*
Current gun owners must take gun-safety course
---- ---- 76.7 68.3 - 8.4**
Require federal safety regulations forgun design
74.6 67.8 74.9 66.2 - 8.4**
Requiring that all new handguns bepersonalized
68.0 71.4 69.8 63.4 - 4.6**
Current gun owners who won’t takegun-safety course be required to turnin their guns
---- ---- 55.1 49.3 - 5.8*
C. Prohibiting Gun Purchases to Criminals Convicted of...
Domestic violence ---- 89.2 90.1 90.4 + 1.2*
Carrying a concealed weapon withouta permit
85.4 82.9 84.3 82.6 - 2.8
Assault and battery that does notinvolve a lethal weapon or seriousinjury
77.9 84.5 80.9 81.8 + 3.9**
Driving under the influence of alcohol 63.1 70.6 68.1 66.5 + 3.4*
Wait and $25 fee to pay forbackground checks
---- ---- 85.1 78.9 - 6.2**
D. Illegal Gun Use
Double sentence if gun used duringcrime
---- ---- 82.8 78.2 - 4.6**
Treat illegal gun possession as aserious crime
---- ---- 84.7 81.6 - 3.1**

��
7DEOH���(Continued)
1996 1997/98 1998 1999
Changea
1999 -First
E. Miscellaneous Beliefs and Issues
Business should prohibit carrying ofconcealed weapons on premises
---- ---- 83.2 75.8 - 7.4**
Manufacturers liable for gun misuse ---- ---- 36.9 39.9 + 3.0**
Congress should hold hearings ongun industry
---- ---- 75.3 74.5 - 0.8
Home less safe with handgun 43.4 45.4 46.4 43.2 - 0.2**
Sources: NGPS-96, NGPS 97-98, NGPS-98, NGPS-99, GSS 94-98
aChange across all years asked. % change from first to last year.bGSS. Support for requiring a police permit grew from 77.9% in 1994 to 82.0% in 1998, prob.=.002.The item will be asked on the 2000 GSS.
*overall change in distribution significant at .05-.002**overall change in distribution significant at .001 or less
Question Wordings:
See Tables 1-4 for itemsin sections A-D. Items insection E listed below.
Do you think that public places, such as stores, movie theaters, andrestaurants, should allow or prohibit people from carrying concealedweapons on their premises?
As you may know, currently some states are suing cigarette makers torecover some of the money the states paid for the medical care ofsmokers. If your state or city considers suing gun manufacturers for themedical costs of gun victims and gun injuries, would you strongly favor,favor, oppose, or strongly oppose this action?
All but one of the major American gun manufacturers are privatecompanies that do not file public reports about their gun business. Foreigncompanies that export guns to America also do not file public reports. Inthe past several years, Congress has conducted several major hearingsto investigate the tobacco industry. But Congress has never held similarhearings on the firearms industry. Should or should not Congress holdhearings to investigate the practices of the gun industry?
Do you think that a gun usually makes a home much safer, safer, lesssafe, or much less safe?

��
7DEOH��3UH��DQG�3RVW�/LWWOHWRQ�$WWLWXGHV�7RZDUGV�*XQV
Harris: In general, would you say you favor stricter gun control, or less strict gun control?
April 1998 June 1999
Stricter 69% 63%
Less strict 23 25
Neither 7 10
Not sure 1 2
(1011) (1006)
Harris: In general, do you favor stricter gun control or less strict laws relating to the control ofhandguns?
April 1998 June 1999
Stricter 76% 73%
Less strict 19 25
Neither 5 5
Not sure * 2
(1011) (1006)
AP: Which of these do you think is more likely to decrease gun violence? Better enforcementof existing gun laws or tougher gun laws.
4/16-19/99 4/28-5/2/99 8/99
Better enforcement 47% 39% 49%
Tougher gun laws 42 51 43
Neither — — 5
Don't know — — 2
(765) (1006) (1026)
AP: Do you favor stricter gun control laws or do you oppose them?
4/9-12/99 4/28-5/2/99 8/99
Favor 56% 64% 56%
Oppose 34 31 39
Don't know 10 5 5
(1021) (1006) (1026)

��
7DEOH���(Continued)
CBS/Gallup: In general, do you feel the laws covering the sale of handguns should be morestrict, less strict, or kept as they are now?
Gallup 2/99
CBS8/99
More strict 68% 67%
Less strict 6 5
Kept as they are 25 23
Don’t know 1 5
(1054) ( 736)
PSRA: Do you think stricter gun control laws would reduce the amount of violent crime in thiscountry a lot, a little, or not at all?
4/21-22/99 8/99
A lot 33% 33%
A little 38 35
Not at all 26 29
Don’t know 3 3
( 757) ( 753)
ABC/WP: Would you support or oppose a law requiring...a nation-wide ban on the sale ofhandguns, except to law enforcement officers?
CBS: Would you favor or oppose a ban on the sale of all handguns, except those issued to lawenforcement officers?
CBS4/22/99
CBS8/99
ABC/WP8-9/99
Favor 43% 35% 32%
Oppose 53 61 65
No opinion 4 4 3
(450) (736) (1526)

��
7DEOH���(Continued)
Gallup: In general, do you feel that the laws covering the sale of firearms should be more strict,less strict, or kept as they are now?
2/99 4/26-27/99 5/23-24/99 6/99 8/99
Stricter 60% 66% 65% 62% 66%
Less strict 29 25 28 31 27
Keep as now 9 5 5 6 6
Don’t know 2 2 2 1 1
(1054) (1073) (NA) (NA) (NA)
ABC: Do you favor or oppose stricter gun control laws in this country? (If favor/oppose, ask:)Is that strongly or somewhat favor/oppose?
5/99 8/99 8-9/99
Strongly favor 55% 46% 52%
Somewhat favor 12 16 11
Somewhat oppose 21 22 25
Strongly oppose 10 12 11
No opinion 1 3 2
(761) (1023) (1526)
Gallup: Which of the following statements comes closest to your view. There should be norestrictions on owning guns; there should be minor restrictions—such as a five-day waitingperiod to buy a gun and gun registration; there should be major restrictions that would banownership of some guns altogether—such as handguns and certain semi-automatic rifles; orall guns should be illegal for everyone except police and authorized persons.
2/99 4/26-27/99
None 5% 4%
Minor 37 30
SOME (Vol.) 0 4
Major 36 38
Ban 18 22
Don’t know 4 2
(1054) (1073)
* less than 0.5%NA = not available

��
7DEOH��3UH��DQG�3RVW�/LWWOHWRQ
&ULPH�*XQ�5HODWHG�0RVW�,PSRUWDQW�3UREOHP�,VVXH�0HQWLRQV
Guns/GunControl
Crime/Violence
A. Harris
1/99 - (1008) 1% 7%
2/99 - (1007) 1 8
4/8-13/99 - (1006) 1 7
5/14-19/99 - (1010) 10 19
6/99 - (1006) 9 14
8/99 - (1008) 9 13
B. Gallup
1/99 - (1009) * 13
5/23-24/99 - (1050) 10 17
C. CBS
1/30-2/1/99 - (1058) – 6
4/13-14/99 - ( 878) – 4
4/22/99 - (450) 3 16
5/1-2/99 - (1151) 3 19
*less than 0.5%—not listed as a category
Question Wordings:
Harris: What do you think are the two most important issues for thegovernment to address?
Gallup/CBS: What do you think is the most important problem facing thiscountry today?

��
7DEOH��/HYHOV�DQG�'LVWULEXWLRQ�RI�*XQ�2ZQHUVKLS�DQG�3XUFKDVHV
A. Levels
Have Gun in Household 39.9%
Respondent Owns Gun 27.2
Other Person Owns Gun 13.6
No Gun in Household 59.2a
Have Handgun in Household 22.2
Respondent Owns Handgun 17.1
No Guns in Household 59.8a
Handgun Only 5.6
Longgun Only 17.0
Both Types of Guns 17.6
Bought Handgun 21.1
Never Bought Handgun 77.8
Refused, etc. 1.1
Source: NGPS-99
aThese numbers differ slightly because of a few missing cases beingexcluded from second set of numbers.

��
7DEOH���(Continued)
B. Ownership by Socio-Demographics
Gun in HouseholdHandgun in Household Personally Owns Gun
Men 45.2% 26.1% 44.4%
Women 35.1** 18.6** 11.6**
Northeast 26.9 15.1 21.0
Midwest 46.9 17.0 29.7
South 43.5 26.5 29.0
West 38.5** 26.7* 27.1**
Rural 66.7 34.7 43.7
Town, Small City 43.2 21.3 26.8
Suburb 26.7 17.2 21.2
Large City 28.9** 18.6** 20.9**
Married 50.6 28.1 33.4
Divorced 27.4 18.4 22.5
Separated 28.4 26.7 28.9
Widowed 33.3 13.2 21.1
Never married 24.5** 13.2** 17.6**
Less than high school 43.9 20.4 32.2
High school 43.3 21.4 28.8
College 37.8 24.4 24.8
Greater than college 34.2 19.4 25.8
$0-9,999 26.6 15.0 21.0
$10,000-19,999 38.1 17.5 27.4
$20,000-29,999 43.0 16.1 29.1
$30,000-39,999 40.4 20.0 28.8
$40,000-49,999 40.3 20.3 20.1
$50,000-59,999 51.5 41.7 35.8
$60-000-79,999 44.6 24.3 33.0
$80,000+ 37.9** 24.5** 31.5*

��
7DEOH���(Continued)
Gun in HouseholdHandgun in Household Personally Owns Gun
Less than 30 years old 30.6 12.9 21.1
30-39 37.9 21.8 23.2
40-49 45.8 21.5 29.5
50-65 47.5 30.2 33.1
65+ 40.2** 26.0** 31.8*
No children in home 40.1 23.6 28.5
1 child 37.8 21.5 23.5
2 children 41.3 15.3 23.2
3 children 35.7 14.3 22.4
4+ children 49.8 38.7** 41.1
Republican 47.3 25.7 34.8
Independent 42.6 23.1 28.8
Democrat 31.7** 18.6* 20.4**
Liberal 29.6 15.5 19.7
Moderate 44.2 25.9 31.6
Conservative 41.3** 22.6* 27.0*
Source: NGPS-99
*overall differences in distributions significant at .05-.002**overall differences in distributions significant at .001 or less

��
7DEOH���7KH�2ZQHUVKLS�RI�*XQV
A. Trends in Gun Ownership - Overall
% of Adults inHouseholds with
Guns % of Households
with Guns
% of AdultsPersonally Owning
Gun
1973 49.1 47.3 ----
1974 47.9 46.2 ----
1976 49.7 46.7 ----
1977 54.0 50.7 ----
1980 50.8 47.7 29.0
1982 48.9 45.5 29.1
1984 48.5 45.2 25.5
1985 48.1 44.3 30.7
1987 48.6 46.1 28.2
1988 43.4 40.1 25.2
1989 48.9 46.1 27.4
1990 45.8 42.7 28.7
1991 43.7 39.9 27.6
1993 45.5 42.1 29.4
1994 43.9 40.7 28.5
1996a 43.4 40.2 27.2
1996b 42.3 39.1 30.8
1997 38.6 37.4 28.7
1998a 36.8 34.9 22.5
1998b 37.8 34.5 25.4
1999 39.9 35.8 27.2

��
7DEOH����(Continued)
B. Trends in Gun Ownership - Type of Firearm
% of Adults in Householdwith Handguns
% of Adults in Householdwith Longguns
1973 20.3 42.1
1974 20.3 40.4
1976 22.2 41.7
1977 21.3 45.8
1980 24.3 42.8
1982 22.4 41.5
1984 22.4 41.3
1985 24.2 39.5
1987 26.5 41.9
1988 24.4 35.9
1989 26.8 40.0
1990 24.9 37.3
1991 22.1 37.0
1993 26.1 36.7
1994 26.2 35.4
1996a 23.7 34.8
1996b 24.8 36.9
1997 24.0 31.1
1998a 20.7 29.0
1998b 23.1 31.9
1999 22.2 33.5
Sources: GSS=1973-1996a, 1998a; NGPS-96=1996b; NGPS-97=1997;NGPS-98=1998; NGPS -99=1999

��
7DEOH���$WWLWXGHV�7RZDUGV�*XQV�E\�*XQ�2ZQHUVKLS
PersonallyOwns Gun
Gun inHousehold
No Gun inHousehold
No Gun—PersonallyOwns Gun Prob. a
A. Support for Gun-Control Measures
Police permit before purchaseb 66.0% 79.9% 88.2% 22.2% .000
Mandatory background check and 5-day waiting period
73.9 88.1 83.5 9.6 .005
Mandatory registration of handguns 64.6 89.2 85.7 21.1 .000
Checks on private sales of guns 66.0 88.0 83.4 17.4 .000
Restrictions on sale of ammunition 52.1 72.6 85.1 33.0 .000
Keep guns from criminals, even ifharder for law-abiding
45.5 76.1 81.5 36.0 .000
Ban all high-capacity ammunitionmagazines
56.2 66.4 72.5 16.3 .000
Handgun owners must at least belicensed and trained
42.4 67.2 77.3 34.9 .000
Mandatory registration ofrifles/shotguns
36.7 65.6 73.2 36.5 .000
Concealed carrying only for those withspecial needs
35.9 56.1 66.2 30.3 .000
General concealed carrying lawsmake it less safe
31.4 53.5 50.8 19.4 .000
Ban possession of handguns, exceptpolice/authorized (98)
10.3 30.5 53.2 42.9 .000
Total ban on handguns 3.9 7.3 18.8 14.9 .000
B. Support for Gun-Safety Measures and Beliefs
Require federal handgun safetystandards
90.8 94.2 95.0 4.2 .235
Gun buyers must take gun-safetycourse
76.7 82.6 89.1 12.4 .000
Federal handgun safety standardseven if more expensive
85.5 91.4 85.5 0.0 .026
Require that all new handguns bechildproof
75.4 88.7 90.4 15.0 .000
Make owners liable for injuries if gunnot stored to prevent misuse bychildren
69.5 71.6 81.3 11.8 .000
Guns must be stored in locked box orcabinet
56.6 76.6 82.8 26.2 .000
Guns must be stored unloaded 62.1 79.9 79.5 17.4 .000

��
7DEOH����(Continued)
PersonallyOwns Gun
Gun inHousehold
No Gun inHousehold
No Gun—PersonallyOwns Gun Prob. a
Guns must be stored with trigger lock 50.4% 72.6% 84.6% 34.2% .000
Current gun owners must take gun-safety course
49.3 69.9 78.1 28.8 .000
Require federal safety regulations forgun design
51.7 63.6 73.9 22.2 .000
Requiring that all new handguns bepersonalized
51.1 67.5 69.4 18.3 .000
Current gun owners who won’t takegun-safety course be required to turnin their guns
23.2 48.7 63.0 39.8 .000
C. Prohibiting Gun Purchases to Criminals Convicted of...
Domestic violence 80.9 92.9 95.6 14.7 .000
Carrying a concealed weapon withouta permit
69.7 80.0 90.6 20.9 .000
Assault and battery that does notinvolve a lethal weapon or seriousinjury
68.3 83.2 88.8 20.5 .000
Driving under the influence of alcohol 51.2 69.2 74.1 22.9 .000
Wait and $25 fee to pay forbackground checks
79.5 82.5 84.6 5.1 .107
D. Illegal Gun Use
Double sentence if gun used duringcrime
79.8 81.8 76.7 - 3.1 .449
Treat illegal gun possession as aserious crime
74.5 86.0 84.7 10.2 .034
E. Miscellaneous Beliefs and Issues
Business should prohibit carrying ofconcealed weapons on premises
63.2 76.0 83.2 20.0 .000
Manufacturers liable for gun misuse 18.3 40.3 51.0 36.7 .000
Congress should hold hearings on gunindustry
53.8 81.4 84.2 30.4 .000
Home less safe with handgun 14.6 43.8 57.5 42.9 .000
Sources: NGPS-96, NGPS 97-98, NGPS-98, NGPS-99, GSS 1994-98aProbability levels are based on the entire distributions, not just the proportions displayed above.
Question Wordings: See Tables 1-4,6

��
7DEOH���$WWLWXGHV�7RZDUG�*XQV�E\�6RFLR�'HPRJUDSKLFV
General FirearmRegulation
Gun SafetyMeasures
Barring Gunsto Criminals
Men 6.3 7.4 2.9
Women 7.7** 8.7** 3.5**
Northeast 7.3 8.6 3.3
Midwest 7.0 7.9 3.0
South 7.0 7.9 3.3
West 7.0 8.1* 3.1**
Rural 6.0 7.1 3.0
Town, small city 7.2 8.2 3.2
Suburb 7.4 8.4 3.3
Large city 7.3** 8.4** 3.3*
Married 6.9 7.7 3.1
Divorced 7.3 8.8 3.1
Separated 7.0 8.7 3.4
Widowed 7.2 8.1 3.7
Never married 7.3 8.4** 3.2**
Less than high school 6.5 7.7 3.4
High school 6.8 8.1 3.2
College 7.3 8.2 3.2
Greater than college 7.4** 7.9 3.1*
$0-9,999 6.6 7.6 3.4
$10,000-19,999 7.1 8.6 3.3
$20,000-29,999 6.7 8.0 3.0
$30,000-39,999 6.9 7.8 3.1
$40,000-49,999 7.0 8.1 3.2
$50,000-59,999 7.2 8.2 3.3
$60,000-79,999 7.3 8.3 3.2
$80,000+ 7.2 8.0 3.1

��
7DEOH����(Continued)
General FirearmRegulation
Gun SafetyMeasures
Barring Gunsto Criminals
Less than 30 years old 7.1 8.5 3.0
30-39 7.2 8.3 3.2
40-49 6.9 8.0 3.2
50-65 6.8 7.6 3.2
65+ 7.3 7.9* 3.6**
No children in home 7.0 7.9 3.2
1 child 7.5 8.5 3.2
2 children 7.0 8.4 3.2
3 children 7.0 8.3 3.2
4+ children 6.0* 7.5* 3.3
Republican 6.7 7.4 3.2
Independent 6.8 8.0 3.1
Democrat 7.6** 8.7** 3.4**
Liberal 7.6 8.6 3.3
Moderate 7.2 8.2 3.2
Conservative 6.7** 7.6** 3.2
Source: NGPS-99
*overall differences in means significant at .05-.002**overall differences in means significant at .001 or less

��
7DEOH���*HQGHU�'LIIHUHQFHV�LQ�$WWLWXGHV�7RZDUGV�DQG�8VH�RI�*XQV
Men Women Probability
A. Support for Gun-Control Measures
Police permit before purchase 77.0 85.9 .000
Mandatory background check and 5-day waiting period
74.6 86.3 .000
Mandatory registration of handguns 74.2 84.4 .000
Checks on private sales of guns 72.9 83.9 .000
Restrictions on sale of ammunition 63.3 82.8 .000
Keep guns from criminals, even ifharder for law-abiding
61.5 75.6 .000
Ban all high-capacity ammunitionmagazines
59.6 73.1 .000
Handgun owners must at least belicensed and trained
54.1 76.5 .000
Mandatory registration ofrifles/shotguns
50.4 71.3 .000
Concealed carrying only for those withspecial needs
49.2 62.1 .000
General concealed carrying laws makeit less safe
38.6 51.2 .000
Ban possession of handguns, exceptpolice/authorized (98)
26.1 50.0 .000
Total ban on handguns 8.7 16.5 .000
B. Support for Gun-Safety Measures and Beliefs
Require federal handgun safetystandards
92.4 94.8 .374
Gun buyers must take gun-safetycourse
81.1 88.0 .000
Federal handgun safety standardseven if more expensive
85.8 86.6 .401
Require that all new handguns bechildproof
79.9 90.9 .000
Make owners liable for injuries if gunnot stored to prevent misuse bychildren
73.0 78.8 .006
Guns must be stored in locked box orcabinet
64.9 82.5 .000
Guns must be stored unloaded 68.7 78.7 .000
Guns must be stored with trigger lock 61.5 83.1 .000
Current gun owners must take gun-safety course
60.4 75.7 .000

��
7DEOH����(Continued)
Men Women Probability
Require federal safety regulations forgun design
59.8 72.1 .000
Requiring that all new handguns bepersonalized
58.5 67.9 .000
Current gun owners who won’t takegun-safety course be required to turn intheir guns
38.8 58.9 .000
C. Prohibiting Gun Purchases to Criminals Convicted of...
Domestic violence 83.4 96.9 .000
Carrying a concealed weapon without apermit
79.2 85.8 .020
Assault and battery that does notinvolve a lethal weapon or seriousinjury
72.4 90.6 .000
Driving under the influence of alcohol 53.2 78.7 .000
Wait and $25 fee to pay for backgroundchecks
74.8 82.7 .000
D. Illegal Gun Use
Double sentence if gun used duringcrime
78.1 78.2 .002
Treat illegal gun possession as aserious crime
76.7 86.1 .000
E. Miscellaneous Beliefs and Issues
Business should prohibit carrying ofconcealed weapons on premises
68.5 82.6 .000
Manufacturers liable for gun misuse 29.3 49.7 .000
Congress should hold hearings on gunindustry
63.1 84.9 .000
Home less safe with handgun 30.9 54.5 .000
Sources: NGPS-98, NGPS-99, GSS-98
Question Wordings: See Tables 1-4,6

��
7DEOH���&RPPXQLW\�7\SH�'LIIHUHQFHV�LQ�$WWLWXGHV�7RZDUG�DQG�8VH�RI�*XQV
Rural Town, SmallCity
Suburbs Big City Prob.
A. Support for Gun-Control Measures
Police permit before purchase 72.2 79.1 82.5 85.5 .000
Mandatory background check and 5-day waiting period
73.9 80.6 83.8 83.0 .042
Mandatory registration of handguns 66.7 83.9 84.6 81.0 .000
Checks on private sales of guns 72.9 77.6 86.1 79.0 .008
Restrictions on sale of ammunition 62.2 74.0 77.2 77.3 .003
Keep guns from criminals, even ifharder for law-abiding
62.1 72.1 69.4 73.2 .012
Ban all high-capacity ammunitionmagazines
61.3 65.3 67.7 71.0 .015
Handgun owners must at least belicensed and trained
52.9 66.4 65.5 73.6 .000
Mandatory registration ofrifles/shotguns
48.7 61.1 69.4 63.7 .000
Concealed carrying only for those withspecial needs
43.1 59.7 57.0 59.7 .004
General concealed carrying laws makeit less safe
34.0 47.3 49.1 47.5 .004
Total ban on handguns 7.5 12.8 12.9 16.2 .000
B. Support for Gun-Safety Measures and Beliefs
Require federal handgun safetystandards
90.1 92.6 95.5 95.8 .015
Gun buyers must take gun-safetycourse
77.1 85.9 89.9 84.5 .025
Federal handgun safety standardseven if more expensive
85.2 82.6 91.9 87.0 .001
Require that all new handguns bechildproof
79.6 84.3 88.7 89.1 .067
Make owners liable for injuries if gunnot stored to prevent misuse bychildren
69.3 73.8 80.4 79.9 .002
Guns must be stored in locked boxor cabinet
63.8 75.8 75.4 77.6 .000

��
7DEOH����(Continued)
Rural Town, SmallCity
Suburbs Big City Prob.
Guns must be stored unloaded 71.5 78.1 69.9 73.5 .099
Guns must be stored with trigger lock 59.7 74.7 76.3 76.4 .000
Current gun owners must take gun-safety course
54.3 67.7 74.6 73.9 .000
Require federal safety regulations forgun design
57.0 66.2 70.1 69.3 .045
Requiring that all new handguns bepersonalized
53.5 66.4 63.1 66.8 .004
Current gun owners who won’t takegun-safety course be required to turnin their guns
35.1 50.9 54.2 53.3 .000
C. Prohibiting Gun Purchases to Criminals Convicted of...
Domestic violence 85.4 91.1 93.0 90.9 .144
Carrying a concealed weapon without apermit
78.5 81.4 84.9 84.9 .077
Assault and battery that does notinvolve a lethal weapon or seriousinjury
73.3 85.7 83.6 81.7 .001
Driving under the influence of alcohol 62.1 64.2 70.4 69.2 .183
Wait and $25 fee to pay for backgroundchecks
69.0 78.0 85.4 81.6 .000
D. Illegal Gun Use
Double sentence if gun used duringcrime
75.9 84.3 77.7 75.7 .059
Treat illegal gun possession as aserious crime
76.6 82.2 85.0 82.4 .144
E. Miscellaneous Beliefs and Issues
Business should prohibit carrying ofconcealed weapons on premises
68.0 79.5 73.3 78.7 .061
Manufacturers liable for gun misuse 31.6 40.7 38.0 45.9 .064
Congress should hold hearings ongun industry
65.7 76.7 73.6 78.6 .000
Home less safe with handgun 30.5 41.3 49.1 49.8 .004
Sources: NGPS-96, NGPS 97-98, NGPS-98, NGPS-99, GSS 94-98

��
Question Wordings: See Tables 1-4,6
The categories for all items except the police permit item are based onself-classification into eight categories that are collapsed into the followingfour groups: Rural=farm or open country; Town, Small City=less than50,000; Suburbs=suburb of a city 50,000+; and Big City=50,000+. For thepolice permit item from GSS—98 there were 10 categories based onCensus classification of place of interview that are collapsed into fourgroups: Rural=open country, incorporated area less than 2,500population; Town, Small City=population less than 50,000 and outsidemetropolitan area; Suburbs=part of metropolitan area, but not central city;and Big City=central city 50,000+.

��
7DEOH���5HJLRQDO�'LIIHUHQFHV�LQ�$WWLWXGHV�7RZDUG�DQG�8VH�RI�*XQV
Northeast Midwest South West Prob.
A. Support for Gun-Control Measures
Police permit before purchase 89.2 78.9 79.7 82.3 .001
Mandatory background check and 5-day waiting period
82.9 79.0 78.9 83.4 .290
Mandatory registration of handguns 76.9 80.6 80.2 81.9 .744
Checks on private sales of guns 81.0 78.5 78.5 76.9 .747
Restrictions on sale of ammunition 79.8 67.3 74.0 73.5 .000
Keep guns from criminals, even ifharder for law-abiding
73.4 71.0 69.7 65.7 .244
Ban all high-capacity ammunitionmagazines
63.8 66.2 65.3 71.5 .209
Handgun owners must at least belicensed and trained
77.2 62.1 61.4 66.8 .114
Mandatory registration ofrifles/shotguns
66.8 56.5 63.7 57.5 .033
Concealed carrying only forthose with special needs
54.6 64.6 51.5 55.1 .016
General concealed carrying laws makeit less safe
46.2 49.7 42.8 43.3 .063
Ban possession of handguns, exceptpolice/authorized (98)
54.3 40.9 33.8 29.7 .001
Total ban on handguns 16.3 12.5 11.9 11.2 .114
B. Support for Gun-Safety Measures and Beliefs
Require federal handgun safetystandards
95.5 94.4 93.7 91.1 .530
Gun buyers must take gun-safetycourse
87.4 83.7 83.4 85.5 .714
Federal handgun safety standardseven if more expensive
87.2 89.3 83.8 86.2 .180
Require that all new handguns bechildproof
88.8 85.4 84.4 85.2 .231
Make owners liable for injuries if gunnot stored to prevent misuse bychildren
78.4 76.8 70.7 81.8 .109

��
7DEOH��� (Continued)
Northeast Midwest South West Prob.
Guns must be stored in locked boxor cabinet
79.6 71.2 72.7 74.5 .092
Guns must be stored unloaded 77.0 77.3 70.7 72.8 .270
Guns must be stored with trigger lock 78.4 70.6 71.0 73.0 .452
Current gun owners must take gun-safety course
79.1 60.7 67.6 67.9 .002
Require federal safety regulations forgun design
69.4 64.0 65.5 66.8 .115
Requiring that all new handguns bepersonalized
67.3 65.4 61.3 61.4 .399
Current gun owners who won’t takegun-safety course be required to turnin their guns
61.3 41.8 49.5 46.0 .002
C. Prohibiting Gun Purchases to Criminals Convicted of...
Domestic violence 91.2 88.6 92.1 88.8 .294
Carrying a concealed weaponwithout a permit
86.2 79.5 85.3 78.4 .146
Assault and battery that does notinvolve a lethal weapon or seriousinjury
84.9 75.3 85.8 79.6 .002
Driving under the influence of alcohol 71.5 61.1 69.9 62.3 .004
Wait and $25 fee to pay for backgroundchecks
82.2 80.7 73.7 82.4 .030
D. Illegal Gun Use
Double sentence if gun used duringcrime
80.1 79.2 77.4 76.8 .001
Treat illegal gun possession as aserious crime
84.6 84.2 79.4 80.0 .180

��
7DEOH��� (Continued)
Northeast Midwest South West Prob.
E. Miscellaneous Beliefs and Issues
Business should prohibit carrying ofconcealed weapons on premises
71.2 80.4 77.4 72.5 .159
Manufacturers liable for gun misuse 47.3 40.2 34.9 40.9 .059
Congress should hold hearings ongun industry
74.2 70.6 77.5 73.7 .174
Home less safe with handgun 54.8 45.9 36.9 40.9 .006
Sources: NGPS-96, NGPS 97-98, NGPS-98, NGPS-99, GSS 94-98
Question Wordings: See Tables 1-4,6

��
7DEOH���3ROLWLFDO�'LIIHUHQFHV�LQ�$WWLWXGHV�7RZDUG�DQG�8VH�RI�*XQV
Party Identity Political Ideology
Rep. Ind. Dem. Prob. Lib. Mod. Con. Prob.
A. Support for Gun-Control Measures
Police permit before purchase 75.4 83.9 85.6 .000 87.2 81.2 78.0 .000
Mandatory background check and5-day waiting period
82.0 79.1 81.6 .207 83.8 83.4 77.2 .275
Mandatory registration ofhandguns
77.6 77.5 83.9 .001 82.6 85.3 75.0 .002
Checks on private sales of guns 79.9 76.5 80.5 .138 80.0 82.0 75.6 .007
Restrictions on sale of ammunition 67.1 68.5 82.9 .000 78.8 72.6 71.8 .457
Keep guns from criminals, even ifharder for law-abiding
62.8 68.7 76.7 .014 76.3 70.6 66.8 .008
Ban all high-capacity ammunitionmagazines
63.7 66.1 70.0 .573 74.7 70.3 60.5 .000
Handgun owners must at least belicensed and trained
55.8 63.4 76.2 .000 73.9 65.5 62.7 .000
Mandatory registration ofrifles/shotguns
57.1 57.3 68.4 .000 69.4 63.7 55.7 .002
Concealed carrying only forthose with special needs
47.9 51.9 67.0 .000 59.6 59.6 51.5 .123
General concealed carrying lawsmake it less safe
41.4 45.1 47.8 .073 53.3 47.3 39.8 .006
Ban possession of handguns,except police/authorized (98)
---- ---- ---- ---- 50.0 37.7 36.6 .018
Total ban on handguns 8.2 12.3 16.7 .000 18.3 9.9 12.5 .013
B. Support for Gun-Safety Measures and Beliefs
Require federal handgun safetystandards
91.7 94.0 95.2 .307 95.6 95.4 91.4 .047
Gun buyers must take gun-safetycourse
81.5 85.5 86.4 .297 81.8 86.6 84.4 .677
Federal handgun safety standardseven if more expensive
88.1 85.9 85.6 .046 88.5 88.5 83.4 .094

��
7DEOH��� (Continued)
Party Identity Political Ideology
Rep. Ind. Dem. Prob. Lib. Mod. Con. Prob.
Require that all new handguns bechildproof
80.3 86.3 89.6 .000 87.2 89.3 82.4 .008
Make owners liable for injuries ifgun not stored to prevent misuseby children
72.9 75.6 79.1 .001 84.3 81.4 68.5 .000
Guns must be stored in lockedbox or cabinet
64.2 75.0 81.0 .000 80.7 76.5 69.1 .007
Guns must be stored unloaded 66.0 72.7 81.6 .000 75.7 78.7 69.4 .045
Guns must be stored with triggerlock
66.7 70.2 80.0 .001 81.0 73.5 68.7 .030
Current gun owners must takegun-safety course
59.9 68.1 74.8 .002 71.0 67.5 68.1 .951
Require federal safety regulationsfor gun design
61.9 62.9 73.7 .013 76.6 66.4 61.5 .000
Requiring that all new handgunsbe personalized
55.3 65.7 68.2 .001 71.9 62.0 59.8 .000
Current gun owners who won’ttake gun-safety course berequired to turn in their guns
40.3 48.3 57.9 .000 55.5 45.0 50.2 .037
C. Prohibiting Gun Purchases to Criminals Convicted of...
Domestic violence 89.6 89.1 93.6 .017 92.2 89.7 89.9 .609
Carrying a concealed weaponwithout a permit
82.2 79.3 87.1 .108 87.0 83.3 80.2 .288
Assault and battery that does notinvolve a lethal weapon or seriousinjury
82.7 76.3 87.7 .000 81.9 82.1 81.5 .569
Driving under the influence ofalcohol
61.4 65.9 72.2 .001 65.3 69.5 64.8 .343
Wait and $25 fee to pay forbackground checks
82.8 77.0 78.2 .236 84.9 79.2 76.2 .048

��
7DEOH��� (Continued)
Party Identity Political Ideology
Rep. Ind. Dem. Prob. Lib. Mod. Con. Prob.
D. Illegal Gun Use
Double sentence if gun usedduring crime
80.9 74.6 81.4 .302 78.5 80.0 76.9 .142
Treat illegal gun possession as aserious crime
82.6 81.5 81.3 .925 79.3 81.3 83.3 .364
E. Miscellaneous Beliefs and Issues
Business should prohibit carryingof concealed weapons onpremises
66.7 74.7 83.8 .000 79.8 78.6 72.2 .024
Manufacturers liable for gunmisuse
26.2 41.0 49.9 .000 53.3 37.5 35.6 .000
Congress should hold hearings ongun industry
64.1 73.7 83.7 .000 82.0 79.5 67.8 .000
Home less safe with handgun 38.3 40.6 50.1 .016 54.4 39.7 41.1 .000
Sources: NGPS-96, NGPS 97-98, NGPS-98, NGPS-99, GSS 94-98
Question Wordings: See Tables 1-4,6

��
7DEOH���3DUWLVDQ�3UHIHUHQFHV�RQ�*XQ�&RQWURO�,VVXH:KLFK�3DUW\V�3RVLWLRQ�%HWWHU�3UHIHUUHG
Organization Date Dem. Rep. Both/Equal Neither DK
ABC/WP 5/99 39% 31% 3% 22% 5% (761)
Gallup 5/99 42 39 --- 8 11 (1050)
PSRA 6/99 42 34 4 8 12 (1153)
Fox 6/99 40 32 8 --- 20 (908)
Gallup 6/99 42 39 --- 8 11 (1016)
NBC/WSJ 6/99 29 24 23 16 8 (2011)
CBS 8/99 33 29 3 12 23 (736)
PSRA 8/99 34 26 8 --- 32 (753)
ABC/WP 8-9/99 46 40 3 7 4 (1526)
Question Wordings:
ABC/WP: [And] which political party, the Democrats or the Republicans, doyou trust to do a better job handling the issue of gun control?
PSRA: In general, which political party do you agree with more on the issueof gun control...the Republican Party or the Democratic Party?
CBS: Regardless of how you usually vote, do you think the Republican partyor the Democratic party would so a better job dealing with gun control?
NBC/WSJ: When it comes to dealing with gun control which party do youthink would do a better job—the Democratic Party, the Republican Party,both the same, or neither?
Gallup: Which party do you think can do a better job of reflecting your viewsabout gun control—the Republican Party or the Democratic Party?
Fox: Which political party—the Republicans or the Democrats—do you thinkwould do the best job on each of the following issues? Gun control(Registered voters only)

��
7DEOH���,PSDFW�RQ�6DIHW\�RI�*XQV�LQ�WKH�+RPH
Statement
% indicating that gun promotes
safety
Having a gun in the house reduces the chance of being burglarized (agree) 19.9
Having a gun in the house increases the chances of domestic violence(disagree)
43.9
Having a gun in the house allows people to better protect themselves fromhome invaders (agree)
60.2
Having a gun in the house increases the chances of someone accidentallybeing shot (disagree)
14.9
Having a gun in the house provides people with a sense of security (agree) 72.7
Having a gun in the house means that its owners always have to worry about itbeing stolen or misused (disagree)
27.4
Source: NGPS-98
Question Wording:
Do you strongly agree, agree, disagree, or strongly disagree with thefollowing statements?

��
5()(5(1&(6
1. Adams, Kenneth, “Guns and Gun Control,” in Americans View Crime and Justice: ANational Public Opinion Survey, edited by Timothy J. Flanagan and Dennis R. Longmire.Thousand Oaks, CA: Sage, 1996.
2. Blendon, Robert J.; Young, John T.; and Hemenway, David, “The American Public and theGun Control Debate,” Journal of the American Medical Association, 275 (June, 1996),1719-722.
3. Bowie, Amy, et al., “Chicagoland Gun Study,” National Opinion Research Center, 1998.
4. Bureau of Justice Statistics, “Homicide Trends in the U.S.,” at <www.ojp.usdoj.gov/bjs/homicide>, 2/10/2000.
5. Carcilli, Alice and Lester, David, “Attitudes toward Gun Control in Urban and SuburbanYouth,” Psychological Reports, 82 (June, 1998), 1402.
6. Carter, Gregg Lee, The Gun Control Movement. New York: Twayne, 1997.
7. Cohen, Adam, “Guns in the Courtroom,” Time, (July 6, 1998), 53-54.
8. Connolly, Ceci, “Littleton Alters the Landscape of Debate on Guns,” Washington Post, May5, 1999, p. A3.
9. Crocker, Royce, “Attitudes Toward Gun Control: A Review,” in Federal Regulation ofFirearms, edited by Congressional Research Service. Washington, DC: GPO, 1982.
10. Crowder, Carla, “Gun-Control Opinions Unchanged,” Denver Rocky Mountain News, May20, 1999, p. 5A.
11. “Current Trends: Homicides Among 15-19-Year-Old Males -- United States, 1963-1991,”MMWR, 43 (Oct. 14, 1994), 725-727.
12. Davis, James A.; Smith, Tom W.; and Marsden, Peter V., General Social Surveys, 1972-1998: Cumulative Codebook. Chicago: NORC, 1998.
13. Division of Violence Prevention, “Rates of Homicide, Suicide, and Firearm-Related DeathAmong Children -- 26 Industrialized Countries,” MMWR, 46 (Feb. 7, 1997), 101-105.
14. Edel, Wilbur, Gun Control: Threat to Liberty or Defense Against Anarchy. Westport, CT:Praeger, 1995.
15. Farragher, Thomas, “Support Seen Rising in Congress for Gun-Control Bill,” Boston Globe,April 23, 1999, p. A22.

��
16. Finlay, Barbara and Love, Gayle, “Explaining the Gender Gap: The Relevance of Women’sDifferent Voice,” Paper presented to the American Sociological Association, Atlanta,August, 1988.
17. Frank N. Magid Associates, “Iowans’ Attitudes towards Guns and Government Regulationof Guns,” October, 1998.
18. Gillespie, Mark, “New Gun Control Efforts Draw Mixed Support from Americans,” GallupPoll Release, July 13, 1999a.
19. Gillespie, Mark, “U.S. Gun Ownership Continues Broad Decline,” Gallup Poll Release,April 6, 1999b.
20. Gimpel, James G., “Packing Heat at the Polls: Gun Ownership, Interest GroupEndorsements, and Voting Behavior in Gubernatorial Elections,” Social ScienceQuarterly, 79 (Sept., 1998), 634-648.
21. Glick, Susan, “Female Persuasion: A Study of How the Firearms Industry Markets toWomen and the Reality of Women and Guns,” Report of the Violence Policy Center,Washington, DC, 1994.
22. Haggerty, Catherine C. and Shin, Hee-Choon, “1996 National Gun Policy Survey:Methodology Report,” NORC, January, 1997.
23. Harding, David R., Jr., “Public Opinion and Gun Control: Appearance and Transparence inSupport and Opposition,” in The Changing Politics of Gun Control, edited by John M.Bruce and Clyde Wilcox. Lanham, MD: Rowman and Littlefield, 1998.
24. Hemenway, David and Azrael, Deborah, “Gun Use in the United States: Results of aNational Survey,” Unpublished paper, Harvard School of Public Health, n.d.
25. Hemenway, David; Solnick, S.J.; and Azrael, D.R., “Firearm Training and Storage,” Journalof the American Medical Association, 273 (1995), 46-50.
26. Hill, Ronald Paul, “A Consumer Perspective of Handgun Control in the U.S.,” Advancingthe Consumer Interest, 6 (Spring, 1994), 10-14.
27. Hopper, JoAnne Stilley, et al.; “Female Handgun Ownership, Usage, and Attitudes towardTraining: Implications for Public Safety,” Journal of Nonprofit and Public SectorMarketing, 4 (1996), 99-110.
28. Irvine, Martha, “Lawsuits Target Handgun Makers for Violence,” Centre Daily Times, July13, 1998, 3A

��
29. Jelen, Ted G., “The Electoral Politics of Gun Ownership,” in The Changing Politics of Gun Control, edited by John M. Bruce and Clyde Wilcox. Lanham, MD: Rowman andLittlefield, 1998.
30. Kann, Laura, et al., “Youth Risk Behavior Surveillance -- United States, 1997, Division ofAdolescent and School Health, August 14, 1998.
31. Kates, Don B., Jr.,”Public Opinion: The Effects of Extremist Discourse on the Gun Debate,”in The Great American Gun Debate: Essays on Firearms and Violence, edited by Don B.Kates Jr. and Gary Kleck. San Francisco: Pacific Research Institute, 1997.
32. Kauder, Neal B., “One-Gun-A-Month: Measuring Public Opinion Concerning a GunControl Initiative,” Behavioral Sciences and the Law, 11 (1993), 353-360.
33. Killias, Martin, “Gun Ownership, Suicide, and Homicide: An International Perspective,” inUnderstanding Crime: Experiences of Crime and Crime Control, edited by Anna Alvazzidel Frate, Ugljesa Zvekic, and Jan J.M. van Dijk. Rome: United Nations InterregionalCrime and Justice Research Institute, 1993a.
34. Killias, Martin, “International Correlations between Gun Ownership and Rates of Homicideand Suicide,” Canadian Medical Association Journal, 148 (May 15, 1993b), 1721-1725.
35. Kleck, Gary, “Crime, Culture Conflict, and the Sources of Support for Gun Control,”American Behavioral Scientist, 39 (February, 1996), 387-404.
36. Kleck, Gary, Point Blank: Guns and Violence in America. New York: Aldine de Gruyter,1991.
37. Kleck, Gary, Targeting Guns: Firearms and Their Control. New York: Aldine de Gruyter,1997.
38. Kleck, Gary and Gertz, Marc, “Carrying Guns for Protection: Results from the NationalSelf-Defense Survey,” Journal of Research in Crime and Delinquency, 35 (May, 1998),193-224.
39. Kovandzic, Tomislav V., “No, Your Evidence Doesn’t Prove What You Think It Does!”American Journal of Economics and Sociology, 57 (July, 1998a), 363-368.
40. Kovandzic, Tomislav; Kleck, Gary; and Gertz, Marc, “Defensive Gun Use: VengefulVigilante Imagery Versus Reality: Results from the National Self-Defense Survey,”Journal of Criminal Justice, 26 (1998b), 251-258.
41. Krug, E.G.; Powell, K.E.; and Dahlberg, L.L., “Firearm-related Deaths in the Untied Statesand 35 Other High- and Upper-Middle-Income Countries,” International Journal ofEpidemiology, 27 (1998), 214-221.

��
42. Kuby, Alma M.; Imhof, Laurie; and Shin, Hee-Choon, “Fall 1998 National Gun PolicySurvey Methodology Report,” Chicago: NORC, 1999.
43. Kuby, Alma M.; Imhof, Laurie; and Shin, Hee-Choon, “Fall 1999 National Gun PolicySurvey Methodology Report,” Chicago: NORC, 2000.
44. Kwon, Ik-Whan; Scott, Bradley; Safranski, Scott R.; and Bae, Muen, “The Effectiveness ofGun Control Laws: Multivariate Statistical Analysis,” American Journal of Economicsand Sociology, 56 (Jan., 1997), 41-50.
45. Kwon, Ik-Whan; Scott, Bradley; Safranski, Scott R.; and Bae, Muen, “Rejoinder,” AmericanJournal of Economics and Sociology, 57 (July, 1998), 369-372.
46. Leenaars, Antoon A. and Lester, David, “Gender and the Impact of Gun Control on Suicideand Homicide,” Archives of Suicide Research, 2 (1996), 223-234.
47. Lester, Will, “Shootings Shift View of Guns,” Boston Globe, May 6, 1999, p. A4.
48. Lighty, Todd and Bendavid, Naftali, “Clinton Mulls Suit to Force Gun Curbs,” ChicagoTribune, December 9, 1999, Section 1, p. 9.
49. Lott, John R., Jr., More Guns, Less Crime: Understanding Crime and Gun-Control Laws.Chicago: University of Chicago Press, 1998.
50. Lott, John R. and Mustard, David B., “Crime, Deterrence, and the Right-to-Carry ConcealedHandguns,” Journal of Legal Studies, 26 (1997), 1-68.
51. Ludwig, Jens; Cook, Philip J.; and Smith, Tom W., “The Gender Gap in ReportingHousehold Gun Ownership,” American Journal of Public Health, 88 (November, 1998),1715-1718.
52. Mauser, Gary A. and Kopel, David B., “‘Sorry, Wrong Number’: Why Media Polls on GunControl Are Often Unreliable,” Political Communication, 9 (1992), 69-92.
53. McDowall, D.; Loftin, Colin; and Wiersema, B., “Easing Concealed Firearms Laws: Effectson Homicide in Three States,” Journal of Criminal Law and Criminology, 86 (1995),193-206.
54. Michigan Partnership to Prevent Gun Violence, “Michigan Statewide Survey,” February,1998.
55. National Center for Health Statistics, “Firearm Mortality” in Fastats, 1999.
56. National Center for Injury Prevention and Control, National Summary of Injury MortalityData, 1987-1994. Atlanta: CDC, 1997.

��
57. Neikirk, William, “Congress Resisting Push for Gun Control,” Chicago Tribune, November5, 1999, Section 1, p. 13.
58. Nelson, D.E.; Grant-Worley, J.A.; Powell, K.; Mercey, J.; and Holtzman, D., “PopulationEstimates of Household Firearms Storage Practices and Firearm Carrying in Oregon,”Journal of the American Medical Association, 275 (1996), 1744-1748.
59. Newport, Frank, “Before Colorado Tragedy, Americans Were Becoming Slightly LessFavorable towards Gun Control,” Gallup Poll Release, April 22, 1999a.
60. Newport, Frank, “Fort Worth Shootings Again Put Focus on Gun Control,” Gallup PollRelease, September 17, 1999b.
61. Newport, Frank, “Gun Control Support Increases Modestly in Wake of Littleton Tragedy,”Gallup Poll Release, May 3, 1999c.
62. Newport, Frank, “Public Continues to Believe a Variety of Factors Caused Littleton,”Gallup Poll Release, May 13, 1999d.
63. Newport, Frank, “Teenagers and Adults Differ on Causes, Cures for Columbine-TypeSituations,” Gallup Poll Release, May 21, 1999e.
64. O’Connell, Jim, “Handgun Sales Misfiring,” Scripps Howard News Service, May 27, 1998.
65. Office of Statistics and Programming and Division of Violence Prevention, “Nonfatal andFatal Firearm-Related Injuries--United States, 1993-1997,” MMWR, 48 (November 19,1999), 1029-1034.
66. Oliver, Charles, “A New Way to Control Crime? ‘Saturday Night Specials’ Bans Haven’tWorked,” Investor’s Business Daily, Feb. 6, 1996, A1.
67. Peter D. Hart Research Associates, “Parents, Kids, and Guns: A Nationwide Survey,”October, 1998
68. “Poll: Most Americans Favor Stricter Gun Laws,” Yahoo! News, May 27, 1998.
69. Public Policy Forum, “Public Opinion Survey,” December, 1997.
70. “Record News Interest in Littleton Shooting,” The Pew Research Center for the People andthe Press, 9/22/99, www.people-press.org/shooting.htm.
71. Saad, Lydia, “Columbine Could Cast Long Shadow Over 2000 Election,” Gallup PollRelease, June 9, 1999.

��
72. Schuldt, Richard; Judy, Eric; Hostetler, Brendan; and McCool, Matthew, “Public Opinion on Allowing Citizens to Carry Concealed Handguns: The Effect of Question Wording onMajority Opinion,” Paper presented to the Midwest Association for Public OpinionResearch, Chicago, November, 1997.
73. Singh, Gopal K.; Kochanek, Kenneth D.; and MacDorman, Marian F., “Advance Report ofFinal Mortality Statistics, 1994,” Monthly Vital Statistics Report, 45 (Sept., 30, 1996), 1-79.
74. Singh, Robert, “Gun Control in America,” Political Quarterly, 69 (1998), 288-296.
75. Smith, Tom W., “Attitude Constraint as a Function of Non-Affective Dimensions,” GSSMethodological Report No. 24, Chicago: NORC, 1982.
76. Smith, Tom W., “Gender and Attitudes Towards Violence,” Public Opinion Quarterly, 48(Spring, 1984), 384-396.
77. Smith, Tom W., “1996 National Gun Policy Survey of the National Opinion ResearchCenter: Research Findings,” NORC Report, March, 1997.
78. Smith, Tom W., “1997-98 National Gun Policy Survey of the National Opinion ResearchCenter: Research Findings,” NORC Report, March, 1998.
79. Smith, Tom W., “1998 National Gun Policy Survey of the National Opinion ResearchCenter: Research Findings,” NORC Report, March, 1999.
80. Smith, Tom W., “The 75% Solution: An Analysis of the Structure of Attitudes on GunControl, 1959-1977,” Journal of Criminal Law and Criminology, 71 (1980), 300-316.
81. Smith, Tom W. and Martos, Luis, “Attitudes Towards and Experiences with Guns: A State-Level Perspective,” NORC Report, December, 1999.
82. Smith, Tom W. and Smith, Robert J., “Changes in Firearms Ownership Among Women,1980-1994,” Journal of Criminal Law and Criminology, 86 (Nov., 1995), 133-149.
83. Southwick, Lawrence, Jr., “Do Guns Cause Crime? Does Crime Cause Guns? A GrangerTest,” Atlantic Economic Journal, 25 (Sept., 1997), 256-273.
84. Spitzer, Robert J., The Politics of Gun Control. Chatham, NJ: Chatham House, 1995.
85. Stinchcombe, Arthur L., et al., Crime and Punishment: Changing Attitudes in America. SanFrancisco: Jossey-Bass, 1980.
86. Swanson, Stevenson, “N.Y. Case on Firearms Liability May Ricochet at Chicago Suit,”Chicago Tribune, Jan. 12, 1999, Section 1, p. 4.

��
87. Teret, Stephen P.; Webster, Daniel W.; Vernick, Jon S.; Smith, Tom W.; Leff, Deborah;Wintemute, Garren J.; Cook, Philip J.; Hawkins, Darnell F.; Kellerman, Arthur L.;Sorensen, Susan B.; and DeFrancesco, Susan, “Support for New Policies to RegulateFirearms,” New England Journal of Medicine, 339 (Sept. 17, 1998), 813-818.
88. Thompson, Carol Y.; Young, Robert L.; and Creasey, Wendy L., “Women’s Emancipationand the Ownership of Firearms,” Women and Criminal Justice, 7 (1996), 69-87.
89. Tyler, Tom R. and Lavrakas, Paul J., “Support for Gun Control: The Influence of Personal,Sociotropic, and Ideological Concerns,” Journal of Applied Social Psychology, 13(1983), 392-405.
90. “TV News,” Time, December 27, 1999.
91. Vernick, Jon S., et al., “Public Opinion Polling on Gun Policy,” Health Affairs, 12 (Winter,1993), 198-208.
92. Webster, Daniel W.; Vernick, Jon S.; Ludwig, J.; and Lester, K.J., “Flawed Gun PolicyResearch Could Endanger Public Safety,” American Journal of Public Health, 87 (1997),918-921.
93. Weil, D.S. and Hemenway, David, “Loaded Guns in the House: Analysis of a NationalRandom Survey of Gun Owners,” Journal of the American Medical Association, 267(1992), 3033-3037,
94. Weisman, Carol S., “Armed by Fear: Self-Defense Handguns and Women’s Health,”Women’s Health Issues, 5 (Spring, 1995), 3-7.
95. Wirls, Daniel, “Reinterpreting the Gender Gap,” Public Opinion Quarterly, 50 (Fall, 1986),316-330.
96. Woolley, Rachel; Kuby, Alma M.; Shin, Hee-Choon, “1997/1998 National Gun PolicySurvey: Methodology Report,” NORC: Chicago, 1998.
97. Wright, James D., “Public Opinion and Gun Control: A Comparison of Results From TwoRecent National Surveys,” Annals, AAPSS 455 (May, 1981), 24-39.
98. Wright, James D., “Second Thoughts on Gun Control,” Public Interest, 91 (Spring, 1988),23-29.
99. Zawitz, Marianne W., “Firearms Injury from Crime: Firearms, Crime, and CriminalJustice,” Bureau of Justice Statistics, NCJ-160093, April, 1996.