NATIONAL FAMILY HEALTH SURVEY (NFHS-5) INDIA 2019 ...
190
NATIONAL FAMILY HEALTH SURVEY (NFHS-5) INDIA 2019-20 MANIPUR MARCH 2021
-
Upload
khangminh22 -
Category
Documents
-
view
2 -
download
0
Transcript of NATIONAL FAMILY HEALTH SURVEY (NFHS-5) INDIA 2019 ...
NATIONAL FAMILY HEALTH SURVEY (NFHS-5)
INDIA
2019-20
MANIPUR
MARCH 2021
Suggested citation: International Institute for Population Sciences (IIPS) and ICF. 2021. National Family Health Survey (NFHS-5), India, 2019-20: Manipur. Mumbai: IIPS.
For additional information about the 2019-20 National Family Health Survey (NFHS-5), please contact:
International Institute for Population Sciences, Govandi Station Road, Deonar, Mumbai-400088 Telephone: 022-4237 2442
Email: [email protected], [email protected] For related information, visit http://www.rchiips.org/nfhs or http://www.iipsindia.ac.in
CONTRIBUTORS
Hemkhothang Lhungdim
S.K. Singh
Sarang Pedgaonkar
Jitendra Gupta

CONTENTS
Page
KEY FINDINGS
Introduction ............................................................................................................................................... 1 Household Characteristics ...................................................................................................................... 3 Education ................................................................................................................................................... 6 Fertility ...................................................................................................................................................... 7 Family Planning ...................................................................................................................................... 10 Infant and Child Mortality .................................................................................................................... 12 Maternal Health ...................................................................................................................................... 14 Child Health ............................................................................................................................................ 18 Breastfeeding, Nutrition, and Anaemia .............................................................................................. 21 Adult Health and Health Care .............................................................................................................. 25 HIV/AIDS................................................................................................................................................ 27 Sexual Behaviour .................................................................................................................................... 29 Women’s Empowerment ....................................................................................................................... 29 Domestic Violence .................................................................................................................................. 32
TABLES Table 1 Results of the household and individual interviews ...................................................... 35 Table 2 Results of the household and individual interviews by district ................................... 36 Table 3 Household population by age, schooling, residence, and sex ...................................... 37 Table 4 Household and housing characteristics ............................................................................ 38 Table 5 Access to a toilet facility ...................................................................................................... 41 Table 6 Access to a toilet facility by district ................................................................................... 42 Table 7 Household possessions and land ownership .................................................................. 43 Table 8 Preschool attendance ........................................................................................................... 44 Table 9 Preschool attendance by district ........................................................................................ 45 Table 10 School attendance ................................................................................................................ 46 Table 11 Children's living arrangements and orphanhood ........................................................... 47 Table 12 Birth registration of children under age five ................................................................... 48 Table 13 Birth registration of children under age five by district ................................................. 49 Table 14 Death registration ................................................................................................................ 50 Table 15 Death registration by district ............................................................................................. 51 Table 16 Disability ............................................................................................................................... 52 Table 17 Background characteristics of respondents ..................................................................... 53 Table 18 Fertility trends ...................................................................................................................... 55 Table 19 Fertility by background characteristics ............................................................................ 56 Table 20 Teenage pregnancy and motherhood ............................................................................... 57 Table 21 Birth order ............................................................................................................................ 58 Table 22 Birth intervals ...................................................................................................................... 59 Table 23 Fertility preferences by number of living children ........................................................ 60
Page
Table 24 Desire not to have any more children ............................................................................... 61 Table 25 Ideal number of children ................................................................................................... 62 Table 26 Indicators of sex preference ................................................................................................ 63 Table 27 Knowledge of contraceptive methods .............................................................................. 64 Table 28 Current use of contraception by background characteristics ........................................ 67 Table 29 Current use of contraceptive methods by district ........................................................... 69 Table 30 Contraceptive use by men with last sexual partner........................................................ 70 Table 31 Source of modern contraceptive methods ........................................................................ 72 Table 32 Informed choice .................................................................................................................... 75 Table 33 Twelve-month contraceptive discontinuation rates ....................................................... 76 Table 34 Men's contraception-related perceptions and knowledge ............................................. 77 Table 35 Need and demand for family planning among currently married women .................................................................................................................. 78 Table 36 Unmet need for family planning by district .................................................................... 79 Table 37 Hysterectomy ....................................................................................................................... 80 Table 38 Pregnancy outcome ............................................................................................................. 81 Table 39 Characteristics of abortions ................................................................................................ 82 Table 40 Age at first marriage ............................................................................................................ 83 Table 41 Early childhood mortality rates ......................................................................................... 84 Table 42 Early childhood mortality rates by background characteristics ................................... 85 Table 43 High-risk fertility behaviour .............................................................................................. 86 Table 44 Antenatal care ....................................................................................................................... 87 Table 45 Antenatal care services and information received .......................................................... 88 Table 46 Antenatal care indicators .................................................................................................... 89 Table 47 Antenatal care indicators by district ................................................................................. 90 Table 48 Advice received during pregnancy ................................................................................... 91 Table 49 Pregnancies for which an ultrasound test was done ...................................................... 92 Table 50 Pregnancy registration and Mother and Child Protection Card ................................... 93 Table 51 Delivery and postnatal care ................................................................................................ 94 Table 52 Delivery and postnatal care by background characteristics .......................................... 95 Table 53 Delivery and postnatal care by district ............................................................................. 96 Table 54 Delivery costs and financial assistance ............................................................................. 97 Table 55 Birth order and delivery characteristics by district ........................................................ 98 Table 56 Timing of first health check after birth for the newborn ................................................ 99 Table 57 Trends in maternal care indicators .................................................................................. 100 Table 58 Male involvement in maternal care: Men's report ........................................................ 101 Table 59 Vaccinations by background characteristics .................................................................. 102 Table 60 Vaccinations by district ..................................................................................................... 104 Table 61 Prevalence and treatment of symptoms of ARI and fever ........................................... 105 Table 62 Prevalence and treatment of diarrhoea .......................................................................... 106 Table 63 Feeding practices during diarrhoea ................................................................................ 108 Table 64 Knowledge of ORS packets .............................................................................................. 109 Table 65 ICDS coverage and utilization of ICDS services ........................................................... 110 Table 66 Utilization of ICDS services during pregnancy and while breastfeeding ........................................................................................................ 111

Page
Table 67 Nutritional status of children ........................................................................................... 112 Table 68 Initial breastfeeding ........................................................................................................... 115 Table 69 Breastfeeding status by age .............................................................................................. 116 Table 70 Median duration of breastfeeding and infant and young child feeding (IYCF) practices ........................................................................... 117 Table 71 Minimum acceptable diet ................................................................................................. 118 Table 72 Child feeding practices and nutritional status of children by district ....................... 120 Table 73 Prevalence of anaemia in children................................................................................... 121 Table 74 Micronutrient intake among children ............................................................................. 123 Table 75 Presence of iodized salt in household ............................................................................. 125 Table 76 Presence of iodized salt in household by district .......................................................... 126 Table 77 Women's and men's food consumption ......................................................................... 127 Table 78 Nutritional status of adults............................................................................................... 128 Table 79 Waist circumference and waist-to-hip ratio ................................................................... 130 Table 80 Prevalence of anaemia in adults ...................................................................................... 132 Table 81 Nutritional status and anaemia among children and women by district .......................................................................................................................... 134 Table 82 Knowledge and prevention of HIV/AIDS ..................................................................... 135 Table 83.1 Accepting attitudes toward those living with HIV/AIDS: Women........................... 137 Table 83.2 Accepting attitudes toward those living with HIV/AIDS: Men ................................ 138 Table 84 Sexual behaviour, HIV testing, blood transfusion, and injections ............................. 139 Table 85 Knowledge of HIV/AIDS and sexual behaviour among youth ................................. 140 Table 86 Prevalence of tuberculosis ................................................................................................ 141 Table 87 Knowledge and attitudes toward tuberculosis ............................................................. 142 Table 88 Health insurance coverage among women and men ................................................... 143 Table 89 Source of health care and health insurance coverage among households ....................................................................................................................... 144 Table 90 Health problems ................................................................................................................. 145 Table 91 Screening tests for cancer .................................................................................................. 146 Table 92.1 Blood pressure status: Women ........................................................................................ 147 Table 92.2 Blood pressure status: Men .............................................................................................. 149 Table 93.1 Random blood glucose levels: Women ........................................................................... 151 Table 93.2 Random blood glucose levels: Men................................................................................. 152 Table 94 Tobacco and alcohol use by women and men ................................................................ 153 Table 95 Methods of menstrual protection ..................................................................................... 154 Table 96 Employment and cash earnings of women and men .................................................... 155 Table 97 Control over and magnitude of women's and men's cash earnings ........................... 156 Table 98 Participation in decision making ...................................................................................... 157 Table 99 Decision making by background characteristics ............................................................ 158 Table 100 Women's access to money and credit .............................................................................. 160 Table 101 Ownership of assets ............................................................................................................ 162 Table 102 Gender role attitudes .......................................................................................................... 164 Table 103 Gender role attitudes by background characteristics .................................................... 165 Table 104 Experience of physical and sexual violence .................................................................... 167
Page
Table 105 Experience of violence during pregnancy ....................................................................... 168 Table 106 Forms of spousal violence ................................................................................................. 169 Table 107 Spousal violence by background characteristics ............................................................ 170 Table 108 Spousal violence by husband's characteristics and empowerment indicators ................................................................................................. 172 Table 109 Injuries to women due to spousal violence ..................................................................... 174 Table 110 Help seeking ........................................................................................................................ 175
APPENDIX Estimates of sampling errors ............................................................................................................... 177
1
INTRODUCTION
The 2019-20 National Family Health Survey (NFHS-5), the fifth in the NFHS series, provides information on population, health, and nutrition for India and each state and union territory. Like NFHS-4, NFHS-5 also provides district-level estimates for many important indicators. All five NFHS surveys have been conducted under the stewardship of the Ministry of Health and Family Welfare (MoHFW), Government of India. MoHFW designated the International Institute for Population Sciences (IIPS), Mumbai, as the nodal agency for the surveys. Funding for NFHS-5 was provided by the Government of India. Technical assistance and additional funding for NFHS-5 was provided by the USAID-supported Demographic and Health Surveys Program, ICF, USA. Assistance for some of the Clinical, Anthropometric, and Biochemical (CAB) tests was provided by the ICMR and the National AIDS Research Institute (NARI), Pune. Four survey questionnaires—household, woman’s, man’s, and biomarker—were used to collect information in 19 languages using Computer Assisted Personal Interviewing (CAPI). All women age 15-49 and men age 15-54 in the selected sample households were eligible for interviewing. In the household questionnaire, basic information was collected on all usual members of the household and visitors who stayed in the household the previous night, as well as socioeconomic characteristics of the household, water and sanitation, health insurance, and number of deaths in the household in the three years preceding the survey. Two versions of the woman’s questionnaire were used in NFHS-5. The first version (district module), which collected information on women’s characteristics, marriage, fertility, contraception, reproductive health, children’s immunizations, treatment of childhood illnesses, and nutrition was fielded in the entire sample of NFHS-5 households. Information on these topics is available at the district, state, and national levels. In the second version of the questionnaire (state module), four additional topics, namely, sexual behaviour, HIV/AIDS, husband’s background and women’s work, and domestic violence, were included. This version was fielded in a subsample of NFHS-5 households designed to provide information only at the state and national levels. The man’s questionnaire covered the man’s characteristics, marriage, number of children, contraception, fertility preferences, nutrition, sexual behaviour, attitudes towards gender roles, HIV/AIDS, and lifestyle. The biomarker questionnaire covered measurements of height, weight, and haemoglobin levels for children; height, weight, waist and hip circumference, haemoglobin levels, and finger-stick blood for additional CAB testing in a laboratory for women age 15-49 and men age 15-54; and blood pressure and random blood glucose for women and men age 15 years and over. Questionnaire information and biomarkers were collected only with informed consent from the respondents.
The NFHS-5 sample was designed to provide estimates of key indicators at the national and state levels, as well as estimates for most key indicators at the district level (for all 707 districts in India, as on 31 March, 2017). The total sample size of approximately 610,000 households for India was based on the size needed to produce reliable indicator estimates for each district. The rural sample was selected through a two-stage sample design with villages as the Primary Sampling Units (PSUs) at the first stage (selected with probability proportional to size), followed by a random selection of 22 households in each PSU at the second stage. In urban areas, there was also a two-stage sample design with Census Enumeration Blocks (CEB) selected at the first stage and

2
a random selection of 22 households in each CEB at the second stage. At the second stage in both urban and rural areas, households were selected after conducting a complete mapping and household listing operation in the selected first-stage units. Readers should be cautious while interpreting and comparing the trends as some States/UTs may
have smaller sample size. Moreover, at the time of survey, Ayushman Bharat AB-PMJAY and
Pradhan Mantri Surakshit Matritva Abhiyan (PMSMA) were not fully rolled out and hence, their
coverage may not have been factored in the results of the percentage of households with any usual
member covered under a health insurance/financing scheme and the percentage of mothers who
received 4 or more antenatal care visits, respectively. Hence, the results should be interpreted with
caution.
NFHS-5 fieldwork for Manipur was conducted in all the 9 districts of the state from 25 July, 2019 to 27 January, 2020 by the Research and Development Initiative (RDI) Pvt. Ltd. Information was collected from 7,881 households, 8,042 women age 15-49 (including 1,256 women interviewed in PSUs in the state module), and 1,162 men age 15-54.
This report presents the key findings of the NFHS-5 survey in Manipur, with detailed tables and an appendix on sampling errors. At the time of finalization of this report, wealth quintiles for the country as a whole were not ready. Therefore, on finalization of the national report, the breakup of key indicators by wealth quintiles for all states will be provided as an additional document and uploaded on the official website of MoHFW and IIPS.
3
HOUSEHOLD CHARACTERISTICS
Important information collected on household characteristics include household composition, housing characteristics, household possessions, access to a toilet facility, and education. The household characteristics reflect the environmental risk factors and behavioural outcomes of the household population, including their likely impact on health status.
Household composition In Manipur, nearly two-thirds (62%) of the households surveyed are in rural areas. On average, households are comprised of 4.3 members. Nineteen percent of households are headed by women, whereas 16 percent of the population live in female-headed households.
Fourty-two percent of households in Manipur have household heads who are Hindu. Ten percent of households have household heads who are Muslim and 29 percent of households have household heads who are Christian.
Eight percent of households in Manipur have household heads who belong to a scheduled caste, 28 percent belong to a scheduled tribe, and 19 percent belong to an other backward class. Forty-five percent of household heads do not belong to a scheduled caste, a scheduled tribe, or an other backward class. The majority of households (62%) are nuclear, and 48 percent of the population reside in non-nuclear households.
More than one-quarter (28%) of Manipur’s population is under age 15, and age 65 and over account for 8 percent. The overall sex ratio of the population is 1,066 females per 1,000 males, while the sex ratio of the population under 7 years of age is much lower at 955 females per 1,000 males. Ninety percent of the surveyed persons have an Aadhaar card.
Among children below 18 years of age, 7 percent have experienced the death of one or both parents. In all, 83 percent of children below 18 years of age live with both parents, 13 percent live with one parent (mostly with their mother), and the remaining 5 percent live with neither parent. Births of most children under 5 years of age (87%) were registered with the civil authorities, and 46 percent of children have a birth certificate.
Death registration Fourty-two percent of deaths of usual residents of households were registered with the civil authorities. In Manipur, 35 percent of deaths registered in age 0-4 , and 44 percent in age 35 and above.
The distribution of death registrations by religion shows that 39 percent of deaths are registered among Hindus, and 54 percent among Christian. Fifty-three percent of deaths are registered among scheduled tribes, 42 percent among other backward class, and 37 percent among scheduled castes. Overall in Manipur, death registration is higher among males (46%) than females (37%), but more or less at the same level in rural and urban areas, 42 percent and 43 percent respectively.
4
Disability The respondent to the Household Questionnaire provided information for all usual household members on whether or not they have any disability in specified domains. The domains of disability are hearing, speech, visual, mental, locomotor, and other. Only 1 percent of the de jure household population has any disability. Men are slightly more likely than women to have any disability (1.3% and 1.0% respectively). The proportion of household members who have any disability rises with increasing age by excluding age 25-34 years unexpected. For instance, almost 2 percent of the household members age 70 and above are reported to have any disability. Among the domains of disability, the most prominent is mental disability (0.3%).
Housing characteristics Less than one-quarter (23%) of households in Manipur live in a pucca house, but almost all households (98%) have electricity.
A little over one-fifth (21%) of households in Manipur have water piped into their dwelling, yard, or plot.
Seventy-seven percent of households in Manipur have access to (use) an improved source of drinking water, but only 21 percent have water piped into their dwelling, yard, or plot. Urban households (30%) are more likely than rural households (15%) to have water piped into their dwelling, yard, or plot. Overall, 72 percent of households have basic drinking water service (i.e. an improved source on the premises or round-trip collection time of 30 minutes or less). Sixty-three percent of households use an appropriate treatment method to make drinking water potable (mostly by boiling). A large majority of households (70%) in Manipur use a clean fuel for cooking, mainly LPG (68%).
Access to toilet facility Safe sanitation is one of the foundations of a healthy, comfortable, and dignified life. Households without proper sanitation facilities have a greater risk of diseases like diarrhoea, dysentery, and typhoid than households with improved sanitation facilities that are not shared with other households.
In Manipur, only less than one percent (0.5%) of all households surveyed do not use any sanitation facility; they use open spaces or fields. Almost all the households have access to toilet facility, with no difference in accessibility either in urban areas or in rural areas. Overall, 62 percent of households have basic sanitation service (i.e., use of improved facilities not shared with any households), while 32 percent households have limited sanitation service (i.e., use of improved sanitation facilities shared by two or more households). Among the districts, access to a toilet facility by households is almost universal in all districts with Tamenglong and Ukhrul having the lowest access (99% each).
Selected household possessions In Manipur, 78 percent of households own a house (79% of rural households and 76% of urban households). Almost all urban households (98%) and rural households (95%) have a mobile
5
phone. Ninety-five percent of households have a bank or post office account. Forty-one percent of households own either a motorcycle or a scooter, and 45 percent households own a bicycle. BPL cards are possessed by 43 percent of households. Irrigated land is owned by 22 percent of rural households and 16 percent of urban households. Overall, 27 percent of all households in Manipur own agricultural land, and more than half of households (55%) own farm animals.
Background characteristics of respondents Almost equal proportion of the different age groups of women and men age 15-49 in Manipur. For instance, 29 percent each of women and men are in the 15-24 age group, while 32 percent of women and 30 percent of men are in the 25-34 age group. More than three-fifths (62%) of women and 58 percent of men live in rural areas.
In NFHS-5, literate persons refer to those who have either completed at least standard 9 or passed a simple literacy test conducted as part of the survey. According to this measure, 85 percent of women and 93 percent of men age 15-49 are literate.
In Manipur, more adult women (8%) than men (4%) age 15-49 have never been to school. Thirty percent of women age 15-49 have completed 12 or more years of schooling, compared with 38 percent of men.
Media exposure is not very much widespread among women and men in Manipur. More than two-fifths (43%) of men and women (44%) watch television at least once a week. However, men (37%) are much more likely than women (20%) to read a newspaper or magazine at least once a week. Thirty-eight percent of men and 41 percent of women are not regularly exposed to print media or other forms of media.
Women are more likely than men to be currently married (65% versus 60%) or widowed (4% versus 0.1%), while men are more likely than women to be never married (39% versus 30%).
A majority of female respondents are Hindu (44%), while 26 percent are Christian, and 12 percent are Muslim.
Twenty-five percent of female respondents belong to schedule tribe, while 20 percent belong to an other backward class. Eight percent of women and 7 percent of men belong to a scheduled caste, while 44 percent of men and 47 percent of women 15-49 do not belong to a scheduled caste, a scheduled tribe, or an other backward class.
Fifty-one percent of women and 18 percent of men age 15-49 were not employed in the 12 months preceding the survey. Two percent of women and 23 percent of men were engaged in an agricultural occupation, while 41 percent of women and 45 percent of men were employed in a non-agricultural occupation.
6
EDUCATION
In NFHS-5, information related to preschool attendance has been collected for the first time. Other information on education of household members includes school attendance among children age 6-17 years and educational attainment of all other members of the household, including reasons for drop-out in the case of those who discontinued education.
Preschool attendance In India many children attend Anganwadi Centres (AWC) that provide spaces for children to learn, play, eat nutritious food, and develop the skills needed for a lifetime of learning. Attending pre-primary education, such as at an Anganwadi Centre, improves children’s school readiness by it providing quality learning through interactive, play methods with qualified instructors. Also, parents or guardians can go to work at ease if children are enrolled in pre-primary education.
In Manipur, 39 percent of boys and 41 percent of girls aged 2-4 years attend preschool. Preschool attendance is lower among children in nuclear households (37%) than children in non-nuclear households (44%). Households headed by Hindu and Christian (43% each) show a much higher preschool attendance than households headed by Muslim (20%). Preschool attendance is highest among those other than scheduled tribe, scheduled caste, other backward class (44%), followed by schedule tribe households (41%), scheduled caste households (37%), and the lowest in households of other backward class (32%). Preschool attendance is also found higher in households with 3 or more members (40%). Overall, urban households (41%) show higher preschool attendance than rural households (40%). Preschool attendance is highest in Imphal East district (50%) and lowest in Thoubal district (28%).
School attendance among children
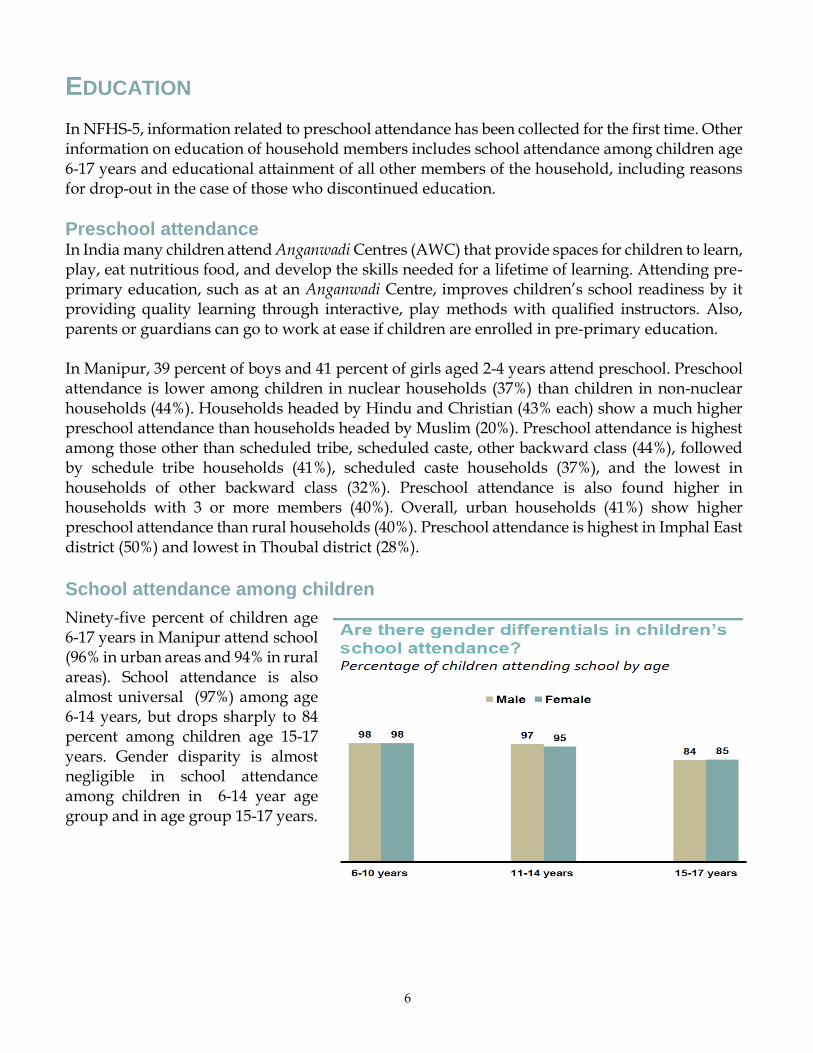
Ninety-five percent of children age 6-17 years in Manipur attend school (96% in urban areas and 94% in rural areas). School attendance is also almost universal (97%) among age 6-14 years, but drops sharply to 84 percent among children age 15-17 years. Gender disparity is almost negligible in school attendance among children in 6-14 year age group and in age group 15-17 years.
7
FERTILITY This section provides trends in the total fertility rate, age at marriage, pregnancy outcomes, teenage pregnancy, birth interval, the desire for more children, and son preference. NFHS-5 estimates on the median age at marriage, total fertility rate, and teenage motherhood illustrated in this section can help in setting benchmarks for the sustainable development goals at the sub-national level.
Age at first marriage In Manipur, the median age at first marriage is 22.9 years among women age 25-29 years and 23.5 years among women age 25-49 years. Only 20 percent of women age 20-49 years have never married, compared with 29 percent of men age 20-49 years. Around 16 percent of women age 20-24 years got married before attaining the legal minimum age of 18 years, up from 14 percent in NFHS-4. Fifty-six percent of women age 20-24 years are never married, compared with 78 percent of men in the same age group, showing that the age at marriage is much lower for women than men in Manipur.
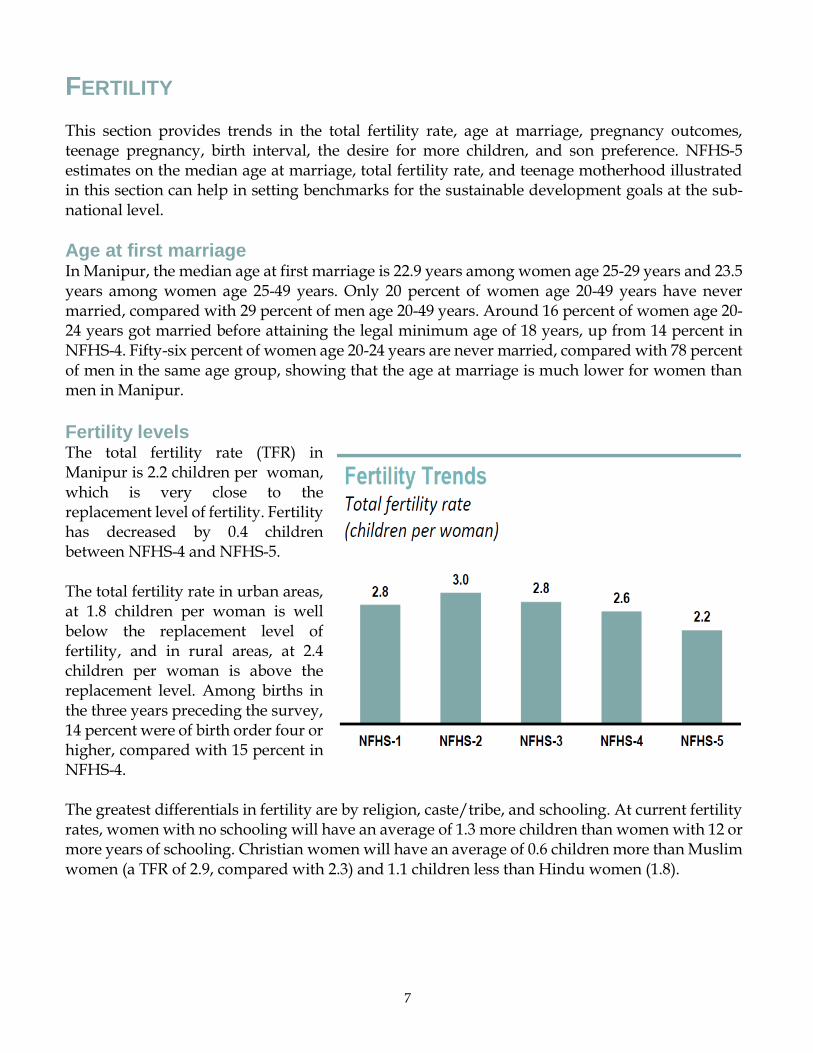
Fertility levels The total fertility rate (TFR) in Manipur is 2.2 children per woman, which is very close to the replacement level of fertility. Fertility has decreased by 0.4 children between NFHS-4 and NFHS-5. The total fertility rate in urban areas, at 1.8 children per woman is well below the replacement level of fertility, and in rural areas, at 2.4 children per woman is above the replacement level. Among births in the three years preceding the survey, 14 percent were of birth order four or higher, compared with 15 percent in NFHS-4.
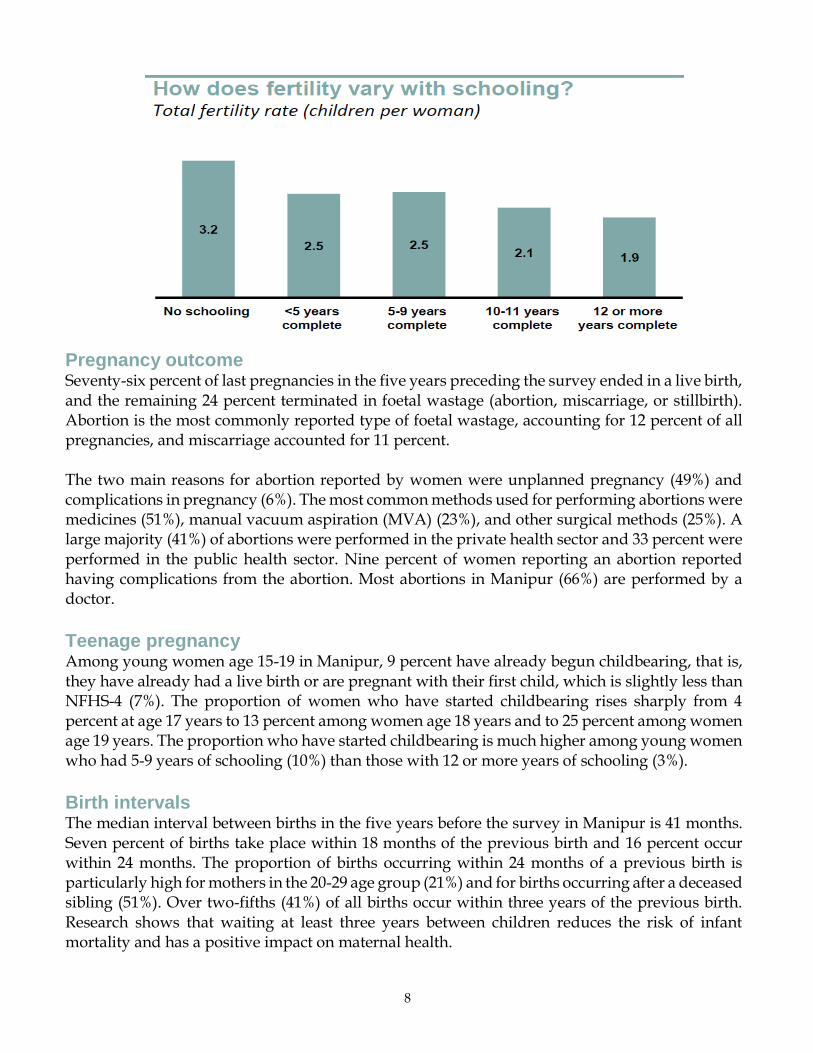
The greatest differentials in fertility are by religion, caste/tribe, and schooling. At current fertility rates, women with no schooling will have an average of 1.3 more children than women with 12 or more years of schooling. Christian women will have an average of 0.6 children more than Muslim women (a TFR of 2.9, compared with 2.3) and 1.1 children less than Hindu women (1.8).
8
Pregnancy outcome Seventy-six percent of last pregnancies in the five years preceding the survey ended in a live birth, and the remaining 24 percent terminated in foetal wastage (abortion, miscarriage, or stillbirth). Abortion is the most commonly reported type of foetal wastage, accounting for 12 percent of all pregnancies, and miscarriage accounted for 11 percent.
The two main reasons for abortion reported by women were unplanned pregnancy (49%) and complications in pregnancy (6%). The most common methods used for performing abortions were medicines (51%), manual vacuum aspiration (MVA) (23%), and other surgical methods (25%). A large majority (41%) of abortions were performed in the private health sector and 33 percent were performed in the public health sector. Nine percent of women reporting an abortion reported having complications from the abortion. Most abortions in Manipur (66%) are performed by a doctor.
Teenage pregnancy Among young women age 15-19 in Manipur, 9 percent have already begun childbearing, that is, they have already had a live birth or are pregnant with their first child, which is slightly less than NFHS-4 (7%). The proportion of women who have started childbearing rises sharply from 4 percent at age 17 years to 13 percent among women age 18 years and to 25 percent among women age 19 years. The proportion who have started childbearing is much higher among young women who had 5-9 years of schooling (10%) than those with 12 or more years of schooling (3%).
Birth intervals The median interval between births in the five years before the survey in Manipur is 41 months. Seven percent of births take place within 18 months of the previous birth and 16 percent occur within 24 months. The proportion of births occurring within 24 months of a previous birth is particularly high for mothers in the 20-29 age group (21%) and for births occurring after a deceased sibling (51%). Over two-fifths (41%) of all births occur within three years of the previous birth. Research shows that waiting at least three years between children reduces the risk of infant mortality and has a positive impact on maternal health.
9
More than two-fifths (41%) of births in Manipur occur within three years of the previous birth.
Fertility preferences Fifty-two percent of currently married women and 49 percent of men age 15-49 years want no more children, are already sterilized, or have a spouse who is sterilized. Among those who want another child, 47 percent of women and 52 percent of men would like to wait at least two years before the next birth. Forty-nine percent of women and 41 percent of men consider the ideal family size to be two or fewer children.
In Manipur, there is a strong preference for sons. Nearly one-quarter of women and one-third of men want more sons than daughters, but only 7 and 3 percent of women and men want more daughters than sons. However, over nine in ten women would like to have at least one son or daughter while eighty-eight percent of men want at least one son and 86 percent of men want at least one daughter.
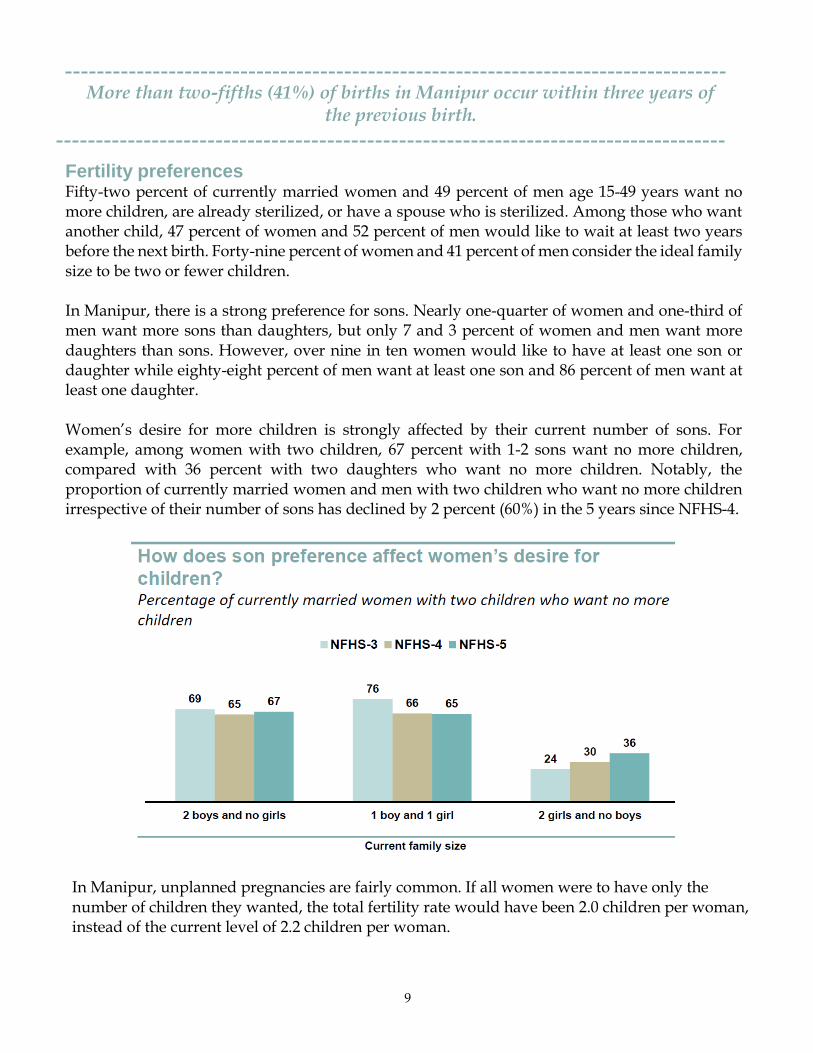
Women’s desire for more children is strongly affected by their current number of sons. For example, among women with two children, 67 percent with 1-2 sons want no more children, compared with 36 percent with two daughters who want no more children. Notably, the proportion of currently married women and men with two children who want no more children irrespective of their number of sons has declined by 2 percent (60%) in the 5 years since NFHS-4.
In Manipur, unplanned pregnancies are fairly common. If all women were to have only the number of children they wanted, the total fertility rate would have been 2.0 children per woman, instead of the current level of 2.2 children per woman.
10
FAMILY PLANNING The family planning section covers trends in contraceptive knowledge and current use, informed choice, and unmet need for family planning methods among women 15-49 years. It also includes information on men’s attitude towards women using a contraceptive method. As in previous rounds of the survey, NFHS-5 provides estimates of the contraceptive prevalence rate and unmet need for family planning.
Contraceptive knowledge and use Knowledge of contraception is almost universal (99%) in Manipur. However, some methods are still less well known. Only 30 percent of currently married women know about the lactational amenorrhoea method (LAM) and 20 percent know about female condoms. Among all women, only 43 percent know about emergency contraception.
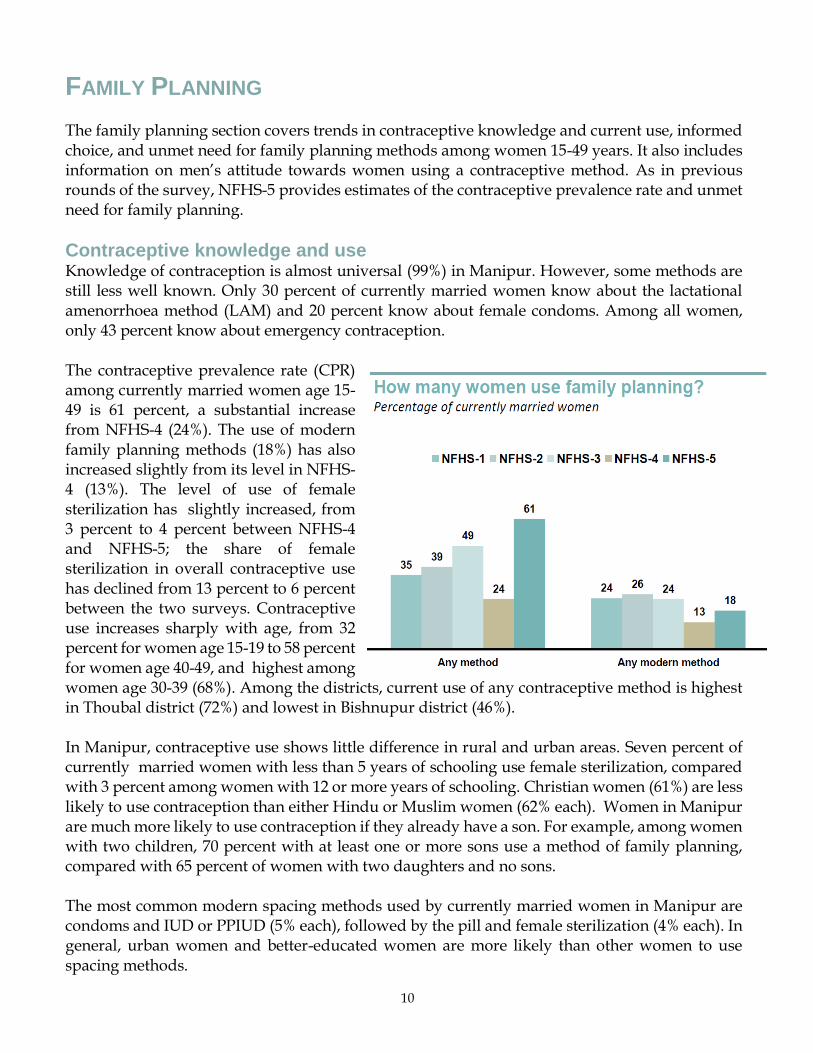
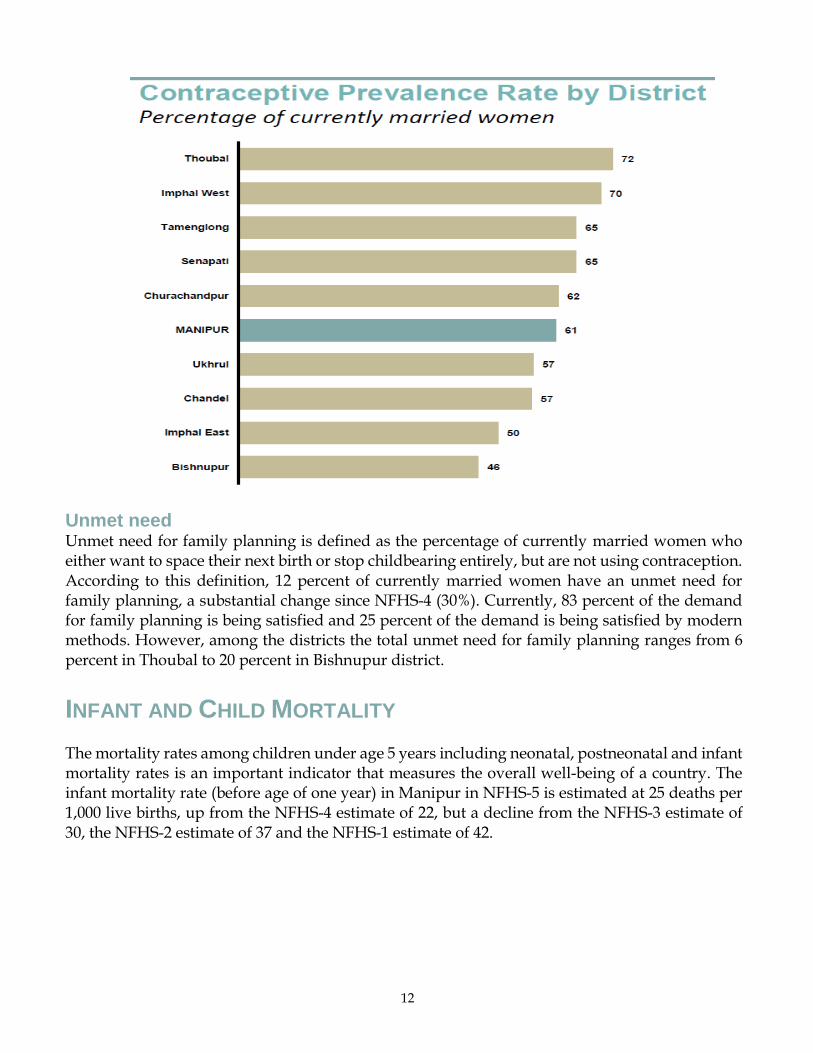
The contraceptive prevalence rate (CPR) among currently married women age 15-49 is 61 percent, a substantial increase from NFHS-4 (24%). The use of modern family planning methods (18%) has also increased slightly from its level in NFHS-4 (13%). The level of use of female sterilization has slightly increased, from 3 percent to 4 percent between NFHS-4 and NFHS-5; the share of female sterilization in overall contraceptive use has declined from 13 percent to 6 percent between the two surveys. Contraceptive use increases sharply with age, from 32 percent for women age 15-19 to 58 percent for women age 40-49, and highest among women age 30-39 (68%). Among the districts, current use of any contraceptive method is highest in Thoubal district (72%) and lowest in Bishnupur district (46%).
In Manipur, contraceptive use shows little difference in rural and urban areas. Seven percent of currently married women with less than 5 years of schooling use female sterilization, compared with 3 percent among women with 12 or more years of schooling. Christian women (61%) are less likely to use contraception than either Hindu or Muslim women (62% each). Women in Manipur are much more likely to use contraception if they already have a son. For example, among women with two children, 70 percent with at least one or more sons use a method of family planning, compared with 65 percent of women with two daughters and no sons.
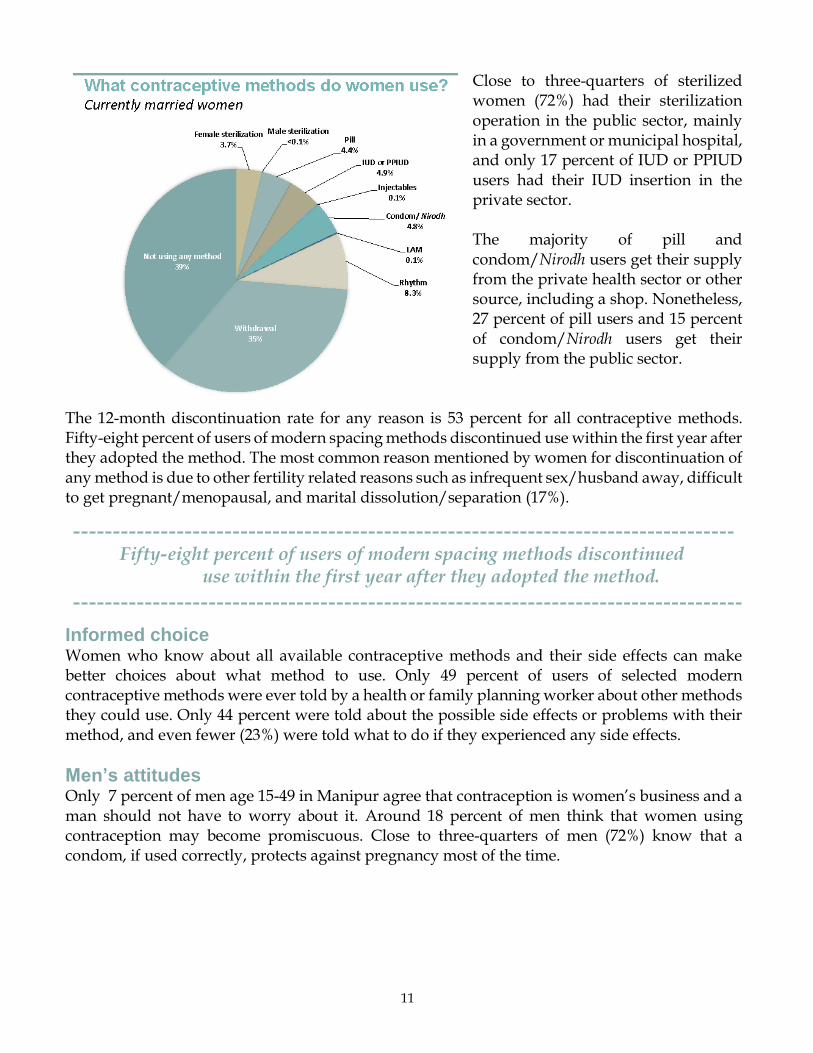
The most common modern spacing methods used by currently married women in Manipur are condoms and IUD or PPIUD (5% each), followed by the pill and female sterilization (4% each). In general, urban women and better-educated women are more likely than other women to use spacing methods.
11
Close to three-quarters of sterilized women (72%) had their sterilization operation in the public sector, mainly in a government or municipal hospital, and only 17 percent of IUD or PPIUD users had their IUD insertion in the private sector. The majority of pill and condom/Nirodh users get their supply from the private health sector or other source, including a shop. Nonetheless, 27 percent of pill users and 15 percent of condom/Nirodh users get their supply from the public sector.
The 12-month discontinuation rate for any reason is 53 percent for all contraceptive methods. Fifty-eight percent of users of modern spacing methods discontinued use within the first year after they adopted the method. The most common reason mentioned by women for discontinuation of any method is due to other fertility related reasons such as infrequent sex/husband away, difficult to get pregnant/menopausal, and marital dissolution/separation (17%).
Fifty-eight percent of users of modern spacing methods discontinued use within the first year after they adopted the method.
Informed choice Women who know about all available contraceptive methods and their side effects can make better choices about what method to use. Only 49 percent of users of selected modern contraceptive methods were ever told by a health or family planning worker about other methods they could use. Only 44 percent were told about the possible side effects or problems with their method, and even fewer (23%) were told what to do if they experienced any side effects.
Men’s attitudes Only 7 percent of men age 15-49 in Manipur agree that contraception is women’s business and a man should not have to worry about it. Around 18 percent of men think that women using contraception may become promiscuous. Close to three-quarters of men (72%) know that a condom, if used correctly, protects against pregnancy most of the time.
12
Unmet need Unmet need for family planning is defined as the percentage of currently married women who either want to space their next birth or stop childbearing entirely, but are not using contraception. According to this definition, 12 percent of currently married women have an unmet need for family planning, a substantial change since NFHS-4 (30%). Currently, 83 percent of the demand for family planning is being satisfied and 25 percent of the demand is being satisfied by modern methods. However, among the districts the total unmet need for family planning ranges from 6 percent in Thoubal to 20 percent in Bishnupur district.
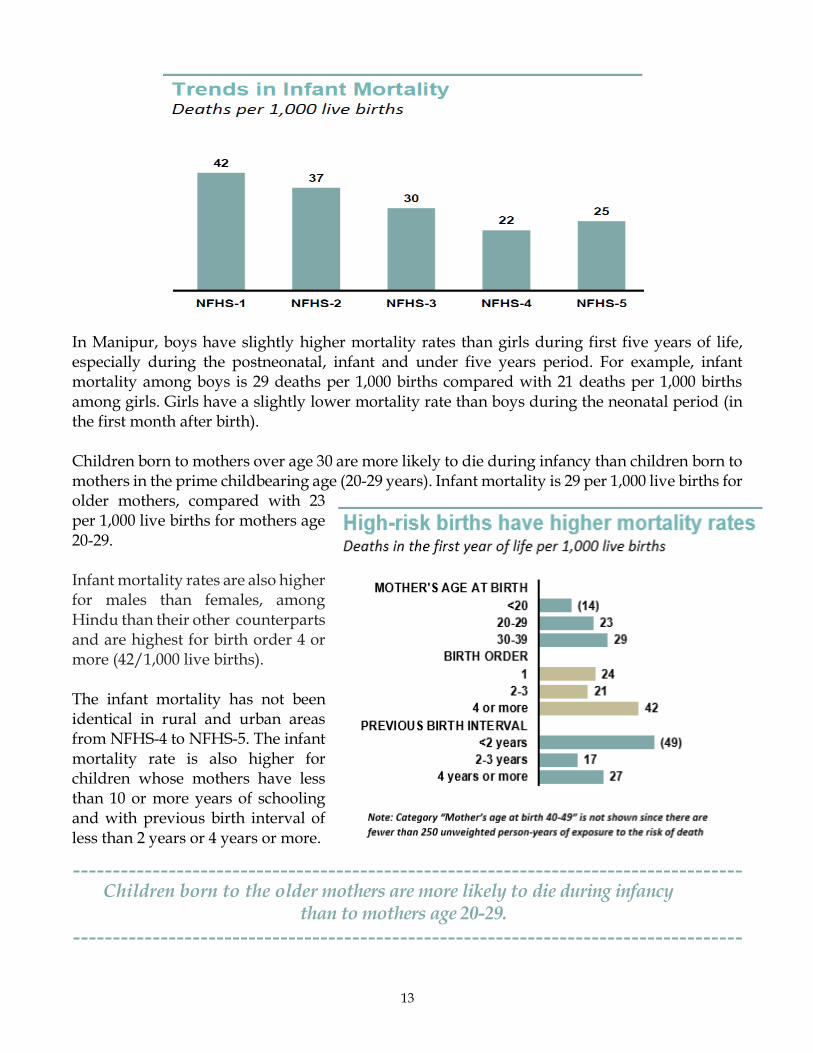
INFANT AND CHILD MORTALITY The mortality rates among children under age 5 years including neonatal, postneonatal and infant mortality rates is an important indicator that measures the overall well-being of a country. The infant mortality rate (before age of one year) in Manipur in NFHS-5 is estimated at 25 deaths per 1,000 live births, up from the NFHS-4 estimate of 22, but a decline from the NFHS-3 estimate of 30, the NFHS-2 estimate of 37 and the NFHS-1 estimate of 42.
13
In Manipur, boys have slightly higher mortality rates than girls during first five years of life, especially during the postneonatal, infant and under five years period. For example, infant mortality among boys is 29 deaths per 1,000 births compared with 21 deaths per 1,000 births among girls. Girls have a slightly lower mortality rate than boys during the neonatal period (in the first month after birth). Children born to mothers over age 30 are more likely to die during infancy than children born to mothers in the prime childbearing age (20-29 years). Infant mortality is 29 per 1,000 live births for older mothers, compared with 23 per 1,000 live births for mothers age 20-29. Infant mortality rates are also higher for males than females, among Hindu than their other counterparts and are highest for birth order 4 or more (42/1,000 live births). The infant mortality has not been identical in rural and urban areas from NFHS-4 to NFHS-5. The infant mortality rate is also higher for children whose mothers have less than 10 or more years of schooling and with previous birth interval of less than 2 years or 4 years or more.
Children born to the older mothers are more likely to die during infancy than to mothers age 20-29.
14
MATERNAL HEALTH Maternal health is an important aspect for the development of any country in terms of increasing equity and reducing poverty. The survival and well-being of mothers is not only important in their own right, but are also central to solving broader economic, social, and developmental challenges. Maternal health care services are essential for the health and wellbeing of mothers, as well as their children, affecting the overall population and its health and nutritional status. This section describes the utilization of antenatal care, delivery care, and postnatal care by women who reported their last births in the five years preceding the survey. It also shows the extent of male involvement in maternal health care.
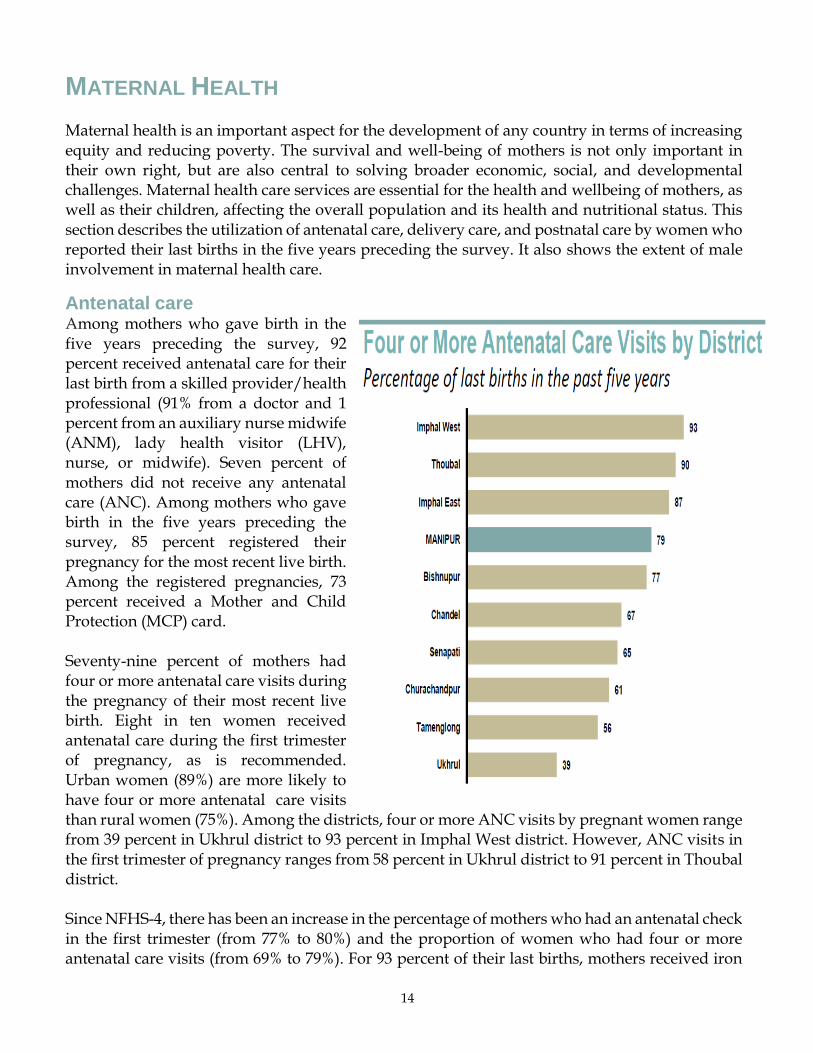
Antenatal care Among mothers who gave birth in the five years preceding the survey, 92 percent received antenatal care for their last birth from a skilled provider/health professional (91% from a doctor and 1 percent from an auxiliary nurse midwife (ANM), lady health visitor (LHV), nurse, or midwife). Seven percent of mothers did not receive any antenatal care (ANC). Among mothers who gave birth in the five years preceding the survey, 85 percent registered their pregnancy for the most recent live birth. Among the registered pregnancies, 73 percent received a Mother and Child Protection (MCP) card.
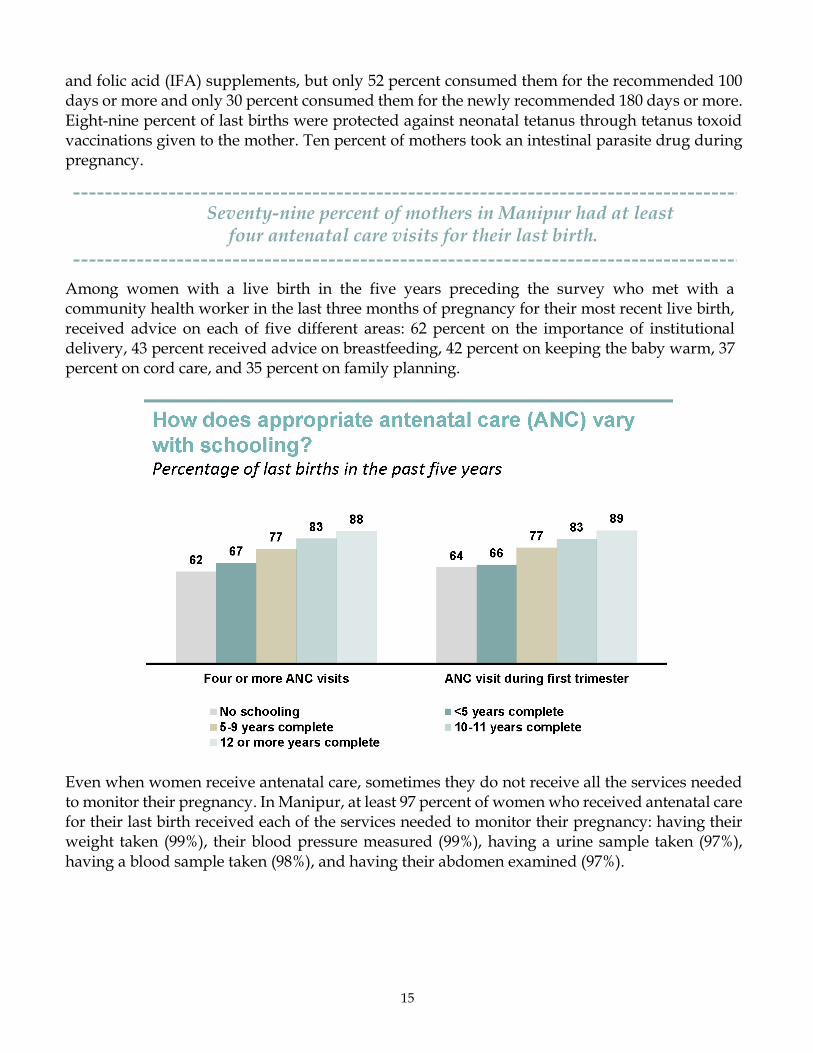
Seventy-nine percent of mothers had four or more antenatal care visits during the pregnancy of their most recent live birth. Eight in ten women received antenatal care during the first trimester of pregnancy, as is recommended. Urban women (89%) are more likely to have four or more antenatal care visits than rural women (75%). Among the districts, four or more ANC visits by pregnant women range from 39 percent in Ukhrul district to 93 percent in Imphal West district. However, ANC visits in the first trimester of pregnancy ranges from 58 percent in Ukhrul district to 91 percent in Thoubal district. Since NFHS-4, there has been an increase in the percentage of mothers who had an antenatal check in the first trimester (from 77% to 80%) and the proportion of women who had four or more antenatal care visits (from 69% to 79%). For 93 percent of their last births, mothers received iron
15
and folic acid (IFA) supplements, but only 52 percent consumed them for the recommended 100 days or more and only 30 percent consumed them for the newly recommended 180 days or more. Eight-nine percent of last births were protected against neonatal tetanus through tetanus toxoid vaccinations given to the mother. Ten percent of mothers took an intestinal parasite drug during pregnancy.
Seventy-nine percent of mothers in Manipur had at least four antenatal care visits for their last birth.
Among women with a live birth in the five years preceding the survey who met with a community health worker in the last three months of pregnancy for their most recent live birth, received advice on each of five different areas: 62 percent on the importance of institutional delivery, 43 percent received advice on breastfeeding, 42 percent on keeping the baby warm, 37 percent on cord care, and 35 percent on family planning.
Even when women receive antenatal care, sometimes they do not receive all the services needed to monitor their pregnancy. In Manipur, at least 97 percent of women who received antenatal care for their last birth received each of the services needed to monitor their pregnancy: having their weight taken (99%), their blood pressure measured (99%), having a urine sample taken (97%), having a blood sample taken (98%), and having their abdomen examined (97%).
16
An ultrasound test was performed for 75 percent of pregnancies in the five years preceding the survey. Women with at least 12 years of schooling were much more likely to have an ultrasound test than women with no schooling. Eighty-six percent of women with at least 12 years of schooling had an ultrasound test compared with 58 percent of women with no schooling. Pregnant women with no sons were much more likely to have an ultrasound test than those with at least one son. For example, among women with two children, those with no sons (76%) were much more likely to have an ultrasound test during their next pregnancy than those who had at least one son (60%).
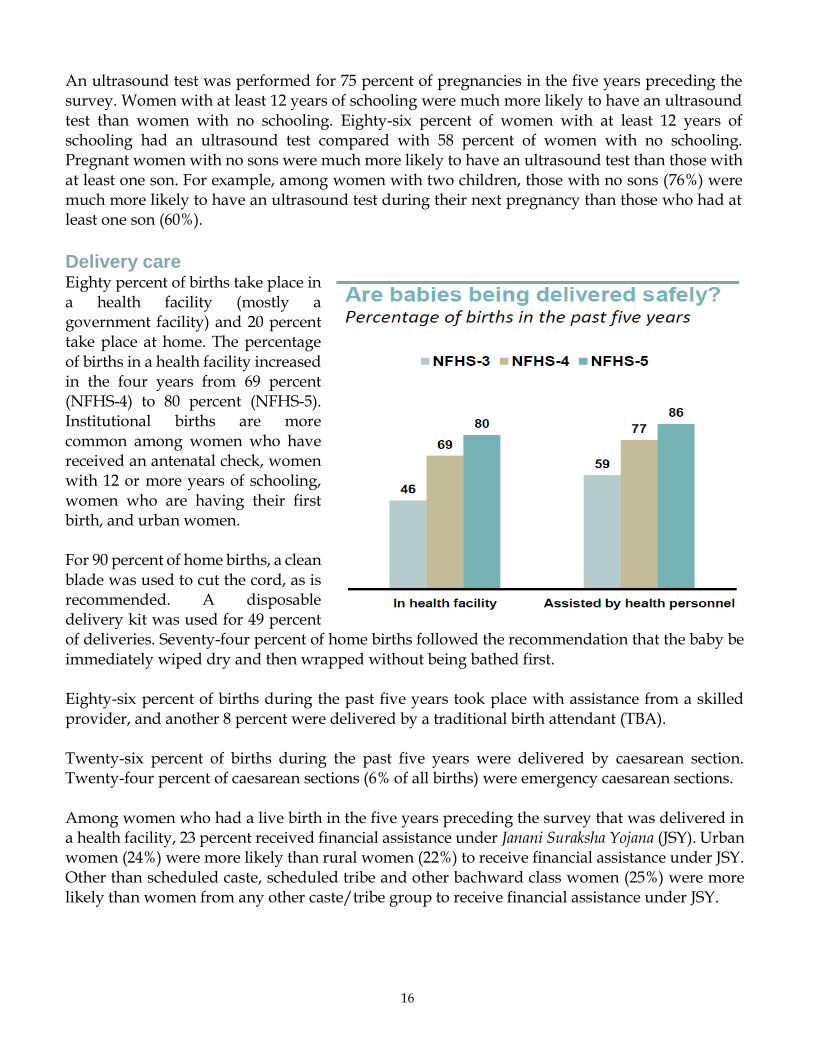
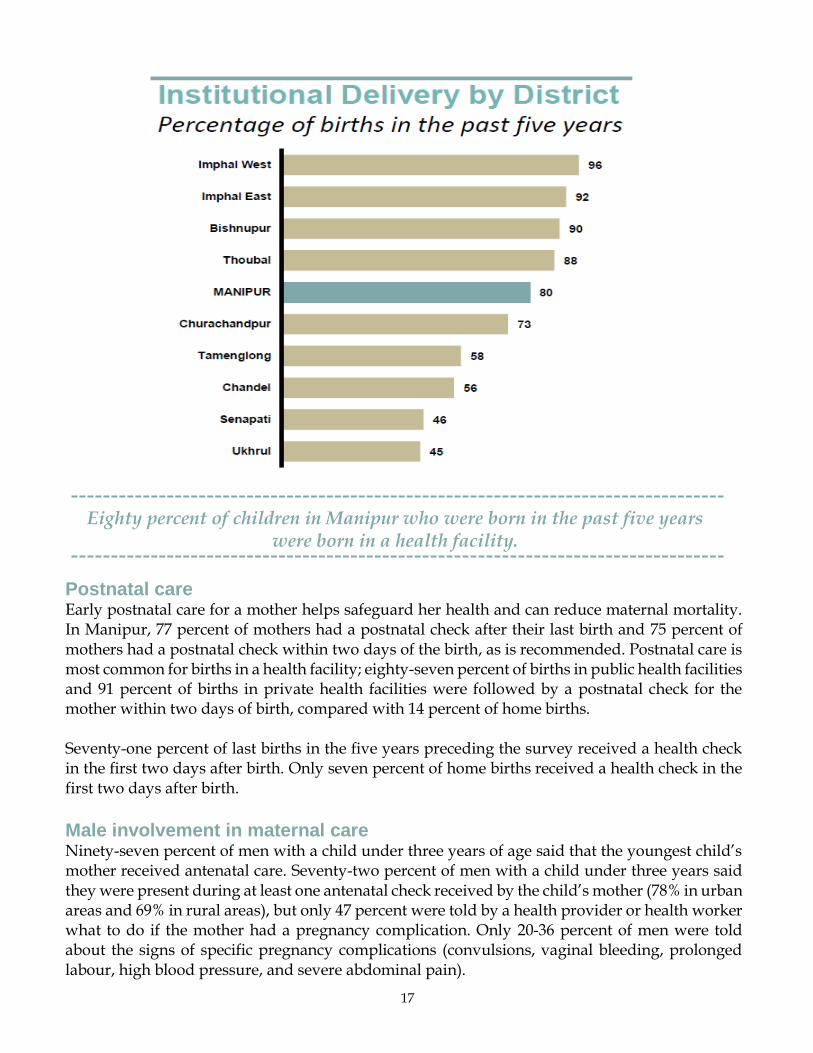
Delivery care Eighty percent of births take place in a health facility (mostly a government facility) and 20 percent take place at home. The percentage of births in a health facility increased in the four years from 69 percent (NFHS-4) to 80 percent (NFHS-5). Institutional births are more common among women who have received an antenatal check, women with 12 or more years of schooling, women who are having their first birth, and urban women. For 90 percent of home births, a clean blade was used to cut the cord, as is recommended. A disposable delivery kit was used for 49 percent of deliveries. Seventy-four percent of home births followed the recommendation that the baby be immediately wiped dry and then wrapped without being bathed first. Eighty-six percent of births during the past five years took place with assistance from a skilled provider, and another 8 percent were delivered by a traditional birth attendant (TBA).
Twenty-six percent of births during the past five years were delivered by caesarean section. Twenty-four percent of caesarean sections (6% of all births) were emergency caesarean sections.
Among women who had a live birth in the five years preceding the survey that was delivered in a health facility, 23 percent received financial assistance under Janani Suraksha Yojana (JSY). Urban women (24%) were more likely than rural women (22%) to receive financial assistance under JSY. Other than scheduled caste, scheduled tribe and other bachward class women (25%) were more likely than women from any other caste/tribe group to receive financial assistance under JSY.
17
Eighty percent of children in Manipur who were born in the past five years were born in a health facility.
Postnatal care Early postnatal care for a mother helps safeguard her health and can reduce maternal mortality. In Manipur, 77 percent of mothers had a postnatal check after their last birth and 75 percent of mothers had a postnatal check within two days of the birth, as is recommended. Postnatal care is most common for births in a health facility; eighty-seven percent of births in public health facilities and 91 percent of births in private health facilities were followed by a postnatal check for the mother within two days of birth, compared with 14 percent of home births.
Seventy-one percent of last births in the five years preceding the survey received a health check in the first two days after birth. Only seven percent of home births received a health check in the first two days after birth.
Male involvement in maternal care Ninety-seven percent of men with a child under three years of age said that the youngest child’s mother received antenatal care. Seventy-two percent of men with a child under three years said they were present during at least one antenatal check received by the child’s mother (78% in urban areas and 69% in rural areas), but only 47 percent were told by a health provider or health worker what to do if the mother had a pregnancy complication. Only 20-36 percent of men were told about the signs of specific pregnancy complications (convulsions, vaginal bleeding, prolonged labour, high blood pressure, and severe abdominal pain).
18
Most fathers with a child less than three years of age were given information about various aspects of maternal care. Seventy-nine percent of men were told about the importance of proper nutrition for the mother during pregnancy and 74 percent of men were told about the importance of delivering the baby in a health facility. Forty-eight percent of men were told by a health provider or a health worker about family planning or delaying the next child.
CHILD HEALTH
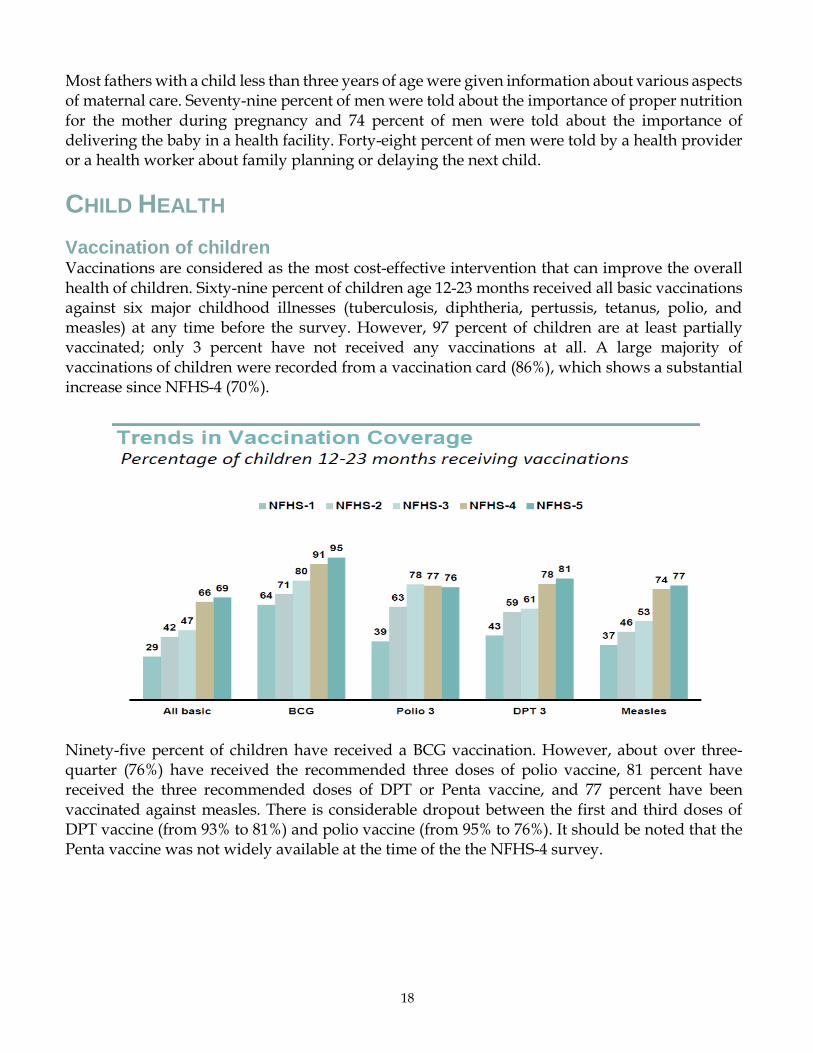
Vaccination of children Vaccinations are considered as the most cost-effective intervention that can improve the overall health of children. Sixty-nine percent of children age 12-23 months received all basic vaccinations against six major childhood illnesses (tuberculosis, diphtheria, pertussis, tetanus, polio, and measles) at any time before the survey. However, 97 percent of children are at least partially vaccinated; only 3 percent have not received any vaccinations at all. A large majority of vaccinations of children were recorded from a vaccination card (86%), which shows a substantial increase since NFHS-4 (70%).
Ninety-five percent of children have received a BCG vaccination. However, about over three-quarter (76%) have received the recommended three doses of polio vaccine, 81 percent have received the three recommended doses of DPT or Penta vaccine, and 77 percent have been vaccinated against measles. There is considerable dropout between the first and third doses of DPT vaccine (from 93% to 81%) and polio vaccine (from 95% to 76%). It should be noted that the Penta vaccine was not widely available at the time of the the NFHS-4 survey.
19
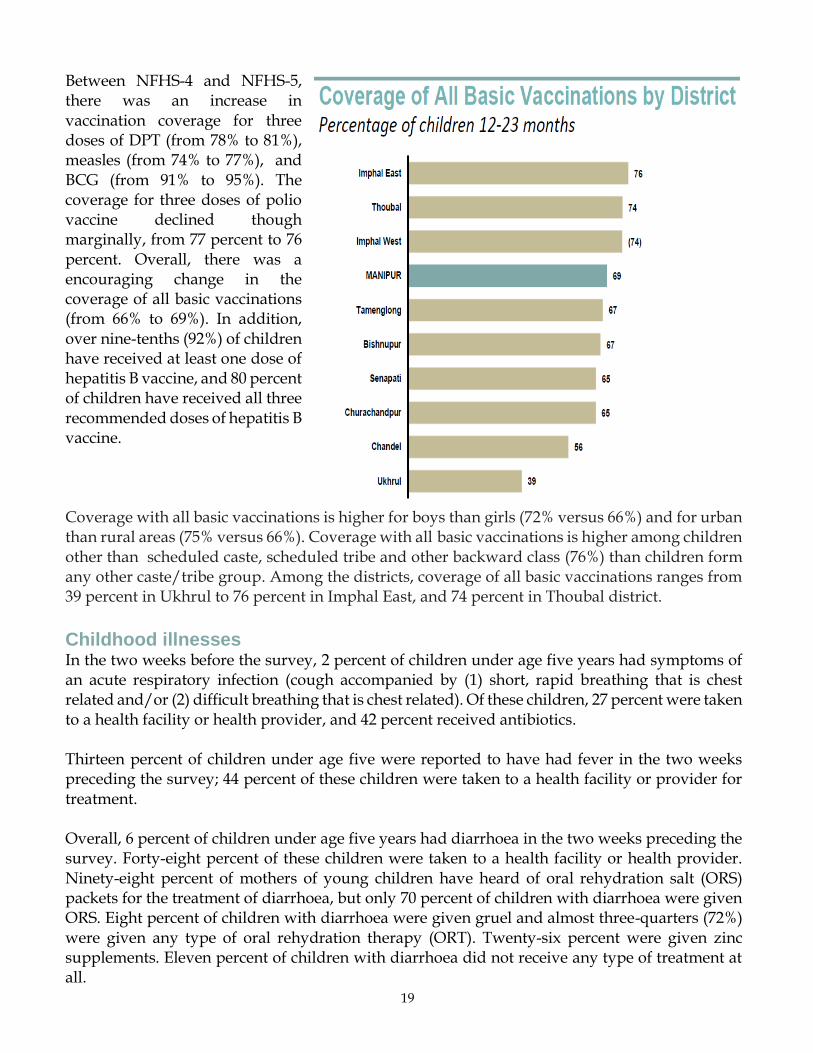
Between NFHS-4 and NFHS-5, there was an increase in vaccination coverage for three doses of DPT (from 78% to 81%), measles (from 74% to 77%), and BCG (from 91% to 95%). The coverage for three doses of polio vaccine declined though marginally, from 77 percent to 76 percent. Overall, there was a encouraging change in the coverage of all basic vaccinations (from 66% to 69%). In addition, over nine-tenths (92%) of children have received at least one dose of hepatitis B vaccine, and 80 percent of children have received all three recommended doses of hepatitis B vaccine.
Coverage with all basic vaccinations is higher for boys than girls (72% versus 66%) and for urban than rural areas (75% versus 66%). Coverage with all basic vaccinations is higher among children other than scheduled caste, scheduled tribe and other backward class (76%) than children form any other caste/tribe group. Among the districts, coverage of all basic vaccinations ranges from 39 percent in Ukhrul to 76 percent in Imphal East, and 74 percent in Thoubal district.
Childhood illnesses In the two weeks before the survey, 2 percent of children under age five years had symptoms of an acute respiratory infection (cough accompanied by (1) short, rapid breathing that is chest related and/or (2) difficult breathing that is chest related). Of these children, 27 percent were taken to a health facility or health provider, and 42 percent received antibiotics.
Thirteen percent of children under age five were reported to have had fever in the two weeks preceding the survey; 44 percent of these children were taken to a health facility or provider for treatment.
Overall, 6 percent of children under age five years had diarrhoea in the two weeks preceding the survey. Forty-eight percent of these children were taken to a health facility or health provider. Ninety-eight percent of mothers of young children have heard of oral rehydration salt (ORS) packets for the treatment of diarrhoea, but only 70 percent of children with diarrhoea were given ORS. Eight percent of children with diarrhoea were given gruel and almost three-quarters (72%) were given any type of oral rehydration therapy (ORT). Twenty-six percent were given zinc supplements. Eleven percent of children with diarrhoea did not receive any type of treatment at all.
20
To reduce dehydration and minimise the effects of diarrhoea on nutritional status, it is recommended that normal feeding of children be continued when they have diarrhoea and that the amount of fluids given should be increased. However, in Manipur only 6 percent of children with diarrhoea received more to drink than normal. Only 40 percent of children received the same amount to drink as usual. Of greater concern is that more than half of children (54%) with diarrhoea were given less to drink or nothing at all to drink. Only 36 percent of children with diarrhoea were given the same amount of food or more food, as recommended.
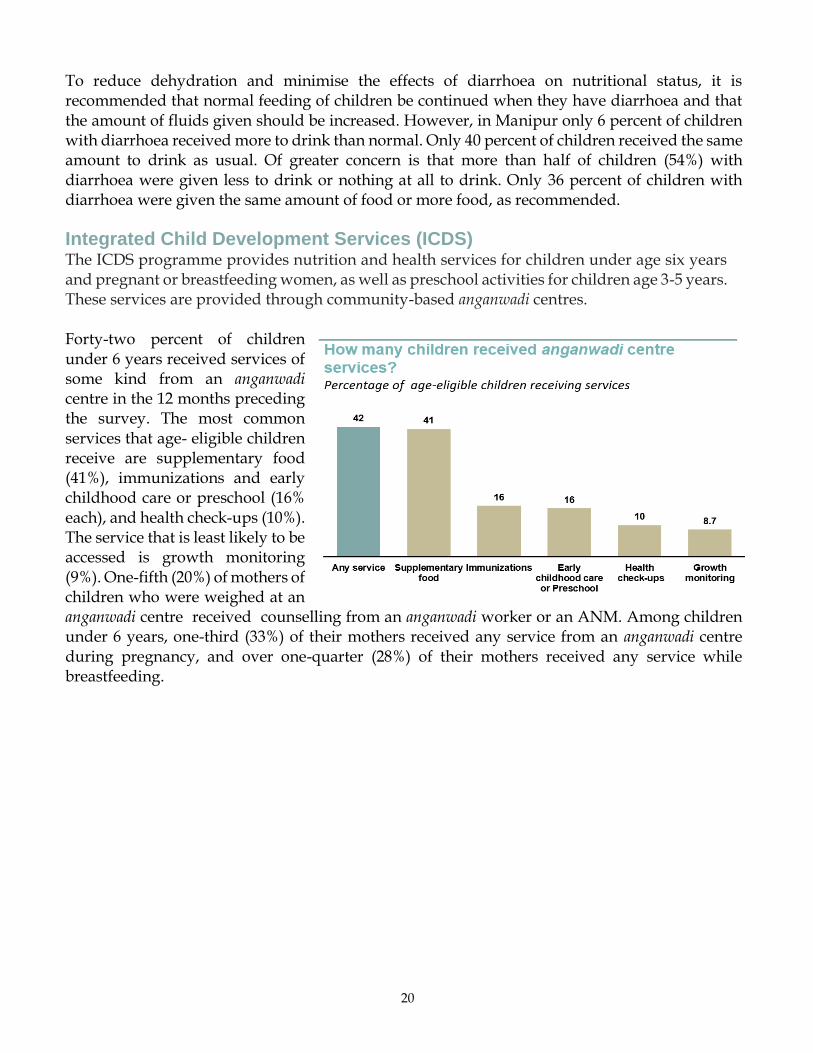
Integrated Child Development Services (ICDS) The ICDS programme provides nutrition and health services for children under age six years and pregnant or breastfeeding women, as well as preschool activities for children age 3-5 years. These services are provided through community-based anganwadi centres. Forty-two percent of children under 6 years received services of some kind from an anganwadi centre in the 12 months preceding the survey. The most common services that age- eligible children receive are supplementary food (41%), immunizations and early childhood care or preschool (16% each), and health check-ups (10%). The service that is least likely to be accessed is growth monitoring (9%). One-fifth (20%) of mothers of children who were weighed at an anganwadi centre received counselling from an anganwadi worker or an ANM. Among children under 6 years, one-third (33%) of their mothers received any service from an anganwadi centre during pregnancy, and over one-quarter (28%) of their mothers received any service while breastfeeding.
21
BREASTFEEDING, NUTRITION, AND ANAEMIA Infant feeding Although breastfeeding is nearly universal in Manipur, only 71 percent of children under 6 months are exclusively breastfed, as the World Health Organization (WHO) recommends. Eighty-nine percent are put to the breast within the first day of life, but only 53 percent started breastfeeding in the first hour of life (as recommended). While exclusive breastfeeding indicators show an improvement since NFHS-4, many infants are still deprived of the highly nutritious first milk (colostrum) and the antibodies it contains. Children breastfed within one hour of birth is highest with 68 percent in Tamenglong district and least with 43 percent in Bishnupur district.
It is recommended that nothing be given to children other than breastmilk even in the first three days when the milk has not begun to flow regularly because prelacteal feeds limit the frequency of suckling by the infant and expose the baby to the risk of infection. However, 29 percent of children are given something other than breastmilk during the first three days. Overall, 94 percent of children continue breastfeeding at 1 year and more than eight-tenths (85%) continue breastfeeding at 2 years.
After the first 6 months, breastmilk is no longer enough to meet the nutritional needs of infants. Therefore, complementary foods should be added to the diet of the child. However, at age 6-8 months, only 79 percent of children in Manipur receive breastmilk and complementary foods.
WHO has several recommendations for infant and young child feeding (IYCF) practices for children age 6-23 months. The key IYCF indicators measure the adequacy of dietary diversity and meal frequency for breastfed and non-breastfed children. Over two-fifths (45%) of children age 6-23 months are fed the recommended minimum number of times per day and nearly two-fifths (40%) are fed with minimum dietary diversity, and only 19 percent fed with minimum acceptable diet.
Micronutrient deficiency is a major component of childhood undernutrition and a significant contributor to childhood morbidity and mortality. Vitamin A is an essential nutrient for growth, immunity, and vision. Severe vitamin A deficiency (VAD) can cause eye damage and a higher risk of dying from measles and diarrhoeal disease. The Government of India recommends that children under 5 years of age receive vitamin A supplements every six months, starting at age 9 months. In Manipur, more than two-fifths (45%) of children age 9-35 months were given a vitamin A supplement in the last six months, but 76 percent of children age 6-23 months living with their mother consumed vitamin A-rich foods during the day or night before the survey.
Iron deficiency is a primary cause of anaemia. Eating foods rich in iron and taking iron supplements can help prevent anaemia. Fifty-eight percent of children age 6-23 months ate iron-rich foods during the day or night before the survey; however, only 7 percent of children in the same age group were given iron supplements in the week before the survey.
22
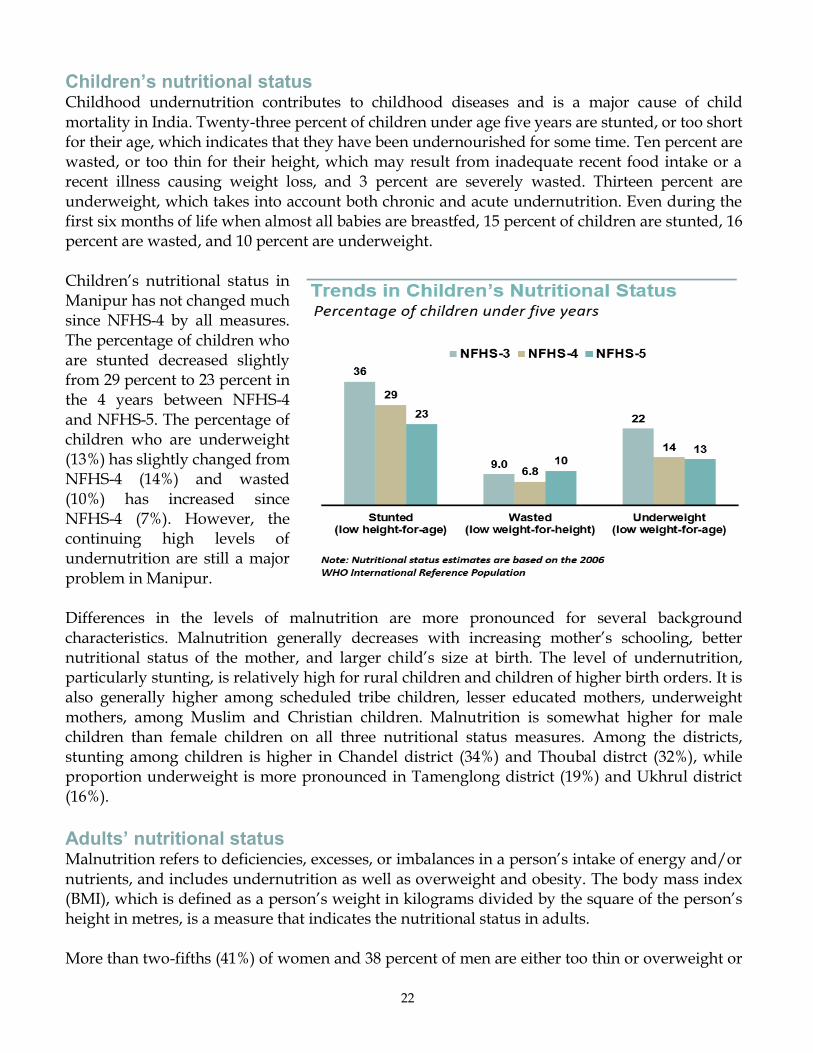
Children’s nutritional status Childhood undernutrition contributes to childhood diseases and is a major cause of child mortality in India. Twenty-three percent of children under age five years are stunted, or too short for their age, which indicates that they have been undernourished for some time. Ten percent are wasted, or too thin for their height, which may result from inadequate recent food intake or a recent illness causing weight loss, and 3 percent are severely wasted. Thirteen percent are underweight, which takes into account both chronic and acute undernutrition. Even during the first six months of life when almost all babies are breastfed, 15 percent of children are stunted, 16 percent are wasted, and 10 percent are underweight.
Children’s nutritional status in Manipur has not changed much since NFHS-4 by all measures. The percentage of children who are stunted decreased slightly from 29 percent to 23 percent in the 4 years between NFHS-4 and NFHS-5. The percentage of children who are underweight (13%) has slightly changed from NFHS-4 (14%) and wasted (10%) has increased since NFHS-4 (7%). However, the continuing high levels of undernutrition are still a major problem in Manipur. Differences in the levels of malnutrition are more pronounced for several background characteristics. Malnutrition generally decreases with increasing mother’s schooling, better nutritional status of the mother, and larger child’s size at birth. The level of undernutrition, particularly stunting, is relatively high for rural children and children of higher birth orders. It is also generally higher among scheduled tribe children, lesser educated mothers, underweight mothers, among Muslim and Christian children. Malnutrition is somewhat higher for male children than female children on all three nutritional status measures. Among the districts, stunting among children is higher in Chandel district (34%) and Thoubal distrct (32%), while proportion underweight is more pronounced in Tamenglong district (19%) and Ukhrul district (16%).
Adults’ nutritional status Malnutrition refers to deficiencies, excesses, or imbalances in a person’s intake of energy and/or nutrients, and includes undernutrition as well as overweight and obesity. The body mass index (BMI), which is defined as a person’s weight in kilograms divided by the square of the person’s height in metres, is a measure that indicates the nutritional status in adults.
More than two-fifths (41%) of women and 38 percent of men are either too thin or overweight or
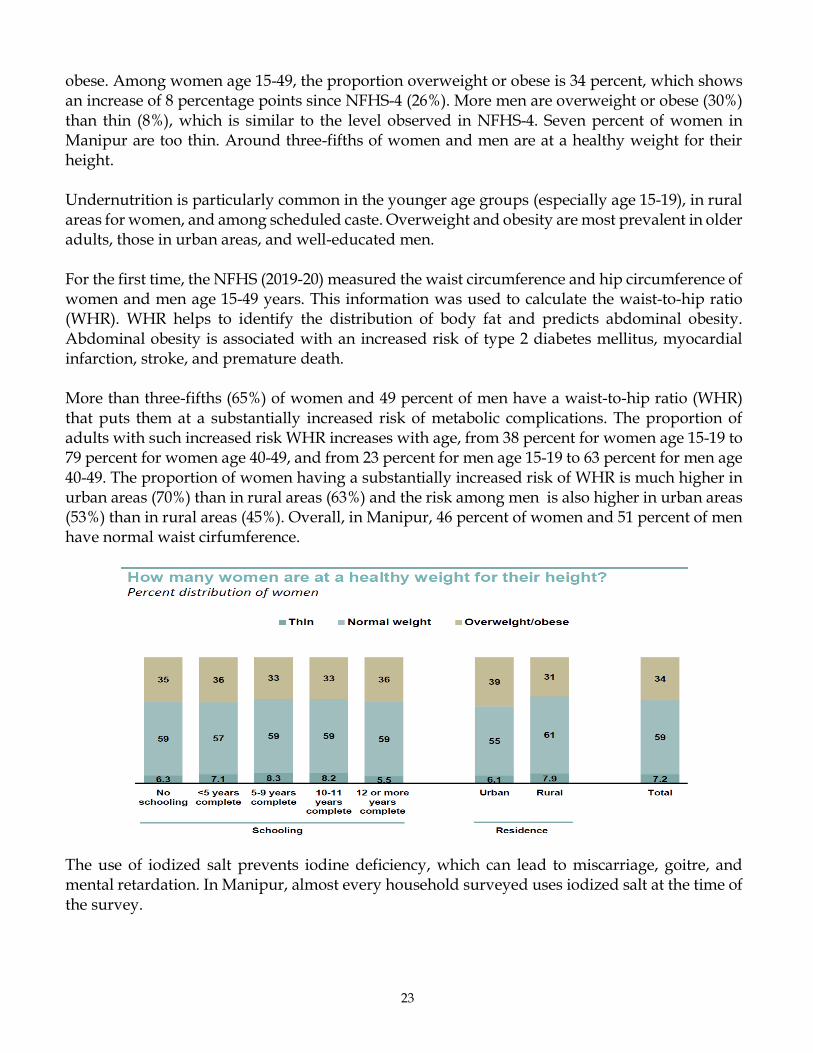
23
obese. Among women age 15-49, the proportion overweight or obese is 34 percent, which shows an increase of 8 percentage points since NFHS-4 (26%). More men are overweight or obese (30%) than thin (8%), which is similar to the level observed in NFHS-4. Seven percent of women in Manipur are too thin. Around three-fifths of women and men are at a healthy weight for their height.
Undernutrition is particularly common in the younger age groups (especially age 15-19), in rural areas for women, and among scheduled caste. Overweight and obesity are most prevalent in older adults, those in urban areas, and well-educated men.
For the first time, the NFHS (2019-20) measured the waist circumference and hip circumference of women and men age 15-49 years. This information was used to calculate the waist-to-hip ratio (WHR). WHR helps to identify the distribution of body fat and predicts abdominal obesity. Abdominal obesity is associated with an increased risk of type 2 diabetes mellitus, myocardial infarction, stroke, and premature death.
More than three-fifths (65%) of women and 49 percent of men have a waist-to-hip ratio (WHR) that puts them at a substantially increased risk of metabolic complications. The proportion of adults with such increased risk WHR increases with age, from 38 percent for women age 15-19 to 79 percent for women age 40-49, and from 23 percent for men age 15-19 to 63 percent for men age 40-49. The proportion of women having a substantially increased risk of WHR is much higher in urban areas (70%) than in rural areas (63%) and the risk among men is also higher in urban areas (53%) than in rural areas (45%). Overall, in Manipur, 46 percent of women and 51 percent of men have normal waist cirfumference.
The use of iodized salt prevents iodine deficiency, which can lead to miscarriage, goitre, and mental retardation. In Manipur, almost every household surveyed uses iodized salt at the time of the survey.
24
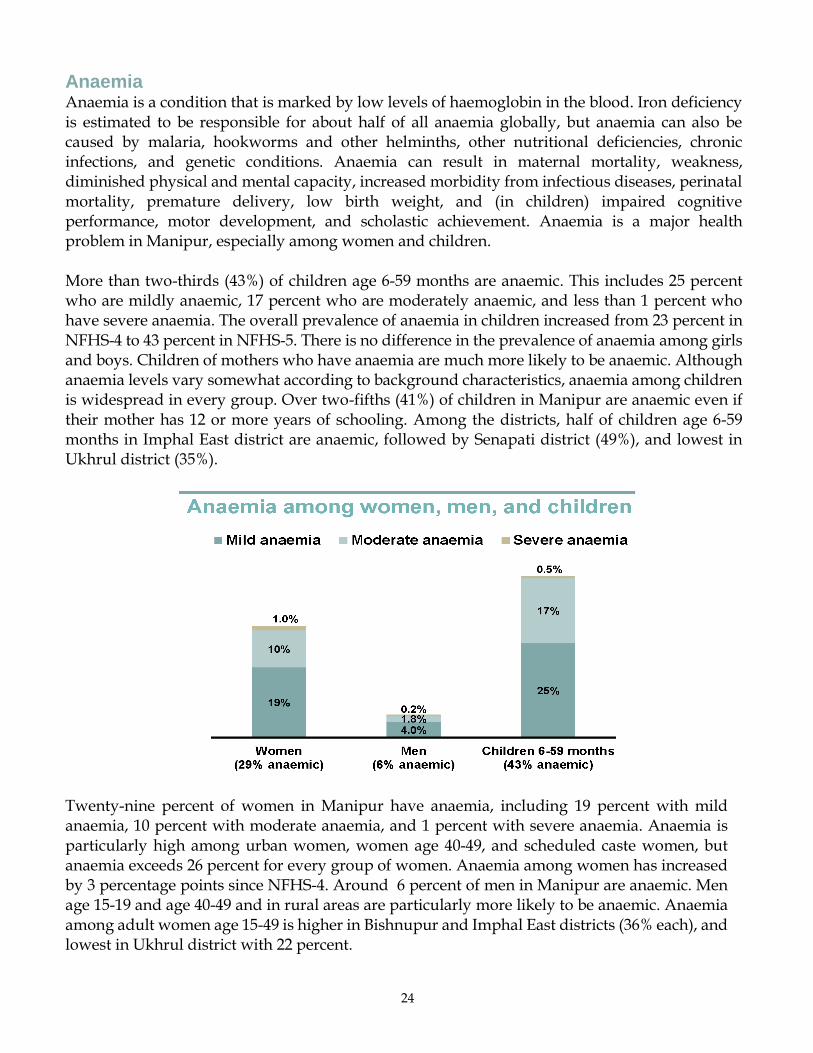
Anaemia Anaemia is a condition that is marked by low levels of haemoglobin in the blood. Iron deficiency is estimated to be responsible for about half of all anaemia globally, but anaemia can also be caused by malaria, hookworms and other helminths, other nutritional deficiencies, chronic infections, and genetic conditions. Anaemia can result in maternal mortality, weakness, diminished physical and mental capacity, increased morbidity from infectious diseases, perinatal mortality, premature delivery, low birth weight, and (in children) impaired cognitive performance, motor development, and scholastic achievement. Anaemia is a major health problem in Manipur, especially among women and children. More than two-thirds (43%) of children age 6-59 months are anaemic. This includes 25 percent who are mildly anaemic, 17 percent who are moderately anaemic, and less than 1 percent who have severe anaemia. The overall prevalence of anaemia in children increased from 23 percent in NFHS-4 to 43 percent in NFHS-5. There is no difference in the prevalence of anaemia among girls and boys. Children of mothers who have anaemia are much more likely to be anaemic. Although anaemia levels vary somewhat according to background characteristics, anaemia among children is widespread in every group. Over two-fifths (41%) of children in Manipur are anaemic even if their mother has 12 or more years of schooling. Among the districts, half of children age 6-59 months in Imphal East district are anaemic, followed by Senapati district (49%), and lowest in Ukhrul district (35%).
Twenty-nine percent of women in Manipur have anaemia, including 19 percent with mild anaemia, 10 percent with moderate anaemia, and 1 percent with severe anaemia. Anaemia is particularly high among urban women, women age 40-49, and scheduled caste women, but anaemia exceeds 26 percent for every group of women. Anaemia among women has increased by 3 percentage points since NFHS-4. Around 6 percent of men in Manipur are anaemic. Men age 15-19 and age 40-49 and in rural areas are particularly more likely to be anaemic. Anaemia among adult women age 15-49 is higher in Bishnupur and Imphal East districts (36% each), and lowest in Ukhrul district with 22 percent.
25
ADULT HEALTH AND HEALTH CARE Tuberculosis Tuberculosis is an infectious disease caused by a type of bacterium called Mycobacterium tuberculosis, which primarily affects the lungs. Tuberculosis is transmitted from person to person through the air, and people with lowered immunity, HIV, malnutrition, diabetes, and those who use tobacco or alcoholhave higher chances of falling ill. Tuberculosis is both preventable and curable, however mortality is high if not treated properly. In Manipur, 425 persons per 100,000 are estimated to have medically treated tuberculosis, based on reports from household respondents. The prevalence of medically treated tuberculosis is lower among men (373 per 100,000) than among women (475 per 100,000) and is higher in urban areas (379 per 100,000) than in rural areas (453 per 100,000).
A large majority of respondents have heard of tuberculosis (98% of women and 96% of men), but even among those who have heard of tuberculosis, only 86 percent of women and 90 percent of men know that it is spread through the air by coughing or sneezing. Less than one-third (31%) of women and 25 percent of men have misconceptions about how tuberculosis is spread. Overall, 92 percent of women and 90 percent of men know that tuberculosis can be cured, and only 5 percent of women and 6 percent of men say that if a family member had tuberculosis, they would want to keep it a secret.
Diabetes, asthma, goitre, heart disease, and cancer According to self-reports, 1,107 women and 1,037 men age 15-49 per 100,000 have diabetes. Overall, 1,395 women and 2,155 men per 100,000 suffer from asthma. The prevalence of asthma among women and men is higher in older age groups, those in urban women and rural men. Goitre is more common than asthma or diabetes among women, but less common than asthma or diabetes among men (2,989 women and 566 men per 100,000). The prevalence of any heart disease is lower among women (1,200 per 100,000) than among men (1,710 per 100,000). Among the five diseases, cancer is the least common, with 110 women and 233 men per 100,000 reportedly having cancer.
Blood pressure (hypertension) Blood pressure is the force exerted by circulating blood against the arterial walls. Hypertension or high blood pressure is a condition in which the blood vessels have persistently raised pressure. Hypertension is major risk factor for cardiovascular diseases, chronic kidney diseases, and brain diseases, and it is a major cause of premature deaths worldwide. Some of the risk factors for developing hypertension are unhealthy diets, physical inactivity, alcohol and tobacco consumption, and excess body weight.
Fourteen percent of women age 15-49 in Manipur have hypertension, including 9 percent with Stage 1 hypertension, 3 percent with Stage 2 hypertension, and 1 percent with Stage 3 hypertension. Hypertension also includes women with normal blood pressure who are taking medicine to lower their blood pressure. Half of women have normal blood pressure.
26
The prevalence of hypertension among men age 15-49 is somewhat higher than among women. Twenty-six percent of men in Manipur have hypertension, including 19 percent with Stage 1 hypertension, 5 percent with Stage 2 hypertension, and 1 percent with Stage 3 hypertension. Hypertension also includes men with normal blood pressure who are taking medicine to lower their blood pressure. Twenty-four percent of men have normal blood pressure. For both women and men, hypertension increases with age.
Blood glucose Diabetes mellitus is a chronic metabolic disease characterized by elevated levels of blood glucose. Diabetes over a period of time can cause severe damage to the heart, blood vessels, retina, kidneys, and nerves, and it puts sufferers at increased risk of various infectious and non-infectious diseases. Early diagnosis, determined by blood glucose testing, and adequate treatment are the key steps for managing diabetes and its complication. NFHS-5 has included random blood glucose measurement using capillary blood among women and men age 15 and above.
In Manipur, four percent of women age 15-49 have high blood glucose level, and 4 percent have very high blood glucose level. Similarly, 5 percent of men age 15-49 have high blood glucose level, and 5 percent have very high blood glucose level. Women in older age groups and those with less than 5 years of schooling have relatively higher blood glucose levels and in case of men, only age matters. Men are more likely than women to have normal blood glucose levels and are taking medicine to lower their blood glucose level (3% of men versus 1% of women). Less than one percent of both women (0.7%) and men (0.3%) have blood glucose levels ≥140 mg/dl and are taking medicine to lower their blood glucose level.
Screening tests for cancer Cancer is a group of diseases with high mortality, and it is the second leading cause of death globally. The chances of successful treatment of cancer increase if diagnosed early. One way of early detection is screening, which is identification of unrecognized disease by using simple tests or examinations among those individuals who have the disease but do not yet have symptoms. NFHS-5 collected information about whether respondents had ever undergone screening test for cancer of the oral cavity, breast, and cervix.
In Manipur, only 1 percent of women age 15-49 have ever undergone a screening test for cancer in both cervix and breast, and less than 1 percent have ever undergone a screening test for cancer of the oral cavity, which is slightly less in men (0.7%).
Health insurance Universal access to health care is the absence of any barriers in health care, including economic barriers. Adequate coverage by health insurance protects a person from financial hardships because of the costs of health care. Despite the emergence of a number of health insurance programmes and health schemes in India, only 14 percent of households surveyed in Manipur have any kind of health insurance that covers at least one member of the household. Health insurance coverage is not equal in rural areas (15%) and urban areas (12%). In Manipur, three
27
types of programmes dominate: the Central Government Health Scheme (CGHS), the State Health Insurance Scheme, and the Rashtriya Swasthya Bima Yojana (RSBY).
Only 8 percent of women and 7 percent of men age 15-49 in Manipur are covered by any health scheme insurance/financing scheme. Older women and men are more likely to be covered than younger women and men. Health insurance/financing scheme coverage is higher among men with 8-9 years of schooling (9%) than among those with no schooling (2%).
Tobacco and alcohol use Over two-thirds (67%) of men, but 42 percent of women, age 15-49 use some form of tobacco. Tobacco products mostly used by men are paan with tobacco (42%), cigarettes (36%), and khaini (20%). Among women and men, the use of any form of tobacco is slightly higher in rural areas (44% for women and 72% for men) than in urban areas (37% for women and 61% for men). Most women and men who smoke cigarettes smoked fewer than five cigarettes in the past 24 hours.
In Manipur, among adults age 15-49, 14 percent of women and 32 percent of men drink alcohol, and the consumption is higher in the rural areas. In rural areas, 14 percent of women and 33 percent of men drink alcohol. In urban areas, 13 percent of women and 31 percent of men drink alcohol. Most men who drink alcohol, drink it about once a week (46%) or less than once a week (44%), and 10 percent drink almost every day.
HIV/AIDS This section presents the findings from NFHS-5 on HIV/AIDS knowledge and attitudes, prior
HIV testing, and the prevalence of sexually transmitted infections (STIs), as well as sexual
behaviour of the adult and youth population. Questions on HIV/AIDS were included only in the
subsample of households selected for the state module.
Awareness of HIV or AIDS More than 99 percent of women and men age 15-49 in Manipur have heard of HIV or AIDS. As awareness about HIV or AIDS is nearly universal, there is no perceptible difference in awareness by residence, age, sex, education, caste/tribe, etc. However, gaps in knowledge existed in terms of attitudes,prevention and transmission of HIV/AIDS.
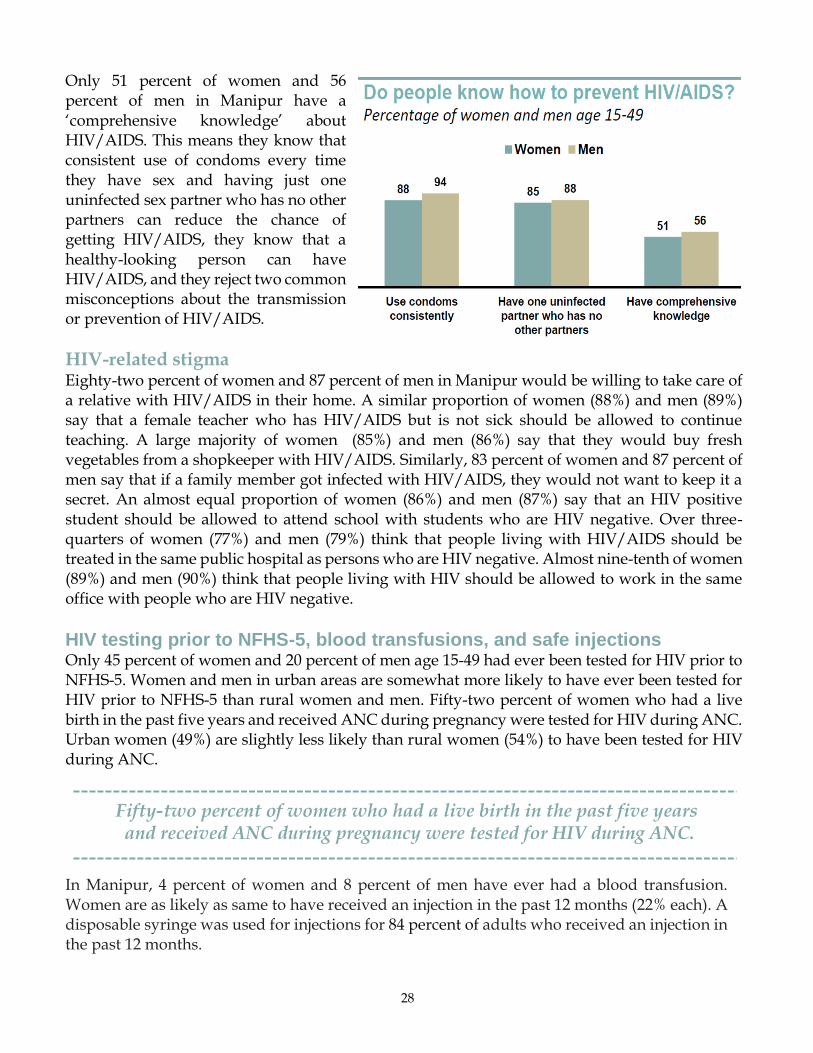
Knowledge of prevention and transmission Men are much more likely than women to know how HIV/AIDS is transmitted and how to keep from getting it. For example, only 88 percent of women know that consistent condom use can help to prevent HIV/AIDS, compared with 94 percent of men, and 85 percent of women know that having just one uninfected partner who has no other partners can reduce the chance of getting HIV/AIDS, compared with 88 percent of men.
28
Only 51 percent of women and 56 percent of men in Manipur have a ‘comprehensive knowledge’ about HIV/AIDS. This means they know that consistent use of condoms every time they have sex and having just one uninfected sex partner who has no other partners can reduce the chance of getting HIV/AIDS, they know that a healthy-looking person can have HIV/AIDS, and they reject two common misconceptions about the transmission or prevention of HIV/AIDS.
HIV-related stigma Eighty-two percent of women and 87 percent of men in Manipur would be willing to take care of a relative with HIV/AIDS in their home. A similar proportion of women (88%) and men (89%) say that a female teacher who has HIV/AIDS but is not sick should be allowed to continue teaching. A large majority of women (85%) and men (86%) say that they would buy fresh vegetables from a shopkeeper with HIV/AIDS. Similarly, 83 percent of women and 87 percent of men say that if a family member got infected with HIV/AIDS, they would not want to keep it a secret. An almost equal proportion of women (86%) and men (87%) say that an HIV positive student should be allowed to attend school with students who are HIV negative. Over three-quarters of women (77%) and men (79%) think that people living with HIV/AIDS should be treated in the same public hospital as persons who are HIV negative. Almost nine-tenth of women (89%) and men (90%) think that people living with HIV should be allowed to work in the same office with people who are HIV negative.
HIV testing prior to NFHS-5, blood transfusions, and safe injections Only 45 percent of women and 20 percent of men age 15-49 had ever been tested for HIV prior to NFHS-5. Women and men in urban areas are somewhat more likely to have ever been tested for HIV prior to NFHS-5 than rural women and men. Fifty-two percent of women who had a live birth in the past five years and received ANC during pregnancy were tested for HIV during ANC. Urban women (49%) are slightly less likely than rural women (54%) to have been tested for HIV during ANC.
Fifty-two percent of women who had a live birth in the past five years and received ANC during pregnancy were tested for HIV during ANC.
In Manipur, 4 percent of women and 8 percent of men have ever had a blood transfusion. Women are as likely as same to have received an injection in the past 12 months (22% each). A disposable syringe was used for injections for 84 percent of adults who received an injection in the past 12 months.
29
SEXUAL BEHAVIOUR
NFHS-5 included questions on respondents’ sexual behaviour. For instance, respondents were asked about their age at first sex, their current and previous sexual partners, higher-risk intercourse, and condom use. In addition, men were asked whether they had paid for sex in the past year. These questions are sensitive and subject to reporting bias, so the results should be interpreted with caution.
Higher-risk behaviour Higher-risk sex refers to sexual intercourse with someone who is neither a spouse nor a cohabiting partner. Among those who had sex in the past 12 months, less than 1 percent (0.2%) of women and 5 percent of men reported having had higher-risk sex during the past 12 months. The percentage of men who had higher-risk sexual intercourse in the past 12 months is somewhat higher (7%) in urban areas than in rural areas (5%). Less than 1 percent (0.2%) of men said they had paid for sex in the past year.
WOMEN’S EMPOWERMENT
Empowering women and promoting gender equality in every sphere of life are essential to improving their lives and achieving the sustainable development goals. NFHS-5 has collected information related to women’s empowerment and autonomy, including menstrual hygiene, employment and earnings, decision-making, ownership of assets, gender role attitudes, and domestic violence.
Women’s hygiene Using a hygienic method of menstrual protection is important for women’s health and personal hygiene. In NFHS-5, young women age 15-24 were asked what method or methods they use for menstrual protection, if anything. In Manipur, 81 percent use sanitary napkins, 64 percent use cloth, 4 percent use locally prepared napkins, and less than 1 percent (0.1%) use tampons. Overall, 83 percent of women age 15-24 use a hygienic method of menstrual protection, up from 76 percent in NFHS-4. Notably, only 80 percent of rural women use a hygienic method of menstrual protection, compared with 90 percent of urban women.
Employment and earnings Only 49 percent of all women age 15-49, compared to 82 percent of men, were employed in the 12 months preceding the survey. Among employed women, 86 percent earned cash, including 18 percent who earned both cash and in-kind. Twelve percent were not paid at all. More men who were employed earned cash (92%), including 11 percent who earned both cash and in-kind. Six percent of employed men were not paid at all. A large majority (95%) of employed women work in non-agricultural occupations, compared with 72 percent of employed men.
30
Only 49 percent of all women age 15-49 were employed in the 12 months preceding the survey.
Decision making Currently married women were asked who makes decisions about their own health care, major household purchases, and visits to their own family or relatives. Women are somewhat more likely to participate in decisions about their own health care (88%) than decisions about visits to their own family and relatives (90%) or about major household purchases (84%). Overall, 78 percent of currently married women participate in making all three of these decisions, and 5 percent do not participate in making any of the three decisions. Participation in all three decisions varies most by age, increasing sharply from 70 percent among women age 20-24 to 85 percent among women age 40-49.
In case of currently married men, they are much more likely than women to report that they alone or jointly with their wives participated in making decisions about their own health care (95%) and 96 percent participated in decisions about major household purchases. Only 1 percent of men did not participate in making either of these decisions.
Other indicators of women’s empowerment In Manipur, 40 percent of women have money that they can decide how to use. The proportion of women who have money that they can decide how to use is equal among urban and rural (40% each) women, much higher among women with 12 or more years of schooling (46%), and is highest among women who are employed for cash (56%) than any other group of women.
Nearly three-quarters (74%) of women have a bank or savings account that they themselves use.
Seventy-four percent of women have a bank or savings account that they themselves use. This percentage is highest, at 78 percent, among women who are not Hindu, Muslim, or Christian, as well as among women who have 12 or more years of schooling (87%). Women’s knowledge and use of microcredit programmes is very limited. Half of women know of a microcredit programme in their area, but only 8 percent have ever taken a loan from a microcredit programme. A little over one-tenth (11%) of women who have a mobile phone use it for financial transactions. Urban women (15%) are more than twice likely to use a mobile phone for financial transactions, than rural women (7%). Use of a mobile phone for financial transactions increases with education; almost one-quarter (22%) of women with 12 or more years of education using a mobile phone for financial transactions, compared women with no schooling (1%). One-sixth of employed women who earn in cash use a mobile phone for financial transactions, compared with 4 percent of employed women who don’t earn in cash. Muslim women are least likely (7%) to use a mobile phone for financial transactions, compared with Hindu or Christian women (12% each). Women not belonging to a scheduled caste, a scheduled tribe, or an other backward class are less likely
31
(9%) to use a mobile phone for financial transactions than women belonging to any other caste/tribe category.
Ownership of assets Fifty-seven percent of women and 77 percent of men age 15-49 in Manipur own a house alone or jointly with someone else, and 25 percent of women and 44 percent of men own land alone or jointly with someone else. Among men and women, ownership of a house is more common in rural than urban areas. Inconsistenly, owenership of land is more common in urban women and rural men.
Fifty-seven percent of women own a house alone or jointly with someone else, and 25 percent of women own land alone or jointly with someone else.
In Manipur, 72 percent of women have a mobile phone that they themselves use, and among women who have a mobile phone that they themselves use, 81 percent can read SMS messages. Seventy-eight percent of urban women have a mobile phone they themselves use, compared with 68 percent of rural women. Mobile phone access increases substantially with education, from 46% among women with no schooling to 93 percent among women with 12 or more years of schooling. Only 71 percent of women belonging to a non-scheduled caste, scheduled tribe, and other backward class have a mobile phone they themselves use, compared with 73-75 percent of women who belong to any other caste/tribe group. Non-scheduled caste, scheduled tribe, and other backward class women who have a mobile phone that they themselves use are also less likely to be able to read SMS messages (79%) than women who belong to any other caste/tribe group (79-88%).
Seventy-two percent of women in Manipur have a mobile phone that they themselves use.
Gender-role attitudes Sixty-six percent of women agree that a husband is justified in hitting or beating his wife with at least one specified reason or under some circumstances. For instance, women are most likely to agree that wife beating is justified if a woman shows disrespect for her in-laws (53%), followed by if she neglects the house or children (41%), and if he suspects her of being unfaithful (17%). Men are less likely to agree than women, 57 percent say that wife beating is justified in some circumstances, especially if the wife shows disrespect for in-laws (47%) or if she neglects the house or children (30%) and if she argues with him (21%). Even among women and men who have completed at least 12 years of schooling, 61 percent of women and 52 percent of men say that a husband is justified in beating his wife for one or more of the specified reasons.
32
Seventy-two percent of women and 70 percent of men believe that a woman is justified in refusing to have sex with her husband if she knows he has a sexually transmitted disease, if she knows he has intercourse with other women, and if she is tired or not in the mood. Similarly, nearly three-quarters of men (73%) agree that if a wife refuses to have sex with her husband he does not have a right to get angry and reprimand her, refuse to give her financial support, use force to have sex even if she doesn’t want to, or have sex with another woman.
DOMESTIC VIOLENCE
The World Health Organization recognizes that violence against women, particularly domestic or spousal violence, is a major public and clinical health problem and a violation of women’s human rights, which also reflects the scale of gender inequality and discrimination against women. The consequences of violence on physical, mental, sexual, and reproductive health often last a lifetime. NFHS-5 collected information on domestic violence from women age 18-49, related to behaviours of her husband that cause physical, sexual or emotional harm, including physical violence, sexual coercion, emotional abuse, and controlling behaviours. Information was also collected on violence during pregnancy and help seeking behaviour for any violence experienced.
In Manipur, 33 percent of women age 18-49 have ever experienced physical violence (38% of ever-married women and 15% of never married women), and 1 percent have ever experienced sexual violence. In all, 37 percent of women experienced physical or sexual violence and 4 percent experienced both physical and sexual violence. For ever-married women who experienced physical violence since age 15, the most common perpetrator was the current husband.
Over two-fifths (44%) of ever-married women age 18-49 in Manipur have experienced physical or sexual violence.
Violence during pregnancy Three percent of women age 18-49 in Manipur, who have ever been pregnant have ever experienced physical violence during one or more of their pregnancies. Women with 8-9 years of schooling, women with 1-2 children, and women who are widowed, divorced, separated, or deserted are more likely to experience violence during pregnancy than women in any other group.
Spousal violence In Manipur, 39 percent of ever-married women age 18-49 have ever experienced any form of physical violence committed by their husband, 5 percent have ever experienced any form of sexual violence committed by their husband, and 11 percent have ever experienced any form of emotional violence committed by their husband. Thirty-three percent of ever-married women report having been slapped by their husband. Twenty percent report being pushed, shaken, or having something thrown at them. Seven percent experienced having their arm twisted or hair pulled, 8 percent being punched with a fist or something that could hurt her, 8 percent report being kicked, dragged, or beaten up, and 1 percent that her husband tried to choke or burn her on purpose.
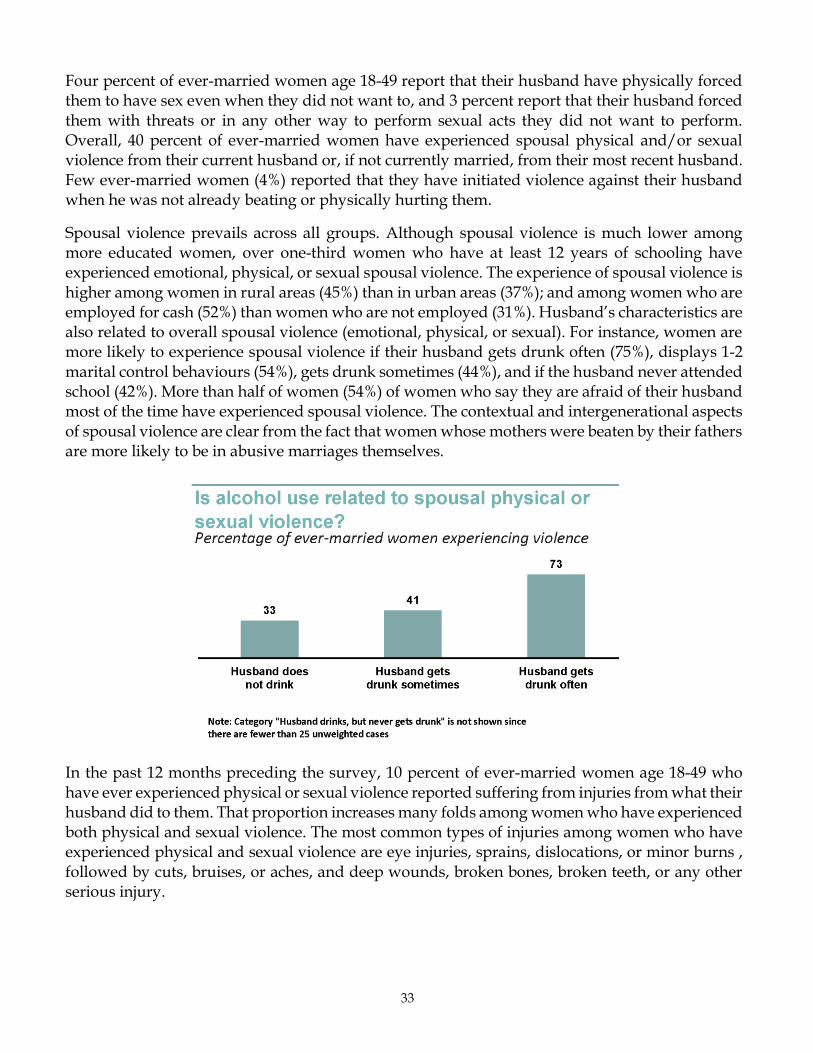
33
Four percent of ever-married women age 18-49 report that their husband have physically forced them to have sex even when they did not want to, and 3 percent report that their husband forced them with threats or in any other way to perform sexual acts they did not want to perform. Overall, 40 percent of ever-married women have experienced spousal physical and/or sexual violence from their current husband or, if not currently married, from their most recent husband. Few ever-married women (4%) reported that they have initiated violence against their husband when he was not already beating or physically hurting them.
Spousal violence prevails across all groups. Although spousal violence is much lower among more educated women, over one-third women who have at least 12 years of schooling have experienced emotional, physical, or sexual spousal violence. The experience of spousal violence is higher among women in rural areas (45%) than in urban areas (37%); and among women who are employed for cash (52%) than women who are not employed (31%). Husband’s characteristics are also related to overall spousal violence (emotional, physical, or sexual). For instance, women are more likely to experience spousal violence if their husband gets drunk often (75%), displays 1-2 marital control behaviours (54%), gets drunk sometimes (44%), and if the husband never attended school (42%). More than half of women (54%) of women who say they are afraid of their husband most of the time have experienced spousal violence. The contextual and intergenerational aspects of spousal violence are clear from the fact that women whose mothers were beaten by their fathers are more likely to be in abusive marriages themselves.
In the past 12 months preceding the survey, 10 percent of ever-married women age 18-49 who have ever experienced physical or sexual violence reported suffering from injuries from what their husband did to them. That proportion increases many folds among women who have experienced both physical and sexual violence. The most common types of injuries among women who have experienced physical and sexual violence are eye injuries, sprains, dislocations, or minor burns , followed by cuts, bruises, or aches, and deep wounds, broken bones, broken teeth, or any other serious injury.
34
Help seeking Only 3 percent of women age 18-49 who have ever experienced physical or sexual violence sought help, while 14 percent never sought help but told someone. A large majority of women who have ever experienced physical or sexual violence (84%) never sought help and never told anyone.
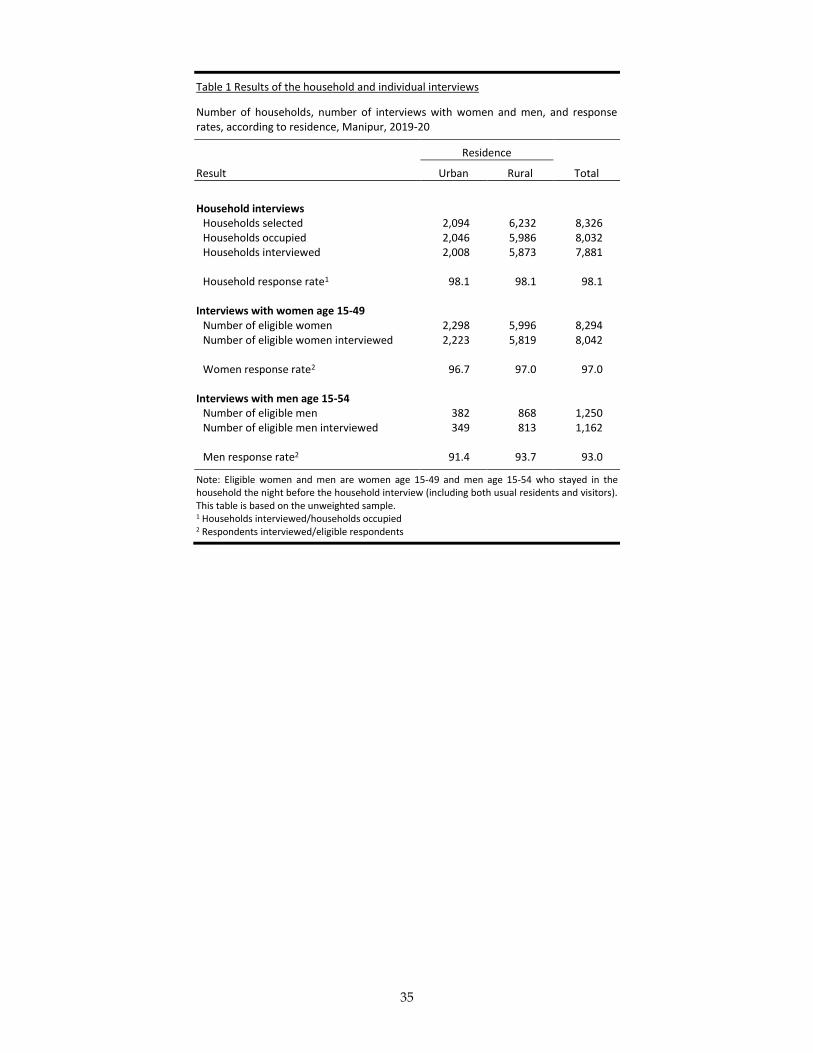
35
Table 1 Results of the household and individual interviews
Number of households, number of interviews with women and men, and response rates, according to residence, Manipur, 2019-20
Residence
Result Urban Rural Total
Household interviews
Households selected 2,094 6,232 8,326 Households occupied 2,046 5,986 8,032 Households interviewed 2,008 5,873 7,881 Household response rate1 98.1 98.1 98.1
Interviews with women age 15-49 Number of eligible women 2,298 5,996 8,294 Number of eligible women interviewed 2,223 5,819 8,042 Women response rate2 96.7 97.0 97.0
Interviews with men age 15-54 Number of eligible men 382 868 1,250 Number of eligible men interviewed 349 813 1,162 Men response rate2 91.4 93.7 93.0
Note: Eligible women and men are women age 15-49 and men age 15-54 who stayed in the household the night before the household interview (including both usual residents and visitors). This table is based on the unweighted sample. 1 Households interviewed/households occupied 2 Respondents interviewed/eligible respondents
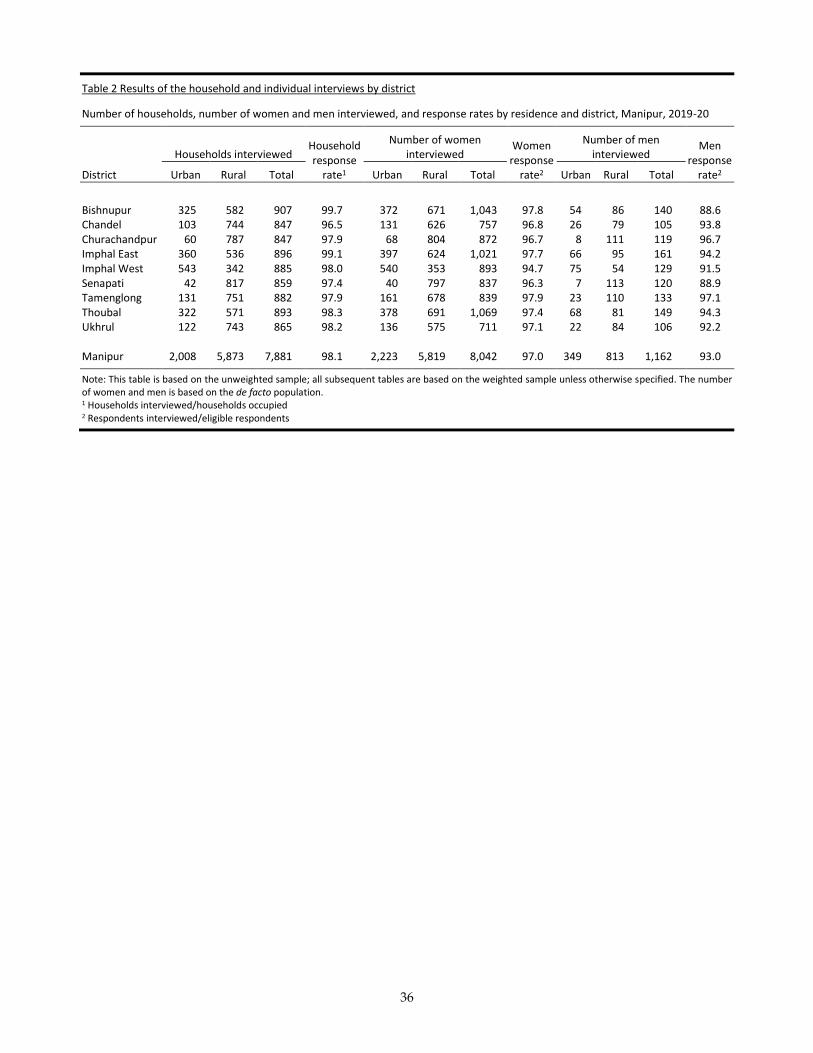
36
Table 2 Results of the household and individual interviews by district
Number of households, number of women and men interviewed, and response rates by residence and district, Manipur, 2019-20
Households interviewed
Household response
rate1
Number of women interviewed
Women response
rate2
Number of men interviewed
Men response
rate2 District Urban Rural Total Urban Rural Total Urban Rural Total
Bishnupur 325 582 907 99.7 372 671 1,043 97.8 54 86 140 88.6 Chandel 103 744 847 96.5 131 626 757 96.8 26 79 105 93.8 Churachandpur 60 787 847 97.9 68 804 872 96.7 8 111 119 96.7 Imphal East 360 536 896 99.1 397 624 1,021 97.7 66 95 161 94.2 Imphal West 543 342 885 98.0 540 353 893 94.7 75 54 129 91.5 Senapati 42 817 859 97.4 40 797 837 96.3 7 113 120 88.9 Tamenglong 131 751 882 97.9 161 678 839 97.9 23 110 133 97.1 Thoubal 322 571 893 98.3 378 691 1,069 97.4 68 81 149 94.3 Ukhrul 122 743 865 98.2 136 575 711 97.1 22 84 106 92.2 Manipur 2,008 5,873 7,881 98.1 2,223 5,819 8,042 97.0 349 813 1,162 93.0
Note: This table is based on the unweighted sample; all subsequent tables are based on the weighted sample unless otherwise specified. The number of women and men is based on the de facto population. 1 Households interviewed/households occupied 2 Respondents interviewed/eligible respondents
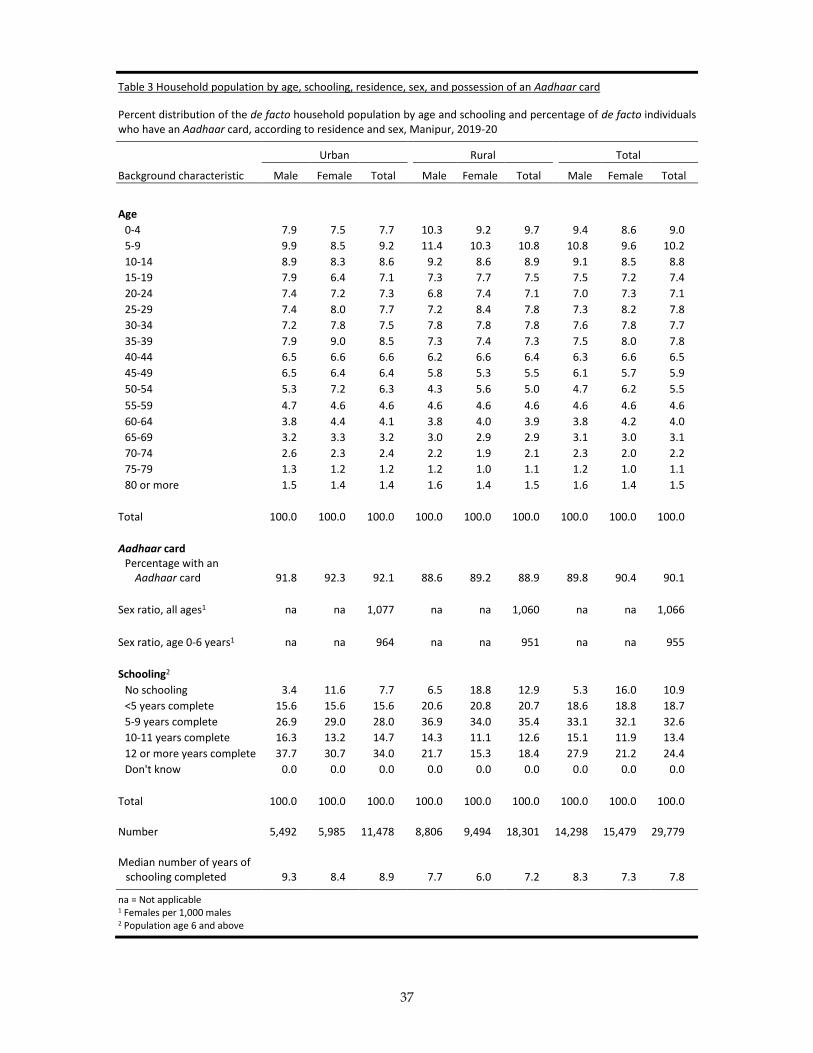
37
Table 3 Household population by age, schooling, residence, sex, and possession of an Aadhaar card
Percent distribution of the de facto household population by age and schooling and percentage of de facto individuals who have an Aadhaar card, according to residence and sex, Manipur, 2019-20
Urban Rural Total
Background characteristic Male Female Total Male Female Total Male Female Total
Age
0-4 7.9 7.5 7.7 10.3 9.2 9.7 9.4 8.6 9.0
5-9 9.9 8.5 9.2 11.4 10.3 10.8 10.8 9.6 10.2
10-14 8.9 8.3 8.6 9.2 8.6 8.9 9.1 8.5 8.8
15-19 7.9 6.4 7.1 7.3 7.7 7.5 7.5 7.2 7.4
20-24 7.4 7.2 7.3 6.8 7.4 7.1 7.0 7.3 7.1
25-29 7.4 8.0 7.7 7.2 8.4 7.8 7.3 8.2 7.8
30-34 7.2 7.8 7.5 7.8 7.8 7.8 7.6 7.8 7.7
35-39 7.9 9.0 8.5 7.3 7.4 7.3 7.5 8.0 7.8
40-44 6.5 6.6 6.6 6.2 6.6 6.4 6.3 6.6 6.5
45-49 6.5 6.4 6.4 5.8 5.3 5.5 6.1 5.7 5.9
50-54 5.3 7.2 6.3 4.3 5.6 5.0 4.7 6.2 5.5
55-59 4.7 4.6 4.6 4.6 4.6 4.6 4.6 4.6 4.6
60-64 3.8 4.4 4.1 3.8 4.0 3.9 3.8 4.2 4.0
65-69 3.2 3.3 3.2 3.0 2.9 2.9 3.1 3.0 3.1
70-74 2.6 2.3 2.4 2.2 1.9 2.1 2.3 2.0 2.2
75-79 1.3 1.2 1.2 1.2 1.0 1.1 1.2 1.0 1.1
80 or more 1.5 1.4 1.4 1.6 1.4 1.5 1.6 1.4 1.5
Total 100.0 100.0 100.0 100.0 100.0 100.0 100.0 100.0 100.0
Aadhaar card Percentage with an
Aadhaar card 91.8 92.3 92.1 88.6 89.2 88.9 89.8 90.4 90.1
Sex ratio, all ages1 na na 1,077 na na 1,060 na na 1,066
Sex ratio, age 0-6 years1 na na 964 na na 951 na na 955
Schooling2
No schooling 3.4 11.6 7.7 6.5 18.8 12.9 5.3 16.0 10.9
<5 years complete 15.6 15.6 15.6 20.6 20.8 20.7 18.6 18.8 18.7
5-9 years complete 26.9 29.0 28.0 36.9 34.0 35.4 33.1 32.1 32.6
10-11 years complete 16.3 13.2 14.7 14.3 11.1 12.6 15.1 11.9 13.4
12 or more years complete 37.7 30.7 34.0 21.7 15.3 18.4 27.9 21.2 24.4
Don't know 0.0 0.0 0.0 0.0 0.0 0.0 0.0 0.0 0.0
Total 100.0 100.0 100.0 100.0 100.0 100.0 100.0 100.0 100.0
Number 5,492 5,985 11,478 8,806 9,494 18,301 14,298 15,479 29,779
Median number of years of
schooling completed 9.3 8.4 8.9 7.7 6.0 7.2 8.3 7.3 7.8
na = Not applicable 1 Females per 1,000 males 2 Population age 6 and above
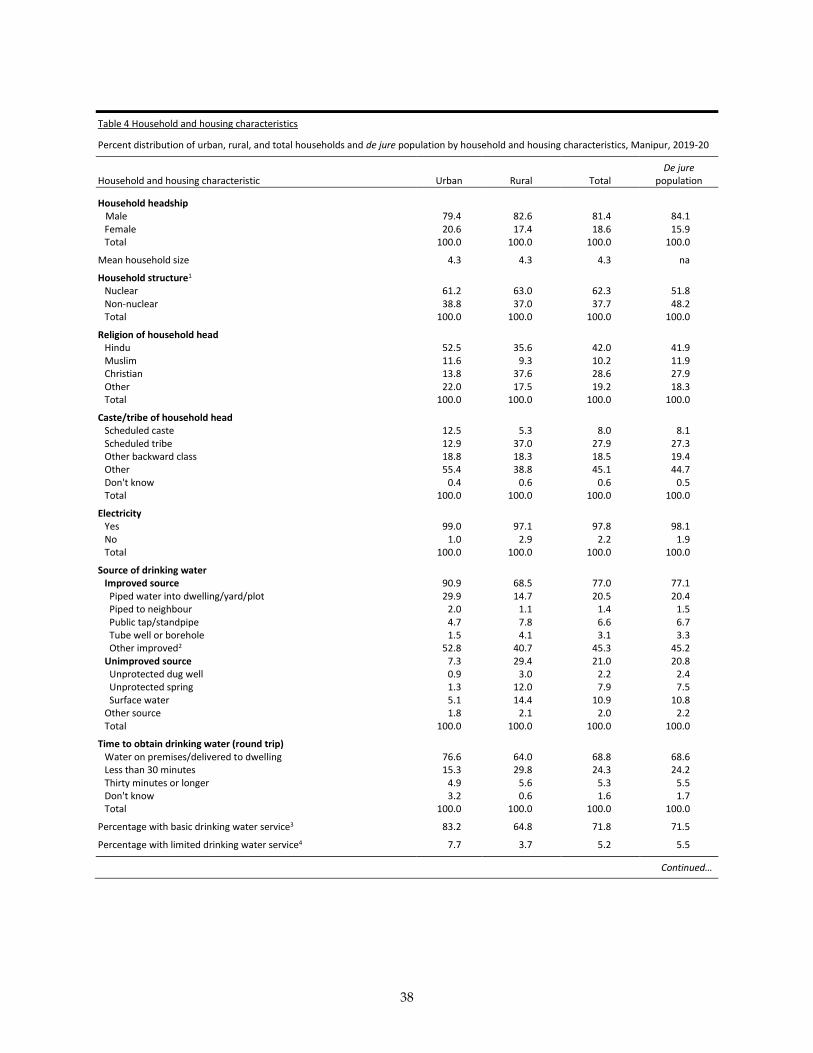
38
Table 4 Household and housing characteristics
Percent distribution of urban, rural, and total households and de jure population by household and housing characteristics, Manipur, 2019-20
Household and housing characteristic Urban Rural Total De jure
population
Household headship Male 79.4 82.6 81.4 84.1 Female 20.6 17.4 18.6 15.9 Total 100.0 100.0 100.0 100.0
Mean household size 4.3 4.3 4.3 na
Household structure1 Nuclear 61.2 63.0 62.3 51.8 Non-nuclear 38.8 37.0 37.7 48.2 Total 100.0 100.0 100.0 100.0
Religion of household head Hindu 52.5 35.6 42.0 41.9 Muslim 11.6 9.3 10.2 11.9 Christian 13.8 37.6 28.6 27.9 Other 22.0 17.5 19.2 18.3 Total 100.0 100.0 100.0 100.0
Caste/tribe of household head Scheduled caste 12.5 5.3 8.0 8.1 Scheduled tribe 12.9 37.0 27.9 27.3 Other backward class 18.8 18.3 18.5 19.4 Other 55.4 38.8 45.1 44.7 Don't know 0.4 0.6 0.6 0.5 Total 100.0 100.0 100.0 100.0
Electricity Yes 99.0 97.1 97.8 98.1 No 1.0 2.9 2.2 1.9 Total 100.0 100.0 100.0 100.0
Source of drinking water Improved source 90.9 68.5 77.0 77.1 Piped water into dwelling/yard/plot 29.9 14.7 20.5 20.4 Piped to neighbour 2.0 1.1 1.4 1.5 Public tap/standpipe 4.7 7.8 6.6 6.7 Tube well or borehole 1.5 4.1 3.1 3.3 Other improved2 52.8 40.7 45.3 45.2 Unimproved source 7.3 29.4 21.0 20.8 Unprotected dug well 0.9 3.0 2.2 2.4 Unprotected spring 1.3 12.0 7.9 7.5 Surface water 5.1 14.4 10.9 10.8 Other source 1.8 2.1 2.0 2.2 Total 100.0 100.0 100.0 100.0
Time to obtain drinking water (round trip) Water on premises/delivered to dwelling 76.6 64.0 68.8 68.6 Less than 30 minutes 15.3 29.8 24.3 24.2 Thirty minutes or longer 4.9 5.6 5.3 5.5 Don't know 3.2 0.6 1.6 1.7 Total 100.0 100.0 100.0 100.0
Percentage with basic drinking water service3 83.2 64.8 71.8 71.5
Percentage with limited drinking water service4 7.7 3.7 5.2 5.5
Continued…
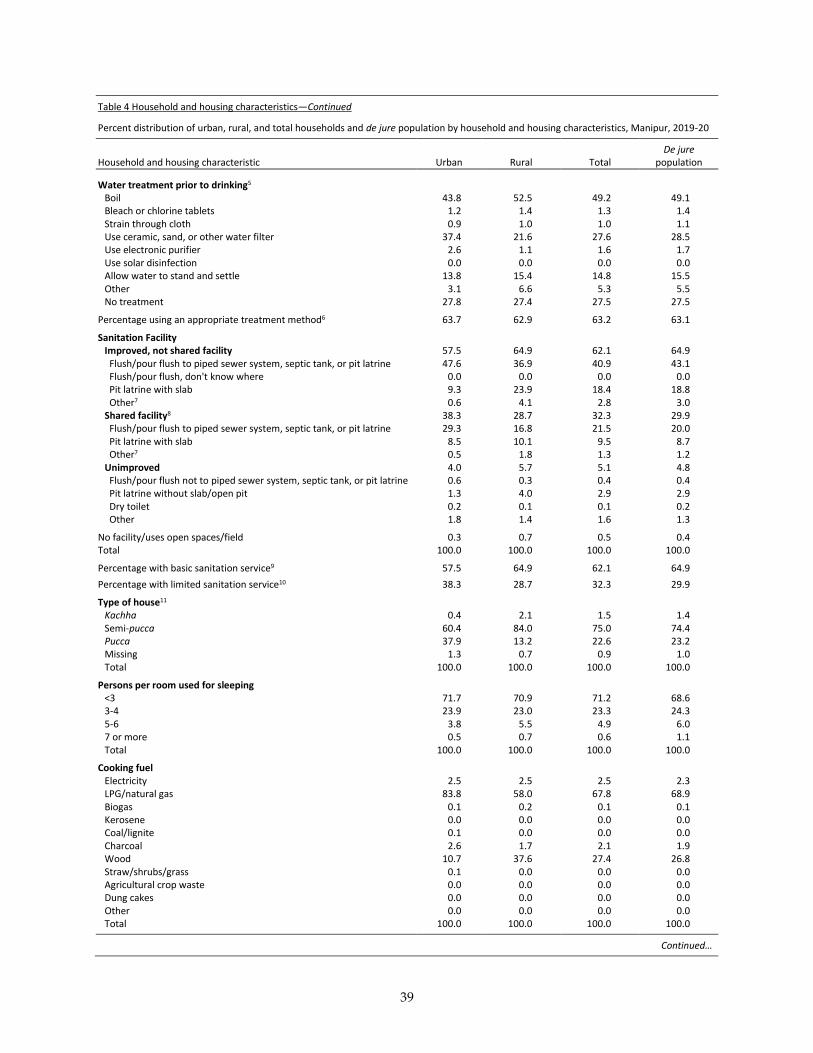
39
Table 4 Household and housing characteristics—Continued
Percent distribution of urban, rural, and total households and de jure population by household and housing characteristics, Manipur, 2019-20
Household and housing characteristic Urban Rural Total De jure
population
Water treatment prior to drinking5 Boil 43.8 52.5 49.2 49.1 Bleach or chlorine tablets 1.2 1.4 1.3 1.4 Strain through cloth 0.9 1.0 1.0 1.1 Use ceramic, sand, or other water filter 37.4 21.6 27.6 28.5 Use electronic purifier 2.6 1.1 1.6 1.7 Use solar disinfection 0.0 0.0 0.0 0.0 Allow water to stand and settle 13.8 15.4 14.8 15.5 Other 3.1 6.6 5.3 5.5 No treatment 27.8 27.4 27.5 27.5
Percentage using an appropriate treatment method6 63.7 62.9 63.2 63.1
Sanitation Facility Improved, not shared facility 57.5 64.9 62.1 64.9 Flush/pour flush to piped sewer system, septic tank, or pit latrine 47.6 36.9 40.9 43.1 Flush/pour flush, don't know where 0.0 0.0 0.0 0.0 Pit latrine with slab 9.3 23.9 18.4 18.8 Other7 0.6 4.1 2.8 3.0 Shared facility8 38.3 28.7 32.3 29.9 Flush/pour flush to piped sewer system, septic tank, or pit latrine 29.3 16.8 21.5 20.0 Pit latrine with slab 8.5 10.1 9.5 8.7 Other7 0.5 1.8 1.3 1.2 Unimproved 4.0 5.7 5.1 4.8 Flush/pour flush not to piped sewer system, septic tank, or pit latrine 0.6 0.3 0.4 0.4 Pit latrine without slab/open pit 1.3 4.0 2.9 2.9 Dry toilet 0.2 0.1 0.1 0.2 Other 1.8 1.4 1.6 1.3
No facility/uses open spaces/field 0.3 0.7 0.5 0.4 Total 100.0 100.0 100.0 100.0
Percentage with basic sanitation service9 57.5 64.9 62.1 64.9
Percentage with limited sanitation service10 38.3 28.7 32.3 29.9
Type of house11 Kachha 0.4 2.1 1.5 1.4 Semi-pucca 60.4 84.0 75.0 74.4 Pucca 37.9 13.2 22.6 23.2 Missing 1.3 0.7 0.9 1.0 Total 100.0 100.0 100.0 100.0
Persons per room used for sleeping <3 71.7 70.9 71.2 68.6 3-4 23.9 23.0 23.3 24.3 5-6 3.8 5.5 4.9 6.0 7 or more 0.5 0.7 0.6 1.1 Total 100.0 100.0 100.0 100.0
Cooking fuel Electricity 2.5 2.5 2.5 2.3 LPG/natural gas 83.8 58.0 67.8 68.9 Biogas 0.1 0.2 0.1 0.1 Kerosene 0.0 0.0 0.0 0.0 Coal/lignite 0.1 0.0 0.0 0.0 Charcoal 2.6 1.7 2.1 1.9 Wood 10.7 37.6 27.4 26.8 Straw/shrubs/grass 0.1 0.0 0.0 0.0 Agricultural crop waste 0.0 0.0 0.0 0.0 Dung cakes 0.0 0.0 0.0 0.0 Other 0.0 0.0 0.0 0.0 Total 100.0 100.0 100.0 100.0
Continued…
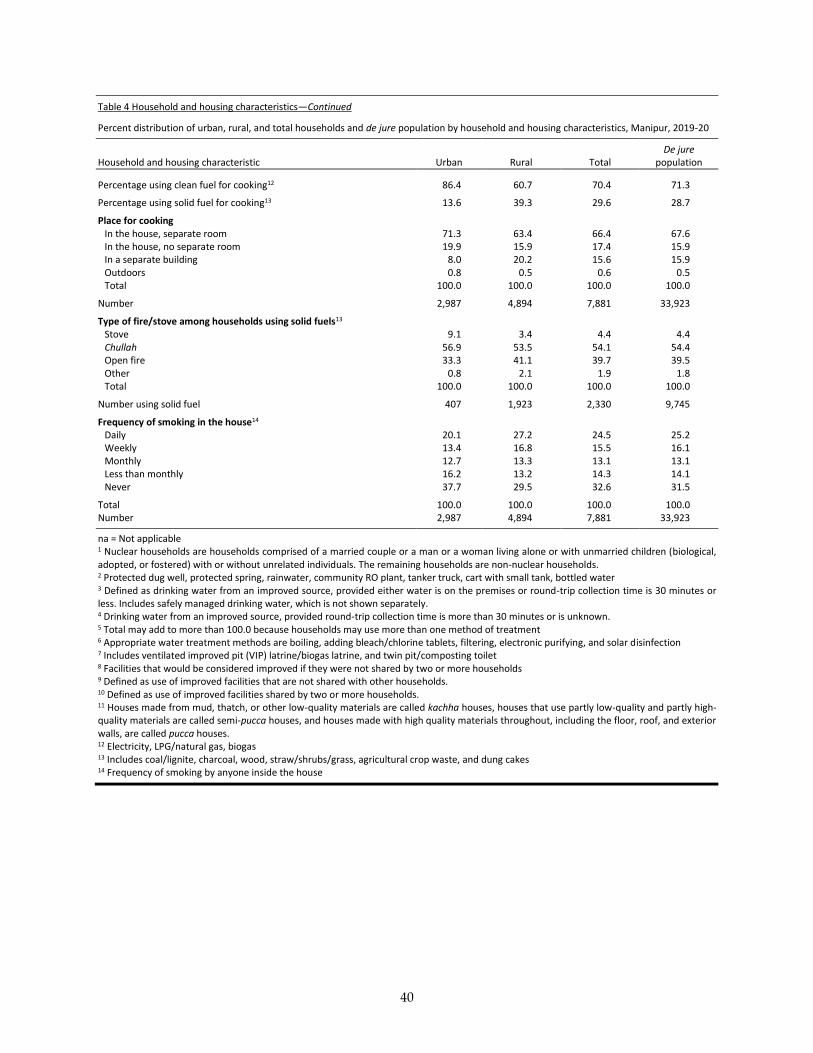
40
Table 4 Household and housing characteristics—Continued
Percent distribution of urban, rural, and total households and de jure population by household and housing characteristics, Manipur, 2019-20
Household and housing characteristic Urban Rural Total De jure
population
Percentage using clean fuel for cooking12 86.4 60.7 70.4 71.3
Percentage using solid fuel for cooking13 13.6 39.3 29.6 28.7
Place for cooking In the house, separate room 71.3 63.4 66.4 67.6 In the house, no separate room 19.9 15.9 17.4 15.9 In a separate building 8.0 20.2 15.6 15.9 Outdoors 0.8 0.5 0.6 0.5 Total 100.0 100.0 100.0 100.0
Number 2,987 4,894 7,881 33,923
Type of fire/stove among households using solid fuels13 Stove 9.1 3.4 4.4 4.4 Chullah 56.9 53.5 54.1 54.4 Open fire 33.3 41.1 39.7 39.5 Other 0.8 2.1 1.9 1.8 Total 100.0 100.0 100.0 100.0
Number using solid fuel 407 1,923 2,330 9,745
Frequency of smoking in the house14 Daily 20.1 27.2 24.5 25.2 Weekly 13.4 16.8 15.5 16.1 Monthly 12.7 13.3 13.1 13.1 Less than monthly 16.2 13.2 14.3 14.1 Never 37.7 29.5 32.6 31.5
Total 100.0 100.0 100.0 100.0 Number 2,987 4,894 7,881 33,923
na = Not applicable 1 Nuclear households are households comprised of a married couple or a man or a woman living alone or with unmarried children (biological, adopted, or fostered) with or without unrelated individuals. The remaining households are non-nuclear households. 2 Protected dug well, protected spring, rainwater, community RO plant, tanker truck, cart with small tank, bottled water 3 Defined as drinking water from an improved source, provided either water is on the premises or round-trip collection time is 30 minutes or less. Includes safely managed drinking water, which is not shown separately. 4 Drinking water from an improved source, provided round-trip collection time is more than 30 minutes or is unknown. 5 Total may add to more than 100.0 because households may use more than one method of treatment 6 Appropriate water treatment methods are boiling, adding bleach/chlorine tablets, filtering, electronic purifying, and solar disinfection 7 Includes ventilated improved pit (VIP) latrine/biogas latrine, and twin pit/composting toilet 8 Facilities that would be considered improved if they were not shared by two or more households 9 Defined as use of improved facilities that are not shared with other households. 10 Defined as use of improved facilities shared by two or more households. 11 Houses made from mud, thatch, or other low-quality materials are called kachha houses, houses that use partly low-quality and partly high-quality materials are called semi-pucca houses, and houses made with high quality materials throughout, including the floor, roof, and exterior walls, are called pucca houses. 12 Electricity, LPG/natural gas, biogas 13 Includes coal/lignite, charcoal, wood, straw/shrubs/grass, agricultural crop waste, and dung cakes 14 Frequency of smoking by anyone inside the house
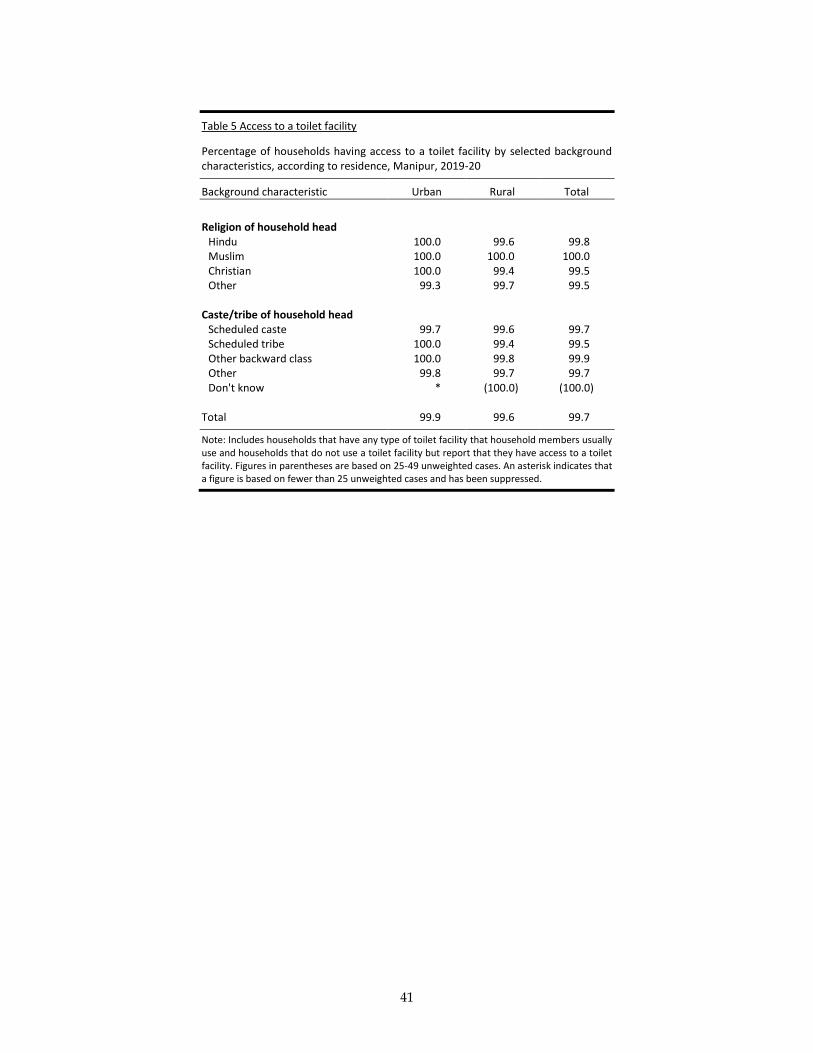
41
Table 5 Access to a toilet facility
Percentage of households having access to a toilet facility by selected background characteristics, according to residence, Manipur, 2019-20
Background characteristic Urban Rural Total
Religion of household head
Hindu 100.0 99.6 99.8 Muslim 100.0 100.0 100.0 Christian 100.0 99.4 99.5 Other 99.3 99.7 99.5
Caste/tribe of household head Scheduled caste 99.7 99.6 99.7 Scheduled tribe 100.0 99.4 99.5 Other backward class 100.0 99.8 99.9 Other 99.8 99.7 99.7 Don't know * (100.0) (100.0)
Total 99.9 99.6 99.7
Note: Includes households that have any type of toilet facility that household members usually use and households that do not use a toilet facility but report that they have access to a toilet facility. Figures in parentheses are based on 25-49 unweighted cases. An asterisk indicates that a figure is based on fewer than 25 unweighted cases and has been suppressed.
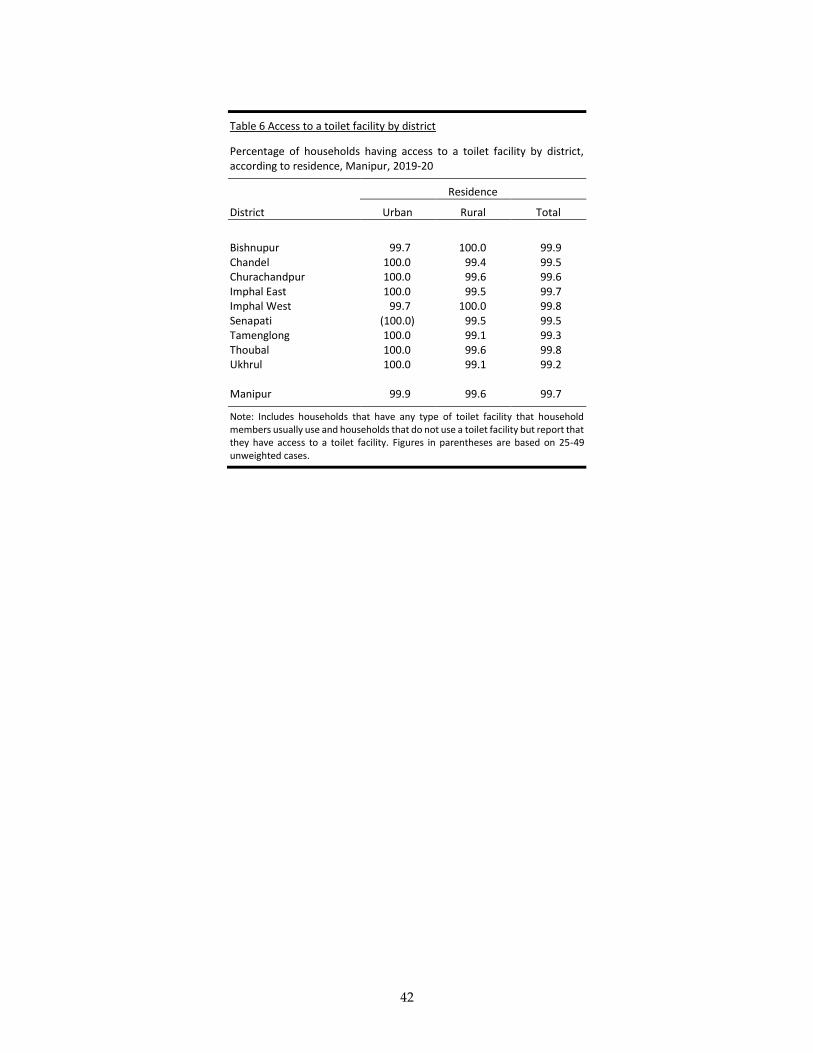
42
Table 6 Access to a toilet facility by district
Percentage of households having access to a toilet facility by district, according to residence, Manipur, 2019-20
Residence
District Urban Rural Total
Bishnupur 99.7 100.0 99.9 Chandel 100.0 99.4 99.5 Churachandpur 100.0 99.6 99.6 Imphal East 100.0 99.5 99.7 Imphal West 99.7 100.0 99.8 Senapati (100.0) 99.5 99.5 Tamenglong 100.0 99.1 99.3 Thoubal 100.0 99.6 99.8 Ukhrul 100.0 99.1 99.2 Manipur 99.9 99.6 99.7
Note: Includes households that have any type of toilet facility that household members usually use and households that do not use a toilet facility but report that they have access to a toilet facility. Figures in parentheses are based on 25-49 unweighted cases.
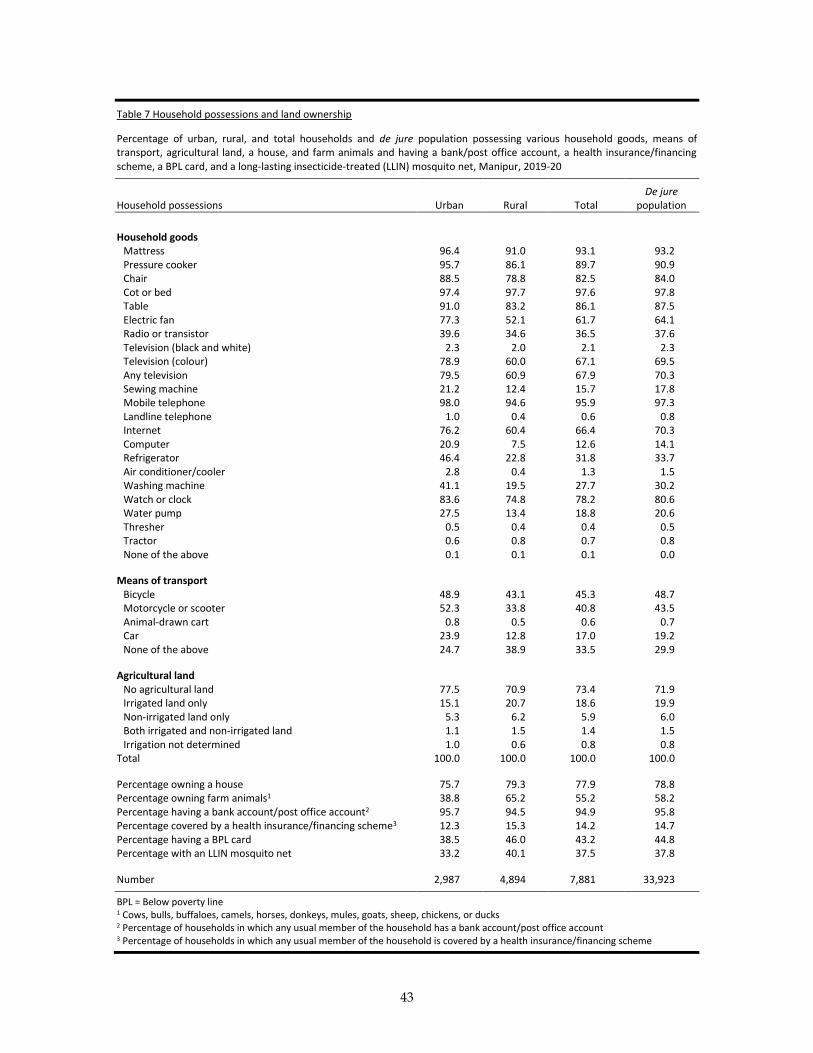
43
Table 7 Household possessions and land ownership
Percentage of urban, rural, and total households and de jure population possessing various household goods, means of transport, agricultural land, a house, and farm animals and having a bank/post office account, a health insurance/financing scheme, a BPL card, and a long-lasting insecticide-treated (LLIN) mosquito net, Manipur, 2019-20
Household possessions Urban Rural Total De jure
population
Household goods Mattress 96.4 91.0 93.1 93.2 Pressure cooker 95.7 86.1 89.7 90.9 Chair 88.5 78.8 82.5 84.0 Cot or bed 97.4 97.7 97.6 97.8 Table 91.0 83.2 86.1 87.5 Electric fan 77.3 52.1 61.7 64.1 Radio or transistor 39.6 34.6 36.5 37.6 Television (black and white) 2.3 2.0 2.1 2.3 Television (colour) 78.9 60.0 67.1 69.5 Any television 79.5 60.9 67.9 70.3 Sewing machine 21.2 12.4 15.7 17.8 Mobile telephone 98.0 94.6 95.9 97.3 Landline telephone 1.0 0.4 0.6 0.8 Internet 76.2 60.4 66.4 70.3 Computer 20.9 7.5 12.6 14.1 Refrigerator 46.4 22.8 31.8 33.7 Air conditioner/cooler 2.8 0.4 1.3 1.5 Washing machine 41.1 19.5 27.7 30.2 Watch or clock 83.6 74.8 78.2 80.6 Water pump 27.5 13.4 18.8 20.6 Thresher 0.5 0.4 0.4 0.5 Tractor 0.6 0.8 0.7 0.8 None of the above 0.1 0.1 0.1 0.0
Means of transport Bicycle 48.9 43.1 45.3 48.7 Motorcycle or scooter 52.3 33.8 40.8 43.5 Animal-drawn cart 0.8 0.5 0.6 0.7 Car 23.9 12.8 17.0 19.2 None of the above 24.7 38.9 33.5 29.9
Agricultural land No agricultural land 77.5 70.9 73.4 71.9 Irrigated land only 15.1 20.7 18.6 19.9 Non-irrigated land only 5.3 6.2 5.9 6.0 Both irrigated and non-irrigated land 1.1 1.5 1.4 1.5 Irrigation not determined 1.0 0.6 0.8 0.8
Total 100.0 100.0 100.0 100.0
Percentage owning a house 75.7 79.3 77.9 78.8 Percentage owning farm animals1 38.8 65.2 55.2 58.2 Percentage having a bank account/post office account2 95.7 94.5 94.9 95.8 Percentage covered by a health insurance/financing scheme3 12.3 15.3 14.2 14.7 Percentage having a BPL card 38.5 46.0 43.2 44.8 Percentage with an LLIN mosquito net 33.2 40.1 37.5 37.8
Number 2,987 4,894 7,881 33,923
BPL = Below poverty line 1 Cows, bulls, buffaloes, camels, horses, donkeys, mules, goats, sheep, chickens, or ducks 2 Percentage of households in which any usual member of the household has a bank account/post office account 3 Percentage of households in which any usual member of the household is covered by a health insurance/financing scheme
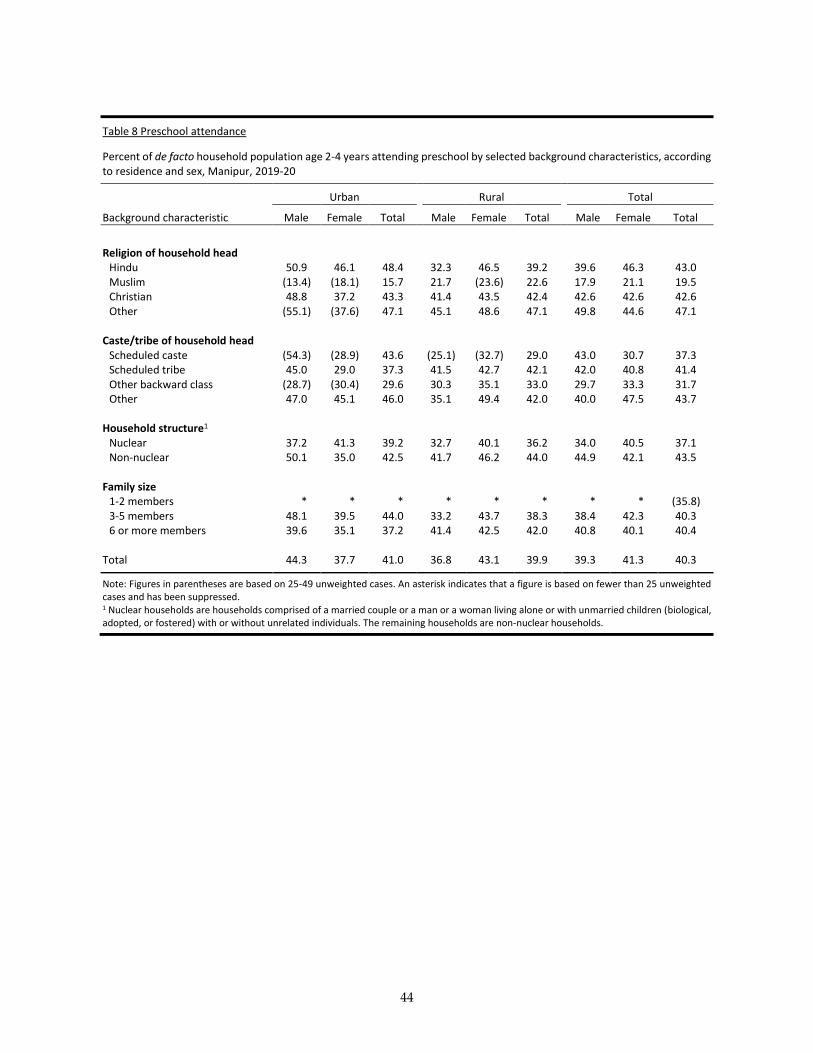
44
Table 8 Preschool attendance
Percent of de facto household population age 2-4 years attending preschool by selected background characteristics, according to residence and sex, Manipur, 2019-20
Urban Rural Total
Background characteristic Male Female Total Male Female Total Male Female Total
Religion of household head
Hindu 50.9 46.1 48.4 32.3 46.5 39.2 39.6 46.3 43.0 Muslim (13.4) (18.1) 15.7 21.7 (23.6) 22.6 17.9 21.1 19.5 Christian 48.8 37.2 43.3 41.4 43.5 42.4 42.6 42.6 42.6 Other (55.1) (37.6) 47.1 45.1 48.6 47.1 49.8 44.6 47.1
Caste/tribe of household head Scheduled caste (54.3) (28.9) 43.6 (25.1) (32.7) 29.0 43.0 30.7 37.3 Scheduled tribe 45.0 29.0 37.3 41.5 42.7 42.1 42.0 40.8 41.4 Other backward class (28.7) (30.4) 29.6 30.3 35.1 33.0 29.7 33.3 31.7 Other 47.0 45.1 46.0 35.1 49.4 42.0 40.0 47.5 43.7
Household structure1 Nuclear 37.2 41.3 39.2 32.7 40.1 36.2 34.0 40.5 37.1 Non-nuclear 50.1 35.0 42.5 41.7 46.2 44.0 44.9 42.1 43.5
Family size 1-2 members * * * * * * * * (35.8) 3-5 members 48.1 39.5 44.0 33.2 43.7 38.3 38.4 42.3 40.3 6 or more members 39.6 35.1 37.2 41.4 42.5 42.0 40.8 40.1 40.4
Total 44.3 37.7 41.0 36.8 43.1 39.9 39.3 41.3 40.3
Note: Figures in parentheses are based on 25-49 unweighted cases. An asterisk indicates that a figure is based on fewer than 25 unweighted cases and has been suppressed. 1 Nuclear households are households comprised of a married couple or a man or a woman living alone or with unmarried children (biological, adopted, or fostered) with or without unrelated individuals. The remaining households are non-nuclear households.
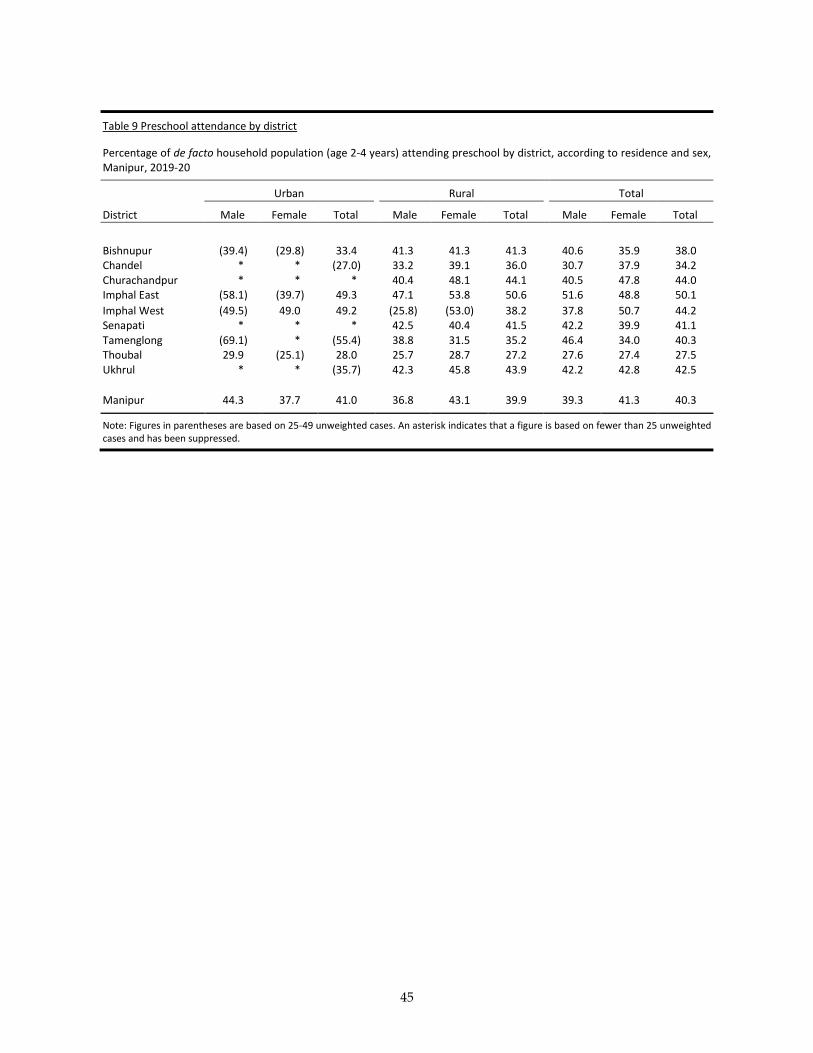
45
Table 9 Preschool attendance by district
Percentage of de facto household population (age 2-4 years) attending preschool by district, according to residence and sex, Manipur, 2019-20
Urban Rural Total
District Male Female Total Male Female Total Male Female Total
Bishnupur (39.4) (29.8) 33.4 41.3 41.3 41.3 40.6 35.9 38.0 Chandel * * (27.0) 33.2 39.1 36.0 30.7 37.9 34.2 Churachandpur * * * 40.4 48.1 44.1 40.5 47.8 44.0 Imphal East (58.1) (39.7) 49.3 47.1 53.8 50.6 51.6 48.8 50.1
Imphal West (49.5) 49.0 49.2 (25.8) (53.0) 38.2 37.8 50.7 44.2 Senapati * * * 42.5 40.4 41.5 42.2 39.9 41.1 Tamenglong (69.1) * (55.4) 38.8 31.5 35.2 46.4 34.0 40.3 Thoubal 29.9 (25.1) 28.0 25.7 28.7 27.2 27.6 27.4 27.5 Ukhrul * * (35.7) 42.3 45.8 43.9 42.2 42.8 42.5
Manipur 44.3 37.7 41.0 36.8 43.1 39.9 39.3 41.3 40.3
Note: Figures in parentheses are based on 25-49 unweighted cases. An asterisk indicates that a figure is based on fewer than 25 unweighted cases and has been suppressed.
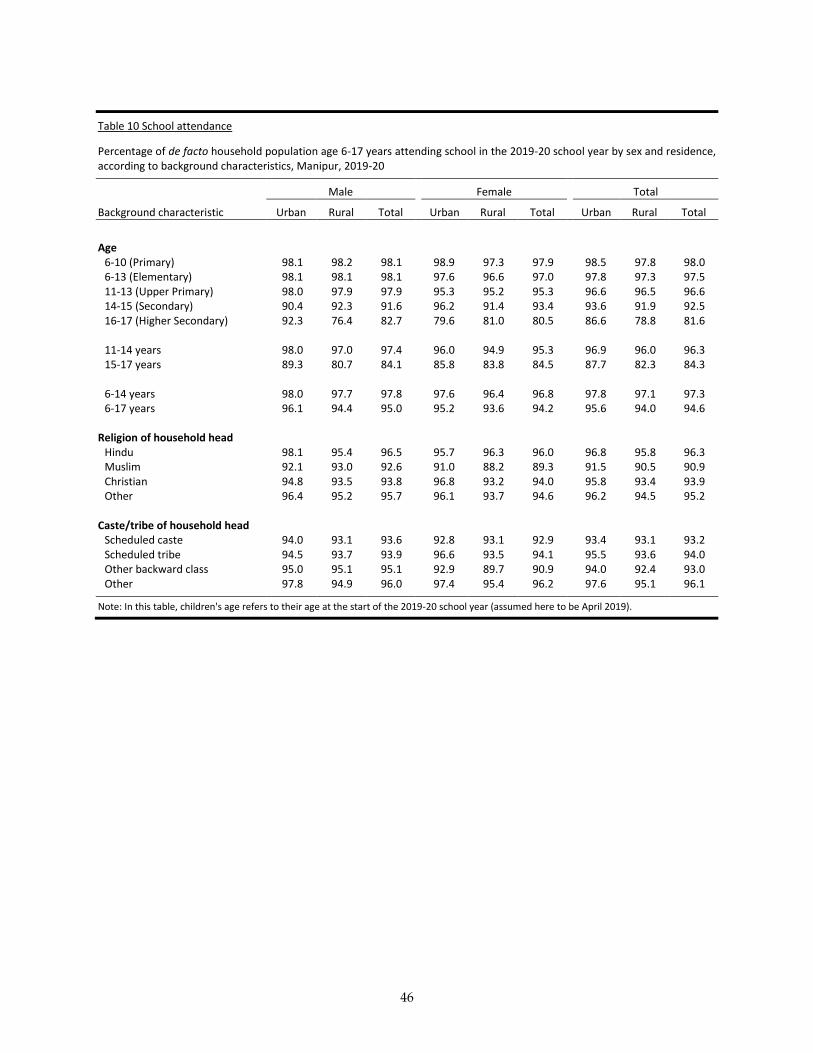
46
Table 10 School attendance
Percentage of de facto household population age 6-17 years attending school in the 2019-20 school year by sex and residence, according to background characteristics, Manipur, 2019-20
Male Female Total
Background characteristic Urban Rural Total Urban Rural Total Urban Rural Total
Age
6-10 (Primary) 98.1 98.2 98.1 98.9 97.3 97.9 98.5 97.8 98.0 6-13 (Elementary) 98.1 98.1 98.1 97.6 96.6 97.0 97.8 97.3 97.5 11-13 (Upper Primary) 98.0 97.9 97.9 95.3 95.2 95.3 96.6 96.5 96.6 14-15 (Secondary) 90.4 92.3 91.6 96.2 91.4 93.4 93.6 91.9 92.5 16-17 (Higher Secondary) 92.3 76.4 82.7 79.6 81.0 80.5 86.6 78.8 81.6 11-14 years 98.0 97.0 97.4 96.0 94.9 95.3 96.9 96.0 96.3 15-17 years 89.3 80.7 84.1 85.8 83.8 84.5 87.7 82.3 84.3 6-14 years 98.0 97.7 97.8 97.6 96.4 96.8 97.8 97.1 97.3 6-17 years 96.1 94.4 95.0 95.2 93.6 94.2 95.6 94.0 94.6
Religion of household head Hindu 98.1 95.4 96.5 95.7 96.3 96.0 96.8 95.8 96.3 Muslim 92.1 93.0 92.6 91.0 88.2 89.3 91.5 90.5 90.9 Christian 94.8 93.5 93.8 96.8 93.2 94.0 95.8 93.4 93.9 Other 96.4 95.2 95.7 96.1 93.7 94.6 96.2 94.5 95.2
Caste/tribe of household head Scheduled caste 94.0 93.1 93.6 92.8 93.1 92.9 93.4 93.1 93.2 Scheduled tribe 94.5 93.7 93.9 96.6 93.5 94.1 95.5 93.6 94.0 Other backward class 95.0 95.1 95.1 92.9 89.7 90.9 94.0 92.4 93.0 Other 97.8 94.9 96.0 97.4 95.4 96.2 97.6 95.1 96.1
Note: In this table, children's age refers to their age at the start of the 2019-20 school year (assumed here to be April 2019).
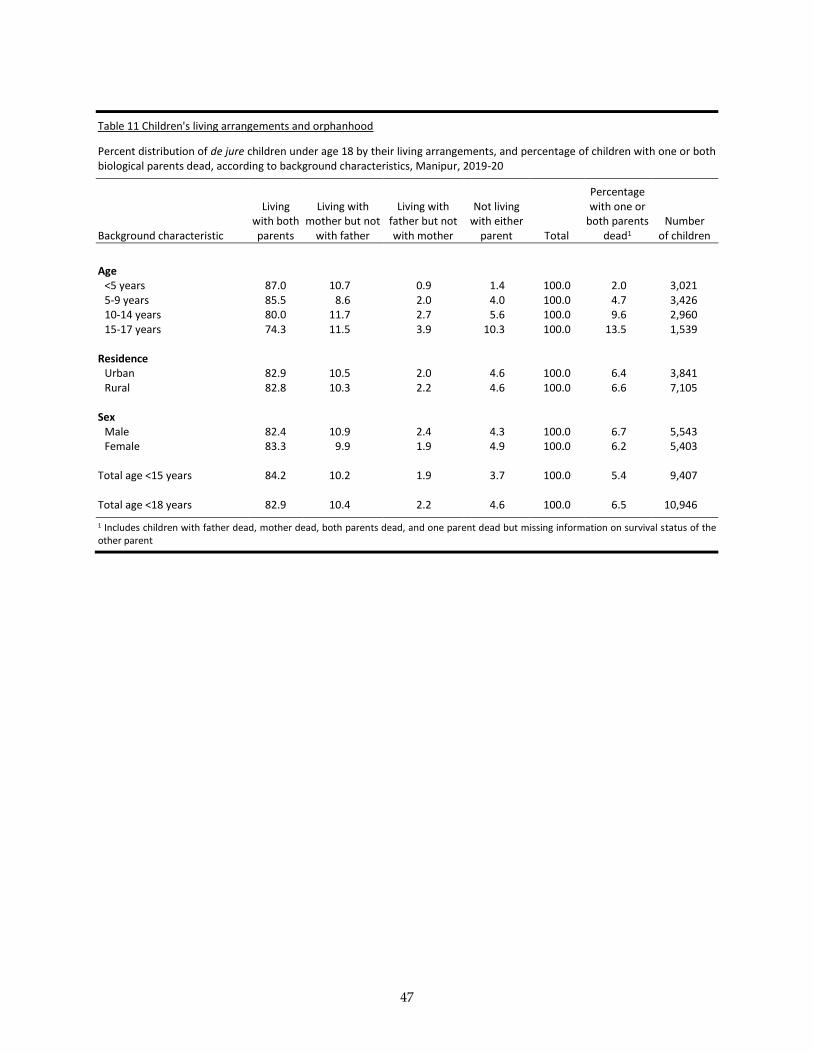
47
Table 11 Children's living arrangements and orphanhood
Percent distribution of de jure children under age 18 by their living arrangements, and percentage of children with one or both biological parents dead, according to background characteristics, Manipur, 2019-20
Background characteristic
Living with both parents
Living with mother but not
with father
Living with father but not with mother
Not living with either
parent Total
Percentage with one or
both parents dead1
Number of children
Age
<5 years 87.0 10.7 0.9 1.4 100.0 2.0 3,021 5-9 years 85.5 8.6 2.0 4.0 100.0 4.7 3,426 10-14 years 80.0 11.7 2.7 5.6 100.0 9.6 2,960 15-17 years 74.3 11.5 3.9 10.3 100.0 13.5 1,539
Residence Urban 82.9 10.5 2.0 4.6 100.0 6.4 3,841 Rural 82.8 10.3 2.2 4.6 100.0 6.6 7,105
Sex Male 82.4 10.9 2.4 4.3 100.0 6.7 5,543 Female 83.3 9.9 1.9 4.9 100.0 6.2 5,403
Total age <15 years 84.2 10.2 1.9 3.7 100.0 5.4 9,407
Total age <18 years 82.9 10.4 2.2 4.6 100.0 6.5 10,946
1 Includes children with father dead, mother dead, both parents dead, and one parent dead but missing information on survival status of the other parent
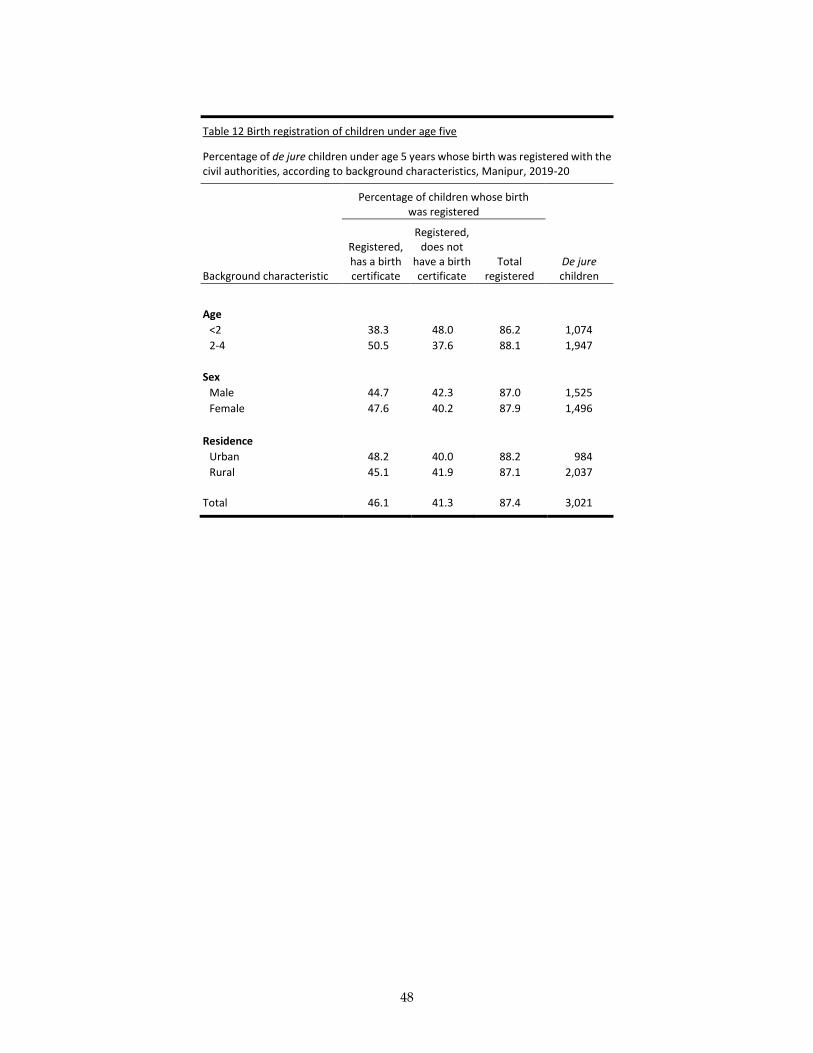
48
Table 12 Birth registration of children under age five
Percentage of de jure children under age 5 years whose birth was registered with the civil authorities, according to background characteristics, Manipur, 2019-20
Percentage of children whose birth was registered
Background characteristic
Registered, has a birth certificate
Registered, does not
have a birth certificate
Total registered
De jure children
Age
<2 38.3 48.0 86.2 1,074
2-4 50.5 37.6 88.1 1,947
Sex
Male 44.7 42.3 87.0 1,525
Female 47.6 40.2 87.9 1,496
Residence
Urban 48.2 40.0 88.2 984
Rural 45.1 41.9 87.1 2,037
Total 46.1 41.3 87.4 3,021
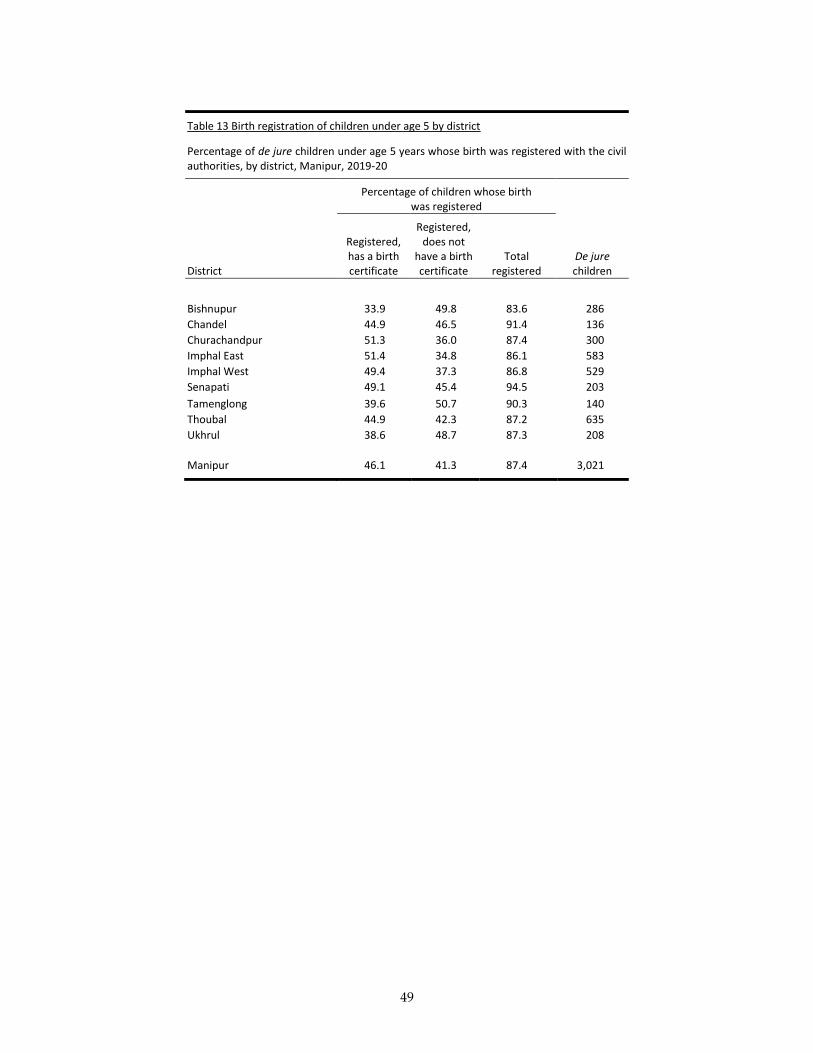
49
Table 13 Birth registration of children under age 5 by district
Percentage of de jure children under age 5 years whose birth was registered with the civil authorities, by district, Manipur, 2019-20
Percentage of children whose birth was registered
District
Registered, has a birth certificate
Registered, does not
have a birth certificate
Total registered
De jure children
Bishnupur 33.9 49.8 83.6 286
Chandel 44.9 46.5 91.4 136
Churachandpur 51.3 36.0 87.4 300
Imphal East 51.4 34.8 86.1 583
Imphal West 49.4 37.3 86.8 529
Senapati 49.1 45.4 94.5 203
Tamenglong 39.6 50.7 90.3 140
Thoubal 44.9 42.3 87.2 635
Ukhrul 38.6 48.7 87.3 208
Manipur 46.1 41.3 87.4 3,021
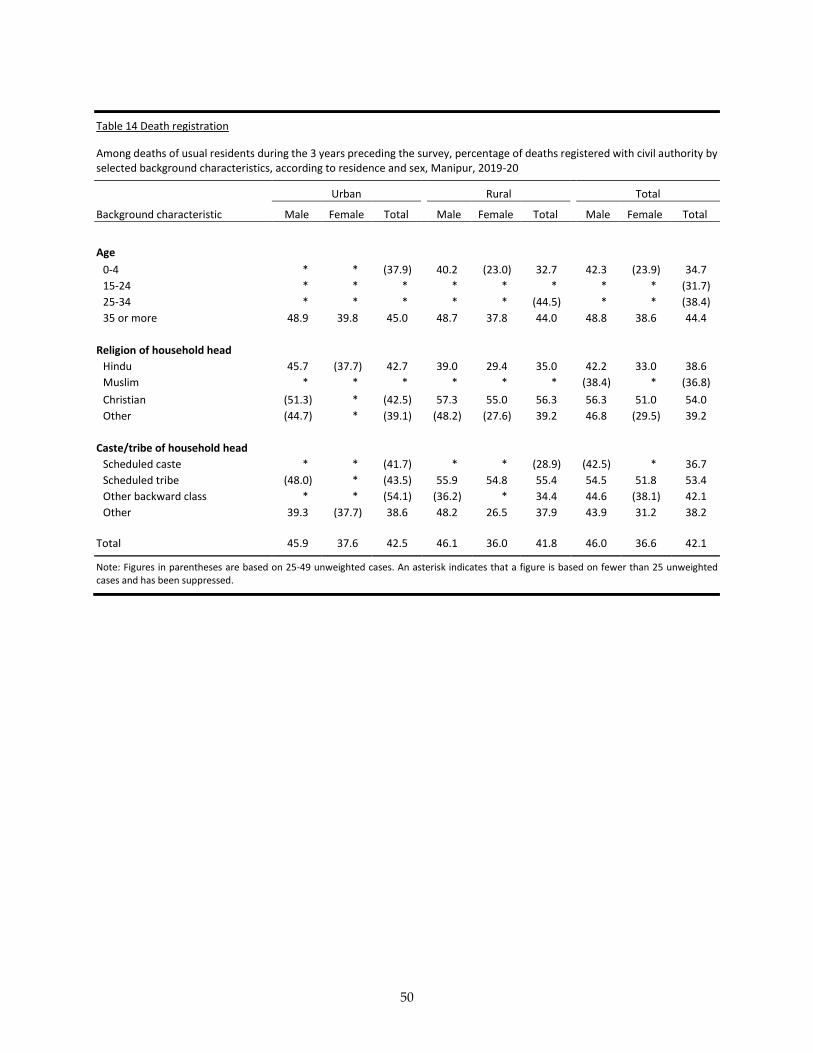
50
Table 14 Death registration
Among deaths of usual residents during the 3 years preceding the survey, percentage of deaths registered with civil authority by selected background characteristics, according to residence and sex, Manipur, 2019-20
Urban Rural Total
Background characteristic Male Female Total Male Female Total Male Female Total
Age
0-4 * * (37.9) 40.2 (23.0) 32.7 42.3 (23.9) 34.7
15-24 * * * * * * * * (31.7)
25-34 * * * * * (44.5) * * (38.4)
35 or more 48.9 39.8 45.0 48.7 37.8 44.0 48.8 38.6 44.4
Religion of household head
Hindu 45.7 (37.7) 42.7 39.0 29.4 35.0 42.2 33.0 38.6
Muslim * * * * * * (38.4) * (36.8)
Christian (51.3) * (42.5) 57.3 55.0 56.3 56.3 51.0 54.0
Other (44.7) * (39.1) (48.2) (27.6) 39.2 46.8 (29.5) 39.2
Caste/tribe of household head
Scheduled caste * * (41.7) * * (28.9) (42.5) * 36.7
Scheduled tribe (48.0) * (43.5) 55.9 54.8 55.4 54.5 51.8 53.4
Other backward class * * (54.1) (36.2) * 34.4 44.6 (38.1) 42.1
Other 39.3 (37.7) 38.6 48.2 26.5 37.9 43.9 31.2 38.2
Total 45.9 37.6 42.5 46.1 36.0 41.8 46.0 36.6 42.1
Note: Figures in parentheses are based on 25-49 unweighted cases. An asterisk indicates that a figure is based on fewer than 25 unweighted cases and has been suppressed.
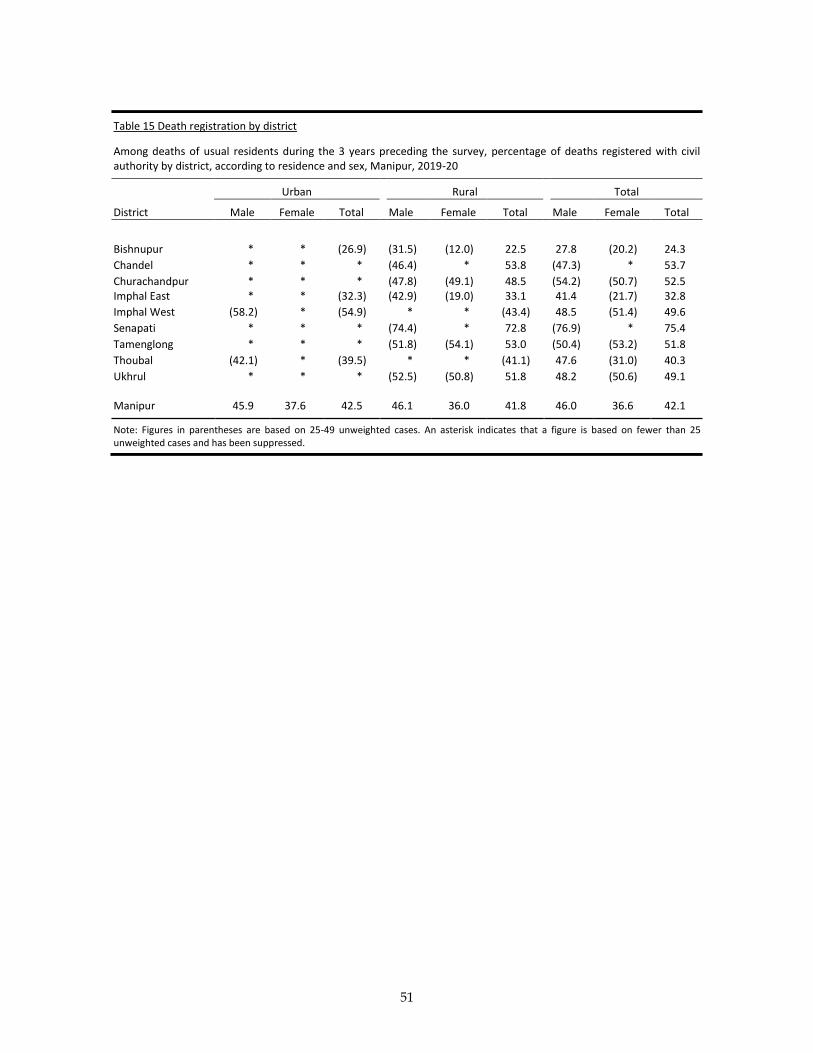
51
Table 15 Death registration by district
Among deaths of usual residents during the 3 years preceding the survey, percentage of deaths registered with civil authority by district, according to residence and sex, Manipur, 2019-20
Urban Rural Total
District Male Female Total Male Female Total Male Female Total
Bishnupur * * (26.9) (31.5) (12.0) 22.5 27.8 (20.2) 24.3
Chandel * * * (46.4) * 53.8 (47.3) * 53.7
Churachandpur * * * (47.8) (49.1) 48.5 (54.2) (50.7) 52.5 Imphal East * * (32.3) (42.9) (19.0) 33.1 41.4 (21.7) 32.8
Imphal West (58.2) * (54.9) * * (43.4) 48.5 (51.4) 49.6
Senapati * * * (74.4) * 72.8 (76.9) * 75.4
Tamenglong * * * (51.8) (54.1) 53.0 (50.4) (53.2) 51.8
Thoubal (42.1) * (39.5) * * (41.1) 47.6 (31.0) 40.3
Ukhrul * * * (52.5) (50.8) 51.8 48.2 (50.6) 49.1 Manipur 45.9 37.6 42.5 46.1 36.0 41.8 46.0 36.6 42.1
Note: Figures in parentheses are based on 25-49 unweighted cases. An asterisk indicates that a figure is based on fewer than 25 unweighted cases and has been suppressed.

52
Table 16 Disability
Percentage of de jure household population having disability by type of disability, according to residence, age, and sex, Manipur, 2019-20
Type of disability
Background characteristic Any
Hearing disability
Speech disability
Visual disability
Mental disability Locomotor Other
Number of persons
FEMALE
Residence Urban 0.8 0.1 0.2 0.1 0.4 0.1 0.1 6,631 Rural 0.8 0.2 0.2 0.1 0.2 0.1 0.2 10,769
Age 0-4 0.4 0.0 0.4 0.0 0.2 0.1 0.0 1,496 5-14 0.5 0.1 0.2 0.0 0.3 0.1 0.1 3,129 15-24 0.8 0.0 0.2 0.0 0.4 0.2 0.2 2,532 25-34 0.6 0.2 0.0 0.0 0.2 0.1 0.2 2,793 35-49 1.0 0.2 0.3 0.2 0.5 0.1 0.0 3,530 50-69 0.8 0.4 0.1 0.1 0.2 0.0 0.2 3,131 70 or more 1.6 0.5 0.2 0.4 0.0 0.4 0.4 788
Total 0.8 0.2 0.2 0.1 0.3 0.1 0.1 17,400
MALE
Residence Urban 1.4 0.2 0.3 0.2 0.4 0.3 0.3 6,241 Rural 1.2 0.2 0.3 0.1 0.3 0.3 0.2 10,282
Age 0-4 0.2 0.0 0.1 0.0 0.0 0.1 0.0 1,525 5-14 0.7 0.1 0.4 0.0 0.1 0.3 0.0 3,259 15-24 1.2 0.1 0.3 0.1 0.4 0.3 0.2 2,380 25-34 0.9 0.2 0.2 0.1 0.4 0.0 0.1 2,496 35-49 1.7 0.2 0.3 0.2 0.6 0.4 0.3 3,340 50-69 2.4 0.4 0.2 0.3 0.4 0.5 0.7 2,681 70 or more 1.7 1.1 0.3 0.2 0.1 0.0 0.4 842
Total 1.3 0.2 0.3 0.1 0.3 0.3 0.3 16,523
TOTAL
Residence Urban 1.1 0.2 0.2 0.1 0.4 0.2 0.2 12,872 Rural 1.0 0.2 0.2 0.1 0.2 0.2 0.2 21,051
Age 0-4 0.3 0.0 0.2 0.0 0.1 0.1 0.0 3,021 5-14 0.6 0.1 0.3 0.0 0.2 0.2 0.1 6,388 15-24 1.0 0.0 0.3 0.1 0.4 0.3 0.2 4,912 25-34 0.8 0.2 0.1 0.0 0.3 0.1 0.1 5,289 35-49 1.4 0.2 0.3 0.2 0.5 0.3 0.2 6,871 50-69 1.5 0.4 0.2 0.2 0.3 0.3 0.4 5,812 70 or more 1.7 0.8 0.3 0.3 0.1 0.2 0.4 1,630
Total 1.0 0.2 0.2 0.1 0.3 0.2 0.2 33,923
Note: Table is based on the responses of the respondent to the household questionnaire.
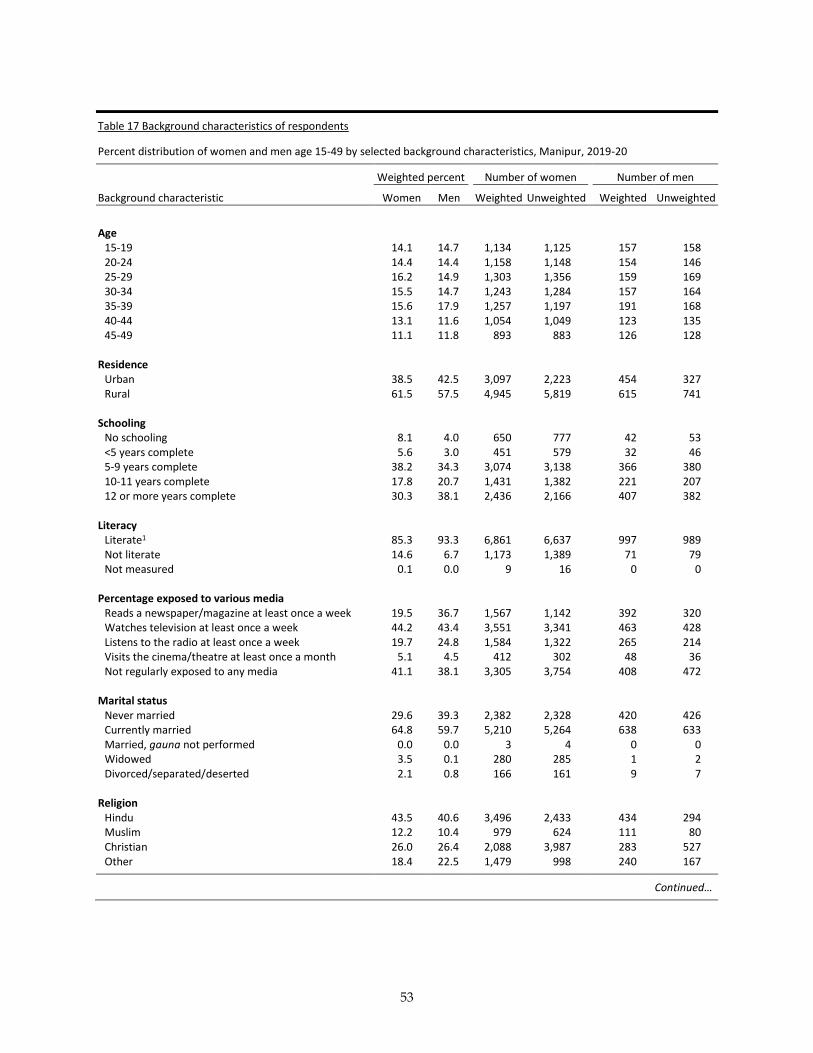
53
Table 17 Background characteristics of respondents
Percent distribution of women and men age 15-49 by selected background characteristics, Manipur, 2019-20
Weighted percent Number of women Number of men
Background characteristic Women Men Weighted Unweighted Weighted Unweighted
Age
15-19 14.1 14.7 1,134 1,125 157 158 20-24 14.4 14.4 1,158 1,148 154 146 25-29 16.2 14.9 1,303 1,356 159 169 30-34 15.5 14.7 1,243 1,284 157 164 35-39 15.6 17.9 1,257 1,197 191 168 40-44 13.1 11.6 1,054 1,049 123 135 45-49 11.1 11.8 893 883 126 128
Residence Urban 38.5 42.5 3,097 2,223 454 327 Rural 61.5 57.5 4,945 5,819 615 741
Schooling No schooling 8.1 4.0 650 777 42 53 <5 years complete 5.6 3.0 451 579 32 46 5-9 years complete 38.2 34.3 3,074 3,138 366 380 10-11 years complete 17.8 20.7 1,431 1,382 221 207 12 or more years complete 30.3 38.1 2,436 2,166 407 382
Literacy Literate1 85.3 93.3 6,861 6,637 997 989 Not literate 14.6 6.7 1,173 1,389 71 79 Not measured 0.1 0.0 9 16 0 0
Percentage exposed to various media Reads a newspaper/magazine at least once a week 19.5 36.7 1,567 1,142 392 320 Watches television at least once a week 44.2 43.4 3,551 3,341 463 428 Listens to the radio at least once a week 19.7 24.8 1,584 1,322 265 214 Visits the cinema/theatre at least once a month 5.1 4.5 412 302 48 36 Not regularly exposed to any media 41.1 38.1 3,305 3,754 408 472
Marital status Never married 29.6 39.3 2,382 2,328 420 426 Currently married 64.8 59.7 5,210 5,264 638 633 Married, gauna not performed 0.0 0.0 3 4 0 0 Widowed 3.5 0.1 280 285 1 2 Divorced/separated/deserted 2.1 0.8 166 161 9 7
Religion Hindu 43.5 40.6 3,496 2,433 434 294 Muslim 12.2 10.4 979 624 111 80 Christian 26.0 26.4 2,088 3,987 283 527 Other 18.4 22.5 1,479 998 240 167
Continued…
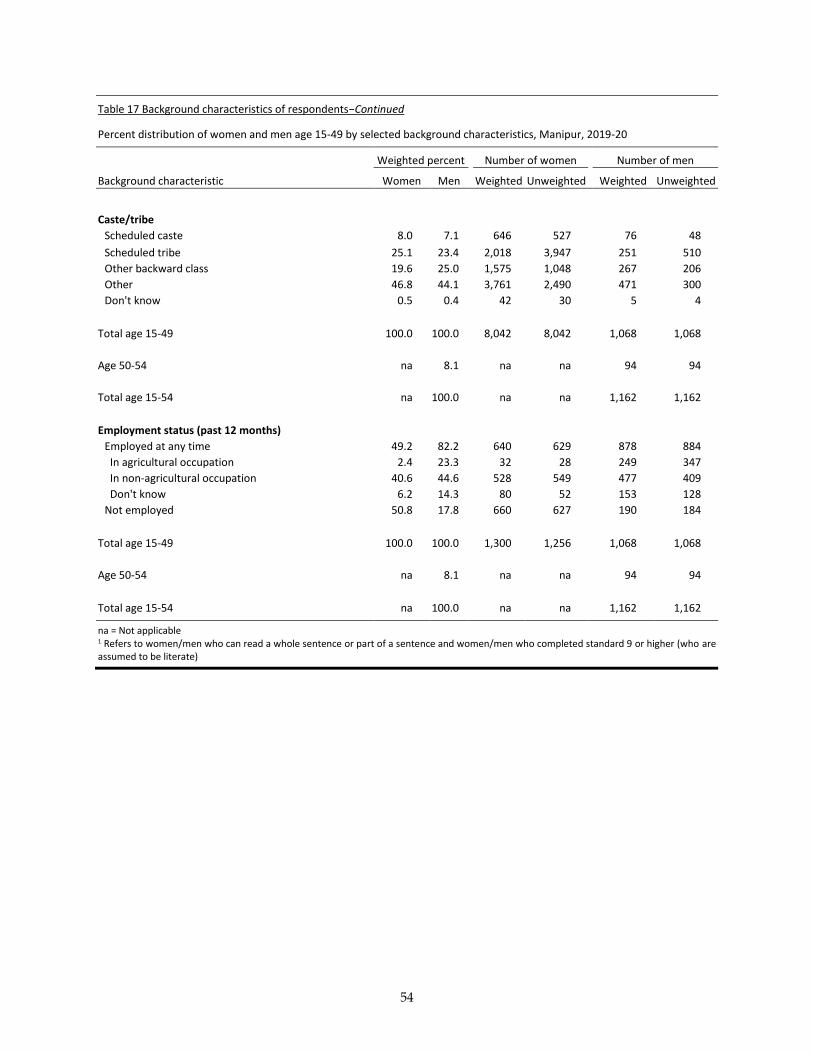
54
Table 17 Background characteristics of respondents−Continued
Percent distribution of women and men age 15-49 by selected background characteristics, Manipur, 2019-20
Weighted percent Number of women Number of men
Background characteristic Women Men Weighted Unweighted Weighted Unweighted
Caste/tribe
Scheduled caste 8.0 7.1 646 527 76 48
Scheduled tribe 25.1 23.4 2,018 3,947 251 510
Other backward class 19.6 25.0 1,575 1,048 267 206
Other 46.8 44.1 3,761 2,490 471 300
Don't know 0.5 0.4 42 30 5 4
Total age 15-49 100.0 100.0 8,042 8,042 1,068 1,068
Age 50-54 na 8.1 na na 94 94
Total age 15-54 na 100.0 na na 1,162 1,162
Employment status (past 12 months)
Employed at any time 49.2 82.2 640 629 878 884
In agricultural occupation 2.4 23.3 32 28 249 347
In non-agricultural occupation 40.6 44.6 528 549 477 409
Don't know 6.2 14.3 80 52 153 128
Not employed 50.8 17.8 660 627 190 184
Total age 15-49 100.0 100.0 1,300 1,256 1,068 1,068
Age 50-54 na 8.1 na na 94 94
Total age 15-54 na 100.0 na na 1,162 1,162
na = Not applicable 1 Refers to women/men who can read a whole sentence or part of a sentence and women/men who completed standard 9 or higher (who are assumed to be literate)
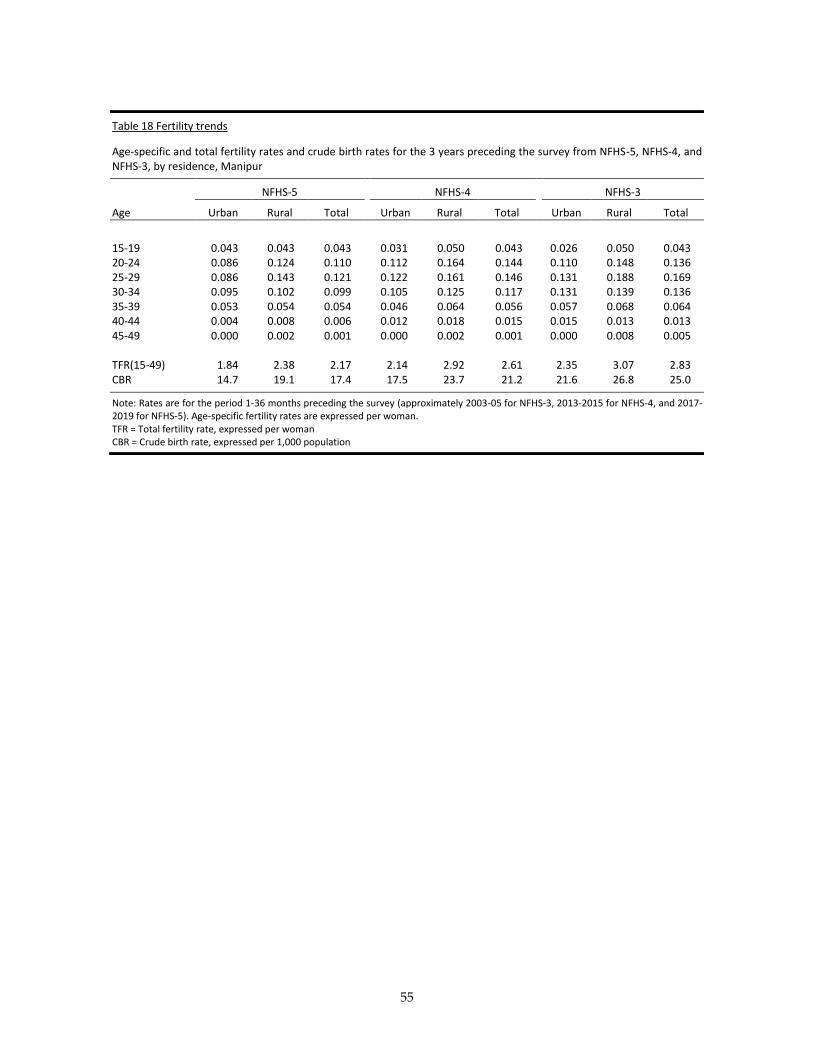
55
Table 18 Fertility trends
Age-specific and total fertility rates and crude birth rates for the 3 years preceding the survey from NFHS-5, NFHS-4, and NFHS-3, by residence, Manipur
NFHS-5 NFHS-4 NFHS-3
Age Urban Rural Total Urban Rural Total Urban Rural Total
15-19 0.043 0.043 0.043 0.031 0.050 0.043 0.026 0.050 0.043 20-24 0.086 0.124 0.110 0.112 0.164 0.144 0.110 0.148 0.136 25-29 0.086 0.143 0.121 0.122 0.161 0.146 0.131 0.188 0.169 30-34 0.095 0.102 0.099 0.105 0.125 0.117 0.131 0.139 0.136 35-39 0.053 0.054 0.054 0.046 0.064 0.056 0.057 0.068 0.064 40-44 0.004 0.008 0.006 0.012 0.018 0.015 0.015 0.013 0.013 45-49 0.000 0.002 0.001 0.000 0.002 0.001 0.000 0.008 0.005 TFR(15-49) 1.84 2.38 2.17 2.14 2.92 2.61 2.35 3.07 2.83 CBR 14.7 19.1 17.4 17.5 23.7 21.2 21.6 26.8 25.0
Note: Rates are for the period 1-36 months preceding the survey (approximately 2003-05 for NFHS-3, 2013-2015 for NFHS-4, and 2017-2019 for NFHS-5). Age-specific fertility rates are expressed per woman. TFR = Total fertility rate, expressed per woman CBR = Crude birth rate, expressed per 1,000 population
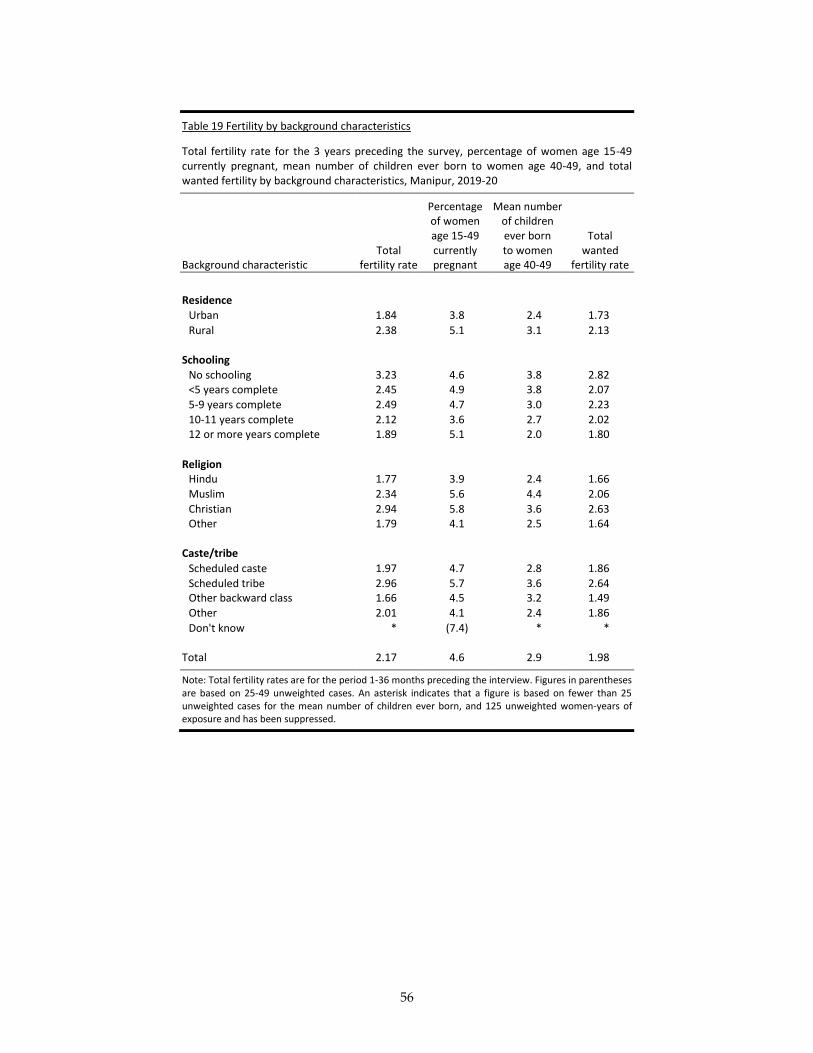
56
Table 19 Fertility by background characteristics
Total fertility rate for the 3 years preceding the survey, percentage of women age 15-49 currently pregnant, mean number of children ever born to women age 40-49, and total wanted fertility by background characteristics, Manipur, 2019-20
Background characteristic Total
fertility rate
Percentage of women age 15-49 currently pregnant
Mean number of children ever born to women age 40-49
Total wanted
fertility rate
Residence
Urban 1.84 3.8 2.4 1.73
Rural 2.38 5.1 3.1 2.13
Schooling
No schooling 3.23 4.6 3.8 2.82 <5 years complete 2.45 4.9 3.8 2.07
5-9 years complete 2.49 4.7 3.0 2.23
10-11 years complete 2.12 3.6 2.7 2.02 12 or more years complete 1.89 5.1 2.0 1.80
Religion Hindu 1.77 3.9 2.4 1.66
Muslim 2.34 5.6 4.4 2.06
Christian 2.94 5.8 3.6 2.63 Other 1.79 4.1 2.5 1.64
Caste/tribe
Scheduled caste 1.97 4.7 2.8 1.86
Scheduled tribe 2.96 5.7 3.6 2.64 Other backward class 1.66 4.5 3.2 1.49
Other 2.01 4.1 2.4 1.86
Don't know * (7.4) * *
Total 2.17 4.6 2.9 1.98
Note: Total fertility rates are for the period 1-36 months preceding the interview. Figures in parentheses are based on 25-49 unweighted cases. An asterisk indicates that a figure is based on fewer than 25 unweighted cases for the mean number of children ever born, and 125 unweighted women-years of exposure and has been suppressed.
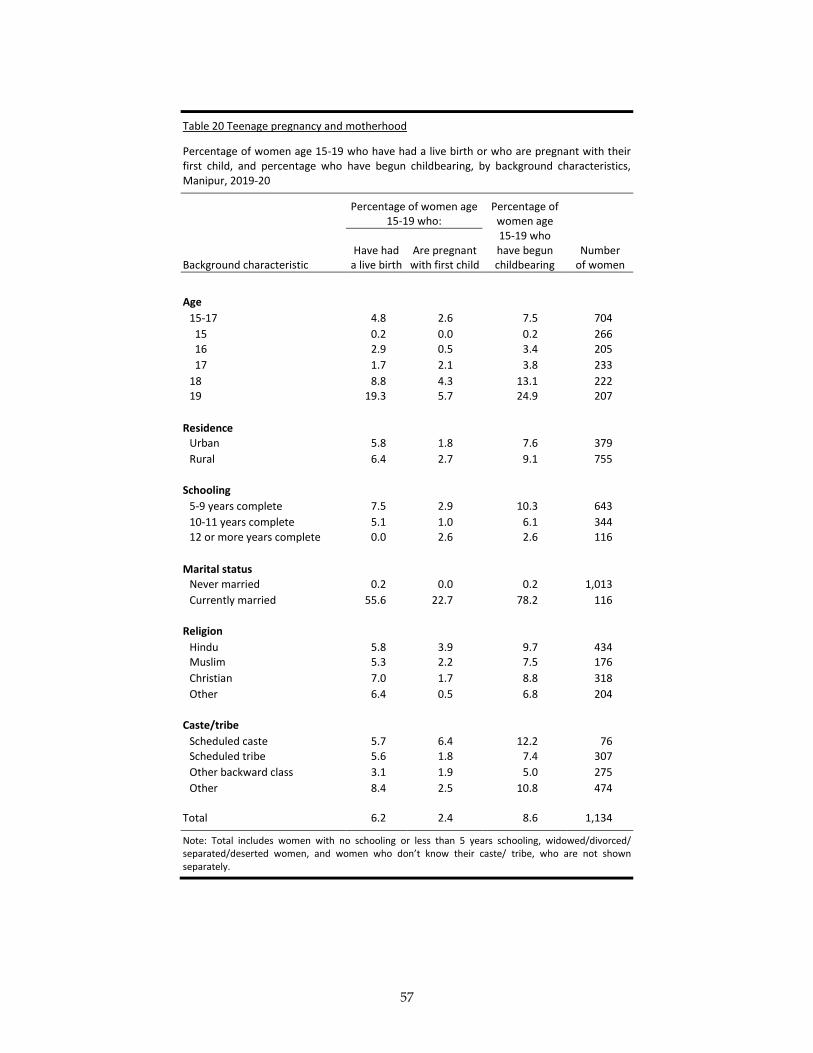
57
Table 20 Teenage pregnancy and motherhood
Percentage of women age 15-19 who have had a live birth or who are pregnant with their first child, and percentage who have begun childbearing, by background characteristics, Manipur, 2019-20
Percentage of women age 15-19 who:
Percentage of women age 15-19 who have begun childbearing
Number of women Background characteristic
Have had a live birth
Are pregnant with first child
Age
15-17 4.8 2.6 7.5 704
15 0.2 0.0 0.2 266
16 2.9 0.5 3.4 205
17 1.7 2.1 3.8 233
18 8.8 4.3 13.1 222 19 19.3 5.7 24.9 207
Residence
Urban 5.8 1.8 7.6 379
Rural 6.4 2.7 9.1 755
Schooling
5-9 years complete 7.5 2.9 10.3 643
10-11 years complete 5.1 1.0 6.1 344
12 or more years complete 0.0 2.6 2.6 116
Marital status
Never married 0.2 0.0 0.2 1,013
Currently married 55.6 22.7 78.2 116
Religion
Hindu 5.8 3.9 9.7 434 Muslim 5.3 2.2 7.5 176
Christian 7.0 1.7 8.8 318
Other 6.4 0.5 6.8 204
Caste/tribe
Scheduled caste 5.7 6.4 12.2 76
Scheduled tribe 5.6 1.8 7.4 307
Other backward class 3.1 1.9 5.0 275
Other 8.4 2.5 10.8 474
Total 6.2 2.4 8.6 1,134
Note: Total includes women with no schooling or less than 5 years schooling, widowed/divorced/ separated/deserted women, and women who don’t know their caste/ tribe, who are not shown separately.

58
Table 21 Birth order
Percent distribution of births to all women during the 3 years preceding the survey by birth order, according to background characteristics, Manipur, 2019-20, and percent distribution of births to women by birth order, NFHS-4
Background characteristic
Birth order
Total Number of births 1 2 3 4 or more
Mother's current age
15-19 87.6 10.4 1.9 0.0 100.0 74 20-29 45.5 35.3 13.0 6.2 100.0 791 30-39 24.1 33.4 21.4 21.1 100.0 660 40-49 12.3 32.9 8.6 46.2 100.0 58
Residence Urban 43.9 35.6 12.6 7.9 100.0 505 Rural 34.3 32.2 17.4 16.2 100.0 1,078
Mother's schooling No schooling 19.3 21.5 23.9 35.3 100.0 117 <5 years complete 20.6 16.2 27.3 35.8 100.0 84 5-9 years complete 33.3 35.6 17.0 14.0 100.0 666 10-11 years complete 43.8 31.3 12.8 12.1 100.0 261 12 or more years complete 47.2 37.2 11.6 4.0 100.0 456
Religion Hindu 42.3 38.3 14.4 5.0 100.0 558 Muslim 34.0 34.7 15.4 15.8 100.0 229 Christian 30.2 26.1 19.4 24.3 100.0 567 Other 46.3 37.2 11.0 5.5 100.0 229
Caste/tribe Scheduled caste 39.4 39.6 9.4 11.7 100.0 120 Scheduled tribe 29.3 24.9 20.6 25.2 100.0 555 Other backward class 43.8 29.8 14.9 11.5 100.0 238 Other 41.6 40.3 13.1 5.0 100.0 666
Total 37.3 33.3 15.8 13.6 100.0 1,584
NFHS-4 (2015-16) 40.4 30.6 13.9 15.1 100.0 3,225
Note: Total includes information on births to women who don’t know their caste/ tribe, who are not shown separately.
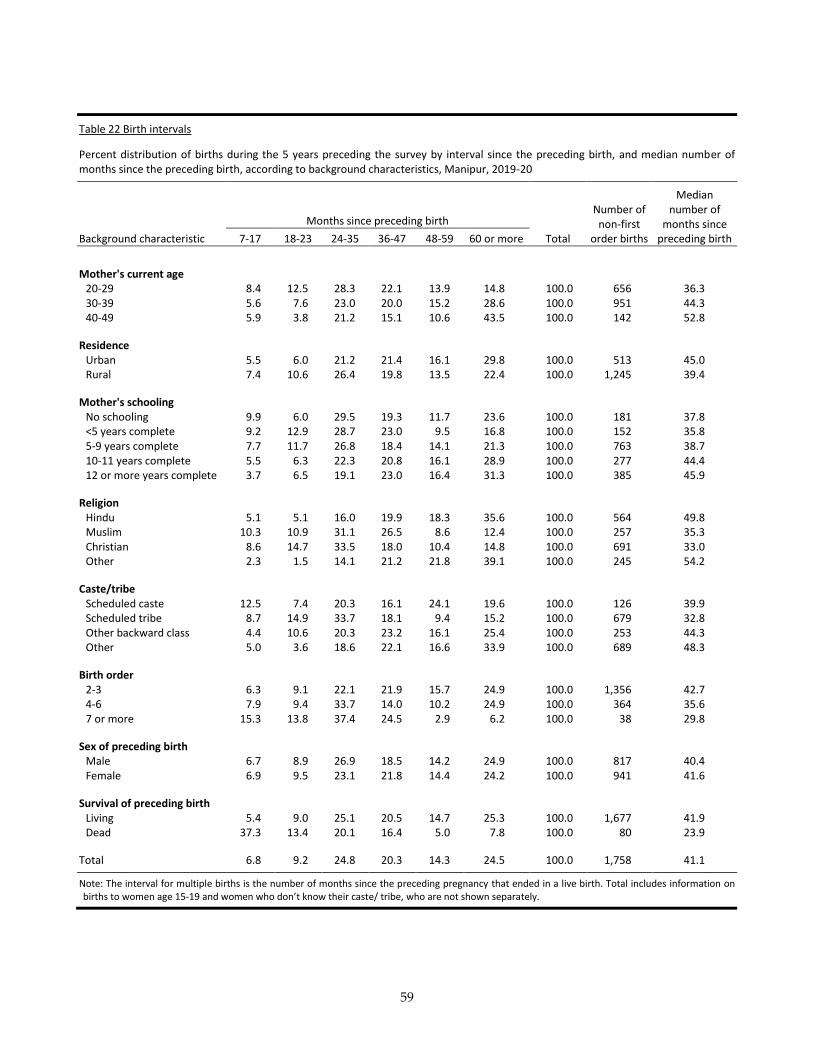
59
Table 22 Birth intervals
Percent distribution of births during the 5 years preceding the survey by interval since the preceding birth, and median number of months since the preceding birth, according to background characteristics, Manipur, 2019-20
Background characteristic
Months since preceding birth
Total
Number of non-first
order births
Median number of
months since preceding birth 7-17 18-23 24-35 36-47 48-59 60 or more
Mother's current age
20-29 8.4 12.5 28.3 22.1 13.9 14.8 100.0 656 36.3 30-39 5.6 7.6 23.0 20.0 15.2 28.6 100.0 951 44.3 40-49 5.9 3.8 21.2 15.1 10.6 43.5 100.0 142 52.8
Residence Urban 5.5 6.0 21.2 21.4 16.1 29.8 100.0 513 45.0 Rural 7.4 10.6 26.4 19.8 13.5 22.4 100.0 1,245 39.4
Mother's schooling No schooling 9.9 6.0 29.5 19.3 11.7 23.6 100.0 181 37.8 <5 years complete 9.2 12.9 28.7 23.0 9.5 16.8 100.0 152 35.8 5-9 years complete 7.7 11.7 26.8 18.4 14.1 21.3 100.0 763 38.7 10-11 years complete 5.5 6.3 22.3 20.8 16.1 28.9 100.0 277 44.4 12 or more years complete 3.7 6.5 19.1 23.0 16.4 31.3 100.0 385 45.9
Religion Hindu 5.1 5.1 16.0 19.9 18.3 35.6 100.0 564 49.8 Muslim 10.3 10.9 31.1 26.5 8.6 12.4 100.0 257 35.3 Christian 8.6 14.7 33.5 18.0 10.4 14.8 100.0 691 33.0 Other 2.3 1.5 14.1 21.2 21.8 39.1 100.0 245 54.2
Caste/tribe Scheduled caste 12.5 7.4 20.3 16.1 24.1 19.6 100.0 126 39.9 Scheduled tribe 8.7 14.9 33.7 18.1 9.4 15.2 100.0 679 32.8 Other backward class 4.4 10.6 20.3 23.2 16.1 25.4 100.0 253 44.3 Other 5.0 3.6 18.6 22.1 16.6 33.9 100.0 689 48.3
Birth order 2-3 6.3 9.1 22.1 21.9 15.7 24.9 100.0 1,356 42.7 4-6 7.9 9.4 33.7 14.0 10.2 24.9 100.0 364 35.6 7 or more 15.3 13.8 37.4 24.5 2.9 6.2 100.0 38 29.8
Sex of preceding birth Male 6.7 8.9 26.9 18.5 14.2 24.9 100.0 817 40.4 Female 6.9 9.5 23.1 21.8 14.4 24.2 100.0 941 41.6
Survival of preceding birth Living 5.4 9.0 25.1 20.5 14.7 25.3 100.0 1,677 41.9 Dead 37.3 13.4 20.1 16.4 5.0 7.8 100.0 80 23.9
Total 6.8 9.2 24.8 20.3 14.3 24.5 100.0 1,758 41.1
Note: The interval for multiple births is the number of months since the preceding pregnancy that ended in a live birth. Total includes information on births to women age 15-19 and women who don’t know their caste/ tribe, who are not shown separately.
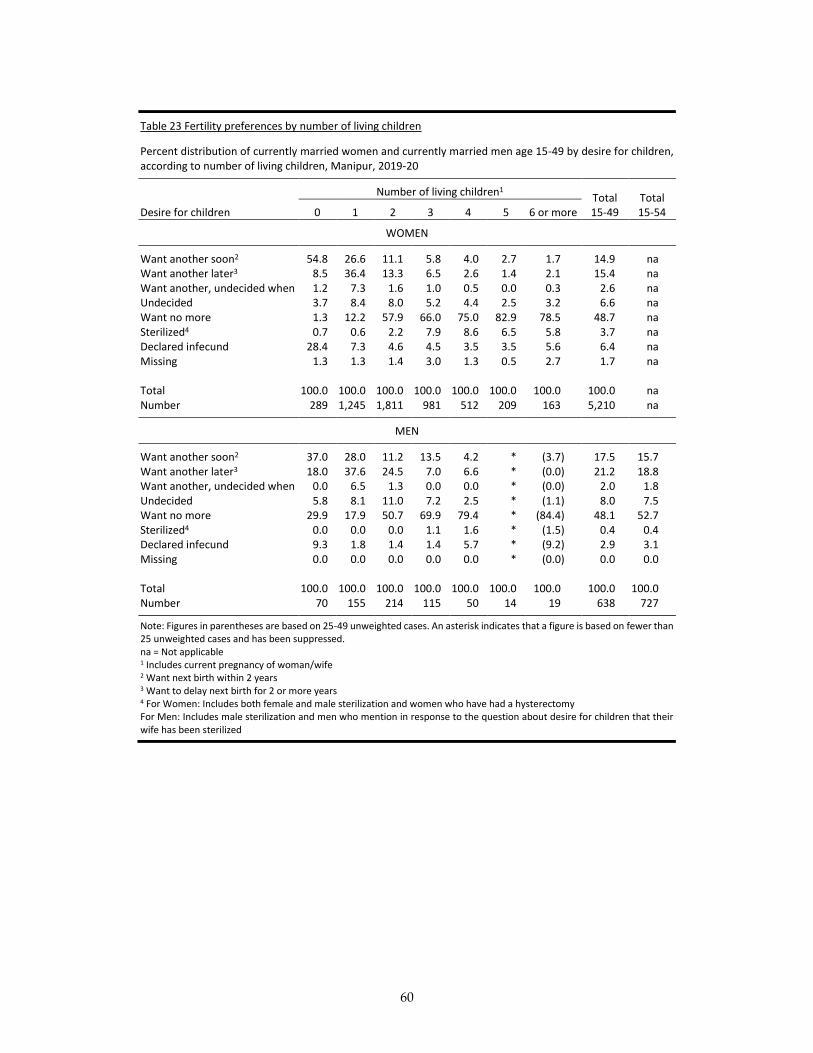
60
Table 23 Fertility preferences by number of living children
Percent distribution of currently married women and currently married men age 15-49 by desire for children, according to number of living children, Manipur, 2019-20
Desire for children
Number of living children1 Total 15-49
Total 15-54 0 1 2 3 4 5 6 or more
WOMEN
Want another soon2 54.8 26.6 11.1 5.8 4.0 2.7 1.7 14.9 na Want another later3 8.5 36.4 13.3 6.5 2.6 1.4 2.1 15.4 na Want another, undecided when 1.2 7.3 1.6 1.0 0.5 0.0 0.3 2.6 na Undecided 3.7 8.4 8.0 5.2 4.4 2.5 3.2 6.6 na Want no more 1.3 12.2 57.9 66.0 75.0 82.9 78.5 48.7 na Sterilized4 0.7 0.6 2.2 7.9 8.6 6.5 5.8 3.7 na Declared infecund 28.4 7.3 4.6 4.5 3.5 3.5 5.6 6.4 na Missing 1.3 1.3 1.4 3.0 1.3 0.5 2.7 1.7 na Total 100.0 100.0 100.0 100.0 100.0 100.0 100.0 100.0 na Number 289 1,245 1,811 981 512 209 163 5,210 na
MEN
Want another soon2 37.0 28.0 11.2 13.5 4.2 * (3.7) 17.5 15.7 Want another later3 18.0 37.6 24.5 7.0 6.6 * (0.0) 21.2 18.8 Want another, undecided when 0.0 6.5 1.3 0.0 0.0 * (0.0) 2.0 1.8 Undecided 5.8 8.1 11.0 7.2 2.5 * (1.1) 8.0 7.5 Want no more 29.9 17.9 50.7 69.9 79.4 * (84.4) 48.1 52.7 Sterilized4 0.0 0.0 0.0 1.1 1.6 * (1.5) 0.4 0.4 Declared infecund 9.3 1.8 1.4 1.4 5.7 * (9.2) 2.9 3.1 Missing 0.0 0.0 0.0 0.0 0.0 * (0.0) 0.0 0.0 Total 100.0 100.0 100.0 100.0 100.0 100.0 100.0 100.0 100.0 Number 70 155 214 115 50 14 19 638 727
Note: Figures in parentheses are based on 25-49 unweighted cases. An asterisk indicates that a figure is based on fewer than 25 unweighted cases and has been suppressed. na = Not applicable 1 Includes current pregnancy of woman/wife 2 Want next birth within 2 years 3 Want to delay next birth for 2 or more years 4 For Women: Includes both female and male sterilization and women who have had a hysterectomy For Men: Includes male sterilization and men who mention in response to the question about desire for children that their wife has been sterilized
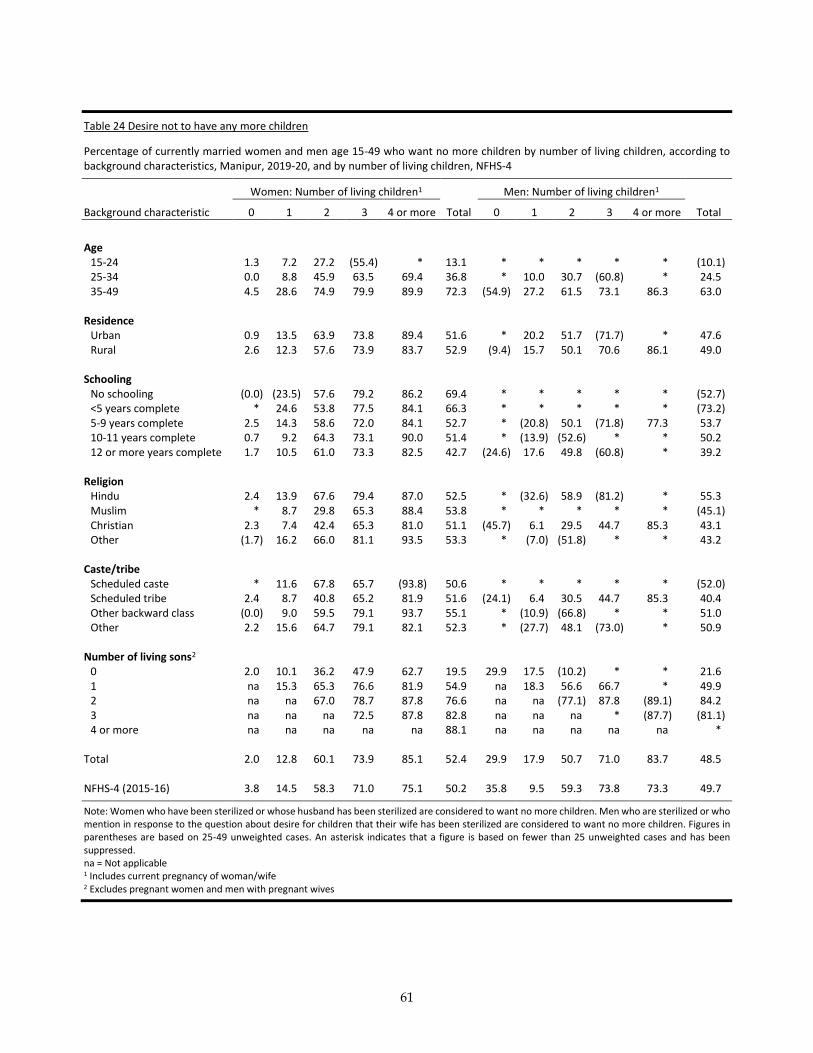
61
Table 24 Desire not to have any more children
Percentage of currently married women and men age 15-49 who want no more children by number of living children, according to background characteristics, Manipur, 2019-20, and by number of living children, NFHS-4
Women: Number of living children1
Total
Men: Number of living children1
Total Background characteristic 0 1 2 3 4 or more 0 1 2 3 4 or more
Age
15-24 1.3 7.2 27.2 (55.4) * 13.1 * * * * * (10.1) 25-34 0.0 8.8 45.9 63.5 69.4 36.8 * 10.0 30.7 (60.8) * 24.5 35-49 4.5 28.6 74.9 79.9 89.9 72.3 (54.9) 27.2 61.5 73.1 86.3 63.0
Residence Urban 0.9 13.5 63.9 73.8 89.4 51.6 * 20.2 51.7 (71.7) * 47.6 Rural 2.6 12.3 57.6 73.9 83.7 52.9 (9.4) 15.7 50.1 70.6 86.1 49.0
Schooling No schooling (0.0) (23.5) 57.6 79.2 86.2 69.4 * * * * * (52.7) <5 years complete * 24.6 53.8 77.5 84.1 66.3 * * * * * (73.2) 5-9 years complete 2.5 14.3 58.6 72.0 84.1 52.7 * (20.8) 50.1 (71.8) 77.3 53.7 10-11 years complete 0.7 9.2 64.3 73.1 90.0 51.4 * (13.9) (52.6) * * 50.2 12 or more years complete 1.7 10.5 61.0 73.3 82.5 42.7 (24.6) 17.6 49.8 (60.8) * 39.2
Religion Hindu 2.4 13.9 67.6 79.4 87.0 52.5 * (32.6) 58.9 (81.2) * 55.3 Muslim * 8.7 29.8 65.3 88.4 53.8 * * * * * (45.1) Christian 2.3 7.4 42.4 65.3 81.0 51.1 (45.7) 6.1 29.5 44.7 85.3 43.1 Other (1.7) 16.2 66.0 81.1 93.5 53.3 * (7.0) (51.8) * * 43.2
Caste/tribe Scheduled caste * 11.6 67.8 65.7 (93.8) 50.6 * * * * * (52.0) Scheduled tribe 2.4 8.7 40.8 65.2 81.9 51.6 (24.1) 6.4 30.5 44.7 85.3 40.4 Other backward class (0.0) 9.0 59.5 79.1 93.7 55.1 * (10.9) (66.8) * * 51.0 Other 2.2 15.6 64.7 79.1 82.1 52.3 * (27.7) 48.1 (73.0) * 50.9
Number of living sons2 0 2.0 10.1 36.2 47.9 62.7 19.5 29.9 17.5 (10.2) * * 21.6 1 na 15.3 65.3 76.6 81.9 54.9 na 18.3 56.6 66.7 * 49.9 2 na na 67.0 78.7 87.8 76.6 na na (77.1) 87.8 (89.1) 84.2 3 na na na 72.5 87.8 82.8 na na na * (87.7) (81.1) 4 or more na na na na na 88.1 na na na na na *
Total 2.0 12.8 60.1 73.9 85.1 52.4 29.9 17.9 50.7 71.0 83.7 48.5
NFHS-4 (2015-16) 3.8 14.5 58.3 71.0 75.1 50.2 35.8 9.5 59.3 73.8 73.3 49.7
Note: Women who have been sterilized or whose husband has been sterilized are considered to want no more children. Men who are sterilized or who mention in response to the question about desire for children that their wife has been sterilized are considered to want no more children. Figures in parentheses are based on 25-49 unweighted cases. An asterisk indicates that a figure is based on fewer than 25 unweighted cases and has been suppressed. na = Not applicable 1 Includes current pregnancy of woman/wife 2 Excludes pregnant women and men with pregnant wives
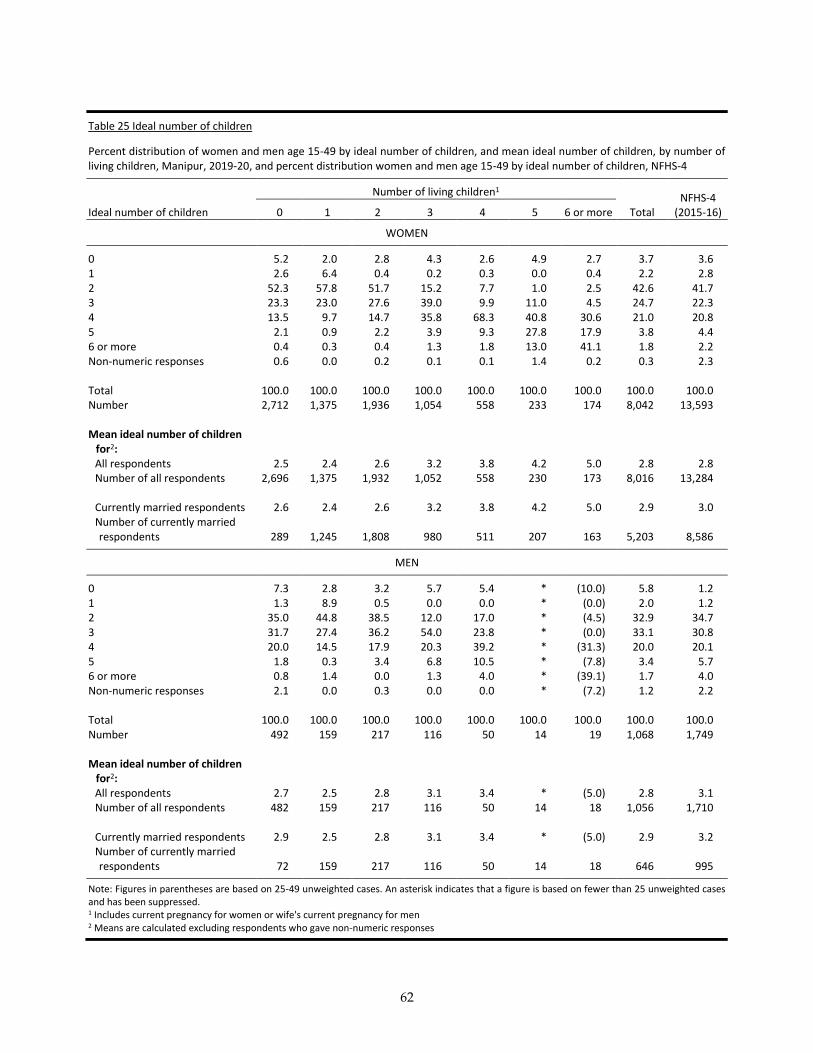
62
Table 25 Ideal number of children
Percent distribution of women and men age 15-49 by ideal number of children, and mean ideal number of children, by number of living children, Manipur, 2019-20, and percent distribution women and men age 15-49 by ideal number of children, NFHS-4
Number of living children1 NFHS-4
(2015-16) Ideal number of children 0 1 2 3 4 5 6 or more Total
WOMEN
0 5.2 2.0 2.8 4.3 2.6 4.9 2.7 3.7 3.6 1 2.6 6.4 0.4 0.2 0.3 0.0 0.4 2.2 2.8 2 52.3 57.8 51.7 15.2 7.7 1.0 2.5 42.6 41.7 3 23.3 23.0 27.6 39.0 9.9 11.0 4.5 24.7 22.3 4 13.5 9.7 14.7 35.8 68.3 40.8 30.6 21.0 20.8 5 2.1 0.9 2.2 3.9 9.3 27.8 17.9 3.8 4.4 6 or more 0.4 0.3 0.4 1.3 1.8 13.0 41.1 1.8 2.2 Non-numeric responses 0.6 0.0 0.2 0.1 0.1 1.4 0.2 0.3 2.3 Total 100.0 100.0 100.0 100.0 100.0 100.0 100.0 100.0 100.0 Number 2,712 1,375 1,936 1,054 558 233 174 8,042 13,593 Mean ideal number of children
for2: All respondents 2.5 2.4 2.6 3.2 3.8 4.2 5.0 2.8 2.8 Number of all respondents 2,696 1,375 1,932 1,052 558 230 173 8,016 13,284 Currently married respondents 2.6 2.4 2.6 3.2 3.8 4.2 5.0 2.9 3.0 Number of currently married respondents 289 1,245 1,808 980 511 207 163 5,203 8,586
MEN
0 7.3 2.8 3.2 5.7 5.4 * (10.0) 5.8 1.2 1 1.3 8.9 0.5 0.0 0.0 * (0.0) 2.0 1.2 2 35.0 44.8 38.5 12.0 17.0 * (4.5) 32.9 34.7 3 31.7 27.4 36.2 54.0 23.8 * (0.0) 33.1 30.8 4 20.0 14.5 17.9 20.3 39.2 * (31.3) 20.0 20.1 5 1.8 0.3 3.4 6.8 10.5 * (7.8) 3.4 5.7 6 or more 0.8 1.4 0.0 1.3 4.0 * (39.1) 1.7 4.0 Non-numeric responses 2.1 0.0 0.3 0.0 0.0 * (7.2) 1.2 2.2
Total 100.0 100.0 100.0 100.0 100.0 100.0 100.0 100.0 100.0 Number 492 159 217 116 50 14 19 1,068 1,749
Mean ideal number of children
for2: All respondents 2.7 2.5 2.8 3.1 3.4 * (5.0) 2.8 3.1 Number of all respondents 482 159 217 116 50 14 18 1,056 1,710 Currently married respondents 2.9 2.5 2.8 3.1 3.4 * (5.0) 2.9 3.2 Number of currently married respondents 72 159 217 116 50 14 18 646 995
Note: Figures in parentheses are based on 25-49 unweighted cases. An asterisk indicates that a figure is based on fewer than 25 unweighted cases and has been suppressed. 1 Includes current pregnancy for women or wife's current pregnancy for men 2 Means are calculated excluding respondents who gave non-numeric responses
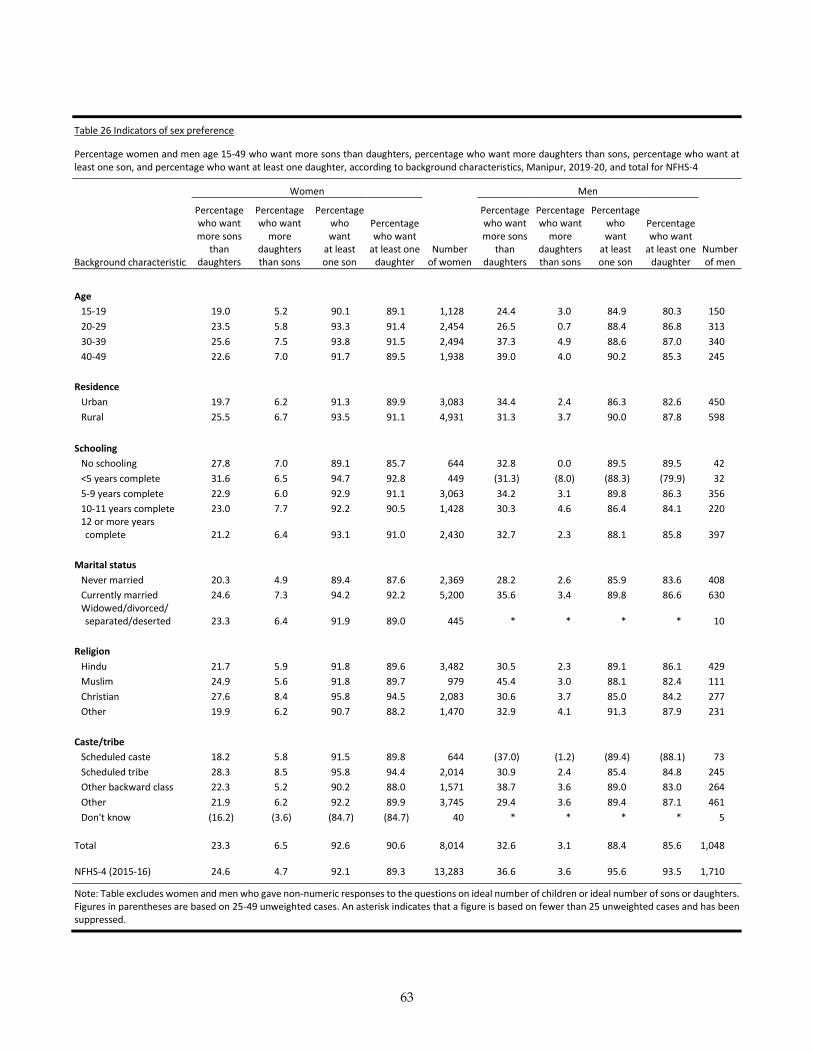
63
Table 26 Indicators of sex preference
Percentage women and men age 15-49 who want more sons than daughters, percentage who want more daughters than sons, percentage who want at least one son, and percentage who want at least one daughter, according to background characteristics, Manipur, 2019-20, and total for NFHS-4
Women Men
Background characteristic
Percentage who want more sons
than daughters
Percentage who want
more daughters than sons
Percentage who want
at least one son
Percentage who want
at least one daughter
Number of women
Percentage who want more sons
than daughters
Percentage who want
more daughters than sons
Percentage who want
at least one son
Percentage who want
at least one daughter
Number of men
Age
15-19 19.0 5.2 90.1 89.1 1,128 24.4 3.0 84.9 80.3 150
20-29 23.5 5.8 93.3 91.4 2,454 26.5 0.7 88.4 86.8 313
30-39 25.6 7.5 93.8 91.5 2,494 37.3 4.9 88.6 87.0 340
40-49 22.6 7.0 91.7 89.5 1,938 39.0 4.0 90.2 85.3 245
Residence
Urban 19.7 6.2 91.3 89.9 3,083 34.4 2.4 86.3 82.6 450
Rural 25.5 6.7 93.5 91.1 4,931 31.3 3.7 90.0 87.8 598
Schooling
No schooling 27.8 7.0 89.1 85.7 644 32.8 0.0 89.5 89.5 42
<5 years complete 31.6 6.5 94.7 92.8 449 (31.3) (8.0) (88.3) (79.9) 32
5-9 years complete 22.9 6.0 92.9 91.1 3,063 34.2 3.1 89.8 86.3 356
10-11 years complete 23.0 7.7 92.2 90.5 1,428 30.3 4.6 86.4 84.1 220 12 or more years complete 21.2 6.4 93.1 91.0 2,430 32.7 2.3 88.1 85.8 397
Marital status
Never married 20.3 4.9 89.4 87.6 2,369 28.2 2.6 85.9 83.6 408
Currently married 24.6 7.3 94.2 92.2 5,200 35.6 3.4 89.8 86.6 630 Widowed/divorced/ separated/deserted 23.3 6.4 91.9 89.0 445 * * * * 10
Religion
Hindu 21.7 5.9 91.8 89.6 3,482 30.5 2.3 89.1 86.1 429
Muslim 24.9 5.6 91.8 89.7 979 45.4 3.0 88.1 82.4 111
Christian 27.6 8.4 95.8 94.5 2,083 30.6 3.7 85.0 84.2 277
Other 19.9 6.2 90.7 88.2 1,470 32.9 4.1 91.3 87.9 231
Caste/tribe
Scheduled caste 18.2 5.8 91.5 89.8 644 (37.0) (1.2) (89.4) (88.1) 73
Scheduled tribe 28.3 8.5 95.8 94.4 2,014 30.9 2.4 85.4 84.8 245
Other backward class 22.3 5.2 90.2 88.0 1,571 38.7 3.6 89.0 83.0 264
Other 21.9 6.2 92.2 89.9 3,745 29.4 3.6 89.4 87.1 461
Don't know (16.2) (3.6) (84.7) (84.7) 40 * * * * 5
Total 23.3 6.5 92.6 90.6 8,014 32.6 3.1 88.4 85.6 1,048
NFHS-4 (2015-16) 24.6 4.7 92.1 89.3 13,283 36.6 3.6 95.6 93.5 1,710
Note: Table excludes women and men who gave non-numeric responses to the questions on ideal number of children or ideal number of sons or daughters. Figures in parentheses are based on 25-49 unweighted cases. An asterisk indicates that a figure is based on fewer than 25 unweighted cases and has been suppressed.
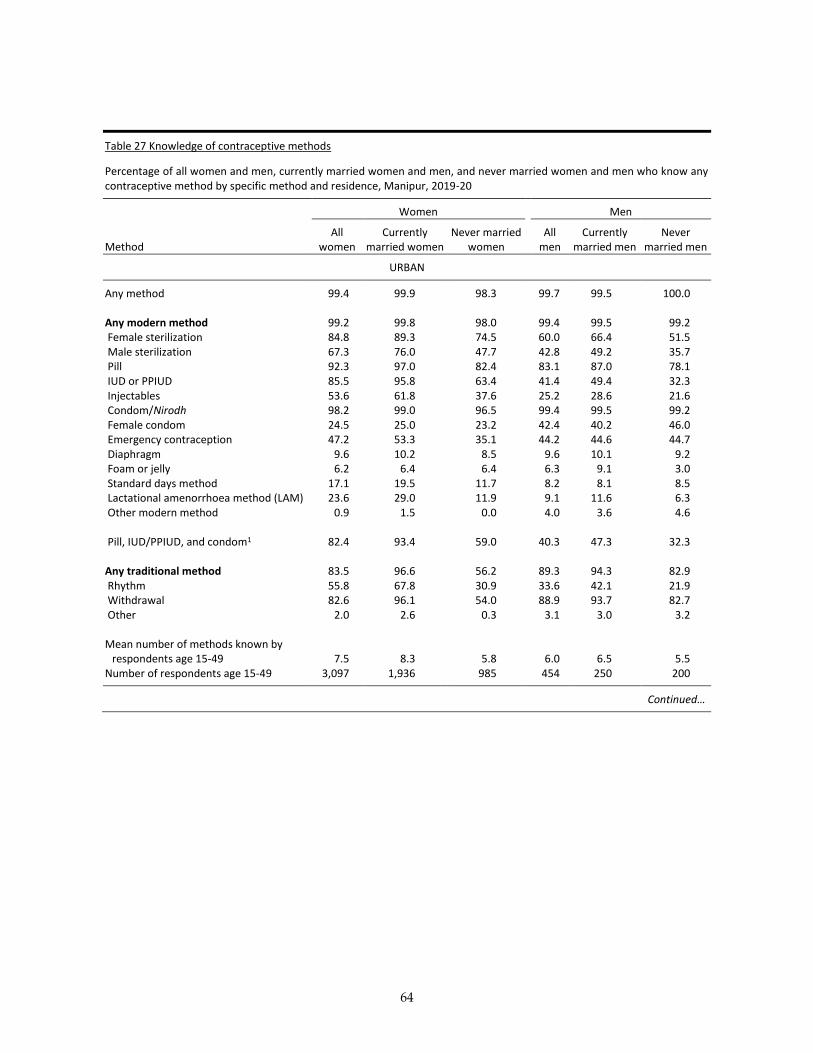
64
Table 27 Knowledge of contraceptive methods
Percentage of all women and men, currently married women and men, and never married women and men who know any contraceptive method by specific method and residence, Manipur, 2019-20
Women Men
Method All
women Currently
married women Never married
women All
men Currently
married men Never
married men
URBAN
Any method 99.4 99.9 98.3 99.7 99.5 100.0 Any modern method 99.2 99.8 98.0 99.4 99.5 99.2 Female sterilization 84.8 89.3 74.5 60.0 66.4 51.5 Male sterilization 67.3 76.0 47.7 42.8 49.2 35.7 Pill 92.3 97.0 82.4 83.1 87.0 78.1 IUD or PPIUD 85.5 95.8 63.4 41.4 49.4 32.3 Injectables 53.6 61.8 37.6 25.2 28.6 21.6 Condom/Nirodh 98.2 99.0 96.5 99.4 99.5 99.2 Female condom 24.5 25.0 23.2 42.4 40.2 46.0 Emergency contraception 47.2 53.3 35.1 44.2 44.6 44.7 Diaphragm 9.6 10.2 8.5 9.6 10.1 9.2 Foam or jelly 6.2 6.4 6.4 6.3 9.1 3.0 Standard days method 17.1 19.5 11.7 8.2 8.1 8.5 Lactational amenorrhoea method (LAM) 23.6 29.0 11.9 9.1 11.6 6.3 Other modern method 0.9 1.5 0.0 4.0 3.6 4.6 Pill, IUD/PPIUD, and condom1 82.4 93.4 59.0 40.3 47.3 32.3 Any traditional method 83.5 96.6 56.2 89.3 94.3 82.9 Rhythm 55.8 67.8 30.9 33.6 42.1 21.9 Withdrawal 82.6 96.1 54.0 88.9 93.7 82.7 Other 2.0 2.6 0.3 3.1 3.0 3.2 Mean number of methods known by
respondents age 15-49 7.5 8.3 5.8 6.0 6.5 5.5 Number of respondents age 15-49 3,097 1,936 985 454 250 200
Continued…
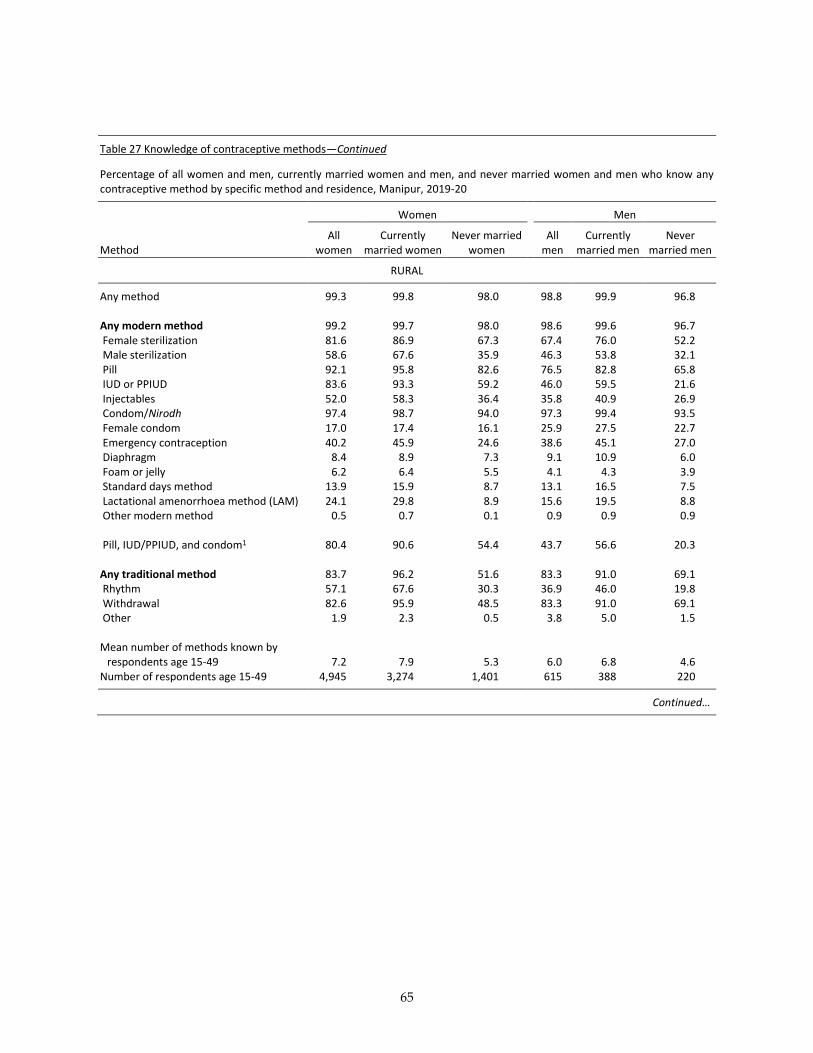
65
Table 27 Knowledge of contraceptive methods—Continued
Percentage of all women and men, currently married women and men, and never married women and men who know any contraceptive method by specific method and residence, Manipur, 2019-20
Women Men
Method All
women Currently
married women Never married
women All
men Currently
married men Never
married men
RURAL
Any method 99.3 99.8 98.0 98.8 99.9 96.8 Any modern method 99.2 99.7 98.0 98.6 99.6 96.7 Female sterilization 81.6 86.9 67.3 67.4 76.0 52.2 Male sterilization 58.6 67.6 35.9 46.3 53.8 32.1 Pill 92.1 95.8 82.6 76.5 82.8 65.8 IUD or PPIUD 83.6 93.3 59.2 46.0 59.5 21.6 Injectables 52.0 58.3 36.4 35.8 40.9 26.9 Condom/Nirodh 97.4 98.7 94.0 97.3 99.4 93.5 Female condom 17.0 17.4 16.1 25.9 27.5 22.7 Emergency contraception 40.2 45.9 24.6 38.6 45.1 27.0 Diaphragm 8.4 8.9 7.3 9.1 10.9 6.0 Foam or jelly 6.2 6.4 5.5 4.1 4.3 3.9 Standard days method 13.9 15.9 8.7 13.1 16.5 7.5 Lactational amenorrhoea method (LAM) 24.1 29.8 8.9 15.6 19.5 8.8 Other modern method 0.5 0.7 0.1 0.9 0.9 0.9 Pill, IUD/PPIUD, and condom1 80.4 90.6 54.4 43.7 56.6 20.3 Any traditional method 83.7 96.2 51.6 83.3 91.0 69.1 Rhythm 57.1 67.6 30.3 36.9 46.0 19.8 Withdrawal 82.6 95.9 48.5 83.3 91.0 69.1 Other 1.9 2.3 0.5 3.8 5.0 1.5 Mean number of methods known by
respondents age 15-49 7.2 7.9 5.3 6.0 6.8 4.6 Number of respondents age 15-49 4,945 3,274 1,401 615 388 220
Continued…
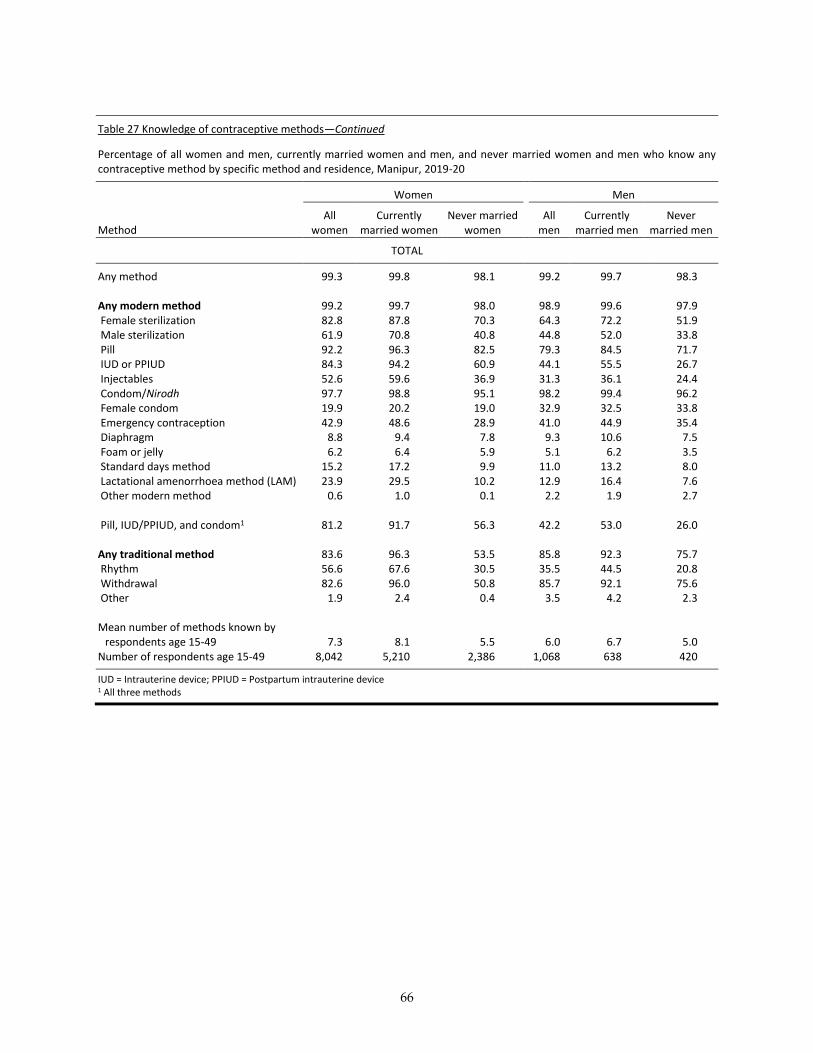
66
Table 27 Knowledge of contraceptive methods—Continued
Percentage of all women and men, currently married women and men, and never married women and men who know any contraceptive method by specific method and residence, Manipur, 2019-20
Women Men
Method All
women Currently
married women Never married
women All
men Currently
married men Never
married men
TOTAL
Any method 99.3 99.8 98.1 99.2 99.7 98.3 Any modern method 99.2 99.7 98.0 98.9 99.6 97.9 Female sterilization 82.8 87.8 70.3 64.3 72.2 51.9 Male sterilization 61.9 70.8 40.8 44.8 52.0 33.8 Pill 92.2 96.3 82.5 79.3 84.5 71.7 IUD or PPIUD 84.3 94.2 60.9 44.1 55.5 26.7 Injectables 52.6 59.6 36.9 31.3 36.1 24.4 Condom/Nirodh 97.7 98.8 95.1 98.2 99.4 96.2 Female condom 19.9 20.2 19.0 32.9 32.5 33.8 Emergency contraception 42.9 48.6 28.9 41.0 44.9 35.4 Diaphragm 8.8 9.4 7.8 9.3 10.6 7.5 Foam or jelly 6.2 6.4 5.9 5.1 6.2 3.5 Standard days method 15.2 17.2 9.9 11.0 13.2 8.0 Lactational amenorrhoea method (LAM) 23.9 29.5 10.2 12.9 16.4 7.6 Other modern method 0.6 1.0 0.1 2.2 1.9 2.7 Pill, IUD/PPIUD, and condom1 81.2 91.7 56.3 42.2 53.0 26.0 Any traditional method 83.6 96.3 53.5 85.8 92.3 75.7 Rhythm 56.6 67.6 30.5 35.5 44.5 20.8 Withdrawal 82.6 96.0 50.8 85.7 92.1 75.6 Other 1.9 2.4 0.4 3.5 4.2 2.3 Mean number of methods known by
respondents age 15-49 7.3 8.1 5.5 6.0 6.7 5.0 Number of respondents age 15-49 8,042 5,210 2,386 1,068 638 420
IUD = Intrauterine device; PPIUD = Postpartum intrauterine device 1 All three methods
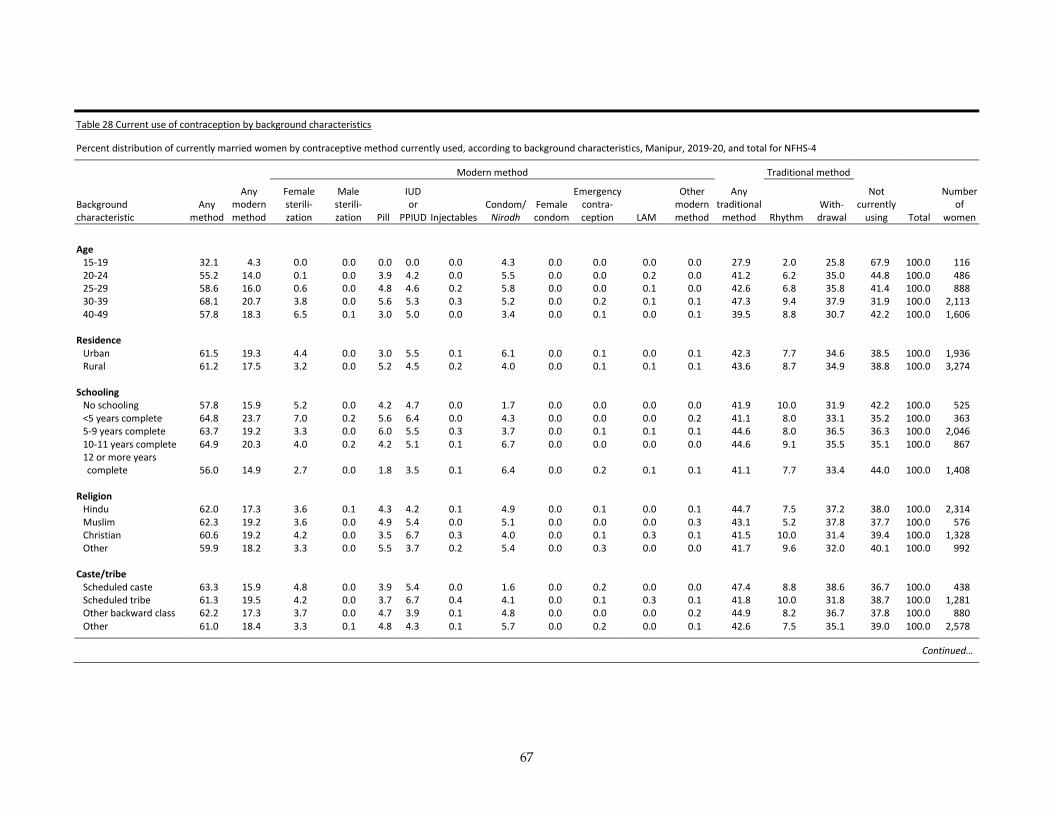
67
Table 28 Current use of contraception by background characteristics
Percent distribution of currently married women by contraceptive method currently used, according to background characteristics, Manipur, 2019-20, and total for NFHS-4
Modern method Traditional method
Background characteristic
Any method
Any modern method
Female sterili-zation
Male sterili-zation Pill
IUD or
PPIUD Injectables Condom/
Nirodh Female condom
Emergency contra-ception LAM
Other modern method
Any traditional
method Rhythm With-
drawal
Not currently
using Total
Number of
women
Age
15-19 32.1 4.3 0.0 0.0 0.0 0.0 0.0 4.3 0.0 0.0 0.0 0.0 27.9 2.0 25.8 67.9 100.0 116 20-24 55.2 14.0 0.1 0.0 3.9 4.2 0.0 5.5 0.0 0.0 0.2 0.0 41.2 6.2 35.0 44.8 100.0 486 25-29 58.6 16.0 0.6 0.0 4.8 4.6 0.2 5.8 0.0 0.0 0.1 0.0 42.6 6.8 35.8 41.4 100.0 888 30-39 68.1 20.7 3.8 0.0 5.6 5.3 0.3 5.2 0.0 0.2 0.1 0.1 47.3 9.4 37.9 31.9 100.0 2,113 40-49 57.8 18.3 6.5 0.1 3.0 5.0 0.0 3.4 0.0 0.1 0.0 0.1 39.5 8.8 30.7 42.2 100.0 1,606
Residence Urban 61.5 19.3 4.4 0.0 3.0 5.5 0.1 6.1 0.0 0.1 0.0 0.1 42.3 7.7 34.6 38.5 100.0 1,936 Rural 61.2 17.5 3.2 0.0 5.2 4.5 0.2 4.0 0.0 0.1 0.1 0.1 43.6 8.7 34.9 38.8 100.0 3,274
Schooling No schooling 57.8 15.9 5.2 0.0 4.2 4.7 0.0 1.7 0.0 0.0 0.0 0.0 41.9 10.0 31.9 42.2 100.0 525 <5 years complete 64.8 23.7 7.0 0.2 5.6 6.4 0.0 4.3 0.0 0.0 0.0 0.2 41.1 8.0 33.1 35.2 100.0 363 5-9 years complete 63.7 19.2 3.3 0.0 6.0 5.5 0.3 3.7 0.0 0.1 0.1 0.1 44.6 8.0 36.5 36.3 100.0 2,046 10-11 years complete 64.9 20.3 4.0 0.2 4.2 5.1 0.1 6.7 0.0 0.0 0.0 0.0 44.6 9.1 35.5 35.1 100.0 867 12 or more years complete 56.0 14.9 2.7 0.0 1.8 3.5 0.1 6.4 0.0 0.2 0.1 0.1 41.1 7.7 33.4 44.0 100.0 1,408
Religion
Hindu 62.0 17.3 3.6 0.1 4.3 4.2 0.1 4.9 0.0 0.1 0.0 0.1 44.7 7.5 37.2 38.0 100.0 2,314 Muslim 62.3 19.2 3.6 0.0 4.9 5.4 0.0 5.1 0.0 0.0 0.0 0.3 43.1 5.2 37.8 37.7 100.0 576 Christian 60.6 19.2 4.2 0.0 3.5 6.7 0.3 4.0 0.0 0.1 0.3 0.1 41.5 10.0 31.4 39.4 100.0 1,328 Other 59.9 18.2 3.3 0.0 5.5 3.7 0.2 5.4 0.0 0.3 0.0 0.0 41.7 9.6 32.0 40.1 100.0 992
Caste/tribe Scheduled caste 63.3 15.9 4.8 0.0 3.9 5.4 0.0 1.6 0.0 0.2 0.0 0.0 47.4 8.8 38.6 36.7 100.0 438 Scheduled tribe 61.3 19.5 4.2 0.0 3.7 6.7 0.4 4.1 0.0 0.1 0.3 0.1 41.8 10.0 31.8 38.7 100.0 1,281 Other backward class 62.2 17.3 3.7 0.0 4.7 3.9 0.1 4.8 0.0 0.0 0.0 0.2 44.9 8.2 36.7 37.8 100.0 880 Other 61.0 18.4 3.3 0.1 4.8 4.3 0.1 5.7 0.0 0.2 0.0 0.1 42.6 7.5 35.1 39.0 100.0 2,578
Continued…
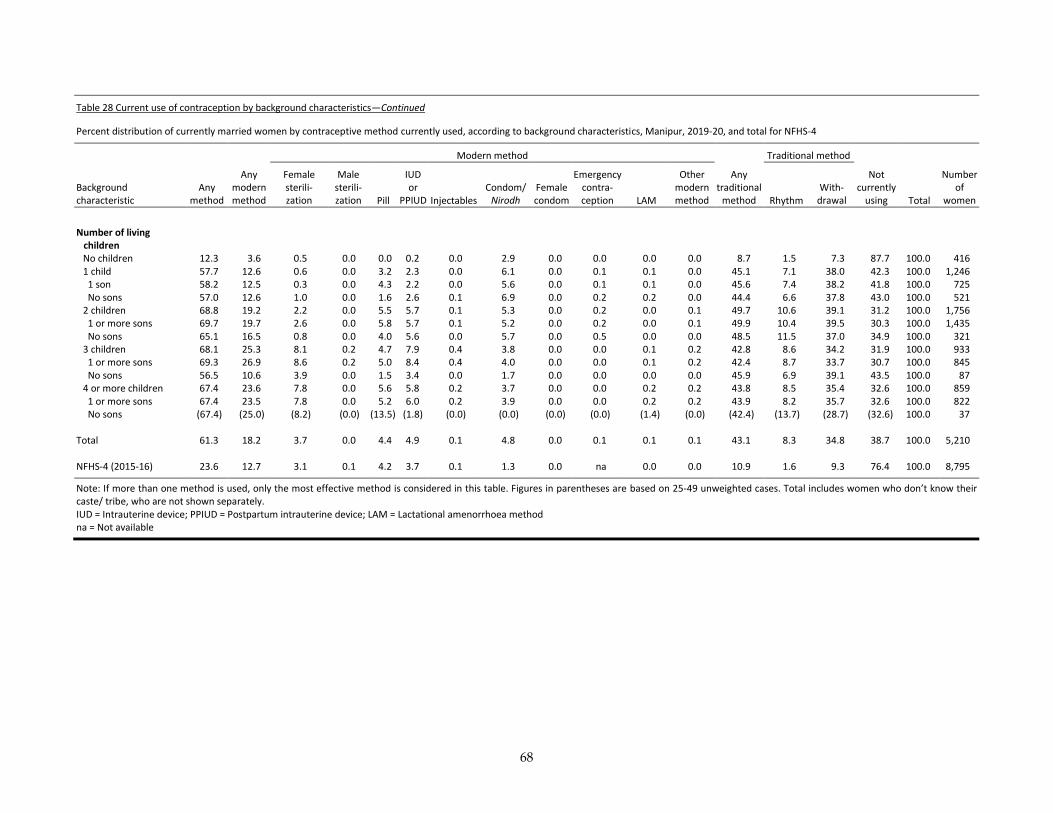
68
Table 28 Current use of contraception by background characteristics—Continued
Percent distribution of currently married women by contraceptive method currently used, according to background characteristics, Manipur, 2019-20, and total for NFHS-4
Modern method Traditional method
Background characteristic
Any method
Any modern method
Female sterili-zation
Male sterili-zation Pill
IUD or
PPIUD Injectables Condom/
Nirodh Female condom
Emergency contra-ception LAM
Other modern method
Any traditional
method Rhythm With-
drawal
Not currently
using Total
Number of
women
Number of living
children No children 12.3 3.6 0.5 0.0 0.0 0.2 0.0 2.9 0.0 0.0 0.0 0.0 8.7 1.5 7.3 87.7 100.0 416 1 child 57.7 12.6 0.6 0.0 3.2 2.3 0.0 6.1 0.0 0.1 0.1 0.0 45.1 7.1 38.0 42.3 100.0 1,246 1 son 58.2 12.5 0.3 0.0 4.3 2.2 0.0 5.6 0.0 0.1 0.1 0.0 45.6 7.4 38.2 41.8 100.0 725 No sons 57.0 12.6 1.0 0.0 1.6 2.6 0.1 6.9 0.0 0.2 0.2 0.0 44.4 6.6 37.8 43.0 100.0 521 2 children 68.8 19.2 2.2 0.0 5.5 5.7 0.1 5.3 0.0 0.2 0.0 0.1 49.7 10.6 39.1 31.2 100.0 1,756 1 or more sons 69.7 19.7 2.6 0.0 5.8 5.7 0.1 5.2 0.0 0.2 0.0 0.1 49.9 10.4 39.5 30.3 100.0 1,435 No sons 65.1 16.5 0.8 0.0 4.0 5.6 0.0 5.7 0.0 0.5 0.0 0.0 48.5 11.5 37.0 34.9 100.0 321 3 children 68.1 25.3 8.1 0.2 4.7 7.9 0.4 3.8 0.0 0.0 0.1 0.2 42.8 8.6 34.2 31.9 100.0 933 1 or more sons 69.3 26.9 8.6 0.2 5.0 8.4 0.4 4.0 0.0 0.0 0.1 0.2 42.4 8.7 33.7 30.7 100.0 845 No sons 56.5 10.6 3.9 0.0 1.5 3.4 0.0 1.7 0.0 0.0 0.0 0.0 45.9 6.9 39.1 43.5 100.0 87 4 or more children 67.4 23.6 7.8 0.0 5.6 5.8 0.2 3.7 0.0 0.0 0.2 0.2 43.8 8.5 35.4 32.6 100.0 859 1 or more sons 67.4 23.5 7.8 0.0 5.2 6.0 0.2 3.9 0.0 0.0 0.2 0.2 43.9 8.2 35.7 32.6 100.0 822 No sons (67.4) (25.0) (8.2) (0.0) (13.5) (1.8) (0.0) (0.0) (0.0) (0.0) (1.4) (0.0) (42.4) (13.7) (28.7) (32.6) 100.0 37
Total 61.3 18.2 3.7 0.0 4.4 4.9 0.1 4.8 0.0 0.1 0.1 0.1 43.1 8.3 34.8 38.7 100.0 5,210
NFHS-4 (2015-16) 23.6 12.7 3.1 0.1 4.2 3.7 0.1 1.3 0.0 na 0.0 0.0 10.9 1.6 9.3 76.4 100.0 8,795
Note: If more than one method is used, only the most effective method is considered in this table. Figures in parentheses are based on 25-49 unweighted cases. Total includes women who don’t know their caste/ tribe, who are not shown separately. IUD = Intrauterine device; PPIUD = Postpartum intrauterine device; LAM = Lactational amenorrhoea method na = Not available
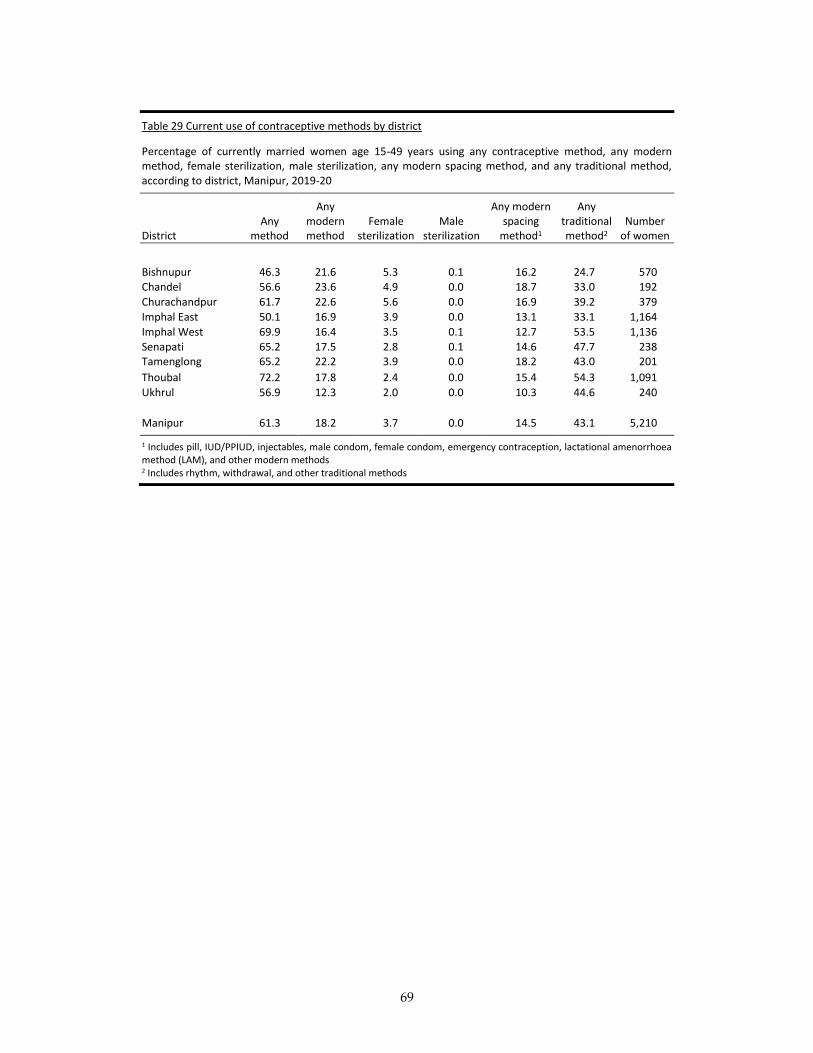
69
Table 29 Current use of contraceptive methods by district
Percentage of currently married women age 15-49 years using any contraceptive method, any modern method, female sterilization, male sterilization, any modern spacing method, and any traditional method, according to district, Manipur, 2019-20
District Any
method
Any modern method
Female sterilization
Male sterilization
Any modern spacing
method1
Any traditional method2
Number of women
Bishnupur 46.3 21.6 5.3 0.1 16.2 24.7 570 Chandel 56.6 23.6 4.9 0.0 18.7 33.0 192
Churachandpur 61.7 22.6 5.6 0.0 16.9 39.2 379
Imphal East 50.1 16.9 3.9 0.0 13.1 33.1 1,164
Imphal West 69.9 16.4 3.5 0.1 12.7 53.5 1,136 Senapati 65.2 17.5 2.8 0.1 14.6 47.7 238 Tamenglong 65.2 22.2 3.9 0.0 18.2 43.0 201
Thoubal 72.2 17.8 2.4 0.0 15.4 54.3 1,091
Ukhrul 56.9 12.3 2.0 0.0 10.3 44.6 240
Manipur 61.3 18.2 3.7 0.0 14.5 43.1 5,210
1 Includes pill, IUD/PPIUD, injectables, male condom, female condom, emergency contraception, lactational amenorrhoea method (LAM), and other modern methods 2 Includes rhythm, withdrawal, and other traditional methods
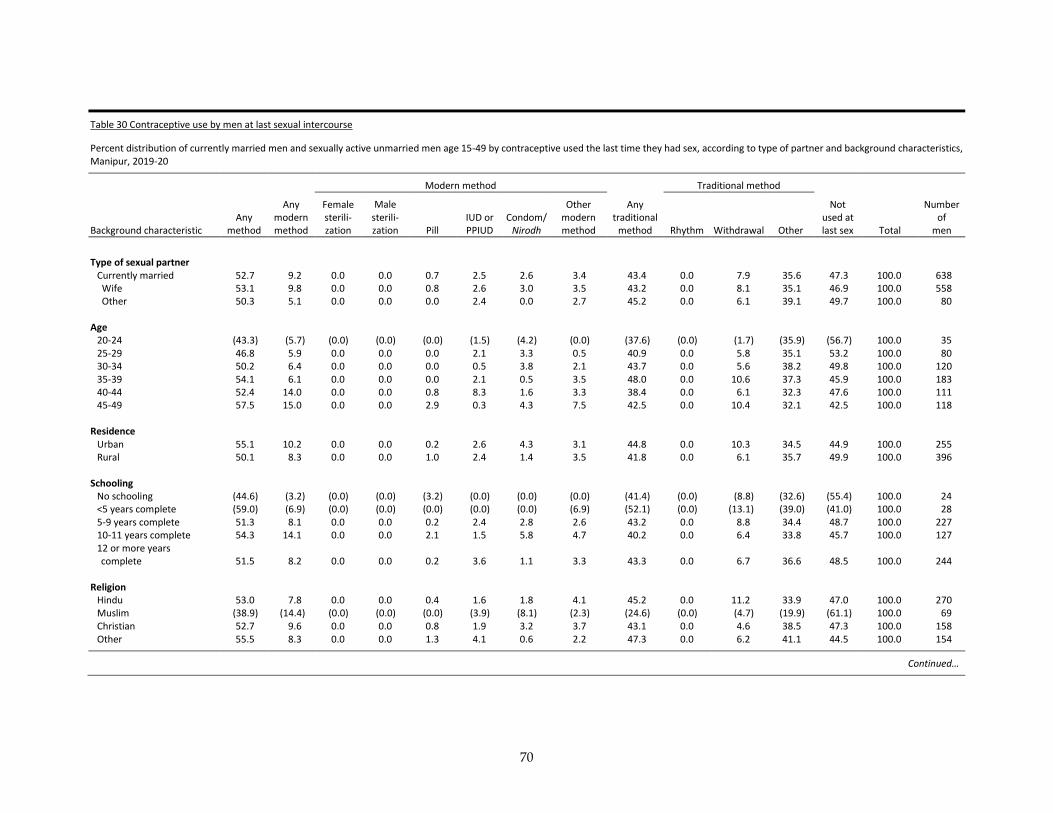
70
Table 30 Contraceptive use by men at last sexual intercourse
Percent distribution of currently married men and sexually active unmarried men age 15-49 by contraceptive used the last time they had sex, according to type of partner and background characteristics, Manipur, 2019-20
Modern method Traditional method
Not used at last sex
Background characteristic Any
method
Any modern method
Female sterili-zation
Male sterili-zation Pill
IUD or PPIUD
Condom/ Nirodh
Other modern method
Any traditional
method Rhythm Withdrawal Other Total
Number of
men
Type of sexual partner
Currently married 52.7 9.2 0.0 0.0 0.7 2.5 2.6 3.4 43.4 0.0 7.9 35.6 47.3 100.0 638 Wife 53.1 9.8 0.0 0.0 0.8 2.6 3.0 3.5 43.2 0.0 8.1 35.1 46.9 100.0 558 Other 50.3 5.1 0.0 0.0 0.0 2.4 0.0 2.7 45.2 0.0 6.1 39.1 49.7 100.0 80
Age 20-24 (43.3) (5.7) (0.0) (0.0) (0.0) (1.5) (4.2) (0.0) (37.6) (0.0) (1.7) (35.9) (56.7) 100.0 35 25-29 46.8 5.9 0.0 0.0 0.0 2.1 3.3 0.5 40.9 0.0 5.8 35.1 53.2 100.0 80 30-34 50.2 6.4 0.0 0.0 0.0 0.5 3.8 2.1 43.7 0.0 5.6 38.2 49.8 100.0 120 35-39 54.1 6.1 0.0 0.0 0.0 2.1 0.5 3.5 48.0 0.0 10.6 37.3 45.9 100.0 183 40-44 52.4 14.0 0.0 0.0 0.8 8.3 1.6 3.3 38.4 0.0 6.1 32.3 47.6 100.0 111 45-49 57.5 15.0 0.0 0.0 2.9 0.3 4.3 7.5 42.5 0.0 10.4 32.1 42.5 100.0 118
Residence Urban 55.1 10.2 0.0 0.0 0.2 2.6 4.3 3.1 44.8 0.0 10.3 34.5 44.9 100.0 255 Rural 50.1 8.3 0.0 0.0 1.0 2.4 1.4 3.5 41.8 0.0 6.1 35.7 49.9 100.0 396
Schooling No schooling (44.6) (3.2) (0.0) (0.0) (3.2) (0.0) (0.0) (0.0) (41.4) (0.0) (8.8) (32.6) (55.4) 100.0 24 <5 years complete (59.0) (6.9) (0.0) (0.0) (0.0) (0.0) (0.0) (6.9) (52.1) (0.0) (13.1) (39.0) (41.0) 100.0 28 5-9 years complete 51.3 8.1 0.0 0.0 0.2 2.4 2.8 2.6 43.2 0.0 8.8 34.4 48.7 100.0 227 10-11 years complete 54.3 14.1 0.0 0.0 2.1 1.5 5.8 4.7 40.2 0.0 6.4 33.8 45.7 100.0 127 12 or more years complete 51.5 8.2 0.0 0.0 0.2 3.6 1.1 3.3 43.3 0.0 6.7 36.6 48.5 100.0 244
Religion
Hindu 53.0 7.8 0.0 0.0 0.4 1.6 1.8 4.1 45.2 0.0 11.2 33.9 47.0 100.0 270 Muslim (38.9) (14.4) (0.0) (0.0) (0.0) (3.9) (8.1) (2.3) (24.6) (0.0) (4.7) (19.9) (61.1) 100.0 69 Christian 52.7 9.6 0.0 0.0 0.8 1.9 3.2 3.7 43.1 0.0 4.6 38.5 47.3 100.0 158 Other 55.5 8.3 0.0 0.0 1.3 4.1 0.6 2.2 47.3 0.0 6.2 41.1 44.5 100.0 154
Continued…
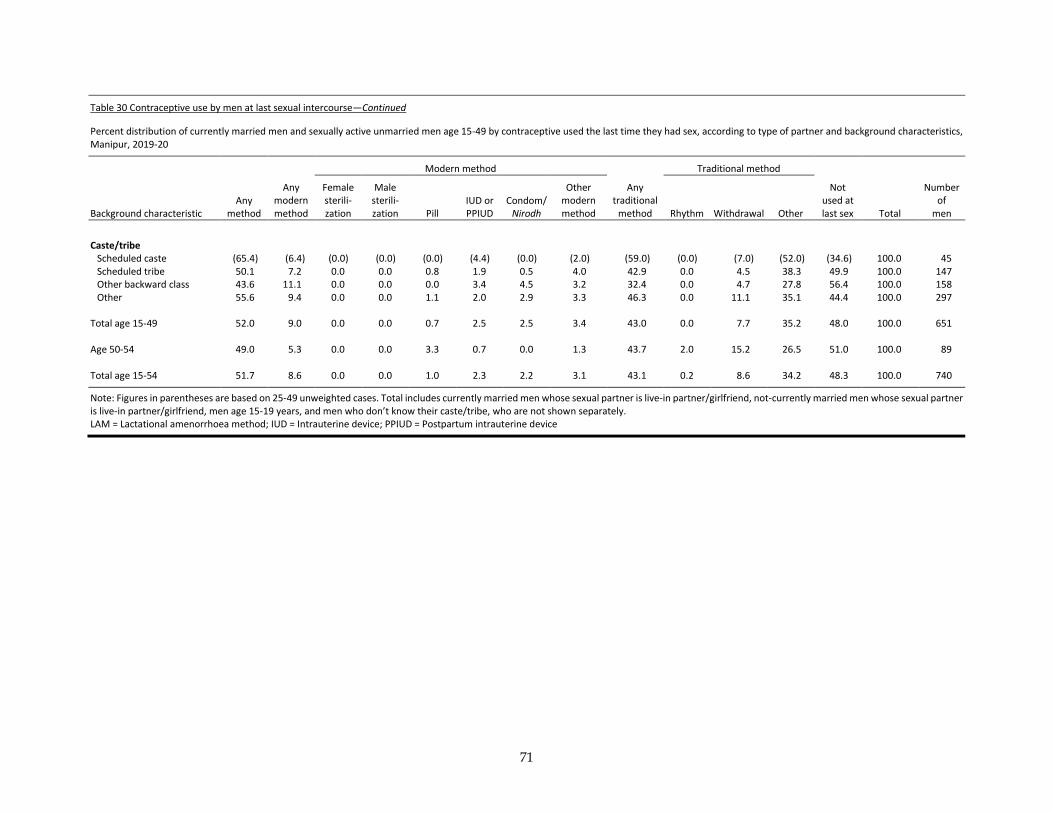
71
Table 30 Contraceptive use by men at last sexual intercourse—Continued
Percent distribution of currently married men and sexually active unmarried men age 15-49 by contraceptive used the last time they had sex, according to type of partner and background characteristics, Manipur, 2019-20
Modern method Traditional method
Not used at last sex
Background characteristic Any
method
Any modern method
Female sterili-zation
Male sterili-zation Pill
IUD or PPIUD
Condom/ Nirodh
Other modern method
Any traditional
method Rhythm Withdrawal Other Total
Number of
men
Caste/tribe
Scheduled caste (65.4) (6.4) (0.0) (0.0) (0.0) (4.4) (0.0) (2.0) (59.0) (0.0) (7.0) (52.0) (34.6) 100.0 45 Scheduled tribe 50.1 7.2 0.0 0.0 0.8 1.9 0.5 4.0 42.9 0.0 4.5 38.3 49.9 100.0 147 Other backward class 43.6 11.1 0.0 0.0 0.0 3.4 4.5 3.2 32.4 0.0 4.7 27.8 56.4 100.0 158 Other 55.6 9.4 0.0 0.0 1.1 2.0 2.9 3.3 46.3 0.0 11.1 35.1 44.4 100.0 297
Total age 15-49 52.0 9.0 0.0 0.0 0.7 2.5 2.5 3.4 43.0 0.0 7.7 35.2 48.0 100.0 651
Age 50-54 49.0 5.3 0.0 0.0 3.3 0.7 0.0 1.3 43.7 2.0 15.2 26.5 51.0 100.0 89
Total age 15-54 51.7 8.6 0.0 0.0 1.0 2.3 2.2 3.1 43.1 0.2 8.6 34.2 48.3 100.0 740
Note: Figures in parentheses are based on 25-49 unweighted cases. Total includes currently married men whose sexual partner is live-in partner/girlfriend, not-currently married men whose sexual partner is live-in partner/girlfriend, men age 15-19 years, and men who don’t know their caste/tribe, who are not shown separately. LAM = Lactational amenorrhoea method; IUD = Intrauterine device; PPIUD = Postpartum intrauterine device

72
Table 31 Source of modern contraceptive methods
Percent distribution of women age 15-49 who are current users of modern contraceptive methods by most recent source of the method, according to residence, Manipur, 2019-20
Most recent source of method Female
sterilization Pill IUD or PPIUD
Condom/ Nirodh
All modern methods1
URBAN
Public health sector 69.6 44.8 78.5 15.6 51.0 Government/municipal hospital 66.5 15.2 37.4 4.6 30.5 Government dispensary 0.0 5.6 8.3 0.0 3.2 UHC/UHP/UFWC 0.0 0.0 1.7 0.0 0.5 CHC/rural hospital/Block PHC 3.0 3.8 20.3 1.7 7.8 PHC/Additional PHC 0.0 0.7 10.0 0.0 3.0 Sub-centre/ANM 0.0 9.4 0.8 0.0 1.6 Anganwadi/ICDS centre 0.0 0.0 0.0 2.5 0.8 ASHA 0.0 10.2 0.0 6.7 3.6 Other public health sector 0.0 0.0 0.0 0.0 0.0 NGO or trust hospital/clinic 0.0 0.0 0.0 3.2 1.0 Private health sector 28.9 53.6 20.8 78.9 46.1 Private hospital 18.8 0.0 15.7 0.0 8.9 Private doctor/clinic 9.2 0.0 1.4 0.7 2.8 Private mobile clinic 0.9 0.0 0.0 0.0 0.2 Traditional healer 0.0 0.0 0.0 0.0 0.0 Pharmacy/drugstore 0.0 53.6 3.4 78.2 34.1 Other private health sector 0.0 0.0 0.4 0.0 0.1 Other source 1.5 1.6 0.7 2.3 1.5 Shop 0.0 0.0 0.0 0.0 0.0 Husband 0.0 0.0 0.0 1.6 0.5 Friend/relative 0.0 0.5 0.0 0.7 0.3 Other 1.5 1.1 0.7 0.0 0.7 Missing 0.0 0.0 0.0 0.0 0.4 Total 100.0 100.0 100.0 100.0 100.0 Number of users 91 58 109 119 381
Continued…
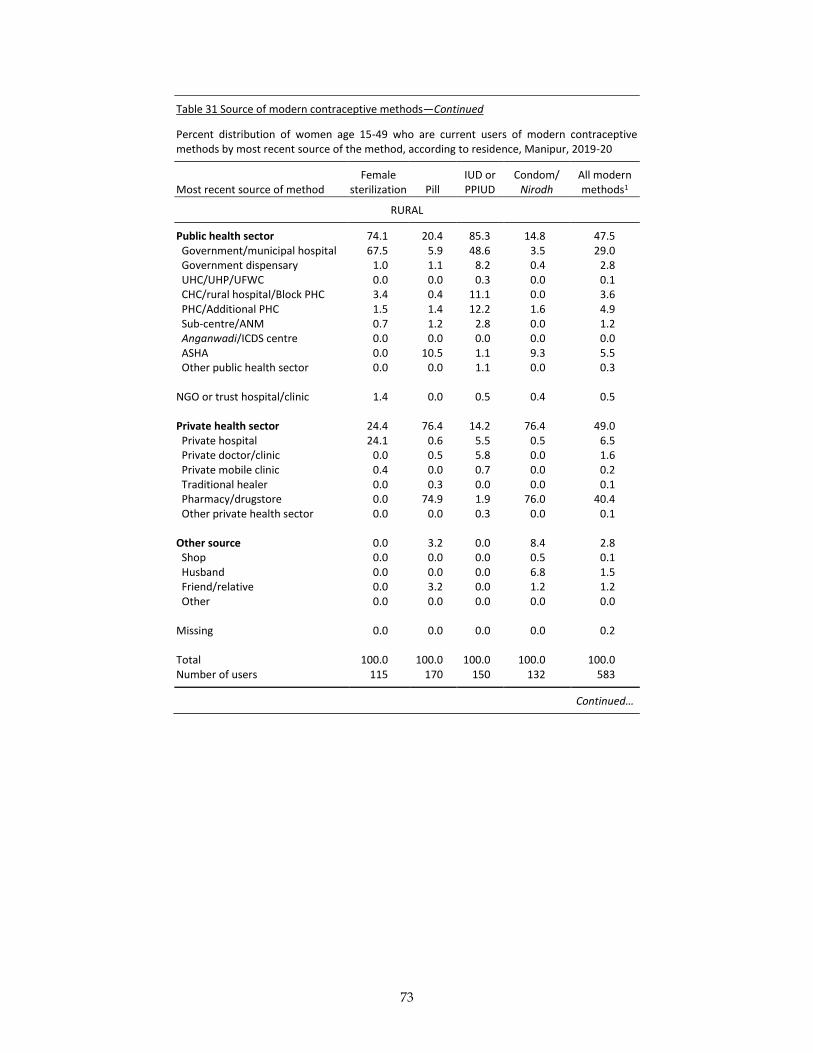
73
Table 31 Source of modern contraceptive methods—Continued
Percent distribution of women age 15-49 who are current users of modern contraceptive methods by most recent source of the method, according to residence, Manipur, 2019-20
Most recent source of method Female
sterilization Pill IUD or PPIUD
Condom/ Nirodh
All modern methods1
RURAL
Public health sector 74.1 20.4 85.3 14.8 47.5 Government/municipal hospital 67.5 5.9 48.6 3.5 29.0 Government dispensary 1.0 1.1 8.2 0.4 2.8 UHC/UHP/UFWC 0.0 0.0 0.3 0.0 0.1 CHC/rural hospital/Block PHC 3.4 0.4 11.1 0.0 3.6 PHC/Additional PHC 1.5 1.4 12.2 1.6 4.9 Sub-centre/ANM 0.7 1.2 2.8 0.0 1.2 Anganwadi/ICDS centre 0.0 0.0 0.0 0.0 0.0 ASHA 0.0 10.5 1.1 9.3 5.5 Other public health sector 0.0 0.0 1.1 0.0 0.3 NGO or trust hospital/clinic 1.4 0.0 0.5 0.4 0.5 Private health sector 24.4 76.4 14.2 76.4 49.0 Private hospital 24.1 0.6 5.5 0.5 6.5 Private doctor/clinic 0.0 0.5 5.8 0.0 1.6 Private mobile clinic 0.4 0.0 0.7 0.0 0.2 Traditional healer 0.0 0.3 0.0 0.0 0.1 Pharmacy/drugstore 0.0 74.9 1.9 76.0 40.4 Other private health sector 0.0 0.0 0.3 0.0 0.1 Other source 0.0 3.2 0.0 8.4 2.8 Shop 0.0 0.0 0.0 0.5 0.1 Husband 0.0 0.0 0.0 6.8 1.5 Friend/relative 0.0 3.2 0.0 1.2 1.2 Other 0.0 0.0 0.0 0.0 0.0 Missing 0.0 0.0 0.0 0.0 0.2 Total 100.0 100.0 100.0 100.0 100.0 Number of users 115 170 150 132 583
Continued…
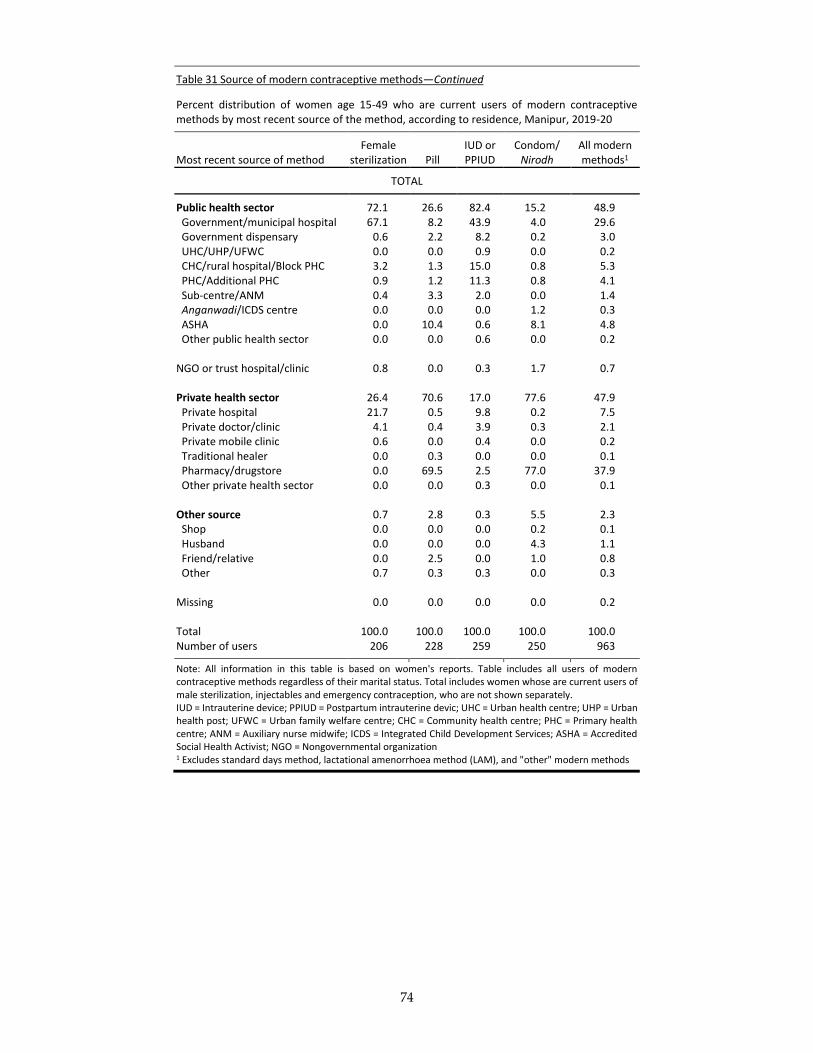
74
Table 31 Source of modern contraceptive methods—Continued
Percent distribution of women age 15-49 who are current users of modern contraceptive methods by most recent source of the method, according to residence, Manipur, 2019-20
Most recent source of method Female
sterilization Pill IUD or PPIUD
Condom/ Nirodh
All modern methods1
TOTAL
Public health sector 72.1 26.6 82.4 15.2 48.9 Government/municipal hospital 67.1 8.2 43.9 4.0 29.6 Government dispensary 0.6 2.2 8.2 0.2 3.0 UHC/UHP/UFWC 0.0 0.0 0.9 0.0 0.2 CHC/rural hospital/Block PHC 3.2 1.3 15.0 0.8 5.3 PHC/Additional PHC 0.9 1.2 11.3 0.8 4.1 Sub-centre/ANM 0.4 3.3 2.0 0.0 1.4 Anganwadi/ICDS centre 0.0 0.0 0.0 1.2 0.3 ASHA 0.0 10.4 0.6 8.1 4.8 Other public health sector 0.0 0.0 0.6 0.0 0.2 NGO or trust hospital/clinic 0.8 0.0 0.3 1.7 0.7 Private health sector 26.4 70.6 17.0 77.6 47.9 Private hospital 21.7 0.5 9.8 0.2 7.5 Private doctor/clinic 4.1 0.4 3.9 0.3 2.1 Private mobile clinic 0.6 0.0 0.4 0.0 0.2 Traditional healer 0.0 0.3 0.0 0.0 0.1 Pharmacy/drugstore 0.0 69.5 2.5 77.0 37.9 Other private health sector 0.0 0.0 0.3 0.0 0.1 Other source 0.7 2.8 0.3 5.5 2.3 Shop 0.0 0.0 0.0 0.2 0.1 Husband 0.0 0.0 0.0 4.3 1.1 Friend/relative 0.0 2.5 0.0 1.0 0.8 Other 0.7 0.3 0.3 0.0 0.3 Missing 0.0 0.0 0.0 0.0 0.2 Total 100.0 100.0 100.0 100.0 100.0 Number of users 206 228 259 250 963
Note: All information in this table is based on women's reports. Table includes all users of modern contraceptive methods regardless of their marital status. Total includes women whose are current users of male sterilization, injectables and emergency contraception, who are not shown separately. IUD = Intrauterine device; PPIUD = Postpartum intrauterine devic; UHC = Urban health centre; UHP = Urban health post; UFWC = Urban family welfare centre; CHC = Community health centre; PHC = Primary health centre; ANM = Auxiliary nurse midwife; ICDS = Integrated Child Development Services; ASHA = Accredited Social Health Activist; NGO = Nongovernmental organization 1 Excludes standard days method, lactational amenorrhoea method (LAM), and "other" modern methods
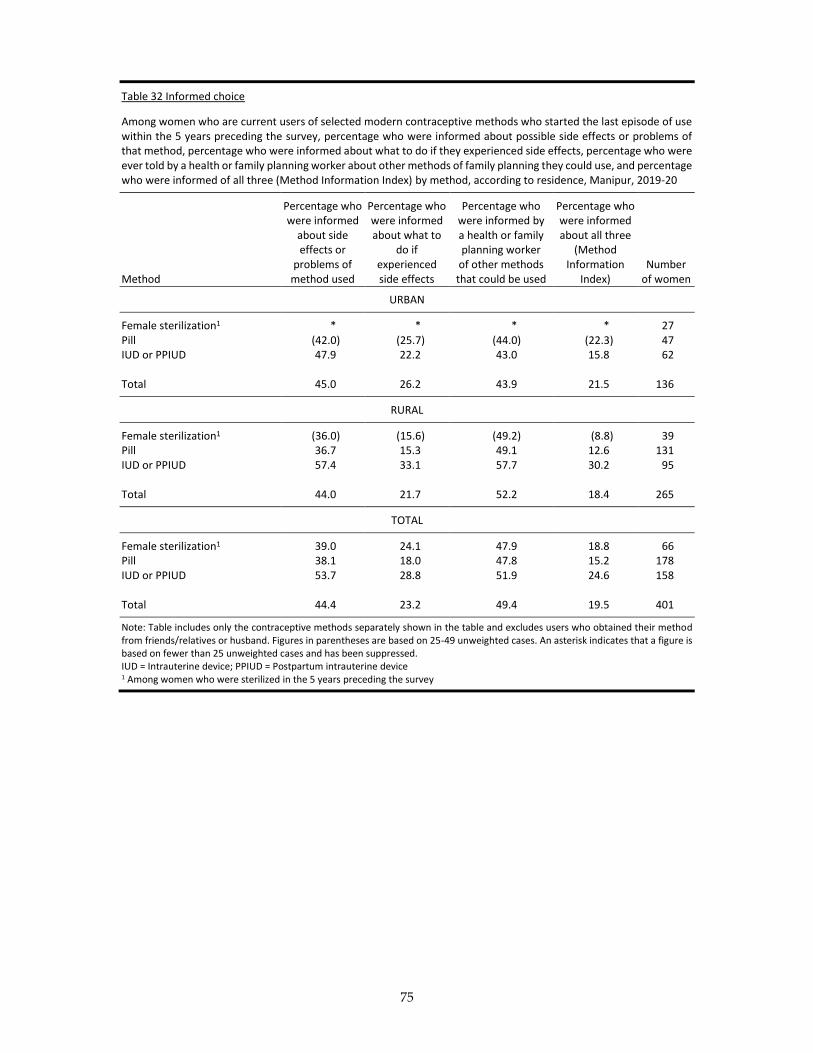
75
Table 32 Informed choice
Among women who are current users of selected modern contraceptive methods who started the last episode of use within the 5 years preceding the survey, percentage who were informed about possible side effects or problems of that method, percentage who were informed about what to do if they experienced side effects, percentage who were ever told by a health or family planning worker about other methods of family planning they could use, and percentage who were informed of all three (Method Information Index) by method, according to residence, Manipur, 2019-20
Method
Percentage who were informed
about side effects or
problems of method used
Percentage who were informed about what to
do if experienced side effects
Percentage who were informed by a health or family planning worker
of other methods that could be used
Percentage who were informed about all three
(Method Information
Index) Number
of women
URBAN
Female sterilization1 * * * * 27 Pill (42.0) (25.7) (44.0) (22.3) 47 IUD or PPIUD 47.9 22.2 43.0 15.8 62
Total 45.0 26.2 43.9 21.5 136
RURAL
Female sterilization1 (36.0) (15.6) (49.2) (8.8) 39 Pill 36.7 15.3 49.1 12.6 131 IUD or PPIUD 57.4 33.1 57.7 30.2 95
Total 44.0 21.7 52.2 18.4 265
TOTAL
Female sterilization1 39.0 24.1 47.9 18.8 66 Pill 38.1 18.0 47.8 15.2 178 IUD or PPIUD 53.7 28.8 51.9 24.6 158
Total 44.4 23.2 49.4 19.5 401
Note: Table includes only the contraceptive methods separately shown in the table and excludes users who obtained their method from friends/relatives or husband. Figures in parentheses are based on 25-49 unweighted cases. An asterisk indicates that a figure is based on fewer than 25 unweighted cases and has been suppressed. IUD = Intrauterine device; PPIUD = Postpartum intrauterine device 1 Among women who were sterilized in the 5 years preceding the survey
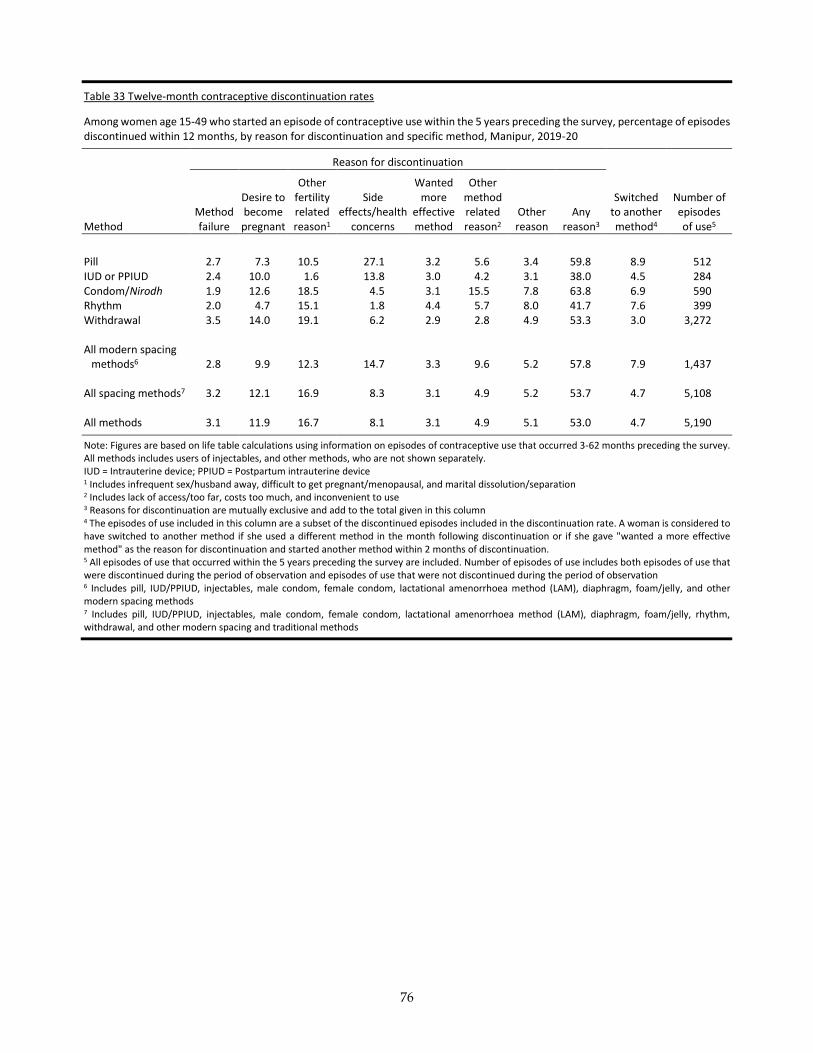
76
Table 33 Twelve-month contraceptive discontinuation rates
Among women age 15-49 who started an episode of contraceptive use within the 5 years preceding the survey, percentage of episodes discontinued within 12 months, by reason for discontinuation and specific method, Manipur, 2019-20
Reason for discontinuation
Method Method failure
Desire to become pregnant
Other fertility related reason1
Side effects/health
concerns
Wanted more
effective method
Other method related reason2
Other reason
Any reason3
Switched to another method4
Number of episodes of use5
Pill 2.7 7.3 10.5 27.1 3.2 5.6 3.4 59.8 8.9 512 IUD or PPIUD 2.4 10.0 1.6 13.8 3.0 4.2 3.1 38.0 4.5 284 Condom/Nirodh 1.9 12.6 18.5 4.5 3.1 15.5 7.8 63.8 6.9 590 Rhythm 2.0 4.7 15.1 1.8 4.4 5.7 8.0 41.7 7.6 399 Withdrawal 3.5 14.0 19.1 6.2 2.9 2.8 4.9 53.3 3.0 3,272 All modern spacing
methods6 2.8 9.9 12.3 14.7 3.3 9.6 5.2 57.8 7.9 1,437 All spacing methods7 3.2 12.1 16.9 8.3 3.1 4.9 5.2 53.7 4.7 5,108 All methods 3.1 11.9 16.7 8.1 3.1 4.9 5.1 53.0 4.7 5,190
Note: Figures are based on life table calculations using information on episodes of contraceptive use that occurred 3-62 months preceding the survey. All methods includes users of injectables, and other methods, who are not shown separately. IUD = Intrauterine device; PPIUD = Postpartum intrauterine device 1 Includes infrequent sex/husband away, difficult to get pregnant/menopausal, and marital dissolution/separation 2 Includes lack of access/too far, costs too much, and inconvenient to use 3 Reasons for discontinuation are mutually exclusive and add to the total given in this column 4 The episodes of use included in this column are a subset of the discontinued episodes included in the discontinuation rate. A woman is considered to have switched to another method if she used a different method in the month following discontinuation or if she gave "wanted a more effective method" as the reason for discontinuation and started another method within 2 months of discontinuation. 5 All episodes of use that occurred within the 5 years preceding the survey are included. Number of episodes of use includes both episodes of use that were discontinued during the period of observation and episodes of use that were not discontinued during the period of observation 6 Includes pill, IUD/PPIUD, injectables, male condom, female condom, lactational amenorrhoea method (LAM), diaphragm, foam/jelly, and other modern spacing methods 7 Includes pill, IUD/PPIUD, injectables, male condom, female condom, lactational amenorrhoea method (LAM), diaphragm, foam/jelly, rhythm, withdrawal, and other modern spacing and traditional methods
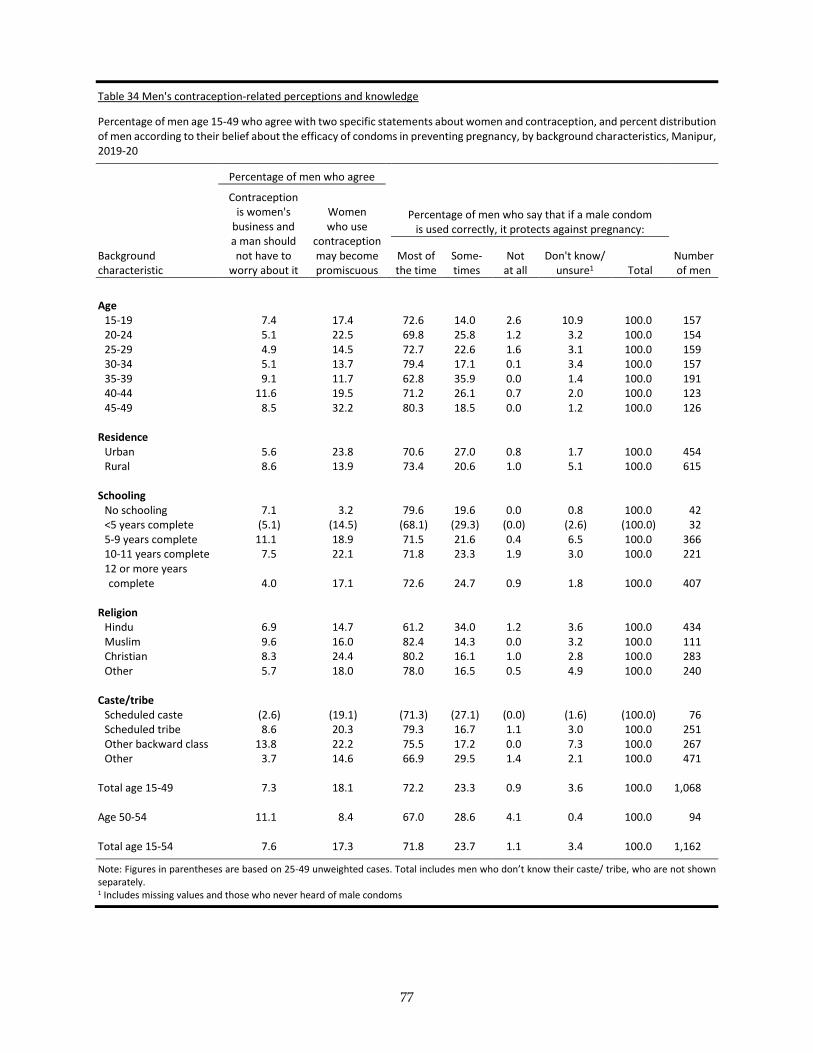
77
Table 34 Men's contraception-related perceptions and knowledge
Percentage of men age 15-49 who agree with two specific statements about women and contraception, and percent distribution of men according to their belief about the efficacy of condoms in preventing pregnancy, by background characteristics, Manipur, 2019-20
Percentage of men who agree
Percentage of men who say that if a male condom is used correctly, it protects against pregnancy:
Number of men
Background characteristic
Contraception is women's
business and a man should not have to
worry about it
Women who use
contraception may become promiscuous
Most of the time
Some-times
Not at all
Don't know/ unsure1 Total
Age
15-19 7.4 17.4 72.6 14.0 2.6 10.9 100.0 157 20-24 5.1 22.5 69.8 25.8 1.2 3.2 100.0 154 25-29 4.9 14.5 72.7 22.6 1.6 3.1 100.0 159 30-34 5.1 13.7 79.4 17.1 0.1 3.4 100.0 157 35-39 9.1 11.7 62.8 35.9 0.0 1.4 100.0 191 40-44 11.6 19.5 71.2 26.1 0.7 2.0 100.0 123 45-49 8.5 32.2 80.3 18.5 0.0 1.2 100.0 126
Residence Urban 5.6 23.8 70.6 27.0 0.8 1.7 100.0 454 Rural 8.6 13.9 73.4 20.6 1.0 5.1 100.0 615
Schooling No schooling 7.1 3.2 79.6 19.6 0.0 0.8 100.0 42 <5 years complete (5.1) (14.5) (68.1) (29.3) (0.0) (2.6) (100.0) 32 5-9 years complete 11.1 18.9 71.5 21.6 0.4 6.5 100.0 366 10-11 years complete 7.5 22.1 71.8 23.3 1.9 3.0 100.0 221 12 or more years complete 4.0 17.1 72.6 24.7 0.9 1.8 100.0 407
Religion
Hindu 6.9 14.7 61.2 34.0 1.2 3.6 100.0 434 Muslim 9.6 16.0 82.4 14.3 0.0 3.2 100.0 111 Christian 8.3 24.4 80.2 16.1 1.0 2.8 100.0 283 Other 5.7 18.0 78.0 16.5 0.5 4.9 100.0 240
Caste/tribe Scheduled caste (2.6) (19.1) (71.3) (27.1) (0.0) (1.6) (100.0) 76 Scheduled tribe 8.6 20.3 79.3 16.7 1.1 3.0 100.0 251 Other backward class 13.8 22.2 75.5 17.2 0.0 7.3 100.0 267 Other 3.7 14.6 66.9 29.5 1.4 2.1 100.0 471
Total age 15-49 7.3 18.1 72.2 23.3 0.9 3.6 100.0 1,068
Age 50-54 11.1 8.4 67.0 28.6 4.1 0.4 100.0 94
Total age 15-54 7.6 17.3 71.8 23.7 1.1 3.4 100.0 1,162
Note: Figures in parentheses are based on 25-49 unweighted cases. Total includes men who don’t know their caste/ tribe, who are not shown separately. 1 Includes missing values and those who never heard of male condoms
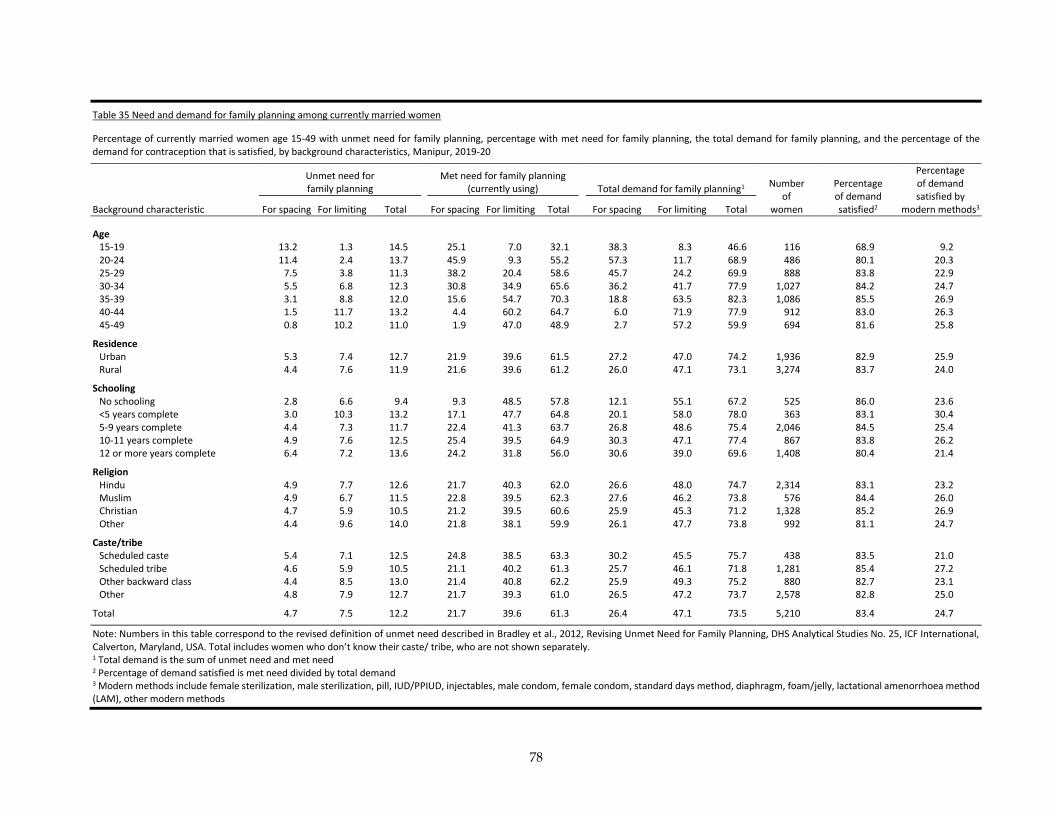
78
Table 35 Need and demand for family planning among currently married women
Percentage of currently married women age 15-49 with unmet need for family planning, percentage with met need for family planning, the total demand for family planning, and the percentage of the demand for contraception that is satisfied, by background characteristics, Manipur, 2019-20
Unmet need for family planning
Met need for family planning (currently using) Total demand for family planning1
Number of
women
Percentage of demand satisfied2
Percentage of demand satisfied by
modern methods3 Background characteristic For spacing For limiting Total For spacing For limiting Total For spacing For limiting Total
Age 15-19 13.2 1.3 14.5 25.1 7.0 32.1 38.3 8.3 46.6 116 68.9 9.2 20-24 11.4 2.4 13.7 45.9 9.3 55.2 57.3 11.7 68.9 486 80.1 20.3 25-29 7.5 3.8 11.3 38.2 20.4 58.6 45.7 24.2 69.9 888 83.8 22.9 30-34 5.5 6.8 12.3 30.8 34.9 65.6 36.2 41.7 77.9 1,027 84.2 24.7 35-39 3.1 8.8 12.0 15.6 54.7 70.3 18.8 63.5 82.3 1,086 85.5 26.9 40-44 1.5 11.7 13.2 4.4 60.2 64.7 6.0 71.9 77.9 912 83.0 26.3 45-49 0.8 10.2 11.0 1.9 47.0 48.9 2.7 57.2 59.9 694 81.6 25.8
Residence Urban 5.3 7.4 12.7 21.9 39.6 61.5 27.2 47.0 74.2 1,936 82.9 25.9 Rural 4.4 7.6 11.9 21.6 39.6 61.2 26.0 47.1 73.1 3,274 83.7 24.0
Schooling No schooling 2.8 6.6 9.4 9.3 48.5 57.8 12.1 55.1 67.2 525 86.0 23.6 <5 years complete 3.0 10.3 13.2 17.1 47.7 64.8 20.1 58.0 78.0 363 83.1 30.4 5-9 years complete 4.4 7.3 11.7 22.4 41.3 63.7 26.8 48.6 75.4 2,046 84.5 25.4 10-11 years complete 4.9 7.6 12.5 25.4 39.5 64.9 30.3 47.1 77.4 867 83.8 26.2 12 or more years complete 6.4 7.2 13.6 24.2 31.8 56.0 30.6 39.0 69.6 1,408 80.4 21.4
Religion Hindu 4.9 7.7 12.6 21.7 40.3 62.0 26.6 48.0 74.7 2,314 83.1 23.2 Muslim 4.9 6.7 11.5 22.8 39.5 62.3 27.6 46.2 73.8 576 84.4 26.0 Christian 4.7 5.9 10.5 21.2 39.5 60.6 25.9 45.3 71.2 1,328 85.2 26.9 Other 4.4 9.6 14.0 21.8 38.1 59.9 26.1 47.7 73.8 992 81.1 24.7
Caste/tribe Scheduled caste 5.4 7.1 12.5 24.8 38.5 63.3 30.2 45.5 75.7 438 83.5 21.0 Scheduled tribe 4.6 5.9 10.5 21.1 40.2 61.3 25.7 46.1 71.8 1,281 85.4 27.2 Other backward class 4.4 8.5 13.0 21.4 40.8 62.2 25.9 49.3 75.2 880 82.7 23.1 Other 4.8 7.9 12.7 21.7 39.3 61.0 26.5 47.2 73.7 2,578 82.8 25.0
Total 4.7 7.5 12.2 21.7 39.6 61.3 26.4 47.1 73.5 5,210 83.4 24.7
Note: Numbers in this table correspond to the revised definition of unmet need described in Bradley et al., 2012, Revising Unmet Need for Family Planning, DHS Analytical Studies No. 25, ICF International, Calverton, Maryland, USA. Total includes women who don’t know their caste/ tribe, who are not shown separately. 1 Total demand is the sum of unmet need and met need 2 Percentage of demand satisfied is met need divided by total demand 3 Modern methods include female sterilization, male sterilization, pill, IUD/PPIUD, injectables, male condom, female condom, standard days method, diaphragm, foam/jelly, lactational amenorrhoea method (LAM), other modern methods
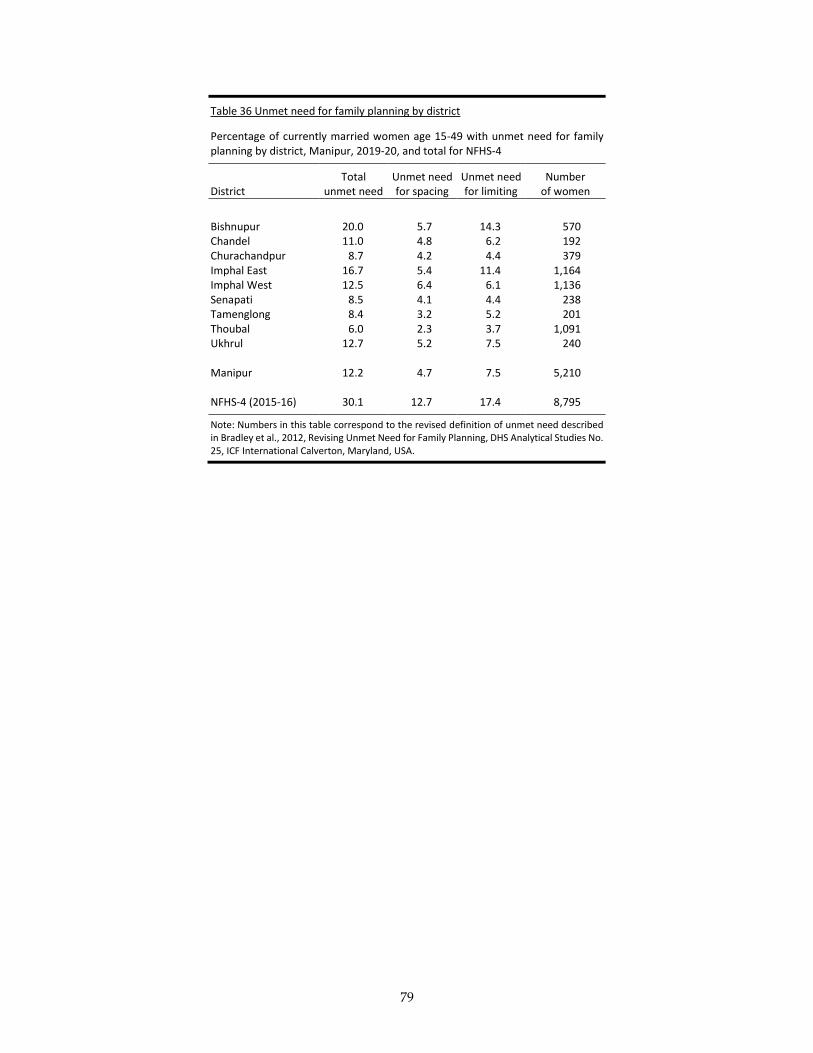
79
Table 36 Unmet need for family planning by district
Percentage of currently married women age 15-49 with unmet need for family planning by district, Manipur, 2019-20, and total for NFHS-4
District Total
unmet need Unmet need for spacing
Unmet need for limiting
Number of women
Bishnupur 20.0 5.7 14.3 570 Chandel 11.0 4.8 6.2 192 Churachandpur 8.7 4.2 4.4 379 Imphal East 16.7 5.4 11.4 1,164 Imphal West 12.5 6.4 6.1 1,136 Senapati 8.5 4.1 4.4 238 Tamenglong 8.4 3.2 5.2 201 Thoubal 6.0 2.3 3.7 1,091 Ukhrul 12.7 5.2 7.5 240 Manipur 12.2 4.7 7.5 5,210 NFHS-4 (2015-16) 30.1 12.7 17.4 8,795
Note: Numbers in this table correspond to the revised definition of unmet need described in Bradley et al., 2012, Revising Unmet Need for Family Planning, DHS Analytical Studies No. 25, ICF International Calverton, Maryland, USA.
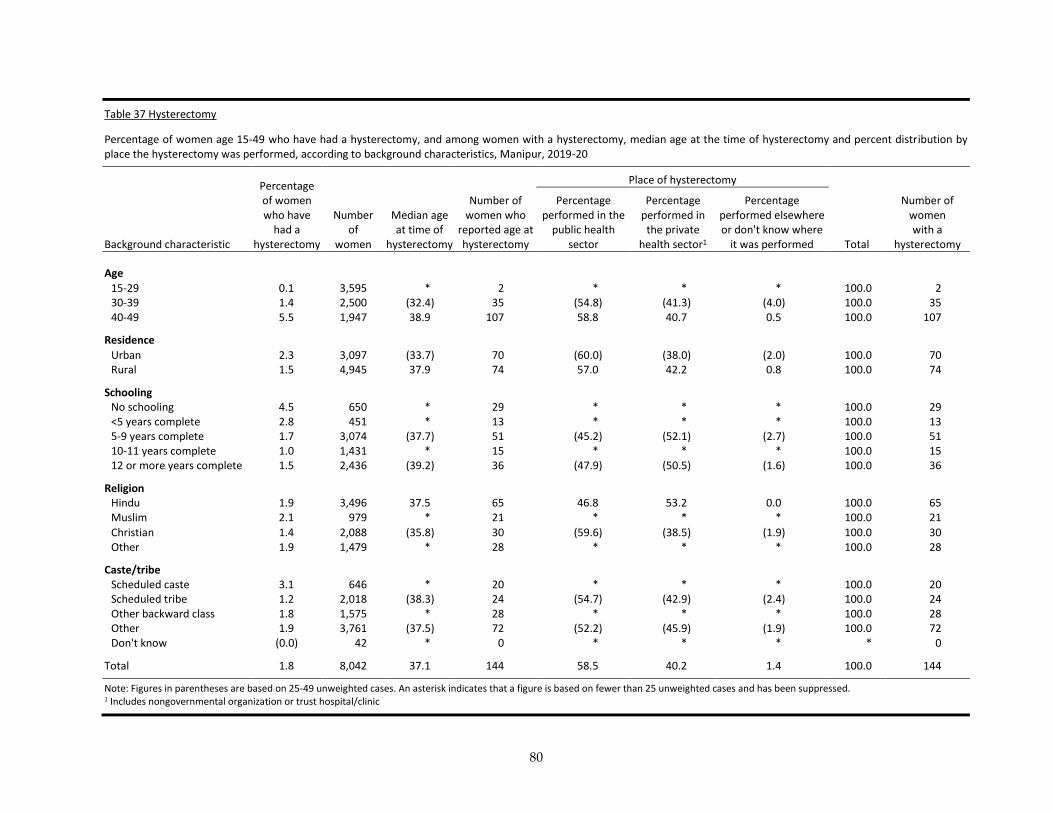
80
Table 37 Hysterectomy
Percentage of women age 15-49 who have had a hysterectomy, and among women with a hysterectomy, median age at the time of hysterectomy and percent distribution by place the hysterectomy was performed, according to background characteristics, Manipur, 2019-20
Background characteristic
Percentage of women who have
had a hysterectomy
Number of
women
Median age at time of
hysterectomy
Number of women who
reported age at hysterectomy
Place of hysterectomy
Percentage performed in the
public health sector
Percentage performed in
the private health sector1
Percentage performed elsewhere or don't know where
it was performed Total
Number of women with a
hysterectomy
Age
15-29 0.1 3,595 * 2 * * * 100.0 2 30-39 1.4 2,500 (32.4) 35 (54.8) (41.3) (4.0) 100.0 35 40-49 5.5 1,947 38.9 107 58.8 40.7 0.5 100.0 107
Residence
Urban 2.3 3,097 (33.7) 70 (60.0) (38.0) (2.0) 100.0 70 Rural 1.5 4,945 37.9 74 57.0 42.2 0.8 100.0 74
Schooling No schooling 4.5 650 * 29 * * * 100.0 29 <5 years complete 2.8 451 * 13 * * * 100.0 13 5-9 years complete 1.7 3,074 (37.7) 51 (45.2) (52.1) (2.7) 100.0 51 10-11 years complete 1.0 1,431 * 15 * * * 100.0 15 12 or more years complete 1.5 2,436 (39.2) 36 (47.9) (50.5) (1.6) 100.0 36
Religion Hindu 1.9 3,496 37.5 65 46.8 53.2 0.0 100.0 65 Muslim 2.1 979 * 21 * * * 100.0 21
Christian 1.4 2,088 (35.8) 30 (59.6) (38.5) (1.9) 100.0 30 Other 1.9 1,479 * 28 * * * 100.0 28
Caste/tribe Scheduled caste 3.1 646 * 20 * * * 100.0 20 Scheduled tribe 1.2 2,018 (38.3) 24 (54.7) (42.9) (2.4) 100.0 24 Other backward class 1.8 1,575 * 28 * * * 100.0 28 Other 1.9 3,761 (37.5) 72 (52.2) (45.9) (1.9) 100.0 72 Don't know (0.0) 42 * 0 * * * * 0
Total 1.8 8,042 37.1 144 58.5 40.2 1.4 100.0 144
Note: Figures in parentheses are based on 25-49 unweighted cases. An asterisk indicates that a figure is based on fewer than 25 unweighted cases and has been suppressed. 1 Includes nongovernmental organization or trust hospital/clinic
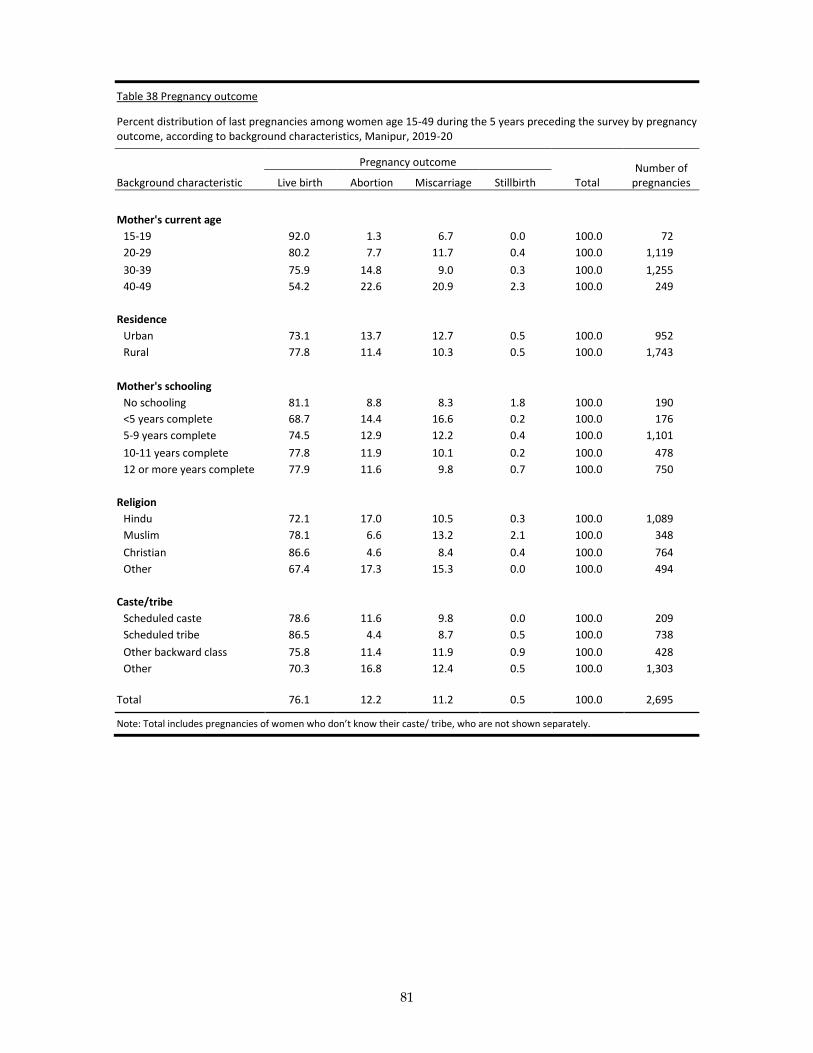
81
Table 38 Pregnancy outcome
Percent distribution of last pregnancies among women age 15-49 during the 5 years preceding the survey by pregnancy outcome, according to background characteristics, Manipur, 2019-20
Background characteristic
Pregnancy outcome
Total Number of
pregnancies Live birth Abortion Miscarriage Stillbirth
Mother's current age
15-19 92.0 1.3 6.7 0.0 100.0 72
20-29 80.2 7.7 11.7 0.4 100.0 1,119
30-39 75.9 14.8 9.0 0.3 100.0 1,255
40-49 54.2 22.6 20.9 2.3 100.0 249
Residence
Urban 73.1 13.7 12.7 0.5 100.0 952
Rural 77.8 11.4 10.3 0.5 100.0 1,743
Mother's schooling
No schooling 81.1 8.8 8.3 1.8 100.0 190
<5 years complete 68.7 14.4 16.6 0.2 100.0 176
5-9 years complete 74.5 12.9 12.2 0.4 100.0 1,101
10-11 years complete 77.8 11.9 10.1 0.2 100.0 478
12 or more years complete 77.9 11.6 9.8 0.7 100.0 750
Religion
Hindu 72.1 17.0 10.5 0.3 100.0 1,089
Muslim 78.1 6.6 13.2 2.1 100.0 348
Christian 86.6 4.6 8.4 0.4 100.0 764
Other 67.4 17.3 15.3 0.0 100.0 494
Caste/tribe
Scheduled caste 78.6 11.6 9.8 0.0 100.0 209
Scheduled tribe 86.5 4.4 8.7 0.5 100.0 738
Other backward class 75.8 11.4 11.9 0.9 100.0 428
Other 70.3 16.8 12.4 0.5 100.0 1,303
Total 76.1 12.2 11.2 0.5 100.0 2,695
Note: Total includes pregnancies of women who don’t know their caste/ tribe, who are not shown separately.
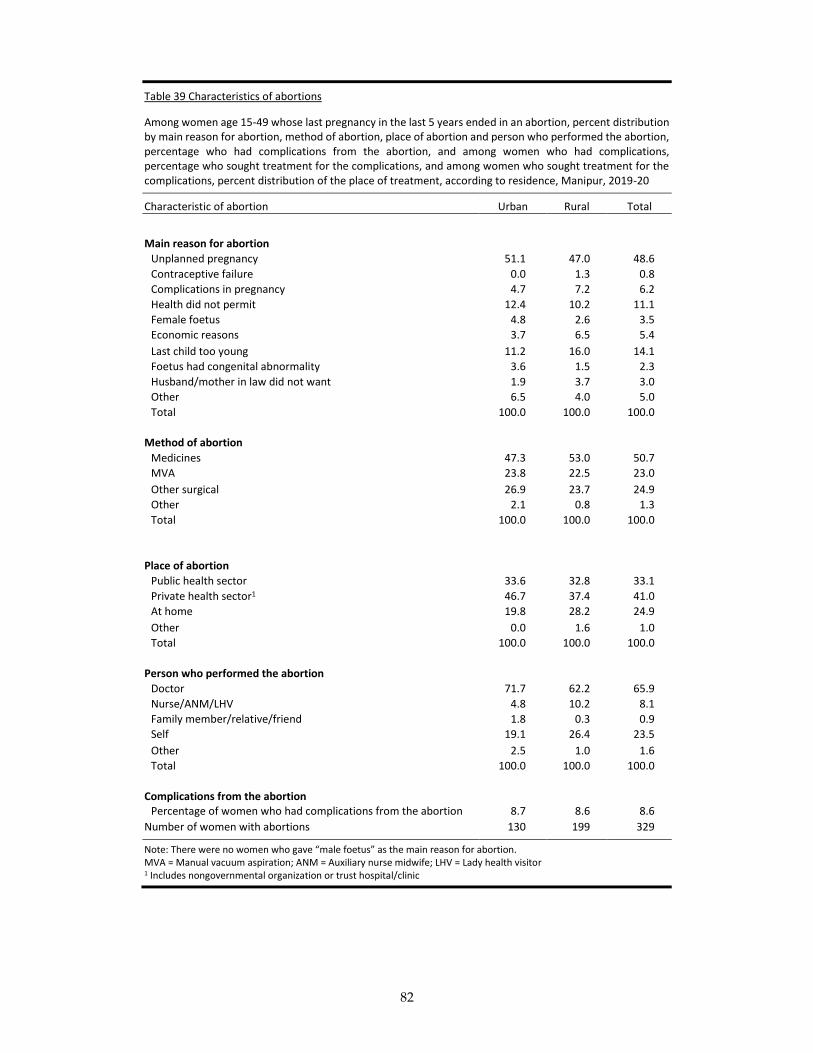
82
Table 39 Characteristics of abortions
Among women age 15-49 whose last pregnancy in the last 5 years ended in an abortion, percent distribution by main reason for abortion, method of abortion, place of abortion and person who performed the abortion, percentage who had complications from the abortion, and among women who had complications, percentage who sought treatment for the complications, and among women who sought treatment for the complications, percent distribution of the place of treatment, according to residence, Manipur, 2019-20
Characteristic of abortion Urban Rural Total
Main reason for abortion
Unplanned pregnancy 51.1 47.0 48.6
Contraceptive failure 0.0 1.3 0.8
Complications in pregnancy 4.7 7.2 6.2
Health did not permit 12.4 10.2 11.1
Female foetus 4.8 2.6 3.5
Economic reasons 3.7 6.5 5.4
Last child too young 11.2 16.0 14.1
Foetus had congenital abnormality 3.6 1.5 2.3
Husband/mother in law did not want 1.9 3.7 3.0
Other 6.5 4.0 5.0
Total 100.0 100.0 100.0
Method of abortion
Medicines 47.3 53.0 50.7
MVA 23.8 22.5 23.0
Other surgical 26.9 23.7 24.9
Other 2.1 0.8 1.3
Total 100.0 100.0 100.0
Place of abortion
Public health sector 33.6 32.8 33.1
Private health sector1 46.7 37.4 41.0
At home 19.8 28.2 24.9
Other 0.0 1.6 1.0
Total 100.0 100.0 100.0
Person who performed the abortion
Doctor 71.7 62.2 65.9
Nurse/ANM/LHV 4.8 10.2 8.1
Family member/relative/friend 1.8 0.3 0.9
Self 19.1 26.4 23.5
Other 2.5 1.0 1.6
Total 100.0 100.0 100.0
Complications from the abortion Percentage of women who had complications from the abortion 8.7 8.6 8.6
Number of women with abortions 130 199 329
Note: There were no women who gave “male foetus” as the main reason for abortion. MVA = Manual vacuum aspiration; ANM = Auxiliary nurse midwife; LHV = Lady health visitor 1 Includes nongovernmental organization or trust hospital/clinic
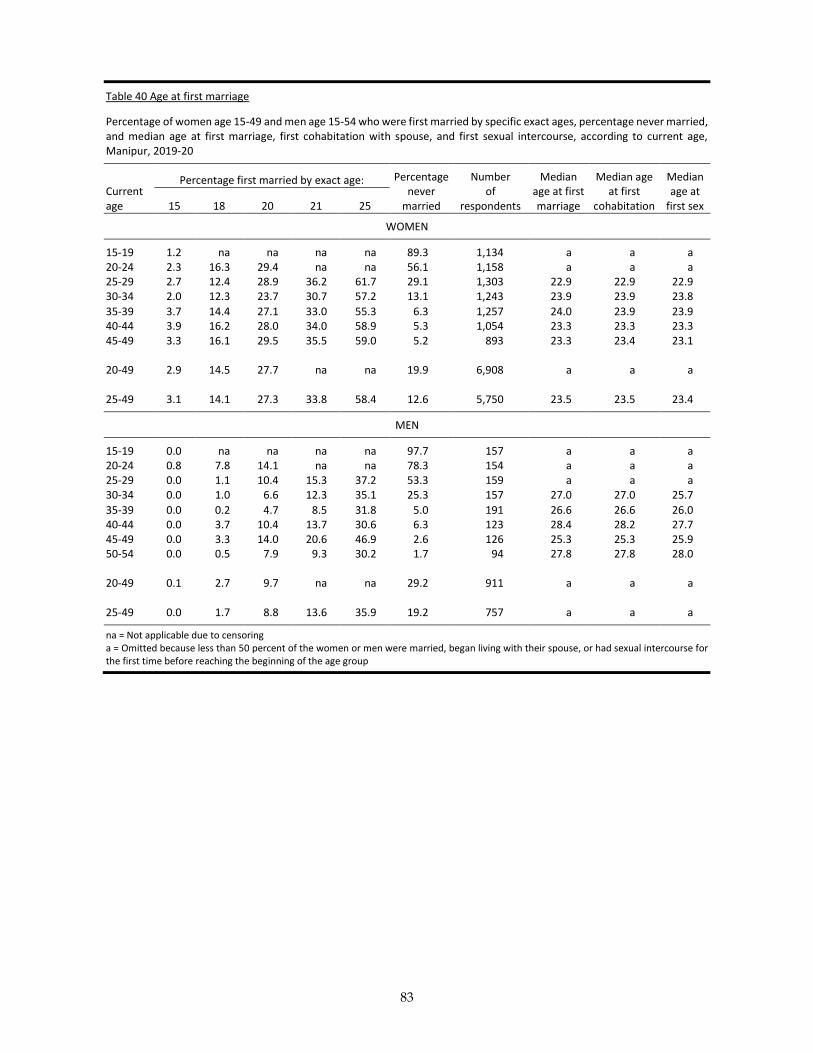
83
Table 40 Age at first marriage
Percentage of women age 15-49 and men age 15-54 who were first married by specific exact ages, percentage never married, and median age at first marriage, first cohabitation with spouse, and first sexual intercourse, according to current age, Manipur, 2019-20
Current age
Percentage first married by exact age: Percentage never
married
Number of
respondents
Median age at first marriage
Median age at first
cohabitation
Median age at
first sex 15 18 20 21 25
WOMEN
15-19 1.2 na na na na 89.3 1,134 a a a 20-24 2.3 16.3 29.4 na na 56.1 1,158 a a a 25-29 2.7 12.4 28.9 36.2 61.7 29.1 1,303 22.9 22.9 22.9 30-34 2.0 12.3 23.7 30.7 57.2 13.1 1,243 23.9 23.9 23.8
35-39 3.7 14.4 27.1 33.0 55.3 6.3 1,257 24.0 23.9 23.9 40-44 3.9 16.2 28.0 34.0 58.9 5.3 1,054 23.3 23.3 23.3 45-49 3.3 16.1 29.5 35.5 59.0 5.2 893 23.3 23.4 23.1 20-49 2.9 14.5 27.7 na na 19.9 6,908 a a a 25-49 3.1 14.1 27.3 33.8 58.4 12.6 5,750 23.5 23.5 23.4
MEN
15-19 0.0 na na na na 97.7 157 a a a 20-24 0.8 7.8 14.1 na na 78.3 154 a a a 25-29 0.0 1.1 10.4 15.3 37.2 53.3 159 a a a 30-34 0.0 1.0 6.6 12.3 35.1 25.3 157 27.0 27.0 25.7
35-39 0.0 0.2 4.7 8.5 31.8 5.0 191 26.6 26.6 26.0 40-44 0.0 3.7 10.4 13.7 30.6 6.3 123 28.4 28.2 27.7 45-49 0.0 3.3 14.0 20.6 46.9 2.6 126 25.3 25.3 25.9 50-54 0.0 0.5 7.9 9.3 30.2 1.7 94 27.8 27.8 28.0 20-49 0.1 2.7 9.7 na na 29.2 911 a a a 25-49 0.0 1.7 8.8 13.6 35.9 19.2 757 a a a
na = Not applicable due to censoring a = Omitted because less than 50 percent of the women or men were married, began living with their spouse, or had sexual intercourse for the first time before reaching the beginning of the age group
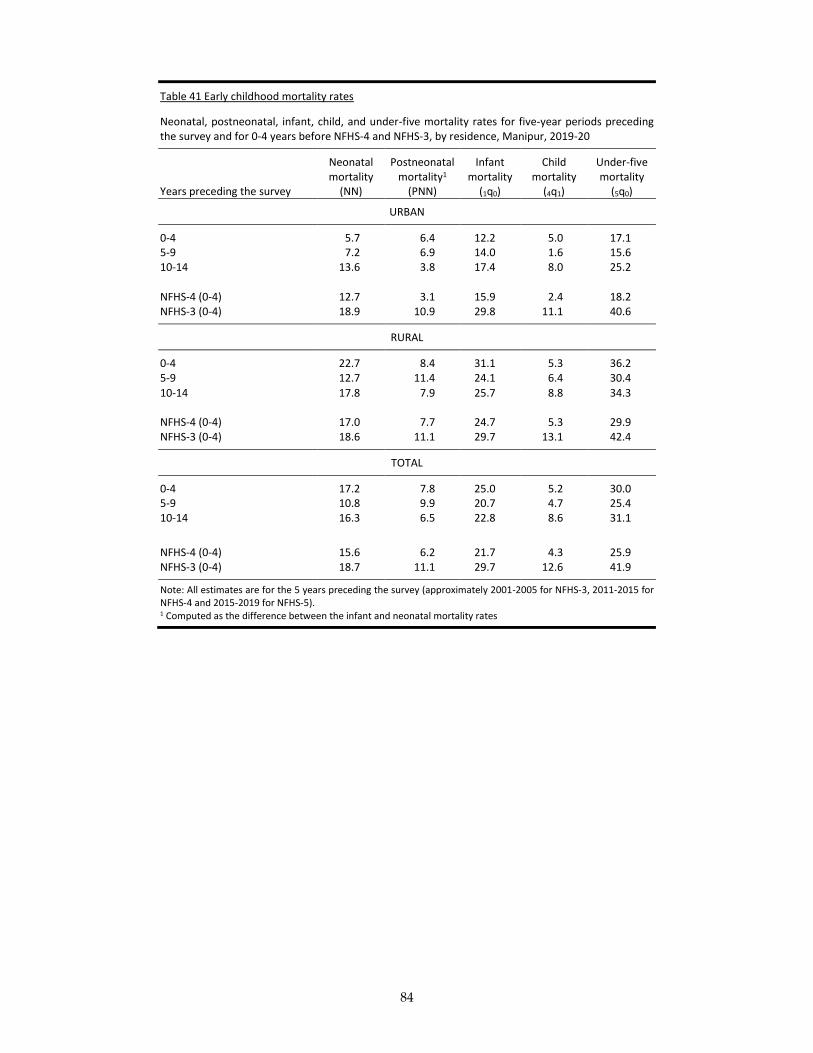
84
Table 41 Early childhood mortality rates
Neonatal, postneonatal, infant, child, and under-five mortality rates for five-year periods preceding the survey and for 0-4 years before NFHS-4 and NFHS-3, by residence, Manipur, 2019-20
Years preceding the survey
Neonatal mortality
(NN)
Postneonatal mortality1
(PNN)
Infant mortality
(1q0)
Child mortality
(4q1)
Under-five mortality
(5q0)
URBAN
0-4 5.7 6.4 12.2 5.0 17.1 5-9 7.2 6.9 14.0 1.6 15.6 10-14 13.6 3.8 17.4 8.0 25.2
NFHS-4 (0-4) 12.7 3.1 15.9 2.4 18.2 NFHS-3 (0-4) 18.9 10.9 29.8 11.1 40.6
RURAL
0-4 22.7 8.4 31.1 5.3 36.2 5-9 12.7 11.4 24.1 6.4 30.4
10-14 17.8 7.9 25.7 8.8 34.3 NFHS-4 (0-4) 17.0 7.7 24.7 5.3 29.9 NFHS-3 (0-4) 18.6 11.1 29.7 13.1 42.4
TOTAL
0-4 17.2 7.8 25.0 5.2 30.0 5-9 10.8 9.9 20.7 4.7 25.4 10-14 16.3 6.5 22.8 8.6 31.1
NFHS-4 (0-4) 15.6 6.2 21.7 4.3 25.9 NFHS-3 (0-4) 18.7 11.1 29.7 12.6 41.9
Note: All estimates are for the 5 years preceding the survey (approximately 2001-2005 for NFHS-3, 2011-2015 for NFHS-4 and 2015-2019 for NFHS-5). 1 Computed as the difference between the infant and neonatal mortality rates
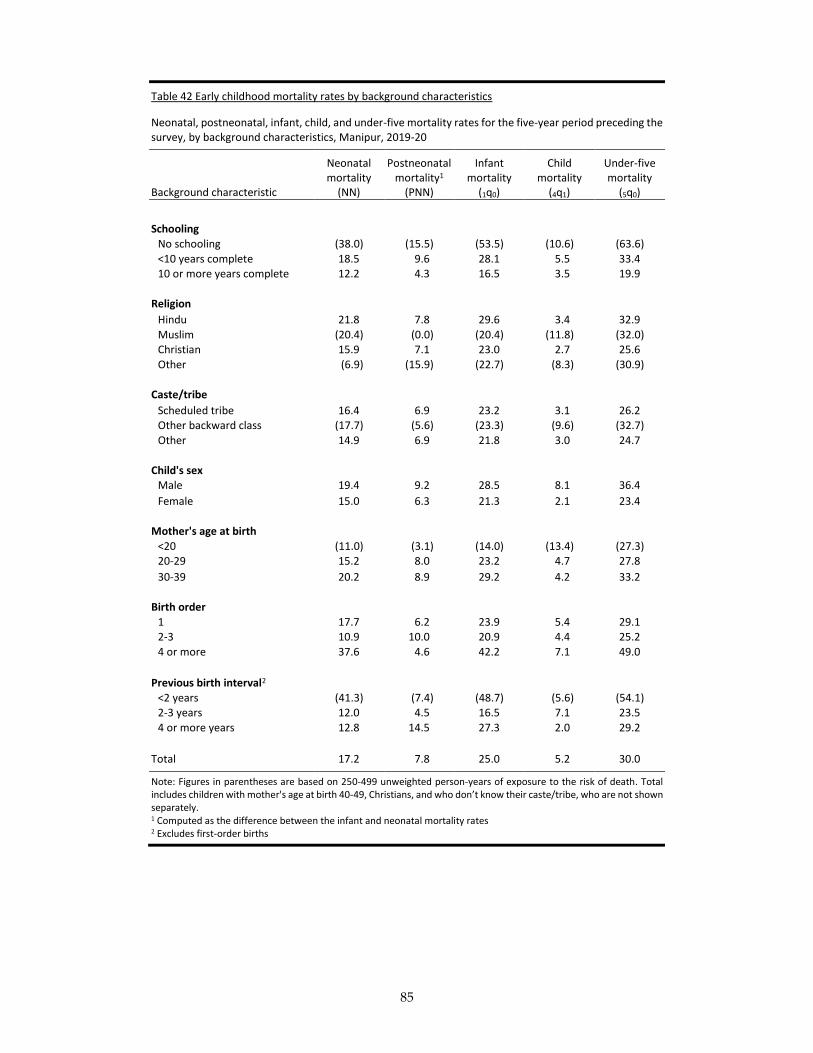
85
Table 42 Early childhood mortality rates by background characteristics
Neonatal, postneonatal, infant, child, and under-five mortality rates for the five-year period preceding the survey, by background characteristics, Manipur, 2019-20
Background characteristic
Neonatal mortality
(NN)
Postneonatal mortality1
(PNN)
Infant mortality
(1q0)
Child mortality
(4q1)
Under-five mortality
(5q0)
Schooling
No schooling (38.0) (15.5) (53.5) (10.6) (63.6)
<10 years complete 18.5 9.6 28.1 5.5 33.4 10 or more years complete 12.2 4.3 16.5 3.5 19.9
Religion
Hindu 21.8 7.8 29.6 3.4 32.9
Muslim (20.4) (0.0) (20.4) (11.8) (32.0) Christian 15.9 7.1 23.0 2.7 25.6
Other (6.9) (15.9) (22.7) (8.3) (30.9)
Caste/tribe
Scheduled tribe 16.4 6.9 23.2 3.1 26.2 Other backward class (17.7) (5.6) (23.3) (9.6) (32.7)
Other 14.9 6.9 21.8 3.0 24.7
Child's sex Male 19.4 9.2 28.5 8.1 36.4
Female 15.0 6.3 21.3 2.1 23.4
Mother's age at birth
<20 (11.0) (3.1) (14.0) (13.4) (27.3) 20-29 15.2 8.0 23.2 4.7 27.8
30-39 20.2 8.9 29.2 4.2 33.2
Birth order
1 17.7 6.2 23.9 5.4 29.1 2-3 10.9 10.0 20.9 4.4 25.2
4 or more 37.6 4.6 42.2 7.1 49.0
Previous birth interval2
<2 years (41.3) (7.4) (48.7) (5.6) (54.1) 2-3 years 12.0 4.5 16.5 7.1 23.5
4 or more years 12.8 14.5 27.3 2.0 29.2
Total 17.2 7.8 25.0 5.2 30.0
Note: Figures in parentheses are based on 250-499 unweighted person-years of exposure to the risk of death. Total includes children with mother's age at birth 40-49, Christians, and who don’t know their caste/tribe, who are not shown separately. 1 Computed as the difference between the infant and neonatal mortality rates 2 Excludes first-order births
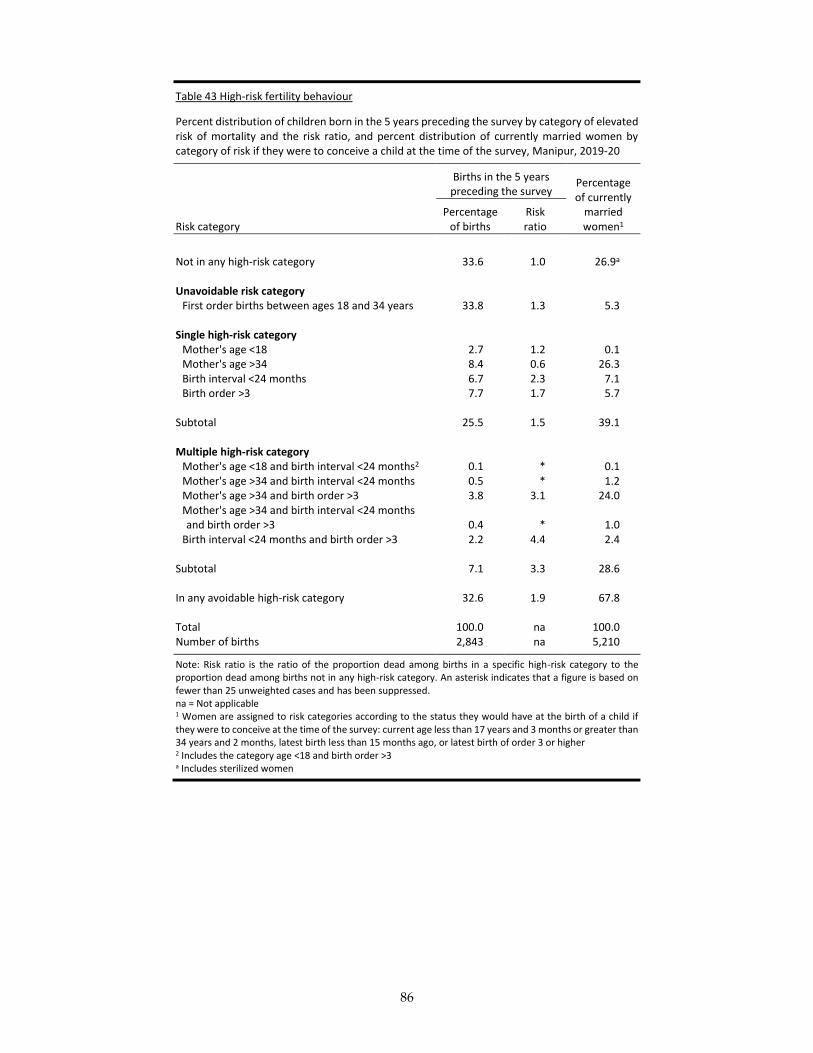
86
Table 43 High-risk fertility behaviour
Percent distribution of children born in the 5 years preceding the survey by category of elevated risk of mortality and the risk ratio, and percent distribution of currently married women by category of risk if they were to conceive a child at the time of the survey, Manipur, 2019-20
Births in the 5 years preceding the survey
Percentage of currently
married women1 Risk category
Percentage of births
Risk ratio
Not in any high-risk category 33.6 1.0 26.9a
Unavoidable risk category
First order births between ages 18 and 34 years 33.8 1.3 5.3
Single high-risk category Mother's age <18 2.7 1.2 0.1 Mother's age >34 8.4 0.6 26.3 Birth interval <24 months 6.7 2.3 7.1 Birth order >3 7.7 1.7 5.7
Subtotal 25.5 1.5 39.1
Multiple high-risk category Mother's age <18 and birth interval <24 months2 0.1 * 0.1 Mother's age >34 and birth interval <24 months 0.5 * 1.2 Mother's age >34 and birth order >3 3.8 3.1 24.0 Mother's age >34 and birth interval <24 months and birth order >3 0.4 * 1.0
Birth interval <24 months and birth order >3 2.2 4.4 2.4
Subtotal 7.1 3.3 28.6
In any avoidable high-risk category 32.6 1.9 67.8
Total 100.0 na 100.0 Number of births 2,843 na 5,210
Note: Risk ratio is the ratio of the proportion dead among births in a specific high-risk category to the proportion dead among births not in any high-risk category. An asterisk indicates that a figure is based on fewer than 25 unweighted cases and has been suppressed. na = Not applicable 1 Women are assigned to risk categories according to the status they would have at the birth of a child if they were to conceive at the time of the survey: current age less than 17 years and 3 months or greater than 34 years and 2 months, latest birth less than 15 months ago, or latest birth of order 3 or higher 2 Includes the category age <18 and birth order >3 a Includes sterilized women
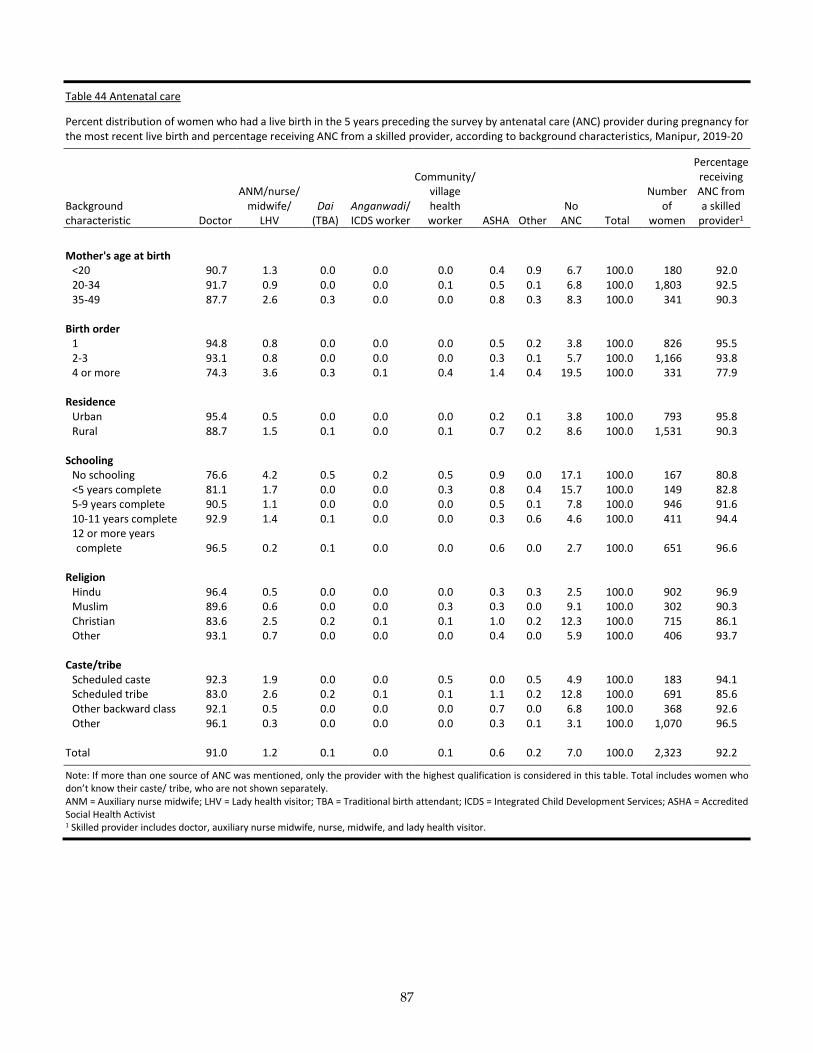
87
Table 44 Antenatal care
Percent distribution of women who had a live birth in the 5 years preceding the survey by antenatal care (ANC) provider during pregnancy for the most recent live birth and percentage receiving ANC from a skilled provider, according to background characteristics, Manipur, 2019-20
Background characteristic Doctor
ANM/nurse/ midwife/
LHV Dai
(TBA) Anganwadi/ ICDS worker
Community/ village health worker ASHA Other
No ANC Total
Number of
women
Percentage receiving ANC from a skilled
provider1
Mother's age at birth
<20 90.7 1.3 0.0 0.0 0.0 0.4 0.9 6.7 100.0 180 92.0 20-34 91.7 0.9 0.0 0.0 0.1 0.5 0.1 6.8 100.0 1,803 92.5 35-49 87.7 2.6 0.3 0.0 0.0 0.8 0.3 8.3 100.0 341 90.3
Birth order 1 94.8 0.8 0.0 0.0 0.0 0.5 0.2 3.8 100.0 826 95.5 2-3 93.1 0.8 0.0 0.0 0.0 0.3 0.1 5.7 100.0 1,166 93.8 4 or more 74.3 3.6 0.3 0.1 0.4 1.4 0.4 19.5 100.0 331 77.9
Residence Urban 95.4 0.5 0.0 0.0 0.0 0.2 0.1 3.8 100.0 793 95.8 Rural 88.7 1.5 0.1 0.0 0.1 0.7 0.2 8.6 100.0 1,531 90.3
Schooling No schooling 76.6 4.2 0.5 0.2 0.5 0.9 0.0 17.1 100.0 167 80.8 <5 years complete 81.1 1.7 0.0 0.0 0.3 0.8 0.4 15.7 100.0 149 82.8 5-9 years complete 90.5 1.1 0.0 0.0 0.0 0.5 0.1 7.8 100.0 946 91.6 10-11 years complete 92.9 1.4 0.1 0.0 0.0 0.3 0.6 4.6 100.0 411 94.4 12 or more years complete 96.5 0.2 0.1 0.0 0.0 0.6 0.0 2.7 100.0 651 96.6
Religion
Hindu 96.4 0.5 0.0 0.0 0.0 0.3 0.3 2.5 100.0 902 96.9 Muslim 89.6 0.6 0.0 0.0 0.3 0.3 0.0 9.1 100.0 302 90.3 Christian 83.6 2.5 0.2 0.1 0.1 1.0 0.2 12.3 100.0 715 86.1 Other 93.1 0.7 0.0 0.0 0.0 0.4 0.0 5.9 100.0 406 93.7
Caste/tribe Scheduled caste 92.3 1.9 0.0 0.0 0.5 0.0 0.5 4.9 100.0 183 94.1 Scheduled tribe 83.0 2.6 0.2 0.1 0.1 1.1 0.2 12.8 100.0 691 85.6 Other backward class 92.1 0.5 0.0 0.0 0.0 0.7 0.0 6.8 100.0 368 92.6 Other 96.1 0.3 0.0 0.0 0.0 0.3 0.1 3.1 100.0 1,070 96.5
Total 91.0 1.2 0.1 0.0 0.1 0.6 0.2 7.0 100.0 2,323 92.2
Note: If more than one source of ANC was mentioned, only the provider with the highest qualification is considered in this table. Total includes women who don’t know their caste/ tribe, who are not shown separately. ANM = Auxiliary nurse midwife; LHV = Lady health visitor; TBA = Traditional birth attendant; ICDS = Integrated Child Development Services; ASHA = Accredited Social Health Activist 1 Skilled provider includes doctor, auxiliary nurse midwife, nurse, midwife, and lady health visitor.
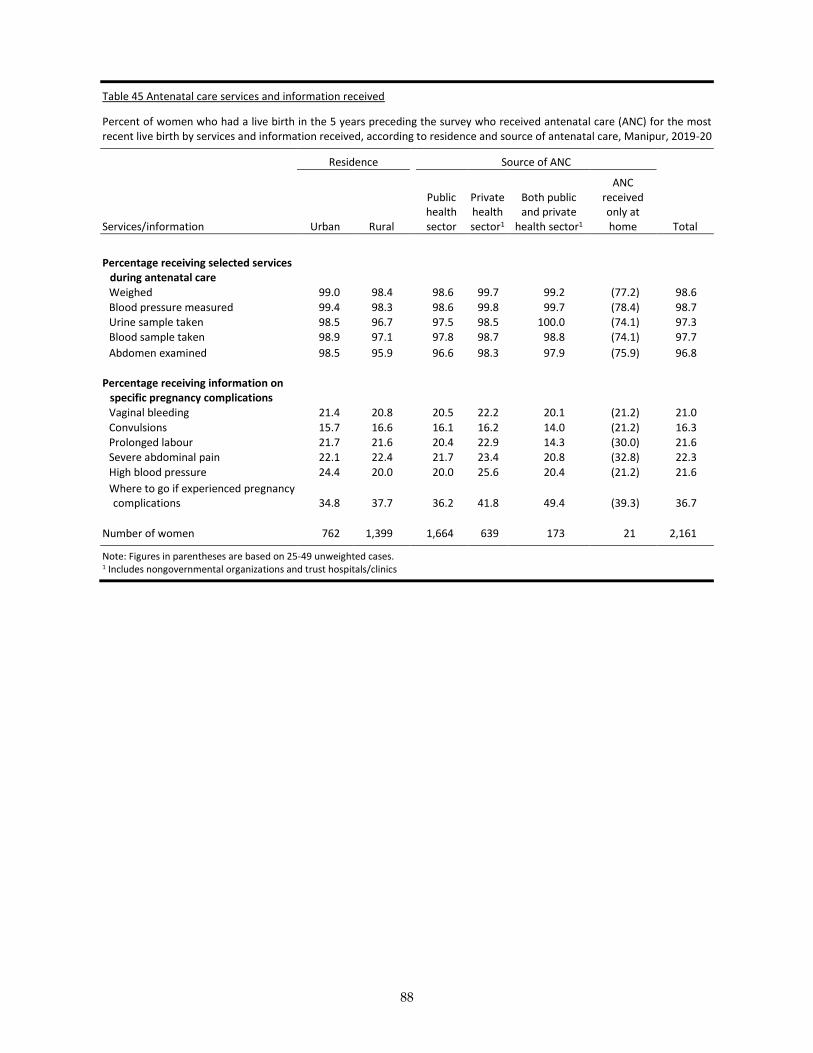
88
Table 45 Antenatal care services and information received
Percent of women who had a live birth in the 5 years preceding the survey who received antenatal care (ANC) for the most recent live birth by services and information received, according to residence and source of antenatal care, Manipur, 2019-20
Residence Source of ANC
Services/information Urban Rural
Public health sector
Private health sector1
Both public and private
health sector1
ANC received only at home Total
Percentage receiving selected services during antenatal care Weighed 99.0 98.4 98.6 99.7 99.2 (77.2) 98.6
Blood pressure measured 99.4 98.3 98.6 99.8 99.7 (78.4) 98.7 Urine sample taken 98.5 96.7 97.5 98.5 100.0 (74.1) 97.3 Blood sample taken 98.9 97.1 97.8 98.7 98.8 (74.1) 97.7
Abdomen examined 98.5 95.9 96.6 98.3 97.9 (75.9) 96.8
Percentage receiving information on specific pregnancy complications Vaginal bleeding 21.4 20.8 20.5 22.2 20.1 (21.2) 21.0
Convulsions 15.7 16.6 16.1 16.2 14.0 (21.2) 16.3 Prolonged labour 21.7 21.6 20.4 22.9 14.3 (30.0) 21.6 Severe abdominal pain 22.1 22.4 21.7 23.4 20.8 (32.8) 22.3
High blood pressure 24.4 20.0 20.0 25.6 20.4 (21.2) 21.6
Where to go if experienced pregnancy complications 34.8 37.7 36.2 41.8 49.4 (39.3) 36.7
Number of women 762 1,399 1,664 639 173 21 2,161
Note: Figures in parentheses are based on 25-49 unweighted cases. 1 Includes nongovernmental organizations and trust hospitals/clinics
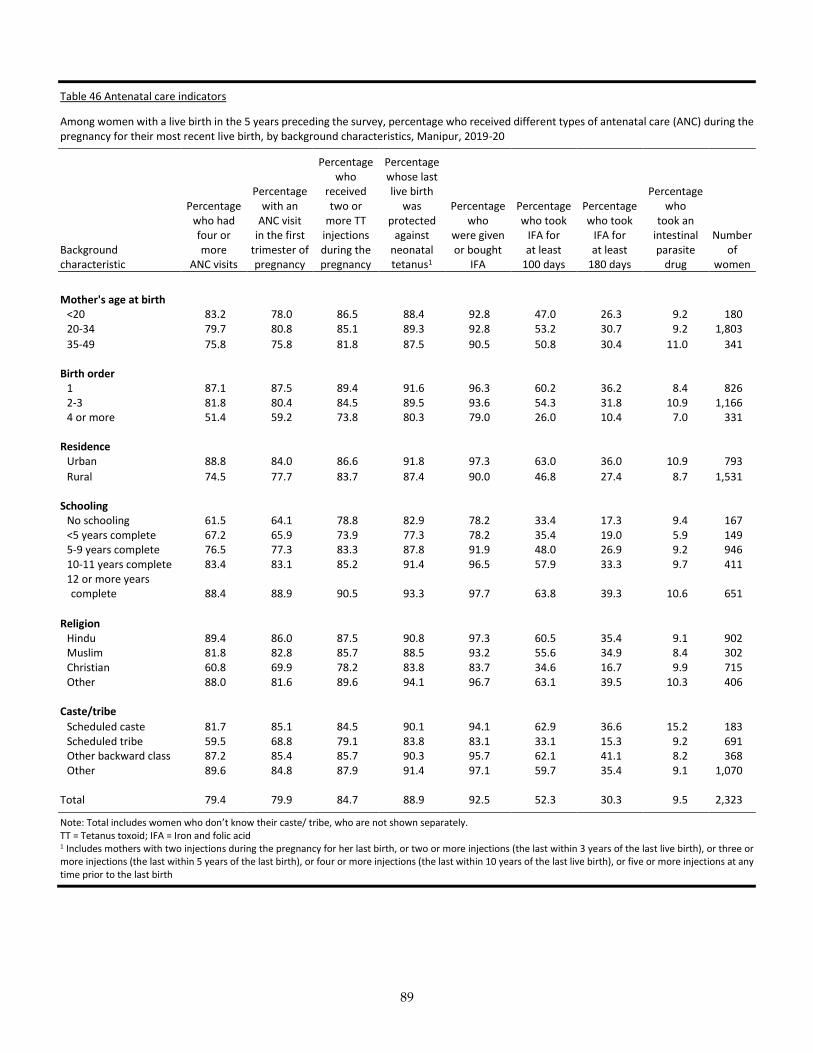
89
Table 46 Antenatal care indicators
Among women with a live birth in the 5 years preceding the survey, percentage who received different types of antenatal care (ANC) during the pregnancy for their most recent live birth, by background characteristics, Manipur, 2019-20
Background characteristic
Percentage who had four or more
ANC visits
Percentage with an
ANC visit in the first
trimester of pregnancy
Percentage who
received two or
more TT injections during the pregnancy
Percentage whose last live birth
was protected
against neonatal tetanus1
Percentage who
were given or bought
IFA
Percentage who took
IFA for at least
100 days
Percentage who took
IFA for at least
180 days
Percentage who
took an intestinal parasite
drug
Number of
women
Mother's age at birth
<20 83.2 78.0 86.5 88.4 92.8 47.0 26.3 9.2 180 20-34 79.7 80.8 85.1 89.3 92.8 53.2 30.7 9.2 1,803
35-49 75.8 75.8 81.8 87.5 90.5 50.8 30.4 11.0 341
Birth order 1 87.1 87.5 89.4 91.6 96.3 60.2 36.2 8.4 826 2-3 81.8 80.4 84.5 89.5 93.6 54.3 31.8 10.9 1,166 4 or more 51.4 59.2 73.8 80.3 79.0 26.0 10.4 7.0 331
Residence Urban 88.8 84.0 86.6 91.8 97.3 63.0 36.0 10.9 793
Rural 74.5 77.7 83.7 87.4 90.0 46.8 27.4 8.7 1,531
Schooling No schooling 61.5 64.1 78.8 82.9 78.2 33.4 17.3 9.4 167 <5 years complete 67.2 65.9 73.9 77.3 78.2 35.4 19.0 5.9 149 5-9 years complete 76.5 77.3 83.3 87.8 91.9 48.0 26.9 9.2 946 10-11 years complete 83.4 83.1 85.2 91.4 96.5 57.9 33.3 9.7 411 12 or more years complete 88.4 88.9 90.5 93.3 97.7 63.8 39.3 10.6 651
Religion
Hindu 89.4 86.0 87.5 90.8 97.3 60.5 35.4 9.1 902 Muslim 81.8 82.8 85.7 88.5 93.2 55.6 34.9 8.4 302 Christian 60.8 69.9 78.2 83.8 83.7 34.6 16.7 9.9 715 Other 88.0 81.6 89.6 94.1 96.7 63.1 39.5 10.3 406
Caste/tribe
Scheduled caste 81.7 85.1 84.5 90.1 94.1 62.9 36.6 15.2 183 Scheduled tribe 59.5 68.8 79.1 83.8 83.1 33.1 15.3 9.2 691 Other backward class 87.2 85.4 85.7 90.3 95.7 62.1 41.1 8.2 368 Other 89.6 84.8 87.9 91.4 97.1 59.7 35.4 9.1 1,070
Total 79.4 79.9 84.7 88.9 92.5 52.3 30.3 9.5 2,323
Note: Total includes women who don’t know their caste/ tribe, who are not shown separately. TT = Tetanus toxoid; IFA = Iron and folic acid 1 Includes mothers with two injections during the pregnancy for her last birth, or two or more injections (the last within 3 years of the last live birth), or three or more injections (the last within 5 years of the last birth), or four or more injections (the last within 10 years of the last live birth), or five or more injections at any time prior to the last birth
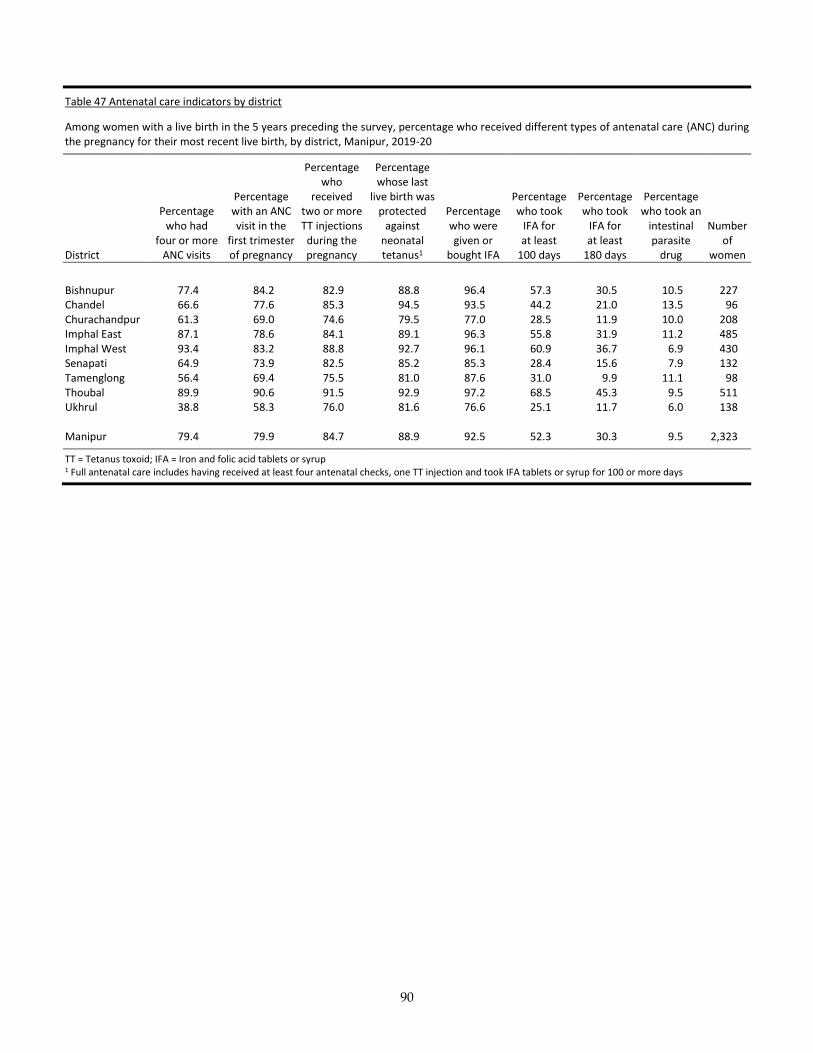
90
Table 47 Antenatal care indicators by district
Among women with a live birth in the 5 years preceding the survey, percentage who received different types of antenatal care (ANC) during the pregnancy for their most recent live birth, by district, Manipur, 2019-20
District
Percentage who had
four or more ANC visits
Percentage with an ANC visit in the
first trimester of pregnancy
Percentage who
received two or more TT injections
during the pregnancy
Percentage whose last
live birth was protected
against neonatal tetanus1
Percentage who were given or
bought IFA
Percentage who took
IFA for at least
100 days
Percentage who took
IFA for at least
180 days
Percentage who took an
intestinal parasite
drug
Number of
women
Bishnupur 77.4 84.2 82.9 88.8 96.4 57.3 30.5 10.5 227 Chandel 66.6 77.6 85.3 94.5 93.5 44.2 21.0 13.5 96 Churachandpur 61.3 69.0 74.6 79.5 77.0 28.5 11.9 10.0 208 Imphal East 87.1 78.6 84.1 89.1 96.3 55.8 31.9 11.2 485 Imphal West 93.4 83.2 88.8 92.7 96.1 60.9 36.7 6.9 430 Senapati 64.9 73.9 82.5 85.2 85.3 28.4 15.6 7.9 132 Tamenglong 56.4 69.4 75.5 81.0 87.6 31.0 9.9 11.1 98 Thoubal 89.9 90.6 91.5 92.9 97.2 68.5 45.3 9.5 511 Ukhrul 38.8 58.3 76.0 81.6 76.6 25.1 11.7 6.0 138 Manipur 79.4 79.9 84.7 88.9 92.5 52.3 30.3 9.5 2,323
TT = Tetanus toxoid; IFA = Iron and folic acid tablets or syrup 1 Full antenatal care includes having received at least four antenatal checks, one TT injection and took IFA tablets or syrup for 100 or more days

91
Table 48 Advice received during pregnancy
Among women with a live birth in the 5 years preceding the survey who met with a community health worker in the last three months of pregnancy for their most recent live birth, percentage who received different types of advice, by background characteristics, Manipur, 2019-20
Background characteristic
Percentage who received advice on:
Number of women who met with a
community health worker in the
last three months of pregnancy1
Importance of institutional
delivery Cord care
Breast-feeding
Keeping the baby warm
Family planning
Mother's age at birth
<20 (57.3) (32.4) (27.5) (32.8) (24.2) 32 20-34 62.8 35.0 42.2 40.8 35.0 361 35-49 58.3 49.3 54.2 53.6 36.5 66
Birth order 1 65.3 37.3 43.0 44.0 30.9 173 2-3 62.6 37.8 45.3 43.8 38.0 220 4 or more 49.7 32.9 34.3 31.6 32.3 66
Residence Urban 55.3 33.6 36.4 37.2 25.9 143 Rural 64.7 38.4 45.8 44.4 38.4 316
Schooling No schooling (65.9) (41.7) (45.0) (43.8) (34.4) 30 <5 years complete (64.4) (48.2) (55.2) (53.5) (51.2) 21 5-9 years complete 61.9 35.2 38.8 35.9 33.0 184 10-11 years complete 62.2 39.4 49.1 49.8 34.1 96 12 or more years complete 59.7 34.5 41.6 43.0 34.2 127
Religion Hindu 57.2 34.9 41.5 38.9 29.8 202 Muslim (67.9) (29.2) (31.0) (39.8) (35.1) 48 Christian 63.2 48.6 53.8 53.2 46.9 108 Other 66.4 32.0 39.6 37.8 30.3 102
Caste/tribe Scheduled caste (69.5) (55.2) (62.3) (52.0) (34.2) 43 Scheduled tribe 61.3 46.9 51.1 50.5 44.8 102 Other backward class (64.3) (22.8) (30.6) (36.9) (33.1) 84 Other 59.5 34.6 40.5 38.9 30.8 227
Total 61.7 36.9 42.9 42.1 34.5 459
Note: Figures in parentheses are based on 25-49 unweighted cases. Total includes women who don’t know their caste/ tribe, who are not shown separately.
1 Community health worker includes auxiliary nurse midwife (ANM), lady health visitor (LHV), Accredited Social Health Activist (ASHA), Anganwadi worker, and other community health workers
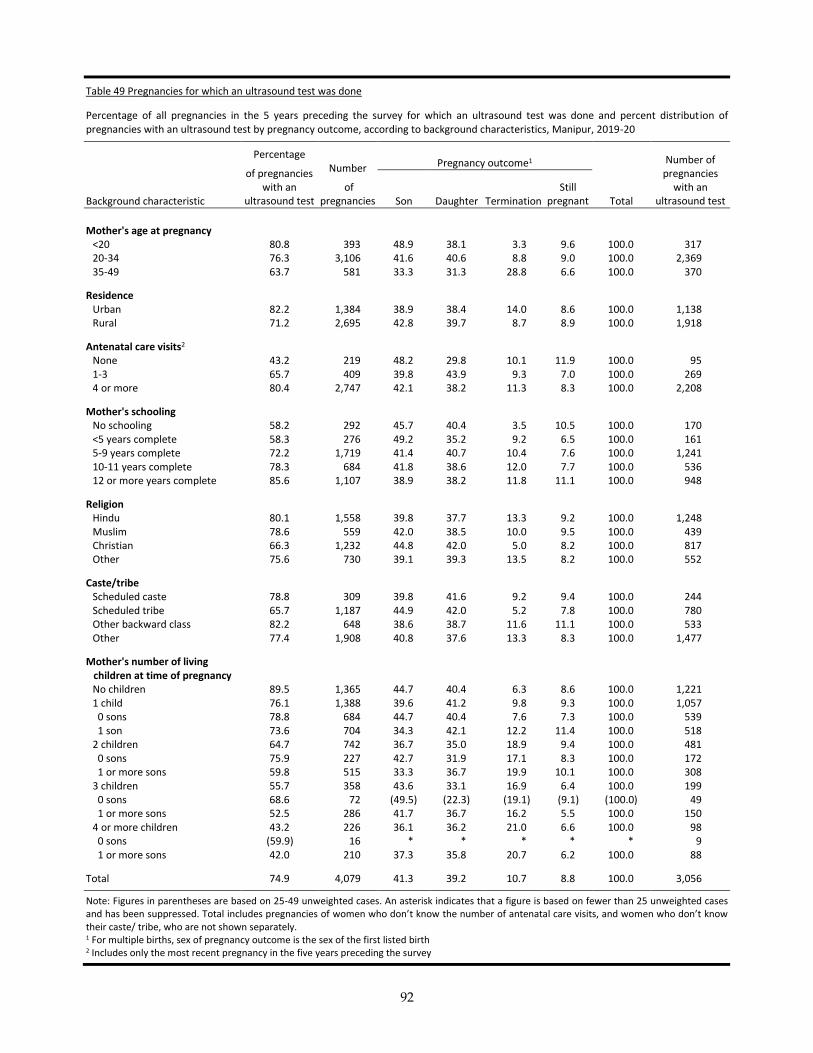
92
Table 49 Pregnancies for which an ultrasound test was done
Percentage of all pregnancies in the 5 years preceding the survey for which an ultrasound test was done and percent distribution of pregnancies with an ultrasound test by pregnancy outcome, according to background characteristics, Manipur, 2019-20
Background characteristic
Percentage
of pregnancies with an
ultrasound test
Number
of pregnancies
Pregnancy outcome1
Total
Number of pregnancies
with an ultrasound test Son Daughter Termination
Still pregnant
Mother's age at pregnancy <20 80.8 393 48.9 38.1 3.3 9.6 100.0 317 20-34 76.3 3,106 41.6 40.6 8.8 9.0 100.0 2,369 35-49 63.7 581 33.3 31.3 28.8 6.6 100.0 370
Residence Urban 82.2 1,384 38.9 38.4 14.0 8.6 100.0 1,138 Rural 71.2 2,695 42.8 39.7 8.7 8.9 100.0 1,918
Antenatal care visits2 None 43.2 219 48.2 29.8 10.1 11.9 100.0 95 1-3 65.7 409 39.8 43.9 9.3 7.0 100.0 269 4 or more 80.4 2,747 42.1 38.2 11.3 8.3 100.0 2,208
Mother's schooling No schooling 58.2 292 45.7 40.4 3.5 10.5 100.0 170 <5 years complete 58.3 276 49.2 35.2 9.2 6.5 100.0 161 5-9 years complete 72.2 1,719 41.4 40.7 10.4 7.6 100.0 1,241 10-11 years complete 78.3 684 41.8 38.6 12.0 7.7 100.0 536 12 or more years complete 85.6 1,107 38.9 38.2 11.8 11.1 100.0 948
Religion Hindu 80.1 1,558 39.8 37.7 13.3 9.2 100.0 1,248 Muslim 78.6 559 42.0 38.5 10.0 9.5 100.0 439 Christian 66.3 1,232 44.8 42.0 5.0 8.2 100.0 817 Other 75.6 730 39.1 39.3 13.5 8.2 100.0 552
Caste/tribe Scheduled caste 78.8 309 39.8 41.6 9.2 9.4 100.0 244 Scheduled tribe 65.7 1,187 44.9 42.0 5.2 7.8 100.0 780 Other backward class 82.2 648 38.6 38.7 11.6 11.1 100.0 533 Other 77.4 1,908 40.8 37.6 13.3 8.3 100.0 1,477
Mother's number of living children at time of pregnancy No children 89.5 1,365 44.7 40.4 6.3 8.6 100.0 1,221 1 child 76.1 1,388 39.6 41.2 9.8 9.3 100.0 1,057 0 sons 78.8 684 44.7 40.4 7.6 7.3 100.0 539 1 son 73.6 704 34.3 42.1 12.2 11.4 100.0 518 2 children 64.7 742 36.7 35.0 18.9 9.4 100.0 481 0 sons 75.9 227 42.7 31.9 17.1 8.3 100.0 172 1 or more sons 59.8 515 33.3 36.7 19.9 10.1 100.0 308 3 children 55.7 358 43.6 33.1 16.9 6.4 100.0 199 0 sons 68.6 72 (49.5) (22.3) (19.1) (9.1) (100.0) 49 1 or more sons 52.5 286 41.7 36.7 16.2 5.5 100.0 150 4 or more children 43.2 226 36.1 36.2 21.0 6.6 100.0 98 0 sons (59.9) 16 * * * * * 9 1 or more sons 42.0 210 37.3 35.8 20.7 6.2 100.0 88
Total 74.9 4,079 41.3 39.2 10.7 8.8 100.0 3,056
Note: Figures in parentheses are based on 25-49 unweighted cases. An asterisk indicates that a figure is based on fewer than 25 unweighted cases and has been suppressed. Total includes pregnancies of women who don’t know the number of antenatal care visits, and women who don’t know their caste/ tribe, who are not shown separately. 1 For multiple births, sex of pregnancy outcome is the sex of the first listed birth 2 Includes only the most recent pregnancy in the five years preceding the survey

93
Table 50 Pregnancy registration and Mother and Child Protection Card
Percentage of women age 15-49 who had a live birth in the 5 years preceding the survey who registered the pregnancy for the most recent live birth; and among registered pregnancies, percent distribution by the timing of the registration and percentage who received a Mother and Child Protection (MCP) Card, by background characteristics, Manipur, 2019-20
Background characteristic
Percentage of pregnancies
that were registered
Number of pregnancies
Timing of pregnancy registration Percentage of mothers given an MCP card
Number of registered
pregnancies First
trimester Later Don't know
Mother's age at birth <20 86.1 180 83.1 16.5 0.4 79.9 155
20-34 84.9 1,803 86.8 12.7 0.2 73.4 1,530
35-49 82.1 341 85.2 14.8 0.0 66.8 280
Birth order
1 88.2 826 89.3 9.8 0.4 74.5 729
2-3 84.6 1,166 87.4 12.4 0.1 71.7 986
4 or more 75.3 331 72.9 26.9 0.1 73.2 249
Residence
Urban 85.5 793 87.6 12.1 0.3 74.9 677
Rural 84.1 1,531 85.6 13.9 0.1 71.9 1,287
Schooling
No schooling 76.6 167 79.5 20.5 0.0 75.2 128
<5 years complete 72.2 149 73.3 26.7 0.0 85.5 108
5-9 years complete 86.7 946 87.1 12.5 0.2 75.6 820 10-11 years complete 86.3 411 84.7 14.7 0.4 74.9 355 12 or more years complete 85.2 651 90.1 9.4 0.2 64.7 554
Religion
Hindu 85.2 902 89.3 10.4 0.3 69.4 768
Muslim 87.1 302 83.4 15.7 0.2 73.2 263
Christian 80.3 715 83.4 16.4 0.1 77.5 574
Other 88.6 406 86.6 12.8 0.2 73.1 359
Caste/tribe
Scheduled caste 88.3 183 89.5 9.6 0.9 85.8 162 Scheduled tribe 80.4 691 82.8 17.0 0.1 77.9 555
Other backward class 88.8 368 84.9 14.6 0.0 70.8 327
Other 85.0 1,070 88.6 11.0 0.2 68.4 910
Total 84.6 2,323 86.3 13.3 0.2 72.9 1,965
Note: Total includes births to women who don’t know their caste/ tribe, who are not shown separately.
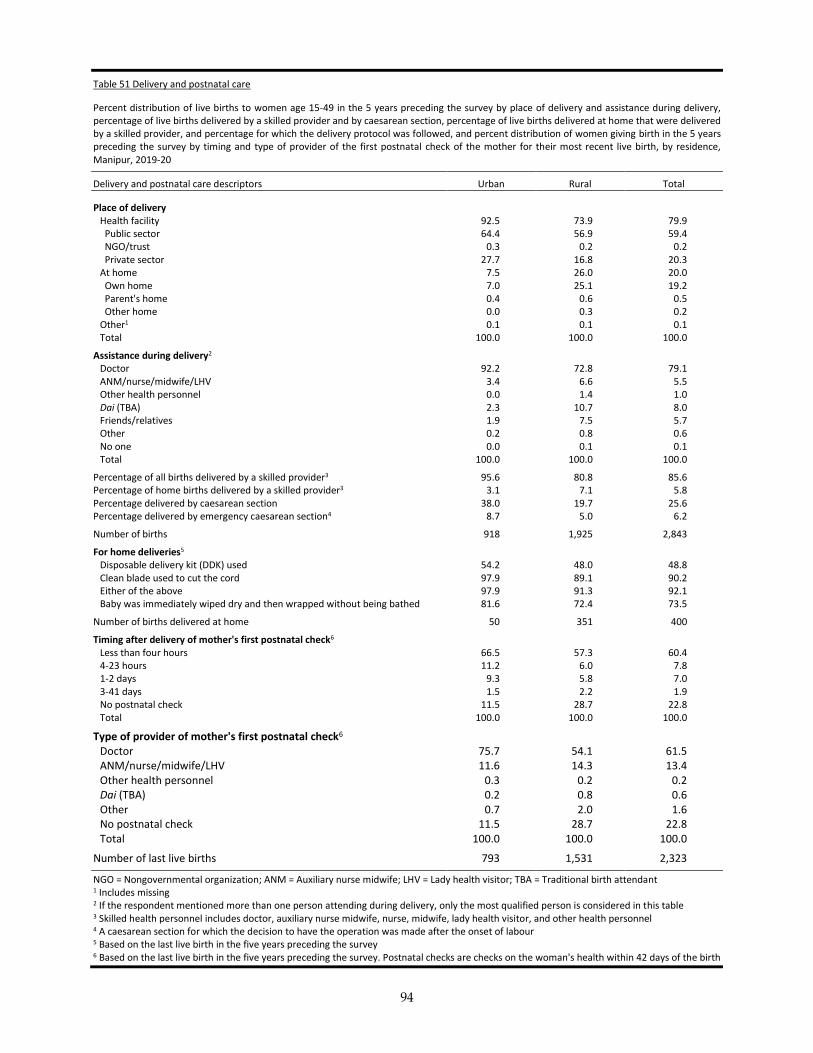
94
Table 51 Delivery and postnatal care
Percent distribution of live births to women age 15-49 in the 5 years preceding the survey by place of delivery and assistance during delivery, percentage of live births delivered by a skilled provider and by caesarean section, percentage of live births delivered at home that were delivered by a skilled provider, and percentage for which the delivery protocol was followed, and percent distribution of women giving birth in the 5 years preceding the survey by timing and type of provider of the first postnatal check of the mother for their most recent live birth, by residence, Manipur, 2019-20
Delivery and postnatal care descriptors Urban Rural Total
Place of delivery Health facility 92.5 73.9 79.9 Public sector 64.4 56.9 59.4 NGO/trust 0.3 0.2 0.2 Private sector 27.7 16.8 20.3 At home 7.5 26.0 20.0 Own home 7.0 25.1 19.2 Parent's home 0.4 0.6 0.5 Other home 0.0 0.3 0.2 Other1 0.1 0.1 0.1 Total 100.0 100.0 100.0
Assistance during delivery2 Doctor 92.2 72.8 79.1 ANM/nurse/midwife/LHV 3.4 6.6 5.5 Other health personnel 0.0 1.4 1.0 Dai (TBA) 2.3 10.7 8.0 Friends/relatives 1.9 7.5 5.7 Other 0.2 0.8 0.6 No one 0.0 0.1 0.1 Total 100.0 100.0 100.0
Percentage of all births delivered by a skilled provider3 95.6 80.8 85.6 Percentage of home births delivered by a skilled provider3 3.1 7.1 5.8 Percentage delivered by caesarean section 38.0 19.7 25.6 Percentage delivered by emergency caesarean section4 8.7 5.0 6.2
Number of births 918 1,925 2,843
For home deliveries5 Disposable delivery kit (DDK) used 54.2 48.0 48.8 Clean blade used to cut the cord 97.9 89.1 90.2 Either of the above 97.9 91.3 92.1 Baby was immediately wiped dry and then wrapped without being bathed 81.6 72.4 73.5
Number of births delivered at home 50 351 400
Timing after delivery of mother's first postnatal check6 Less than four hours 66.5 57.3 60.4 4-23 hours 11.2 6.0 7.8 1-2 days 9.3 5.8 7.0 3-41 days 1.5 2.2 1.9 No postnatal check 11.5 28.7 22.8 Total 100.0 100.0 100.0
Type of provider of mother's first postnatal check6 Doctor 75.7 54.1 61.5 ANM/nurse/midwife/LHV 11.6 14.3 13.4 Other health personnel 0.3 0.2 0.2 Dai (TBA) 0.2 0.8 0.6 Other 0.7 2.0 1.6 No postnatal check 11.5 28.7 22.8 Total 100.0 100.0 100.0
Number of last live births 793 1,531 2,323
NGO = Nongovernmental organization; ANM = Auxiliary nurse midwife; LHV = Lady health visitor; TBA = Traditional birth attendant 1 Includes missing 2 If the respondent mentioned more than one person attending during delivery, only the most qualified person is considered in this table 3 Skilled health personnel includes doctor, auxiliary nurse midwife, nurse, midwife, lady health visitor, and other health personnel 4 A caesarean section for which the decision to have the operation was made after the onset of labour 5 Based on the last live birth in the five years preceding the survey 6 Based on the last live birth in the five years preceding the survey. Postnatal checks are checks on the woman's health within 42 days of the birth
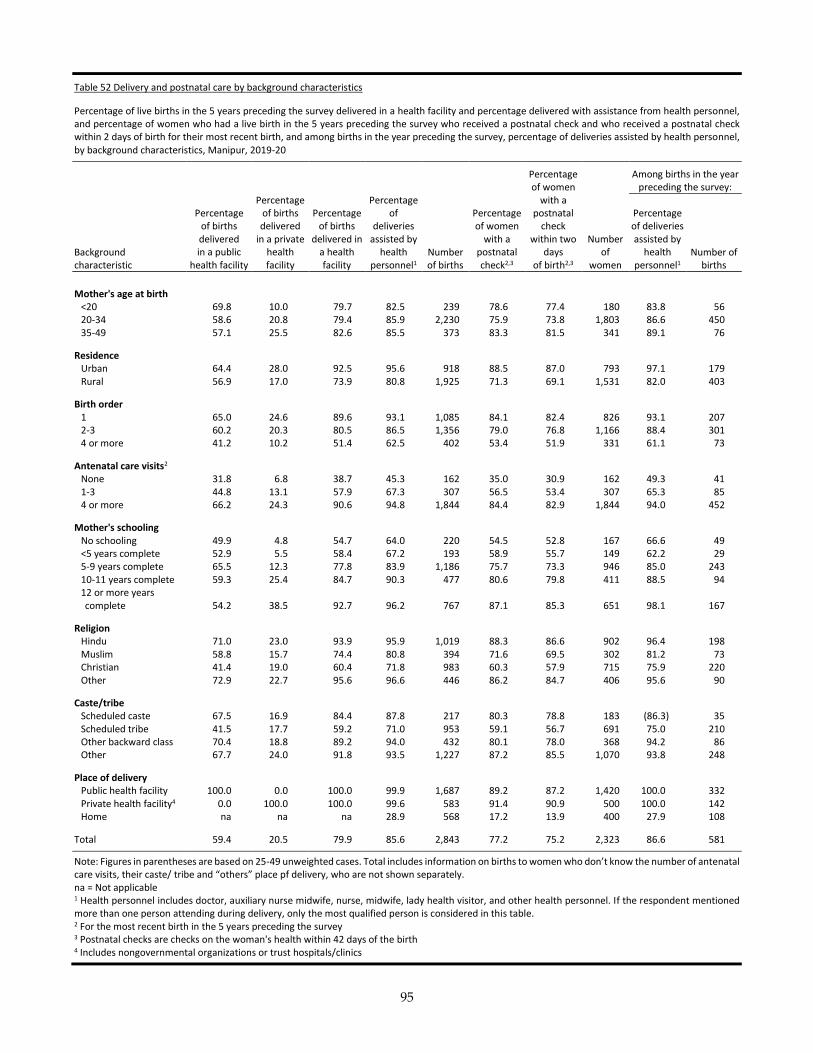
95
Table 52 Delivery and postnatal care by background characteristics
Percentage of live births in the 5 years preceding the survey delivered in a health facility and percentage delivered with assistance from health personnel, and percentage of women who had a live birth in the 5 years preceding the survey who received a postnatal check and who received a postnatal check within 2 days of birth for their most recent birth, and among births in the year preceding the survey, percentage of deliveries assisted by health personnel, by background characteristics, Manipur, 2019-20
Background characteristic
Percentage of births delivered in a public
health facility
Percentage of births delivered
in a private health facility
Percentage of births
delivered in a health facility
Percentage of
deliveries assisted by
health personnel1
Number of births
Percentage of women
with a postnatal check2,3
Percentage of women
with a postnatal
check within two
days of birth2,3
Number of
women
Among births in the year preceding the survey:
Percentage of deliveries assisted by
health personnel1
Number of births
Mother's age at birth <20 69.8 10.0 79.7 82.5 239 78.6 77.4 180 83.8 56 20-34 58.6 20.8 79.4 85.9 2,230 75.9 73.8 1,803 86.6 450 35-49 57.1 25.5 82.6 85.5 373 83.3 81.5 341 89.1 76
Residence Urban 64.4 28.0 92.5 95.6 918 88.5 87.0 793 97.1 179 Rural 56.9 17.0 73.9 80.8 1,925 71.3 69.1 1,531 82.0 403
Birth order 1 65.0 24.6 89.6 93.1 1,085 84.1 82.4 826 93.1 207 2-3 60.2 20.3 80.5 86.5 1,356 79.0 76.8 1,166 88.4 301 4 or more 41.2 10.2 51.4 62.5 402 53.4 51.9 331 61.1 73
Antenatal care visits2 None 31.8 6.8 38.7 45.3 162 35.0 30.9 162 49.3 41 1-3 44.8 13.1 57.9 67.3 307 56.5 53.4 307 65.3 85 4 or more 66.2 24.3 90.6 94.8 1,844 84.4 82.9 1,844 94.0 452
Mother's schooling No schooling 49.9 4.8 54.7 64.0 220 54.5 52.8 167 66.6 49 <5 years complete 52.9 5.5 58.4 67.2 193 58.9 55.7 149 62.2 29 5-9 years complete 65.5 12.3 77.8 83.9 1,186 75.7 73.3 946 85.0 243 10-11 years complete 59.3 25.4 84.7 90.3 477 80.6 79.8 411 88.5 94 12 or more years complete 54.2 38.5 92.7 96.2 767 87.1 85.3 651 98.1 167
Religion Hindu 71.0 23.0 93.9 95.9 1,019 88.3 86.6 902 96.4 198 Muslim 58.8 15.7 74.4 80.8 394 71.6 69.5 302 81.2 73 Christian 41.4 19.0 60.4 71.8 983 60.3 57.9 715 75.9 220 Other 72.9 22.7 95.6 96.6 446 86.2 84.7 406 95.6 90
Caste/tribe Scheduled caste 67.5 16.9 84.4 87.8 217 80.3 78.8 183 (86.3) 35 Scheduled tribe 41.5 17.7 59.2 71.0 953 59.1 56.7 691 75.0 210 Other backward class 70.4 18.8 89.2 94.0 432 80.1 78.0 368 94.2 86 Other 67.7 24.0 91.8 93.5 1,227 87.2 85.5 1,070 93.8 248
Place of delivery Public health facility 100.0 0.0 100.0 99.9 1,687 89.2 87.2 1,420 100.0 332 Private health facility4 0.0 100.0 100.0 99.6 583 91.4 90.9 500 100.0 142 Home na na na 28.9 568 17.2 13.9 400 27.9 108
Total 59.4 20.5 79.9 85.6 2,843 77.2 75.2 2,323 86.6 581
Note: Figures in parentheses are based on 25-49 unweighted cases. Total includes information on births to women who don’t know the number of antenatal care visits, their caste/ tribe and “others” place pf delivery, who are not shown separately. na = Not applicable 1 Health personnel includes doctor, auxiliary nurse midwife, nurse, midwife, lady health visitor, and other health personnel. If the respondent mentioned more than one person attending during delivery, only the most qualified person is considered in this table. 2 For the most recent birth in the 5 years preceding the survey 3 Postnatal checks are checks on the woman's health within 42 days of the birth 4 Includes nongovernmental organizations or trust hospitals/clinics
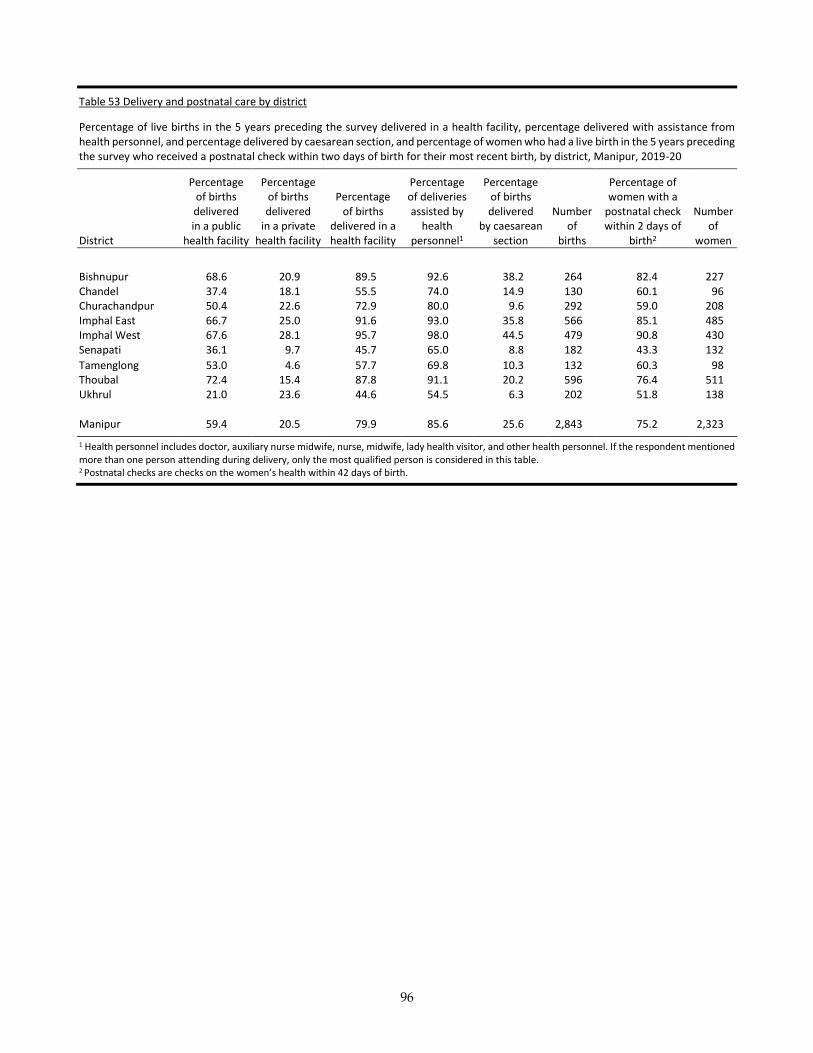
96
Table 53 Delivery and postnatal care by district
Percentage of live births in the 5 years preceding the survey delivered in a health facility, percentage delivered with assistance from health personnel, and percentage delivered by caesarean section, and percentage of women who had a live birth in the 5 years preceding the survey who received a postnatal check within two days of birth for their most recent birth, by district, Manipur, 2019-20
District
Percentage of births delivered in a public
health facility
Percentage of births delivered
in a private health facility
Percentage of births
delivered in a health facility
Percentage of deliveries assisted by
health personnel1
Percentage of births delivered
by caesarean section
Number of
births
Percentage of women with a
postnatal check within 2 days of
birth2
Number of
women
Bishnupur 68.6 20.9 89.5 92.6 38.2 264 82.4 227 Chandel 37.4 18.1 55.5 74.0 14.9 130 60.1 96 Churachandpur 50.4 22.6 72.9 80.0 9.6 292 59.0 208 Imphal East 66.7 25.0 91.6 93.0 35.8 566 85.1 485 Imphal West 67.6 28.1 95.7 98.0 44.5 479 90.8 430 Senapati 36.1 9.7 45.7 65.0 8.8 182 43.3 132
Tamenglong 53.0 4.6 57.7 69.8 10.3 132 60.3 98 Thoubal 72.4 15.4 87.8 91.1 20.2 596 76.4 511 Ukhrul 21.0 23.6 44.6 54.5 6.3 202 51.8 138 Manipur 59.4 20.5 79.9 85.6 25.6 2,843 75.2 2,323
1 Health personnel includes doctor, auxiliary nurse midwife, nurse, midwife, lady health visitor, and other health personnel. If the respondent mentioned more than one person attending during delivery, only the most qualified person is considered in this table. 2 Postnatal checks are checks on the women’s health within 42 days of birth.
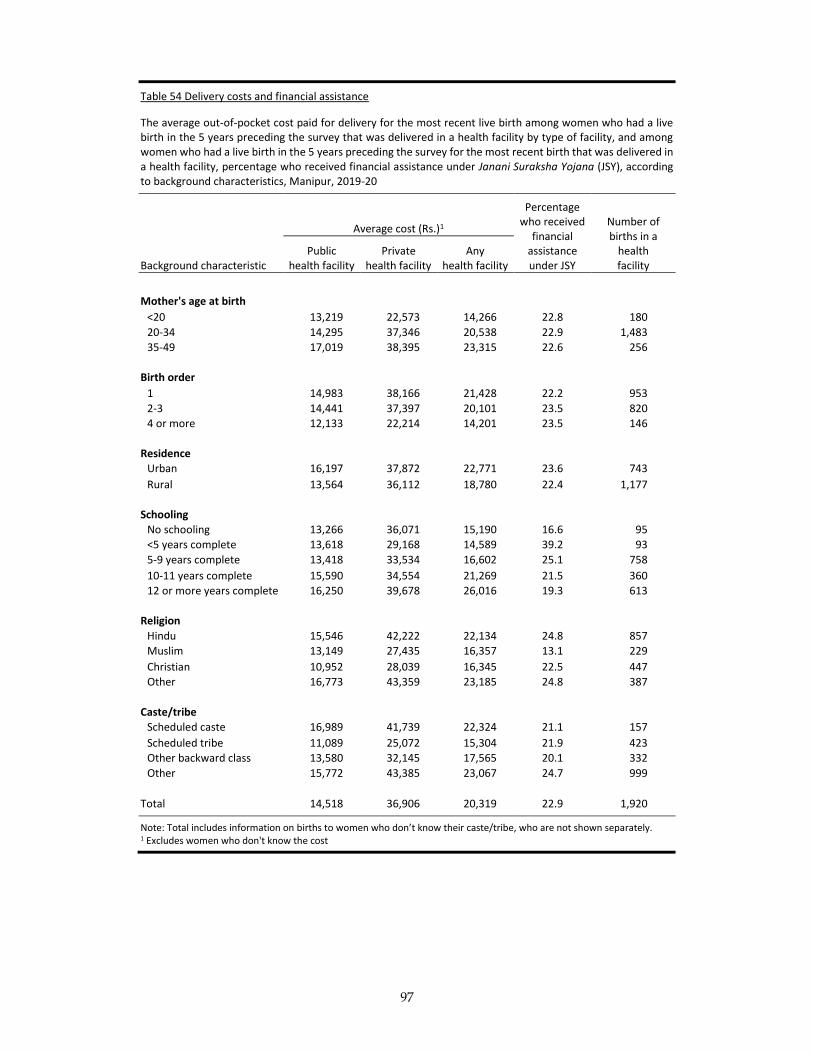
97
Table 54 Delivery costs and financial assistance
The average out-of-pocket cost paid for delivery for the most recent live birth among women who had a live birth in the 5 years preceding the survey that was delivered in a health facility by type of facility, and among women who had a live birth in the 5 years preceding the survey for the most recent birth that was delivered in a health facility, percentage who received financial assistance under Janani Suraksha Yojana (JSY), according to background characteristics, Manipur, 2019-20
Background characteristic
Average cost (Rs.)1
Percentage who received
financial assistance under JSY
Number of births in a
health facility
Public health facility
Private health facility
Any health facility
Mother's age at birth
<20 13,219 22,573 14,266 22.8 180
20-34 14,295 37,346 20,538 22.9 1,483
35-49 17,019 38,395 23,315 22.6 256
Birth order
1 14,983 38,166 21,428 22.2 953
2-3 14,441 37,397 20,101 23.5 820
4 or more 12,133 22,214 14,201 23.5 146
Residence
Urban 16,197 37,872 22,771 23.6 743
Rural 13,564 36,112 18,780 22.4 1,177
Schooling
No schooling 13,266 36,071 15,190 16.6 95
<5 years complete 13,618 29,168 14,589 39.2 93
5-9 years complete 13,418 33,534 16,602 25.1 758
10-11 years complete 15,590 34,554 21,269 21.5 360
12 or more years complete 16,250 39,678 26,016 19.3 613
Religion
Hindu 15,546 42,222 22,134 24.8 857
Muslim 13,149 27,435 16,357 13.1 229
Christian 10,952 28,039 16,345 22.5 447
Other 16,773 43,359 23,185 24.8 387
Caste/tribe
Scheduled caste 16,989 41,739 22,324 21.1 157
Scheduled tribe 11,089 25,072 15,304 21.9 423
Other backward class 13,580 32,145 17,565 20.1 332
Other 15,772 43,385 23,067 24.7 999
Total 14,518 36,906 20,319 22.9 1,920
Note: Total includes information on births to women who don’t know their caste/tribe, who are not shown separately. 1 Excludes women who don't know the cost
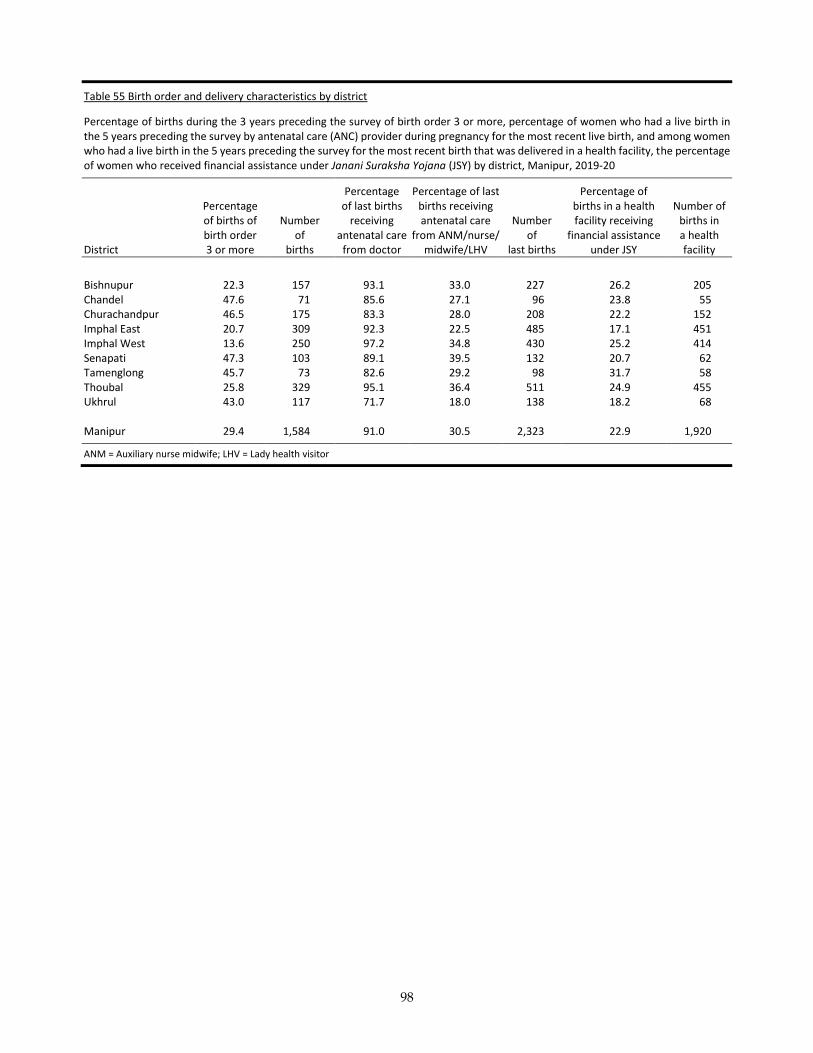
98
Table 55 Birth order and delivery characteristics by district
Percentage of births during the 3 years preceding the survey of birth order 3 or more, percentage of women who had a live birth in the 5 years preceding the survey by antenatal care (ANC) provider during pregnancy for the most recent live birth, and among women who had a live birth in the 5 years preceding the survey for the most recent birth that was delivered in a health facility, the percentage of women who received financial assistance under Janani Suraksha Yojana (JSY) by district, Manipur, 2019-20
District
Percentage of births of birth order 3 or more
Number of
births
Percentage of last births
receiving antenatal care
from doctor
Percentage of last births receiving antenatal care
from ANM/nurse/ midwife/LHV
Number of
last births
Percentage of births in a health facility receiving
financial assistance under JSY
Number of births in a health facility
Bishnupur 22.3 157 93.1 33.0 227 26.2 205 Chandel 47.6 71 85.6 27.1 96 23.8 55 Churachandpur 46.5 175 83.3 28.0 208 22.2 152 Imphal East 20.7 309 92.3 22.5 485 17.1 451 Imphal West 13.6 250 97.2 34.8 430 25.2 414 Senapati 47.3 103 89.1 39.5 132 20.7 62 Tamenglong 45.7 73 82.6 29.2 98 31.7 58 Thoubal 25.8 329 95.1 36.4 511 24.9 455 Ukhrul 43.0 117 71.7 18.0 138 18.2 68 Manipur 29.4 1,584 91.0 30.5 2,323 22.9 1,920
ANM = Auxiliary nurse midwife; LHV = Lady health visitor

99
Table 56 Timing of first health check after birth for the newborn
Percent distribution of last births in the 5 years preceding the survey by time after birth of first health check, and the percentage of births with a health check in the first two days after birth, according to background characteristics, Manipur, 2019-20
Background characteristic
Time between delivery and newborn's first postnatal health check No
postnatal health check1 Total
Percentage of births with a
health check in the first two
days after birth
Number of
births Less than
1 hour 1-3
hours 4-23
hours 1-2
days 3-6
days
Mother's age at birth
<20 15.6 42.3 5.9 8.2 0.3 25.4 100.0 71.9 224 20-34 18.7 38.3 7.0 6.4 0.5 25.7 100.0 70.3 1,799 35-49 16.8 44.4 6.6 7.8 0.1 21.1 100.0 75.7 301
Birth order 1 20.5 44.9 6.3 6.4 0.4 16.8 100.0 78.1 826 2-3 18.0 40.0 7.0 8.1 0.5 23.9 100.0 73.2 1,166 4-5 12.5 25.8 8.1 2.4 0.2 47.8 100.0 48.9 271 6 or more 13.6 15.7 2.7 3.1 1.4 59.9 100.0 35.1 60
Place of delivery Public health facility 19.1 47.6 8.7 8.2 0.4 12.8 100.0 83.7 1,420 Private health facility2 26.6 46.7 7.0 6.8 0.0 6.6 100.0 87.2 500 Home 4.1 1.8 0.0 1.6 1.1 91.3 100.0 7.4 400
Residence Urban 21.0 45.0 9.6 7.2 0.2 11.7 100.0 82.8 793 Rural 16.6 36.6 5.4 6.5 0.6 32.0 100.0 65.1 1,531
Religion Hindu 18.6 45.1 8.3 9.9 0.6 12.8 100.0 82.0 902 Muslim 21.0 30.0 8.1 7.3 0.0 31.6 100.0 66.4 302 Christian 12.7 33.8 4.4 3.2 0.7 42.8 100.0 54.0 715 Other 24.5 43.9 6.7 5.7 0.2 16.3 100.0 80.8 406
Caste/tribe Scheduled caste 20.6 44.4 3.3 5.8 0.0 21.4 100.0 74.0 183 Scheduled tribe 12.9 32.7 4.4 3.0 0.6 43.8 100.0 52.9 691 Other backward class 19.5 33.4 12.6 9.3 0.0 21.6 100.0 74.8 368 Other 20.7 45.1 7.0 8.5 0.6 14.8 100.0 81.3 1,070
Mother's schooling No schooling 9.1 31.4 2.7 2.9 2.0 46.7 100.0 46.1 167 <5 years complete 14.9 22.4 11.1 6.5 0.9 43.1 100.0 55.0 149 5-9 years complete 16.2 39.8 5.7 7.1 0.5 28.9 100.0 68.7 946 10-11 years complete 20.5 39.2 9.2 6.8 0.2 20.8 100.0 75.6 411 12 or more years complete 22.5 45.2 7.0 7.3 0.1 12.5 100.0 82.0 651
Total 18.1 39.5 6.8 6.7 0.5 25.1 100.0 71.2 2,323
Note: Total includes information on births delivered at “other” place, and who don’t know their caste/ tribe, who are not shown separately. 1 Includes newborns who received a health check after the first week 2 Includes nongovernmental organization or trust hospital/clinic
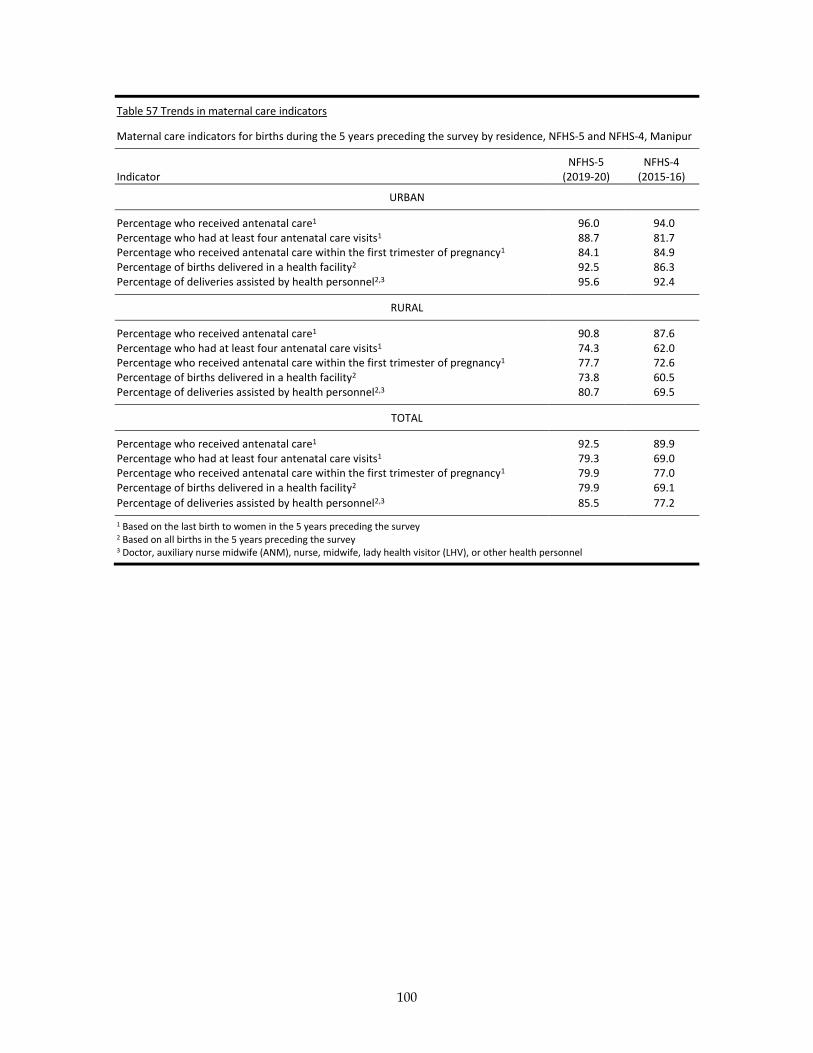
100
Table 57 Trends in maternal care indicators
Maternal care indicators for births during the 5 years preceding the survey by residence, NFHS-5 and NFHS-4, Manipur
Indicator NFHS-5
(2019-20) NFHS-4
(2015-16)
URBAN
Percentage who received antenatal care1 96.0 94.0 Percentage who had at least four antenatal care visits1 88.7 81.7 Percentage who received antenatal care within the first trimester of pregnancy1 84.1 84.9 Percentage of births delivered in a health facility2 92.5 86.3 Percentage of deliveries assisted by health personnel2,3 95.6 92.4
RURAL
Percentage who received antenatal care1 90.8 87.6 Percentage who had at least four antenatal care visits1 74.3 62.0 Percentage who received antenatal care within the first trimester of pregnancy1 77.7 72.6 Percentage of births delivered in a health facility2 73.8 60.5 Percentage of deliveries assisted by health personnel2,3 80.7 69.5
TOTAL
Percentage who received antenatal care1 92.5 89.9 Percentage who had at least four antenatal care visits1 79.3 69.0 Percentage who received antenatal care within the first trimester of pregnancy1 79.9 77.0 Percentage of births delivered in a health facility2 79.9 69.1
Percentage of deliveries assisted by health personnel2,3 85.5 77.2
1 Based on the last birth to women in the 5 years preceding the survey 2 Based on all births in the 5 years preceding the survey 3 Doctor, auxiliary nurse midwife (ANM), nurse, midwife, lady health visitor (LHV), or other health personnel
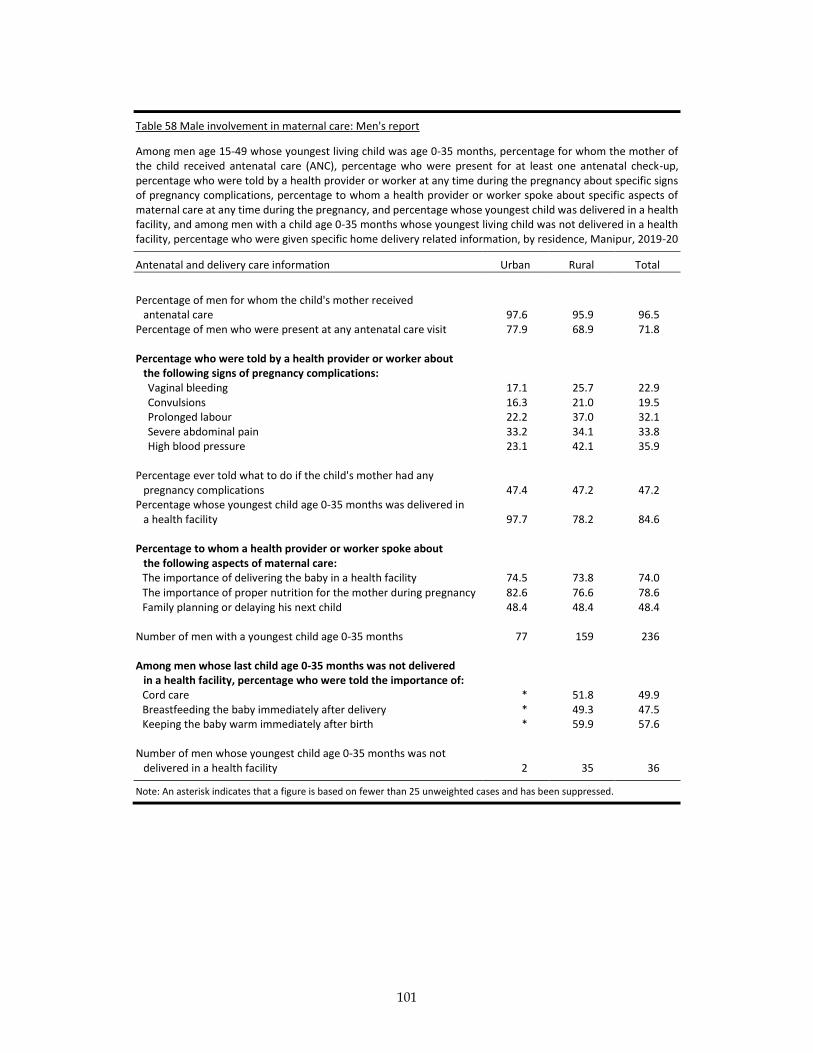
101
Table 58 Male involvement in maternal care: Men's report
Among men age 15-49 whose youngest living child was age 0-35 months, percentage for whom the mother of the child received antenatal care (ANC), percentage who were present for at least one antenatal check-up, percentage who were told by a health provider or worker at any time during the pregnancy about specific signs of pregnancy complications, percentage to whom a health provider or worker spoke about specific aspects of maternal care at any time during the pregnancy, and percentage whose youngest child was delivered in a health facility, and among men with a child age 0-35 months whose youngest living child was not delivered in a health facility, percentage who were given specific home delivery related information, by residence, Manipur, 2019-20
Antenatal and delivery care information Urban Rural Total
Percentage of men for whom the child's mother received
antenatal care 97.6 95.9 96.5 Percentage of men who were present at any antenatal care visit 77.9 68.9 71.8 Percentage who were told by a health provider or worker about
the following signs of pregnancy complications: Vaginal bleeding 17.1 25.7 22.9 Convulsions 16.3 21.0 19.5 Prolonged labour 22.2 37.0 32.1 Severe abdominal pain 33.2 34.1 33.8 High blood pressure 23.1 42.1 35.9
Percentage ever told what to do if the child's mother had any pregnancy complications 47.4 47.2 47.2
Percentage whose youngest child age 0-35 months was delivered in a health facility 97.7 78.2 84.6
Percentage to whom a health provider or worker spoke about the following aspects of maternal care: The importance of delivering the baby in a health facility 74.5 73.8 74.0 The importance of proper nutrition for the mother during pregnancy 82.6 76.6 78.6 Family planning or delaying his next child 48.4 48.4 48.4
Number of men with a youngest child age 0-35 months 77 159 236
Among men whose last child age 0-35 months was not delivered in a health facility, percentage who were told the importance of: Cord care * 51.8 49.9 Breastfeeding the baby immediately after delivery * 49.3 47.5 Keeping the baby warm immediately after birth * 59.9 57.6
Number of men whose youngest child age 0-35 months was not delivered in a health facility 2 35 36
Note: An asterisk indicates that a figure is based on fewer than 25 unweighted cases and has been suppressed.
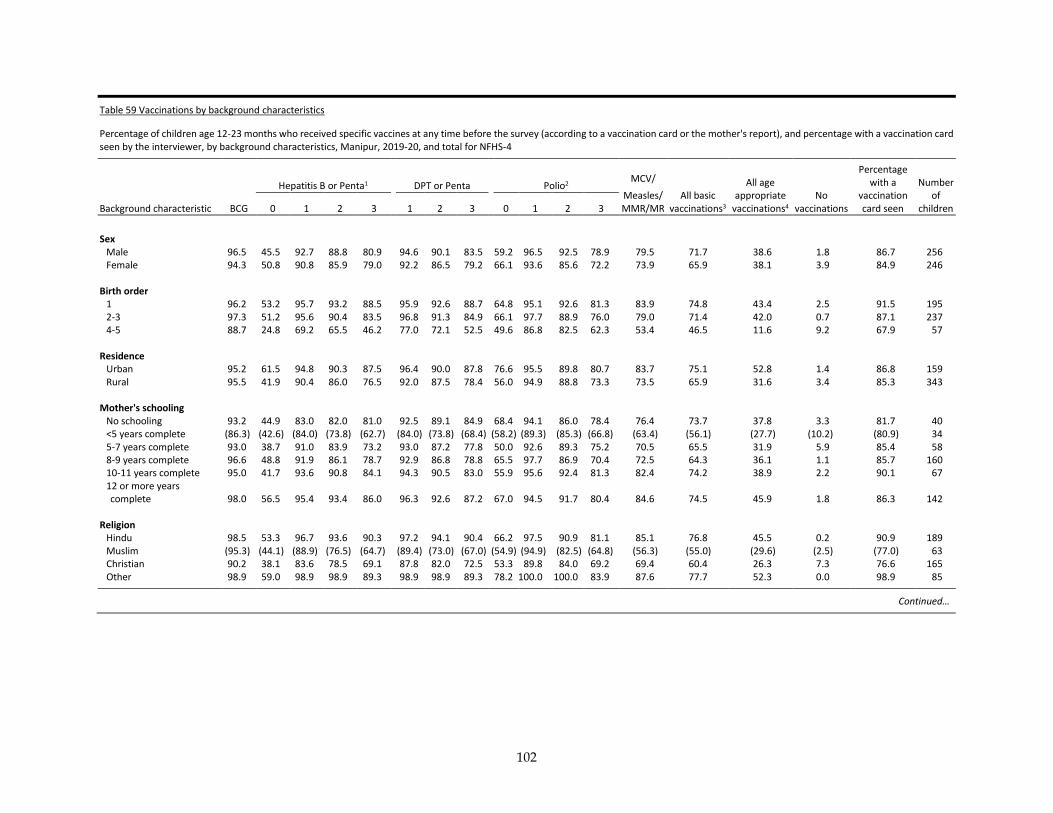
102
Table 59 Vaccinations by background characteristics
Percentage of children age 12-23 months who received specific vaccines at any time before the survey (according to a vaccination card or the mother's report), and percentage with a vaccination card seen by the interviewer, by background characteristics, Manipur, 2019-20, and total for NFHS-4
Background characteristic BCG
Hepatitis B or Penta1 DPT or Penta Polio2 MCV/
Measles/ MMR/MR
All basic vaccinations3
All age appropriate
vaccinations4 No
vaccinations
Percentage with a
vaccination card seen
Number of
children 0 1 2 3 1 2 3 0 1 2 3
Sex
Male 96.5 45.5 92.7 88.8 80.9 94.6 90.1 83.5 59.2 96.5 92.5 78.9 79.5 71.7 38.6 1.8 86.7 256 Female 94.3 50.8 90.8 85.9 79.0 92.2 86.5 79.2 66.1 93.6 85.6 72.2 73.9 65.9 38.1 3.9 84.9 246
Birth order 1 96.2 53.2 95.7 93.2 88.5 95.9 92.6 88.7 64.8 95.1 92.6 81.3 83.9 74.8 43.4 2.5 91.5 195 2-3 97.3 51.2 95.6 90.4 83.5 96.8 91.3 84.9 66.1 97.7 88.9 76.0 79.0 71.4 42.0 0.7 87.1 237 4-5 88.7 24.8 69.2 65.5 46.2 77.0 72.1 52.5 49.6 86.8 82.5 62.3 53.4 46.5 11.6 9.2 67.9 57
Residence Urban 95.2 61.5 94.8 90.3 87.5 96.4 90.0 87.8 76.6 95.5 89.8 80.7 83.7 75.1 52.8 1.4 86.8 159 Rural 95.5 41.9 90.4 86.0 76.5 92.0 87.5 78.4 56.0 94.9 88.8 73.3 73.5 65.9 31.6 3.4 85.3 343
Mother's schooling No schooling 93.2 44.9 83.0 82.0 81.0 92.5 89.1 84.9 68.4 94.1 86.0 78.4 76.4 73.7 37.8 3.3 81.7 40 <5 years complete (86.3) (42.6) (84.0) (73.8) (62.7) (84.0) (73.8) (68.4) (58.2) (89.3) (85.3) (66.8) (63.4) (56.1) (27.7) (10.2) (80.9) 34 5-7 years complete 93.0 38.7 91.0 83.9 73.2 93.0 87.2 77.8 50.0 92.6 89.3 75.2 70.5 65.5 31.9 5.9 85.4 58 8-9 years complete 96.6 48.8 91.9 86.1 78.7 92.9 86.8 78.8 65.5 97.7 86.9 70.4 72.5 64.3 36.1 1.1 85.7 160 10-11 years complete 95.0 41.7 93.6 90.8 84.1 94.3 90.5 83.0 55.9 95.6 92.4 81.3 82.4 74.2 38.9 2.2 90.1 67 12 or more years complete 98.0 56.5 95.4 93.4 86.0 96.3 92.6 87.2 67.0 94.5 91.7 80.4 84.6 74.5 45.9 1.8 86.3 142
Religion
Hindu 98.5 53.3 96.7 93.6 90.3 97.2 94.1 90.4 66.2 97.5 90.9 81.1 85.1 76.8 45.5 0.2 90.9 189 Muslim (95.3) (44.1) (88.9) (76.5) (64.7) (89.4) (73.0) (67.0) (54.9) (94.9) (82.5) (64.8) (56.3) (55.0) (29.6) (2.5) (77.0) 63 Christian 90.2 38.1 83.6 78.5 69.1 87.8 82.0 72.5 53.3 89.8 84.0 69.2 69.4 60.4 26.3 7.3 76.6 165 Other 98.9 59.0 98.9 98.9 89.3 98.9 98.9 89.3 78.2 100.0 100.0 83.9 87.6 77.7 52.3 0.0 98.9 85
Continued…
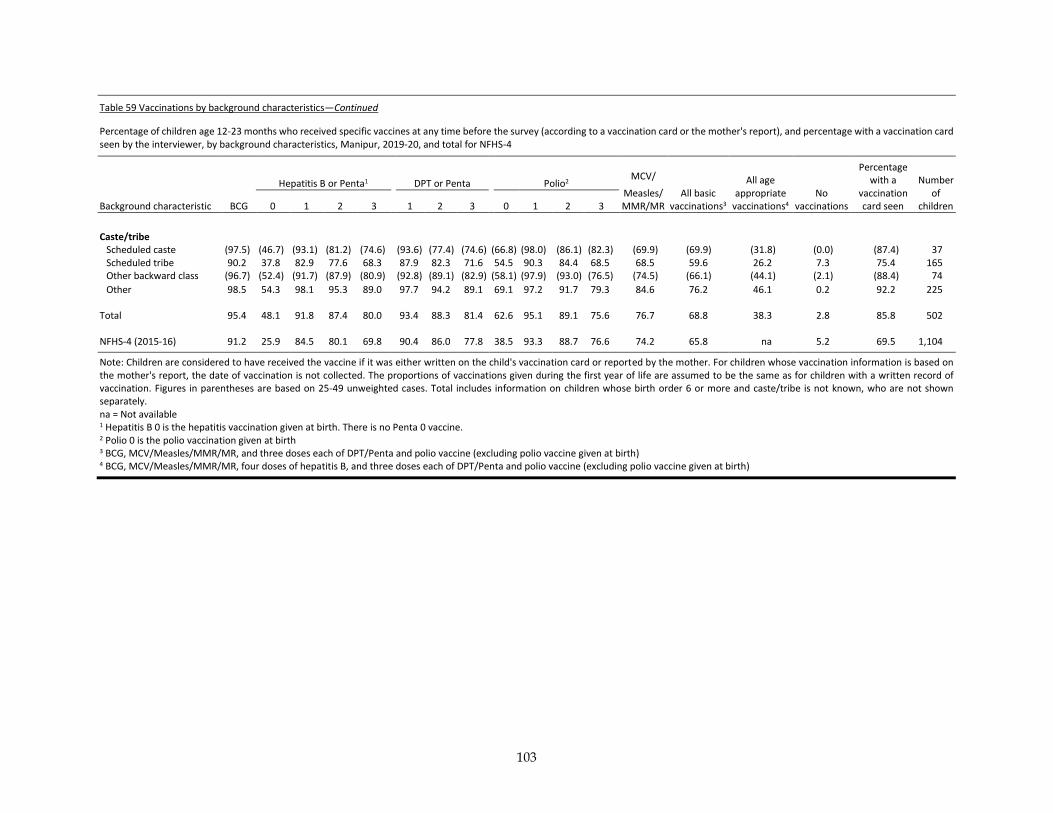
103
Table 59 Vaccinations by background characteristics—Continued
Percentage of children age 12-23 months who received specific vaccines at any time before the survey (according to a vaccination card or the mother's report), and percentage with a vaccination card seen by the interviewer, by background characteristics, Manipur, 2019-20, and total for NFHS-4
Background characteristic BCG
Hepatitis B or Penta1 DPT or Penta Polio2 MCV/
Measles/ MMR/MR
All basic vaccinations3
All age appropriate
vaccinations4 No
vaccinations
Percentage with a
vaccination card seen
Number of
children 0 1 2 3 1 2 3 0 1 2 3
Caste/tribe
Scheduled caste (97.5) (46.7) (93.1) (81.2) (74.6) (93.6) (77.4) (74.6) (66.8) (98.0) (86.1) (82.3) (69.9) (69.9) (31.8) (0.0) (87.4) 37 Scheduled tribe 90.2 37.8 82.9 77.6 68.3 87.9 82.3 71.6 54.5 90.3 84.4 68.5 68.5 59.6 26.2 7.3 75.4 165 Other backward class (96.7) (52.4) (91.7) (87.9) (80.9) (92.8) (89.1) (82.9) (58.1) (97.9) (93.0) (76.5) (74.5) (66.1) (44.1) (2.1) (88.4) 74
Other 98.5 54.3 98.1 95.3 89.0 97.7 94.2 89.1 69.1 97.2 91.7 79.3 84.6 76.2 46.1 0.2 92.2 225
Total 95.4 48.1 91.8 87.4 80.0 93.4 88.3 81.4 62.6 95.1 89.1 75.6 76.7 68.8 38.3 2.8 85.8 502 NFHS-4 (2015-16) 91.2 25.9 84.5 80.1 69.8 90.4 86.0 77.8 38.5 93.3 88.7 76.6 74.2 65.8 na 5.2 69.5 1,104
Note: Children are considered to have received the vaccine if it was either written on the child's vaccination card or reported by the mother. For children whose vaccination information is based on the mother's report, the date of vaccination is not collected. The proportions of vaccinations given during the first year of life are assumed to be the same as for children with a written record of vaccination. Figures in parentheses are based on 25-49 unweighted cases. Total includes information on children whose birth order 6 or more and caste/tribe is not known, who are not shown separately. na = Not available 1 Hepatitis B 0 is the hepatitis vaccination given at birth. There is no Penta 0 vaccine. 2 Polio 0 is the polio vaccination given at birth 3 BCG, MCV/Measles/MMR/MR, and three doses each of DPT/Penta and polio vaccine (excluding polio vaccine given at birth) 4 BCG, MCV/Measles/MMR/MR, four doses of hepatitis B, and three doses each of DPT/Penta and polio vaccine (excluding polio vaccine given at birth)
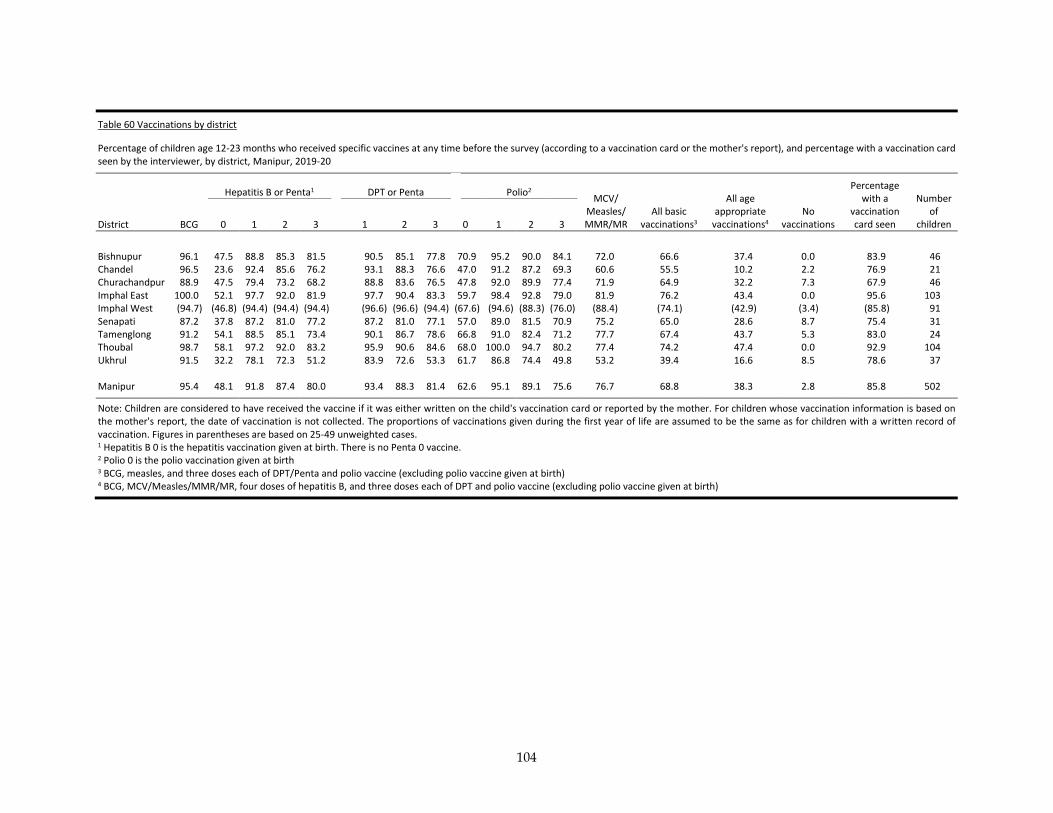
104
Table 60 Vaccinations by district
Percentage of children age 12-23 months who received specific vaccines at any time before the survey (according to a vaccination card or the mother's report), and percentage with a vaccination card seen by the interviewer, by district, Manipur, 2019-20
District BCG
Hepatitis B or Penta1 DPT or Penta Polio2 MCV/
Measles/ MMR/MR
All basic vaccinations3
All age appropriate
vaccinations4 No
vaccinations
Percentage with a
vaccination card seen
Number of
children 0 1 2 3 1 2 3 0 1 2 3
Bishnupur 96.1 47.5 88.8 85.3 81.5 90.5 85.1 77.8 70.9 95.2 90.0 84.1 72.0 66.6 37.4 0.0 83.9 46 Chandel 96.5 23.6 92.4 85.6 76.2 93.1 88.3 76.6 47.0 91.2 87.2 69.3 60.6 55.5 10.2 2.2 76.9 21 Churachandpur 88.9 47.5 79.4 73.2 68.2 88.8 83.6 76.5 47.8 92.0 89.9 77.4 71.9 64.9 32.2 7.3 67.9 46 Imphal East 100.0 52.1 97.7 92.0 81.9 97.7 90.4 83.3 59.7 98.4 92.8 79.0 81.9 76.2 43.4 0.0 95.6 103 Imphal West (94.7) (46.8) (94.4) (94.4) (94.4) (96.6) (96.6) (94.4) (67.6) (94.6) (88.3) (76.0) (88.4) (74.1) (42.9) (3.4) (85.8) 91 Senapati 87.2 37.8 87.2 81.0 77.2 87.2 81.0 77.1 57.0 89.0 81.5 70.9 75.2 65.0 28.6 8.7 75.4 31 Tamenglong 91.2 54.1 88.5 85.1 73.4 90.1 86.7 78.6 66.8 91.0 82.4 71.2 77.7 67.4 43.7 5.3 83.0 24 Thoubal 98.7 58.1 97.2 92.0 83.2 95.9 90.6 84.6 68.0 100.0 94.7 80.2 77.4 74.2 47.4 0.0 92.9 104 Ukhrul 91.5 32.2 78.1 72.3 51.2 83.9 72.6 53.3 61.7 86.8 74.4 49.8 53.2 39.4 16.6 8.5 78.6 37 Manipur 95.4 48.1 91.8 87.4 80.0 93.4 88.3 81.4 62.6 95.1 89.1 75.6 76.7 68.8 38.3 2.8 85.8 502
Note: Children are considered to have received the vaccine if it was either written on the child's vaccination card or reported by the mother. For children whose vaccination information is based on the mother's report, the date of vaccination is not collected. The proportions of vaccinations given during the first year of life are assumed to be the same as for children with a written record of vaccination. Figures in parentheses are based on 25-49 unweighted cases. 1 Hepatitis B 0 is the hepatitis vaccination given at birth. There is no Penta 0 vaccine. 2 Polio 0 is the polio vaccination given at birth 3 BCG, measles, and three doses each of DPT/Penta and polio vaccine (excluding polio vaccine given at birth) 4 BCG, MCV/Measles/MMR/MR, four doses of hepatitis B, and three doses each of DPT and polio vaccine (excluding polio vaccine given at birth)
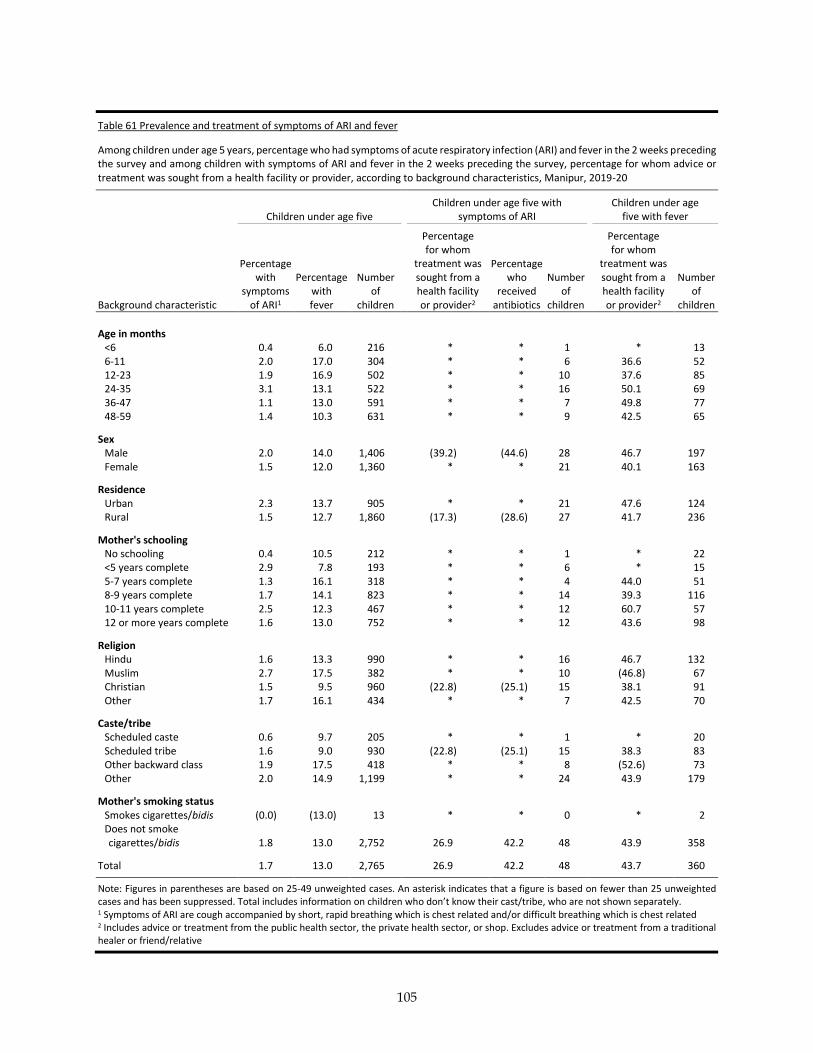
105
Table 61 Prevalence and treatment of symptoms of ARI and fever
Among children under age 5 years, percentage who had symptoms of acute respiratory infection (ARI) and fever in the 2 weeks preceding the survey and among children with symptoms of ARI and fever in the 2 weeks preceding the survey, percentage for whom advice or treatment was sought from a health facility or provider, according to background characteristics, Manipur, 2019-20
Children under age five
Children under age five with symptoms of ARI
Children under age five with fever
Background characteristic
Percentage with
symptoms of ARI1
Percentage with fever
Number of
children
Percentage for whom
treatment was sought from a health facility or provider2
Percentage who
received antibiotics
Number of
children
Percentage for whom
treatment was sought from a health facility or provider2
Number of
children
Age in months <6 0.4 6.0 216 * * 1 * 13 6-11 2.0 17.0 304 * * 6 36.6 52 12-23 1.9 16.9 502 * * 10 37.6 85 24-35 3.1 13.1 522 * * 16 50.1 69 36-47 1.1 13.0 591 * * 7 49.8 77 48-59 1.4 10.3 631 * * 9 42.5 65
Sex Male 2.0 14.0 1,406 (39.2) (44.6) 28 46.7 197 Female 1.5 12.0 1,360 * * 21 40.1 163
Residence Urban 2.3 13.7 905 * * 21 47.6 124 Rural 1.5 12.7 1,860 (17.3) (28.6) 27 41.7 236
Mother's schooling No schooling 0.4 10.5 212 * * 1 * 22 <5 years complete 2.9 7.8 193 * * 6 * 15 5-7 years complete 1.3 16.1 318 * * 4 44.0 51 8-9 years complete 1.7 14.1 823 * * 14 39.3 116 10-11 years complete 2.5 12.3 467 * * 12 60.7 57 12 or more years complete 1.6 13.0 752 * * 12 43.6 98
Religion Hindu 1.6 13.3 990 * * 16 46.7 132 Muslim 2.7 17.5 382 * * 10 (46.8) 67 Christian 1.5 9.5 960 (22.8) (25.1) 15 38.1 91 Other 1.7 16.1 434 * * 7 42.5 70
Caste/tribe Scheduled caste 0.6 9.7 205 * * 1 * 20 Scheduled tribe 1.6 9.0 930 (22.8) (25.1) 15 38.3 83 Other backward class 1.9 17.5 418 * * 8 (52.6) 73 Other 2.0 14.9 1,199 * * 24 43.9 179
Mother's smoking status Smokes cigarettes/bidis (0.0) (13.0) 13 * * 0 * 2 Does not smoke cigarettes/bidis 1.8 13.0 2,752 26.9 42.2 48 43.9 358
Total 1.7 13.0 2,765 26.9 42.2 48 43.7 360
Note: Figures in parentheses are based on 25-49 unweighted cases. An asterisk indicates that a figure is based on fewer than 25 unweighted cases and has been suppressed. Total includes information on children who don’t know their cast/tribe, who are not shown separately. 1 Symptoms of ARI are cough accompanied by short, rapid breathing which is chest related and/or difficult breathing which is chest related 2 Includes advice or treatment from the public health sector, the private health sector, or shop. Excludes advice or treatment from a traditional healer or friend/relative
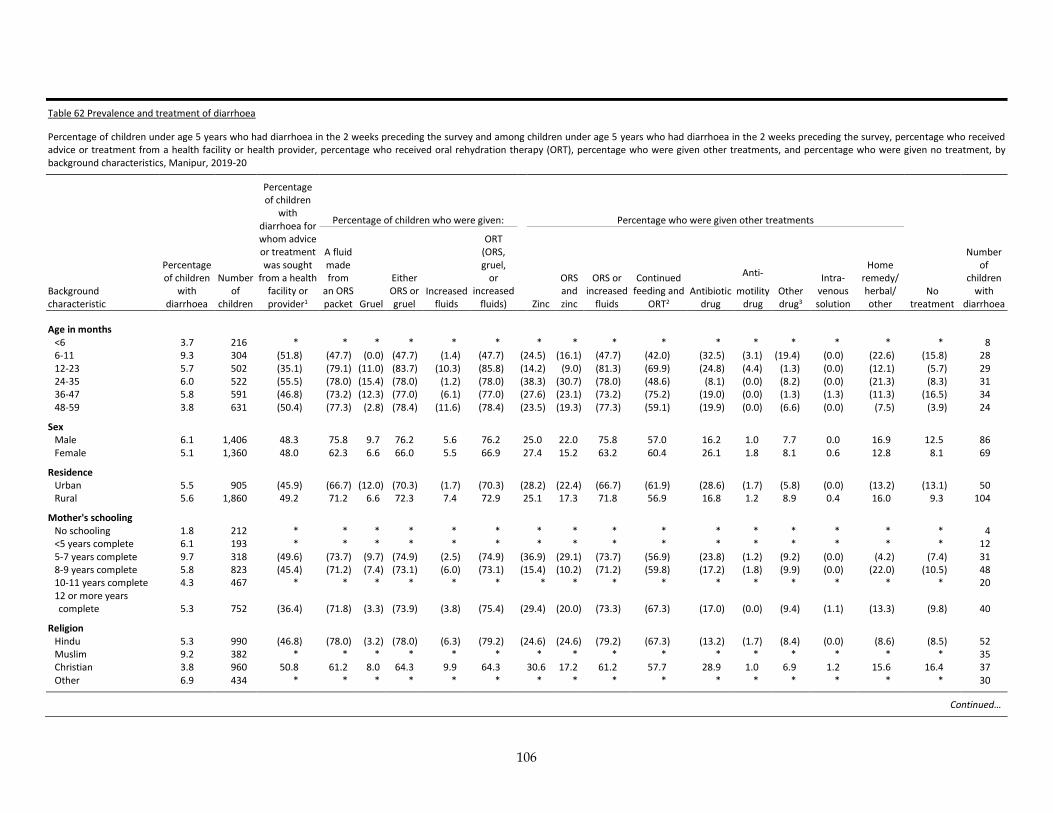
106
Table 62 Prevalence and treatment of diarrhoea
Percentage of children under age 5 years who had diarrhoea in the 2 weeks preceding the survey and among children under age 5 years who had diarrhoea in the 2 weeks preceding the survey, percentage who received advice or treatment from a health facility or health provider, percentage who received oral rehydration therapy (ORT), percentage who were given other treatments, and percentage who were given no treatment, by background characteristics, Manipur, 2019-20
Background characteristic
Percentage of children
with diarrhoea
Number of
children
Percentage of children
with diarrhoea for whom advice or treatment was sought
from a health facility or provider1
Percentage of children who were given: Percentage who were given other treatments
No treatment
Number of
children with
diarrhoea
A fluid made from
an ORS packet Gruel
Either ORS or gruel
Increased fluids
ORT (ORS, gruel,
or increased
fluids) Zinc
ORS and zinc
ORS or increased
fluids
Continued feeding and
ORT2 Antibiotic
drug
Anti-
motility drug
Other drug3
Intra-venous solution
Home remedy/ herbal/ other
Age in months <6 3.7 216 * * * * * * * * * * * * * * * * 8 6-11 9.3 304 (51.8) (47.7) (0.0) (47.7) (1.4) (47.7) (24.5) (16.1) (47.7) (42.0) (32.5) (3.1) (19.4) (0.0) (22.6) (15.8) 28 12-23 5.7 502 (35.1) (79.1) (11.0) (83.7) (10.3) (85.8) (14.2) (9.0) (81.3) (69.9) (24.8) (4.4) (1.3) (0.0) (12.1) (5.7) 29 24-35 6.0 522 (55.5) (78.0) (15.4) (78.0) (1.2) (78.0) (38.3) (30.7) (78.0) (48.6) (8.1) (0.0) (8.2) (0.0) (21.3) (8.3) 31 36-47 5.8 591 (46.8) (73.2) (12.3) (77.0) (6.1) (77.0) (27.6) (23.1) (73.2) (75.2) (19.0) (0.0) (1.3) (1.3) (11.3) (16.5) 34 48-59 3.8 631 (50.4) (77.3) (2.8) (78.4) (11.6) (78.4) (23.5) (19.3) (77.3) (59.1) (19.9) (0.0) (6.6) (0.0) (7.5) (3.9) 24
Sex Male 6.1 1,406 48.3 75.8 9.7 76.2 5.6 76.2 25.0 22.0 75.8 57.0 16.2 1.0 7.7 0.0 16.9 12.5 86 Female 5.1 1,360 48.0 62.3 6.6 66.0 5.5 66.9 27.4 15.2 63.2 60.4 26.1 1.8 8.1 0.6 12.8 8.1 69
Residence Urban 5.5 905 (45.9) (66.7) (12.0) (70.3) (1.7) (70.3) (28.2) (22.4) (66.7) (61.9) (28.6) (1.7) (5.8) (0.0) (13.2) (13.1) 50 Rural 5.6 1,860 49.2 71.2 6.6 72.3 7.4 72.9 25.1 17.3 71.8 56.9 16.8 1.2 8.9 0.4 16.0 9.3 104
Mother's schooling No schooling 1.8 212 * * * * * * * * * * * * * * * * 4 <5 years complete 6.1 193 * * * * * * * * * * * * * * * * 12 5-7 years complete 9.7 318 (49.6) (73.7) (9.7) (74.9) (2.5) (74.9) (36.9) (29.1) (73.7) (56.9) (23.8) (1.2) (9.2) (0.0) (4.2) (7.4) 31 8-9 years complete 5.8 823 (45.4) (71.2) (7.4) (73.1) (6.0) (73.1) (15.4) (10.2) (71.2) (59.8) (17.2) (1.8) (9.9) (0.0) (22.0) (10.5) 48 10-11 years complete 4.3 467 * * * * * * * * * * * * * * * * 20 12 or more years complete 5.3 752 (36.4) (71.8) (3.3) (73.9) (3.8) (75.4) (29.4) (20.0) (73.3) (67.3) (17.0) (0.0) (9.4) (1.1) (13.3) (9.8) 40
Religion Hindu 5.3 990 (46.8) (78.0) (3.2) (78.0) (6.3) (79.2) (24.6) (24.6) (79.2) (67.3) (13.2) (1.7) (8.4) (0.0) (8.6) (8.5) 52 Muslim 9.2 382 * * * * * * * * * * * * * * * * 35 Christian 3.8 960 50.8 61.2 8.0 64.3 9.9 64.3 30.6 17.2 61.2 57.7 28.9 1.0 6.9 1.2 15.6 16.4 37 Other 6.9 434 * * * * * * * * * * * * * * * * 30
Continued…
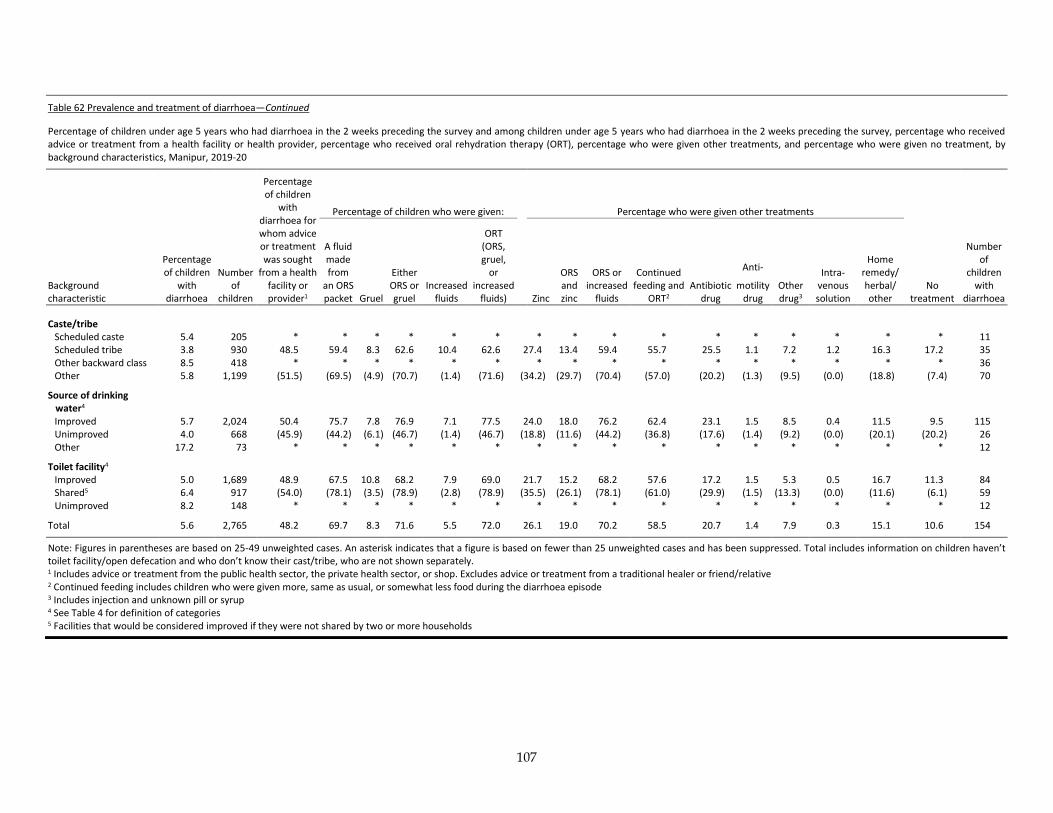
107
Table 62 Prevalence and treatment of diarrhoea—Continued
Percentage of children under age 5 years who had diarrhoea in the 2 weeks preceding the survey and among children under age 5 years who had diarrhoea in the 2 weeks preceding the survey, percentage who received advice or treatment from a health facility or health provider, percentage who received oral rehydration therapy (ORT), percentage who were given other treatments, and percentage who were given no treatment, by background characteristics, Manipur, 2019-20
Background characteristic
Percentage of children
with diarrhoea
Number of
children
Percentage of children
with diarrhoea for whom advice or treatment was sought
from a health facility or provider1
Percentage of children who were given: Percentage who were given other treatments
No treatment
Number of
children with
diarrhoea
A fluid made from
an ORS packet Gruel
Either ORS or gruel
Increased fluids
ORT (ORS, gruel,
or increased
fluids) Zinc
ORS and zinc
ORS or increased
fluids
Continued feeding and
ORT2 Antibiotic
drug
Anti-
motility drug
Other drug3
Intra-venous solution
Home remedy/ herbal/ other
Caste/tribe Scheduled caste 5.4 205 * * * * * * * * * * * * * * * * 11 Scheduled tribe 3.8 930 48.5 59.4 8.3 62.6 10.4 62.6 27.4 13.4 59.4 55.7 25.5 1.1 7.2 1.2 16.3 17.2 35 Other backward class 8.5 418 * * * * * * * * * * * * * * * * 36 Other 5.8 1,199 (51.5) (69.5) (4.9) (70.7) (1.4) (71.6) (34.2) (29.7) (70.4) (57.0) (20.2) (1.3) (9.5) (0.0) (18.8) (7.4) 70
Source of drinking water4 Improved 5.7 2,024 50.4 75.7 7.8 76.9 7.1 77.5 24.0 18.0 76.2 62.4 23.1 1.5 8.5 0.4 11.5 9.5 115 Unimproved 4.0 668 (45.9) (44.2) (6.1) (46.7) (1.4) (46.7) (18.8) (11.6) (44.2) (36.8) (17.6) (1.4) (9.2) (0.0) (20.1) (20.2) 26 Other 17.2 73 * * * * * * * * * * * * * * * * 12
Toilet facility4 Improved 5.0 1,689 48.9 67.5 10.8 68.2 7.9 69.0 21.7 15.2 68.2 57.6 17.2 1.5 5.3 0.5 16.7 11.3 84 Shared5 6.4 917 (54.0) (78.1) (3.5) (78.9) (2.8) (78.9) (35.5) (26.1) (78.1) (61.0) (29.9) (1.5) (13.3) (0.0) (11.6) (6.1) 59 Unimproved 8.2 148 * * * * * * * * * * * * * * * * 12
Total 5.6 2,765 48.2 69.7 8.3 71.6 5.5 72.0 26.1 19.0 70.2 58.5 20.7 1.4 7.9 0.3 15.1 10.6 154
Note: Figures in parentheses are based on 25-49 unweighted cases. An asterisk indicates that a figure is based on fewer than 25 unweighted cases and has been suppressed. Total includes information on children haven’t toilet facility/open defecation and who don’t know their cast/tribe, who are not shown separately. 1 Includes advice or treatment from the public health sector, the private health sector, or shop. Excludes advice or treatment from a traditional healer or friend/relative 2 Continued feeding includes children who were given more, same as usual, or somewhat less food during the diarrhoea episode 3 Includes injection and unknown pill or syrup 4 See Table 4 for definition of categories 5 Facilities that would be considered improved if they were not shared by two or more households

108
Table 63 Feeding practices during diarrhoea
Percent distribution of children under age 5 years who had diarrhoea in the 2 weeks preceding the survey by amount of liquids and food given compared with normal practice, according to background characteristics, Manipur, 2019-20
Amount of liquids given Amount of food given
Number of
children with
diarrhoea Background characteristic More
Same as usual
Somewhat less
Much less None
Don't know Total More
Same as usual
Somewhat less
Much less None
Never gave food
Don't know Total
Age in months
6-11 (1.4) (66.2) (25.7) (6.7) (0.0) (0.0) (100.0) (1.4) (39.0) (47.2) (6.7) (0.0) (5.8) (0.0) (100.0) 28 12-23 (10.3) (37.0) (41.3) (11.4) (0.0) (0.0) (100.0) (8.1) (22.8) (50.9) (18.1) (0.0) (0.0) (0.0) (100.0) 29 24-35 (1.2) (25.9) (42.8) (24.2) (6.0) (0.0) (100.0) (4.4) (25.3) (40.9) (29.4) (0.0) (0.0) (0.0) (100.0) 31 36-47 (6.1) (33.0) (54.3) (6.7) (0.0) (0.0) (100.0) (7.8) (29.0) (61.3) (1.9) (0.0) (0.0) (0.0) (100.0) 34 48-59 (11.6) (41.8) (40.0) (6.6) (0.0) (0.0) (100.0) (3.4) (39.7) (37.6) (12.8) (6.6) (0.0) (0.0) (100.0) 24
Sex Male 5.6 40.4 40.7 12.4 1.0 0.0 100.0 5.2 22.0 52.4 15.9 1.8 2.7 0.0 100.0 86 Female 5.5 39.8 43.6 9.3 1.9 0.0 100.0 4.6 41.7 43.2 9.3 0.0 1.3 0.0 100.0 69
Residence Urban (1.7) (40.2) (46.3) (11.7) (0.0) (0.0) (100.0) (6.2) (32.9) (52.5) (8.4) (0.0) (0.0) (0.0) (100.0) 50 Rural 7.4 40.1 39.9 10.6 2.0 0.0 100.0 4.3 29.7 46.3 15.1 1.5 3.1 0.0 100.0 104
Mother's schooling 5-7 years complete (2.5) (23.7) (59.0) (14.8) (0.0) (0.0) (100.0) (2.5) (21.0) (56.4) (14.8) (0.0) (5.3) (0.0) (100.0) 31 8-9 years complete (6.0) (42.6) (38.8) (12.7) (0.0) (0.0) (100.0) (1.8) (37.8) (41.8) (16.7) (0.0) (1.9) (0.0) (100.0) 48 12 or more years complete (3.8) (54.1) (37.1) (0.2) (4.7) (0.0) (100.0) (2.2) (43.3) (46.4) (8.1) (0.0) (0.0) (0.0) (100.0) 40
Religion
Hindu (6.3) (47.5) (39.2) (5.2) (1.6) (0.0) (100.0) (7.1) (37.7) (43.3) (11.9) (0.0) (0.0) (0.0) (100.0) 52 Christian 9.9 29.0 51.7 8.7 0.7 0.0 100.0 4.5 24.1 59.7 7.5 0.0 4.2 0.0 100.0 37
Caste/tribe Scheduled tribe 10.4 30.3 49.4 9.1 0.7 0.0 100.0 4.7 25.3 57.8 7.8 0.0 4.4 0.0 100.0 35 Other (1.4) (42.0) (46.9) (9.6) (0.0) (0.0) (100.0) (0.5) (37.9) (47.0) (12.3) (0.0) (2.3) (0.0) (100.0) 70
Total 5.5 40.1 42.0 11.0 1.4 0.0 100.0 4.9 30.8 48.3 12.9 1.0 2.1 0.0 100.0 154
Note: It is recommended that children should be given more liquids to drink during diarrhoea and food should not be reduced. Figures in parentheses are based on 25-49 unweighted cases. Total includes children age <6 months, children whose mothers have “no schooling, less than 5 years schooling & 10-11 years schooling”, Muslim & other religion children, and children belongs to scheduled caste, other backward class & who don’t know their caste/ tribe, who are not shown separately.
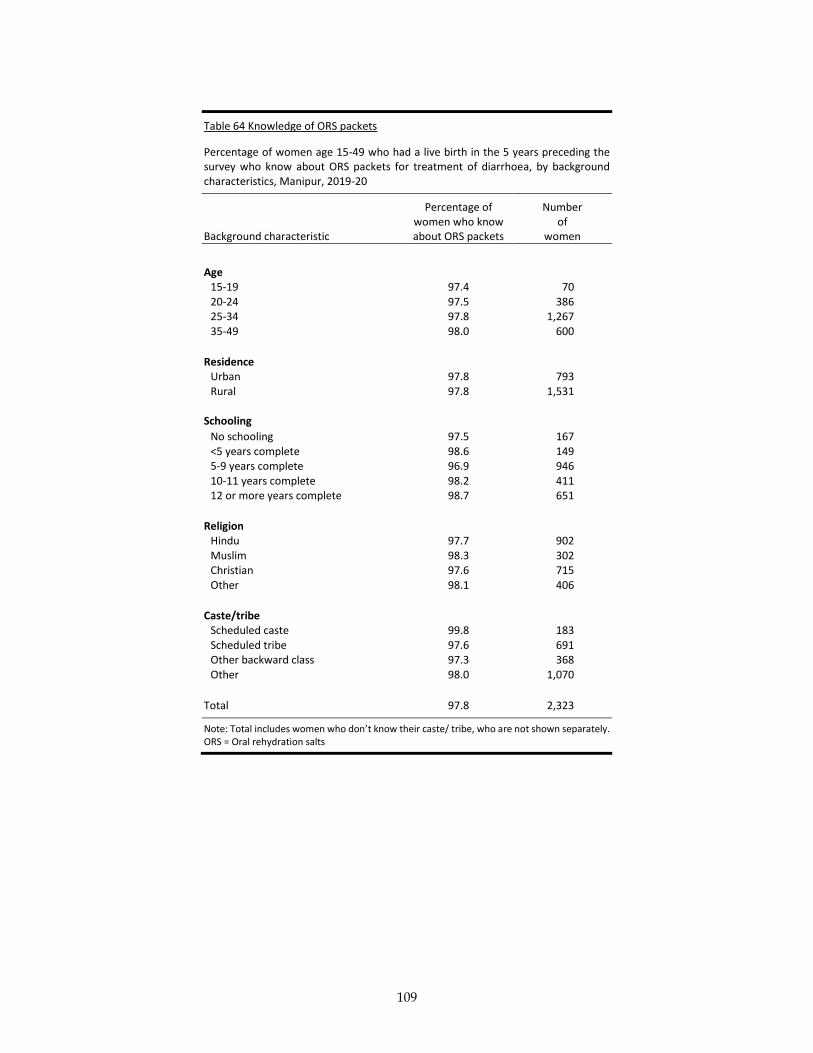
109
Table 64 Knowledge of ORS packets
Percentage of women age 15-49 who had a live birth in the 5 years preceding the survey who know about ORS packets for treatment of diarrhoea, by background characteristics, Manipur, 2019-20
Background characteristic
Percentage of women who know about ORS packets
Number of
women
Age
15-19 97.4 70 20-24 97.5 386 25-34 97.8 1,267 35-49 98.0 600
Residence
Urban 97.8 793 Rural 97.8 1,531
Schooling
No schooling 97.5 167 <5 years complete 98.6 149 5-9 years complete 96.9 946 10-11 years complete 98.2 411 12 or more years complete 98.7 651
Religion Hindu 97.7 902 Muslim 98.3 302 Christian 97.6 715 Other 98.1 406
Caste/tribe
Scheduled caste 99.8 183 Scheduled tribe 97.6 691 Other backward class 97.3 368 Other 98.0 1,070
Total 97.8 2,323
Note: Total includes women who don’t know their caste/ tribe, who are not shown separately. ORS = Oral rehydration salts
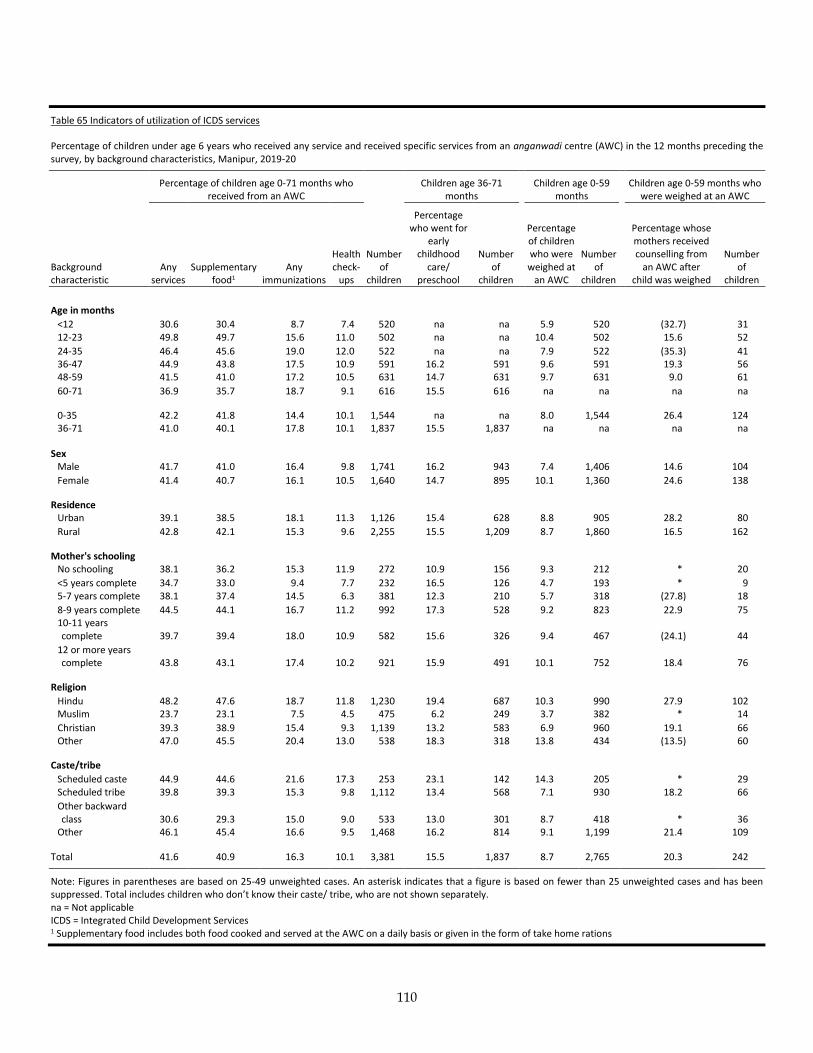
110
Table 65 Indicators of utilization of ICDS services
Percentage of children under age 6 years who received any service and received specific services from an anganwadi centre (AWC) in the 12 months preceding the survey, by background characteristics, Manipur, 2019-20
Percentage of children age 0-71 months who received from an AWC
Children age 36-71 months
Children age 0-59 months
Children age 0-59 months who were weighed at an AWC
Background characteristic
Any services
Supplementary food1
Any immunizations
Health check-
ups
Number of
children
Percentage who went for
early childhood
care/ preschool
Number of
children
Percentage of children who were weighed at
an AWC
Number of
children
Percentage whose mothers received counselling from
an AWC after child was weighed
Number of
children
Age in months
<12 30.6 30.4 8.7 7.4 520 na na 5.9 520 (32.7) 31 12-23 49.8 49.7 15.6 11.0 502 na na 10.4 502 15.6 52
24-35 46.4 45.6 19.0 12.0 522 na na 7.9 522 (35.3) 41 36-47 44.9 43.8 17.5 10.9 591 16.2 591 9.6 591 19.3 56 48-59 41.5 41.0 17.2 10.5 631 14.7 631 9.7 631 9.0 61
60-71 36.9 35.7 18.7 9.1 616 15.5 616 na na na na
0-35 42.2 41.8 14.4 10.1 1,544 na na 8.0 1,544 26.4 124 36-71 41.0 40.1 17.8 10.1 1,837 15.5 1,837 na na na na
Sex Male 41.7 41.0 16.4 9.8 1,741 16.2 943 7.4 1,406 14.6 104
Female 41.4 40.7 16.1 10.5 1,640 14.7 895 10.1 1,360 24.6 138
Residence Urban 39.1 38.5 18.1 11.3 1,126 15.4 628 8.8 905 28.2 80
Rural 42.8 42.1 15.3 9.6 2,255 15.5 1,209 8.7 1,860 16.5 162
Mother's schooling No schooling 38.1 36.2 15.3 11.9 272 10.9 156 9.3 212 * 20
<5 years complete 34.7 33.0 9.4 7.7 232 16.5 126 4.7 193 * 9 5-7 years complete 38.1 37.4 14.5 6.3 381 12.3 210 5.7 318 (27.8) 18
8-9 years complete 44.5 44.1 16.7 11.2 992 17.3 528 9.2 823 22.9 75 10-11 years complete 39.7 39.4 18.0 10.9 582 15.6 326 9.4 467 (24.1) 44
12 or more years complete 43.8 43.1 17.4 10.2 921 15.9 491 10.1 752 18.4 76
Religion
Hindu 48.2 47.6 18.7 11.8 1,230 19.4 687 10.3 990 27.9 102 Muslim 23.7 23.1 7.5 4.5 475 6.2 249 3.7 382 * 14
Christian 39.3 38.9 15.4 9.3 1,139 13.2 583 6.9 960 19.1 66 Other 47.0 45.5 20.4 13.0 538 18.3 318 13.8 434 (13.5) 60
Caste/tribe
Scheduled caste 44.9 44.6 21.6 17.3 253 23.1 142 14.3 205 * 29 Scheduled tribe 39.8 39.3 15.3 9.8 1,112 13.4 568 7.1 930 18.2 66
Other backward class 30.6 29.3 15.0 9.0 533 13.0 301 8.7 418 * 36
Other 46.1 45.4 16.6 9.5 1,468 16.2 814 9.1 1,199 21.4 109
Total 41.6 40.9 16.3 10.1 3,381 15.5 1,837 8.7 2,765 20.3 242
Note: Figures in parentheses are based on 25-49 unweighted cases. An asterisk indicates that a figure is based on fewer than 25 unweighted cases and has been suppressed. Total includes children who don’t know their caste/ tribe, who are not shown separately. na = Not applicable ICDS = Integrated Child Development Services 1 Supplementary food includes both food cooked and served at the AWC on a daily basis or given in the form of take home rations
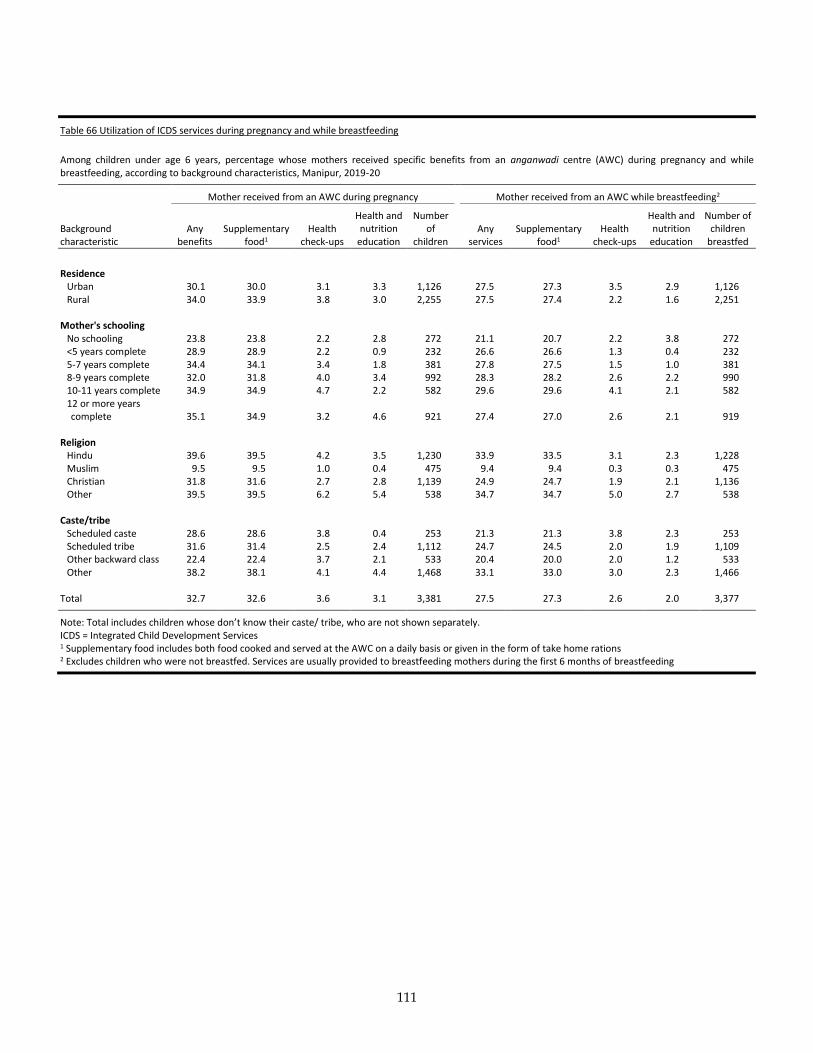
111
Table 66 Utilization of ICDS services during pregnancy and while breastfeeding
Among children under age 6 years, percentage whose mothers received specific benefits from an anganwadi centre (AWC) during pregnancy and while breastfeeding, according to background characteristics, Manipur, 2019-20
Mother received from an AWC during pregnancy
Mother received from an AWC while breastfeeding2
Background characteristic
Any benefits
Supplementary food1
Health check-ups
Health and nutrition
education
Number of
children Any
services Supplementary
food1 Health
check-ups
Health and nutrition
education
Number of children
breastfed
Residence
Urban 30.1 30.0 3.1 3.3 1,126 27.5 27.3 3.5 2.9 1,126 Rural 34.0 33.9 3.8 3.0 2,255 27.5 27.4 2.2 1.6 2,251
Mother's schooling No schooling 23.8 23.8 2.2 2.8 272 21.1 20.7 2.2 3.8 272 <5 years complete 28.9 28.9 2.2 0.9 232 26.6 26.6 1.3 0.4 232 5-7 years complete 34.4 34.1 3.4 1.8 381 27.8 27.5 1.5 1.0 381 8-9 years complete 32.0 31.8 4.0 3.4 992 28.3 28.2 2.6 2.2 990 10-11 years complete 34.9 34.9 4.7 2.2 582 29.6 29.6 4.1 2.1 582 12 or more years complete 35.1 34.9 3.2 4.6 921 27.4 27.0 2.6 2.1 919
Religion
Hindu 39.6 39.5 4.2 3.5 1,230 33.9 33.5 3.1 2.3 1,228 Muslim 9.5 9.5 1.0 0.4 475 9.4 9.4 0.3 0.3 475 Christian 31.8 31.6 2.7 2.8 1,139 24.9 24.7 1.9 2.1 1,136 Other 39.5 39.5 6.2 5.4 538 34.7 34.7 5.0 2.7 538
Caste/tribe Scheduled caste 28.6 28.6 3.8 0.4 253 21.3 21.3 3.8 2.3 253 Scheduled tribe 31.6 31.4 2.5 2.4 1,112 24.7 24.5 2.0 1.9 1,109 Other backward class 22.4 22.4 3.7 2.1 533 20.4 20.0 2.0 1.2 533 Other 38.2 38.1 4.1 4.4 1,468 33.1 33.0 3.0 2.3 1,466
Total 32.7 32.6 3.6 3.1 3,381 27.5 27.3 2.6 2.0 3,377
Note: Total includes children whose don’t know their caste/ tribe, who are not shown separately. ICDS = Integrated Child Development Services 1 Supplementary food includes both food cooked and served at the AWC on a daily basis or given in the form of take home rations 2 Excludes children who were not breastfed. Services are usually provided to breastfeeding mothers during the first 6 months of breastfeeding
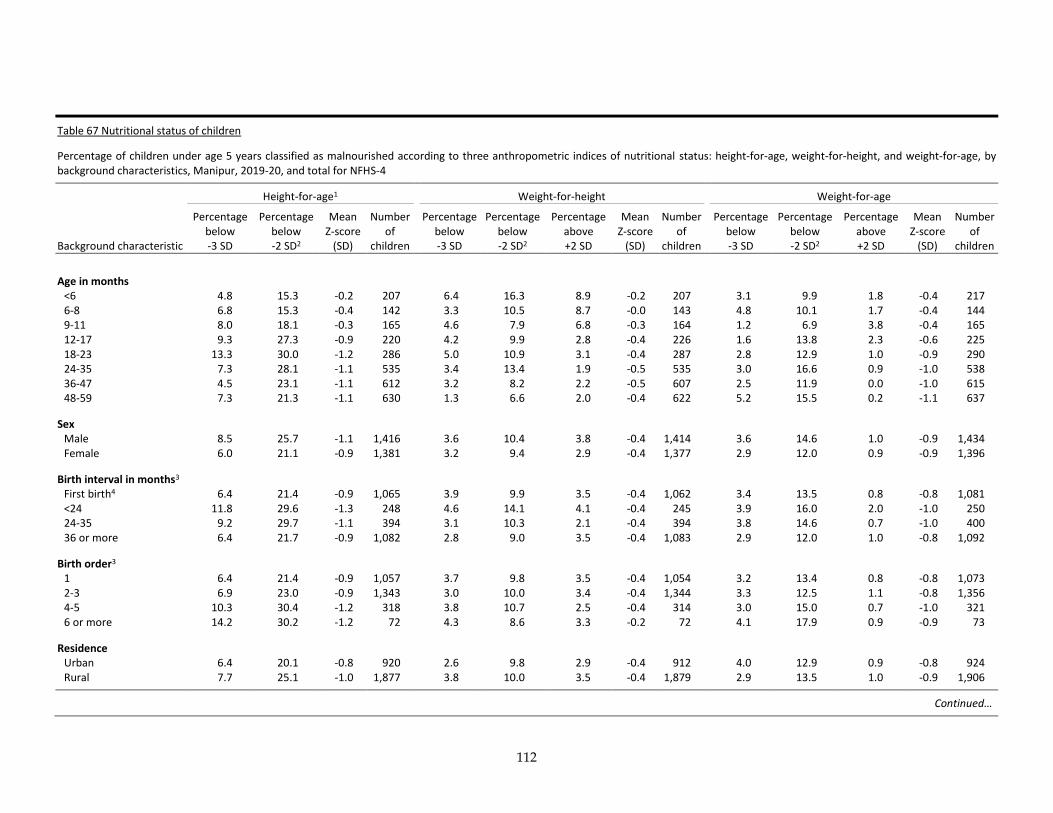
112
Table 67 Nutritional status of children
Percentage of children under age 5 years classified as malnourished according to three anthropometric indices of nutritional status: height-for-age, weight-for-height, and weight-for-age, by background characteristics, Manipur, 2019-20, and total for NFHS-4
Height-for-age1
Weight-for-height
Weight-for-age
Background characteristic
Percentage below -3 SD
Percentage below -2 SD2
Mean Z-score
(SD)
Number of
children
Percentage below -3 SD
Percentage below -2 SD2
Percentage above +2 SD
Mean Z-score
(SD)
Number of
children
Percentage below -3 SD
Percentage below -2 SD2
Percentage above +2 SD
Mean Z-score
(SD)
Number of
children
Age in months
<6 4.8 15.3 -0.2 207 6.4 16.3 8.9 -0.2 207 3.1 9.9 1.8 -0.4 217 6-8 6.8 15.3 -0.4 142 3.3 10.5 8.7 -0.0 143 4.8 10.1 1.7 -0.4 144 9-11 8.0 18.1 -0.3 165 4.6 7.9 6.8 -0.3 164 1.2 6.9 3.8 -0.4 165 12-17 9.3 27.3 -0.9 220 4.2 9.9 2.8 -0.4 226 1.6 13.8 2.3 -0.6 225 18-23 13.3 30.0 -1.2 286 5.0 10.9 3.1 -0.4 287 2.8 12.9 1.0 -0.9 290 24-35 7.3 28.1 -1.1 535 3.4 13.4 1.9 -0.5 535 3.0 16.6 0.9 -1.0 538 36-47 4.5 23.1 -1.1 612 3.2 8.2 2.2 -0.5 607 2.5 11.9 0.0 -1.0 615 48-59 7.3 21.3 -1.1 630 1.3 6.6 2.0 -0.4 622 5.2 15.5 0.2 -1.1 637
Sex Male 8.5 25.7 -1.1 1,416 3.6 10.4 3.8 -0.4 1,414 3.6 14.6 1.0 -0.9 1,434 Female 6.0 21.1 -0.9 1,381 3.2 9.4 2.9 -0.4 1,377 2.9 12.0 0.9 -0.9 1,396
Birth interval in months3 First birth4 6.4 21.4 -0.9 1,065 3.9 9.9 3.5 -0.4 1,062 3.4 13.5 0.8 -0.8 1,081 <24 11.8 29.6 -1.3 248 4.6 14.1 4.1 -0.4 245 3.9 16.0 2.0 -1.0 250 24-35 9.2 29.7 -1.1 394 3.1 10.3 2.1 -0.4 394 3.8 14.6 0.7 -1.0 400 36 or more 6.4 21.7 -0.9 1,082 2.8 9.0 3.5 -0.4 1,083 2.9 12.0 1.0 -0.8 1,092
Birth order3 1 6.4 21.4 -0.9 1,057 3.7 9.8 3.5 -0.4 1,054 3.2 13.4 0.8 -0.8 1,073 2-3 6.9 23.0 -0.9 1,343 3.0 10.0 3.4 -0.4 1,344 3.3 12.5 1.1 -0.8 1,356 4-5 10.3 30.4 -1.2 318 3.8 10.7 2.5 -0.4 314 3.0 15.0 0.7 -1.0 321 6 or more 14.2 30.2 -1.2 72 4.3 8.6 3.3 -0.2 72 4.1 17.9 0.9 -0.9 73
Residence Urban 6.4 20.1 -0.8 920 2.6 9.8 2.9 -0.4 912 4.0 12.9 0.9 -0.8 924 Rural 7.7 25.1 -1.0 1,877 3.8 10.0 3.5 -0.4 1,879 2.9 13.5 1.0 -0.9 1,906
Continued…
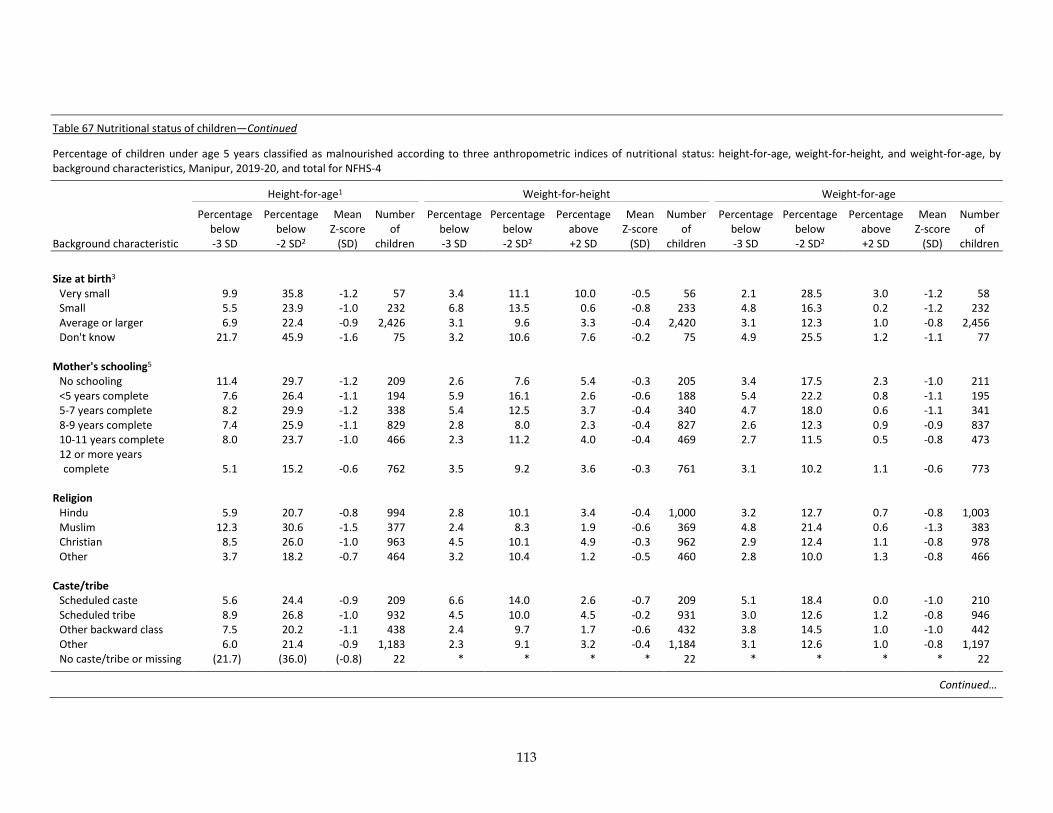
113
Table 67 Nutritional status of children—Continued
Percentage of children under age 5 years classified as malnourished according to three anthropometric indices of nutritional status: height-for-age, weight-for-height, and weight-for-age, by background characteristics, Manipur, 2019-20, and total for NFHS-4
Height-for-age1
Weight-for-height
Weight-for-age
Background characteristic
Percentage below -3 SD
Percentage below -2 SD2
Mean Z-score
(SD)
Number of
children
Percentage below -3 SD
Percentage below -2 SD2
Percentage above +2 SD
Mean Z-score
(SD)
Number of
children
Percentage below -3 SD
Percentage below -2 SD2
Percentage above +2 SD
Mean Z-score
(SD)
Number of
children
Size at birth3
Very small 9.9 35.8 -1.2 57 3.4 11.1 10.0 -0.5 56 2.1 28.5 3.0 -1.2 58 Small 5.5 23.9 -1.0 232 6.8 13.5 0.6 -0.8 233 4.8 16.3 0.2 -1.2 232 Average or larger 6.9 22.4 -0.9 2,426 3.1 9.6 3.3 -0.4 2,420 3.1 12.3 1.0 -0.8 2,456 Don't know 21.7 45.9 -1.6 75 3.2 10.6 7.6 -0.2 75 4.9 25.5 1.2 -1.1 77
Mother's schooling5 No schooling 11.4 29.7 -1.2 209 2.6 7.6 5.4 -0.3 205 3.4 17.5 2.3 -1.0 211 <5 years complete 7.6 26.4 -1.1 194 5.9 16.1 2.6 -0.6 188 5.4 22.2 0.8 -1.1 195 5-7 years complete 8.2 29.9 -1.2 338 5.4 12.5 3.7 -0.4 340 4.7 18.0 0.6 -1.1 341 8-9 years complete 7.4 25.9 -1.1 829 2.8 8.0 2.3 -0.4 827 2.6 12.3 0.9 -0.9 837 10-11 years complete 8.0 23.7 -1.0 466 2.3 11.2 4.0 -0.4 469 2.7 11.5 0.5 -0.8 473 12 or more years complete 5.1 15.2 -0.6 762 3.5 9.2 3.6 -0.3 761 3.1 10.2 1.1 -0.6 773
Religion
Hindu 5.9 20.7 -0.8 994 2.8 10.1 3.4 -0.4 1,000 3.2 12.7 0.7 -0.8 1,003 Muslim 12.3 30.6 -1.5 377 2.4 8.3 1.9 -0.6 369 4.8 21.4 0.6 -1.3 383 Christian 8.5 26.0 -1.0 963 4.5 10.1 4.9 -0.3 962 2.9 12.4 1.1 -0.8 978 Other 3.7 18.2 -0.7 464 3.2 10.4 1.2 -0.5 460 2.8 10.0 1.3 -0.8 466
Caste/tribe Scheduled caste 5.6 24.4 -0.9 209 6.6 14.0 2.6 -0.7 209 5.1 18.4 0.0 -1.0 210 Scheduled tribe 8.9 26.8 -1.0 932 4.5 10.0 4.5 -0.2 931 3.0 12.6 1.2 -0.8 946 Other backward class 7.5 20.2 -1.1 438 2.4 9.7 1.7 -0.6 432 3.8 14.5 1.0 -1.0 442 Other 6.0 21.4 -0.9 1,183 2.3 9.1 3.2 -0.4 1,184 3.1 12.6 1.0 -0.8 1,197 No caste/tribe or missing (21.7) (36.0) (-0.8) 22 * * * * 22 * * * * 22
Continued…
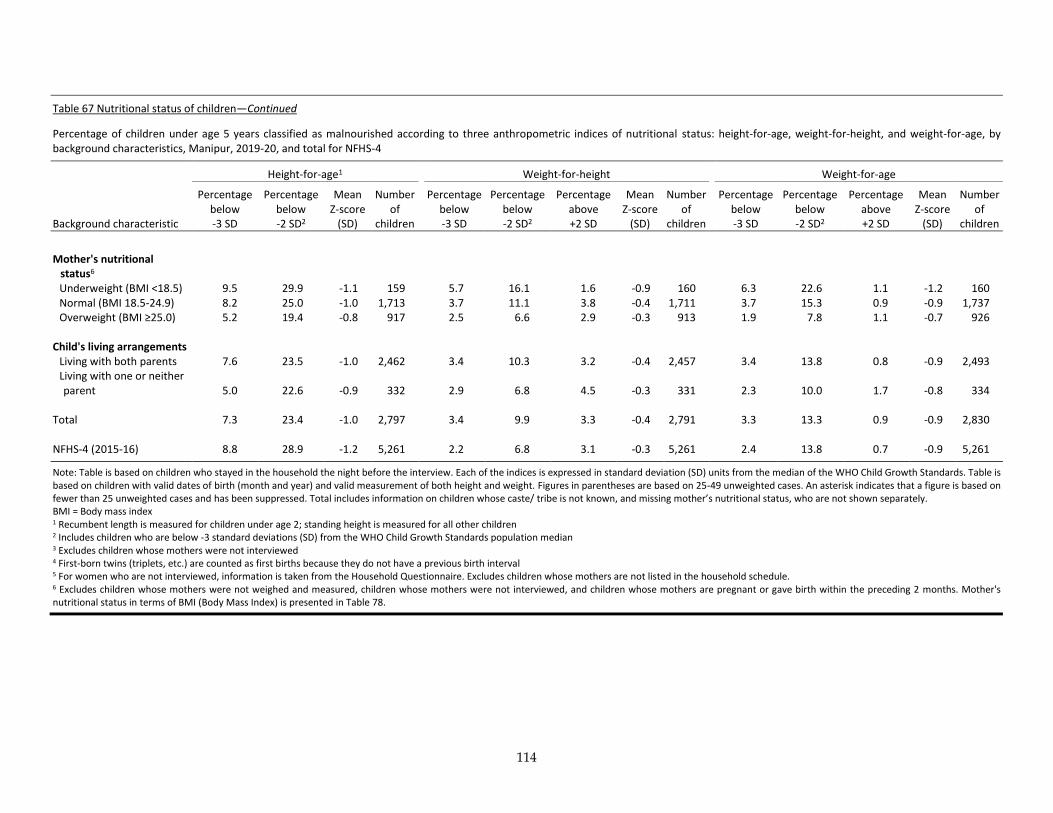
114
Table 67 Nutritional status of children—Continued
Percentage of children under age 5 years classified as malnourished according to three anthropometric indices of nutritional status: height-for-age, weight-for-height, and weight-for-age, by background characteristics, Manipur, 2019-20, and total for NFHS-4
Height-for-age1
Weight-for-height
Weight-for-age
Background characteristic
Percentage below -3 SD
Percentage below -2 SD2
Mean Z-score
(SD)
Number of
children
Percentage below -3 SD
Percentage below -2 SD2
Percentage above +2 SD
Mean Z-score
(SD)
Number of
children
Percentage below -3 SD
Percentage below -2 SD2
Percentage above +2 SD
Mean Z-score
(SD)
Number of
children
Mother's nutritional
status6 Underweight (BMI <18.5) 9.5 29.9 -1.1 159 5.7 16.1 1.6 -0.9 160 6.3 22.6 1.1 -1.2 160 Normal (BMI 18.5-24.9) 8.2 25.0 -1.0 1,713 3.7 11.1 3.8 -0.4 1,711 3.7 15.3 0.9 -0.9 1,737 Overweight (BMI ≥25.0) 5.2 19.4 -0.8 917 2.5 6.6 2.9 -0.3 913 1.9 7.8 1.1 -0.7 926
Child's living arrangements Living with both parents 7.6 23.5 -1.0 2,462 3.4 10.3 3.2 -0.4 2,457 3.4 13.8 0.8 -0.9 2,493 Living with one or neither parent 5.0 22.6 -0.9 332 2.9 6.8 4.5 -0.3 331 2.3 10.0 1.7 -0.8 334
Total 7.3 23.4 -1.0 2,797 3.4 9.9 3.3 -0.4 2,791 3.3 13.3 0.9 -0.9 2,830
NFHS-4 (2015-16) 8.8 28.9 -1.2 5,261 2.2 6.8 3.1 -0.3 5,261 2.4 13.8 0.7 -0.9 5,261
Note: Table is based on children who stayed in the household the night before the interview. Each of the indices is expressed in standard deviation (SD) units from the median of the WHO Child Growth Standards. Table is based on children with valid dates of birth (month and year) and valid measurement of both height and weight. Figures in parentheses are based on 25-49 unweighted cases. An asterisk indicates that a figure is based on fewer than 25 unweighted cases and has been suppressed. Total includes information on children whose caste/ tribe is not known, and missing mother’s nutritional status, who are not shown separately. BMI = Body mass index 1 Recumbent length is measured for children under age 2; standing height is measured for all other children 2 Includes children who are below -3 standard deviations (SD) from the WHO Child Growth Standards population median 3 Excludes children whose mothers were not interviewed 4 First-born twins (triplets, etc.) are counted as first births because they do not have a previous birth interval 5 For women who are not interviewed, information is taken from the Household Questionnaire. Excludes children whose mothers are not listed in the household schedule. 6 Excludes children whose mothers were not weighed and measured, children whose mothers were not interviewed, and children whose mothers are pregnant or gave birth within the preceding 2 months. Mother's nutritional status in terms of BMI (Body Mass Index) is presented in Table 78.
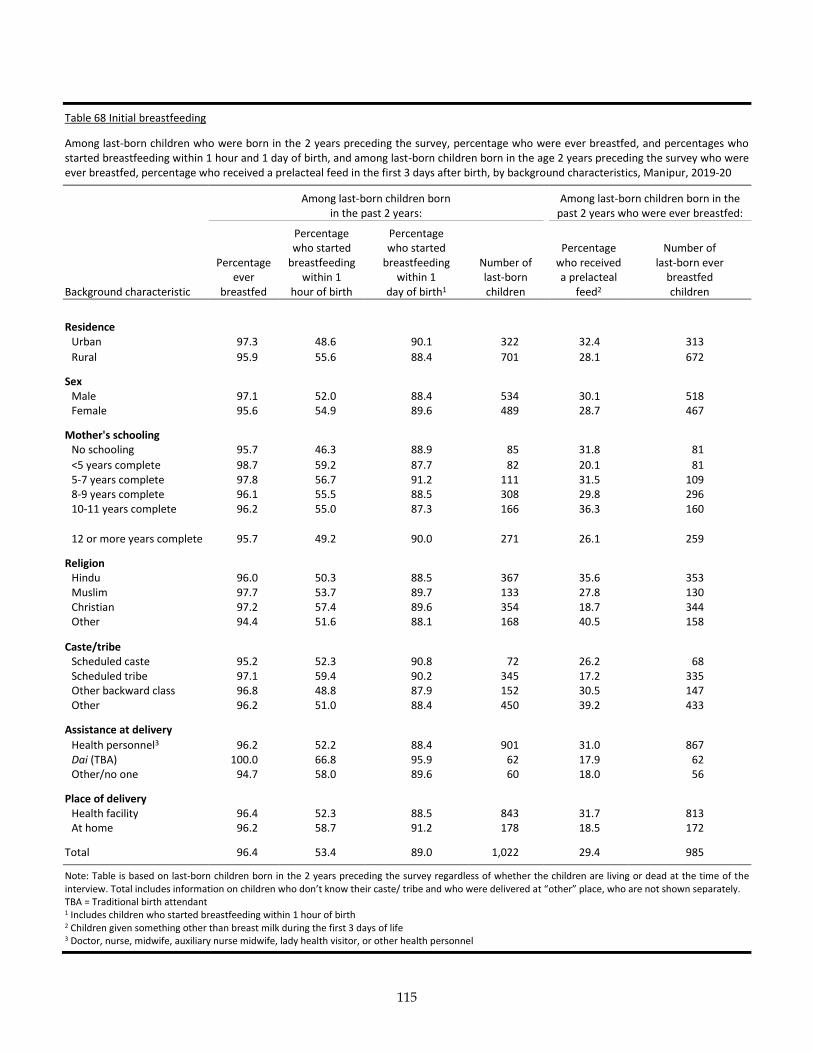
115
Table 68 Initial breastfeeding
Among last-born children who were born in the 2 years preceding the survey, percentage who were ever breastfed, and percentages who started breastfeeding within 1 hour and 1 day of birth, and among last-born children born in the age 2 years preceding the survey who were ever breastfed, percentage who received a prelacteal feed in the first 3 days after birth, by background characteristics, Manipur, 2019-20
Among last-born children born
in the past 2 years:
Among last-born children born in the past 2 years who were ever breastfed:
Background characteristic
Percentage ever
breastfed
Percentage who started
breastfeeding within 1
hour of birth
Percentage who started
breastfeeding within 1
day of birth1
Number of last-born children
Percentage who received a prelacteal
feed2
Number of last-born ever
breastfed children
Residence Urban 97.3 48.6 90.1 322 32.4 313
Rural 95.9 55.6 88.4 701 28.1 672
Sex Male 97.1 52.0 88.4 534 30.1 518 Female 95.6 54.9 89.6 489 28.7 467
Mother's schooling No schooling 95.7 46.3 88.9 85 31.8 81
<5 years complete 98.7 59.2 87.7 82 20.1 81 5-7 years complete 97.8 56.7 91.2 111 31.5 109 8-9 years complete 96.1 55.5 88.5 308 29.8 296 10-11 years complete 96.2 55.0 87.3 166 36.3 160
12 or more years complete 95.7 49.2 90.0 271 26.1 259
Religion Hindu 96.0 50.3 88.5 367 35.6 353 Muslim 97.7 53.7 89.7 133 27.8 130 Christian 97.2 57.4 89.6 354 18.7 344 Other 94.4 51.6 88.1 168 40.5 158
Caste/tribe Scheduled caste 95.2 52.3 90.8 72 26.2 68 Scheduled tribe 97.1 59.4 90.2 345 17.2 335 Other backward class 96.8 48.8 87.9 152 30.5 147 Other 96.2 51.0 88.4 450 39.2 433
Assistance at delivery
Health personnel3 96.2 52.2 88.4 901 31.0 867 Dai (TBA) 100.0 66.8 95.9 62 17.9 62 Other/no one 94.7 58.0 89.6 60 18.0 56
Place of delivery Health facility 96.4 52.3 88.5 843 31.7 813 At home 96.2 58.7 91.2 178 18.5 172
Total 96.4 53.4 89.0 1,022 29.4 985
Note: Table is based on last-born children born in the 2 years preceding the survey regardless of whether the children are living or dead at the time of the interview. Total includes information on children who don’t know their caste/ tribe and who were delivered at “other” place, who are not shown separately. TBA = Traditional birth attendant 1 Includes children who started breastfeeding within 1 hour of birth 2 Children given something other than breast milk during the first 3 days of life 3 Doctor, nurse, midwife, auxiliary nurse midwife, lady health visitor, or other health personnel
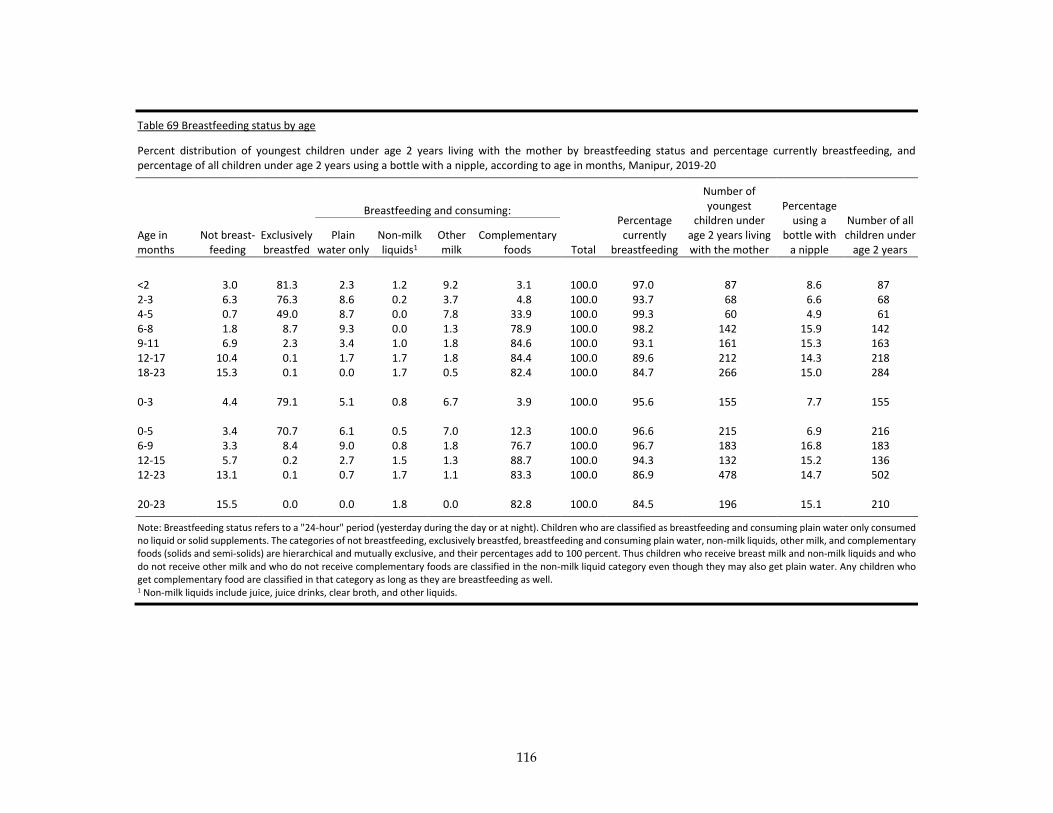
116
Table 69 Breastfeeding status by age
Percent distribution of youngest children under age 2 years living with the mother by breastfeeding status and percentage currently breastfeeding, and percentage of all children under age 2 years using a bottle with a nipple, according to age in months, Manipur, 2019-20
Age in months
Not breast- feeding
Exclusively breastfed
Breastfeeding and consuming:
Total
Percentage currently
breastfeeding
Number of youngest
children under age 2 years living with the mother
Percentage using a
bottle with a nipple
Number of all children under
age 2 years Plain
water only Non-milk liquids1
Other milk
Complementary foods
<2 3.0 81.3 2.3 1.2 9.2 3.1 100.0 97.0 87 8.6 87 2-3 6.3 76.3 8.6 0.2 3.7 4.8 100.0 93.7 68 6.6 68 4-5 0.7 49.0 8.7 0.0 7.8 33.9 100.0 99.3 60 4.9 61 6-8 1.8 8.7 9.3 0.0 1.3 78.9 100.0 98.2 142 15.9 142 9-11 6.9 2.3 3.4 1.0 1.8 84.6 100.0 93.1 161 15.3 163 12-17 10.4 0.1 1.7 1.7 1.8 84.4 100.0 89.6 212 14.3 218 18-23 15.3 0.1 0.0 1.7 0.5 82.4 100.0 84.7 266 15.0 284 0-3 4.4 79.1 5.1 0.8 6.7 3.9 100.0 95.6 155 7.7 155 0-5 3.4 70.7 6.1 0.5 7.0 12.3 100.0 96.6 215 6.9 216 6-9 3.3 8.4 9.0 0.8 1.8 76.7 100.0 96.7 183 16.8 183 12-15 5.7 0.2 2.7 1.5 1.3 88.7 100.0 94.3 132 15.2 136 12-23 13.1 0.1 0.7 1.7 1.1 83.3 100.0 86.9 478 14.7 502 20-23 15.5 0.0 0.0 1.8 0.0 82.8 100.0 84.5 196 15.1 210
Note: Breastfeeding status refers to a "24-hour" period (yesterday during the day or at night). Children who are classified as breastfeeding and consuming plain water only consumed no liquid or solid supplements. The categories of not breastfeeding, exclusively breastfed, breastfeeding and consuming plain water, non-milk liquids, other milk, and complementary foods (solids and semi-solids) are hierarchical and mutually exclusive, and their percentages add to 100 percent. Thus children who receive breast milk and non-milk liquids and who do not receive other milk and who do not receive complementary foods are classified in the non-milk liquid category even though they may also get plain water. Any children who get complementary food are classified in that category as long as they are breastfeeding as well. 1 Non-milk liquids include juice, juice drinks, clear broth, and other liquids.
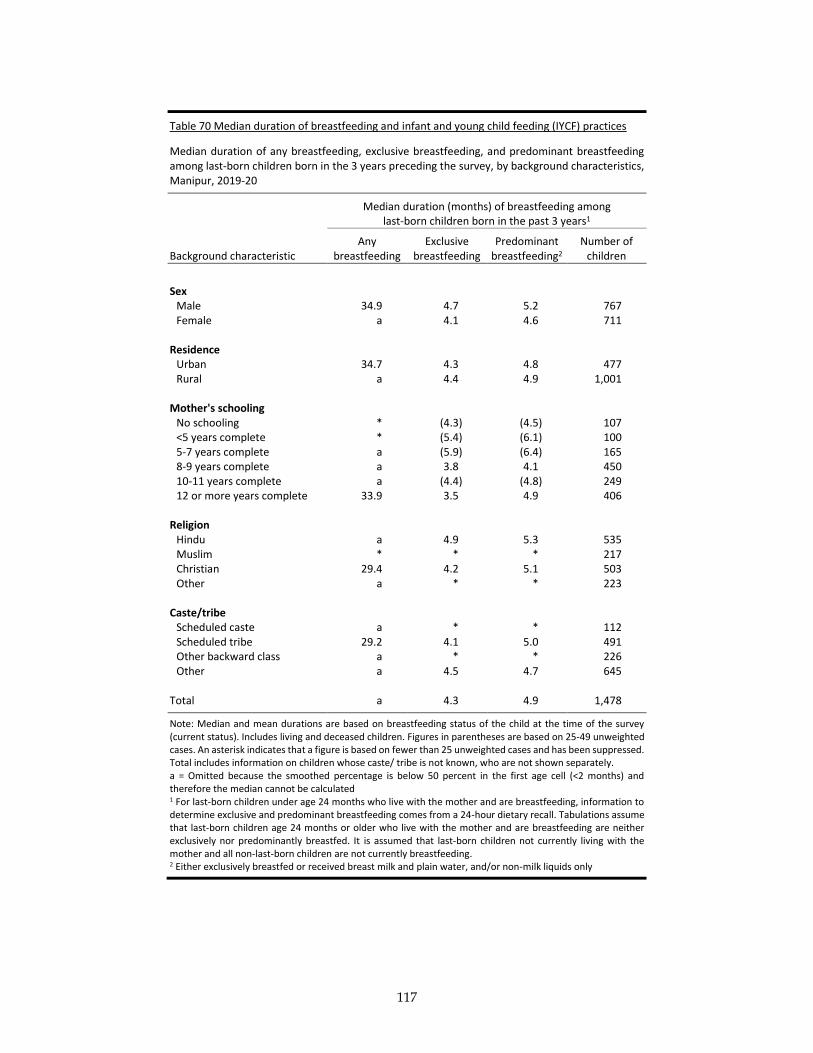
117
Table 70 Median duration of breastfeeding and infant and young child feeding (IYCF) practices
Median duration of any breastfeeding, exclusive breastfeeding, and predominant breastfeeding among last-born children born in the 3 years preceding the survey, by background characteristics, Manipur, 2019-20
Median duration (months) of breastfeeding among last-born children born in the past 3 years1
Background characteristic Any
breastfeeding Exclusive
breastfeeding Predominant
breastfeeding2 Number of
children
Sex
Male 34.9 4.7 5.2 767 Female a 4.1 4.6 711
Residence Urban 34.7 4.3 4.8 477 Rural a 4.4 4.9 1,001
Mother's schooling No schooling * (4.3) (4.5) 107 <5 years complete * (5.4) (6.1) 100 5-7 years complete a (5.9) (6.4) 165 8-9 years complete a 3.8 4.1 450 10-11 years complete a (4.4) (4.8) 249 12 or more years complete 33.9 3.5 4.9 406
Religion Hindu a 4.9 5.3 535 Muslim * * * 217 Christian 29.4 4.2 5.1 503 Other a * * 223
Caste/tribe Scheduled caste a * * 112 Scheduled tribe 29.2 4.1 5.0 491 Other backward class a * * 226 Other a 4.5 4.7 645
Total a 4.3 4.9 1,478
Note: Median and mean durations are based on breastfeeding status of the child at the time of the survey (current status). Includes living and deceased children. Figures in parentheses are based on 25-49 unweighted cases. An asterisk indicates that a figure is based on fewer than 25 unweighted cases and has been suppressed. Total includes information on children whose caste/ tribe is not known, who are not shown separately. a = Omitted because the smoothed percentage is below 50 percent in the first age cell (<2 months) and therefore the median cannot be calculated 1 For last-born children under age 24 months who live with the mother and are breastfeeding, information to determine exclusive and predominant breastfeeding comes from a 24-hour dietary recall. Tabulations assume that last-born children age 24 months or older who live with the mother and are breastfeeding are neither exclusively nor predominantly breastfed. It is assumed that last-born children not currently living with the mother and all non-last-born children are not currently breastfeeding. 2 Either exclusively breastfed or received breast milk and plain water, and/or non-milk liquids only
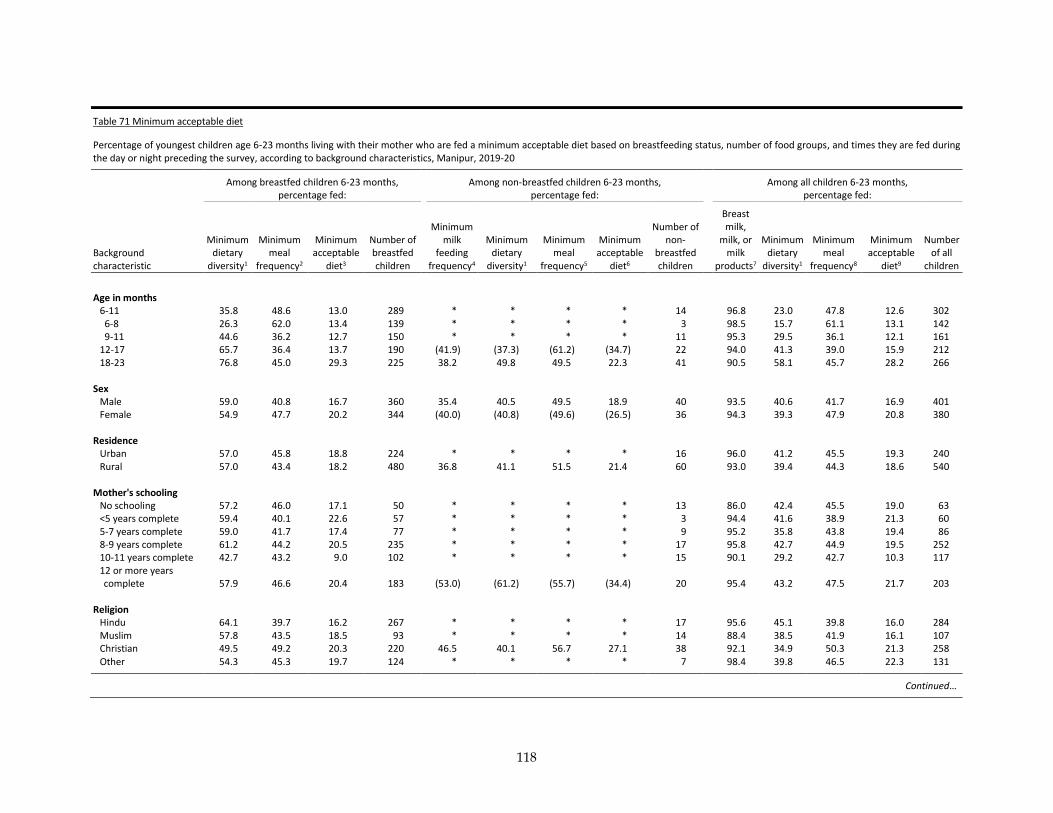
118
Table 71 Minimum acceptable diet
Percentage of youngest children age 6-23 months living with their mother who are fed a minimum acceptable diet based on breastfeeding status, number of food groups, and times they are fed during the day or night preceding the survey, according to background characteristics, Manipur, 2019-20
Among breastfed children 6-23 months, percentage fed:
Among non-breastfed children 6-23 months, percentage fed:
Among all children 6-23 months, percentage fed:
Background characteristic
Minimum dietary
diversity1
Minimum meal
frequency2
Minimum acceptable
diet3
Number of breastfed children
Minimum milk
feeding frequency4
Minimum dietary
diversity1
Minimum meal
frequency5
Minimum acceptable
diet6
Number of non-
breastfed children
Breast milk,
milk, or milk
products7
Minimum dietary
diversity1
Minimum meal
frequency8
Minimum acceptable
diet9
Number of all
children
Age in months
6-11 35.8 48.6 13.0 289 * * * * 14 96.8 23.0 47.8 12.6 302 6-8 26.3 62.0 13.4 139 * * * * 3 98.5 15.7 61.1 13.1 142 9-11 44.6 36.2 12.7 150 * * * * 11 95.3 29.5 36.1 12.1 161 12-17 65.7 36.4 13.7 190 (41.9) (37.3) (61.2) (34.7) 22 94.0 41.3 39.0 15.9 212 18-23 76.8 45.0 29.3 225 38.2 49.8 49.5 22.3 41 90.5 58.1 45.7 28.2 266
Sex Male 59.0 40.8 16.7 360 35.4 40.5 49.5 18.9 40 93.5 40.6 41.7 16.9 401 Female 54.9 47.7 20.2 344 (40.0) (40.8) (49.6) (26.5) 36 94.3 39.3 47.9 20.8 380
Residence Urban 57.0 45.8 18.8 224 * * * * 16 96.0 41.2 45.5 19.3 240 Rural 57.0 43.4 18.2 480 36.8 41.1 51.5 21.4 60 93.0 39.4 44.3 18.6 540
Mother's schooling No schooling 57.2 46.0 17.1 50 * * * * 13 86.0 42.4 45.5 19.0 63 <5 years complete 59.4 40.1 22.6 57 * * * * 3 94.4 41.6 38.9 21.3 60 5-7 years complete 59.0 41.7 17.4 77 * * * * 9 95.2 35.8 43.8 19.4 86 8-9 years complete 61.2 44.2 20.5 235 * * * * 17 95.8 42.7 44.9 19.5 252 10-11 years complete 42.7 43.2 9.0 102 * * * * 15 90.1 29.2 42.7 10.3 117 12 or more years complete 57.9 46.6 20.4 183 (53.0) (61.2) (55.7) (34.4) 20 95.4 43.2 47.5 21.7 203
Religion
Hindu 64.1 39.7 16.2 267 * * * * 17 95.6 45.1 39.8 16.0 284 Muslim 57.8 43.5 18.5 93 * * * * 14 88.4 38.5 41.9 16.1 107 Christian 49.5 49.2 20.3 220 46.5 40.1 56.7 27.1 38 92.1 34.9 50.3 21.3 258 Other 54.3 45.3 19.7 124 * * * * 7 98.4 39.8 46.5 22.3 131
Continued…
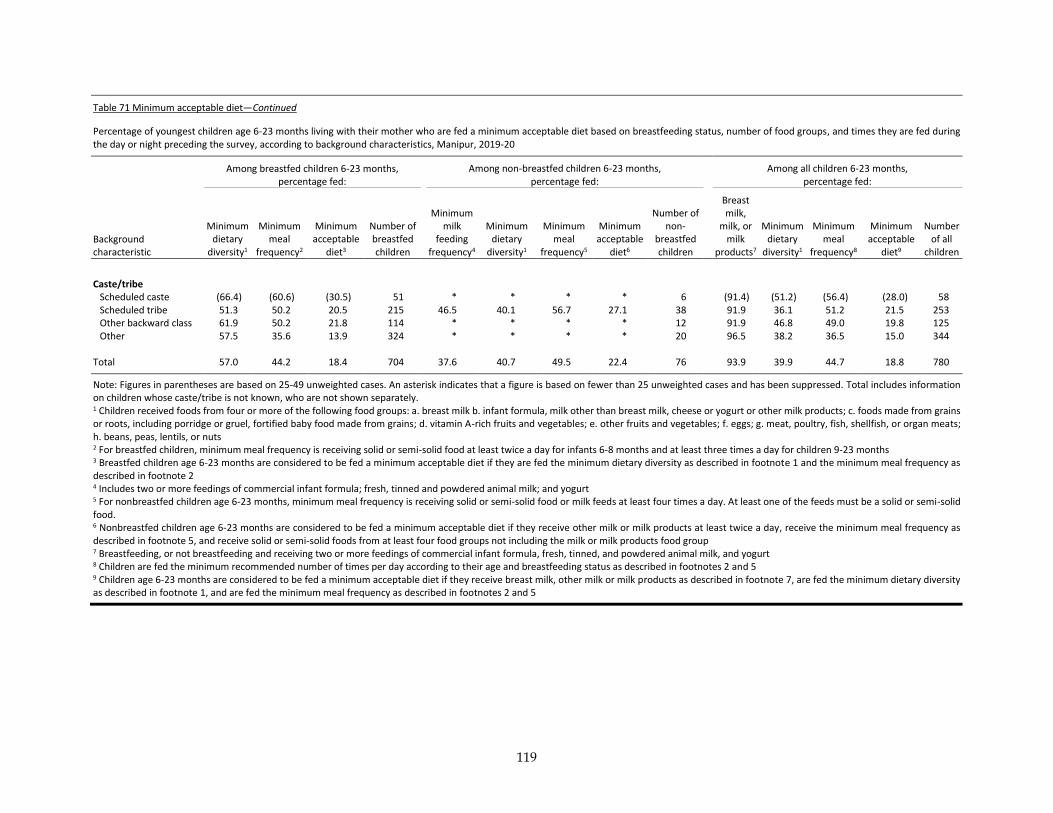
119
Table 71 Minimum acceptable diet—Continued
Percentage of youngest children age 6-23 months living with their mother who are fed a minimum acceptable diet based on breastfeeding status, number of food groups, and times they are fed during the day or night preceding the survey, according to background characteristics, Manipur, 2019-20
Among breastfed children 6-23 months, percentage fed:
Among non-breastfed children 6-23 months, percentage fed:
Among all children 6-23 months, percentage fed:
Background characteristic
Minimum dietary
diversity1
Minimum meal
frequency2
Minimum acceptable
diet3
Number of breastfed children
Minimum milk
feeding frequency4
Minimum dietary
diversity1
Minimum meal
frequency5
Minimum acceptable
diet6
Number of non-
breastfed children
Breast milk,
milk, or milk
products7
Minimum dietary
diversity1
Minimum meal
frequency8
Minimum acceptable
diet9
Number of all
children
Caste/tribe
Scheduled caste (66.4) (60.6) (30.5) 51 * * * * 6 (91.4) (51.2) (56.4) (28.0) 58 Scheduled tribe 51.3 50.2 20.5 215 46.5 40.1 56.7 27.1 38 91.9 36.1 51.2 21.5 253 Other backward class 61.9 50.2 21.8 114 * * * * 12 91.9 46.8 49.0 19.8 125 Other 57.5 35.6 13.9 324 * * * * 20 96.5 38.2 36.5 15.0 344
Total 57.0 44.2 18.4 704 37.6 40.7 49.5 22.4 76 93.9 39.9 44.7 18.8 780
Note: Figures in parentheses are based on 25-49 unweighted cases. An asterisk indicates that a figure is based on fewer than 25 unweighted cases and has been suppressed. Total includes information on children whose caste/tribe is not known, who are not shown separately. 1 Children received foods from four or more of the following food groups: a. breast milk b. infant formula, milk other than breast milk, cheese or yogurt or other milk products; c. foods made from grains or roots, including porridge or gruel, fortified baby food made from grains; d. vitamin A-rich fruits and vegetables; e. other fruits and vegetables; f. eggs; g. meat, poultry, fish, shellfish, or organ meats; h. beans, peas, lentils, or nuts 2 For breastfed children, minimum meal frequency is receiving solid or semi-solid food at least twice a day for infants 6-8 months and at least three times a day for children 9-23 months 3 Breastfed children age 6-23 months are considered to be fed a minimum acceptable diet if they are fed the minimum dietary diversity as described in footnote 1 and the minimum meal frequency as described in footnote 2 4 Includes two or more feedings of commercial infant formula; fresh, tinned and powdered animal milk; and yogurt 5 For nonbreastfed children age 6-23 months, minimum meal frequency is receiving solid or semi-solid food or milk feeds at least four times a day. At least one of the feeds must be a solid or semi-solid food. 6 Nonbreastfed children age 6-23 months are considered to be fed a minimum acceptable diet if they receive other milk or milk products at least twice a day, receive the minimum meal frequency as described in footnote 5, and receive solid or semi-solid foods from at least four food groups not including the milk or milk products food group 7 Breastfeeding, or not breastfeeding and receiving two or more feedings of commercial infant formula, fresh, tinned, and powdered animal milk, and yogurt 8 Children are fed the minimum recommended number of times per day according to their age and breastfeeding status as described in footnotes 2 and 5 9 Children age 6-23 months are considered to be fed a minimum acceptable diet if they receive breast milk, other milk or milk products as described in footnote 7, are fed the minimum dietary diversity as described in footnote 1, and are fed the minimum meal frequency as described in footnotes 2 and 5
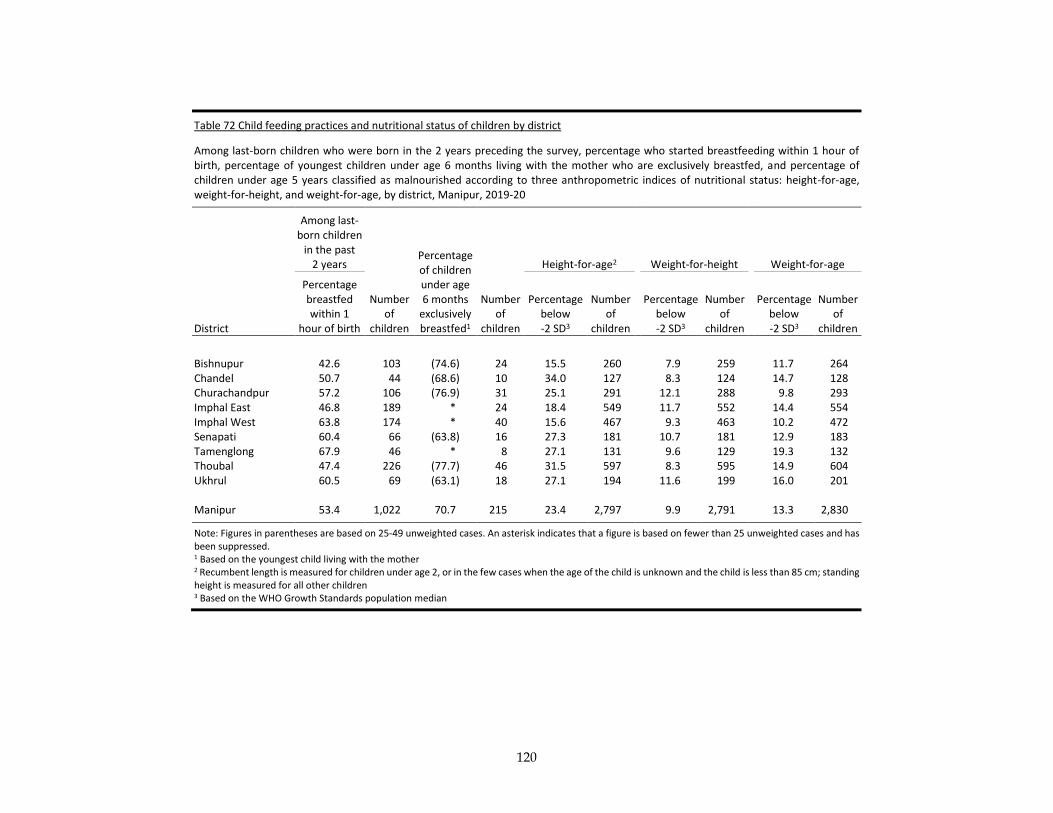
120
Table 72 Child feeding practices and nutritional status of children by district
Among last-born children who were born in the 2 years preceding the survey, percentage who started breastfeeding within 1 hour of birth, percentage of youngest children under age 6 months living with the mother who are exclusively breastfed, and percentage of children under age 5 years classified as malnourished according to three anthropometric indices of nutritional status: height-for-age, weight-for-height, and weight-for-age, by district, Manipur, 2019-20
District
Among last- born children
in the past 2 years
Number of
children
Percentage of children under age 6 months
exclusively breastfed1
Number of
children
Height-for-age2 Weight-for-height Weight-for-age
Percentage breastfed within 1
hour of birth
Percentage below -2 SD3
Number of
children
Percentage below -2 SD3
Number of
children
Percentage below -2 SD3
Number of
children
Bishnupur 42.6 103 (74.6) 24 15.5 260 7.9 259 11.7 264 Chandel 50.7 44 (68.6) 10 34.0 127 8.3 124 14.7 128 Churachandpur 57.2 106 (76.9) 31 25.1 291 12.1 288 9.8 293 Imphal East 46.8 189 * 24 18.4 549 11.7 552 14.4 554 Imphal West 63.8 174 * 40 15.6 467 9.3 463 10.2 472 Senapati 60.4 66 (63.8) 16 27.3 181 10.7 181 12.9 183 Tamenglong 67.9 46 * 8 27.1 131 9.6 129 19.3 132 Thoubal 47.4 226 (77.7) 46 31.5 597 8.3 595 14.9 604 Ukhrul 60.5 69 (63.1) 18 27.1 194 11.6 199 16.0 201 Manipur 53.4 1,022 70.7 215 23.4 2,797 9.9 2,791 13.3 2,830
Note: Figures in parentheses are based on 25-49 unweighted cases. An asterisk indicates that a figure is based on fewer than 25 unweighted cases and has been suppressed. 1 Based on the youngest child living with the mother 2 Recumbent length is measured for children under age 2, or in the few cases when the age of the child is unknown and the child is less than 85 cm; standing height is measured for all other children 3 Based on the WHO Growth Standards population median
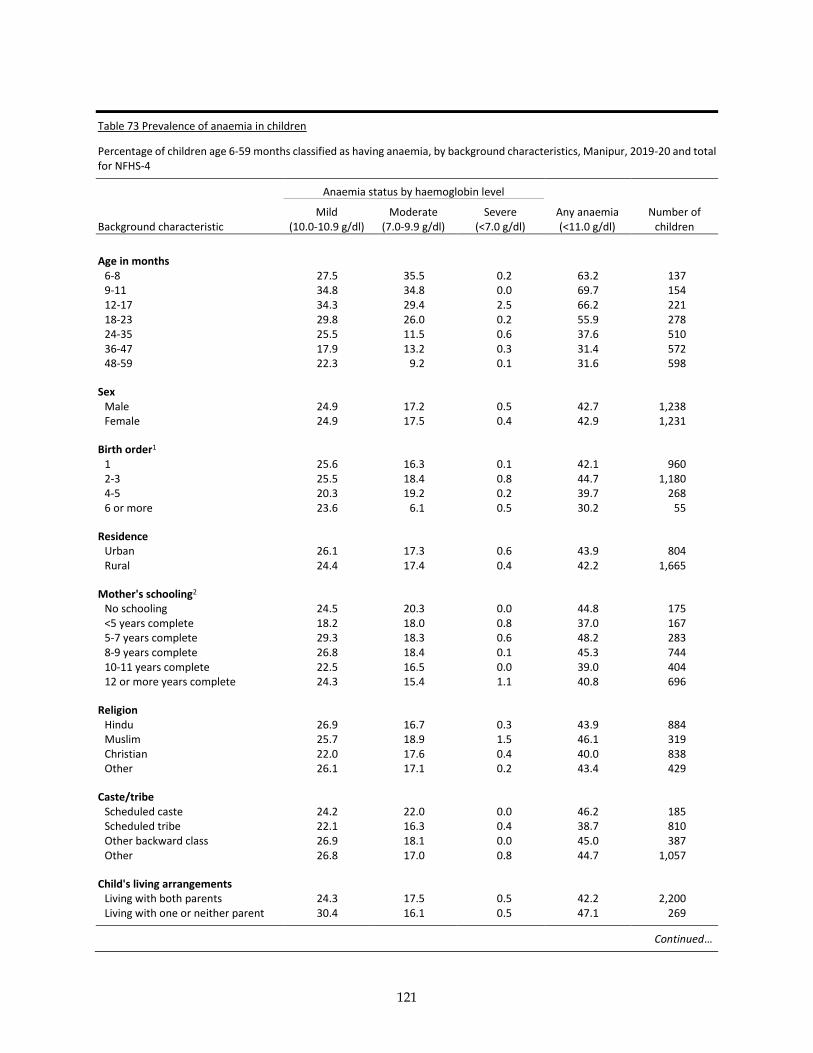
121
Table 73 Prevalence of anaemia in children
Percentage of children age 6-59 months classified as having anaemia, by background characteristics, Manipur, 2019-20 and total for NFHS-4
Anaemia status by haemoglobin level
Background characteristic Mild
(10.0-10.9 g/dl) Moderate
(7.0-9.9 g/dl) Severe
(<7.0 g/dl) Any anaemia (<11.0 g/dl)
Number of children
Age in months 6-8 27.5 35.5 0.2 63.2 137 9-11 34.8 34.8 0.0 69.7 154 12-17 34.3 29.4 2.5 66.2 221 18-23 29.8 26.0 0.2 55.9 278 24-35 25.5 11.5 0.6 37.6 510 36-47 17.9 13.2 0.3 31.4 572 48-59 22.3 9.2 0.1 31.6 598
Sex Male 24.9 17.2 0.5 42.7 1,238 Female 24.9 17.5 0.4 42.9 1,231
Birth order1 1 25.6 16.3 0.1 42.1 960 2-3 25.5 18.4 0.8 44.7 1,180 4-5 20.3 19.2 0.2 39.7 268 6 or more 23.6 6.1 0.5 30.2 55
Residence Urban 26.1 17.3 0.6 43.9 804 Rural 24.4 17.4 0.4 42.2 1,665
Mother's schooling2 No schooling 24.5 20.3 0.0 44.8 175 <5 years complete 18.2 18.0 0.8 37.0 167 5-7 years complete 29.3 18.3 0.6 48.2 283 8-9 years complete 26.8 18.4 0.1 45.3 744 10-11 years complete 22.5 16.5 0.0 39.0 404 12 or more years complete 24.3 15.4 1.1 40.8 696
Religion Hindu 26.9 16.7 0.3 43.9 884 Muslim 25.7 18.9 1.5 46.1 319 Christian 22.0 17.6 0.4 40.0 838 Other 26.1 17.1 0.2 43.4 429
Caste/tribe Scheduled caste 24.2 22.0 0.0 46.2 185 Scheduled tribe 22.1 16.3 0.4 38.7 810 Other backward class 26.9 18.1 0.0 45.0 387 Other 26.8 17.0 0.8 44.7 1,057
Child's living arrangements Living with both parents 24.3 17.5 0.5 42.2 2,200 Living with one or neither parent 30.4 16.1 0.5 47.1 269
Continued…
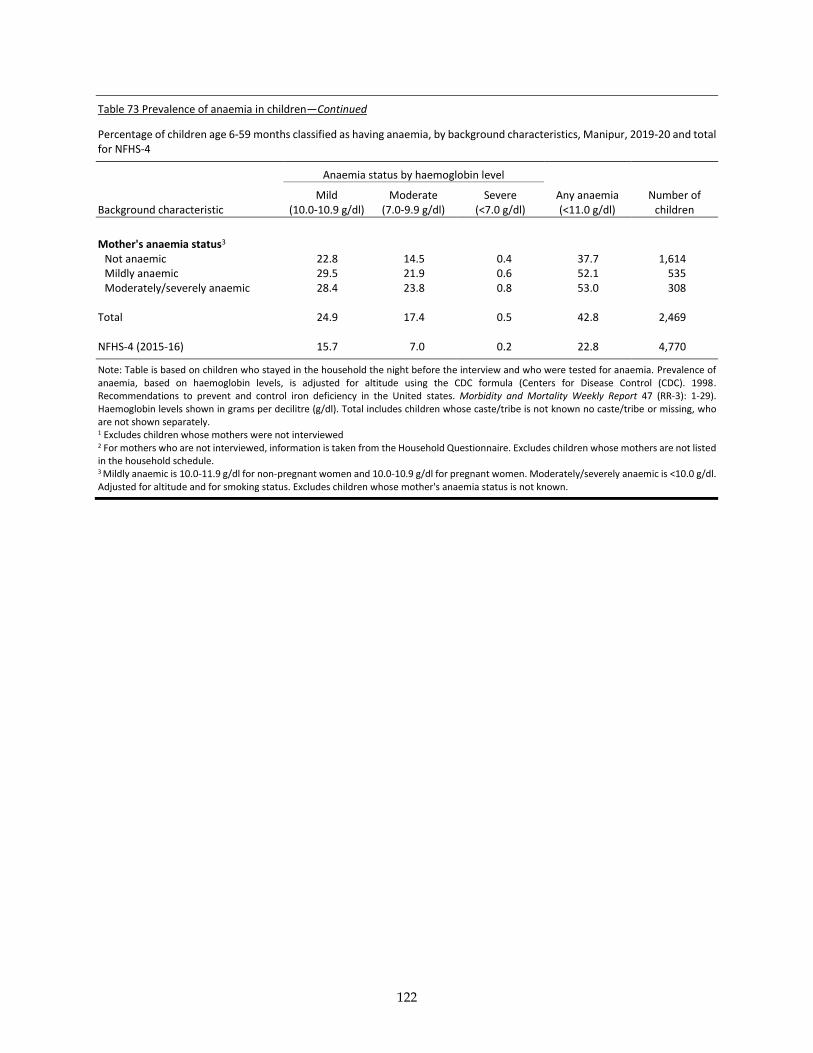
122
Table 73 Prevalence of anaemia in children—Continued
Percentage of children age 6-59 months classified as having anaemia, by background characteristics, Manipur, 2019-20 and total for NFHS-4
Anaemia status by haemoglobin level
Background characteristic Mild
(10.0-10.9 g/dl) Moderate
(7.0-9.9 g/dl) Severe
(<7.0 g/dl) Any anaemia (<11.0 g/dl)
Number of children
Mother's anaemia status3 Not anaemic 22.8 14.5 0.4 37.7 1,614 Mildly anaemic 29.5 21.9 0.6 52.1 535 Moderately/severely anaemic 28.4 23.8 0.8 53.0 308
Total 24.9 17.4 0.5 42.8 2,469
NFHS-4 (2015-16) 15.7 7.0 0.2 22.8 4,770
Note: Table is based on children who stayed in the household the night before the interview and who were tested for anaemia. Prevalence of anaemia, based on haemoglobin levels, is adjusted for altitude using the CDC formula (Centers for Disease Control (CDC). 1998. Recommendations to prevent and control iron deficiency in the United states. Morbidity and Mortality Weekly Report 47 (RR-3): 1-29). Haemoglobin levels shown in grams per decilitre (g/dl). Total includes children whose caste/tribe is not known no caste/tribe or missing, who are not shown separately. 1 Excludes children whose mothers were not interviewed 2 For mothers who are not interviewed, information is taken from the Household Questionnaire. Excludes children whose mothers are not listed in the household schedule. 3 Mildly anaemic is 10.0-11.9 g/dl for non-pregnant women and 10.0-10.9 g/dl for pregnant women. Moderately/severely anaemic is <10.0 g/dl. Adjusted for altitude and for smoking status. Excludes children whose mother's anaemia status is not known.
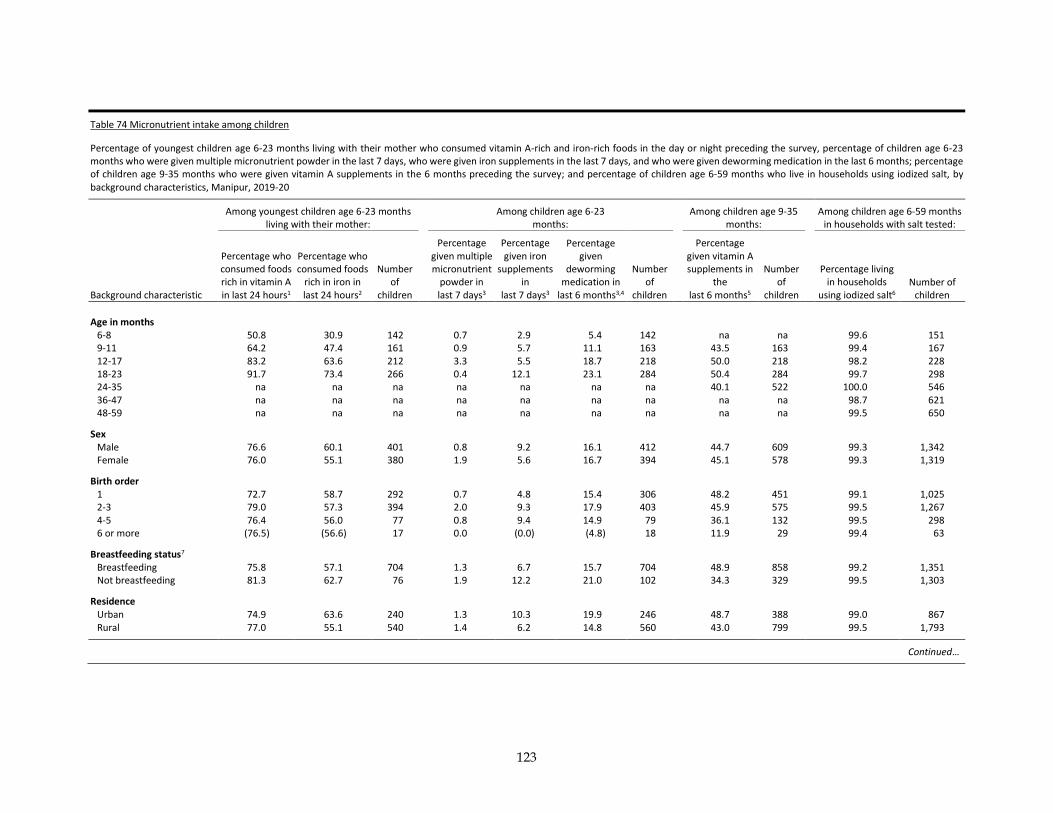
123
Table 74 Micronutrient intake among children
Percentage of youngest children age 6-23 months living with their mother who consumed vitamin A-rich and iron-rich foods in the day or night preceding the survey, percentage of children age 6-23 months who were given multiple micronutrient powder in the last 7 days, who were given iron supplements in the last 7 days, and who were given deworming medication in the last 6 months; percentage of children age 9-35 months who were given vitamin A supplements in the 6 months preceding the survey; and percentage of children age 6-59 months who live in households using iodized salt, by background characteristics, Manipur, 2019-20
Among youngest children age 6-23 months living with their mother:
Among children age 6-23 months:
Among children age 9-35 months:
Among children age 6-59 months in households with salt tested:
Background characteristic
Percentage who consumed foods rich in vitamin A in last 24 hours1
Percentage who consumed foods
rich in iron in last 24 hours2
Number of
children
Percentage given multiple micronutrient
powder in last 7 days3
Percentage given iron
supplements in
last 7 days3
Percentage given
deworming medication in
last 6 months3,4
Number of
children
Percentage given vitamin A supplements in
the last 6 months5
Number of
children
Percentage living in households
using iodized salt6 Number of
children
Age in months 6-8 50.8 30.9 142 0.7 2.9 5.4 142 na na 99.6 151 9-11 64.2 47.4 161 0.9 5.7 11.1 163 43.5 163 99.4 167 12-17 83.2 63.6 212 3.3 5.5 18.7 218 50.0 218 98.2 228 18-23 91.7 73.4 266 0.4 12.1 23.1 284 50.4 284 99.7 298 24-35 na na na na na na na 40.1 522 100.0 546 36-47 na na na na na na na na na 98.7 621 48-59 na na na na na na na na na 99.5 650
Sex Male 76.6 60.1 401 0.8 9.2 16.1 412 44.7 609 99.3 1,342 Female 76.0 55.1 380 1.9 5.6 16.7 394 45.1 578 99.3 1,319
Birth order 1 72.7 58.7 292 0.7 4.8 15.4 306 48.2 451 99.1 1,025 2-3 79.0 57.3 394 2.0 9.3 17.9 403 45.9 575 99.5 1,267 4-5 76.4 56.0 77 0.8 9.4 14.9 79 36.1 132 99.5 298 6 or more (76.5) (56.6) 17 0.0 (0.0) (4.8) 18 11.9 29 99.4 63
Breastfeeding status7 Breastfeeding 75.8 57.1 704 1.3 6.7 15.7 704 48.9 858 99.2 1,351 Not breastfeeding 81.3 62.7 76 1.9 12.2 21.0 102 34.3 329 99.5 1,303
Residence Urban 74.9 63.6 240 1.3 10.3 19.9 246 48.7 388 99.0 867 Rural 77.0 55.1 540 1.4 6.2 14.8 560 43.0 799 99.5 1,793
Continued…
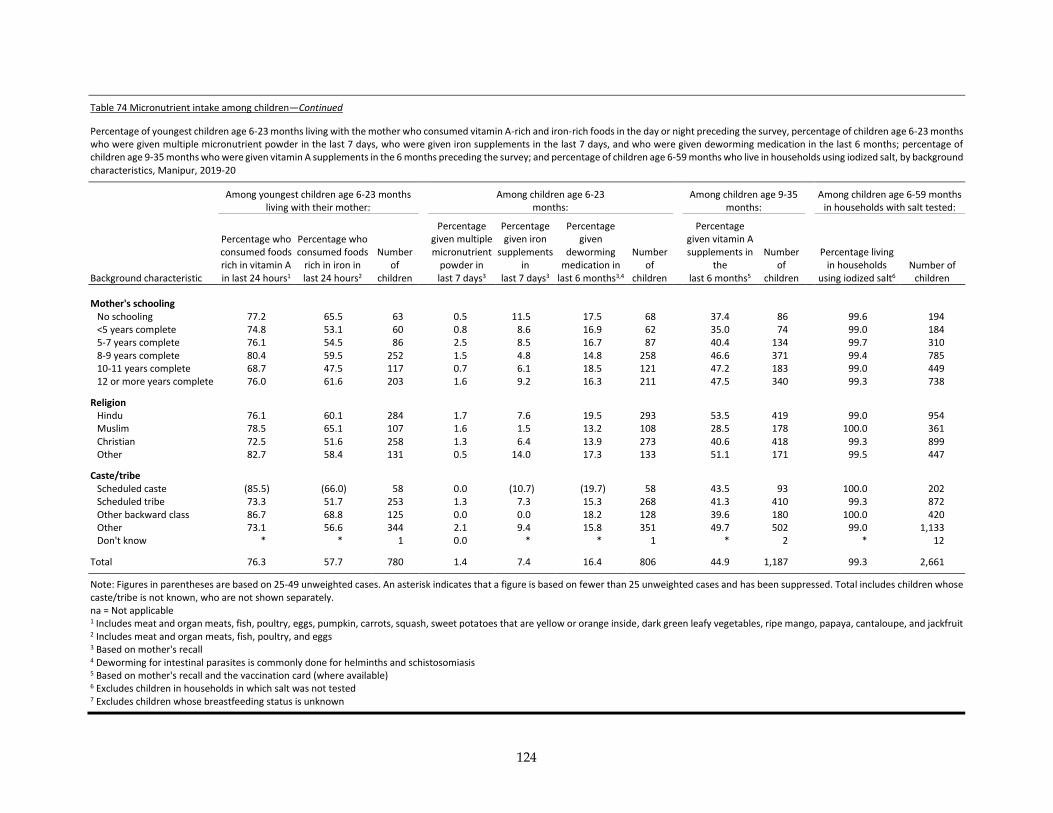
124
Table 74 Micronutrient intake among children—Continued
Percentage of youngest children age 6-23 months living with the mother who consumed vitamin A-rich and iron-rich foods in the day or night preceding the survey, percentage of children age 6-23 months who were given multiple micronutrient powder in the last 7 days, who were given iron supplements in the last 7 days, and who were given deworming medication in the last 6 months; percentage of children age 9-35 months who were given vitamin A supplements in the 6 months preceding the survey; and percentage of children age 6-59 months who live in households using iodized salt, by background characteristics, Manipur, 2019-20
Among youngest children age 6-23 months living with their mother:
Among children age 6-23 months:
Among children age 9-35 months:
Among children age 6-59 months in households with salt tested:
Background characteristic
Percentage who consumed foods rich in vitamin A in last 24 hours1
Percentage who consumed foods
rich in iron in last 24 hours2
Number of
children
Percentage given multiple micronutrient
powder in last 7 days3
Percentage given iron
supplements in
last 7 days3
Percentage given
deworming medication in
last 6 months3,4
Number of
children
Percentage given vitamin A supplements in
the last 6 months5
Number of
children
Percentage living in households
using iodized salt6 Number of
children
Mother's schooling No schooling 77.2 65.5 63 0.5 11.5 17.5 68 37.4 86 99.6 194 <5 years complete 74.8 53.1 60 0.8 8.6 16.9 62 35.0 74 99.0 184 5-7 years complete 76.1 54.5 86 2.5 8.5 16.7 87 40.4 134 99.7 310 8-9 years complete 80.4 59.5 252 1.5 4.8 14.8 258 46.6 371 99.4 785 10-11 years complete 68.7 47.5 117 0.7 6.1 18.5 121 47.2 183 99.0 449 12 or more years complete 76.0 61.6 203 1.6 9.2 16.3 211 47.5 340 99.3 738
Religion Hindu 76.1 60.1 284 1.7 7.6 19.5 293 53.5 419 99.0 954 Muslim 78.5 65.1 107 1.6 1.5 13.2 108 28.5 178 100.0 361 Christian 72.5 51.6 258 1.3 6.4 13.9 273 40.6 418 99.3 899 Other 82.7 58.4 131 0.5 14.0 17.3 133 51.1 171 99.5 447
Caste/tribe Scheduled caste (85.5) (66.0) 58 0.0 (10.7) (19.7) 58 43.5 93 100.0 202 Scheduled tribe 73.3 51.7 253 1.3 7.3 15.3 268 41.3 410 99.3 872 Other backward class 86.7 68.8 125 0.0 0.0 18.2 128 39.6 180 100.0 420 Other 73.1 56.6 344 2.1 9.4 15.8 351 49.7 502 99.0 1,133 Don't know * * 1 0.0 * * 1 * 2 * 12
Total 76.3 57.7 780 1.4 7.4 16.4 806 44.9 1,187 99.3 2,661
Note: Figures in parentheses are based on 25-49 unweighted cases. An asterisk indicates that a figure is based on fewer than 25 unweighted cases and has been suppressed. Total includes children whose caste/tribe is not known, who are not shown separately. na = Not applicable 1 Includes meat and organ meats, fish, poultry, eggs, pumpkin, carrots, squash, sweet potatoes that are yellow or orange inside, dark green leafy vegetables, ripe mango, papaya, cantaloupe, and jackfruit 2 Includes meat and organ meats, fish, poultry, and eggs 3 Based on mother's recall 4 Deworming for intestinal parasites is commonly done for helminths and schistosomiasis 5 Based on mother's recall and the vaccination card (where available) 6 Excludes children in households in which salt was not tested 7 Excludes children whose breastfeeding status is unknown
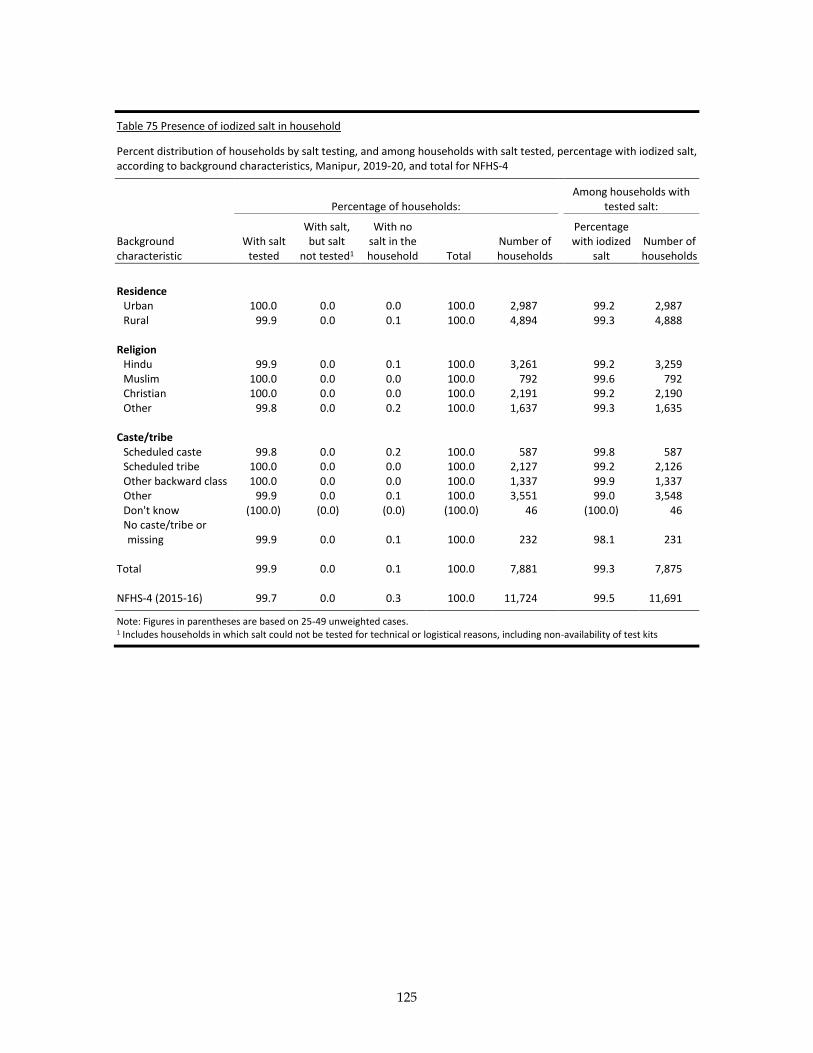
125
Table 75 Presence of iodized salt in household
Percent distribution of households by salt testing, and among households with salt tested, percentage with iodized salt, according to background characteristics, Manipur, 2019-20, and total for NFHS-4
Percentage of households:
Among households with tested salt:
Background characteristic
With salt tested
With salt, but salt
not tested1
With no salt in the household Total
Number of households
Percentage with iodized
salt Number of households
Residence
Urban 100.0 0.0 0.0 100.0 2,987 99.2 2,987 Rural 99.9 0.0 0.1 100.0 4,894 99.3 4,888
Religion Hindu 99.9 0.0 0.1 100.0 3,261 99.2 3,259 Muslim 100.0 0.0 0.0 100.0 792 99.6 792 Christian 100.0 0.0 0.0 100.0 2,191 99.2 2,190 Other 99.8 0.0 0.2 100.0 1,637 99.3 1,635
Caste/tribe Scheduled caste 99.8 0.0 0.2 100.0 587 99.8 587 Scheduled tribe 100.0 0.0 0.0 100.0 2,127 99.2 2,126 Other backward class 100.0 0.0 0.0 100.0 1,337 99.9 1,337 Other 99.9 0.0 0.1 100.0 3,551 99.0 3,548 Don't know (100.0) (0.0) (0.0) (100.0) 46 (100.0) 46 No caste/tribe or missing 99.9 0.0 0.1 100.0 232 98.1 231
Total 99.9 0.0 0.1 100.0 7,881 99.3 7,875
NFHS-4 (2015-16) 99.7 0.0 0.3 100.0 11,724 99.5 11,691
Note: Figures in parentheses are based on 25-49 unweighted cases. 1 Includes households in which salt could not be tested for technical or logistical reasons, including non-availability of test kits
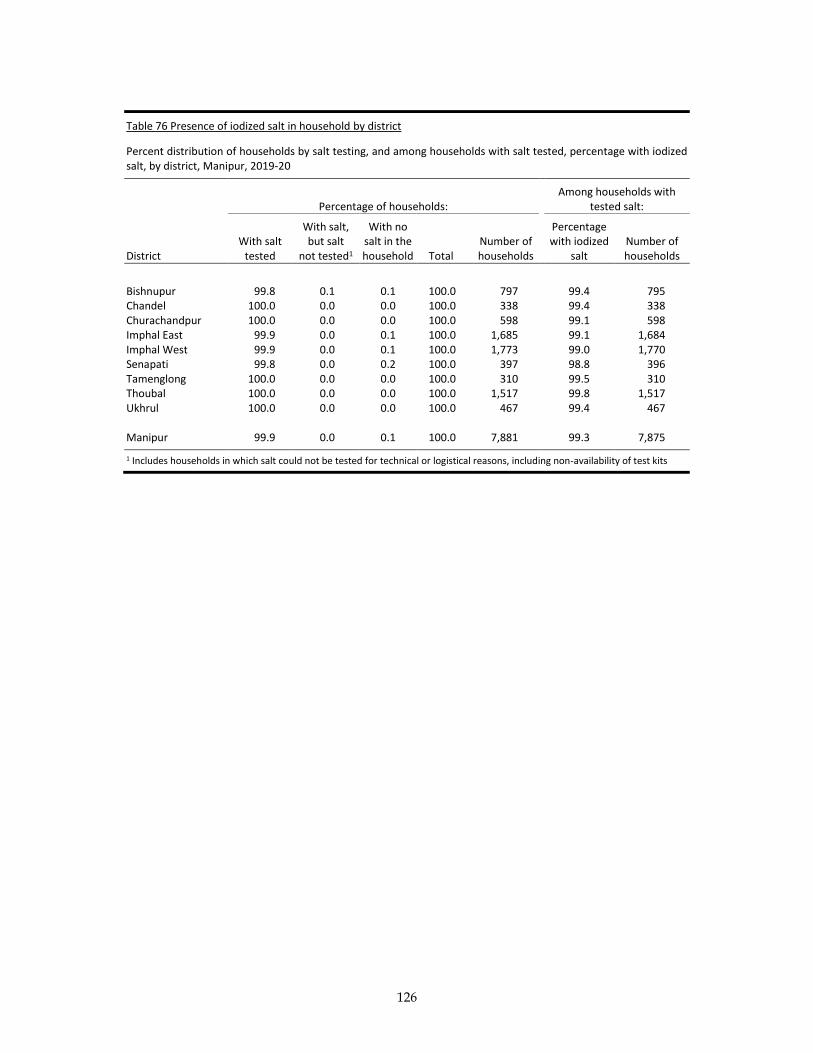
126
Table 76 Presence of iodized salt in household by district
Percent distribution of households by salt testing, and among households with salt tested, percentage with iodized salt, by district, Manipur, 2019-20
Percentage of households:
Among households with tested salt:
District With salt
tested
With salt, but salt
not tested1
With no salt in the household Total
Number of households
Percentage with iodized
salt Number of households
Bishnupur 99.8 0.1 0.1 100.0 797 99.4 795 Chandel 100.0 0.0 0.0 100.0 338 99.4 338 Churachandpur 100.0 0.0 0.0 100.0 598 99.1 598 Imphal East 99.9 0.0 0.1 100.0 1,685 99.1 1,684 Imphal West 99.9 0.0 0.1 100.0 1,773 99.0 1,770 Senapati 99.8 0.0 0.2 100.0 397 98.8 396 Tamenglong 100.0 0.0 0.0 100.0 310 99.5 310 Thoubal 100.0 0.0 0.0 100.0 1,517 99.8 1,517 Ukhrul 100.0 0.0 0.0 100.0 467 99.4 467 Manipur 99.9 0.0 0.1 100.0 7,881 99.3 7,875
1 Includes households in which salt could not be tested for technical or logistical reasons, including non-availability of test kits
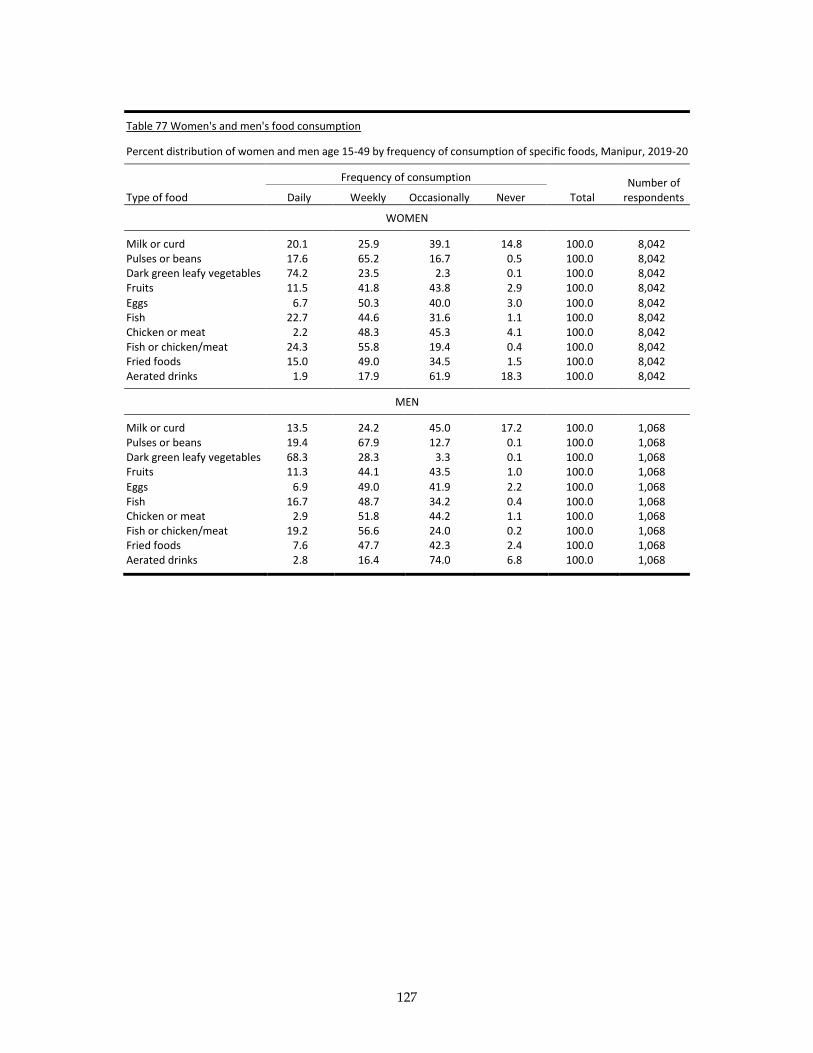
127
Table 77 Women's and men's food consumption
Percent distribution of women and men age 15-49 by frequency of consumption of specific foods, Manipur, 2019-20
Frequency of consumption Number of respondents Type of food Daily Weekly Occasionally Never Total
WOMEN
Milk or curd 20.1 25.9 39.1 14.8 100.0 8,042 Pulses or beans 17.6 65.2 16.7 0.5 100.0 8,042 Dark green leafy vegetables 74.2 23.5 2.3 0.1 100.0 8,042 Fruits 11.5 41.8 43.8 2.9 100.0 8,042
Eggs 6.7 50.3 40.0 3.0 100.0 8,042 Fish 22.7 44.6 31.6 1.1 100.0 8,042 Chicken or meat 2.2 48.3 45.3 4.1 100.0 8,042 Fish or chicken/meat 24.3 55.8 19.4 0.4 100.0 8,042 Fried foods 15.0 49.0 34.5 1.5 100.0 8,042 Aerated drinks 1.9 17.9 61.9 18.3 100.0 8,042
MEN
Milk or curd 13.5 24.2 45.0 17.2 100.0 1,068 Pulses or beans 19.4 67.9 12.7 0.1 100.0 1,068 Dark green leafy vegetables 68.3 28.3 3.3 0.1 100.0 1,068 Fruits 11.3 44.1 43.5 1.0 100.0 1,068
Eggs 6.9 49.0 41.9 2.2 100.0 1,068 Fish 16.7 48.7 34.2 0.4 100.0 1,068 Chicken or meat 2.9 51.8 44.2 1.1 100.0 1,068 Fish or chicken/meat 19.2 56.6 24.0 0.2 100.0 1,068 Fried foods 7.6 47.7 42.3 2.4 100.0 1,068 Aerated drinks 2.8 16.4 74.0 6.8 100.0 1,068
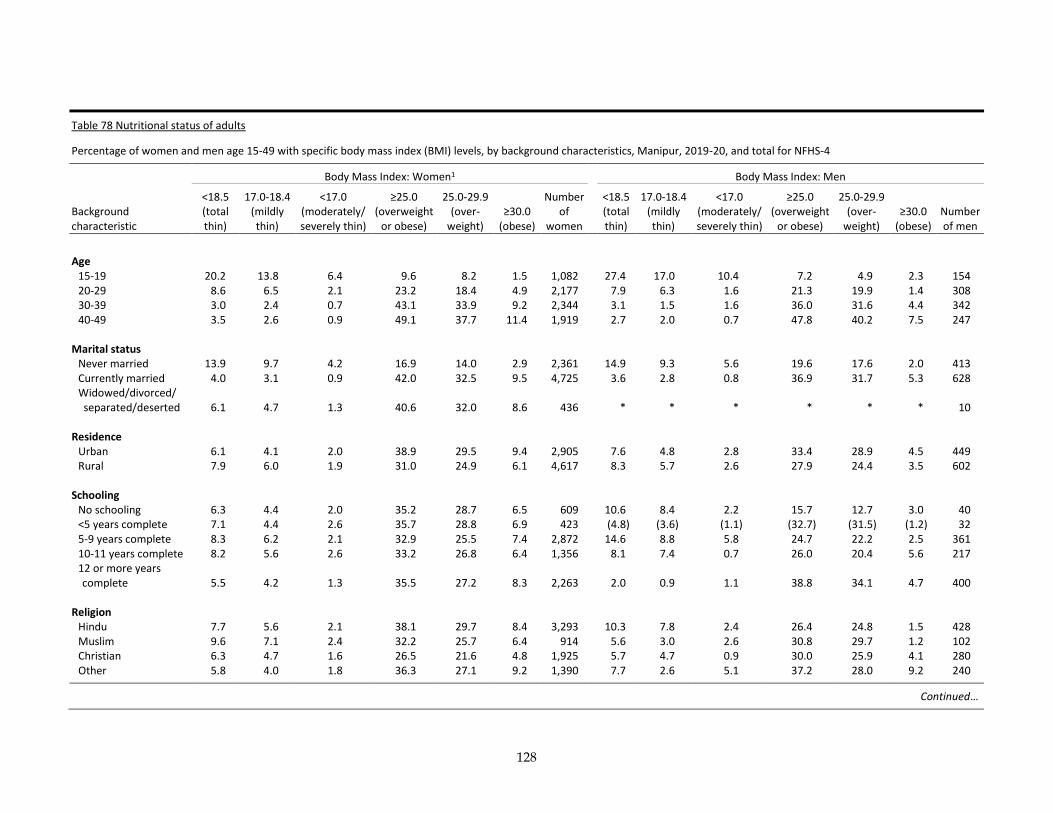
128
Table 78 Nutritional status of adults
Percentage of women and men age 15-49 with specific body mass index (BMI) levels, by background characteristics, Manipur, 2019-20, and total for NFHS-4
Body Mass Index: Women1
Body Mass Index: Men
Background characteristic
<18.5 (total thin)
17.0-18.4 (mildly thin)
<17.0 (moderately/ severely thin)
≥25.0 (overweight
or obese)
25.0-29.9 (over-
weight) ≥30.0
(obese)
Number of
women
<18.5 (total thin)
17.0-18.4 (mildly thin)
<17.0 (moderately/ severely thin)
≥25.0 (overweight
or obese)
25.0-29.9 (over-
weight) ≥30.0
(obese) Number of men
Age
15-19 20.2 13.8 6.4 9.6 8.2 1.5 1,082 27.4 17.0 10.4 7.2 4.9 2.3 154 20-29 8.6 6.5 2.1 23.2 18.4 4.9 2,177 7.9 6.3 1.6 21.3 19.9 1.4 308 30-39 3.0 2.4 0.7 43.1 33.9 9.2 2,344 3.1 1.5 1.6 36.0 31.6 4.4 342 40-49 3.5 2.6 0.9 49.1 37.7 11.4 1,919 2.7 2.0 0.7 47.8 40.2 7.5 247
Marital status Never married 13.9 9.7 4.2 16.9 14.0 2.9 2,361 14.9 9.3 5.6 19.6 17.6 2.0 413 Currently married 4.0 3.1 0.9 42.0 32.5 9.5 4,725 3.6 2.8 0.8 36.9 31.7 5.3 628 Widowed/divorced/ separated/deserted 6.1 4.7 1.3 40.6 32.0 8.6 436 * * * * * * 10
Residence Urban 6.1 4.1 2.0 38.9 29.5 9.4 2,905 7.6 4.8 2.8 33.4 28.9 4.5 449 Rural 7.9 6.0 1.9 31.0 24.9 6.1 4,617 8.3 5.7 2.6 27.9 24.4 3.5 602
Schooling No schooling 6.3 4.4 2.0 35.2 28.7 6.5 609 10.6 8.4 2.2 15.7 12.7 3.0 40 <5 years complete 7.1 4.4 2.6 35.7 28.8 6.9 423 (4.8) (3.6) (1.1) (32.7) (31.5) (1.2) 32 5-9 years complete 8.3 6.2 2.1 32.9 25.5 7.4 2,872 14.6 8.8 5.8 24.7 22.2 2.5 361 10-11 years complete 8.2 5.6 2.6 33.2 26.8 6.4 1,356 8.1 7.4 0.7 26.0 20.4 5.6 217 12 or more years complete 5.5 4.2 1.3 35.5 27.2 8.3 2,263 2.0 0.9 1.1 38.8 34.1 4.7 400
Religion
Hindu 7.7 5.6 2.1 38.1 29.7 8.4 3,293 10.3 7.8 2.4 26.4 24.8 1.5 428 Muslim 9.6 7.1 2.4 32.2 25.7 6.4 914 5.6 3.0 2.6 30.8 29.7 1.2 102 Christian 6.3 4.7 1.6 26.5 21.6 4.8 1,925 5.7 4.7 0.9 30.0 25.9 4.1 280 Other 5.8 4.0 1.8 36.3 27.1 9.2 1,390 7.7 2.6 5.1 37.2 28.0 9.2 240
Continued…

129
Table 78 Nutritional status of adults—Continued
Percentage of women and men age 15-49 with specific body mass index (BMI) levels, by background characteristics, Manipur, 2019-20, and total for NFHS-4
Body Mass Index: Women1
Body Mass Index: Men
Background characteristic
<18.5 (total thin)
17.0-18.4 (mildly thin)
<17.0 (moderately/ severely thin)
≥25.0 (overweight
or obese)
25.0-29.9 (over-
weight) ≥30.0
(obese)
Number of
women
<18.5 (total thin)
17.0-18.4 (mildly thin)
<17.0 (moderately/ severely thin)
≥25.0 (overweight
or obese)
25.0-29.9 (over-
weight) ≥30.0
(obese) Number of men
Caste/tribe
Scheduled caste 13.3 8.7 4.7 32.3 25.5 6.8 602 (18.9) (17.6) (1.2) (33.2) (33.2) (0.0) 73 Scheduled tribe 6.2 4.9 1.3 26.5 21.5 5.0 1,861 3.8 3.1 0.6 29.4 26.5 2.9 248 Other backward class 8.6 5.6 3.0 33.7 26.8 6.9 1,485 7.1 4.4 2.7 29.6 24.8 4.9 255 Other 6.1 4.7 1.4 38.4 29.4 9.0 3,536 8.9 4.9 4.0 30.9 26.3 4.6 470 Don't know (9.9) (6.1) (3.8) (37.3) (35.3) (2.0) 38 * * * * * * 5
Total age 15-49 7.2 5.3 2.0 34.1 26.7 7.4 7,522 8.0 5.3 2.7 30.2 26.3 3.9 1,051
Age 50-54 na na na na na na na 5.4 4.9 0.5 37.9 36.2 1.7 92
Total age 15-54 na na na na na na na 7.8 5.3 2.5 30.9 27.1 3.8 1,143
Age 15-49 NFHS-4 (2015-16) 8.8 6.7 2.1 26.0 20.8 5.2 12,728 11.1 8.4 2.8 19.8 17.0 2.8 1,728
Note: The body mass index (BMI) is expressed as the ratio of weight in kilograms to the square of height in metres (kg/m2). Figures in parentheses are based on 25-49 unweighted cases. An asterisk indicates that a figure is based on fewer than 25 unweighted cases and has been suppressed. na = Not applicable 1 Excludes pregnant women and women with a birth in the preceding 2 months
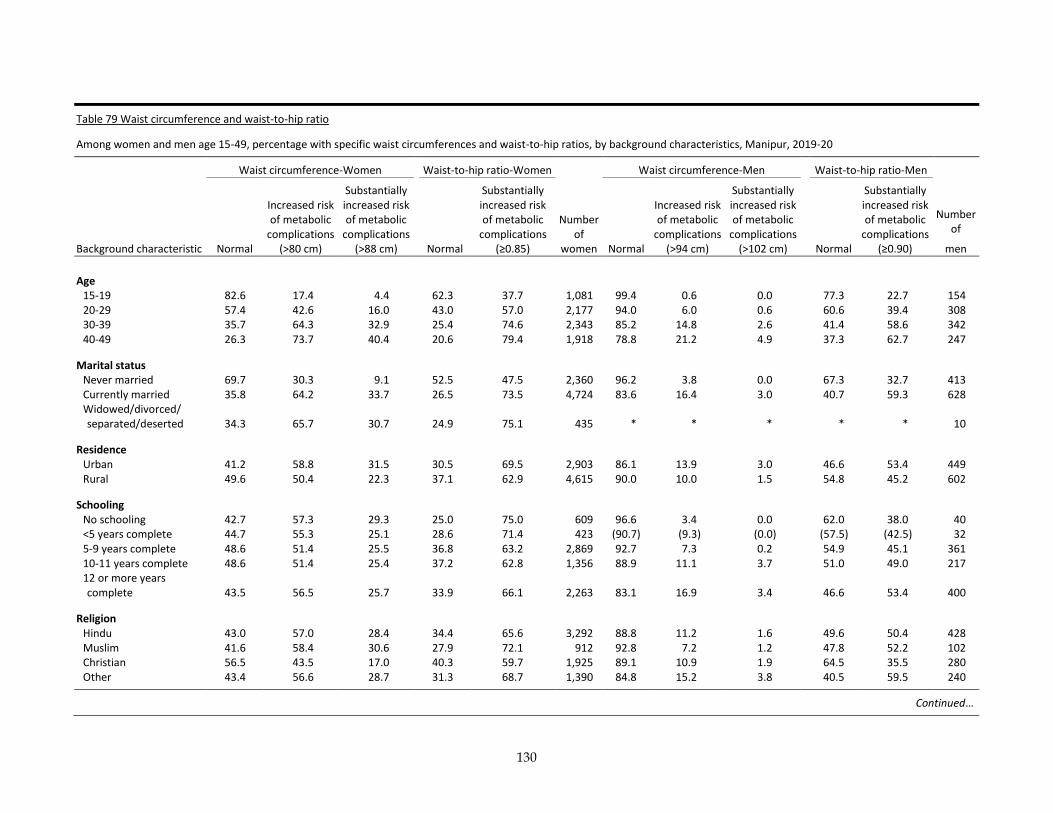
130
Table 79 Waist circumference and waist-to-hip ratio
Among women and men age 15-49, percentage with specific waist circumferences and waist-to-hip ratios, by background characteristics, Manipur, 2019-20
Waist circumference-Women Waist-to-hip ratio-Women Waist circumference-Men Waist-to-hip ratio-Men
Background characteristic Normal
Increased risk of metabolic
complications (>80 cm)
Substantially increased risk of metabolic
complications (>88 cm) Normal
Substantially increased risk of metabolic
complications (≥0.85)
Number of
women Normal
Increased risk of metabolic
complications (>94 cm)
Substantially increased risk of metabolic
complications (>102 cm) Normal
Substantially increased risk of metabolic
complications (≥0.90)
Number of
men
Age 15-19 82.6 17.4 4.4 62.3 37.7 1,081 99.4 0.6 0.0 77.3 22.7 154 20-29 57.4 42.6 16.0 43.0 57.0 2,177 94.0 6.0 0.6 60.6 39.4 308 30-39 35.7 64.3 32.9 25.4 74.6 2,343 85.2 14.8 2.6 41.4 58.6 342 40-49 26.3 73.7 40.4 20.6 79.4 1,918 78.8 21.2 4.9 37.3 62.7 247
Marital status Never married 69.7 30.3 9.1 52.5 47.5 2,360 96.2 3.8 0.0 67.3 32.7 413 Currently married 35.8 64.2 33.7 26.5 73.5 4,724 83.6 16.4 3.0 40.7 59.3 628 Widowed/divorced/ separated/deserted 34.3 65.7 30.7 24.9 75.1 435 * * * * * 10
Residence Urban 41.2 58.8 31.5 30.5 69.5 2,903 86.1 13.9 3.0 46.6 53.4 449 Rural 49.6 50.4 22.3 37.1 62.9 4,615 90.0 10.0 1.5 54.8 45.2 602
Schooling No schooling 42.7 57.3 29.3 25.0 75.0 609 96.6 3.4 0.0 62.0 38.0 40 <5 years complete 44.7 55.3 25.1 28.6 71.4 423 (90.7) (9.3) (0.0) (57.5) (42.5) 32 5-9 years complete 48.6 51.4 25.5 36.8 63.2 2,869 92.7 7.3 0.2 54.9 45.1 361 10-11 years complete 48.6 51.4 25.4 37.2 62.8 1,356 88.9 11.1 3.7 51.0 49.0 217 12 or more years complete 43.5 56.5 25.7 33.9 66.1 2,263 83.1 16.9 3.4 46.6 53.4 400
Religion Hindu 43.0 57.0 28.4 34.4 65.6 3,292 88.8 11.2 1.6 49.6 50.4 428 Muslim 41.6 58.4 30.6 27.9 72.1 912 92.8 7.2 1.2 47.8 52.2 102 Christian 56.5 43.5 17.0 40.3 59.7 1,925 89.1 10.9 1.9 64.5 35.5 280 Other 43.4 56.6 28.7 31.3 68.7 1,390 84.8 15.2 3.8 40.5 59.5 240
Continued…
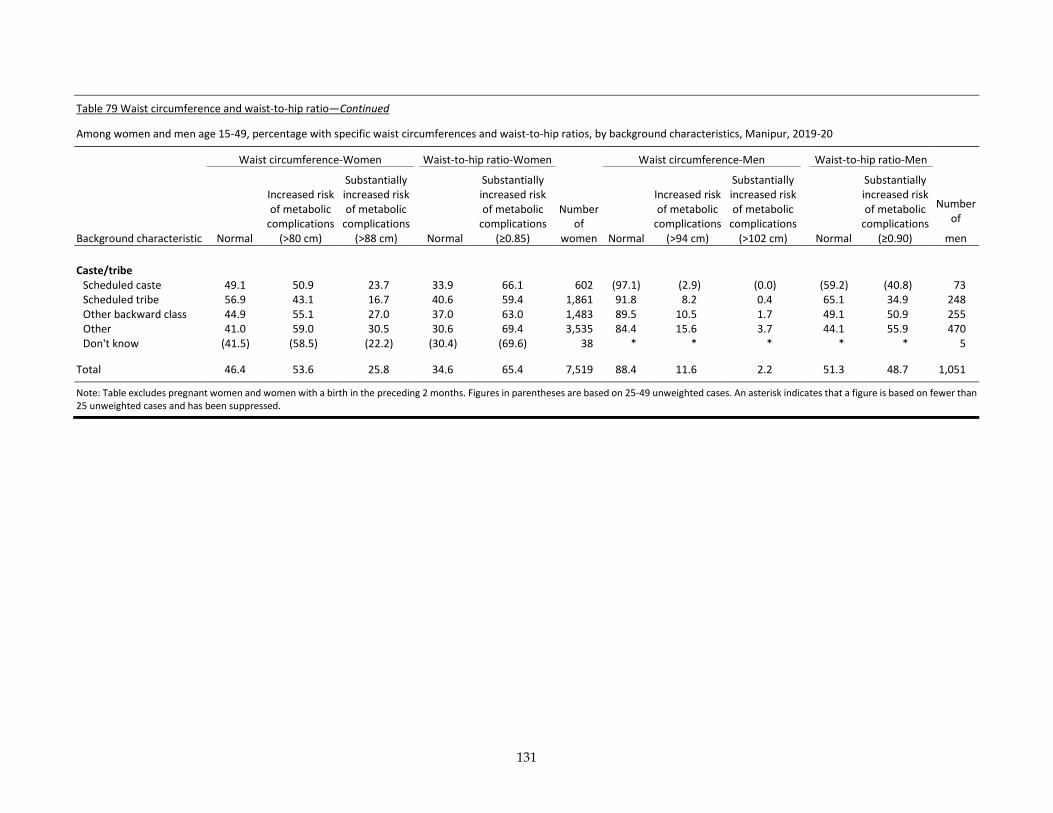
131
Table 79 Waist circumference and waist-to-hip ratio—Continued
Among women and men age 15-49, percentage with specific waist circumferences and waist-to-hip ratios, by background characteristics, Manipur, 2019-20
Waist circumference-Women Waist-to-hip ratio-Women Waist circumference-Men Waist-to-hip ratio-Men
Background characteristic Normal
Increased risk of metabolic
complications (>80 cm)
Substantially increased risk of metabolic
complications (>88 cm) Normal
Substantially increased risk of metabolic
complications (≥0.85)
Number of
women Normal
Increased risk of metabolic
complications (>94 cm)
Substantially increased risk of metabolic
complications (>102 cm) Normal
Substantially increased risk of metabolic
complications (≥0.90)
Number of
men
Caste/tribe Scheduled caste 49.1 50.9 23.7 33.9 66.1 602 (97.1) (2.9) (0.0) (59.2) (40.8) 73 Scheduled tribe 56.9 43.1 16.7 40.6 59.4 1,861 91.8 8.2 0.4 65.1 34.9 248 Other backward class 44.9 55.1 27.0 37.0 63.0 1,483 89.5 10.5 1.7 49.1 50.9 255 Other 41.0 59.0 30.5 30.6 69.4 3,535 84.4 15.6 3.7 44.1 55.9 470 Don't know (41.5) (58.5) (22.2) (30.4) (69.6) 38 * * * * * 5
Total 46.4 53.6 25.8 34.6 65.4 7,519 88.4 11.6 2.2 51.3 48.7 1,051
Note: Table excludes pregnant women and women with a birth in the preceding 2 months. Figures in parentheses are based on 25-49 unweighted cases. An asterisk indicates that a figure is based on fewer than 25 unweighted cases and has been suppressed.
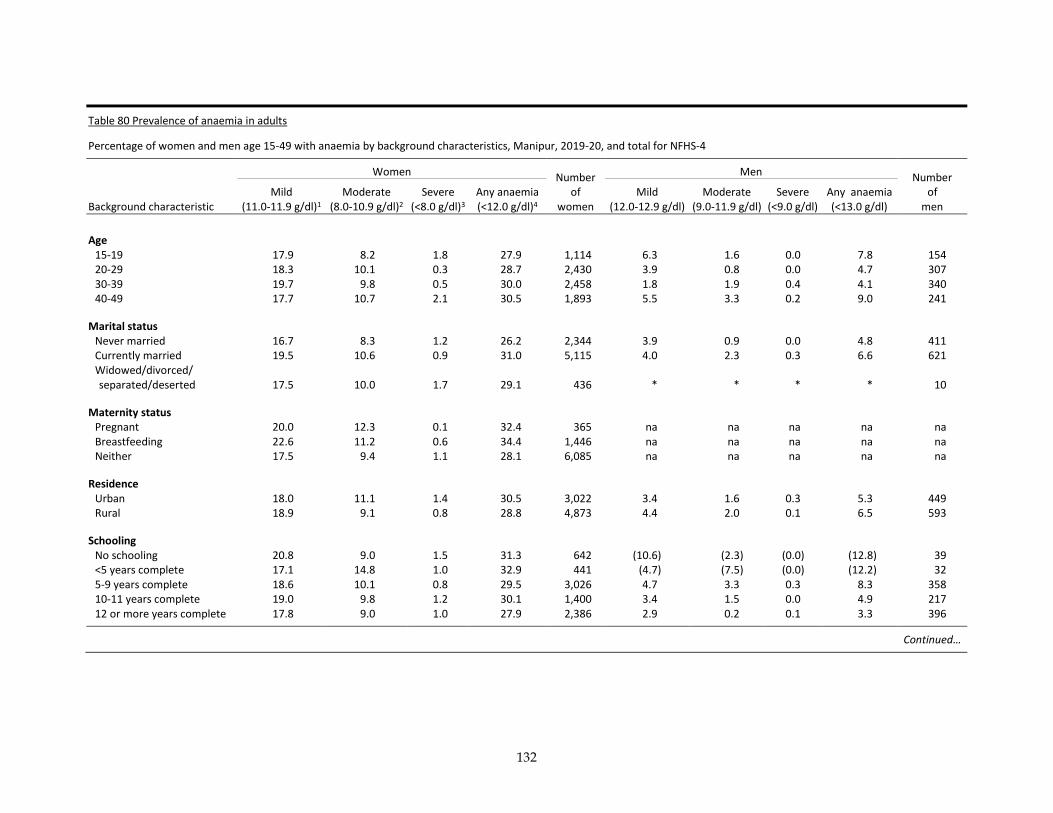
132
Table 80 Prevalence of anaemia in adults
Percentage of women and men age 15-49 with anaemia by background characteristics, Manipur, 2019-20, and total for NFHS-4
Women Number of
women
Men Number of
men Background characteristic Mild
(11.0-11.9 g/dl)1 Moderate
(8.0-10.9 g/dl)2 Severe
(<8.0 g/dl)3 Any anaemia (<12.0 g/dl)4
Mild (12.0-12.9 g/dl)
Moderate (9.0-11.9 g/dl)
Severe (<9.0 g/dl)
Any anaemia (<13.0 g/dl)
Age 15-19 17.9 8.2 1.8 27.9 1,114 6.3 1.6 0.0 7.8 154 20-29 18.3 10.1 0.3 28.7 2,430 3.9 0.8 0.0 4.7 307 30-39 19.7 9.8 0.5 30.0 2,458 1.8 1.9 0.4 4.1 340 40-49 17.7 10.7 2.1 30.5 1,893 5.5 3.3 0.2 9.0 241
Marital status Never married 16.7 8.3 1.2 26.2 2,344 3.9 0.9 0.0 4.8 411 Currently married 19.5 10.6 0.9 31.0 5,115 4.0 2.3 0.3 6.6 621 Widowed/divorced/ separated/deserted 17.5 10.0 1.7 29.1 436 * * * * 10
Maternity status Pregnant 20.0 12.3 0.1 32.4 365 na na na na na Breastfeeding 22.6 11.2 0.6 34.4 1,446 na na na na na Neither 17.5 9.4 1.1 28.1 6,085 na na na na na
Residence Urban 18.0 11.1 1.4 30.5 3,022 3.4 1.6 0.3 5.3 449 Rural 18.9 9.1 0.8 28.8 4,873 4.4 2.0 0.1 6.5 593
Schooling No schooling 20.8 9.0 1.5 31.3 642 (10.6) (2.3) (0.0) (12.8) 39 <5 years complete 17.1 14.8 1.0 32.9 441 (4.7) (7.5) (0.0) (12.2) 32 5-9 years complete 18.6 10.1 0.8 29.5 3,026 4.7 3.3 0.3 8.3 358 10-11 years complete 19.0 9.8 1.2 30.1 1,400 3.4 1.5 0.0 4.9 217 12 or more years complete 17.8 9.0 1.0 27.9 2,386 2.9 0.2 0.1 3.3 396
Continued…
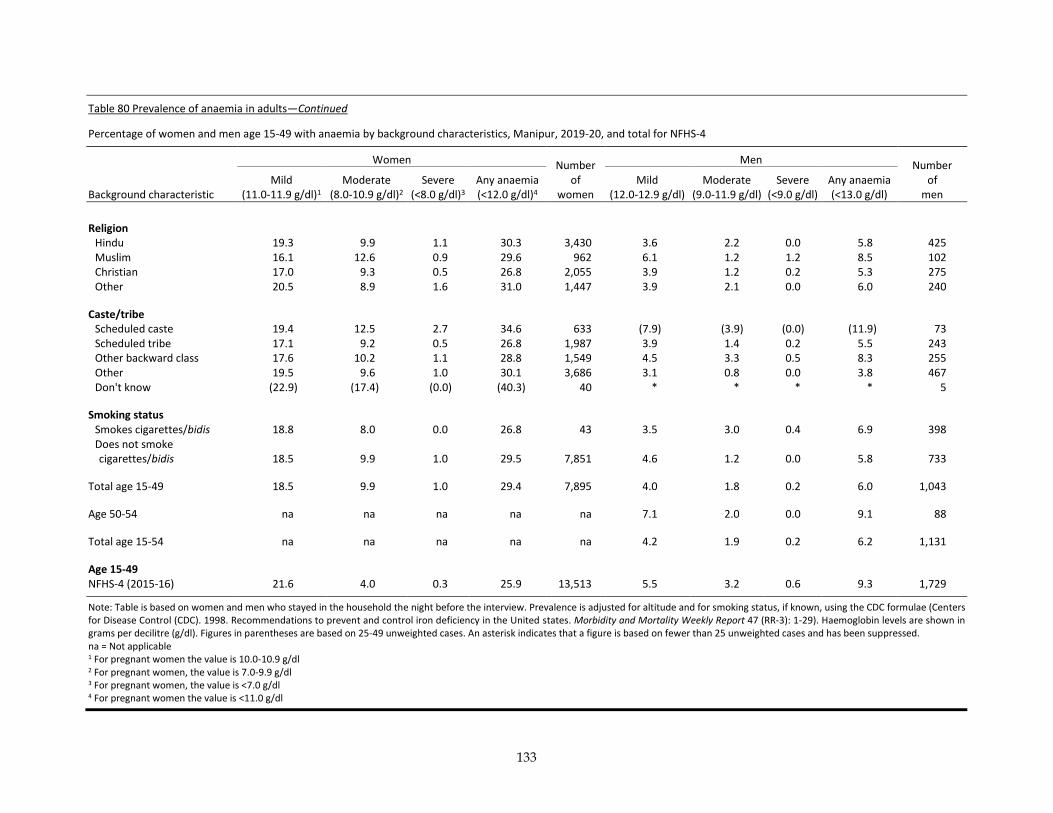
133
Table 80 Prevalence of anaemia in adults—Continued
Percentage of women and men age 15-49 with anaemia by background characteristics, Manipur, 2019-20, and total for NFHS-4
Women Number of
women
Men Number of
men Background characteristic Mild
(11.0-11.9 g/dl)1 Moderate
(8.0-10.9 g/dl)2 Severe
(<8.0 g/dl)3 Any anaemia (<12.0 g/dl)4
Mild (12.0-12.9 g/dl)
Moderate (9.0-11.9 g/dl)
Severe (<9.0 g/dl)
Any anaemia (<13.0 g/dl)
Religion Hindu 19.3 9.9 1.1 30.3 3,430 3.6 2.2 0.0 5.8 425 Muslim 16.1 12.6 0.9 29.6 962 6.1 1.2 1.2 8.5 102 Christian 17.0 9.3 0.5 26.8 2,055 3.9 1.2 0.2 5.3 275 Other 20.5 8.9 1.6 31.0 1,447 3.9 2.1 0.0 6.0 240
Caste/tribe Scheduled caste 19.4 12.5 2.7 34.6 633 (7.9) (3.9) (0.0) (11.9) 73 Scheduled tribe 17.1 9.2 0.5 26.8 1,987 3.9 1.4 0.2 5.5 243 Other backward class 17.6 10.2 1.1 28.8 1,549 4.5 3.3 0.5 8.3 255 Other 19.5 9.6 1.0 30.1 3,686 3.1 0.8 0.0 3.8 467 Don't know (22.9) (17.4) (0.0) (40.3) 40 * * * * 5
Smoking status Smokes cigarettes/bidis 18.8 8.0 0.0 26.8 43 3.5 3.0 0.4 6.9 398 Does not smoke cigarettes/bidis 18.5 9.9 1.0 29.5 7,851 4.6 1.2 0.0 5.8 733
Total age 15-49 18.5 9.9 1.0 29.4 7,895 4.0 1.8 0.2 6.0 1,043
Age 50-54 na na na na na 7.1 2.0 0.0 9.1 88
Total age 15-54 na na na na na 4.2 1.9 0.2 6.2 1,131
Age 15-49 NFHS-4 (2015-16) 21.6 4.0 0.3 25.9 13,513 5.5 3.2 0.6 9.3 1,729
Note: Table is based on women and men who stayed in the household the night before the interview. Prevalence is adjusted for altitude and for smoking status, if known, using the CDC formulae (Centers for Disease Control (CDC). 1998. Recommendations to prevent and control iron deficiency in the United states. Morbidity and Mortality Weekly Report 47 (RR-3): 1-29). Haemoglobin levels are shown in grams per decilitre (g/dl). Figures in parentheses are based on 25-49 unweighted cases. An asterisk indicates that a figure is based on fewer than 25 unweighted cases and has been suppressed. na = Not applicable 1 For pregnant women the value is 10.0-10.9 g/dl 2 For pregnant women, the value is 7.0-9.9 g/dl 3 For pregnant women, the value is <7.0 g/dl 4 For pregnant women the value is <11.0 g/dl
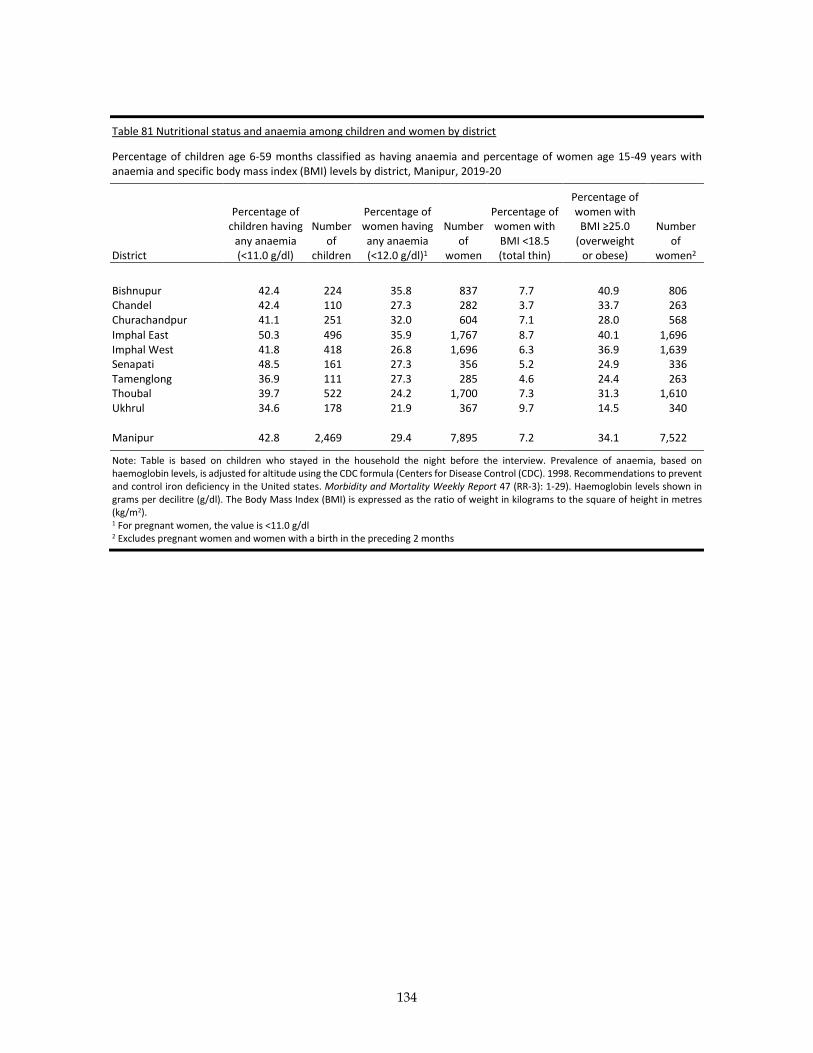
134
Table 81 Nutritional status and anaemia among children and women by district
Percentage of children age 6-59 months classified as having anaemia and percentage of women age 15-49 years with anaemia and specific body mass index (BMI) levels by district, Manipur, 2019-20
District
Percentage of children having
any anaemia (<11.0 g/dl)
Number of
children
Percentage of women having any anaemia (<12.0 g/dl)1
Number of
women
Percentage of women with
BMI <18.5 (total thin)
Percentage of women with
BMI ≥25.0 (overweight
or obese)
Number of
women2
Bishnupur 42.4 224 35.8 837 7.7 40.9 806 Chandel 42.4 110 27.3 282 3.7 33.7 263 Churachandpur 41.1 251 32.0 604 7.1 28.0 568
Imphal East 50.3 496 35.9 1,767 8.7 40.1 1,696 Imphal West 41.8 418 26.8 1,696 6.3 36.9 1,639 Senapati 48.5 161 27.3 356 5.2 24.9 336 Tamenglong 36.9 111 27.3 285 4.6 24.4 263 Thoubal 39.7 522 24.2 1,700 7.3 31.3 1,610 Ukhrul 34.6 178 21.9 367 9.7 14.5 340
Manipur 42.8 2,469 29.4 7,895 7.2 34.1 7,522
Note: Table is based on children who stayed in the household the night before the interview. Prevalence of anaemia, based on haemoglobin levels, is adjusted for altitude using the CDC formula (Centers for Disease Control (CDC). 1998. Recommendations to prevent and control iron deficiency in the United states. Morbidity and Mortality Weekly Report 47 (RR-3): 1-29). Haemoglobin levels shown in grams per decilitre (g/dl). The Body Mass Index (BMI) is expressed as the ratio of weight in kilograms to the square of height in metres (kg/m2). 1 For pregnant women, the value is <11.0 g/dl 2 Excludes pregnant women and women with a birth in the preceding 2 months
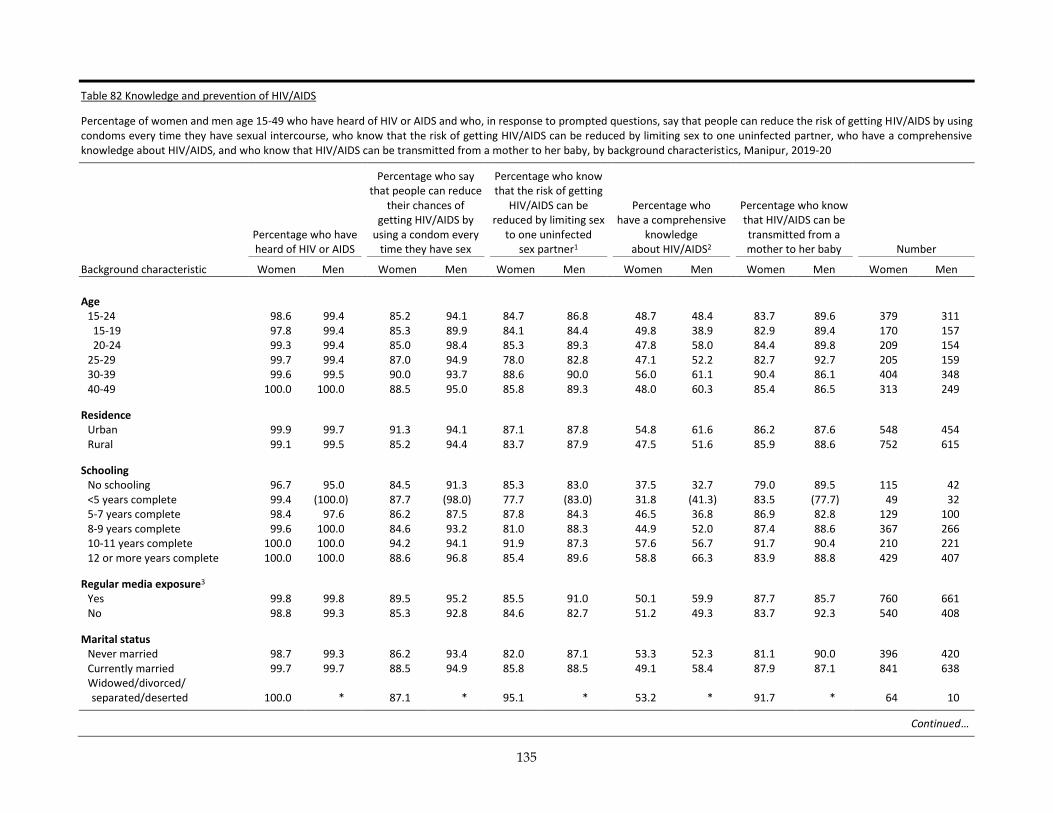
135
Table 82 Knowledge and prevention of HIV/AIDS
Percentage of women and men age 15-49 who have heard of HIV or AIDS and who, in response to prompted questions, say that people can reduce the risk of getting HIV/AIDS by using condoms every time they have sexual intercourse, who know that the risk of getting HIV/AIDS can be reduced by limiting sex to one uninfected partner, who have a comprehensive knowledge about HIV/AIDS, and who know that HIV/AIDS can be transmitted from a mother to her baby, by background characteristics, Manipur, 2019-20
Percentage who have heard of HIV or AIDS
Percentage who say that people can reduce
their chances of getting HIV/AIDS by
using a condom every time they have sex
Percentage who know that the risk of getting
HIV/AIDS can be reduced by limiting sex
to one uninfected sex partner1
Percentage who have a comprehensive
knowledge about HIV/AIDS2
Percentage who know that HIV/AIDS can be transmitted from a mother to her baby Number
Background characteristic Women Men Women Men Women Men Women Men Women Men Women Men
Age 15-24 98.6 99.4 85.2 94.1 84.7 86.8 48.7 48.4 83.7 89.6 379 311 15-19 97.8 99.4 85.3 89.9 84.1 84.4 49.8 38.9 82.9 89.4 170 157 20-24 99.3 99.4 85.0 98.4 85.3 89.3 47.8 58.0 84.4 89.8 209 154 25-29 99.7 99.4 87.0 94.9 78.0 82.8 47.1 52.2 82.7 92.7 205 159 30-39 99.6 99.5 90.0 93.7 88.6 90.0 56.0 61.1 90.4 86.1 404 348 40-49 100.0 100.0 88.5 95.0 85.8 89.3 48.0 60.3 85.4 86.5 313 249
Residence Urban 99.9 99.7 91.3 94.1 87.1 87.8 54.8 61.6 86.2 87.6 548 454 Rural 99.1 99.5 85.2 94.4 83.7 87.9 47.5 51.6 85.9 88.6 752 615
Schooling No schooling 96.7 95.0 84.5 91.3 85.3 83.0 37.5 32.7 79.0 89.5 115 42 <5 years complete 99.4 (100.0) 87.7 (98.0) 77.7 (83.0) 31.8 (41.3) 83.5 (77.7) 49 32 5-7 years complete 98.4 97.6 86.2 87.5 87.8 84.3 46.5 36.8 86.9 82.8 129 100 8-9 years complete 99.6 100.0 84.6 93.2 81.0 88.3 44.9 52.0 87.4 88.6 367 266 10-11 years complete 100.0 100.0 94.2 94.1 91.9 87.3 57.6 56.7 91.7 90.4 210 221 12 or more years complete 100.0 100.0 88.6 96.8 85.4 89.6 58.8 66.3 83.9 88.8 429 407
Regular media exposure3 Yes 99.8 99.8 89.5 95.2 85.5 91.0 50.1 59.9 87.7 85.7 760 661 No 98.8 99.3 85.3 92.8 84.6 82.7 51.2 49.3 83.7 92.3 540 408
Marital status Never married 98.7 99.3 86.2 93.4 82.0 87.1 53.3 52.3 81.1 90.0 396 420 Currently married 99.7 99.7 88.5 94.9 85.8 88.5 49.1 58.4 87.9 87.1 841 638 Widowed/divorced/ separated/deserted 100.0 * 87.1 * 95.1 * 53.2 * 91.7 * 64 10
Continued…
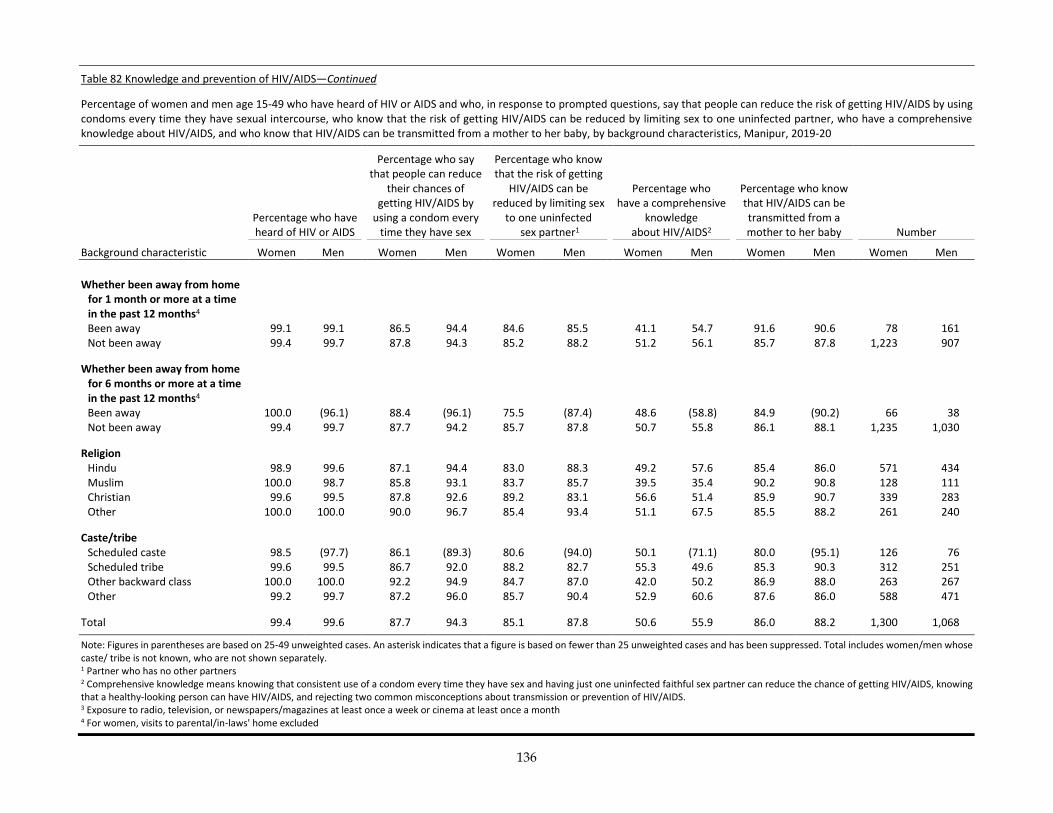
136
Table 82 Knowledge and prevention of HIV/AIDS—Continued
Percentage of women and men age 15-49 who have heard of HIV or AIDS and who, in response to prompted questions, say that people can reduce the risk of getting HIV/AIDS by using condoms every time they have sexual intercourse, who know that the risk of getting HIV/AIDS can be reduced by limiting sex to one uninfected partner, who have a comprehensive knowledge about HIV/AIDS, and who know that HIV/AIDS can be transmitted from a mother to her baby, by background characteristics, Manipur, 2019-20
Percentage who have heard of HIV or AIDS
Percentage who say that people can reduce
their chances of getting HIV/AIDS by
using a condom every time they have sex
Percentage who know that the risk of getting
HIV/AIDS can be reduced by limiting sex
to one uninfected sex partner1
Percentage who have a comprehensive
knowledge about HIV/AIDS2
Percentage who know that HIV/AIDS can be transmitted from a mother to her baby Number
Background characteristic Women Men Women Men Women Men Women Men Women Men Women Men
Whether been away from home for 1 month or more at a time in the past 12 months4 Been away 99.1 99.1 86.5 94.4 84.6 85.5 41.1 54.7 91.6 90.6 78 161 Not been away 99.4 99.7 87.8 94.3 85.2 88.2 51.2 56.1 85.7 87.8 1,223 907
Whether been away from home for 6 months or more at a time in the past 12 months4 Been away 100.0 (96.1) 88.4 (96.1) 75.5 (87.4) 48.6 (58.8) 84.9 (90.2) 66 38 Not been away 99.4 99.7 87.7 94.2 85.7 87.8 50.7 55.8 86.1 88.1 1,235 1,030
Religion Hindu 98.9 99.6 87.1 94.4 83.0 88.3 49.2 57.6 85.4 86.0 571 434 Muslim 100.0 98.7 85.8 93.1 83.7 85.7 39.5 35.4 90.2 90.8 128 111 Christian 99.6 99.5 87.8 92.6 89.2 83.1 56.6 51.4 85.9 90.7 339 283 Other 100.0 100.0 90.0 96.7 85.4 93.4 51.1 67.5 85.5 88.2 261 240
Caste/tribe Scheduled caste 98.5 (97.7) 86.1 (89.3) 80.6 (94.0) 50.1 (71.1) 80.0 (95.1) 126 76 Scheduled tribe 99.6 99.5 86.7 92.0 88.2 82.7 55.3 49.6 85.3 90.3 312 251 Other backward class 100.0 100.0 92.2 94.9 84.7 87.0 42.0 50.2 86.9 88.0 263 267 Other 99.2 99.7 87.2 96.0 85.7 90.4 52.9 60.6 87.6 86.0 588 471
Total 99.4 99.6 87.7 94.3 85.1 87.8 50.6 55.9 86.0 88.2 1,300 1,068
Note: Figures in parentheses are based on 25-49 unweighted cases. An asterisk indicates that a figure is based on fewer than 25 unweighted cases and has been suppressed. Total includes women/men whose caste/ tribe is not known, who are not shown separately. 1 Partner who has no other partners 2 Comprehensive knowledge means knowing that consistent use of a condom every time they have sex and having just one uninfected faithful sex partner can reduce the chance of getting HIV/AIDS, knowing that a healthy-looking person can have HIV/AIDS, and rejecting two common misconceptions about transmission or prevention of HIV/AIDS. 3 Exposure to radio, television, or newspapers/magazines at least once a week or cinema at least once a month 4 For women, visits to parental/in-laws' home excluded

137
Table 83.1 Accepting attitudes toward those living with HIV/AIDS: Women
Among women age 15-49 who have heard of HIV or AIDS, percentage expressing specific accepting attitudes toward people with HIV/AIDS, by background characteristic, Manipur, 2019-20
Percentage of women who:
Background characteristic
Are willing to care for a relative
with HIV/AIDS
in own home
Would buy fresh
vegetables from a
shopkeeper or vendor who has HIV/AIDS
Say that a female
teacher who has HIV/AIDS
but is not sick should be allowed to continue
teaching
Would not want to keep
secret that a family member
got infected with
HIV/AIDS
Would allow an
HIV positive
student to attend
school with students who are
HIV negative
Think that people living
with HIV/AIDS should be
treated in the same public hospital as
persons who are HIV
negative
Think that people
living with HIV should be allowed to work in the same
office with people who
are HIV negative
Express accepting attitudes
on all seven
indicators
Number of
women who have heard of HIV or AIDS
Age 15-24 82.1 83.6 86.2 80.1 85.4 71.9 88.7 45.2 373 15-19 79.0 84.2 90.3 79.7 85.4 73.8 91.1 46.7 166 20-24 84.6 83.1 82.9 80.4 85.4 70.3 86.8 44.0 207 25-29 85.1 87.9 93.6 85.7 88.1 78.3 90.1 52.9 204 30-39 84.3 87.6 87.6 84.0 85.6 78.4 88.8 54.3 402 40-49 77.0 83.3 85.7 82.2 84.3 78.7 86.7 47.1 313
Residence Urban 84.3 91.3 92.4 85.4 89.9 81.4 92.6 54.8 547 Rural 80.4 81.1 84.2 80.7 82.5 73.0 85.4 46.0 745
Schooling No schooling 77.6 77.9 84.5 74.0 84.5 74.5 85.8 40.4 111 <5 years complete 76.6 72.6 75.0 86.2 78.2 77.0 80.2 52.2 49 5-7 years complete 80.7 79.9 79.2 76.6 77.4 71.0 81.7 43.5 127 8-9 years complete 78.9 83.6 85.5 86.9 82.8 75.9 84.7 51.8 365 10-11 years complete 81.3 85.0 90.3 78.7 84.5 79.5 93.2 46.6 210 12 or more years complete 87.2 92.3 93.0 84.8 92.2 77.9 93.0 53.4 429
Regular media exposure1 Yes 84.5 86.1 90.8 83.8 88.6 77.0 92.0 50.2 759 No 78.5 84.5 83.2 81.1 81.4 76.0 83.4 49.0 534
Marital status Never married 82.0 86.6 91.0 81.4 89.1 76.5 91.7 48.8 391 Currently married 82.5 85.2 85.9 83.2 83.7 76.4 86.8 50.2 838 Widowed/divorced/ separated/deserted 76.6 82.1 91.0 84.1 89.2 80.0 91.0 48.4 64
Religion Hindu 83.0 90.4 90.9 84.0 89.4 77.2 93.0 53.2 565 Muslim 81.4 75.9 85.9 89.6 83.5 75.0 83.3 51.4 128 Christian 81.9 82.5 85.2 81.9 80.3 78.1 84.4 47.9 338 Other 80.5 83.2 84.7 77.4 85.3 74.2 86.4 43.7 261
Caste/tribe Scheduled caste 72.6 93.4 83.6 81.9 81.1 71.2 82.7 39.9 124 Scheduled tribe 81.1 80.6 84.0 81.8 80.5 76.1 84.4 48.8 310 Other backward class 80.6 80.2 88.0 86.9 89.7 77.1 88.4 49.6 263 Other 85.3 88.8 90.8 82.1 87.7 78.6 92.1 52.9 583
Total 82.0 85.4 87.7 82.7 85.6 76.6 88.5 49.7 1,292
Note: Total includes women whose caste/tribe is not known, who are not shown separately. 1 Exposure to radio, television, or newspapers/magazines at least once a week or cinema at least once a month
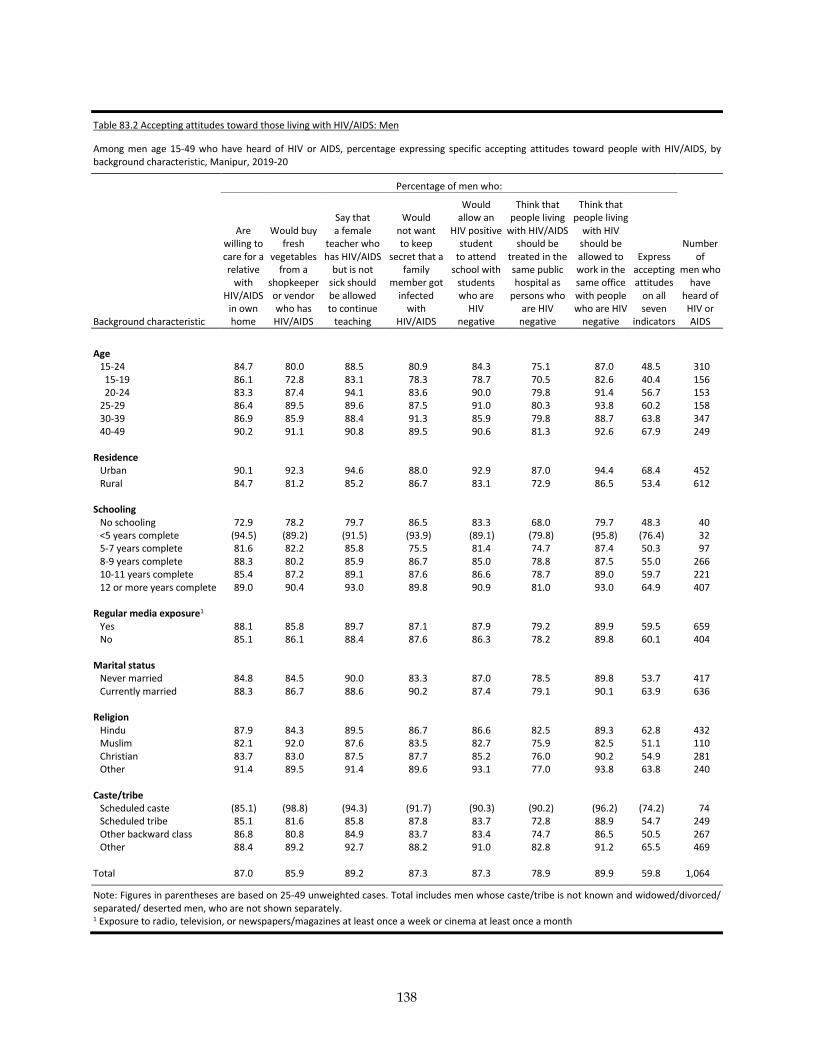
138
Table 83.2 Accepting attitudes toward those living with HIV/AIDS: Men
Among men age 15-49 who have heard of HIV or AIDS, percentage expressing specific accepting attitudes toward people with HIV/AIDS, by background characteristic, Manipur, 2019-20
Percentage of men who:
Background characteristic
Are willing to care for a relative
with HIV/AIDS
in own home
Would buy fresh
vegetables from a
shopkeeper or vendor who has HIV/AIDS
Say that a female
teacher who has HIV/AIDS
but is not sick should be allowed to continue
teaching
Would not want to keep
secret that a family
member got infected
with HIV/AIDS
Would allow an
HIV positive student
to attend school with
students who are
HIV negative
Think that people living
with HIV/AIDS should be
treated in the same public hospital as
persons who are HIV
negative
Think that people living
with HIV should be allowed to work in the same office with people who are HIV
negative
Express accepting attitudes
on all seven
indicators
Number of
men who have
heard of HIV or AIDS
Age
15-24 84.7 80.0 88.5 80.9 84.3 75.1 87.0 48.5 310 15-19 86.1 72.8 83.1 78.3 78.7 70.5 82.6 40.4 156 20-24 83.3 87.4 94.1 83.6 90.0 79.8 91.4 56.7 153 25-29 86.4 89.5 89.6 87.5 91.0 80.3 93.8 60.2 158 30-39 86.9 85.9 88.4 91.3 85.9 79.8 88.7 63.8 347 40-49 90.2 91.1 90.8 89.5 90.6 81.3 92.6 67.9 249
Residence Urban 90.1 92.3 94.6 88.0 92.9 87.0 94.4 68.4 452 Rural 84.7 81.2 85.2 86.7 83.1 72.9 86.5 53.4 612
Schooling No schooling 72.9 78.2 79.7 86.5 83.3 68.0 79.7 48.3 40 <5 years complete (94.5) (89.2) (91.5) (93.9) (89.1) (79.8) (95.8) (76.4) 32 5-7 years complete 81.6 82.2 85.8 75.5 81.4 74.7 87.4 50.3 97 8-9 years complete 88.3 80.2 85.9 86.7 85.0 78.8 87.5 55.0 266 10-11 years complete 85.4 87.2 89.1 87.6 86.6 78.7 89.0 59.7 221 12 or more years complete 89.0 90.4 93.0 89.8 90.9 81.0 93.0 64.9 407
Regular media exposure1 Yes 88.1 85.8 89.7 87.1 87.9 79.2 89.9 59.5 659 No 85.1 86.1 88.4 87.6 86.3 78.2 89.8 60.1 404
Marital status Never married 84.8 84.5 90.0 83.3 87.0 78.5 89.8 53.7 417 Currently married 88.3 86.7 88.6 90.2 87.4 79.1 90.1 63.9 636
Religion Hindu 87.9 84.3 89.5 86.7 86.6 82.5 89.3 62.8 432 Muslim 82.1 92.0 87.6 83.5 82.7 75.9 82.5 51.1 110 Christian 83.7 83.0 87.5 87.7 85.2 76.0 90.2 54.9 281 Other 91.4 89.5 91.4 89.6 93.1 77.0 93.8 63.8 240
Caste/tribe Scheduled caste (85.1) (98.8) (94.3) (91.7) (90.3) (90.2) (96.2) (74.2) 74 Scheduled tribe 85.1 81.6 85.8 87.8 83.7 72.8 88.9 54.7 249 Other backward class 86.8 80.8 84.9 83.7 83.4 74.7 86.5 50.5 267 Other 88.4 89.2 92.7 88.2 91.0 82.8 91.2 65.5 469
Total 87.0 85.9 89.2 87.3 87.3 78.9 89.9 59.8 1,064
Note: Figures in parentheses are based on 25-49 unweighted cases. Total includes men whose caste/tribe is not known and widowed/divorced/ separated/ deserted men, who are not shown separately. 1 Exposure to radio, television, or newspapers/magazines at least once a week or cinema at least once a month
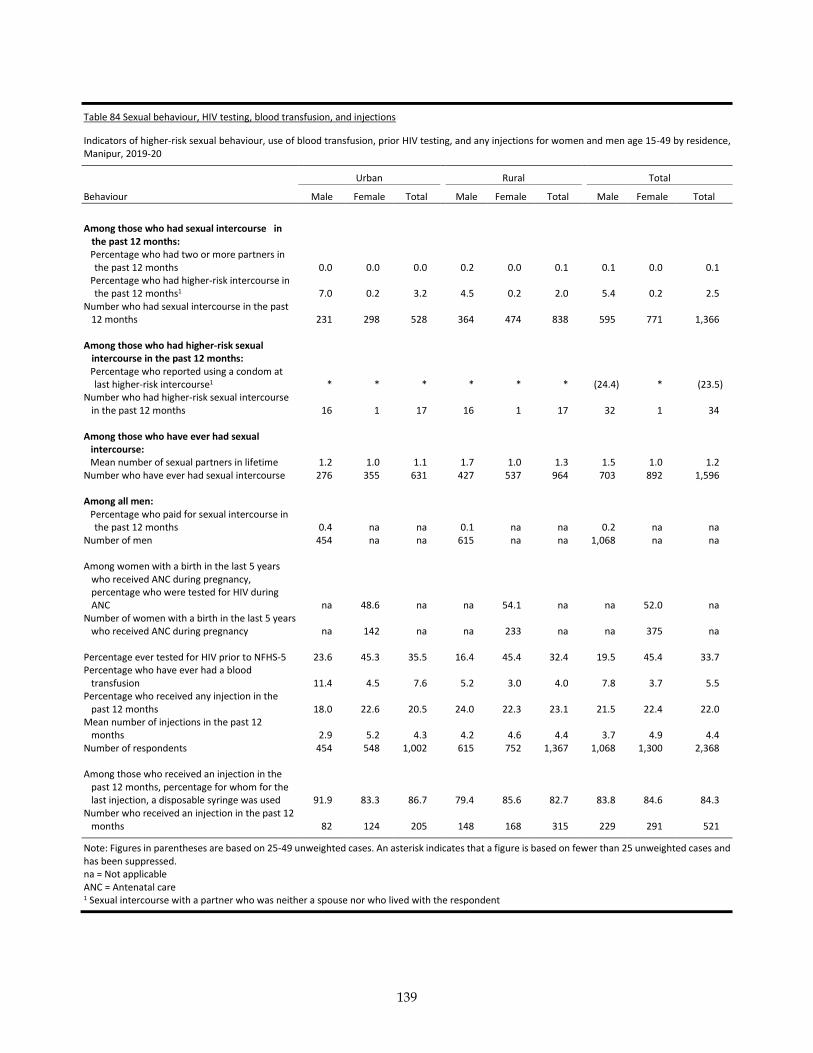
139
Table 84 Sexual behaviour, HIV testing, blood transfusion, and injections
Indicators of higher-risk sexual behaviour, use of blood transfusion, prior HIV testing, and any injections for women and men age 15-49 by residence, Manipur, 2019-20
Urban Rural Total
Behaviour Male Female Total Male Female Total Male Female Total
Among those who had sexual intercourse in
the past 12 months: Percentage who had two or more partners in the past 12 months 0.0 0.0 0.0 0.2 0.0 0.1 0.1 0.0 0.1
Percentage who had higher-risk intercourse in the past 12 months1 7.0 0.2 3.2 4.5 0.2 2.0 5.4 0.2 2.5
Number who had sexual intercourse in the past 12 months 231 298 528 364 474 838 595 771 1,366
Among those who had higher-risk sexual intercourse in the past 12 months: Percentage who reported using a condom at last higher-risk intercourse1 * * * * * * (24.4) * (23.5)
Number who had higher-risk sexual intercourse in the past 12 months 16 1 17 16 1 17 32 1 34
Among those who have ever had sexual intercourse: Mean number of sexual partners in lifetime 1.2 1.0 1.1 1.7 1.0 1.3 1.5 1.0 1.2
Number who have ever had sexual intercourse 276 355 631 427 537 964 703 892 1,596
Among all men: Percentage who paid for sexual intercourse in the past 12 months 0.4 na na 0.1 na na 0.2 na na
Number of men 454 na na 615 na na 1,068 na na Among women with a birth in the last 5 years
who received ANC during pregnancy, percentage who were tested for HIV during ANC na 48.6 na na 54.1 na na 52.0 na
Number of women with a birth in the last 5 years who received ANC during pregnancy na 142 na na 233 na na 375 na
Percentage ever tested for HIV prior to NFHS-5 23.6 45.3 35.5 16.4 45.4 32.4 19.5 45.4 33.7 Percentage who have ever had a blood
transfusion 11.4 4.5 7.6 5.2 3.0 4.0 7.8 3.7 5.5 Percentage who received any injection in the
past 12 months 18.0 22.6 20.5 24.0 22.3 23.1 21.5 22.4 22.0 Mean number of injections in the past 12
months 2.9 5.2 4.3 4.2 4.6 4.4 3.7 4.9 4.4 Number of respondents 454 548 1,002 615 752 1,367 1,068 1,300 2,368 Among those who received an injection in the
past 12 months, percentage for whom for the last injection, a disposable syringe was used 91.9 83.3 86.7 79.4 85.6 82.7 83.8 84.6 84.3
Number who received an injection in the past 12 months 82 124 205 148 168 315 229 291 521
Note: Figures in parentheses are based on 25-49 unweighted cases. An asterisk indicates that a figure is based on fewer than 25 unweighted cases and has been suppressed. na = Not applicable ANC = Antenatal care 1 Sexual intercourse with a partner who was neither a spouse nor who lived with the respondent
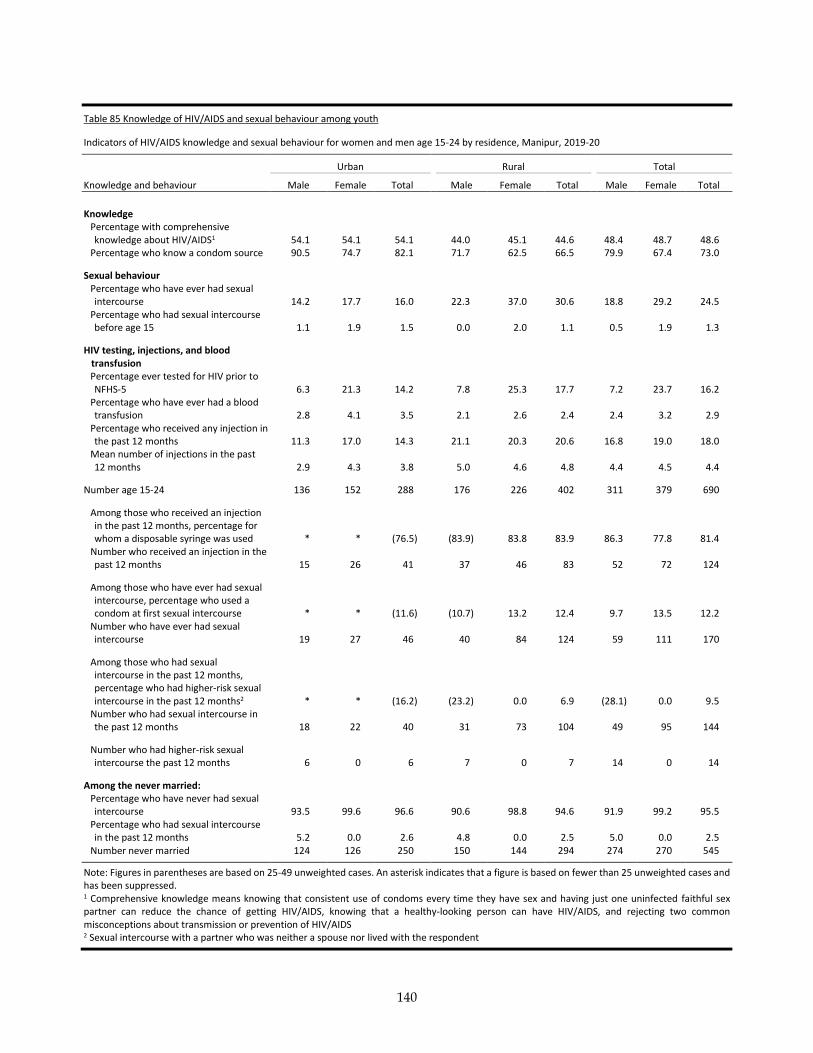
140
Table 85 Knowledge of HIV/AIDS and sexual behaviour among youth
Indicators of HIV/AIDS knowledge and sexual behaviour for women and men age 15-24 by residence, Manipur, 2019-20
Urban Rural Total
Knowledge and behaviour Male Female Total Male Female Total Male Female Total
Knowledge Percentage with comprehensive knowledge about HIV/AIDS1 54.1 54.1 54.1 44.0 45.1 44.6 48.4 48.7 48.6
Percentage who know a condom source 90.5 74.7 82.1 71.7 62.5 66.5 79.9 67.4 73.0
Sexual behaviour Percentage who have ever had sexual intercourse 14.2 17.7 16.0 22.3 37.0 30.6 18.8 29.2 24.5
Percentage who had sexual intercourse before age 15 1.1 1.9 1.5 0.0 2.0 1.1 0.5 1.9 1.3
HIV testing, injections, and blood transfusion Percentage ever tested for HIV prior to NFHS-5 6.3 21.3 14.2 7.8 25.3 17.7 7.2 23.7 16.2
Percentage who have ever had a blood transfusion 2.8 4.1 3.5 2.1 2.6 2.4 2.4 3.2 2.9
Percentage who received any injection in the past 12 months 11.3 17.0 14.3 21.1 20.3 20.6 16.8 19.0 18.0
Mean number of injections in the past 12 months 2.9 4.3 3.8 5.0 4.6 4.8 4.4 4.5 4.4
Number age 15-24 136 152 288 176 226 402 311 379 690
Among those who received an injection in the past 12 months, percentage for whom a disposable syringe was used * * (76.5) (83.9) 83.8 83.9 86.3 77.8 81.4
Number who received an injection in the past 12 months 15 26 41 37 46 83 52 72 124
Among those who have ever had sexual intercourse, percentage who used a condom at first sexual intercourse * * (11.6) (10.7) 13.2 12.4 9.7 13.5 12.2
Number who have ever had sexual intercourse 19 27 46 40 84 124 59 111 170
Among those who had sexual intercourse in the past 12 months, percentage who had higher-risk sexual intercourse in the past 12 months2 * * (16.2) (23.2) 0.0 6.9 (28.1) 0.0 9.5
Number who had sexual intercourse in the past 12 months 18 22 40 31 73 104 49 95 144
Number who had higher-risk sexual intercourse the past 12 months 6 0 6 7 0 7 14 0 14
Among the never married: Percentage who have never had sexual intercourse 93.5 99.6 96.6 90.6 98.8 94.6 91.9 99.2 95.5
Percentage who had sexual intercourse in the past 12 months 5.2 0.0 2.6 4.8 0.0 2.5 5.0 0.0 2.5
Number never married 124 126 250 150 144 294 274 270 545
Note: Figures in parentheses are based on 25-49 unweighted cases. An asterisk indicates that a figure is based on fewer than 25 unweighted cases and has been suppressed. 1 Comprehensive knowledge means knowing that consistent use of condoms every time they have sex and having just one uninfected faithful sex partner can reduce the chance of getting HIV/AIDS, knowing that a healthy-looking person can have HIV/AIDS, and rejecting two common misconceptions about transmission or prevention of HIV/AIDS 2 Sexual intercourse with a partner who was neither a spouse nor lived with the respondent
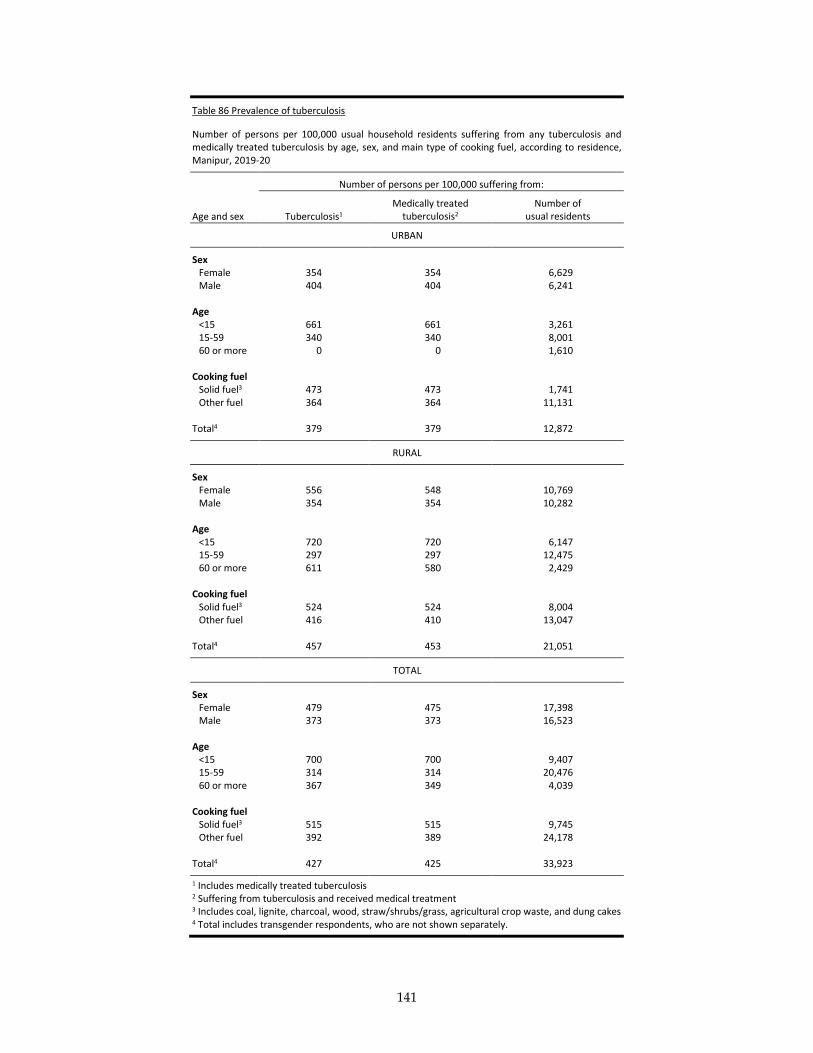
141
Table 86 Prevalence of tuberculosis
Number of persons per 100,000 usual household residents suffering from any tuberculosis and medically treated tuberculosis by age, sex, and main type of cooking fuel, according to residence, Manipur, 2019-20
Age and sex
Number of persons per 100,000 suffering from:
Tuberculosis1 Medically treated
tuberculosis2 Number of
usual residents
URBAN
Sex Female 354 354 6,629 Male 404 404 6,241
Age
<15 661 661 3,261 15-59 340 340 8,001 60 or more 0 0 1,610
Cooking fuel
Solid fuel3 473 473 1,741 Other fuel 364 364 11,131
Total4 379 379 12,872
RURAL
Sex Female 556 548 10,769 Male 354 354 10,282
Age
<15 720 720 6,147 15-59 297 297 12,475 60 or more 611 580 2,429
Cooking fuel
Solid fuel3 524 524 8,004 Other fuel 416 410 13,047
Total4 457 453 21,051
TOTAL
Sex Female 479 475 17,398 Male 373 373 16,523
Age
<15 700 700 9,407 15-59 314 314 20,476 60 or more 367 349 4,039
Cooking fuel
Solid fuel3 515 515 9,745 Other fuel 392 389 24,178
Total4 427 425 33,923
1 Includes medically treated tuberculosis 2 Suffering from tuberculosis and received medical treatment 3 Includes coal, lignite, charcoal, wood, straw/shrubs/grass, agricultural crop waste, and dung cakes 4 Total includes transgender respondents, who are not shown separately.
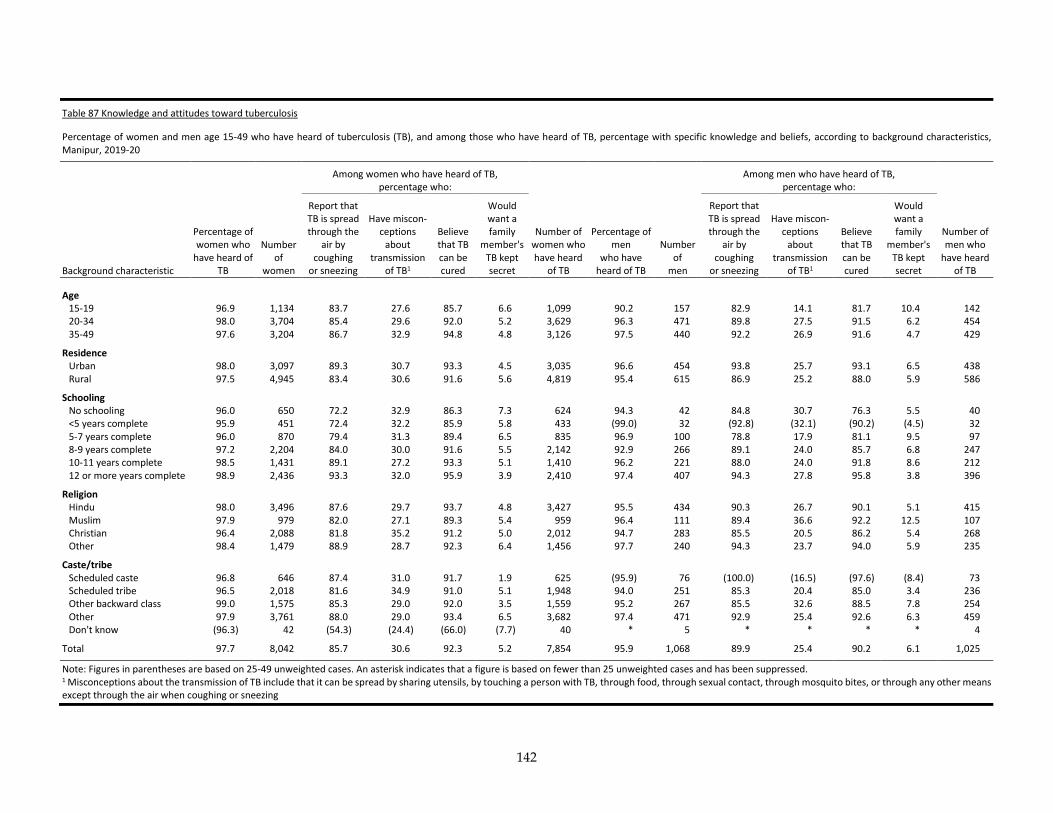
142
Table 87 Knowledge and attitudes toward tuberculosis
Percentage of women and men age 15-49 who have heard of tuberculosis (TB), and among those who have heard of TB, percentage with specific knowledge and beliefs, according to background characteristics, Manipur, 2019-20
Among women who have heard of TB, percentage who:
Among men who have heard of TB, percentage who:
Background characteristic
Percentage of women who
have heard of TB
Number of
women
Report that TB is spread through the
air by coughing
or sneezing
Have miscon-ceptions
about transmission
of TB1
Believe that TB can be cured
Would want a family
member's TB kept secret
Number of women who have heard
of TB
Percentage of men
who have heard of TB
Number of
men
Report that TB is spread through the
air by coughing
or sneezing
Have miscon-ceptions
about transmission
of TB1
Believe that TB can be cured
Would want a family
member's TB kept secret
Number of men who
have heard of TB
Age 15-19 96.9 1,134 83.7 27.6 85.7 6.6 1,099 90.2 157 82.9 14.1 81.7 10.4 142 20-34 98.0 3,704 85.4 29.6 92.0 5.2 3,629 96.3 471 89.8 27.5 91.5 6.2 454 35-49 97.6 3,204 86.7 32.9 94.8 4.8 3,126 97.5 440 92.2 26.9 91.6 4.7 429
Residence Urban 98.0 3,097 89.3 30.7 93.3 4.5 3,035 96.6 454 93.8 25.7 93.1 6.5 438 Rural 97.5 4,945 83.4 30.6 91.6 5.6 4,819 95.4 615 86.9 25.2 88.0 5.9 586
Schooling No schooling 96.0 650 72.2 32.9 86.3 7.3 624 94.3 42 84.8 30.7 76.3 5.5 40 <5 years complete 95.9 451 72.4 32.2 85.9 5.8 433 (99.0) 32 (92.8) (32.1) (90.2) (4.5) 32 5-7 years complete 96.0 870 79.4 31.3 89.4 6.5 835 96.9 100 78.8 17.9 81.1 9.5 97 8-9 years complete 97.2 2,204 84.0 30.0 91.6 5.5 2,142 92.9 266 89.1 24.0 85.7 6.8 247 10-11 years complete 98.5 1,431 89.1 27.2 93.3 5.1 1,410 96.2 221 88.0 24.0 91.8 8.6 212 12 or more years complete 98.9 2,436 93.3 32.0 95.9 3.9 2,410 97.4 407 94.3 27.8 95.8 3.8 396
Religion Hindu 98.0 3,496 87.6 29.7 93.7 4.8 3,427 95.5 434 90.3 26.7 90.1 5.1 415 Muslim 97.9 979 82.0 27.1 89.3 5.4 959 96.4 111 89.4 36.6 92.2 12.5 107 Christian 96.4 2,088 81.8 35.2 91.2 5.0 2,012 94.7 283 85.5 20.5 86.2 5.4 268 Other 98.4 1,479 88.9 28.7 92.3 6.4 1,456 97.7 240 94.3 23.7 94.0 5.9 235
Caste/tribe Scheduled caste 96.8 646 87.4 31.0 91.7 1.9 625 (95.9) 76 (100.0) (16.5) (97.6) (8.4) 73 Scheduled tribe 96.5 2,018 81.6 34.9 91.0 5.1 1,948 94.0 251 85.3 20.4 85.0 3.4 236 Other backward class 99.0 1,575 85.3 29.0 92.0 3.5 1,559 95.2 267 85.5 32.6 88.5 7.8 254 Other 97.9 3,761 88.0 29.0 93.4 6.5 3,682 97.4 471 92.9 25.4 92.6 6.3 459 Don't know (96.3) 42 (54.3) (24.4) (66.0) (7.7) 40 * 5 * * * * 4
Total 97.7 8,042 85.7 30.6 92.3 5.2 7,854 95.9 1,068 89.9 25.4 90.2 6.1 1,025
Note: Figures in parentheses are based on 25-49 unweighted cases. An asterisk indicates that a figure is based on fewer than 25 unweighted cases and has been suppressed. 1 Misconceptions about the transmission of TB include that it can be spread by sharing utensils, by touching a person with TB, through food, through sexual contact, through mosquito bites, or through any other means except through the air when coughing or sneezing
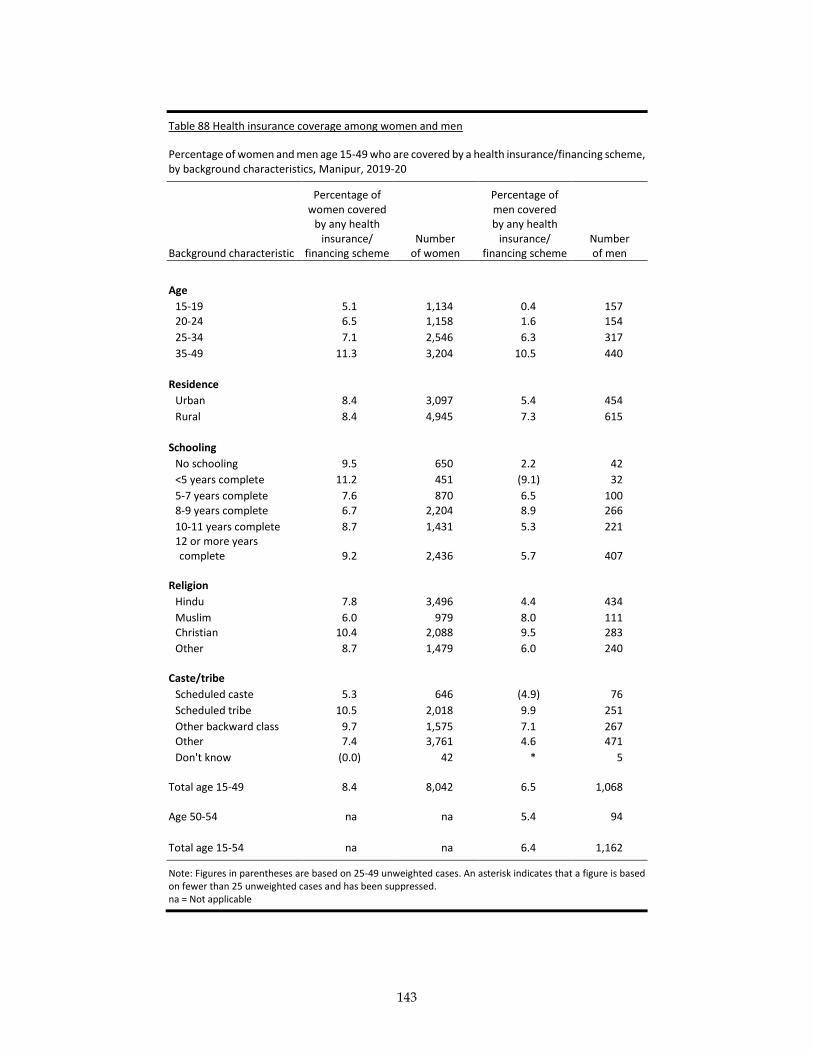
143
Table 88 Health insurance coverage among women and men
Percentage of women and men age 15-49 who are covered by a health insurance/financing scheme, by background characteristics, Manipur, 2019-20
Background characteristic
Percentage of women covered
by any health insurance/
financing scheme Number
of women
Percentage of men covered by any health
insurance/ financing scheme
Number of men
Age
15-19 5.1 1,134 0.4 157 20-24 6.5 1,158 1.6 154
25-34 7.1 2,546 6.3 317
35-49 11.3 3,204 10.5 440
Residence
Urban 8.4 3,097 5.4 454
Rural 8.4 4,945 7.3 615
Schooling
No schooling 9.5 650 2.2 42
<5 years complete 11.2 451 (9.1) 32
5-7 years complete 7.6 870 6.5 100 8-9 years complete 6.7 2,204 8.9 266
10-11 years complete 8.7 1,431 5.3 221 12 or more years complete 9.2 2,436 5.7 407
Religion
Hindu 7.8 3,496 4.4 434
Muslim 6.0 979 8.0 111 Christian 10.4 2,088 9.5 283
Other 8.7 1,479 6.0 240
Caste/tribe
Scheduled caste 5.3 646 (4.9) 76
Scheduled tribe 10.5 2,018 9.9 251
Other backward class 9.7 1,575 7.1 267 Other 7.4 3,761 4.6 471
Don't know (0.0) 42 * 5
Total age 15-49 8.4 8,042 6.5 1,068
Age 50-54 na na 5.4 94
Total age 15-54 na na 6.4 1,162
Note: Figures in parentheses are based on 25-49 unweighted cases. An asterisk indicates that a figure is based on fewer than 25 unweighted cases and has been suppressed. na = Not applicable
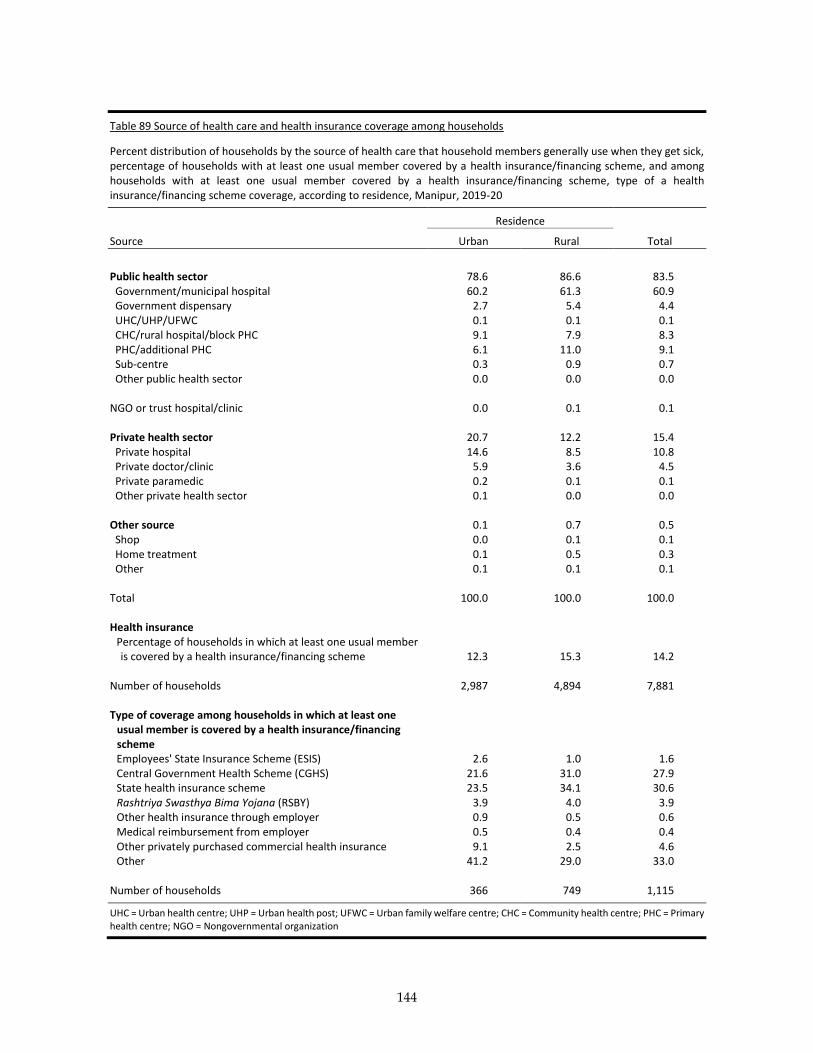
144
Table 89 Source of health care and health insurance coverage among households
Percent distribution of households by the source of health care that household members generally use when they get sick, percentage of households with at least one usual member covered by a health insurance/financing scheme, and among households with at least one usual member covered by a health insurance/financing scheme, type of a health insurance/financing scheme coverage, according to residence, Manipur, 2019-20
Residence
Source Urban Rural Total
Public health sector 78.6 86.6 83.5 Government/municipal hospital 60.2 61.3 60.9 Government dispensary 2.7 5.4 4.4 UHC/UHP/UFWC 0.1 0.1 0.1 CHC/rural hospital/block PHC 9.1 7.9 8.3 PHC/additional PHC 6.1 11.0 9.1 Sub-centre 0.3 0.9 0.7 Other public health sector 0.0 0.0 0.0 NGO or trust hospital/clinic 0.0 0.1 0.1 Private health sector 20.7 12.2 15.4 Private hospital 14.6 8.5 10.8 Private doctor/clinic 5.9 3.6 4.5 Private paramedic 0.2 0.1 0.1 Other private health sector 0.1 0.0 0.0 Other source 0.1 0.7 0.5 Shop 0.0 0.1 0.1 Home treatment 0.1 0.5 0.3 Other 0.1 0.1 0.1 Total 100.0 100.0 100.0 Health insurance
Percentage of households in which at least one usual member is covered by a health insurance/financing scheme 12.3 15.3 14.2
Number of households 2,987 4,894 7,881
Type of coverage among households in which at least one
usual member is covered by a health insurance/financing scheme Employees' State Insurance Scheme (ESIS) 2.6 1.0 1.6 Central Government Health Scheme (CGHS) 21.6 31.0 27.9 State health insurance scheme 23.5 34.1 30.6 Rashtriya Swasthya Bima Yojana (RSBY) 3.9 4.0 3.9 Other health insurance through employer 0.9 0.5 0.6 Medical reimbursement from employer 0.5 0.4 0.4 Other privately purchased commercial health insurance 9.1 2.5 4.6 Other 41.2 29.0 33.0
Number of households 366 749 1,115
UHC = Urban health centre; UHP = Urban health post; UFWC = Urban family welfare centre; CHC = Community health centre; PHC = Primary health centre; NGO = Nongovernmental organization
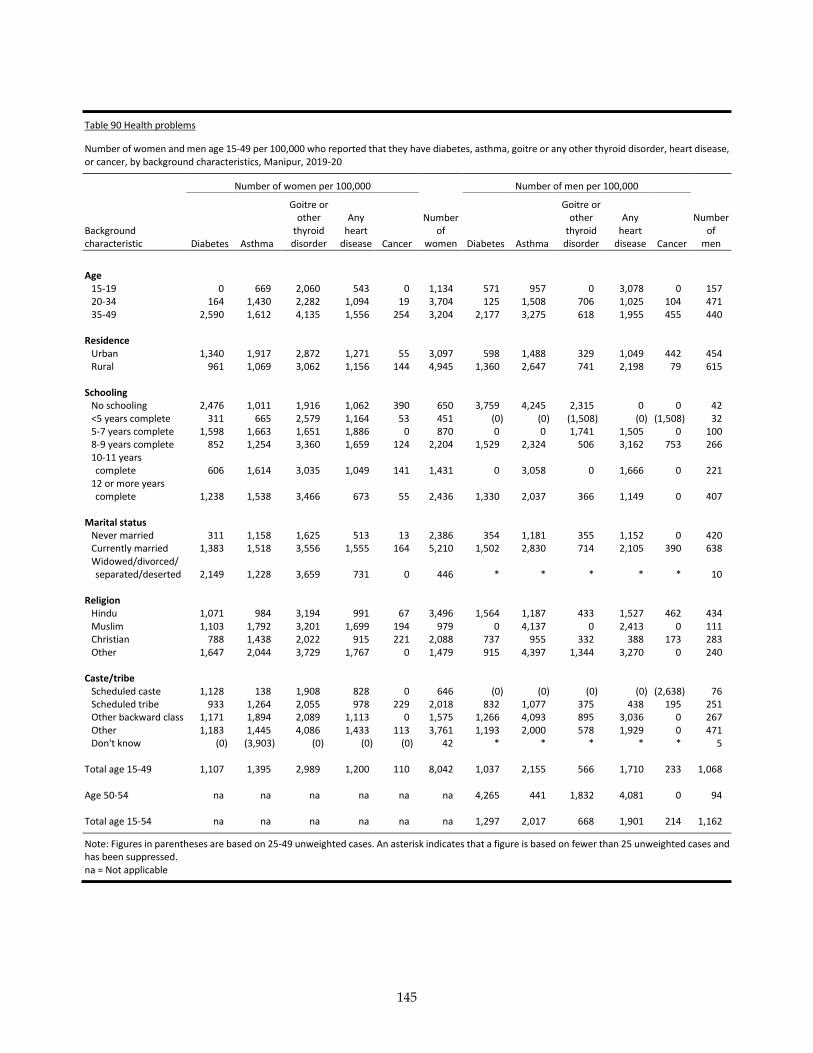
145
Table 90 Health problems
Number of women and men age 15-49 per 100,000 who reported that they have diabetes, asthma, goitre or any other thyroid disorder, heart disease, or cancer, by background characteristics, Manipur, 2019-20
Number of women per 100,000 Number of men per 100,000
Background characteristic Diabetes Asthma
Goitre or other
thyroid disorder
Any heart
disease Cancer
Number of
women Diabetes Asthma
Goitre or other
thyroid disorder
Any heart
disease Cancer
Number of
men
Age
15-19 0 669 2,060 543 0 1,134 571 957 0 3,078 0 157 20-34 164 1,430 2,282 1,094 19 3,704 125 1,508 706 1,025 104 471 35-49 2,590 1,612 4,135 1,556 254 3,204 2,177 3,275 618 1,955 455 440
Residence Urban 1,340 1,917 2,872 1,271 55 3,097 598 1,488 329 1,049 442 454 Rural 961 1,069 3,062 1,156 144 4,945 1,360 2,647 741 2,198 79 615
Schooling No schooling 2,476 1,011 1,916 1,062 390 650 3,759 4,245 2,315 0 0 42 <5 years complete 311 665 2,579 1,164 53 451 (0) (0) (1,508) (0) (1,508) 32 5-7 years complete 1,598 1,663 1,651 1,886 0 870 0 0 1,741 1,505 0 100 8-9 years complete 852 1,254 3,360 1,659 124 2,204 1,529 2,324 506 3,162 753 266 10-11 years complete 606 1,614 3,035 1,049 141 1,431 0 3,058 0 1,666 0 221
12 or more years complete 1,238 1,538 3,466 673 55 2,436 1,330 2,037 366 1,149 0 407
Marital status
Never married 311 1,158 1,625 513 13 2,386 354 1,181 355 1,152 0 420 Currently married 1,383 1,518 3,556 1,555 164 5,210 1,502 2,830 714 2,105 390 638 Widowed/divorced/ separated/deserted 2,149 1,228 3,659 731 0 446 * * * * * 10
Religion
Hindu 1,071 984 3,194 991 67 3,496 1,564 1,187 433 1,527 462 434 Muslim 1,103 1,792 3,201 1,699 194 979 0 4,137 0 2,413 0 111 Christian 788 1,438 2,022 915 221 2,088 737 955 332 388 173 283 Other 1,647 2,044 3,729 1,767 0 1,479 915 4,397 1,344 3,270 0 240
Caste/tribe Scheduled caste 1,128 138 1,908 828 0 646 (0) (0) (0) (0) (2,638) 76 Scheduled tribe 933 1,264 2,055 978 229 2,018 832 1,077 375 438 195 251 Other backward class 1,171 1,894 2,089 1,113 0 1,575 1,266 4,093 895 3,036 0 267 Other 1,183 1,445 4,086 1,433 113 3,761 1,193 2,000 578 1,929 0 471 Don't know (0) (3,903) (0) (0) (0) 42 * * * * * 5
Total age 15-49 1,107 1,395 2,989 1,200 110 8,042 1,037 2,155 566 1,710 233 1,068 Age 50-54 na na na na na na 4,265 441 1,832 4,081 0 94 Total age 15-54 na na na na na na 1,297 2,017 668 1,901 214 1,162
Note: Figures in parentheses are based on 25-49 unweighted cases. An asterisk indicates that a figure is based on fewer than 25 unweighted cases and has been suppressed. na = Not applicable
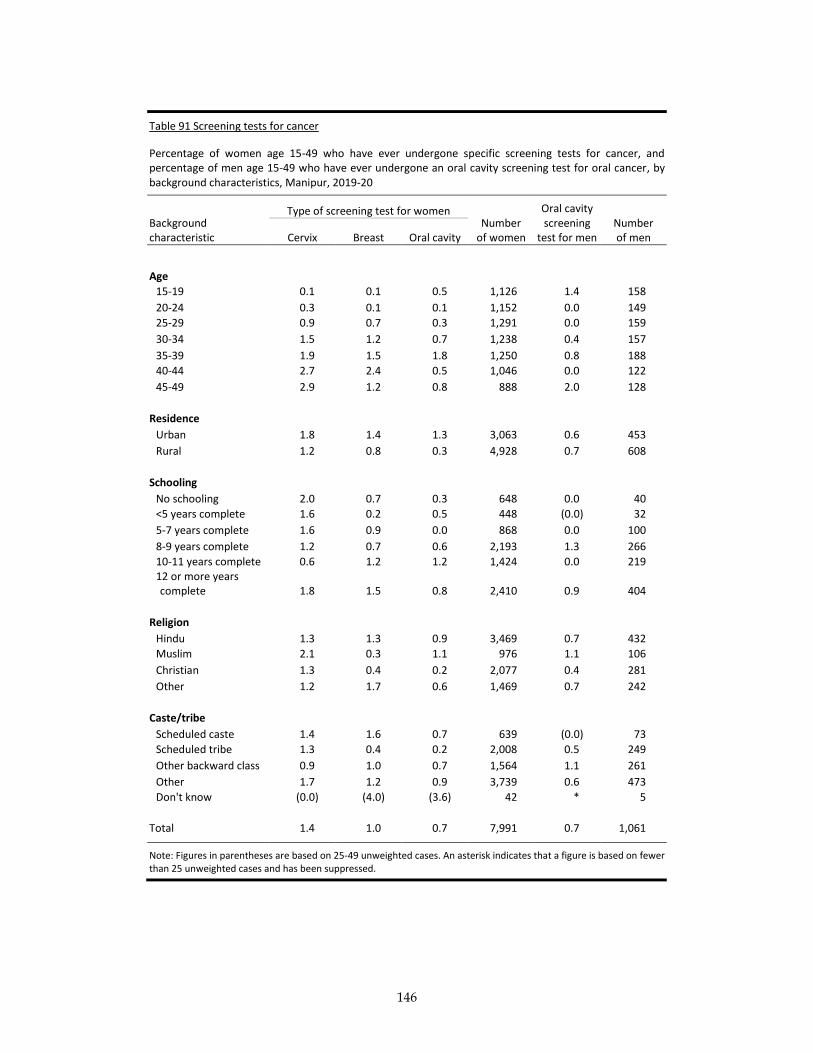
146
Table 91 Screening tests for cancer
Percentage of women age 15-49 who have ever undergone specific screening tests for cancer, and percentage of men age 15-49 who have ever undergone an oral cavity screening test for oral cancer, by background characteristics, Manipur, 2019-20
Background characteristic
Type of screening test for women Number
of women
Oral cavity screening
test for men Number of men Cervix Breast Oral cavity
Age
15-19 0.1 0.1 0.5 1,126 1.4 158
20-24 0.3 0.1 0.1 1,152 0.0 149
25-29 0.9 0.7 0.3 1,291 0.0 159
30-34 1.5 1.2 0.7 1,238 0.4 157
35-39 1.9 1.5 1.8 1,250 0.8 188
40-44 2.7 2.4 0.5 1,046 0.0 122
45-49 2.9 1.2 0.8 888 2.0 128
Residence
Urban 1.8 1.4 1.3 3,063 0.6 453
Rural 1.2 0.8 0.3 4,928 0.7 608
Schooling
No schooling 2.0 0.7 0.3 648 0.0 40
<5 years complete 1.6 0.2 0.5 448 (0.0) 32
5-7 years complete 1.6 0.9 0.0 868 0.0 100
8-9 years complete 1.2 0.7 0.6 2,193 1.3 266
10-11 years complete 0.6 1.2 1.2 1,424 0.0 219 12 or more years complete 1.8 1.5 0.8 2,410 0.9 404
Religion
Hindu 1.3 1.3 0.9 3,469 0.7 432
Muslim 2.1 0.3 1.1 976 1.1 106
Christian 1.3 0.4 0.2 2,077 0.4 281
Other 1.2 1.7 0.6 1,469 0.7 242
Caste/tribe
Scheduled caste 1.4 1.6 0.7 639 (0.0) 73
Scheduled tribe 1.3 0.4 0.2 2,008 0.5 249
Other backward class 0.9 1.0 0.7 1,564 1.1 261
Other 1.7 1.2 0.9 3,739 0.6 473
Don't know (0.0) (4.0) (3.6) 42 * 5
Total 1.4 1.0 0.7 7,991 0.7 1,061
Note: Figures in parentheses are based on 25-49 unweighted cases. An asterisk indicates that a figure is based on fewer than 25 unweighted cases and has been suppressed.
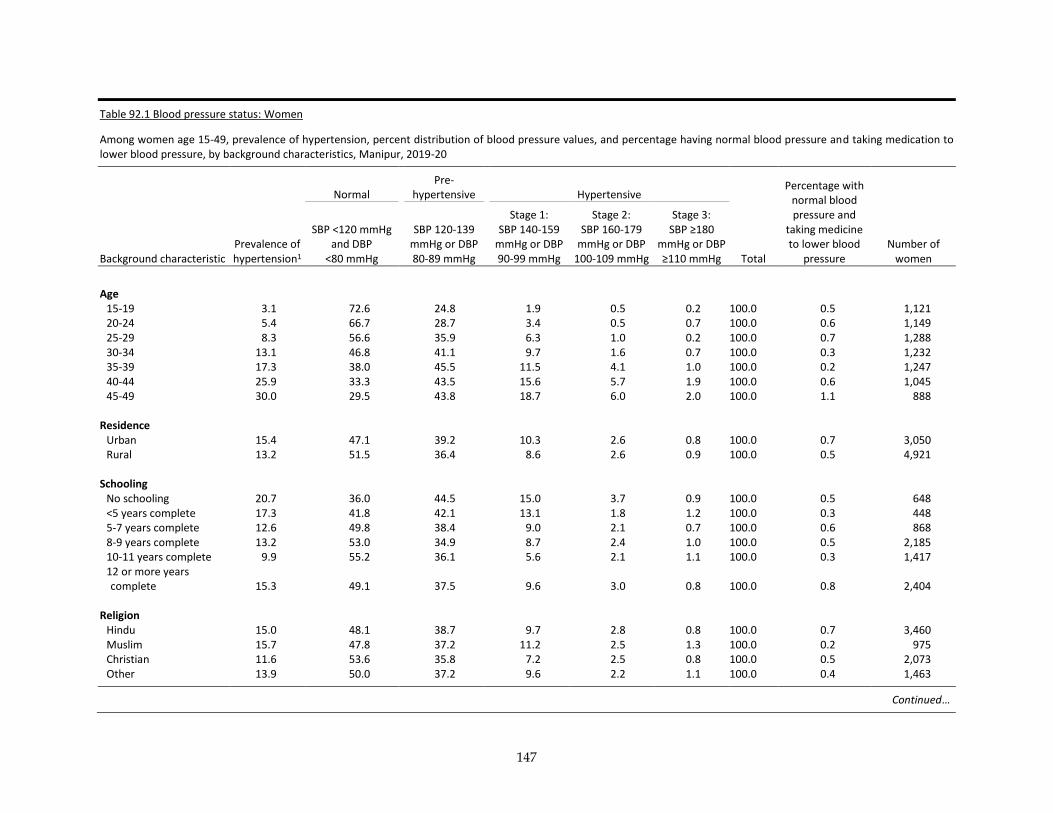
147
Table 92.1 Blood pressure status: Women
Among women age 15-49, prevalence of hypertension, percent distribution of blood pressure values, and percentage having normal blood pressure and taking medication to lower blood pressure, by background characteristics, Manipur, 2019-20
Normal
Pre-hypertensive Hypertensive
Percentage with normal blood pressure and
taking medicine to lower blood
pressure
Background characteristic Prevalence of hypertension1
SBP <120 mmHg and DBP
<80 mmHg
SBP 120-139 mmHg or DBP 80-89 mmHg
Stage 1: SBP 140-159
mmHg or DBP 90-99 mmHg
Stage 2: SBP 160-179
mmHg or DBP 100-109 mmHg
Stage 3: SBP ≥180
mmHg or DBP ≥110 mmHg Total
Number of women
Age
15-19 3.1 72.6 24.8 1.9 0.5 0.2 100.0 0.5 1,121 20-24 5.4 66.7 28.7 3.4 0.5 0.7 100.0 0.6 1,149 25-29 8.3 56.6 35.9 6.3 1.0 0.2 100.0 0.7 1,288 30-34 13.1 46.8 41.1 9.7 1.6 0.7 100.0 0.3 1,232 35-39 17.3 38.0 45.5 11.5 4.1 1.0 100.0 0.2 1,247 40-44 25.9 33.3 43.5 15.6 5.7 1.9 100.0 0.6 1,045 45-49 30.0 29.5 43.8 18.7 6.0 2.0 100.0 1.1 888
Residence Urban 15.4 47.1 39.2 10.3 2.6 0.8 100.0 0.7 3,050 Rural 13.2 51.5 36.4 8.6 2.6 0.9 100.0 0.5 4,921
Schooling No schooling 20.7 36.0 44.5 15.0 3.7 0.9 100.0 0.5 648 <5 years complete 17.3 41.8 42.1 13.1 1.8 1.2 100.0 0.3 448 5-7 years complete 12.6 49.8 38.4 9.0 2.1 0.7 100.0 0.6 868 8-9 years complete 13.2 53.0 34.9 8.7 2.4 1.0 100.0 0.5 2,185 10-11 years complete 9.9 55.2 36.1 5.6 2.1 1.1 100.0 0.3 1,417 12 or more years complete 15.3 49.1 37.5 9.6 3.0 0.8 100.0 0.8 2,404
Religion
Hindu 15.0 48.1 38.7 9.7 2.8 0.8 100.0 0.7 3,460 Muslim 15.7 47.8 37.2 11.2 2.5 1.3 100.0 0.2 975 Christian 11.6 53.6 35.8 7.2 2.5 0.8 100.0 0.5 2,073 Other 13.9 50.0 37.2 9.6 2.2 1.1 100.0 0.4 1,463
Continued…
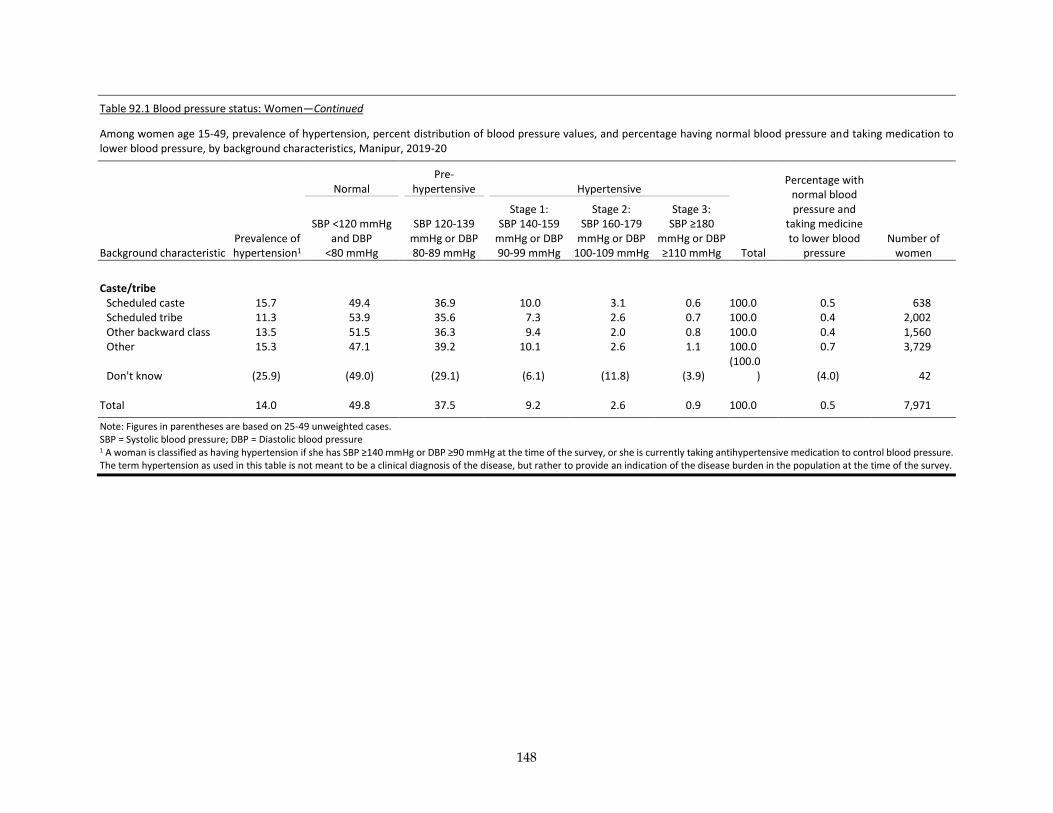
148
Table 92.1 Blood pressure status: Women—Continued
Among women age 15-49, prevalence of hypertension, percent distribution of blood pressure values, and percentage having normal blood pressure and taking medication to lower blood pressure, by background characteristics, Manipur, 2019-20
Normal
Pre-hypertensive Hypertensive
Percentage with normal blood pressure and
taking medicine to lower blood
pressure
Background characteristic Prevalence of hypertension1
SBP <120 mmHg and DBP
<80 mmHg
SBP 120-139 mmHg or DBP 80-89 mmHg
Stage 1: SBP 140-159
mmHg or DBP 90-99 mmHg
Stage 2: SBP 160-179
mmHg or DBP 100-109 mmHg
Stage 3: SBP ≥180
mmHg or DBP ≥110 mmHg Total
Number of women
Caste/tribe
Scheduled caste 15.7 49.4 36.9 10.0 3.1 0.6 100.0 0.5 638 Scheduled tribe 11.3 53.9 35.6 7.3 2.6 0.7 100.0 0.4 2,002 Other backward class 13.5 51.5 36.3 9.4 2.0 0.8 100.0 0.4 1,560 Other 15.3 47.1 39.2 10.1 2.6 1.1 100.0 0.7 3,729
Don't know (25.9) (49.0) (29.1) (6.1) (11.8) (3.9) (100.0
) (4.0) 42
Total 14.0 49.8 37.5 9.2 2.6 0.9 100.0 0.5 7,971
Note: Figures in parentheses are based on 25-49 unweighted cases. SBP = Systolic blood pressure; DBP = Diastolic blood pressure 1 A woman is classified as having hypertension if she has SBP ≥140 mmHg or DBP ≥90 mmHg at the time of the survey, or she is currently taking antihypertensive medication to control blood pressure. The term hypertension as used in this table is not meant to be a clinical diagnosis of the disease, but rather to provide an indication of the disease burden in the population at the time of the survey.
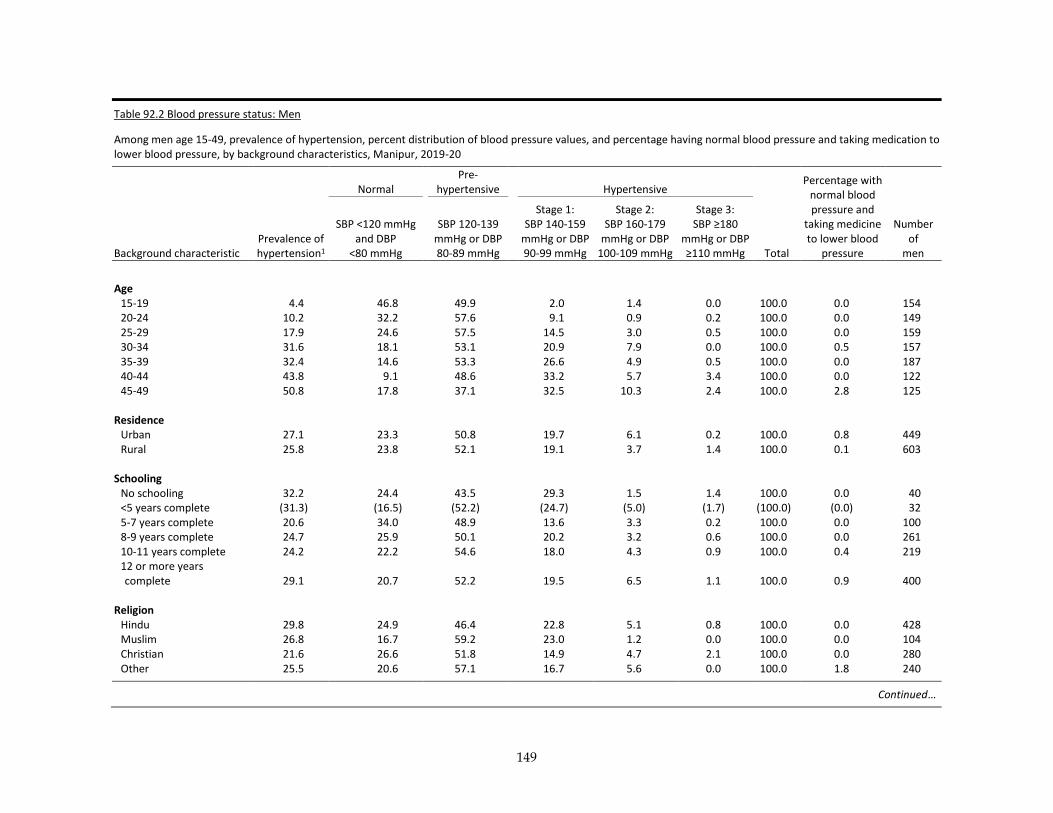
149
Table 92.2 Blood pressure status: Men
Among men age 15-49, prevalence of hypertension, percent distribution of blood pressure values, and percentage having normal blood pressure and taking medication to lower blood pressure, by background characteristics, Manipur, 2019-20
Normal
Pre-hypertensive Hypertensive
Total
Percentage with normal blood pressure and
taking medicine to lower blood
pressure
Number of
men Background characteristic Prevalence of hypertension1
SBP <120 mmHg and DBP
<80 mmHg
SBP 120-139 mmHg or DBP 80-89 mmHg
Stage 1: SBP 140-159
mmHg or DBP 90-99 mmHg
Stage 2: SBP 160-179
mmHg or DBP 100-109 mmHg
Stage 3: SBP ≥180
mmHg or DBP ≥110 mmHg
Age
15-19 4.4 46.8 49.9 2.0 1.4 0.0 100.0 0.0 154 20-24 10.2 32.2 57.6 9.1 0.9 0.2 100.0 0.0 149 25-29 17.9 24.6 57.5 14.5 3.0 0.5 100.0 0.0 159 30-34 31.6 18.1 53.1 20.9 7.9 0.0 100.0 0.5 157 35-39 32.4 14.6 53.3 26.6 4.9 0.5 100.0 0.0 187 40-44 43.8 9.1 48.6 33.2 5.7 3.4 100.0 0.0 122 45-49 50.8 17.8 37.1 32.5 10.3 2.4 100.0 2.8 125
Residence Urban 27.1 23.3 50.8 19.7 6.1 0.2 100.0 0.8 449 Rural 25.8 23.8 52.1 19.1 3.7 1.4 100.0 0.1 603
Schooling No schooling 32.2 24.4 43.5 29.3 1.5 1.4 100.0 0.0 40 <5 years complete (31.3) (16.5) (52.2) (24.7) (5.0) (1.7) (100.0) (0.0) 32 5-7 years complete 20.6 34.0 48.9 13.6 3.3 0.2 100.0 0.0 100 8-9 years complete 24.7 25.9 50.1 20.2 3.2 0.6 100.0 0.0 261 10-11 years complete 24.2 22.2 54.6 18.0 4.3 0.9 100.0 0.4 219 12 or more years complete 29.1 20.7 52.2 19.5 6.5 1.1 100.0 0.9 400
Religion
Hindu 29.8 24.9 46.4 22.8 5.1 0.8 100.0 0.0 428 Muslim 26.8 16.7 59.2 23.0 1.2 0.0 100.0 0.0 104 Christian 21.6 26.6 51.8 14.9 4.7 2.1 100.0 0.0 280 Other 25.5 20.6 57.1 16.7 5.6 0.0 100.0 1.8 240
Continued…
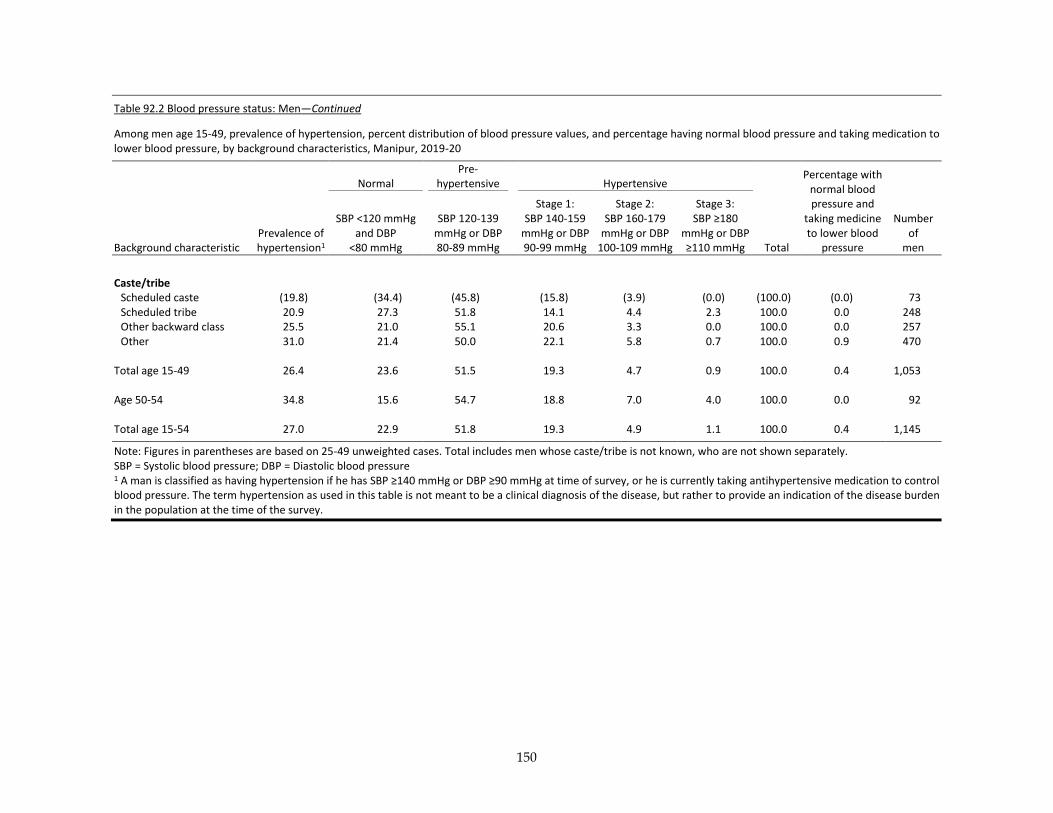
150
Table 92.2 Blood pressure status: Men—Continued
Among men age 15-49, prevalence of hypertension, percent distribution of blood pressure values, and percentage having normal blood pressure and taking medication to lower blood pressure, by background characteristics, Manipur, 2019-20
Normal
Pre-hypertensive Hypertensive
Total
Percentage with normal blood pressure and
taking medicine to lower blood
pressure
Number of
men Background characteristic Prevalence of hypertension1
SBP <120 mmHg and DBP
<80 mmHg
SBP 120-139 mmHg or DBP 80-89 mmHg
Stage 1: SBP 140-159
mmHg or DBP 90-99 mmHg
Stage 2: SBP 160-179
mmHg or DBP 100-109 mmHg
Stage 3: SBP ≥180
mmHg or DBP ≥110 mmHg
Caste/tribe
Scheduled caste (19.8) (34.4) (45.8) (15.8) (3.9) (0.0) (100.0) (0.0) 73 Scheduled tribe 20.9 27.3 51.8 14.1 4.4 2.3 100.0 0.0 248 Other backward class 25.5 21.0 55.1 20.6 3.3 0.0 100.0 0.0 257 Other 31.0 21.4 50.0 22.1 5.8 0.7 100.0 0.9 470
Total age 15-49 26.4 23.6 51.5 19.3 4.7 0.9 100.0 0.4 1,053
Age 50-54 34.8 15.6 54.7 18.8 7.0 4.0 100.0 0.0 92
Total age 15-54 27.0 22.9 51.8 19.3 4.9 1.1 100.0 0.4 1,145
Note: Figures in parentheses are based on 25-49 unweighted cases. Total includes men whose caste/tribe is not known, who are not shown separately. SBP = Systolic blood pressure; DBP = Diastolic blood pressure 1 A man is classified as having hypertension if he has SBP ≥140 mmHg or DBP ≥90 mmHg at time of survey, or he is currently taking antihypertensive medication to control blood pressure. The term hypertension as used in this table is not meant to be a clinical diagnosis of the disease, but rather to provide an indication of the disease burden in the population at the time of the survey.
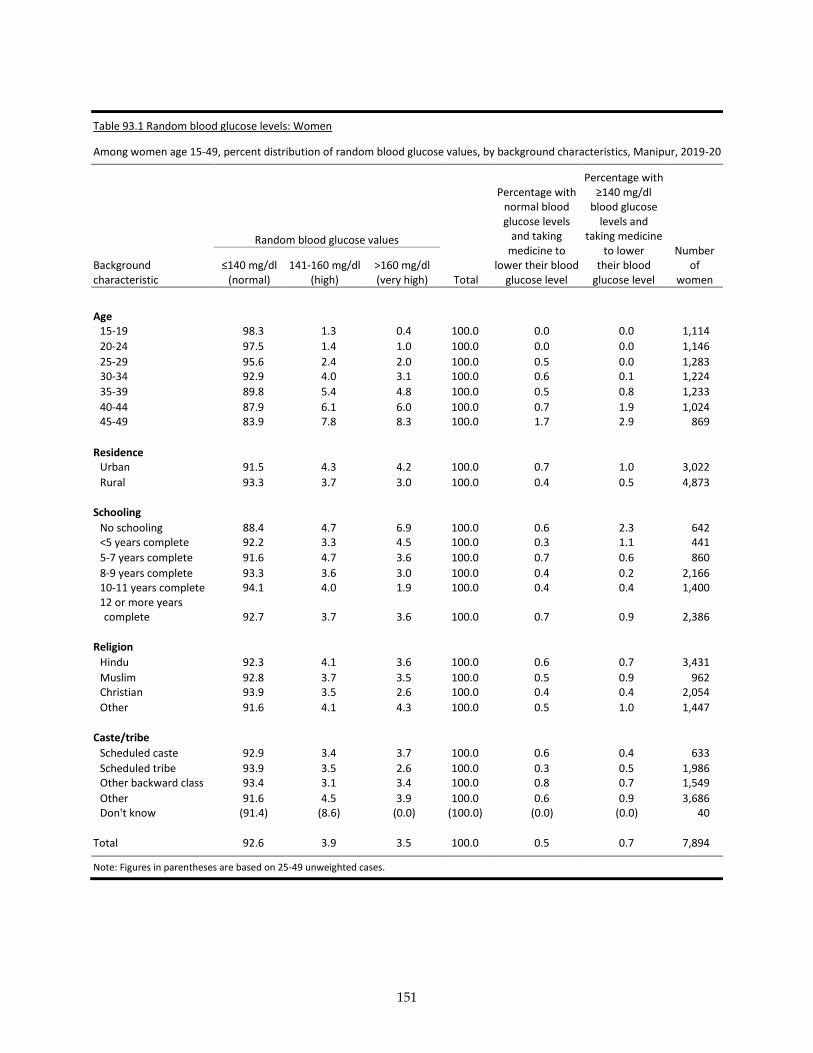
151
Table 93.1 Random blood glucose levels: Women
Among women age 15-49, percent distribution of random blood glucose values, by background characteristics, Manipur, 2019-20
Background characteristic
Random blood glucose values
Total
Percentage with normal blood glucose levels
and taking medicine to
lower their blood glucose level
Percentage with ≥140 mg/dl
blood glucose levels and
taking medicine to lower
their blood glucose level
Number of
women ≤140 mg/dl
(normal) 141-160 mg/dl
(high) >160 mg/dl (very high)
Age 15-19 98.3 1.3 0.4 100.0 0.0 0.0 1,114
20-24 97.5 1.4 1.0 100.0 0.0 0.0 1,146
25-29 95.6 2.4 2.0 100.0 0.5 0.0 1,283 30-34 92.9 4.0 3.1 100.0 0.6 0.1 1,224
35-39 89.8 5.4 4.8 100.0 0.5 0.8 1,233
40-44 87.9 6.1 6.0 100.0 0.7 1.9 1,024 45-49 83.9 7.8 8.3 100.0 1.7 2.9 869
Residence Urban 91.5 4.3 4.2 100.0 0.7 1.0 3,022
Rural 93.3 3.7 3.0 100.0 0.4 0.5 4,873
Schooling
No schooling 88.4 4.7 6.9 100.0 0.6 2.3 642 <5 years complete 92.2 3.3 4.5 100.0 0.3 1.1 441
5-7 years complete 91.6 4.7 3.6 100.0 0.7 0.6 860
8-9 years complete 93.3 3.6 3.0 100.0 0.4 0.2 2,166 10-11 years complete 94.1 4.0 1.9 100.0 0.4 0.4 1,400 12 or more years complete 92.7 3.7 3.6 100.0 0.7 0.9 2,386
Religion
Hindu 92.3 4.1 3.6 100.0 0.6 0.7 3,431
Muslim 92.8 3.7 3.5 100.0 0.5 0.9 962 Christian 93.9 3.5 2.6 100.0 0.4 0.4 2,054
Other 91.6 4.1 4.3 100.0 0.5 1.0 1,447
Caste/tribe
Scheduled caste 92.9 3.4 3.7 100.0 0.6 0.4 633
Scheduled tribe 93.9 3.5 2.6 100.0 0.3 0.5 1,986 Other backward class 93.4 3.1 3.4 100.0 0.8 0.7 1,549
Other 91.6 4.5 3.9 100.0 0.6 0.9 3,686 Don't know (91.4) (8.6) (0.0) (100.0) (0.0) (0.0) 40
Total 92.6 3.9 3.5 100.0 0.5 0.7 7,894
Note: Figures in parentheses are based on 25-49 unweighted cases.
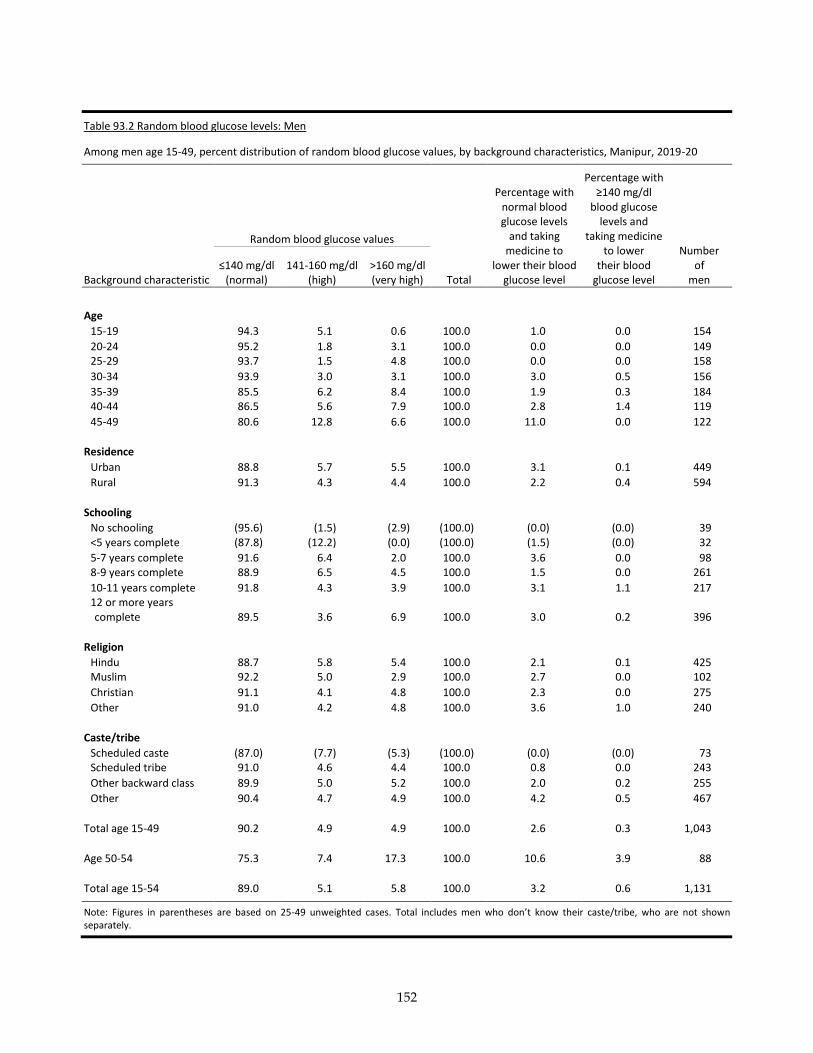
152
Table 93.2 Random blood glucose levels: Men
Among men age 15-49, percent distribution of random blood glucose values, by background characteristics, Manipur, 2019-20
Random blood glucose values
Total
Percentage with normal blood glucose levels
and taking medicine to
lower their blood glucose level
Percentage with ≥140 mg/dl
blood glucose levels and
taking medicine to lower
their blood glucose level
Number of
men Background characteristic ≤140 mg/dl
(normal) 141-160 mg/dl
(high) >160 mg/dl (very high)
Age
15-19 94.3 5.1 0.6 100.0 1.0 0.0 154
20-24 95.2 1.8 3.1 100.0 0.0 0.0 149 25-29 93.7 1.5 4.8 100.0 0.0 0.0 158
30-34 93.9 3.0 3.1 100.0 3.0 0.5 156
35-39 85.5 6.2 8.4 100.0 1.9 0.3 184 40-44 86.5 5.6 7.9 100.0 2.8 1.4 119
45-49 80.6 12.8 6.6 100.0 11.0 0.0 122
Residence
Urban 88.8 5.7 5.5 100.0 3.1 0.1 449
Rural 91.3 4.3 4.4 100.0 2.2 0.4 594
Schooling
No schooling (95.6) (1.5) (2.9) (100.0) (0.0) (0.0) 39 <5 years complete (87.8) (12.2) (0.0) (100.0) (1.5) (0.0) 32
5-7 years complete 91.6 6.4 2.0 100.0 3.6 0.0 98 8-9 years complete 88.9 6.5 4.5 100.0 1.5 0.0 261
10-11 years complete 91.8 4.3 3.9 100.0 3.1 1.1 217 12 or more years complete 89.5 3.6 6.9 100.0 3.0 0.2 396
Religion
Hindu 88.7 5.8 5.4 100.0 2.1 0.1 425 Muslim 92.2 5.0 2.9 100.0 2.7 0.0 102
Christian 91.1 4.1 4.8 100.0 2.3 0.0 275
Other 91.0 4.2 4.8 100.0 3.6 1.0 240
Caste/tribe
Scheduled caste (87.0) (7.7) (5.3) (100.0) (0.0) (0.0) 73 Scheduled tribe 91.0 4.6 4.4 100.0 0.8 0.0 243
Other backward class 89.9 5.0 5.2 100.0 2.0 0.2 255
Other 90.4 4.7 4.9 100.0 4.2 0.5 467
Total age 15-49 90.2 4.9 4.9 100.0 2.6 0.3 1,043
Age 50-54 75.3 7.4 17.3 100.0 10.6 3.9 88
Total age 15-54 89.0 5.1 5.8 100.0 3.2 0.6 1,131
Note: Figures in parentheses are based on 25-49 unweighted cases. Total includes men who don’t know their caste/tribe, who are not shown separately.
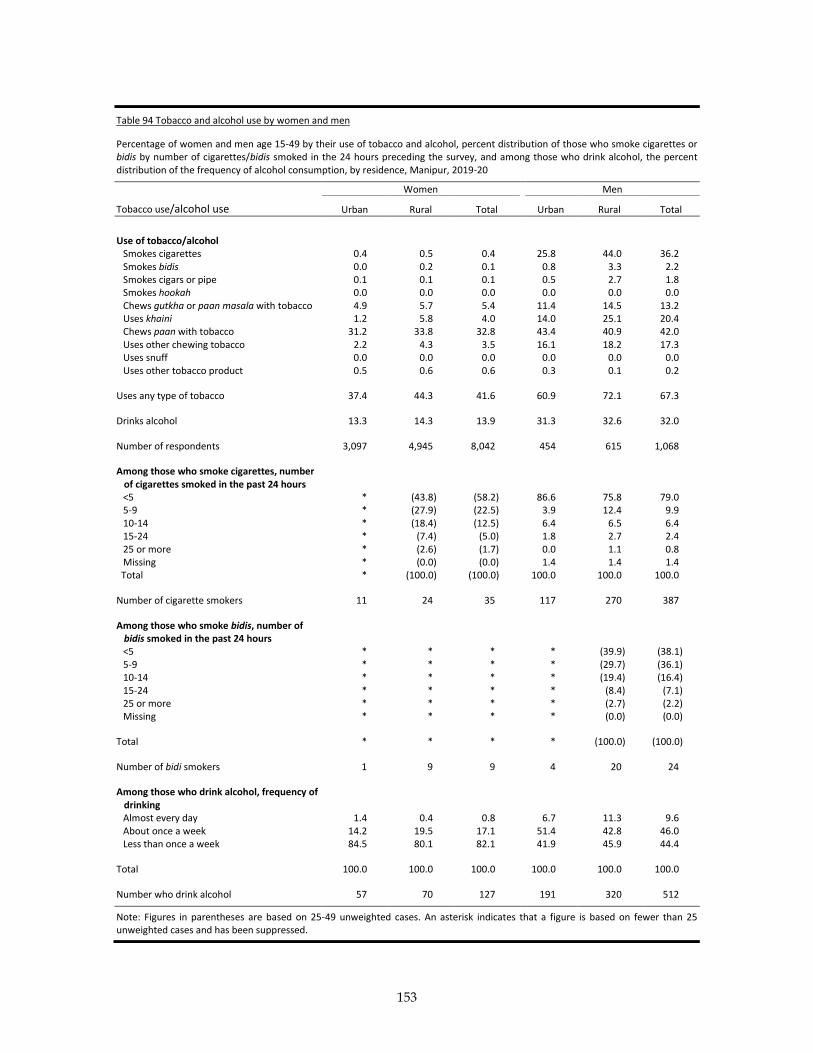
153
Table 94 Tobacco and alcohol use by women and men
Percentage of women and men age 15-49 by their use of tobacco and alcohol, percent distribution of those who smoke cigarettes or bidis by number of cigarettes/bidis smoked in the 24 hours preceding the survey, and among those who drink alcohol, the percent distribution of the frequency of alcohol consumption, by residence, Manipur, 2019-20
Women Men
Tobacco use/alcohol use Urban Rural Total Urban Rural Total
Use of tobacco/alcohol Smokes cigarettes 0.4 0.5 0.4 25.8 44.0 36.2 Smokes bidis 0.0 0.2 0.1 0.8 3.3 2.2 Smokes cigars or pipe 0.1 0.1 0.1 0.5 2.7 1.8 Smokes hookah 0.0 0.0 0.0 0.0 0.0 0.0 Chews gutkha or paan masala with tobacco 4.9 5.7 5.4 11.4 14.5 13.2 Uses khaini 1.2 5.8 4.0 14.0 25.1 20.4 Chews paan with tobacco 31.2 33.8 32.8 43.4 40.9 42.0 Uses other chewing tobacco 2.2 4.3 3.5 16.1 18.2 17.3 Uses snuff 0.0 0.0 0.0 0.0 0.0 0.0 Uses other tobacco product 0.5 0.6 0.6 0.3 0.1 0.2
Uses any type of tobacco 37.4 44.3 41.6 60.9 72.1 67.3
Drinks alcohol 13.3 14.3 13.9 31.3 32.6 32.0
Number of respondents 3,097 4,945 8,042 454 615 1,068
Among those who smoke cigarettes, number of cigarettes smoked in the past 24 hours <5 * (43.8) (58.2) 86.6 75.8 79.0 5-9 * (27.9) (22.5) 3.9 12.4 9.9 10-14 * (18.4) (12.5) 6.4 6.5 6.4 15-24 * (7.4) (5.0) 1.8 2.7 2.4 25 or more * (2.6) (1.7) 0.0 1.1 0.8 Missing * (0.0) (0.0) 1.4 1.4 1.4
Total * (100.0) (100.0) 100.0 100.0 100.0
Number of cigarette smokers 11 24 35 117 270 387
Among those who smoke bidis, number of bidis smoked in the past 24 hours <5 * * * * (39.9) (38.1) 5-9 * * * * (29.7) (36.1) 10-14 * * * * (19.4) (16.4) 15-24 * * * * (8.4) (7.1) 25 or more * * * * (2.7) (2.2) Missing * * * * (0.0) (0.0)
Total * * * * (100.0) (100.0)
Number of bidi smokers 1 9 9 4 20 24
Among those who drink alcohol, frequency of drinking Almost every day 1.4 0.4 0.8 6.7 11.3 9.6 About once a week 14.2 19.5 17.1 51.4 42.8 46.0 Less than once a week 84.5 80.1 82.1 41.9 45.9 44.4
Total 100.0 100.0 100.0 100.0 100.0 100.0
Number who drink alcohol 57 70 127 191 320 512
Note: Figures in parentheses are based on 25-49 unweighted cases. An asterisk indicates that a figure is based on fewer than 25 unweighted cases and has been suppressed.
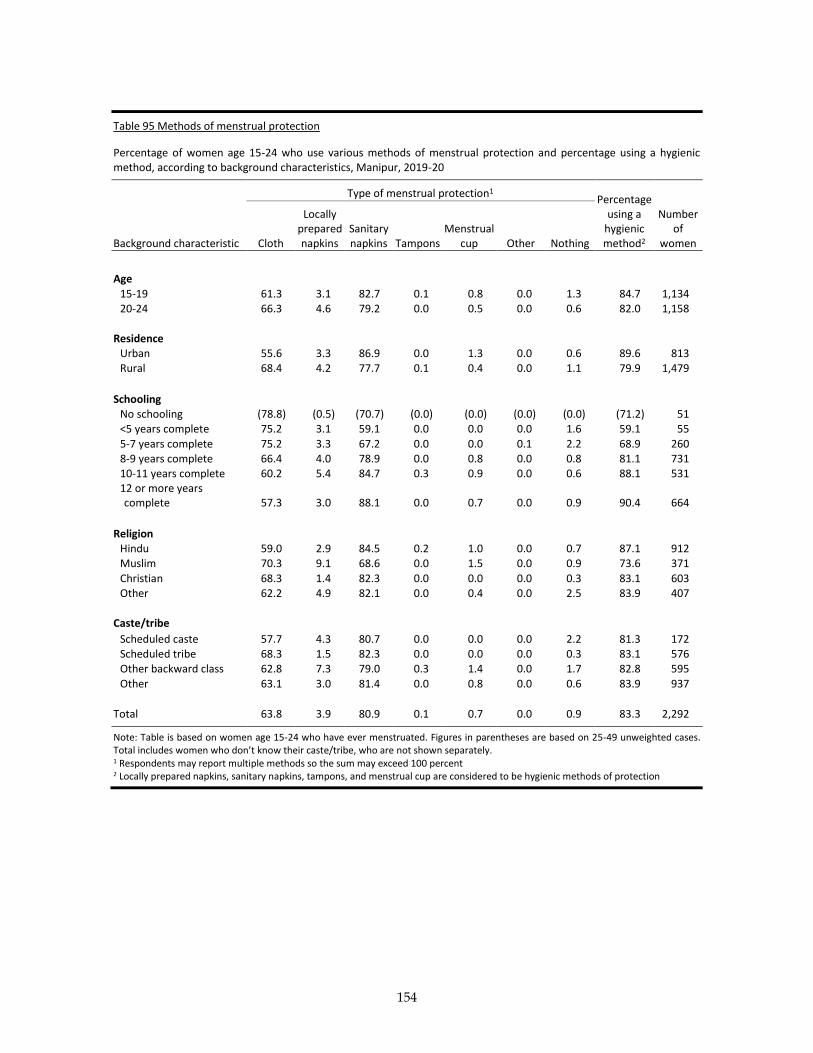
154
Table 95 Methods of menstrual protection
Percentage of women age 15-24 who use various methods of menstrual protection and percentage using a hygienic method, according to background characteristics, Manipur, 2019-20
Type of menstrual protection1 Percentage
using a hygienic method2
Background characteristic Cloth
Locally prepared napkins
Sanitary napkins Tampons
Menstrual cup Other Nothing
Number of
women
Age
15-19 61.3 3.1 82.7 0.1 0.8 0.0 1.3 84.7 1,134 20-24 66.3 4.6 79.2 0.0 0.5 0.0 0.6 82.0 1,158
Residence Urban 55.6 3.3 86.9 0.0 1.3 0.0 0.6 89.6 813 Rural 68.4 4.2 77.7 0.1 0.4 0.0 1.1 79.9 1,479
Schooling No schooling (78.8) (0.5) (70.7) (0.0) (0.0) (0.0) (0.0) (71.2) 51 <5 years complete 75.2 3.1 59.1 0.0 0.0 0.0 1.6 59.1 55
5-7 years complete 75.2 3.3 67.2 0.0 0.0 0.1 2.2 68.9 260 8-9 years complete 66.4 4.0 78.9 0.0 0.8 0.0 0.8 81.1 731 10-11 years complete 60.2 5.4 84.7 0.3 0.9 0.0 0.6 88.1 531 12 or more years complete 57.3 3.0 88.1 0.0 0.7 0.0 0.9 90.4 664
Religion Hindu 59.0 2.9 84.5 0.2 1.0 0.0 0.7 87.1 912 Muslim 70.3 9.1 68.6 0.0 1.5 0.0 0.9 73.6 371
Christian 68.3 1.4 82.3 0.0 0.0 0.0 0.3 83.1 603 Other 62.2 4.9 82.1 0.0 0.4 0.0 2.5 83.9 407
Caste/tribe
Scheduled caste 57.7 4.3 80.7 0.0 0.0 0.0 2.2 81.3 172 Scheduled tribe 68.3 1.5 82.3 0.0 0.0 0.0 0.3 83.1 576 Other backward class 62.8 7.3 79.0 0.3 1.4 0.0 1.7 82.8 595
Other 63.1 3.0 81.4 0.0 0.8 0.0 0.6 83.9 937
Total 63.8 3.9 80.9 0.1 0.7 0.0 0.9 83.3 2,292
Note: Table is based on women age 15-24 who have ever menstruated. Figures in parentheses are based on 25-49 unweighted cases. Total includes women who don’t know their caste/tribe, who are not shown separately. 1 Respondents may report multiple methods so the sum may exceed 100 percent 2 Locally prepared napkins, sanitary napkins, tampons, and menstrual cup are considered to be hygienic methods of protection
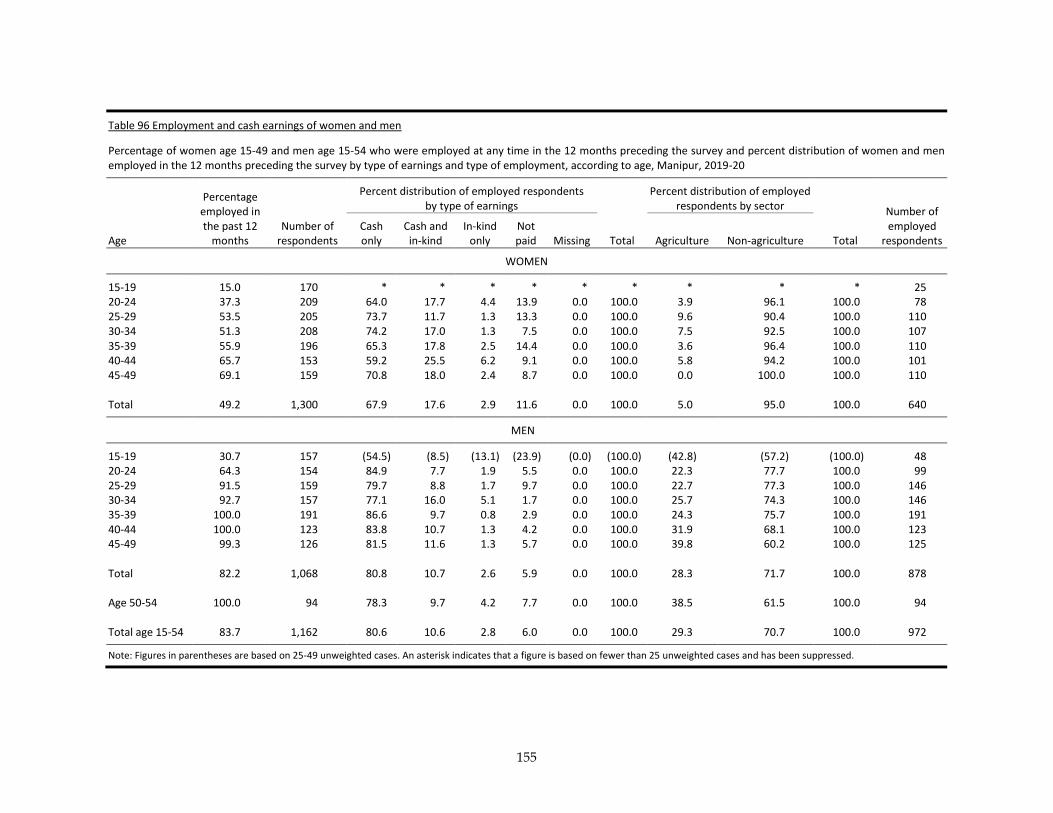
155
Table 96 Employment and cash earnings of women and men
Percentage of women age 15-49 and men age 15-54 who were employed at any time in the 12 months preceding the survey and percent distribution of women and men employed in the 12 months preceding the survey by type of earnings and type of employment, according to age, Manipur, 2019-20
Age
Percentage employed in the past 12
months Number of
respondents
Percent distribution of employed respondents by type of earnings
Percent distribution of employed respondents by sector
Number of employed
respondents Cash only
Cash and in-kind
In-kind only
Not paid Missing Total Agriculture Non-agriculture Total
WOMEN
15-19 15.0 170 * * * * * * * * * 25 20-24 37.3 209 64.0 17.7 4.4 13.9 0.0 100.0 3.9 96.1 100.0 78 25-29 53.5 205 73.7 11.7 1.3 13.3 0.0 100.0 9.6 90.4 100.0 110 30-34 51.3 208 74.2 17.0 1.3 7.5 0.0 100.0 7.5 92.5 100.0 107 35-39 55.9 196 65.3 17.8 2.5 14.4 0.0 100.0 3.6 96.4 100.0 110 40-44 65.7 153 59.2 25.5 6.2 9.1 0.0 100.0 5.8 94.2 100.0 101 45-49 69.1 159 70.8 18.0 2.4 8.7 0.0 100.0 0.0 100.0 100.0 110 Total 49.2 1,300 67.9 17.6 2.9 11.6 0.0 100.0 5.0 95.0 100.0 640
MEN
15-19 30.7 157 (54.5) (8.5) (13.1) (23.9) (0.0) (100.0) (42.8) (57.2) (100.0) 48 20-24 64.3 154 84.9 7.7 1.9 5.5 0.0 100.0 22.3 77.7 100.0 99 25-29 91.5 159 79.7 8.8 1.7 9.7 0.0 100.0 22.7 77.3 100.0 146 30-34 92.7 157 77.1 16.0 5.1 1.7 0.0 100.0 25.7 74.3 100.0 146 35-39 100.0 191 86.6 9.7 0.8 2.9 0.0 100.0 24.3 75.7 100.0 191 40-44 100.0 123 83.8 10.7 1.3 4.2 0.0 100.0 31.9 68.1 100.0 123 45-49 99.3 126 81.5 11.6 1.3 5.7 0.0 100.0 39.8 60.2 100.0 125 Total 82.2 1,068 80.8 10.7 2.6 5.9 0.0 100.0 28.3 71.7 100.0 878 Age 50-54 100.0 94 78.3 9.7 4.2 7.7 0.0 100.0 38.5 61.5 100.0 94 Total age 15-54 83.7 1,162 80.6 10.6 2.8 6.0 0.0 100.0 29.3 70.7 100.0 972
Note: Figures in parentheses are based on 25-49 unweighted cases. An asterisk indicates that a figure is based on fewer than 25 unweighted cases and has been suppressed.
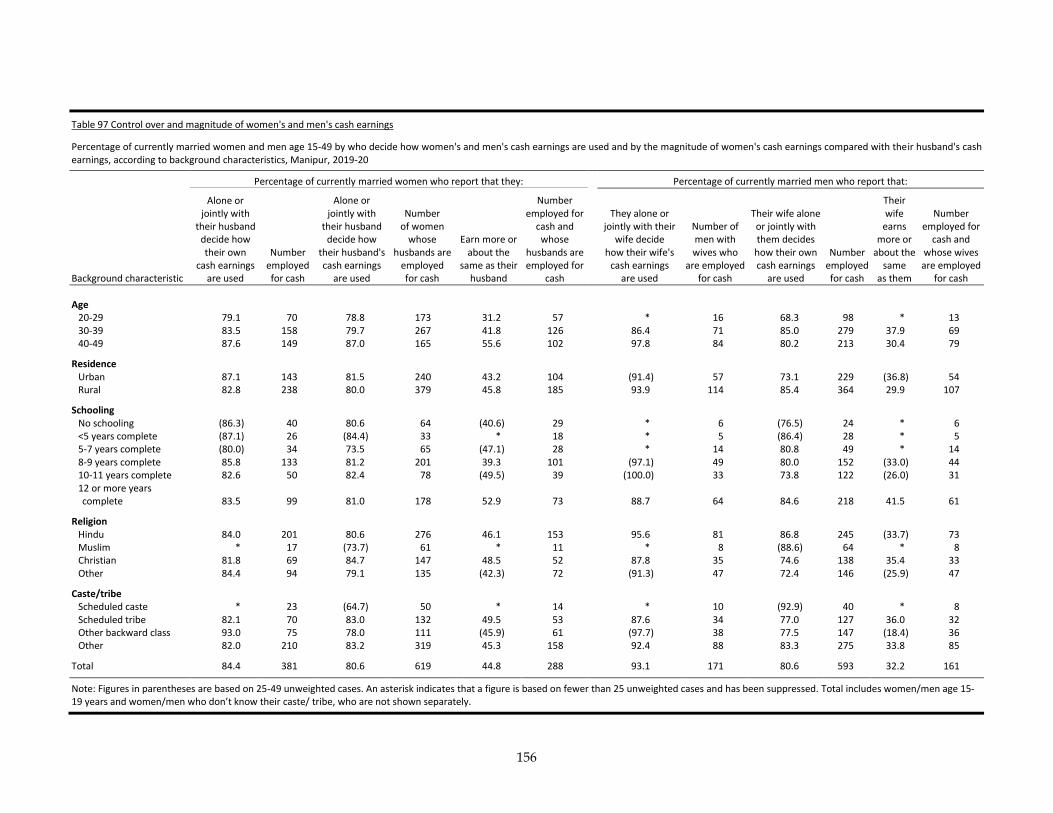
156
Table 97 Control over and magnitude of women's and men's cash earnings
Percentage of currently married women and men age 15-49 by who decide how women's and men's cash earnings are used and by the magnitude of women's cash earnings compared with their husband's cash earnings, according to background characteristics, Manipur, 2019-20
Percentage of currently married women who report that they: Percentage of currently married men who report that:
Background characteristic
Alone or jointly with
their husband decide how their own
cash earnings are used
Number employed for cash
Alone or jointly with
their husband decide how
their husband's cash earnings
are used
Number of women
whose husbands are
employed for cash
Earn more or about the
same as their husband
Number employed for
cash and whose
husbands are employed for
cash
They alone or jointly with their
wife decide how their wife's
cash earnings are used
Number of men with wives who
are employed for cash
Their wife alone or jointly with them decides how their own cash earnings
are used
Number employed for cash
Their wife
earns more or
about the same
as them
Number employed for
cash and whose wives are employed
for cash
Age 20-29 79.1 70 78.8 173 31.2 57 * 16 68.3 98 * 13 30-39 83.5 158 79.7 267 41.8 126 86.4 71 85.0 279 37.9 69 40-49 87.6 149 87.0 165 55.6 102 97.8 84 80.2 213 30.4 79
Residence Urban 87.1 143 81.5 240 43.2 104 (91.4) 57 73.1 229 (36.8) 54 Rural 82.8 238 80.0 379 45.8 185 93.9 114 85.4 364 29.9 107
Schooling No schooling (86.3) 40 80.6 64 (40.6) 29 * 6 (76.5) 24 * 6 <5 years complete (87.1) 26 (84.4) 33 * 18 * 5 (86.4) 28 * 5 5-7 years complete (80.0) 34 73.5 65 (47.1) 28 * 14 80.8 49 * 14 8-9 years complete 85.8 133 81.2 201 39.3 101 (97.1) 49 80.0 152 (33.0) 44 10-11 years complete 82.6 50 82.4 78 (49.5) 39 (100.0) 33 73.8 122 (26.0) 31 12 or more years complete 83.5 99 81.0 178 52.9 73 88.7 64 84.6 218 41.5 61
Religion Hindu 84.0 201 80.6 276 46.1 153 95.6 81 86.8 245 (33.7) 73 Muslim * 17 (73.7) 61 * 11 * 8 (88.6) 64 * 8 Christian 81.8 69 84.7 147 48.5 52 87.8 35 74.6 138 35.4 33 Other 84.4 94 79.1 135 (42.3) 72 (91.3) 47 72.4 146 (25.9) 47
Caste/tribe Scheduled caste * 23 (64.7) 50 * 14 * 10 (92.9) 40 * 8 Scheduled tribe 82.1 70 83.0 132 49.5 53 87.6 34 77.0 127 36.0 32 Other backward class 93.0 75 78.0 111 (45.9) 61 (97.7) 38 77.5 147 (18.4) 36 Other 82.0 210 83.2 319 45.3 158 92.4 88 83.3 275 33.8 85
Total 84.4 381 80.6 619 44.8 288 93.1 171 80.6 593 32.2 161
Note: Figures in parentheses are based on 25-49 unweighted cases. An asterisk indicates that a figure is based on fewer than 25 unweighted cases and has been suppressed. Total includes women/men age 15-19 years and women/men who don’t know their caste/ tribe, who are not shown separately.
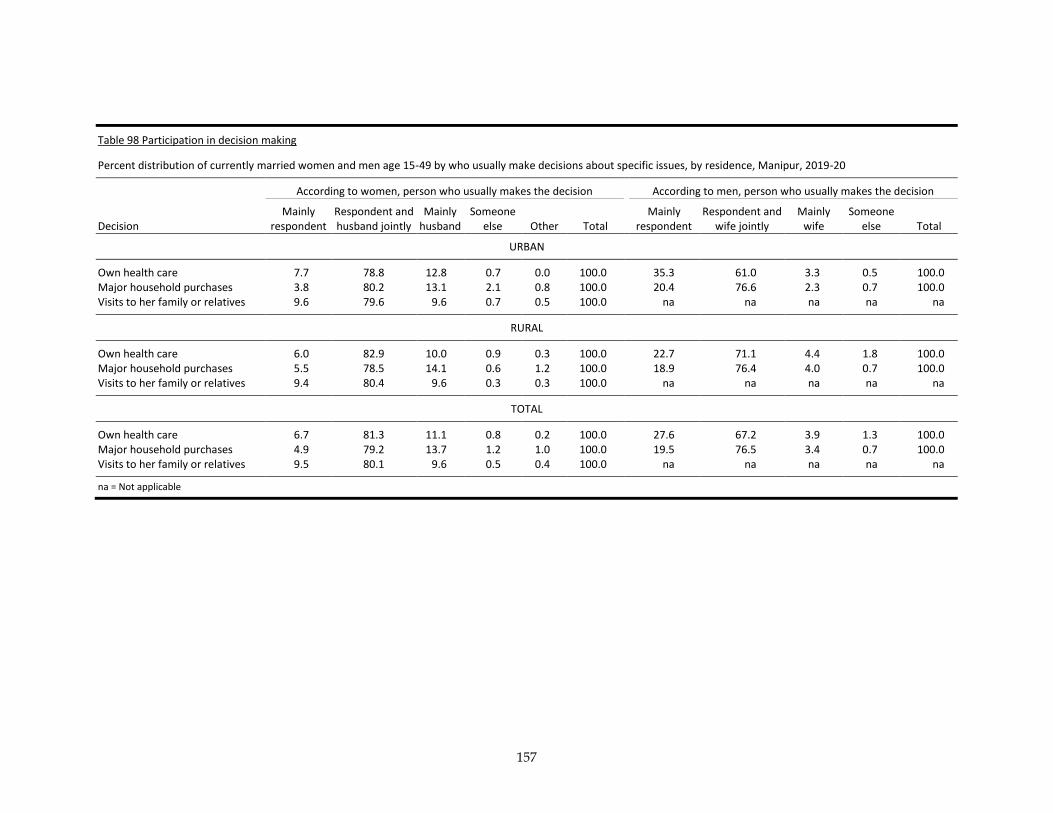
157
Table 98 Participation in decision making
Percent distribution of currently married women and men age 15-49 by who usually make decisions about specific issues, by residence, Manipur, 2019-20
According to women, person who usually makes the decision According to men, person who usually makes the decision
Decision Mainly
respondent Respondent and husband jointly
Mainly husband
Someone else Other Total
Mainly respondent
Respondent and wife jointly
Mainly wife
Someone else Total
URBAN
Own health care 7.7 78.8 12.8 0.7 0.0 100.0 35.3 61.0 3.3 0.5 100.0 Major household purchases 3.8 80.2 13.1 2.1 0.8 100.0 20.4 76.6 2.3 0.7 100.0 Visits to her family or relatives 9.6 79.6 9.6 0.7 0.5 100.0 na na na na na
RURAL
Own health care 6.0 82.9 10.0 0.9 0.3 100.0 22.7 71.1 4.4 1.8 100.0 Major household purchases 5.5 78.5 14.1 0.6 1.2 100.0 18.9 76.4 4.0 0.7 100.0 Visits to her family or relatives 9.4 80.4 9.6 0.3 0.3 100.0 na na na na na
TOTAL
Own health care 6.7 81.3 11.1 0.8 0.2 100.0 27.6 67.2 3.9 1.3 100.0 Major household purchases 4.9 79.2 13.7 1.2 1.0 100.0 19.5 76.5 3.4 0.7 100.0 Visits to her family or relatives 9.5 80.1 9.6 0.5 0.4 100.0 na na na na na
na = Not applicable
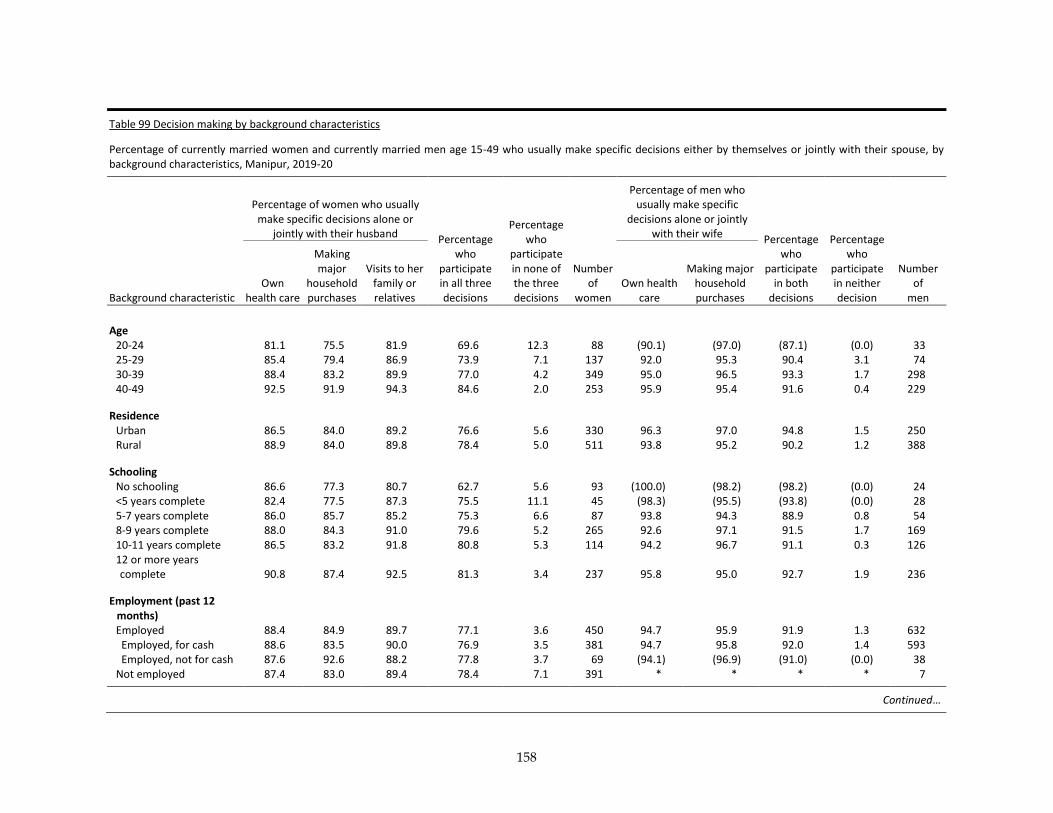
158
Table 99 Decision making by background characteristics
Percentage of currently married women and currently married men age 15-49 who usually make specific decisions either by themselves or jointly with their spouse, by background characteristics, Manipur, 2019-20
Percentage of women who usually
make specific decisions alone or jointly with their husband Percentage
who participate in all three decisions
Percentage who
participate in none of the three decisions
Number of
women
Percentage of men who usually make specific
decisions alone or jointly with their wife Percentage
who participate
in both decisions
Percentage who
participate in neither decision
Number of
men Background characteristic Own
health care
Making major
household purchases
Visits to her family or relatives
Own health care
Making major household purchases
Age 20-24 81.1 75.5 81.9 69.6 12.3 88 (90.1) (97.0) (87.1) (0.0) 33 25-29 85.4 79.4 86.9 73.9 7.1 137 92.0 95.3 90.4 3.1 74 30-39 88.4 83.2 89.9 77.0 4.2 349 95.0 96.5 93.3 1.7 298 40-49 92.5 91.9 94.3 84.6 2.0 253 95.9 95.4 91.6 0.4 229
Residence Urban 86.5 84.0 89.2 76.6 5.6 330 96.3 97.0 94.8 1.5 250 Rural 88.9 84.0 89.8 78.4 5.0 511 93.8 95.2 90.2 1.2 388
Schooling No schooling 86.6 77.3 80.7 62.7 5.6 93 (100.0) (98.2) (98.2) (0.0) 24 <5 years complete 82.4 77.5 87.3 75.5 11.1 45 (98.3) (95.5) (93.8) (0.0) 28 5-7 years complete 86.0 85.7 85.2 75.3 6.6 87 93.8 94.3 88.9 0.8 54 8-9 years complete 88.0 84.3 91.0 79.6 5.2 265 92.6 97.1 91.5 1.7 169 10-11 years complete 86.5 83.2 91.8 80.8 5.3 114 94.2 96.7 91.1 0.3 126 12 or more years complete 90.8 87.4 92.5 81.3 3.4 237 95.8 95.0 92.7 1.9 236
Employment (past 12 months) Employed 88.4 84.9 89.7 77.1 3.6 450 94.7 95.9 91.9 1.3 632 Employed, for cash 88.6 83.5 90.0 76.9 3.5 381 94.7 95.8 92.0 1.4 593 Employed, not for cash 87.6 92.6 88.2 77.8 3.7 69 (94.1) (96.9) (91.0) (0.0) 38 Not employed 87.4 83.0 89.4 78.4 7.1 391 * * * * 7
Continued…
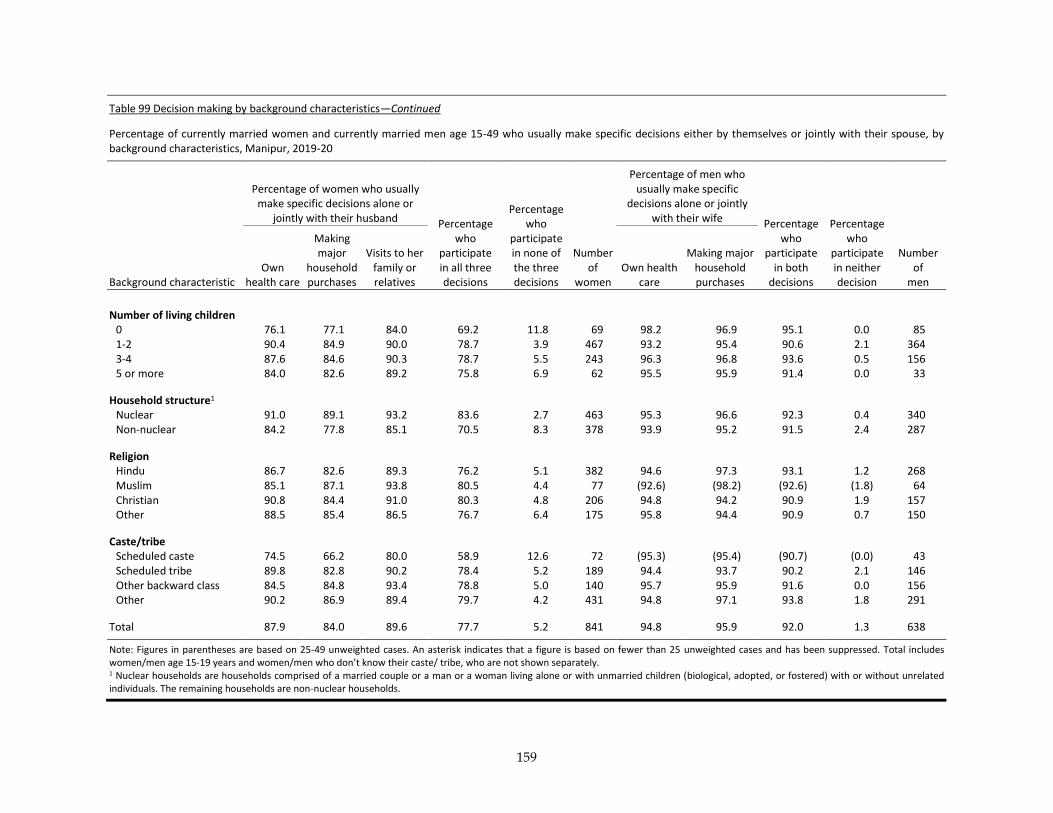
159
Table 99 Decision making by background characteristics—Continued
Percentage of currently married women and currently married men age 15-49 who usually make specific decisions either by themselves or jointly with their spouse, by background characteristics, Manipur, 2019-20
Background characteristic
Percentage of women who usually make specific decisions alone or
jointly with their husband Percentage who
participate in all three decisions
Percentage who
participate in none of the three decisions
Number of
women
Percentage of men who usually make specific
decisions alone or jointly with their wife Percentage
who participate
in both decisions
Percentage who
participate in neither decision
Number of
men Own
health care
Making major
household purchases
Visits to her family or relatives
Own health care
Making major household purchases
Number of living children 0 76.1 77.1 84.0 69.2 11.8 69 98.2 96.9 95.1 0.0 85 1-2 90.4 84.9 90.0 78.7 3.9 467 93.2 95.4 90.6 2.1 364 3-4 87.6 84.6 90.3 78.7 5.5 243 96.3 96.8 93.6 0.5 156 5 or more 84.0 82.6 89.2 75.8 6.9 62 95.5 95.9 91.4 0.0 33
Household structure1 Nuclear 91.0 89.1 93.2 83.6 2.7 463 95.3 96.6 92.3 0.4 340 Non-nuclear 84.2 77.8 85.1 70.5 8.3 378 93.9 95.2 91.5 2.4 287
Religion Hindu 86.7 82.6 89.3 76.2 5.1 382 94.6 97.3 93.1 1.2 268 Muslim 85.1 87.1 93.8 80.5 4.4 77 (92.6) (98.2) (92.6) (1.8) 64 Christian 90.8 84.4 91.0 80.3 4.8 206 94.8 94.2 90.9 1.9 157 Other 88.5 85.4 86.5 76.7 6.4 175 95.8 94.4 90.9 0.7 150
Caste/tribe Scheduled caste 74.5 66.2 80.0 58.9 12.6 72 (95.3) (95.4) (90.7) (0.0) 43 Scheduled tribe 89.8 82.8 90.2 78.4 5.2 189 94.4 93.7 90.2 2.1 146 Other backward class 84.5 84.8 93.4 78.8 5.0 140 95.7 95.9 91.6 0.0 156 Other 90.2 86.9 89.4 79.7 4.2 431 94.8 97.1 93.8 1.8 291
Total 87.9 84.0 89.6 77.7 5.2 841 94.8 95.9 92.0 1.3 638
Note: Figures in parentheses are based on 25-49 unweighted cases. An asterisk indicates that a figure is based on fewer than 25 unweighted cases and has been suppressed. Total includes women/men age 15-19 years and women/men who don’t know their caste/ tribe, who are not shown separately. 1 Nuclear households are households comprised of a married couple or a man or a woman living alone or with unmarried children (biological, adopted, or fostered) with or without unrelated individuals. The remaining households are non-nuclear households.

160
Table 100 Women's access to money and credit
Percentage of women age 15-49 who have access to money, who know of a microcredit programme, who have taken a loan from a microcredit programme, and who are allowed to go to three specified places alone, and among women who own a mobile phone, percentage who use it for financial transactions by background characteristics, Manipur, 2019-20
Women's access to money
Women's knowledge and use of microcredit programmes
Percentage of women allowed to
go to three specified places
alone1 Number of women
Percentage who use mobile phone
for financial transactions
Number of women who have a mobile
phone Background characteristic
Percentage who have money that they can decide
how to use
Percentage who have a bank or savings account
that they themselves use
Percentage who know of a
microcredit programme
Percentage who have taken a loan from a microcredit
programme
Age
15-19 20.6 37.1 34.3 0.0 7.1 170 1.8 80 20-24 33.9 70.6 53.3 4.4 23.5 209 10.0 168 25-29 46.5 79.2 49.3 3.5 33.1 205 16.9 166 30-39 44.5 82.0 48.3 9.0 32.5 404 10.8 327 40-49 44.6 82.6 58.2 17.2 46.6 313 9.6 198
Residence Urban 40.1 78.6 55.1 9.2 32.9 548 15.1 426 Rural 40.0 70.7 46.0 7.5 30.0 752 7.1 513
Schooling No schooling 27.4 68.5 40.0 5.7 35.4 115 1.2 53 <5 years complete 37.8 65.5 33.1 9.3 41.3 49 (2.1) 31 5-7 years complete 32.6 65.3 31.5 4.8 26.7 129 0.0 72 8-9 years complete 39.0 67.2 51.0 11.7 23.9 367 2.9 227 10-11 years complete 42.4 70.3 47.1 9.6 32.6 210 3.5 157 12 or more years complete 45.5 86.8 60.3 6.0 35.8 429 21.8 398
Employment (past 12 months) Employed 54.1 78.6 57.4 12.2 38.5 640 14.5 453 Employed, for cash 55.6 78.8 59.0 12.5 41.3 548 16.2 390 Employed, not for cash 45.2 77.3 48.1 10.0 21.8 92 4.1 63 Not employed 26.4 69.6 42.5 4.4 24.2 660 7.1 486
Continued…
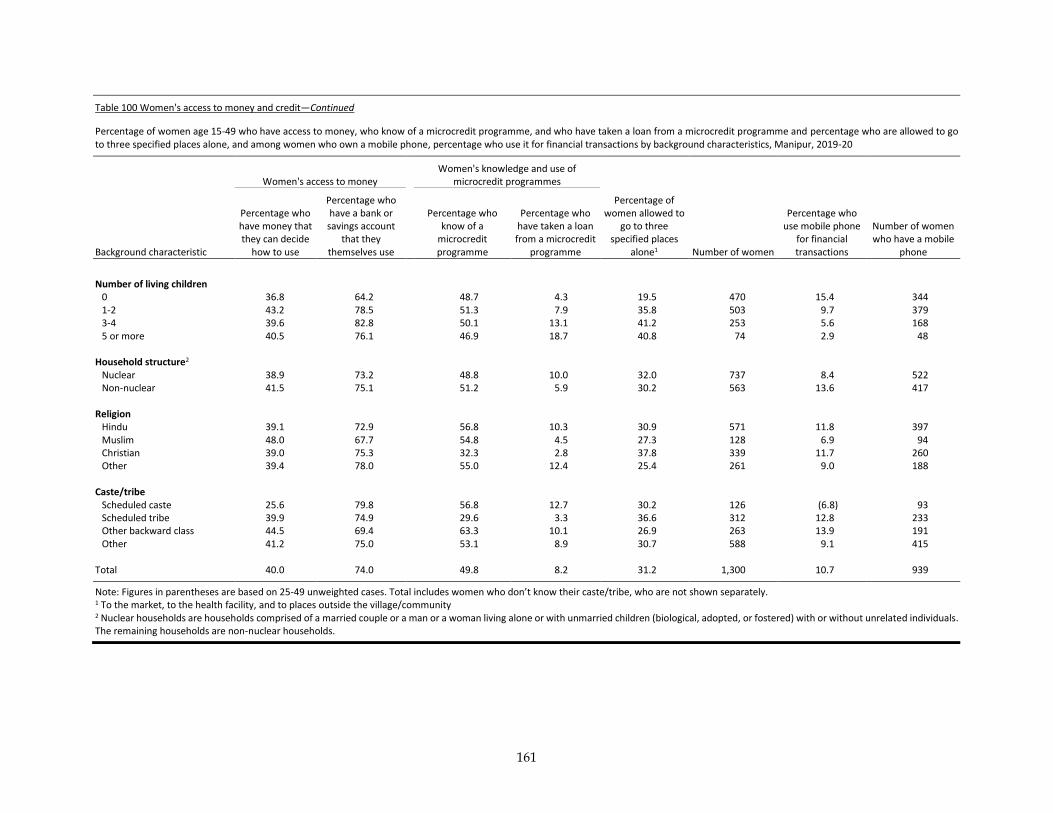
161
Table 100 Women's access to money and credit—Continued
Percentage of women age 15-49 who have access to money, who know of a microcredit programme, and who have taken a loan from a microcredit programme and percentage who are allowed to go to three specified places alone, and among women who own a mobile phone, percentage who use it for financial transactions by background characteristics, Manipur, 2019-20
Women's access to money
Women's knowledge and use of microcredit programmes
Percentage of women allowed to
go to three specified places
alone1 Number of women
Percentage who use mobile phone
for financial transactions
Number of women who have a mobile
phone Background characteristic
Percentage who have money that they can decide
how to use
Percentage who have a bank or savings account
that they themselves use
Percentage who know of a
microcredit programme
Percentage who have taken a loan from a microcredit
programme
Number of living children
0 36.8 64.2 48.7 4.3 19.5 470 15.4 344 1-2 43.2 78.5 51.3 7.9 35.8 503 9.7 379 3-4 39.6 82.8 50.1 13.1 41.2 253 5.6 168 5 or more 40.5 76.1 46.9 18.7 40.8 74 2.9 48
Household structure2 Nuclear 38.9 73.2 48.8 10.0 32.0 737 8.4 522 Non-nuclear 41.5 75.1 51.2 5.9 30.2 563 13.6 417
Religion Hindu 39.1 72.9 56.8 10.3 30.9 571 11.8 397 Muslim 48.0 67.7 54.8 4.5 27.3 128 6.9 94 Christian 39.0 75.3 32.3 2.8 37.8 339 11.7 260 Other 39.4 78.0 55.0 12.4 25.4 261 9.0 188
Caste/tribe Scheduled caste 25.6 79.8 56.8 12.7 30.2 126 (6.8) 93 Scheduled tribe 39.9 74.9 29.6 3.3 36.6 312 12.8 233 Other backward class 44.5 69.4 63.3 10.1 26.9 263 13.9 191 Other 41.2 75.0 53.1 8.9 30.7 588 9.1 415
Total 40.0 74.0 49.8 8.2 31.2 1,300 10.7 939
Note: Figures in parentheses are based on 25-49 unweighted cases. Total includes women who don’t know their caste/tribe, who are not shown separately. 1 To the market, to the health facility, and to places outside the village/community 2 Nuclear households are households comprised of a married couple or a man or a woman living alone or with unmarried children (biological, adopted, or fostered) with or without unrelated individuals. The remaining households are non-nuclear households.
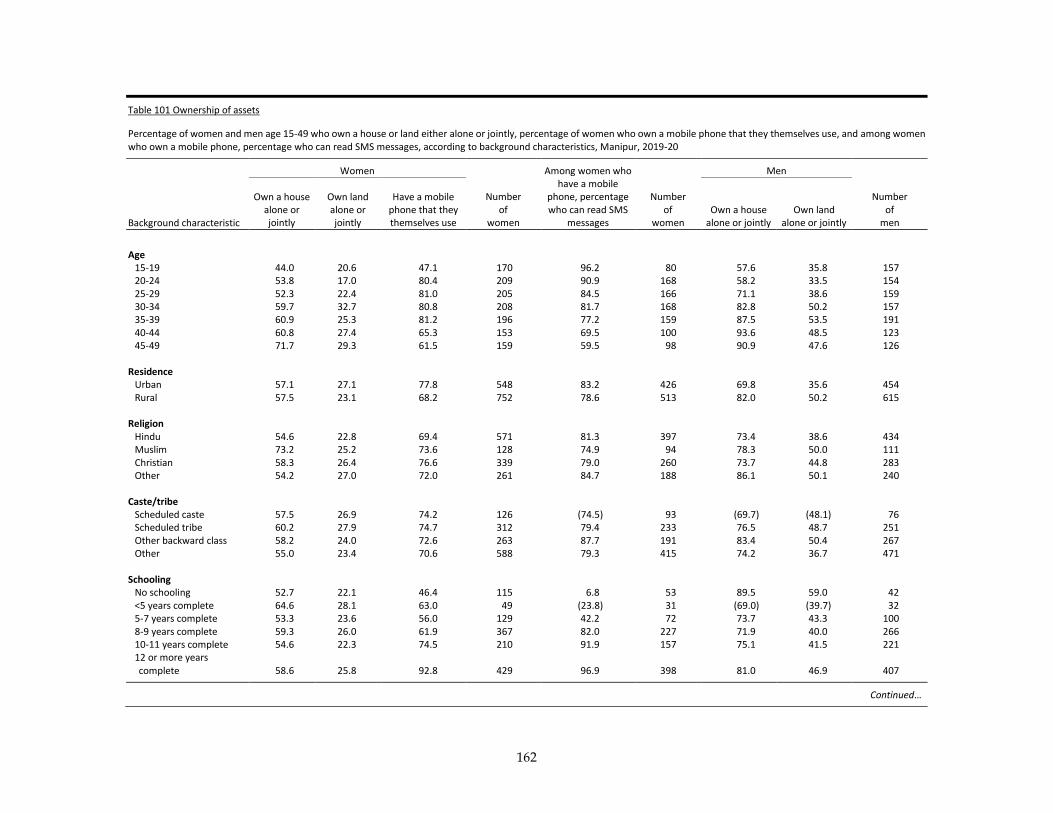
162
Table 101 Ownership of assets
Percentage of women and men age 15-49 who own a house or land either alone or jointly, percentage of women who own a mobile phone that they themselves use, and among women who own a mobile phone, percentage who can read SMS messages, according to background characteristics, Manipur, 2019-20
Women
Number of
women
Among women who have a mobile
phone, percentage who can read SMS
messages
Number of
women
Men
Number of
men Background characteristic
Own a house alone or jointly
Own land alone or jointly
Have a mobile phone that they themselves use
Own a house alone or jointly
Own land alone or jointly
Age
15-19 44.0 20.6 47.1 170 96.2 80 57.6 35.8 157 20-24 53.8 17.0 80.4 209 90.9 168 58.2 33.5 154 25-29 52.3 22.4 81.0 205 84.5 166 71.1 38.6 159 30-34 59.7 32.7 80.8 208 81.7 168 82.8 50.2 157 35-39 60.9 25.3 81.2 196 77.2 159 87.5 53.5 191 40-44 60.8 27.4 65.3 153 69.5 100 93.6 48.5 123 45-49 71.7 29.3 61.5 159 59.5 98 90.9 47.6 126
Residence Urban 57.1 27.1 77.8 548 83.2 426 69.8 35.6 454 Rural 57.5 23.1 68.2 752 78.6 513 82.0 50.2 615
Religion Hindu 54.6 22.8 69.4 571 81.3 397 73.4 38.6 434 Muslim 73.2 25.2 73.6 128 74.9 94 78.3 50.0 111 Christian 58.3 26.4 76.6 339 79.0 260 73.7 44.8 283 Other 54.2 27.0 72.0 261 84.7 188 86.1 50.1 240
Caste/tribe Scheduled caste 57.5 26.9 74.2 126 (74.5) 93 (69.7) (48.1) 76 Scheduled tribe 60.2 27.9 74.7 312 79.4 233 76.5 48.7 251 Other backward class 58.2 24.0 72.6 263 87.7 191 83.4 50.4 267 Other 55.0 23.4 70.6 588 79.3 415 74.2 36.7 471
Schooling No schooling 52.7 22.1 46.4 115 6.8 53 89.5 59.0 42 <5 years complete 64.6 28.1 63.0 49 (23.8) 31 (69.0) (39.7) 32 5-7 years complete 53.3 23.6 56.0 129 42.2 72 73.7 43.3 100 8-9 years complete 59.3 26.0 61.9 367 82.0 227 71.9 40.0 266 10-11 years complete 54.6 22.3 74.5 210 91.9 157 75.1 41.5 221 12 or more years complete 58.6 25.8 92.8 429 96.9 398 81.0 46.9 407
Continued…
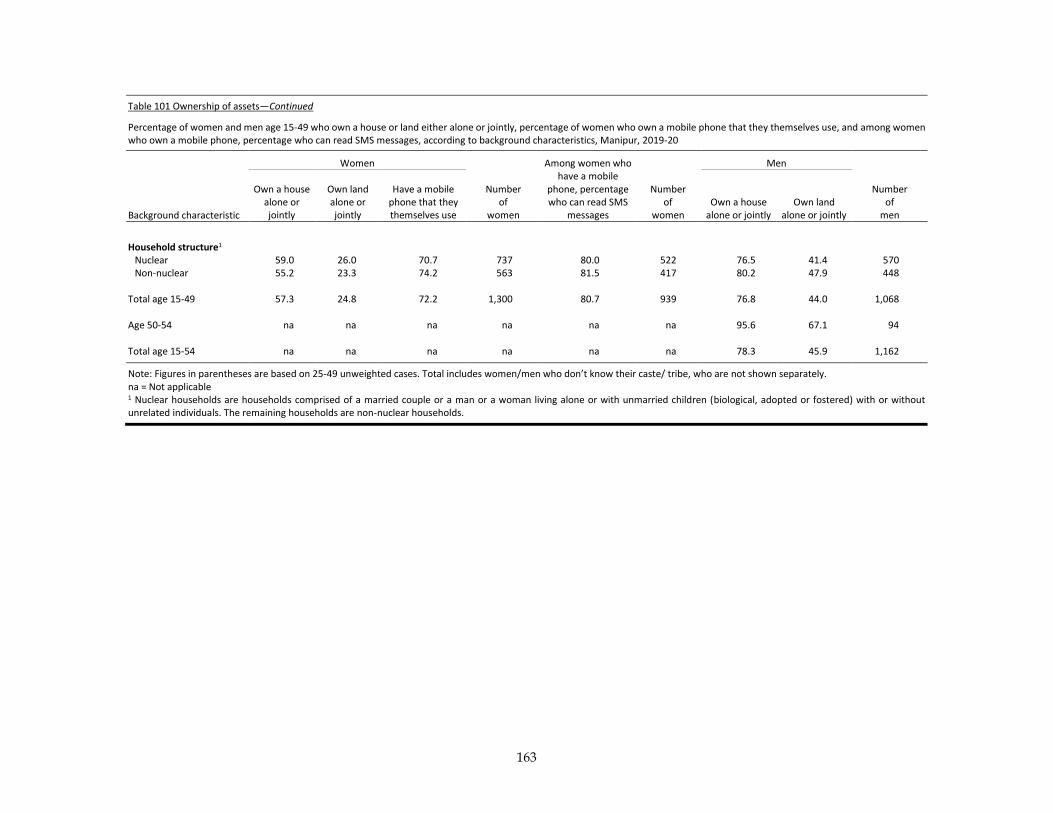
163
Table 101 Ownership of assets—Continued
Percentage of women and men age 15-49 who own a house or land either alone or jointly, percentage of women who own a mobile phone that they themselves use, and among women who own a mobile phone, percentage who can read SMS messages, according to background characteristics, Manipur, 2019-20
Women
Number of
women
Among women who have a mobile
phone, percentage who can read SMS
messages
Number of
women
Men
Number of
men Background characteristic
Own a house alone or jointly
Own land alone or jointly
Have a mobile phone that they themselves use
Own a house alone or jointly
Own land alone or jointly
Household structure1
Nuclear 59.0 26.0 70.7 737 80.0 522 76.5 41.4 570 Non-nuclear 55.2 23.3 74.2 563 81.5 417 80.2 47.9 448
Total age 15-49 57.3 24.8 72.2 1,300 80.7 939 76.8 44.0 1,068
Age 50-54 na na na na na na 95.6 67.1 94
Total age 15-54 na na na na na na 78.3 45.9 1,162
Note: Figures in parentheses are based on 25-49 unweighted cases. Total includes women/men who don’t know their caste/ tribe, who are not shown separately. na = Not applicable 1 Nuclear households are households comprised of a married couple or a man or a woman living alone or with unmarried children (biological, adopted or fostered) with or without unrelated individuals. The remaining households are non-nuclear households.

164
Table 102 Gender role attitudes
Percentage of women and men age 15-49 with specific attitudes toward wife beating and refusal by a wife to have sex with her husband by reason, and percentage of men age 15-49 who agree that a man can behave in specific ways if his wife refuses to have sex with him, according to marital status, Manipur, 2019-20
Ever-married Never married Total
Reason/behaviour Women Men Women Men Women Men
Percentage who agree that a husband is justified in hitting or beating his wife if:
She goes out without telling him 26.3 16.3 21.6 12.7 24.9 14.9
She neglects the house or children 40.3 30.0 41.0 29.3 40.5 29.7
She argues with him 18.3 20.3 15.6 21.4 17.5 20.7
She refuses to have sexual intercourse with him 8.4 7.8 4.3 5.7 7.1 7.0
She doesn't cook properly 19.5 8.2 17.1 7.8 18.8 8.1
He suspects her of being unfaithful 17.3 29.3 17.4 29.8 17.3 29.5
She shows disrespect for in-laws 49.7 44.3 59.9 50.2 52.8 46.6
Percentage who agree with at least one specified
reason 63.5 54.4 71.3 60.7 65.9 56.8
Percentage who agree that a wife is justified in refusing to have sex with her husband when she:
Knows her husband has a sexually transmitted disease 80.8 83.5 81.6 80.2 81.0 82.2
Knows her husband has sex with other women 86.4 81.9 88.3 78.9 87.0 80.7
Is tired or not in the mood 82.5 84.8 81.7 81.0 82.3 83.3
Percentage who agree with all three reasons 71.5 71.2 73.6 67.4 72.2 69.7
Percentage who agree with none of the three reasons 8.2 6.3 9.1 8.9 8.5 7.3
Percentage who agree that when a wife refuses to have sex with her husband, he has the right to:
Get angry and reprimand her na 21.7 na 18.0 na 20.2
Refuse to give her financial support na 14.5 na 14.2 na 14.3
Use force to have sex even if she doesn't want to na 13.1 na 11.6 na 12.5
Have sex with another woman na 15.8 na 14.2 na 15.1
Percentage who agree with all four behaviours na 9.0 na 8.8 na 8.9 Percentage who agree with none of the four
behaviours na 71.6 na 76.9 na 73.7
Number of respondents 904 649 396 420 1,300 1,068
na = Not applicable

165
Table 103 Gender role attitudes by background characteristics
Percentage of women and men age 15-49 who agree that a husband is justified in hitting or beating his wife for at least one specified reason, who agree that a wife is justified in refusing to have sex with her husband for all specified reasons, and percentage of men who agree that when a wife refuses to have sex with her husband, the husband does not have the right to any of the four specified behaviours, by background characteristics, Manipur, 2019-20
Percentage who agree that a husband is justified
in hitting or beating his wife for at least one
specified reason1
Percentage who agree that a wife is justified in
refusing to have sex with her husband for all specified reasons2
Percentage who agree that when a wife
refuses to have sex with her husband, he
does not have the right to any of the four specified behaviours3 Number
Background characteristic Women Men Women Men Men Women Men
Age
15-19 73.7 69.7 69.2 66.7 76.3 170 157 20-24 67.5 61.2 69.1 65.6 72.8 209 154 25-29 65.8 64.6 75.4 59.1 71.1 205 159 30-39 58.4 46.3 72.8 74.7 71.6 404 348 40-49 70.3 55.8 72.9 74.0 72.2 313 249
Residence Urban 63.8 48.0 74.5 75.6 71.4 548 454 Rural 67.5 63.4 70.5 65.4 73.4 752 615
Schooling No schooling 68.1 62.9 66.9 71.2 80.0 115 42 <5 years complete 58.3 (49.4) 68.8 (84.1) (71.9) 49 32 5-7 years complete 64.0 53.6 72.4 73.6 70.5 129 100 8-9 years complete 68.4 60.7 68.6 66.7 71.0 367 266 10-11 years complete 72.5 63.1 76.5 68.6 74.6 210 221 12 or more years complete 61.4 51.7 74.8 70.1 72.1 429 407
Employment (past 12
months) Employed 70.6 54.9 71.5 69.9 71.4 640 878 Employed, for cash 71.4 54.8 71.6 70.3 71.2 548 804 Employed, not for cash 66.0 56.4 71.1 65.9 72.8 92 74 Not employed 61.3 65.8 72.8 68.9 77.8 660 190
Marital status Never married 71.3 60.7 73.6 67.4 74.2 396 420 Currently married 62.5 54.0 71.8 71.3 71.4 841 638 Widowed/divorced/ separated/deserted 76.9 * 68.1 * * 64 10
Number of living children
0 71.0 58.1 72.9 68.0 74.7 470 507 1-2 61.0 54.3 75.1 71.3 70.8 503 371 3-4 64.7 56.5 63.6 70.7 69.0 253 157 5 or more 70.9 67.7 77.0 73.6 75.3 74 33
Continued…
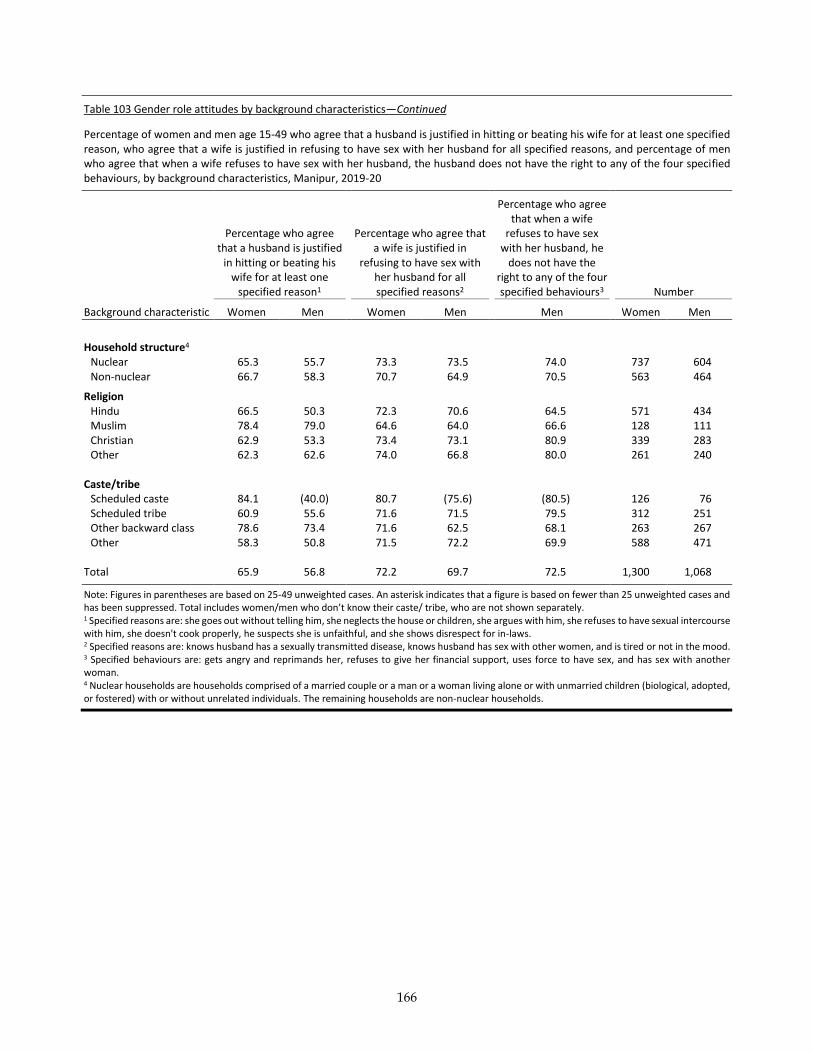
166
Table 103 Gender role attitudes by background characteristics—Continued
Percentage of women and men age 15-49 who agree that a husband is justified in hitting or beating his wife for at least one specified reason, who agree that a wife is justified in refusing to have sex with her husband for all specified reasons, and percentage of men who agree that when a wife refuses to have sex with her husband, the husband does not have the right to any of the four specified behaviours, by background characteristics, Manipur, 2019-20
Percentage who agree that a husband is justified
in hitting or beating his wife for at least one
specified reason1
Percentage who agree that a wife is justified in
refusing to have sex with her husband for all specified reasons2
Percentage who agree that when a wife
refuses to have sex with her husband, he
does not have the right to any of the four specified behaviours3 Number
Background characteristic Women Men Women Men Men Women Men
Household structure4
Nuclear 65.3 55.7 73.3 73.5 74.0 737 604 Non-nuclear 66.7 58.3 70.7 64.9 70.5 563 464
Religion Hindu 66.5 50.3 72.3 70.6 64.5 571 434 Muslim 78.4 79.0 64.6 64.0 66.6 128 111 Christian 62.9 53.3 73.4 73.1 80.9 339 283 Other 62.3 62.6 74.0 66.8 80.0 261 240
Caste/tribe Scheduled caste 84.1 (40.0) 80.7 (75.6) (80.5) 126 76 Scheduled tribe 60.9 55.6 71.6 71.5 79.5 312 251 Other backward class 78.6 73.4 71.6 62.5 68.1 263 267 Other 58.3 50.8 71.5 72.2 69.9 588 471
Total 65.9 56.8 72.2 69.7 72.5 1,300 1,068
Note: Figures in parentheses are based on 25-49 unweighted cases. An asterisk indicates that a figure is based on fewer than 25 unweighted cases and has been suppressed. Total includes women/men who don’t know their caste/ tribe, who are not shown separately. 1 Specified reasons are: she goes out without telling him, she neglects the house or children, she argues with him, she refuses to have sexual intercourse with him, she doesn't cook properly, he suspects she is unfaithful, and she shows disrespect for in-laws. 2 Specified reasons are: knows husband has a sexually transmitted disease, knows husband has sex with other women, and is tired or not in the mood. 3 Specified behaviours are: gets angry and reprimands her, refuses to give her financial support, uses force to have sex, and has sex with another woman. 4 Nuclear households are households comprised of a married couple or a man or a woman living alone or with unmarried children (biological, adopted, or fostered) with or without unrelated individuals. The remaining households are non-nuclear households.
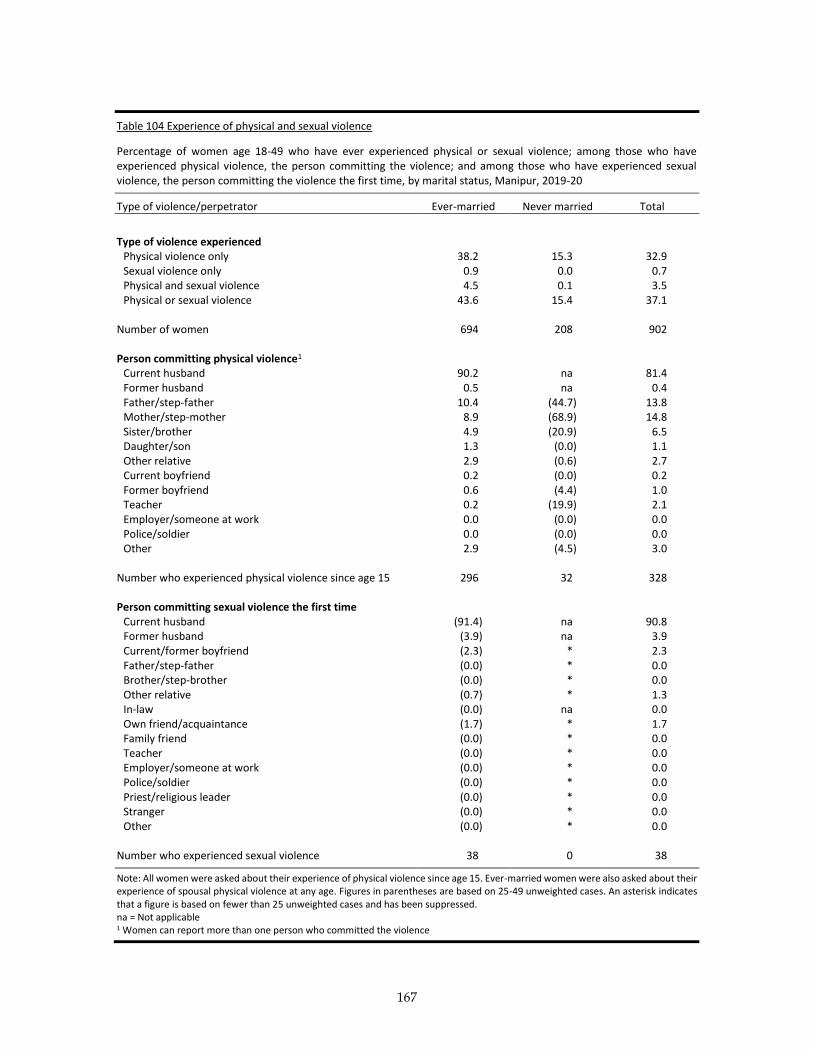
167
Table 104 Experience of physical and sexual violence
Percentage of women age 18-49 who have ever experienced physical or sexual violence; among those who have experienced physical violence, the person committing the violence; and among those who have experienced sexual violence, the person committing the violence the first time, by marital status, Manipur, 2019-20
Type of violence/perpetrator Ever-married Never married Total
Type of violence experienced
Physical violence only 38.2 15.3 32.9 Sexual violence only 0.9 0.0 0.7 Physical and sexual violence 4.5 0.1 3.5 Physical or sexual violence 43.6 15.4 37.1
Number of women 694 208 902
Person committing physical violence1 Current husband 90.2 na 81.4 Former husband 0.5 na 0.4 Father/step-father 10.4 (44.7) 13.8 Mother/step-mother 8.9 (68.9) 14.8 Sister/brother 4.9 (20.9) 6.5 Daughter/son 1.3 (0.0) 1.1 Other relative 2.9 (0.6) 2.7 Current boyfriend 0.2 (0.0) 0.2 Former boyfriend 0.6 (4.4) 1.0 Teacher 0.2 (19.9) 2.1 Employer/someone at work 0.0 (0.0) 0.0 Police/soldier 0.0 (0.0) 0.0 Other 2.9 (4.5) 3.0
Number who experienced physical violence since age 15 296 32 328
Person committing sexual violence the first time Current husband (91.4) na 90.8 Former husband (3.9) na 3.9 Current/former boyfriend (2.3) * 2.3 Father/step-father (0.0) * 0.0 Brother/step-brother (0.0) * 0.0 Other relative (0.7) * 1.3 In-law (0.0) na 0.0 Own friend/acquaintance (1.7) * 1.7 Family friend (0.0) * 0.0 Teacher (0.0) * 0.0 Employer/someone at work (0.0) * 0.0 Police/soldier (0.0) * 0.0 Priest/religious leader (0.0) * 0.0 Stranger (0.0) * 0.0 Other (0.0) * 0.0
Number who experienced sexual violence 38 0 38
Note: All women were asked about their experience of physical violence since age 15. Ever-married women were also asked about their experience of spousal physical violence at any age. Figures in parentheses are based on 25-49 unweighted cases. An asterisk indicates that a figure is based on fewer than 25 unweighted cases and has been suppressed. na = Not applicable 1 Women can report more than one person who committed the violence
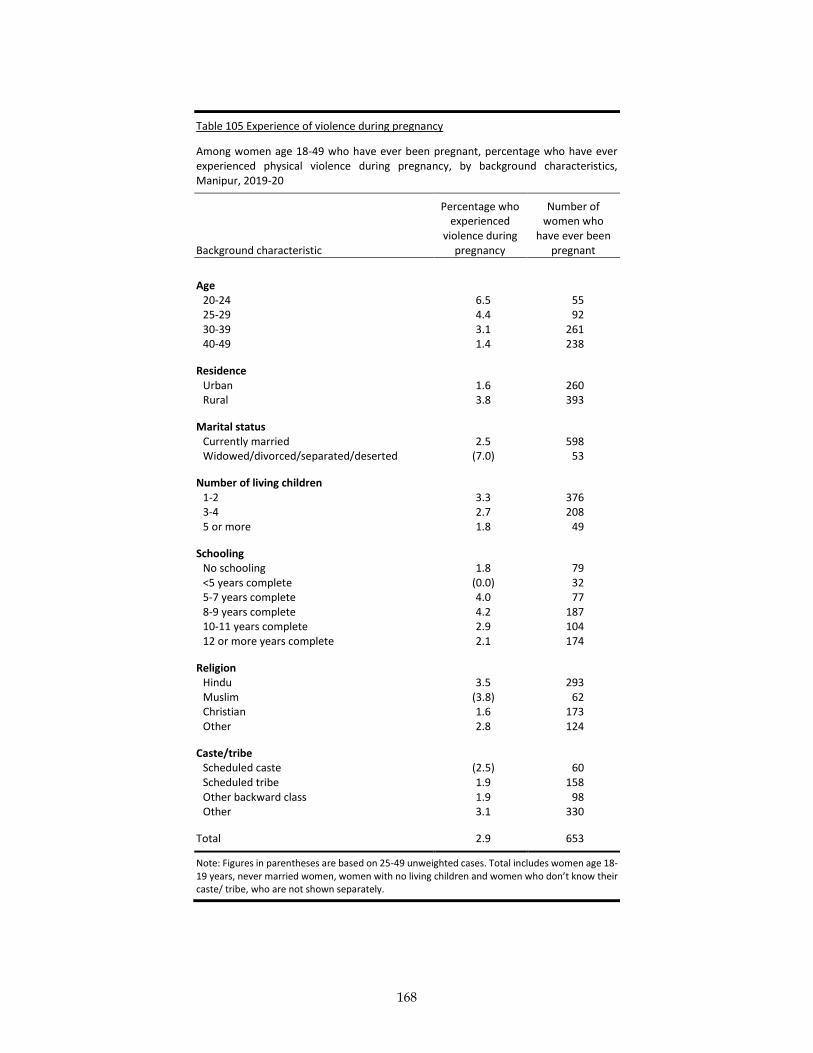
168
Table 105 Experience of violence during pregnancy
Among women age 18-49 who have ever been pregnant, percentage who have ever experienced physical violence during pregnancy, by background characteristics, Manipur, 2019-20
Background characteristic
Percentage who experienced
violence during pregnancy
Number of women who
have ever been pregnant
Age
20-24 6.5 55 25-29 4.4 92 30-39 3.1 261 40-49 1.4 238
Residence Urban 1.6 260 Rural 3.8 393
Marital status Currently married 2.5 598 Widowed/divorced/separated/deserted (7.0) 53
Number of living children 1-2 3.3 376 3-4 2.7 208 5 or more 1.8 49
Schooling No schooling 1.8 79 <5 years complete (0.0) 32 5-7 years complete 4.0 77 8-9 years complete 4.2 187 10-11 years complete 2.9 104 12 or more years complete 2.1 174
Religion Hindu 3.5 293 Muslim (3.8) 62 Christian 1.6 173 Other 2.8 124
Caste/tribe Scheduled caste (2.5) 60 Scheduled tribe 1.9 158 Other backward class 1.9 98 Other 3.1 330
Total 2.9 653
Note: Figures in parentheses are based on 25-49 unweighted cases. Total includes women age 18-19 years, never married women, women with no living children and women who don’t know their caste/ tribe, who are not shown separately.
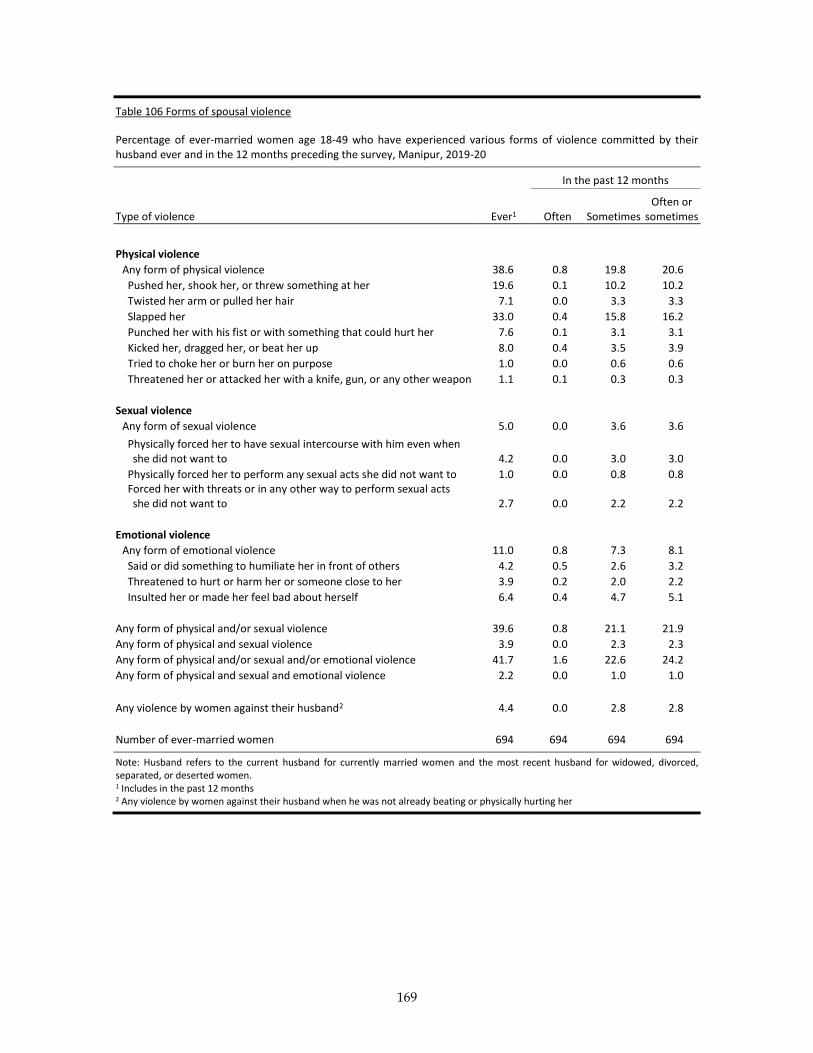
169
Table 106 Forms of spousal violence
Percentage of ever-married women age 18-49 who have experienced various forms of violence committed by their husband ever and in the 12 months preceding the survey, Manipur, 2019-20
In the past 12 months
Type of violence Ever1 Often Sometimes Often or
sometimes
Physical violence
Any form of physical violence 38.6 0.8 19.8 20.6
Pushed her, shook her, or threw something at her 19.6 0.1 10.2 10.2
Twisted her arm or pulled her hair 7.1 0.0 3.3 3.3
Slapped her 33.0 0.4 15.8 16.2
Punched her with his fist or with something that could hurt her 7.6 0.1 3.1 3.1
Kicked her, dragged her, or beat her up 8.0 0.4 3.5 3.9
Tried to choke her or burn her on purpose 1.0 0.0 0.6 0.6
Threatened her or attacked her with a knife, gun, or any other weapon 1.1 0.1 0.3 0.3
Sexual violence
Any form of sexual violence 5.0 0.0 3.6 3.6
Physically forced her to have sexual intercourse with him even when she did not want to 4.2 0.0 3.0 3.0
Physically forced her to perform any sexual acts she did not want to 1.0 0.0 0.8 0.8 Forced her with threats or in any other way to perform sexual acts
she did not want to 2.7 0.0 2.2 2.2
Emotional violence
Any form of emotional violence 11.0 0.8 7.3 8.1
Said or did something to humiliate her in front of others 4.2 0.5 2.6 3.2
Threatened to hurt or harm her or someone close to her 3.9 0.2 2.0 2.2
Insulted her or made her feel bad about herself 6.4 0.4 4.7 5.1
Any form of physical and/or sexual violence 39.6 0.8 21.1 21.9
Any form of physical and sexual violence 3.9 0.0 2.3 2.3
Any form of physical and/or sexual and/or emotional violence 41.7 1.6 22.6 24.2
Any form of physical and sexual and emotional violence 2.2 0.0 1.0 1.0
Any violence by women against their husband2 4.4 0.0 2.8 2.8
Number of ever-married women 694 694 694 694
Note: Husband refers to the current husband for currently married women and the most recent husband for widowed, divorced, separated, or deserted women. 1 Includes in the past 12 months 2 Any violence by women against their husband when he was not already beating or physically hurting her

170
Table 107 Spousal violence by background characteristics
Percentage of ever-married women age 18-49 by whether they have ever experienced emotional, physical, or sexual violence committed by their husband, according to background characteristics, Manipur, 2019-20
Background characteristic Emotional violence
Physical violence
Sexual violence
Physical or sexual
violence
Emotional, physical, or
sexual violence
Number of women
Age
20-24 9.5 42.1 3.6 42.1 44.0 72 25-29 11.4 42.4 4.9 45.0 47.2 96 30-39 11.5 34.5 6.6 36.2 37.9 271 40-49 10.8 41.3 3.9 41.3 43.9 247
Residence Urban 7.5 35.0 0.7 35.0 36.8 279 Rural 13.3 41.0 7.9 42.8 45.0 415
Schooling No schooling 10.2 40.3 2.3 42.5 44.9 80 <5 years complete (2.8) (40.9) (6.2) (45.5) (46.8) 33 5-7 years complete 8.3 32.6 10.0 34.6 35.7 78 8-9 years complete 17.5 41.8 7.6 42.8 45.4 195 10-11 years complete 8.7 47.9 2.9 48.3 50.2 107 12 or more years complete 8.5 31.7 2.6 31.8 33.9 201
Employment (past 12 months) Not employed 4.0 29.1 2.9 30.0 31.1 313 Employed for cash 18.5 47.7 7.7 49.1 51.5 327 Employed not for cash 6.0 38.0 1.2 38.0 44.0 54
Marital status Currently married 11.1 37.3 4.6 38.4 40.5 639 Widowed (7.7) (48.7) (5.5) (48.7) (51.4) 40
Marital duration1 Married only once 11.0 38.6 4.9 39.7 41.7 686 0-4 years 11.0 33.9 3.0 34.2 36.5 137 5-9 years 10.5 37.6 8.0 39.3 40.0 152 10 or more years 11.3 40.7 4.4 41.7 44.2 397
Number of living children 0 4.7 21.5 1.9 21.8 24.1 61 1-2 11.0 35.7 4.8 36.6 39.1 376 3-4 13.8 46.0 7.0 47.7 48.5 208 5 or more 6.5 50.1 1.8 50.1 54.2 49
Household structure2 Nuclear 11.0 38.4 7.1 39.9 42.8 397 Non-nuclear 10.9 38.8 2.3 39.2 40.3 297
Continued…
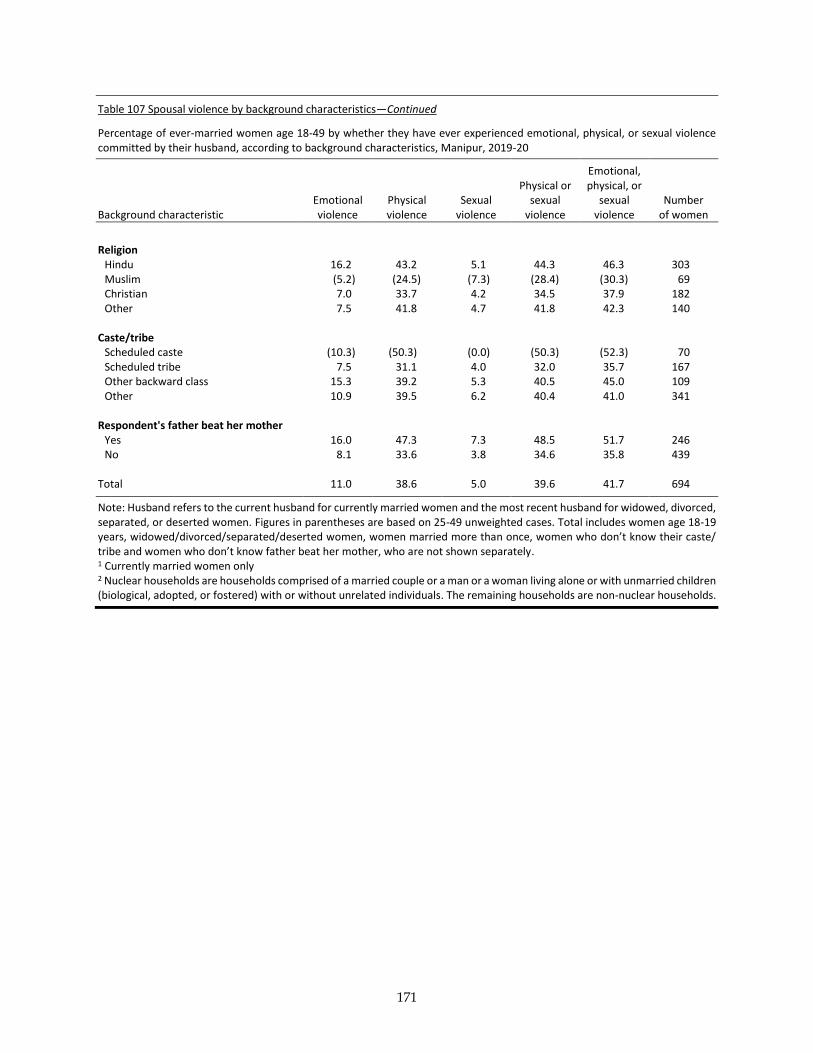
171
Table 107 Spousal violence by background characteristics—Continued
Percentage of ever-married women age 18-49 by whether they have ever experienced emotional, physical, or sexual violence committed by their husband, according to background characteristics, Manipur, 2019-20
Background characteristic Emotional violence
Physical violence
Sexual violence
Physical or sexual
violence
Emotional, physical, or
sexual violence
Number of women
Religion
Hindu 16.2 43.2 5.1 44.3 46.3 303 Muslim (5.2) (24.5) (7.3) (28.4) (30.3) 69 Christian 7.0 33.7 4.2 34.5 37.9 182 Other 7.5 41.8 4.7 41.8 42.3 140
Caste/tribe Scheduled caste (10.3) (50.3) (0.0) (50.3) (52.3) 70 Scheduled tribe 7.5 31.1 4.0 32.0 35.7 167 Other backward class 15.3 39.2 5.3 40.5 45.0 109 Other 10.9 39.5 6.2 40.4 41.0 341
Respondent's father beat her mother Yes 16.0 47.3 7.3 48.5 51.7 246 No 8.1 33.6 3.8 34.6 35.8 439
Total 11.0 38.6 5.0 39.6 41.7 694
Note: Husband refers to the current husband for currently married women and the most recent husband for widowed, divorced, separated, or deserted women. Figures in parentheses are based on 25-49 unweighted cases. Total includes women age 18-19 years, widowed/divorced/separated/deserted women, women married more than once, women who don’t know their caste/ tribe and women who don’t know father beat her mother, who are not shown separately. 1 Currently married women only 2 Nuclear households are households comprised of a married couple or a man or a woman living alone or with unmarried children (biological, adopted, or fostered) with or without unrelated individuals. The remaining households are non-nuclear households.
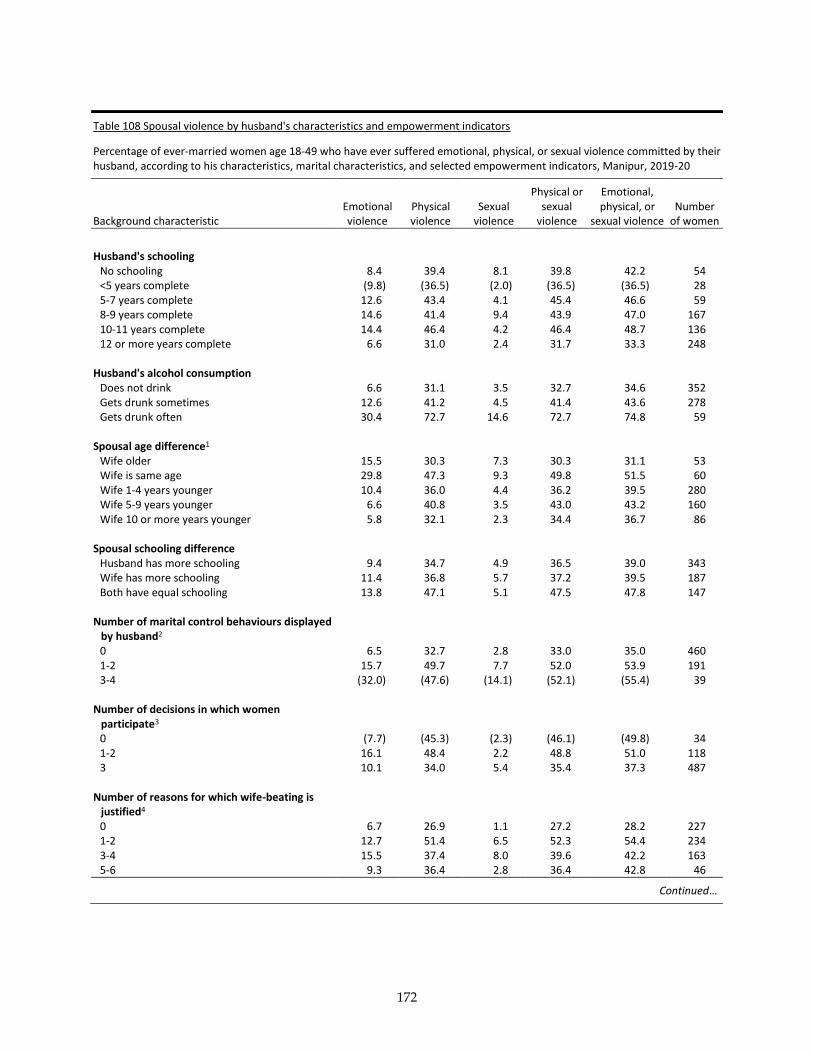
172
Table 108 Spousal violence by husband's characteristics and empowerment indicators
Percentage of ever-married women age 18-49 who have ever suffered emotional, physical, or sexual violence committed by their husband, according to his characteristics, marital characteristics, and selected empowerment indicators, Manipur, 2019-20
Background characteristic Emotional violence
Physical violence
Sexual violence
Physical or sexual
violence
Emotional, physical, or
sexual violence Number
of women
Husband's schooling
No schooling 8.4 39.4 8.1 39.8 42.2 54 <5 years complete (9.8) (36.5) (2.0) (36.5) (36.5) 28 5-7 years complete 12.6 43.4 4.1 45.4 46.6 59 8-9 years complete 14.6 41.4 9.4 43.9 47.0 167 10-11 years complete 14.4 46.4 4.2 46.4 48.7 136 12 or more years complete 6.6 31.0 2.4 31.7 33.3 248
Husband's alcohol consumption Does not drink 6.6 31.1 3.5 32.7 34.6 352 Gets drunk sometimes 12.6 41.2 4.5 41.4 43.6 278 Gets drunk often 30.4 72.7 14.6 72.7 74.8 59
Spousal age difference1 Wife older 15.5 30.3 7.3 30.3 31.1 53 Wife is same age 29.8 47.3 9.3 49.8 51.5 60 Wife 1-4 years younger 10.4 36.0 4.4 36.2 39.5 280 Wife 5-9 years younger 6.6 40.8 3.5 43.0 43.2 160 Wife 10 or more years younger 5.8 32.1 2.3 34.4 36.7 86
Spousal schooling difference Husband has more schooling 9.4 34.7 4.9 36.5 39.0 343 Wife has more schooling 11.4 36.8 5.7 37.2 39.5 187 Both have equal schooling 13.8 47.1 5.1 47.5 47.8 147
Number of marital control behaviours displayed by husband2 0 6.5 32.7 2.8 33.0 35.0 460 1-2 15.7 49.7 7.7 52.0 53.9 191 3-4 (32.0) (47.6) (14.1) (52.1) (55.4) 39
Number of decisions in which women participate3 0 (7.7) (45.3) (2.3) (46.1) (49.8) 34 1-2 16.1 48.4 2.2 48.8 51.0 118 3 10.1 34.0 5.4 35.4 37.3 487
Number of reasons for which wife-beating is justified4 0 6.7 26.9 1.1 27.2 28.2 227 1-2 12.7 51.4 6.5 52.3 54.4 234 3-4 15.5 37.4 8.0 39.6 42.2 163 5-6 9.3 36.4 2.8 36.4 42.8 46
Continued…
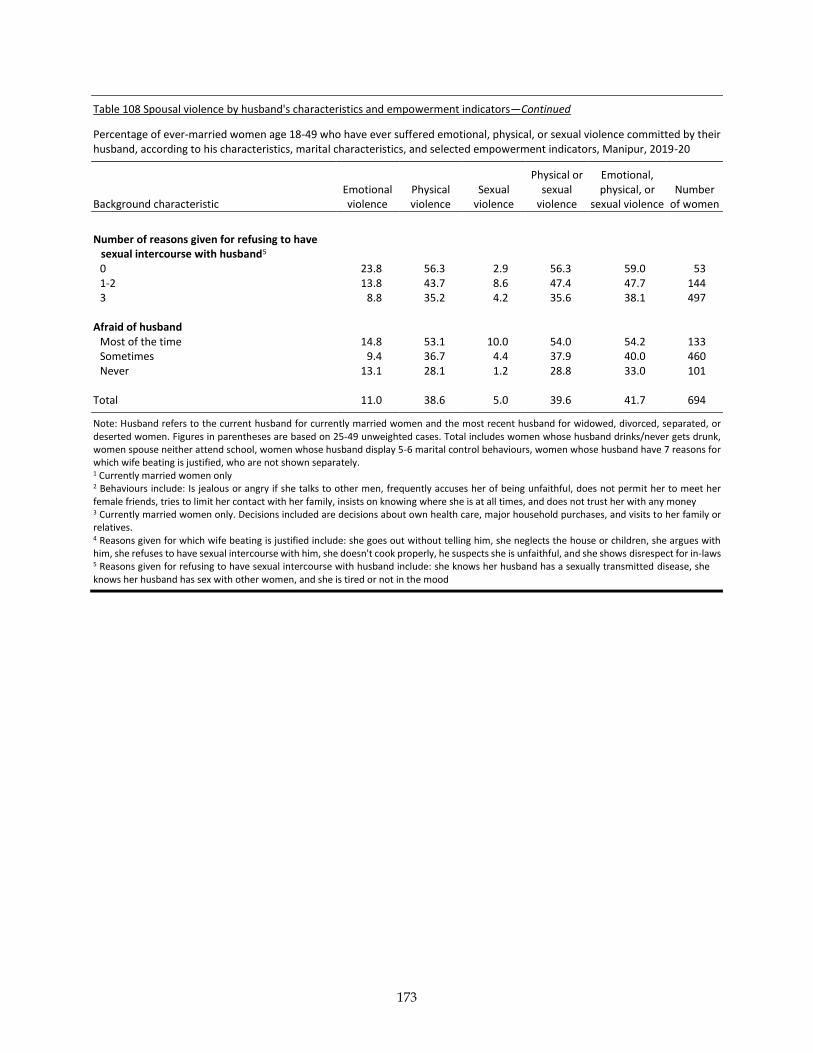
173
Table 108 Spousal violence by husband's characteristics and empowerment indicators—Continued
Percentage of ever-married women age 18-49 who have ever suffered emotional, physical, or sexual violence committed by their husband, according to his characteristics, marital characteristics, and selected empowerment indicators, Manipur, 2019-20
Background characteristic Emotional violence
Physical violence
Sexual violence
Physical or sexual
violence
Emotional, physical, or
sexual violence Number
of women
Number of reasons given for refusing to have
sexual intercourse with husband5 0 23.8 56.3 2.9 56.3 59.0 53 1-2 13.8 43.7 8.6 47.4 47.7 144 3 8.8 35.2 4.2 35.6 38.1 497
Afraid of husband Most of the time 14.8 53.1 10.0 54.0 54.2 133 Sometimes 9.4 36.7 4.4 37.9 40.0 460 Never 13.1 28.1 1.2 28.8 33.0 101
Total 11.0 38.6 5.0 39.6 41.7 694
Note: Husband refers to the current husband for currently married women and the most recent husband for widowed, divorced, separated, or deserted women. Figures in parentheses are based on 25-49 unweighted cases. Total includes women whose husband drinks/never gets drunk, women spouse neither attend school, women whose husband display 5-6 marital control behaviours, women whose husband have 7 reasons for which wife beating is justified, who are not shown separately. 1 Currently married women only 2 Behaviours include: Is jealous or angry if she talks to other men, frequently accuses her of being unfaithful, does not permit her to meet her female friends, tries to limit her contact with her family, insists on knowing where she is at all times, and does not trust her with any money 3 Currently married women only. Decisions included are decisions about own health care, major household purchases, and visits to her family or relatives. 4 Reasons given for which wife beating is justified include: she goes out without telling him, she neglects the house or children, she argues with him, she refuses to have sexual intercourse with him, she doesn't cook properly, he suspects she is unfaithful, and she shows disrespect for in-laws 5 Reasons given for refusing to have sexual intercourse with husband include: she knows her husband has a sexually transmitted disease, she knows her husband has sex with other women, and she is tired or not in the mood

174
Table 109 Injuries to women due to spousal violence
Percentage of ever-married women age 18-49 who have experienced spousal violence by types of injuries resulting from what their husband did to them, the type of violence, and whether they have experienced the violence ever and in the 12 months preceding the survey, Manipur, 2019-20
Percentage of women who have had:
Type of spousal violence experienced
Cuts, bruises, or aches
Severe burns
Eye injuries, sprains,
dislocations, or minor burns
Deep wounds, broken bones, broken teeth, or any other serious injury
Any of these injuries
Number of ever-married
women
Experienced physical violence
Ever1 4.7 0.3 4.7 2.5 8.0 268 In the past 12 months 4.8 0.3 5.5 3.1 9.7 143
Experienced sexual violence Ever1 (16.3) (2.5) (18.1) (15.1) (29.5) 35 In the past 12 months (9.9) (1.8) (18.8) (16.4) (28.4) 25
Experienced physical or sexual violence
Ever1 4.6 0.3 4.6 2.5 7.8 275 In the past 12 months 4.5 0.3 5.2 3.0 9.1 152
Experienced physical and sexual violence
Ever1 (20.7) (3.2) (23.0) (19.2) (37.5) 27 In the past 12 months * * * * * 16
Note: Husband refers to the current husband for currently married women and the most recent husband for widowed, divorced, separated, or deserted women. Figures in parentheses are based on 25-49 unweighted cases. An asterisk indicates that a figure is based on fewer than 25 unweighted cases and has been suppressed. 1 Includes violence in the past 12 months
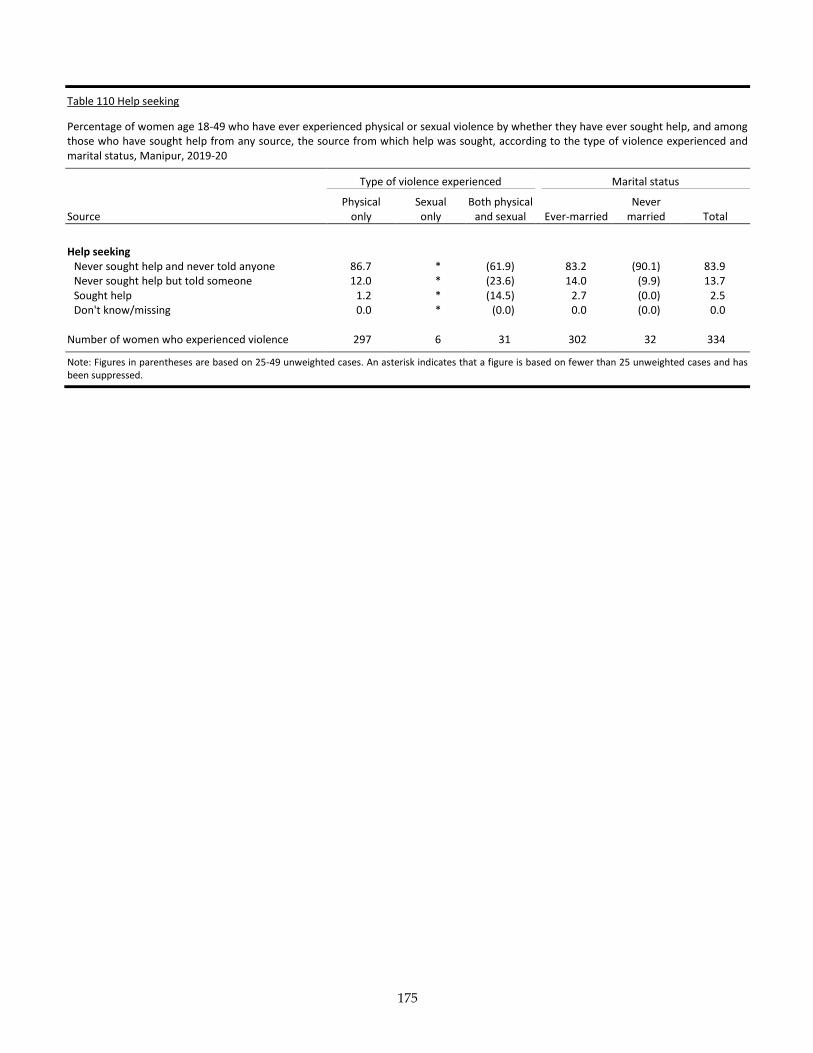
175
Table 110 Help seeking
Percentage of women age 18-49 who have ever experienced physical or sexual violence by whether they have ever sought help, and among those who have sought help from any source, the source from which help was sought, according to the type of violence experienced and marital status, Manipur, 2019-20
Type of violence experienced Marital status
Source Physical
only Sexual only
Both physical and sexual Ever-married
Never married Total
Help seeking
Never sought help and never told anyone 86.7 * (61.9) 83.2 (90.1) 83.9 Never sought help but told someone 12.0 * (23.6) 14.0 (9.9) 13.7 Sought help 1.2 * (14.5) 2.7 (0.0) 2.5 Don't know/missing 0.0 * (0.0) 0.0 (0.0) 0.0
Number of women who experienced violence 297 6 31 302 32 334
Note: Figures in parentheses are based on 25-49 unweighted cases. An asterisk indicates that a figure is based on fewer than 25 unweighted cases and has been suppressed.

176
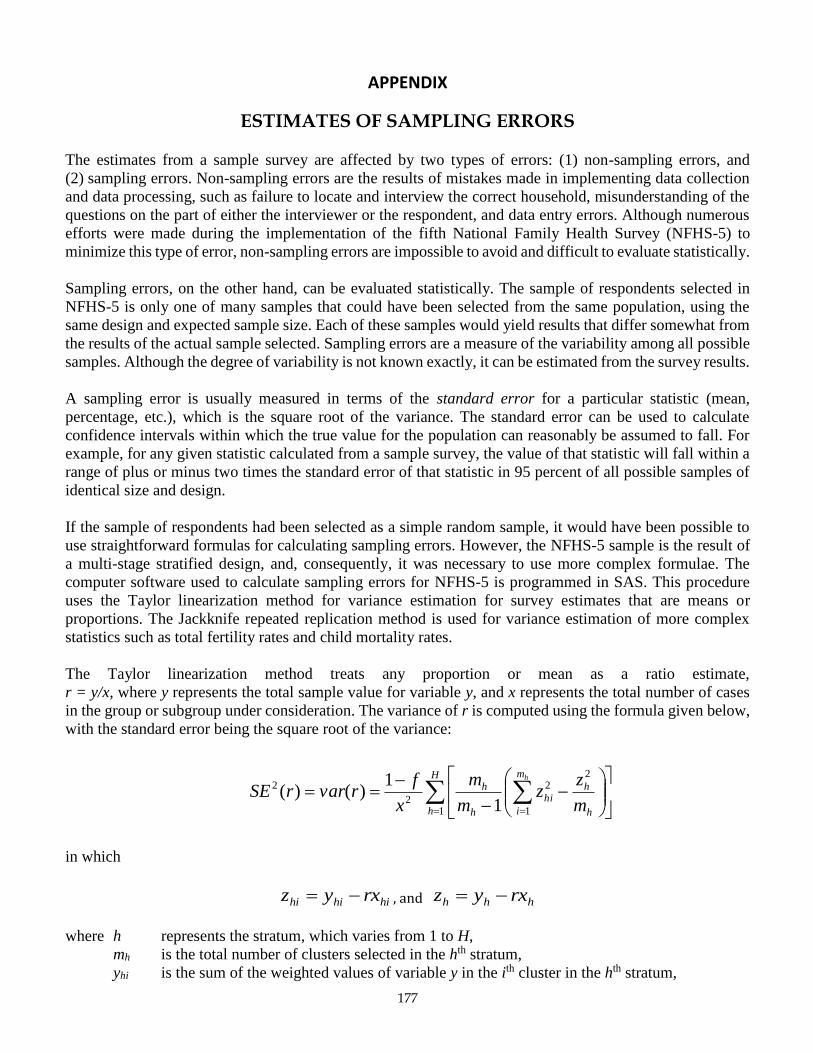
177
APPENDIX
ESTIMATES OF SAMPLING ERRORS
The estimates from a sample survey are affected by two types of errors: (1) non-sampling errors, and
(2) sampling errors. Non-sampling errors are the results of mistakes made in implementing data collection
and data processing, such as failure to locate and interview the correct household, misunderstanding of the
questions on the part of either the interviewer or the respondent, and data entry errors. Although numerous
efforts were made during the implementation of the fifth National Family Health Survey (NFHS-5) to
minimize this type of error, non-sampling errors are impossible to avoid and difficult to evaluate statistically.
Sampling errors, on the other hand, can be evaluated statistically. The sample of respondents selected in
NFHS-5 is only one of many samples that could have been selected from the same population, using the
same design and expected sample size. Each of these samples would yield results that differ somewhat from
the results of the actual sample selected. Sampling errors are a measure of the variability among all possible
samples. Although the degree of variability is not known exactly, it can be estimated from the survey results.
A sampling error is usually measured in terms of the standard error for a particular statistic (mean,
percentage, etc.), which is the square root of the variance. The standard error can be used to calculate
confidence intervals within which the true value for the population can reasonably be assumed to fall. For
example, for any given statistic calculated from a sample survey, the value of that statistic will fall within a
range of plus or minus two times the standard error of that statistic in 95 percent of all possible samples of
identical size and design.
If the sample of respondents had been selected as a simple random sample, it would have been possible to
use straightforward formulas for calculating sampling errors. However, the NFHS-5 sample is the result of
a multi-stage stratified design, and, consequently, it was necessary to use more complex formulae. The
computer software used to calculate sampling errors for NFHS-5 is programmed in SAS. This procedure
uses the Taylor linearization method for variance estimation for survey estimates that are means or
proportions. The Jackknife repeated replication method is used for variance estimation of more complex
statistics such as total fertility rates and child mortality rates.
The Taylor linearization method treats any proportion or mean as a ratio estimate,
r = y/x, where y represents the total sample value for variable y, and x represents the total number of cases
in the group or subgroup under consideration. The variance of r is computed using the formula given below,
with the standard error being the square root of the variance:
H
h h
h
m
i
hi
h
h
m
zz
m
m
x
frvarrSE
h
1
2
1
2
2
2
1
1)()(
in which
hihihi rxyz , and hhh rxyz
where h represents the stratum, which varies from 1 to H,
mh is the total number of clusters selected in the hth stratum,
yhi is the sum of the weighted values of variable y in the ith cluster in the hth stratum,
178
xhi is the sum of the weighted number of cases in the ith cluster in the hth stratum, and
f is the overall sampling fraction, which is so small that it is ignored.
The Jackknife repeated replication method derives estimates of complex rates from each of several
replications of the parent sample, and calculates standard errors for these estimates using simple formulae.
Each replication considers all but one cluster in the calculation of the estimates. Pseudo-independent
replications are thus created. In the NFHS-5 sample for Manipur, there were 378 clusters. Hence, 378
replications were created. The variance of a rate r is calculated as follows:
SE r var rk k
r ri
k
i
2
1
21
1( ) ( )
( )( )
in which
)()1( ii rkkrr
where r is the estimate computed from the full sample of 378 clusters,
r(i) is the estimate computed from the reduced sample of 377 clusters (ith cluster excluded), and
k is the total number of clusters.
In addition to the standard error, the design effect (DEFT) for each estimate is computed, which is defined
as the ratio between the standard error using the given sample design and the standard error that would result
if a simple random sample had been used. A DEFT value of 1.0 indicates that the sample design is as efficient
as a simple random sample, while a value greater than 1.0 indicates the increase in the sampling error due
to the use of a more complex and less statistically efficient design. The relative standard error (SE/R) and
confidence limits (R±2SE) for each estimate are also computed.
Sampling errors for NFHS-5 are calculated for selected variables considered to be of primary interest. The
results are presented in this appendix for Manipur as a whole and for the urban and rural areas of the state.
For each variable, the type of statistic (mean, proportion, rate, or ratio) and the base population are given in
Table A.1. Tables A.2-A4 present the total, urban, and rural values of the statistic (R), their standard errors
(SE), the number of unweighted (N) and weighted (WN) cases, the design effect (DEFT), the relative
standard error (SE/R), and the 95 percent confidence limits (R±2SE) for each variable. The DEFT is
considered undefined when the standard error for a simple random sample is zero (when the estimate is close
to 0 or 1).
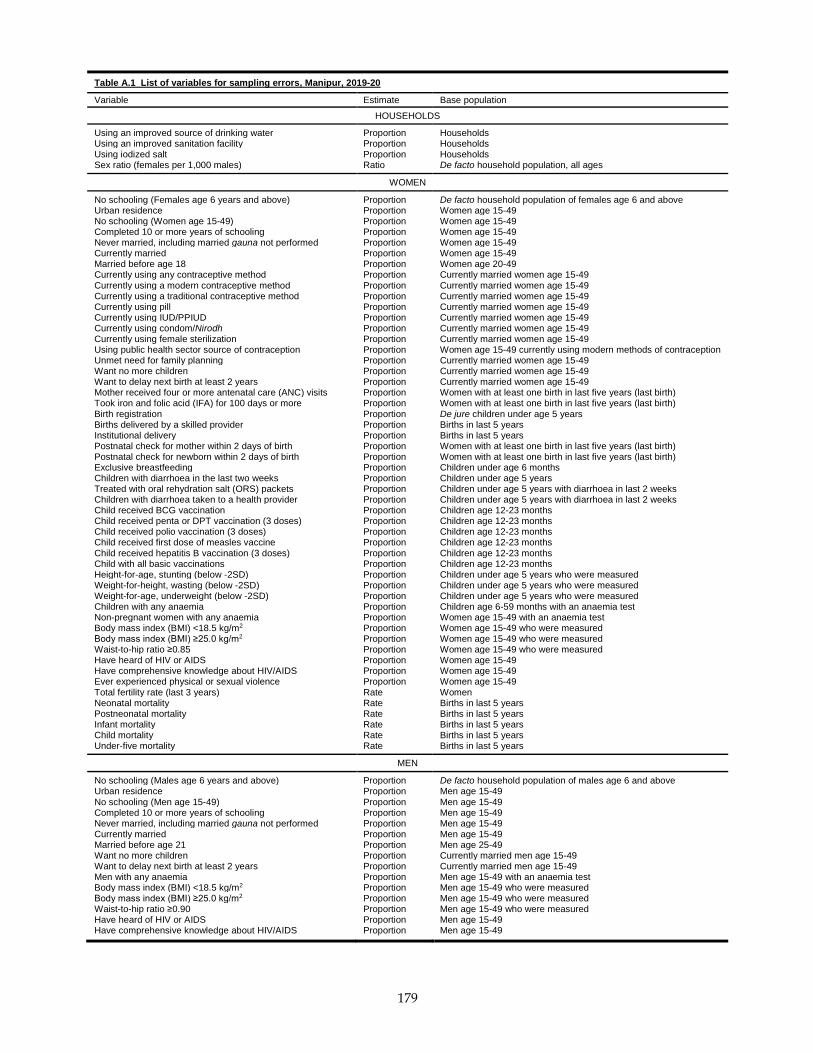
179
Table A.1 List of variables for sampling errors, Manipur, 2019-20
Variable Estimate Base population
HOUSEHOLDS
Using an improved source of drinking water Proportion Households Using an improved sanitation facility Proportion Households Using iodized salt Proportion Households Sex ratio (females per 1,000 males) Ratio De facto household population, all ages
WOMEN
No schooling (Females age 6 years and above) Proportion De facto household population of females age 6 and above Urban residence Proportion Women age 15-49 No schooling (Women age 15-49) Proportion Women age 15-49 Completed 10 or more years of schooling Proportion Women age 15-49 Never married, including married gauna not performed Proportion Women age 15-49 Currently married Proportion Women age 15-49 Married before age 18 Proportion Women age 20-49 Currently using any contraceptive method Proportion Currently married women age 15-49 Currently using a modern contraceptive method Proportion Currently married women age 15-49 Currently using a traditional contraceptive method Proportion Currently married women age 15-49 Currently using pill Proportion Currently married women age 15-49 Currently using IUD/PPIUD Proportion Currently married women age 15-49 Currently using condom/Nirodh Proportion Currently married women age 15-49 Currently using female sterilization Proportion Currently married women age 15-49 Using public health sector source of contraception Proportion Women age 15-49 currently using modern methods of contraception Unmet need for family planning Proportion Currently married women age 15-49 Want no more children Proportion Currently married women age 15-49 Want to delay next birth at least 2 years Proportion Currently married women age 15-49 Mother received four or more antenatal care (ANC) visits Proportion Women with at least one birth in last five years (last birth) Took iron and folic acid (IFA) for 100 days or more Proportion Women with at least one birth in last five years (last birth) Birth registration Proportion De jure children under age 5 years Births delivered by a skilled provider Proportion Births in last 5 years Institutional delivery Proportion Births in last 5 years Postnatal check for mother within 2 days of birth Proportion Women with at least one birth in last five years (last birth) Postnatal check for newborn within 2 days of birth Proportion Women with at least one birth in last five years (last birth) Exclusive breastfeeding Proportion Children under age 6 months Children with diarrhoea in the last two weeks Proportion Children under age 5 years Treated with oral rehydration salt (ORS) packets Proportion Children under age 5 years with diarrhoea in last 2 weeks Children with diarrhoea taken to a health provider Proportion Children under age 5 years with diarrhoea in last 2 weeks Child received BCG vaccination Proportion Children age 12-23 months Child received penta or DPT vaccination (3 doses) Proportion Children age 12-23 months Child received polio vaccination (3 doses) Proportion Children age 12-23 months Child received first dose of measles vaccine Proportion Children age 12-23 months Child received hepatitis B vaccination (3 doses) Proportion Children age 12-23 months Child with all basic vaccinations Proportion Children age 12-23 months Height-for-age, stunting (below -2SD) Proportion Children under age 5 years who were measured Weight-for-height, wasting (below -2SD) Proportion Children under age 5 years who were measured Weight-for-age, underweight (below -2SD) Proportion Children under age 5 years who were measured Children with any anaemia Proportion Children age 6-59 months with an anaemia test Non-pregnant women with any anaemia Proportion Women age 15-49 with an anaemia test Body mass index (BMI) <18.5 kg/m2 Proportion Women age 15-49 who were measured Body mass index (BMI) ≥25.0 kg/m2 Proportion Women age 15-49 who were measured Waist-to-hip ratio ≥0.85 Proportion Women age 15-49 who were measured Have heard of HIV or AIDS Proportion Women age 15-49 Have comprehensive knowledge about HIV/AIDS Proportion Women age 15-49 Ever experienced physical or sexual violence Proportion Women age 15-49 Total fertility rate (last 3 years) Rate Women Neonatal mortality Rate Births in last 5 years Postneonatal mortality Rate Births in last 5 years Infant mortality Rate Births in last 5 years Child mortality Rate Births in last 5 years Under-five mortality Rate Births in last 5 years
MEN
No schooling (Males age 6 years and above) Proportion De facto household population of males age 6 and above Urban residence Proportion Men age 15-49
No schooling (Men age 15-49) Proportion Men age 15-49 Completed 10 or more years of schooling Proportion Men age 15-49 Never married, including married gauna not performed Proportion Men age 15-49 Currently married Proportion Men age 15-49 Married before age 21 Proportion Men age 25-49 Want no more children Proportion Currently married men age 15-49 Want to delay next birth at least 2 years Proportion Currently married men age 15-49 Men with any anaemia Proportion Men age 15-49 with an anaemia test Body mass index (BMI) <18.5 kg/m2 Proportion Men age 15-49 who were measured Body mass index (BMI) ≥25.0 kg/m2 Proportion Men age 15-49 who were measured Waist-to-hip ratio ≥0.90 Proportion Men age 15-49 who were measured Have heard of HIV or AIDS Proportion Men age 15-49 Have comprehensive knowledge about HIV/AIDS Proportion Men age 15-49
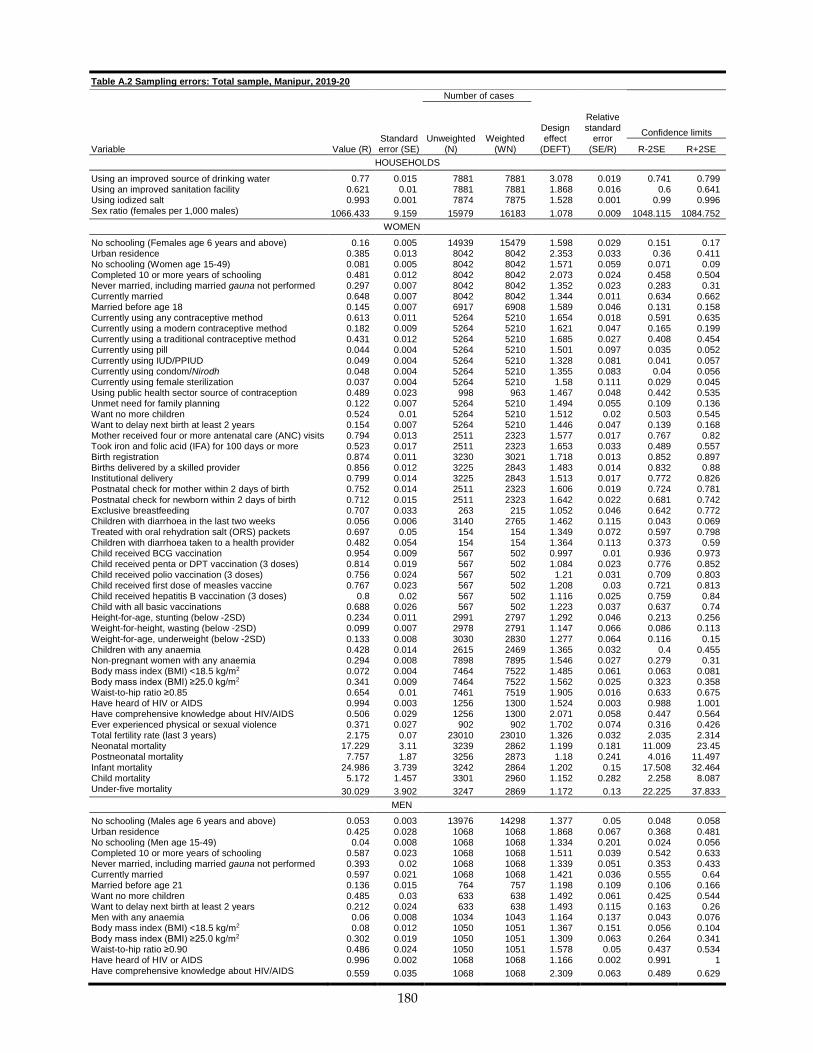
180
Table A.2 Sampling errors: Total sample, Manipur, 2019-20
Variable Value (R) Standard error (SE)
Number of cases
Design effect
(DEFT)
Relative standard
error (SE/R)
Confidence limits Unweighted
(N) Weighted
(WN) R-2SE R+2SE
HOUSEHOLDS
Using an improved source of drinking water 0.77 0.015 7881 7881 3.078 0.019 0.741 0.799 Using an improved sanitation facility 0.621 0.01 7881 7881 1.868 0.016 0.6 0.641 Using iodized salt 0.993 0.001 7874 7875 1.528 0.001 0.99 0.996 Sex ratio (females per 1,000 males) 1066.433 9.159 15979 16183 1.078 0.009 1048.115 1084.752
WOMEN
No schooling (Females age 6 years and above) 0.16 0.005 14939 15479 1.598 0.029 0.151 0.17 Urban residence 0.385 0.013 8042 8042 2.353 0.033 0.36 0.411 No schooling (Women age 15-49) 0.081 0.005 8042 8042 1.571 0.059 0.071 0.09 Completed 10 or more years of schooling 0.481 0.012 8042 8042 2.073 0.024 0.458 0.504 Never married, including married gauna not performed 0.297 0.007 8042 8042 1.352 0.023 0.283 0.31 Currently married 0.648 0.007 8042 8042 1.344 0.011 0.634 0.662 Married before age 18 0.145 0.007 6917 6908 1.589 0.046 0.131 0.158 Currently using any contraceptive method 0.613 0.011 5264 5210 1.654 0.018 0.591 0.635 Currently using a modern contraceptive method 0.182 0.009 5264 5210 1.621 0.047 0.165 0.199 Currently using a traditional contraceptive method 0.431 0.012 5264 5210 1.685 0.027 0.408 0.454 Currently using pill 0.044 0.004 5264 5210 1.501 0.097 0.035 0.052 Currently using IUD/PPIUD 0.049 0.004 5264 5210 1.328 0.081 0.041 0.057 Currently using condom/Nirodh 0.048 0.004 5264 5210 1.355 0.083 0.04 0.056 Currently using female sterilization 0.037 0.004 5264 5210 1.58 0.111 0.029 0.045 Using public health sector source of contraception 0.489 0.023 998 963 1.467 0.048 0.442 0.535 Unmet need for family planning 0.122 0.007 5264 5210 1.494 0.055 0.109 0.136 Want no more children 0.524 0.01 5264 5210 1.512 0.02 0.503 0.545 Want to delay next birth at least 2 years 0.154 0.007 5264 5210 1.446 0.047 0.139 0.168 Mother received four or more antenatal care (ANC) visits 0.794 0.013 2511 2323 1.577 0.017 0.767 0.82 Took iron and folic acid (IFA) for 100 days or more 0.523 0.017 2511 2323 1.653 0.033 0.489 0.557 Birth registration 0.874 0.011 3230 3021 1.718 0.013 0.852 0.897 Births delivered by a skilled provider 0.856 0.012 3225 2843 1.483 0.014 0.832 0.88 Institutional delivery 0.799 0.014 3225 2843 1.513 0.017 0.772 0.826 Postnatal check for mother within 2 days of birth 0.752 0.014 2511 2323 1.606 0.019 0.724 0.781 Postnatal check for newborn within 2 days of birth 0.712 0.015 2511 2323 1.642 0.022 0.681 0.742 Exclusive breastfeeding 0.707 0.033 263 215 1.052 0.046 0.642 0.772 Children with diarrhoea in the last two weeks 0.056 0.006 3140 2765 1.462 0.115 0.043 0.069 Treated with oral rehydration salt (ORS) packets 0.697 0.05 154 154 1.349 0.072 0.597 0.798 Children with diarrhoea taken to a health provider 0.482 0.054 154 154 1.364 0.113 0.373 0.59 Child received BCG vaccination 0.954 0.009 567 502 0.997 0.01 0.936 0.973 Child received penta or DPT vaccination (3 doses) 0.814 0.019 567 502 1.084 0.023 0.776 0.852 Child received polio vaccination (3 doses) 0.756 0.024 567 502 1.21 0.031 0.709 0.803 Child received first dose of measles vaccine 0.767 0.023 567 502 1.208 0.03 0.721 0.813 Child received hepatitis B vaccination (3 doses) 0.8 0.02 567 502 1.116 0.025 0.759 0.84 Child with all basic vaccinations 0.688 0.026 567 502 1.223 0.037 0.637 0.74 Height-for-age, stunting (below -2SD) 0.234 0.011 2991 2797 1.292 0.046 0.213 0.256 Weight-for-height, wasting (below -2SD) 0.099 0.007 2978 2791 1.147 0.066 0.086 0.113 Weight-for-age, underweight (below -2SD) 0.133 0.008 3030 2830 1.277 0.064 0.116 0.15 Children with any anaemia 0.428 0.014 2615 2469 1.365 0.032 0.4 0.455 Non-pregnant women with any anaemia 0.294 0.008 7898 7895 1.546 0.027 0.279 0.31 Body mass index (BMI) <18.5 kg/m2 0.072 0.004 7464 7522 1.485 0.061 0.063 0.081 Body mass index (BMI) ≥25.0 kg/m2 0.341 0.009 7464 7522 1.562 0.025 0.323 0.358 Waist-to-hip ratio ≥0.85 0.654 0.01 7461 7519 1.905 0.016 0.633 0.675 Have heard of HIV or AIDS 0.994 0.003 1256 1300 1.524 0.003 0.988 1.001 Have comprehensive knowledge about HIV/AIDS 0.506 0.029 1256 1300 2.071 0.058 0.447 0.564 Ever experienced physical or sexual violence 0.371 0.027 902 902 1.702 0.074 0.316 0.426 Total fertility rate (last 3 years) 2.175 0.07 23010 23010 1.326 0.032 2.035 2.314 Neonatal mortality 17.229 3.11 3239 2862 1.199 0.181 11.009 23.45 Postneonatal mortality 7.757 1.87 3256 2873 1.18 0.241 4.016 11.497 Infant mortality 24.986 3.739 3242 2864 1.202 0.15 17.508 32.464 Child mortality 5.172 1.457 3301 2960 1.152 0.282 2.258 8.087 Under-five mortality 30.029 3.902 3247 2869 1.172 0.13 22.225 37.833
MEN
No schooling (Males age 6 years and above) 0.053 0.003 13976 14298 1.377 0.05 0.048 0.058 Urban residence 0.425 0.028 1068 1068 1.868 0.067 0.368 0.481 No schooling (Men age 15-49) 0.04 0.008 1068 1068 1.334 0.201 0.024 0.056 Completed 10 or more years of schooling 0.587 0.023 1068 1068 1.511 0.039 0.542 0.633 Never married, including married gauna not performed 0.393 0.02 1068 1068 1.339 0.051 0.353 0.433 Currently married 0.597 0.021 1068 1068 1.421 0.036 0.555 0.64 Married before age 21 0.136 0.015 764 757 1.198 0.109 0.106 0.166 Want no more children 0.485 0.03 633 638 1.492 0.061 0.425 0.544 Want to delay next birth at least 2 years 0.212 0.024 633 638 1.493 0.115 0.163 0.26 Men with any anaemia 0.06 0.008 1034 1043 1.164 0.137 0.043 0.076 Body mass index (BMI) <18.5 kg/m2 0.08 0.012 1050 1051 1.367 0.151 0.056 0.104 Body mass index (BMI) ≥25.0 kg/m2 0.302 0.019 1050 1051 1.309 0.063 0.264 0.341 Waist-to-hip ratio ≥0.90 0.486 0.024 1050 1051 1.578 0.05 0.437 0.534 Have heard of HIV or AIDS 0.996 0.002 1068 1068 1.166 0.002 0.991 1 Have comprehensive knowledge about HIV/AIDS 0.559 0.035 1068 1068 2.309 0.063 0.489 0.629
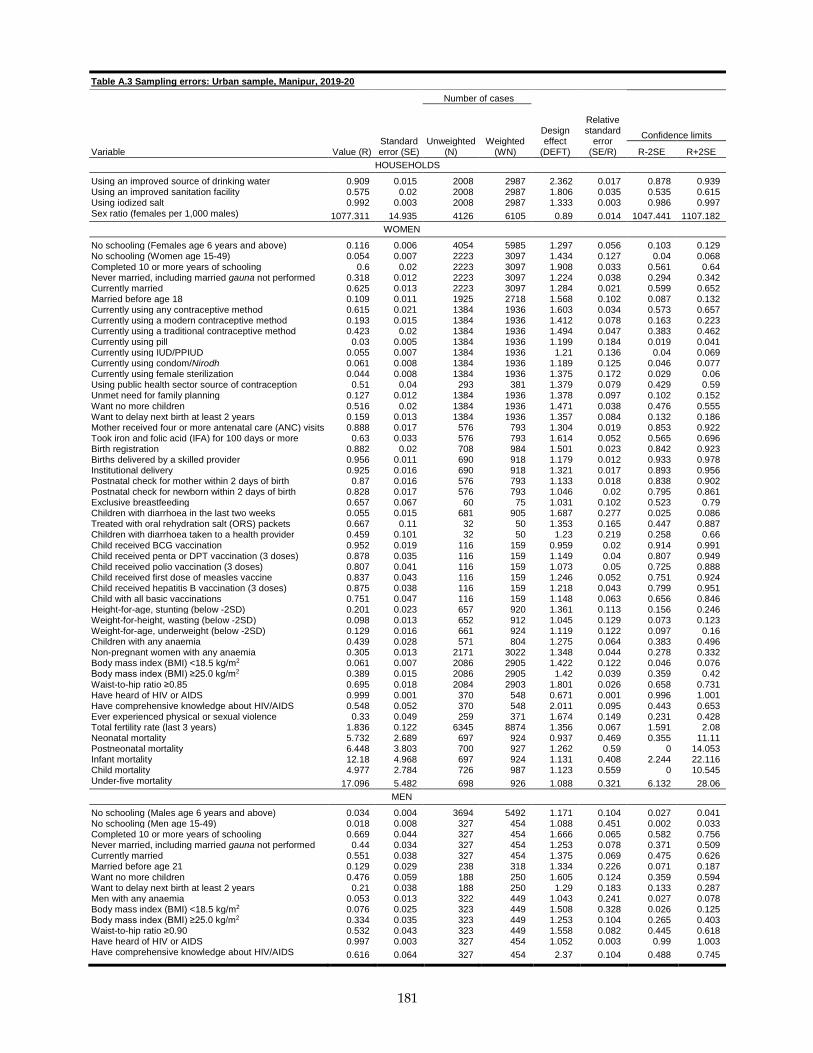
181
Table A.3 Sampling errors: Urban sample, Manipur, 2019-20
Variable Value (R) Standard error (SE)
Number of cases
Design effect
(DEFT)
Relative standard
error (SE/R)
Confidence limits Unweighted
(N) Weighted
(WN) R-2SE R+2SE
HOUSEHOLDS
Using an improved source of drinking water 0.909 0.015 2008 2987 2.362 0.017 0.878 0.939 Using an improved sanitation facility 0.575 0.02 2008 2987 1.806 0.035 0.535 0.615 Using iodized salt 0.992 0.003 2008 2987 1.333 0.003 0.986 0.997 Sex ratio (females per 1,000 males) 1077.311 14.935 4126 6105 0.89 0.014 1047.441 1107.182
WOMEN
No schooling (Females age 6 years and above) 0.116 0.006 4054 5985 1.297 0.056 0.103 0.129 No schooling (Women age 15-49) 0.054 0.007 2223 3097 1.434 0.127 0.04 0.068 Completed 10 or more years of schooling 0.6 0.02 2223 3097 1.908 0.033 0.561 0.64 Never married, including married gauna not performed 0.318 0.012 2223 3097 1.224 0.038 0.294 0.342 Currently married 0.625 0.013 2223 3097 1.284 0.021 0.599 0.652 Married before age 18 0.109 0.011 1925 2718 1.568 0.102 0.087 0.132 Currently using any contraceptive method 0.615 0.021 1384 1936 1.603 0.034 0.573 0.657 Currently using a modern contraceptive method 0.193 0.015 1384 1936 1.412 0.078 0.163 0.223 Currently using a traditional contraceptive method 0.423 0.02 1384 1936 1.494 0.047 0.383 0.462 Currently using pill 0.03 0.005 1384 1936 1.199 0.184 0.019 0.041 Currently using IUD/PPIUD 0.055 0.007 1384 1936 1.21 0.136 0.04 0.069 Currently using condom/Nirodh 0.061 0.008 1384 1936 1.189 0.125 0.046 0.077 Currently using female sterilization 0.044 0.008 1384 1936 1.375 0.172 0.029 0.06 Using public health sector source of contraception 0.51 0.04 293 381 1.379 0.079 0.429 0.59 Unmet need for family planning 0.127 0.012 1384 1936 1.378 0.097 0.102 0.152 Want no more children 0.516 0.02 1384 1936 1.471 0.038 0.476 0.555 Want to delay next birth at least 2 years 0.159 0.013 1384 1936 1.357 0.084 0.132 0.186 Mother received four or more antenatal care (ANC) visits 0.888 0.017 576 793 1.304 0.019 0.853 0.922 Took iron and folic acid (IFA) for 100 days or more 0.63 0.033 576 793 1.614 0.052 0.565 0.696 Birth registration 0.882 0.02 708 984 1.501 0.023 0.842 0.923 Births delivered by a skilled provider 0.956 0.011 690 918 1.179 0.012 0.933 0.978 Institutional delivery 0.925 0.016 690 918 1.321 0.017 0.893 0.956 Postnatal check for mother within 2 days of birth 0.87 0.016 576 793 1.133 0.018 0.838 0.902 Postnatal check for newborn within 2 days of birth 0.828 0.017 576 793 1.046 0.02 0.795 0.861 Exclusive breastfeeding 0.657 0.067 60 75 1.031 0.102 0.523 0.79 Children with diarrhoea in the last two weeks 0.055 0.015 681 905 1.687 0.277 0.025 0.086 Treated with oral rehydration salt (ORS) packets 0.667 0.11 32 50 1.353 0.165 0.447 0.887 Children with diarrhoea taken to a health provider 0.459 0.101 32 50 1.23 0.219 0.258 0.66 Child received BCG vaccination 0.952 0.019 116 159 0.959 0.02 0.914 0.991 Child received penta or DPT vaccination (3 doses) 0.878 0.035 116 159 1.149 0.04 0.807 0.949 Child received polio vaccination (3 doses) 0.807 0.041 116 159 1.073 0.05 0.725 0.888 Child received first dose of measles vaccine 0.837 0.043 116 159 1.246 0.052 0.751 0.924 Child received hepatitis B vaccination (3 doses) 0.875 0.038 116 159 1.218 0.043 0.799 0.951 Child with all basic vaccinations 0.751 0.047 116 159 1.148 0.063 0.656 0.846 Height-for-age, stunting (below -2SD) 0.201 0.023 657 920 1.361 0.113 0.156 0.246 Weight-for-height, wasting (below -2SD) 0.098 0.013 652 912 1.045 0.129 0.073 0.123 Weight-for-age, underweight (below -2SD) 0.129 0.016 661 924 1.119 0.122 0.097 0.16 Children with any anaemia 0.439 0.028 571 804 1.275 0.064 0.383 0.496 Non-pregnant women with any anaemia 0.305 0.013 2171 3022 1.348 0.044 0.278 0.332 Body mass index (BMI) <18.5 kg/m2 0.061 0.007 2086 2905 1.422 0.122 0.046 0.076 Body mass index (BMI) ≥25.0 kg/m2 0.389 0.015 2086 2905 1.42 0.039 0.359 0.42 Waist-to-hip ratio ≥0.85 0.695 0.018 2084 2903 1.801 0.026 0.658 0.731 Have heard of HIV or AIDS 0.999 0.001 370 548 0.671 0.001 0.996 1.001 Have comprehensive knowledge about HIV/AIDS 0.548 0.052 370 548 2.011 0.095 0.443 0.653 Ever experienced physical or sexual violence 0.33 0.049 259 371 1.674 0.149 0.231 0.428 Total fertility rate (last 3 years) 1.836 0.122 6345 8874 1.356 0.067 1.591 2.08 Neonatal mortality 5.732 2.689 697 924 0.937 0.469 0.355 11.11 Postneonatal mortality 6.448 3.803 700 927 1.262 0.59 0 14.053 Infant mortality 12.18 4.968 697 924 1.131 0.408 2.244 22.116 Child mortality 4.977 2.784 726 987 1.123 0.559 0 10.545 Under-five mortality 17.096 5.482 698 926 1.088 0.321 6.132 28.06
MEN
No schooling (Males age 6 years and above) 0.034 0.004 3694 5492 1.171 0.104 0.027 0.041 No schooling (Men age 15-49) 0.018 0.008 327 454 1.088 0.451 0.002 0.033 Completed 10 or more years of schooling 0.669 0.044 327 454 1.666 0.065 0.582 0.756 Never married, including married gauna not performed 0.44 0.034 327 454 1.253 0.078 0.371 0.509 Currently married 0.551 0.038 327 454 1.375 0.069 0.475 0.626 Married before age 21 0.129 0.029 238 318 1.334 0.226 0.071 0.187 Want no more children 0.476 0.059 188 250 1.605 0.124 0.359 0.594 Want to delay next birth at least 2 years 0.21 0.038 188 250 1.29 0.183 0.133 0.287 Men with any anaemia 0.053 0.013 322 449 1.043 0.241 0.027 0.078 Body mass index (BMI) <18.5 kg/m2 0.076 0.025 323 449 1.508 0.328 0.026 0.125 Body mass index (BMI) ≥25.0 kg/m2 0.334 0.035 323 449 1.253 0.104 0.265 0.403 Waist-to-hip ratio ≥0.90 0.532 0.043 323 449 1.558 0.082 0.445 0.618 Have heard of HIV or AIDS 0.997 0.003 327 454 1.052 0.003 0.99 1.003 Have comprehensive knowledge about HIV/AIDS 0.616 0.064 327 454 2.37 0.104 0.488 0.745
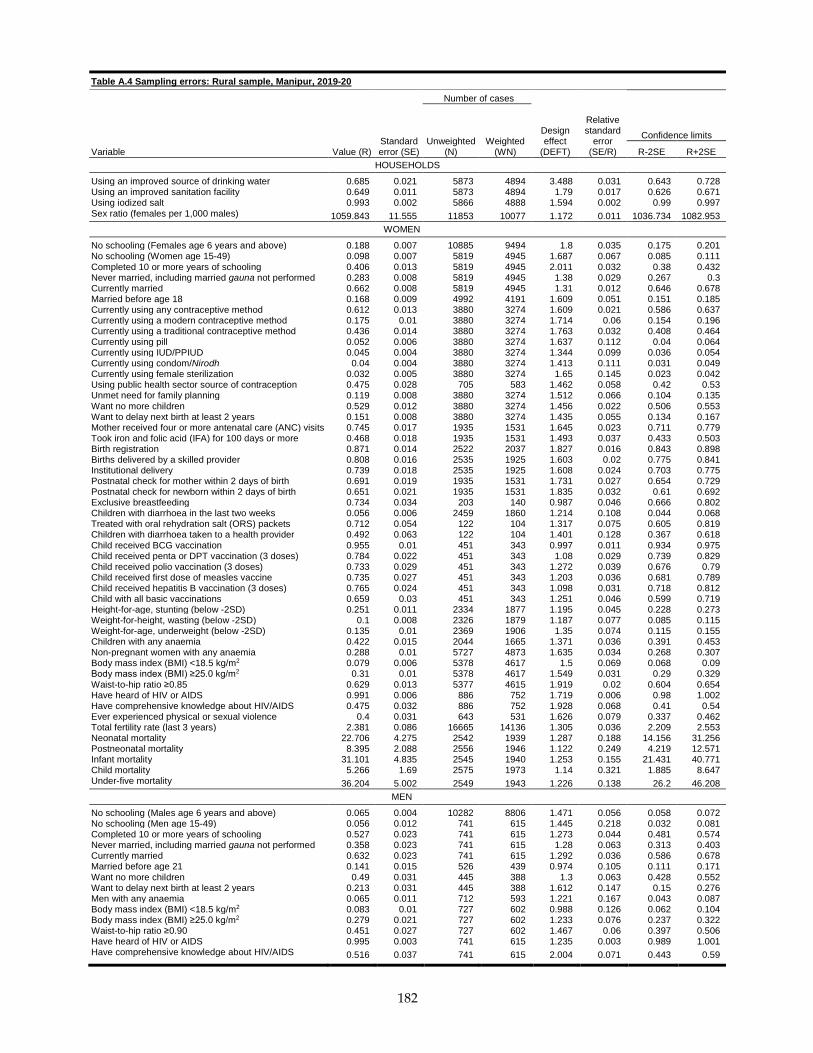
182
Table A.4 Sampling errors: Rural sample, Manipur, 2019-20
Variable Value (R) Standard error (SE)
Number of cases
Design effect
(DEFT)
Relative standard
error (SE/R)
Confidence limits Unweighted
(N) Weighted
(WN) R-2SE R+2SE
HOUSEHOLDS
Using an improved source of drinking water 0.685 0.021 5873 4894 3.488 0.031 0.643 0.728 Using an improved sanitation facility 0.649 0.011 5873 4894 1.79 0.017 0.626 0.671 Using iodized salt 0.993 0.002 5866 4888 1.594 0.002 0.99 0.997 Sex ratio (females per 1,000 males) 1059.843 11.555 11853 10077 1.172 0.011 1036.734 1082.953
WOMEN
No schooling (Females age 6 years and above) 0.188 0.007 10885 9494 1.8 0.035 0.175 0.201 No schooling (Women age 15-49) 0.098 0.007 5819 4945 1.687 0.067 0.085 0.111 Completed 10 or more years of schooling 0.406 0.013 5819 4945 2.011 0.032 0.38 0.432 Never married, including married gauna not performed 0.283 0.008 5819 4945 1.38 0.029 0.267 0.3 Currently married 0.662 0.008 5819 4945 1.31 0.012 0.646 0.678 Married before age 18 0.168 0.009 4992 4191 1.609 0.051 0.151 0.185 Currently using any contraceptive method 0.612 0.013 3880 3274 1.609 0.021 0.586 0.637 Currently using a modern contraceptive method 0.175 0.01 3880 3274 1.714 0.06 0.154 0.196 Currently using a traditional contraceptive method 0.436 0.014 3880 3274 1.763 0.032 0.408 0.464 Currently using pill 0.052 0.006 3880 3274 1.637 0.112 0.04 0.064 Currently using IUD/PPIUD 0.045 0.004 3880 3274 1.344 0.099 0.036 0.054 Currently using condom/Nirodh 0.04 0.004 3880 3274 1.413 0.111 0.031 0.049 Currently using female sterilization 0.032 0.005 3880 3274 1.65 0.145 0.023 0.042 Using public health sector source of contraception 0.475 0.028 705 583 1.462 0.058 0.42 0.53 Unmet need for family planning 0.119 0.008 3880 3274 1.512 0.066 0.104 0.135 Want no more children 0.529 0.012 3880 3274 1.456 0.022 0.506 0.553 Want to delay next birth at least 2 years 0.151 0.008 3880 3274 1.435 0.055 0.134 0.167 Mother received four or more antenatal care (ANC) visits 0.745 0.017 1935 1531 1.645 0.023 0.711 0.779 Took iron and folic acid (IFA) for 100 days or more 0.468 0.018 1935 1531 1.493 0.037 0.433 0.503 Birth registration 0.871 0.014 2522 2037 1.827 0.016 0.843 0.898 Births delivered by a skilled provider 0.808 0.016 2535 1925 1.603 0.02 0.775 0.841 Institutional delivery 0.739 0.018 2535 1925 1.608 0.024 0.703 0.775 Postnatal check for mother within 2 days of birth 0.691 0.019 1935 1531 1.731 0.027 0.654 0.729 Postnatal check for newborn within 2 days of birth 0.651 0.021 1935 1531 1.835 0.032 0.61 0.692 Exclusive breastfeeding 0.734 0.034 203 140 0.987 0.046 0.666 0.802 Children with diarrhoea in the last two weeks 0.056 0.006 2459 1860 1.214 0.108 0.044 0.068 Treated with oral rehydration salt (ORS) packets 0.712 0.054 122 104 1.317 0.075 0.605 0.819 Children with diarrhoea taken to a health provider 0.492 0.063 122 104 1.401 0.128 0.367 0.618 Child received BCG vaccination 0.955 0.01 451 343 0.997 0.011 0.934 0.975 Child received penta or DPT vaccination (3 doses) 0.784 0.022 451 343 1.08 0.029 0.739 0.829 Child received polio vaccination (3 doses) 0.733 0.029 451 343 1.272 0.039 0.676 0.79 Child received first dose of measles vaccine 0.735 0.027 451 343 1.203 0.036 0.681 0.789 Child received hepatitis B vaccination (3 doses) 0.765 0.024 451 343 1.098 0.031 0.718 0.812 Child with all basic vaccinations 0.659 0.03 451 343 1.251 0.046 0.599 0.719 Height-for-age, stunting (below -2SD) 0.251 0.011 2334 1877 1.195 0.045 0.228 0.273 Weight-for-height, wasting (below -2SD) 0.1 0.008 2326 1879 1.187 0.077 0.085 0.115 Weight-for-age, underweight (below -2SD) 0.135 0.01 2369 1906 1.35 0.074 0.115 0.155 Children with any anaemia 0.422 0.015 2044 1665 1.371 0.036 0.391 0.453 Non-pregnant women with any anaemia 0.288 0.01 5727 4873 1.635 0.034 0.268 0.307 Body mass index (BMI) <18.5 kg/m2 0.079 0.006 5378 4617 1.5 0.069 0.068 0.09 Body mass index (BMI) ≥25.0 kg/m2 0.31 0.01 5378 4617 1.549 0.031 0.29 0.329 Waist-to-hip ratio ≥0.85 0.629 0.013 5377 4615 1.919 0.02 0.604 0.654 Have heard of HIV or AIDS 0.991 0.006 886 752 1.719 0.006 0.98 1.002 Have comprehensive knowledge about HIV/AIDS 0.475 0.032 886 752 1.928 0.068 0.41 0.54 Ever experienced physical or sexual violence 0.4 0.031 643 531 1.626 0.079 0.337 0.462 Total fertility rate (last 3 years) 2.381 0.086 16665 14136 1.305 0.036 2.209 2.553 Neonatal mortality 22.706 4.275 2542 1939 1.287 0.188 14.156 31.256 Postneonatal mortality 8.395 2.088 2556 1946 1.122 0.249 4.219 12.571 Infant mortality 31.101 4.835 2545 1940 1.253 0.155 21.431 40.771 Child mortality 5.266 1.69 2575 1973 1.14 0.321 1.885 8.647 Under-five mortality 36.204 5.002 2549 1943 1.226 0.138 26.2 46.208
MEN
No schooling (Males age 6 years and above) 0.065 0.004 10282 8806 1.471 0.056 0.058 0.072 No schooling (Men age 15-49) 0.056 0.012 741 615 1.445 0.218 0.032 0.081 Completed 10 or more years of schooling 0.527 0.023 741 615 1.273 0.044 0.481 0.574 Never married, including married gauna not performed 0.358 0.023 741 615 1.28 0.063 0.313 0.403 Currently married 0.632 0.023 741 615 1.292 0.036 0.586 0.678 Married before age 21 0.141 0.015 526 439 0.974 0.105 0.111 0.171 Want no more children 0.49 0.031 445 388 1.3 0.063 0.428 0.552 Want to delay next birth at least 2 years 0.213 0.031 445 388 1.612 0.147 0.15 0.276 Men with any anaemia 0.065 0.011 712 593 1.221 0.167 0.043 0.087 Body mass index (BMI) <18.5 kg/m2 0.083 0.01 727 602 0.988 0.126 0.062 0.104 Body mass index (BMI) ≥25.0 kg/m2 0.279 0.021 727 602 1.233 0.076 0.237 0.322 Waist-to-hip ratio ≥0.90 0.451 0.027 727 602 1.467 0.06 0.397 0.506 Have heard of HIV or AIDS 0.995 0.003 741 615 1.235 0.003 0.989 1.001 Have comprehensive knowledge about HIV/AIDS 0.516 0.037 741 615 2.004 0.071 0.443 0.59