Names-based classification of accident and emergency department users
24
1 This is an accepted pre-publication manuscript. For the final version please check the published article and cite as: Petersen, J, Gibin, M, Mateos, P, Atkinson, P, Longley, P (2011) Names-based classification of accident and emergency department users, Health and Place, in press Names-based classification of accident and emergency department users Jakob Petersen ab , Maurizio Gibin ab , Pablo Mateos a , Philip Atkinson ab , Paul Longley a* a Department of Geography and Centre for Advanced Spatial Analysis, University College London, Gower Street, WC1E 6BT, b Southwark Primary Care Trust, Public Health, Neckinger, London SE16 3QN *Corresponding author: Paul Longley, Department of Geography and Centre for Advanced Spatial Analysis, University College London, Gower Street, WC1E 6BT, Email: [email protected] This paper studies differential healthcare utilisation by ethnic group. Nearly 100,000 users of an Inner London accident and emergency (A&E) facility were analysed using an innovative names-based ethnicity classification. Adult repeated ‘light’ usage (i.e. with no hospitalisation or follow-up) did not differ according to ethnic group. Users from ethnic minorities had lower GP registration rates than the majority reference group. However, lack of GP registration was not associated with repeated light use of A&E, over- all. Therefore, these results challenge common perceptions of differential A&E access rates by ethnicity. Keywords: Ethnicity, names, accident and emergency, healthcare services, London Introduction National Health Service (NHS) accident and emergency departments (A&E) offer free access to healthcare and are open 24 hours a day. Southwark Primary Care Trust calculates that the average visit to an A&E facility costs the NHS three times as much as a visit to a General Practioner (GP). This financial expedient provides a strong incentive for analysis of the cost-effectiveness of care provision if this leads to reductions in the numbers of A&E visits that can be deemed as inappropriate, non-urgent, convenience-
Transcript of Names-based classification of accident and emergency department users
1
This is an accepted pre-publication manuscript. For the final version please check the published article and cite as: Petersen, J, Gibin, M, Mateos, P, Atkinson, P, Longley, P (2011) Names-based classification of accident and emergency department users, Health and Place, in press Names-based classification of accident and emergency department users Jakob Petersenab, Maurizio Gibinab, Pablo Mateosa, Philip Atkinsonab, Paul Longleya* aDepartment of Geography and Centre for Advanced Spatial Analysis, University College London, Gower Street, WC1E 6BT, bSouthwark Primary Care Trust, Public Health, Neckinger, London SE16 3QN *Corresponding author: Paul Longley, Department of Geography and Centre for Advanced Spatial Analysis, University College London, Gower Street, WC1E 6BT, Email: [email protected] This paper studies differential healthcare utilisation by ethnic group. Nearly 100,000 users of an Inner London accident and emergency (A&E) facility were analysed using an innovative names-based ethnicity classification. Adult repeated ‘light’ usage (i.e. with no hospitalisation or follow-up) did not differ according to ethnic group. Users from ethnic minorities had lower GP registration rates than the majority reference group. However, lack of GP registration was not associated with repeated light use of A&E, over-all. Therefore, these results challenge common perceptions of differential A&E access rates by ethnicity.
Keywords: Ethnicity, names, accident and emergency, healthcare services, London
Introduction National Health Service (NHS) accident and emergency departments (A&E) offer free
access to healthcare and are open 24 hours a day. Southwark Primary Care Trust
calculates that the average visit to an A&E facility costs the NHS three times as much as
a visit to a General Practioner (GP). This financial expedient provides a strong incentive
for analysis of the cost-effectiveness of care provision if this leads to reductions in the
numbers of A&E visits that can be deemed as inappropriate, non-urgent, convenience-

2
oriented, preventable or ‘light’ (Murphy, 1998a, Murphy, 1998b, Sempere-Selva et al.,
2001, Giesen et al., 2006, Leaman et al., 2006).
Segmentation of users according to ethnicity is predicated upon the notion that members
of some ethnic groups have utilisation patterns that differ from the general population
because of differences in cultural perceptions, language barriers or (particularly for recent
migrants) lack of familiarity with the UK National Health Service (NHS) procedures and
functions (Hargreaves et al., 2006). Analysis of differences in healthcare utilisation
patterns by ethnicity using routinely collected data is far from straightforward, however,
because of issues of data incompleteness and quality in spite of the sustained albeit
frustrating efforts to extend and improve its coverage (Aspinall, 2000; Kumarapeli et al,
2006; Raleigh, 2008; Sangowawa and Bhopal, 2000). The contribution of this research is
to classify individual health records according to patient cultural, linguistic and ethnic
group, using information derived from given and family names, in order to increase our
understanding of differential healthcare usage by ethnicity. We see this as a contribution
to the debate on ethnicity and the utilisation of healthcare (Mladovsky, 2009). In the
present study we have analysed GP registration rates and the characteristics of light
frequent users of King College Hospital’s A&E department in Inner London. These data
have been coded using Onomap, a names-based ethnicity coding tool developed by
University College London and applied in Camden and Southwark Primary Care Trusts
as well as other public and private organisations (Lakha et al., forthcoming, Mateos,
2007a, Mateos, 2007b). There is a vast literature on the health inequalities of migrant
populations; enabled by country of birth information, which is the most widely collected
3
information related to ethnicity. Yet, the literature on ethnic health inequalities is
relatively recent and scarcer, in the main, due to the fact that monitoring of such
inequalities is a recent phenomenon in Britain and almost non-existent in other countries
(Mateos, 2007a, Mateos, 2007b). A systematic review of name-based ethnicity
classifications found the sensitivity compared to self-reported ethnicity varied between
0.67 and 0.95, specificity between 0.80 and 1 (Mateos, 2007b). This paper attempts to
make a contribution to this scarce literature by proposing an application of a cost-
effective method to analyse data sets in which ethnicity information is not available.
Moreover, when information on country of birth is available, the name methodology can
complement the analyses by distinguishing first from subsequent generations. The role of
this type of quantitative research is to formulate hypotheses or ‘breaking the ground’ for
more specific and resource-intensive qualitative research.
Methods
Study area King’s College Hospital A&E Department is located in the London Borough of
Southwark on the south bank of the River Thames in Central London. Historically
Southwark was centrally located in relation to London’s port and associated industries.
Today, it is among the most deprived local authorities in England, ranking 18th out of
325 local authorities on the income deprivation measure and 25th on the employment
deprivation measure (Office for National Statistics, 2008). The majority of patients (66%)
live in areas ranked amongst the 20% most deprived areas in England. More than 40% of
patients live in publicly rented accommodation; typically social housing apartment blocks
built in the 1960s. Southwark has a high population turnover, as well as a diverse and
multicultural population. The Borough scores badly on a number of official health

4
indicators including high infant mortality, low birth weight, low male life expectancy at
birth, low disability-free life expectancy and high teenage conception rates (Petersen et
al., 2009). Therefore, the interrelations between these diverse population characteristics
and unequal health outcomes make Southwark a unique study area to investigate
differential A&E usage.
Data Records for each of the 141,613 A&E attendances (aka visits) at King’s College Hospital
A&E unit during a one-year period (1 April 2005-31 March 2006) were obtained from
King’s College Hospital NHS Foundation Trust. This facility principally serves the South
London Boroughs of Southwark and neighbouring Lambeth and the analyses were
restricted to residents living in these two Boroughs.
Most services in the National Health Service (NHS) record information on episodes of
care labelled with unique person identifiers (NHS numbers). NHS numbers are issued
when patients first register with a GP. However, NHS numbers are often missing from
A&E records, because users can ‘walk in’ from the street without an appointment, some
patients are unconscious or distressed on arrival, and some are not registered with a GP.
As a consequence, individuals were identified, for this study by using a combination of
date of birth, postcode, and sex in place of a unique identifier (Gill, 1997). This approach
was tested using the local GP patient register, where all users are identified using unique
NHS numbers. The combination of the three fields correctly identified unique individuals
in 99% of all cases. Using this technique we identified 107,735 users from the 163,333
A&E attendances collected over that particular year (average 1.5 attendances per user per
year).

5
Classification of outcome severity Many studies have been concerned with identifying A&E usage that is deemed
inappropriate, non-urgent, convenience-oriented, preventable or light (Murphy, 1998a,
Murphy, 1998b, Sempere-Selva et al., 2001, Giesen et al., 2006). In this research we
have focussed on A&E outcome categories, because in comparison with other available
data (diagnosis, triage, mode of transport) it is recorded at discharge rather than upon
arrival (cf. triage) and it was also recorded more comprehensively (86% of attendances)
than for any of the other characteristics. We reclassified the outcomes into four major
categories of severity by drawing on the expertise of A&E staff:
(1) Majors containing major operations and emergency admission to hospital (2) Follow-up containing cases where the attendee is referred to another speciality (3) Discharged without follow-up; for those treated and discharged within 4 hours. (4) Did-Not-Wait for those that did not wait to receive attention.
Examples of the Majors category are outcomes coded “Admit”, “Gynae
scanning”, “Theatre” or “Died”, indicating: hospitalisation, major complications,
redirection to an operating theatre or death, respectively. Follow-up included categories
such as “Eye clinic” or “Fracture clinic”. Discharged included for instance, “Discharged”
or more cryptic categories such as “Taxi”. Did-Not-Wait contained the code for this
outcome alone. Many of the codes in use required very specific, local knowledge such as
the name of particular hospital wing or clinic.
Each of the 107,735 users was subsequently identified by the outcome of their
first attendance within the study period resulting in a user classification with Majors
(16%), Follow-up (24%), Discharged (44%) or Did-Not-Wait (2%). Users where the
outcome data were missing (14%) were not analysed further, but resembled the
Discharged category in their demographic profile. The analysis was performed on the

6
93,096 users with outcome information. To focus on users that potentially could be
treated in other healthcare settings we have chosen to assign repeat users, i.e. those that
attended two or more times during the one year study period, to the Discharged and Did-
Not-Wait categories and termed these 13,764 ‘light frequent users’ for the purpose of this
study. ‘Light’ is thus intended as an umbrella term for attendances that did not lead to
hospitalisation or follow-up treatment. Non-registration with a GP was assumed where
the GP details were either missing or coded as unknown.
Statistical analysis Age- and sex-specific attendance rates were calculated as the number of attendances per
user. Multiple logistic regression analysis was used to control for a number of potentially
confounding factors (Long and Freese, 2006). The following independent categorical
variables were included: sex; ethnicity; and area deprivation derived from the 2004 Index
of Multiple Deprivation in quintiles (Department for Communities and Local
Government, 2004). Ethnicity was assigned based on the user’s forename and surname
combination using the Onomap names classification software (Lakha et al., forthcoming,
Mateos, 2007a). In a small proportion of cases (4.6%) the Onomap software did not
assign the user to a known ethnic group and the user was subsequently assigned to an
‘Other’ category. The age profile varied significantly across different ethnic groups
(likelihood-ratio test of interaction, χ2=41.33, df=24, P=0.015) and the subsequent
analyses were hence stratified by the following age groups: 0-15, 16-29, 30-44, 45+ years
of age. Covariates were analysed for deviation from null using a Wald-test. The logit
proportions of users not registered with a GP relative to all GP-registered users were
likewise analysed with sex, deprivation and ethnicity as covariates in age stratified
7
analyses. All logistic regression models were furnished with Hosmer-Lemeshow
goodness-of-fit statistics (in deciles) as to whether predicted values were significantly
different from observed values (Long and Freese, 2006).
Results Attendances per user were highest amongst the under-1 and 1-4 year olds, but then tailed
off only to rise again after 40 years of age for men and age 50 for women (Figure 1).
(Figure 1 – about here)
Light frequent users The 13,764 light frequent users accounted for 38,002 attendances (28.8% of all
attendances). On average, a light frequent user attended A&E 2.8 times per year; nearly
twice the overall average of 1.5 attendances per user per year.
There were more light frequent users among men than women and this gender effect was
significant for the 30-44 and 45+ age groups (Table 1). There were more light frequent
users in the four most deprived areas; they were 22-31% more common among 0-15 year
olds, 18-23% for 30-44 year olds, and 19-32% for 45+ year olds. Ethnic group,
determined by ethnicity, was only significant as a covariate for the 0-15 year cohort,
where users with names classified as Eastern European (OR 1.58, 95% CI 1.27-1.98),
Hispanic (OR 1.17, 95% CI 1.03-1.35) and Muslim (OR 1.13, 95% CI 1.26) were more
likely to be repeat users relative to the reference population with English names.
(Table 1 and 2 – about here)

8
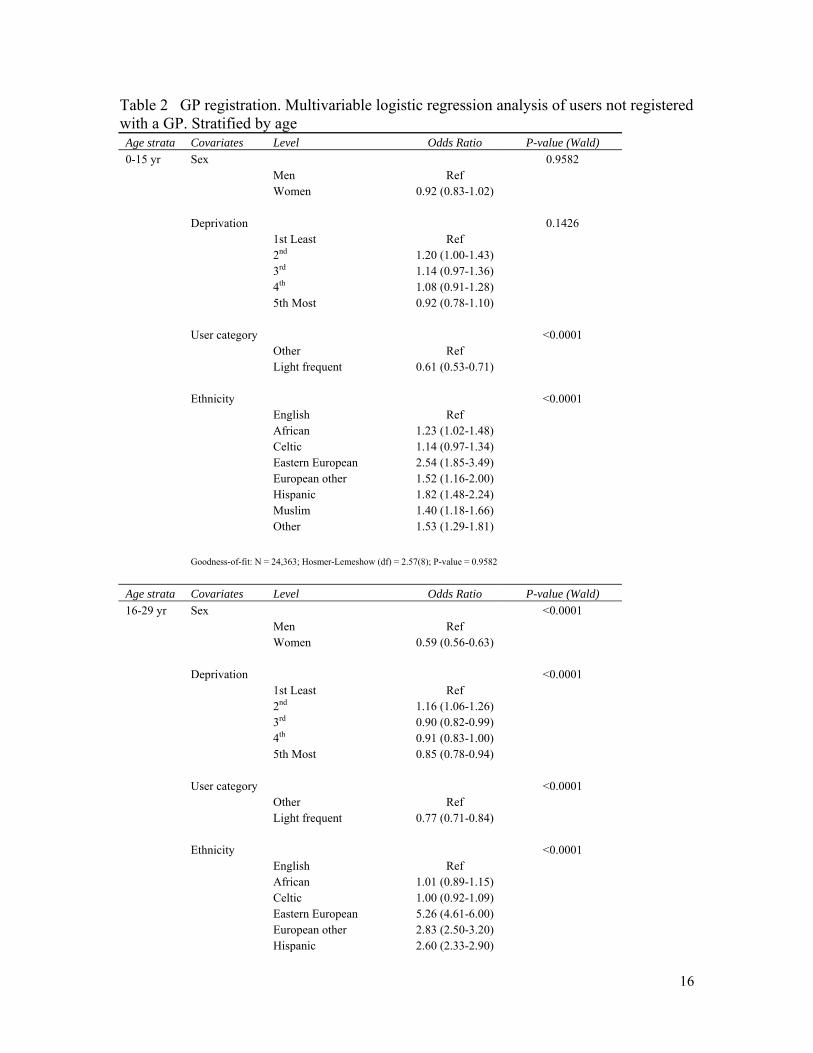
Non-registration with a GP There were 15,062 A&E users who were not classed as registered with a GP, amounting
to 16% of users. Non-registration by age group was 6% for 0-15 year olds, 30% for 16-29
year olds, 19% for 30-44 year olds and 9% for 45+ year olds. Children of many ethnic
minority groups had lower rates of GP-registration relative to those with English (the
reference population) or Celtic names (Table 2). Lower rates of registration also persisted
for ethnic minorities throughout the adult age groups, especially for the non-British
Europeans and other minority name origin groups. Adult men were 39-59% less likely
than women to be registered with a GP in their respective age groups. The effects of area
deprivation were relatively weak and did not follow a clear trend. Hypothetically, it
might be anticipated that users not registered with a GP would rely on A&E for non-
urgent care needs. However, we found that light frequent users were consistently 25-
39%, more likely to be registered relative to all other users.
A more detailed analysis revealed that non-registration with a GP was much more
common in users with names associated with EU-15 countries (the fifteen pre-2004 EU
Member States) as well as from Eastern Europe and China (see Table 3).
(Table 3 – about here)
Discussion A much repeated assertion within the healthcare profession is that many ethnic minority
groups are not yet accustomed to the healthcare system and therefore go to A&E with
minor ailments (Hargreaves et al., 2006). Name-based ethnicity coding has been
suggested as a way in which local healthcare authorities can identify such user groups

9
and design social marketing campaigns to divert them to more cost-effective alternatives
(Nanchahal et al., 2001, Leaman et al., 2006). The Inner London location of King’s
College Hospital A&E means that it serves a very fluid, diverse and multicultural
population. Relating these general area characteristics to patients presenting at A&E
facilities is complicated by the lack of population registers with usable information on
ethnic group and indicators of local, regional or national residential mobility. The
analysis described in this paper offers a way around this methodological problem.
Ethnic group information is routinely collected from users of NHS services, but in
the case of A&E, missing and inconsistent data often make this source inadequate for
analysis. Interestingly, A&E records are, at the same time, one of the few data sources
that are likely to correspond with the de facto population characteristics at any given
point in time. Name-based ethnicity classification of populations can in such cases
provide a timely insight into questions of population mobility, international migration,
utilisation and accessibility of public services, health inequality, and so forth (Mateos,
2007a, Mateos, 2007b). One of the problems with applying name-based ethnicity
classifications in these cases, however, is that crude numerical analysis may simply and
unjustly encourage the stigmatisation of entire ethnic groups. With this research we have
instead tried to focus on healthcare seeking behaviours, specifically of light frequent use
of A&E within a one year time period, and compared this to GP-registration rates within
the same population. We have used a novel names-based ethnicity classification to do this
(Mateos, 2007a, Mateos, 2007b). The Onomap methodology takes both forename and
surname into account when assigning an individual to the most likely group based on
culture, ethnicity and linguistic indicators. The classification provides a flexible and
10
readily updateable means of assigning ethnic minority groups, where self-reported
ethnicity is not available to the desired quality (Mateos, 2007b, Mateos, 2007a, Gibin et
al., 2009). Onomap has been evaluated against large population registers where the self-
reported ethnicity is available next to a person’s name, and preliminary results show an
overall specificity and sensitivity around 80-90% (Lakha et al., forthcoming).
Children under 1 year of age were up to 80% more likely to be light frequent
users relative to the overall average. This result corresponds with the findings of Agran et
al. (2003), that children aged 15-17 months have the highest injury rates of all children
under 16 years of age. This age period coincides with the time at which most children
start to stand up and learn to walk, develop inquisitive behaviour and increase hand-to-
mouth activity. Agran et al. (2003) showed that the primary causes are, in decreasing
order, falls, poisoning, transportation, foreign bodies, and fires and burns. Another
potential cause is the incidence of certain early age childhood diseases. Parents are
generally thought to be more risk averse with their young children and will go to A&E
for reassurance. In this cross-sectional study it is difficult to separate out the somewhat
subjectively termed ‘worried parent’ effect. We concur with view of Murphy (1998a) that
any classification of ‘inappropriateness’ for A&E attendance is essentially subjective.
Infants may, as mentioned above, be taken to A&E as a consequence of higher accident
rates for this age group, sudden fevers and other morbidities as well as an actual higher
risk of mortality (Gavrilov and Gavrilova, 2001). This suggests that although children are
the most frequent light users, there are fundamental principles at work that would make it
11
difficult and possibly unethical to reduce this type health seeking behaviour on the basis
of cost-cutting.
More men than women fell into the target category of light frequent users in the
30-44 and 45+ year age groups, although only with a risk difference of 7-8% (Table 1).
The effects for area deprivation were generally weak or did not follow a specific gradient
apart from that the most deprived 4/5th of the area usually had greater odds ratios than the
least deprived quintile. A number of other studies have identified stronger gradients with
area deprivation (see e.g. studies in Kendrick et al., 2005). The majority of the population
in this study, however, resided in areas ranking amongst the 20% most deprived
nationally. Consequently, the study area has less variation with regards to area
deprivation, which is another likely reason for the relatively weak effects of deprivation
found in this study.
We identified very few significant differences within this very ethnically diverse
user group with regards to light frequent use of A&E. The exception to the general trend
concerned the 0-15 year old age cohort, where users with names classified as Eastern
European and some other name minorities were more likely to be repeat users relative to
the reference population with English names. Further qualitative research is needed to
uncover whether these groups of families have particular needs that should be addressed
and whether more could be done to accommodate these potential needs in a primary care
setting.
An alternative explanation for the apparent equality in light A&E usage might be that
inner city GP services are not considered equally attractive/acceptable by different ethnic
groups. A study by Rajpar et al. (2000) showed that among users of A&E and out-of-

12
hours GP services in inner Birmingham (UK) those of White ethnic background were
more likely to use A&E rather than the GP alternative compared to other ethnic groups.
Low GP registration rates have for years been associated with the fluid
populations of inner city areas (Haynes et al., 1995, Hargreaves et al., 2006) and
especially among the 20-40 year olds and men more than women (Millett et al., 2005). In
this study the level of non-registration was particularly high amongst users with names
originating in Poland (51%) as well as with users from many of the fifteen pre-2004 EU
membership countries (25-30% non-registration). Adult men were also 39-59% less
likely than women to be registered with a GP in their respective age groups (Table 3).
Poland is the largest of the ten new Eastern European countries that joined the EU in
2004 and differences in GP-registration rate could be interpreted as an effect of a shorter
period of residence for the citizens of the EU accession countries (Leaman et al 2006).
Hypothetically users not registered with a GP might rely on A&E for non-urgent care
needs. However, we found that light frequent users were consistently, 25-39%, more
likely to be registered relative to all other users (Table 2). There may be at least two
different possible explanations for this. First, it could be interpreted as a type of ‘healthy
user’ bias, i.e. the effect that some patients are more concerned about their health than
others, engage in healthier lifestyles and also tend to use the healthcare services more
often and more assertively than others. Second, a correlation between health service
registration and healthcare seeking behaviour could alternatively be interpreted as a result
of a prevalence-incidence bias (Delgado-Rodriguez and Llorca, 2004), where users that
are more likely to leave an area also have different healthcare needs and behaviours to
those resident for longer periods of time. Although this is an interesting counter-

13
hypothesis the actual number of contacts that most users have with the A&E services are
probably too infrequent to fully disentangle such a relationship using routinely collected
data for an annual period.
There is a continuing debate about the health of ethnic minorities in general and
recent migrants in particular, much of it focused upon access and use of healthcare
services. We concur with Mladovsky (2009) about the importance of monitoring equity
in these areas. There are many known examples of inequalities, for example in the uptake
of vaccination and screening, as well as the use of dental, sexual, mental, inpatient,
outpatient, and long-term health care services (Mladovsky, 2009). Yet there are also other
examples in which ethnicity or migrant status does not appear to constitute a specific risk
factor. The findings from this study enabled the local healthcare authority to focus upon
potentially unmet needs of children from ethnic minorities. The results of this research
suggest that campaigns to increase GP registrations should not be priorities for resource
expenditure.
Names-based ethnicity classifications may present a promising means of updating
and informing local healthcare programmes, especially where ethnicity - self-reported or
otherwise - is not available to the desired level of granularity or with near complete
coverage. We see our approach as a ‘first filter’ or segmentation method to identify
groups with particular needs or behaviours, that can assist health authorities in selecting
individuals, for example for focus groups that in turn might garner valuable insights to
inform public health campaigns and optimise the use of local healthcare services. The
study also highlights some of the pitfalls associated with this type of analysis that users
should be aware of.

14
Table 1 light frequent usage of A&E. Multivariable logistic regression analysis stratified by age Age strata Covariates Level Odds Ratio P-value (Wald) 0-15 yr Sex 0.3802 Men Ref Women 0.97 (0.91-1.04) Deprivation <0.0001 1st Least Ref 2nd 1.31 (1.18-1.46) 3rd 1.22 (1.10-1.36) 4th 1.25 (1.13-1.39) 5th Most 1.22 (1.11-1.36) Ethnicity <0.0001 English Ref African 0.96 (0.86-1.07) Celtic 1.00 (0.91-1.09) Eastern European 1.58 (1.27-1.98) European other 1.11 (0.93-1.32) Hispanic 1.17 (1.03-1.35) Muslim 1.13 (1.02-1.26) Other 1.18 (1.06-1.31)
Goodness-of-fit: N = 24,363; Hosmer-Lemeshow (df) = 2.29(8); P-value = 0.9707
Age strata Covariates Level Odds Ratio P-value (Wald) 16-29 yr Sex 0.9885 Men Ref Women 1.00 (0.93-1.08) Deprivation 0.0549 1st Least Ref 2nd 1.13 (1.00-1.27) 3rd 1.15 (1.02-1.29) 4th 1.19 (1.06-1.33) 5th Most 1.10 (0.98-1.24) Ethnicity 0.2873 English Ref African 1.04 (0.89-1.20) Celtic 1.00 (0.98-1.24) Eastern European 1.01 (0.84-1.20) European other 0.84 (0.70-1.00) Hispanic 1.04 (0.90-1.21) Muslim 1.08 (0.95-1.23) Other 0.91 (0.80-1.04)
Goodness-of-fit: N = 23,370; Hosmer-Lemeshow (df) = 3.82(8); P-value = 0.8727
Age strata Covariates Level Odds Ratio P-value (Wald)

15
30-44 yr Sex 0.0436 Men Ref Women 0.92 (0.85-1.00) Deprivation 0.0007 1st Least Ref 2nd 1.02 (0.90-1.16) 3rd 1.18 (1.05-1.34) 4th 1.19 (1.05-1.34) 5th Most 1.23 (1.09-1.39) Ethnicity 0.2175 English Ref African 0.91 (0.79-1.06) Celtic 1.03 (0.93-1.14) Eastern European 1.03 (0.79-1.33) European other 0.84 (0.69-1.03) Hispanic 1.07 (0.92-1.25) Muslim 1.06 (0.92-1.22) Other 0.89 (0.76-1.04)
Goodness-of-fit: N = 22,787; Hosmer-Lemeshow (df) = 14.7(8); P-value = 0.0653
Age strata Covariates Level Odds Ratio P-value (Wald) 45+ yr Sex 0.0385 Men Ref Women 0.92 (0.84-1.00) Deprivation 0.0002 1st Least Ref 2nd 1.19 (1.05-1.36) 3rd 1.13 (0.99-1.29) 4th 1.29 (1.13-1.46) 5th Most 1.32 (1.16-1.50) Ethnicity 0.6415 English Ref African 1.13 (0.93-1.36) Celtic 0.99 (0.89-1.10) Eastern European 0.93 (0.61-1.41) European other 1.00 (0.78-1.30) Hispanic 1.21 (0.98-1.49) Muslim 0.98 (0.82-1.17) Other 0.98 (0.82-1.17)
Goodness-of-fit: N = 22,576; Hosmer-Lemeshow (df) = 3.63(8); P-value = 0.8885
16
Table 2 GP registration. Multivariable logistic regression analysis of users not registered with a GP. Stratified by age Age strata Covariates Level Odds Ratio P-value (Wald) 0-15 yr Sex 0.9582 Men Ref Women 0.92 (0.83-1.02) Deprivation 0.1426 1st Least Ref 2nd 1.20 (1.00-1.43) 3rd 1.14 (0.97-1.36) 4th 1.08 (0.91-1.28) 5th Most 0.92 (0.78-1.10) User category <0.0001 Other Ref Light frequent 0.61 (0.53-0.71) Ethnicity <0.0001 English Ref African 1.23 (1.02-1.48) Celtic 1.14 (0.97-1.34) Eastern European 2.54 (1.85-3.49) European other 1.52 (1.16-2.00) Hispanic 1.82 (1.48-2.24) Muslim 1.40 (1.18-1.66) Other 1.53 (1.29-1.81) Goodness-of-fit: N = 24,363; Hosmer-Lemeshow (df) = 2.57(8); P-value = 0.9582
Age strata Covariates Level Odds Ratio P-value (Wald) 16-29 yr Sex <0.0001 Men Ref Women 0.59 (0.56-0.63) Deprivation <0.0001 1st Least Ref 2nd 1.16 (1.06-1.26) 3rd 0.90 (0.82-0.99) 4th 0.91 (0.83-1.00) 5th Most 0.85 (0.78-0.94) User category <0.0001 Other Ref Light frequent 0.77 (0.71-0.84) Ethnicity <0.0001 English Ref African 1.01 (0.89-1.15) Celtic 1.00 (0.92-1.09) Eastern European 5.26 (4.61-6.00) European other 2.83 (2.50-3.20) Hispanic 2.60 (2.33-2.90)

17
Muslim 1.13 (1.02-1.26) Other 2.56 (2.33-2.82) Goodness-of-fit: N = 23,370; Hosmer-Lemeshow (df) = 15.5(8); P-value = 0.0502
Age strata Covariates Level Odds Ratio P-value (Wald) 30-44 yr Sex <0.0001 Men Ref Women 0.41 (0.38-0.44) Deprivation 0.0343 1st Least Ref 2nd 1.06 (0.96-1.18) 3rd 0.96 (0.86-1.07) 4th 0.96 (0.86-1.07) 5th Most 0.89 (0.81-1.00) User category <0.0001 Other Ref Light frequent 0.75 (0.68-0.84) Ethnicity <0.0001 English Ref African 0.95 (0.82-1.09) Celtic 0.92 (0.83-1.02) Eastern European 3.30 (2.74-3.98) European other 1.72 (1.48-2.00) Hispanic 2.15 (1.91-2.43) Muslim 1.20 (1.06-1.36) Other 1.74 (1.54-1.96) Goodness-of-fit: N = 22,787; Hosmer-Lemeshow (df) = 5.92(8); P-value = 0.6559
Age strata Covariates Level Odds Ratio P-value (Wald) 45+ yr Sex <0.0001 Men Ref Women 0.61 (0.56-0.67) Deprivation 1st Least Ref 0.0005 2nd 1.36 (1.18-1.57) 3rd 1.23 (1.07-1.43) 4th 1.18 (1.02-1.37) 5th Most 1.10 (0.95-1.28) User category 0.0007 Other Ref Light frequent 0.76 (0.65-0.89) Ethnicity <0.0001 English Ref African 1.61 (1.31-1.97) Celtic 1.14 (1.00-1.28)

18
Eastern European 4.45 (3.30-6.00) European other 1.62 (1.25-2.10) Hispanic 3.49 (2.91-4.20) Muslim 1.56 (1.29-1.88) Other 2.00 (1.68-2.37) Goodness-of-fit: N = 22,576; Hosmer-Lemeshow (df) = 10.23(8); P-value = 0.2496

19
Table 3 Users not registered with a GP by names-based ethnicity (Onomap CEL Type). Groups with less than 25% un-registered were aggregated in the ‘Other’ category. Names-based ethnicity (CEL Type) Freq. Total Percent Poland 723 1,424 50.8 China 140 325 43.1 Russia 56 182 30.8 Greece 64 215 29.8 Germany 140 475 29.5 Spain 679 2,458 27.6 Italy 497 1,832 27.1 Hong Kong 137 511 26.8 Portugal 713 2,665 26.8 Albania 39 152 25.7 Norway 74 291 25.4 Balkan 39 156 25.0 Other 6,700 43,180 15.5 England 5,061 39,230 12.9 Total 15,062 93,096 16.2

20
1.3
1.4
1.5
1.6
1.7
1.8
1.9
2.0
0 10 20 30 40 50 60 70 80
Age
Atte
ndan
ces p
er u
ser
MaleFemale
Figure 1 Light A&E attendance rate by age and sex (95% CI).

21
References Agran, P.F., Anderson, C., Winn, D., Trent, R., Walton-Haynes, L., Thayer, S., 2003.
Rates of pediatric injuries by 3-month intervals for children 0 to 3 years of age.
Pediatrics, 111, e683-692.
Aspinall, P. J., 2000. The mandatory collection of data on ethnic group of inpatients:
experience of NHS trusts in England in the first reporting years. Public Health
114(4): 254-259
Delgado-Rodriguez, M., Llorca, J., 2004. Bias. Journal of Epidemiology and Community
Health, 58, 635-641.
Gavrilov, L., Gavrilova, N., 2001. The reliability theory of aging and longevity. Journal
of Theoretical Biology, 213, 527-545.
Gibin, M., Mateos, P., Petersen, J., Atkinson, P., 2009. Google maps mash-ups for local
public health service planning. In: Geertman, S., Stillwell, J. (Eds) Planning
support systems: best practice and proven methodologies. Springer Publishers,
Berlin, pp. 227-242.
Giesen, P., Franssen, E., Mokkink, H., Bosch, W., 2006. Patients either contacting a
general practice cooperative or accident and emergency department out of hours:
a comparison. Emergency Medicine Journal, 23, 731-734.
Gill, L., 1997. OX-LINK: The Oxford medical record linkage system. In: Alvey, W.,
Jamerson, B. (Eds), Record linkage techniques, National Academy Press,
Washington DC, pp. 15-33.
Hargreaves, S., Friedland, J.S., Gothard, P., Saxena, S., Millington, H., Eliahoo, J., Le
Feuvre, P., Holmes, A., 2006. Impact on and use of health services by

22
international migrants: questionnaire survey of inner city London A&E attenders.
BMC Health Services Research, 6, 153-160.
Haynes, R.M., Lovett, A.A., Bentham, G., Brainard, J.S., Gale, S.H., 1995. Comparison
of ward population estimates from FHSA patient registers with the 1991 Census.
Environment and Planning A, 27, 1849-1858.
Kendrick, D., Mulvaney, C., Burton, P., Watson, M., 2005. Relationship between child,
family and neighbourhood characteristics and childhood injury: a cohort study.
Social Science, Medicine, 61, 1905-1915.
Kumarapeli, P., Stepaniuk, R., de Lusignan, S., Williams, R., Rowlands, G., 2006.
Ethnicity recording in general practice computer systems. Journal of Public
Health 28(3): 283
Lakha, F., Gorman, D., Mateos, P., forthcoming. Name analysis to classify populations
by ethnicity in public health: Validation of Onomap in Scotland. Journal of
Epidemiology and Community Health (in press)
Leaman, A.M., Rysdale, E., Webber, R., 2006. Use of the emergency department by
Polish migrant workers. Emergency Medicine Journal, 23, 918-919.
Long, J.S., Freese, J., 2006. Regression models for categorical dependent variables using
Stata College Station: Stata Press.
Mateos, P., 2007a. Classifying ethnicity using people's names. Proceedings to the Social
Statistics and Ethnic Diversity Conference. Montreal: Quebec Inter-University
Center for Social Statistics and the Institut National d'Études Démographiques.
Mateos, P., 2007b. A review of name-based ethnicity classification methods and their
potential in population studies. Population, Space and Place, 13, 243-263.

23
Millett, C., Zelenyanszki, C., Binysh, K., Lancaster, J., Majeed, A., 2005. Population
mobility: characteristics of people registering with general practices. Public
Health, 119, 632-638.
Mladovsky, P., 2009. A framework for analysing migrant health policies in Europe.
Health Policy, 93, 55-63.
Murphy, A.W., 1998a. 'Inappropriate' attenders at accident and emergency departments I:
definition, incidence and reasons for attendance. Family Practice, 15, 23-32.
Murphy, A.W., 1998b. 'Inappropriate' attenders at accident and emergency departments
II: health service responses. Family Practice, 15, 33-37.
Nanchahal, K., Mangatani, P., Alston, M., Dos Santos Silva, I., 2001. Development and
validation of a computerized South Asian names and group recognition algorithm
(SANGRA) for use in British health-related studies. Journal of Public Health
Medicine, 23, 278-285.
Office for National Statistics, 2008. Key population and vital statistics. London.
Petersen, J., Atkinson, P., Petrie, S., Gibin, M., Ashby, D., Longley, P., 2009. Teenage
pregnancy - new tools to support local health campaigns. Health and Place, 15,
300-307.
Rajpar, S. F., Smith, M. A., Cooke, M. W., 2000. Study of choice between accident and
emergency departments and general practice centres for out of hours primary care
problems. Journal of Accident and Emergency Medicine, 17: 18:21.
Raleigh, V. S., 2008. Collection of data on ethnic origin in England. British Medical
Journal 337(aug21 1): a1107

24
Sangowawa, O., Bhopal, R., 2000. Can we implement ethnic monitoring in primary
health care and use the data? Public Health Medicine 2(3): 106-108
Sempere-Selva, T., Peiro, S., Sendra-Pina, P., Martinez-Espin, C., Lopez-Aguilera, I.,
2001. Inappropriate use of an accident and emergency department: magnitude,
associated factors, and reasons - an approach with explicit criteria. Annals of
Emergency Medicine, 37, 568-579.