Astable Multivibrator (23 points) The circuit above has been ...
Upload
khangminh22Category
view
1download
0
N O T I C E
THIS DOCUMENT HAS BEEN REPRODUCED FROM MICROFICHE. ALTHOUGH IT IS RECOGNIZED THAT
CERTAIN PORTIONS ARE ILLEGIBLE, IT IS BEING RELEASED IN THE INTEREST OF MAKING AVAILABLE AS MUCH
INFORMATION AS POSSIBLE

a CR-159789
SPECTROLAB, INC.
PREPARED FOR
# ^yA UG 1980
RECEIVEDNASA sn WJU
TMFEZ DEPT
1 ,
SCREEN PRINTING TECHNOLOGY APPLIED TO SILICO[
SOLAR CELL FAL)'RICATIO"J
(NASA-CH-159789) SCRE1,14 F14INIING 1ECl1NCLCGYAPPLIED IC SILICCN SCLAE CELL FABRICATIONFinal Report, Nov. 1977 - Feb. 1979(Spectrolab, Inc.) 64 p t1C AJ4/1F A;,1
CSCL 1JA GJ/44
BY J. 1'I. THORNHILL AND W. E. SIPPERLY
1:80-27JJd
t)t^c;ia^d11.3
NATIOUL AERONAUTICS AND SPACE AYINISTRA.TION
NASA LEWIS RESEARCH CENTER
CONTRACT NAS3-2082.6

I. Report No. 2. Government Accession No. RaCtplent's Catalog No.
NASA CR-14 Title and SubLrtle S. Repon Data
Screen Printing Technology Applied to Silicon April 1980Solar Cell Fabrication 8. Performing Organ zation Code
7. Authors) 8. Performing Organization Report No.Jay W. Thornhill and William E. Sipperly
10. Work Unit No.g Performing Organization Name and Addreu
Spectrolab, Inc.12500 Gladstone Avenue
11. Contract or Grant No.
Sylmar, Calii" rnia 91342 NAS3-20826
13. Type of Report and Period CoveredFinal Report12 Sponsoring Agency Name and Address
National Aeronautics and Space Nny- 1977 to Feb. 197914. Sponsoring Agency CodeAdministration
Washington, DC 20546
15 Su pp lementary Notes
Project Manager: John C. Evans, Jr., NASA-Lewis Research Center,Cleveland, Ohio 44135
16. Abstract
The work done on this contract optimized the process for producing space qualified
solar cells in both the conventional and wraparound configuration using screen
printing techniques. Process modifications were chosen that could be easilyautomated or mechanized. Work was accomplished to optimize the tradeoffs asso-
ciated with gridline spacing, gridline definition and junction depth. An exten-
sive search for possible front contact metallization was completed.
The back surface field structures along with the screen printed back contacts
were optimized to produce open circuit voltages of at least an average of 600
millivolts. After all modifications on the process sequence that were intended
were a8complished,the cells were exhaustively tested. Electrical tests at AMO
and 28 C were made before and after boiling water immersion, thermal shock and
storage under conditions of high temperature and high humidity. After the tests
were completed, cells from both conventional lots and wraparound lots were sent
to NASA-Lewis Research Center.
17. Key Words (Suggested by Authors)) 18. Distribution Sutement
Silicon, solar cells, Unclassified-Unlimited
screen printed contacts
19 Secu r ity Clasuf (of this re port) 20 Security Class f (of this page) 21. No of ►pas 22 Price*Unclassified 58
' For sale by the National Technical Information Service. Springfield, Virginia 22151
NASA•C•164(1 11r, &71)

TABLE OF CONTENTS
Section T_tle Page
ABSTRACT iv
1.0 SUMMARY 1
2.0 INTRODUCTION 4
2.1 BACKGROUND 4
2.2 OBJECTIVES 5
2.3 PROGRAM ORGANIZATION 6
3.0 TECHNICAL DISCUSSION 8
3.1 JUNCTION DEPTH OPTIMIZATION 8
3.2 GRIDLINE DEFINITION CONSIDERATIONS 11
3.3 EFFECTS OF FRIT CONTENT AND FIRING CONDITIONS 12
3.4 BACK SURFACE FIELD FORMATION 14
3.5 PASTE COST CONSIDERATIONS 16
3.6 NON-SILVER METALLIZATIONS 17
3.7 GLASS FRIT MATERIALS 17
3.8 FRONT METALLIZATIONS 18
3.9 MINIMUM CELL THICKNESS 22
3.10 DIELECTRIC ISOLATION 22
3.11 PROCESS SEQUENCE USED FOR NON-WRAPAROUND 24CELLS
3.12 TEST RESULTS FOR NON-WRAPAROUND CELLS 30
3.13 PROCESS SEQUENCE USED FOR WRAPAROUND CONTACT 49CELLS
3.14 TEST RESULTS FOR WRAPAROUND CELLS 50
4.0 FURTHER TECHNOLOGICAL DEVELOPMENT 55
4.1 FRONT SURFACE METALLIZATION 55
4.2 MINIMUM CELL THICKNESS 55
5.0 CONCLUSIONS 56
1

LIST OF FIGURES
Figure Title Page
1 Process Sequence for Conventional (Non- 26Wraparound) Cells
2 I-V Characteristics for Sodium Hydroxide 31Etched Cell
3 Cell Series Resistance (NaOH Processed Cell) 32
4 I-V Characteristic Curve for Representative 35Screen-Printed Cell
5 Series Resistance Measurement Curves for Re- 36presentative Screen-Printed Cell
6 I-V Characteristic Before and After Boiling 39Water Immersion (Typical Cell)
7 Cell Performance Before and After Temperature- 43Humidity Storage
8 Cell Performance Before and After Post 44Humidity Boil/Bake Cycle
9 Typical I-V Curve Obtained Before and After 47Thermal Shock
10 Cartesian Coordinate Diagram for a Front 48Contact Metallization Test Pattern(Each division equals 0.25 mm)
ii
LIST OF TABLES
Table Title Page
1 Effect of Bulk Resistivity and Junction 9Depth
2 Minimum Number of 0.13 mm Gridlines for 10Various Junction Depths
3 Short Circuit Current vs Junction Depth 10
4 Fair Commercially Available Materials 19
5 Comparison of Front Paste Metallizations 23
6 Dielectric Isolation Measurements - Single 25Printing
7 HF Removal of Phosphorous Glass Layer 28
8 Process Sequence Showing Yields and Losses 33
9 Electrical Performance Test Data For Non- 34Wraparound Cells (A..M0 Illumination at 280C)
10 Electrical Performance Before and After 10 Min. 38Boiling Water Immersion
11 Temperature - Humidity Test Data 41
12 Thermal Shock Test Data 46
13 Data For Representative Screen Printed Wrap- 52around Contact 2 x 2 cm Silicon Solar CellsWith Dielectric Isolation
14 Data for Boiling Water Test of Screen Printed 53Wraparound Contact Silicon Solar Cells
15 Data for Thermal Shock Test of Screen Printed 54Wraparound Contact Silicon Solar Cells
iii

ABSTRACT
The work done on this contract optimized the process for producing
space qualified solar cells in both the conventional and wrap-
around configuration using screen printing techniques. Process
modifications were chosen that could be easily automated or
mechanized. Work was accomplished to optimize the tradeoffs
• associated with gridline spacing, gridline definition and junc-
tion depth. An extensive search for possible front contact
metallization was completed.
The back surface field structures along with the screen printed
back contacts were optimized to produce open circuit voltages
of at least an average of 600 millivolts. After all modifica-
tions on the process sequence that were intended were accomplished
the cells were exhaustively tested. Electrical tests at A.MO
and 28 0C were made before and after boiling water immersion,
thermal shock and storage under conditions of high temperature
and high humidity. After the tests were completed, cells from
both conventional lots and wraparound lots were sent to NASA-
Lewis Research Center.
IV

1.0 SUMMARY
An optimized screen printing process was developed for use on
space solar cells. This process was effective with both the
conventional solar cell and the wraparound cell. All experimentsthat did not specify the number of cells used were run with five
cells for each data point. All cells used were AR coated.
The cells fabricated under thi contract performed well under
the conventional Scotch tape peel test, storage at 80 0C and 90%
relative humidity for ten days, a ten minute immersion in boil-
ing water and thermal shock consisting of fifteen cycles from
-196 0C to +100 0C at a 20 0C/minute rate.
The cells fabricated for both the lot of conventional cells and
the lot of wraparound cells used a texturized surface. This step
reduced the reflectivity at the surface and improved adhesion of
the front surface metallization. This program also found that it
was necessary to tighten the specification for the bulk resisti-
vity of the wafer. Nine to fourteen was suggested instead of the
seven to fourteen which was used in the past. The higher resis-
tivity bulk material was somewhat less sensitive to the mechanical
processes associated with screen printing.
Work was also completed on the trade-offs that must be considered
between cell output, junction depth and minimum gridline width.
Eight to ten lines per centimeter proved to be the minimum density
of gridlines that would permit the use of a shallow junction. A
screen mesh size of 325 and a mesh orientation of 22 0 was used to
give the proper line definition. The emulsions used had a thick-
ness of 0.020 to 0.025mm. The paste was dried with a fast infrared
drying cycle which caused the exterior of the paste to harden first,
preventing paste flow during drying.
-1-

k ^
A number of different pastes were looked at as possible candidates
for the front surface metallization. These pastes included
selections from various non-silver materials, commercially
available silver compositions, modified silver compositions,
modified frit compositions diluted and modified frit composi-
tions and customized frit compositions. Thick Film Systems
paste A256 with Transene n-diffusol was selected from the
modified frit composition group as the paste that had the best
overall characteristics. Frit content not exceeding five percent
and firing temperature not exceeding 700 0C were determined as
the optimum characteristics for this paste.
Work completed on the optimiza^ion of the back surface field
processing sequence has shown that the back etch step before
printing of the aluminum is optional. No noticable degradation
of the curve shape can be seen when the step is left out of the
process. Open circuit voltages of greater than 600 mV have
been obtained with both variations.
A minimal amount of work was also done to determine the minimum
cell thickness with acceptable yields. Cells 2^ to 3^ mils
were the thinnest that could be reproduced with any consistency.
Work on the dielectric isolation used for the wraparound
configuration proved Thick Film Systems 1126RCB superior to the
others tested. A double coating was preferred for filling in
pinholes and eliminating shunting effects.
The process sequence optimized under this contract was used to
fabricate a lot of both conventional and wraparound cells.
Thirty cells electrically tested, ten cells tested in boiling water,
twelve cells tested in higz temperatures and high humidity and
five cells exposed to a thermal shock cycle were selected from the
initial lot of conventional cells and shipped to the NASA-Lewis
Research Center.
-2-

Twenty-five cells were selected from the lot of cells with the
wraparound configuration and tested for electrical performance at
AMO and. 28 C. These cells were also shipped to the NASA Lewis
Research Center. Other cells from the lot of wraparound cells
were tested in boiling water and exposed to thermal shock tests,
but no testing at high temperature and high humidity was accom-
plished due to a lack of additional funds and time.
- 3-
Z.

2.0 INTRODUCTION
2.1 BACKGROUND
Future space missions are currently being planned that will re-
quire the use of very large quantities of solar cells. Programs
such as the Solar Electric Propulsion System (SEPS) 1 and th_
Satellite Solar Power System (SSPS) 2 will require the manufacture
of such large numbers of cells that it becomes highly desirable
to develop cell designs and processing techniques that are amen-
able to automated or mechanized fabrication. Current aerospace
solar cell processing involves considerable hand labor and indi-
vidual device handling, particularly in the high vacuum deposition
of contact metallizations and antireflective coatings.
Screen printed contact metallizations are in common usage for the
manufacture of terrestrial silicon solar cells. This technique is
one that has been shown to be amenable to automation by investiga-
tions at Spectrolab, discussed in the NASA-Lewis final report,
"Demonstration of the Feasibility of Automated Silicon Solar Cell
Fabrication", under contract NAS3-16566. 3 Contract NAS3-20029,alsc
sponsored by NASA-Lewis, demonstrated that screen printed silicon
solar cells could be fabricated with significantly improved charac-
teristics, as well as with a screen printed dielectric wraparound
configuration that permitted wraparound contacts. 4 This wraparound
contact structure offers the possibility of major savings in solar
panel assembly using automated procedures.
While the feasibility of these concepts was shown by these efforts,
the processes and materials used were not optimized. It was nec-
essary to use relatively deep junctions to avoid shunting effects
brought about by firing on the screen printed contacts, with the
associated penalty of reduced conversion efficiencies. Also, no
real attempts were made to reduce gridline widths in order to
increase cell active areas. Some environmental tests were per-
formed, but the effects of boiling water immersion, thermal shock,
and storage under conditions of high temperature and humidity were
-4-

established only for the specific pastes in use at that time. No
work was done to investigate a variety of screen printed pastes
for contacts and for dielectric isolation.
2.2. OBJECTIVES
This investigation was carried cat with the specific intent of
developing screen printed metal front and back contacts that met
the following requirements:
• grid line widths were to be minimized to the limit of
the state-of-the-art for screen printing technology
• contact coverage of the f ront surface area was to be
less than 10%
• cell series resistance was to be equal to or less than
that of conventional vacuum metallized cells
• the screen printed metallization was to have a sheet
resistance less than 0.02 ohm/square, and the metal-to-
silicon contact resistance was to be less than 0.02 ohm-cm2
• back surface field structures along with the screen print-
ed back contacts should produce open circuit voltages
of at least 600 millivolts (average) for 10 ohm-cm sil-
icon base material
• the contac' paste material should not cost more than $0.05
for 60 cm of cell
• contacts were to withstand the standard Scotch tape peel
test
• contacts were not to be adversely affected oy humidity
• the screen printed contacts were to exhibit low resist-
ance ohmic behavior
The silicon solar cells to be used for the investigation were to
be 2 X 2 X 0.02 cm in size, with the n+ diffused layer having a
sheet resistance of approximately 100 ohms/square, both being
typical for current space cell production. Texturization of the
front surface was optional. Paste composition, printing screens,
printing conditions, firing procedures, and firing atmospheres
5-

t
were to bE --ptimized for solar cell applications. If possible a
single contact firing wa3 to be utilized.
F
The minimum thickness of silicon to which such screen printed
contacts could be used was to be established. The screen printed
contacts were to be capable of withstanding the conventional
Scotch tape peel test, storage at 80 0C and 90% relative humidity
for ten days, a ten minute immersion in boiling water, and therm-
al shock consisting of fifteen cycles from -196 0C to +1000C at
a 200C/minute rate without loss of adhesion.
A thick film dielectric paste was to be developed and used to
provide isolation for screen printed wraparound contacts. This
dielectric material was to be pinhole-free and provide more than
10 5 ohms isolation with a thickness of less than 30 microns. In
the wraparound configuration the dielectric should nc,t show bead-
ing along the edge of the cell after firing, and should be compat-
ible with the metallization. No loss in isolation should occur
after the temperature/humidity storage test.
Once the materials and processing had been optimized,two groups of
cells were to be fabricated utilizing these materials ara processes.
One group was to be in the conventional non-wraparound configuration,
and the other was to be with wraparound contacts using screen print-
ed dielectric isolation.
2.3. PROGRAM ORGANIZATION
In order to attain the objectives of the program, the effort wat,
divided into the following specific tasks:
Task I Optimize the composition of the pastes, the dimenrions
and type of screen mesh, the printing conditions, the
metal type and composition, the curing conditions, the
firing schedule and atmosphere to obtain the desired

contact characteristics and apply the optimized process
to fabricate silicon solar cells. Establish the min-
imum thickness of silicon to which such contacts can be
applied without breakage. Perform are evaluation of the
cells and contact system, testing for electrical perform
ante, effects of boiling water immersion, storage under
elevated temperature and relative humidity, adhesion
and thermal shock.
Tb.^; ^I Develop an appropriate dielectric paste and the process
for applying it and firing it to permit the fabrication
of dielectrically isolated wraparound contact cells, to
be made using only screen printing techniques.
Task III Using the processes, materials, and techniques developed
under Tasks I and II fabricate 24 silicon solar cells
in the non-wraparound configuration, and 25 cells with
wraparound contacts.
-7-

3.0 TECHNICAL DISCUSSION
3.1 JUNCTION DEATH OPTIMIZATION
It was decided early in the program that the front surfaces of
the cells used in this program should be texturized. This improves
the short circuit current because of reduced front surface reflec-
tivity. It also permits screen printed contacts to "key" to the
surface and thus should improve adhesion. The starting material was
therefore first etched with a 30% sodium hydroxide solution at
about 110 0C to remove saw damage. A 26 sodium hydroxide solution
containing 20% isopropyl alcohol was then used to develop the
texturized front surface of the cells. The alcohol is added to
precipitate the sodium silicate reaction product. This low
concentration NaOH etchant is orientation dependent and develops
a surface that is uniformly covered with closely packed tetrahedra
when used on a silicon surface that is in the (100) plane.
As might be expected, texturized surfaces are more sensitive to
handling than smooth surfaces because of the possibility of damage
to the peeks of the tetrahedra. Past experience has also shown
that this sensitivity to mechanical damage is greater for silicon
having lower bulk resistivity. The sensitivity also increases
with shallow diffusions. It was desirable, therefore, to explore
both the effects of junction depth and bulk resistivity for screen
printed contact cells.
An experiment was performed which compared 1-3 ohm-cm with 9-11
ohm-cm materials. A series of diffusions were made with the
two materials, yielding sheet resistance values of 40, 60, and
80 ohms/sq. Cells were then fabricated using screen printed
contacts of Engelhard NA-2921 paste and aluminum paste P + back
surface field structures with the fired-on aluminum left in
place to act as the back contact. The results of these tests
are given in Table 1 below:
-8-
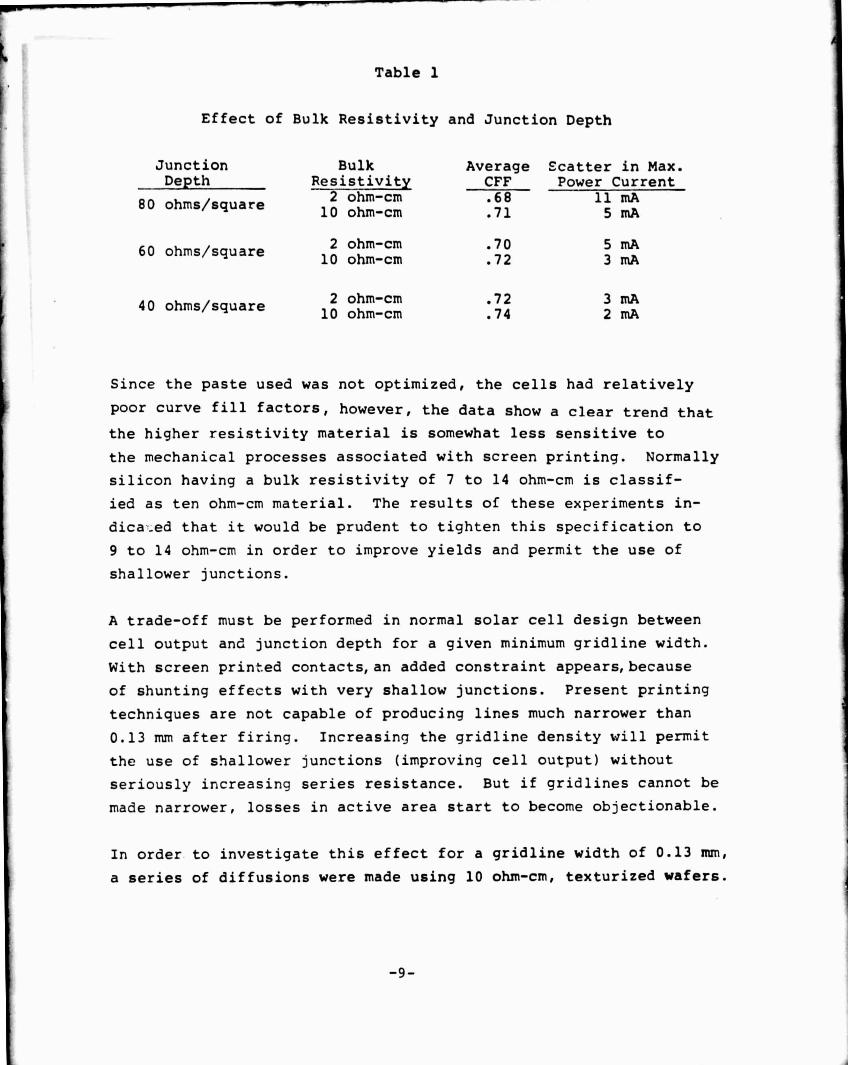
Table 1
Effect of Bulk Resistivity and Junction Depth
Junction Bulk AverageDepth Resistivity CFF
80 ohms/square 2 ohm-cm .6810 ohm-cm .71
60 ohms/square 2 ohm-cm .7010 ohm-cm .72
40 ohms/square 2 ohm-cm .7210 ohm-cm .74
Since the paste used was not optimized, the cells had relatively
poor curve fill factors, however, the data show a clear trend that
the higher resistivity material is somewhat less sensitive to
the mechanical processes associated with screen printing. Normally
silicon having a bulk resistivity of 7 to 14 ohm-cm is classif-
ied as ten ohm-cm material. The results of these experiments in-
dica,;ed that it would be prudent to tighten this specification to
9 to 14 ohm-cm in order to improve yields and permit the use of
shallower junctions.
A trade-off must be performed in normal solar cell design between
cell output and junction depth for a given minimum gridline width.
With screen printed contacts,an added constraint appears,because
of shunting effects with very shallow junctions. Present printing
techniques are not capable of producing lines much narrower than
0.13 mm after firing. Increasing the gridline density will permit
the use of shallower junctions (improving cell output) without
seriously increasing series resistance. But if gridlines cannot be
made narrower, losses in active area start to become objectionable.
In order to investigate this effect for a gridline width of 0.13 mm,
a series of diffusions were made using 10 ohm-cm, texturized wafers.
Ecatter in Max.Power Current
11 mA5 mA
5 mA3 mA
3 mA2 mA
-9-

The wafers were 0.20 mm thick and aluminum paste back surface fields
were used. The wafers were then fabricated into 2 X 2 cm cells
using a series of different gridline densities. Using 0.20 ohm
as a reasonable upper limit for cell series resistance, the minimum
number of grid lines was established for the various junction depths.
These data are shown below in Table 2.
Table 2
Minimum Number of 0.13 mm Gridlinesfor Various Junction Depths
Junction Depth(ohms/square)
30
40
55
70
100
Minimum Number of Linesper 2 X 2 cm Cell
5
6
10
12
16
Measurements of the short circuit current for the te a t cells at
AMO also gave an indication of the effect of junction depth on
cell output for illumination containing an appreciable ultra-
violet content.
Table 3
Short Circuit Current vs Junction Depth
Junction Depth(ohms/square)
30
40
55
100
Short Circuit 2Current(mA/cm )
36.1
39.0
40.2
41.6
The combined data appear to indicate that a junction depth of
about 45 ohms/sq., along with a minimum of three gridlines per
centimeter, should provide the best compromise for a line width
of about 0.13 mm, providing a satisfactory photocurrent and an
acceptable series resistance. In order to permit additional
shallowing of the juriction,it was decided to use a gridline den-
sity of eight to ten lines per centimeter.
-1 )-
i
i
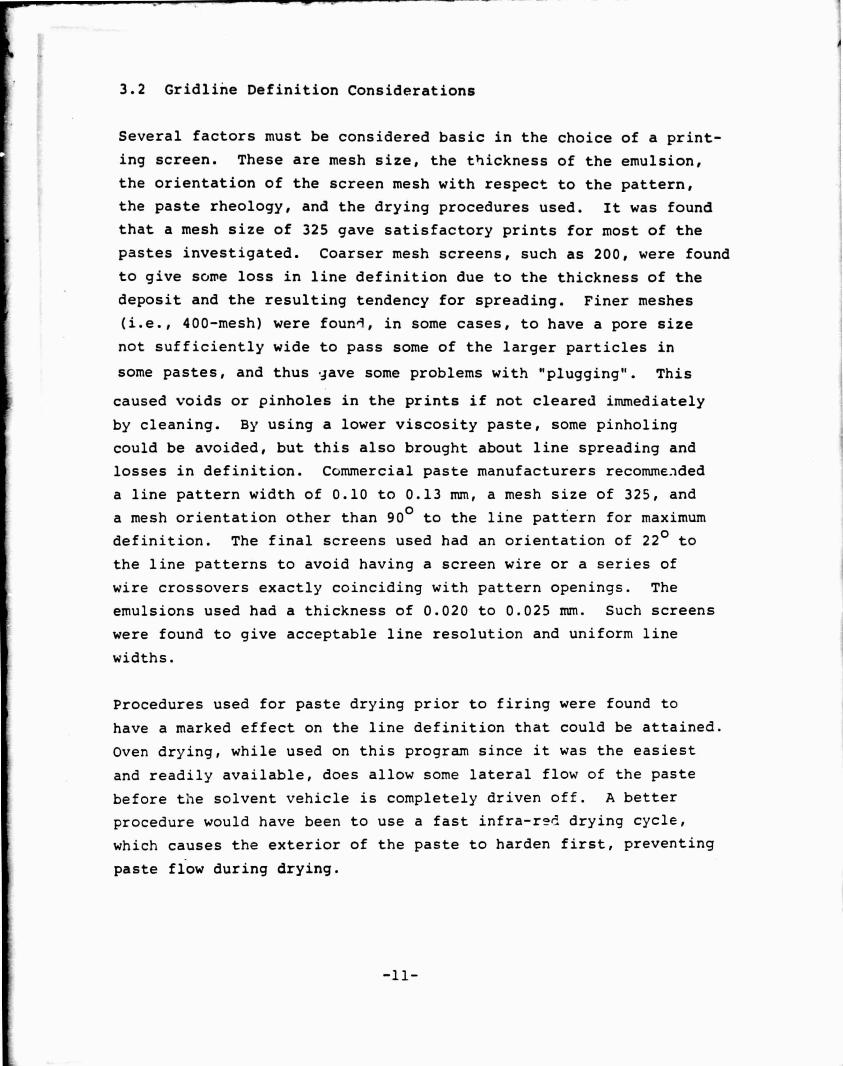
3.2 Gridline Definition Considerations
Several factors must be considered basic in the choice of a print-
ing screen. These are mesh size, the thickness of the emulsion,
the orientation of the screen mesh with respect to the pattern,
the paste rheology, and the drying procedures used. It was found
that a mesh size of 325 gave satisfactory prints for most of the
pastes investigated. Coarser mesh. screens, such as 200, were found
to give some loss in line definition due to the thickness of the
deposit and the resulting tendency for spreading. Finer meshes
(i.e., 400-mesh) were four.-1 , in some cases, to have a pore size
not sufficiently wide to pass some of the larger particles in
some pastes, and thus •jave some problems with "plugging". This
caused voids or pinholes in the prints if not cleared immediately
by cleaning. By using a lower viscosity paste, some pinholing
could be avoided, but this also brought about line spreading and
losses in definition. Cc,mmercial paste manufacturers recommE1ded
• line pattern width of 0.10 to 0.13 mm, a mesh size of 325, and
• mesh orientation other than 90 0 to the line pattern for maximum
definition. The final screens used had an orientation of 22 0 to
the line patterns to avoid having a screen wire or a series of
wire crossovers exactly coinciding with pattern openings. The
emulsions used had a thickness of 0.020 to 0.025 mm. Such screens
were found to give acceptable line resolution and uniform line
widths.
Procedures used for paste drying prior to firing were found to
have a marked effect on the line definition that could be attained.
Oven drying, while used on this program since it was the easiest
and readily available, does allow some lateral flow of the paste
before the solvent vehicle is completely driven off. A better
procedure would have been to use a fast infra-rsd drying cycle,
which causes the exterior of the paste to harden first, preventing
paste flow during drying.
-11-

The viscosity of the paste was also found to have a marked effect
on line definition, with the lower viscosity inks having some tend-
ency to flow or "spread" after printing. Too high a viscosity
results in insufficient flow after printing to give the needed
leveling to eliminate screen marks and variations in paste depth.
A common practice among paste manufacturers is to include a thix-
otropic component in the paste This produces a lowered viscosity
under the shear forces of the equeegee, yet causes the paste to
set up again after these forces have passed. Such pastes remain
well mixed in their containers because of the high viscosity, but
still flow very well under the action of the squeegee. It is a
good practice, however, to print several patterns on dummy wafers
before actual use to assure good ink flow and leveling on actual
cells.
A variety of commercially available conductive pastes were compared
from the following suppliers:
AVX Materials
Cermalloy
E.I. DuPont De Nemours
Electromaterials Corp.
Electro-Science Laboratories
Engelhard
Ferro Corp.
Methode Development Co.
Plessey EMD
Thick Film Systems
Transene Co.
What appeared to be the best rheology was found for the materials
from Thick Film Systems and from the Ferro Corporation's thermo-
plastic inks. Comparable line widths were obtained with both
of these materials. Since the thermoplastic inks from Ferro
required specialized printing equipment, it was decided to use
only conventional inks for this investigation.
3.3 EFFECTS OF r'R:T CONTENT AND FIRING CONDITIONS
A curve fill factor of .68 to .76 can be obtained if the glass
frit content of the pas'Le is not more than five percent and if
-12-

the firing temperature is not higher than 700 0C. Those inks
designed for use on glass substrates appear to be the most useful
for solar cell applications.
In general, for a given firing temperature, the short circuit
I
current will increase as the firing times are increased. As the
maximum I sc is approached, the series resistance starts to
tdecrease, and a moderate value of curve fill factor will be ob-
tained, ranging from .68 to .76. Further increases in the firing
i time results in decreasing values of I sc with little change in
` the CFF until finally shunting begins to appear, with losses in
fill factor. The initial decrease in the short circuit current
may, from other investigations, be associated with the partial
shunting of the junction and localized higher junction fields.
For most pastes, the maximum in I sc does not occur simultaneously
with the maximum in CFF. It was found that for pastes that were
highly sensitive to firing times, the maximum fill factor was
achieved after the short circuit current had started to fall off.
It was quite possible therefore, for a paste that did not give
the best line definition to give a better performance in terms of
the finished cell characteristics.
The fall-off in short circuit current appears to correlate well
with the paste frit content. Paste materials appear to bond to
the silicon surface by an oxidative reaction. The frit composition
determines the rate and magnitude of the silicon oxidation. Other
factors which may be present are lattice distortion or impurity
migration, the latter possibly causing the changes observed in
short circuit current which occur without changes in fill factor.
Most of the frit materials found in pastes contain lead oxide which
can be reduced by silicon to yield silicon dioxide and elemental
lead. In the presence of oxygen the lead is oxidized again to
continue the reaction with silicon. Some verification of this
effect has been done by firing the paste materials for a constant
time in atmospheres containing varying levels of oxygen. In-
creased shunting was found for increased oxygen levels, with the
-13-

scatter in maximum power levels increasing also for increased
oxygen content. As the firing atmosphere was made to contain
higher and higher percentages of nitrogen, it became necessary
to increase the firing temperature in order to avoid curve fill
factor degradation from increased series resistance. Increased
firing times for the same firing temperature were not capable
of compensating for increased nitrogen content in the firing
atmosphere.
The optimum firing time appears to be a moderately stable
factor, and the firing temperature can be varied to compensate for
ambient changes. The best fill factor and tolerance to variations
was tested for each paste as a function of atmosphere firing
times and temperatures. No really significant advantage was found
by shifting to a nitrogen rich atmosphere, and thus optimized
firing schedules were established using an air ambient, primarily
because of the potential versatility and cost savings. Prelim-
inary tests of the effects of humidity appeared to indicate also
that nitrogen fired metallizations were more subject to output
degradation than air fired parts.
The organic vehicle and binder used in commercial paste materials
do not appear to play a role in the output characteristics of
finished cells. It thus becomes possible to combine an optimized
frit material and content with a binder having an optimum Theology.
Thus an improvement in cell output due to a reduced gridline
width is not compromised by an improper silicon-frit interaction.
3.4 BACK SURFACE FIELD FORMATION
The back surface field obtained by alloying screen printed
aluminum paste, a process developed under contract NAS3-20029,
was utilized and refined to produce open circuit voltages
greater than 600 mV. 4 This process was used to produce
space qualified cells ranging in base resistivity from one
to eight hundred ohm-cm. It was found possible to carry
-14-

out this process without the necessity for a back etching step,
because the molten silicon-aluminum eutectic can penetrate as
much as 15 micrometers into the back surface of the cells.
The phosphorus-diffused layer is overrun and dispersed into
the melt in the process.
Wafers are fired in a horizontal position using a "skeleton"
boat which has minimal thermal mass, this allows the time
temperature cycle to be essentially a "spike". The silicon
regrowth layer is doped to saturation with aluminum, producing
an abrupt P+/P back surface junction. The epitaxial regrowth
silicon layer is very thin, with the remainder of the silicon
forming a dendritic silicon layer. The aluminum then forms a
Metallic layer as an overlay. The large thermal mismatch between
the thermal expansion coefficients of aluminum and silicon are
at least partially compensated for by the porous nature of the
aluminum, a high aluminum oxide content, and the natural mal-
leability of the aluminum.
A layer of aluminum oxide powder fcrms on the surface of the
alloyed aluminum paste. This must be removed in order to obtain
a low resistance contact to the cell. Treatment with dilute
sodium hydroxide followed by ultrasonic agitation can be used
to remove this powder, but high level ultrasonic cleaning
can damage the front surface tetrahedra on texturized cells.
By going to 325-mesh aluminum powder in the paste, and using a
warm 1% NaOH treatment for only a short time, a gentle ultrasonic
cleaning may be ,lsed. The powder was found to be readily re-
moved also by rubbing the back surface with a mild abrasive,
such as baking soda. The remaining back surface is then a
bright metallic aluminum layer.
Several experiments were attempted to simultaneously fire both
the screen printed aluminum and back and front metallizations,
where each had been dried immediately after printing. This
does not appear to be practical because of the disparity between
-15-

optimum firing times and temperatures. Some co-firing was
accomplished by using a nitrogen atmosphere, but the resulting
back surface exhibited almost no field effect.
3.5 PASTE COST CONSIDERATIONS
The typical quantity of aluminum paste required to achieve
a high quality back surface field is approximately 0.01 gm/cm2.
This consists of 6.6 mg/cm2 of aluminum powder and 3.4 mg/cm2
of organic materials for the vehicle and binder. If the aluminum
powder, ethyl cellulose binder, and terpineol vehicle are pur-
chased separately and mixed in-house, the cost of coating 60
cm 2 of back surface will be about 1/3 of a cent for the materials.
Aluminum paste without any glass frit content may be purchased
commercially. In modest quantities the cost of using such a
paste to cover 60 cm would be about 8 cents, however, prices
are subject to change.
Typical silver paste deposition quantities are 0.01 gm/cm 2 when
using a 200-mesh screen with a 0.025 mm thick emulsion, which
might be considered an upper limit on contact paste thickness.
Actually a 325-mesh screen, which produces a thinner deposit,
would most likely be used. If it is assumed that the front
contact coverage is a full 10% of the cell area, then a typical
silver metallization (i.e., Thick Film Systems A256 + 2% Transene
n-diffusol), which costs about 84.7 cents per gm, would cost
approximately 5.08 cents for 60 cm of cells. If it is also assumed
that the same silver paste would be applied to the backs of the
cells, and that a 95% back surface coverage is used to provide
some contact "float", then 60 cm of 2 X 2 cm cells can be
metallized for about 13.37 cents.
The above figures are necessarily approximations, since the amount
of paste used will depend on whether the screen printing opera-
tions are continuous or start-stop, with frequent screen cleaning
-16-

required. The prices of commercial pastes are also sensitive to
the quantities purchased at any one time.
3.6 NON-SILVER METALLIZATIONS
Because of the relatively high cost of silver pastes, some attempts
were made to evaluate the use of base metal pastes for cell con-
tacts. Copper and nickel conductive pastes were purchased from
the Transene Company and tested, Both of these materials
require a relatively high firing temperature and must be fired
in an inert atmosphere. A time-temperature matrix was investiga-
ted for both pastes, but no firing schedule could be found that
did not result in shunting and extremely poor I-V characteristics.
It was felt that these pastes were potentially cheaper than silver
paste, and thus worth testing, but the poor re.:ults obtained
indicated that appreciable effort would be necessary to develop
a viable process.
Aluminum-silicon alloy and molybdenum-aluminum alloy pastes were
also tested for possible use as front grid contacts. Time-tem-
perature matrices were investigated in inert atmospheres. The
aluminum-silicon material gave more shunting than the aluminum
molybdenum alloy, but both showed curve fill factors less than .68
and were judged unsatisfazLory. It had been hoped that these
materials could be used, since they offer a freedom from including
glass frit in the paste. It might be possible to use the aluminum
alloy pastes for contacting P-on-N structures, but this was not inves-
tigated because it was beyond the scope of the program. The lack
of immediately encouraging results and the complexities of the pro-
blems made it necessary to restrict the development effort of this
program for front contacts to silver conductive pastes.
3.7 GLASS FRIT MATERIALS
The nature of silver paste contacts requires frit. It is possible
to use fritless silver paste, fired at temperatures as high as
-17-

the melting point of silver, and get good I-V curve shapes, but
the contacts will not adhere after exposure to humidity. Adherence
is dependent on some fusion of the frit with the silicon which
produces some dissolution of the silicon through an oxidative
sequence. The silicon dioxide formed during the firing is wet by
the frit, which in tern holds the conductive metal in intimate
contact with the -,ell's front surface. After firing, the oxide
layer must be treated and removed in order to minimize series
resistance.
There are several methods for removing the oxide layer. These
include chemical treatment, an electrical discharge that breaks
down the oxide barriers, and boiling water immersion. The
chemical treatment consists of a short soak in dilute hydro-
fluoric acid or preferably ammonium bifluoride, which leaves
less residue that might be humidity sensitive. The electrical
method utilizes a capacitative discharge through the oxide barrier
from the contact to the underlying silicon. The boiling water
immersion, while the most simple, is not too effective. None
of these techniques are very satisfactory. While good fill
!actors may be achieved, the results are not very consistent
and the resulting cells are somewhat humidity sensitive. Generally,
the cells revert to their original carve shape after humidity
exposure.
In view of the problems with humidity,it became necessary to
develop a firing technique for available contact materials
that yielded good curve shape without subsequent operations.
3.8 FRONT METALLIZATIONS
Five categories of silver conductor metallization were screened
for their suitability as the front contact metallization. These
categories were commercially available,modified conductor com-
positions, modified frit conductors, diluted and modified frit
conductors and customized frit conductors.
-18-

Among the large variety of commercial products tested, six
produced a fair I-V curve shape. (Table 4).
Table 4
FAIR COrM7ERCIALLY AVAILABLE MATERIALS
1. E.I. Dupont 70952. EMCA Ag 923. ESL Type 5904. Engelhard A2921 Mod. 025 (no
longer available but may beobtained by diluting theirE4 39A)
5. Thick Film Systems A256-a 50/50blend of their standard 3345 andfritless silver A250
6. Transene 50
The optimal firing time and temperature for the above six
materials is about twenty seconds at 7000C. Both Dupont
7095 and Transene 50 were eliminated from further tests becauseof the lack of firing consistency and series resistance problems,
respectively.
The second category of front metallizations tested was the mod-
ified conductor composition. Four modified compositions were tried:
1. Elemental antimony added to TFS A2562. Elemental antimony added to ESL Type 5903. Powered bismuth added to Dupont 70954. Titanium Hydride added to Dupont 7095
Elemental antimony was added in the first two cases in the hope
that the low temperature ant imony - silver eutectic (440 0C) would
help to eliminate the series resistance problems previously en-
countered, and induce a deep junction at the metallization site.
No improvement over previous compositions was realize'.
-19-

In the third case powdered bismuth was added to the Dupont 7095.
This resulted in a catastrophic loss of curve shape due to
excessive shunting and was extremely sensitive to the firing
temperature.
The final modification of a titanium hydride added to Dupont
7095 was tested because it was thought that after decomposition
of the titanium hydride n t a relatively low temperature, the
hydrogen, in its atomic state would break down the oxide on
the silicon surface and facilitate metal-silicon bonds. The
decomposition of titanium hydride is slow up to 350 0C, then begins
to accelerate in the range of 350-450 0C. Between 4500C and
550 00 almost all of the hydride will be decomposed. This mod-
ification, however, did nothing to improve the characteristics
of the fired paste. Even when the hydride was applied directly on
top of the diffusion glass, the results were still negative.
Ohmic contact through an oxide glass appears to be an insoluble
problem with.. this composition, however, it appears that spin-on
diffusion sources can be fired in nitrogen to yield an N+ region
and a surface silicon nitride. This nitride serves as a reason-
ably good AR coating and can be contacted directly without ex-
cessive series resistance.
The third category of the silver conductor metallizations is the
modified frit conductors. The frit conductors used had phos-
phorus and antimony oxides added to the stardard frit conductors.
This was done to aid in the prevention of junction shunting and
to decrease the sensitivity to chances in the firing time a..:
temperature. The use of antimony in the frit composition, was
thought to be especially advantageous, because of the potential
for oxidation-reduction reactions at the silicon surface. Both
the phosphorus and antimony oxides used in the frit compositior.+
came from standard spray-on diffusion sources. The use of both
of these oxides resulted in a definite improvement on the paste
performance in both the prevention of junction shunting and the
-20-

decrease of sensitivity to changes in the firing time and tempera-
ture. The most effective materials tested were Transene
n-diffusol and Emulsitone #773 (Antimony source). The followinq
formulations performed well:
a. E.I. DuPont 7095 + Emulsitone 0773
b. E.I. DuPont 7095 + Transene n-diffusol
C. ESL Type 590 + Emulsitone #773
d. ESL Type 590 + Transene n-diffusol
e. TFS A256 + Transene n-diffusol
The fourth category of silver conductor metallizations is the dil-
uted and modified frit conductors. Cermalloy 4450, one of the
commercial materials that was judged unsatisfactory, was diluted
to one half the original frit content and modified with Emulsitone
#773. Prior to dilution, the curve shape was pla g ued by high
series resistance. After dilution modification by addition of
the F:.ulsitone source, firing characteristics similar to those
observe for the DuPont 7095 resulted.
The fifth and final of the silver conductor metallizations locked
at were the customized frit conductors. A glass with a -::)w
fusion temperature,that had been used in another program as an
insulator,was used as the frit. This frit had the following mole
percent composition of the following elements:
Na 2014.2
L'_ 2 0 4.3
NaF 10.0
P 2 0 55.7
B2 0 342.9
Si0 222.9
This frit wa y found to be equivalent to some of the best com-
mercially available products. It also had an excellent tolerance
for firing time variations.
-21-

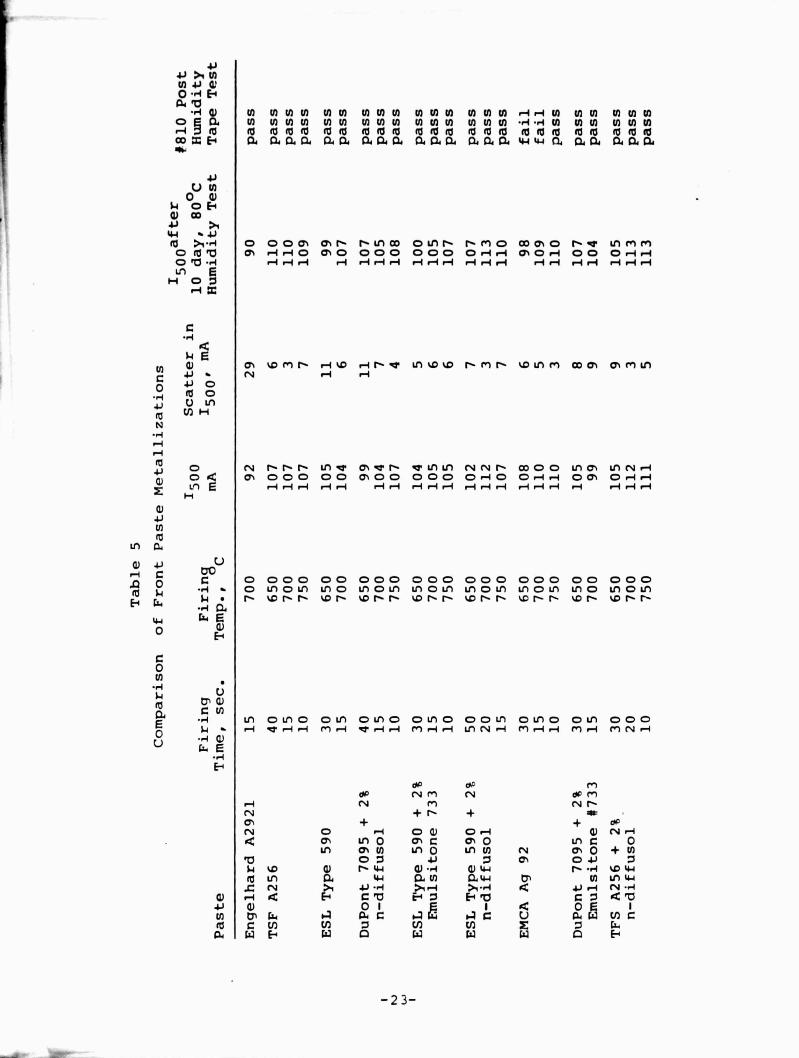
After the tests were completed on the front paste metallizations
that were developed in the above five categories, a selection was
made of the most promising front paste materials. A small lot of
cells was made using these selections. The results of this
test are presented in Table 5. All firings were done i n an arti-
ficial air atmosphere with a coarse screen pattern. Both Thick
Film System A256 + 2% n-diffusol and ESL Type 590 i 2% n-diffusol
appear to show the best performance. TSF A256 with Tra.isFne n-
diffusol was selected for the front contact paste r.arerial,
because of its thixotropic properties. The compene.,ts of the
thick film system paste remain in solution, therefore giving the
paste a long shelf life. The paste also turns into spreadable
liquid when exposed to isothermal shearing stress.
3.9 MINIMUM CELL THICKNESS
The limiting factor in using screen printed contacts with thin
cells is the warpage caused by the expansion differential be-
tween aluminum and silicon. Cells as thin as 2^ to 3^ mils
can be manufactured with acceptable yields, however, these cells
had a slight curvature. Cells which are 1^ to 2^ mils thick
may be printed without breakagre, but the firing frequently re-
sults in wafer fracture unless the perimeter is reinforced with
greater silicon thickness.
3.10 DIELECTRIC ISOLATION
Five commercially available dielectric pastes were tested during
the program. One of these pastes was selected for use on the
wraparound cell configuration. The pastes tested were Thick Film
Systems 1126RCB, 1126 1124, Electro Science Labs Type M-4023-B
and Trarsene Type 980. All of the pastes were screened onto the
back surface field side of the wafers using an actual pro-
duction size screen. The wafers were separated into two
-22-
1> >, NN +1 G,'
O •14 Fas 10
•H v N mom Mm N N N MMM N N N H H N N N N N N
O a N N N N N N N N N M N N U1 MM • rl •r+ N N N MOM
r-+ ro ro rororo ro ro rororo rororo rororo rororo roro rororo00x F a aaa as aaa a a a aaa Wua 04 as aaa
uN0 v
i4 o E+C1 mw 4-)ro H O 000n m r r Ln00 0Ln r r MO CC) m0 r y if) MM
0 ro a m ri r1 0 m o 0 0 0 0 0 0 o ri ri m o ri o 0 O r1 r4O ro • rl ri r -4 ri r-1 ri r-1 H ri ri r1 r4 ri r-I ri r-q ri r-1 r-1 r-I ri
L1 F•,H O
^+ x
C
a^E
N Q1 a% LD M r r4 ^o ri r -01 Ln %C Lo r M r ^o Ln M co m an M Ln
1-1 . N vi ri
0 O
U Lnro to H
N
ri
r-1O N r r r Ln -Cr a% a r V Ln Ln N N r CO 0 0 Lf1 Cn Ln N r1
O Q Cn OOO 0 ITOO 000 Ori O OHri 00) Or--I r1
L'1 rz r4 r-1 r1 r-I r1 r-1 r-I r-1 r-i r1 r-1 r1 ri r1 r1 H r1 r1 ri r1^ HvyJ
Nro
to CL
v u0 000 cc 000 000 0oo 00o 00 coo
b0 •ri O Ln o Ln Ln CD Ln o Ln U) o Ln Ln o Ln Ln o Ln Ln c) Ln o Ln
H w w r ^crr ^cr err Corr Corr err ^r v^rr-. r., a
44 w E
o vH
C0N
r-I U
^4v
roC N1 Ln OLno OLn 000) 000 CDOLn OLno OLn coo
O ^ r-I ^ r-1 r-1 M r-1 ^ r-1 r1 M r1 r-i Ln N r1 M 4 r-1 M r1 MN r1
u GL E.14H
do Mdo N M N dC M
ri N M N rN + r +Cr + + orN O r-i O v 0-4 v N ri
rn Ln 0 m C rn O Ln C OLn m N Ln 0 Ln N N m O + N
't7 O ::1 41 : LT O 4.) Z►4 Lo v r W v • 1 Q1 W r •rl %o Wro U a W a N aW N Ln w.0 N >, • r•1 -4 >, -4 h` 4-1 r-I N -4
v -1 a E Cb r a Fro C a Q 'D
LU1 0 w .a a C ►a k- ra G U a W cn Cro C V) UJ 7 Cn Ul Csas w F w n w w w n E-
.
-23—

groups, one for single printing and firing and the other for
double printing and firing. The ideal printing method used the
following sequence: (1) print on dielectric paste, (2) allow
the paste to level for 10 minutes, (3) dry for ten minutes at
1250C, (4) fire in air for 5 minutes over a temperature range
of 5500C-6500C, and (5) repeat steps one through four for those
wa.ers that will be run through the process twice. After the
firing was completed, a conductive silver epoxy was applied .o
the dielectric surface for isolation measurements. Table 6
is a compilation of electrical measurements for each paste and
firing temperature.
The Thick Film Systems1126RCB paste appears to be superior to the
others tested. Although both the single and double printing and
firing tested good at 550 0C for both types of Thick Film Systems
1126, double coatings are preferable for filling in pinholes
and eliminating shunting effects.
3.11 PROCESS SEQUENCE USED FOR NON -WRAPAROUND CELLS
The process sequence shown in Figure 1 has been developed during
this contract. All process steps have been optimized and sim-
plified using the information gathered during this program.
In view of the program Is success in researching the back etch step,
work was completed to see if the front etch step that removes
the phosphorus glass layer on the surface could similarly be
investigated.
Normally, prior to screen printing the front contact pattern, the
phosphorus glass layer, grown during the diffusion, is removed
by etching in a dilute solution of hydrofluoric acid. It was thought
that if the glass frit in the paste could wet the phosphorus
-24-

Table 6
Dielectric Isolation Measurements
Single Printing
oC
i 550 575 600 625 650- TFS 1126 RCB G GB GB B GB
ESL Type M 4023-B GB GB GB GB GB
Transene Type 980 B B B B B
TFS 1126 G GB GB GB B
TFS 1124 B B B B B
Double Printing
TFS 1126 RCB G G G G G
ESL Type M 4023 -B G G G G G
Transene Type 980 B GB GB GB GB
TFS 1126 G G G G G
TFS 1124 B GB GB GB G
G = Good (greater than 20 megohms)
B - Bad (less than 20 megohms)
GB = combination of good and bad
Each measured point is a minimum of 8 samples
-25-

ITi
•S
5
E
NaOH Damage Print BackRemoval Etch Metal Contacts
^Texturizing Dry BackEtch Contact Paste
+Phosphorous N4
Fire Contact
Diffusion Pastes
Apply Etch Mask Dice to
to Wafer Fronts 2 X 2 cm Size
HF Strip Oxide Clean andfrom Wafer Backs Dry Cells
Remove Apply Ta 05Etch Masking AR Coating
Print AluminumBake Cells
Paste on Backs
^T IDry Aluminum Apply Etch Mask
Paste on Backs to Fronts
Alloy Aluminum Apply Etch Mask
La,.-ef to Backs
E` c ffa Clean N.askingAluminutat from Cell Edges
17 Dip to Remove
Remove Oxide Etch Masking
I
Print FrontBake Cells
Metal Contacts
Dry FrontTest Cells
Contact Paste
Figure 1
Process Sequence for Conventional (Non-Wraparound) Cells
-26-

glass layer and dissolve it into a solution, then the HF step
could be eliminated. An experiment was performed to test this
theory. Three groups of cells were screen printed with the front
silver paste. In the first group, the glass layer was left un-
touched, the second group had the glass layer partially removed,
and the third group had the glass layer completely removed. The
experiment showed that the cells which were HF etched had better
outputs, therefore showing that that this step could not be re-
moved from the process sequence. The curve fill factors and open
circuit voltages were also somewhat higher. The short circuit
currents were satisfactory for all three groups. The group
that was processed with the glass layer left intact had a higher
series resistance. Firing of the silver paste was done at
7000C in air. Twenty seconds was found to be the optimum time
to produce good fill factors. Table 7 lists the average output
values found for each group for a 20 second firing time.
This program also investigated the cause of the scatter in open
circuit voltages found from time to time between lots in the
process sequence of the paste back surface field supposedly pro-
cessed in identical ways. One possible variation in the processing
has been the cooling rate of wafers when they are removed from
the aluminum alloying furnace. An experiment was designed to
test the apparent effect of the cooling rate on the back surface
field.
Identically diffused wafers were divided into two groups. One
group was back etched prior to the aluminum paste BSF processing.
The other group was processed without removing tte diffused layer.
Each of these groups was divided into three sub-groups to permit
the use of three different dwell times during the alloying cycle.
All cells were alloyed at 9000C in artifical air. Ten, fifteen,
and twenty seconds were used for the alloying times. Half of
the wafers withdrawn from the furnace as rapidly as possible,
and the other half withdrawn very slowly.
-27-

Table 7
HF REMOVAL OF PHOSPHOROUS GLASS LAYER
Voc Isc 1500(mV) (MA) (mA)
Group 1 598 140 116(no phosphorous glass removed)
Group 2 603 136 122(partially removed)
Group 3(completely removed) 604 141 127
-28-

The wafers were processed into 2 x 2 cm cells by etching away
the metallic aluminum layer with hydrochloric acid, screen printing
and firing a standard silver paste front grid pattern, dicing to
size, and applying electron-beam evaporated Cr-Pd-Ag back contacts.
It was found that the wafers which were not back-etched had markedly
higher open circuit voltages when removed rapidly from the furnace,
regardless of the dwell times. Wafers which had been back-etched
exhibited higher values of V oc for wafers that were removed
slowly. The poorest Voc values were found for non-back-etched
wafers that were alloyed for twenty seconds and then withdrawn
slowly. These data are shown below:
Group A (Back-Etched)
Dwell TimeSlow Removal Fast Removal
Average Voc (mV) Average Voc(mV)
10 sec. 578 584
15 sec. 594 577
20 sec. 593 576
Group B (Non-Back-Etched)
Dwell TimeSlow Removal Fast Removal
Average Voc (mV) Average Voc(mV)
10 sec. 573 602
15 sec. 595 600
20 sec. 566 600
A fast removal of the wafers has been incorporated into process
sequence because of the results obtained in the experiment.
Work was also completed on refinement of the acid etch step to
remove the excess aluminum from the back surface. A comparison
was made between hydrochloric acid and sodium hydroxide treatment.
Completed kCl etched cells showed a loss in V oc indicating that
some of the back surface field effect was lost. The cell out-
put at the maximum load point was low and very poor fill factors
were found.
-29-

Cells that received the NaOH treatment were better in V andoc
CFF. Figure 2 is the curve obtained for a NaOH treated cell.
Series resistance was measured and a typcial result is shown
in Figure 3. This value is still somewhat high, but is better
than previous values obtained.
3.12 TEST RESULTS FOR NON-WRAPAROUND CELLS
One hundred conventional (non-wraparound) cells were fabricated
using the process sequence developed under this program. The
cells were fabricated using starting wafers that were approxi-
mately 57 mm in diameter. Two 20 x 20 mm cells were potentially
possible from each wafer. The process sequence, along with
the yield for each operation is shown in Table 8. The mechanical
yield going into the electrical testing was 82%. After electri-
cal testing 50% of the cells were over 136 efficient. The cells
obtained from this lot provided sufficient quantities for delivery
to the NASF.-Lewis Research Center, as well as the quantities
required for the environmental tests that were required.
A group of thirty cells was randomly selected for the electrical
performance tests from the finished cells. These cells were
assigned serial numbers one through thirty. The cells wer tested
electrically in simulated AMO sunlight using a Spectrosun6
Mark
III Solar Simulator. The cells were tested at a test block
temperature of 28 0C. The simulator was adjusted to the proper
intensity level using a Standard Cell (No. 1037). Every sixth
cell was tested for series resistance. Table 9 presents the
electrical performance data and the average values for all thirty
cells. Figure 4 and Figure 5 give the I-V plots for a re-
presentative cell (No. 6). These plots were used to establish
the cell performance and the series resistance. After these
performance tests, the thirty cells were boxed and shipped to
the Project Manager at NASA-Lewis Research Center.
-30-

L PAGE rsOI i n QUALITY
s 100
790
r
- 6 0
r Q 5C
ZW!Y
u 4C
6Ct
Nx
7C
3C
2:
1C
0
__^ Figure 2 -
I-V Characteristics for
Sodium Hydroxide Etched Cell
^1 1 1 1 I I I 1 .Y
1 I ^- 1—_
--- -- --- - —=
,=`4
1
^ I
SOLAR CONVERTER E I CURVE
SPCCTROLAB 0 C FORM ]O::
1 S : L V A e CALIFCF'.:A DJ.TE
^ ^-.CJECT.-^M3•-20)Z^ISERIAL NO. _ --
x CELL _ MODULE _ PANEL DESIGNATION: —
-SOURCE: DSUN q TUNGSTEN XENON_ COLLIMATED ILUNCOLLIMATED
TEST TEMP.: __*_S -C -FTEST NO. PROC. NO.
- ISC = _ v0C -PMD- 8V^-L•
--
—
--
-
-- --_ - --- t
- —-— -
—- -
-'
' - - -'^t
0.1 0.2 0.3 0.4 0.5 0.6 0.7
VOLTAGE (VOLTS X— l—)

100
90
^- 8 0
70
6C
N^x
-}- 5cz
zW
U 4C
3C
2C
110
OA 0.2 0.3 0.4 0.5 0.6 0.7
VOLTAGE (VOLTS X._ f)
I-32- U1. l 4, ..,:1 Y
I^
I ' I- JJ^i J J_ _1.1_L -L _ 1_ I I
1
Figure 3 rI _
Cell Series Res; :`,, fte -(N&OH Processe 11) r
I 1 J I
I 1 ^ ^ ^ ^ -^-i1! 1 _1 ' 1 J JI -I^^ I I ^1
I
r ^ 1
—'1_ — _ '
I 1 1
' ^-' n^^ -I
_ II
11 1
li J^-'^ i J
J l l_
I I
11
^-
- 'I_^
J-III
1'- -I-= I L I I -^ 'i_
^It--
^ I I
I^ 1 1 I
-
I
^'
I I
I JI
I I I I '
I^ 1 J ^1 1 1 -
i — I
II1
I 11 I
I ,JJ
4-H I I
-- II I
III
1I I I I
I I1 I I
-; I
i-^ ^
I I
_1_4 -1 JJ !
I -^ ^ II I, ^^ ^•
1 1 - I I
-!1
^I
1-1 '
'—--
--
__
1 I till I I I - _ —_ -1 1 1 1 1— I
i —'-_-- ' I ^, 1 1 I
I
^ 'I I
I I
1 1I
1 11 ITI
I
I
I1
I^ ^-1^^III
11
1 1 1 1
1I' I
'^_ 1 1 I II -^^l
V-1 1 I,, 1 ,I I I _
+7-
I I- - -
1-^-- - 1
--
_ffAL E I STAII
II_ psi
1, I I
II I 1, 1
i I—
1
—
I
I I
Jill
I
I
-
1
. , --- I I I I^ 1 I
FIE
SOLAR CONVERTER E I CURVE
SPECTROLAB p C FORM 3:,'l
_ sVLMAR. CALIFORNIA DATE:
PROJECT fNAS f ^^^^^
- SERIAL NO.J g CELL :D MODULE 2 PANEL DESIGNATION:
- N AQ.A_
SOURCE: q SUN q TUNGSTEN ^XE1JONCOLLIMATED 31 UNCOLLIMATED
TEST TEMP.: C--C -'FTEST NO -PROC. NO.Itc^ Voc--
^PM.p- 8Y
--1- -
I
II till I1
j^
I I I 1
I I
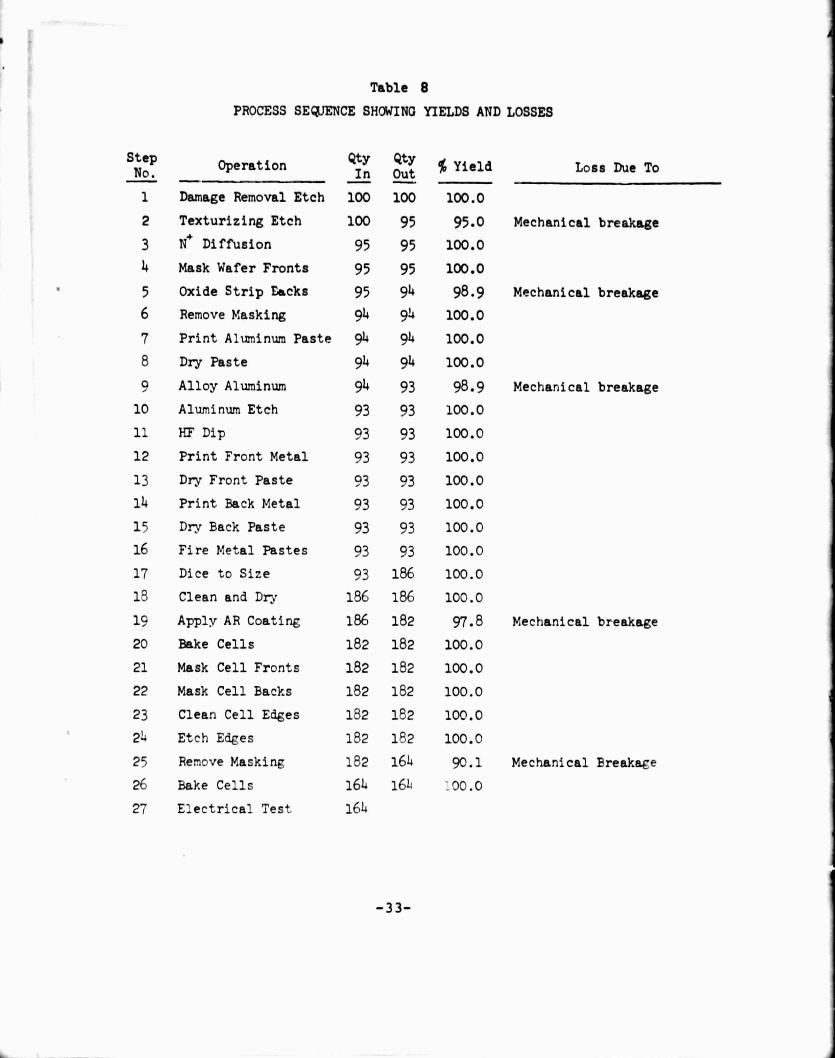
Table 8
PROCESS SEQUENCE SHOWING YIELDS AND LOSSES
Step OperationQIn Out
% Yield Loss Due To
1 Damage Removal Etch 100 100 100.0
2 Texturizing Etch 100 95 95.0 Mechanical breakage
3 N+ Diffusion 95 95 100.04 Mask Wafer Fronts 95 95 100.0
5 Oxide Strip racks 95 94 98.9 Mechanical breakage
6 Remove Masking 94 94 100.0
7 Print Aluminum Paste 94 94 100.0
8 Dry Paste 94 94 100.0
9 Alloy Aluminum 94 93 98.9 Mechanical breakage
10 Aluminum Etch 93 93 100.0
11 HF Dip 93 93 100.0
12 Print Front Metal 93 93 100.0
13 Dry Front Paste D3 93 100.0
14 Print. Back Metal 93 93 100.0
15 Dry Back. Paste 93 93 100.0
16 Fire Metal Pastes 93 93 100.0
17 Dice to Size 93 186 100.0
13 Clean and Dr; 186 186 100.0
19 Apply AR Coating 186 182 97.8 Mechanical breakage
20 Bake Cells 182 182 100.0
21 Mask Cell Fronts 182 182 100.0
22 Mask Cell Backs 182 182 100.0
23 Clean Cell Edges 182 162 100.0
24 Etch Edges 182 182 100.0
25 Remove Masking 182 164 90.1 Mechanical Breakare
26 Bake Cells 164 16 1. 00.0
27 Electrical Test 164
-33-

Table 9
ELECTRICAL PERFMIAIICE TEST DATA FOR NgN-WRAPAROUND CELLS(AMO Illumination at 28 C)
E Cell voc Isc Pmax 2 Calc. Calc. RseriesNo. (mV) (mA) .(mw/cm ) Eff.(%) CFF (ohms)
j 1 590 157 17.90 13.2 .77 ----
2 590 159 18.04 13.3 .77 ----
3 591 158 17.82 13.2 .76 ----
4 594 164 17.70 13.1 .73 ----
5 590 157 17.95 13.3 .77 ----
6 591 160 17.81 13.2 .75 0.19
7 591 157 17.86 13.2 .77 ----
8 591 158 17.70 13.1 .76 ----
9 591 158 17.73 13.1 .76 ----
10 594 167 17.95 13.3 .72 ----
11 594 164 18.17 13.4 .75 ----
12 594 165 18.08 13.4 .74 0.36
13 592 159 18.00 13.3 .77 ----
14 592 16 :o 17.85 13.2 .75 ----
15 501 157 17.46 12.9 .75 ----
16 590 167 17.87 13.2 .73 ----
17 591 150, 16.03 13.3 .77 ----
18 590 159 18.13 13.4 .77 0.20
19 591 157 17.98 13.3 .70 ----
20 592 158 18.01 13.3 .77 ----
21 500 156 17.82 13.2 .77 ----
22 592 157 17.93 13.3 .77 ----
23 591 160 17.60 13.1 .75 ----
24 502 150, 18.25 13.5 .78 C.18
25 595 162 18.00 13.3 .75 ----
26 592 162 15.15 13.4 .76 ----
27 593 159 19.07 13.4 .77 ----
28 591 159 18.04 13.3 .77 ----
29 593 160 17.91 13.2 .75 ----
30 591 164 18.12 13.4 .75 0.25
A •.. 591.7 159.9 17.03 13.3 .75ci 0.236 (5 cells)
-34-

r
iC0
9C
+ 8C
7C
6C
N !^
IK
f- 5C
vH2WfYcr
u 4C
3C
2C
1C
0
VIUI .I `, is(W I l k) .•Y -35-
IT-
4
-11 T4 T-jTA
Figure 4
I-V Characteristic Curve forRepresentative Screen-Printed Cell."
-
^-1 - - - -__^
_T41
""''1
Z
LL: - -^_= - -- - - - -=--- --
- --- - ---
SOLAR COKVERTERE I CURVE ` V 591 mVoc
SFECTROLAS p C FORM ao:l Isc = 163 mA —
SYLMAR. CRLIFOR%iA DATE ^^ _z^i'7^ P = 17.61 Ii;W/cm2 --11L(/I^ S Z- 2or2 Ce m
PROJECT:_ n = 13. 2%SERIAL NO. t-VIC
yI _ MODULE L-'PANEL DESIGNATI CFF = .75
^--— -
- _--- - --- --
- - '---- - -- ---- -.-- -_-
'SOURCE: q SUN GTUNGSTEN '-605ENON.y/
_ COLLIMATED .JU NCOLLIMATEOTEST TEMP.- z?i_'C_ 'F'-T^
eTEST NO.
PM V - ar_
- 1
t
0.1 0.2 U.3 0.4 0.5 0.6 0.7
VOLTAGE (VOLTS X- 1 )

-36-
100
90
86
70
i60
N
K
L d 50C
Z
W
Q'
U 40
30
20
10
ONIGINAT. i'.".rTI? IS
J, F,.=via - - I - - -- J' -
_^ 1 ^^ I I I I ,
I^^
-^I
4-1 f ^
_
1 , 1 I + II I I
I
I Rl
_
17- I^ I 1 I
^J
Ir' , 1^_I I^ I 1
^T1 1 .^ ^ IJ -:
_ I I II _ i _ _ 1 - 1 ' __ _ __^ ^_ II I ^ ^ 1 I ^ 1 I
'- I I, I I I I' ^ II l l l
I_^1 V I I I I I I I I I I _J I
Figure 5I
Series Resistance MeasurementCurves for Representative Screen-
-- Printed Cell-- ^ I I 1 1 f^rt- 1
r -I^^'^
i 1
1^
I^ _
J
-I 'f,
I-H I
_!_- _I I I
I
I I I; a - I^ I I
I, I I I I
'^ I J1 ^
^^_I
' 1
Y' •_1J ' ^
JI-1
I I I I' '' I I' _^-. - - I
^ `(
^ IitI
I I I I I I I I I
I ^
I I I I I
It II I I I I I"
--'-- I
I 1 I, I 1 1 I I I ^ I' I 1I ' I 1 I I 1 I
' - I - I^ 1 ,,
I. I I I I I
^j I,^^-! ^
,_
I.
II I i
^I^ I ^ I I ^ I I
iI I I
I
I II
I1 1
-_-I
_ 'T1 1 I II
^ ^
I1 1 _-+-
1
1j I I I ^ 1 i I I I I
I
_I 1 I I
I ^ I I -^! I I '
I I I '
I1 - II I I I I I I I I I I
1 P I I Ii
1111
11
• I I I
-
I I I ^ I 1 I I' ^- I I I I I I I I
' _H7 I 1 77 ' I
I I I I I I I
IL 11t I I
SULAR CONVERTER E I CURVE
_ SPECTROL-AB 0 C FORM 3C'l
SYLMAR. CALIFORHI/A DATE: X4-79,PROJECT:-- //,4.S 2 0 r2 (e -
SERIAL NO. -' — RS = 0.19 0'
ELL ] MODULE G PANEL DES GNATIO - —_
2 X 2 4,, Ce n W .,,i I-
1 I I I
I
SOURCE: 0SUN q TUNGSTEN LI(ENON
J COLLIMATED NCOLLIMATED
TEST TEMP.. 2 •C •F
-TEST NO. PROC. NO-Sve, X037LIst- V /,^
/f
'PMD- BY
I I I
I I
I
1
0.1 0.2 0.3 0.4 0.5 0.6 0.7
VOLTAGE (VOLTS X 1 )
e`4

Ten cells were randomly selected from the f
inclusion in the boiling water tests. The red
for electrical performance at AMO and 2Fc
immersed in boiling deionized water for ,y
a one minute bake on a hot plate at apF nd
tested again at A.MO and 28 0C. The elect_ ad
before and after the boiling water treatme d in
Table 10. Unexpectedly all ten cells disp_ vement
' in output power and curve shape after the b The
cells were then passed through a standard t, esting machine
using Scotch Brand #600 tape. There was nc of loss of
the AR coating or front metallization, how 3entifying
penciled numbers were removed from the ce ne tape.
A representative before and after I-V se- is shown
in Figure 6. The cells were boxed and s _he Project
Manager at NASA-Lewis Research Center.
Twelve randomly selected cells were se or inclusion in
the high temperature and high humidit These cells were
tested under a solar simulator at 28 (I-V curves were
plotted for each cell. The cells we n boiling D.I.
water for ten minutes, baked on a t- r one minute at
approximately 375 0C and tested agF _ells were placed
in a chamber at 800C and 90% (mir ve humidity for a
period of ten days, after which e tested within a few
hours of removal from the chambe. w.Ll,uut any attempt to dry
them.
The cells were then given a one minute bake on a hot plate at
375 0C and tested again. Unfortunately these tests cannot be
compared with the three earlier tests, :s ince routine maintenance
had been performed on the simulator, resulting in a slight change
in the red/blue ratio of the source. The curve fill factors,
however, can be compared since they are not spectrum dependent.
-37-

}ii
Table 10
ELECTRICAL PERFOWANCE BEFORE AND AF'T'ER 10 MIN. BOILING WATER IVERSION
Cell Voc(mV) Isc (mA) P
max (mW/cm2)
Calc. Eff. Calc. CFFNo. Before After Before After Before After Before After Before After
B-01 591 592 157 158 16.97 17.76 12.5 13.1 .73 .76
B-02 591 592 159 162 16.93 17.78 12.5 13.1 .72 .74
B-03 594 594 156 157 17.40 18.14 12.9 13.4 .75 .77
B-05 592 592 156 157 16.49 17.82 12.2 13.2 .71 .76
B-07 591 592 154 156 15.68 17.72 11.6 13.1 .68 .76
B-09 590 591 154 156 17.19 17.85 12.7 13.2 .75 .77
B-12 591 591 155 156 16.82 17.84 12.4 13.2 .73 .77
B-16 591 595 161 163 16.88 18.74 12.5 13.9 .71 .77
B-21 502 594 158 160 16.79 18.31 12.4 13.5 .71 .77
B -23 591 592 152 154 16.27 17.55 12.0 13.0 .72 .77
I
-38-

-39-
iI
I _-
-
- I I I
I III I^ 1
!
^
I I
I I.
^ X
I t 1
1
1 1 1 1
I I 1 -
' I, I
1 ^I ._j;
1 I
I I
I I
I 1 _^
II^
I I
1 1I I _ I i
I
--
- -
^ II I
I1^
! ^^
+4.;J^^
I I I
I
II - 1 I^. 11 I I
^-1 ' -^ I I I I ^17
4iA II 1 1 I I^ I I I I
'- -
--- --
I I- I I III I I I I' 11
j^^T
I
OT--- _-^- I I
!
IT I
1 I1III I
-1-^
II I I T i
_--- I ^ I II I I
^I I
I^ ! I
II I I1
1-r-
II I I - _I 1
1^I
^1' I
--- I i f I
_ I
Figure 6
I-V Characteristic Before andT--- ^ I I I ^--After Boiling Water Immersion
(Typical Cell)—;
— Before - -
AfterI
-1I I
-J-J,
,-, -
— T1 it - ^—
l i I I I I
-- - -I I I i t ^ I I
I I I I
I I I ^
-- I I I
I-- --
----
i-
-
II
I
^ I I
1 ( I I
I
II
I^ I I `
I
-- 1^ ^
I
I
I
I
I ^1 1 ^ 1
--I ^^ ^ I I I I I I
. 1 I I I I I I ^I I
-I I
I I----- - I I I I I
SOLAR CONVERTER E I CURVE I Before AfterSPECTROLAB Q C FOR:, 0031 ^Voc 590 591 mV
_ SYLMAR. CALIFORNIA DATE: — I sc 154 156 mA -
PROJECT: /V1 % rf^ 3 - !O^LC; Pmax 17.19 17. 85 mW/cm 2 —
SERIAL N0.
%/ CELL --'MODULE PANEL DESIGNATION: • n 12.70 13.19%
I
_SOURCE: GSUN [:-TUNGSTEN//TEN _
I =COLLIMATED II/'UNCOLLIMATED —
_TEST TEMP.: 'C 'F
TEST N0. PROC. NOSEw57
Isc=--- L Voc-
Prep- BY ]C 1 __- I
—
! I I I
000.5 0.6 0.70.1 0.2 111 U.4
VOLTAGE (VOLTS X 1
100
90
80
7C
6C
NjII
X
It 5C
HZ4J
U 4C
3C
2(
1(

The changes noted here can be attributed to the one minute bake
on the hot plate after the humidity tests. The cells were sub-
jected to the water boil and bake treatment and tested again.
These data are presented in Table 11. The point where the simu-
lator was cleaned is indicated by a dashed line in the "Test
Condition" column. Figures 7 and 8 are typical I-V curves for a
single cell. All cells exhibited an improvement in curve shape
after the first boil/bake cycle. After the temperature-humidity
chamber test, all cells had improved short circuit currents,
little or no change in open circuit voltage and a degradation in
curve fill factor. The second boil/bake cycle yielded little
change in performance from that found after the cells had been
baked following removal from the temperature-humidity chamber.
It should be noted that all values of V oc and I sc were measured
using a digital volt meter readout, rather than obtaining these
values from the I-V curves themselves.
After all electrical testing was complete, all cells were tape
peel tested using Scotch brand #600 tape in a conventional tape
test machine. One cell was broken during these tests, but the
front contact metallization of all cells appeared to be unaf-
fected by the temperature-humidity storage and the repeated
boil/bake cycles. Back contacts appeared to have a slightly
more "pepper and salt" look after the tape peel test, however,
no obvious metallization was removed by the tape, even though
the tape removed the identifying pencil number from the backs
of the cells.
To assure that the scatter in cell performance was actually
the result of cell variation and not caused by test rixture con-
tact problems, the following test was performed. One cell was
chosen at random from the completely finished lot. This cell
had not been screen tested. Three I-V curves were taken of this
cell. The cell was taken completely out of the test fixture and
-40-

Table 11
Temperature - Humidity Test Data
Cell Test voc Isc Pmax Calc. Calc.No. Condition (mV) (mA) (64/cm2) Eff.(%) FF
01 Initial Test 592 159 17.16 12.7 .73Post Boil/Bake 595 160 18.44 13.6 .77Post Temp/Humidity 593 165 17.41 12.9 .71
Pre-Boil/Bake 594 166 18.25 13.5 .74Post Boil/Bake 594 164 17.94 13.3 .74
02 Initial Test 590 156 15.40 11.4 .67Post Boil/Bake 591 156 16.85 12.5 .73Post -TempZHumidity 589 161 15.53 11.5 .66
Pre-Boil/Bake 592 161 16.60 12.3 .70Post Boil/Bake 593 160 16.33 12.1 .69
03 Initial Test 592 159 17.64 13.0 .75Post Boil/Bake 593 160 18.25 13.5 .77Post Temp/Humidity---------------
592 165 17.88 13.2 .73
Pre-B2il/Bake 593 164 17.78 13.1 .73Post Boil/Bake 593 164 17.78 13.1 .73
04 Initial Test 586 154 15.81 11.7 .70Post Boil/Bake 589 155 17.03 12.6 .75Post Temp ,!Hx.idity---------------
58°• 160 16.04 11.9 .65
Pre-Boil/Bate 591 159 18.41 13.6 .78Post Boil/Bake 591 158 18.41 13.6 .79
05 Initial TeF' 590 153 16.26 12.0 .72Post Boil/Bake 592 154 16.99 12.6 .75Post Temp/Humidity 590 161 16.26 12.0 .68
Pre-Boil/Bake 594 157 16.51 12.2 .71Post Boil/Bake 593 156 16.51 12.2 .71
06 Initial Test 590 157 17.37 12.8 .75Post Boil/Bake 592 153 13.12 13.1^ .77Post Temp/Humidity---------------
591 163 17.37 12.8 .72
Pre-B^Al/Bake 593 162 18.05 13.3 .75Post BAl/Bake 592 162 17.81 13.2 .74
07 Initial Test 539 155 16.G1 12.5 .7'»Post B_il%Bake 502 156 17.80 13.2 .77Post/Hui-idity-Temp 589 161 16.57 12.2 .70
Pre-Boil,/ Bake 593 159 17.64 13.0 .75Post Boil,/Bake 592 159 17.43 12.0 .74
03 Initial Test 591 156 15.75 11 .6 .6^
Post Boil/Bake 591 157 17.17 12.7 .74PostTemp/Humidity 590 162 15.19 11.2 .64-
Pre-Boil/Bake 594 161 16.01 11.8 .67Post Boil/Bake 593 160 16.49 12.2 .70
-41-

Table 11 ( cont' d)
Temperature - Humidity Test Data
Cell Test Voc Isc Pmax Calc. Calc.No. Condition, (mV) (mA) (mw/cm Eff.(%) F'F
09 Initial Test 589 160 17.16 12.7 .73Post Boil/Bake 592 162 18.25 13.5 .76Post -TempZHumidity 590 164 16.46 12.2 .68
Pre-Boil/Bake 594 164 17.84 13.2 .73Post Bnil/Bake 593 164 17.84 13.2 .73
10 Initial Test 582 153 14.63 10.8 .66Post Boil/Bake 585 154 16.03 11.8 .71Post Temp/Humidity 585 158 14.84 11.0 .64
Pre-Boil/Bake 588 157 15.52 11.5 .67Post Boil/Bake 588 157 15.52 11.5 .67
11 Initial Test 593 162 17.08 12.6 .71Post Boil/Bake 595 164 19.05 14.1 .78Post Temp/Humidity----------------
593 168 17.28 12.8 .69
Pre-Boil/Bake 595 166 17.22 12.7 .70Post Boil/Bake 592 166 17.22 12.7 .70
12 Initial Test 589 150 15.87 11.7 .72Post Boil/Bake 589 153 16.93 12.5 .75Post-Temp/Humidity 589 156 15.87 11.7 .69
Pre-Boil/Bake 592 156 16.10 11.9 .70Post Boil/Bake 592 154 16.35 12.1 .72
Av. Initial Test 589 156 16.42 12.1 .71Post Boil/Bake 591 157 17.58 13.0 .75Post Temp/Humidity---------------
590 162 16.39 12.1 .69
Pre-Boil/Bake 593 161 17.16 12.7 .72Post Boil/Bake 592 160 17.14 12.7 .72
i
-4:-

0.1 V.z U.3 U.4
VOLTAGE (VOLTS X 1
0.5 e.6 0.7
100
^T 90
+- 8C
r
- d 5C
ZW
u 4C
6C
N
7C
3C
2C
1C
I 1 I ^^ _
jJL
y, I _I_ _
I I
T # -I^
-1 I ,^^T K7
'-- ^11
II
I
41 -II
PostHumidity
Ej' J I
y I_ 1 I I _
7
-'
I I JI
^^
1 II
I II I
^r I
_I
__ i—L _
I^^- 11 i
_'_
I I
-'-T1 1
' I I1 I
I I
^.^
_T i _TI
I i^I
I I
-4I^^_I 1^i I I
I
i 1—
I I I I J ! JJ^I^ I I
I ! --^-
I I^I
JI ^ ^ ^ i
I I J ! I _ _
^^- II
PostBoil/Bake
1 ^=^ I ^ I
J_ _ ^J I ^ I I ^ I^
I 1 ^ ^ I ^ ^
—_^ ^^ —'^I I 1 ^—
Initial
IFigure 7
Cell Performance Before and AfterTemperature - Humidity Storage ;1
1 1 1 ^ I'
.- --
^ I I i 1- I 1 -- I-
-I
Ii I ^ I I I 1 I I I
I
I
I I ^
I I I I I I I I I
TEMP./HWIDITY TESTSI1
Post PostInitial Boil/Bake Humidity --
I I^voc (mv) 590 592 590
I sc (mA) 153 154 161
P (mw/cm2 ) 16.26 16.99 16.26MCalc.Eff. 12.0 12.6 12.0
Cale. CF'F .72 .75 .68
—I
--
— - I —1 I I-- - —
I II I I ^
—
LII
I I I I
SOLAR CONVERTER E I CURVE
SPECTROLAB 0 C FORM 311
sYLMAR. CALWOR'JIA DATE'
PROJECT:- S 3
-SERIAL NO.— S "-
31-CELL D MODUL r] PAN L DESIGNATION:
SOURCE: q SUN q TUNGST EN I^J'^(ENON
COLLIMATED ^!'GNCOLLIMATED
TEST TEMP.:---?—`C.-- 1— 'F
ST' I^^^ _TEST N0. -_ _PROC. N0._^-
Isc- Voc-
-
-^—--
- --- ---- - - 1----
I I
1 , ,,
I
T` I -I 1 I '^_ —i I I--
11'may
1 1 I
0 . I
-d'A-

0.1 0.2 0.3 0.4 0.5 0.6 0
VOLTAGE (VOLTS X.—i —)
0
I
Figure 8
Cell Performance Before and AfterPost-Humidity Boil/Bake Cycle
till
-fill
-
-IIi
-1+1- M44 I-
- Before_ Boil
-/Bake
1-7 ' ^-{
BoilAfter
I I
/Bake
I- i
^, I
I _
, I
NOTE: Simulator was cleaned prior _! to both of these I-V tests,
thus slightly changing the red-to-blue ration from the value used forthe earlier curves on this cell.
I I . . . , , . . , i . . i . 1 . , . 1 . 1 1 1 1 /-1
POST TEMP./HUMIDITY TESTS
Before AfterBoil Bake Boil BEke
Vol(mV) 594 593
Isc(M)157 156
IDjmW/cm2 ) 16.51 16.51
Calc. Eff. 12.2 12.2
Calc. CFF .71 .71l $1
II ^
all_yl
I I I
_T_ 7
- ; I I ^ I ISOLAR CONVERTER E I CURVE
SPECTROLAB o c roRm 3ooi
I SYLIll CALIrORNIA DATE: 9- -?g'
PROJECT: Noq s3 - zo GSERIAL N0.
^. V6ELL q MODULE 0 PANEL DESIGNATION:2X Y o"(6641(SOURCE: q SUN q TUNGSTEN U ENON
q COLLIMATED OKNCOLUMATEO
TEST TEMP.: at, 6C 'FTEST N0. PROC. NO?Sl! X11_7
Isc- ci. -va _ ssrPMO- Br Q/^ s8T
I I I
I II I
I
- —
3C
2C
Ic
. 5CvZW
u 4C

replaced each time. The cell was retested three times again
in a different fixture. The I-V curves for all six measurements
were reproducible and identical. All of the cells used for the
temperature-humidity test were shipped to the NASA-Lewis Program
Manager.
Five cells were randomly selected for the thermal shock tests.
I-V curves were made for each cell under a solar simulator at
28 O and AMO. The cells were loaded into a basket and immersed
in the boiling water for thirty seconds. The cells were transferred
over a period of sixty seconds to boiling D.I. water and
immersed in the boiling water for thirty seconds. The cells
were transfe r red back to the liquid nitrogen over a period of
thirty seconds and immersed in the liquid nitrogen for thirty
seconds. This cycle was repeated for fifteen times after
which the cells were again tested electrically as before.
The cells were tape peel tested using Scotch brand #600 tape.
No contact failures were found, although the tape removed the
identifying pencil numbers from the cell backs. The data ob-
tained is listed in Table 12. These cells were also shipped
to the NASA-Lewis Program Manager. It should be noted that
these thermal shock tests were somewhat more srvere than those
required by the contract Statement of Work. Figure 9 shows a
typical I-V curve obtained during these tests.
Tests were also completed on the measurement of the sheet resis-
tance of the front contact metallization. Initially, an attempt
was made to evaluate the sheet resistance with a four point probe
technique, but the resistivity was too low to permit reliable
readings. Therefore a printing screen was designed to allow
measurement of the voltage drop over a long (72.0 cm) continuous
0.25 mm wide contact printed on a 2 inch round silicon wafer. The
Cartesien coordinate diagram used for generating the test pattern
is shown in Figure 10. This pattern was made up in two screen
-45-

f Table 12
Thermal Shock Test Data
Cell Test Voc Isc max 2 Calc. Calc.No. Condition (mV) (mA) (mW cm ) Eff.(%) FF
19 Before Thermal Shock. 591 156 17.82 13.2 .7719 After Thermal Shock 588 156 17.82 13.2 .78
20 Before Thermal Shock 591 159 16.45 12.2 .7020 After Thermal Shock 591 159 16.96 12.5 .72
21 Before Thermal Shock 593 160 18.16 13.4 .7721 After Thermal Shock 593 16o 18.38 13.6 .77
22 Before Thermal Shock 592 160 17.73 13.1 .7522 After Thermal Shock 592 160 18.19 13.4 .77
23 Before Thermal Shock 587 158 16.15 11.9 .7023 After Thermal Shock 587 159 17.34 12.8 .74
Averages:
Before Thermal Shock 591 159 17.26 12.8 .74After Thermal Shock 590 159 17.74 13.1 .76
-46-

0.1 0.2 0.3 0.4 0.5 ♦. G 0
VOLTAGE (VOLTS X— 1
0
^ II I
,, J I I 1 - -t - -
-
- ,- 1 II I 1
-y ^, I., I ,^ ^ 11
1
*, I I 1
-II I ^
i 111 I
I1^ II-
i1^ .
1
?_711
I-^ --H1
1 I 1
JI J 4 ,
_I
J^-rill1 1
After
1 1
4-J^
---1-- _ I I 1 1_ -^ + -_ I I _I i1
1 1 1 I 1 1 1
Before
I I I
_T
.1
,
_ I_
=7-
I I
-- , ----
1 1 I,II I
I^ I I
_ i i II
I I II
i-yI
T I-I
I Ir I I I i I
-T ^^^^I I I I
" T1 - f^ II I ^ I - ^ ' II I1
I I I -
Figure 9
— Typical I-V Curve Obtained Before andAfter Thermal Shock 1
I
I
-_.
-
1 1 I I ^_'
4I
^
II ,I I I
, ^ I 1 1 I 1 _ I^ I-^- ' -
1I I 1 1 1 11 I I, 1 1. I
THEWAL SHOCK TESTS
— Before After
v (mV) 592 592ocI (mA) 16o 160
Pm (mw/cm2 ) 17.73 18.19
Ca1c. Eff. 13.1 13.4
Ca1c. CFF .75 .T1
T-I i
I -
74-
1I l
I
y
1 ^
I I _
- i I
-SOLAR CONVERTER E I CURVEI
_ SPECTROLAB 0 C FORA! 30:1R• 2 ] • >^_ jYLMAR. CALK p RYIA DATE- ?' ?-
PROJECT:_ NisSERIAL N0.
_
/NNEL E)GNATION:CELL ] MODULE q PA^Z2x CA1 ( I •
- 1
^—
=-r-— -
-- r—
^
SOURCE: q SUN q TUNGGSSTTEN L`rJCENON
_ COLLIMATED t d !UNCOLLIMATEDCTEST TEMP.: 'C 'F
TEST NO.1
PROC. N0.' '{ /103
Isc- /, VOC- fs
PMO- By
^^ 1
I
1 -^
+ 20
10

Ow
N
Figure 10
Cartesian Coordinate M agr= fora Front Contact Metallization Test Pattern
(each division equals 0.25 =)
-48-

mesh sizes !200 and 325) using a 22 0 screen orientaticn to
minimize the possibility of wires in the screen coinciding with
openings in the pattern.
A test metallization was printed on dummy silicon wafers that
had been etched and texturized exactly the same as those usea
for solar cells. The paste used was identical to that found
to give the best results to date for a screen printed solar
cell, namely Thick Film Systems A256 with Transene n-diffusol
added. The screen printed paste was dried for 15 minutes at
1500C and fired for 20 seconds at 700 0C. Line thickness was
established using a Taylor-Hobson Talysurf-4.
Current leads were soldered to the end tabs of the pattern
and voltage leads to the adjacent inner tabs. Measurements
of current and voltage, along with the physical dimensions
gave average values of specific resistivity of 5 to 6 x 10⁻⁶
ohm-cm for t;ie fired metallization. Because of time and funding,
this investigac_)n was not extended to include measurements
of other paste systems or other drying and firing schedules.
3.13 PROCESS SEQUENCE USED FOR WRAPAROUND CONTACT CELLS
The process sequence used for the wraparound cell configuration
is exactly the same as the conventional sequence shown in Figure 1
on page 26. r.fter alloying the aluminum, however, the aluminum
oxide powder was removed to reveal the metallic aluminum layer
which was left in place. It was decided, because of immediate
availability, to use the dielectric screens on hand for printing
the wraparound isolation layer. The wafers were wax mounted on
dummy silicon wafers and diced to 2 x 4 cm. This permits
cutting clear through the wafers leaving a square edge which is
better geometrically for wraparound printing than a scored and
broken edge.
-49-
J

Two layers of Thick Film Systems #1125RCB dielectric glass were
printed on the solar cell. Only the second layer wrapped around
the cell's edge. The cells were then dried and fired in turn.
x
After ink masking all of the cell except the front face, the
cells were etched in hydrofluoric acid tc remove any possible
oxide layers prior to applying the screen printed contacts. After
removing the ink masking, the contact metallization was screen
printed., applying first the front surface wraparound gridlines,
drying them, printing on the back contact pads, drying them, and
then firing both simultaneously. The contact paste used was the
same as used on the conventional cells, namely Thick Film Systems
A256 tho had been doped with Transene n-diffusol solution. Lot
0 was printed using a gridline screen pattern that was on hand (ithad been used on Contract No. NAS3-20029 4 ), since the screens made
up previously for this contract were found to have a design error.
This older screen produced gridlines having a width of about 0.25
mm and had a density of three lines per centimeter. Redesigned
screens were received in time for use on Lots 1 and 2, so the
gridlines on these lots were about 0.13 to 0.15 mm wide and had a
density of four lines per centimeter.
After firing the contacts, the cells were AR coated with Ta205
and then cut in half to yield two 2 x 2 cm cells. The cells were
ink masked and edge etched. After stripping the ink masking,
they were baked and tested.
3.14 TEST RESULTS FOR WRAPAROUND CELLS
Three lots of wafers were processed into 2 x 2 cm wraparound
contact cells using the process developed under this program.
Thick Film Systems #1126RCB dielectric qlass was used for the
isolation layer. The cells were screened for electrical per-
formance at 28 0C under AMO illumination. It was found that
-50-
11

while nearly all of the cells exhibited open circuit voltages
and short circuit currents similar to those of the conventional
cells processed earlier in the program, nearly all of the I-V
curves were characterized by relatively low curve films factors.
Using a cutoff of 10% conversion efficiency, a group of cells
was assembled from the three lots for shipment to the NASA-
Lewis Research Center. Sixty-five percent of the cells had
over ten percent efficiency. Cells were also assembled for the
boiling water and thermal shock environmental testing. Table
13 presents the data for the 25 wraparound contact cells shipped.
Tables 14 and 15 present the data for the boiling water and
thermal shock tests, respectively. Those cells subjected to the
environmental tests were tape peel tested with Scotch Brand #600
tape with no failures. No temperature humidity tests were under-
taken because of the lack of time and funding.
Cyr
-51-

Table 13
Data for Representative Screen Printed Wraparound Contact2 X 2 cm Silicon Solar Cells With Dielectric Isolation
Max. Par.
Cell Voc IscDensity
(mW cm2 )Calculated Calculated
No. (mV) (mA) Efficiency Curve Factor
0 -01 596 1,T8 15.99 11.30 .6o
0-02 6ol 173 15.98 11.81 .61
0 -07 591 168 15.o4 11.11 .6o
0-10 583 164 14.65 10.82 .58
0 -13 595 167 15.14 11.19 .61
0-15 592 167 15.63 11.55 .63
o-16 592 168 16.89 12.48 .68
0-17 591 167 16.30 12.05 .66
P-18 592 170 14.82 10.95 .59
O -19 589 167 15.74 11.63 .64
0 -20 589 168 14.58 10.77 .59
0 -21 591 170 14.80 10.93 .59
0-27 588 168 14.61 10.80 .59
0 -28 588 165 15.51 11.46 .64
1-08 587 171 15.44 11.41 .61
1-10 592 168 14.74 10.89 .59
1-11 592 172 15.91 11.76 .62
1-14 598 171 15.09 11.15 .59
1-15 589 168 14.78 10.92 .60
1-16 587 166 14.62 10.80 .6o
2-01 592 161 15.50 11.45 .62
2-02 502 172 16.73 12.36 .67
2-04 503 172 16.47 12.17 .64
2-o6 585 170 15.05 11.14 .6o
2-16 587 170 15.:x= 11.74 .6-)
Av. 591 16a 15.41 11.3c) .62
NOTE: 1) Above values of open circuit voltage and short circuit currentare not derived from the I-V curve but are read separately.
2) Lot 0 printed with six grid lines per cell with approx. .010"line widths. Lots 1 and 2 printed with eight grid lines per celland approx. .005" line widths.
-52-

Table 14
Data for Boiling Water Test of Screen PrintedWraparound Contact Silicon Solar Cells
Max.Pwr.
Cell Test yoc IscDensity
Calculated CalculatedNo. Condition (mV) (mA) (MW/cm ) Efficiency Curve Factor
1-01 Initial 585 161 14.62 10.8 .62Post Boil --- --- ----- ---- ---Post Etch* 584 161 14.00 10.3 .60
1-02 Initial 592 171 14.70 10.9 .58Post Boil 593 171 14.02 10.4 .55Post Etch* 591 17r) 14.52 10.7 .58
1-04 Initial 592 170 12.94 9.6 .51Post Boil --- --- ----- ---- ---Post Etch* 593 170 12.58 9.3 .50
1-05 Initial 591 155 11.87 8.9 .52Post Boil 593 155 11.14 8.2 .48Post Etch* 591 155 11.55 8.5 .50
1-07 Initial 591 162 14.77 10.9 .62Post Boil --- --- ----- ---- ---Post Etch* 588 161 13.57 10.0 .57
Av. Initial 590 164 13.78 10.2 .57Post Boil --- --- ----- ---- ---Post Etch* 589 163 13.2+ 9.8 .55
NOTE: 1) Test consisted of immersing cells in boiling deionized water forten minutes and drying. Cells were measured before ("initial")and after immersion ("post boil"). Three cells indicated short
after boiling. All cells were then edge etched and tested againto yield the "post etch" data marked (*).
2) All cells were tape peel tested with Scotch brand #600 tape afterthese tests with no failures.
f
-53--
J

ANTable 15
Data for Thermal Shock Test of Screen PrintedWraparound Contact Silicon Solar Cells
Max.Pwr.
Cell Test vo2 IseDensity
Cale. Cale.No. Condition (mv) (mA) (mk' cm2 ) Eff.(%) CFF
0-03 Initial 594 167 13.04 9.6 .53After Thermal Shock 594 166 14.46 10.7 .59
0-08 Initial 589 169 13.47 10.0 .54After Thermal Shock 591 l68 12.99 9.6 .52
0-26 Initial 593 169 14.22 10.5 .57After Thermal Shock 593 158 12.54 9.3 .54
0-30 Initial 593 168 13.59 10.0 .55After Thermal Shock 593 168 13.59 10.0 .55
0-32 Initial 592 167 13.89 10.3 .56After Thermal Shock (Cell Broken Prior to Retesting)
1-12 Initial 594 173 14.43 10.7 .56After Thermal Shock 594 171 13.52 10.0 .53
1-13 Initial 594 169 14.30 10.6 .57After Thermal Shock 594 168 13.69 10.1 .55
2-11 Initial 593 172 13.89 10.3 .54After Thermal Shock 5q3 171 13.06 9.7 .52
2-12 Initial 591 173 12.97 9.6 .51After Thermal Shock 592 170 12.56 9.3 .50
2-17 Initial 585 171 13.93 10.3 .56After Thermal Shock 585 170 12.70 9.4 .51
Av. Initial 592 170 13.90 10.3 .55After Thermal Shock 592 163 13.23 9.8 .53
NOTE: 1) Test consisted of immersion in li quid nitrogen for 30 seconds andthen in boiling deionized water fcr 30 seconds, a cycle which was re-peated fifteen times with a transfer time of 60 seconds from bath
to bath.
2) All cells were tape peel tested with Scotch brand 0600 tape withno failures.
54

4.0 FURTHER TECHNOLOGICAL DEVELOPMENT
4.1 FRONT SURFACE METALLIZATION
Due to the skyrocketing costs of silver it is imperative that
an alternative front surface metallization material be developed
that has similar characteristics. The cost of the front surface
metallization was the only objective laid out at the beginning
of the program that was not achieved. The silver paste costs
upward of thirteen cents for 60 cm rather than the objective
of five cents for 60 cm stated at the beginning of the program.
Work on non-silver metallizations was looked at during this con-
tract, but no material tested proved satisfactory. The copper and
nickel conductive pastes that were purchased from the Transene
Company resulted in extremely poor I-V characteristics, and the
aluminum-silicon alloy and molybdenum aluminum alloy pastes
tested were also poor performers.
Work currently being done by Milo Macha of Sol/Los Inc. in the
Low-cost Solar Array Project under contract with Jet Propulsion
Laboratory Inc. shows promise for meeting the cost goals that
tnis program has laid out. He is working on a Molybdenum-tin
titanium alloy. This work shows promise for the future as a cost
effective alternative, because both molybdenum and tin are roughly
one twenty-fifth the cost of silver and the titanium used in
the alloy is only present in quantities of one part in ten thousand.
4.2 MINIMUM CELL THICKNESS
There was a minimum of effort devoted to finding the minimum cell
thickness that can be successfully screen printed. Further work
in this area needs to be accomplished in order to better define
the problems associated with the difference in expansion coeff-
icients between aluminum and silicon. Once the thermal mismatch
problem and the mechanical interaction of the screen printing
machine with the wafer are understood, work can be initiated to
minimize these effects.
ift
-55-

5.0 CONCLUSIONS
An optimized screen printed contact system for both conventionali and wraparound cells was established during this contract. All
parts of the process sequence were looked at in order to make the
most cost effective cell. Thick Film Systems silver paste A256
with Transene n-diffusol was selected as the front surface metal-
lization that had the best over-all characteristics. Frit content
not exceeding five percent and a firing temperature not exceeding
I 700°C were determined as the optimum characteristics for this
E
paste. Thick Film System #1126RCB was selected as the best di-
f electric isolation. It was found that a double coating was pre-
ferable for filling in pinholes and eliminating shunting effects
even though both the double and single coats were judged good in
the tests. Work on the back surface field preparation sequence
showed that the oxide etch before the alloy step showed no noti^-e-
able effect on efficiency and therefore could be considered optional.
Work was also completed investigating the cause of the scatter in
open circuit voltages found from time to time between lots of cells
where the paste back surface field was supposedly processed in
identical ways. Cells that were removed slowly showed a markedly
poorer performance than the ones that were removed fast. A fast
removal has been incorporated into the process sequence. Wafers
with a bulk resistivity of 9 to 14 ohms were used for all cells.
Wafers that had a resistivity of 7 to 9 ohms were found too sensi-
tive to the mechanical processes that are associated with screen
printing. Investigation into the appropriate gridline density
has shown that eight to ten lines per centimeter is the optimum
number that allows additional shallowing of the junction.
The minimum cell thickness that could be successfully screen
printed (with acceptable yields) was about 2^ to 3^ mils. Cells
1^ to 2^ may be printed without breakage, but the firing frequently
results in wafer fracture unless the perimeter is reinforced with
greater silicon thickness.
-56-

Conventional cells, fabricated under this contract, were able
to withstand the conventional Scotch tape peel test, storage at
88B or and 909 relative humidity for ten days, a ten minute immer-
sion in boiling water, and thermal shock consisting of fifteen
cycles from -196 0C to +100 0C at a 20 0C minute rate without loss
of adhesion. Wraparound cells, fabricated under this contract,
were able to withstand both the thermal and boiling water tests,
but a lack of funds and time prevented any testing at high temper-
ature and high humidity.
Both the conventional and wraparound cells produced on this con-
tract compared favorably with cells produced in the past
with the old batch processing methods. The optimized screen
printing process developed in this program shows great promise for
application to the mechanized production techniques that will be
required on the Solar Electric Propulsion System (SEPS) and the
Satellite Solar Power System (SSPS). With the implementation of
the process sequence developed under this program, cost could be
greatly reduced.
-57-

6.0 REFERENCES
1. Elms, R.V., Jr., and Young, L.E., Eleventh IECEC, pp 1372,
Sept., 1966
2. "Satellite Solar Power Station", Spectrolab Report Q-71098,
Nov., 1971
3. Tavlor, W. E., "Demonstration of the Feasibility of
Automated Silicon Solar Cell Fabrication", Topical Report,
NASA Lewis Research Center, Contract NAS3-18566,
NAS CR-134981, Oct., 1975
4. Thornhill, J. W., "Automated Fabrication of Back Surface
Field Silicon Solar Cells with Screen Printed Wraparound
Contacts", Final Report, NASA Lewis Research Center,
Contract NAS3-20029, NAS CR-135202, Aug., 1977
-58-
Copyright © 2022 FDOKUMEN