OCCASION This publication has been made available to the ...
-
Upload
khangminh22 -
Category
Documents
-
view
1 -
download
0
Transcript of OCCASION This publication has been made available to the ...

UNITED NATIONS INDUSTRIAL DEVELOPMENT ORGANIZATION Vienna International Centre, P.O. Box 300, 1400 Vienna, Austria
Tel: (+43-1) 26026-0 · www.unido.org · [email protected]
OCCASION
This publication has been made available to the public on the occasion of the 50th
anniversary of the
United Nations Industrial Development Organisation.
DISCLAIMER
This document has been produced without formal United Nations editing. The designations
employed and the presentation of the material in this document do not imply the expression of any
opinion whatsoever on the part of the Secretariat of the United Nations Industrial Development
Organization (UNIDO) concerning the legal status of any country, territory, city or area or of its
authorities, or concerning the delimitation of its frontiers or boundaries, or its economic system or
degree of development. Designations such as “developed”, “industrialized” and “developing” are
intended for statistical convenience and do not necessarily express a judgment about the stage
reached by a particular country or area in the development process. Mention of firm names or
commercial products does not constitute an endorsement by UNIDO.
FAIR USE POLICY
Any part of this publication may be quoted and referenced for educational and research purposes
without additional permission from UNIDO. However, those who make use of quoting and
referencing this publication are requested to follow the Fair Use Policy of giving due credit to
UNIDO.
CONTACT
Please contact [email protected] for further information concerning UNIDO publications.
For more information about UNIDO, please visit us at www.unido.org

tlfl ····1 \}~·::R;:;:;;:' !=(::.==.::::::.:::,::;: h:,:;::k::::;t:·=>:::;: =D-b=;;;lopment Organization
Industrial Feasibility
Studies
2 I -=·7:·=· q·. I ~--.:::· .. ::····
.. - -~·
CONCRETE BUILDING
PANELS AND CONSTRUCTION
Of HOUSES IN CHILE
CHl/033/ M/94-10
Office - Milan

UNIDO
FEASIBILITY STUDY FOR A PROJECT OF
INDUSTRIALISED PRODUCTION OF CONCRETE BUILDING PANELS AND
CONSTRUCTION OF HOUSES IN CHILE
JUNE, 1995
LIST OF CONTENTS
CHAPTER1-EXECUTIVESUMMARY
1.1 Project background and basic idea
1.2 Presuppositions of the Feasibility Study
1.3 Reference Production Programme Table 1-1 - Reference Production Programme
1.4 Market analysis and marketing strategy Table 1-2 - Selection of products (house types) to be marketed Table 1-3 - Production Programme (data per year)
1.5 Raw material and supplies
1.6 Location and site
1. 7 Environmental protection
1.8 Technology and equipment
1.9 Organisation
1.10 Human resources
1.11 Implementation planning
1.12 Financial appraisal
1.13 Conclusions of the Feasibility Study and Recommendations
1.14 Additional statements and information 1.14.1 The new Construction Master Plan 1.14.2 The Government-supported construction programmes and the present trends
towards a better quality. 1.14.3 The definition of "prefabrication" 1.14.4 Products and quality standards of local competitors. The possibility of producing
panels for third parties 1.14.5 Miscellaneous issues regarding building quality standard, which could have an
impact on the Project 1.14.6 Some notes on architectural features
CHAPTER 2 - PROJECT BACKGROUND AND BASIC IDEA
2.1 Project objective
2.2 Project idea
2.3 Suitability of local environment for the Project idea
2.4 Project Promoter or Initiator
2.5 Project History
7
7
7
7 8
10 13 14
14
15
15
16
18
19
20
20
21
21 21
21 23
23
24 25
26
26
26
26
27
28
2
2.6 Basic characteristics of the Project and their impact on the Feasibility Study 28
2.7 Preparatory studies and related investigations 29
CHAPTER 3 - MARKET ANALYSIS AND MARKETING STRATEGY 30
3.1 Salient features of the construction sector in Chile 30
3.2 Data and projection methods for market analysis 31 3.2.1 Data 31 3.2.2 Demand forecasting method 31
3.3 Determination of market size for houses 32 3.3.1 Size and composition of present effective demand 32
Table 111-1 - Unsatisfied housing requirements by income class, 1992 33 Table 111-2 - Yearly annual housing needs, 1995 34
3.4 Estimate of the market development and of the expected market share for the Investors 35 Table 111-3 - Housing construction programmes 3S
3.5 Main characteristics of the housing market 36 Table 111-4 - Recent evolution of the housing market structure, 1989-1994 36 Table 111-S - Housing Units, by Government Programme 37 Table 111-6 - Comparison between Unified Subsidy Programme and private market prices 37
3.6 Outline of the marketing strategy 38
3.7 Government Housing Programmes 38
3.8 Housing supply 40 Table Ill- 7 - 1994 Investment in housing and infrastructure 41 Table 111-8 - Housing construction in Santiago M. R. and Fifth Region 41 Table 111-9 - 1992 Census - Urban Housing (Number in '000) 42
3.9 Identification of products to be marketed and sales programme 42 Table 111-10 - Reference Production Programme 43 Table 111-14 - Production and sales programme (data per year) 44 Table 111-11 - Direct Costs for Construction of Houses (dedicated personnel included) 4S Table 111-12 - Reference Production Costs of House - Simplified method 46 Table 111-13 - Selection of products (house types) to be marketed 47
3.10 Estimate of sales/revenues 48 Table 111-15 - Sales revenues selected for the financial analysis 48
3.11 Estimate of marketing costs 48
CHAPTER 4 - RAW MATERIAL AND SUPPLIES 49
4.1 Raw materials and semifinished products needed to produce concrete panels in the plant 49
4.2 Data and alternatives; cost estimate 49 Table IV-1 - Raw materials for the production process at factory S4 Table IV-2 - Raw materials for in-yard assembling SS Table IV-3 - Raw materials for in-yard assembling S6 Table IV-4 - Raw materials for in-yard assembling S7 Table IV-S - Raw materials for in-yard finishing S8 Table IV-6 - Raw materials for in-yard finishing S9 Table IV-7 - Raw materials for in-yard finishing 60
3
CHAPTER 5 - LOCATION, SITE AND ENVIRONMENT ASSESSMENT
5.1 Site Selection Figure V-1 - Project Area
5.2 Climatic characteristics Figure V-1 - A possible location of the factory Figure V-2 - Detailed plan of a possible location of the factory
5.3 Roads and other traffic connections
5.4 Environmental impact 5.4.1 General situation of the environmental sector in the Country 5.4.2 Waste owing to the Project implementation
5.4.2.1 Concrete mixing equipment washing water 5.4.2.2 Sewer water 5.4.2.3 Waste treatment plants costs 5.4.2.4 Pollution standards
CHAPTER 6 - ENGINEERING ANO TECHNOLOGY
6.1 Scope of the Project
6.2 Technology selection
6.3 Production Programme 6.3.1 The production in the factory
Figure Vl-1 - Manufacturing flow lines 6.3.2 Assembly and sealing in the building yard 6.3.3 The house finishing
61
61 62
63 64 65
66
67 67 68 69 69 69 69
70
70
70
71 71 72 73 73
6.4 Technology and equipment 73 6.4.1 Production factory equipment 7 4 6.4.2 Yard-use equipment 82 6.4.3 Additional transport means from the factory to the yard and yard erection equipment 82 6.4.4 Direction premises 83
6.5 Equipment cost
6.6 Factory lay-out Table Vl-1 - Main Equipment Supply Figure Vl-2 - Main factory buildings Figure Vl-3 - Machinery lay-out
6.7. Civil engineering works
6.8 Analysis of compatibility of the proposed technology with local building regulatory standards
6.8.1 Standards to prevent fire risks 6.8.2 Thermal insulation standards 6.8.3 Seismic standards 6.8.4 Standards for the usage of prefabricated panels.
CHAPTER 7 - ORGANIZATION AND OVERHEAD COSTS
7.1 Organisation
7.2 Overhead Costs Table Vll-1 - Overhead Costs (Personnel)
83
83 84 85 86
87
88 89 90 90 91
92
92
93 94
4
CHAPTER 8 - HUMAN RESOURCES 95
8.1 Personnel at the factory dedicated to production 95
8.2 kl-yard assembling personnel 96
8.3 Total personnel requirements 96
8.4 Cost of the required personnel 97 Table V/11-1 - Production Personnel, Dedicated 98 Table V/11-2 - Human Resources 99
CHAPTER 9 - IMPLEMENTATION PLANNING AND BUDGETING 100 Table IX-1 - Planning of Implementation of Activities 101 Table IX-2 - Factory Implementation 102
CHAPTER 10 - FINANCIAL APPRAISAL 103
10.1 Investment costs 103 Table X-1 - Investment costs 104 Table X-2 - Fixed Investment Costs 106
10.2 Operation costs 107
10.3 Sales and revenues 108
10.4 Costs and Sales 108
10.5 Project financing 108
10.6 Financial results 108 10.6.1. Net income statement: 108
Table X-3 - Nominal Sales Revenues 109 10.6.2. Cash Flow 110 10.6.3. Working Capital Requirements 110 10.6.4. Sensitivity analysis 110
ANNEX 1 - TYPICAL COMPOSITION OF LIQUID WASTE FROM THE FACTORY 111
ANNEX 2 - OFFER FOR CEMENT SUPPLY 112
ANNEX 3 - CHILEAN HOUSE CHARACTERISTICS IN THE RANGE OF LOW AND MEDIUM INCOME 113
ANNEX 4 - CHILEAN HOUSE CHARACTERISTICS IN THE PRIVATE SECTOR (MEDIUM-HIGH AND HIGH INCOME RANGES) 114
ANNEX 5 - CHARACTERISTICS OF HOUSES PRODUCIBLE THROUGH THE PROPOSED TECHNOLOGY 115
ANNEX 6 - COMFAR OUTPUT TABLES 116
5

ACRONYMS AND USEFUL DATA FOR AN EASY READING OF THE REPORT
Fifth Region: GDP: GNP: Metropolitan Region: MIDEPLAN:
MINVU:
M.R.: peso:
UF:
USP: VthR: VR:
The region including Valparaiso and Vina del Mar Gross Domestic Product Gross National Product the region including Santiago Ministerio de Planificacion y Cooperacion (Ministry of Planning and Co-operation) Ministerio de Vivienda y Urbanismo (Ministry of Housing and Urbanism) Metropolitan Region local Chilean currency. 1 US$= 400 pesos, at the date of local data analysis and collection (April 1995). Rate adopted in the study "unidad de fomento" - Reference cost unit applied in the construction sector. 1 UF= 29 US$ at the date of local data analysis and collection (April 1995). This rate has been adopted through the whole study. Unified Subsidy Programme Fifth Region Fifth Region
6

CHAPTER 1 - EXECUTIVE SUMMARY
1 .1 Project background and basic idea
The background of the Project is the international experience gained by lntertransports Centre SpA, in the civil building construction field. lntertransports Centre SpA decided to verify the possibility of implementing a new project in Chile, utilising a special industrialised pre-fabrication technology which may allow a low construction cost also for high standard houses, provided the manufacturing factory utilisation factor is maintained at very high levels.
1.2 Presuppositions of the Feasibility Study
The Feasibility Study has been carried out on the basis of the following presuppositions, to be considered as the starting point of the Study. These presuppositions not have been discussed, nor have they been verified with a view of a possible Project optimisation:
- partners of the Company; - machinery and structures necessary for the endowment of the production factory and
for the following phases of housing assembly, as well as their costs for the Project; - production process and sharing of the factory production among the several building
types (see point 1.3); - organisation of production; - sharing of investment costs between the foreign currency (for supply from Italy) and
local currency (for supply from Chile) equal to 85% and 15% respectively of the total investment cost.
On the basis of such presuppositions, the activities carried out within the framework of the Feasibility Study have involved in particular:
- the analysis of market trends, and the market forecast for the products in question; - the verification of availability at the site of all raw materials and of man-power
necessary for the operation of the factory and for the successive phases of production; - the verification of the cost of raw materials and of man-power; - the verification of possible law or regulation constraints susceptible to prevent a
successful outcome of the Project; - the analysis of the financial profitability of the Project.
During the implementation of the Study, the production programme initially foreseen by the Entrepreneurs has been partially modified (see point 1.3).
1.3 Reference Production Programme
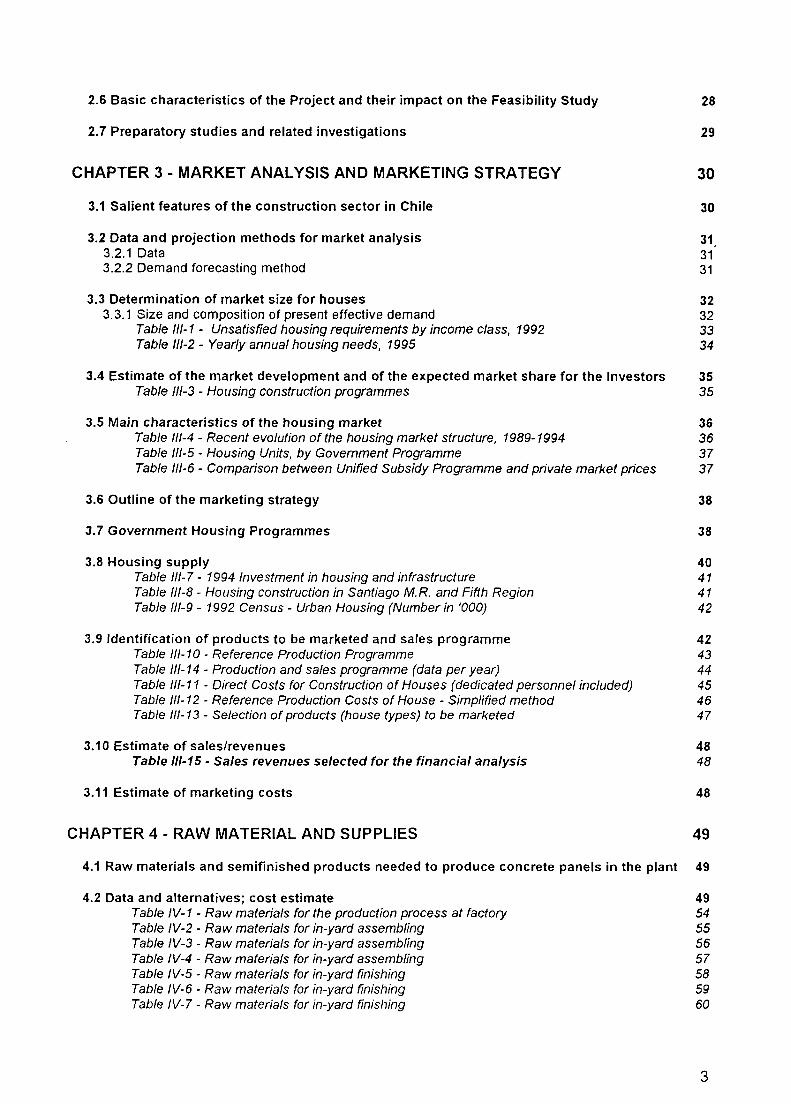
The factory for industrialised fabrication of building panels and structures has been designed so as to allow the production capacity shown in Table 1-1 (in the report, mentioned as Reference Production Programme).
7

INTR0101.XLS N°3
YEARLY PRODUCTION I m2/unit n° units/building n° buildings tot units total m2
A IH 40/B type 40.40 1 150 150 6,060 IH 40/28 type 40.40 2 200 400 16, 160
total A 350 550 22,220
B two-floor, two-units type 118.80 2 54 108 12,830
c four-floor, sixteen-unit building 90.00 16 18 288 25,920 (4 units/floor; ground floor+ 3 floors; balcony excluded)
-- --
----
total A+ B + C 422 946 60,970
OJ
Table 1-1 - Reference Production Programme
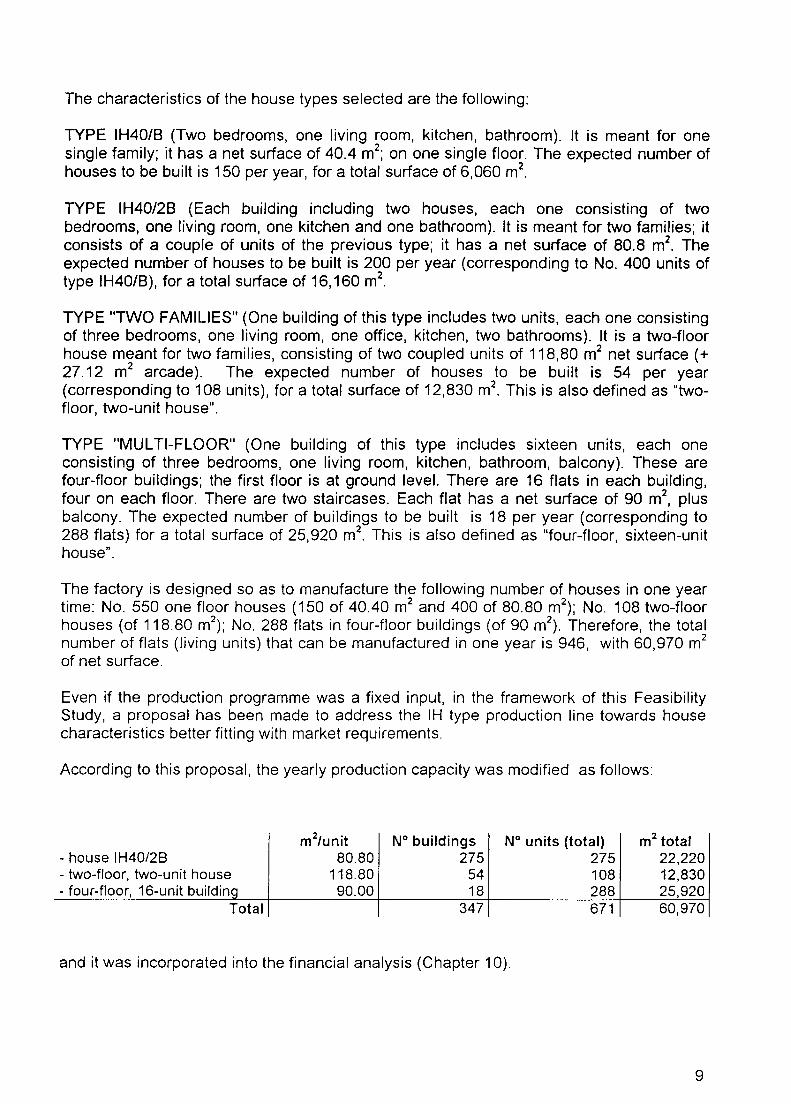
The characteristics of the house types selected are the following:
TYPE IH40/B (Two bedrooms, one living room, kitchen, bathroom). It is meant for one single family; it has a net surface of 40.4 m2
; on one single floor. The expected number of houses to be built is 150 per year, for a total surface of 6,060 m2
.
TYPE IH40/28 (Each building including two houses, each one consisting of two bedrooms, one living room, one kitchen and one bathroom). It is meant for two families; it consists of a couple of units of the previous type; it has a net surface of 80.8 m2
. The expected number of houses to be built is 200 per year (corresponding to No. 400 units of type IH40/B}, for a total surface of 16, 160 m2
.
TYPE "TWO FAMILIES" (One building of this type includes two units, each one consisting of three bedrooms, one living room, one office, kitchen, two bathrooms). It is a two-floor house meant for two families, consisting of two coupled units of 118,80 m2 net surface(+ 27.12 m2 arcade). The expected number of houses to be built is 54 per year (corresponding to 108 units}, for a total surface of 12,830 m2
. This is also defined as "twofloor, two-unit house".
TYPE "MUL Tl-FLOOR" (One building of this type includes sixteen units, each one consisting of three bedrooms, one living room, kitchen, bathroom, balcony). These are four-floor buildings; the first floor is at ground level. There are 16 flats in each building, four on each floor. There are two staircases. Each flat has a net surface of 90 m2
, plus balcony. The expected number of buildings to be built is 18 per year (corresponding to 288 flats) for a total surface of 25,920 m2
. This is also defined as "four-floor, sixteen-unit house".
The factory is designed so as to manufacture the following number of houses in one year time: No. 550 one floor houses (150 of 40.40 m2 and 400 of 80.80 m2
); No. 108 two-floor houses (of 118.80 m2}; No. 288 flats in four-floor buildings (of 90 m\ Therefore, the total number of flats (living units) that can be manufactured in one year is 946, with 60,970 m2
of net surface.
Even if the production programme was a fixed input, in the framework of this Feasibility Study, a proposal has been made to address the IH type production line towards house characteristics better fitting with market requirements.
According to this proposal, the yearly production capacity was modified as follows:
m2/unit N° buildings N° units (total) m2 total - house IH40/2B 80.80 275 275 22,220 - two-floor, two-unit house 118.80 54 108 12,830 - four-floor, 16-unit building 90.00 18 288 25,920
Total 347 671 6o,97o I
and it was incorporated into the financial analysis (Chapter 10).
9

1.4 Market analysis and marketing strategy
- Chile has developed an efficient private construction industry in housing, particularly during the last ten years.
- After a decade of five significant drops (1981-89), unit prices started to move during the last years slightly upwards. Economics of scale, confidence of adequate demand, greater specialisation of construction firms, simplification of permit and inspection procedures, are all elements which are being offset by the strong expansion in the construction activity and increases in labour cost and building materials. From 1990 to 1993, the number of square meters for the whole construction sector increased steadily up from 6.2 million to about 10 million. At the same time, the size of the houses showed a trend towards smaller apartments, with particular reference to the private market.
- The cost of constructing an acceptable quality house varies greatly reflecting local conditions of land, material supply and transport costs. In the Metropolitan Region of Santiago, a basic house of 50 m2 costs less than 480 UF and a house on the private market of 100 m2 costs around 3,000 UF.
- In general, there is still sufficient land supply in the Project area (around Santiago and Valparaiso). However, the availability of adequate infrastructure (with special reference to sewerage) may be a constraint in certain areas of the Santiago Metropolitan Region, and, in the Fifth Region as well (with special reference to Valparaiso).
- Population increase and growth of urban area largely bypassed the Country's investment capacity with the result of a widespread housing deficit. It has been estimated that, at the Country level, more than 500,000 families living as "allegados" are affected by housing shortfall, while an extra 150,000 are living in sub-standard condition.
- The MINVU has calculated that, in order to prevent the situation to worsen, a minimum of annual need of 85,000 new units is required, for a total amount of 600,000 housing units up to year 2000. This amount would cope with population growth and deterioration of the housing stock.
- A different approach, leading to a higher figure, is followed by the MIDEPLAN (Ministry of Planning). According to this view, the Census of 1992 had detected unsatisfied housing needs of about 900,000 units.
- Moving from national to regional level or, more precisely, to the two specific Regions of the Project, the corresponding number of "allegados" needing a house was estimated at 385,000 people (42.7 % of the total) for the Santiago Metropolitan Region and 73,000 people (8.1 %) for the Fifth Region.
- However, it is very unlikely that these requirements will be met by actual construction. Over the last few years, the number of standard houses constructed increased from a yearly average of 80,000 (1989-91) to an average of 110,000 (1992-94), while housing initiated in 1993 reached a number of 50-55 thousand units in Santiago and 1 O thousand in the Fifth Region. Most of them were very low-cost units, aimed at the lowincome population.
10

- Since the technology proposed in this Project refers to rather high-standard houses, with a production cost which cannot be reduced too much, the market analysis must refer to the new housing requirements in a medium-top standard level range.
- A more realistic estimate of housing requirements, therefore, to be considered in the framework of the present Project, should take into account the actual planning of the MINVU regarding units of the top level, and that segment of private market incorporating housing units ranging from 1, 700 to 3,000 UF.
- The housing planning of MINVU is based on demographic growth and on the need to renew the housing stock to prevent housing conditions from worsening. It is what it could be defined as a "minimum requirement" to maintain the "status quo". On this assumption and taking into account also low-cost units, a housing deficit of about 33,000 units per annum in Santiago Region and about 8-9,000 units for Valparaiso Region was calculated. In total, 41-42,000 units is the estimated annual deficit of these two Regions.
- The bulk of these housing needs concerns the poorest segment of the population. Taking into account the extremely low construction costs of the first two housing programmes of MINVU ("Vivienda Basica" e "Vivienda Progresiva") and very likely, also of the third one (P.E.T.), focus for the market strategy should be put on the so-called "Subsidio Urbano" (Unified Subsidy) programme, whose housing units are supposed to range from 500 to 1,500 UF. In physical terms, that means a market size of the order of 7,000 units.
- The market demand has been projected over the coming years. To get an idea of market development until the year 2000, the housing construction programme of MINVU and its minimum housing target may be assumed as basis.
The Table below shows this programme:
A) Minimum target to be achieved at national level by year 2000 : 600,000 housing units
B) Target for the Metropolitan Region and the Fifth Region:
1995 1996 1997 1998 1999 2000 Total (95-2000
1) Santiago Housing Units 39,400 40,708 41,358 42,008 42,658 42,658 246,190 2) V Region Housing Units 9,850 10,015 10, 177 10,340 10,502 10,665 61,549 3 Total of above 49,250 50,073 50,885 51,698 52,510 53,323 307,739
If we consider the income class corresponding to the Unified Subsidy Programme (see Chapter 3) and we take into account the share of the total housing construction plan corresponding to such a programme (which insists on the fourth quintile of the household income structure), we obtain the projected market volume from 1995 to 2000. In quantitative terms, the following figures are obtained:
1) M. R. of Santiago (% share: 17 .2) 2) Vth Region (% share: 15.3) 3) Total of above
6,776 1,507 8,283
6,890 7,002 7, 114 1,532 1,557 1,582 8,422 8,559 8,696
7,225 7,337 1,607 1,632 8,832 8,969
11

- On this basis, considering the productive capacity of the factory of the Project and, at the same time, the virtual absence of competition for prefabricated houses in Chile (no relevant experience can be found in this kind of product), a market share of the firm of some 9-10 % of market volume may be considered as realistic.
- Appears a share of 10% of the "rich" housing market (private; this market arrives at 800 units) also appears realistic.
- Globally, the market sector of the Unified Subsidy Programme and the private market sector appear compatible with the saturation capacity of the proposed factory (671 units per year).
- Sales prices (per house) in the Unified Subsidy Programme (USP) are ranging from 8,500 - 9,000 US$ (340-360 UF) for the first category to 30-33,000 US$ (1,200 - 1,320 UF) for the third category (see Chapter 3).
- As far as the private market is concerned, the bulk of houses constructed have a size of a maximum 100 m2. The relative prices are strictly comparable with the two first categories of USP, while the housing units with an average size of more than 100 m2 but less than 140 reach a price of 2,700 UF.
- As specified before, the production factory selected by lntertransports Centre S.p.A. was conceived for a well specified production programme (Reference Production Programme). Since the market analysis pointed out the existence of a great variety of building types, with an extremely wide range of sales prices, a comparison was made between the cost characteristics of the standard houses manufacturable by the proposed factory and the price characteristics of the existing market. Through this comparison, the assessment of products to be manufactured and marketed, was calculated.
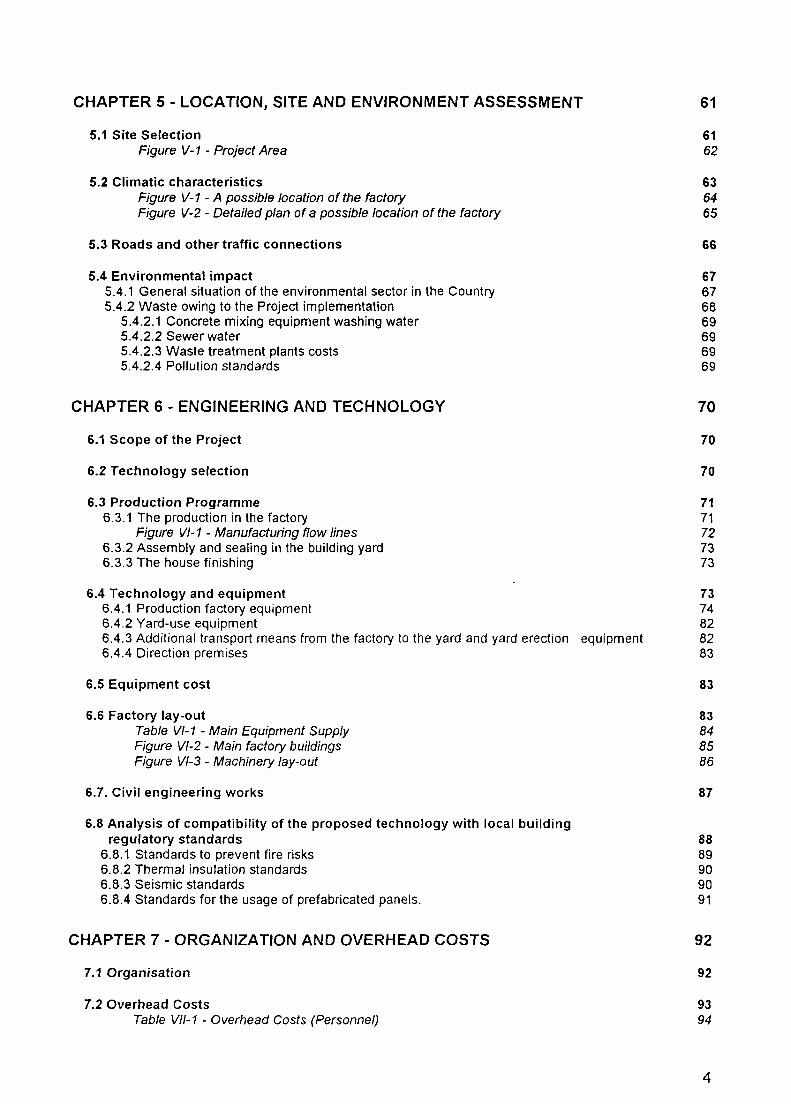
- Relevant data of this comparison are summarised in Table 1-2, where a typical and representative situation is shown, that of civil building constructions in 1993, with reference to the highest sectors of the market.
- Sales price per square meter ranges between 7.19 UF and 41.05 UF (or between 5.99 UF and 39.85 UF, if the cost of urbanised land is excluded from the sales price of the building).
- The three types of buildings which can be produced through the proposed factory have been compared with typical building requirements of the market from both the points of view of surface per unit and of compatibility between production cost and sales price.
- The comparison has brought to the exclusion of IH40 construction model, unless used in double-module houses, with a net surface of some 80 m2
. In this case, IH40 type (only IH40/28) fits with the requirements of Unified Subsidy Programme type houses (third top segment), and with a segment of the private market, while the two-floor, twounit buildings fit with requirements of the private sector only (starting from 71 m2 of net surface) and the four-floor, sixteen-unit buildings fit with requirements of Unified Subsidy Programme type houses (third top segment) and with private sector requirements (in the range 71-140 m2
).
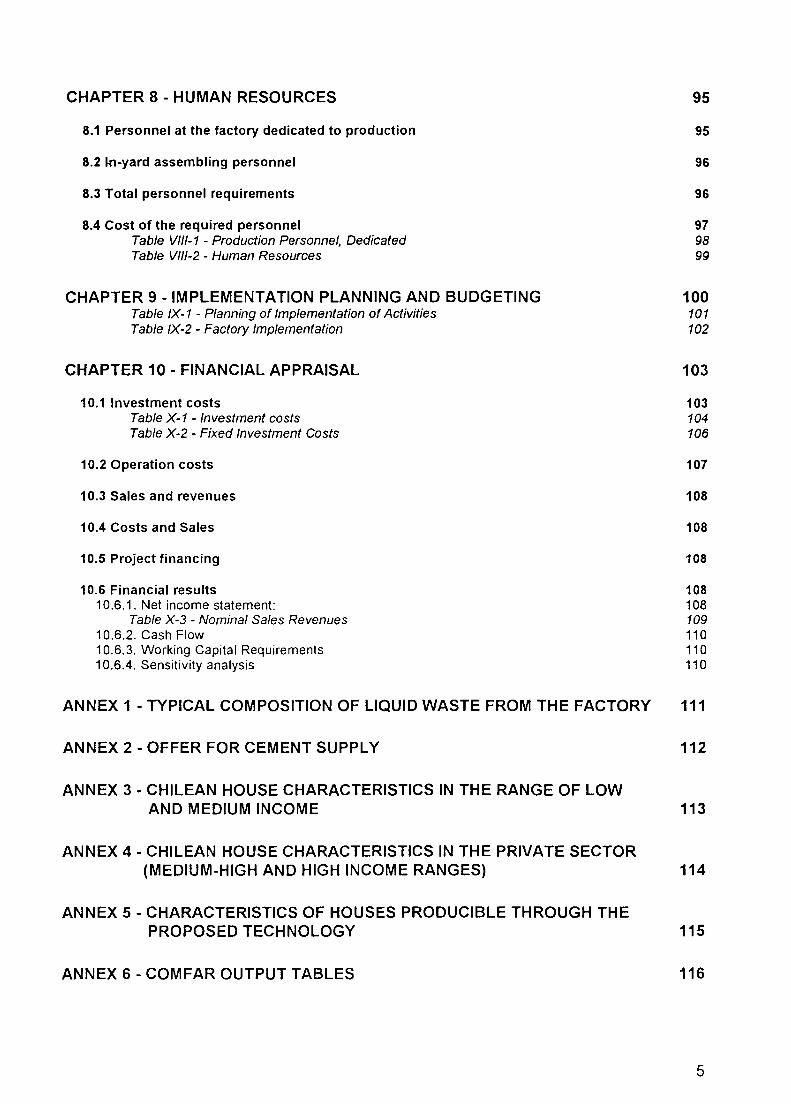
- The reference sale prices shown in Table 1-3 were selected in the Financial Analysis.
12

INTR0101.XLS N° 16 2
I MARKET TYPE REQUIREMENTS PET i SUBSIDIO 1 SUBSIDIO 2 SUBSIDIO 3 PRIVATE PRIVATE PRIVATE
I I 71/100 m 2 101/140 m2 from140m 2
I I
HOUSE UNITS BUil T IN 1993 I 13,669j 12,145 5,957 780 14,027 6,895 5,351
AVERAGE SURFACE(~ I I 44.591 46.05 55.93 81.14 82.21 117.71 202.14 ~--
AVERAGE SALE PRICE (US$/unit) I 8,016i 8,595 15, 176 33,365 34, 150 71,912 207,464 AVERAGE SALE PRICE (US$/m2
) i 179.771 186.64 271.34 411.20 415.40 610.93 1,026.34
AVERAGE SALE PRICE (UF/m2) (rate 1993:
I 7.191 7.47 10.85 16.45 16.62 24.44 41.05
25US$/UF) I AVERAGE SALE PRICE NO LAND (UF/m2
} 5.99 6.27 9.65 15.25 15.42 23.24 39.85
-~
SUITABILITY AS FOR SURFACE average surface (m2)
IH40 40.4 / 80.8 IH40/B IH40/B NOT IH40/28 IH40/2B NOT NOT 2-FLOOR,2-UNIT 118.80 NOT NOT NOT NOT YES YES YES? 4-FLOOR, 16-UNIT 90.00 NOT NOT NOT YES YES YES NOT
SUITABILITY AS FOR COST/PRICE simplified reference cost
IUF/m2)
IH40 11.20 NOT NOT NOT YES YES YES YES -----
2-FLOOR,2-UNIT 10.41 NOT NOT NOT YES YES YES YES 4-FLOOR, 16-UNIT 9.28 NOT NOT YES YES YES YES YES
FINAL SUITABILITY ASSESSMENT NOT NOT NOT IH40/2B IH40/2B NOT NOT NOT NOT NOT NOT 2-FL,2-UN 2-FL,2-UN 2-FL,2-UN NOT NOT NOT 4-FL,16-UN 4-FL,16-UN 4-FL,16-UN NOT
Note: the 1993 Exchanqe Rate has been applied: 25 US$ per UF
...... w
Table 1-2 - Selection of products (house types) to be marketed
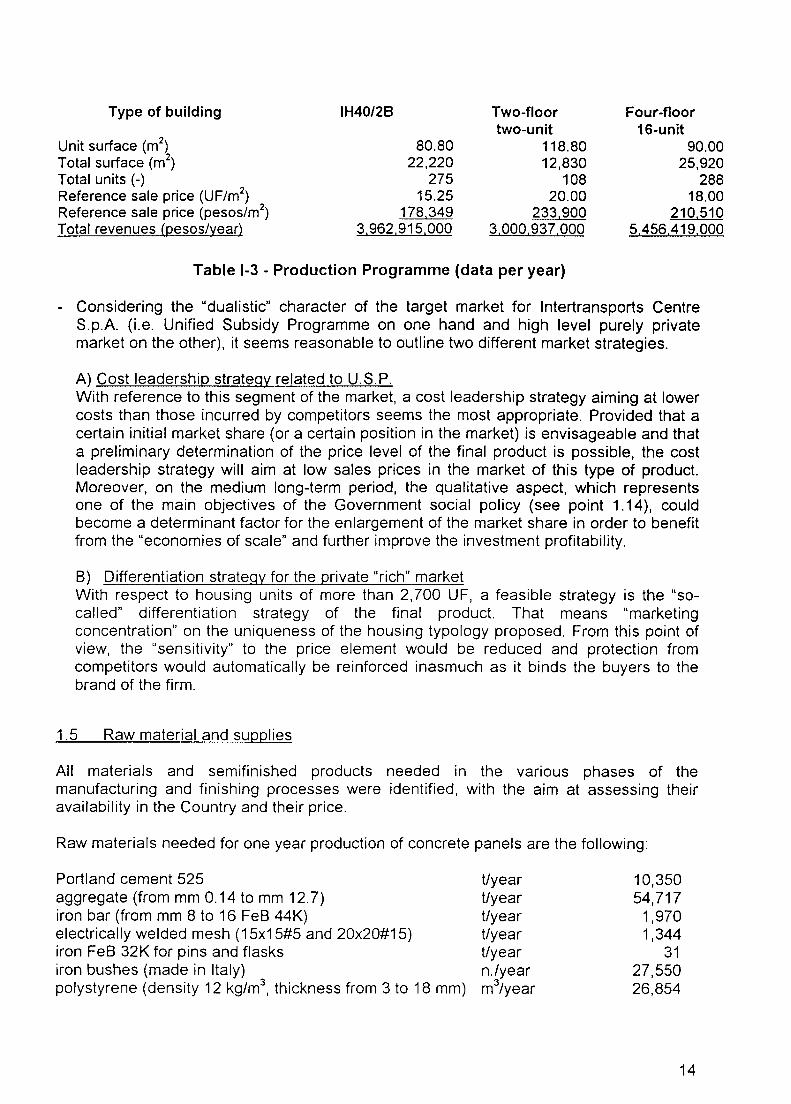
Type of building
Unit surface (m2)
Total surface (m2)
Total units (-) Reference sale price (UF/m2
)
Reference sale price (pesos/m2)
Total revenues (pesos/year}
IH40/28
80.80 22,220
275 15.25
178,349 3.962.915,000
Two-floor two-unit
118.80 12,830
108 20.00
233,900 3,000,937,000
Table 1-3 - Production Programme (data per year)
Four-floor 16-unit
90.00 25,920
288 18.00
210,510 5,456.419.000
- Considering the "dualistic" character of the target market for lntertransports Centre S.p.A. (i.e. Unified Subsidy Programme on one hand and high level purely private market on the other), it seems reasonable to outline two different market strategies.
A) Cost leadership strategy related to U.S.P. With reference to this segment of the market, a cost leadership strategy aiming at lower costs than those incurred by competitors seems the most appropriate. Provided that a certain initial market share (or a certain position in the market) is envisageable and that a preliminary determination of the price level of the final product is possible, the cost leadership strategy will aim at low sales prices in the market of this type of product. Moreover, on the medium long-term period, the qualitative aspect, which represents one of the main objectives of the Government social policy (see point 1.14), could become a determinant factor for the enlargement of the market share in order to benefit from the "economies of scale" and further improve the investment profitability.
8) Differentiation strategy for the private "rich" market With respect to housing units of more than 2, 700 UF, a feasible strategy is the "socalled" differentiation strategy of the final product. That means "marketing concentration" on the uniqueness of the housing typology proposed. From this point of view, the "sensitivity" to the price element would be reduced and protection from competitors would automatically be reinforced inasmuch as it binds the buyers to the brand of the firm.
1.5 Raw material and supplies
All materials and semifinished products needed in the various phases of the manufacturing and finishing processes were identified, with the aim at assessing their availability in the Country and their price.
Raw materials needed for one year production of concrete panels are the following:
Portland cement 525 aggregate (from mm 0.14 to mm 12. 7) iron bar (from mm 8 to 16 FeB 44K) electrically welded mesh (15x15#5 and 20x20#15) iron FeB 32K for pins and flasks iron bushes (made in Italy) polystyrene (density 12 kg/m3
, thickness from 3 to 18 mm)
Uy ear Uyear t/year Uyear t/year n./year m3/year
10,350 54,717
1,970 1,344
31 27,550 26,854
14

Other needed materials are: fluidifying concrete additive oil to remove forms water to clean concrete mixing equipment service water panel production water
liter/year liter/year liter/year liter/year liter/year
186,000 9,000
350,000 900,000
5,465,000
All raw materials needed are available "in loco" in the amounts needed. Only some minor components could require to be imported, but this will not affect the economics of the Project. The cost of raw materials has been assessed.
1.6 Location and site
The Project foresees the building of the selected house types in the Metropolitan Region of Santiago and in the Fifth Region.
The distance between the production factory and the assembly area (yard) should be within a range of 200-300 km, depending on the cost and the time needed for the transport, which is a function of the existing connection facilities.
The soil for the construction of the manufacturing plant has not yet been bought nor chosen. The investors, however, focus their attention on the agricultural areas near the town of La Calera.
The Chilean Government started some rehabilitation programme of the road system in the Country. Most relevant actions regard the area of the Project, including connections between Santiago and Valparaiso, Santiago and San Antonio, Santiago and Los Vilas passing through the site where the factory should be built (La Calera).
The pipeline road improvement programmes, whose benefits will be felt since 1996, fully justify the Investors' choice of the plant location.
The factory, whose aim is to produce prefabricated elements and to transport them to the building yard in the areas of development of the Metropolitan Region and of the Fifth Region, would be located in the centre of an important arterial network that will ensure, in the prudential range of 200 km from the plant, the fast reaching of the assembly locations .
1. 7 Environmental protection ..
Among the materials needed for the manufacturing processes, the following ones contribute to the production of wastes (data expressed with reference to one year of production of the plant):
polystyrene: 3% of year consumption = 805 m3/year iron: 2.5% of year consumption = 49.25 t/year concrete mixing equipment washing water = 350,000 liter/year services water = 900,000 liter/year sewage water = 1,300,000 liter/year
15

Polystyrene is a self-extinguishing material formed of 90% air; it does not produce any damage because it does not eject fibrous particles, it is odourless and inert. It may be 100% recycled, so the factory should have a simple collecting network of polystyrene residues, to be sent to recycling companies for the production of "cellular concrete", porous bricks, raw materials for other products destined to high energy efficiency applications. In Chile the companies possessing a sufficient technological level to carry out these processes already exist and moreover a network that will allow the material to arrive at the recycling sites is now growing.
Iron wastes are not a problem at all, owing to the nature of material and to the possibility of easy recycling.
Concerning the water for the concrete m1x1ng washing equipment, a plant for the collection of the solid from the concrete mixing equipment washing, mainly cement particles, will be built.
Also fluids of the sewage system will be treated in a suitable plant.
1.8 Technology and equipment
The Project focuses on the production, assembling and sale of industrialised type houses for living. These activities will be carried out by a Company which will be established for this purpose, and include:
- production of building panels and structures, in the factory; - transport of panels and structures to the site; - assembling and finishing of houses; - marketing and sales activity.
The technology for the industrialised production of panels for the buildings was not subjected to analysis for the selection of the most suitable one for the Project; the technology was selected by the Project promoter, who wishes to utilise it because of his know-how and experience.
The technology proposed has been extensively experimented in Italy.
The suggested system allows to realise civil buildings of medium-high level in a short time at competitive costs, thanks to the industrialised prefabrication of all the components of the building. Only the assembly, the sealing and the finishing of the living unit are made in the building yard.
The external wall panels and the base and covering slabs are insulated, thanks to a polystyrene foam layer put into the concrete during the casting.
Specially equipped walls contain the bathroom and kitchen systems.
The raceways for electric, telephone and TV systems, the boxes containing electric current taps, switches and boards are included in the panels. The door and window openings are made directly in the forms using special molds.
The construction is performed in three separate phases:
16
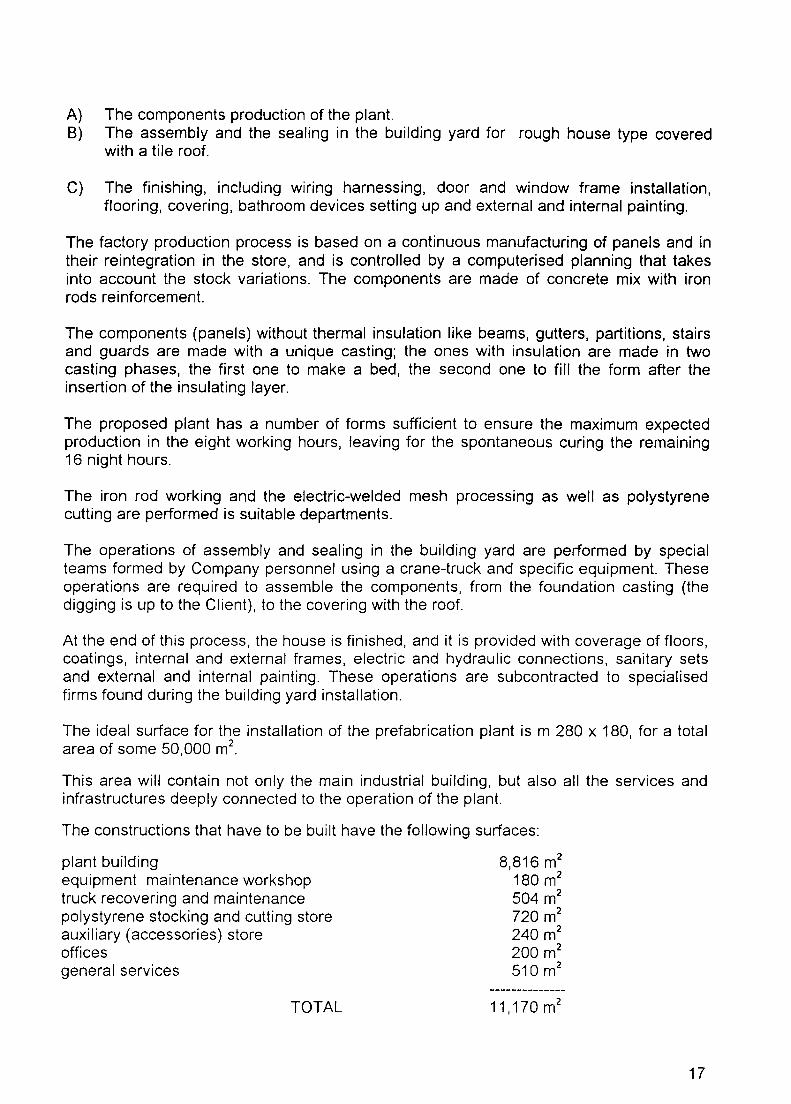
A) The components production of the plant. B) The assembly and the sealing in the building yard for rough house type covered
with a tile roof.
C) The finishing, including wmng harnessing, door and window frame installation, flooring, covering, bathroom devices setting up and external and internal painting.
The factory production process is based on a continuous manufacturing of panels and in their reintegration in the store, and is controlled by a computerised planning that takes into account the stock variations. The components are made of concrete mix with iron rods reinforcement.
The components (panels) without thermal insulation like beams, gutters, partitions, stairs and guards are made with a unique casting; the ones with insulation are made in two casting phases, the first one to make a bed, the second one to fill the form after the insertion of the insulating layer.
The proposed plant has a number of forms sufficient to ensure the maximum expected production in the eight working hours, leaving for the spontaneous curing the remaining 16 night hours.
The iron rod working and the electric-welded mesh processing as well as polystyrene cutting are performed is suitable departments.
The operations of assembly and sealing in the building yard are performed by special teams formed by Company personnel using a crane-truck and specific equipment. These operations are required to assemble the components, from the foundation casting (the digging is up to the Client), to the covering with the roof.
At the end of this process, the house is finished, and it is provided with coverage of floors, coatings, internal and external frames, electric and hydraulic connections, sanitary sets and external and internal painting. These operations are subcontracted to specialised firms found during the building yard installation.
The ideal surface for the installation of the prefabrication plant is m 280 x 180, for a total area of some 50,000 m2
.
This area will contain not only the main industrial building, but also all the services and infrastructures deeply connected to the operation of the plant.
The constructions that have to be built have the following surfaces:
plant building equipment maintenance workshop truck recovering and maintenance polystyrene stocking and cutting store auxiliary (accessories) store offices general services
TOTAL
8,816 m2
180 m2
504 m2
720 m2
240 m2
200 m2
510 m2
11, 170 m2
17

The proposed technology is basically compatible with local standards and regulations. A systematic review of standards is nevertheless suggested at the starting of the implementation phase, but only minor possible adaptations may be envisaged which will not affect at all the outcome of the present Feasibility Study.
1.9 Organisation
The Company implemented by the Project will be provisionally subdivided into the following nine areas:
-A) General Administration, including the managing director and a secretary (provisionally located in dedicated premises in Santiago);
-8) Marketing, including three people, under direct control of the managing director (located in Santiago, in the same office as that of the general administration);
-C) Production and Construction, bearing the responsibility of management all activities at the factory and of assembly and finishing of the buildings, including the manager of the factory and two foremen. They are located at the factory;
-D) Factory Production, bearing the responsibility of all technical activities within the factory, for the construction of panels, including 63 people in the concrete-line and 28 people in the iron, mixing, polystyrene line. These people are considered in the category of costs directly associated to the product. They are located at the factory;
-E) Assembling and Finishing, bearing the responsibility of transporting, assembling and finishing the houses at the site. It includes 13 people not directly associated with the product, and 57 people considered in the category of costs directly associated with the product. They are only seldom located at the factory;
-F) Technical Office, bearing the responsibility of design activities regarding final products (houses/panels), as well as selection of construction techniques for panels and special design activities regarding the factory. It includes 5 people, located at the factory;
-G) Maintenance Unit, bearing the responsibility of the maintenance of all machinery, of the factory with its plants, of equipment utilised at the site (trucks, cranes, etc.). It includes 10 people, at the factory;
-H) Administration, Purchase, Personnel, bearing the responsibility of procurement, purchasing, administration. It operates under the guidance of the managing director and the manager of the factory. It includes 4 people, at the factory;
-1) General Services, including 30 people (drivers, messengers, keepers, auxiliaries), at the factory.
18

1.10 Human resources
The production proposed in the Project is based on 300 working days per year with one 8-hour shift per day (for most of the personnel; see Chapter 8).
Personnel required for the Project implementation include:
1) Factory Personnel
Direction 1 factory manager 2 unit supervisors 1 maintenance supervisor
Technical Department 1 building engineer 3 surveyors 1 industrial technician
Administration 4 employees
Direct Production 48 concrete workers 43 iron bar workers
n° 4
n° 5
n° 4
n° 91
Maintenance n° 9 2 electricians 2 mechanics 2 hydropneumatics 3 steel structural workers
Non-production personnel n° 30
2)
3)
12 cleaning and internal transport workers 5 crane operators (two shifts) 8 loading workers (two shifts) 2 Messagers and drivers 3 keepers (24-hour/day)
Yard operation personnel
Managing and marketing personnel
1 Managing Director 1 Secretary 3 Marketing personnel
GENERAL TOTAL OF PERSONNEL
n° 70
n° 5
218
All professional skills required are available in the Country.
19

1.11 Implementation planning
The Company which will be established to implement the Project will start activities after the provision of funding requested (at least, 85% of the investment cost).
The engineering phase will follow, immediately after the selection and purchase of the soil, the construction of civil works at the site, the procurement of machinery, the start-up of the factory, training of people.
Pre-production activities will last some 12 months.
1.12 Financial appraisal
The financial appraisal was performed utilising very conservative hypotheses as for plant utilisation. Even in the very conservative scenario of a very limited productivity (25% the first year, 50 the second year, 75% all subsequent years), the Project presents a financial Internal Rate of Return (I.RR.) of 24.29% (including corporate taxes of 35%), with a discount rate of 12% and a positive Net Present Value. This represents a minimum but sustainable investment ratio, considering that additional tuning of data might increase the I.RR. (i.e. including full production from the first year).
The Project, after a construction period of one year, will rely on a net profit (assuming a zero-level inflation rate and after 35% of corporate tax) from -516,480 US$ to a maximum level of 3,264,862 US$ in year 10.
The most sensible parameter from the point of view of financial profitability results the sales programme/productivity. All other parameters (investment and running costs) provide minimum modifications.
Two additional, less restrictive, sales I productivity programmes were considered:
Alternative 1 :
a) year 1 :50% of productivity for all products;
b) from year 2, ongoing: 75% of productivity for all products.
This solution provides an I.RR. of 28%.
Alternative 2:
a) year 1: 50% of productivity for all products;
b) from year 2, ongoing: 100% of productivity for all products.
This solution provides an I. R.R. of 37%.
20

1.13 Conclusions of the Feasibility Study and Recommendations
The Feasibility Study has shown that the Project promoted by lntertransports Centre SpA is feasible under the technical point of view. Also the profitability of the Project appears sufficiently high.
In order to reduce the risks of the investment, it is strongly recommended that the Partners establish a very good marketing structure so as to allow a saturation of the production capacity of the factory.
1.14 Additional statements and information
In this paragraph, some additional information and data are reported, which may be useful for the Entrepreneurs in the phase of selecting the final production and marketing strategies.
1.14.1 The new Construction Master Plan
A ceremony chaired by the Secretary of State of "Vivienda y Urbanismo" gave start to the New Construction Master Plan of the urban area of Santiago, replacing the one in force since 1960. The main object of the new planning is to increase the density of inhabitants in Santiago by adopting City Master Plan instruments implying the reduction of almost one third of the available surface and the rise of population density, which will raise from 100 to 150 inhabitants per hectare.
According to the rate of growth of the Metropolitan Region of Santiago, in 25 years about nine million people are expected to live in the 59,000 hectares available for new housing and provided by the New Construction Market Plan. Between 1970 and 1990, the rate of expansion of Santiago has changed from 500 hectares per year to 1,000 hectares per year. The excessive increase of the city extension had to be regulated.
Due to the great extension that the city has reached during this period, the costs connected with the construction and management of infrastructures and utilities has become unbearable. To meet the needs of the local Administration, the schedule favours the utilisation of those districts that are already inhabited and which show a low living standard.
The suggested programme of industrialised fabrication described in the Project will be a great incentive for the next development of urban regions.
1.14.2 The Government-supported construction programmes and the present trends
towards a better quality.
The "Ministerio de la Vivienda" programmed different types of actions to face the housing problems, with a specific reference to the needs of each social group. The programmes differentiate one from the other basically and mainly with regard to the extension and value of the house that is bought. They are described in paragraph 3.7.
These programmes are:
21

A VIVIENDA PROGRESIVA -Target users are extremely poor people. The house construction is divided into two stages. In the first stage a very small nucleus is built, mainly technological; in the second stage this nucleus will be enlarged to meet the increasing needs of the family.
8. VIVIENDA BASICA -Target users are families with a very low income.
C. P.E.T. (Programa Especial Trabajadores) -Target users are families that do not own any house, that have never received any subsidy from the Government Programmes and that are organised in groups of workers.
D. SUBSIDIO GENERAL UNIFICADO -Target users are families with poor economical resources and with an average income.
These Government Programmes are an appropriate answer to the increased demand for low cost housing coming from low income people.
On the other hand, these programmes brought to a low level the prices and finally the quality of the product. As a consequence, some works were contracted to Companies that succeeded in building the largest number of living units on the basis of a fixed budget.
The reduction of the house building costs led to the employment of low quality and easily perishable materials and contributed to reduce the living spaces down to uninhabitable dimensions with less than two meter wide rooms and very low ceilings. Many of the new houses are built with low quality wood, asbestos slabs, hardboard, vinyl floors, pipeline on sight, doors in plywood. What, at first sight, may appear as an architectonic characteristic, typical the Country, is actually the result of economical choices.
This is mostly true for the two-floor Anglo-Saxon style houses, built according to the Government Programmes. The pitches of these houses have the gutters at the ground floor level and the ridges of the roof that have pronounced slope cover the upper floor. Under this roof there is a sort of mansard where dormers frequently are placed.
This technical solution saves materials and space, especially concerning the ground floor, because there are no more lateral walls. The relative architectonic characteristics now preferred by the users may be seen in the enclosed picture.
Actually politicians and entrepreneurs, operating in the building field, are becoming sensitive to the problem, and the lack of quality of the new buildings is now insistently declared. The attempt to face the situation and to cause a trend inversion is now being made.
The main expectations come from the building industry itself which, with empirical methods (reconversion of companies producing concrete prefabrication elements for the heavy industry), is trying to reorganise the building field through the production of industrialised or prefabricated components.
22

1.14.3 The definition of "prefabrication"
The word "prefabrication" has a different meaning in Chile as compared to Europe. In 1963, in the "Comuna de Vitacura", approximately 900 houses were built in reinforced concrete with sliding metallic form. Their sale was very slow because the houses, made with non-insulating concrete, were prone to problems of condensation and mould on the structures.
This method was put aside but the population thought that it was linked to low quality buildings.
Most of the one-family houses existing or under construction according to the Government Programmes in the Country are built with "prefabricated" materials and their standard is rather low.
Compounds of paperboard and calcined gypsum are the materials with which curtain walls of ground floor and partitions inside the flats are made. Also plywood panels are generally used as components.
Chileans associate the word "prefabrication" with these materials that, of course, are not accepted with enthusiasm because of their fragility.
The word "prefabrication" has a completely different meaning in the case of lntertransports Centre S.p.A. houses: in this case, prefabrication stands for industrialised production. Owing to the quite high standard of houses proposed in the Project, we suggest lntertransports Centre S.p.A. and its partners not to use the word "prefabrication" in advertising their products.
1.14.4 Products and quality standards of local competitors. The possibility of producing
panels for third parties
Excluding companies present on the market with the so called "prefabricated" houses, which cannot be considered as competitors (see point 1.14.3), as well as the production of industrialised and non-industrialised wooden buildings, only a few attempts of standardisation of building components are present in the market.
Among these, some factories, that had produced big blocks in concrete for industrial applications, converted the production to obtain structures or parts of structures for house building such as slabs and precast beams.
In Chile there is also the Company "Monolite Chile S. A", that produces a complete construction system of precast walls of foam polystyrene. This system includes: the supply of all the components in foam polystyrene, already covered with electrically welded mesh, their installation on the lot, and the total coating with a spray structural compound of concrete and sand.
At present, in the Country there is no factory producing panels made of insulated heavy concrete, quick to install, and large enough to achieve the object of this Study.
23

On the other hand, should factories of this kind be present in a neighbouring Country, they would not be interested in the Project market because for the best yield of this type of prefabrication system, the distance between the place of production and the place of installation should not exceed 250 - 300 km.
The production of prefabricated elements or components for the building that, put on the market, may be assembled by the user, is another relevant feature which may be of interest for many assembling and finishing construction Companies, in the framework of a new approach to industrialisation of the construction process.
1.14.5 Miscellaneous issues regarding building quality standard, which could have an
impact on the Project
The increase in building activity in the Country and the opening of the market, that will push the industrial and construction operators to the use of advanced technologies, puts into evidence a certain lack of qualified workers.
Because of the last complaints and charges of low_quality in the building field, with special reference to the houses for poor people as m~ntioned before, systems of technical inspection and of check in the building yards should be improved.
Authorities are also making a significant to make known the methods of usage of the houses which implies regular and periodic maintenance.
A high preparation level will allow to solve at least 30% of problems connected to the house maintenance, solving, gradually, a problem that worries the Country and that gave way to a law proposal that is now to be approved by the "Congreso Nacional".
Some of these problems could be explained by the progressive growth of the buildings that had as a consequence to make the qualified workers become insufficient; the growth was not controlled because of the urgency of the housing problem in Chile.
All Authorities agree on the need to change this situation and will carry out in a short time studies and programmes with the aim at improving the house standard in the Country. There are new financial tools to buy houses, like the house leasing (Law No. 19.281 of December 15, 1993) that allows the purchase of new or used houses through rent payment, with contemporary sale arrangement.
According to the law, the interested person will have to rent a house from a company, signing a rent contract with promise to buy; in this contract the price at which the house will be bought, the monthly rent and the time needed to complete the savings, must be stated.
There is also a law proposal that allows the owners of the houses in "Subsidio" to sell their living unit to buy a higher quality one.
All these efforts of the various political and ministerial Authorities give support to the hope for a future building development through the construction of houses that are more lasting and have a higher technical and distributive quality.
24
1.14.6 Some notes on architectural features
The architectural features of most houses in the Country show some differences with those of the Project.
The capability in introducing the new architectural types foreseen by lntertransports Centre S.p.A will depend basically on the demonstration of the profound difference in spaces available and in space distribution. Free heights of ceilings substantially greater than 2.30 m as those used in Chile, large rooms, high quality standard of construction materials and accurate fittings of construction parts are all positive features which are in counter-tendency with local praxis.
A suggestion to the Entrepreneurs is to consider the opportunity of modifying some features of the Italian building types in order to make them more similar to the Chilean ones. It is advisable: to have larger windows; to add a "lavadero" near the kitchen and possibly in an area that communicates with the outside; probably, to increase the slope of roofs. Cost savings and increase in free space may be achieved through the elimination of bidets and the elimination of the second group of stairs of the four-floor type buildings.
25

CHAPTER 2 - PROJECT BACKGROUND AND BASIC IDEA
2. 1 Project objective
The immediate objective of the Project is the establishment of a company in Chile, with a mixed share capital between Chilean and Italian Partners, whose purposes are the production of industrialised structures for living houses and the assembling, finishing and selling of houses based on the utilisation of such structures.
The key element of the Project is the construction of a factory for the production of prefabricated elements according to the technology of heavy prefabrication, which foresees the construction of the various prefabricated elements with characteristics similar to those of the finished products. In this way, the operations of construction at the site refer basically to assembling activities. Preliminary activities for the preparation of the ground and final operations of finishing as wall painting, assembling of doors and windows, etc., have to be added.
2.2 Project idea
The Project idea belongs to one of the two Entrepreneurs who will become a Partner in the proposed Company, and that gained a considerable experience in manufacturing and selling of prefabricated buildings for living purposes.
This Entrepreneur, with extensive experience in this field in Italy, Russia and Germany, decided to verify the possibility of implementing ~ new initiative in Latin America. Chile was selected because of two reasons: a) its favourable political, social and economic environment for foreign investments, and b) the possibility of creating a synergy with other initiatives in the field of prefabricated wooden production structures.
2.3 Suitability of local environment for the Project idea
The Chilean economy is moving towards the end of the structural adjustment process led by FMI, with the perspective of a higher level of economic activity coupled with a steady reduction of the inflation rate. Economic activity was rather depressed in the last two years mainly in the "non-tradable" sectors, owing to the restrictive monetary policy and to the severe cut in Government expenditure.
Macro-economic policies have been kept basically unchanged from 1990 on, when Mr. Patricio Aylmin inherited the most dynamic and best-run economy in Latin America at the time.
Rather recently, to finance greater expenditure on public health, education and housing, the Government took several measures on the fiscal side.
In particular, it raised: a) the VAT rate by 2 percentage points to 18% (as of July 1990), b) the Corporate Income Tax from 10 % of distributed income to 15 % of all declared profits (whether distributed or not) and, finally, c) the personal income taxes.
26

Moreover, on the trade policy side, the uniform import tariff rate was cut to 11 % in June 1991 with a view at fighting inflation and stimulating imports (and, by consequences, lowering the Peso).
Chile is undertaking an important restructuring process at both the production and the employment level in the framework of an externally open-economy.
This is implying the need for analysing and correcting the external distortion to make possible a greater gradualisation of those negative effects brought about by foreign competition and, at the same time, to support the private sector in implementing its modernisation efforts.
Economic policy for future years aims at attaining a solid and sustainable development coupled with a persistent reduction of the inflation rate. The achievement of these two objectives should facilitate the creation of new employment opportunities and a more solid basis for a sustained increase in real salaries. At the same time a larger share of the benefits of economic growth should be channelled to the poorest segment of the population.
In quantitative terms, Government is aiming at an average annual growth rate of 5.8 % between 1995 and 2000. To achieve this objective, a 3.5 % of productivity increase, with special reference to the public sector, will be necessary.
As far as the priority sectors are concerned, education and physical infrastructure will be the first two sectors in the Government agenda. Investments in infrastructure are, at present, lacking. Government stands ready to encourage investments from the private sector in this area.
Immediate perspectives for next year point to an economic growth of around 6 %, an inflation rate lower than 8 % and an unemployment rate of about 5.5 %.
It is expected that the growing economic and political stability will stimulate foreign private investments while public investments should continue to show the dynamism of recent years.
2.4 Project Promoter or Initiator
The promoter of the Project is the Company "lntertransports Centre S.p.A., a joint stock Company established in Italy, Via F. Ferrucci, 57, Prato, with a share capital of 24,000,000,000 ITL.
lntertransports Centre S.p.A. has gained a considerable experience in the field of industrialised building industry, also through controlled and shared Companies as lntervladsever (Russia), lntervaladles (Russia), La Nuova Legno S.p.A. (Italy). lntertransports Centre S.p.A. will own 51 % of the shares of the new Company.
The other 49% of the shares will belong to the Chilean Company "Concretes y Paneles Quinta Region Ltda", Plaza de la Justicia 45, 8° Pi so, Valparaiso.
The Company "Concretes y Paneles Quinta Region Ltda" was established with the specific purpose to invest, in joint-venture with lntertransports Centre S.p.A., in the
27

construction of a plant for the production of prefabricated reinforced concrete houses, following the "RAPID CASA" system, in Chile.
The partners of "Concretos y Paneles Quinta Region Ltda" hold important parcels of shares and own many anonymous companies of great economical importance in Chile.
Their main business is in the shipping and harbour fields. They are important shareholders in the Chilean shipping Company "L'lnteroceanica S.A." and the "Caba Froward S.A." too and are in the control party of these Companies. The "Caba Froward S.A." owns harbour service Companies and sea terminals.
The same group invested also in the forest and mining field and in manufacturing companies.
2.5 Project History
The Project idea is of 1994, when lntertransports Centre S.p.A. verified the possibility of establishing a Joint Venture with a Chilean partner in a project of houses manufacture. It asked SACE for a buyer's credit guarantee, and requested UNIDO for independent assessment on the market potential of the proposed technology in Chile, as well as on the profitability of a Project of implementation of a factory in the same Country. The independent assessment will be used for commercial purposes ..
2.6 Basic characteristics of the Project and their impact on the Feasibility Study
The implementation of the Project is based on the following:
- the utilisation, for the factory for th'e production of prefabricated structures, of a technology which has been utilised, developed and improved in Italy for a long time (technology RAPID CASA);
- the insurance coverage by SACE, Italy, for the acquisition of financial support to export, in the framework of the Italian law number 227 (24.5. 77), which foresees a maximum value for the export credit of 85% of the contract value, with the condition that the amount of the credit would concern Italian goods only.
Because of the constraints imposed by these two conditions, the objective of the Feasibility Study has basically concerned the verification of the following aspects:
suitability of the production technology proposed, to the socio-economic situation in Chile;
- existence of a potential market in the Project area capable, in principle, to absorb the scheduled production of the factory (i.e., to absorb the product of the Project);
- congruence between the building types utilised in the Country and the building types which are foreseen to be produced through the RAPID CASA technology;
- financial profitability of the Project.
28

2. 7 Preparatory studies and related investigations
No preparatory study or special investigations are needed in the framework of this Project.
The Project implementation is conditional upon the granting of insurance coverage by SACE and the credit financing provided by a primary bank organisation.
The production process is well-known and tested; therefore, no special investigations were required. The Study, therefore, concentrated on the identification and analysis of the various cost items. Supplementary information, including site survey and costs of raw materials are being provided by the local Partner.
29

CHAPTER 3 - MARKET ANALYSIS AND MARKETING STRATEGY
3.1 Salient features of the construction sector in Chile
- Chile has developed an efficient private construction industry in housing, particularly during the last ten years. Most formal construction Companies belong to the Construction Chamber, which seems very effective in representing the interests of its members and in promoting industry.
- In 1993, the last year for which official data are available, the construction industry directly accounted for about 6 % of GNP and employed approximately 400,000 people (8 % of total employed labour force) 1. According to the provisional data for 1994, the rate of increase of the construction industry declined sharply (from 14 % in 1993 to 2.0 in 1994), bringing down the contribution of the sector to 5.5 %. Available projections for 1995 point to a slight recovery(+ 5.3 % over the previous year) in the rhythm of growth, which is insufficient, however, to keep pace with the overall GDP growth(+ 6.0 %).
- This deceleration in the rhythm of the sector's expansion, however can be considered as physiological after the two booming years of 1992 and 1993 (plus 12.8 and 14.0 %, respectively).
- The cost of constructing an acceptable quality house varies greatly depending on local conditions of land, material supply and transport costs. In the Metropolitan Region of Santiago, a basic house of 50 m2 costs less than 480 UF and a house on the private market of 100 m2 costs around 3,000 UF2
.
- In general, there is still sufficient land supply around Santiago and Valparaiso. However, the availability of adequate infrastructure (with special reference to sewerage) may be a constraint in certain areas of the Santiago Metropolitan Region, and, in the Fifth Region as well (with special reference to Valparaiso).
- After a decade of five significant drops (1981-89), unit prices started to move upwards over the last years.
Economics of scale, confidence of adequate demand, greater specialisation of construction firms, simplification of permit and inspection procedures, are all elements which are being offset by the strong expansion in the construction activity and increases in labour cost and building materials. From 1990 to 1993, the number of square meters for the whole construction sector increased steadily up from 6.2 million to about 10 million. At the same time, the size of the houses showed a trend towards smaller apartments, with particular reference to the private market.
1 However, when indirect production and employment effects (i.e. for materials, furnishing, appliances) are taken into account, the contribution to GNP increases significantly. 2 By way of comparison, housing costs in the isolated regions of the extreme south are more than double those of Santiago.
30

3.2 Data and projection methods for market analysis
3.2.1 Data
Data needed for market analysis can be grouped into the following categories:
a) General economic indicators affecting the demand of the final product such as population, income per capita, growth rate of GDP and income distribution.
b) Government policy "vis-a-vis" the product in question, with special reference to sales taxes, subsidies and/or encouragement measures to the construction enterprises, exchange regulations, credit policy, etc ..
c) Present level of domestic production (quantities and values) over a certain number of years in general and/or in the two selected Project areas.
d) Critical production factors, such as labour availability.
e) Government production targets to meet the requirements of local demand.
f) Psychological attitude and consumer preference toward the product under consideration.
3.2.2 Demand forecasting method
From a theoretical point of view, several methods of data evaluation and demand forecasting can be used. As far as data evaluation is concerned, most of the data obtained from one source were cross-checked with similar or indirect data obtained by other sources, with special reference to official sources. A case in point refers to the Government calculation of housing deficit. Two different estimates were available:
- one, produced by the Ministry of Housing and Urbanism (MINVU), reached a value of 600,000 units as a minimum housing requirement up to year 2000;
- the other one, produced by the Ministry of Planning, ended-up with a value of more than 900,000 units.
An analysis of these two different data revealed that they underlined two different concepts, with a complete different view.
This brings us to the methods of demand determination used for the Project under consideration.
Initial annual housing need was determined by taking into account population growth rate in each of the two Regions selected and dividing by average family size. To this a coefficient of "nuclearisation" has been tentatively applied, to take into account the problem of "doubling-up" of families (more than one family per dwelling).
31

The resulting figures have been compared for consistency with the plan of the MINVU for the Country as a whole by taking on a "pro-rata basis" the relative weight of both the Metropolitan Region of Santiago (about 40% of the total) and the Fifth Region (10 %).
3.3 Determination of market size for houses
3.3.1 Size and composition of present effective demand
- Population increase and growth of urban areas largely bypassed the Country's investment capacity with the result of a widespread housing deficit3
. It has been estimated that, at the Country level, more than 500,000 families living as "allegados" are affected by housing shortfall while an extra 150,000 are living in sub-standard condition.
- The MINVU has calculated that, in order to prevent the situation to worsen, a minimum of annual need of 85.000 units is required, for a total amount of 600,000 housing units up to year 2000. This amount would cope with population growth and deterioration of the housing stock.
- A different approach, leading to a higher figure, is followed by the MIDEPLAN (Ministry of Planning). According to this view, the Census of 1992 had detected unsatisfied housing needs of about 900,000 units 4 at national level, coming from the following two components:
a) the difference between dwellings without housing (3.706,090) and housing units occupied by present persons (3, 101.356);
b) the needs of "reposicion", up to an amount of 300,000 housing units.
This figure of 900,000 however, has to be considered as a "potential" untapped demand resulting from the number of "Hogares" and "Nucleos" at present without housing.
Moving, in the same vein, from national to regional level or, more precisely, to the two specific Regions of the Project, the corresponding number of "allegados" was estimated at 385,000 people (42. 7 % of the total) for Santiago Metropolitan Region and 73.000 people (8.1 %) for the Fifth Region.
When those figures are broken-down according to the available income distribution (see Table 111-1 ), it appears that more than 90 % of the housing needs of Santiago Metropolitan Region and of the Fifth Region (i.e. 342,710 and 65,884 respectively) refer to people belonging to the first four income classes (that is up to a maximum of 75,547 pesos or 6.5 UF per-capita per month and, assuming an average of 4 persons per family, of 17 UF per "hogar")5
.
3 Practically all towns are affected by this problem. 4 According to the most recent information, this figure has moved up to about 1.000.000 housing. 5 It is worth noting that while population belonging to the first four quintiles amount up to 78 per cent of the total in Santiago and 84 per cent in the Fifth Region, their corresponding share of income is of barely 36 per cent in the first area and about 49 per cent in the second. Therefore the bulk of purchasing power is concentrated in the fifth quintile, whose average income per "hogar" and per month approximates 213,000 pesos in Santiago and 160,000 pesos in the Fifth Region. Maximum values, however, range from 1.3 million (Fifth Region) to 2.5 million pesos (R.M. Santiago), that is from 111 UF to 214 UF)
32

However, these requirements very unlikely are going to be met by actual construction. Over the last few years, the number of standard houses constructed passed from an yearly average of 80,000 (1989-91) to an average of 110,000 (1992-94), while housing initiated in 1993 reached a number of 50-55 thousand units in Santiago Metropolitan Region and 10 thousand in the Fifth Region.
A) Metropolitan Region MgotbJ~ io~crn~mc "b.Qga('6
Housing number Percentage Total % guint. Per-Ca12ita of total
(pesos) (pesos)
I (up to 15,457 $) 52,703 7 13.7 41,366.8 2.0 8,823.9
II (from 15,457 to 26,015) 110,579 28.8 91,503.2 5.9 20,905.4 Ill (from 26,015 to 41,977) 101,635 26.4 137,326.9 10.8 33,732.6 IV (from 41,977 to 75,548) 77,793 20.2 203,019.2 17.2 55,918.0 V (75,548 and above) 41,904 10.9 673,582.8 64.2 212,917.3
Total 364 6:1.~ lQQQ 26.~ . .46.2.~ lQJlQ zs ... ~10.6 B) Vth Region
I (up to 15,457 $) 12,688 17.4 43,297.4 4.6 9,649.0 II (from 15,457 to 26,015) 21,820 30.0 87,392.6 9.3 20,641.6 Ill (from 26,015 to 41,977) 17,088 23.5 128,216.7 13.2 33,766.4 IV (from 41,977 to 75,548) 14,308 19.7 194, 171.2 22.1 56, 191.0 V (75,548 and above) 6,852 9.4 488,736.6 50.8 159,658.0
Total 1.2..l;lQ 1!lQ..Q j6La.2Z 1QQJl 55 772 2
Table 111-1 - Unsatisfied housing requirements by income class, 1992 [General note: monetary income "per-capita" is composed by the three following components: a)
Salary; b) Pensions and c) Poverty subsidies.]
A more realistic estimate of housing requirements, therefore, should take into account the actual planning of the MINVU on one side and that segment of purely and highly volatile private market incorporating housing units ranging from 1,700 to 3,000 UF on the other.
The housing planning of MINVU is based on demographic growth and on the need to renew the housing stock to prevent housing conditions from worsening. It is what it could be defined as a "minimum requirement" to maintain the "status quo"8
. On this assumption it was calculated an housing deficit of about 33,000 units per annum in Santiago Region and about 8-9,000 units for Valparaiso Region. In total, 41-42,000 units is the estimated annual deficit of these two Regions.
The bulk of these housing needs concerns the poorest segment of the population. From Table 111-2 it can be seen that the larger share of demands (i.e. 30,825 units) is
6 "Hogar": statistical unit composed by a group of people living together and constituting an independent economic unit 7 It excludes 67,927 nucleus "allegados" without any real purchasing power 8 Figures on the two components are not readily available. However, new household formation should account for about 75 per cent of the needs.
33

concentrated on the first three income classes, that is up to a maximum of 11. 7 UF. More precisely, 73.5 % (Santiago) and more than 77 % (Valparaiso) of these requirements come from these groups of people. If the fourth quintile (corresponding to 17.4 UF per "hogar") is added, percentages of 91 and 93 % respectively are obtained.
UF 3.54 7.74 11.74 17.41 57.5 Q.19 Q.11 Q.111 Q.IV Q.V
1. Deficit at national level 85 000/year
2. Deficit: Metrop. Region between (26.7) (24.4) (22.4) (17.2) (9.3) (100) 32,300 and No 8811 8052 7392 5676 3069 3300 34,000
3. Deficit: Fifth Region (35.4) (23.5) ( 18.4) (15.3) (7.4) (100) No 3009 1997 1564 1301 629 8500
IQl. (2+~) between 40,800 and No :I :lf!ZQ jQQ~~ ~ Q.ill ~ ~l!iQQ 42,500
Table 111-2 - Yearly annual housing needs, 1995
Since the quality standard of houses produced through the proposed technology is high and the construction cost cannot be significantly reduced, it is more logical to concentrate on the medium-top market of housing. The impact of the preliminary analysis for the identification of target markets for the Project products is twofold:
a) from one side, the target market is determined by that part of the population 10 on which it is concentrated the 60-65 % of the total purchasing power, with a minimum monthly income "per capita" of 75,548 pesos in 1992. This would correspond to about 3,700 housing units per annum, or 8-9 % of the whole housing deficit. As this number includes houses whose value ranges from 550 UF to about 8,000 UF, if reference is made to the structure of the private market over the last five years, it seems reasonable to focus on a market size of 900-1.000 units of 2.700 UF or more11
b) On the other side, referring to Government supported housing programmes (see point 1.14.2), taking into account the extremely low construction costs of the first two housing programmes of MINVU ("Vivienda Basica" e "Vivienda Progresiva) and very likely, also of the third zone (P.E.T.), focus should be put on the so-called "Subsidio General Unificado" Programme, whose housing units are supposed to range from 500 to 1, 500 UF. In physical terms, that means a market size of the order of 7 000 units.
9 Including the poorest group of population. 10 This population share is equal to 22 per cent of the total in Santiago Region and 16 per cent in the richer area of Valparaiso and Vina del Mar. 11 This would leave aside the remaining 2,700-2,800 units with a value from 500 to 1,200 UF for which there would be strong competition.
34

3.4 Estimate of the market development and of the expected market share for the
Investors
Taking into account the future rate of growth of the population in the two Regions under examination and the likely rhythm to renew the housing stock, the current market volume should grow by an average rate of 1.4/1.5 % per year, only due to demographic increase. On top of this, another 0.4-0.5 % increase is due to the renewing process. In quantitative term, that means an increase of 133 units in 1996, corresponding to a percentage growth of 1.9 % over 1995.
1995 Housing need
1. Valparaiso 1,301 2. M.R. Santiago 5,676
6,997
Estimated Yearly
Population Growth 1.25% 1.80%
1996 Projected
housing need (due to popu-ration growth)
1,317 5,778
1996 Yearly Housing
increase due need to renewing
process 0.4% 1,322 0.5% 5,808
7,130
To get an idea of market development until the year 2000, it is necessary to take as a basis the housing construction programme of MINVU and its minimum housing target. Table 111-3 shows the main factors of this programme.
A) Minimum target to be achieved at national level by year 200012: 600,000 housing units
B) Estimated target for a) M.R. of Santiago12:
b) Fifth Region: c) a)+b)= Total:
C) MINVU Housing construction programme (national level): 1994 1995 1996 1997 1998
-Housing Units 96,884 98,500 100,145 101,770 103,395 -Leasing 108,500 110,145 -Financial 14,469 14,410 15,022 15,266 15,509 Resources (000 pesos)
-Unit Cost 149.35 146.29 150 150 150 (pesos/m2
)
Source: MINVU
D) Estimated MINVU construction programme for:
240,000 60,000
300,000 units
1999 2000 105,020 106,645
15,753 15,997
150 150
Total 712,359
1995 1996 1997 1998 1999 2000 Total (95-
1) Santiago (Housing Units 13) 39,400 40,708 41,358 42,008 42,658
2) V Region (Housing Units 13) 9,850 10,015 10, 177 10,340 10,502
3) Total of above13 49,250 50,073 50,885 51,698 52,510
Table 111-3 - Housing construction programmes Source: Our estimates
12 The period considered begins in year 1994.
42,658 10,665 53,323
13 The year 1994 is not taken into account for our projections because it is not useful for our purposes.
2000) 246, 190
61,549 307,739
35
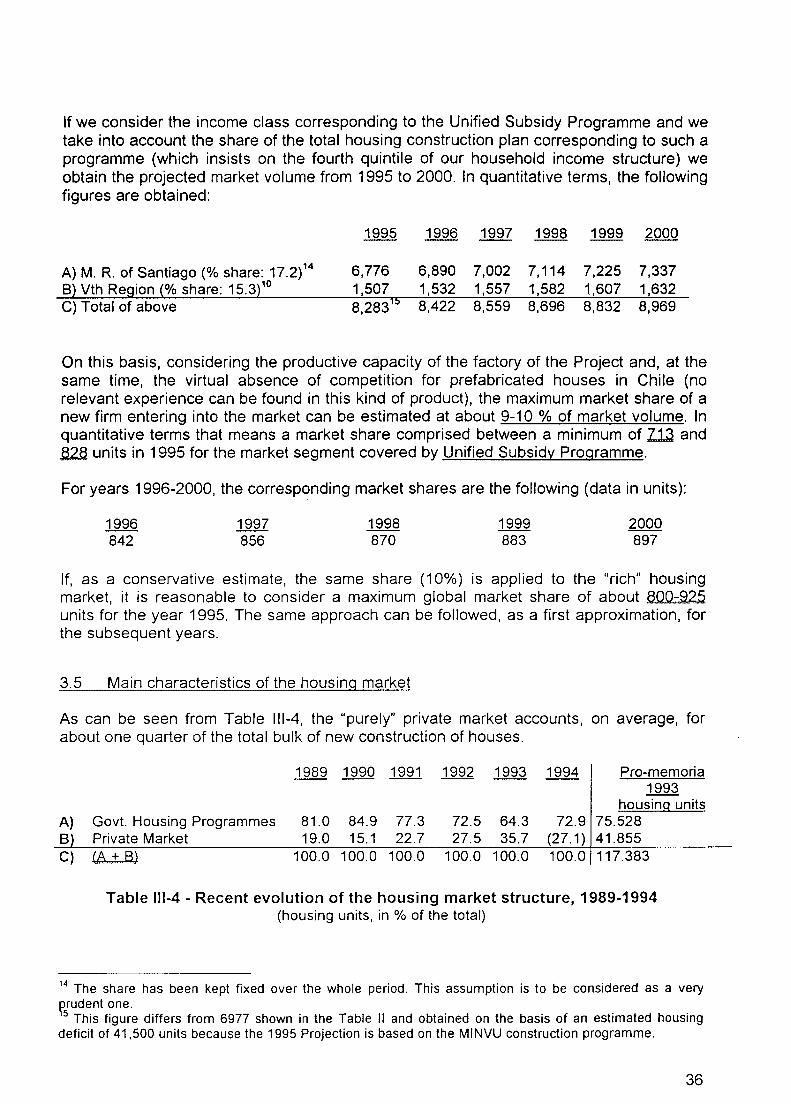
If we consider the income class corresponding to the Unified Subsidy Programme and we take into account the share of the total housing construction plan corresponding to such a programme (which insists on the fourth quintile of our household income structure) we obtain the projected market volume from 1995 to 2000. In quantitative terms, the following figures are obtained:
A) M. R. of Santiago (% share: 17 .2) 14
B) Vth Region (% share: 15.3) 10
C) Total of above
6,776 1,507 8,283
15
6,890 1,532 8,422
7,002 1,557 8,559
7, 114 1,582 8,696
7,225 1,607 8,832
7,337 1,632 8,969
On this basis, considering the productive capacity of the factory of the Project and, at the same time, the virtual absence of competition for prefabricated houses in Chile (no relevant experience can be found in this kind of product), the maximum market share of a new firm entering into the market can be estimated at about 9-10 % of market volume. In quantitative terms that means a market share comprised between a minimum of ill and ,62..6 units in 1995 for the market segment covered by Unified Subsidy Programme.
For years 1996-2000, the corresponding market shares are the following (data in units):
1996 842
1997 856
1998 870
1999 883
2000 897
If, as a conservative estimate, the same share (10%) is applied to the "rich" housing market, it is reasonable to consider a maximum global market share of about 8QQ-925 units for the year 1995. The same approach can be followed, as a first approximation, for the subsequent years.
3.5 Main characteristics of the housing market
As can be seen from Table 111-4, the "purely" private market accounts, on average, for about one quarter of the total bulk of new construction of houses.
A) 8 C)
1989 1990 1991 1992 1993 1994 Pro-memoria 1993
housing units Govt. Housing Programmes 81.0 84.9 77.3 72.5 64.3 72.9 75.528 Private Market 19.0 15.1 22.7 27.5 35.7 (27.1) 41.855 ([1.+ SJ 100.0 100.0 100.0 100.0 100.0 100.0 117.383
Table 111-4 - Recent evolution of the housing market structure, 1989-1994 (housing units, in % of the total)
14 The share has been kept fixed over the whole period. This assumption is to be considered as a very wudent one. 5 This figure differs from 6977 shown in the Table II and obtained on the basis of an estimated housing
deficit of 41,500 units because the 1995 Projection is based on the MINVU construction programme.
36

Starting with the Government Housing Programmes, it can immediately be seen (Table Ill-5) that the Unified Subsidy Programme with its percentage share of 28.6 ranks second with about 102,000 houses constructed between 1989 and 1993, immediately after the Basic Housing Programme (113,814 houses constructed over the period 1989-1993, accounting for 31.0 of the total).
1989 1990 1991 1992 1993 199416 1989-93 Percentage share
1989-93 1. Progressive Housing 5,406 2,186 2,483 8,169 8,287 10,000 26,531 7.5
17 Programme
2. Basic Housing Progr. 15,537 20,853 25,212 25,248 26,964 27,700 113,814 32.0 3. Rural Subsidy 8,088 6,307 4,910 8,353 7,477 7,500 35, 135 9.9
Programme 4. Special Programme 16,379 15,640 16,252 16,218 13,669 16,000 78, 158 22.0
for Worker (PED. 5. Unified Subsidy 12,551 21,970 19,519 18,643 19,131 19,500 101,814 28.6
Programme, of which: - First category 17,704 15,933 14,549 12,545 12,145 12,500 72,866 20.5 - Second category 3,802 4,249 3,325 4,164 5,797 5,500 21,337 6.0 - Third category 967 1, 156 883 730 780 900 4,556 1.3 - Others 78 642 762 1164 409 600 3,055 0.8
6. Total of above 67,961 66,956 68,376 76,631 75,528 80,700 355,452 100.0
Table 111-5 - Housing Units, by Government Programme
Within the Unified Subsidy Programme (USP), it is the first category (up to 500 UF of cost per unit) which is by far the most important component. More than 71 % of houses constructed under this programme belong to this category. Considering also the second category (21 %), we reach 92% of the total.
Sales prices (US$ per house) in the Unified Subsidy Programme are ranging from 8,500 -9,000 US$ (340-360 UF) for the first category to 30-33,000 US$ (1,200 - 1,320 UF) for the third category.
As far as the private market is concerned, the bulk of houses constructed have a size of a maximum 100 m2 ( 41 ,855 in 1993). The relative prices are strictly comparable with the two first categories of USP (see Table 111-6), while the housing units with an average size of more than 100 m2 but less than 140 reach a price of 2,700 UF.
First class Second class
Private Market From 36 m2 to 70 m2
From 71 m2 to 100 m2
500 UF 1,000 UF
545 UF 1,209 UF
Table 111-6 - Comparison between Unified Subsidy Programme and private market
prices
16 Estimate 17 Including the Sanitary Infrastructural Programme
37
3.6 Outline of the marketing strategy
Considering the "dualistic" character of the target market for lntertransports Centre S.p.A. (i.e. Unified Subsidy Programme on one hand and medium-high level private market on the other), it seems reasonable to outline two different market strategies.
A) Cost leadership strategy related to USP
With reference to this segment of the market, a cost leadership strategy aiming at lower costs than those incurred by competitors seems the most appropriate. Provided that a certain initial market share (or a certain position in the market) is envisageable and that a preliminary determination of the price level of the final product is possible, the cost leadership strategy will aim at low sales prices in the market of this type of product. Moreover, on the medium to long-term period, the qualitative aspect, which represents one of the main objectives of the Government social policy, could become a determinant factor for the enlargement of the market share to benefit from the "economies of scale" and improve further the investment profitability18
.
B) Differentiation strategy fro the private "rich" market
With respect to housing units of more than 2700 UF, a feasible strategy is the "so-called" differentiation strategy of the final product. That means "marketing concentration" on the uniqueness of the housing typology proposed. From this point of view, the "sensitivity" to the price element would be reduced and protection from competitors would automatically be reinforced inasomuch it binds the buyers to the brand or the firm.
3. 7 Government Housing Programmes
Presently, the public sector implements its policies through five major Programmes (see point 1.14.2): 1. the Progressive Housing Programme ("Programa de Vivienda Progresiva"); 2. the Basic Housing Programme ("Programa de Vivienda Basica); 3. the Special Programme for Workers ("Programa Especial para Trabajadores" P.E.T.); 4. the Rural Subsidy Programme (Subsidio Habitacional para el Sector Rural"), and 5. the Unified Subsidy Programme ("Sistema General Unificado de Subsidio Habitacional") 19
.
All these programmes share some common characteristics: a) they are intended to provide housing solution to "non-owners" or "homeless" people; b) they include "up-front" capital subsides provided through the Government budget to a
maximum of 70-75 % of the housing value; c) they rank potential beneficiaries through a transparent competition; d) they make optimal use of the private sector; e) they do not distort the private housing finance system; f) they are "progressive" in what subsidies are related to the level of the household
income.
18 It must be considered however that even if sales volume and relative market share increases, it may not be possible to benefit immediately from a corresponding decrease in unit costs. Only at a later stage, then, with a further increase in the market share, it would be possible to benefit from the above mentioned "economies of scale". 19 In addition, there is a related programme supported by a loan of 40 millions from A.l.D. ("Projects MINVUAID N° 513-H6-01 O") to increase the participation of the private sector as well as Government institutions and NGO's in the area of mortgage credit.
38

The main and most significant difference among these programmes relates to the final value of the house on the market.
Hereafter, the main characteristics of each individual programme, are highlighted (with the exclusion of the Rural Subsidy Programme, which goes beyond the scope of this Study).
A) Progressive Housing Programme ("VIVIENDA PROGRESIVA")
This programme is focusing on individual families or organised groups without their own housing and sharing the status of "allegados". It has been designed for very-low-income families (first quintile), that is between 0 and 3 UF. The programme is implemented in two steps. House sizes is approximately of 14 m2. House value is about 140 UF (3,500 US$) for the first step and 70 UF (1, 750 US$)20 for the second one.
Each step is financed as follows:
First Step Second Step Total Minimum saving 8 UF 5 UF 13 UF Subsidy 132 UF 18 UF21 150 UF Credit Serviu22
--------- 47 UF 47 UF 140 UF 70 UF 210 UF
B) Basic Housing Programme ("VIVIENDA BASICA")
People without housing are the target group. Basic Housing Programme (BHP) is intended mainly for families whose level of income is comprised between 3 and 8 UF. Average houses size equals 38 m2. Values of the housing range from 200 to 330 UF23
.
The BHP contracts with private contractors for the· design and constructions of small completed houses. The financing mechanism is the following:
Minimum saving Subsidy Credit SERVIU 18
SERVIU's modality 10 UF
140 UF 100 UF
C) Special Programme for Workers (P.E.T.)
Private modality 20 UF 140 UF
100 UF at maximum
This programme (Decreto de Aplicacion 235/85) is intended for organised groups of workers whose minimum level of saving and income is apt to obtain a mortgage credit. This credit is extended by the "Banco del Estado" de Chile24 and is going to benefit families with an income of 8 to 12 UF. Average value of houses is about 330 UF while the average size is 45 m2. In summary, the financing mechanism is the following:
20 When the programme was launched the UF was 25 US$ 21 It becomes 35 UF when the first step is executed without subsidy 22 Interest rate of 8 per cent 23 330 U.F. is for Regions XI and XII only 24 By virtue of an agreement with the MINVU, the "Banco del Estado" is obliged to finance the programme
39

Minimum Saving Maximum Subsidy Mortgage credit (Banco del Estado)
Total
40 UF 90 UF
200 UF
330 UF
0) Unified Subsidy Programme ("SUDSIDIO GENERAL UNIFICAOO")
This system is regulated by D.S. 44/88. The Unified Subsidy Programme distributes subsidy certificates to lower and middle-income families (between 14 and 20 UF) to facilitate acquisition or construction of housing for three different maximum housing values: 1) 500 UF, 2) 1000 UF and 3) 1500 UF. These certificates can be used to cover a portion of the purchase price of houses located by the beneficiaries on the private housing market. For the actual housing financing, the beneficiary can take advantage of three different sources of money: a) housing subsidy; b) previous saving; c) mortgage credit from the private financing market.
The different level of subsidy and the minimum need of saving according to the three above mentioned categories of housing values are presented below:
Housing value (UF)
1. Up to 500 2. From 500 to 1,000 3. From 1,000 to 1,500 4. Urban restructuring
Amount of subsidy (UF)
130-120-110 110-100-90 90-80-70 200-190-180
50
Minimum saving (UF)
100 150 50-100-15025
The mortgage credit is obtained from the private financial market, though, in connection with the first category, there is an agreement between the MINVU and the "Banco del Estado". /
3.8 Housing supply
Statistics on housing construction are still rather incomplete; however, it appears that the number of standard houses constructed in the two most recent available years, (1992 and 1993), more than covered new housing need. According to the official statistics, against an average housing requirement of about 85,000 units at national level, actual construction reached 105,669 units in 1992 and 117,383 in 1993. Preliminary estimates for 1994 indicate a decline of 6 % with respect to the preceding year, for an absolute number of little more than 110,000 units. As a consequence of the restrictive measures adopted by the Government to reduce public spending (and, hence, inflation) as well as the deteriorating terms of trade, in 1994 housing investment recorded a decline of 4.5 % in real terms over 1993. This figure results from an increase of 9.7 % in public investment and a decrease of 7.2 % in private investment (see Table 111-7).
25 According to the housing value
40

A) Housing - Public - Private
8) Infrastructure - Public - Private
-4.5 % + 9.7 % - 7.2 %
+6.5 % + 19.7 % + 1.4 %
Table 111-7 - 1994 Investment in housing and infrastructure (changes in real terms)
The Metropolitan Region (M.R.) of Santiago is mainly responsible for this decline. In fact, in terms of square meters constructed, the M.R. showed a decline from about 3. 7 million to an estimated value of 3.2 million in 1994, while for the other Regions taken together it appears an increase of about 200 thousand m2. It is worth to stress that a less negative trend can be detected for the number of housing units constructed. No detailed information was available for the Fifth Region (Valparaiso) but it is to be thought, that this Region behaved along with the other ones. In summary, as can be seen from Table 8, the share of both the Fifth Region and the M.R. of Santiago in total national construction moved from 54.5 % in 1989 to 58.3 % in 1993. In 1994, preliminary estimates show a decline of the relative weight of the M.R. of Santiago (43.8 %), compensated by an increase of the share of the all other Regions taken together. However, as mentioned before, the decline of the M. R. of Santiago in 1994 has been more evident in terms of square meters occupied than in terms of number of units, which seem to indicate the orientation of housing supply towards houses of smaller sizes.
1989 1990 1991 1992 1993 A) Total number of housing 83,891 78,621 87,500 105,669 117,383
constructed, of which: - Vth Region 6,869 7,127 6,726 10,433 10,866 - M.R. Santiago 38,846 34,927 42,601 49,441 57,519
8) Percentage share 100 100 100 100 100 - Vth Region 8.2 9.1 7.7 9.9 9.3 - M.R. Santiago 46.3 44.4 487 46.8 49.0
Table 111-8 - Housing construction in Santiago M.R. and Fifth Region Source: Camara Chilena de la Construccion and our estimates
199426
112,000
........... 49,000
100
43.8
A certain recovery is expected in 1995. From this point of view, it is revealing the estimated increase is the number of employed workers from Oct. 1994 on, as well as the concomitant increase in the use of basic material inputs. Overall, sector investments are expected to increase by around 6 %27 in 1995, while relatively optimistic expectations are
26 Estimates 27 Of which more than 7 per cent from the private sector and 3.8 per cent from the public sector.
41

looming at medium-term, in view of the foreseen relaxation of the stringent government budget for next 3-4 years. Coming to the size and the structure of the housing supply, the 1992 Census counted 3.1 million houses in Chile, both in rural an urban areas, of which 91.1 % were constructed of permanent material. With reference to the urban areas only, this percentage reaches the values of 93.0 and 92.4% respectively in the Metropolitan Region and in the Fifth Region. Most housing in Chile is one family and owner-occupied (7 4.2 % in Santiago and 79.0 percent in the Fifth Region), while apartments account for less than 15 % and 11 % in the two Regions respectively. Most housing units (61 % in 1989) are of one floor only, while two-floor houses accounted for 23. 5 %. At national level, more than 65 % of houses are owner occupied, while the rental market is rather limited for both cultural and political reasons. Mobility is low. Government policy emphasises home ownership by assisting families in acquiring their own home. At the same time, the Government is an important organiser of demand and supply, though actual design and construction is performed almost entirely through the private sector. In 1993, more than 99 % of total new constructions were performed through the private sector.
M.R. Santiago Fifth Region Total Count[Y Total 1,185.7 (100.0) 3, 14.4 (100.0) 2,594.4 1. Permanent housing, of which: 1,091.2 (92.0) 290.6 (92.4) 2,392.9
Houses 879.5 (74.2) 248.4 (79.0) 2,060 Apartments 174.6 (14. 7) 34.7 (11.0) 254.1 "Pieza en casa antigua o en conventillo" 37.2 (3.1) 7.5 (2.4) 78.3
2. Semi-permanent housing 93.4 23.5 199.9
3. Mobil housing 0.2 0.1 0.6
4. Other, not specified 0.9 0.2 1.9
Table 111-9 - 1992 Census - Urban Housing (Number in '000) Source: Camara Chilena de la Construccion
3.9 Identification of products to be marketed and sales programme
(100.0) (92.2) (79.4) (9.8)
(3.0)
As specified in Chapter 1, the production factory selected by lntertransports Centre S.p.A. was designed so as to allow a well defined production (Reference Production Programme; see Table 111-10).
In the framework of this Feasibility Study (see Chapter 1 ), the production programme was considered as an input, and an activity of optimisation of the product in order to have it fitting better with market requirements was excluded. In fact, this would have brought to a possible modification of the design of the factory, which was excluded by lntertransports Centre S.p.A..
On the other hand, the analysis of the market pointed out the existence of a great variety of building types, with an extremely wide range of sales prices.
42

~ w
INTR0101.XLS N° 2
YEARLY PRODUCTION - -
m2/unit n° units/building n° buildings A
IH 40/B type 40.40 1 150 IH 40/28 type 40.40 2 200
total A 350
B two-floor, two-units type 118.80 2 54
c four-floor, sixteen-unit building 90.00 16 18 (4 units/floor; ground floor+ 3 floors; balcony excluded)
-- ---
total A+ B + C 422
Table 111-10 - Reference Production Programme
3
tot units total m2
150 6,060 400 16, 160 550 22,220
108 12,830
288 25,920 --
946 60,970

This has caused the necessity of an evaluation of cost characteristics of the house-types manufacturable through the proposed factory, to be compared with the price characteristics of the existing market. Through this comparison, an assessment of products to be manufactured and marketed, was performed.
Chapter 4, includes a detailed analysis of production costs for the three reference house types in the Project. In Chapter 7 and 8 there is a description of personnel involved and relative costs. Relevant data are summarised in both Table 111-11 (showing dedicated direct costs for the. construction of the houses, including all raw materials and dedicated personnel), and Table 111-12. Table 111-12 includes a cost item, called "overhead cost", which refers to fixed yearly production costs and takes into account depreciation of the investment costs (overheads). The depreciation has been calculated very roughly (in accordance with the limits of the objective of the analysis in this paragraph), assuming a recovery of investment costs in five years (translated into yearly costs equal to 20% of the total investment costs).
Cost figures of Table 111-12 provide very important information for the identification of the marketing programme.
This programme was selected through a comparison with the real market of typical houses in the Country and with the sales prices in the various ranges of building standards.
Relevant data of this comparison are summarised in Table 111-13, where a typical and representative situation is shown, that of civil building constructions in 1993, with reference to the highest sectors of the market.
Sales price per square meter ranges between 7.19 UF and 41.05 UF, or between 5.99 UF and 39.85 UF, if the cost of urbanised land is excluded from the sales price of the building.
The three types of buildings capable of being produced through the proposed factory are compared with typical building requirements of the market from both the points of view of surface per unit and of compatibility between production cost and sales price.
The comparison excludes the utilisation of IH40/A construction type, unless it is used in double-module houses, with a net surface of some 80 m2
. In this case, IH40/2B type may fit with requirements of Unified Subsidy Programme (third top range) type houses and with the private market (for limited surface}, while the two-floor, two-unit buildings fit with requirements of the private sector only (starting from 71 m2 of net surface) and the fourfloor, sixteen-unit buildings fit with requirements of Unified Subsidy Programme (third top range) type houses and with private sector requirements (in the range 71-140 m2
). In the view of the financial analysis (Chapter 10), the production programme shown in Table 111-14 has been assumed.
Type of building
Unit surface (m2)
Total surface (m2)
Total units(-) Reference sales price (UF/m2
)
Reference sales price (Pesos/m2)
IH40/2B
80.80 22,220
275 15.25
178,349
Two-floor two-unit
118.80 12,830
108 20.00
233,900
Four-floor 16-unit
90.00 25,920
288 18.00
210,510
Table 111-14 - Production and sales programme (data per year)
44

INTR0101.XLS N° 10
TOTAL DIRECT COSTS DEDICATED TO PRODUCTION
IH40 TYPE m2 = 22,220
pesos/year pesos/m2
RAW MATERIALS CONSTRUCTION 803,007,650 36,139 RAW MATERIALS ASSEMBLING 331,840,220 14,934 FINISHING 1,227,982,000 55,265 DEDICATED FACTORY PERSONNEL 74,100,000 3,335 DEDICATED YARD PERSONNEL 29,250,000 1,316
2,466, 179,870 110,989
2-FLOOR,2-UNIT mz = 12,830
pesos/year pesos/mz RAW MATERIALS CONSTRUCTION 483,309,438 37,670 RAW MATERIALS ASSEMBLING 210,237,680 16,386 FINISHING 540, 111,640 42,098 DEDICATED FACTORY PERSONNEL 38,870,000 3,030 DEDICATED YARD PERSONNEL 34,125,000 2,660
1,306,653, 758 101,844
4-FLOOR, 16-UNIT m2 = 25,920
pesos/year pesos/m2
RAW MATERIALS CONSTRUCTION 792,027,912 30,557 RAW MATERIALS ASSEMBLING 362,020,780 13,967 FINISHING 1,052,624,010 40,610 DEDICATED FACTORY PERSONNEL 60,385,000 2,330 DEDICATED YARD PERSONNEL 29,250,000 1,128
2,296,307' 702 88,592
Table 111-11 - Direct costs for construction of houses (dedicated personnel included)
45
4
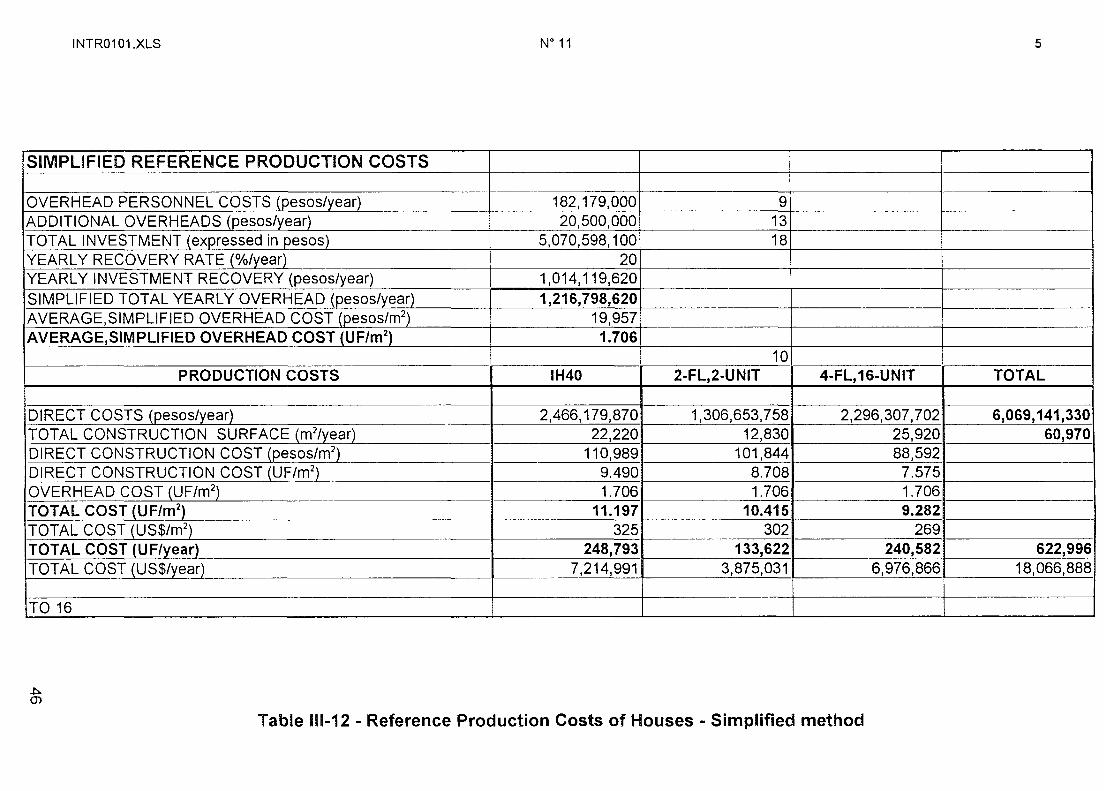
INTR0101.XLS
SIMPLIFIED REFERENCE PRODUCTION COSTS
OVERHEAD PERSONNEL COSTS (pesos/year) ADDITIONAL OVERHEADS (pesos/year) TOTAL INVESTMENT (expressed in pesos) YEARLY RECOVERY RA TE (%/year) YEARLY INVESTMENT RECOVERY {pesos/year) SIMPLIFIED TOTAL YEARLY OVERHEAD (pesos/year) AVERAGE.SIMPLIFIED OVERHEAD COST (pesos/m2
}
AVERAGE,SIMPLIFIED OVERHEAD COST (UF/m2)
PRODUCTION COSTS
DIRECT COSTS {eesos/l'.ear} TOTAL CONSTRUCTION SURFACE {m2/]'.ear} DIRECT CONSTRUCTION COST {eesos/m2
}
DIRECT CONSTRUCTION COST {UF/m2}
OVERHEAD COST {UF/m2}
TOTAL COST (UF/m 2)
TOTAL COST (US$/m2)
TOTAL COST (UF/year) TOTAL COST (US$/year)
TO 16
.::.. (J)
N°11
182, 179,000 9 20,500,000 13
5,070,598, 100 18 20
1,014,119,620 1,216,798,620
19,957 1.706
10 IH40 2-FL,2-UNIT 4-FL, 16-UNIT
2,466, 179,870 1,306,653,758 2,296, 307 I 702 22,220 12,830 25,920
110,989 101,844 88,592 9.490 8.708 7.575 1.706 1.706 1.706
11.197 10.415 9.282 325 302 269
248,793 133,622 240,582 7,214,991 3,875,031 6,976,866
Table 111-12 - Reference Production Costs of Houses - Simplified method
5
-
TOTAL
6,069, 141,330 60,970
-
622,996 18,066,888

.ti. -....J
INTR0101.XLS N°12
MARKETING STRATEGY
MARKET TYPE REQUIREMENTS PET SUBSIDIO 1 SUBSIDIO 2 SUBSIDIO 3 PRIVATE
71/100 m2
HOUSE UNITS BUil T IN 1993 13,669 12, 145 5,957 780 14,027 AVERAGE SURFACE (m 2
) 44.59 46.05 55.93 81.14 82.21 AVERAGE SALE PRICE (US$/unit) 8,016 8,595 15, 176 33,365 34,150 AVERAGE SALE PRICE (US$/mL) 179.77 186.64 271.34 411.20 415.40 AVERAGE SALE PRICE (UF/m2
) (rate 1993:25US$/U 7.19 7.47 10.85 16.45 16.62 AVERAGE SALE PRICE NO LAND (UF/m2
) 5.99 6.27 9.65 15.25 15.42
SUITABILITY AS FOR SURFACE IH40 YES YES NOT (IH40/2B) (IH40/2B) 2-FLOOR,2-UNIT NOT NOT NOT NOT YES 4-FLOOR, 16-UNIT NOT NOT NOT YES YES
SUITABILITY AS FOR COST/PRICE IH40 NOT NOT NOT YES YES 2-FLOOR,2-UNIT NOT NOT NOT YES YES 4-FLOOR, 16-UN IT NOT NOT YES YES YES
FINAL SUITABILITY ASSESSMENT NOT NOT NOT IH40/2B IH40/2B NOT NOT NOT NOT 2-FL,2-UN NOT NOT NOT 4-FL,16-UN 4-FL,16-UN
Table 111-13 - Selection of products (house types) to be marketed
6
PRIVATE PRIVATE
101/140 m2 from140m2
6,895 5,351 117.71 202.14 71,912 207,464 610.93 1,026.34
24.44 41.05 23.24 39.85
NOT NOT YES YES? YES NOT
YES YES YES YES YES YES
NOT NOT 2-FL,2-UN 2-FL,2-UN 4-FL,16-UN NOT

3.10 Estimate of sales/revenues
The annual sales revenues, based on the production programme and referring to the products selected (see paragraph 3.9), are shown in Table 111-15.
Type of building
Surface sold (m2/year) Ref. sales price (pesos/m2
)
Total revenues (pesos/year)
IH40/28
22,220 178,349
3,962,915,000
Two-floor two-unit
12,830 233,900
3,000,937,000
Four-floor 16-unit
25,920 210,510
5,456,419.000
Table 111-15 - Sales revenues selected for the financial analysis
3.11 Estimate of marketing costs
The marketing structure includes three people, who work under the direct responsibility of the managing director (see Chapters 7 and 8). They are located in the same office which hosts the administration of the Company.
Marketing costs include personnel costs, at the assumed rate of 12,000,000 pesos/year, and direct costs (15,000,000 pesos/year) for advertisement on newspapers and on T.V. broadcasting.
48

CHAPTER 4 - RAW MATERIAL AND SUPPLIES
In the evaluation of costs of the final product "house", all the materials and semifinished products used in the various phases of the manufacturing and finishing processes are considered here as "raw materials".
4.1 Raw materials and semifinished products needed to produce concrete panels in the
plant
Raw materials needed for one year production of concrete panels are the following:
Portland cement 525 aggregate (from mm 0.14 to mm 12. 7) iron bar (from mm 8 to 16 FeB 44K) electrically welded mesh (15x15#5 and 20x20#15) iron FeB 32K for pins and flasks iron bushes (made in Italy) polystyrene (density 12 kg/m3
, thickness from 3 to 18 mm)
Other materials needed are:
fluidifying concrete additive oil to remove forms water to clean concrete mixing equipment service water panel production water
t/year Uy ear Uy ear Uyear Uyear n/rear m /year
liter/year liter/year liter/year liter/year liter/year
10,350 54,717
1,970 1,344
31 27,550 26,854
186,000 9,000
350,000 900,000
5,465,000
The operation of the plant requires an installed electric power of 1,200 kVA.
4.2 Data and alternatives; cost estimate
In the Study, special attention has been devoted to availability and cost of the four most important materials, in the prefabrication process: cement, aggregate, iron and polystyrene.
CEMENT
The "Departamento de Estudios Camara Chilena de la Costruccion" published statistical data regarding the supplies from 1985 to 1993. Hereafter, the supplies are expressed as thousands of 42.5 kg bags, made by "Cementa El Melon" and by "Cementa Polpaico".
year 1985 Melon 13,228 Polpaico 12,998 year1986 II 12,602 II 12,496 year1987 II 14,591 year 1988 " 16,922 16, 177 year1989 17,286 18,313 year1990 18,365 18,805 year 1991 20,551 19,920 year1992 24,780 24,410 year 1993 28,623 22,982
49
The "Asociacion Chilena de Empresas Productoras de Hormigon premezclado" gives an estimate of the market of the ready-mixed concrete supplies: in the Metropolitan Region, the supplies increased from 345,877 m
3 in 1985 to 1,489,675 m
3 in 1993.
In the Country, there are three main cement producers:
"CEMENTO EL MELONS.A." "CEMENTO POLPAICOS S.A." "CEMENTOS BIO BIO S.A."
The cement factory "El Melon" is located in the town of La Calera, 110 km North-West from Santiago. The quarries used by this cement factory are a few km North near the town of Nogale. El Melon was the first cement factory in the Country (1908) and, because of its location near the areas taken into consideration for the building of the prefabrication factory, a bid for the cement supply was asked to them (see Annex 2).
Cement 525 is not produced in Chile; the characteristics of the two cements offered by El Melon Company are:
a) Melon Super cement, containing:
Portland clinker Gypsum
96% 4%
The clinker content before the gypsum addition is equal to 100%, according to the European standards.
a) Melon Extra cement, containing:
Portland clinker Pozzuolana Gypsum
78% 16% 6%
The clinker content before the gypsum addition is equal to 83%, according to the European standards.
The technical specifications of the two types of materials are included in the offer.
The offer, made on March 30, 1995, concerns a supply of 13,200 t per year. The price of the "extra" type is 55,884 pesos per t, including transport to the plant. The price of the "super" type is 61,395 pesos pert. Both prices do not include VAT (18%).
AGGREGATE
Generally in the Country there are no problems connected with aggregate extraction.
Attention however must be paid to the city of Santiago because, due to the overflowings of the rivers Mapocho and Maipo, there is a continuous check on the extraction near the river basins. Urban areas near the basins are prone to the risk of floods and, because of their high inhabitants density, are under a stricter regulation.
50

However, in the nearby of the river Aconcagua, in the Fifth Region, the problem is smaller because of the lower density of inhabitants.
Should the owner Company, taking into consideration the location of the plant in the Fifth Region, decide to extract the aggregate herself, the local Administration of La Calera will have to be asked for the permit for the extraction.
The main extraction Companies on the market are the following:
- SOCIETAD MINERA ARRIP S.A. - PETREOS S.A. - COMPANIA MINERA TECNO ARIDOS.
The aggregates, washed and mechanically riddled, are in accordance with the Chilean standards (NCH 163) and are classified as follows:
IRON
coarse gravel aggregate fine gravel aggregate sand stabilised
from 1 1 /2" to 3/4" from 3/4" to 5/16" 5/16" less than 1 1 /2"
There is an important iron and steel factory in the Eighth Region South of Santiago, that produces good material. There are also many metallurgic firms able to supply the market with finished products like smooth rods, improved bond rods and electric-welded meshes. The main production Companies are the following:
- CAPS.A. - COMPANIA SIDERURGICA HUACHIPATO S.A. - SIDERURGICA AZA S.A.
POLYSTYRENE
Due to the growth of the demand, the production of polystyrene in the Country has been steadily increasing over the last years. Excluding the packaging boxes and other containers, which are produced in big stocks for the market of transport and export of vegetables and fishes, there is a trend to an increased use of this material for the building sector also.
To present the alternative solutions, frequently adopted in the insulating field, were the use of hardboard-gypsum, fibre glass and wooden agglomerate panels.
The local Authorities of "La Florida" gave start to a programme, called "PIAT', "Programa de Incentive al Acondicionamento Termico de viviendas"; after that the "Universita Tecnica Federico Santa Maria" made experiments to put into evidence the gain in temperature and the power saving, connected to building insulation techniques. The owners whose design takes into consideration the building thermal insulation, receive financial incentives from the "PIAT'' programme under the form of a discount on the cost of the building license.
51

There are only a few polystyrene factories in the Country and among them there are:
- AISLAPOL CHILE - SHELL CHILE S.A.C. - AISLANTES NACIONALES L TOA.
A wide documentation had been asked to the AISLAPOL CHILE, that provided a complete document about the materials they produce and an offer for the following types:
3 Polystyrene density 11 kg/m
3 Polystyrene density 15kg/m
3 Polystyrene density 25kg/m
WATER
11 , 500 pesos/m3
17,400 pesos/m3
28,500 pesos/m3
The analysis of water sources is strictly connected to the choice of the area for the manufacturing plant siting. Since the most probable area is in the Fifth Region North of Santiago, in agricultural zones, mainly without aqueducts, there will be the need to drill a well. To drill a well, a permit has to be obtained from the "Direccion General del Riego".
ADDITIONAL MATERIALS INCLUDED IN PANELS
The materials for the electric and hydraulic systems, that are to be placed within the form during the production of prefabricated panels, are available in the Country. A wide range of choices is available: from the high-quality b-Ticino production of electric devices, to the various productions of hydraulic material in copper, iron, cast iron and PVC.
ENERGY SUPPLIES
As mentioned before, the plant will need an electric power supply of 1,200 .kVA. Electric equipment for electric distribution systems are available in the Country. 28
As for the electric fees, they are divided into two classes on the basis of consumption characteristics:
AT2 is a contract for a fixed amount of power; even if consumed power amount is less than stated, the contract amount has to be paid.
AT3 is a more convenient contract, called "Domanda Maxima Promedio". The average consumption of three months is calculated and on this basis the price for the following months is fixed. The calculation of the average consumption is performed every three months.
28 The Company "Transformadores L TOA" has been asked to make an offer for the supply of an oil cooled substation, divided into two sections for the BT and AT boards, according to the Chilean standards ANSI C571290. The cost of this equipment is US$ 56,200 for silicone transformer and US$ 45,450 for oil transformer.
52

In case of contract AT3, the cost per kWh is 17.846 pesos, corresponding to 0.044 US$. To this cost we must add a fixed cost of 2,578,912 pesos/month and another fixed cost of 1,215 pesos/month (in the framework of the financial analysis, only the consumption cost has been considered).
The costs of the contract, of the Project approv9I and the connection works must be evaluated; these costs vary according to the type of demand and to the kind of user. For example, the expenses for an isolated one-family house are about 550,000 pesos.
Concerning the gas, generally outside the Metropolitan Regions it is supplied by tanktrucks that fill big cylinders installed in the users' property. It is not possible to obtain supply offers without stating the precise technical characteristics of the equipment. For example, one kg of gas supplied to a small factory costs 215 pesos+ VAT. The bigger the factory, the bigger will be the gas consumption, the less will be its unit price, that may arrive for large plants at 80-90 pesos/kg. A pressurised cylinder for 2000 kg ~a 4 m3
cylinder) costs some 1,000,000 pesos; a 15,000 kg cylinder, that is 30 m , costs 15,000,000 pesos.
In Tables IV-1 through IV-7, the costs of all raw materials needed in the various phases of the production process are listed, for the three types of panels (houses) of the Reference Production Programme.
53

c.n .J::>.
IN I KU1 Ul . .AL::> W4
TYPE IH 40/B - IH 40 28 N° units= 550 rate US$/peso= Materials meas. Q/unit Q tot. pesos/ meas. unit pesos (supply) total cost (pesos)
unit lsunnlvl PORTLAND CEMENT 425 t 7.036 3,870 61,395 237,598,650 237,598,650 AGGREGATES (0.14-12.7) m' 21.455 11,800 3,200 37,760,000 37,760,000 IRON 8-16 mm t 1.464 805 250,000 201,250,000 201,250,000 ELEC. WELD. MESH (diam. 515x15) t 0.709 390 190,000 74,100,000 74,100,000 IRON-PIN-STACK (estimation) t 0.056 31 270,000 8,370,000 8,370,000 STEEL BLUSHES (estimation) n• 50.091 27,550 550 15,152,500 15,152,500
-- --POLYSTYRENE 11 kgim' m' 19.782 10,880 11,500 125, 120,000 125, 120,000 FLUID ADDITIVES liter 126.545 69,600 1,283 89,296,800 89,296,800 EXTRACTING OIL (estimation) liter 6.091 3,350 610 2,043,500 2,043,500 WATER liter 3,727.273 2,050,000 0 172,200 172,200 ELECTRIC WIRE DUCT (estimation) m 60.000 33,000 128 4,224,000 4,224,000 HYDRAULIC PIPING (estimation) m 12.000 6,600 1,200 7,920,000 7,920,000
803,007,650
TWO-FLOOR TYPE N° units= 108 rate US$/peso= Materials meas. Q/unit Q tot. pesos/ meas. unit pesos (supply) total cost (pesos)
unit (suooly) PORTLAAN CEMENT 425 I 22.204 2,398 61,395 147,225,210 147,225,210 AGGREGATES (0.14-12.7) m' 63.935 6,905 3,200 22,096,000 22,096,000 IRON 8-16 mm t 4.176 451 250,000 112,750,000 112,750,000 ELEC. WELD. MESH (diam. 5 15x15) t 3.315 358 190,000 68,020,000 68,020,000 POLYSTYRENE 11 kg/m' m' 59.056 6,378 11,500 73,347,000 73,347,000 FLUID ADDITIVES liter 400.000 43,200 1,283 55,425,600 55,425,600 EXTRACTING OIL (estimation) liter 19.259 2,080 610 1,268,800 1,268,800 WATER liter 11,731.481 1,267,000 0 106,428 106,428 _ELECTRIC WIRE DUCT (estimation) m 109.259 11,800 128 1,510,400 1,510,400 HYDRAULIC PIPING (estimation) m 12.037 1,300 1,200 1,560,000 1,560,000
483,309,438
MUL Tl-FLOOR TYPE N° units= 288 rate US$/peso= Materials meas. Q/unit Q tot. pesos/ meas. unit pesos (supply) total cost (pesos)
unit (supply) CEMENT PORTLAND 425 t 14.181 4,084 61,395 250,737, 180 250,737,180 AGGREGATES (0.14-12.7) m' 40.625 11,700 3,200 37,440,000 37,440,000 IRON 8-16 mm t 2.455 707 250,000 176,750,000 176,750,000 ELEC. WELD. MESH (diam. 515x15) t 2.069 596 190,000 113,240,000 113,240,000 POLYSTYRENE 11 kg/m' m' 33.333 9,600 11,500 110,400,000 110,400,000 FLUID ADDITIVES liter 254.167 73,200 1,283 93,915,600 93,915,600 EXTRACTING OIL (estimation) liter 12.326 3,550 610 2,165,500 2,165,500 WATER liter 7,458.333 2,148,000 0 180,432 180,432 ELECTRIC WIRE DUCT (estimation) m 82.986 23,900 128 3,059,200 3,059,200 HYDRAULIC PIPING (estimation) m 11.979 3,450 1,200 4,140,000 4,140,000
792,027,912
Table IV-1 - Raw materials for the production process at factory
I
440 eq. total cost
IUSSI 593,997
94,400 503,125 185,250
20,925 37,881
312,800 223,242
5,109 431
10,560 19,800
2,007,519
440 eq. total cost
(USS) 368,063
55,240 281,875 170,050 183,368 138,564
3,172 266
3,776 3,900
1,208,714
440 eq. total cost
(USS) 626,843
93,600 441,875 283,100 276,000 234,789
5,414 451
7,648 10,350
1,980,510

01 01
INTR0101.XLS
IH 40/B - IH 40 28 TYPE
Materials
AGGLOMERATE PORTLAND CEMENT 425 POLYSTYRENE 25 kg/m' ASPHALT LAYER P.V.C. PIPING diam. 80 BENDING, diam. 80 30°-67° PIPING BRACKETS diam. 80 30°-67° GLUE AGENT PIPING OPENING diam. 60 RESIN CLAY TILES RIDGE TILES FOAMEDINSUSLATOR
TOTAL
meas. unit
m' t
m' m' m n n kg n
Gall. n n
bag
N° 5
Number of units = 550
Q/unit Q tot supply erection (pesos/meas.un.) supply (pesos/meas. (pesos)
un.l 1.64 900 4,500 4,050,000 0.40 220 61,395 13,506,900 1.67 920 28,500 26,220,000
61.09 33,600 2,550 85,680,000 6.18 3,400 1,200 4,080,000 4.07 2,240 570 1,276,800 6.11 3,360 57 191,520 7.64 4,200 5,230 21,966,000 2.04 1, 120 1,500 1,680,000 3.45 1,900 2,850 5,415,000
1,527.27 840,000 187 157,080,000 36.36 20,000 363 7,260,000 1.84 1,010 3,400 3,434,000
Table IV-2 - Raw Materials for in-yard assembling
8
pesos/$= 400
erection total cost (pesos) eq. total cost (pesos) (US$)
0 4,050,000 10,125 0 13,506,900 33,767 0 26,220,000 65,550 0 85,680,000 214,200 0 4,080,000 10,200 0 1,276,800 3,192 0 191,520 479 0 21,966,000 54,915 0 1,680,000 4,200 0 5,415,000 13,538 0 157,080,000 392,700 0 7,260,000 18,150 0 3,434,000 8,585
331,840,220 829,601

c..n (J)
INTR0101.XLS
TWO-FLOOR, TWO-UNIT HOUSE TYPE
Materials meas. unit
AGGLOMERATE m' PORTLAND CEMENT 425 t POLYSTYRENE 25 kg/m' m' ASPHALT LAYER m2
P.V.C. PIPING diam. 80 m BENDING diam. 80 30°-67° n PIPING BRACKETS diam. 80 30°-67° n GLUE AGENT kg PIPING OPENING diam. 60+A3+A62 n RESIN Gall. CLAY TILES n RIDGE TILES n POOR CONCRETE m' ASSEMBLED CONCRETE m' IRON t WHITE CEMENT bag ELECTRIC WIRE DUCT m SHAVING AGENT (estimation) k FIBER MESH m2
TOTAL
N°5 9
Number of units = 108 pesos/$= 400 ---
Q/unit a tot supply erection (pesos/meas.un.) supply erection total cost (pesos) eq. total cost (pesos/meas. (pesos) (pesos) (US$)
un.l 3.38 365 4,500 1,642,500 0 1,642,500 4,106 0.51 55 61,395 3,376,725 0 3,376,725 8,442 1.76 190 28,500 5,415,000 0 5,415,000 13,538
97.22 10,500 2,550 26,775,000 0 26,775,000 66,938 20.83 2,250 1,200 2,700,000 0 2,700,000 6,750 6.99 755 570 430,350 0 430,350 1,076 21.67 2,340 57 133,380 0 133,380 333 67.59 7,300 5,230 38,179,000 0 38,179,000 95,448 6.99 755 1,500 1,132,500 0 1,132,500 2,831 8.80 950 2,850 2,707,500 0 2,707,500 6,769
2,326.39 251,250 187 46,983,750 0 46,983,750 117,459 37.50 4,050 363 1,470, 150 0 1,470,150 3,675 5.00 540 23,700 0 12,798,000 12,798,000 31,995 1.15 125 30,850 0 3,840,825 3,840,825 9,602 1.43 154 252,000 38,808,000 0 38,808,000 97,020 1.20 130 7,750 1,007,500 0 1,007,500 2,519
74.07 8,000 126 1,008,000 0 1,008,000 -- 2,520
125.00 13,500 1,500 20,250,000 0 20,250,000 50,625 ----~-
20.83 2,250 702 1,579,500 0 1,579,500 3.949 210,237,680 5!~.594
Table IV-3 - Raw Materials for in-yard assembling
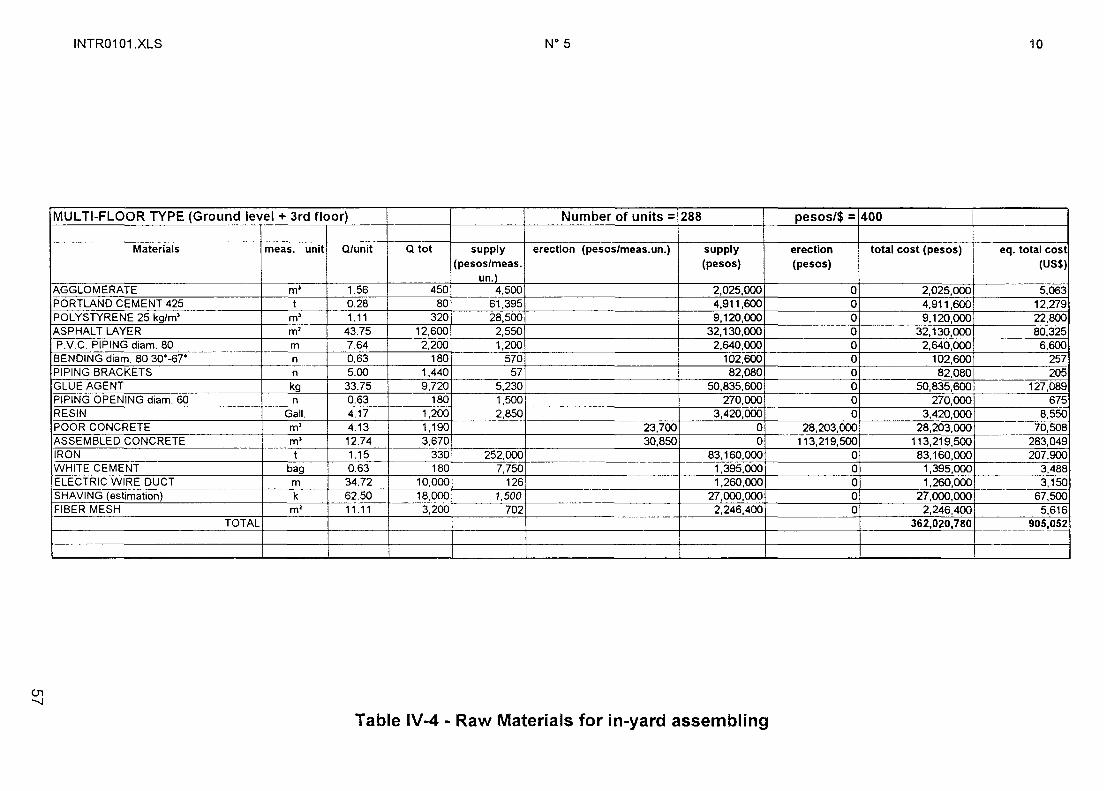
(J'1 -...J
INTR0101.XLS N° 5
MUL Tl-FLOOR TYPE (Ground level + 3rd floor) Number of units = 288
Materials meas. unit Q/unit Q tot supply erection (pesos/meas.un.) supply (pesos/meas. (pesos)
un.\ AGGLOMERATE m' 1.56 450 4,500 2,025,000 PORTLAND CEMENT 425 t 0.28 80 61,395 4,911,600 POLYSTYRENE 25 kg/m' m' 1.11 320 28,500 9,120,000 ASPHALT LAYER m' 43.75 12,600 2,550 32,130,000 P.V.C. PIPING diam. 80 m 7.64 2,200 1,200 2,640,000 BENDING diam. 80 30°-67° n 0.63 180 570 102,600 PIPING BRACKETS n 5.00 1,440 57 82,080 GLUE AGENT kg 33.75 9,720 5,230 50,835,600 PIPING OPENING diam. 60 n 0.63 180 1,500 270,000 RESIN Gall. 4.17 1,200 2,850 3,420,000 POOR CONCRETE m' 4.13 1,190 23,700 0 ASSEMBLED CONCRETE m' 12.74 3,670 30,850 0 IRON t 1.15 330 252,000 83,160,000 WHITE CEMENT bag 0.63 180 7,750 1,395,000 ELECTRIC WIRE DUCT m 34.72 10,000 126 1,260,000 SHAVING (estimation) k 62.50 18,000 1,500 27,000,000 FIBER MESH m' 11.11 3,200 702 2,246,400
TOTAL
Table IV-4 - Raw Materials for in-yard assembling
10
pesos/$= 400 I
erection total cost (pesos) i eq. total cost (pesos) I (US$) I
0 2,025,000 5,063 0 4,911,600 12,279 0 9,120,000 22,800 0 32,130,000 80,325 0 2,640,000 6,600 0 102,600 257 0 82,0801 205 0 50,835,600 127,089 0 270,000 675 0 3,420,000 8,550
28,203,000 28,203,000 70,508 113,219,500 113,219,500 283,049
0 83,160,000 207,900 0 1,395,000 3,488 0 1,260,000 ___ 3,150 0 27,000,000 67,500 0 2,246,400 5,616
362,020,780 905,052
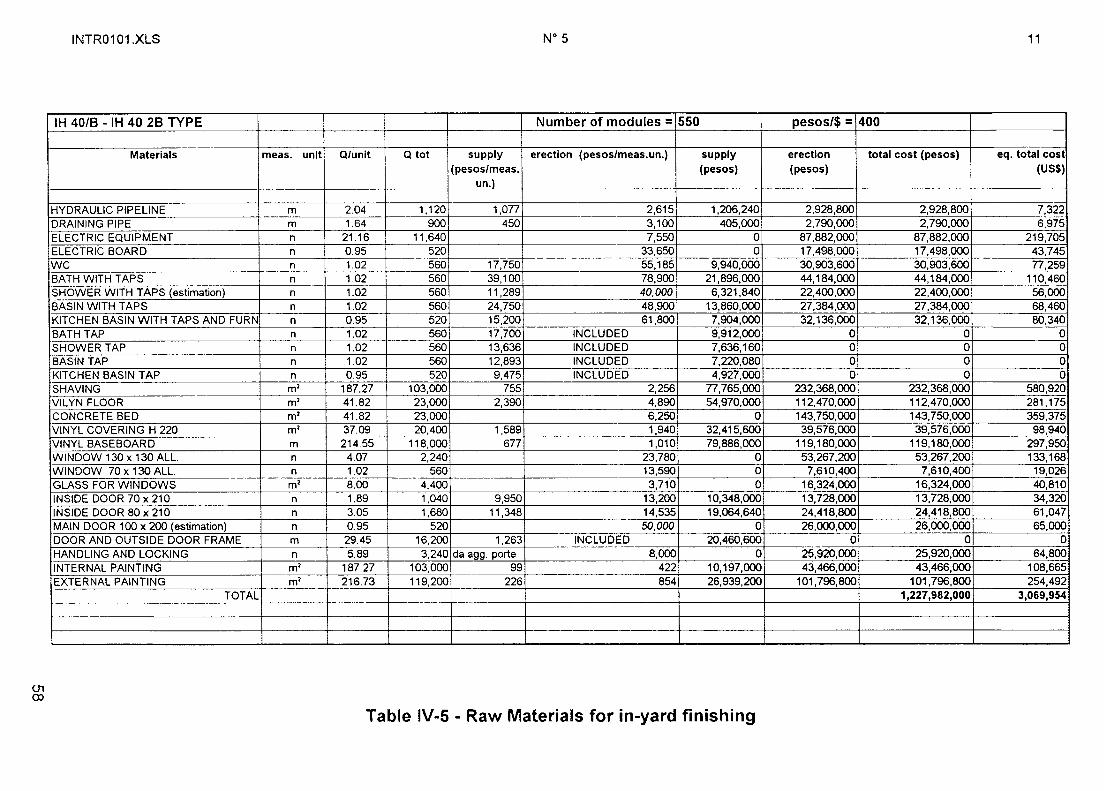
c.n CX>
INTR0101.XLS
IH 40/B - IH 40 28 TYPE
Materials
HYDRAULIC PIPELINE DRAINING PIPE ELECTRIC EQUIPMENT ELECTRIC BOARD WC BATH WITH TAPS SHOWER WITH TAPS (estimation) BASIN WITH TAPS KITCHEN BASIN WITH TAPS AND FURN BATH TAP SHOWER TAP BASIN TAP KITCHEN BASIN TAP SHAVING VILYN FLOOR CONCRETE BED VINYL COVERING H 220 VINYL BASEBOARD WINDOW 130 x 130 ALL. WINDOW 70 x 130 ALL. GLASS FOR WINDOWS INSIDE DOOR 70 x 210 INSIDE DOOR 80 x 210 MAIN DOOR 100 x 200 (estimation) DOOR AND OUTSIDE DOOR FRAME HANDLING AND LOCKING INTERNAL PAINTING EXTERNAL PAINTING
TOTAL
meas. unit
m m n n n n n n n n n n n m' m' m' m' m n n m' n n n m n m' m'
N°5
Number of modules = 550
Q/unit a tot supply erection (pesos/meas.Un.) supply (pesos/meas. (pesos)
un.l
2.04 1,120 1,077 2,615 1,206,240 1.64 900 450 3,100 405,000
21.16 11,640 7,550 0 0.95 520 33,650 0 1.02 560 17,750 55,185 9,940,000 1.02 560 39,100 78,900 21,896,000 1.02 560 11,289 40,000 6,321,840 1.02 560 24,750 48,900 13,860,000 0.95 520 15,200 61,800 7,904,000 1.02 560 17,700 INCLUDED 9,912,000 1.02 560 13,636 INCLUDED 7,636,160 1.02 560 12,893 INCLUDED 7,220,080 0.95 520 9,475 INCLUDED 4,927,000
187.27 103,000 755 2,256 77,765,000 41.82 23,000 2,390 4,890 54,970,000 41.82 23,000 6,250 0 37.09 20,400 1,589 1,940 32,415,600 214.55 118,000 677 1,010 79,886,000
4.07 2,240 23,780 0 1.02 560 13,590 0 8.00 4,400 3,710 0 1.89 1,040 9,950 13,200 10,348,000 3.05 1,680 11,348 14,535 19,064,640 0.95 520 50,000 0 29.45 16,200 1,263 INCLUDED 20,460,600 5.89 3,240 da agg. porte 8,000 0
187.27 103,000 99 422 10,197,000 216.73 119,200 226 854 26,939,200
Table IV-5 - Raw Materials for in-yard finishing
11
pesos/$= 400
erection total cost (pesos) eq. total cost
(pesos) (US$)
2,928,800 2,928,800 7,322 2,790,000 2,790,000 6,975
87,882,000 87,882,000 219,705 17,498,000 17,498,000 43,745 30,903,600 30,903,600 77,259 44,184,000 44,184,000 110,460 22,400,000 22,400,000 56,000 27,384,000 27,384,000 68,460 32,136,000 32,136,000 80,340
0 0 0 0 0 0 0 0 0 0 0 0
232,368,000 232,368,000 580,920 112,470,000 112,470,000 281,175 143,750,000 143,750,000 359,375
39,576,000 39,576,000 98,940 119,180,000 119,180,000 297,950
53,267,200 53,267,200 133,168 7,610,400 7,610,400 19,026
16,324,000 16,324,000 40,810 13,728,000 13,728,000 34,320 24,418,800 24,418,800 61,047 26,000,000 26,000,000 65,000
0 0 0 25,920,000 25,920,000 64,800 43,466,000 43,466,000 108,665
101,796,800 101,796,800 254,492 1,227,982,000 3,069,954

(J1 co
INTRD101.XLS
TWO-FLOOR TYPE
Materials
HYDRAULIC PIPELINE DRAINING PIPE ELECTRIC EQUIPMENT ELECTRIC BOARD WC BATH WITH TAP BASIN WITH TAP BIDET WITH TAP KITCHEN BASIN WITH TAP AND FURNI BATH TAP BASIN TAP BIDET TAP KITCHEN BASIN TAP SHAVING TILE FLOOR TILE COVERING H 220 CONCRETE BED (estimation) TILE BASEBOARD WINDOW 130x150 WINDOW 130 X 240 WINDOW 70 X 150 GLASS FOR WINDOWS MAIN DOOR 100 X 210 (estimation) INTERNAL DOOR 70 X 210 INTERNAL DOOR 80 X 210 DOOR AND WINDOW FRAME INTERNAL PAINTING SMOOTH EXTERNAL PAINTING ROUGH EXTERNAL PAINTING STAIR RAILING HANDLINGANDLOC~NG
LAVADERO C/RUBIN. LAVADERO TAP
TOTAL
meas. unit
m m n n n n n n n n n n n
m' m' m' m' m n n n
m' n n n m m' m' m' kg n n n
N°5
Number of modules = 108
Q/unlt Q tot supply erection (pesos/meas.un.) supply (pesos/meas. (pesos)
un.}
11.57 1,250 1,077 2,615 1,346,250 6.02 650 2,600 3,100 1,690,000 19.00 2,052 7,550 0 1.00 108 33,650 0 2.00 216 17,750 55,185 3,834,000 1.00 108 39,100 78,900 4,222,800 2.00 216 24,750 48,900 5,346,000 2.00 216 23,250 42,300 5,022,000 1.00 108 15,200 61,800 1,641,600 1.00 108 17,700 INCLUDED 1,911,600 2.00 216 12,893 INCLUDED 2,784,888 2.00 216 12,893 INCLUDED 2,784,888 1.00 108 9,475 INCLUDED 1,023,300
451.85 48,800 755 2,256 36,844,000 136.11 14,700 3,511 6,100 51,611,700 43.06 4,650 2,100 4,900 9,765,000 136.11 14,700 6,250 0 111.11 12,000 164 719 1,968,000 5.00 540 27,500 0 3.00 324 45,000 0 1.00 108 14,000 0
20.12 2,173 3,710 0 1.00 108 50,000 0 2.00 216 11,460 16,870 2,475,360 6.00 648 13, 100 20,000 8,488,800
45.00 4,860 1,263 INCLUDED 6,138,180 451.85 48,800 99 422 4,831,200 59.26 6,400 226 854 1,446,400 203.24 21,950 700 1,807 15,365,000 90.28 9,750 495 0 9.00 972 da agg. a port 8,000 0 1.00 108 39,580 60,210 4,274,640 1.00 108 7,210 INCLUDED 778,680
Table IV-6 - Raw Materials for in-yard finishing
12
pesos/$= 400
erection total cost (pesos) eq. total cost
(pesos) (US$)
3,268,750 3,268,750 8,172 2,015,000 2,015,000 5,038
15,492,600 15,492,600 38,732 3,634,200 3,634,200 9,086
11,919,9601 11,919,960 29,800 8,521,200 8,521,200 21,303
10,562,400 10,562,400 26,406 9,136,800 9,136,800 22,842 6,674,400 6,674,400 16,686
0 0 0 0 0 0 0 0 0 0 0 0
110,092,800 110,092,800 275,232 89,670,000 89,670,000 224,175 22,785,000 22,785,000 56,963 91,875,000 91,875,000 229,688
8,628,000 8628000 21,570 14,850,000 14,850,000 37,125 14,580,000 14,580,000 36,450
1,512,000 1,512,000 3,780 8,061,830 8,061,830 20,155 5,400,000 5,400,000
~· 13,500
3,643,920 3,643,920 9,110 12,960,000 12,960,000 32,400
0 0 ------0 20,593,600 20,593,600 51,484
5,465,600 5,465,600 13,664 39,663,650 39,663,650 99,159
4,826,250 4,826,250 12,066 7,776,000 7,776,000 19,440 6,502,680 6,502,680 16,257
0 0 0 540, 111,640 1,350,279
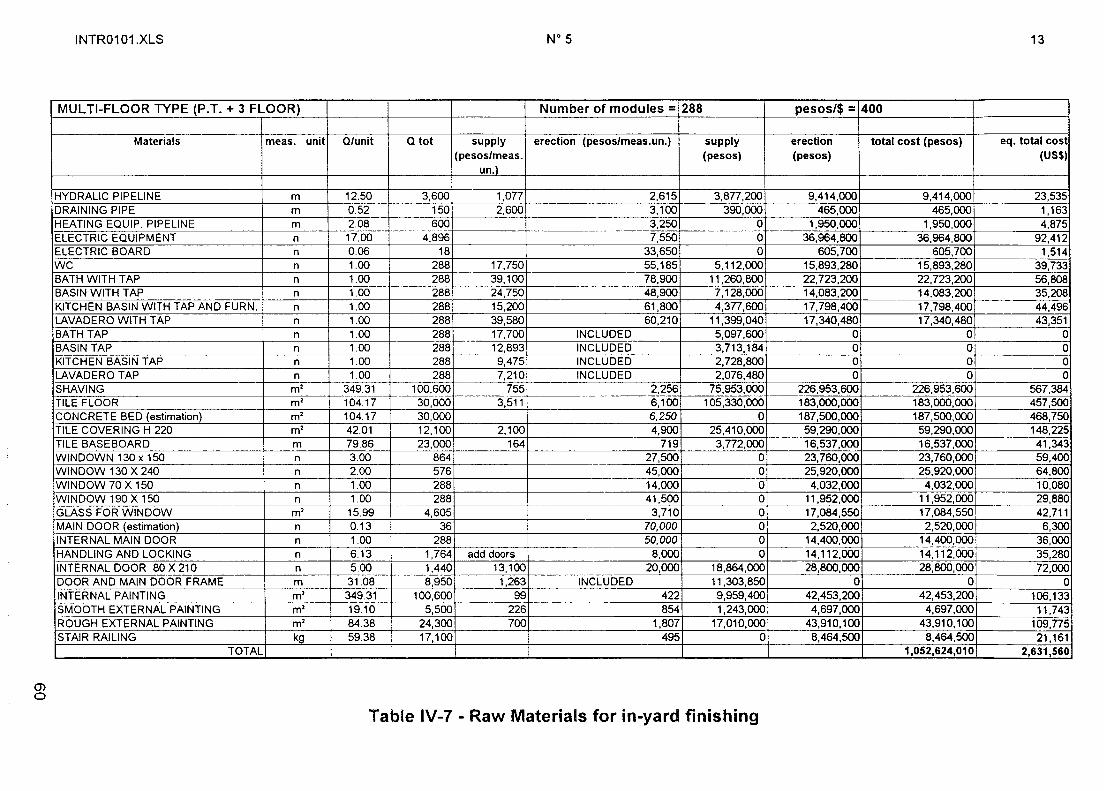
m 0
INTR0101.XLS
MULTI-FLOOR TYPE (P.T. + 3 FLOOR)
Materials meas. unit
HYDRALIC PIPELINE m DRAINING PIPE m HEATING EQUIP. PIPELINE m ELECTRIC EQUIPMENT n ELECTRIC BOARD n WC n BATH WITH TAP n BASIN WITH TAP n -KITCHEN BASIN WITH TAP AND FURN. n LAVADERO WITH TAP n BATH TAP n BASIN TAP n KITCHEN BASIN TAP n LAVADERO TAP n SHAVING m' TILE FLOOR m' CONCRETE BED (estimation) m' TILE COVERING H 220 m' TILE BASEBOARD m WINDOWN 130 x 150 n WINDOW 130 X 240 n WINDOW 70 X 150 n WINDOW 190 X 150 n GLASS FOR WINDOW m' MAIN DOOR (estimation) n INTERNAL MAIN DOOR n HANDLING AND LOCKING n INTERNAL DOOR 80 X 210 n DOOR AND MAIN DOOR FRAME m INTERNAL PAINTING m' SMOOTH EXTERNAL PAINTING m' ROUGH EXTERNAL PAINTING m' STAIR RAILING kg
TOTAL
N°5
Number of modules = 288
Q/unit Q tot supply erection (pesos/meas.Un.) supply (pesos/meas. (pesos)
un.l
12.50 3,600 1,077 2,615 3,877,200 0.52 150 2,600 3,100 390,000 2.08 600 3,250 0 17.00 4,896 7,550 0 0.06 18 33,650 0 1.00 288 17,750 55,185 5,112,000 1.00 288 39,100 78,900 11,260,800 1.00 288 24,750 48,900 7,128,000 1.00 288 15,200 61,800 4,377,600 1.00 288 39,580 60,210 11,399,040 1.00 288 17,700 INCLUDED 5,097,600 1.00 288 12,893 INCLUDED 3,713,184 1.00 288 9,475 INCLUDED 2,728,800 1.00 288 7,210 INCLUDED 2,076,480
349.31 100,600 755 2,256 75,953,000 104.17 30,000 3,511 6,100 105,330,000 104.17 30,000 6,250 0 42.01 12,100 2,100 4,900 25,410,000 79.86 23,000 164 719 3,772,000 3.00 864 27,500 0 2.00 576 45,000 0 1.00 288 14,000 0 1.00 288 41,500 0
15.99 4,605 3,710 0 0.13 36 70,000 0 1.00 288 50,000 0 6.13 1,764 add doors 8,000 0 5.00 1,440 13,100 20,000 18,864,000 31.08 8,950 1,263 INCLUDED 11,303,850 349.31 100,600 99 422 9,959,400 19.10 5,500 226 854 1,243,000 84.38 24,300 700 1,807 17,010,000 59.38 17,100 495 0
Table IV-7 - Raw Materials for in-yard finishing
13
pesos/$= 400
erection total cost (pesos) eq. total cost (pesos) (US$)
9,414,000 9,414,000 23,535 465,000 465,000 1,163
1,950,000 1,950,000 4,875 36,964,800 36,964,800 92,412
605,700 605,700 1,514 15,893,280 15,893,280 39,733 22,723,200 22,723,200 56,808 14,083,200 14,083,200 35,208 17,798,400 17,798,400 44,496 17,340,480 17,340,480 43,351
0 0 0 0 0 0 0 0 0 0 0 0
226,953,600 226,953,600 567,384 183,000,000 183,000,000 457,500 187,500,000 187,500,000 468,750 59,290,000 59,290,000 148,225 16,537,000 16,537,000 41,343 23,760,000 23,760,000 59,400 25,920,000 25,920,000 64,800
4,032,000 4,032,000 10,080 11,952,000 11,952,000 29,880 17,084,550 17,084,550 42,711 2,520,000 2,520,000 6,300
14,400,000 14,400,000 36,000 14,112,000 14, 112,000 35,280 28,800,000 28,800,000 72,000
0 0 0 42,453,200 42,453,200 106,133 4,697,000 4,697,000 11,743
43,910,100 43,910,100 109,775 8,464,500 8,464,500 21, 161
1,052,624,010 2,631,560

CHAPTER 5 - LOCATION, SITE AND ENVIRONMENT ASSESSMENT
The programme implies the building of house types described in paragraph 1.3 in the Metropolitan Region of Santiago and in the Fifth Region.
The Fifth Region is located North of the Metropolitan Region and reaches the Pacific coast. At present, in the outskirts of the urban areas, a fairly good building activity is going on in wide sectors of urbanised lots.
The East part of the Fifth Region is mainly concentrated on the agricultural sector; its location allows the production of large amounts of fruit and flowers, for both domestic consumption and export. The West side receives beneficial effects from the ocean coast. Located on the coast, Valparaiso and Vina del Mar are the places of highest urban concentration, although the town of Vina del Mar is mainly formed by intensive building for the seasonal tourism.
Along the inner state road n. 60, that drives North from Valparaiso, there are two important centres; the town of Quillota (60,000 inhabitants) and the town of La Calera (50,000 inhabitants).
A political programme foresees the building of intensive constructions in Quillota.
The town of La Calera is now in a phase of big expansion because its location is excellent for trade, transports and for mines exploitation. An increase of 15,000-20,000 inhabitants is expected within the year 2000. The ancient Cement Factory "El Melon", one of the biggest and the first one installed in Chile, is the main reason for the development of La Calera.
There is also a remarkable building activity along the state road that links Valparaiso to Limache.
5.1 Site Selection
The choice of the location of the plant for the production of prefabricated panels for building has to be careful and must take into account the areas object of the building planning.
In other words, the industrialised production of such goods should be realised in a baricentric area with regards to the places of building.
The distance between the production factory and the assembly area should vary within a maximum limit of 200-300 km, depending on the cost and the time needed for the transport, which is a function of the infrastructure connections.
The soil for the construction of the manufacturing plant has not jet been chosen or bought. Anyway the investors focus their attention on the agricultural areas near the town of La Calera.
61
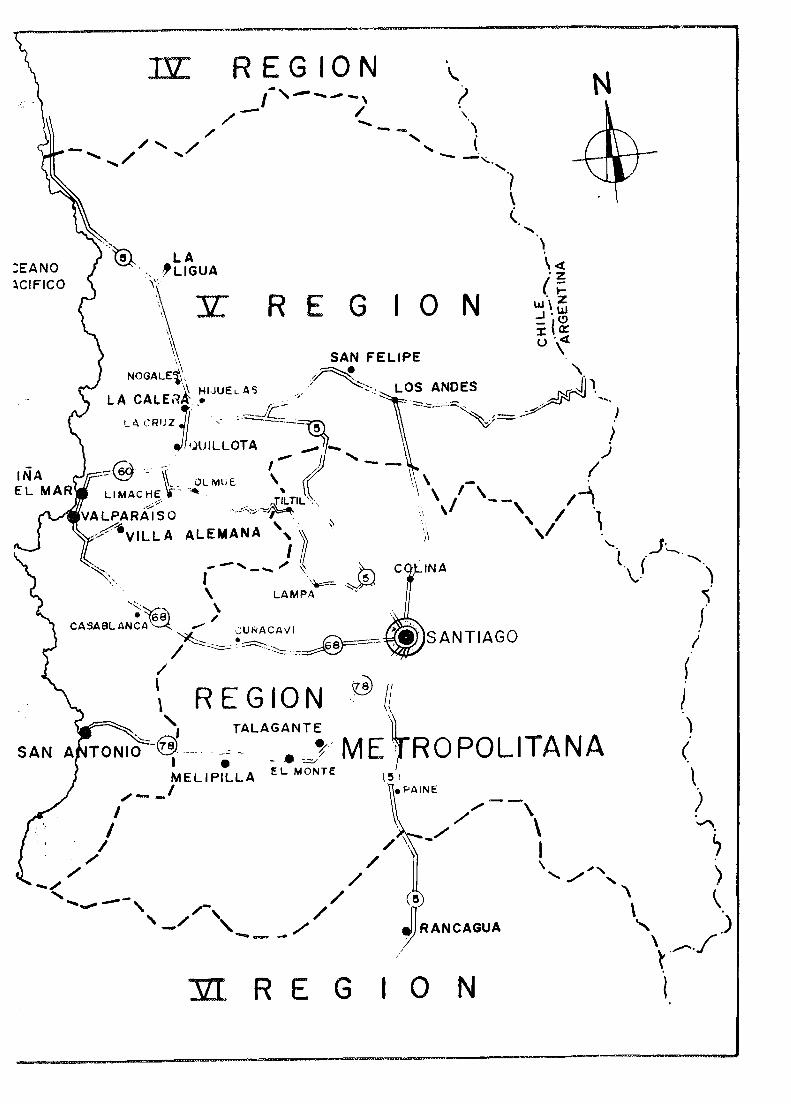
:EANO ~CIFICO
SAN
_,,
REGION ' i \
'\ (
...... ~ . ·-~~ LA \
_ 1LIGUA \ ~
'~\\. Y R E G I 0 N i\i \\ SAN FELIPE \.
N
NOGALE1\ ~ '\. ~ HI.JUEL A5 ·:..'' ~-: LOS ANDES "',_j/l.
LA CALE1~]: .• r, ;.. . --.:::::.::.:..:..c::::" ...... ~" ''·
L•CR'1ZJLlJl~L0~~1\_ \ ~,=f J c~ - ,- )J '- - I
:;-.~ --- \\_ OL MUE \ (( \.'. \ - .
LIMAC_~?'j-:. ... •' ,:r7LTI~\. '\ \ I '- - I~ VALPARAISO .·-_:,:;;-~ip+ \/ ' / .,
_,/-6VILLA ALEMANA '1 ~ ' \I ',I ~" __ , __ "" «: . ~
·> I '~W . \ LAM PA ~·
--~:Ys81 > ' CASABLANCA'O.--.£' CURACAVI ~ ..
/ ~c:.::=·~:~~ _.,~ .• SANTIAGO
/
\ R E G I 0 N ·~ {/ . '1 TALAGANTE ,'~
TONIO---~~·.---·-~'- ,. ME·~ ROPOLITANA I • - • :.:::/ MELI PILLA ~L MONTE l~ i
I ( ) )
( \
I I
I /
/
,, __ , ...... --, )
/ \ """· // \ ~/ I 7
\ """' ) / '-./ ' ' -----' / c~ ' c /-, / \ \
/ '-- - ~ IT ..... .) ,,,. ./ R ANCAGUA ' I \~ ,,.-• ./
'
R E G 0 N t

The negotiations are still pending which is why it was not possible to analyse a particular solution.
Two areas, object of analysis and preliminary negotiations, have been visited: they are both located along the Panamericana road that leads from Hijubelas to Llaillay (see enclosed planimetry).
The first one is in front of the street, near to the Aconcagua river, and for this reason, even though it is agricultural land, the ground should be pebbled and hard enough.
The second one is only a few km away from the first one and is limited by the Panamericana road and the railway parallel to this road. This land is for agricultural usage and has rights on a wood located one the other side of the road. The plot has an extension of 5.5 ha, is from 60 to 150 m wide and has the street side 500 m long.
The railway that runs along it, transports goods from Valparaiso to Los Andes (area near the Argentina border); the requested price is 12,000,000 pesos/ha, for a total of 66,000,000 pesos. The planimetry of the visited soil is enclosed. In our opinion, anyway, the sizes of this land is not suitable to the characteristics and requirements of the proposed factory because the plot is never wider than 150 m.
The mentioned plot is near to the new areas for the urban expansion of the town of Hijuelas; the expansion project made by the town Administration and that will be included in the City Master Plan, is available.
The agricultural soils in the Country are divided into three classes, according to the quality of the land. The best soil for agriculture is of class 1; this soil is not good for building activity because 40-50 cm of loam should be taken away to reach the more solid levels.
The benefits connected with the purchase of an agricultural soil are mainly connected to the low market price.
There is a high probability to find an agricultural and not an industrial soil for the plant and is therefore useful to ask for information the local Administration to check the possibility to change the soil destination. The local Authorities of the Hijuelas confirmed the possibility to change the destination through an application to the SAC (Servicio Agricola y Ganadero). The SAC verifies the Project of the plant and its non polluting characteristics, before giving the permit.
5.2 Climatic characteristics
Chile has been divided into nine climatic-living areas, according to the parallel crossing the Region. The areas are from "Norte desertica" to "Sur extrema". The Fifth Region, North of Santiago, and the Metropolitan Region are between the areas "Central Interior" and "Central literal".
The "Central interior area" is the central valley between the North coast and the Cordellera of the Andes below 1,000 m of height.
63

-- - - ,,,.
,.
- ,, ; '
I ./
.. ...- ./
' , I ,
I 0
I ,,---" ---(
----- .. ~ ', , ___ , /'
~--:.:-----
' ' I t' I I
\ ' I
"/ v \~
t (

-·"
3l6. 8
166000 -~---r-- --- - --
325.t /-
___ / ________ _
326,.l--' J .... -
.,, ·' .... ·-----., .. --
• ... ___ :..__
--- (---- ........ ... :, __ _
--328.1
365000 --
]64000
---- -308000
---
I I
I
I 311 • I
I I I
------'
I
I I
I
,..
/ ~·
-- ----~--,~
])7 ·"
I '
I I
134.1
336. 5 . '\ \
309000
\
• 338. 5
' _\\'. \ ' ·. '
65

The climate of this area is Mediterranean, with mild temperatures, 4 or 5 months long winter, normal vegetation, rain and frost increasing moving South, intense insulation in summer moving North, limited daily temperature variations, winds from SW.
The "Central literal area" is the coastal region including the big valleys that correspond to the mouths of the rivers. The characteristics of this area are: marine climate; short winters, from 4 to 6 months; mild temperature; clouds on summer mornings; big rainfalls; normal vegetation; winds from W predominantly.
The climate characteristics of the biggest cities of the Fifth Region and the Metropolitan Region follow, as example.
Temperature Insulation Rainfall Snowing average daily excursion cal./cm 2 mm/year day/year
Sum.-Win. Sum.-Win. Sum.-Win. VALPARAISO 17.8-11.4 9.2-7.3 520-160 463 0 SANTIAGO 20.7-7.9 17.0-11.3 570-130 367 0.7
...... . ~
5.3 Roads and other traffic connections
Chile has a road network of 79,423 km, formed by a basic network and a town network. The basic network is formed by national roads, main and secondary roads.
In particular, the national network is formed by a long longitudinal road ("RUTA 5") with a length of 3,000 km that drives through the Country from North to South and which is the backbone of the long-distance industrial transport.
Furthermore, there are 2,000 km transversal roads that guarantee the connection between the main urban, productive, touristic and harbour centres of the Country.
An analysis made in 1991 about the real condition of the entire Chilean road network pointed out that only 48% of infrastructures were in good condition, while the remaining 52% needed immediate rebuilding works not to influence negatively the development of the Country, particularly in the industrial and touristic fields.
As a consequence, the Government started and promoted a wide programme of rebuilding of public works to improve the global efficiency in the field.
The biggest investment regarding those Projects (858 million of US$) is connected to the programmes called "Autopistas Centrales", whose aim is to rebuild the most important highway in the Country, the "RUTA 5", and to the project "Carretera 68" that will connect Santiago to the harbour of Valparaiso (estimated investment 200,000,000 US$). In the planned main road rebuilding, there are also 172 km of road that connect Los Vilas to Santiago passing through the centres of La Ligua, La Calera and Hijuelas, where the prefabrication plant is meant to be built.
Government Programmes want to improve the highway 78 that connects Santiago to San Antonio. Together with the improvement of the highway 68 from Santiago to Valparaiso, there is a new project called highway "La Dormida" that will connect Santiago to the harbour of Valpariso with a 3.2 km long tunnel. The tunnel will make it faster and easier
66

the travel on the old road around the mountain and will connect important industrialised areas like Quilicura, Til Til, Limache, Penablaca and Vina Del Mar.
All these programmes, whose benefits are going to be seen since 1996, fully justify the Investors' choice of the location of the plant.
As a matter of fact, the factory, whose aim is to produce prefabricated elements to be supplied to building yards in the areas of development of the Metropolitan Region and of the Fifth Region, would be located in the centre of an important arterial network that will ensure, in the prudential range of 200 km from the plant, the fast reaching of the assembly locations.
5.4 Environmental impact
5.4.1 General situation of the environmental sector in the Country
The "Division de desarrollo urbano" has an important role in the constitution of the "Unidad del Medio Ambiente" of the Ministry of Housing. The main aims of the Division are the following:
a) to define the environmental standards and norms to be included in the Ministry programmes. These standards refer also to the evaluation of the environmental impact in the urban development Projects (EIA);
b) to identify and suggest an institutional and operative plan to introduce the environmental standards in the management of the Ministry of Housing.
At present, the Division objective is to favour a more systematic introduction of sound environmental practices and economic instruments in the City Master Plan.
The National Commission of "Medio Ambiente" CONAMA is the official administrative body of control of Chilean environmental system. A topical subject is a Study, made in March 1995, about the programming of big investments in the evaluation of environmental impact.
The programmes focus on extraction activities, and on power sources, but will gradually deal with activities in the industrial, forestry, infrastructural, and touristic fields too. The subject is considered essential as precaution, because the polluting productive processes cause serious and harmful situations in the Country.
The "CONAMA" is now working out rules that will oblige those who want a permit for the installation of extractive or industrial plants, to make an environmental impact analysis.
An information system for the consumers is now being promoted, to make them aware of the origin and the fabrication quality of the products they are going to buy.
Nowadays a few factories show the non-polluting peculiarity of their products, but this will be compulsory for all products on the market in the near future.
A recent meeting of Canadian and Chilean Governments gave start to a seminar where condition environmental impact experts trained Chilean Government officials.
67

Many Projects regarding environment themes are now being developed; one of these is an approved law project that will require complex costs and benefits analyses before new environment, safety and health protection regulations may be issued.
Another Government Programme will reward those owners whose property value was reduced of 20% or more due to the application of prevention and environment protection regulations concerning lake soils and vegetation protection, and animals to save.
In practice, every factory must have its own waste disposal plant and if the plant waste is contaminated, an adequate discharge water purification plant also; every solution has to be approved by the "Ministerio de la Salud".
5.4.2 Waste owing to the Project implementation
To evaluate the introduction of the proposed industrial plant into the surrounding environment, the main solid and liquid wastes produced by the process in the factory have been taken into consideration.
Among the materials needed for the manufacturing processes, the following ones may be considered as "wastes" (data expressed with reference to one year of production of the plant at the rate capacity) :
polystyrene: 3% of year consumption = 805 m3/year concrete additive = negligible iron: 2.5% of year consumption = 49.25 t/year electric wires = negligible hydraulic pipes = negligible concrete mixing equipment washing water = 350,000 liter/year services water = 900,000 liter/year sewage water = 1,300,000 liter/year
Polystyrene is a self-extinguishing material, formed by 90% air; it does not produce any damage because it does not eject fibrous particles, it is odourless and inert.
The plant waste should have a simple collecting network of polystyrene residues, to be sent to recycling companies for the production of "cellular concrete", porous bricks, raw materials for other products destined to high energy efficiency applications. In Chile, the Companies with technology sufficient to carry out these processes already exist and moreover a network that will allow the material to arrive to the recycling sites is now growing.
The main polluting action is due to liquid wastes produced at the factory. These are grouped into two categories:
water from washing concrete mixing equipment; sewer water due to closets and kitchen.
Owing to the profound differences of the two liquid wastes, two different treatment systems are foreseen, each one with dedicated piping and a dedicated process cycle.
68

5.4.2.1 Concrete mixing equipment washing water
Several technical solutions may be adopted. The solution here foreseen is mainly aimed at assessing the magnitude of cost of the plant needed.
Polluted water coming from the two concrete mixing plants is collected into a storage tank. A mixer allows fluid to be maintained in suspension. The fluid is sent, through pumping, to a sound clarifier and flocculator equipment. Suitable dosing device introduces a solution of aluminium polycloride, with the flocculating function. A pump draws sludge from the bottom to a 3-stage dehydration system.
Concentrated sludge is dried and stored, with possibility of being reutilised as filler in construction industry.
Treated fluid is sent to a neutralisation chamber, where a suitable HCI dosing system allows the correction of solution pH, before the delivery to the environment.
In Annex 1 is the result of a standard analysis of waste water produced in a similar plant in Italy.
5.4.2.2 Sewer water
A treatment plant dedicated to sewer fluids produced in the factory, is foreseen. It has been designed so as to handle the polluting load of 250 equivalent inhabitants.
The process is based on a biological cycle, which allows a high purification standard (90-98%). The process is completely automatic.
The plant includes a basin for oxidation and sedimentation, a basin for aired thickening and a basin for disinfenction.
5.4.2.3 Waste treatment plants costs
The costs of the two liquid treatment plants, utilised in the Financial Analysis, are the following:
- concrete mixing equipment washing water * electromechanical plants * civi I works
- sewer water * electromechanical plants * civil works
5.4.2.4 Pollution standards
US$ pesos
US$ pesos
45,000 6,000,000
30,000 6,000,000
The above said plants were selected according to Italian environmental standards for liquid wastes to be introduced into the environment. The new Company will have to verify the applicable standards in Chile at the time of starting with Project implementation. It will have to select the process and the technology accordingly.
69

CHAPTER 6 - ENGINEERING AND TECHNOLOGY
6. 1 Scope of the Project
The Project concerns the production, assembling and sale of industrialised type houses for living.
The Project activities will be carried out by a Company which will be established for this purpose, and include:
- production of building panels (and structures, assimilated to panels), in the factory; - transport of panels to the site; - assembling and finishing of houses; - marketing and sales activity.
The following main functional areas may be recognised, under the point of view of relevance of machinery and infrastructures utilisation (for a detailed organisational structure, see Chapter 7):
- AREA FACTORY PRODUCTION (including storage of raw materials and of finished products, as well as auxiliaries);
- AREA ASSEMBLING AND FINISHING.
In this Chapter, production activities and equipment used within these two Areas are taken into particular consideration.
6.2 Technology selection
As specified in Chapter 1, the technology for the industrialised production of panels for the buildings was not subjected to analysis for the selection of the most suitable one for the Project: the technology was selected by the Project promoter, who wishes to utilise it because of his know-how and experience with that technology.
All following data refer to this well identified technology, and to a very precise factory, which is optimised for implementing the selected technology.
Since the technology proposed by lntertransports Centre S.p.A. is the result of highly specialised know how that has been experimented for a long time in Italy and since the Company has the patent right, exactly the same technology will be used for the housebuilding programme in Chile. The technology was initially developed by RAPID CASA (Italy), with satisfactory results. Several hundreds of houses were built in Italy. lntertransports Centre S.p.A. selected this technology because of its positive technical characteristics, its cost, the possibility of marketing it for lntertransports Centre S.p.A. itself. lntertransports Centre S.p.A. improved the technology through the study of applications in Angola. The same technology is presently proposed for Greece, Algeria, Lebanon, etc ..
The suggested construction system allows to realise civil buildings of medium-high level in a short time and with competitive costs, thanks to the industrialised prefabrication of all
70
the components of the building. Adopting the lntertransports Centre S.p.A. technology, only the assembly, the sealing and the finishing of the house are performed in the building yard.
The external wall panels and the base and covering slabs are insulated, thanks to a polystyrene foam layer put into the concrete during the casting. Particularly equipped walls contain the bathroom and kitchen systems.
The raceways for electric, telephone and TV systems, the boxes containing electric current taps, switches and boards are included in the panels, according to the design project diagram. The door and window openings are made directly in the forms using special molds.
6.3 Production Programme
The construction is performed in three separated phases:
A) the components production in the plant.
8) The assembly and the sealing in the building yard to have the rough house covered with a tile roof.
C) The finishing, including wiring harnessing, door and window frame installation, floor, covering, bathroom devices setting up and external and internal painting.
6.3.1 The production in the factory
The production process is based on the manufacturing of the standard components (panels), which are continuously reintegrated in the store, and is regulated by a computerised planning that takes into account the stock variations.
The components are made of concrete mix with iron rods reinforcement. Components (panels) that are in contact with the outside are insulated with an intermediate polystyrene layer fixed by electric-welded meshes linked to the main reinforcement.
The components without thermal insulation like beams, gutters, partitions, stairs and guards are made with a unique casting; the ones with insulation are made in two casting phases, the first one to make a bed, the second one to fill the form after the insertion of the insulating layer.
The rate of production depends on the curing time, on the time spent working on the forms and on the number of installed forms.
The proposed plant has a number of forms sufficient to ensure the maximum expected production in the eight working hours, leaving for the spontaneous curing the remaining 16 night hours.
The iron rod working and the electric-welded mesh processing is organised according to the material type; for these operations a semifinished working area is needed.
71

-...J I\.)
CONCRETE
REINFORCING ROD
POLYSTYRENE
END PRODUCT ~
r----- -- -- - -i I I I I I I
MATERIALS AND PRODUCTS FLUX LINES
POLYSTYRENE I Y--+--...--...--...--...---...--+------ -\
I I
._._,__.......,,__~,.............,,___.. _ __, _ _,. _ _.._~ I • ' iP'ARi---, :---------------------1 1 ,---------------------;~ART--~
1 MACHINEd ; I 1MACHINED1 I STORE~ FORMS +-r-l- -~ FORMS .,..;tSTORE I I I I •·l···l···· .... ~.. I I I I 1 I . I I j I I I I
:--;--! L-t--:;-- .. ---;--.--~-~--t·-· ._Ii f L-:;--;--+--.;-:--:-~---.-J !---.. ---! 'PA'Rr--1 .--------------------, 1 1 1--------------------, 'PiRT-1
1-~---"--""lMACHINEd : • I :MACHINEd
: STORE 4j=!- . FORMS ~.: ... '. .. L .. .t! FOR MS ffsTORE :
FINISHED
PARTS STORE
I I I
I I I I I I I I I I I '-----------.....J
I I I I I I I I I L ____ .J L------------------.J : 1--------------------....l 1-----~ .. _L_;i._.,1-__ +-_l_x_ __ i __ t.__,;t_,.! __ + _ __, + i + r_ ... __ _r __ t__J __ L _ _; __ ~ + +- ~. ..
I I . I • I I : REINFORCING :: ROD WORKING .J .... J.. .... l+ ROD WORKING 1
1 FOIUilS I
1 ROD STORE 11 I I I MAINTENANCE1 I . II 1 ! I I I
+ L.,--+-+--+-IL:r--+--+--.--+--~--'+ l .,..1--,.--+--.--+--:i..--:t:-{ + ~ .. i 1- - - - ., I - - - - - - - - - - - - - - - - - - - - -, 1 - - - - - - - - - - - - - - - - - - -1 r; - - - - -( ,PART I I ; I I ,PART I 1MACHINEd : •·l·""i····++ _ 1 1~ACttlNEDj I STORE~ FORMS i..1.-.~--..... FORMS -r-'l"STORE I I I I I • I I I I 1 I ! I I I L----' L----------------l I j 1--------------------l ~----' + + '9' • .. •-. T ~ • + +:+ +-+ ~ .+ 4.-+ 4 1- ~ + + ~1>'A11r--1 f--,----------------l l i i-------------------J :PAR_T __ 1 1MACHINEd ! •1 .. 1··: .••• I.+ f1MACHINEDi I STORE*+- FORMS 4-+ -;- -1+ FORMS STORE I I I I I I I I I I I I I I L _____ I L-- -----------------1 L __ ---------------' L----'
ID ,..
~ + .. ~ •
"H" •• HO"' '""'''.""."' I ! ----r-1 116
T
r------ -- - -, I I I I I .
FINISHED
PARTS STORE
I I I I I I I
L------- ___ j

The precise polystyrene cutting is performed directly in the store and the semifinished handling is made by means of dollies.
The extraction from the forms and the transport to the daily storing area are made by means of adequate bridge-cranes. The transport to the storing areas and the loading on the trucks is made by means of a bridge crane moving on tracks.
Concrete is a conveyed from the mixer (in electric controlled opening buckets) to the single form by means of a light bridge-crane moving on tracks, placed below the ones used for the extraction bridge-crane.
Taking into consideration the estimated daily number of trucks and the loading time, the shift of the personnel that have the task of truck loading at the factory, must be doubled.
Because of the scale of the plant, the aggregate supply should be made daily; the cement and polystyrene supplies are weekly.
The iron supplies, due to the bigger amount that can be stored, are less frequent.
6.3.2 Assembly and sealing in the building yard
These operations are made by special teams formed by Company personnel, using a crane-truck and specific equipment.
These operations are the ones necessary to assemble the components, from the foundation casting (the digging is up to the Client), to the covering with the roof.
6.3.3 The house finishing
The whole house finishing, meant as supply and installation of floors, coatings, internal and external frames, electric and hydraulic connections, sanitary sets and external and internal painting, is subcontracted to specialised firms found during the building yard installation.
6.4 Technology and equipment
The plant is designed to produce 60,970 m2 of net living surface, in one year.
It is divided into three large departments:
a) IRON MACHINING b) REINFORCEMENT ASSEMBLY c) CONCRETE CASTING
The precise cutting of polystyrene slabs is made in its store; the finished products storing area may contain a 20-day production.
73

6.4.1 Production factory equipment
In the following, is a list of main equipment and machinery at the production factory.
A. Concrete production equipment (140 kW, 10 m3 water consumption per day).
A 1. Concrete mixing station Two complete concrete mixing stations are foreseen in the factory. Each concrete mixing station is formed by:
1 1,500 I forced mixer with hydraulic-opening discharge, fed with a loading skip, with a washing device that works at every mixer discharge. The equipment is located on a loading semi-trestle with an eccentric truncated cone gargoyle placed so that the discharge is 4.5 m high. The trestle has a stair and a service gangway.
1 Water batching plant with a self-acting liter-counter.
1 Cement balance with kg 750 weighing hopper directly installed on the mixer.
2 193 mm diameter, 8 m long screw feeder for each cement weighing hopper.
2 Cement filters.
2 40 t storage bins in carbon steel plate and steel sections, with charging pipes, venting pipe, explosion-proof valve and level indicator.
1 500 mm weighing belt with hopper.
1 3000 kg aggregate balance with leverage on the weighing belt.
3 40 m3 aggregate hoppers, on steel frame, complete with pneumatic opening discharge. The hoppers are fed by dumpers, through dedicated loading ramp.
1 2 m high tank for concrete additive with automatic batching plant and electric board.
1 General electric board.
A2. Working equipment (8 kW).
• 3.5 m long iron rule, equipped with a rocking engine for superficial panel finishing n°12
• iron rule with vibrator for the ceiling panels superficial finishing n° 4
• iron rule with comb, wheel mounted and fixed to the forms for the superficial finishing of the vertical external type IH panels n° 2
• 40 mm diameter needle vibrator n° 4
74
8. Forms
81. For production of IH type panels (for one-floor, one-unit house) • Rocking forms, with a maximum rotation angle of 70 degrees, with
planes of the specified size n° 15 The forms are made of 8 mm thick sheet, reinforced by 5 mm bars and equipped with 5 mm thick iron side panels, whose opening is made by a rotation and a translation, and are fixed on solid metallic frame beds, at the casting height. Every bed has an adequate number of plates to anchor motor-vibrators and vibrationdamping plates. An oleodynamic system controlled by a gearbox (one every two forms) allows the form to rock and the side panel to be opened.
The forms have various characteristics, as follows.
4 one-impression benches for the supporting panels and the central wall panel
4 one-impression benches for curtain wall panel
Forms like the previous ones, with manual opening of side panels
2 one-impression benches for central partition 2 double-impression benches for fishbone partition panel 1 double-impression bench for fishbone partition panel 1 double-impression bench for equipped partition panel 1 double-impression bench for covering panel
• Fixed forms
m m
m m m m m
8.6x3.8 6.7x2.8
6.5x3.4 6.8x3.4 3.3x3.4 6.5x3.0 3.0x1.7
n° 21
The forms are made of 8 mm thick sheet, reinforced by 5 mm thick iron bars. They have side panels whose opening is made by a rotation and a translation, and are fixed on solid metallic frame beds at the casting height. Every bed has an adequate number of plates to anchor motor-vibrators and vibrationdamping plates. An oleodynamic system controlled by a gearbox (one every two forms) allows the form to be opened.
The forms have various characteristics, as follows.
2 one-impression benches for central slab m 6.8x2.4 4 one-impression benches for lateral slab m 6.8x2.8 2 one-impression benches for porch panel m 7.8x2.8 4 one-impression benches for ridge of the roof panel m 6.8x2.7 2 one-impression benches for gutter m 7.8x2.1 1 double-impression benches for lateral beam m 7.7x1.9 1 one-impression benches for lateral beam m 7.7x1 .1 2 double-impression bench for connecting beam m 6.4x1 .5 1 one-impression benches for central beam m 8.9x1 .5 2 double-impression benches for gutters m 7.2x2.6
75

82. For two-floor and/or multi-floor production
• Rocking forms with maximum rotation of 70 degree n° 25
17 forms for 7.0x3.4 m panels.
The forms are made of 8 mm thick smooth sheet, reinforced by sections with 5 mm thick iron bars and have 5 mm thick side panels whose opening is made by a rotation and a translation, and are fixed on solid metallic frame beds at the casting height.
The lower side panel is fixed to the bench, the upper one has pockets for the flask exit (one every 11 cm) and has a manual sliding plate to close the pockets; the side panel and the plate overturn oleodynamically. The two terminal stop-casting side panels may be fixed to the bench with flasks and have, as the longitudinal side panel, pockets for the flask exit. Every bed has an adequate number of plates to anchor motor-vibrators and vibrationdamping plates. An oleodynamic system controlled by a gearbox (one every two forms) allows the form to rock and the side panel to be opened.
2 forms for gable panel with a width of 18 m and a height of 4 m in the centre and 1.8 m at the ends.
These forms have the same characteristics as the ones for the wall panels with an additional side panel and a 50 cm wide plate corresponding to the upper form profile.
6 forms for 7x3 m partition panels
The forms are equal to the ones for the wall panel but do not have flash exit pockets.
• Fixed forms n° 9
3 forms for 41.8x2.8m covering-race panels.
The races are made of 8 mm thick smooth plate, reinforced by suitable bars; these have 5 mm thick iron side panels and casting baffle plates. These are fixed on solid metallic frame bed at the casting height. The longitudinal (upper and lower) and the terminal side panels have an oleodynamic opening system controlled by a gearbox. The casting baffle plates (5 for each race) have mechanical opening. Every race has plates to anchor the motor-vibrators and vibration-damping plates, one every 2 m for the plain and one every 3 m for the longitudinal side plates.
1 form for gutter roof 1Ox1.7 m panel.
It has two/three casting diaphragms with automatic opening.
The form, equal to the previous ones, has side panels which are rotated oleodynamically.
76

1 form for 7x1 m plane gutter panel
Form as above. 1 form for 11x1 . 5 m guard panel
It has two/three casting diaphragms with automatic opening. The form, equal to the previous ones, has side panels with manual opening.
1 form for guard panel and terrace floor 7x2m panel
Form as above.
1 form for 2.5x1 .2 stair
Form with same characteristics as above, with oleodynamic opening of sides.
1 form for 4.5x1 .4 stair (stair and two 1 m landings)
Form as above.
B.3 Form servomechanisms (252 kW)
• High frequency motor vibrators, three phases, 42 V 6,000 rpm • High frequency motor vibrators, three phases, 42 V 3,000 rpm • Frequency converters for the mentioned vibrators • Oleodynamic gearboxes, hand driven, for the form turnover and the
side panel opening (minimum 8 users, 4+4) • Various size piping and fittings for the oleodynamic circuit • Electric boards and push buttons to start converters and vibrators • Frequency converter electric boards • Board connection electric wire
C. Handling (439 kW)
• 20 m high tower crane with a 40 m, 4 t at end load, moving on 80 m long rails
• Casting truck on 16 m gage bridge (V= 5/40 m/min), including a 1,500 liter bucket moving on a dolly (V= 10 m/min), and an independent sliding push bottom. The bucket has an elevator for the positioning at the required height (1/3 m). (Special truck made by OMG Company from Perugia).
• Double beam bridge-crane with winch-dolly: 6300 kg load, 16 m gage, 5 m/min hoisting, 10/40 m/min truck moving velocity, independent sliding pendant push bottom
• Bridge-crane as above: 3000 kg load, 12 m gage
n° 250 n° 147 n° 12
n° 36 m1 ,200 n° 46 n° 12 m1, 100
n° 2
n° 4
n° 8
n° 2
77

• Bridge-crane rails complete with electric supply system m 1,400
• 1.5 m3 hydraulic bucket moving on track, electric control and 18 m long tracks included
• Metallic frame bridge-crane entrance stair
• 6 t, 5.5 m long arms for the vertical panel lifting and handling arms
• Steel chains for horizontal components (slabs, stairs, beams, etc.) lifting and handling, with two 2.5 m long, 3 t, booms
• Various size arms to handle the assembled iron (reinforcement for the IH type) made in iron bars, with an average weight of 130 kg.
• Various size dollies to handle iron, made, according to the design, of metallic frame with an average weight of 200 kg and with rotative wheels
• Various size dollies to handle polystyrene, made of metallic frame, with an average weight of 100 kg and with rotating wheels
D. Storing
• Tubular structure for the temporary vertical panel storing, placed at the end of the casting lanes and anchored to the building pillars. These are made according to the design and have a total weight of 350 kg.
• Frame with basement for the vertical panels external storing, capable of containing 20 panels (10 for each side), made according to the design, with a total weight of 450 kg.
E. Iron machining ( 36 kW)
• Self-acting iron rectifying equipment for homogenous diameter rods up to 16 mm, with a capacity of 6,000 kg, including guides
n° 4 n° 10
n° 8
n° 16
n° 6
n° 12
n° 12
n° 4
n° 40
for cutted rods collection n° 1
• Electric iron rod cutter, for less than 30 mm diameter rods, fixed on a dolly n° 1
• Self-acting iron bending rolls for less than 30 mm diameter rods n° 4
• 8 m long bending machine benches n° 2
• Self-acting electric welded mesh cutter for maximum 10 mm diameter wire n° 1
78

• Mesh bending machine for 6/8 m of length, for maximum diameter 10 mm electric welded mesh, with two bending pistons and 30 clamps n° 1
• Completely self-acting computerised flask maker to produce flasks with maximum 10 mm diameter wire n° 1
• Tools (manual cutters, tongs)
F. Iron assembly (9 kW)
• Bench template to assembly the reinforcement needed in the construction of the IH type. These are made, acco·rding to the design, in metallic frame. Max size 8.4x3.4, average weight 500 kg
• 2+2 mm manual spot welder
• Portable pneumatic cutter for less than 14 mm diameter wire
G. Polystyrene working (2kW)
• Hot wire polystyrene slab cutter, including a 4x1 m bench and a three wire
n° 8
n° 5
n° 3
loam n°2
H. Maintenance workshop (14 kW)
• 160 Ampere portable arc-welding machine • Autogenous welder with dolly • Bead welder • 250 mm disk cropper • Pillar drill with max. 30 mm chuck • 2 m long bench with vise and drawers • Wrenches and other tools (114 tools Beta type bench)
I. Analyses laboratory
n° 1 n° 1 n° 1 n° 1 n° 1 n° 1 n° 1
• Hand driven 200 t hydraulic device for the concrete compression test n° 1 • 1.0 x 0.8 m steel bench with vibrating table n° 1 • 0.15 x 0.15 x 0.15 - 4 place dice molds n° 1 • Set of 200 mm diameter sieves for the granulometry curve
(from 0.18to1.7 mm) n° 2 • 1.5 x 0.8 x 0.8 m steel tank for dice curing, including
temperature control system n. 1 • ABRAMS cone for the concrete workability and
consistence measurement n. 1 • Oven for accelerated curing of concrete n. 1
79
L. Lifting and transporting vehicles
• Little van n° 1 • 30 t crane truck n° 1 • 3 t frontal loading fork lift truck n° 1 • Fixed flatcar truck, equipped with crane (max 300 kg at 20 m height) n° 3
M. Miscellaneous
• 60 t underground electronic balance (20 kg precision, 14x3m plane) n° 1
N. Auxiliary systems
N.1 Electric system
It is built according to CEI standards and includes the following:
- Electric energy supply and distribution systems, internal and external lighting, internal communications. Wires, inside the factory, lay over an aerial raceway, with descending sections in correspondence with electric boards and with users (about 150).
- Grounding system The plant, closed loop type along the external perimeter of the building, 1s 1n copper plait, with dispersion bars. The loop is connected to the general electric board.
- Protection against atmospheric discharges Cage made of zinc plated strap, designed according to the local average meteorological conditions.
- Smoke detectors suitable smoke detectors are installed on the ceiling, with acoustic alarm at the main control board. This plant is limited to the area for storage and working of polystyrene.
Main equipment for the electric distribution system are:
- n° 2 600 kVA transformers - n° 2 oil switches for high and medium voltage - n° 1 general board with power factor correctors - n° 13 area power control centres - various small local boards - wires and raceways - n° 1 emergency electric generator, for operations of cleaning of casting trucks
(100 kVA capacity).
N.2 Compressed air system
80

It includes a distribution aerial loop, connected to compressors located in the form maintenance workshop. The loop feeds the various users through descending piping.
Main equipment include:
- n°2 rotating compressors, 1,500 liters, 12 bar, 20 HP - n°1 drier - n°1 tank - piping (about 800 m) - n°30 condensate dischargers. - n° 2 air compressors, 300 liters, 12 bar
N.3 Fire Protection System (12 kW) Within the factory extinguishing systems are foreseen near electric boards (powder type). Around the buildings for storage and working of polystyrene, is a water-based fire protection system including a water reservoir, a pumping station and a network for distribution of water including, in suitable boxes, nozzles and fire hoses.
N. 4 Hot Water Production Plant ( 40 kW) A plant for production of hot water is foreseen for the supply of services of offices and of the building with locker room and dining room. A boiler, electrically or gas-fired heated, will be foreseen.
0. Social Services Building (12kW) The 51 Om2 building includes dressing rooms, sanitary facilities (basins, WC, showers) and dining room and it is suitable for about 150 workers. The plant includes lighting, socket and phone equipments, and:
dining room: refrigerator and freezer 4-fire stove with oven, steaker and fryer vent system working bench pots and pan rack dishes and cutlery hot-dishes bench trays tables and chairs
dressing room: wardrobes
P. Office building and keeper's lodge (6kW) The office building includes, apart from lighting, socket and phone equipment, the following: office furniture network computer system printers copiers
81
automatic fax phone switchboard drawing board plotter drawing boxes iron shelving filing equipment
The keeper's lodge is equipped with a table, chair and telephone.
6.4.2 Yard-use equipment
In the following, main equipment used at the yard are listed.
Electric 300 liter concrete mixer Erecting stands for transporting vertical panels, made of iron bars, 750 kg
Supporting framework for vertical panels, including tie plates, weight 22kg Steel framework for horizontal panel Iron scaffolding for the storing of panels at the yard, 450 kg Chains for lifting and transport of vertical panels (see point C) Small equipment for the assembling team (drillers, linishers, jemmies, EE cables, small electric boards, trays, wrenches, stepladders) Steel scaffolding equipped with erecting stands, stringers, diagonals and sheet iron docks Protections against accidents, prefabricated steel elements Wooden panel for foundation forms, including vertical rods and wedges Tile sawing equipment complete with and water pump Sheath burners Auxiliary equipment for crane operation
n° 4
n° 16
n° 720 n°1200 n° 10 n° 20
n° 4
m2 3,100 n° 150
m2 350 n° 10 n° 10 n° 3
6.4.3 Additional transport means from the factory to the yard and yard erection
equipment
The construction of houses at the yard requires the availability of additional trucks for transport from the factory to the yard as well as additional cranes for the implementation of the assembling phases.
These equipment may either be purchased by the Company of the Project, or be rent at the yard site. Owing to the high cost of rental in Chile, the solution of a purchase has been selected. Additionally, in order to reduce the investment cost, high-quality, used equipment will be bought.
In the following, is a list of such equipment:
N° 6 trucks, 25 t capacity, 12 m length loading plane N° 4 trucks, 25 t capacity, 13.6 m length, depressed loading plane
82
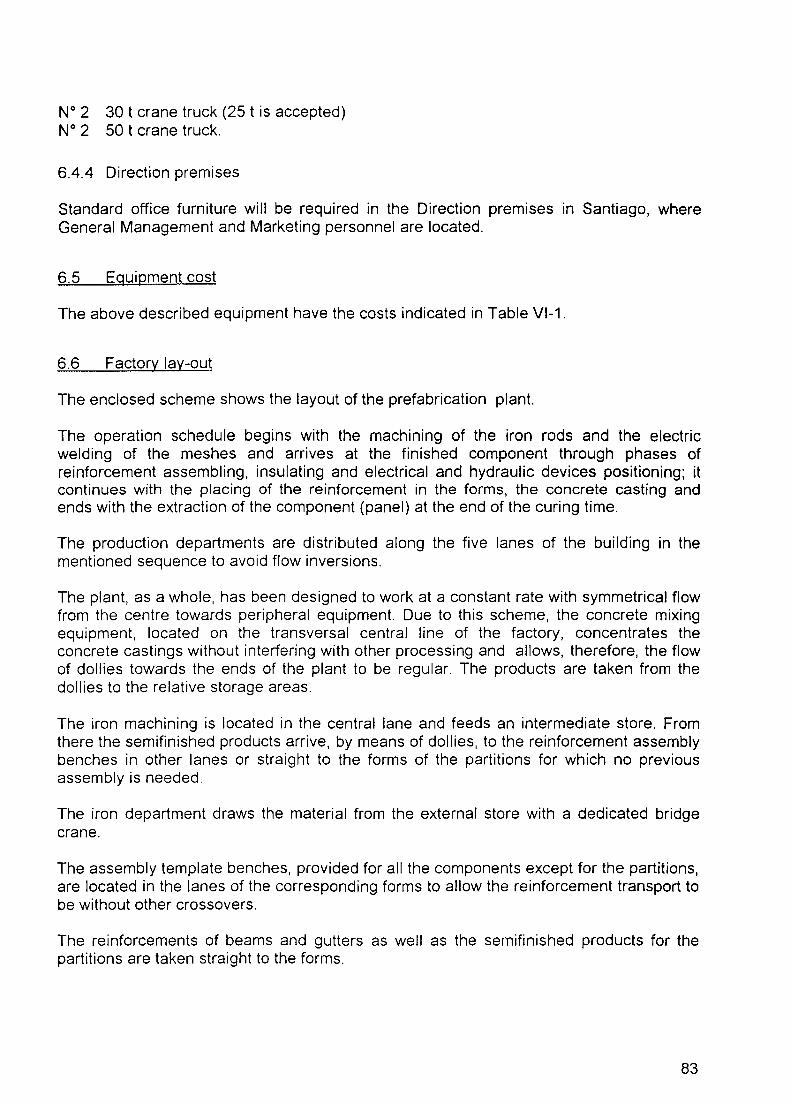
N° 2 30 t crane truck (25 t is accepted) N° 2 50 t crane truck.
6.4.4 Direction premises
Standard office furniture will be required in the Direction premises in Santiago, where General Management and Marketing personnel are located.
6.5 Equipment cost
The above described equipment have the costs indicated in Table Vl-1.
6.6 Factory lay-out
The enclosed scheme shows the layout of the prefabrication plant.
The operation schedule begins with the machining of the iron rods and the electric welding of the meshes and arrives at the finished component through phases of reinforcement assembling, insulating and electrical and hydraulic devices positioning; it continues with the placing of the reinforcement in the forms, the concrete casting and ends with the extraction of the component (panel) at the end of the curing time.
The production departments are distributed along the five lanes of the building in the mentioned sequence to avoid flow inversions.
The plant, as a whole, has been designed to work at a constant rate with symmetrical flow from the centre towards peripheral equipment. Due to this scheme, the concrete mixing equipment, located on the transversal central line of the factory, concentrates the concrete castings without interfering with other processing and allows, therefore, the flow of dollies towards the ends of the plant to be regular. The products are taken from the dollies to the relative storage areas.
The iron machining is located in the central lane and feeds an intermediate store. From there the semifinished products arrive, by means of dollies, to the reinforcement assembly benches in other lanes or straight to the forms of the partitions for which no previous assembly is needed.
The iron department draws the material from the external store with a dedicated bridge crane.
The assembly template benches, provided for all the components except for the partitions, are located in the lanes of the corresponding forms to allow the reinforcement transport to be without other crossovers.
The reinforcements of beams and gutters as well as the semifinished products for the partitions are taken straight to the forms.
83

()) ~
INTR0101.XLS N° 7 14
-·· ·- -------- .. - --------·---· -- ....•
ITEMS GROUP --------------------------- ~ I
________ , ____ COS!_l~~
-------·------ ---- I CONCRETE MIXING STATION 425 330 -------------·--- ' WORKING EQUIPMENT 24 000 FORMS - --------------------- ----------- 2,628 1840 ----·----·-·----- -- --------- ' FO~~- S_E_RVOMECHAN1Sfv1E)_ -·---·· _ ___ _ _ _ _. ___________ . . .. --· __ ??~133Q HAtJ9~1tJ_G _________________ . __ ...... _ ·----- _________ J!_~~r.z~Q STORING 38,800 !~QNMA_g_t~_t'11NG_ --·- --·--·-----·----··--·--····- --- -· ·····------------------------122,676 IRON ASSEMBLING 2·3,000 ~_<:?!-YST_\'~~_!'J_E __ '{Y.QRKI~~ 3, 180 fyi~~NT~A~~~~_.?_RKSHOP _____ 5,350 ~tJ~~~?-~~-~~B9.~-~ I_Qf3Y _________________ ·---··- _ __________ __ _ -· -·---··- __ 11.01Q ~~?~q-~1-~TING_ ANQ_I_RAtJ.§.POR_J EOYIPM~~l._________ ________ _____ 586,220 81\U\N~_E_ . _ . _ . . __ _ . -· .. _ ... . .. . --·. __ ~~.1~Q AUXl_1=_1t\'3_~_'!_~"I_~f"'.!§_____ ··------------ ------· 522,000 SOCIAL _§_ERYIC~§___ ____ 33,800
QEFIC~_£U~~I!!_f3~---------------------=!----- 66,530
~-~C~i<u~s~~W~W1i~~~o~1~~~NI£Q~_,_N.-xf.\_R_o_g~~~~!!_9_~--=-j~~-- __ 1_.~-~~~~~ TOTAL 7,645,410
Table Vl-1 - Main Equipment supply

CX> U'1
50"400 S.M. ( 280•180 I
A + B + C + D • 8'818 S.M.
E . 1 20 S M.
F . : 240 S.M.
G : !104 S.M.
H . I 80 S.M.
M = !110 S.M.
N . 100 S.M.
LOCATION PLAN
....... . - ... -. - ·. . . . •. ~· :··· . .":- -· .... - - .. . .: .. ""•·•,.I ... ·tfilj"· . ., ... .- .. ·-' · .. ·,··--'· -• . ·" . ·" ...... _. r,
.... ·~ .... Ir@} 8IIED l L ll
. . .. . . . . . . .. -. . KI) ; .. ' .......
' .:.
IIDIEI 111111111111
r-- - - --·1 ......... - . '. ~ ...... I I \ r • ,t
I I
G~~ ;@ -. . .- ·- r-----,
I I
.-------, . . ~ I
I I
I I I
I I I I
I I I I
1111 I
I I
I I I
I ill! I
I I j-
A I I
I
I FINISHED
I
rrrr I I
I PARTS I FINISHED I
lsTORE
I ,.. ~ ' IO
I PARTS
B D ... I I STORE
I c I r.r<
I I I
"' I I I
~ I I I
.J :JI
. I I
[I] ~ ' I I .
I I
I I I I j.U: I I
', I I
I I I I
A I I
I Jn]
'
I
L _____ _. I I
. ·- -L _____ 1 .
• ~ 116 -~ 188181 ~-- I
EIIlill~lll~ i ____ __ l I
I
0 0 : I I ~llW II J ... c:.. • . • .. ' . .. . .. •,, .. ' ' ••. ,. '. , ... -. '., .- • .- ..,..,.-........... I II ,,,s;;;? ....... , ., : .. 51 ... , ... ,, ........... A - CONCRETE CASTING
It ·ROD WORKING
C -REINFORCING ROD STORE
D ·MAINTENANCE SHOP
E - POLYSTYRENE
F - FITTINGS STORE
G- MOTOR VEllCLES MAINTENANCE
H - SYSTEM MAINTENANCE
1- TRANSFORMER ROOM
L - WATER TANK
M- DRESSING -LOCkER ROOMS AND
MESS - ROOM
N - OFFICES
0 ·ELECTRONIC WEliHBRID6E
P - PORTER BOX
a:> (J)
-
'
.
~
.
'
LAY- OUT
[ '""'""'"' I I l I • I I I
~ BB~ .
~~~~~: L ~~~~~ I
I I I I
~ rwALL J ~ ~l.IJ rwALL I : I ~ rwALLj rwALL I ~ ~ALL I • . ~ ~ ~ . - L L ~ -
fuiill lfu@~: l 1 ~ rn \!TA1Rs1 IPARAeu 1
Irv 101 I @if@ I I mI£D mWJ !PARAPET I
PARTITION!J I ' PARTITIONS
jTV901-10~1 !nuooJlnuoo! loR . .1!loj IGR. . .15oj l lrM3s4~ii~000 .... _ .. _ - . ......_ -- .__
-L-. ~ ~ . . ... .. • • ~ . ~ 7 . . I I ' I I I
: REIN FORCINO ROD I I I I I I ROD WORKING I I ROD WORKING , MAINTENANCE I
I STORE I I I I SHOP I I ' I I I I I I
- L =- ·~ --------· - - - ---- --- --- -..... p - --- - % - - -~ ~ ~ f P,O( a;q ,,P'loli! I : ~RPqo1ztJ pr<Joi ztlJ fu~ J!c ~ol ~I~
I I I I I
~~~~~· I ~16iiil~~~~ . . ~
e===~i
r ~ (~! qof t•9 ~t qof &>ti ~ :
I 1c= FL 00 RS :J -I ----I I I I
I l'L 00 R 8 I I d L----~-LOORS I -
~ E.,: POLYSTYRENE
. . . I

The reinforcement of walls, base slabs and covering panels that are to be completed with polystyrene or electric materials are taken to the finishing benches where, after the positioning of the mentioned materials, the electric welded mesh is supplied. The handling is made by means of bridge cranes with rockers with magnetic hooks.
The polystyrene already cutted comes, by means of dollies, straight from the two stores outside the factory.
The electric materials like boxes and wiring devices are also stored locally in the departments.
The two concrete mixing stations located on the external sides, are essentially formed by a mixer, a storage bin for cement and fixed hoppers for the aggregates.
The transport of concrete to the forms is made by hoppers with pneumatic openings. The hoppers are taken from the external lanes to the mixers by means of the dedicated bridge cranes; the hoppers that feed the other lanes are installed on motorised dollies that go from the mixer to the corresponding bridge crane and back.
The dismantling at the end of the curing and the moving of the finished components to the storage areas are carried out by means of bridge-cranes.
The loading of the finished components is carried out by cranes, dedicated to the storing areas. The driveways that cross these areas allow the simultaneous loading of at least three trucks.
6.7. Civil engineering works
The ideal surface for the installation of the prefabrication plant is m 280 x 180, for a total area of about 50,000 m2
. See the enclosed planimetry.
This area will contain not only the main industrial building, but also all the services and infrastructures deeply connected to the operation of the plant.
Since the flow diagram of industrial processing is symmetrical from the centre to the peripherical equipment, the location of the building should be baricentrical for the available area. This solution will not only make it easier the building of the various accessories and services, but also will allow an easy and organic heavy vehicle circulation without interference with the equipment. The building itself will have a total covered surface of 8,816 m2 and will be formed by four abreast sheds made by a metallic structure, with a span of 16 m and by the shed of the central lane, with a 12 m span.
Each one of the five sheds will be 116 m long with 6 m long bays. A bay with a span of 8 m will be added to each longitudinal structure that will be assigned to the concrete feeding line. The total dimensions will be therefore: 16+16+12+16+16 = 76 m on the transversal side and 6x9 m long bays X 2 + 8 m = 116 m on the other side. Globally, the covered surface will be 116 x 76 = m2 8,816.
Far from the central services a workshop will be placed for the equipment maintenance, covering an area of 180 m2
, near the electric substation hosting the transformers. Also
87

far, but easy to reach by means of the external ways, a metallic construction will be built for the parking and the maintenance of the trucks; its surface will be 504 m2
.
Two stores for the cutting and storage of polystyrene will be built over a surface of 720 m2
, as well as an auxiliary equipment storing building, over a surface of 240 m2.
The factory will have two different entrances, one for personnel and the other one for industrial vehicles.
The industrial vehicle entrance will be equipped with an electronic balance and adequate door keepers box.
The personnel's entrance will be suitably separated from the industrial areas and sufficient parking places will be provided.
In this area, there will be the management and administration offices with a surface of approximately 100 m2
, as well as the building for the general services for the personnel, including a messhall with kitchen, depot rooms, dressing rooms, bathrooms with showers, with a total surface of 510 m2
.
The constructions that have to be built have the following surfaces:
plant building equipment maintenance workshop truck recovering and maintenance polystyrene stocking and cutting store auxiliary (accessories) store offices general services
TOTAL
8,816 m2
180 m2
504 m2
720 m2
240 m2
200 m2
510 m2
11, 170 m2
The estimated costs of the buildings are shown in Chapter 10.
6.8 Analysis of compatibility of the proposed technology with local building regulatory
standards
Any information connected with the building standards in Chile is found in the "Ordenanza General de Construccion".
The "Institute Nacional se Normalizacion" publishes (NCH) up-to-date bulletins, identified by progressive numbers, containing the rules of application of such standards.
The most significant building standards have been examined, to make a comparison with the Italian ones with regard to the construction and assembly of prefabrication panels, aimed at verifying possible incompatibilities with RAPID CASA technology.
The above mentioned standards, which have been examined, are the following: - Ordenanza General de urbanismo y construccion 1995-NCH 19.0F79 Prevencion de
riesgos 1979 - NCH 853.0F91 Acondicionamiento ambiental 1991
88
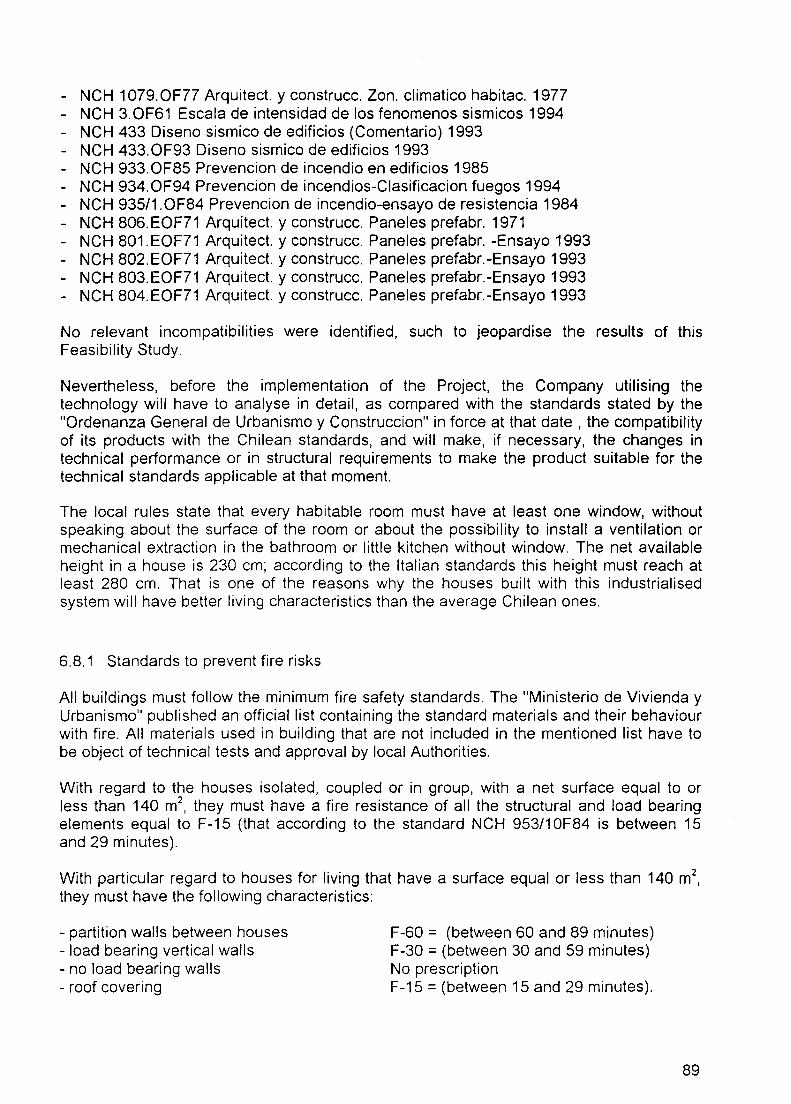
- NCH 1079.0F77 Arquitect. y construcc. Zan. climatico habitac. 1977 - NCH 3.0F61 Escala de intensidad de los fenomenos sismicos 1994 - NCH 433 Diseno sismico de edificios (Comentario) 1993 - NCH 433.0F93 Diseno sismico de edificios 1993 - NCH 933. OF85 Prevencion de incendio en edificios 1985 - NCH 934.0F94 Prevencion de incendios-Clasificacion fuegos 1994 - NCH 935/1. OF84 Prevencion de incendio-ensayo de resistencia 1984 - NCH 806.EOF71 Arquitect. y construcc. Paneles prefabr. 1971 - NCH 801. EOF71 Arquitect. y construcc. Panel es prefabr. -Ensayo 1993 - NCH 802.EOF71 Arquitect. y construcc. Paneles prefabr.-Ensayo 1993 - NCH 803.EOF71 Arquitect. y construcc. Paneles prefabr.-Ensayo 1993 - NCH 804.EOF71 Arquitect. y construcc. Paneles prefabr.-Ensayo 1993
No relevant incompatibilities were identified, such to jeopardise the results of this Feasibility Study.
Nevertheless, before the implementation of the Project, the Company utilising the technology will have to analyse in detail, as compared with the standards stated by the "Ordenanza General de Urbanismo y Construccion" in force at that date , the compatibility of its products with the Chilean standards, and will make, if necessary, the changes in technical performance or in structural requirements to make the product suitable for the technical standards applicable at that moment.
The local rules state that every habitable room must have at least one window, without speaking about the surface of the room or about the possibility to install a ventilation or mechanical extraction in the bathroom or little kitchen without window. The net available height in a house is 230 cm; according to the Italian standards this height must reach at least 280 cm. That is one of the reasons why the houses built with this industrialised system will have better living characteristics than the average Chilean ones.
6.8.1 Standards to prevent fire risks
All buildings must follow the minimum fire safety standards. The "Ministerio de Vivienda y Urbanismo" published an official list containing the standard materials and their behaviour with fire. All materials used in building that are not included in the mentioned list have to be object of technical tests and approval by local Authorities.
With regard to the houses isolated, coupled or in group, with a net surface equal to or less than 140 m2
, they must have a fire resistance of all the structural and load bearing elements equal to F-15 (that according to the standard NCH 953/10F84 is between 15 and 29 minutes).
With particular regard to houses for living that have a surface equal or less than 140 m2,
they must have the following characteristics:
- partition walls between houses - load bearing vertical walls - no load bearing walls - roof covering
F-60 = (between 60 and 89 minutes) F-30 = (between 30 and 59 minutes) No prescription F-15 =(between 15 and 29 minutes).
89

According to the "Decreto con Fuerza de Ley N. 2 de 1959", a house with the considered surface of 140 m2 is classified as "vivienda economica" and it is therefore possible for the owners of these houses to obtain fiscal benefits.
The texts of the corresponding Chilean technical standards have been handed over to lntertransports Centre SpA, to put it in a position to verify the compatibility of their products with the standards and to eventually make the appropriate changes.
6.8.2 Thermal insulation standards
The building insulation standards provide the thermal conductivity, the heat transmission coefficient and the thermal resistance to be adopted in design. These formulas may be applied to each single sample panel to verify if it is in accordance with the rules. In particular, the formulas to be applied are the ones regarding heterogeneous constructive elements (prefabricated products including polystyrene slabs are of this kind).
The texts of the Chilean technical standards have been given to lntertransports Centre SpA to verify that their products are in accordance with the standards and to make the appropriate changes, if needed.
On the basis of the climate data published in the standards NCH 1079, the frequent absence of the heating system in the houses, especially in the Fifth Region and in the Metropolitan Region of Santiago, may be justified.
A few very high standard houses have private gas heating system with radiant elements or low temperature floor radiant elements.
In the single houses as well as in the flats proposed in the Project, a copper pipe in the centre of the building will be installed; from this pipe, every owner could connect a central heating stove with an external connection to a balanced flow duct. Portable catalytic stoves moving on wheels with gas cylinder included, are also used in the coldest days; they can be pushed from room to room in the whole house. Obviously, no thermal equipment need to be installed during the house building, for these stoves.
6.8.3 Seismic standards
The Chilean standards classify the seismic phenomena according to 12 intensity levels; the first one is noticed only by particularly sensitive people, the last one is the one that produces total damages with general modification of the ground levels. The Chilean ground is divided into three longitudinal seismic zones: the No. 1 is the band close to the Cordillera of Andes; the No. 2 is the central band; the No. 3 is the Pacific coastal zone.
The Metropolitan Region of Santiago is mainly in zone No. 2 and partially in zone No. 3; the Fifth Region is mainly in zone No. 3 and partially in zone No. 2.
The standards divide the buildings in classes according to their destination. Class A: Government buildings Class B: Public buildings bound to be crowded with people Class C: Private buildings for habitation
90

Class D. Other buildings not meant for habitation.
The structural calculation may be made according to either the allowable stress method or the load and resistance factor method. Standards including the seismic calculus formula are available to enable to control the prefabricated structures and to make eventual changes.
6.8.4 Standards for the usage of prefabricated panels.
The Chilean standards divide the prefabricated panels into 7 types on the basis of the constructive characteristics and in 8 classes on the basis of the materials adopted for the construction.
The panels that are going to be utilised in the Project are of types 5 and 6 (monolithic with or without covering) and of class A (concrete).
Before being used, all the prefabricated panels, or anyway a significant number of them, have to be load tested according to the standards, in order to obtain the homologation.
These tests consist in:
pressure test RC horizontal load test RH bending load test RT impact resistance test.
These tests are described in the available standards 801.EOF71, 802.EOF71, 803.EOF71, 804.EOF71 and 806.EOF71.
91
CHAPTER 7 - ORGANIZATION AND OVERHEAD COSTS
7.1 Organisation
The Company which will implement the Project will be provisionally subdivided into nine areas from the organisational point of view:
:111111111
11·111111111111•111111111111111111111
ll!lllilill:tlll!llil
-A) General Administration, including the managing director and a secretary (provisionally located in the premises in Santiago);
-8) Marketing, including three people, under direct control of the managing director (located in Santiago, in the same office as that of the general administration);
-C) Production and Construction, with the responsibility of all management of activities of the factory and of assembly and finishing of the buildings, including the manager of the factory and two foremen. They are located at the factory;
-0) Factory Production, with the responsibility of all technical activities within the factory, for the construction of panels, including 63 people in the concrete-line and 28 people in the steel, mixing, polystyrene line. These people are considered in the category of costs directly associated to the product. They are located at the factory;
-E) Assembling and Finishing, with the responsibility of transporting, assembling and finishing the houses at the site. It includes 13 people not directly associated with the product, and 57 people considered in the category of costs directly associated with the product. They are seldom located at the factory;
-F) Technical Office, with the responsibility of design activities regarding final products (houses/panels), as well as selection of construction techniques for panels and special design activities regarding the factory. It includes 5 people, located at the factory;
-G) Maintenance Unit, with the responsibility of maintenance of all machinery, of the factory with its plants, of equipment utilised at the site (trucks, cranes, etc.). It includes 10 people, at the factory;
:.
92

-H) Administration. Purchase. Personnel, with the responsibility of procurement, purchasing, administration. It operates under inputs by the managing director and by the manager of the factory. It includes 4 people, at the factory;
-1) General Services, including 30 people (drivers, messengers, keepers, auxiliaries), at the factory.
7.2 Overhead Costs
Overhead costs include mainly personnel costs. If cost of persons directly associable to products is taken away, the cost items to be considered are those indicated in Table Vll-1.
In addition, other overhead costs are to be considered, as:
- cost for premises in Santiago 2.500.000 pesos/year
- legal/administrative costs 3.000.000 pesos/year
- direct costs for marketing 15.000.000 pesos/year
93

c.o .t.
INTR0101.XLS N° 1
NON PRODUCTS-DEDICATED LABOUR
PRODUCTION, NON PRODUCT-ASSOCIATED LABOUR
Cat. Description No Pesos/year per person
c MANAGER OF THE FACTORY 1 7,150,000 c FOREMEN 2 4,810,000
E SKILLED WORKERS 8 3,640,000 E CRANE OPERATORS 5 2,860,000
F ENGINEER, TECH. OFF. 1 5,850,000 F TECHNICIANS, TECH. OFF. 4 3,640,000
G TECHNICIAN, MAINTEN. 1 4,550,000 G SKILLED WORKERS, MAINTEN. 9 1,625,000
subtotal 31
NON PRODUCTION LABOUR
Cat. Description No Pesos/year per person
A MANAGING DIRECTOR 1 15,000,000 A SECRETARY 1 2,000,000
B MARKETING CLERKS 3 4,000,000
H ADMINISTRATIVE CLERKS 3 3,640,000 H ADMINISTRATIVE SECRETARY 1 1,300,000
I DRIVERS 2 1,372,800 I KEEPERS 3 1,372,800 I AUXILIARIES 25 1,372,800
subtotal 39
TOTAL OVERHEAD PERSONNEL COST (pesos/year) 182,179,000
Table Vll-1 - Overhead Costs (Personnel)
15
Pesos/year
7,150,000 9,620,000
29,120,000 14,300,000
5,850,000 14,560,000
4,550,000 14,625,000
99,775,000
Pesos/year
15,000,000 2,000,000
12,000,000
10,920,000 1,300,000
2,745,600 4,118,400
34,320,000 82,404,000

CHAPTER 8 - HUMAN RESOURCES
8.1 Personnel at the factory dedicated to production
The production proposed in the Project is based on 300 working days per year with one 8-hour shift per day, according the following Table.
A Concrete line and frame packaging
63 persons will be needed, divided into:
n° 30 for type 1 production (IH) n° 13 for type 2 production (two-floor, two-unit) n° 20 for type 3 production (four-floor, sixteen-unit)
The requirement of above personnel was obtained from one accurate analysis of working time requirements for the Reference Production Programme (see Chapter 1) as follows.
Type 1 - one-floor houses
Beams and gutters Walls Partitions Slabs and coverings
Partial total
hour/year 12,467 19,083 13, 163 28,050
72,763
Type 2 and 3 - Two- floor and multi-floor houses
Walls Floors Partitions Tympanums Roof gutters Guards Stairs Floor terraces Special gutters
B.
C.
Partial total
Gran total
Iron manufacturing unit It will require
Mixing It will require
hour/year 30,408 28, 170
7,576 4,716 1,980 2,553 1,512
234 396
77,545 --------------150,308
n° 19 workers
n° 5 workers
95
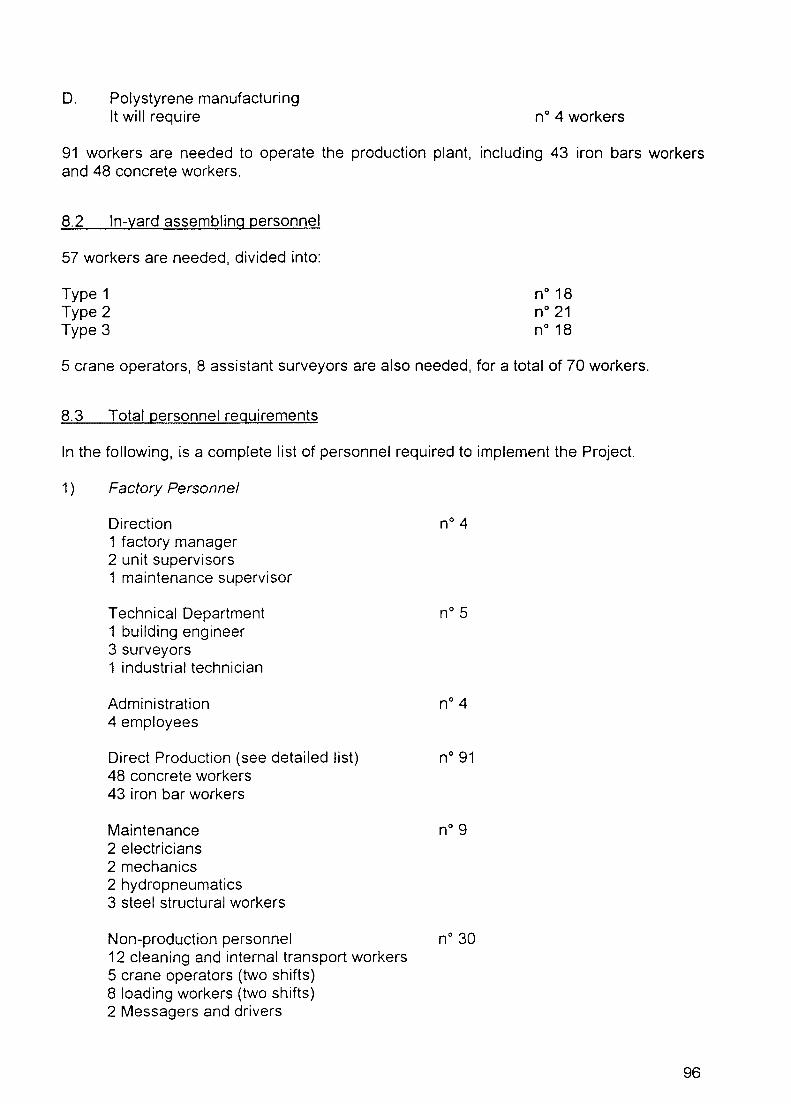
D. Polystyrene manufacturing It will require n° 4 workers
91 workers are needed to operate the production plant, including 43 iron bars workers and 48 concrete workers.
8.2 In-yard assembling personnel
57 workers are needed, divided into:
Type 1 Type 2 Type 3
n° 18 n° 21 n° 18
5 crane operators, 8 assistant surveyors are also needed, for a total of 70 workers.
8.3 Total personnel requirements
In the following, is a complete list of personnel required to implement the Project.
1) Factory Personnel
Direction 1 factory manager 2 unit supervisors 1 maintenance supervisor
Technical Department 1 building engineer 3 surveyors 1 industrial technician
Administration 4 employees
Direct Production (see detailed list) 48 concrete workers 43 iron bar workers
Maintenance 2 electricians 2 mechanics 2 hydropneumatics 3 steel structural workers
n° 4
n° 5
n° 4
n° 91
n° 9
Non-production personnel n° 30 12 cleaning and internal transport workers 5 crane operators (two shifts) 8 loading workers (two shifts) 2 Messagers and drivers
96

2)
3)
3 keepers (24-hour/day)
Yard operation personnel
Managing and marketing personnel
1 Managing Director 1 Secretary 3 Marketing personnel
GENERAL TOTAL OF PERSONNEL
8.4 Cost of the required personnel
n° 70
n° 5
218
The cost of dedicated production personnel is shown in Table Vlll-1.
In Table Vlll-2, is a list of all human resources needed for the operation of the Company, with the yearly costs.
With reference to all categories of labour, data collected in Chile were increased by a factor 1.083, to take into account possible increase in labour cost which is expected as a consequence of present expansion situation (a 13th monthly salary has been added to the standard 12 salaries per year).
In addition, the requirement is to be considered of additional, temporary, skilled people operating at the factory to train local technicians in the first phase of plant operation:
N° 1 expert on product technology (one month; overall cost: 9,000 US$) N° 1 expert on steel working (one month; overall cost: 9,0QO US$) N° 1 expert on concrete panel manufacturing (one month; overall cost: 9,000 US$).
97

(!) ())
INTR0101.XLS N°8
IH 40 TYPE No pesos/year per person
CONCRETE PANEL LINE 30 1,625,000 STEEL WORKING, MIXING, POLYSTYRENE 10 2,535,000 (37,34% OF 28)
TWO-FLOOR, TWO-UNIT TYPE No pesos/year per person
CONCRETE PANEL LINE 13 1,625,000 STEEL WORKING, MIXING, POLYSTYRENE 7 2,535,000 (23,85% OF 28)
FOUR-FLOOR, 16-UNIT TYPE No pesos/year per person
--i.--·-
CONCRETE PANEL LINE 20 1,625,000 STEEL WORKING, MIXING, POLYSTYRENE 11 2,535,000 (38,80% OF 28)
Table Vlll-1 - Production Personnel, Dedicated
18
pesos/year 48,750,000 25,350,000
74,100,000
pesos/year 21,125,000 17,745,000
38,870,000
pesos/year 32,500,000 27,885,000
60,385,000

INTR0101.XLS N° 9 17
PRODUCTION LABOUR Product-associated personnel
Description No pesos/year per person pesos/year Cat.
SKILLED WORKERS (CONCRETE) 63 1,625,000 102,375,000 0 HIGHLY SKILLED WORKERS (STEEL WORKING, ETC) 28 2,535,000 70,980,000 0 SKILLED WORKERS ASSEMBLING (IH40) 18 1,625,000 29,250,000 E SKILLED WORKERS ASSEMBLING (2-FLOOR,2-UNIT) 21 1,625,000 34,125,000 E SKILLED WORKERS ASSEMBLING (4-FLOOR,16-UNIT) 18 1,625,000 29,250,000 E subtotal 148 265,980,000
Non-product-associated personnel
Description No pesos/year per person pesos/vear Cat.
MANAGER OF THE FACTORY 1 7,150,000 7,150,000 c FOREMEN 2 4,810,000 9,620,000 c
SKILLED WORKERS 8 3,640,000 29,120,000 E CRANE OPERATORS 5 2,860,000 14,300,000 E
ENGINEER, TECH. OFF. 1 5,850,000 5,850,000 F TECHNICIANS, TECH. OFF. 4 3,640,000 14,560,000 F
TECHNICIAN, MAINTEN. 1 4,550,000 4,550,000 G SKILLED WORKERS, MAINTEN. 9 1,625,000 14,625,000 G subtotal 31 99,775,000
NON PRODUCTION LABOUR Description No pesos/year per person pesos/year
Cat. MANAGING DIRECTOR 1 15,000,000 15,000,000
A SECRETARY 1 2,000,000 2,000,000 A
MARKETING CLERKS 3 4,000,000 12,000,000 8
ADMINISTRATIVE CLERKS 3 3,640,000 10,920,000 H ADMINISTRATIVE SECRETARY 1 1,300,000 1,300,000 H
DRIVERS 2 1,372,800 2,745,600 I KEEPERS 3 1,372,800 4,118,400 I AUXILIARIES 25 1,372,800 34,320,000 I subtotal 39 82,404,000
TOT AL LABOUR (N°l 218
Product-associated personnel cost (pesos/year) 265,980,000
Non-product-associated personnel cost (pesos/year) 99,775,000
Non production labour (pesos/year) 82,404,000
TOTAL OVERHEAD PERSONNEL COST (pesos/year) 182, 179,000
TOTAL PERSONNEL COST (pesos/year) 448, 159,000
Table Vlll-2 - Human resources
99

CHAPTER 9 - IMPLEMENTATION PLANNING AND BUDGETING
The Company which will be established to implement the Project will begin activities after the provision of funding requested (at least, 85% of the investment cost).
The selection and purchase of the site, and the construction of civil works at the site will follow, with the engineering phase, the procurement of machinery, the start-up of the factory, training of people.
In Table IX-1 is the scheduling for main activities foreseen for the implementation of the Project.
In Table IX-2 is the scheduling for activities directly associated to factory construction and start-up.
100

INTR0101.XLS N°17 18
MONTH before 0 1 2 3 4 5 6 7 8 9 10 11 12 -
ACTIVITY 1 feasibility study approval x 2 new Company establishment x
--- -----3 supply contract between lntertransports and the new Company x 4 loan agreement x 5 request of SAGE approval x 6 SAGE approval x 7 provision by the Company of 15% contract value x 8 establishment of project implementation management x
1 approval of 85% financing and guarantee by City Bank; starting time x
1 purchase of the land x 2 selection of final marketing strategy and identification of main factory requirements xxxx 3 engineering of factory equipment, technical specifications, purchase xxxx xxxx xxxx xxxx 4 engineering of civil works at the site xxxx xxxx xxxx 5 build-up of administration xxxx 6 arrangements for local supplies xxxx xxxx xxxx xxxx 7 recruitment and training of local staff and labour xxxx xxxx xxxx 8 arrangements for marketing xxxx xxxx xxxx --9 contacts with local authorities for approval of licences, etc. xxxx xxxx ---
10 assembling of the plants at the factory xxxx xxxx xxxx xxxx xxxx 11 technical assistance by expatriates at the site xxxx 12 purchase of spare parts xxxx 13 purchase of start-up raw materials xxxx xxxx
1 financing of 85% contract value distributed over the 12 months
Note: time zero is the startinq of the 12-month period foreseen for project implementation, accordinq to financinq contract
-->.
0 -->.
Table IX-1 - Planning of implementation of activities

_... 0 I\.)
INTR0101.XLS N°19
MONTH 1 2 3 4 ACTIVITY
1 design and technical specifications xxxx xxxx xxxx xxxx 2 purchase orders issue xx xx 3 material shipment 1 4 foundations for main building, waste treatment, aggregate hoppers 5 tower crane foundations 6 other metal building foundations 7 electronic balance foundations 8 social services building 9 office building
10 electric cabin 11 assembling by skillied expatriates 12 tower crane 13 metal frame for main building D 14 auxiliary plants 15 bridge crane, moulding crane and ground level hopper 16 concrete mixing equipment, tanks 17 forms and servomechanisms 18 equipment for steel and polystyrene working and maintenance buildings 19 social building equipment 20 electronic balance 21 transport and lifiting equipment 22 additional equipment and frames for the factory 23 analyses laboratory 24 office furniture and equipment 25 concrete working equipment 26 yard equipment 27 in-site training by expatriates 28 supply of raw materials 29 supervision and technical assistance at the site
D = goods delivery date; S = civil works starting date
Table IX-2 - Factory implementation
19
5 6 7 8 9 10 11 12
2 3 4 5 6 7 s
s s
s s
s s
D xxx xx xxxx xx
D x xxxx xxx D xxx xxx
D xxxx xx D xx xxxx
D xxx x D xx
D xx D D x D x
D D D
xxxx xx.xx xxxx
xxxx xxxx xxxx xxxx xxxx xxxx

CHAPTER 10 - FINANCIAL APPRAISAL
The project, based on a joint venture agreement, aims at producing pre-assembled houses to be marketed in the local market. The agreement, will be using the patented technology of the Italian partner.
The foreseen plant capacity is 60.970 m2. The Chilean partner will be in charge of
obtaining the necessary permits and licenses. Issues related to land, building, local labour, collection and procurement of raw material and any other input related to the operational aspect of the Project will also fall under his supervision and responsibility.
The Italian party will be responsible for the technology transfer, training of technicians and, acquisition of machinery and plants.
The financial analysis regarding this investment project has been carried out using COMFAR, the financial package developed by the Industrial Investment Division of UNIDO.
The following Tables present the input data which have been used to perform the financial analysis with the UNIDO COMFAR system (see also Annex 6).
Data have been rearranged on the basis of the information provided by the project team members following a supervision mission in the Country.
The Project intends to produce and sell on the Chilean market three different products/types of prefabricated houses.
The prices (costs and sales) are constant over the 10 years of cash flow calculation.
The construction phase will last one year (1996).
10.1 Investment costs
In Table X-1, is the list of investment costs for the Project.
It includes the following items: fixed investment costs, pre-production costs, net initial capital.
1. Fixed investment costs.
They include: - site preparation - civil works - plant machinery supply - auxiliary equipment and works - environmental protection system - incorporated fixed assets as engineering and technical assistance and training.
103

INTR0101.XLS N°18 20
INVESTMENT COSTS I LOCAL COSTS LOC. COSTS FOREIGN
(equivalent, in COSTS US$)
pesos US$ US$
LAND PURCHASE 70,000,000 175,000
SITE PREPARATION ••OUOOAOO•• OOO•UOO OOOO•ooooooooooo
STRIPPING 45,000,000 112,500 FOUNDATION DIGGING 480,000 1,200
CIVIL WORKS Jo 0 000
PLANT BUILDING 58,185,600 145,464 1,062,328 FOUNDATIONS 39,200,000 98,000 FOUNDATION STEEL 29,400,000 73,500 STEEL BUILD. COVERAGE 117, 152,000 292,880
MAINTENANCE BUILD. 7,308,000 18,270 21,690 OFFICES 39,440,000 98,600 SOCIAL BUILDING 100,572,000 251,430 POLYSTYRENE STORE 29,232,000 73,080 86,760 ACCESSORIES STORES 9,744,000 24,360 28,920 TRUCK BUILDING 7,056,000 17,640 60,732 ELECTRIC STATION 200,000 500 KEEPER LODGE 200,000 500
PLANT MACHINERY SUPPLY MACHINERY 7,645,410 TRANSPORT 40,000,000 100,000 815,000 ASSEMBLING 211,750
AUX. EQUIPMENT AND WORKS -»UJ,_~~->~OLL•J>•O•J<AOO>-OOOLOO~•OOO•O•HOOO•~OOOOO•
FENCING 5,980,000 14,950 GAS STORAGE 1,000,000 2,500 GAS DISTRIBUTION 812,500 2,031 EXTERNAL LIGHTING 6,600,000 16,500 DRAIN AND SEWAGE SYSTEM 2,080,000 5,200 GREEN AREAS AND CURBS 9,750,000 24,375 ASPHALT AND SURF.FINISH. 64,470,000 161,175
ENVIRONMENTAL PROTECTION CEMENT PLANT TREATMENT 6,000,000 15,000 45,000 SEWAGE TREATMENT 6,000,000 15,000 30,000
ENGIN. & TECH. ASSISTANCE 149,250
TRAINING 60,000 ---·--·--·····-~-
PARTIAL TOTAL 695,862, 100 1,739,655 10,216,840
TOTAL 11,956,495
ADDITIONAL FINANCIAL REQUIREMENTS
·--
PRE-PRODUCTIVE EXPENSES ....... ················· ···········-"·····
PRE-INVESTMENT ACTIVITIES 320,000
NET INITIAL CAPITAL 400,000 ·················-· ., .. ,. .. ,_. __ ......
PARTIAL TOTAL 0 720,000
TOTAL 720,000
. j -· - -------
TOTAL INVESTMENT 12,676,495 I
Table X-1 - INVESTMENT COSTS 104
2. Additional fixed financial requirements
They include: - pre-investment activities - net initial capital requirements
Most items were described in previous Chapters.
Transport of supplies refers to transport of imported machinery and of parts of buildings which are to be imported (see Chapter 1 ).
Assembling refers to the technical staff which will operate at the site for the assembling and start-up of imported machinery. It was evaluated on the basis of 26 man/months of expatriates with a monthly, overall salary of 7,000US$ per month, and of n° 17 round tickets.
Engineering and technical assistance includes the selection of machinery according to the final marketing programme, the selection of final factory layout, the design and technical specifications of the buildings and of auxiliary systems, as well as a 6-month supervision during the factory construction.
Item "training" refers to three expatriates for one month in Chile (3 x 8,000 US$; plus 3 round trip tickets) and five Chileans to be trained in Italy (the factory manager, the two foremen, the head of maintenance and one technician) for about 20 days.
The fixed investment costs (see Table X-2), have been allocated following the list presented in the COMFAR system. The total amount represents the amount (in Dollars and Pesos) necessary to install the manufacturing plant and the machinery. The total amount inputed in the COMFAR in year 1 of the project (1996), is 13,643,855 US$.
The total investment of 13,643,855 US$ has been allocated as follows: 11,603,885 US$ in fixed assets and the balance in net working capital and pre-production expenditures, in order to meet the cash requirements of the Project for the first months of operation.
Investment in land purchase has been estimated at 70 million Pesos.
A total sum of about 2,000,000 US$, distributed between civil works and auxiliary and plant equipment, has been envisaged for the factory construction, procurement of fuel/gas containers and the auxiliary and plant equipment.
In the basic assumption, selected conservatively, the productivity has been estimated as follows:
- The first production year (1997), the productivity is estimated at 25% of the rated value. - The second production (1998), the productivity is estimated at 50% of the rated value. - From the third year the productivity is confirmed at 75% of the rated value.
These assumptions allow the evaluation of the benefits in a "risky" situation. In the sensitivity analysis, different productive projections have been estimated and calculated.
105
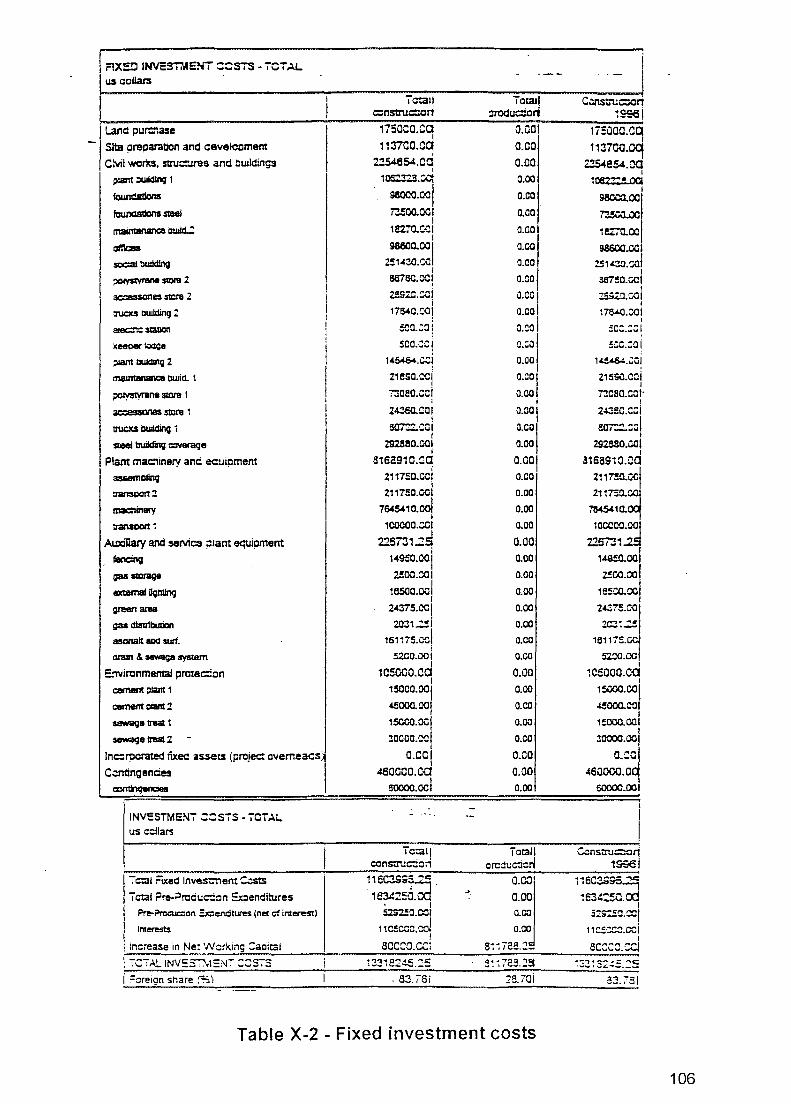
r AX::::l INVESiMENT ::::SIS - iCi ~L ~ acilats
l.atld pul'Clase
Sita preparation and cevelopment
C:vil wcru, stru=ires and buddings
p:ant~1
founCatlcnS
fcunaatlCnl steel
maimanlll'IC8 ilulld.1
at:lcsa
soc:al bW!dlng
~-2
ai:::::essones su:ra Z
:n:cxs owlding 2
eiec::-.:: 3tlllCl1
)(eeo« loage
~ IJUJ4UIQ 2
maunananc::a buliel. 1
~8st0f'B1
ac=esscnes stcra 1
1rUCla buddino i
SIM buildin9 c:iveraqe
Plant mac:.'iinery anc ec:m:ment
as&amllling
~rt2
madlin8"f
Auxfliary and servic:s piant equicment fancing
ga&S10nlge
4Xtatnal Doll!inq
green area
i;aa dlsll1bulicn
ssonaJt alld surf.
arain & -Qe sysiam
E:'IVironmental proteC:::cn cement plant 1
cement pial1t 2
sewage traat :Z
lnc:::rporated fixec as.sets (projec: ovemeacs:
C.::rrtingences
ccnli'1g•IC8S
I INVESTMEN7 c::s1s - 'iOTAI..
. us dollars
1 ctal i='ixed lnv~ent C.::sts
'i otal ?re-;:lrcch.:C:::::n Ex:ienditures
I Pre-?rcauc:icn :.X::er.dit~ (net cfir.t~) lmerests
I I ln::rease in Ne: Werking Cacical
\ TC7AL INV:57:'11t::NT ::STS
i .=oreign share ~)
Tc!all c::nstru:=:cri
1750CO.CC
1137co.cd I
2:?54854. c~ I
1~.::c:
98000.ooj r-soo.001
I 18270.C.CI
I
z:°:.:1 S87sc.ccj zgszc.::ci
i 17640.C-Ol
:ca.co 1
5CO.CCI I
1 "45464. c::j 21eso.ccj ;:;oao.cci
I
2~0.COJ I
sor..z.:ci t
292880.001 I
S16c910.CC i
2117SO.CCf i
211750.001
7045410.ooj
1COOOO.CCI
225731.2::1 i
1-4950.001 I
2S00.001
1esoo.ool I
2-4375.CCI I
2031..:.!i
1s11i5.c.cJ
sico.ooi I
1CSCOO.CCI I
15000.00j
-45000.001
15CCO.CU! ~coco.co
a.eel 460000.C-0
I 50000.001
Tc:aq cons:ruC::::: ri
11 SQ:!S;S ~=
1S34:!50~ I
52S2!0.COI
11csccc.ccl I
8CCCO.CCi
. 83.i'Si
Tota1I :roduc::icr1
a.001
a.co 0.00
a.co a.co 0.00
a.co a.co o.co 0.00
Q.CCf
a.col a.co I a.col a.aol
! a.col 0.00
i a.aoi
I a.col 0.00
0.001
~:~~, 0.00
a.co 0.00
a.co o.ao a.oo a.co 0.00
a.co a.co 0.00
a.ao a.co a.co a.co a.co a.ao
0.00
Tocall crc:ii.:dcrl
~:~~I 0.00
a.co 8i~725.2-
25.70i
Table X-2 - Fixed investment costs
Cwnstruc::cri ~9961
175000.CC( J
1131ca.oq I
ZS4eS4.oq 1082::.!..L'.Xl
I G8CCO.OC
~..sca.oo
1l!Z70.00
98600..CCI J
:514~.~I I
SSi'!!O.(;Qj I
zs;.zo.~1 I
H640.00i I
:c:.::1 :::c.:al
14!4&4 . .;Cf I
21ssa.cc1 7:!caa.cct·
I 24~SC.C~i 1rn-.. ~~1 ~,..._.w
2S2!SO.COI I
a1sas10.ca 2117SO.~"".<: 21-:7so.r
7&45-410.
10CCOO.OO!
2257:l1.25 I
1~001
:z!C0.001 1SSCO.CC
24375.c<JI
2~! ::1 161175.cd
52.."<l.ool I
1c=ooo.ca I
15000.col 45000.cal
~=:~' a. ,.. .... wY
4SOOOO.O
60000.001
C.::ns.:U.::::1Jtl 199€1
116C39;5.2:j
1S34:5i1cd 3:s-...:a.~I 11c:~.ooi
I
sc:::cc.sci .. -:., .. :::- ~= """C: ·--· ....... --. -
82.751
106

10.2 Operation costs
The nominal production capacity of 60,970 m2 for the equivalent of 671 pre-assembled houses, will produce 45,727 m2 of houses at the assumed productive capacity of 75% from the third year of production onwards.
Given the "unlimited" availability of raw material involved, the estimated production capacity should be achieved without shortcomings. Also from the sales point of view, given the high level of demand due to the large governmental housing schemes, which guarantees the complete absorption of the project's production, no market failure is assumed.
The Project is labour-intensive.
The labour requirements, classified according to main groups, present the following range of payrates: from 3,432 US$/year, to 17,875 US$/year, including taxes and social contributions. At full operation, 218 people will be employed by the project including the administration and management work force.
In the "Pre-productive expenses" item, a training component has been estimated.
In the "Working Requirements" table, the following parameters for the success of the Project have been taken into consideration:
a) Given the unperishable nature of the products, 60 days of finished product is the mandatory stock requirement condition which must be met.
b) In order to counter-balance the cash requirements of the Project's major inputs, a period of 30 days has been foreseen for both "Accounts receivable" and "Accounts payable".
The production indirect recurrent costs (see Annex 6), are mainly represented by labour costs both in the production and installation phase, administrative and marketing costs. Administrative overheads (general costs) have been also included.
The total amount considered is 506,698 US$ recurrent every year starting from the first production year (1997), to the last year of the calculation (2006).
The direct production costs are related to the three products foreseen: namely IH40, twofloor two-unit, and four-floor sixteen-unit types.
Those costs are the following:
IH40 type: 2-FL, 2-UN type: 4-FL, 16-UN type:
The total costs per year are
6,378,293 US$ per year; 3,389,532 US$ per year; 5,980,055 US$ per year.
15,7 47,880 US$.
107

10.3 Sales and revenues
The sales programme, has been considered according to the total square meters produced, multiplied by the sales price in Pesos. Data referring to nominal rated production capacity are in Table X-3.
10.4 Costs and Sales
The cash flow Table (see Annex 6) presents the flows of costs and sales over the 1 O years of project calculation.
The presented cash flow is based on the assumption that only the 75% of the productivity will be maintained from the third year of the productive phase. This basic assumption allows to re-examine the sales programme inputing higher productive parameters in the sensitivity analysis.
10.5 Project financing
The Joint-Venture's structure foresees an equal distribution of the Company's shares between the two Partners for a total value of 2,000,000 US$.
The remaining 11,700,000 US$ need to be covered by external financing. The proposed scheme for such coverage is 11,700,000 US$ in the international market, at 8% interest rate, to be reimbursed over a 5 year period.
10.6 Financial results
Tables in Annex 6 report the results of the financial analysis performed through the COMFAR system. In all Tables, data are restricted to 2002, being the data the same for all subsequent years.
The Project presents a financial IRR of 24.29% (including corporate taxes of 35%), with a discount rate of 12% and a positive Net Present Value. This represents a minimum but sustainable investment ratio, considering that additional tuning of data might increase the IRR (i.e. including full production from the first year).
10.6.1. Net income statement:
This Table provides a concise and yearly overview of the annual turnover (total sales), direct costs, indirect costs, depreciation, interest expenditures, income tax expenses and net profit generated by the investment project.
The Project, after a construction period of one year, will rely on a net profit (assuming a zero-level inflation rate and after 35% of corporate tax) from -516,480 US$ to a maximum level of 3,264,862 US$ in year 10.
108

...... 0 <.D
INTR0101.XLS N° 20
TOTAL IH40
NOMINAL SURFACE PRODUCED m2/year 60,970 22,220 UNIT SALES REVENUES pesos/m2 178,349
STANDARD YEAR PRODUCTION m2/year 60,970 22,220 SALES REVENUES pesos/year 12,420,270,980 3,962,914,780 SALES REVENUES US$/year 31,050,677 9,907,287
FIRST-YEAR PRODUCTION m2/year 40, 113 15,554 SALES REVENUES pesos/year 8,094,002,286 2,774,040,346 SALES REVENUES US$/year 20,235,006 6,935,101
Table X-3 - Nominal sales revenues
21
2-FL,2-UN 4-FL,16-UN
12,830 25,920 233,900 210,510
12,830 25,920 3,000,937,000 5,456,419,200
7,502,343 13,641,048
6,415 18, 144 1,500,468,500 3,819,493,440
3,751,171 9,548,734

10.6.2. Cash Flow
The liquidity aspect of the Project is clearly illustrated in the "Cash Flow" Table. This Table is a further confirmation that the Project should not encounter any short-term cash deficit.
10.6.3. Working Capital Requirements
This Table calculates the working capital requirement of the Joint Venture on the basis of the estimated coverage days indicated in point 10.2. At full utilisation capacity, the net working capital of the project equals 891,788 US$.
10.6.4. Sensitivity analysis
The most sensible parameter results the sales programme/productivity. All other parameters (investment and running costs) provide minimum modifications.
Therefore, we estimated two additional, less restrictive, sales/productivity programmes as follows:
Alternative 1:
a) year 1: 50% of productivity for all products;
b) from year 2, ongoing: 75% of productivity for all products.
This alternative provides an I. R.R. of 28%.
Alternative 2:
a) year 1: 50% of productivity for all products;
b) from year 2, ongoing: 100% of productivity for all products.
This alternative provides an I.RR. of 37%.
110

ANNEX 1 - TYPICAL COMPOSITION OF LIQUID WASTE FROM THE FACTORY
111
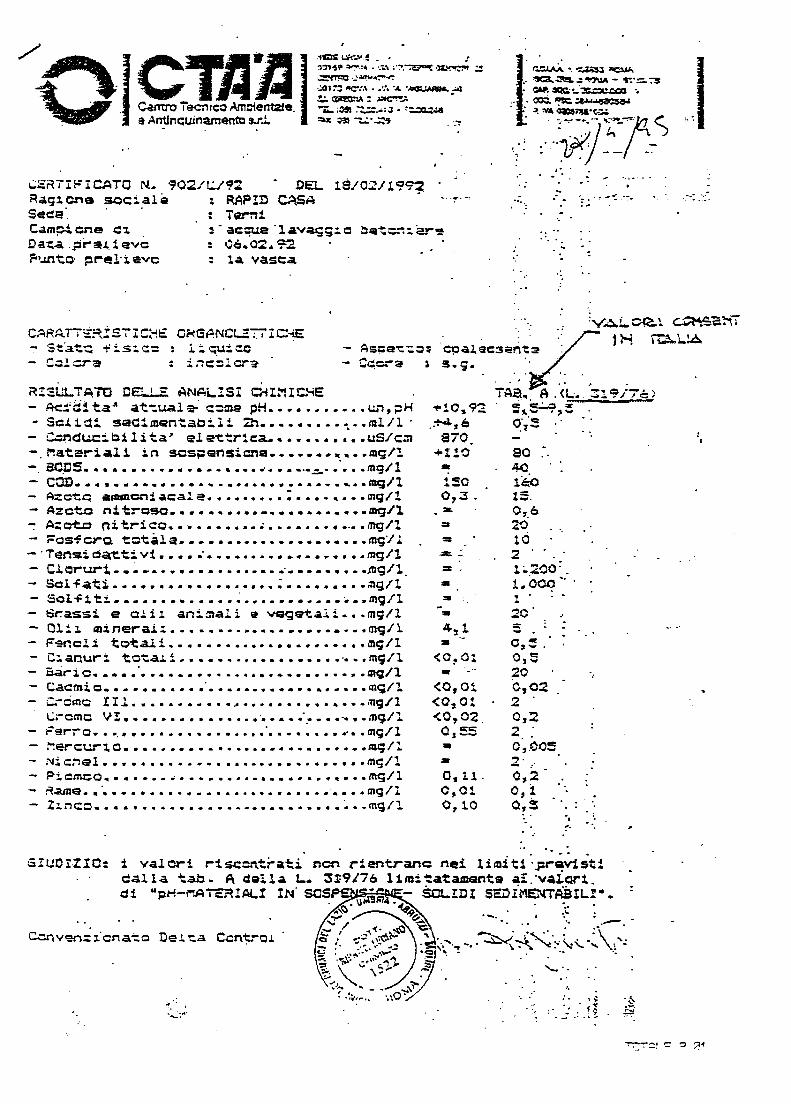
:il&lS ~-".! ! :l~i'P "".""-·~ • ·::.'\ :·:-.~ ~~ .=
..:.-a,:: 114<:!,\ • • ·: • • "' -~~
.:.:.~:l~.;. --a.. ~QS! :-:..::.- : .J .. ~:.:c.:.:.a
=;.x 3 ~·~
..:;;:~T!r:ICATO N. ~O~/LJ~2 .OEL 18/02/19~ Ra.c;.icne soc:ialia : RAP!D CASA Sec1;1 ·. · · TQ?"T'ti Ca.mp.tone Cl. .
Dal:..a. .;:fr·~.L.1 eve F<•.uit.c· pl""t!l·:i.evc
~ - ac:~e ·1.vai;;;:.o z::~tc.-::.ar9'! ! ¢6.02 .. ~2 : t.a. vase~
. · ,._ .
: ; . ~--~ . .
. : .: :Y'Ai..0-tal ~'a!il
St.at-:: -;: !.s:. c: l:. ~~:i =c C.:i.l er~ i nc:=l a=
R!Sl.Jl.. T~TO OEW....E. ANAL!S! CiI!'tICHE:
· · : z·· 1H ~i..!A opalac::;en'.=~ : s.;. . . .· .. .
. . ' TA.a,. A. <L· ... 3!. 9.i7e ~
Ac~.'d! t.a.a at"":u.al e-· c:ma pH ••••••••••• ~.,, ;:H Sci1d! sad!mQntabili :zh ••••••••• ~ •• ml/l · ::.:nducibilita' el~ttr1c~, ••••••••• uS/cm
-. ~a.tariali in sas;:ensicna ............... aiq/l a~:s .................... ..... ···-=-· ••• • mg/1 Ct:Jlj •• 4 ................................... mg/l A:ctq a.mncniacala ••••••••• : ......... mg/l Azcto nit~oso ••••• - •••••••••••••••• mg/l A:ot.c ni t.ric:o ........... ~ ...•..• • •·•. mg/l Fosfcra tctale ...................... mgJ•
- · Tansi Oa-t,ti vi •••• • · ........ .., ....... ,.. ..... mg/l C.l.cr-tJrt ... ~ -· ••••••••••••••.•••••••• • mg/l. Sol~ati •••••••••••••.•••. ; ••••••••. ~g/l Sol~1ti •••••.••.•••• ~-·······-··•··m9/l ~r.assi e c!il animali e V&9Qt•li ••• m;/l Ol!~ mineraii ••.••••.•••••••••••••• tJl9/l F-sncl i tota..I. i . ...........••......•. mc;/l C::..a.o.ur:. tc"t.a.J.i ••••••••••••••••••.••• m9/l a.elr-io ...... · ........................... - .mg/1 Cac:mi a • •••••••••• · •••••••••••••••••• mg/l C:-Omc !Il ....................... , •. . m9/l L:rcmc V? •••••• .......... · ....... · .......... mg/l r="er1c • ................... ; ............ in;/l ~erc:t.!rl-O ................. ., •• ~ ........ • m;/l Nic~el ••••••••••••••••••••••••••••• m~/l Picm.c.o ......... . · ...................... • lftg/l R4tme • .. · ••••••••••••••••••••••••••••• mg/l Zi.nc:o •••••••••••••••.••••••••••• ~ •. mg.fl
5IUO!-ZIO:
~!Cs9:!
.:t-4,e 870
+1!0 -150 o, .3 -a
= =
..
<0~01 -<O,O!. <O,O! <0,02. CJ~5 .. .. 0 9 11. 0,01 0,10
80 4-0. l.~ 1:. 0,6 20· 10 2 1 ;..-2,00=. 1. O°'? •. l 20 =t .... o:1; o,s 20 c,02 2 0,2 2 o,.oce :z· 0,2 o,1 o.,~
·, '·
: I
ANNEX 2 - OFFER FOR CEMENT SUPPLY
112

Cemento Melon S.A. Mirnllores 178 - -1• Piso Santiago de Chile
Senor
ielelono: (56-21 6381005 Fax: (56-21 6394979
~Cementa b:!::!d Melon
30 de Marze, 1995 96-C-V/95
Nelson Cataldo Intertransports Center S.P.A. Presente
Estimado senor
De acuerdo a lo solicitado, tengo el agrado de hacer llegar a usted, nuestras condiciones comerciales de precio de cemento para el Proyecto "Instalaci6n Planta Prefabricados de Hormig6n Liviano"
Cantidad
Producto y Pracio
Lugar de entrega
Forma de page
Reajustabilidad
Asesoria Tecnica
. .
. .
. .
Aproximadamente 13.800 ton/aiio.
Cementa Melon Extra Granel. $ 55.884,00 + I.V.A. par tonelada.
Cementa Melon Super Granel. $ 61.395,00 + I.V.A.
Puesto en vuestra planta.
Contado.
El precio se reajustara mensualmente de acuerdo a la variacion que experimente el Indice de Precios al Consumidor (I. P. C.), entre el mes anterior a la f echa de facturaci6n y el mes de febrero de 1995 (245,25).
Cemen to Melon cuen ta con un equipo de prof esionales que pueden asistir a sus tecnicos en el mej or uso de nuestros productos, lo que incide directamente en la calidad de las obras a ejecutar. Este servicio es gratuito y puede ser utilizado segtln acuerdo mutuo.
-------·---·-·

Cementa Melon S.A. Miraflores t 78 - -l9 Piso Santiago de Chile
Accesos
Validez de Oferta
Tetefono: (56-2) 6381005 Fax: (56·2) 6394979
~Cementa b!::!d Mel6n
. . Se entiende que las precios y condiciones ofrecidas estan sujetas a que los accesos a la f aena permiten la operaci6n normal de transito y descarga de nuestros productos con carga completa.
07 de abril, 1995.
Saluda muy atentamente a usted.
Patricio Diaz M. ~ere Zonal ae en~as
PDM/nor c. c. : Ar chi VO
····-· -·-··---------------
ANNEX 3 - CHILEAN HOUSE CHARACTERISTICS IN THE RANGE OF LOW AND MEDIUM INCOME
113

11VIVIENDA BASICA
11 30 S.m.

LA CALERA
II
SUBSIDIO UNIF ICADO If 59 S.m. 840 UF. = # 24'560
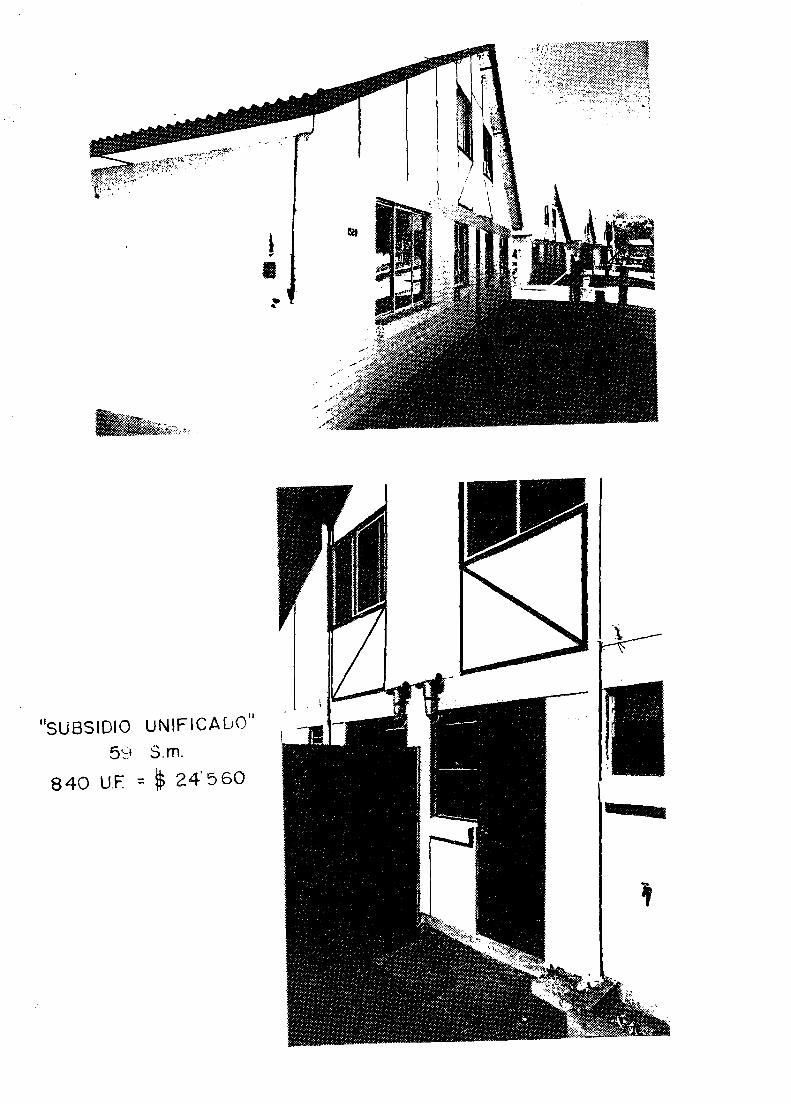
11SUBSIOIO UNIFICALJ011
5 ..::1 ., ~.m.
8 40 U.F = ~ 2 4· 5 60
l • • ...
•--~~-..

LIVING
11SUBSl[IQ UNIFI( AD0 11
59 3.m.
84J U.F. = $ 24'560
BATH-ROOM
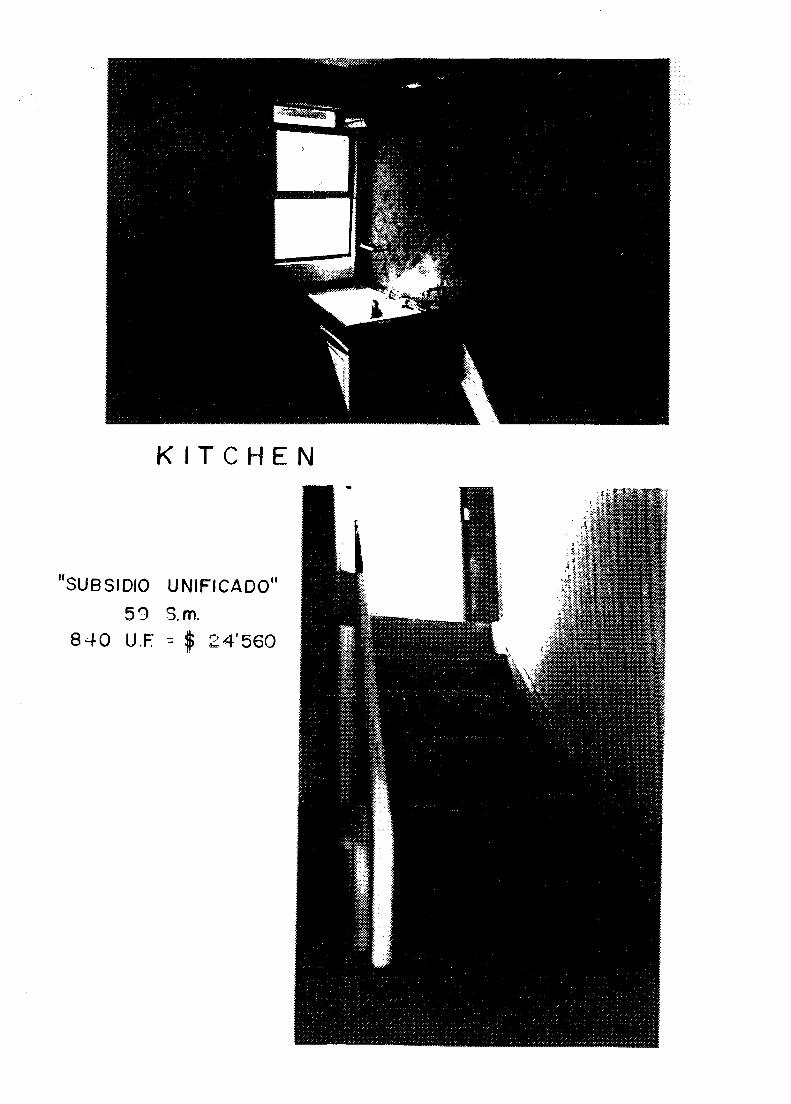
KITCHEN
11SUBSIDIO UNIFICAD0 11
59 S.m.
840 U.F ::: $ 24'560

11 8 U 8 SIDlu
59
840 U.F. :::
UNI FICA DO''
S.m.
$ 24' 5 60
LIVING
BEDROOM

BEDROOM
BEDROOM

1 ..... ,.
LA CALERA
11SUBSIDIO UNIFICAD0
11
56 S.m. 500 U.F. = $ 14.600
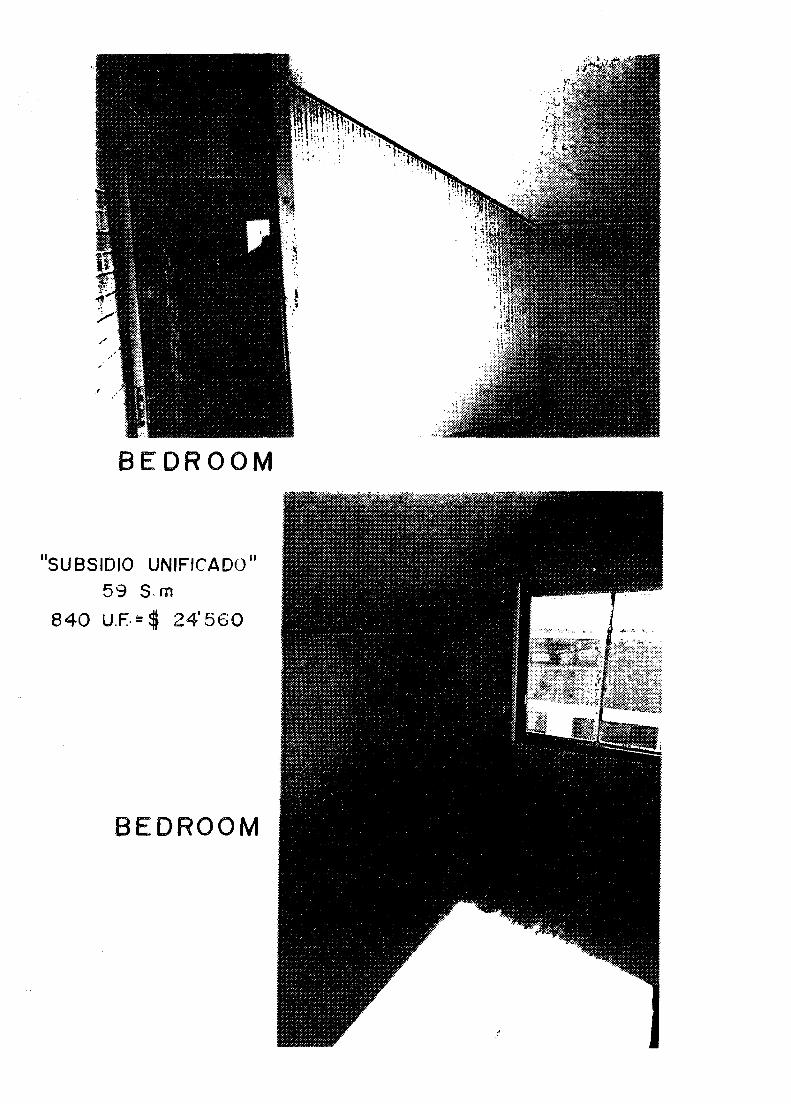
BEDROOM
11SU BSIDIO UNIFICADO II
59 s.m 840 U.F· = $ 24' 560
BEDROOM

BEDROOM
LIVING

KITCHEN
BATH- ROOM

VI LL A ALE MANA
•
~-............. .._ .... _.. _____ .... ........_ ''·f·

·~
SANTIAGO
VILLA ALE MANA
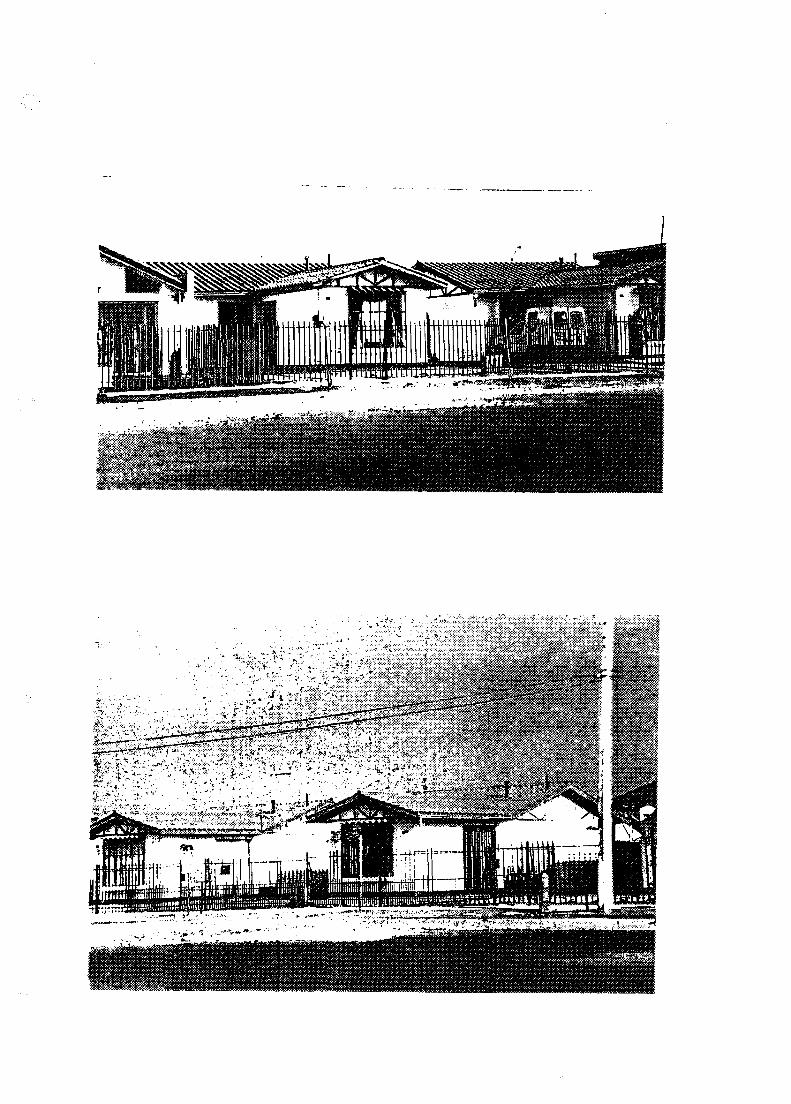

ANNEX 4 - CHILEAN HOUSE CHARACTERISTICS IN THE PRIVATE SECTOR (MEDIUM-HIGH AND HIGH INCOME RANGES}
114
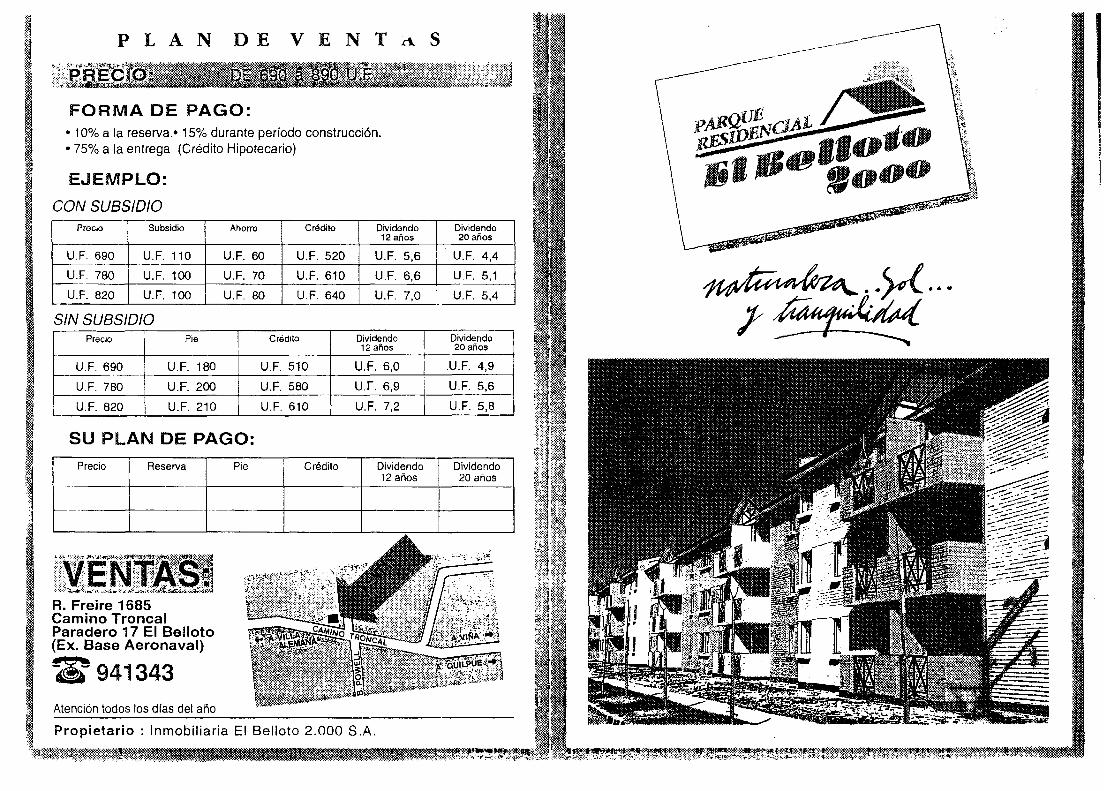
:·~:· { t·:·
I
I J
PLAN DE VENTAS
tit1m•lllJ~1.:.:·,\:;,1i;till FORMA DE PAGO:
• 10% a la reserva. • 15% durante periodo construcci6n. • 75% a la entrega (Credito Hipotecario)
EJEMPLO:
CON SUBS/010 Procio Subsidio Ahorro Credito
U.F. 690 U.F. 110 U.F. 60 U.F. 520 -~-~ -
U.F. 780 U.F. 100 U.F. 70 U.F. 610 --U.F. 820 U.F. 100 U.F. 80 U.F. 640
SIN SUBS/010 Precio
I Pie Credito
U.F. 690 U.F. 180 U.F. 510 ---
U.F. 780 U.F. 200 U.F. 580
U.F. 820 U.F. 210 U.F. 610
SU PLAN DE PAGO:
Precio Reserva Pie Credito
Dividendo 12 aiios
U.F. 5,6
U.F. 6,6
U.F. 7,0
Dividendo 12 aiios
U.F. 6,0
U.F. 6,9
U.F. 7,2
Dividendo 12 anos
-~~~~-;~~~~~~- +~--~--~~+-~~~~~~-;~~~·
l:.·::'.l'·,::·::i::'l' ,llt .... J~~$tJ*:_::·:~i"jtl~:l:t'~:t:·:,w;:*~:::.:«-I . ..: .
. , t3l E l\'.:1m1A1~ ·:;J:l;!{:;_ .... _,l·~J£!.'.!~~~~ R. Freire 1685 Camino Troncal Paradero 17 El Belloto (Ex. Base Aeronaval)
~ 941343 Atenci6n todos los dfas del ano
I i i
I
Dividendo 20 anos
U.F. 4,4
U.F. 5,1
U.F. 5,4
Dividendo 20 anos
.U.F. 4,9
U F. 5,6
U.F. 5,8
Dividendo 20 anos
~)~]*··· ;t~~ r:~:ri i~t~'.tjtj
n i~1 ;;.;.;.,;.;
-·------.--------------- ~,2:}:t~n;
I ·.·~ \
~Q~ cML . 4'·4Bt 1ifsIJJffi - 110•-fi • fJdJ ,,,,,,,,
tl Propietario : lnmobiliaria El Belloto 2.000 S.A.
·1wm1t1f..~wmmwrmwmwmmamt.l"'l"I:*. ·_ "".""HH"".1~_·.1· .8:.l"."!.~11·"""11 .. 1. :::::.m .. ,m .. , ......... ..... .. ·wa1sm1mw1wa1n~ir:,,~:~~~i~~w~~~~:tt~~~mm1'f!t:~~eM1!T'~t=~~!:f:~F:t:n:t11l'mt&.!?::mL)!UJr=~w1:rt=::tl•:·™·:.::if!.:m_~

U na gran urbanizaci6n en un excelente sector
de la ciudad de Quilpue. Su buen clima, rodeado de naturaleza y tranqui/idad le haran disfrutar plenamente su nuevo hogar.
-----· ·-----pAJl.QUE ~1vENCIA! / ---=-=-°jj I B llJ ll0,0
floOO
• Ubicaci6n en el coraz6n de El Belloto ( Ex Base Aeronaval ) junto al camino troncal.
• Urbanizaci6n completa con amplias avenidas.
• Areas verdes • Centro Comercial • lnmejorable oportunidad de inversion • Ventas con y sin subsidio
Caraterlsticas de los departamentos • Albaiiileria reforzada a la vista • Tres dormitorios alfombrados • Piso de flexit en living - comedor • Bano completo con tina • Closets terminados • Loggia con lavadero • Balc6n • Excelentes terminaciones
.c-B\~'.'(%~:!i't•;1t;%1;t1:~~~t'M11r~'1m1:%¥fM{;:t%%''~Eittifi\IBBf!t1Tu1¢1l~~ltlme~~\~~--"'"«·•
~~;~~---.
DEPARTAMENIO )'-! . - - Ii 3 DORM., 1 SANO I~ ----
1
''~UI!lr~J - •RtITr -:r ~._!'. :;FtT' ·"'""F~""!I·~ f~:~·1
Des de U. F. 690 II ~ i 1•
• ·~ ~· 11']] trl IJ_-.-·... l ' 1. Jl. •'' ! . ._
[~·I -1_J--~ ~·~
. r=·· 1 ~"''-r-r ; (fl . I I
; ' J ; I
•-. ---=---.. .-~/!
T i'
·;.=,V
I I -L_ __ '
r 1 ,.-. ·~
r ~!ill i ·~~::.:.·~1:~:
_),: _: -·-· i' 1 1' , 'iTifi I ,~ ~,;:f!',~
- . .-~1. 1N.f.....i;:"-' ...... ,.c.rr~£
DEPART AMENTO 3 DORM.,2 BANOS
I " Desde U. F_ 820 ::D ,'.'\i_
• ""!¥'*
\
Y() f 1) '-' [l
!.~[- .~::~j
I I I ' ; ' I ' I I "
I ' : I I
..t...!.J-ll_-LL -:~L
)~ ,?, .J -I 1X:i-
I
:r ' j I
,,... ',11.-·-;-·r' ! .·I· ,.. .-.-.
p •• ·~ !
~. ;- ;_,
, ................ ..
t Q Gti) rf¥•~, -

P L A N DE V E N T A S
PRECIO: 1650 a 1860 U.F.
FORMA DE PAGO: • 10°/,, ci 1<1 rAsArva. • 1 fi% durante perfodo construcci6n. • 15°1" a la entrPgEI 1Crerlito H1potP.cario)
EJEMPLO: .... ----,---------------···--
Prec!cc · l"eserva ; Pin i I
- -- -I -
1650 165 255 - - >---- - -------- -
1700 170 260 >------
i800 180 270
1860 186 284 --- ---
SU PLAN DE PAGO: ::>rer10
-,----. ______ """7' __ _
Reserva I Pie
Credito
1230
1270
1350
1390
f:redito
----------
-
Dividondo 12 anos --~ -13 0
13,4
14,2
14,7
Dividendo 12 anos
~-
'-------------- -----~-
~-=---+---
rnvirJcndo 20 anos
9,9
10.3
10,9
11,2
Uividcndo 20 anos
l ns l:i;:i:;tos Gem'!ralr.s do Opcr;:ir.iiin :;o pawm al rnomento de firrn;:ir ornrnesa de Cornpr::i11Anta. La 1 •r11prns.1 tn1111t<1 c:11 crerl1tn h1pntncrino
VENTAS: R. Freire 1685 Quilpue Fono:941343 ,\tcncion rndcs los dias ck:I :int.
Arquite('to: (:. ,\gu11re ~!
Cakulo : ARCO<;EN LTDA. Cono;truvt- El '.:irll'ln S.:'1 Financia : lt1nrn l'nnr·Ppci6n
---- -----------------Propietario : I1rn1uLiliari:i El Hclloto 2.00() SA.
~~ CONJUNTO RESIDENCIAL
~
Casas aislaclas de 90 111 ~

-.·1.·:
•• El en .. orno • Nueva Urbanizaci6n con Amplias avenidas
y ca!les pavimentarlas ............... w....=...~- w 'I
• Toda la movilizaci6n a 1 ~O mts.
• Multicancha y area verde construidas
• Piscina y Club House de! Conjunto
• Pr6ximo a futuro Centro Comercial
----------- --~.,.Ro-..._____rv ------------~. C4t ~----
Su c'1.sa • Casa aislada de 90 m2 utiles. Ampliables
• Tres dormitorios, 2 bai'los ppal. en suite .
• Sala de estar familiar
Amplios terrenos ( 220 mts2) con enrrada
para 2 autos.
• Cierros completos
• Finas terminaciones: Parquet· Alfumbr:i
· Cerimicos · 2 walk in closet· Cocina equ1pada
• Telefono y 1V Cable instalados
·--
--/ ,.i :'·-::::....:_:.:_ ---._ ·-
iit~,~o I. i ;-- .
-·---1 (!---/:'
4Vo~ ii ---~ Los --R;y---- _______ . /. //
___ ii
-;1 i.
I
! j
I· I
0 I ' ,:-:~---::~ • - - ----ll ({ .. :l11D ,-;·-- __ ~ -!....1 II i o o j o· . .:.:----- --0 I i- -- - !_ ! . . ! 0 ;[]-_ ---::_,--- -
i i r· -- ~.;_ ·. , I , -!~ ! I . 0 / ·' -.. • i I ---~~. I i ·!J!D --- __ s/
.rN' i--->--:-~-- _ -<:~- ::.-dL_.j D a10' -- ~:· ;\ \' ; ~ ~ .'" ....:.:~---- - .::· ·.::--~... .· . ; .. r--·-* "'}<' --- -- ----- !J .- ·- ~t . .J· a;----~'· ~--- -...:.:.-~ -,; ~ ' il .; \-' ·1· Iii_~%-~.,:~ \(~~/i~- - r-- I -- ~: ·- 1 . -- - ER 1
1 1i 0-1 a i
:+> - ~L- ~ ~ ... ~ ~ ·) ;i c~- it r:_, ~ !
N, ~,
~ ~
=\). '~- ~-~ ----~.-.: 1'.' __ ~_2: L._J .; 0: I I ':f>. -,- -~ ---~-~__:___]'~
0 1 0 1o·o·u:o10T 101
11 1 1 ; 1 · 1 1n1 u:
!i ; - ,_. - --- ! _ j _I • 1 _ _ 1 Ljr :
'11 ~q- .·~ 1i .~ ,~ 7 0·1o+ororo,otdo1G· Ji !. ~-; --·! · -- -·· - __ ._, "'-:-'_·:= .c'.'.:::::: "- :::.: ,J:-_.., -:::.1_:_.L]J , ,, I • J • I .. --1 ---------------------------- ·---------
AVDA. V CENTENARIO
Ll R ~
-; ~J -j ~ --1 "i t- ' I i
~ I t ·1
I ! t i r J r -: ~ - 1 r ~ t' - [ -
~ 1 j ! I I
~-- r- -: L i
~ I l r- - ~ --~
PLANT!:- :·\NSARDA
PIANTA PRIMER PISO
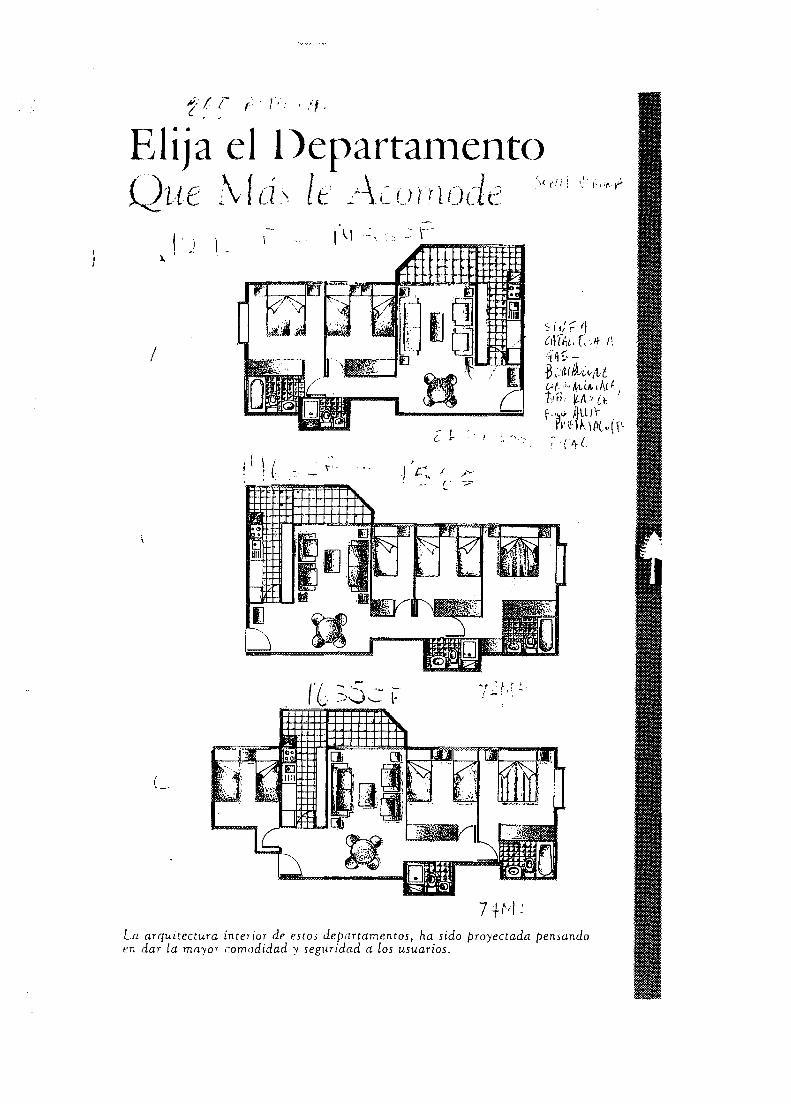
Elija el l)epartan1ento ' ') \ f , l ~ 1 .'\(ti i ! .~. l·dq"
1_,{ c·<; ,· · .·· L··1 \ t.·; ,.:- t- ( > 1 r l (){.-- · ,~~· , t. . ~- ~ - ,_ -· I -· - '--·
I
( __
' ( I I ! ·: l:
IJ _J
z ~ . '
La arquzcectura inre1 ior de estos departamentos, ha sido proyectada pen~ando rn dar la mnyor rnmcJdidad y segHridad a los usuarios.
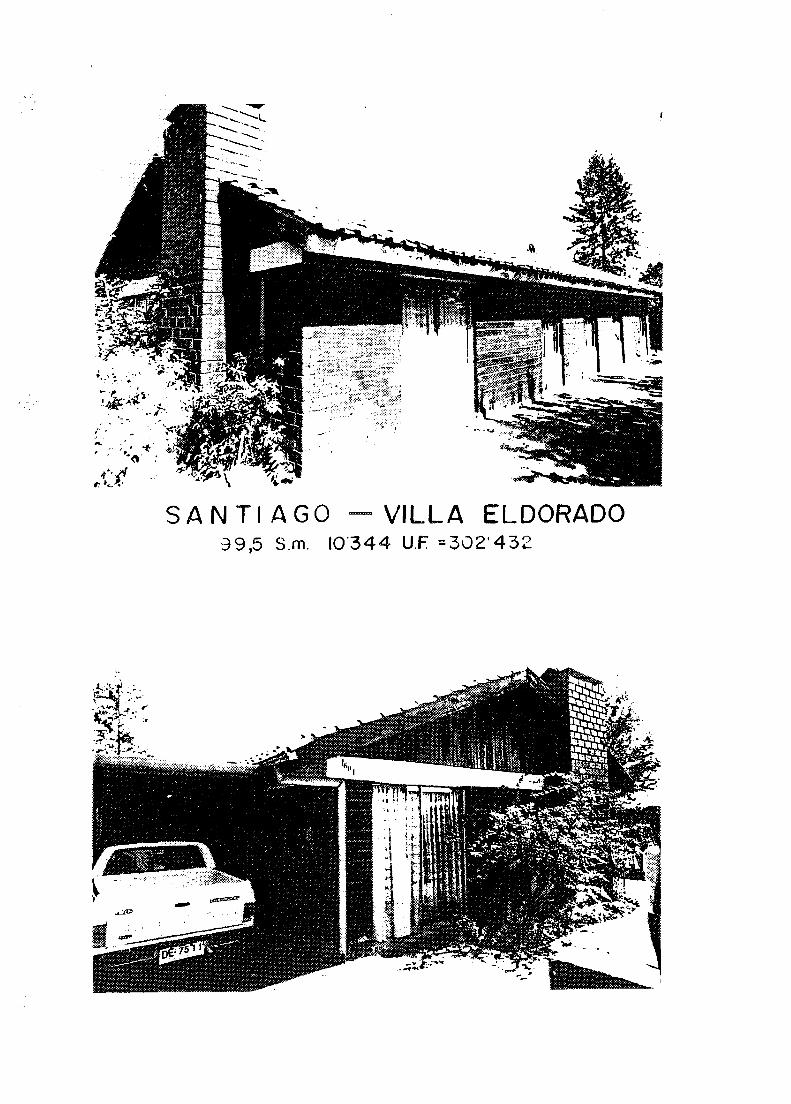
' . '~ .. ·,· ... - . ·'
~~ ------:;f:?:.:~ ~ ~~s ~
SANTIAGO VILLA ELDORADO 39,5 S.m. 10·344 U.F =302'432
-

VINA DEL MAR

VINA DEL MAR

LA DEt1ESA SANTIAGO

440 S. rn. 18.500 UF. = 540.000

440 SM. 18'500 U.F = $ =540.000

ANNEX 5 - CHARACTERISTICS OF HOUSES PRODUCIBLE THROUGH THE PROPOSED TECHNOLOGY
115

r
r
,-
r I
r
' 7
_,I I I
,-1
\ I
r .,
2 .1 TIPOLOGiE lDENTiFICA TE paragraio 2.1. 4
= tipo IH 40x21 B ncte
codi:2 n. 1 04 000
sucenca C:llle!ta I
1171Su mqj • • smefcie fcrda ma 93,~
so001cma - I cm., 41s=3z;,s le:tto 1 I c:n.1 . 315 x 323~5 I due accartame!1ti
I .. Jette 2 c:n .. J 210 :% 323,5 hanna !e ste!Si!
bacnc I 310:: 17_011 sucerr!d inteme C:"n.! .. I .
anaoio cmtura c:n .. 180:: 14815 ... c.-n.I disimoe!lna 125:c148,5
~--------- 1.392
-------------------------~ ·---------------------- .,
TiO 652
I
I
__£1: 70
: 114
844
bagno rl ... u ~ \ ! I enc 1
...
1 - I a.ngc::-1 I c::tt. ais. \ lenc 2 sc:;gicrnc /_ I \j ( I
scggicrnc leno 2 dis. ~ang. c:::ttura
lettc 1
LJ cagno I 11 1.
---------------------~ ······ .
/CO
I
~-------------------------] +----- 630 ----...12.-
4----630 ___ ,....~
1.332
dimensicni in canlimetri
TJ.VCLA

'"· ·('---~
I I •,
--"c<:z - ?:._ J
_.:,....._ ' !
I .....__ ~
I I '
I 81 ~I
I CJ ~ i i I j I
I
7G...~
: '
i I
~- o<;c; ;
<ft ('J/
\!ll
I I
I
I ! I
I ; I
I i:1.11 I ,,..
--";-- ~II \'
I I
I i <fl ! ~ I ·~I
I I I
I -"-r---"'r
0 :2:
C-i I
i~ b:: 0: 'L.!.l r. i i ·a t2 '.<1 1_ h ....--! '

<T <T
01 <T'
j <
Vl : "'I <C :
-"'<-i I
Cl 7•
·""' I
;:;~
Cl <t;
"''
-"":-
o: <T ;
·""I I i
-
~-=-i
o~ <T ' ,..,·
-~ i ! ' i I
al I "'I <D'
" "
:~ ~ . .:S
n
i!: :I'
1!
" I
~
I 1: ; .
B i;
-l
-·~~'
=
~· .})j .,.,, i ~ I
::1 ~i
I I i
~
~ ---,-, cl I! .,, < .~l ;: ~~ oi
I <T :
01 ~f.
"'' i I ~
I
i Cl G'll <Tl
I
I ~
I ~I ..,, I I
+ I
I I
ci ~1
1 I
GI "11 :<'II
I I "' ~

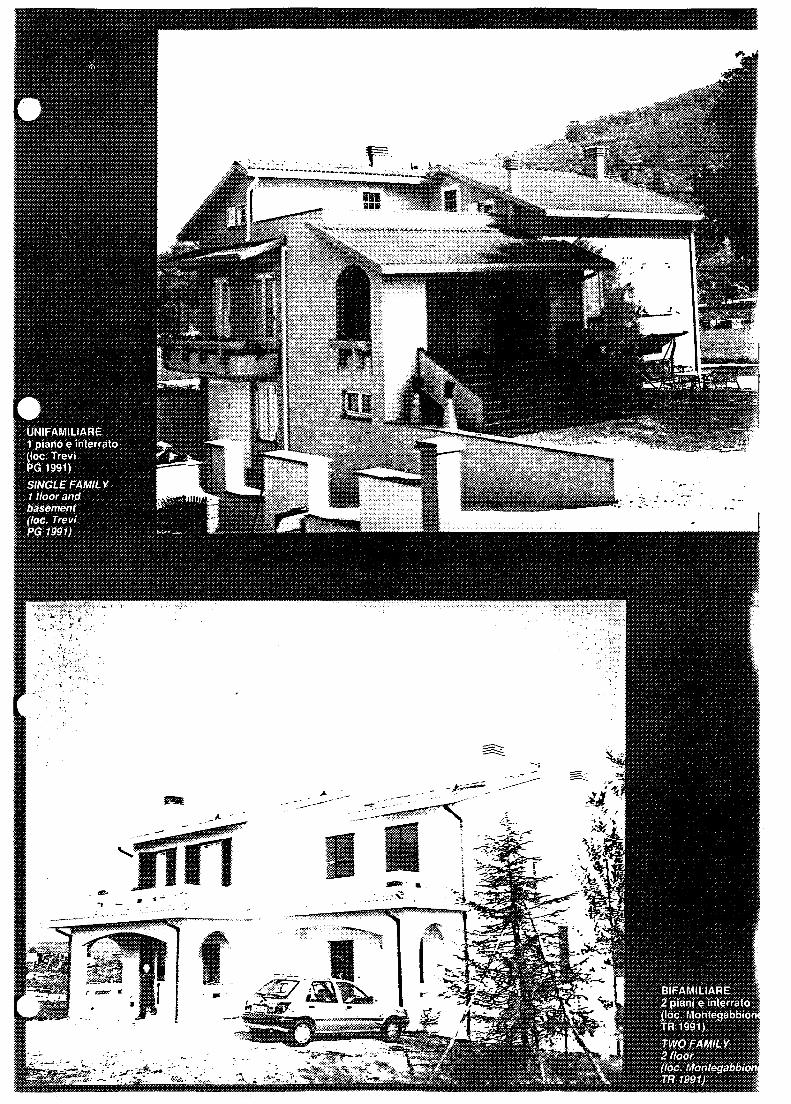
". ·i
--;
---=----> ---:---~--- -- :__· ___ ~-
--- -~~~: .. ·· ~ ' 11: -·a -: :>:?:
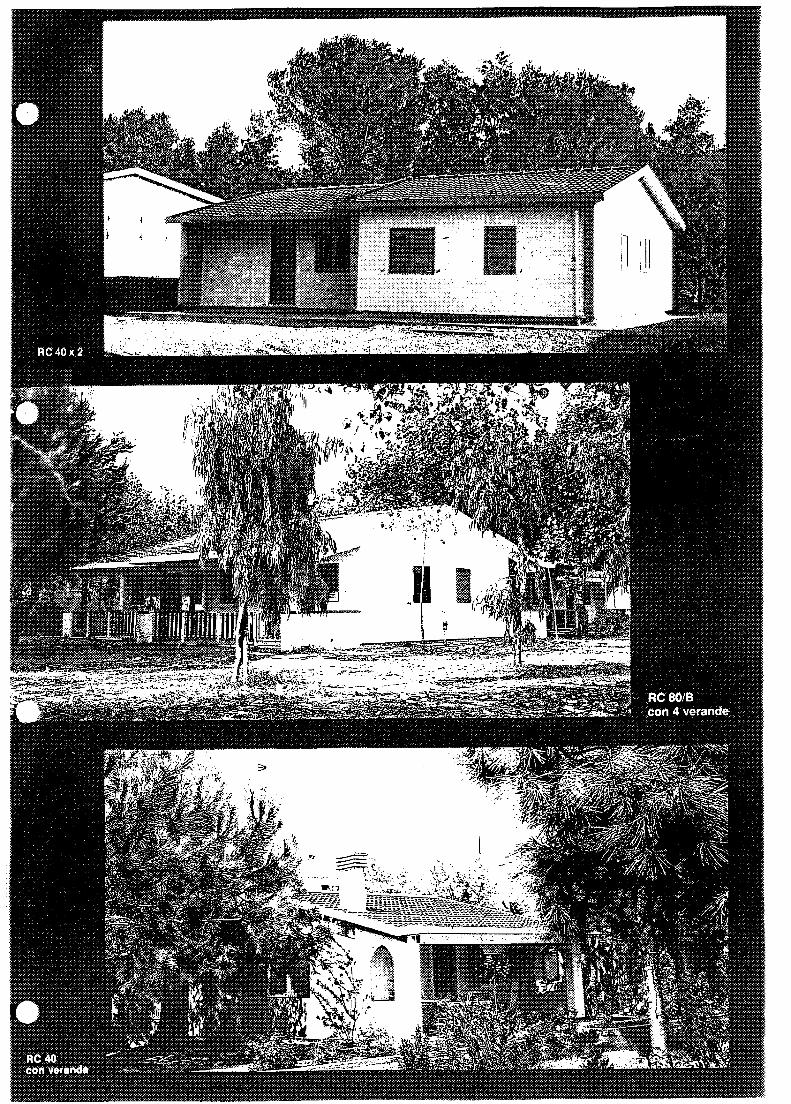

DICHIARAZIONE DI IDONEITA
IL PRESIDENTE DEL CONSIGLIO SUPERIORE DEI LAVORI PUBBLICI
- Vista la legge 2 febbraio 1974, n. 64; - Vista la Circolare del Servizio Tecnico Centrale n. 6090 dell'll
agosto 1969; - Vista la domanda presentata in data 27 febbraio 1987 dalla RAPIDCA
SA S.p.A. con sede in Sangemini (TR) afferente la richiesta di rinnovo del certificate di idoneita tecnica del sistema di prefabbricazione ''RAPIDCASA' '; Vista la documentazione tecnica presentata ad illustrazione del sistema; Vista la precedente dichiarazione di idoneita tecnica rilasciata in data 13 marzo 1985 con validita triennale;
- Vista il voto n. 153 espresso dalla I Sezione del Consiglio Superiore dei Lavori Pubblici, nell'adunanza del 23/30 aprile 1987; .
- Considerate che il sistema non ha subito alcuna modifica, ma degli aggiornamenti che non incidono sulla staticita del sistema.
DICHIARA
Le strutture portanti realizzate secondo il sistema di prefabbricazione ' 'RAPIDCASA' ' definite, per quanta attiene alle loro caratteristiche tecniche, dalla descrizione che fa parte integrante del presente certificato, sono considerate idonee ai fini della costruzione di edifici anche in zone sismiche, a condizione che siano rispettate le prescrizioni dianzi riportate. Il presente certificate di idonei ta e valido per tre anni a decorrere dal 13 ma.rzo 1988, data di scadenza della precedente dichiarazione ed e rinnovabile SU domanda che dovra pervenire al Servizio Tecnico Centrale almeno tre mesi prima della scadenza, corredata della documentazione delle piu significative applicazioni fatte e dei relativi collaudi statici.
Roma, 13 MAG. 1988 IL PRESIDENTE
(Dott. Ing. Giuseppe d'Amore)
./


/'.NfJIW l=·-:·;. ·.
I . .
Ill .
; .

ANNEX 6 - COMFAR OUTPUT TABLES
116

;f.4~;'\l. UNIDO ~~,_ff COMFAR Ill Expert
Project title: case prefabbricate
UNIDO INVESTMEr--.JT PROMOTION SERVICE, MILAN, IT1
SUMMARY SHEET
Project description: Date and time:
allestimento di un impianto per la produzione di case prefabbricate Z.7.july. 1995
Project classification:
Construction phase: Length: Production phase: Length:
Accounting currency: Units: qeference currency: ~change rate:
INVESTMENT COSTS
New project Joint venture project
1/1996 - 12/1996 1 years 1 /1 997 - 12/2006 10 periods
us dollars Absolute usdollars 400
Total Fixed Investment Costs Total Pre-Production Expenditures Increase in Net Working Capital TOTAL INVESTMENT COSTS
SOURCES OF FINANCE
Equity capital Long term loans Total short term loans TOTAL SOURCES OF FINAr--.ICE
INCOME AND COSTS FROM OPERATIONS
SALES REVENUE Factory costs Administrative overhead costs OPERATING COSTS Depreciation Financial costs TOTAL PRODUCTION COSTS Marketing costs COSTS OF PRODUCTS SOLD Interest on securities GROSS PROFIT FROM OPERATIONS Extraordinary income Extraordinary loss DeQreciation allowances GROSS PROFIT Investment allowances TAXABLE PROFIT Income (cor12orate) tax NET PROFIT
Total construction
11603995.25 1959860.09
80000.00 13643855. 34
Total inflow
2639162.34 11 004693. 00 3620091.66
17263947.00
First year 1997
4882500.00 3491826.75
51250.00 3543076.75 790931.31
1100469.30 5434477.36
53750.00 5488227.36
470.23 -516480 39
0.00 0.00 0.00
-516480.39 0.00 000 0.00
-516480.39
Total production
0.00 0.00
811788.28 811788.28
Reference yea1 2000
14647875.00 8729793.97
51250.00 8781043.97 790931.31 497691.88
10069667.17 53750 00
10123417.17 71566
4525173.49 0.00 0.00 0.00
4525173.49 0.00
4525173.49 1583810.72 2941362. 77
Total investment
11603995.25 1959860.09 891788.28
14455643.62
Last year 2006
14647875.00 8729793.97
51250.00 8781043.97 790931.31
0.00 9571975.29
53750.00 9625725.29
715.66 5022865.37
0.00 0.00 0 00
5022865.37 0.00
5022865.37 1758002 88 3264862.49
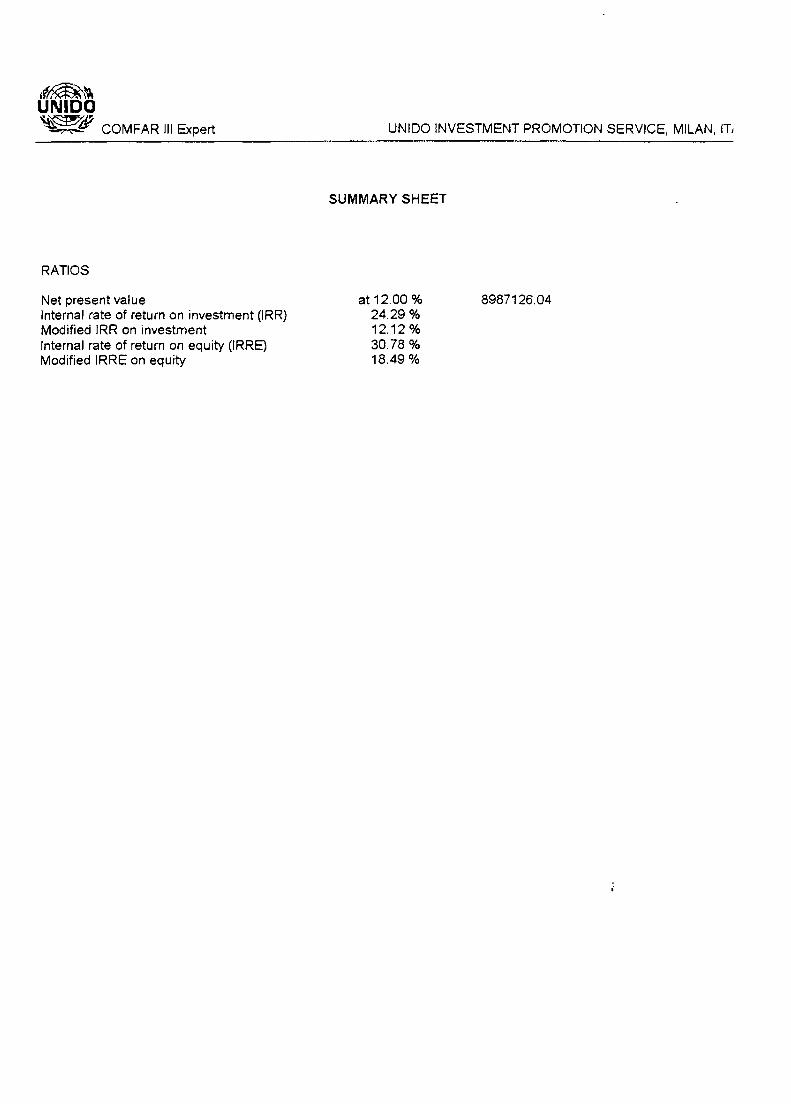
,f~~ UNIDO ~ COMFAR Ill Expert
RATIOS
Net present value Internal rate of return on investment (IRR) Modified IRR on investment Internal rate of return on equity (IRRE) Modified IRRE on equity
UNIDO INVESTMENT PROMOTION SERVICE, MILAN, IT1
SUMMARY SHEET
at 12.00 % 24.29 % 12.12 % 30.78 % 18.49 %
8987126.04

'
;{~~-~ UNIDO ~~1.9 .....,...,__ COMFAR Ill Expert
FIXED INVESTMENT COSTS - TOTAL
us dollars
Land purchase
Site preparation and development
Civil works, structures and buildings
plant building 1
foundations
foundations steel
maintenance build.2
offices
social building
polystyrene store 2
accessories store 2
trucks building 2
electric station
keeper lodge
plant bulding 2
maintenance build. 1
polystyrene store 1
accessories store 1
trucks building 1
steel building coverage
Plant machinery and equipment
assembling
transport 2
machinery
transport 1
Auxiliary and service plant equipment
fencing
gas storage
external lighting
green area
gas distribution
asphalt abd surf.
drain & sewage system
Environmental protection
cement plant 1
cement plant 2
sewage treat 1
sewage treat 2
Incorporated fixed assets (project overheads)
Contingencies
contingencies
net initial capital
TOTAL FIXED INVESTMENT COSTS
U1'JIOO INVESTMENT PROMOTION SERVICE, MILAN, IT,
Total Total Constructior con stru cti or productior 1996
175000.0C 0.00 175000.0C
113700.0C 0.00 113700.0C
2354654.0C 0.00 2354654.0C
1062328.00 0.00 1062328.00
98000.00 0.00 98000.00
73500.00 0.00 73500.00
18270.00 0.00 18270.00
98600.00 0.00 98600.00
251430.00 0.00 251430.00
86760.00 0.00 86760.00
28920.00 0.00 28920.00
17640.00 0.00 17640.00
500.00 0.00 500.00
500.00 0.00 500.00
145464.00 0.00 145464.00
21690.00 0.00 21690.00
73080.00 0.00 73080.00
24360.00 0.00 24360.00
60732.00 0.00 60732.00
292880.00 0.00 292880.00
816891 O.OC 0.00 8168910.0C
211750.00 0.00 211750.00
211750.00 0.00 211750.00
7645410.00 0.00 7645410.00
100000.00 0.00 100000.00
226731.25 0.00 226731.25
14950.00 0.00 14950.00
2500.00 0.00 2500.00
16500.00 0.00 16500.00
24375.00 0.00 24375.00
2031.25 0.00 2031.25
161175.00 0.00 161175.00
5200.00 0.00 5200.00
105000.00 0.00 105000.0C
15000.00 0.00 15000.00
45000.00 0.00 45000.00
15000.00 0.00 15000.00
30000.00 0.00 30000.00
0.00 0.00 0 00
460000 00 0.00 460000.00
60000.00 0.00 60000.00
400000.00 0.00 400000.00
11603995.2~ 0.00 11603995.2~

if~~ UNIDO ~ COMFAR Ill Expert
NET WORKING CAPITAL REQUIREMENTS -TOTAL us dollars
Total inventory
Raw materials
Factory supplies
utilities
Energy
Spare parts consumed
Work in progress
Finished product
Accounts receivable
ih40b
bifam
multipiano
Cash-in-hand
CURRENT ASSETS
Current liabilities
Accounts payable
ih40b
bifam
multi piano
Indirect costs
TOTAL NET WORKING CAPITAL REQUIREMEN
INCREASE IN NET WORKING CAPITAL
Foreign share (%)
UNIOO INVESTMENT PROMOTION SERVICE, MILAN, IT1
Coefficien Constructior Productior of turnove 1996 1997
0.00 80000.00 311581.13 0.00 25000.00 79614.79
0.00 25000.00 69.44
0.00 2500.00 7.33
0.00 2500.00 13.48
0.00 25000.00 338.53
0.00 0.00 116394.22
0.00 0.00 115143.33
0.00 0.00 116935.00 0.00 0.00 70422.72
0.00 0.00 19568.38
0.00 0.00 26943.90
30.00 0.00 32654.63
0.00 80000.00 461170.76
0.00 0.00 107162.22 0.00 0.00 54969.42
0.00 0.00 13766.24
0.00 0.00 19732.98
0.00 0.00 18693.59
0.00 80000.00 354008.53
0.00 80000.00 274008.53
0.00 0.00 22.44
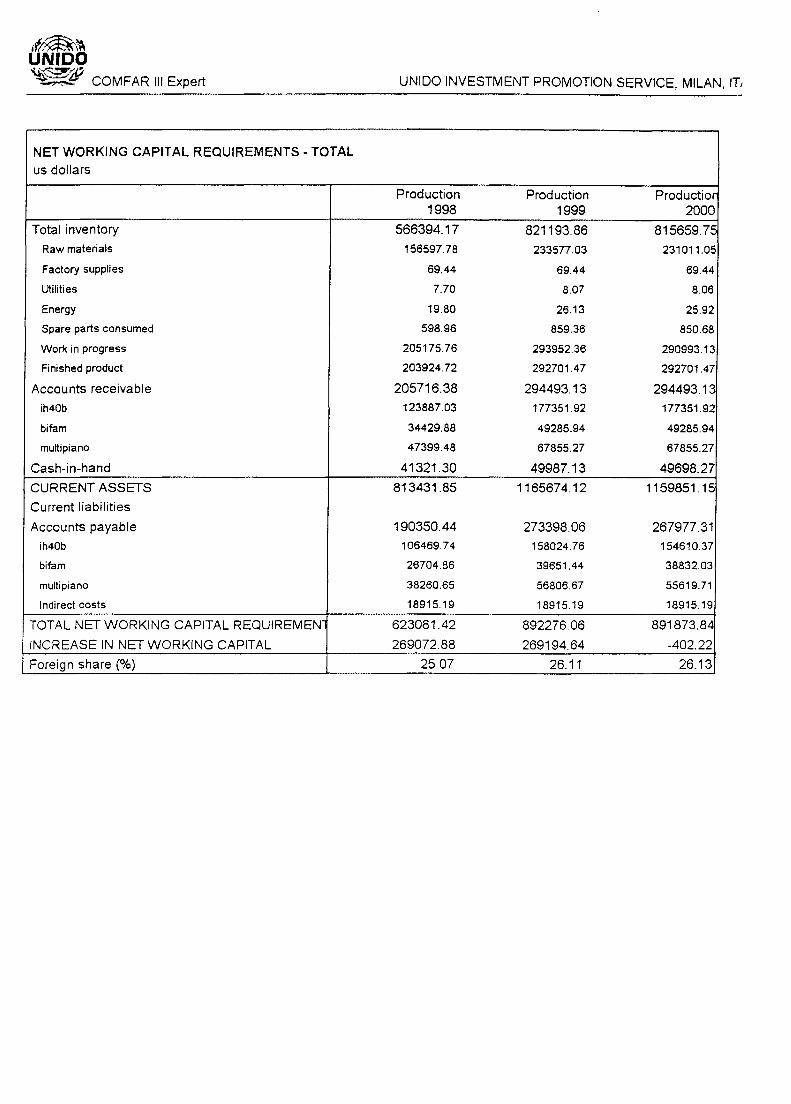
l~~ UNIDO ~ff COMFAR Ill Expert
NET WORKING CAPITAL REQUIREMENTS - TOTAL us dollars
Total inventory
Raw materials
Factory supplies
utilities
Energy
Spare parts consumed
Work in progress
Finished product
Accounts receivable
ih40b
bifam
multi piano
Cash-in-hand
CURRENT ASSETS
Current liabilities
Accounts payable
ih40b
bifam
multi piano
Indirect costs
TOTAL NET WORKING CAPITAL REQUIREMEN
INCREASE IN NET WORKING CAPITAL
Foreign share (%)
UNIDO INVESTMENT PROMOTION SERVICE, MILAN, IT1
Production Production Productior 1998 1999 2000
566394.17 821193.86 815659.75 156597.78 233577.03 231011.05
69.44 69.44 69.44
7.70 8.07 8.06
19.80 26.13 25.92
598.96 859.36 850.68
205175.76 293952.36 290993.13
203924.72 292701.47 292701.47
205716.38 294493.13 294493.13 123887.03 177351.92 177351.92
34429.88 49285.94 49285.94
47399.48 67855.27 67855.27
41321.30 49987.13 49698.27
813431.85 1165674.12 1159851.15
190350.44 273398.06 267977.31 106469.74 158024.76 154610.37
26704.86 39651.44 38832.03
38260.65 56806.67 55619.71
18915.19 18915.19 18915.19
623081.42 892276.06 891873.84
269072.88 269194.64 -402.22
25.07 26.11 26.13

if~-~ UNIDO ~"" ~ COMFAR Ill Expert
NET WORKING CAPITAL REQUIREMENTS -TOTAL us dollars
Total inventory
Raw materials
Factory supplies
Utilities
Energy
Spare parts consumed
Work in progress
Finished product
Accounts receivable
ih40b
bifam
multi piano
Cash-in-hand
CURRENT ASSETS
Current liabilities
Accounts payable
ih40b
bifam
multi piano
Indirect costs
TOTAL NET WORKING CAPITAL REQUIREMEN
INCREASE IN NET WORKING CAPITAL
Foreign share (%)
UNIDO INVESTMENT PROMOTION SERVICE, MILAN, IT1
Production Production Production 2001 2002 2003
815659.75 815659.75 815659.75 231011.05 231011.05 231011.05
69.44 69.44 69.44
8.06 8.06 8.06
25.92 25.92 25.92
850.68 850.68 850.68
290993.13 290993.13 290993.13
292701.47 292701.47 292701.47
294493.13 294493.13 294493.13 177351.92 177351.92 177351.92
49285.94 49285.94 49285.94
67855.27 67855.27 67855.27
49698.27 49698.27 49698.27
1159851.15 1159851.15 1159851.15
268062.87 268062.87 268062.87 154665.08 154665.08 154665.08
38844.54 38844.54 38844.54
55638.06 55638.06 55638.06
18915.19 18915.19 18915.19
891788.28 891788.28 891788.28
-85.56 0.00 0.00
26.13 26.13 26.13

'~~ UNIDO ~ COMFAR Ill Expert
NET WORKING CAPITAL REQUIREMENTS - TOTAL us dollars
Total inventory
Raw materials
Factory supplies
Utilities
Energy
Spare parts consumed
Work in progress
Finished product
Accounts receivable
ih40b
bifam
multi piano
Cash-in-hand
CURRENT ASSETS
Current liabilities
Accounts payable
ih40b
bifam
multi piano
Indirect costs
TOTAL NET WORKING CAPITAL REQUIREMEN
INCREASE IN NET WORKING CAPITAL
Foreign share (%)
UNIDO INVESTMENT PROMOTION SERVICE, MILAN, IT1
Production Production Productior 2004 2005 2006
815659.75 815659. 75 815659.75 231011.05 231011.05 231011.05
69.44 69.44 69.44
8.06 8.06 8.06
25.92 25.92 25.92
850.68 850.68 850.68
290993.13 290993.13 290993.13
292701.47 292701.47 292701.47
294493.13 294493.13 294493.13 177351.92 177351.92 177351.92
49285.94 49285.94 49285.94
67855.27 67855.27 67855.27
49698.27 49698.27 49698.27
1159851.15 1159851.15 1159851.15
268062.87 268062.87 268062.87 154665.08 154665.08 154665.08
38844.54 38844.54 38844.54
55638.06 55638.06 55638.06
18915.19 18915.19 18915.19
891788.28 891788.28 891788.28
0.00 0.00 0.00
2613 26.13 26.13

,f~~~ UNIDO ~ COMFAR Ill Expert
INVESTMENT COSTS - TOT AL us dollars
Total Fixed Investment Costs
Total Pre-Production Expenditures
Pre-Production Expenditures (net of interest)
Interests
Increase in Net Working Capital
TOTAL INVESTMENT COSTS
, Foreign share (%)
UNIOO INVESTMENT PROMOTION SERVICE, MILAN, IT1
Total Total Con structi or constructior production 1996
11603995.2~ 0.00 11603995.2:
1959860.0S 0.00 1959860.0S 529250.00 0.00 529250.00
1430610.09 0.00 1430610.09
80000.00 811788.28 80000.00
13643855.3L 811788.28 13643855.3.:l
83.44 28.70 83.44

~~~-~ JNIDO ~_# COMFAR Ill Expert
PRE-PRODUCTION EXPENDITURES -TOTAL us dollars
engineering & tech assistance
pre-investment activities
pre-production supply
training
Pre-Production Expenditures (net of interest)
Interests
TOTAL PRE-PRODUCTION EXPENDITURE~
oreign share (%)
UNIOO INVESTMENT PROMOTION SERVICE, MILAN, ITi
Total Total Constructior constructior production 1996
149250.0C 0.00 149250.00
320000.0C 0.00 320000.00
0.00 0.00 0.00
60000.00 0.00 60000.00
529250.00 0.00 529250.00
1430610.09 0.00 1430610.0S
1959860.0S 0.00 1959860.0S
77.54 0.00 77.54

'~~ UNIDO ~& ~ COMFAR Ill Expert
ANNUAL COSTS OF PRODUCTS SOLD - TOT AL us dollars
Production 1997
Raw materials 2411360.35
Factory supplies 25000.00
Utilities 2511.54
Energy 2696.03
Spare parts consumed 121869.97
Repair, maintenance, material 109369.97
Royalties 0.00
Labour 609018.90
Labour overhead costs (taxes etc.) 200000.00
Factory overhead costs 10000.00
FACTORY COSTS 3491826.75
Administrative overhead costs 51250.00
OPERATING COSTS 3543076.75
Depreciation 790931.31
Financial costs 1100469.30 Interests 1100469.30
Leasing costs 0.00
TOT AL PRODUCTION COSTS 5434477.36
Direct marketing costs 0.00
Marketing overhead costs 53750.00
COSTS OF PRODUCTS SOLD 5488227.36
Foreign share (%) 47.12
Variable share (%) 50.15
UNIDO INVESTMENT PROMOTION SERVICE, MILAN, IT1
Production Productior 1998 1999
4720850.09 7030227.5€
25000.00 25000.00
2522.70 2533.87
2885.75 3075.46
215625.16 309369.97
203125.16 296869.97
0.00 0.00
775263.99 941493.90
200000.00 200000.00
10000.00 10000.0C
6155272.86 8818570.n.
51250.00 51250.00
6206522.86 8869820.72
790931.31 790931.31
916589.18 716159.85 916589.18 716159.85
0.00 0.00
7914043.35 10376911.8S
0.00 0.00
53750.00 53750.0C
7967793.35 10430661.SS
40.01 36.19
67.97 77.45

,f~~ UNIDO ~ COMFAR Ill Expert
ANNUAL COSTS OF PRODUCTS SOLD -TOTAL us dollars
Production 2000
Raw materials 6953248.20
Factory supplies 25000.00
Utilities 2533.50
Energy 3069.14
Spare parts consumed 306245.13
Repair, maintenance, material 293745.13
Royalties 0.00
Labour 935952.89
Labour overhead costs (taxes etc.) 200000.00
Factory overhead costs 10000.00
FACTORY COSTS 8729793.97
Administrative overhead costs 51250.00
OPERATING COSTS 8781043.97
Depreciation 790931.31
Financial costs 497691.88
Interests 497691.88
Leasing costs 0.00
TOTAL PRODUCTION COSTS 10069667.17
Direct marketing costs 0.00
Marketing overhead costs 53750.00
COSTS OF PRODUCTS SOLD 10123417.17
Foreign share (%) 35.10
Variable share (%) 78.93
2
UNIOO INVESTMENT PROMOTION SERVICE, MILAN, IT1
Production Productior 2001 2002
6953248.20 6953248.2(
25000.00 25000.00
2533.50 2533.50
3069.14 3069.14
306245.13 306245.13
293745.13 293745.13
0.00 0.00
935952.89 935952.89
200000.00 200000.0C
10000.00 10000.0C
8729793.97 8729793.97
51250.00 51250.00
8781043.97 8781043.97
790931.31 790931.31
259561.79 0.00 259561.79 0.00
0.00 0.00
9831537.08 9571975.2S
0.00 0.00
53750.00 53750.0C
9885287.08 9625725.2S
33.77 32.26
80.83 83.01

l~~ UNIDO ·~LP ~ COMFAR Ill Expert
ANNUAL COSTS OF PRODUCTS SOLD -TOTAL us dollars
Production 2003
Raw materials 6953248.20
Factory supplies 25000.00
Utilities 2533.50
Energy 3069.14
Spare parts consumed 306245.13
Repair, maintenance, material 293745.13
Royalties 0.00
Labour 935952.89
Labour overhead costs (taxes etc.) 200000.00
Factory overhead costs 10000.00
FACTORY COSTS 8729793.97
Administrative overhead costs 51250.00
OPERATING COSTS 8781043.97
Depreciation 790931.31
Financial costs 0.00
Interests 0.00
Leasing costs 0.00
TOTAL PRODUCTION COSTS 9571975.29
Direct marketing costs 0.00
Marketing overhead costs 53750.00
COSTS OF PRODUCTS SOLD 9625725.29
Foreign share (%) 32.26
Variable share (%) 83.01
3
UNIDO INVESTMENT PROMOTION SERVICE, MILAN, IT1
Production Productior 2004 2005
6953248.20 6953248.2(
25000.00 25000.00
2533.50 2533.50
3069.14 3069.14
306245.13 306245.13
293745.13 293745.12
0.00 0.00
935952.89 935952.89
200000.00 200000.00
10000.00 10000.00
8729793.97 8729793.97
51250.00 51250.0C
8781043.97 8781043.97
790931.31 790931.31
0.00 0.00 0.00 0.00
0.00 0.00
9571975.29 9571975.29
0.00 0.00
53750.00 53750.0C
9625725.29 9625725.2S
32.26 32.26
83.01 83.01

if~~ UNIDO ~ COMFAR Ill Expert
ANNUAL COSTS OF PRODUCTS SOLD - TOTAL us dollars
Productior 2006
Raw materials 6953248.2(
Factory supplies 25000.00
Utilities 2533.50
Energy 3069.14
Spare parts consumed 306245.12
Repair, maintenance, material 293745.12
Royalties 0.00
Labour 935952.89
Labour overhead costs (taxes etc.) 200000.00
Factory overhead costs 10000.00
FACTORY COSTS 8729793.97
Administrative overhead costs 51250.00
OPERATING COSTS 8781043.97
Depreciation 790931.31
Financial costs 0.00
Interests 0.00
Leasing costs 0.00
TOT AL PRODUCTION COSTS 9571975.29
Direct marketing costs 0.00
Marketing overhead costs 53750 00
COSTS OF PRODUCTS SOLD 9625725.2S
Foreign share (%) 32.26
Variable share (%) 83 01
4
UNIDO INVESTMENT PROMOTION SERVICE, MILAN, IT1

A m 0
u n t
1200000(
1000000(
800000(
600000(
400000(
200000(
0
1997 1998 1999
Total Costs of Products sold
2000 2001
[1 Foreign [l Local !Si§ Fixed
2002 2003 2004
0 Variable
2005
11111
:1111
1111
2006
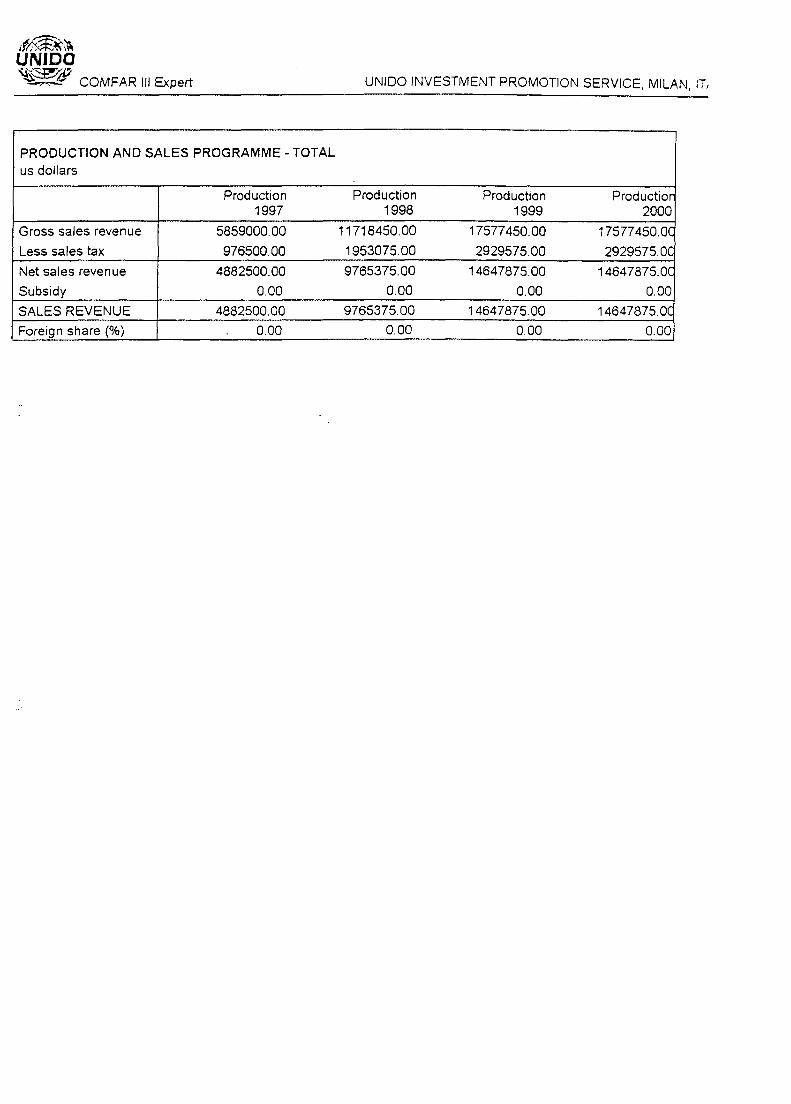
;f&:~~ UN JOO ~,# COMFAR Ill Expert
PRODUCTION AND SALES PROGRAMME - TOTAL us dollars
Production 1997
Gross sales revenue 5859000.00
Less sales tax 976500.00
Net sales revenue 4882500.00
Subsidy 0.00
SALES REVENUE 4882500.00
Foreign share (%) 0.00
UNIOO INVESTMENT PROMOTION SERVICE, MILAN, IT,
Production Production Productior 1998 1999 2000
11718450.00 17577450.00 17577450.0C
1953075.00 2929575.00 2929575.0C
9765375.00 14647875.00 14647875.0C
0.00 0.00 0.00
9765375.00 14647875.00 14647875.0C
0.00 0.00 0.00
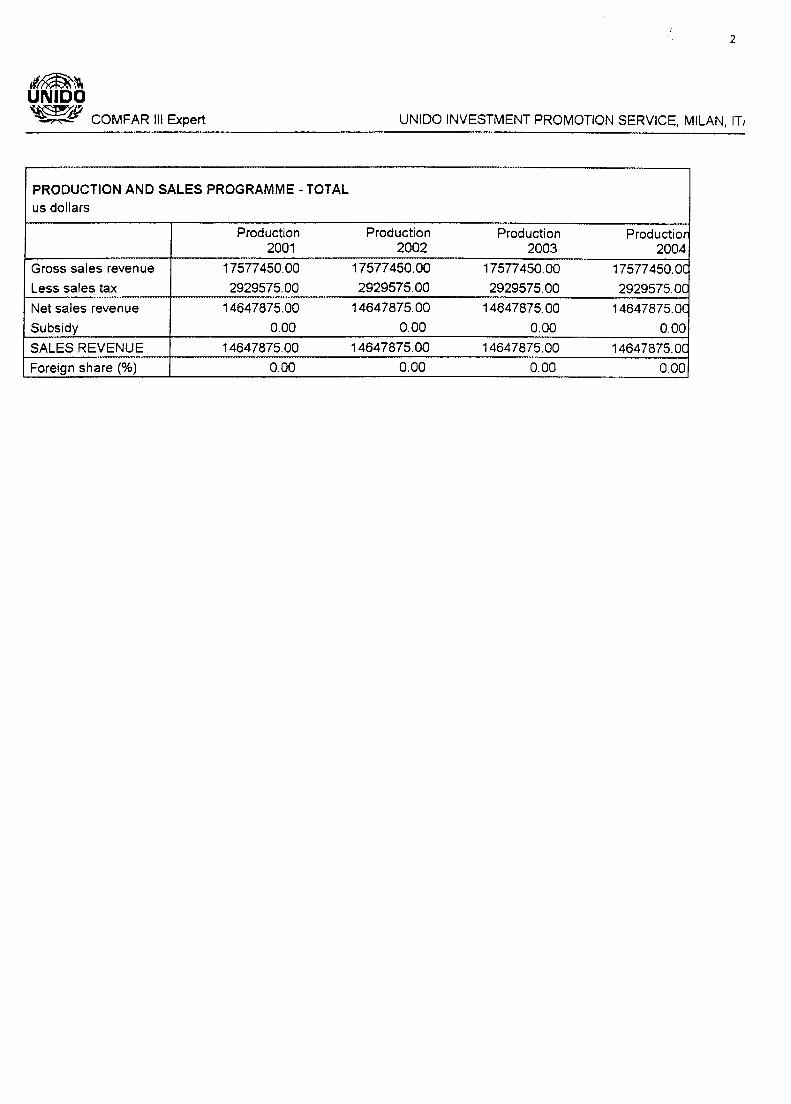
'~~ UNIDO ~ COMFAR Ill Expert
PRODUCTION AND SALES PROGRAMME -TOTAL us dollars
Production 2001
Gross sales revenue 17577450.00
Less sales tax 2929575.00
Net sales revenue 14647875.00
Subsidy 0.00
SALES REVENUE 14647875.00
Foreign share (%) 0.00
2
UNIDO INVESTMENT PROMOTION SERVICE, MILAN, IT1
Production Production Productior 2002 2003 2004
17577450.00 17577450.00 17577450.0C 2929575.00 2929575.00 2929575.0C
14647875.00 14647875.00 14647875.0C 0.00 0.00 0.00
14647875.00 14647875.00 14647875.0C
0.00 0.00 0.00
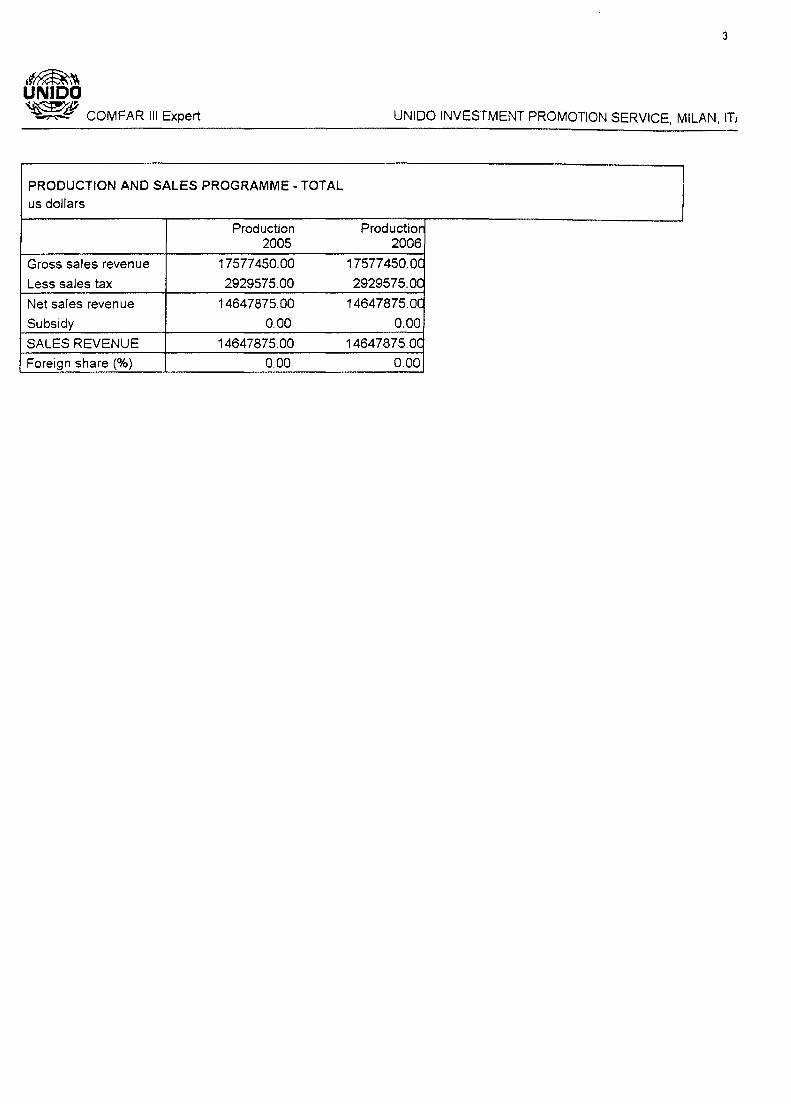
,f~~ UNIDO ~ COMFAR Ill Expert
PRODUCTION AND SALES PROGRAMME -TOTAL us dollars
Production 2005
Gross sales revenue 17577450.00
Less sales tax 2929575.00
Net sales revenue 14647875.00
Subsidy 0.00
SALES REVENUE 14647875.00
Foreign share (%) 0.00
3
UNIDO INVESTMENT PROMOTION SERVICE, MILAN, IT1
Productior 2006
17577450.0C
2929575.00
14647875.0C
0.00
14647875.0C
0.00

A m 0
u n t
1600000(
1400000(
1200000(
1000000(
800000(
600000(
400000(
200000(
0
t-
:i:r:::f :~::i~f :~i::~: 1l I !
l
1997 1998 1999
Total Sales
111111111:11:11
i:1:1.:!li
1 111 Ii !!! l -----.
I
2004 2000 2001 2002 2003 2005 2006
@ Foreign Q Local
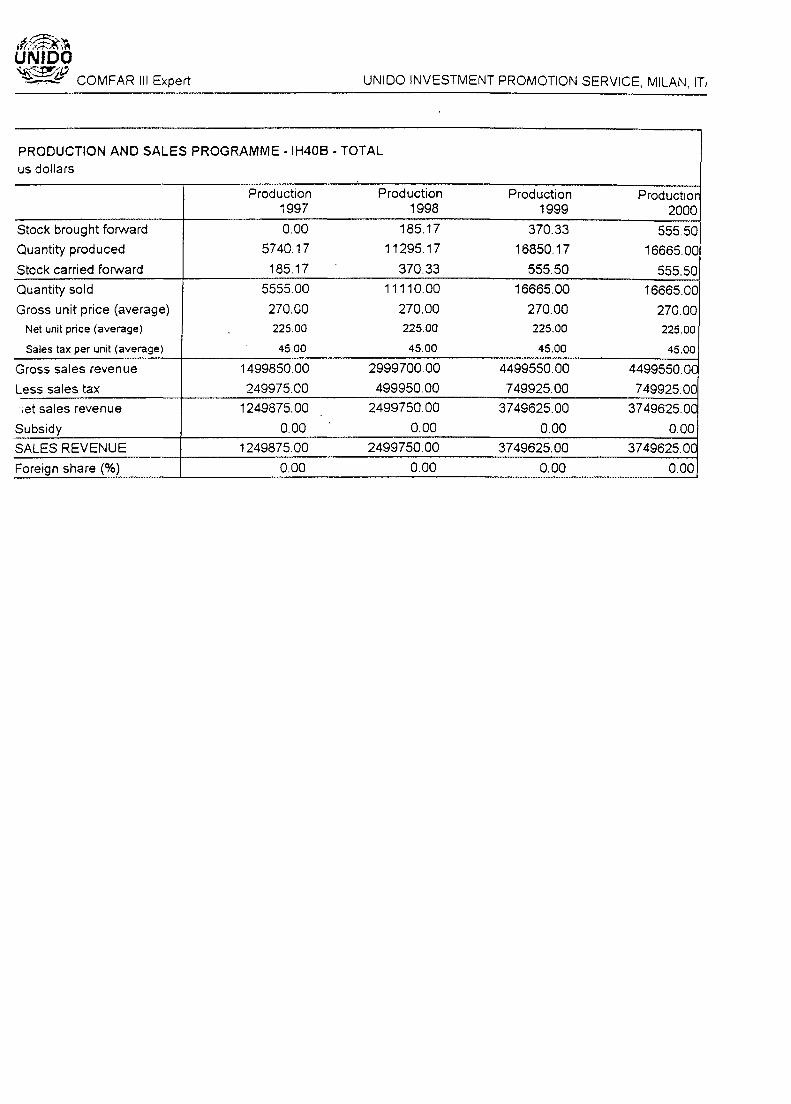
_j~''"'-1((/ ;<n->.\·.~ UNIDO "¥£-:Z"~ _:-,..,.;g COMFAR Ill Expert UNIDO INVESTMENT PROMOTION SERVICE, MILAf\l, IT1
PRODUCTION ANO SALES PROGRAMME - IH408 - TOTAL us dollars
Production Production Production Productior 1997 1998 1999 2000
Stock brought forvvard 0.00 185.17 370.33 555.50 Quantity produced 5740.17 11295.17 16850.17 16665.00
Stock carried forvvard 185.17 370.33 555.50 555.50
Quantity sold 5555.00 11110.00 16665.00 16665.00
Gross unit price (average) 270.00 270.00 270.00 270.00 Net unit price (average) 225.00 225.00 225.00 225.00
Sales tax per unit (average) 45.00 45.00 45.00 45.00
Gross sales revenue 1499850.00 2999700.00 4499550.00 4499550.0C
Less sales tax 249975.00 499950.00 749925.00 749925.00
.et sales revenue 1249875.00 2499750.00 3749625.00 3749625.0C
Subsidy 0.00 0.00 0.00 0.00
SALES REVENUE 1249875.00 2499750.00 3749625.00 3749625.0C
Foreign share (%) 0.00 0.00 0.00 000

,f~ UNIDO ~ COMFAR Ill Expert
2
UNIOO INVESTMENT PROMOTION SERVICE, MILAN, IT1
PRODUCTION AND SALES PROGRAMME - IH408 - TOTAL us dollars
Production Production Production Productior 2001 2002 2003 2004
Stock brought forward 555.50 555.50 555.50 555.50
Quantity produced 16665.00 16665.00 16665.00 16665.00
Stock carried forward 555.50 555.50 555.50 555.50
Quantity sold 16665.00 16665.00 16665.00 16665.00
Gross unit price (average) 270.00 270.00 270.00 270.00 Net unit price (average) 225.00 225.00 225.00 225.00
Sales tax per unit (average) 45.00 45.00 45.00 45.00
Gross sales revenue 4499550.00 4499550.00 4499550.00 4499550.00
Less sales tax 749925.00 749925.00 749925.00 749925.0C
Net sales revenue 3749625.00 3749625.00 3749625.00 3749625.0C
Subsidy 0.00 0.00 0.00 0.00
SALES REVENUE 3749625.00 3749625.00 3749625.00 3749625.0C
Foreign share(%) 0.00 0.00 0.00 0.00

if~~ UNIDO ~ COMFAR Ill Expert
3
UNIDO INVESTMENT PROMOTION SERVICE, MILAN, IT1
PRODUCTION AND SALES PROGRAMME - IH408 - TOTAL us dollars
Production Productior 2005 2006
Stock brought forward 555.50 555.50
Quantity produced 16665.00 16665.00
Stock carried forward 555.50 555.50
Quantity sold 16665.00 16665.00
Gross unit price (average) 270.00 270.00
Net unit price (average) 225.00 225.00
Sales tax per unit (average) 45.00 45.00
Gross sales revenue 4499550.00 4499550.0C
Less sales tax 749925.00 749925.0C
Net sales revenue 3749625.00 3749625.0C
Subsidy 0.00 0.00
SALES REVENUE 3749625.00 3749625.0C
Foreign share (%) 0.00 0.00

,f~k~ UNIDO ~~" ::::.:.,P COMFAR Ill Expert UNIDO INVESTMENT PROMOTION SERVICE, MILAN, IT1
PRODUCTION AND SALES PROGRAMME - BIFAM - TOTAL us dollars
Production Production Production Productior 1997 1998 1999 2000
Stock brought forvVard 0.00 106.90 213.83 320.73
Quantity produced 3313.90 6521.93 9728.90 9622.00
Stock carried forward 106.90 213.83 320.73 320.73
Quantity sold 3207.00 6415.00 9622.00 9622.00
Gross unit price (average) 450.00 450.00 450.00 450.00 Net unit price (average) 375.00 375.00 375.00 375.00
Sales tax per unit (average) 75.00 75.00 75.00 75.00
Gross sales revenue 1443150.00 2886750.00 4329900.00 4329900.0C
Less sales tax 240525.00 481125.00 721650.00 721650.00
• ,·let sales revenue 1202625.00 2405625.00 3608250.00 3608250.0C
Subsidy 0.00 0.00 0.00 0.00
SALES REVENUE 1202625.00 2405625.00 3608250.00 3608250.0C
Foreign share(%) 0.00 0.00 0.00 0.00
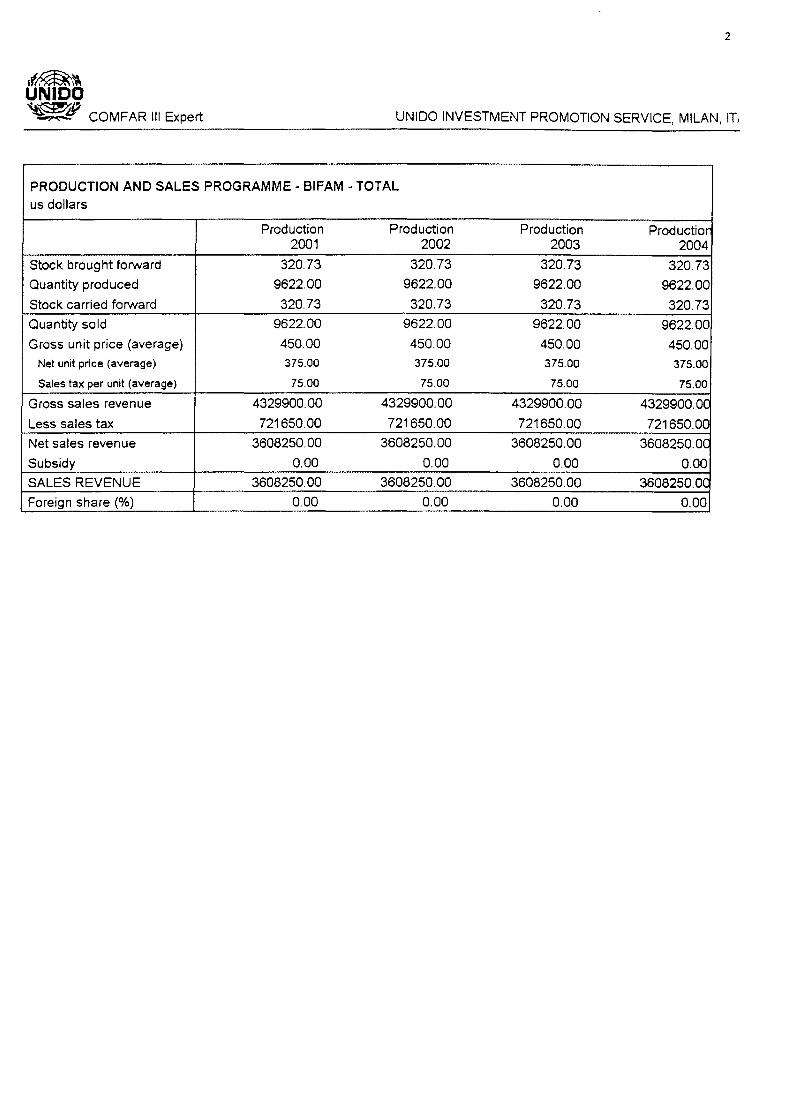
,f~~ UNIDO ~ COMFAR Ill Expert
2
UNIDO INVESTMENT PROMOTION SERVICE, MILAN, IT,
PRODUCTION AND SALES PROGRAMME - BIFAM -TOTAL us dollars
Production Production Production Productior 2001 2002 2003 2004
Stock brought forward 320.73 320.73 320.73 320.73
Quantity produced 9622.00 9622.00 9622.00 9622.00
Stock carried forward 320.73 320.73 320.73 320.73
Quantity sold 9622.00 9622.00 9622.00 9622.00
Gross unit price (average) 450.00 450.00 450.00 450.00 Net unit price (average) 375.00 375.00 375.00 375.00
Sales tax per unit (average) 75.00 75.00 75.00 75.00
Gross sales revenue 4329900.00 4329900.00 4329900.00 4329900.0C
Less sales tax 721650.00 721650.00 721650.00 721650.00
Net sales revenue 3608250.00 3608250.00 3608250.00 3608250.0C
Subsidy 0.00 0.00 0.00 0.00
SALES REVENUE 3608250.00 3608250.00 3608250.00 3608250.0C
Foreign share (%) 0.00 0.00 0.00 0.00

'~~ UNIDO ~ COMFAR Ill Expert
3
UNIDO INVESTMENT PROMOTION SERVICE, MILAN, IT1
PRODUCTION AND SALES PROGRAMME-BIFAM -TOTAL us dollars
Production Production 2005 2006
Stock brought forward 320.73 320.73
Quantity produced 9622.00 9622.00
Stock carried forward 320.73 320.73
Quantity sold 9622.00 9622.00
Gross unit price (average) 450.00 450.00
Net unit price (average) 375.00 375.00
Sales tax per unit (average) 75.00 75.00
Gross sales revenue 4329900.00 4329900.0C
Less sales tax 721650.00 721650.00
Net sales revenue 3608250.00 3608250.0C
Subsidy 0.00 0.00
SALES REVENUE 3608250.00 3608250.0C
Foreign share (%) 0.00 0.00
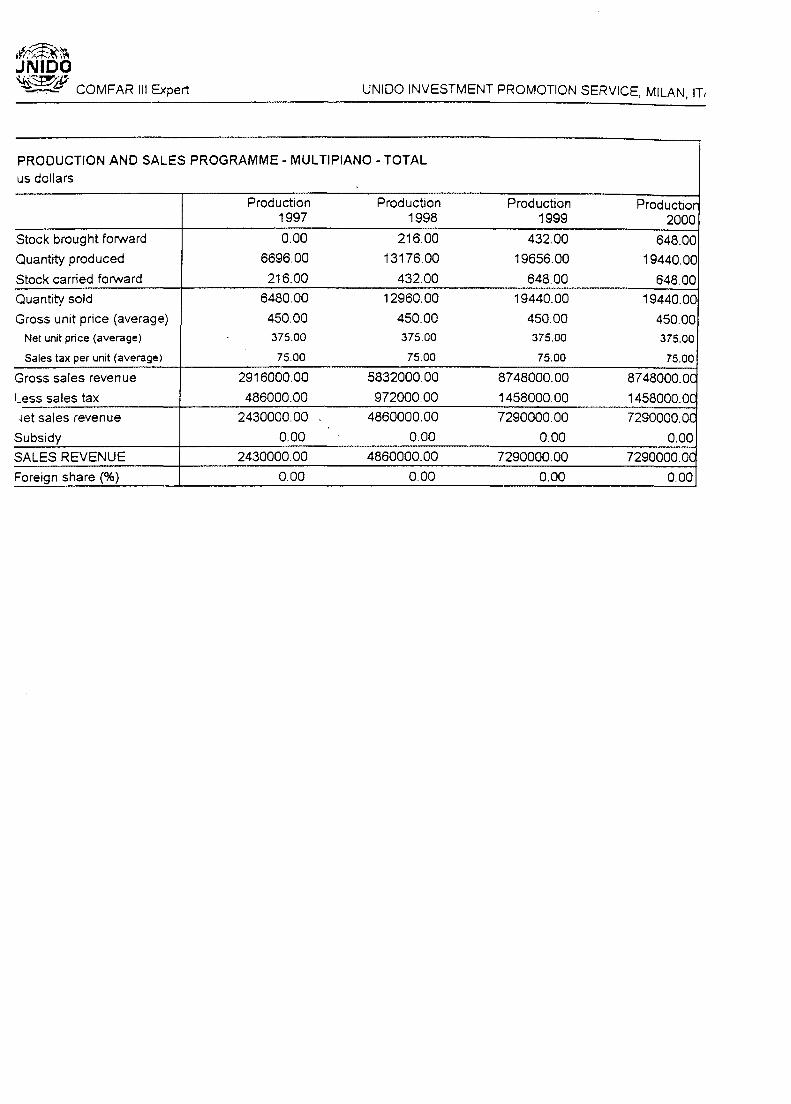
·-'r.~V."> •fl/M~ .. :':\ ··'" JNIDO ~_# COMFAR Ill Expert UNIOO INVESTMENT PROMOTION SERVICE, MILAN, IT1
PRODUCTION AND SALES PROGRAMME - MULTIPIANO - TOTAL us dollars
Production Production Production Productior 1997 1998 1999 2000
Stock brought forward 0.00 216.00 432.00 648.00
Quantity produced 6696.00 13176.00 19656.00 19440.00
Stock carried forward 216.00 432.00 648.00 648.00
Quantity sold 6480.00 12960.00 19440.00 19440.00
Gross unit price (average) 450.00 450.00 450.00 450.00 Net unit price (average) 375.00 375.00 375.00 375.00
Sales tax per unit (average) 75.00 75.00 75.00 75.00
Gross sales revenue 2916000.00 5832000.00 8748000.00 8748000.0C
l_ess sales tax 486000.00 972000.00 1458000.00 1458000.0C
Jet sales revenue 2430000.00 4860000.00 7290000.00 7290000.0C
Subsidy 0.00 0.00 0.00 0.00
SALES REVENUE 2430000.00 4860000.00 7290000.00 7290000.0C
Foreign share (%) 0.00 0.00 0.00 0.00
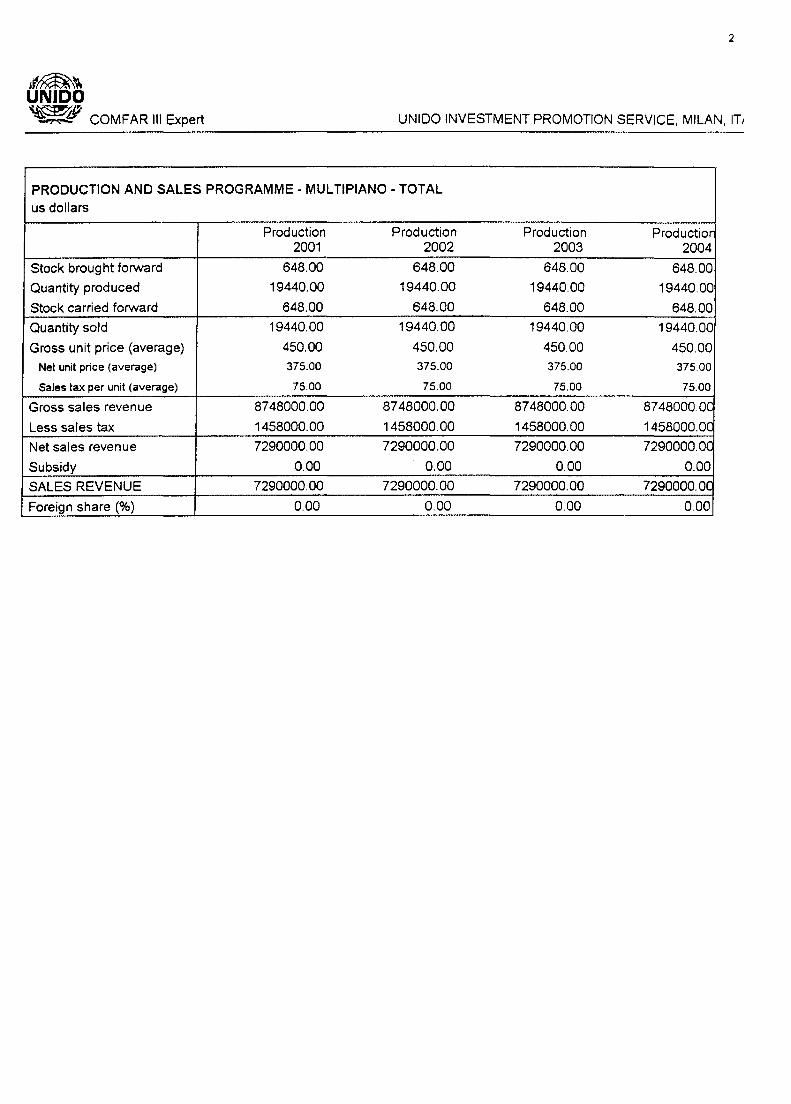
if~~ UNIDO ~ COMFAR Ill Expert
2
UNIOO INVESTMENT PROMOTION SERVICE, MILAN, IT1
PRODUCTION AND SALES PROGRAMME - MUL TIPIANO - TOTAL us dollars
Production Production Production Production 2001 2002 2003 2004
Stock brought forward 648.00 648.00 648.00 648.00
Quantity produced 19440.00 19440.00 19440.00 19440.00
Stock carried forward 648.00 648.00 648.00 648.00
Quantity sold 19440.00 19440.00 19440.00 19440.00
Gross unit price (average) 450.00 450.00 450.00 450.00
Net unit price (average) 375.00 375.00 375.00 375.00
Sales tax per unit (average) 75.00 75.00 75.00 75.00
Gross sales revenue 8748000.00 8748000.00 8748000.00 8748000.0C
Less sales tax 1458000.00 1458000.00 1458000.00 1458000.0C
Net sales revenue 7290000.00 7290000.00 7290000.00 7290000.0C
Subsidy 0.00 0.00 0.00 0.00
SALES REVENUE 7290000.00 7290000.00 7290000.00 7290000.0C
Foreign share (%) 0.00 0.00 0.00 0.00

,f~;\\ UNIDO ~ COMFAR Ill Expert
3
UNIOO INVESTMENT PROMOTION SERVICE, MILAN, IT1
PRODUCTION AND SALES PROGRAMME - MULTIPIANO - TOTAL us dollars
Production Productior 2005 2006
Stock brought forvvard 648.00 648.00
Quantity produced 19440.00 19440.0C
Stock carried forward 648.00 648.00
Quantity sold 19440.00 19440.0C
Gross unit price (average) 450.00 450.00
Net unit price (average) 375.00 375.00
Sales tax per unit (average) 75.00 75.00
Gross sales revenue 8748000.00 8748000.0C
Less sales tax 1458000.00 1458000.0C
Net sales revenue 7290000.00 7290000.0C
Subsidy 0.00 0.00
SALES REVENUE 7290000.00 7290000.0C
Foreign share (%) 0.00 0.00
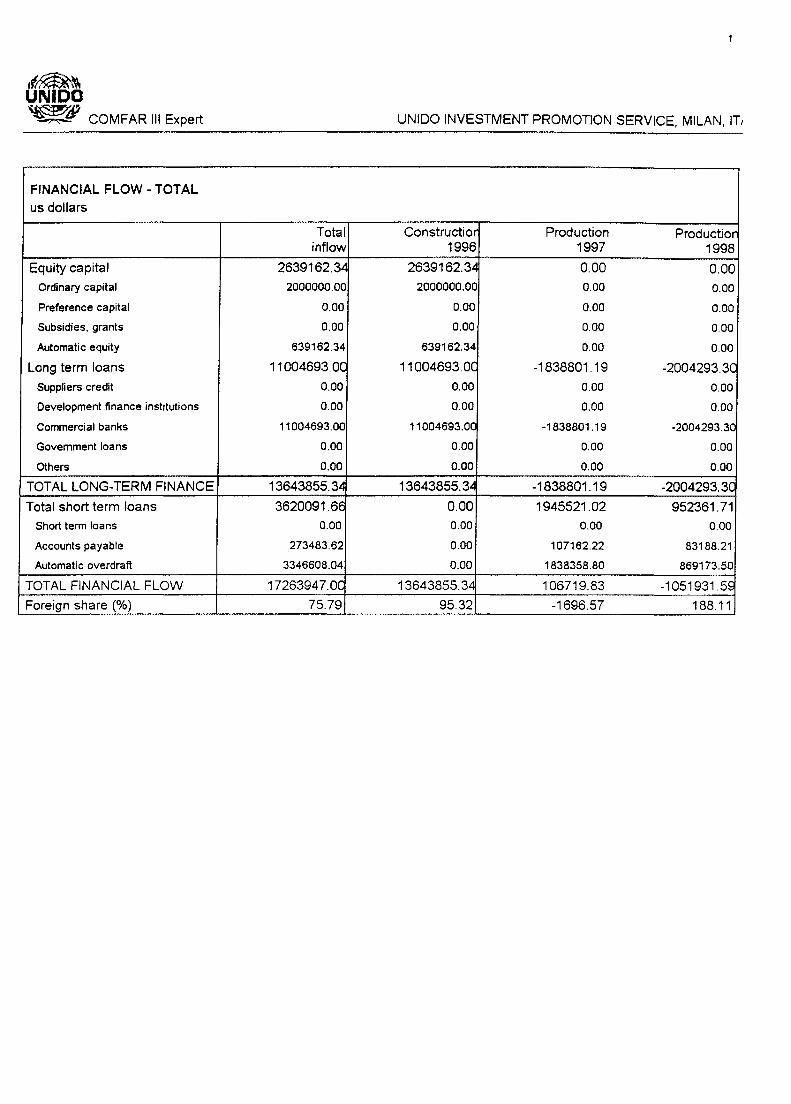
if~~ UNIDO ~'9 ~ COMFAR Ill Expert
FINANCIAL FLOW - TOT AL us dollars
Equity capital
Ordinary capital
Preference capital
Subsidies, grants
Automatic equity
Long term loans
Suppliers credit
Development finance institutions
Commercial banks
Government loans
Others
TOTAL LONG-TERM FINANCE
Total short term loans Short term loans
Accounts payable
Automatic overdraft
TOTAL FINANCIAL FLOW
Foreign share (%)
Total inflow
2639162.34
2000000.00
0.00
0.00
639162.34
11004693.0C
0.00
0.00
11004693. 00
0.00
0.00
13643855. 34
3620091.66 0.00
273483.62
3346608.04
1726394 7. oc 75.79
UNIOO INVESTMENT PROMOTION SERVICE, MILAN, IT1
Constructior Production Productior 1996 1997 1998
2639162.34 0.00 0.00 2000000.00 0.00 0.00
0.00 0.00 0.00
0.00 0.00 0.00
639162.34 0.00 0.00
11 004693. oc -1838801.19 -2004293.3( 0.00 0.00 0.00
0.00 0.00 0.00
11004693.00 -1838801.19 -2004293.30
0.00 0.00 0.00
0.00 0.00 0.00
13643855.3( -1838801.19 -2004293.3(
0.00 1945521.02 952361.71 0.00 0.00 0.00
0.00 107162.22 83188.21
0.00 1838358.80 869173.50
13643855.34 106719.83 -1051931.5S
95.32 -1696.57 188.11

if~~ UNIDO ~ COMFAR Ill Expert
FINANCIAL FLOW - TOT AL us dollars
Equity capital
Ordinary capital
Preference capital
Subsidies, grants
Automatic equity
Long term loans
Suppliers credit
Development finance institutions
Commercial banks
Government loans
Others
TOTAL LONG-TERM FINANCE
Total short term loans
Short term loans
Accounts payable
Automatic overdraft
TOTAL FINANCIAL FLOW
Foreign share (%)
Production 1999
0.00
0.00
0.00
0.00
0.00
-2184679. 70
0.00
0.00
-2184679.70
0.00
0.00
-2184679.70
346310.00 0.00
83047.62
263262.38
-1838369. 69
117.45
2
UNIDO INVESTMENT PROMOTION SERVICE, MILAN, IT1
Production Production Production 2000 2001 2002
0.00 0.00 0.00 0.00 0.00 0.00
0.00 0.00 0.00
0.00 0.00 0.00
0.00 0.00 0.00
-2381300.87 -2595617.95 0.00 0.00 0.00 0.00
0.00 0.00 0.00
-2381300.87 -2595617.95 0.00
0.00 0.00 0.00
0.00 0.00 0.00
-2381300.87 -2595617.95 0.00
113865.20 256612.97 -2423362.5€ 0.00 0.00 0.00
-5420.75 85.56 0.00
119285.95 256527.41 -2423362.56
-2267435.66 -2339004.97 -2423362.56
105.10 110.97 0.00

if~~ UNIDO ~'9 ~ COMFAR Ill Expert
FINANCIAL FLOW - TOT AL us dollars
Equity capital Ordinary capital
Preference capital
Subsidies, grants
Automatic equity
Long term loans
Suppliers credit
Development finance institutions
Commercial banks
Government loans
Others
TOTAL LONG-TERM FINANCE
Total short term loans Short term loans
Accounts payable
Automatic overdraft
TOTAL FINANCIAL FLOW
Foreign share (%)
Production 2003
0.00 0.00
0.00
0.00
0.00
0.00
0.00
0.00
0.00
0.00
0.00
0.00
-923245.48 0.00
0.00
-923245.48
-923245.48
0.00
3
UNIDO INVESTMENT PROMOTION SERVICE, MILAN, IT1
Production Production Productior 2004 2005 2006
0.00 0.00 0.00 0.00 0.00 0.00
0.00 0.00 0.00
0.00 0.00 0.00
0.00 0.00 0.00
0.00 0.00 0.00 0.00 0.00 0.00
0.00 0.00 0.00
0.00 0.00 0.00
0.00 0.00 0.00
0.00 0.00 0.00
0.00 0.00 0.00
0.00 0.00 0.00 0.00 0.00 0.00
0.00 0.00 0.00
0.00 0.00 0.00
0.00 0.00 0.00
0.00 0.00 0.00

If'~~ UNIDO ~ COMFAR Ill Expert
FINANCIAL FLOW - TOT AL us dollars
Equity capital
Ordinary capital
Preference capital
Subsidies, grants
Automatic equity
Long term loans
Suppliers credit
Development finance institutions
Commercial banks
Government loans
Others
TOTAL LONG-TERM FINANCE
Total short term loans
Short term loans
Accounts payable
Automatic overdraft
TOTAL FINANCIAL FLOW
Foreign share (%)
Scrap 2007
0.00
0.00
0.00
0.00
0.00
0.00
0.00
0.00
0.00
0.00
0.00
0.00
-268062.87 0.00
-268062.87
0.00
-268062.87
28.97
4
UNIDO INVESTMENT PROMOTION SERVICE, MILAN, IT1
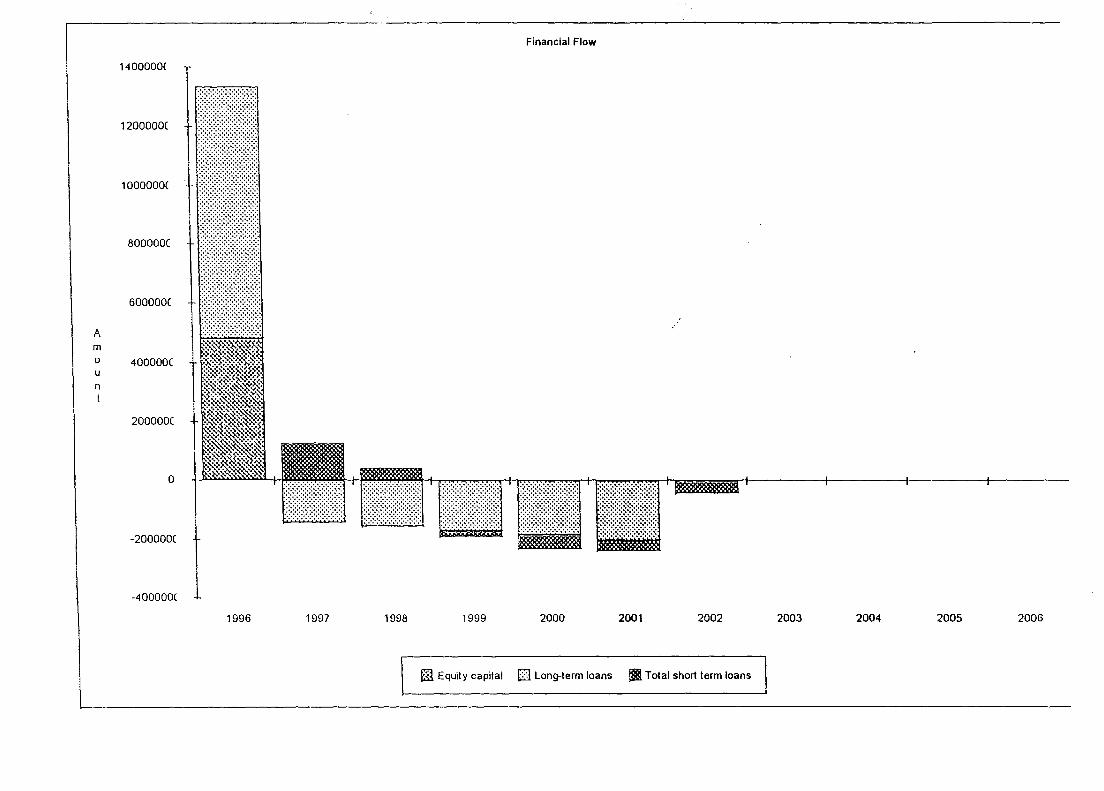
1400000(
1200000(
1000000(
800000(
600000(
A m 0 400000( u n t
200000(
0
-200000(
-400000(
ll'I\ 1il1i
l\\11
ii I i( ll\
'""~; .. -»~ r.:. ;.::::: .. ::~~~~~ . ·~$··«:".;-);X·. ~:::,:;:..::.·:-.;,~~-::. ••• ... :-•• ~ ... ~~ ... Jo)' ~::::~::::~m.·<~:, ···:;:: ··:·:-:~1(:~ B~·~-::~"~~»~-:, ~~~~-~~~-::~~
'·..:.·:-..:-.:.::~x<·:-.· »~~~:~>: ·~~1fil:.t~: ru:;t.·\·.-:-::; ~~~~···,:.::~. ·-.::::~·.='>, m~~ .. ~~ ).,'..). .. ~'"'· ~.
1996
Financial Flow
'llf r~_;11,· II 111·1 · lll!!i ~
1997 1998 1999 2000 2001 2002 2003 2004 2005 2006
m Equity capital Q Long-term loans .. Total short term loans
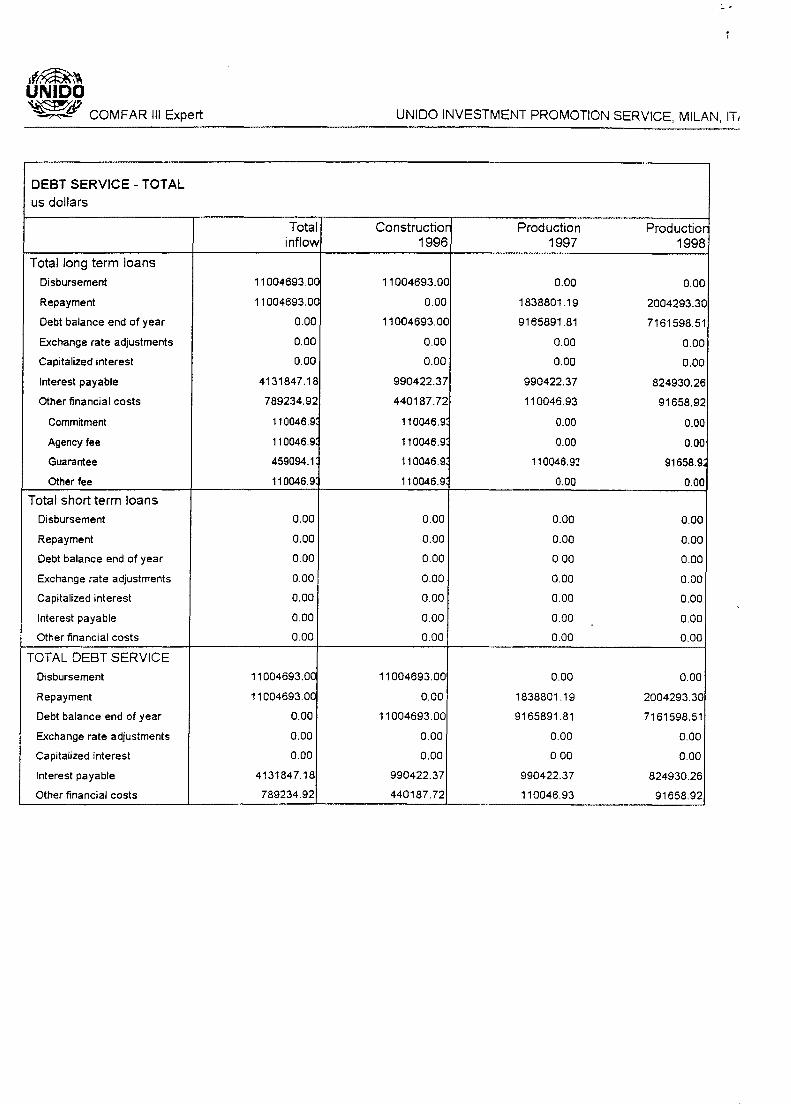
,f@~~ UNIDO ~ COMFAR Ill Expert
DEBT SERVICE - TOT AL us dollars
Total long term loans
Disbursement
Repayment
Debt balance end of year
Exchange rate adjustments
Capitalized interest
Interest payable
Other financial costs
Commitment
Agency fee
Guarantee
Other fee
Total short term loans
Disbursement
Repayment
Debt balance end of year
Exchange rate adjustments
Capitalized interest
Interest payable
Other financial costs
TOT AL DEBT SERVICE
Disbursement
Repayment
Debt balance end of year
Exchange rate adjustments
Capitalized interest
Interest payable
Other financial costs
Total inflow
11004693.0G
11004693.0C
0.00
0.00
0.00
4131847.18
789234.92
110046.9
110046.9
459094.1
110046.9
0.00
0.00
0.00
0.00
0.00
0.00
0.00
11004693.00
11004693.0C
0.00
0.00
0.00
4131847.18
789234.92
UNIDO INVESTMENT PROMOTION SERVICE, MILAN, IT1
Constructior Production Production 1996 1997 1998
11004693.00 0.00 0.00
0.00 1838801.19 2004293.30
11004693.00 9165891.81 7161598.51
0.00 0.00 0.00
0.00 0.00 0.00
990422.37 990422.37 824930.26
440187.72 110046.93 91658.92
110046.9 0.00 0.00
110046.9 0.00 0.00
110046.9 110046.9:! 91658.9.
110046.9 0.00 0.00
0.00 0.00 0.00
0.00 0.00 0.00
0.00 0.00 0.00
0.00 0.00 0.00
0.00 0.00 0.00
0.00 0.00 0.00
0.00 0.00 0.00
11004693.00 0.00 0.00
0.00 1838801.19 2004293.30
11004693.00 9165891.81 7161598.51
0.00 0.00 0.00
0.00 0.00 0.00
990422.37 990422.37 824930.26
440187.72 110046.93 91658.92

'~~ UNIDO ~ COMFAR Ill Expert
DEBT SERVICE - TOT AL us dollars
Total long term loans
Disbursement
Repayment
Debt balance end of year
Exchange rate adjustments
Capitalized interest
Interest payable
Other financial costs
Commitment
Agency fee
Guarantee
Other fee
Total short term loans Disbursement
Repayment
Debt balance end of year
Exchange rate adjustments
Capitalized interest
Interest payable
Other financial costs
TOTAL DEBT SERVICE Disbursement
Repayment
Debt balance end of year
Exchange rate adjustments
Capitalized interest
Interest payable
Other financial costs
Production 1999
0.00
2184679.70
4976918.81
0.00
0.00
644543.87
71615.99
0.00
0.00
71615.99
0.00
0.00
0.00
0.00
0.00
0.00
0.00
0.00
0.00
2184679.70
4976918.81
0.00
0.00
644543.87
71615.99
2
UNIDO INVESTMENT PROMOTION SERVICE, MILAN, IT1
Production Production Production 2000 2001 2002
0.00 0.00 0.00
2381300.87 2595617.95 0.00
2595617.95 0.00 0.00
0.00 0.00 0.00
0.00 0.00 0.00
447922.69 233605.62 0.00
49769.19 25956.18 0.00
0.00 0.00 0.00
0.00 0.00 0.00
49769.19 25956.18 0.00
0.00 0.00 0.00
0.00 0.00 0.00
0.00 0.00 0.00
0.00 0.00 0.00
0.00 0.00 0.00
0.00 0.00 0.00
0.00 0.00 0.00
0.00 0.00 0.00
0.00 0.00 0.00
2381300.87 2595617.95 0.00
2595617.95 0.00 0.00
0.00 0.00 0.00
0.00 0.00 0.00
447922.69 233605.62 0.00
49769.19 25956.18 0.00

if@~~ UNIDO ~iP ~ COMFAR Ill Expert
DEBT SERVICE - TOT AL us dollars
Total long term loans
Disbursement
Repayment
Debt balance end of year
Exchange rate adjustments
Capitalized interest
Interest payable
Other financial costs
Commitment
Agency fee
Guarantee
Other fee
Total short term loans Disbursement
Repayment
Debt balance end of year
Exchange rate adjustments
Capitalized interest
Interest payable
Other financial costs
TOT AL DEBT SERVICE Disbursement
Repayment
Debt balance end of year
Exchange rate adjustments
Capitalized interest
Interest payable
Other financial costs
Production 2003
0.00
0.00
0.00
0.00
0.00
0.00
0.00
0.00
0.00
0.00
0.00
0.00
0.00
0.00
0.00
0.00
0.00
0.00
0.00
0.00
0.00
0.00
0.00
0.00
0.00
3
UNIOO INVESTMENT PROMOTION SERVICE, MILAN, IT1
Production Production Productior 2004 2005 2006
0.00 0.00 0.00
0.00 0.00 0.00
0.00 0.00 0.00
0.00 0.00 0.00
0.00 0.00 0.00
0.00 0.00 0.00
0.00 0.00 0.00
0.00 0.00 0.00
0.00 0.00 0.00
0.00 0.00 0.00
0.00 0.00 0.00
0.00 0.00 0.00
0.00 0.00 0.00
0.00 0.00 0.00
0.00 0.00 0.00
0.00 0.00 0.00
0.00 0.00 0.00
0.00 0.00 0.00
0.00 0.00 0.00
0.00 0.00 0.00
0.00 0.00 0.00
0.00 0.00 0.00
0.00 0.00 0.00
0.00 0.00 0.00
0.00 0.00 0.00

'~~ UNIDO ~ COMFAR Ill Expert
DEBT SERVICE - TOT AL us dollars
Total long term loans Disbursement
Repayment
Debt balance end of year
Exchange rate adjustments
Capitalized interest
Interest payable
Other financial costs
Commitment
Agency fee
Guarantee
Other fee
Total short term loans Disbursement
Repayment
Debt balance end of year
Exchange rate adjustments
Capitalized interest
Interest payable
Other financial costs
TOT AL DEBT SERVICE Disbursement
Repayment
Debt balance end of year
Exchange rate adjustments
Capitalized interest
Interest payable
Other financial costs
4
UNIDO INVESTMENT PROMOTION SERVICE, MILAN, ITi
Scrap 2007
0.00
0.00
0.00
0.00
0.00
0.00
0.00
0.00
0.00
0.00
0.00
0.00
0.00
0.00
0.00
0.00
0.00
0.00
0.00
0.00
0.00
0.00
0.00
0.00
0.00

if~~ UNIDO ~ COMFAR Ill Expert
CASH FLOW FOR FINANCIAL PLANNING -TOTAL us dollars
Constructior 1996
TOTAL CASH INFLOW 13004693.0C
Inflow funds 13004693.0C
Total Equity 2000000.00
Total long term loans 11004693.00
Total short term loans 0.00
Inflow operation 0.00
Sales revenue 0.00
Interest on securities 0.00
Other income 0.00
TOT AL CASH OUTFLOW 13643855.3.!l
Increase in fixed assets 12133245.2~
Fixed investments 11603995.2~
Pre-Production Expenditures (net of interest) 529250.00
Increase in current assets 80000.00
Operating costs 0.00
Marketing costs 0.00
Income (corporate) tax 0.00
Financial costs 1430610.09
Loan repayment 0.00
Dividends payable 0.00
intertransport 0.00
chi le 0.00
Others 0.00
Equity capital refund 0.00
SURPLUS (DEFICIT) -639162.3.!l
CUMULATIVE CASH BALANCE -639162.34
Foreign surplus (deficit) 1620680.62
: Local surplus (deficit) -2259842.97
Foreign cumulative cash balance 1620680.62
Local cumulative cash balance -2259842.97
Net flow of funds 1157 4082. 91
UNIDO INVESTMENT PROMOTION SERVICE, MILAN, IT1
Production Productior 1997 1998
4990132.45 9849158.2.!l
107162.22 83188.21
0.00 0.00
0.00 0.00
107162.22 83188.21
4882970.23 9765970.02
4882500.00 9765375.00
470.23 595.03
0.00 0.00
6828491.25 10718331.74
0.00 0.00 0.00 0.00
0.00 0.00
381170.76 352261.1C
3454300.00 6117741.47
53750.00 53750.00
0.00 660435.32
1100469.30 916589.18
1838801.19 2004293.3C
0.00 613261.37
0.00 306630.68
0.00 306630.68
0.00 0.00
0.00 0.00
-1838358. 80 -869173.50
-2477521.14 -3346694.64
-3703509. 59 -4 77 4998. 46
1865150.79 3905824.9€
-2082828.96 -6857827.4~
-394692.18 3511132.7e.
-2832108.27 -3450955.62

itom-~ UNIDO
2
~ COMFAR Ill Expert UNIDO INVESTMENT PROMOTION SERVICE, MILAN, IT1
CASH FLOW FOR FINANCIAL PLANNING -TOTAL us dollars
Production Production Productior 1999 2000 2001
TOTAL CASH INFLOW 14731642.44 14648590.66 14648676.2~
Inflow funds 83047.62 0.00 85.56 Total Equity 0.00 0.00 0.00
Total long term loans 0.00 0.00 0.00
Total short term loans 83047.62 0.00 85.56
Inflow operation 14648594.81 14648590. 66 14648590.6€
Sales revenue 14647875.00 14647875.00 14647875.00
Interest on securities 719.81 715.66 715.66
Other income 0.00 0.00 0.00
TOT AL CASH OUTFLOW 14994904.82 14767876.61 14905203.6:':
Increase in fixed assets 0.00 0.00 0.00 Fixed investments 0.00 0.00 0.00
Pre-Production Expenditures (net of interest) 0.00 0.00 0.00
Increase in current assets 352242.27 -5822.97 0.00
Operating costs 8781043.97 8781043.97 8781043.97
Marketing costs 53750.00 53750.00 53750.00
Income (corporate) tax 1507348.39 1583810.72 1667156.25
Financial costs 716159.85 497691.88 259561.7S
Loan repayment 2184679.70 2386721.62 2595617.9:
Dividends payable 1399680.65 1470681.38 1548073.6E
intertransport 699840.32 735340.69 774036.83
chi le 699840.32 735340.69 774036.83
others 0.00 0.00 0.00
Equity capital refund 0.00 0.00 0.00
SURPLUS (DEFICIT) -263262.38 -119285.95 -256527.41
CUMULATIVE CASH BALANCE -3609957.02 -3729242.97 -3985770.38
Foreign surplus (deficit) -5935710.99 -5894486.65 -5933125.94
Local surplus (deficit) 5672448.61 5775200.70 5676598.53
Foreign cumulative cash balance -12793538. 41 -18688025. 06 -24621151.0C
Local cumulative cash balance 9183581.39 14958782. 09 20635380.6~
Net flow of funds -4217472.57 -4355094.88 -4403167. 84
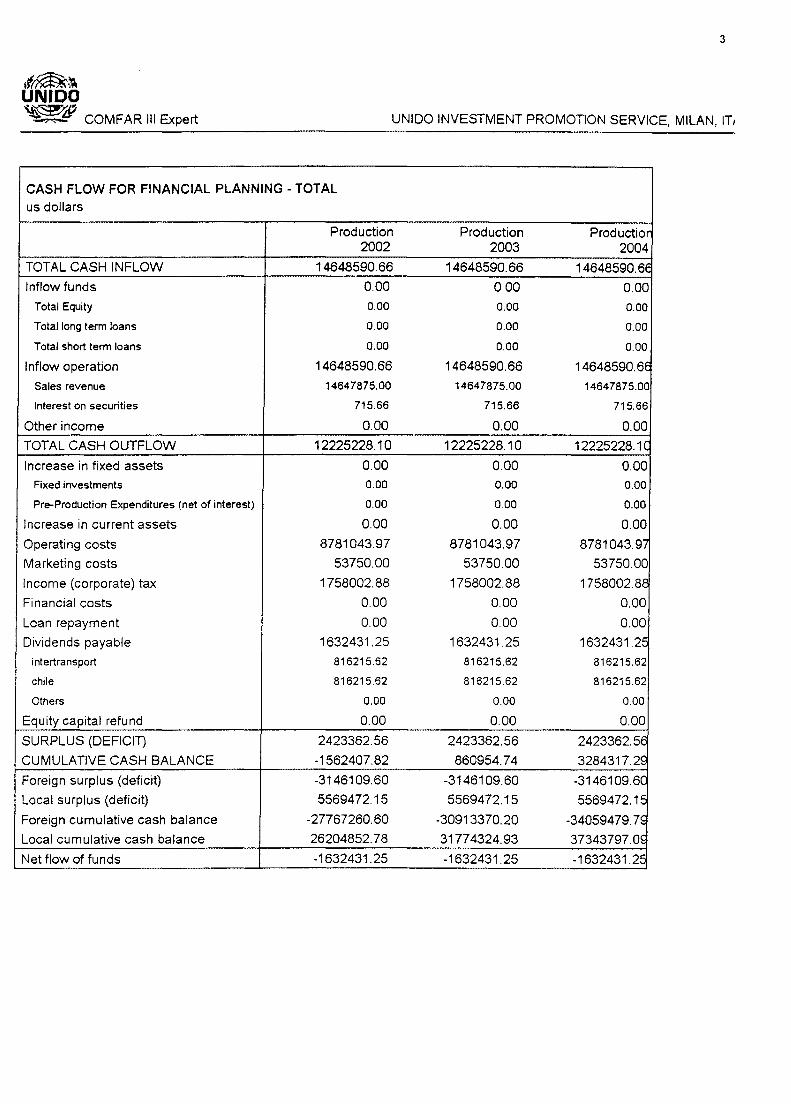
if~~ UNIDO
3
~ COMFAR Ill Expert UNIOO INVESTMENT PROMOTION SERVICE, MILAN, IT1
CASH FLOW FOR FINANCIAL PLANNING -TOTAL us dollars
Production Production Productior 2002 2003 2004
TOTAL CASH INFLOW 14648590.66 14648590. 66 14648590. 6E
Inflow funds 0.00 0.00 0.00 Total Equity 0.00 0.00 0.00
Total long term loans 0.00 0.00 0.00
Total short term loans 0.00 0.00 0.00
Inflow operation 14648590. 66 14648590.66 14648590.6€
Sales revenue 14647875.00 14647875.00 14647875.00
Interest on securities 715.66 715.66 715.66
Other income 0.00 0.00 0.00
TOTAL CASH OUTFLOW 12225228.10 12225228.1 0 12225228.1 c Increase in fixed assets 0.00 0.00 0.00
Fixed investments 0.00 0.00 0.00
Pre-Production Expenditures (net of interest) 0.00 000 0.00
Increase in current assets 0.00 0.00 0.00
Operating costs 8781043.97 8781043.97 8781043.97
Marketing costs 53750.00 53750.00 53750.00
Income (corporate) tax 1758002.88 1758002.88 1758002.88
Financial costs 0.00 0.00 0.00
Loan repayment 0.00 0.00 0.00
Dividends payable 1632431.25 1632431.25 1632431.2E
intertransport 816215.62 816215.62 816215.62
Chile 816215.62 816215.62 816215.62
Others 0.00 0.00 0.00
Equity capital refund 0.00 0.00 0.00
SURPLUS (DEFICIT) 2423362.56 2423362.56 2423362.56
CUMULATIVE CASH BALANCE -1562407.82 860954.74 3284317.2S
Foreign surplus (deficit) -3146109.60 -3146109.60 -3146109.6(
Local surplus (deficit) 5569472.15 5569472.15 5569472.1E
Foreign cumulative cash balance -27767260.60 -30913370.20 -34059479. 7S
Local cumulative cash balance 26204852. 78 31774324.93 37343797.0S
Net flow of funds -1632431.25 -1632431.25 -1632431.25

'~~ UNIDO
4
~ COMFAR Ill Expert UNIDO INVESTMENT PROMOTION SERVICE, MILAN, IT1
CASH FLOW FOR FINANCIAL PLANNING - TOT AL us dollars
Production Productior Scrap 2005 2006 2007
TOTAL CASH INFLOW 14648590.66 14648590. 6€ 6814393.37
Inflow funds 0.00 0.00 0.00 Total Equity 0.00 0.00 0.00
Total long tenn loans 0.00 0.00 0.00
Total short term loans 0.00 0.00 0.00
Inflow operation 14648590.66 14648590. 6€ 0.00 Sales revenue 14647875.00 14647875.0C 0.00
Interest on securities 715.66 715.66 0.00
Other income 0.00 0.00 6814393.37
TOTAL CASH OUTFLOW 12225228.10 12225228.1 c 268062.87
Increase in fixed assets 0.00 0.00 0.00 Fixed investments 0.00 0.00 0.00
Pre-Production Expenditures (net of interest) 0.00 0.00 0.00
Increase in current assets 0.00 0.00 0.00
Operating costs 8781043.97 8781043.97 0.00
Marketing costs 53750.00 53750.00 0.00
Income (corporate) tax 1758002.88 1758002.88 0.00
Financial costs 0.00 0.00 0.00
Loan repayment 0.00 0.00 268062.87
Dividends payable 1632431.25 1632431.2~ 0.00 intertransport 816215.62 816215.62 0.00
chi le 816215.62 816215.62 0.00
Others 0.00 0.00 0.00
Equity capital refund 0.00 0.00 0.00
SURPLUS (DEFICl1) 2423362.56 2423362.5€ 6546330.4S
CUMULATIVE CASH BALANCE 5707679.85 8131042.41 14677372.9(
Foreign surplus (deficit) -3146109.60 -3146109.6( 1223411.77
Local surplus (deficit) 5569472.15 5569472.15 5322918.7':-.
Foreign cumulative cash balance -3 7205589. 39 -40351698. 9~ -39128287.2~
Local cumulative cash balance 42913269.24 48482741.4( 53805660.1 ~
Net flow of funds -1632431.25 -1632431.2~ -268062.87

,f~~ UNIDO ~ COMFAR Ill Expert UNIDO INVESTMENT PROMOTION SERVICE, MILAN, ITi
DISCOUNTED CASHFLOW-TOTAL CAPITAL INVESTED us dollars
Constructior Production Productior 1996 1997 1998
TOTAL CASH INFLOW 0.00 4882970.23 9765970.0::
Inflow operation 0.00 4882970.23 9765970.0::
Sales revenue 0.00 4882500.00 9765375.00
Interest on securities 0.00 470.23 595.03
Other income 0.00 0.00 0.00
TOT AL CASH OUTFLOW 12213245. 25 3782058.53 7100999.68
Increase in fixed assets 12133245.25 0.00 0.00 Fixed investments 11603995.2!: 0.00 0.00
Pre-Production Expenditures (net of interest) 529250.00 0.00 0.00
Increase in net working capital 80000.00 274008.53 269072.88
Operating costs 0.00 3454300.00 6117741.47
Marketing costs 0.00 53750.00 53750.00
Income (corporate) tax 0.00 0.00 660435.32
NET CASH FLOW -12213245.25 1100911.69 2664970.35
CUMULATIVE NET CASH FLOW -12213245.25 -11112333.56 -8447363.21
Net present value -12213245.25 982956.87 2124498.05
Cumulative net present value -12213245. 2: -11230288. 38 -9105790. 32
NET PRESENT VALUE at 12.00 °/c 8987126.04
INTERNAL RATE OF RETURN 24.29 %
MODIFIED INTERNAL RATE OF RETUR~ 12.12 %
NORMAL PAYBACK at 0.00 o/c 6
DYNAMIC PAYBACK at 12.00 °/c 7
NPV RATIO 0.70
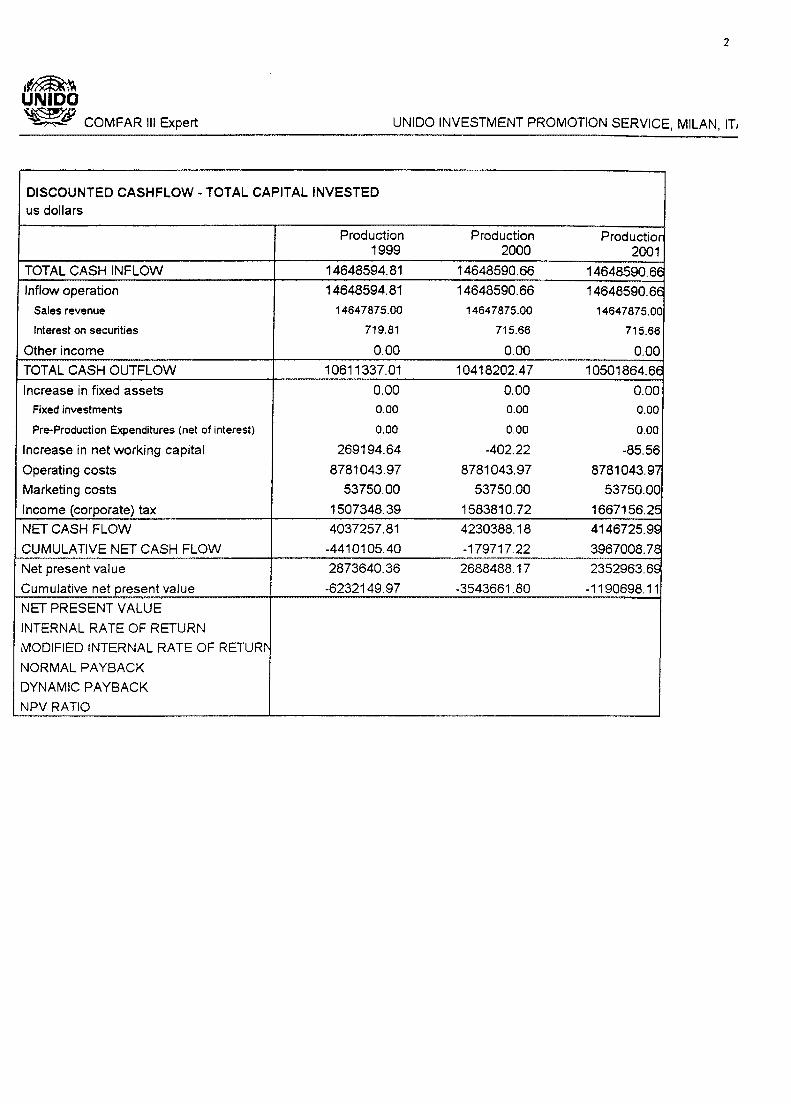
'~ UNIDO
2
~ COMFAR Ill Expert UNIDO INVESTMENT PROMOTION SERVICE, MILAN, IT1
DISCOUNTED CASHFLOW-TOTAL CAPITAL INVESTED us dollars
Production Production Productior 1999 2000 2001
TOTAL CASH INFLOW 14648594. 81 14648590.66 14648590. 6E
Inflow operation 14648594. 81 14648590.66 14648590.6€ Sales revenue 14647875.00 14647875.00 14647875.00
Interest on securities 719.81 715.66 715.66
Other income 0.00 0.00 0.00
TOT AL CASH OUTFLOW 10611337.01 10418202.47 10501864.66
Increase in fixed assets 0.00 0.00 0.00 Fixed investments 0.00 0.00 0.00
Pre-Production Expenditures (net of interest) 0.00 0.00 0.00
Increase in net working capital 269194.64 -402.22 -85.56
Operating costs 8781043.97 8781043.97 8781043.97
Marketing costs 53750.00 53750.00 53750.00
Income (corporate) tax 1507348.39 1583810.72 1667156.2~
NET CASH FLOW 4037257.81 4230388.18 4146725.9S
CUMULATIVE NET CASH FLOW -4410105.40 -179717.22 3967008.7€
Net present value 2873640.36 2688488.17 2352963.68
Cumulative net present value -6232149.97 -3543661.80 -1190698.11
NET PRESENT VALUE
INTERNAL RATE OF RETURN
MODIFIED INTERNAL RATE OF RETUR~
NORMAL PAYBACK
DYNAMIC PAYBACK
NPV RATIO

,f~~ UNIDO
3
~ COMFAR Ill Expert UNIDO INVESTMENT PROMOTION SERVICE, MILAN, IT1
DISCOUNTED CASHFLOW-TOTAL CAPITAL INVESTED us dollars
Production Production Productior 2002 2003 2004
TOTAL CASH INFLOW 14648590.66 14648590. 66 14648590.6€
Inflow operation 14648590.66 14648590. 66 14648590.6€ Sales revenue 14647875.00 14647875.00 14647875.00
Interest on securities 715.66 715.66 715.66
Other income 0.00 0.00 0.00
TOT AL CASH OUTFLOW 10592796.85 10592796. 85 10592796. 85
Increase in fixed assets 0.00 0.00 0.00 Fixed investments 0.00 0.00 0.00
Pre-Production Expenditures (net of interest) 0.00 0.00 0.00
Increase in net working capital 0.00 0.00 0.00
Operating costs 8781043.97 8781043.97 8781043.97
Marketing costs 53750.00 53750.00 53750.00
Income (corporate) tax 1758002.88 1758002.88 1758002.88
NET CASH FLOW 4055793.80 4055793.80 4055793.80
CUMULATIVE NET CASH FLOW 8022802.58 12078596.38 16134390.1 s Net present value 2054791.36 1834635.14 1638067.0S
Cumulative net present value 864093.25 2698728.40 4336795.4S
NET PRESENT VALUE
INTERNAL RATE OF RETURN
MODIFIED INTERNAL RATE OF RETUR~
NORMAL PAYBACK
DYNAMIC PAYBACK
NPV RATIO

'~~ UNIDO
4
~ COMFAR Ill Expert UNIDO INVESTMENT PROMOTION SERVICE, MILAN, IT1
DISCOUNTED CASHFLOW-TOTAL CAPITAL INVESTED us dollars
Production Productior Scrap 2005 2006 2007
TOT AL CASH INFLOW 14648590. 66 14648590.6€ 6546330.4S
Inflow operation 14648590.66 14648590. 6E 0.00
Sales revenue 14647875.00 14647875.00 0.00
Interest on securities 715.66 715.66 0.00
Other income 0.00 0.00 6546330.4S
TOTAL CASH OUTFLOW 10592796. 85 10592796. 8e 0.00
Increase in fixed assets 0.00 0.00 0.00
Fixed investments 0.00 0.00 0.00
Pre-Production Expenditures (net of interest) 0.00 0.00 0.00
Increase in net working capital 0.00 0.00 0.00
Operating costs 8781043.97 8781043.97 0.00
Marketing costs 53750.00 53750.00 0.00
Income (corporate) tax 1758002.88 1758002.88 0.00
NET CASH FLOW 4055793.80 4055793.8C 6546330.49
CUMULATIVE NET CASH FLOW 20190183.99 24245977.7S 30792308.28
Net present value 1462559.90 1305857.06 1881913.59
Cumulative net present value 5799355.39 7105212.45 8987126.04
NET PRESENT VALUE
INTERNAL RATE OF RETURN
MODIFIED INTERNAL RATE OF RETUR~
NORMAL PAYBACK
DYNAMIC PAYBACK
NPV RATIO

,f~~ UNIDO ~ COMFAR Ill Expert
NET INCOME STATEMENT us dollars
Sales revenue
Less variable costs
Material
Personnel
Marketing (except personnel)
Other variable costs
VARIABLE MARGIN
in % of sales revenue
Less fixed costs
Material
Personnel
Marketing (except personnel)
Depreciation
Other fixed costs
OPERATIONAL MARGIN
in % of sales revenue
Interest on securities
Financial costs
GROSS PROFIT FROM OPERATION~
in % of sales revenue
Extraordinary income
Extraordinary loss
Depreciation allowances
GROSS PROFIT
Investment allowances
TAXABLE PROFIT
Income (corporate) tax
NET PROFIT
in% of sales revenue
Dividends payable
RETAINED PROFIT
Ratios(%)
Net profit I equity capital
Net profit I Net worth
Net profit+ interest I investment
Production 1997
4882500.00
2663302.50
2403326.98
166230.39
0.00
93745.13
2219197.50
45.45
1635678.81
80000.00
647247.50
43750.00
790931.31
73750.00
583518.69
11.95
470.23
1100469.30
-516480.39
-10.58
0.00
0.00
0.00
-516480.39
0.00
0.00
0.00
-516480.39
-10.58
0.00
-516480.39
-25.82
-24.33
4.20
UNIDO INVESTMENT PROMOTION SERVICE, MILAN, ITi
Production Productior 1998 1999
9765375.00 1464 7875. oc 5326743.97 7990046.47
4806768.97 7210095.96
332475.00 498705.39
0.00 0.00
187500.00 281245.13
4438631.03 6657828.53
45.45 45.45
1635678.81 1635678.81 80000.00 80000.00
647247.50 647247.50
43750.00 43750.00
790931.31 790931.31
73750.00 73750.00
2802952.21 5022149.71
28.70 34.29
595.03 719.81
916589.18 716159.85
1886958.06 4306709.68
19.32 29.40
0.00 0.00
0.00 0.00
0.00 0.00
1886958.06 4306709.68
0.00 0.00
1886958.06 4306709.68
660435.32 1507348.39
1226522.74 2799361.2S
12.56 19.11
613261.37 1399680.65
613261.37 1399680.65
61.33 139.97
44.83 67.69
15.11 24.32

l~~ UNIDO ~ COMFAR Ill Expert
NET INCOME STATEMENT us dollars
Sales revenue
Less variable costs
Material
Personnel
Marketing (except personnel)
Other variable costs
VARIABLE MARGIN
in % of sales revenue
Less fixed costs
Material
Personnel
Marketing (except personnel)
Depreciation
Other fixed costs
OPERATIONAL MARGIN
in % of sales revenue
Interest on securities
Financial costs
GROSS PROFIT FROM OPERATION~
in% of sales revenue
Extraordinary income
Extraordinary loss
Depreciation allowances
GROSS PROFIT
Investment allowances
TAXABLE PROFIT
Income (corporate) tax
NET PROFIT
in % of sales revenue
Dividends payable
RETAINED PROFIT
Ratios(%)
Net profit I equity capital
Net profit I Net worth
Net profit + interest I investment
Production 2000
14647875.00
7990046.47
7210095.96
498705.39
0.00
281245.13
6657828.53
45.45
1635678.81
80000.00
647247.50
43750.00
790931.31
73750.00
5022149.71
34.29
715.66
497691.88
4525173.49
30.89
0.00
0.00
0.00
4525173.49
0.00
4525173.49
1583810.72
2941362.77
20.08
1470681.38
1470681.38
147.07
52.47
23.79
2
UNIDO INVESTMENT PROMOTION SERVICE, MILAN, IT1
Production Productior 2001 2002
14647875.00 14647875. OC
7990046.47 7990046.47
7210095.96 7210095.96
498705.39 498705.39
0.00 0.00
281245.13 281245.13
6657828.53 6657828.53
45.45 45.45
1635678.81 1635678.81 80000.00 80000.00
647247.50 647247.50
43750.00 43750.00
790931.31 790931.31
73750.00 73750.00
5022149.71 5022149.71
34.29 34.29
715.66 715.66
259561.79 0.00
4763303.57 5022865.37
32.52 34.29
0.00 0.00
0.00 0.00
0.00 0.00
4763303.57 5022865.37
0.00 0.00
4763303.57 5022865.37
1667156.25 1758002.88
3096147.32 3264862.49
21.14 22.29
1548073.66 1632431.2!:
1548073.66 1632431.2:
154.81 163.24
43.28 37.16
23.21 22.59
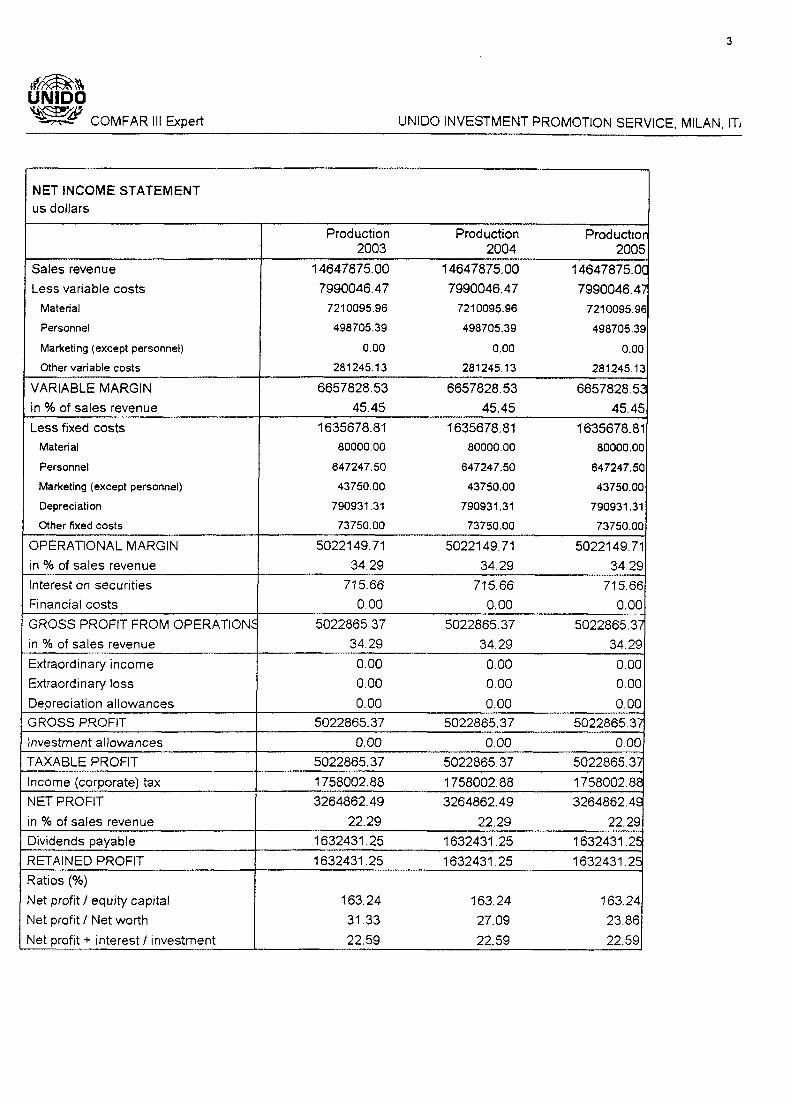
if~~ UNIDO ~iP ~ COMFAR Ill Expert
NET INCOME STATEMENT us dollars
Sales revenue
Less variable costs
Material
Personnel
Marketing (except personnel)
Other variable costs
VARIABLE MARGIN
in% of sales revenue
Less fixed costs
Material
Personnel
Marketing (except personnel)
Depreciation
Other fixed costs
OPERATIONAL MARGIN
in% of sales revenue
Interest on securities
Financial costs
GROSS PROFIT FROM OPERATION.:
in % of sales revenue
Extraordinary income
Extraordinary loss
Depreciation allowances
GROSS PROFIT
Investment allowances
TAXABLE PROFIT
Income (corporate) tax
NET PROFIT
in % of sales revenue
Dividends payable
RETAINED PROFIT
Ratios(%)
Net profit I equity capital
Net profit I Net worth
Net profit+ interest I investment
Production 2003
14647875.00
7990046.47
7210095.96
498705.39
0.00
281245.13
6657828.53
45.45
1635678.81
80000.00
647247.50
43750.00
790931.31
73750.00
5022149.71
34.29
715.66
0.00
5022865.37
34.29
0.00
0.00
0.00
5022865.37
0.00
5022865.37
1758002.88
3264862.49
22.29
1632431.25
1632431.25
163.24
31.33
22.59
3
UNIDO INVESTMENT PROMOTION SERVICE, MILAN, ITi
Production Productior 2004 2005
14647875.00 14647875.0C
7990046.47 7990046.47
7210095.96 7210095.96
498705.39 498705.39
0.00 0.00
281245.13 281245.13
6657828.53 6657828.52
45.45 45.45
1635678.81 1635678.81 80000.00 80000.00
647247.50 647247.50
43750.00 43750.00
790931.31 790931.31
73750.00 73750.00
5022149.71 5022149.71
34.29 34.29
715.66 715.66
0.00 0.00
5022865.37 5022865.37
3429 34.29
0.00 0.00
0.00 0.00
0.00 0.00
5022865.37 5022865.37
0.00 0.00
5022865.37 5022865.37
1758002.88 1758002.8€
3264862.49 3264862.48
22.29 22.29
1632431.25 1632431.25
1632431.25 1632431.2~
163.24 163.24
27.09 23.86
22.59 22.59

l~~ UNIDO ~U' ~ COMFAR Ill Expert
NET INCOME STATEMENT us dollars
Sales revenue
Less variable costs
Material
Personnel
Marketing (except personnel)
Other variable costs
VARIABLE MARGIN
in % of sales revenue
Less fixed costs
Material
Personnel
Marketing (except personnel)
Depreciation
Other fixed costs
OPERATIONAL MARGIN
in % of sales revenue
Interest on securities
Financial costs
GROSS PROFIT FROM OPERATION!:
in % of sales revenue
Extraordinary income
Extraordinary loss
Depreciation allowances
GROSS PROFIT
Investment allowances
TAXABLE PROFIT
Income (corporate) tax
NET PROFIT
in % of sales revenue
Dividends payable
RETAINED PROFIT
Ratios(%)
Net profit I equity capital
Net profit I Net worth
Net profit + interest I investment
4
UNIDO INVESTMENT PROMOTION SERVICE, MILAN, IT1
Productior 2006
14647875.0C
7990046.47
7210095.96
498705.39
0.00
281245.13
6657828.5~
45.45
1635678.81
80000.00
647247.50
43750.00
790931.31
73750.00
5022149.71
34.29
715.66
0.00
5022865.37
34.29
0.00
0.00
0.00
5022865.37
0.00
5022865.37
1758002.BE
3264862.4S
22.29
1632431.2:
1632431.25
163.24
21.32
22.59
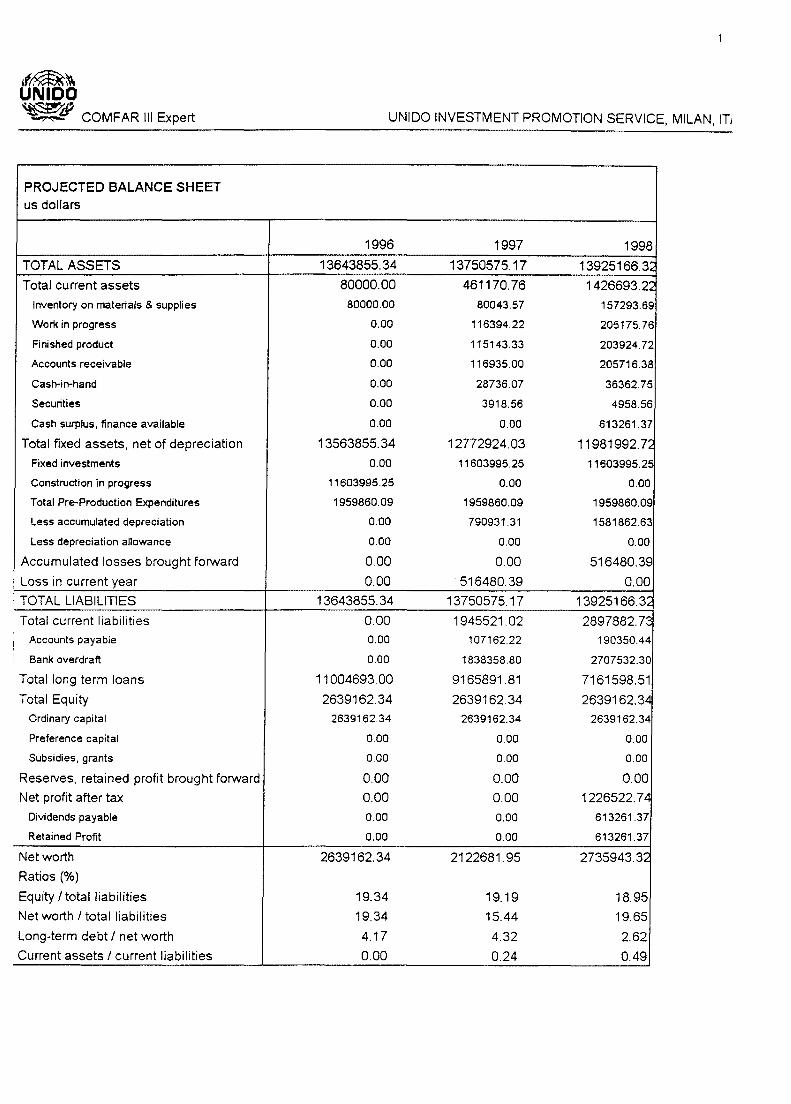
,f~~ UNIDO ~~ ~ COMFAR Ill Expert
PROJECTED BALANCE SHEET us dollars
TOTAL ASSETS
Total current assets
Inventory on materials & supplies
Work in progress
Finished product
Accounts receivable
Cash-in-hand
Securities
Cash surplus, finance available
Total fixed assets, net of depreciation
Fixed investments
Construction in progress
Total Pre-Production Expenditures
Less accumulated depreciation
Less depreciation allowance
Accumulated losses brought forward
Loss in current year
TOTAL LIABILITIES
1
Total current liabilities
! Accounts payable
I Bank overdraft
Total long term loans
Total Equity Ordinary capital
Preference capital
Subsidies, grants
Reserves, retained profit brought forward
Net profit after tax
Dividends payable
Retained Profit
Net worth
Ratios(%)
Equity I total liabilities
Net worth I total liabilities
Long-term debt I net worth
Current assets I current liabilities
UNIDO INVESTMENT PROMOTION SERVICE, MILAN, lT1
1996 1997 1998
13643855. 34 13750575.17 13925166.3L
80000.00 461170.76 1426693.22 80000.00 80043.57 157293.69
0.00 116394.22 205175.76
0.00 115143.33 203924.72
0.00 116935.00 205716.38
0.00 28736.07 36362.75
0.00 3918.56 4958.56
0.00 0.00 613261.37
13563855. 34 12772924.03 11981992. 7L 0.00 11603995.25 11603995.25
11603995.25 0.00 0.00
1959860.09 1959860.09 1959860.09
0.00 790931.31 1581862.63
0.00 0.00 0.00
0.00 0.00 516480.39
0.00 516480.39 0.00
13643855.34 13750575.17 13925166.32
0.00 1945521.02 2897882.73 0.00 107162.22 190350.44
0.00 1838358.80 2707532.30
11004693.00 9165891.81 7161598.51
2639162.34 2639162.34 2639162.3..:1 2639162.34 2639162.34 2639162.34
0.00 0.00 0.00
0.00 0.00 0.00
0.00 0.00 0.00
0.00 0.00 1226522.7"1
0.00 0.00 613261.37
0.00 0.00 613261.37
2639162.34 2122681.95 2735943.32
19.34 19.19 18.95
19.34 15.44 19.65
4.17 4.32 2.62
0.00 0.24 0.49

if~~ UNIDO ~ COMFAR Ill Expert
PROJECTED BALANCE SHEET us dollars
TOTAL ASSETS
Total current assets
Inventory on materials & supplies
Work in progress
Finished product
Accounts receivable
Cash-in-hand
Securities
Cash surplus, finance available
Total fixed assets, net of depreciation
Fixed investments
Construction in progress
Total Pre-Production Expenditures
Less accumulated depreciation
Less depreciation allowance
Accumulated losses brought forward
Loss in current year
TOTAL LIABILITIES
Total current liabilities Accounts payable
Bank overdraft
Total long term loans
Total Equity
Ordinary capital
Preference capital
Subsidies, grants
Reserves, retained profit brought forward
Net profit after tax
Dividends payable
Retained Profit
Net worth
Ratios(%)
Equity I total liabilities
Net worth I total liabilities
Long-term debt I net worth
Current assets I current liabilities
2
UNIOO INVESTMENT PROMOTION SERVICE, MILAN, IT1
1999 2000 2001
13756416.17 13030662. 62 12317123.5f
2565354.77 2630532.53 2707924.81 234540.04 231965.15 231965.15
293952.36 290993.13 290993.13
292701.47 292701.47 292701.47
294493.13 294493.13 294493.13
43988.67 43734.48 43734.48
5998.46 5963.79 5963.79
1399680.65 1470681.38 1548073.66
11191061.40 10400130.09 9609198.7~
11603995.25 11603995.25 11603995.25
0.00 0.00 0.00
1959860.09 1959860.09 1959860.09
2372793.94 3163725.25 3954656.56
0.00 0.00 0.00
0.00 0.00 0.00
0.00 0.00 0.00
13756416.17 13030662. 62 12317123.5f
3244192.74 3358057.94 3614670.91 273398.06 267977.31 268062.87
2970794.68 3090080.63 3346608.04
4976918.81 2595617.95 0.00
2639162.34 2639162.34 2639162.3"1 2639162.34 2639162.34 2639162.34
0.00 0.00 0.00
0.00 0.00 0.00
96780.98 1496461.63 2967143.01
2799361.29 2941362.77 3096147.3~
1399680.65 1470681.38 1548073.66
1399680.65 1470681.38 1548073.66
4135623.97 5606305.35 7154379.01
19.18 20.25 21.43
30.06 43.02 58.08
1.20 0.46 0.00
0.79 0.78 0.75
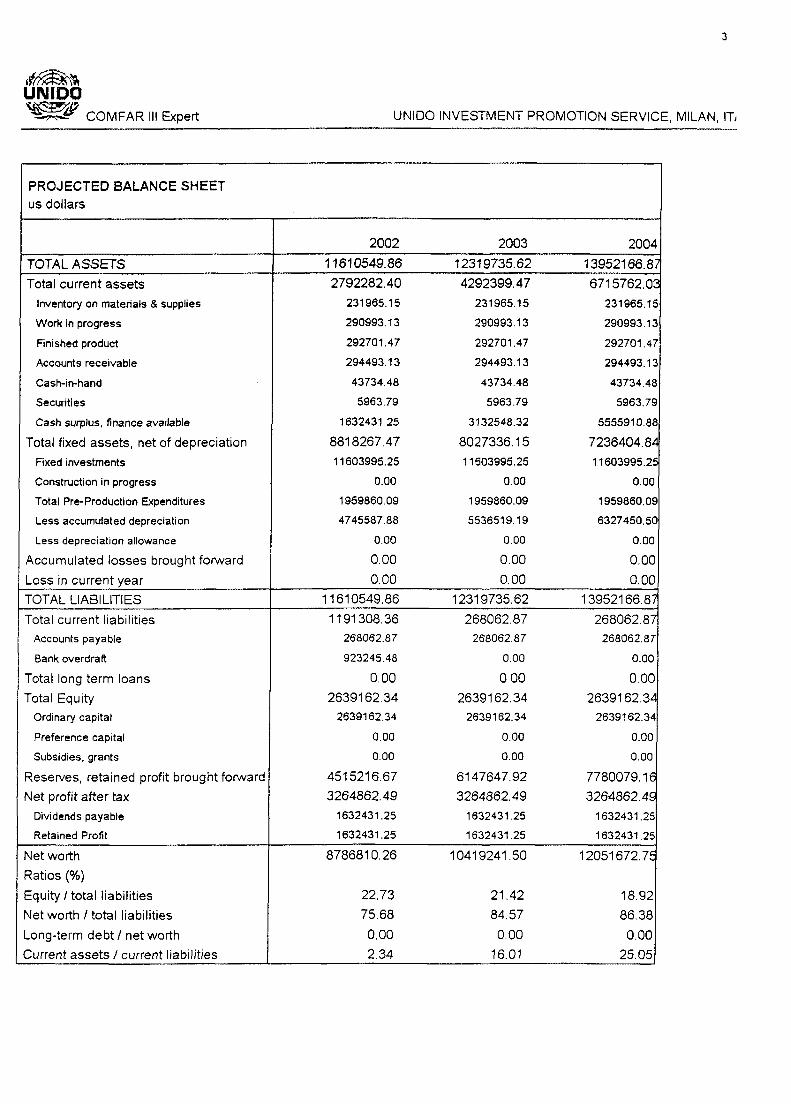
if~~ UNIDO ~ COMFAR Ill Expert
PROJECTED BALANCE SHEET us dollars
TOT AL ASSETS
Total current assets
Inventory on materials & supplies
Work in progress
Finished product
Accounts receivable
Cash-in-hand
Securities
Cash surplus, finance available
Total fixed assets, net of depreciation
Fixed investments
Construction in progress
Total Pre-Production Expenditures
Less accumulated depreciation
Less depreciation allowance
Accumulated losses brought forward
Loss in current year
TOTAL LIABILITIES
Total current liabilities Accounts payable
Bank overdraft
Total long term loans
Total Equity
Ordinary capital
Preference capital
Subsidies, grants
Reserves, retained profit brought forward
Net profit after tax
Dividends payable
Retained Profit
Net worth
Ratios(%)
Equity I total liabilities
Net worth I total liabilities
Long-term debt I net worth
Current assets I current liabilities
3
UNIDO INVESTMENT PROMOTION SERVICE, MILAN, ITi
2002 2003 2004
11610549.86 12319735.62 13952166.ai
2792282.40 4292399.47 6715762.0~
231965.15 231965.15 231965.15
290993.13 290993.13 290993.13
292701.47 292701.47 292701.47
294493.13 294493.13 294493.13
43734.48 43734.48 43734.48
5963.79 5963.79 5963.79
1632431.25 3132548.32 5555910.88
8818267.47 8027336.15 7236404.8£
11603995. 25 11603995.25 11603995.2!:
0.00 0.00 0.00
1959860.09 1959860.09 1959860.09
4745587.88 5536519.19 6327450.50
0.00 0.00 0.00
0.00 0.00 0.00
0.00 0.00 0.00
11610549.86 12319735.62 13952166.87
1191308.36 268062.87 268062.87 268062.87 268062.87 268062.87
923245.48 0.00 0.00
0.00 000 0.00
2639162.34 2639162.34 2639162.3L 2639162.34 2639162.34 2639162.34
0.00 0.00 0.00
0.00 0.00 0.00
4515216.67 6147647.92 7780079.1E
3264862.49 3264862.49 3264862.4~
1632431.25 1632431.25 1632431.25
1632431.25 1632431.25 1632431.25
8786810.26 10419241.50 12051672. 7:
22.73 21.42 18.92
75.68 84.57 86.38
0.00 0.00 0.00
2.34 16.01 25.05

if~~ UNIDO ~ COMFAR Ill Expert
PROJECTED BALANCE SHEET us dollars
TOTAL ASSETS
Total current assets
Inventory on materials & supplies
Work in progress
Finished product
Accounts receivable
Cas~in-hand
Securities
Cash surplus, finance available
Total fixed assets, net of depreciation
Fixed investments
Construction in progress
Total Pre-Production Expenditures
Less accumulated depreciation
Less depreciation allowance
Accumulated losses brought forward
Loss in current year
TOTAL LIABILITIES
Total current liabilities Accounts payable
Bank overdraft
Total long term loans
Total Equity Ordinary capital
Preference capital
Subsidies, grants
Reserves, retained profit brought forward
Net profit after tax
Dividends payable
Retained Profit
Net worth
Ratios(%)
Equity I total liabilities
Net worth I total liabilities
Long-term debt I net worth
Current assets I current liabilities
4
UNIDO INVESTMENT PROMOTION SERVICE, MILAN, IT1
2005 2006
15584598.11 17217029.3E
9139124.59 11562487.1 L
231965.15 231965.15
290993.13 290993.13
292701.47 292701.47
294493.13 294493.13
43734.48 43734.48
5963.79 5963.79
7979273.44 10402635.9~
6445473.53 5654542.2:;;
11603995.25 11603995.25
0.00 0.00
1959860.09 1959860.09
7118381.81 7909313.13
0.00 0.00
0.00 0.00
0.00 0.00
15584598.11 17217029.3E
268062.87 268062.87 268062.87 268062.87
0.00 0.00
0.00 0.00
2639162.34 2639162.3£ 2639162.34 2639162.34
0.00 0.00
0.00 0.00
9412510.41 11044941. 6E
3264862.49 3264862.4~
1632431.25 1632431.25
1632431.25 1632431.25
13684104.00 15316535.2£
16.93 15.33
87.81 88.96
0.00 0.00
34.09 43.13

if~~ UNIDO ~ COMFAR Ill Expert
FINANCIAL RATIOS us dollars
Long-term debt I net worth
Current assets I current liabilities
Net cash flow/ long term debt
Accounts receivable I accounts payable
Net cash flow / long term debt service
1996
4.17
0.00
-1.11
0.00
-8.54
UNIDO INVESTMENT PROMOTION SERVICE, MILAN, IT1
1997 1998
4.32 2.62
0.24 0.49
0.12 0.37
1.09 1.08
0.37 0.91

,f~~ UNIDO ~ COMFAR Ill Expert
FINANCIAL RATIOS us dollars
Long-term debt I net worth
Current assets I current liabilities
Net cash flow/ long term debt
Accounts receivable I accounts payable
Net cash flow / long term debt service
1999
1.20
0.79
0.81
1.08
1.39
2
UNIOO INVESTMENT PROMOTION SERVICE, MILAN, ITi
2000 2001
0.46 0.00
0.78 0.75
1.63 0.00
1.10 1.10
1.47 1.45
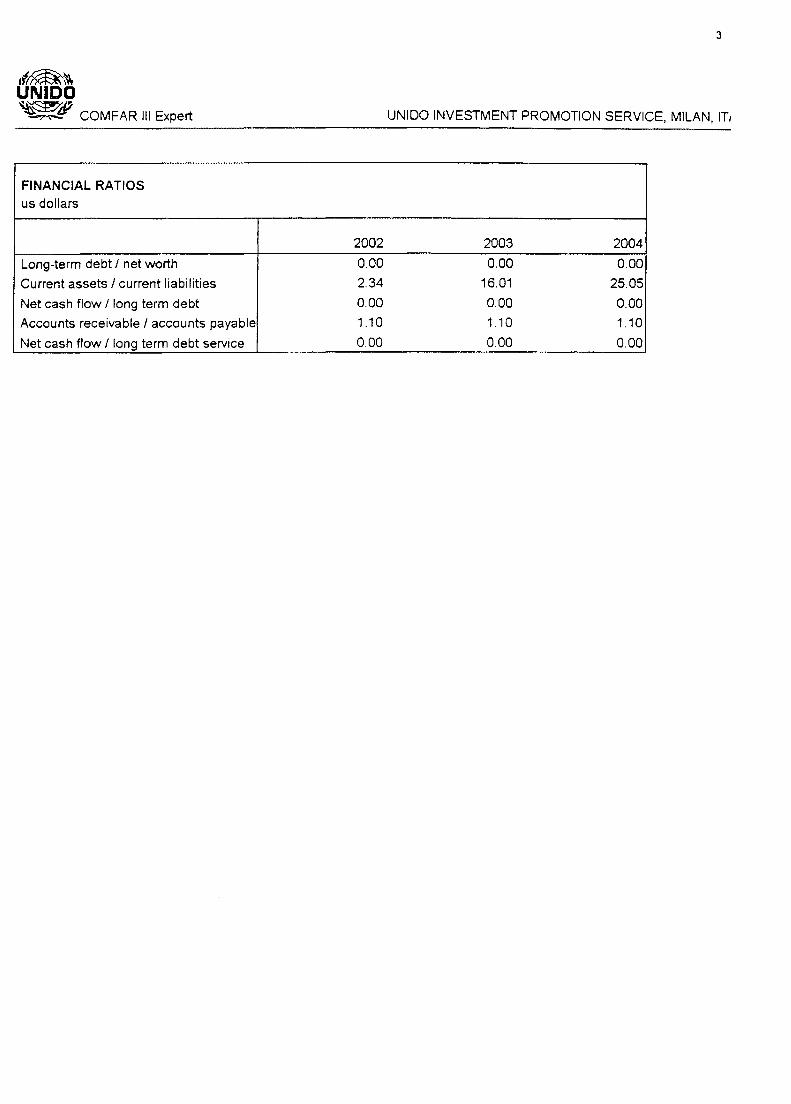
,f~~ UNIDO ~ COMFAR Ill Expert
FINANCIAL RATIOS us dollars
Long-term debt I net worth
Current assets I current liabilities
Net cash flow I long term debt
Accounts receivable I accounts payable
Net cash flow I long term debt service
2002
0.00
2.34
0.00
1.10
0 00
3
UNIDO INVESTMENT PROMOTION SERVICE, MILAN, IT1
2003 2004
0.00 0.00
16.01 25.05
0.00 0.00
1.10 1.10
0.00 0.00

'~~ UNIDO ~ COMFAR Ill Expert
FINANCIAL RATIOS us dollars
Long-term debt I net worth
Current assets I current liabilities
Net cash flow / long term debt
Accounts receivable I accounts payable
Net cash flow / long term debt service
4
UNIDO INVESTMENT PROMOTION SERVICE, MILAN, IT1
2005 2006
0.00 0.00
34.09 43.13
0.00 0.00
1.10 1.10
0.00 0.00

if~~ UNIDO ~ COMFAR Ill Expert
EFFICIENCY RATIOS us dollars
Sales I total capital investment
Initial investment I personnel cost
Inventory I sales
Net cash flow I Total sales
Production 1997
0.35
17.11
15.67
0.23
UNIDO INVESTMENT PROMOTION SERVICE, MILAN, !Ti
Production Productior 1998 1999
0.69 1.01
14.48 12.61
17.24 17.84
0.27 0.28

,f~~ UNIDO ~ COMFAR Ill Expert
EFFICIENCY RATIOS us dollars
Sales I total capital investment
Initial investment I personnel cost
Inventory I sales
Net cash flow I Total sales
Production 2000
1.01
12.61
17.96
0.29
2
UNIDO INVESTMENT PROMOTION SERVICE, MILAN, IT1
Production Productior 2001 2002
1.01 1.01
12.61 12.61
17.96 17.96
0.28 0.28

I
,f~~ UNIDO ~o ~ COMFAR Ill Expert
EFFICIENCY RATIOS us dollars
Sales J total capital investment
Initial investment I personnel cost
Inventory I sales
Net cash flow I Total sales
Production 2003
1.01
12.61
17.96
0.28
3
UNIOO INVESTMENT PROMOTION SERVICE, MILAN, IT1
Production Productior 2004 2005
1.01 1.01 12.61 12.61
17.96 17.96
0.28 0.28

'~~~ UNIDO ~ COMFAR Ill Expert
EFFICIENCY RATIOS us dollars
Sales I total capital investment
Initial investment I personnel cost
Inventory I sales
Net cash flow I Total sales
4
UNIDO INVESTMENT PROMOTION SERVICE, MILAN, IT1
Production 2006
1.01
12.61
17.96
0.28

I
if~~~ UNIDO ~_? COMFAR Ill Expert
EFFICIENCY RATIOS us dollars
Sales I total capital investment
Initial investment I personnel cost
Inventory I sales
Net cash flow I Total sales
4
UNIDO INVESTMENT PROMOTION SERVICE, MILAN, IT1
Productior 2006
1.01
12.61
17.96
0.28

