MuRF1, Twitchin kinase & cardiac titin
167
Biophysical characterisation of muscle-specific proteins involved in sarcomere signalling and elasticity: MuRF1, Twitchin kinase & cardiac titin Thesis submitted in accordance with the requirements of the University of Liverpool for the degree of Doctor in Philosophy by Barbara Gisela Franke September 2012
-
Upload
khangminh22 -
Category
Documents
-
view
1 -
download
0
Transcript of MuRF1, Twitchin kinase & cardiac titin

! ! !
!
Biophysical characterisation
of
muscle-specific proteins involved in sarcomere
signalling and elasticity:
MuRF1, Twitchin kinase & cardiac titin
Thesis submitted in accordance with the requirements of the University of Liverpool
for the degree of Doctor in Philosophy
by
Barbara Gisela Franke
September 2012

! ! "#!$%&'()!
! *!
Abstract
Striated muscle has the ability to remodel itself in response to mechanical
stress and (patho) physiological factors, through the various signalling pathways,
which govern myofibril turnover. One such pathway, involving MuRF1 is the
ubiquitin proteasome system, which targets proteins for degradation. The focus of this
work has been placed on investigating muscle specific proteins involved in sarcomere
signalling and elasticity. Emphasis has been placed in elucidating the crystal structure
of the coiled coil domain of MuRF1 to 2.1Å resolution. This domain has been thought
to govern homodimerization of this E3 ubiquitin ligase, but we show that the coiled
coil potential of this fragment in isolation is limited, and has a promiscuous sequence
capable of establishing parallel and anti-parallel self-associative interactions. We have
concluded that this domain requires the presence of either the N-terminal B-box
domain to set the registry of the coiled-coil or the C-terminal COS-box domain. We
predict that the latter forms two short helices, which interact with the coiled coil
domain to form a clamp that stabilizes the dimer interaction.
MuRF1 binds to the titin cytoskeleton vicinal to the titin kinase domain. We
have also examined the titin homologue twitchin (from C. elegans) to gain insight
into how the kinase domain is activated by sensing mechanical strain. We have
determined that these kinase domains are autoinhibited by two regulatory tails
flanking the catalytic core, and can be activated by stretching forces that displace the
N-terminal tail.
Finally, to further understand the ability of the titin I-band to contribute to
sarcomere elasticity and end-filament formation work has been carried out on a five-
domain construct of the distal I-band. Preliminary results suggest that there may be
key Ig “catch” domains, which are deterministic for inducing self-assembly of titin.

! ! "#!$%&'()!
! **!
Table of Contents Acknowledgements ............................................................................................................... 1 List of Figures ...................................................................................................................... 2 List of Tables ....................................................................................................................... 4 Glossary of Abbreviations ..................................................................................................... 5
Chapter 1:
General Introduction ............................................................................................. 8 !"#"!$%&'(%)*!+,-./)!-(&.0+)&)-!(1*!%2)'&!3)4!.0+501)1%-!########################################!6!
Chapter 2:
Structural Studies of the helical domain of MuRF1 ............................... 11 !7#"!81%&0*,.%'01!########################################################################################################################!""!
2.1.1 MuRF protein family ......................................................................................... 12 2.1.2 MuRF proteins function and localization ............................................................. 13 2.1.3 MuRF1 ............................................................................................................. 15 2.1.3.1 MuRF1 and its role in muscle degradation ........................................................... 17 2.1.3.2 The involvement of MuRF1 in regulating cardiac hypertrophy .............................. 19 2.1.4 Status of MuRF1 Molecular structure ................................................................. 22 2.1.5 MuRF1 and titin ................................................................................................ 24 2.1.6 Coiled-coil motifs ............................................................................................. 26
7#7! 9'+-!#####################################################################################################################################!7:!7#;! <(%)&'(/-!(1*!<)%20*-!##################################################################################################!;=!
2.3.1 Sequence analyses of MuRF proteins .................................................................. 30 2.3.2 Cloning ............................................................................................................ 31 2.3.3 Protein expression and purification ..................................................................... 32 2.3.4 Size Exclusion Chromatography coupled to Multiangle Laser Light Scattering
(SEC-MALLS) ................................................................................................. 33 2.3.5 Small Angle X-ray scattering ............................................................................. 34 2.3.6 Crystallization of MuRF1-CC .......................................................................... 35 2.3.7 Electron Microscopy (EM) ................................................................................. 36 2.3.8 Ab initio modelling ........................................................................................... 36
7#>! ?)-,/%-!################################################################################################################################!;@!2.4.1 Determination of the coiled-coil formation propensity of the helical domain of
MuRFs ........................................................................................................... 37 2.4.2 Production of recombinant MuRF1-CC and MuRF1-BCC .................................... 40 2.4.3 MuRF1-CC crystallization ................................................................................. 42 2.4.4 Collection and processing of native diffraction data ............................................. 46 2.4.4.1 MuRF1-CC needle morphology ......................................................................... 46 2.4.4.2 MuRF1-CC plate morphology ............................................................................ 48 2.4.4.3 MuRF1-CC bipyramidal morphology ................................................................. 49 2.4.5 Crystal lattice characterization ............................................................................ 53 2.4.5.1 MuRF1-CC needle ............................................................................................ 53 2.4.5.2 MuRF1-CC plate ............................................................................................... 56

! ! "#!$%&'()!
! ***!
2.4.5.3 MuRF1-CC bipyramidal .................................................................................... 57 2.4.6 Molecular replacement attempts ......................................................................... 59 2.4.7 Experimental phasing (SIRAS/MAD) ................................................................. 60 2.4.7.1 Derivatization of crystals ................................................................................... 60 2.4.7.2 MAD data collection and processing ................................................................... 61 2.4.7.3 Substructure solution and density modification .................................................... 62 2.4.7.4 Model building and Refinement ......................................................................... 65 2.4.8 Phasing with ARCIMBOLDO ............................................................................ 67 2.4.8.1 Model building and refinement ........................................................................... 68 2.4.9 Crystal structure of MuRF1-CC .......................................................................... 79 2.4.10 Molecular arrangement of MuRF1-CC in solution ............................................... 76 2.4.11 Overall molecular parameters of MuRF1-B2HD .................................................. 79 2.4.12 Ab initio modelling of the C-terminal COS-box of MuRF1................................... 82 2.4.12.1 Experimental data in support of the predicted MuRF1-CC-COS model .................. 87
7#A! B'-.,--'01!#########################################################################################################################!66!
Chapter 3:
Analyses of Twitchin kinase from Caenorhabditis elegans ................... 92 ;#"! 81%&0*,.%'01!######################################################################################################################!:7!;#7!! C2(&(.%)&'D(%'01!0E!&)F,/(%0&4!*0+('1-!'1!%G'%.2'1!3'1(-)!(1*!+0/).,/(&!'1-'F2%-!'1%0!'%-!+).2(1'.(/!(.%'H(%'01!#############################################################################!:I!;#;! J&)/'+'1(&4!-%,*')-!%0G(&*-!%2)!.2(&(.%)&'D(%'01!0E!%2)!.(%(/4%'.(//4!(.%'H)!.01E0&+(%'01!0E!%G'%.2'1!3'1(-)!######################################################################################!""A!3.3.1 Production and analysis of N15 labeled recombinant twitchin kinase ................................ 116 ;#>! $,++(&4!#########################################################################################################################!"7=!;#A! K,%,&)!5)&-5).%'H)-!####################################################################################################!"7"!
Chapter 4: Titin elasticity in constitutively expressed Ig arrays ....................... 122 >#"! 81%&0*,.%'01!###################################################################################################################!"77!>#7!! 9'+-!##################################################################################################################################!"76!>#;! <)%20*-!###########################################################################################################################!"7:!
4.3.1 Cloning .......................................................................................................... 129 4.3.2 Protein production ........................................................................................ 130 4.3.2 Protein production ........................................................................................... 131 4.3.3 Small angle X-ray scattering ............................................................................ 132 4.3.4 Size Exclusion Chromatography coupled to Multiangle Laser Light Scattering .... 132 4.3.5 Crystallization ................................................................................................. 134
>#>!! ?)-,/%-!(1*!B'-.,--'01!###############################################################################################!";>!4.4.1 Production and characterization of I102-I106 & I102-I106OVH ......................... 134 4.4.2 Oligomeric state determination of I102-I106 ..................................................... 136 4.3.4 Preliminary crystallographic analysis of I102-I106 ............................................ 138 4.4.2 Conformational analysis of I102-I106OVH in solution ....................................... 143
>#A! C01./,-'01!######################################################################################################################!">I!

! ! "#!$%&'()!
! *+!
Chapter 5: References ............................................................................................ 147
Chapter 6: Appendices .......................................................................................... 162 I#"! 955)1*'L!8M!<,/%'C0'/!0,%5,%!!###################################################################################!"I7!
6.1.1 MuRF1 .......................................................................................................... 162 6.1.2 MuRF2 .......................................................................................................... 163 6.1.3 MuRF3 ........................................................................................................... 164
I#7! 955)1*'L!88!M!NG'-%)&!0,%5,%!E0&!<,?K"MCC!########################################################!"IA!6.2.1 Dimer AC ....................................................................................................... 165 6.2.2 Dimer BD ....................................................................................................... 167 6.2.3 Tetramer ......................................................................................................... 169
I#;! 955)1*'L!888!M!$OCPQN!0,%5,%!E0&!<,?K"MCC!######################################################!"@"!I#>! 955)1*'L!8R!M!J,S/'-2)*!5(5)&-!##############################################################################!"@A!
6.4.1 Assembly of a protein “brush” by end-grafting titin fragments to liposomes ........ 175 6.4.2 The intracellular Ig fold: a robust protein scaffold for the engineering of molecular
recognition ..................................................................................................... 178 I#>! 955)1*'L!R!T!C054&'F2%!5)&+'--'01-!(1*!-%(%)+)1%-!#####################################!":6!
!!

! ! "#!$%&'()!
! ,!
Acknowledgements
I would firstly like to thank my supervisor Dr. Olga Mayans for allowing me
the opportunity to become her student and achieve my dreams, but mostly for
introducing me the world of crystallography. I am grateful for all the support,
encouragement, and discussions both scientific and not throughout these 4 years.
I thank past members of the Mayans group, Sonia, Marc, and Eli for their
teaching and for all the laughs. Much of this work would not have been possible
without past and present members of labs C and D, who not only helped with
troubleshooting, but were always willing to trade for that much needed chemical or
plastic ware. They were all invaluable when it came time to head to the AJ's. I'd
especially like to thank Paul and Gaz for never thinking my questions were too stupid.
For those who make up my Liverpool family I appreciate all the support over
the years. Thanks to Al for getting me through that rickety first year, and to Aus as
well, for letting me talk both your ears off about science.
I'm grateful to my parents for teaching me to dream big, and that I could do
and be anything I wanted to. Gracias por creer en mi y por ayudarme a realizar mis
sueños! Agradezco al resto de mi familia también por todo el apoyo que me han dado,
especialmente a mi abuela que no llego a ver el final, pero por decirme cada vez que
hablábamos lo orgullosa que estaba de mi.
Lastly but certainly not least I thank my other half for being my biggest
champion and giving me all of the support I needed. You pushed me to work when I
needed to and took care of everything else when I couldn't. Thank you for being by
my side and understanding, the way only someone who's been through it can. To you
and to my parents I dedicate this thesis.

! ! "#!$%&'()!
! -!
List of Figures
Figure 1.1. The striated muscle sarcomere. 9
Figure 2.1. Domain organization of MuRF family 13
Figure 2.2. Domain organization of MuRF1, representing domains common to the MuRF family of
proteins 16
Figure 2.3. Cardiac hypertrophic response of mice lacking MuRF1 or MuRF2 in response to TAC 21
Figure 2.4. Crystallographic structure of the B-box2 dimeric domain of MuRF1 23
Figure 2.5. Surface representation of the crystal structure of titin A168-A170 25
Figure 2.6. The GCN4 Leucine zipper, a canonical coiled-coil 27
Figure 2.7. Declaration of MuRF1 constructs used in this study 31
Figure 2.8. Sequence analysis of the helical domain of MuRFs 39
Figure 2.9. Size exclusion chromatography of MuRF1-CC on a Superdex 75 (16/60 PG) column. 40
Figure 2.10. Size exclusion chromatography of MuRF1-B2HD on a Superdex 200 (16/60 PG)
column 41
Figure 2.11. SDS-PAGE of MuRF1-B2HD samples obtained from size exclusion chromatography 42
Figure 2.12. MuRF1-CC crystal morphologies 45
Figure 2.13. MuRF1-CC needle crystal mounted on a nylon loop 47
Figure 2.14. Diffraction image for MuRF1-CC needle morphology 48
Figure 2.15. Diffraction image of MuRF1-CC blade morphology 49
Figure 2.16. Diffraction image for MuRF1-CC bipyramidal morphology 51
Figure 2.17. Polar representation of the self-rotation function calculated with POLARRFN 55
Figure 2.18. Native Patterson map of MuRF1-CC needle morphology in the resolution range
15-5 Å 55
Figure 2.19. Polar representation of the self-rotation function for MuRF1-CC thin plate calculated with
POLARRFN 57
Figure 2.20. NZ test to detect twinning and translational NCS, based on cumulative distribution of
intensities 58
Figure 2.21. Polar representation of the self-rotation function for MuRF1-CC bipyramid calculated
with POLARRFN 59
Figure 2.22. (Ta6Br12)2+ derivatized bipyramidal crystal of MuRF1-CC 61
Figure 2.23. Real (f’) and imaginary (f’’) components of the anomalous signal from tantalum 62
Figure 2.24. Anomalous and dispersive Patterson maps 64
Figure 2.25. Partial poly-alanine model of MuRF1-CC in space group P41 66
Figure 2.26. Superimposition of initial poly-alanine model over completed MuRF1-CC 68
Figure 2.27. Crystal structure of MuRF1-CC 71
Figure 2.28. Extent of knobs-into-hole packing of the crystallographic dimers of MuRF1-CC 75
Figure 2.29. SEC-MALLS analyses of MuRF1-CC 76
Figure 2.30. Fitting of crystallographic dimer onto experimental scattering pattern 78
Figure 2.31. Distance distribution function of MuRF1-CC 79

! ! "#!$%&'()!
! .!
Figure 2.32. SEC-MALLS analyses of MuRF1-B2HD 80
Figure 2.33. Electron microscopy full field image of MuRF1-B2HD 81
Figure 2.34. Ab initio modelling of MuRF1-CC-COS and MuRF1-HD 84
Figure 2.35. Ab initio model family for MuRF1-CC-COS generated using Quark (a) and
superimposition onto MuRF1-CC crystallographic structure (b) 85
Figure 2.36. Hypothertical dimer of MuRF1-CC-COS 91
Figure 2.37. Schematic representation of proposed full length MuRF1 protein. 91
Figure 3.1. Domain composition of the conserved kinase region of titin-like filaments 93
Figure 3.2. CRD blockage of ATP binding pocket of Twitchin kinase 94
Figure 3.3. Chemical structure of ATP and AppCp 118
Figure 3.4. HSQC spectra of apo Kin (top) and in the presence of 1mM ADP (bottom) 119
Figure 4.1. Domain structure of skeletal titin 123
Figure 4.2. Conservation of sequence motifs in Ig tandems from I-band titin 126
Figure 4.3. End-filaments and their proposed electrostatic association 127
Figure 4.4. Size exclusion chromatography of titin I101- I106 on superdex 200 (16/60 PG)
column 135
Figure 4.5. Size exclusion chromatography of titin I102- I106OVH on a Superdex 200 (16/60 PG)
column 135
Figure 5.6. Size exclusion chromatography of titin I102-I106 on a Superdex 200 (16/60 PG)
column 135
Figure 4.7. SEC-MALLS measurement of titin I102-106 136
Figure 4.8. Titin I102-I106 crystals obtained from screening conditions 139
Figure 4.9. X-ray diffraction pattern of I102-I106 crystals fom condition CLASSII-85 141
Figure 4.10. X-ray diffraction pattern of I102-I106 crystals fom condition PEGRxI-10 142
Figure 4.11. Fitting of ab initio model onto experimental curves of I102-I106OVH 144
Figure 4.12. Distance distribution function of titin I102-I106OVH 144
Figure 4.13. Ab initio model of titin I102-I106OVH 145
Figure 6.1. MuRF1 coiled-coil probability scores 162
Figure 6.2. MuRF2 coiled-coil probability scores 163
Figure 6.3. MuRF3 coiled-coil probability scores 164

! ! "#!$%&'()!
! /!
List of Tables
Table 2.1. Common discontinuities among apolar residue seperation in coiled-coil heptad repeat
Patters 28
Table 2.2. MuRF sequences and accession numbers for uniprotKB database 30
Table 2.3. Initial crystallization hits obtained for MuRF1-CC 43
Table 2.4. Diffraction data statistics for MuRF1-CC crystal morphologies. 52
Table 2.5. Calculation of the Matthews coefficient for all morphologies of MuRF1-CC 54
Table 2.6. Outline of native MuRF1-CC crystals soaked in various heavy atoms. 61
Table 2.7. Fractional coordinates of heavy atom sites identified and refined with SOLVE 64
Table 2.8. Native X-ray data statistics 70
Table 2.9. Interactions in the dimeric portions of the crystal structure of MuRF1-CC 72
Table 2.10. Interactions in the tetramer portion of the crystal structure of MuRF1-CC 73
Table 2.11. Molecular parameters estimated from scattering data 78
Table 4.1. Initial crystallization hits obtained for Titin I102-I106. 138
Table 4.2. SAXS analysis of titin I102-I106OVH 143

! ! "#!$%&'()!
! 0!
List of Abbreviations
AFM Atomic force microscopy
AMP Adenosine monophosphate
approx. Approximately
ATP Adenosine triphosphate
B2 B-box domain subtype II
BSA Bovine serum albumin
C. elegans Caenorhabditis elegans
CAM Ca2+-calmodulin
CC Coiled-coil
CD Circular dichroism
CHES N-Cyclohexyl-2-aminoethanesulfonic acid
COS COS-box domain
CRD C-terminal regulatory tail
DNA Deoxyribonucleic acid
DNase Deoxyribonuclease
dn/dc Differential index of refraction
dKO Double knockout
DSS 4,4-dimethyl-4-silapentane-1-sulfonic acid
E. coli Escherichia coli
EM Electron microscopy
Fig Figure
FJSC Freely-jointed segmented chain
Fn Fibronectin
GMEB-1 Glucocorticoid modulatory element binding protein-1
HD Helical domain
HEPES 4-(2-Hydroxyethyl)-pperazine-1-sulfonic acid
HSQC Heteronuclear Single Quantum Coherence
Ig Immunoglobulin
IPTG isopropyl-b-D-thiogalactopyranoside
ITC Isothermal titration calorimetry
Kin Kinase domain of Twitchin
KO Knockout

! ! "#!$%&'()!
! 1!
M-CK Muscle creatine kinase
MAD Multiwavelength anomalous diffraction
MD Molecular dynamics
MFC MuRF conserved region
MLCK Myosin light-chain kinases
MM molecular mass
MOPS 3-Morpholino-propanesulfonic acid
MPD 2-Methyl-2,4-pentandiol
MR Molecular replacement
MuRF Muscle specific RING finger protein
MW weight-averaged molecular mass
NCS Non crystallographic symmetry
NL N-terminal linker
NMJ Neuromuscular junction
NMR Nuclear magnetic resonance
OD Optical density
PCR Polymerase chain reaction
PDB protein data bank
PEG Polyethylene glycol
PEVK Proline Glutamate Valine Lysine
RBCC RING B-box coiled-coil
RING Really interesting new protein
SAXS Small angle X-ray scattering
SDS-PAGE Sodium dodecyl sulfate polyacrylamide gel electrophoresis
SEC-MALLS Size exclusion chromatography with multi-angle laser light scattering
SEC-MALS Size exclusion chromatography with multi-angle light scattering
ß-ME ß-Mercapto-ethanol
SUMO-3 Small ubiquitin related modifier type 3
TAC Transaortic constriction
TCEP Tris(2-carboxyethyl) phosphine hydrochloride
TEV Tobacco etch virus
TK Titin kinase
TLS Translation Libration Screw-motion
TRIM Tripartite motif

! ! "#!$%&'()!
! 2!
Tris Tris-(hydroxymethyl)-aminomethane
TTN-1 small titin
TwcK Twitchin kinase
Ubc9 Ubiquitin carrier protein 9

34&56)%!,78)')%&9!:'6%;<=>6*;'! ! "#!$%&'()!
! ?!
Chapter 1
General Introduction
1.1 Striated muscle sarcomeres and their key components
Striated (i.e. skeletal and cardiac) muscle is composed of a regular assembly
of protein filaments (contractile, cytoskeletal, and signalling proteins) that are
arranged into contractile units called sarcomeres (Fig 1.1). Sarcomeres are highly
ordered 2-3!m long structures that align in an end-to-end fashion to form the long
myofibrils, which in turn bundle together to form muscle fibres (Squire, 1997;
Sanger et al., 2002).
The striated pattern visible in the light microscope lead to a division of the
sarcomere into several zones (Fig 1.1a). The Z-disc is a dark narrow line at either
end of the sarcomere which borders the I-band (isotropic in polarized light). Z-discs
are shared by adjacent sarcomeres and denote the end/beginning of these structures.
At the centre of the sarcomere is a dark zone called the A-band (anisotropic in
polarized light), which is divided by a less dense region called the H-zone. In the
center of the H-zone is a narrow band of high density called the M-line, which
defines the geometrical middle of the sarcomere (Sjostrom & Squire, 1977).
The main components of the sarcomere are the thin filaments, the thick
filaments, and titin. The thin filaments are mainly composed of actin, but nebulin,
tropomyosin and troponin are also present among others, complexed to actin. The
thin filaments are anchored at the Z-disc and span the I-band region of the sarcomere

34&56)%!,78)')%&9!:'6%;<=>6*;'! ! "#!$%&'()!
! @!
extending towards the M-line. In the A-band region they interlink with thick
filaments. The thick filaments are mainly composed of myosin molecules, which are
the molecular motor for muscle contraction (Clark et al., 2002).
The third filament system in sarcomeres is titin, which provides structure (via
its interactions with thin and thick filaments) and elasticity (by the stretching and
recoiling of its I-band segments) to the sarcomere. Titin’s N-terminus is embedded in
the Z-disc where it interacts with thin filaments, while its C-terminus is in the M-line
region, binding thick myosin filaments (Granzier & Labeit, 2004; Bassel-Duby &
M-line Z-discZ-disc
A-bandI-bandI-band
Titin kinase
Titin
Thin filament
Thick filament
A168-A170MuRF-1 binding
Elastic regionof titin
Figure 1.1. The striated muscle sarcomere. a) electron micrograph of a whole sarcomere, Z to Z distance is 2.3!m. Adapted from (Squire et al., 2005). b) Schematic representation of a full sarcomere. Thin (blue) and thick (yellow) filaments and main regions of the sarcomere are indicated. Titin (black), and the titin kinase (red circle) domain are also shown. The elastic I-band region of titin and the MuRF1 binding site, which is adjacent to the titin kinase domain and composed of two Ig domains and one FnIII domain (A168-A170), are labelled.
&A!
BA!

34&56)%!,78)')%&9!:'6%;<=>6*;'! ! "#!$%&'()!
! ,C!
Olson, 2006; Kontrogianni-Konstantopoulos et al., 2009). Titin is composed of a
regular pattern of Ig super-motifs located in the I-band region of the sarcomere that
have been identified as providing segmental flexibility to the protein (Von Castelmur
et al., 2008). Titin also contains a catalytic serine/threonine kinase domain located at
the M-line of the sarcomere close to its C-terminus. The Muscle specific RING
Finger 1 (MuRF1) protein, a muscle-specific E3 ubiquitin ligase, binds to the M-line
of titin, onto a set of Ig-like domains immediately preceding the kinase domain
(Figure 1.1) (Mrosek et al., 2007). It is possible that either MuRF1 regulates the titin
kinase domain or that MuRF1 is phosphorylated by titin, triggering downstream
pathways involved in proteosome-dependant degradation of various muscle fibres,
regulation of metabolic functions, and gene expression (Centner et al., 2001;
McElhinny et al., 2002; Gregorio et al., 2005; Mrosek et al., 2007; Koyama et al.,
2008).

34&56)%!-7D=E$,! ! "#!$%&'()!
! ,,!
Chapter 2
Structural Studies of the helical domain of MuRF1
2.1 Introduction
Striated muscle remodels itself in response to mechanical stress. There are
numerous intracellular signalling pathways that control protein degradation in the
myofibril, participating in muscle turnover (Lecker et al., 1999; Granzier & Labeit,
2004; Bassel-Duby & Olson, 2006; Murton et al., 2008; Labeit et al., 2010). This
chapter focuses on a family of proteins, the Muscle Specific RING Fingers (MuRFs),
that are involved in various functions in the sarcomere from modulating gene
expression to targeting proteins for degradation (Bodine et al., 2001; Centner et al.,
2001; Zhao et al., 2007; Koyama et al., 2008). Particular interest is held on MuRF1
and its role in muscle atrophy. Studies show that MuRF1 is upregulated at the onset
of atrophy, and that MuRF1 deficient mice show an increased resistance to atrophy
(~36% less muscle loss) (Bodine et al., 2001). These findings provide support for
considering this protein as a potential drug target for treatment of muscle atrophy,
particularly in the elderly and chronic disease patients.
Muscle atrophy is known as a decrease in muscle mass and can occur as a
consequence of various disease states such as: cancer, diabetes, denervation, sepsis,
and chronic obstructive pulmonary disease. Muscle atrophy can also be induced by:
ageing (sarcopenia), extended bed rest, glucocorticoid treatment, and exposure to
microgravity (Granzier & Labeit, 2004; Argiles et al., 2005; Bassel-Duby & Olson,

34&56)%!-7D=E$,! ! "#!$%&'()!
! ,-!
2006; Faulkner et al., 2008; Murton et al., 2008), when the balance of protein
synthesis and protein degradation is shifted towards the later.
MuRF1 is known to interact with titin (Centner et al., 2001; Mrosek et al.,
2007). This particular binding partner is of great interest as MuRF1 localizes to the
M-line at the onset of atrophy, where the titin kinase domain is located. It is on this
basis that further study into the role of this atrogen is needed in order to fully
understand its role in muscle protein turnover and contribute towards finding a
suitable treatment for muscle loss.
2.1.1 MuRF protein family
The MuRF family has three known members: MuRF1, MuRF2, and MuRF3;
each encoded by a different gene located at a distinct locus in different chromosomes
(Centner et al., 2001). The MuRFs are E3 ubiquitin ligases that belong to the
TRIM/RBCC protein superfamily (C-II subfamily) (Short & Cox, 2006). MuRFs are
characterised by having a distinct tripartite fold that consists of a RING finger; a B-
box 2 (B2) domain; and a helical domain that possibly folds into a coiled-coil (CC)
(Mayans & Labeit, 2012). In addition, the MuRF family also contains three
conserved sequence motifs: a MuRF family conserved region (MFC) whose function
is unknown at present; a COS (C-terminal subgroup one signature)-box motif that
mediates binding to microtubules; and an acidic C-terminal tail predicted to be
intrinsically disordered (Figure 2.1). The MuRF proteins share high sequence
identity (Figure 2.1) (approx. 81% seq. Id.) across their RING, MFC and B-box
motifs, whilst their CC fraction is less conserved (approx. 36% seq. id.) (Mayans &
Labeit, 2012).
34&56)%!-7D=E$,! ! "#!$%&'()!
! ,.!
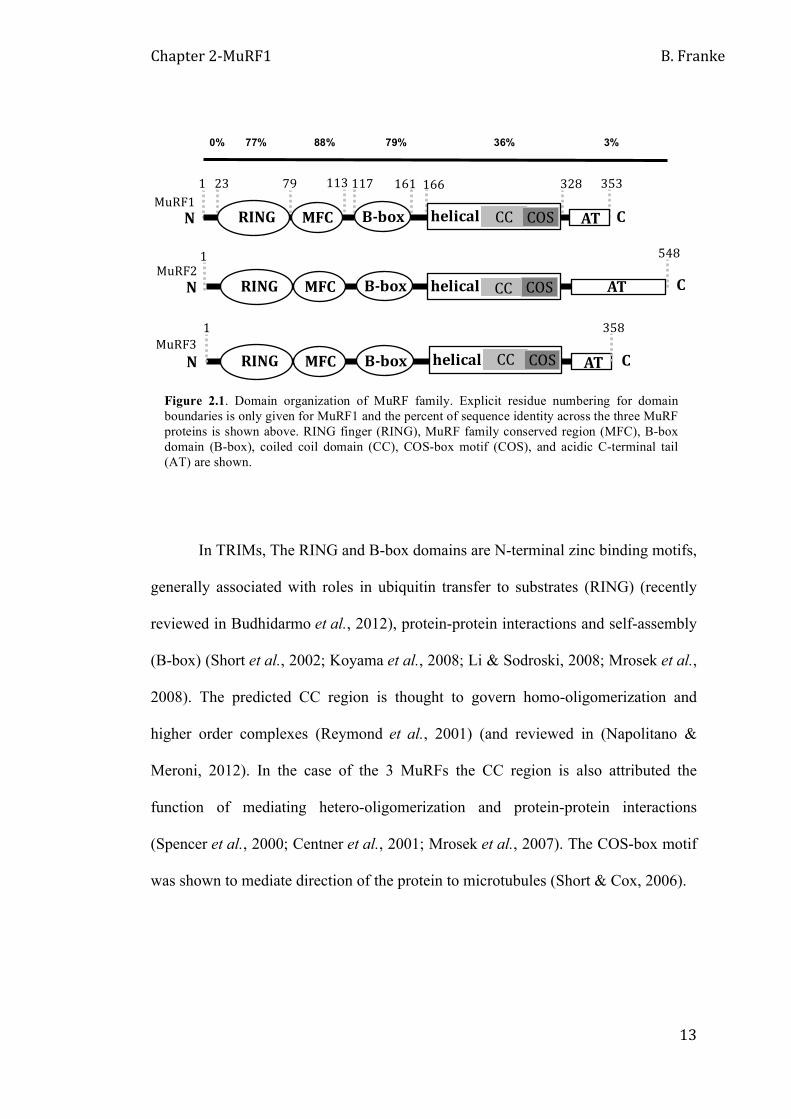
In TRIMs, The RING and B-box domains are N-terminal zinc binding motifs,
generally associated with roles in ubiquitin transfer to substrates (RING) (recently
reviewed in Budhidarmo et al., 2012), protein-protein interactions and self-assembly
(B-box) (Short et al., 2002; Koyama et al., 2008; Li & Sodroski, 2008; Mrosek et al.,
2008). The predicted CC region is thought to govern homo-oligomerization and
higher order complexes (Reymond et al., 2001) (and reviewed in (Napolitano &
Meroni, 2012). In the case of the 3 MuRFs the CC region is also attributed the
function of mediating hetero-oligomerization and protein-protein interactions
(Spencer et al., 2000; Centner et al., 2001; Mrosek et al., 2007). The COS-box motif
was shown to mediate direction of the protein to microtubules (Short & Cox, 2006).
Figure 2.1. Domain organization of MuRF family. Explicit residue numbering for domain boundaries is only given for MuRF1 and the percent of sequence identity across the three MuRF proteins is shown above. RING finger (RING), MuRF family conserved region (MFC), B-box domain (B-box), coiled coil domain (CC), COS-box motif (COS), and acidic C-terminal tail (AT) are shown.
0% 77% 88% 79% 36% 3%
! ! ! !!" !M!!" !"# ! ! !"#$
0/? D=E$-!
,!
!
! ! ! !!" !M!!" !"# ! ! !"#$
, .0? D=E$.!
!
D=E$,!, -. ,,. ,,2 ,1, ,11 .-? 2@ .0.
! ! !!M!!" !"# ! !"#$ ! ! !!" !"#$%&#
!"#$%&#
!"#$%&#
33!
33!
33!
3FG
3FG
3FG

34&56)%!-7D=E$,! ! "#!$%&'()!
! ,/!
2.1.2 MuRF proteins function and localization
The MuRFs have diverse functions implicating them in muscle turnover and
regeneration, as well as varying localization and expression patterns within muscle
cells. MuRF3, for example, has been shown to stabilize microtubules and is involved
in the initiation of myogenesis and myotube formation and is developmentally up-
regulated (Spencer et al., 2000), it has also been implicated in maintaining cardiac
integrity and function after myocardium infarction (Fielitz et al., 2007). MuRF3
localizes to stable microtubules and to the Z-disc and M-line of myofibrils (Spencer
et al., 2000; Centner et al., 2001). MuRF2 has been shown to be developmentally
down-regulated and its expression is essential for myoblast fusion events. McElhinny
and co-workers (Centner et al., 2001; McElhinny et al., 2004) also showed that
knock-down of MuRF2 disrupts microtubule stability, specifically at the M-line
region. Its transient association with myosin, titin, and microtubules has introduced
the possibility that MuRF2 may act as an adaptor between these proteins during
myofibrillogenesis (Pizon et al., 2002; McElhinny et al., 2004). MuRF2 also forms
part of a signalling complex that binds to titin, in its kinase region, that is involved in
muscle gene expression and protein turnover (Lange et al., 2005). MuRF1 has been
the most researched member of this family and has been associated with various
functions. MuRF1 is found to localize at the M-line and Z-disc of the sarcomere at
the nucleus and peri-nuclear envelope, and in close proximity to the neuromuscular
junction (NMJ) (accumulating at the endplate of skeletal muscle). This E3 ligase has
been found to be upregulated in atrophy, whilst MuRF2 and 3 are constitutively
expressed (Centner et al., 2001; McElhinny et al., 2002; Gregorio et al., 2005;
Rudolf et al., 2012). Among the various roles attributed to MuRF1 is its ubiquitin

34&56)%!-7D=E$,! ! "#!$%&'()!
! ,0!
ligase activity, shown to be an accurate assumption as it targets cardiac troponin I,
muscle creatine kinase (M-CK), and phospho-c-jun for degradation (Hornemann et
al., 2003; Kedar et al., 2004; Koyama et al., 2008; Li et al., 2011a). Binding studies
have shown interactions of MuRF1 with several proteins including titin (Ig domains
A168-A170), glucocorticoid modulatory element binding protein-1 (GMEB-1),
SUMO-3, cardiac myosin–binding protein C, and Ubc9 to name a few (Centner et
al., 2001; Dai & Liew, 2001; McElhinny et al., 2002; Koyama et al., 2008; Mearini
et al., 2010).
2.1.3 MuRF1
MuRF1 is a 38kDa protein that has been implicated in many roles within the
pathways found in skeletal and cardiac muscle remodelling. This muscle specific
atrogen is involved for example in muscle fibre type-II remodelling and maintenance
by regulating myozenin-1 (a calcineurin/NFAT regulator, required for maintenance
of type-II muscle fibres) (Moriscot et al., 2010). Evidence also suggests that this
protein is involved in the regulation of muscle energy metabolism via its interaction
with M-CK, (Fig 2.2) and other metabolic enzymes such as NADH dehydrogenase
and adenylate kinase, that are considered as potential substrates (Witt et al., 2005).
M-CK is an enzyme that reversibly produces phosphocreatine and ATP (Zhao et al.,
2007; Koyama et al., 2008). When undergoing malnutrition, muscle energy
consumption must be down-regulated, therefore targeting of M-CK by MuRF1 for
degradation can reduce energy consumption by muscle. The assumption that MuRF1
acts as a homeostatic regulator of energy is also based upon the evidence that its
presence is important for maintaining physiological levels of essential amino acids,

34&56)%!-7D=E$,! ! "#!$%&'()!
! ,1!
possibly by targeting muscle proteins for degradation (Koyama et al., 2008). MuRF1
was also shown to interact with several proteins involved in glycogen metabolism
(pyruvate dehydrogenase and its regulator PDK2), and plays a role in the rerouting of
glycogen synthesis (Hirner et al., 2008), further depicting this protein as a regulator
of metabolic functions.
The association of MuRF1 to proteins in the nucleus and at NMJs indicate a
more complex role for this E3 ligase. The interaction with GMEB-1 (transcription
regulator found in the nucleus), and their co-localization in the nuclei of some
myocytes, have suggested that MuRF1 may have a role in muscle gene expression,
raising the possibility that MuRF1 acts as a link between gene expression and
myofibril signalling pathways (McElhinny et al., 2002). It is also hypothesised that
this signalling pathway would also involve the titin kinase domain, as MuRF1 binds
directly upstream from this domain (Fig 2.2) (Centner et al., 2001; Mrosek et al.,
Figure 2.2. Domain organization of MuRF1, representing domains common to the MuRF family of proteins. RING finger (RING), MuRF family conserved region (MFC), B-box domain (Bbox), coiled coil domain (CC), Cos-box motif (COS), and acidic C-terminal tail (AT) are shown. The structure of the RING finger has been predicted from sequence data, the B-box structure (Mrosek et al., 2008), and the CC structure have been elucidated experimentally. In yellow are proposed binding partners for each domain, creatine kinase (CK), and titin. (Figure adapted from Mayans & Labeit, 2009).
! ! ! ! !!" !"#$%&# !M!!" !"# ! ! !"#$
HB*I=*6*'&6*;'!
J*6*'! 3K!

34&56)%!-7D=E$,! ! "#!$%&'()!
! ,2!
2007). Regulation of nicotininc acetylcholine receptor (AChR) turnover by MuRF1,
and its association with Bif-1 at the NMJ (synapses between motor neurons and
muscle fibres) show that this ligase may also connect muscle activity to
endo/lysosomal and atrophy pathways (Rudolf et al., 2012). AChR is the primary
postsynaptic protein of the NMJ, mediating voluntary muscle contraction by
transducing the motorneuronal stimulus into muscle activity. In atrophying muscle
not only do myofibrils undergo degradation and rearrangement, but the NMJs are
also affected, Rudolf and co-workers postulate that these two processes are linked by
the regulation of AChR by MuRF1 during atrophy. The participation of MuRF1 in
the various pathways mentioned illustrate the complexity of the function of this
ligase.
2.1.3.1 MuRF1 and its role in muscle degradation
Bodine and colleagues were the first to identify specific molecules involved
in atrophy-related degradation of skeletal muscle. They used three models of skeletal
muscle atrophy (hindlimb suspension, immobilization, and denervation) to identify
genes that were regulated (periods of 1 to 14 days examined) across all modes of
atrophy, which led them to discover the up regulation of MuRF1 and Muscle
Atrophy F-box (MAFbx), as specific atrogens (Bodine et al., 2001). In two
additional models involving cachectic agents the up regulation of these proteins was
also confirmed. KO mice for both of these atrogens were viable and fertile, and
appeared phenotypically normal. Induction of muscle atrophy to these KO mice via
denervation showed significant muscle sparing at 14 days (56% and 36% for
MAFbx-/- and MuRF1-/- mice, respectively, compared to wild-type (+/+) mice).

34&56)%!-7D=E$,! ! "#!$%&'()!
! ,?!
These results showed that indeed these two atrogens were regulators of muscle
atrophy (Bodine et al., 2001).
To determine the role and importance of this E3 ligase in muscle protein
degradation via the ubiquitin proteosome pathway, various studies have been
performed with MuRF1 KO mice under atrophying conditions (Bodine et al., 2001;
Koyama et al., 2008; Cohen et al., 2009; Labeit et al., 2010). In these studies the
MuRF1 KO mice were shown to be resistant to atrophy induced by denervation, hind
limb suspension, or amino acid deprivation. In all studies, MuRF1 KO mice showed
significantly less loss of muscle mass than WT mice. They also showed that MuRF1
was up regulated during muscle atrophy (Bodine et al., 2001; Koyama et al., 2008;
Cohen et al., 2009; Labeit et al., 2010). In this way, MuRF1 has been identified as
the critical ligase that acts on the cytoskeletal components of the sarcomere in situ
contributing to the disassembly of the myofibril (Mayans & Labeit, 2012)
Further studies involving MuRF1 KO mice that used either amino acid
deprivation (Koyama et al., 2008) or hind-limb suspension (Labeit et al., 2010)
confirmed the previously reported up-regulation of MuRF1, and muscle sparing in
MuRF1-/- mice. The amino acid deprivation atrophy model studied simulated
physiological protein degradation, where skeletal muscle is degraded to provide
amino acids to other organs. In this same study by Koyama and co-workers, they
showed that the B-box domain of MuRF1 is needed for binding to M-CK. It was
shown that MuRF1 down-regulates M-CK activity in vivo during muscle atrophy
caused by malnutrition, by ubiquitinating this enzyme and targetting it for
degradation. GMEB1 and 3-hydroxyisobutyrate dehydrogenase (HIBADH), were
also found to be targeted for degradation by MuRF1 (Koyama et al., 2008). The
hind-limb suspension study showed that the amount of muscle sparing was higher

34&56)%!-7D=E$,! ! "#!$%&'()!
! ,@!
(close to 100%) to figures reported by Bodine et al., but also reported on the role of
MuRF1 in muscle fatigue and twitch potentiation, where MuRF1-KO mice fatigued
considerably faster and had reduced twitch potentiation to that of WT mice (Labeit
et al., 2010), showing that a treatment model where MuRF1 activity is completely
inhibited would not be desirable. A final mouse model study worthy of note here is
one where only the RING domain of MuRF1 was obliterated, allowing the protein to
still interact with any binding partners, but abolishing its ubiquitinating properties.
This RING less MuRF1, was still seen to be up-regulated during atrophy, but muscle
wasting (22% muscle weight loss) was comparable to MuRF1-/- mice (20% muscle
weight loss), while WT mice had a 38% decrease (Cohen et al., 2009). Thus
confirming that the RING domain of MuRF1 is necessary for its role in muscle
degradation. These studies not only confirmed the influence of MuRF1 on muscle
degradation during atrophy but also showed the wider regulatory roles carried out by
MuRF1.
2.1.3.2 The involvement of MuRF1 in regulating cardiac hypertrophy
Whilst the main focus in the previous section has been on the atrophic state of
muscle, here I will focus on the opposite effect - hypertrophy, where there is a shift
towards an increase in muscle mass caused by an increase in myofibrillar protein
synthesis. Pathological cardiac hypertrophy develops as a response to increased
pressure overload, which can be caused by various stimuli such as hypertension,
aortic stenosis, endocrine disorders, and high blood pressure. In response to any of
these stimuli the myocardium can increases its muscle mass (by the addition of
parallel sarcomeres, which increases cell size and heart wall thickness) to

34&56)%!-7D=E$,! ! "#!$%&'()!
! -C!
compensate for the extra pressure load placed on it. As an initial compensatory
action cardiac hypertrophy can be beneficial but when it becomes chronic it is
deleterious and increases the risk of heart failure and sudden death, thus limiting or
reversal of these effects is desirable (Parry et al., 2008; Mason et al., 2009). To this
effect, there have been numerous studies into the molecular pathways involved in
hypertrophy and there are several comprehensive reviews outlining these pathways
(Parry, 1982; O'Shea et al., 1991; Krylov et al., 1994; Gruber & Lupas, 2003; Mason
et al., 2009) , here we will focus on the involvement of MuRF1 and MuRF2 as
hypertrophy preventive agents.
The first instance of cardiac hypertrophy prevention by MuRF1 was seen via
its regulation of protein kinase C-" (PKC") dependant hypertrophic response induced
in ventricular cardiac myocytes (Arya et al., 2004). Regulation of PKC" occurs via
the association of MuRF1 to the receptor for activated protein kinase C (RACK1)
(after RACK1 activation), and most likely a formation of a tertiary complex between
these three proteins is what blocks PKC" tranlsocation to focal adhesions, disrupting
focal adhesion formation (a critical event in the hypertrophic signalling cascade ) and
activation of downstream signalling pathways in phenylephrine and phorbol
myristate acetate induced hypertrophy (Arya et al., 2004). Further investigation of
the influence of MuRF1 and MuRF2 on cardiac hypertrophy lead investigators to
conclude that MuRF1 is involved in regulating the induction of cardiac hypertrophy
(Willis et al., 2007). KO mice models lacking either MuRF1 or MuRF2 were used to
measure hypertrophic response to transaortic constriction (TAC). TAC is a mouse
model for pressure induced cardiac hypertrophy and heart failure. These KO mice
models showed that MuRF2-/- mice had almost no differences to WT mice, but that
MuRF1-/- showed an increased hypertrophic response (Fig 2.3) (Willis et al., 2007).

34&56)%!-7D=E$,! ! "#!$%&'()!
! -,!
A related study carried out by Witt and co-workers (Witt et al., 2008) found
that double knockout (dKO) mice models developed extreme cardiac and milder
skeletal muscle hypertrophy. The dKO lead 74% early postnatal death, most likely
caused by acute heart failure and long term survivors developed 3-4 fold enlarged
hearts and had normal life expectancy and were fertile. They also found that the dKO
mice maintained cardiac hypertrophy and had a 38% increase in quadricep to body
weight (QW/BW) ratios compared to WT mice, whilst single MuRF1 or MuRF2 KO
mice had only a 17% and 11% increase in QW/BW. They also identified 35
myocellular proteins (Witt et al., 2008) that interacted with both MuRF family
members through YTH screens which included sarcomeric proteins, transcription
factors, translation factors, and proteins involved in mitochondrial ATP production,
Figure 2.3. Cardiac hypertrophic response of mice lacking MuRF1 or MuRF2 in response to TAC. MuRF1-/- vs. MuRF1+/+ A) Anterior and B) posterior wall thickness C) individual cardiomyocyte area. MuRF2-/- vs MuRF2+/+ D) Anterior and E) posterior wall thickness, F) individual cardiomyocyte area. Taken and adapted from Willis et al. 2007.

34&56)%!-7D=E$,! ! "#!$%&'()!
! --!
this coupled with the increased hypertrophy observed in dKO mice led them to
conclude that a cooperative control of striated muscle mass and metabolism by
MuRF1 and MuRF2 was possible. In conclusion, the essential role of MuRF1 in
mediating cardiac muscle atrophy has placed it as a possibly useful therapeutic target
to combat pathological cardiac hypertrophy.
2.1.4 Status of MuRF1 Molecular structure
Of the several domains comprised by MuRF1 (Figure 2.1) only the B-box
domain structure has been elucidated to date (Mrosek et al., 2008; in our laboratory)
(Figure 2.4). The B-box motif of MuRF1 belongs to the B-box type 2 (B2) of Zinc-
binding domains which have a !!# structural core, common across other zinc-
binding RING fingers (for e.g. RING, PHD, FYVE, ZZ) (Mrosek et al., 2008). Both
B-box type of domains (B1 and B2) have similar patterns of cysteine and histide
residues, which coordinate the binding of the zinc ions, although in B2 domains the
second cysteine is replaced by a histidine, they also differ in the length of their
consensus sequensce (Reymond et al., 2001; Meroni & Diez-Roux, 2005).
The MuRF1 B2 domain has an #-helix (#1) that packs against a three-
stranded antiparallel !-sheet forming a structural core which supports three loop
regions (Fig 2.4) (Mrosek et al., 2008). Mrosek and co-workers found that this B2
domain binds two zinc-ions and was shown to be dimeric (Fig 2.4) in both
crystalline and solution states (verified by analytical ultracentrifugation and NMR
studies). The dimer of this B2 is formed by the docking of the #1 helix from one
subunit into a concave depression formed by the #1 helix and strand !3 of the other
dimer constituent. This same study found that the "-helical portion of MuRF1

34&56)%!-7D=E$,! ! "#!$%&'()!
! -.!
(residues 166-315 Fig 2.1) was dimeric in solution, in the absence of the B2 domain,
supported by CD and SEC-MALS data, whilst in the presence of the B2 domain
higher oligomeric species were formed. The CD spectrum showed that the "-helical
portion of MuRF1 had a predominantly "-helical composition and SEC-MALS
measurements determined a molecular mass of 32.3kDa, which was in agreement
with the calculated mass of 34.7kDa for a dimer (Mrosek et al., 2008). They
concluded that the B-box domain of MuRF1 was responsible for the assembly of
higher order association of MuRF1, whilst the helical portion was responsible for
dimeric association.
Figure 2.4. Crystallographic structure of the B-box2 dimeric domain of MuRF1. On the left is a cartoon representation of the B-box2 dimer, and on the right is a surface representation of one domain showing the groove formed by the #1 helix and strand !3. !-strands are coloured cyan, #-helix in magenta, and Zn ions are in orange. PDB accession number 3DDT.
L!
L!
3! 3!

34&56)%!-7D=E$,! ! "#!$%&'()!
! -/!
2.1.5 MuRF1 and titin
Among the many cellular targets of MuRF1 is titin. These two proteins are
known to interact on titin’s M-line region, and the binding site on titin corresponds to
the IgA168-IgA169-FnA170 (A168-A170) domains (Centner et al., 2001; Mrosek et al.,
2007). It has been shown (by members of our lab) that MuRF1 interacts with titin’s
A168-A170 domains through its helical region (Mrosek et al., 2007). Structural
studies on the A168-A170 titin construct suggested that the shallow groove present
on the concave side of the crystal structure would accommodate up to 70% of the
predicted coiled coil region of MuRF1 (Fig 2.5). Titin’s A168 domain contains a
unique loop insertion that interacts with MuRF1 constructs containing the central
helical region. The same study also confirmed through ITC data that the titin/MuRF1
interaction was of high affinity, 37nM, and that the "-helical region of MuRF1 was
sufficient for binding. Titin’s A168-A170 domains are located N-terminally to the
titin kinase domain (TK). This interaction leads to a hypothesis that MuRF1 could be
a regulator of the titin kinase domain stated previously by Centner and co-workers
(Centner et al., 2001), through its RING domain, depending on the orientation of
MuRF1 binding onto titin. The opposite situation could also be possible where by
MuRF1 is phosphorylated and thus regulated by titin. Phosphorylation of MuRF1
could activate downstream pathways involved in: gene expression, regulations of
metabolism, or protein turnover. Both MuRF1 and titin are involved in diverse roles
within muscle, and the significance of their interaction is not yet clear.
!
!

34&56)%!-7D=E$,! ! "#!$%&'()!
! -0!
!
!
!
!
!
Figure 2.5. Surface representation of the crystal structure of titin A168-A170 (PDB code 2NZI). Docking of a representative coiled coil (human lamin A coil 2B PDB code 1X8Y) onto the A168-A170 surface to model possible interaction between A168-A170 and MuRF1-CC.
M,1@!
M,1?!
M,2C!

34&56)%!-7D=E$,! ! "#!$%&'()!
! -1!
2.1.6 Coiled-coil motifs
To date, no structural data have been obtained on the helical domain of
MuRF1. This domain is the most divergent part across MuRF proteins and, thus, the
most likely candidate to underlie their functional differences (Fig 2.1).
It is thought that MuRF1 helical domain folds into a coiled-coil motif. CC
motifs are simple folds consisting of two to five amphipathic helices (although larger
structures exist) that wind around each other to form a supercoil. The sequences of
the integrating helices are often biased in composition and contain repeats of seven-
(heptad), eleven- (hendecad), or fifteen-residues (pentadecad), which determine the
handedness of the CC. The periodicity of these repeats, such as 7/2 (7 residues over 2
helical turns) gives rise to the number of residues per turn, in this case 3.5 residues
per turn. Hendecad (11/3) and pentadecad (15/4) repeats give the supercoil structure
a right-handed twist due to the increase in number of residues per turn, 3.67 and
3.75, respectively; in contrast, heptad repeats give the super coil a left-handed twist
as the number of residues per turn is lowered to 3.5 (Lupas & Gruber, 2005; Parry et
al., 2008). Left-handed CCs characterised by heptad repeats are most common and
each residue making up the repeat is assigned a position (a-g,) in the registry of the
helix. Hydrophobic resides (usually Leu, Val, Ile, Met, Phe, Ala, Tyr) are found in
positions a and d, and form the hydrophobic interface of each helix, whereas charged
residues (such as Lys, Arg, Glu, Gln) are found at positions e and g forming
interchain electrostatic interactions (Fig 2.6) contributing to specificity and
orientation (parallel vs. antiparallel, homo vs. hetero oligomerization) as well as
definition of the registry (Parry, 1982; Monera et al., 1996; Arndt et al., 2000;
Burkhard et al., 2001; Arndt et al., 2002; Lupas & Gruber, 2005; Parry et al., 2008).

34&56)%!-7D=E$,! ! "#!$%&'()!
! -2!
The hydrophobic residues in positions a and d form the hydrophobic interface (Fig
2.6) of each helix and pack in a knobs-into-holes manner where one residue packs
into space surrounded by the 4 side chains of the facing helix (Crick, 1953; Walshaw
& Woolfson, 2003). Variations in packing of the hydrophobic core and
oligomerization states seem to be dependent on nature and type of residue present in
the a and d positions of the heptad repeat, as shown for e.g. by Harbury et al., where
they mutated the residues in these positions causing a switch between two, three, and
four stranded CCs (Harbury et al., 1993).
There are many CC structures which deviate from the canonical CC first
described by Crick in 1953, these structures are quite common now, and it is normal
to come across a structure that deviates in some way. Many of these non-canonical
CCs contain discontinuities caused by the insertion of one or more residues into the
Figure 2.6. The GCN4 Leucine zipper, a canonical coiled-coil. a) sequence of the GCN4 leucine zipper. b) helical wheel representation of protein sequence, electrostatic interactions shown with dashed line (DrawCoil 1.0 http://www.grigoryanlab.org/drawcoil/). c) core and lateral view of the GCN4 structure. Residues in positions a and d are shown in red, pdb entry 2ZTA. !
&A!
BA! >A!

34&56)%!-7D=E$,! ! "#!$%&'()!
! -?!
heptad pattern and are termed skips (1 residue insertion), stammers (3 residue
insertion), and stutters (4 residue insertion), and cause a change in the apolar
separation of continuous heptad repeats (Table 2.1). These discontinuities in the
heptad repeat cause breaks or kinks (in the case of skips) or changes in the packing
geometry of the core and thus change the degree of supercoiling causing the pitch
(distance required to complete a full turn of the CC) to vary from the ideal of ~140-
150Å for a dimer and ~200Å for a tetramer. In most cases the discontinuities
mentioned are not isolated cases, but occur 2 or more times along the CC (Seo &
Cohen, 1993; Brown et al., 1996; Strelkov & Burkhard, 2002; Lupas & Gruber,
2005).
Table 2.1 Common discontinuities among apolar residue separation in coiled-coil heptad repeat patters Continuous heptad 3-4-3-4-3-4 Skip 3-4-(3+1)-4-3-4/
3-4-3-(4-1)-3-4 1 residue insertion
Stammer 3-4-3-3-4 3 residue insertion Stutter 3-4-3-4-4-3 4 residue insertion
CC motifs are amongst the most ubiquitous folds found in proteins, where
they have roles in mediating self- and hetero-association, folding and molecular
recognition. The importance of CC folds is further enhanced by the fact that, through
the design of synthetic sequences, their properties are exploited in the development
of self-assembled and bioactive polymeric materials.

34&56)%!-7D=E$,! ! "#!$%&'()!
! -@!
2.2 Aims
The aim of this study is to gain a structural understanding of the coiled-coil
domain of MuRF1, which plays a pivotal role in its binding of the titin A168-A170
domains and contributes to the determination of the molecular mechanism of this
interaction. With this interaction in mind the structure produced from this domain
would contribute to the design of specific inhibitors aimed to abolish its targeting of
the titin cytoskeleton. This domain is also involved in the formation of homo-dimers,
and perhaps higher oligomerization states of MuRF1, and would be the first
elucidation of a coiled-coil domain of a TRIM/RBCC protein.

34&56)%!-7D=E$,! ! "#!$%&'()!
! .C!
2.3 Materials and Methods
2.3.1 Sequence analyses of MuRF proteins
MuRF sequences were obtained from the uniprotKB database (see Table 2.2
for sequence codes), only sequences with evidence at protein or transcription level
were utilized. Sequences were aligned using Clustalw2 (Larkin et al., 2007; Goujon
et al., 2010) with BLOSUM matrix.
Table 2.2 MuRF sequences and accession numbers for uniprotKB database MuRF1 (TRIM63, IRF, RNF28, SMRZ)
Homo sapiens (Human) Q969Q1 Mus musculus (mouse) Q38HM4 Rattus norvegicus (Rat) Q91Z63
MuRF2 (TRIM55, RNF29)
Homo sapiens (Human) Q9BYV6 Rattus norvegicus (Rat) Q5PQN5
MuRF3 (TRIM54, RNF30)
Homo sapiens (Human) Q9BYV2 Mus musculus (mouse) Q9ERP3 Rattus norvegicus (Rat) Q5XIH6 Bos Taurus (Bovine) Q58D15 Pongo abelii (Orangutan) Q5REJ9
In brackets alternative names are given.
Secondary structure prediction of the helical region of MuRF1/2/3 used the
program Jpred 3 (Cole et al., 2008).The probability for coiled-coil formation was
calculated using MultiCoil (Wolf et al., 1997) using a sequence window size of 28
residues and a coiled-coil probability cutoff of 0.5.

34&56)%!-7D=E$,! ! "#!$%&'()!
! .,!
2.3.2 Cloning
MuRF1-CC (uni-prot Q969Q1, residues 214-271, Fig 2.7) was amplified
with Phusion High-Fidelity DNA Polymerase (NEB) with the following primer pair:
MuRF1-CC forward primer CATGC CATGGACACGTTGTATGC
MuRF1-CC reverse primer AGTGGTACCTTACCCAGGCTC GTCCAG
PCR products were inserted into the pETM-11 expression vector via NcoI
and KpnI restriction sites (in bold above). The vector pETM-11 includes an N-
terminal His6-tag and a TEV (tobacco etch virus) protease cleavage site prior to the
inserted sequence. All constructs were verified by sequencing (Geneservice)
MuRF1-B2HD (uni-prot Q969Q1, residues 117-327 Fig. 2.7) was cloned into
the vector pETM-11 by previous members of the laboratory, and contained a C298S
mutation designed to prevent unspecific aggregation of the samples due to oxidation
during storage.
Figure 2.7 Declaration of MuRF1 constructs used in this study. !

34&56)%!-7D=E$,! ! "#!$%&'()!
! .-!
2.3.3 Protein expression and purification
MuRF1-CC was overexpressed in Escherichia coli (E. coli) Rosetta 2 (DE3)
(Novagen) cells. Cultures were grown at 30°C up to an OD600 of 0.6 in Luria Bertani
medium supplemented with 20µg/mL chloramphenicol and 30µg/mL kanamycin.
Expression was induced by addition of isopropyl-!-D-thiogalactopyranoside (IPTG)
to a final concentration of 0.75mM. Cultures were grown at 20°C for a further 20
hours post-induction. Cells were harvested by centrifugation at 6000rpm (6640.92g)
for 15 minutes at 4°C. Bacterial cell pellet was resuspended in 20mL lysis buffer
(50mM Tris-HCl pH 8.0, 50mM NaCl, 0.5mM 2-mercaptoethanol (!-ME))
containing a protease inhibitor cocktail (Roche). Lysis was carried out by French
pressing at 1000 PSIG in the presence of DNAse. The homogenate was clarified by
centrifugation at 18000rpm (41656.68g) for 45 minutes at 4°C. The supernatant was
applied to a Ni2+-chelating His trap column (GE Healthcare) equilibrated in lysis
buffer containing 20mM imidazol and eluted using 200mM imidazol. The eluate was
dialyzed against 50mM Tris-HCl pH 8.0, 50mM NaCl, 0.5mM !-ME in the presence
of His-tagged TEV protease at 4°C overnight. The protein was then subjected to
subtractive affinity chromatography prior to gel filtration on a Superdex 75 16/60
prep grade hi-load column (GE Healthcare) in lysis buffer. The resulting sample was
homogeneously pure according to SDS-PAGE (Fig 2.9). Samples were then
concentrated to 14mg/mL and stored at 4°C until further use.
MuRF1-B2HD overexpression and purification was carried out in the same
manner as MuRF1-CC, but using 50mM Tris-HCl pH 8.0, 300mM NaCl 2mM !-ME
as a lysis buffer. Size exclusion chromatography utilized a Superdex 200 16/60 prep

34&56)%!-7D=E$,! ! "#!$%&'()!
! ..!
grade hi-load column (GE Healthcare) in 50mM Tris-HCl pH 8.0, 100mM NaCl.
Purified samples were then stored at 4°C until further use.
Ion exchange chromatography was carried out on a 1mL MonoQ 5 50 GL
column (GE Healthcare). Sample was dialysed overnight in Buffer A (50mM Tris-
HCl 50mM NaCl pH 8.0) prior to loading onto the column. To elute the sample a salt
gradient ranging from 50mM NaCl to 500mM NaCl over 20 column volumes was
used.
2.3.4 Size Exclusion Chromatography coupled to Multiangle Laser Light
Scattering (SEC-MALLS)
SEC-MALLS measurements were carried out at the Wellcome Trust Centre
for Cell-Matrix Research at the University of Manchester with the assistance of
Marjorie Howard. For this, 1mL of purified MuRF1-CC at a concentration of
1.5mg/mL was applied to a Superdex 75 10/300GL gel filtration column (GE
Healthcare) running at a flow rate of 0.75mL/min in a buffer containing 20mM Tris-
HCl pH 8.0, 50mM NaCl. Samples eluting from the column passed through an in-
line DAWN HELEOS-II (Wyatt) laser photometer (laser wavelength 658 nm) and an
Optilab rEX refractometer (Wyatt) with a QELS dynamic light scattering attachment.
Light scattering intensity and eluate refractive index (concentration) were analysed
using ASTRA v5.3.4.13 software (Wyatt technologies) to give a weight-averaged
molecular mass (MW). A specific refractive index increment (dn/dc) value of
0.180mL/g was used. To determine the detector delay volumes and normalization
coefficients for the MALS detector, a BSA sample (Sigma A-8531) was used as
reference.

34&56)%!-7D=E$,! ! "#!$%&'()!
! ./!
The MuRF1-B2HD sample was subject to the same experimental conditions
and equipment as above, except pure protein was concentrated to 0.7mg/mL and
injected into a Superdex 200 10/300 GL gel filtration column (GE Healthcare), and
the buffer used was 20mM Tris-HCl pH 8.0 100mM NaCl.
2.3.5 Small Angle X-ray scattering
SAXS data were collected on the EMBL beamline X33 (DESY, Hamburg)
using a photon counting Pilatus 1M detector (DECTRIS, Switzerland). MuRF1-CC
samples were measured at solute concentrations of 2.2, 2.4, 2.7 and 4.4mg/mL. The
scattering intensity I in the range of momentum transfer 0.01 < s < 0.45 Å-1 was
recorded (s = 4# sin$/%, where % = 1.5Å is the X-ray wavelength and 2$ is the
scattering angle) at a sample-detector distance of 2.7m. Radiation damage, monitored
by repetitive 15 sec exposures, was negligible. Background scattering was subtracted
and data reduced, normalized and extrapolated to infinite dilution using PRIMUS
(Konarev et al., 2003). Also in PRIMUS, the forward scattering I(0) and the radius of
gyration (Rg) were evaluated using the Guinier approximation (Guinier, 1939), which at
small scattering angles (s<1.3/Rg) assumes the intensity is represented as I(s) = I(0)
exp(-(sRg)2/3). Therefor Rg = $-3m, where m is the gradient of the linear part of the
Guinier plot (utilized to determine monodispersity of the sample) (Svergun & Koch,
2003). These parameters were also computed from the entire scattering patterns using
the indirect transform package GNOM (Svergun, 1992), providing also the pair
distribution function of the particle p(r) and the maximum size Dmax. The molecular
mass (MM) was estimated from I(0) by normalization against reference solutions of
bovine serum albumin.

34&56)%!-7D=E$,! ! "#!$%&'()!
! .0!
The scattering patterns and form factor files of the crystallographic model, and
oligomeric variants, were calculated using CRYSOL (Svergun et al., 1995). SASREF
(Petoukhov & Svergun, 2005) was employed to calculate a dimeric variant model of
MuRF1-CC by rigid body refinement of individual domain components against SAXS
data. To examine the probability of a multicomponent mixture and their respective
volume fractions the program OLIGOMER (ATSAS Software Suite) was utilized. The
program suite EOM (Ensemble Optimisation Method) (Bernado et al., 2007) was used
to generate and select an ensemble of models used to interpret the experimental SAXS
data of MuRF1-CC.
2.3.6 Crystallization of MuRF1-CC
Crystallization screening of MuRF1-CC was carried out at 22°C on 96-well
MRC crystallization plates (Molecular Dimensions Ltd.) The sitting drop, vapour
diffusion strategy was implemented, with reservoirs containing 70µL of
crystallization solution and drops consisting of a 1:1 protein:reservoir solution ratio
at a final volume of 2µL. Protein concentration used for crystallization was
approximately 14mg/mL, calculated using a BCA protein assay (BCA Assay Kit
Catalogue Number 23227, Thermo Scientific) (Smith et al., 1985). MuRF1-CC was
screened against 288 different chemical conditions using three different commercial
crystallization matrices: Hampton Crystal I and II (Hampton Research); Wizard I and
II (Emerald Biosystems); CRYO I and II (Emerald Biosystems).
Initial optimization of MuRF1-CC was carried out using the same plates and
methodology mentioned above. It was subsequently necessary (for reasons described
in Results) to implement a hanging drop vapour diffusion strategy. For this, 48-well

34&56)%!-7D=E$,! ! "#!$%&'()!
! .1!
VDX plates (Hampton Research) and siliconized glass cover slides (12 mm in
diameter, with 0.22 mm thickness, Hampton Research) were used with reservoirs
containing 150µL of crystallization solution and drops consisting of a 1:1
protein:reservoir solution ratio at a final volume of 2 or 4µL.
2.3.7 Electron Microscopy (EM)
Aliquots (5µL) of MuRF1 B2HD samples were adsorbed (1 minute) onto
glow-discharged carbon-coated copper grids and negatively stained with 2% (w/v)
uranyl acetate. Visualization used a Hitachi H-7000 transmission electron
microscope (Hitachi, Ltd, Tokyo, Japan). EM experiments and analyses of images
were carried out by Dr. Mohamed Chami (Biozentrum, University of Basel).
2.3.8 Ab initio modelling
Fragment assembly-based ab initio modelling was done with ROSETTA
using default parameters (Abinitio protocol) to produce 1000 models of MuRF1-CC-
COS (Simons et al., 1997; Shortle et al., 1998; Simons et al., 1999; Bonneau et al.,
2002). This was done both with and without specifying that residues 214-271 must
adopt the experimentally visualised helical structure (flag fix_residues_to_).
Residues 214-327 were submitted also to the Quark ab initio modelling server (Xu &
Zhang, 2012) as well as the full-length sequence of the MuRF helical domain.
Comparisons between predictions, structure alignments and presentation as figures
were done with PyMOL (http://pymol.org). The work carried out using ROSETTA
was done by Dr. Jaclyn Bibby (University of Liverpool).

34&56)%!-7D=E$,! ! "#!$%&'()!
! .2!
2.4 Results
2.4.1 Determination of the coiled-coil formation propensity of the helical
domain of MuRFs
To estimate the associative properties of the helical domain of MuRF proteins
and identify the responsible sequence segments, we predicted their potential for
coiled-coil formation. An initial prediction of sequence conservation and secondary
structure content (Fig 2.8b-c), indicated that the domain has a consistently high
tendency to adopt an "-helical structure, but that only the N-terminal 2/3 fraction is
likely to form an uninterrupted helix. The C-terminal 1/3 fraction is predicted to
contain two short helices linked by loops. This region spans the conserved sequence
motif of the COS-box (Short & Cox, 2006; Sardiello et al., 2008). The secondary
structure prediction is consistent with a previous study that estimated the structural
content of this segment of MuRF1 to be 70% "-helical and 30% random coil based
on CD data(Mrosek et al., 2007). Next, predictors indicated that only the central 1/3
segment of this helical domain has tendency to CC formation. The prediction was
consistent for all three MuRF proteins, although MuRF2 had the shortest predicted
CC-segment as a result of the presence of bulky residues (M227 and F266) in core
heptad positions a and d (Fig 2.8b,d). Such bulky groups are poorly accommodated
in the limited interface of coiling "-helices (Walshaw & Woolfson, 2001).
Nonetheless, the tendency for CC formation appeared modest for all MuRFs as
reflected by the low probability scores (Fig 2.8d). These, in addition, could not
resolve a preference for dimeric or trimeric association as both states yielded
comparably low values, at exception of MuRF3 where a trimeric association was

34&56)%!-7D=E$,! ! "#!$%&'()!
! .?!
favoured. Yet, previous studies that used SEC-MALS and ultracentrifugation to
resolve the oligomeric state of the helical domain of MuRF1 showed it to form
dimers (Mrosek et al., 2007; Mrosek et al., 2008). In the light of these data, the
predictions led us to anticipate that the CC-prone, central 1/3 fraction of the helical
domain of MuRFs must be a main determinant of their molecular assembly -
possibly by forming dimeric CC motifs.
Figure 2.8. Sequence analysis of the helical domain of MuRFs a) Domain structure of MuRF1, where domain boundaries indicated. MFC refers to a MuRF family specific motif, and AT denotes the C-terminal acidic tail. The potential coiled coil (CC) and COS-box (COS) domains are shaded in grey and labeled; b) Sequence alignment of the helical domains of all known MuRF sequences (MuRF11-324, MuRF21-326, MuRF31-328; h=human, m=mouse, r=rat, b=bovine, p=orangutan). The colour code reflects sequence conservation as identity percentage: dark blue >80%, light blue >60%, light grey >40%, white <=40%; c) Secondary structure prediction of human MuRFs, where MuRF1 is in grey, MuRF2 in cyan and MuRF3 in red. Cylinders are used to indicate helical segments; d) Prediction of coiled-coil regions in human MuRFs, (colour code as above). The total probability for CC formation is shown as a solid line, with the probability for dimeric CC assembly indicated by a dashed line. Marked in orange is the section identified here as to constitute the coiled-coil core segment of MuRF proteins. Prediction were calculate with MultiCoil (Wolf et al., 1997) using a sequence window size of 28.

!"
!#$"
!#%"
!#&"
!#'"
("
)"*" +"," -" ,"." /"0"1".")" -" )" +" *" ," 2" ," ," +" *" +" )" )"+" *"," ,"-" 3" ," *","."+" -")" +"4" 5" ,"
4678
98:;:<="
1>?:@A>?"
!"# $%# &&"# &'&#
()*+&#
()*+"#()*+!#
&''# !&,# !$&#
-.#
/.#
0.#
1.#
"!,#
5B"C>;:D9;"EFE7G"H2I"/" I"
&# !"# &&"#&&$# &'&# &''# "!2#$%# "3"#
1-/J" 44# 456#

34&56)%!-7D=E$,! ! "#!$%&'()!
! /C!
2.4.2 Production of recombinant MuRF1-CC and MuRF1-B2HD
Subsequently, we explored the properties of the predicted assembly region of
MuRF1 experimentally. MuRF1-CC and MuRF1-B2HD were both overexpressed in
E.coli in soluble form and purified to a high homogeneity using chromatographic
approaches with final yields ranging between 10-15mg/L of bacterial culture.
MuRF1-CC elutes from the gel filtration column at 63.3mL (Fig. 2.9), this
would correspond to a protein larger than 25kDa, which would indicate at least a
tetramer of this molecule, as a monomer has a molecular weight of 7kDa. The large
apparent molecular weight may simply reflect the anisometric shape of the MuRF1-
CC molecule, which would allow it to travel through the bed of the column faster
than a globular protein of the same molecular weight.
Figure 2.9. Size exclusion chromatography of MuRF1-CC on a Superdex 75 (16/60 PG) column. The column void volume (Vo) and the exclusion volume (Ve) of MuRF1-CC are indicated. Black diamonds indicate elution volumes of four standard proteins. The red box outlines pure fractions according to SDS-PAGE (inset) that were utilized for crystallization. High molecular weight bands seen at the top of the gel correspond to proteins stuck at the stacking gel-resolving gel interface, and did not migrate.
!

34&56)%!-7D=E$,! ! "#!$%&'()!
! /,!
MuRF1-B2HD does not elute in a single peak on the gel filtration column,
and the definition and height of peaks from various oligomeric states is not
consistent between productions. SDS-gel shows that samples obtained from the 3
main peaks in Fig 2.10 correspond to MuRF1-B2HD (Fig 2.11). The elution
volumes seen in Fig. 2.10 would correspond to proteins ranging in the size of
160kDa to ~700kDa. As a monomer of this construct would have a molecular weight
of 24kDa, this apparent Mr would correspond to oligomers containing 6-30
molecules each. In an attempt to better resolve the various species, all corresponding
to MuRF1-B2HD, ion exchange chromatography was carried out on a 1mL MonoQ
5 50 GL (GE Healthcare), but this method proved unreliable and was abandoned.
Figure 2.10. Size exclusion chromatography of MuRF1-B2HD on a Superdex 200 (16/60 PG) column. The column void volume (Vo) and the exclusion volume (Ve) of MuRF1- B2HD are indicated. Black diamonds indicate elution volumes of five standard proteins. Red box denotes sample seen in Fig 2.11.
Thyroglobulin 669 kDa
Catalase 232 kDa
Ferritin 440kDa Aldolase 158 kDa
Albumin 67 kDa
N)!O!01#1-!
N)!O!12#0,!
N)!O!21#.C!
NC!O!/2#?-!

34&56)%!-7D=E$,! ! "#!$%&'()!
! /-!
2.4.3 MuRF1-CC crystallization
As stated in section 2.3.6, a screening of MuRF1-CC was carried out against
288 different conditions, out of which nine hits were identified (Table 2.3). Initial
crystal optimization efforts concentrated on PEG based conditions, where pH, PEG
type and concentration ranges were varied. However, this did not yield single
crystals. An MPD based condition containing 35% MPD, 0.1M sodium acetate
(NaOAc) pH 4.5, 10% [v/v] glycerol (CRYO II - condition 44) that had yielded
spherulites and clustered needles was also refined by varying MPD and glycerol
concentrations. The MPD condition optimization was successful in producing single,
diffraction quality crystals.
-2!!
11#/!!
00!!
,/!!
(P&!!
@2#-!!
./#1!!
Figure 2.11. SDS-PAGE of MuRF1-B2HD samples obtained from size exclusion chromatography. Samples shown are taken from boxed area of Fig 2.10. Molecular weight marker is shown at the side (Broad-Range 2-212kDa, NEB).

34&56)%!-7D=E$,! ! "#!$%&'()!
! /.!
Table 2.3. Initial crystallization hits obtained for MuRF1-CC. Condition 9 (in bold) led to crystals suitable for data collection. Condition Mother liquor Crystal Morphology 1. CSII-22 12% PEG 20000, 0.1M MES pH 6.5 rosettes 2. CSII-35 70% MPD, 0.1M Hepes, pH 7.5 quadrilateral plates
(clustered) 3. CSII-37 10% PEG 8000, 0.1M Hepes, pH 7.5,
8% Ethylene Glycol rosettes
4. CSII-38 20% PEG 10000, 0.1M Hepes, pH 7.5 rosettes 5. CSII-45 20% PEG MME 550, 0.1M Bicine, pH 9.0,
0.01M NaCl spherulites
6. CSII-46 2.0 M MgCl2, 0.1M Bicine, pH 9.0, spherulites 7. WizI-29 10% PEG 8000, 0.1M CHES, pH 9.5,
0.2 M NaCl spherulites
8. WizII-37 20% PEG 8000, 0.1M Hepes pH 7.5 rosettes 9. CRYOII-44 35% MPD, 0.1M Sodium acetate, pH 4.5,
10% glycerol spherulites and clustered needles
CS: Crystal Screen (Hampton Research); Wiz: Wizard Screen (Emerald Biosystems); CRYO: CRYO Screen (Emerald Biosystems).
MuRF1-CC single crystals were obtained from a solution containing 38%
MPD, 0.1M NaOAc pH 4.5, 15% [v/v] glycerol, using the sitting drop vapour
diffusion method, with protein concentrations of approximately 14mg/mL. Crystals
grew in the habit of needles or rods (space group P212121) with maximal dimensions
of 500x20x20µm3 (Fig. 2.12). Although good quality diffraction data at 2.35Å
resolution was collected from this morphology, a problem with reproducibility of the
crystals occurred when more crystals were needed for experimental phasing. The
lack of reproducibility was suspected to be caused by unidentified variations between
protein batches. New optimizations varying MPD and glycerol concentrations were
designed, that did not yield needles again, but instead a new crystal morphology was
observed resembling prolate spheroids (Fig. 2.12b). Visual inspection with polarized
light showed that the prolate spheroids suffered from multiple growths and were not
suitable for diffraction experiments (confirmed by diffraction tests). Seeding, a
technique used to improve crystal morphology, was attempted but did not improve
the multiplicity of the crystals. The prolate spheroids with lowest visible multiplicity
grew from 35% MPD, 0.1M NaOAc pH 4.5, 12% [v/v] glycerol condition chosen for

34&56)%!-7D=E$,! ! "#!$%&'()!
! //!
an additive screening with the Hampton Additive Screen (Hampton Research),
containing 96 unique reagents. To carry out the additive screen larger drops had to
be used, thus the crystallization format was changed to the hanging drop vapour
diffusion method, using VDX 48-well plates (Hampton Research). Reservoirs
contained 150µL mother liquor, with drops containing 2µL reservoir solution, 2µL
protein, and 0.4µL additive. The additive screen yielded an improvement in the
prolate spheroid crystals obtained, as well as a new thin plate morphology in rosette
formation, not previously observed, and the reappearance of needles.
Three additives: tris(2-carboxyethyl) phosphine hydrochloride (TCEP),
sodium fluoride (NaF), and benzamidine hydrochloride were chosen to be optimised,
by varying concentrations, to reproduce the different crystal morphologies. With the
addition of 10-16mM TCEP (a reducing agent) to mother liquor it was possible to re-
grow needles (Fig 2.12a) (space group P212121) of similar size to those achieved
originally. Varying concentrations of NaF 20-50mM resulted in crystals growing in
the habit of thin plates (space group P21) with measurable dimension in the plane of
the plate of 400x100µm (Fig 2.12d). In conditions containing NaF, co-growth of
small rod-like NaF crystals was also observed, confirmed to be of inorganic origin
using diffraction tests. It was not possible to reproduce the improvement of prolate
spheroids seen with benzamidine hydrochloride.

34&56)%!-7D=E$,! ! "#!$%&'()!
! /0!
Figure 2.12. MuRF1-CC crystal morphologies. a) needles, first morphology observed (grown in 38% MPD, 0.1M NAOAc pH 4.5, 15% glycerol), and regrown with TCEP 2-16mM additive; b) prolate spheroids, second morphology observed; c) bipyramids (grown in 32-35% MPD, 0.1M NaAc pH 4.5, 20-26% glycerol, refined from prolate spheroids (b); d) clusters of thin plates, obtained by addition of NaF (grown in 35% MPD 0.1M NaOAc pH 4.5, 20%glycerol, 20mM NaF (co-growth of NaF crystals can be observed, red circle). !
SU!! .U!J>"7"7!V!J>;7"7!!!;#;W!
*U!J7"!!!7#"W!
(U!J7"7"7"!!!7#;AW!
!"#$%%$

34&56)%!-7D=E$,! ! "#!$%&'()!
! /1!
A control plate with varying MPD and glycerol was also set up in order to
verify that crystal growth did occur in the hanging drop plates in the absence of
additives, surprisingly the change in format also resulted in single crystals growing
in the habit of bipyramids (Fig. 2.12c). These bipyramidal crystals (apparent space
group P41212/P43212), with dimensions 50x40x40µm3, grew in solutions containing
32-35% MPD, 0.1M NaOAc pH 4.5, 20-26% [v/v] glycerol. These crystals grew to
full size in 1 week and visibly deteriorated and dissolved after ~4 weeks.
2.4.4 Collection and processing of native diffraction data
In all cases, crystals used for diffraction data collection were flash frozen in
liquid nitrogen using mother liquor as cryo-protectant. Data processing and reduction
used the XDS/XSCALE package (Kabsch, 2010). Diffraction data statistics for all
crystal forms are listed in Table 2.4.
2.4.4.1 MuRF1-CC needle morphology
The best diffraction data set for this morphology was collected at 100K at
beamline MX-14.1 BESSY II (Berlin), which is equipped with a marCCD-225
detector. Four data wedges were collected in a series of non-overlapping 1°
oscillations for a total range of 180° (data was processed to 2.35Å resolution).
Because of extensive radiation damage the crystal had to be repositioned between
wedges by translating along the crystal axis, exposing a fresh region of the crystal to
the beam each time (Fig 2.13). MuRF1-CC needles were identified as Porthorombic

34&56)%!-7D=E$,! ! "#!$%&'()!
! /2!
(point group P222) with unit cell dimensions a=23.76Å, b=68.70Å, c=140.65Å. Fig
2.14 shows a diffraction image of this morphology.
Figure 2.13. MuRF1-CC needle crystal mounted on a nylon loop. Red circle shows the position of the irradiating beam, approximately 70µm in diameter. !

34&56)%!-7D=E$,! ! "#!$%&'()!
! /?!
2.4.4.2 MuRF1-CC plate morphology
Native x-ray diffraction data was collected at the undulator beamline I03 in
Diamond (Oxford) at 100K. Data was collected in a series of non-overlapping, 1°
oscillations for a total range of 190° and processed to 2.1Å resolution. This is the
highest resolution data obtained to date from crystals of this construct. The thin
plates belong to the Pmonoclinic crystal system (point group P2) and have unit cell
Figure 2.14. Diffraction image for MuRF1-CC needle morphology. Data was collected to a maximum of 2.2Å resolution.

34&56)%!-7D=E$,! ! "#!$%&'()!
! /@!
dimensions of a=70.79Å, b=24.41Å, c=75.39Å, !=107.65°. Fig 2.15 shows a
diffraction image of this morphology.
2.4.4.3 MuRF1-CC bipyramidal morphology
The native diffraction data for this morphology was collected at beamline I03
in Diamond (Oxford) at 100K. The highest resolution data obtained were processed
to 3.3Å resolution, and was collected in a series of non-overlapping, 0.5° oscillations
for a total range of 180°. MuRF1-CC bipyramids were found to have a tetragonal
Figure 2.15. Diffraction image of MuRF1-CC blade morphology. Data was collected to a maximum of 1.8Å resolution.

34&56)%!-7D=E$,! ! "#!$%&'()!
! 0C!
crystal lattice (point group P422). A second set of diffraction data was collected from
a (Ta6Br12)2+ derivatized crystal, which was processed to 2.5Å resolution with unit
cell dimensions a=b=36.76Å, c=378.20Å. As this is the highest resolution obtained
for this crystal morphology, and bound heavy atom could not be detected, it was used
as the reference data set for this crystal morphology. It should be noted that the very
long c axis of this crystal form makes data collection challenging by causing
reflections to overlap (Fig. 2.16). Thus, successful data collection in this case
requires a small and highly collimated X-ray beam of high brightness, as that
produced by undulator insertion devices at synchrotron sources.

34&56)%!-7D=E$,! ! "#!$%&'()!
! 0,!
(U!
Figure 2.16. Diffraction image for MuRF1-CC bipyramidal morphology, where the long c axis (~376Å) can be seen. a) full diffraction image, b) depicts red boxed area of a.
SU!

! !
!
Table 2.4. Diffraction data statistics for MuRF1-CC crystal morphologies. Unit Cells were considered as being independent upon analyses with the phenix.explore_metric_symmetry program (PHENIX Adams et al., 2010). Crystal morphology Needle Plate Bipyramidal
Native Native (Ta6Br)2+ derivative Reference Set Peak Edge Remote Space group P 212121 P 21 P41212/P43 212 Unit cell dimensions
a= 23.76Å b= 68.70Å c = 140.65Å
a= 70.79Å b= 24.41Å c= 75.39Å !=107.65°
a= b= 36.76Å c= 378.20Å
a= b= 37.582Å c= 376.393Å
beamline MX 14.1 (BESSY) I03 (Diamond) I03 (Diamond) I03 (Diamond) I03 (Diamond) I03 (Diamond) Detector mar ccd 225 ADSC Q315r ADSC Q315r ADSC Q315r ADSC Q315r ADSC Q315r Wavelength (Å) 0.9184 0.9700 0.9763 1.2552 1.2559 1.0163 Resolution (Å) 15-2.35(2.4-2.35) 20-2.1(2.15-2.1) 20-2.5(2.6-2.5) 20-3.6(3.8-3.6) 20-3.8(4.1-3.8) 20-4.0(4.4-4.0)
No. of unique reflections
10041 (567) 14626(1008) 17034(1931) 5937(928) 4987(1010) 4332(1088)
Rsym(I) 7.5 (51.3) 2.7 (45.0) 4.4(51) 4.6(41.7) 5.8(47.3) 9.2(49.7) Multiplicity 4.51 (4.66) 3.64 (3.74) 3.73(3.77) 4.12(4.24) 4.14(4.14) 4.14(4.09) Completeness (%) 97.2 (91.3) 97.7 (99.3) 99.5(99.8) 99.2(99.9) 99.2(99.8) 99.2(99.8) I/s(I) 12 (3.11) 17.24 (3.31) 17.54(3.2) 14.21(3.47) 11.014(3.32) 7.89(3.13)
Friedel pairs are treated as separate reflections for the derivative data.
52
Chapter 2-M
uRF1
B
. Franke

!"#$%&'()*+,-./( ( 01(.'#23&(
45(
2.4.5 Crystal lattice characterization
2.4.5.1 MuRF1-CC needle
The analysis of the pattern of systematic absences (reflection conditions 2n,
0, 0; 0, 2n, 0; 0, 0, 2n) present along each crystallographic axis for the MuRF1-CC
needle crystal lattice indicated the space group to be P212121. Calculation of the
Matthews coefficient (Matthews, 1968) (Table 2.5) suggested the presence of two
(VM=4.26, one biological dimer) to four (VM=2.16, two biological dimers) molecules
per asymmetric unit, corresponding to a crystal solvent content of approx. 71% or
42%, respectively.
To detect non-crystallographic symmetry (NCS) a self-rotation function was
calculated, using the program POLARRFN (CCP4 program suite; Bailey, 1994;
Winn et al., 2011), between a resolution range of 15-3.5Å using a radius of
integration of 20Å. Only peaks corresponding to the crystallographic symmetry
were found (Figure 2.17). A native Patterson map was then calculated using FFT
CCP4 program suite (Bailey, 1994; Winn et al., 2011), where an off origin peak
(height approximately 20-25% that of the Patterson origin peak) is visible (Figure
2.18), indicating the presence of translational NCS in this crystal form. In this case,
the 2-fold NCS axis is parallel to the 2-fold crystallographic axis along c and defined
by the translation vector 0, 0.5, 0.007 (Tx, Ty and Tz given in fractional unit cell
dimensions and as calculated using phenix.xtriage (Adams et al., 2010). This
constitutes an A2 pseudo-centered symmetry. The space group assignment of
P212121 was validated at a later stage by MR using as search model the structure of
MuRF1-CC from the P21 crystal form.

!"#$%&'()*+,-./( ( 01(.'#23&(
46(
Table 2.5. Calculation of the Matthews coefficient for all morphologies of MuRF1-CC. In bold are the most likely copy number and solvent content of the asymmetric unit for each morphology. It is possible that there are more or less molecules in the asymmetric unit, as can be seen from the table. Matthews coefficient calculations were carried out with the matthews_coef function of CCP4 Program Suite. Needle Plate Bipyramid P212121 P21 P41/P43 P41212/P43212 a= 23.76Å
b=68.70Å c = 140.65Å
a= 70.79Å b= 24.41Å c= 75.39Å !=107.65°
a= b= 36.76Å c= 378.20Å
Number of molecules
VM Solvent Content (%)
VM Solvent Content (%)
VM Solvent Content (%)
VM Solvent Content (%)
1 8.5 85.5 9.15 86.5 19.22 93.6 9.61 87.2 2 4.26 71.1 4.57 73.1 9.61 87.2 4.81 74.4 3 2.84 56.7 3.05 59.6 6.41 80.8 3.2 61.6 4 2.13 42.2 2.29 46.2 4.81 74.4 2.4 48.8 5 1.7 27.8 1.83 32.8 3.84 68.0 1.92 36.0 6 1.42 13.4 1.52 19.3 3.2 61.6 1.6 23.2 7 1.31 5.9 2.75 55.2 1.37 10.4 8 2.4 48.8 9 2.14 42.4 10 1.92 36.0 11 1.75 29.6 12 1.6 23.2

!"#$%&'()*+,-./( ( 01(.'#23&(
44(
Figure 2.18. Native Patterson map of MuRF1-CC needle morphology in the resolution range 15-5 Å. The origin peak (black arrow) and off origin peak (red arrow) are indicated. The off origin peak has a height of 25% that of the origin peak. A contour level of 2" is shown with an increment of 1".
Figure 2.17. Polar representation of the self-rotation function calculated with POLARRFN (omega is defined as the angle from the pole and phi is the angle around the equator). Section #=180° shown. Black arrows indicate peaks corresponding to the three crystallographic 2-fold axes (point group P222).

!"#$%&'()*+,-./( ( 01(.'#23&(
47(
2.4.5.2 MuRF1-CC plate
The crystal lattice for the thin plate morphology of MuRF1-CC was identified
as monoclinic, systematic absences along the screw axis (reflection conditions: 0, 2n,
0) suggested the space group to be P21. Calculation of the Matthews coefficient
(Table 2.5) (VM = 2.29) indicated the possibility of four molecules (two biological
dimers) per asymmetric unit with a solvent content of approx. 46%. NCS analyses
used the program POLARRFN to calculate a self-rotation function between a
resolution range of 15-3.5Å, with a radius of integration of 20Å. A peak
corresponding to a 2-fold NCS axis was found $=90°, %=153°, #=180°, with a
correlation of approx. 85% (red arrow in Fig 2.19a). The orthogonal code 3
(NCODE=3) option was used in POLARRFN, which allows plotting of monoclinic
space groups with the unique b axis along the orthogonal z axis. The location of the
NCS axis with respect to the crystallographic axis is shown in Fig 2.19, it is roughly
contained in the ac plane. To determine the position of the NCS axis the
corresponding reciprocal space axis a* and angle !* were calculated from real space
! (!*=180°- !). (Fig 2.19d).

!"#$%&'()*+,-./( ( 01(.'#23&(
48(
2.4.5.3 MuRF1-CC bipyramidal
Data processing was carried out in space groups P4x212 and P4x (x=1 or x=3,
enantiomeric space groups). The P4x212 symmetry was supported by merging
statistics and an analysis of the systematic absences along each crystallographic axis
(reflection conditions: 0, 0, 4n; 2n, 0, 0). During an analysis of data quality with
phenix.xtriage (Adams et al., 2010), the possibility of merohedral twinning was
identified. The twinning fraction for the P4x symmetry was estimated as 0.38
according to the twinning law h, -k, -l (Fig. 2.20).
Figure 2.19. NCS axis determination of MuRF1-CC thin plate. a) Shows the polar representation of the self-rotation function calculated with POLARRFN (omega ($) is defined as the angle from the pole and phi (%) is the angle around the equator). Section kappa (#)=180° is shown. The black arrow indicates the peak corresponding to the crystallographic 2-fold axis, and the red arrows indicate the peaks that derive from the NCS axis (and it’s symmetry related axis). The coordinate system of the unit cell is overlaid. The NCS axis is represented by a red line, unit cell axis a and c by green lines (b and b* are perpendicular to the plane of the paper), and a* from the reciprocal lattice in blue, where !=107°, and !*=73° (!*=180°- !). Phi angles for a, a* and the NCS axis are given. The axes x,y, z lie along c, b*xc, b*. b) Shows the crystallographic structure and the unit cell, the axes a and c are indicated, the NCS axis is represented by a red line, which intercepts the molecule.

!"#$%&'()*+,-./( ( 01(.'#23&(
49(
Calculation of the Matthews coefficient (Table 2.5) indicated the presence of
4 molecules (2 biological dimers) for the P4x212 symmetry (accordingly, 8 molecules
in the P4x symmetry), with a solvent content of approx. 49%. Analysis of the self-
rotation function using POLARRFN was carried out in the resolution range of 15-5Å
with a radius of integration of 20 Å. A peak corresponding to a NCS axis was found
at $=90°, %=22.5°, #=180°, with a correlation of approx. 87% (black arrow in Fig.
2.21). This NCS axis bisects the diagonal 2-fold crystallographic axis.
Figure 2.20. NZ test to detect twinning and translational NCS, based on cumulative distribution of intensities. The curve of the observed acentric (dark blue) reflections is sigmoidal, and in the absence of translational NCS symmetry, this might be indicative of twinning. The presence of twinning is also supported by an L test of acentric data, also based on intensity distribution (data not shown).

!"#$%&'()*+,-./( ( 01(.'#23&(
4:(
2.4.6 Molecular replacement attempts
Phasing was initially attempted using molecular replacement. For this, a
BLAST (Altschul et al., 1990) search of the RCSB Protein Data Base (PDB) to find
homologous structures was carried out, but did not reveal any coiled-coil models
with suitable sequence similarity. Therefore, 22 models of canonical coiled-coils in
dimeric and tetrameric arrangement were chosen from the PDB to create a library.
The programs PHASER (McCoy et al., 2007) and MOLREP (CCP4 1994) were used
on both libraries, as well as with poly-alanine versions of the models, monomeric
helices and short, helical chain fragments. Space group ambiguity was accounted for
by manually trying molecular replacement in all space groups within the P422 point
group. NCS relations were accounted for by using self rotation angles to evaluate
solutions in the cross-rotation. The solutions obtained, although showing good lattice
Figure 2.21. Polar representation of the self-rotation function for MuRF1-CC bipyramid calculated with POLARRFN (omega is defined as the angle from the pole and phi is the angle around the equator). Section #=180° is shown. The black arrow indicates the peaks corresponding to the crystallographic 2-fold and 4-fold (centre peak) axis, and the red arrow indicates the NCS axis.

!"#$%&'()*+,-./( ( 01(.'#23&(
7;(
packing, did not progress successfully in automated refinement attempts in PHENIX
(Adams et al., 2010) and ARP/wARP (Langer et al., 2008). Thus, experimental
phasing was pursued instead.
2.4.7 Experimental phasing (SIRAS/MAD)
2.4.7.1 Derivatization of crystals
As the MuRF1-CC sequence is devoid of methionine residues, seleno-
methionine labelling of the sample was not readily possible and heavy atom
derivatization (overview of technique in (Garman & Murray, 2003) was pursued
instead. For experimental phasing, MuRF1-CC crystals of all morphologies were
soaked in their respective mother liquors containing: samarium chloride (SmCl3),
cadmium chloride (CdCl2), 5-Amino-2,4,6-triiodoisophthalic acid (magic triangle),
or tantalum bromide ((Ta6Br12)2+) (Table 2.6). Only the bipyramidal and thin plate
morphologies soaked in (Ta6Br12)2+ allowed the collection of diffraction data with
detectable anomalous signal. These crystals often acquired a green colour indicative
of successful heavy atom uptake (Fig. 2.22) For storage and data collection all
crystals were flash frozen in liquid nitrogen using mother liquor as cryo-protectant.

!"#$%&'()*+,-./( ( 01(.'#23&(
7/(
Table 2.6. Outline of native MuRF1-CC crystals soaked in various heavy atoms. Concentration and time ranges for soaks carried out are listed. Soak type SmCl3 CdCl2 Magic triangle (Ta6Br12)2+
Morphology [mM] range
Time range
[mM] range
Time range
[mM] range
Time range
[mM] range
Time range
Needle 0.5, 1, 25
1-24hs 1, 5, 10 1-24hs 5, 20, 50
1-24hs 3-5 1-5hs, and 2-3 days
Thin plate
3-5 2-3 days
Bipyramid 0.5, 1, 25
1-24hs 1, 5, 10 1-24hs 5, 20, 50
1-24hs 3-5 1 –3 and 30 days
Crystals were soaked in the above concentrations and were removed from soaks for freezing at various intervals between the time ranges given.
2.4.7.2 MAD data collection and processing
Multiwavelength anomalous diffraction (MAD) data could only be acquired
from a (Ta6Br12)2+ derivatized MuRF1-CC bipyramidal crystal, collected at the
beamline I03, Diamond (Oxford). An X-ray fluorescence scan of the LIII- edge of
tantalum was carried out (processed in CHOOCH; Evans & Pettifer, 2001) to
identify experimentally the optimal wavelength values for data collection (the
theoretical absorption at the L-edges of tantalum is shown in Fig. 2.23). Data for the
peak wavelength (maximal f") was collected at 9.877KeV (~1.25528Å); inflection
point (minimal f') was collected at 9.8725KeV (~1.25585Å); and high energy remote
Figure 2.22. (Ta6Br12)2+ derivatized bipyramidal crystal of MuRF1-CC. Soak time for this crystal was 1 month in 4mM (Ta6Br12)2+. Crystals acquired a green colour, indicating heavy atom binding. Heavy precipitate occurred during soaking troubling the extraction and mounting of crystals.

!"#$%&'()*+,-./( ( 01(.'#23&(
7)(
(outside the L-edge) was collected at 12.2KeV (~1.0163Å). Diffraction data was
collected in non-overlapping 0.21° oscillations for a total range of 100°, and was
processed using the XDS/XSCALE package to 3.5Å resolution for the peak; 3.9Å for
the inflection; 4.1Å for the high energy remote. Bijvoet pairs F+ and F- were treated
as separate reflections and the peak data set was used as the reference wavelength for
scaling of all other data sets used. The unit cell for the MAD data sets was
a=b=37.561Å, c=376.314Å (diffraction data statistics in Table2.4).
2.4.7.3 Substructure solution and density modification
The position of anomalous scatterers and the calculation and refinement of
experimental phases used the program SOLVE in various resolution ranges,
particularly 20-4.0Å and 20-6.0Å (Terwilliger & Berendzen, 1999). SOLVE carries
out a heavy atom search by calculating anomalous difference Patterson maps, in this
case all 3 MAD wavelengths were used as well as SAD on the peak data set, and
subsequently switching to Fourier analyses. The features of the peak wavelength
Figure 2.23. Real (f’) and imaginary (f’’) components of the anomalous signal from tantalum. Plot of the theoretical f’ and f’’ values versus energy, for MAD data collection. Wavelengths indicated were selected experimentally based on an X-ray fluorescence scan.
<(
=2>?&@%AB2(
CAD"(&2&'DE('&FB%&(

!"#$%&'()*+,-./( ( 01(.'#23&(
75(
anomalous difference map (Fig. 2.24a and 2.24b) were consistent with those present
in a dispersive difference map (Fig. 2.24c and 2.24d) (although an isomorphous
difference map appeared somewhat featureless and uninterpretable, possibly
reflecting lack of isomorphism). Peaks were found at Harker sections corresponding
to the P4x212 (x=1 or 3) space groups, w=0.25, w=0.5, w=0.75. A first heavy atom
site was identified and used as seed to find a second site, both of which where
refined using SOLVE, and then plotted onto the Patterson maps (Fig. 2.24c and
2.24d) with VECTOR (CCP4) for visual inspection. Table 2.7 gives the coordinates
of the heavy atom sites identified.
The output from SOLVE was then fed into RESOLVE (Terwilliger, 2000;
Terwilliger, 2003) for density modification and automated model building. The
model and the corresponding electron density map obtained from resolve were then
refined against the highest resolution (2.5Å) reference data set of the bipyramid
morphology using phenix.refine (Adams et al., 2010). The refined model and
electron density map had several partial helices ranging from 1-6 helical turns. Prior
to refinement a subset of reflections were set aside with the program FREERFLAG
(CCP4, 1994) to create an R-free set (Brunger, 1992; Brunger, 1997) to be used as a
cross-validation tool in model building refinement.

!"#$%&'()*+,-./( ( 01(.'#23&(
76(
Table 2.7 Fractional coordinates of heavy atom sites identified and refined with SOLVE. X Y Z Site 1 0.3173 0.0894 0.1153 Site 2 0.6464 0.4717 0.1136
Figure 2.24. Anomalous and dispersive Patterson maps. Figures a, & c correspond to Harker section w=0.25 and b & d correspond to Harker section z=0.50. a) and b) Anomalous difference Patterson map of the peak wavelength using data between 11 and 4Å. c) and d) Dispersive difference Patterson map between peak and edge wavelengths using data between 10 and 4Å. Heavy atom site 1 (red circle) and 2 (blue circle) are shown only on the dispersive map for clarity. Harker section w=0.75 is not shown as is a symmetry replica of section 0.25.
!"#
$"# %"#
&"#'()*+,# '()*,)#
G2BF#?B,H(IA>>&'&2@&(<#%%&'HB2(F#$(
JAH$&'HAK&(IA>>&'&2@&((<#%%&'HB2(F#$(

!"#$%&'()*+,-./( ( 01(.'#23&(
74(
The data described correspond to phasing calculations carried out in the
P4x212 setting. However, because of the possibility for twinning (as described
above), the equivalent calculations were replicated in a P4x lattice (data not shown).
2.4.7.4 Model building and Refinement
In order to improve the model and electron density maps so obtained the
program ARP/wARP (Langer et al., 2008) was used, by running the “improvement
of maps by atoms update and refinement” task, which refines and updates phases
through the use of dummy atoms in automatic building. This yielded an improved
map, where features were more clearly visible, density corresponding to longer
helical fragments was also observed. With this map it was possible to manually
rebuild a poly-alanine model in COOT (Emsley et al., 2010), using an ideal helix as
template. This process was carried out in a series of iterations. The model obtained
(Fig. 2.25) had detectably better refinement statistics if considering a P41 lattice with
twinning symmetry, namely R-factor=39.64% and a R-free=44.56%, and the longest
chain contained 30 (total of 58) residues of MuRF1-CC. However, further attempts at
extending the helices of the MuRF1-CC model failed, due to an absence of phases
resulting from the inability to correctly locate the heavy atom sites (Fig 2.24 &
Table 2.7).

!"#$%&'()*+,-./( ( 01(.'#23&(
77(
Figure 2.25. Partial poly-alanine model of MuRF1-CC in space group P41. There are 11 partial chains built, some of which appear to be fragments of the same chain, such as chains a and b.
#(
L(

!"#$%&'()*+,-./( ( 01(.'#23&(
78(
2.4.8 Phasing with ARCIMBOLDO
As it was not possible to solve the MuRF1-CC structure using established
procedures, the use of ARCIMBOLDO (Rodriguez et al., 2009) was considered. A
collaboration with Dr. Isabel Uson (Institut de Biologia Molecular de Barcelona,
Barcelona, Spain) was established.
ARCIMBOLDO is a phasing method for macromolecules, utilizing PHASER
(McCoy et al., 2007) to localize small model fragments generated ab initio, such as
small &-helices (10-14 amino acids), and the program SHELXE (Sheldrick, 2010)
for iterative rounds of density modification and main-chain autotracing.
For ARCIMBOLDO, the MuRF1-CC diffraction data obtained from the plate
crystal morphology was utilized. As mentioned previously, (Sections 2.4.4.2 and
2.4.5.2) this data was processed to 2.1Å resolution and characterisation of the crystal
lattice showed the space group to be P21, with 2 biological dimers in the asymmetric
unit being the most likely scenario. For use with ARCIMBOLDO data were subject
to anisotropic correction (by Dayte Rodriguez & Isabel Uson). Model fragments used
for this “brute force method” were 16-20 amino acids in size and both poly-alanine
and modelled side chain version of the fragments were used.
From ARCIMBOLDO two models were returned i) a poly alanine model
(Fig. 2.26) and ii) a partially traced model. The partially traced model had 24 residue
side chains placed over two chains. They indicated that the two chains comprising
each dimer were offset by a heptad repeat and that the 2 biological dimers interacted
at their C-terminus to form a tetramer. The observed offset was confirmed by parallel
attempts of using ARP/wARP (Langer et al., 2008) to designate residues, and

!"#$%&'()*+,-./( ( 01(.'#23&(
79(
manually placing sequence by finding side-chain density in COOT (Emsley et al.,
2010), using the poly-alanine model as a starting point.
2.4.8.1 Model building and refinement.
Placement of the side-chains, and further building/extension of the helices
onto the poly-alanine model was carried out in COOT (Emsley et al., 2010), with
refinement being carried out in the first instance with phenix.refine (Adams et al.,
2010), designating each chain as a TLS group, and later with refmac5 (Murshudov et
al., 1997). Water molecules were placed by using the PHENIX (Adams et al., 2010)
water picking option, and were checked in COOT. Molecules belonging to
crystallization buffer were placed manually in COOT.
Figure 2.26. Superimposition of initial poly-alanine model over completed MuRF1-CC. The poly-alanine model (purple) obtained from ARCIMNOLDO (R-work of 0.36 , R-Free of 0.41), superimposed over the completed MuRF1 CC model (grey).

!"#$%&'()*+,-./( ( 01(.'#23&(
7:(
2.4.9 Crystal structure of MuRF1-CC
In order to clarify the assembly state afforded to MuRF proteins by the CC
core segment identified above, we elucidated the crystal structure of the CC fragment
from human MuRF1 (MuRF1-CC) to 2.1Å resolution. Diffraction data statistics and
model parameters are given in Table 2.8. The crystals contained 4 copies of the
MuRF1-CC chain in their asymmetric unit. These assembled into two parallel
dimers, each having an “open scissor” conformation, that intercalate through their C-
terminal ends to form a palindromic, inverted tetramer (Fig 2.27). This molecular
assembly resembles closely that of the C-terminal domain of the postsynaptic density
protein Homer (Hayashi et al., 2009) (Fig 2.28). In MuRF1, the conformation of the
dimers deviated from the classical CC geometry. Firstly, the chains within each
dimer were out of registry by one full heptad repeat and, further, the crossing angle
between the chains was broad leading to the unpairing of both N- and C-termini. It
was the resulting exposure of aromatic and hydrophobic residues at the C-terminus
that created a core for the formation of the inverted tetramer (inset in Fig 2.27). It is
that core that appears to be the dominant interhelical packing feature in the crystal
structure as the contacts within the dimer are comparably fewer, with only two salt
bridges (K224-E236’ and E236-K238’) providing chain recognition (examination of
chain interfaces used the PISA server; (Krissinel & Henrick, 2007). One additional
salt bridge (K238-D268’’; chains DA in Fig 2.27a) is present in the structure, but it
contributes to tetramer stabilization. The packing of interface residues (complete list
of contacts given in Tables 2.9 & 2.10) was used to identify stretches on each of the
four chains that formed either parallel, antiparallel, or simultaneous parallel/anti-

!"#$%&'()*+,-./( ( 01(.'#23&(
8;(
parallel interactions (Fig 2.27). This analysis revealed that the MuRF1-CC sequence
can establish promiscuous self-associative interactions.
Table 2.8. Native X-ray data statistics. In brackets are shown values for highest resolution bin. Space group P21 Unit cell dimensions a= 70.79Å b= 24.41Å c=
75.39Å &='= 90.00° != 107.65° X-ray Data Beamline I03 (Diamond) Detector ADSC Q315r Wavelength 0.97 Resolution 20-2.1 (2.15-2.1) No. of unique reflections 14626 (1008) Rsym (I) 2.7 (45.0) Multiplicity 3.64 (3.74) Completeness (%) 97.7 (99.3) I/" (I) 17.24 (3.31) Refinement Number of reflections in working/free set 13899 / 725 Number of protein residues/water molecules/solvent molecules
228/69/24
R-factor / R-free (%) 22.79 / 28.23 Model Rmsd bond length (Å) / bond angle (°) 0.007/0.888 Total number of missing residues is 16 (6.5% of structure): Chain A (G271); Chain C (G-3, E269, P270, G271); Chain B (E269, P270, G271); Chain D (G-3, A-2, M-1, D214, D268, E269, P270, G271).
Figure 2.27: Crystal structure of MuRF1-CC a. Crystal structure of MuRF1-CC, where helices have been coloured to indicate: no interchain assembly (grey); parallel interaction (beige); antiparallel interaction (yellow); simultaneous parallel and antiparallel interaction (orange). Salt bridges are labelled. The inset shows the hydrophobic core formation of the tetrameric region, hydrophobic residues are labelled. b. Twister analysis. Solid lines indicate pitch and dashed lines radius, lower case letters denote position in heptad repeat of AC dimer. Red box denotes position of stutter.(

!"#$%&
&
'%
!"#$%&%'""(%
'""(%&%!"#$%
'"#)%*%!"#$%
+%%
,%
-%%%
.'"#)%*%!"#$%
+/)%&%'"#)%
0 1 2 3 4 5 6 7 8 9 10
0 50
100 150 200 250 300 350 400
A M D T L Y A I L D E K K S E L L Q R I T Q E Q E E K L S F I E A L I Q Q Y Q E Q L D K S T K L V E
I L D E K K S E L L Q R I T Q E Q E E K L S F I E A L I Q Q Y Q E Q L D K S T K L V E T A I Q S L A
E V L K T S K D L Q D Q T Q Q I
A L S Q I A T E V L K T S K D L
Rad
ius
Pitc
h
Chains A, D
Chains B, C
pitchAC pitchBD tetramer pitch radiusAC radiusBD tetramer radius
(")*% +",-%
."/)%+",-% 0"/#%
+",*%
(")*%+",-%
(")*%
+"/1%
+",*%
d e f g a b c d e f g a b c d e f g a b c d e f!g a b c d e f g a b c d e f g d e f g a b c d e !
23%
43%

!"#$%&'()*+,-./( ( 01(.'#23&(
8)(
Table 2.9. Interactions in the dimeric portions of the crystal structure of MuRF1-CC. Only hydrophobic interactions with buried areas of over 50% are listed. Salt bridges (polar interactions) are in bold and core heptad positions of the dimeric coiled coil, (hydrophobic interactions) a and d are in bold and designated.
Polar interactions Hydrophobic interactions Atom Distance
Å Atom Residue BSA [Å2] § Heptad
position Dimer AC
C:Q235[NE2] 2.98 A:S225[O] C:L228 77.96 ||||||| d C:Q235[OE1] 2.55 A:S225[OG] C:T232 35.33 |||||||| a C:K238[NZ] 2.97 A:E236[OE2] C:Q235 76.38 ||||||| d C:E236[OE2] 3.61 A:K224[NZ] C:L239 85.95 ||||||||| a C:I242 57.85 |||||||| d C:I246 80.65 ||||||||| a C:Y249 74.16 |||||| d C:L253 58.28 ||||| a A:S225 57.59 ||||||||| a A:L228 77.84 |||||||| d A:T232 51.01 |||||||| a A:Q235 59.21 |||||| d A:E236 44.35 ||||| A:L239 86.20 ||||||||| a A:I242 51.63 |||||||| d A:I246 61.05 |||||| a A:Y249 60.65 ||||| d
Dimer DB D:S225[OG ] 2.54 B:Q235[OE1] D:A218 48.69 ||||||||| a D:Q235[NE2] 2.53 B:E33[OE1] D:D221 62.92 |||||||| d D:Q235[NE2] 2.64 B:E33[OE2] D:K224 37.95 |||| D:D221[OD2] 2.31 B:Q229[NE2] D:S225 50.32 |||||||| a D:S225[O ] 2.70 B:Q235[NE2] D:L228 75.23 ||||||||| d D:Q229[OE1] 3.53 B:Q235[NE2] D:T232 55.64 |||||||||| a D:K224[NZ] 2.51 B:E236[OE1] D:Q235 63.18 ||||||| d D:E236[OE2] 2.84 B:K238[NZ] D:E236 37.09 ||||| D:L239 82.92 ||||||||| a D:I242 46.64 ||||||| d D:I246 58.69 ||||||| a D:Y249 58.93 ||||| d B:S225 21.63 ||||| a B:L228 85.23 ||||||||| d B:T232 44.76 ||||||||| a B:Q235 87.92 |||||||| d B:E236 40.02 ||||| B:L239 83.41 |||||||| a B:I242 56.80 ||||||||| d B:I246 78.50 |||||||||| a B:Y249 71.10 |||||| d B:L253 58.68 |||||| a § BSA – buried surface area where every bar represents 10%.

!"#$%&'()*+,-./( ( 01(.'#23&(
85(
Table 2.10. Interactions in the tetramer portion of the crystal structure of MuRF1-CC. Only hydrophobic interactions with buried areas of over 50% are listed. Salt bridges (polar interactions) are in bold and core heptad positions of the dimeric coiled coil, (hydrophobic interactions) a and d are in bold and designated.
Polar interactions Hydrophobic interactions Atom Distance
Å Atom Chain:
Residue BSA [Å2] § Heptad
postiion B:Q250[NE2] 2.71 A:D268[OD2] B:Q250 68.49 ||||||| B:Q250[NE2] 2.60 A:D268[OD1] B:T257 50.70 |||||||| B:D268[OD1] 2.76 A:Q250[NE2] B:I264 80.77 ||||||||| a B:I264[O] 3.03 A:Q250[NE2] B:L267 92.97 |||||| d D:Q250[NE2] 2.99 D:I264[O] A:Q250 85.04 |||||||| D:T247[OG1] 2.60 A:Y249[OH] A:L253 43.51 ||||| d D:S256[OG] 2.95 A:Q252[OE1] A:D254 28.60 ||||| D:Q252[NE2] 3.08 A:S256[OG] A:T257 48.15 ||||||| a D:Y249[OH] 2.68 A:T247[OG1] A:I264 48.18 ||||| D:K238[NZ] 3.72 A:D268[OD1] D:Q250 78.21 ||||||| C:Q252[NE2] 3.08 B:S266[O] D:L253 42.78 ||||| C:S256[OG] 3.19 B:A263[O] D:T257 5.38 |||||||| a D:I264 48.94 ||||| C:T257 47.92 |||||||| a C:E261 33.05 ||||| C:I264 73.37 |||||||| a C:L267 88.28 |||||| d D:K238 56.27 ||||| D:L245 63.10 |||||||| D:Y249 59.83 ||||| d D:Q252 45.26 ||||| D:S256 57.78 ||||||||| D:V260 47.80 ||||||| d D:A263 30.66 |||||| D:L267 91.69 |||||| A:L245 66.58 |||||||| A:Y249 59.09 ||||| d A:S256 50.25 ||||||||| A:V260 55.25 ||||||| d A:A263 36.91 |||||| A:I264 44.97 ||||| A:L267 83.74 ||||||| C:Q252 42.02 ||||| C:S256 42.01 ||||||||| d C:L259 82.14 ||||||| C:A263 42.14 ||||||||| C:S266 40.24 ||||| C:L267 70.61 ||||| B:Q252 50.37 |||||| B:S256 36.95 |||||||| d B:L259 88.15 ||||||| B:A263 41.97 ||||||||| B:S266 58.39 ||||||| B:L267 65.27 ||||| § BSA – buried surface area where every bar represents 10%.

!"#$%&'()*+,-./( ( 01(.'#23&(
86(
Analysis of the crystallographic dimer using TWISTER (Strelkov &
Burkhard, 2002) showed that although the pitch and radius vary along the length of
the molecule, the values of its central region are close to those of a classical dimeric
coiled-coil (where pitch approximates 140 Å and radius 5 Å; Crick, 1953; Seo &
Cohen, 1993). In agreement, an analysis of the knobs-into-hole packing of each
dimer carried out using the SOCKET server (Walshaw & Woolfson, 2001; Walshaw
& Woolfson, 2003) indicated that in the AC dimer, 18 residues exhibited a
conventional CC packing (7,7,4 repeat), whilst the BD dimer had 25 residues in CC
arrangement (7,7,7,4 repeat) (Fig 2.27 & Fig 2.28 show the packing details of the
dimeric regions in both palindromic arms that exhibit slight anisometry). In the
sequence that follows from this, TWISTER shows the opening of the coil and a
subsequent helical phase transition (between residues 252-QL-253 in chains A and
D, respectively partnered to chains C and B at motif 259-LV-260) that defines the
switch from a dimeric to a tetrameric association (Fig2.27b).
In summary, the crystal structure of the CC-prone segment from MuRF1
shows that this can establish manifold interactions, being able to support the
simultaneous formation of parallel and antiparallel dimers, and tetrameric helical
bundles. However, in agreement with predictions, it does not associate into robust
CC formations suggesting that, on its own, it is unlikely to direct the productive
quaternary assembly of MuRF1.

!"#$%&'()*+,-./( ( 01(.'#23&(
84(
Figure 2.28. Extent of knobs-into-hole packing of the crystallographic dimers of MuRF1-CC. On the left side is dimer B-D, and on the right dimer A-C. Residues shown are in position a (red), d (green), e and g (blue) of the heptad repeats identified by the SOCKET program. a) full length MuRF1-CC. b) side view. c) cross section, d) residues involved in packing with heptad positions below.
#M(
LM(
@M(
SELLQRITQEQEEKLSFI abcdefgabcdefgabcd
TQEQEEKLSFIEALIQQY abcdefgabcdefgabcd
IM(

!"#$%&'()*+,-./( ( 01(.'#23&(
87(
2.4.10 Molecular arrangement of MuRF1-CC in solution
Given the unexpected assembly state of MuRF1-CC in the crystalline state,
we studied its association in solution using SEC-MALLS. This technique yields an
accurate determination of MW without being influenced by molecular shape or
hydrodynamic parameters, an important consideration when dealing with strongly
anisometric proteins such as MuRF1-CC. SEC-MALLS measurements of MuRF1-
CC yielded an average MW of 11.8kDa (Fig 2.29). This value is intermediate
between the calculated MM of a monomer (7kDa) and a dimer (14kDa) of this
sample. This result indicated that the sample exists in solution as an equilibrium of
approximately equal parts of monomers and dimers, confirming that the associative
potential of this helical segment is weak.
Figure 2.29. SEC-MALLS analyses of MuRF1-CC. The red line denotes the average weighted molecular mass calculated from the sample, whilst grey dashed lines show the theoretical molecular weight of a monomer (7kDA) and a dimer (14kDa) of this sample.(

!"#$%&'()*+,-./( ( 01(.'#23&(
88(
A further insight into MuRF1-CC properties in solution was gained through
SAXS. The parameters calculated form the scattering data, the experimental
scattering pattern, and the pair distance distribution function p(r) are given in Table
2.11, Fig 2.30, & 2.31 respectively. The MM was estimated from I(0) by
normalization against reference solutions of bovine serum albumin as 14.1 KDa,
indicating that MuRF1-CC is predominantly dimeric in solution in the concentration
range assayed (2.2-4.4 mg/ml), higher concentrations were not assayed due to time
restrictions. Effectively, no agreement could be found between monomeric or
tetrameric models of MuRF1-CC and experimental data, where Rg, Dmax and ( fitting
values were strongly in discordance (Table 2.11). Interestingly, the agreement of the
SAXS data with crystallographic dimers (extracted halves of the crystal structure)
was only modest ((=1.42 and (=1.28 for AC and BD dimers respectively Fig 2.30),
with the experimental parameters Rg and Dmax indicating that the species in solution
were somewhat smaller. The agreement of models with SAXS data could not be
improved by assaying multi-component mixtures (monomers, dimers, tetramers) in
OLIGOMER (Konarev et al., 2006; Petoukhov et al., 2012). We then concluded that
the difference might reflect variations in the dimeric association of the chain in
solution respect to that in the crystal (possibly even a fraying of the chain termini).
However, the intrinsic limitations of the SAXS technique in discriminating fine
features in models and the highly anisometric shape of the sample worked together to
impede the modelling of the molecule through approaches such as rigid-body in
SASREF (Petoukhov & Svergun, 2005) or the ensemble optimization method in
EOM (Bernado et al., 2007). Nevertheless, we concluded that the differences in
association state observed between SEC-MALLS, SAXS and crystallographic data
are probably due to the progressively increased concentration of the samples in these

!"#$%&'()*+,-./( ( 01(.'#23&(
89(
experiments, and warrants further SEC-MALS and SAX analyses with higher
concentrations to be carried out in future work. This mutability in self-association
properties once again suggested that CC formations generated by MuRF1-CC are
weak.
Table 2.11. Molecular parameters estimated from scattering data Experimental Calculated from models
Monomerxt Dimerxt Tetramerxt AC BD MMcalc (kDa) 14.0 MM (kDa) 14.1 Rg (Å) 24.2 ± 0.1 26.09 26.75 26.03 36.61 Dmax (Å) 88.75 92.10 100.3 96.61 149.0 # 5.02 1.42 1.28 3.42 MM, Rg, Dmax, denote the molecular mass, radius of gyration, and maximum size, respectively. MMcalc is the theoretical MM of the constructs computed from the primary sequence. ( is the discrepancy between the experimental curve and those computed from models. xt refers to crystallographic model.
-./012#+*3)1( (-.44.5/#67# $1894!::6/1!;<.$#%.=21#6546#2>;21.=254!:# 9$!4421.5/#;!44215*(SAXS data are displayed as circles (blue) with error bars in grey, while the curve computed from the crystallographic BD dimer (black) is given as a solid line.(

!"#$%&'()*+,-./( ( 01(.'#23&(
8:(
2.4.11 Overall molecular parameters of MuRF1-B2HD
The structural and biophysical data described above led us to question the
coiled-coil forming potential of MuRF1-CC and, thus, the assembly state induced by
the helical domain. In a previous study, we showed that the B2 domain from MuRF1
assembles into homodimers with high affinity (Mrosek et al., 2008). We speculated
then that the B2 box was possibly required to pre-define the registry of the helical
domain and to initiate its productive assembly by vicinal confinement. However, we
could not confirm the assembly state of samples spanning both the B2 box and the
helical domain of MuRF1 (MuRF1-B2HD; Fig 2.7). In this study, we have analysed
the oligomeric state of MuRF1-B2HD using SEC-MALLS (Fig 2.32). The data show
that the sample forms a range of oligomeric species, including high-order aggregates
-./012# +*3?*# #Distance distribution function of MuRF1-CC. Calculated from experimental scattering patterns with the program GNOME, Dmax is 88.75Å, error bars are given in black. Y-axis units are arbitrary.

!"#$%&'()*+,-./( ( 01(.'#23&(
9;(
but that a sizeable fraction of the population forms small assemblies with an average
MM of 50.1kDa. This value is in excellent agreement with the theoretical MM of
48.1kDa for a dimer of this construct, confirming that the dimeric state is the ground
association state of this sample.
To explore the global conformational features of the MuRF1-B2HD portion,
we imaged population fractions predominantly enriched in the dimeric state using
negative staining electron microscopy (Fig 2.33). The micrographs revealed a rod-
like morphology with approximate dimensions of 17 ± 3 nm length and 2.6 ± 0.36
nm cross-section. This overall shape suggested that, as expected, the helical domain
forms an elongated shaft with the B2-box located in apical position. However, the
molecular length was significantly shorter than that predicted for a helical domain in
Figure 2.32. SEC-MALLS analyses of MuRF1-B2HD. A SEC-MALLS analysis of MuRF1-B2HD was able to identify 3 distinct oligomerization states, a dimer (50.1kDa) and 2 higher oligomers corresponding to a trimer (79.56kDa) and pentamer (120.7kDa). The red line denotes average molecular mass for the dimer, grey dashed line denotes the theoretical molecular weight of a dimer of MuRF1-B2HD.

!"#$%&'()*+,-./( ( 01(.'#23&(
9/(
fully extended conformation. In actual fact, the observed measures were well
explained by the size of the long N-terminal helix (approx. 29 helical turns with 5.4
Å pitch amounting to 15.6 nm) plus the B2 box (approx. 2 nm). This led us to infer
that the two short C-terminal helices, i.e. the COS-box, must fold against that B2HD
core fraction.
Figure 2.33. Electron microscopy full field image of MuRF1-B2HD. Black arrows show particles in field, and inset shows average particle images.

!"#$%&'()*+,-./( ( 01(.'#23&(
9)(
2.4.12 Ab initio modelling of the C-terminal COS-box of MuRF1
We then explored the fold characteristics of the COS-box through ab initio
modelling. This region of MuRF1 has no recognisable homology with any protein of
known structure preventing the application of comparative modelling. In ab initio
modelling the three-dimensional structure of proteins is derived solely from their
amino-acid sequence. The method works by stitching together suitable protein
fragments to assemble native-like structures using simulated annealing, where the
energy of the structure is computed and then lowered over several cycles. Although
less reliable than comparative modelling, ab initio methodology is remarkably
successful when applied to all-$ proteins (Bibby et al., 2012), for reasons that relate
to the greater accuracy of their secondary structure prediction and the relatively
limited modes of helical packing, in contrast to the variable twists of !-sheets. Here,
we employed the two leading ab initio modelling programs, Quark (Xu & Zhang,
2012) and ROSETTA (Simons et al., 1997). Quark assembles fragments of variable
length identified by fold recognition methods. Presently only available as a server, it
returns a set of ten predictions and estimates of model reliability in terms of
predicted TM-scores (Zhang & Skolnick, 2004). A TM-score of 1 would indicate a
perfect model, with lower values reflecting increasing degrees of error. ROSETTA,
on the other hand, assembles fragments of 3- and 9-residues length identified using
PSI-BLAST. At the fragment assembly stage, thousands of models are clustered by
structural similarity and centroid representatives of large top clusters considered as
candidate fold predictions. The appearance of a large top clusters is generally
indicative of accurate fold predictions (Shortle et al., 1998).

!"#$%&'()*+,-./( ( 01(.'#23&(
95(
We subjected to ab initio modelling the sequence spanning both MuRF1-CC
and the COS-box (MuRF1-CC-COS; construct definition in Fig 2.7). This, since EM
data led us to infer that the COS-box might require the preceding MuRF1-CC portion
for its native packing. In addition, since the crystal structure of the MuRF1-CC chain
was available, it allowed us to cross-validate the ab initio models for consistency
with experimental results. Effectively, models of MuRF1-CC-COS calculated using
QUARK revealed the C-terminal end as a compact arrangement, where the two short
helices in the COS-box form an &-hairpin that folds back onto the long &-helical
shaft, forming a short three-helix bundle (Fig 2.34a). The fold resembles a minimal
version of the three-helix bundle of the spectrin fold, where two helices are parallel
to each other and the third acts as a cross-connector (Le Rumeur et al., 2012). Seven,
out of the ten predictions returned by Quark, shared this same broad fold and had
TM-scores of 0.51-0.45 (which exceeded the threshold of 0.3 that indicates
statistically significant structural similarity; Zhang & Skolnick, 2004) (Fig 2.35a).
Supporting the accuracy of the models was their recapitulation of the long helix of
MuRF1-CC observed experimentally, even though neither this information nor any
structural fragments deriving from that helix had been provided to Quark.
Interestingly, a comparison of Quark models with the crystallographic structure of
MuRF1-CC revealed a remarkable similarity in helix packing (Fig 2.35b). Within
the tetrameric portion of MuRF1-CC, helices arranged themselves along the same
interfaces as those occupied by the COS-box a-hairpin in the ab initio models. This
suggested that the crystallographic arrangement was a compensatory conformation
aimed to satisfy naturalistic interfaces. To further test whether the C-terminal COS-
box might contact more distant regions in the helical domain, we also performed ab
initio modelling of the full helical domain (MuRF1-HD; Fig 2.34d). Quark models

!"#$%&'()*+,-./( ( 01(.'#23&(
96(
of MuRF1-HD (TM-scores of 0.51-0.58) represented the N-terminal fraction of the
domain as a single uninterrupted helix and were consistent with MuRF1-CC-COS
models at the C-terminus (Fig 2.34). This result is in excellent agreement with
secondary structure predictions (Fig 2.8) and expectations derived from EM data.
Figure 2.34. Ab initio modelling of MuRF1-CC-COS and MuRF1-HD. a. Quark model coloured in a blue-to-red gradient, superimposed on the crystal structure of the MuRF1-CC chain (grey). The pathogenic Q247ter mutation is shown in black and motifs previously identified to mediate microtubule binding are in magenta; b. Rosetta model; c. Superimposition of Quark and Rosetta models; d. Quark modelling of the full-length helical domain of MuRF1(

!"#$%&'()*+,-./( ( 01(.'#23&(
94(
Ab initio modelling in ROSETTA using the standard protocol resulted in
little clustering of models, indicative of low reliability of the results. Furthermore,
the cluster representative structures were four-helical bundles in which the sequence
spanning MuRF1-CC, experimentally shown to be a single helix, was broken into
two helices. This typifies the known tendency of ROSETTA to override long helices
suggested by secondary structure predictions in the interests of producing compact,
globular folds (Bibby et al., 2012). Therefore, we ran ROSETTA providing the
(!"!
!!!"################################# !!!!!"############# # # (
Figure 2.35. Ab initio model family for MuRF1-CC-COS generated using Quark (a) and superimposition onto MuRF1-CC crystallographic structure (b). MuRF1 crystallographic structure is shown in cyan and the Quark model is shown in orange.

!"#$%&'()*+,-./( ( 01(.'#23&(
97(
experimental structure of the MuRF1-CC &-helix as a fixed starting point. This time
the largest resulting cluster contained 150 of the total 1000 models, indicative of a
reasonably reliable result. The resulting model exhibits a topology that closely
resembles that of Quark models (Fig 2.34b). Consistency in results from Quark and
ROSETTA provides a useful further indication of reliability (Rigden & Galperin,
2008).
The spectrin fold is known to act as a dimerization interface, a platform for
the recruitment of signalling molecules, an association region for membranes and a
motif for interaction with cytoskeletal components (Le Rumeur et al., 2012). In
particular, the fold has been observed in a number of proteins known to associate
with microtubules, as e.g. the tubulin binding cofactor proteins (Subramanian et al.,
2010; Garcia-Mayoral et al., 2011). The COS-box is a conserved sequence segment
of about 50 aa length found in a range of TRIM proteins known to be associated with
microtubules (Short & Cox, 2006). The mutation of the conserved motifs FLQ and
LDY in the COS-box (respectively, 275-FLL-277 and 323-IDF-325 in MuRF1) were
previously shown to independently abolish the interaction of the TRIM protein
MID1 with microtubules (Short & Cox, 2006). Both Quark and ROSETTA
generated models indicate that these motifs co-localize –and mutually interact– at the
termini of the a-hairpin fold, at the base of the helical domain. This led us to
speculate that these motifs are important for the correct folding of the COS-box
and/or that this is an important interaction locus in the fold. Also in MuRFs is the
COS box required to preserve function. A recent study (Chen et al., 2012) has
uncovered that the truncating mutation p.Q247*, which causes MuRF1 to lack the
full C-terminal three-helix bundle (Fig 2.34a), is pathogenic, being linked to
hypertrophic cardiomyopathy. This truncation has been shown to result in a near

!"#$%&'()*+,-./( ( 01(.'#23&(
98(
total loss-of-function in MuRF1, abolishing its E3 ubiquitin ligase activity both in
auto-ubiquitination as well as ubiquitination of the MYH6 and MYBPC3 substrates.
The mutation was also shown to affect the subcellular distribution of MuRF1 to the
sarcomeric Z-disc through its co-localization with the &-actinin, also a spectrin-
repeat containing protein. Thus, we conclude that the spectrin-like, C-terminal
fraction of the helical domain of MuRFs is essential to preserve native interactions
with sarcomeric partners and substrates.
2.4.12.1 Experimental data in support of the predicted MuRF1-CC-COS model
Data available in the laboratory of our collaborator, Prof. Siegfried Labeit at
the Mannheim Hospital of the University of Heidelberg, bring support to our
calculated ab initio models, through the testing of the interaction of independently
produced samples of the COS box and the preceding, long helical shaft of MuRF1.
Effectively, data from both pull-downs and gel filtration chromatography have
confirmed the interaction of the two segments. In collaboration, we will establish
next whether this interaction mimics native conformations in the protein and not
simply the unspecific aggregation of the samples. For this, we will measure the
oligomeric state of the samples using SEC-MALLS.

!"#$%&'()*+,-./( ( 01(.'#23&(
99(
2.5 Discussion
Despite the apparent simplicity of CC architectures, their crystallographic
analysis remains a challenge, and this study on MuRF1-CC has been no exception.
General factors contributing to this are: i) the filamentous nature and individualized
helical twist, that confers a varying degree of long-range order, complicating
molecular replacement approaches, through cumulative deviations along the
molecular axis of the superhelix; ii) the formation of idiosyncratic crystal lattices,
resulting from their acutely anisometric molecular shape (such as ultra-dry or ultra-
wet lattice formation); iii) the repetitive nature of their sequences, that are often
deficient in methionine and cysteine residues that could assist MAD phasing; and,
most importantly, iv) the acute mutability of their self-association properties, that are
highly dependent on medium conditions and exact sequence content, causing drastic
and unpredictable changes of their overall conformation and troubling the
interpretation of electron density maps. Examples of this last factor are numerous;
where artifactual crystal structures have been elucidated for many CC extracted from
their global protein contexts (for e.g. Garcia et al., 2006). The current work,
however, highlights the potential of new phasing methodologies such as
ARCIMBOLDO (Rodriguez et al., 2009) and possibly AMPLE (Bibby et al., 2012)
for the efficient elucidation of this important class of proteins.
Coiled-coil domains are thought to be essential for the assembly, molecular
recognition and cellular function of TRIM/RBCC proteins. However, only minimal
structural data exist to date that can clarify the properties and functional roles of CC
domains in this protein family. Here, we have analysed the molecular features of the
helical domain of MuRF1 and revealed that, contrary to belief, it is unlikely to

!"#$%&'()*+,-./( ( 01(.'#23&(
9:(
exhibit canonical CC characteristics. Experimental results suggest CC formations in
MuRFs to be only weak, but still forming dimeric associations. We studied MuRF1-
CC anticipating that this would be the segment triggering association, but our
findings have revealed that the assembly poorly accommodates a CC fold and that
self-interaction can follow a broad range of promiscuous interaction patterns. The
various biophysical studies carried out point towards a concentration dependent
effect on association. However, the formation of the non-physiological tetramer, and
offset registry in the crystal structure of MuRF1-CC may be due to the lack of
stabilizing motifs present, such as the B2 or COS-box, or the presence of organic
solvent in the crystallization solution.
The resulting ab initio model of MuRF1-CC-COS had features that coincided
with the arrangement of chains in the crystallographic model. Where the small
helices of the COS-box align with parallel and anti-parallel interactions seen in the
crystal structure. It is also possible to see in the surface representations of the
MuRF1-CC-COS model that a groove exists that could accommodate dimer
formation (Fig 2.36). It is the last 32 residues of the MuRF1-COS domain, which
have been identified previously as the binding site for titin A168-A170 (Witt et al.,
2005). EM data on MuRF1-B2-HD demonstrate that the HD of MuRF1 in this
context is not a solely elongated structure, and, thus, the idea that the short helices
predicted to be present in the COS domain fold up to interact in such a manner is
feasible.
To date the only structural data for MuRF1 consisted of a dimeric B2 domain
(Mrosek et al., 2008), consistent with the structure of the MuRF3-B2 domain (pdb
entry 3Q1D). This B2 domain may act to align the helices N-terminally, but is not
necessary for formation of a HD dimer. The CC is then clamped C-terminally by the

!"#$%&'()*+,-./( ( 01(.'#23&(
:;(
COS-box, which may be necessary to stabilize the dimer interaction. The ab initio
model of MuRF1-CC-COS has surface features that suggest that it is essential to
secure the correct assembly of the helical domain. This ab initio model also shows a
negatively charged area that would contribute to the nature of the unstructured acidic
tail, also negatively charged. A non-charged surface is also present which forms a
groove that could act as a docking site for the other helix (also as observed in the
crystal structure), suggesting a dimer formation. Considering previous knowledge
and the work done in this study we speculate a possible arrangement of a MuRF1-
CC-COS dimer in Fig 2.37. Although the relative location of RING domains in the
full-length structure is unknown, they will most likely interact via their respective !-
sheets, as do other RING domains (Budhidarmo et al., 2012), contributing to the
overall dimer formation. The RING and B2 domains most likely contribute to higher
order oligomerization states of this protein. We have seen that the presence of the B2
domain gives rise to higher oligomeric states (Fig 2.32), which is consistent with
finding by others regarding the higher oligomeric states formed by TRIM proteins
(Reymond et al., 2001; Diaz-Griffero et al., 2009; Li et al., 2011b; Napolitano &
Meroni, 2012).

!"#$%&'()*+,-./( ( 01(.'#23&(
:/(
Figure 2.36. Hypothetical dimer of MuRF1-CC-COS. One of the dimer constituents is shown in surface representation, with hypothetical electrostatic surface areas shown, positive (blue), negative (red), and white (neutral). The long helix of MuRF1-CC-COS in orange sits into the shallow groove, thought to accommodate an interacting molecule for dimer formation.
:;N( :;N( :;N(
Figure 2.37. Schematic representation of proposed full length MuRF1 protein.
-=OP( ((((((((0LBQ)( ( ( (((((((((!!( ((((((!RS*LBQ( ((((((((((GT(

!"#$%&'(5*TUA%@"A2(3A2#H&( ( 01(.'#23&(
:)(
Chapter 3: Analyses of Twitchin kinase from
Caenorhabditis elegans
3.1 Introduction
Within the human kinome there is a family of Ca2+-calmodulin (CAM)
regulated myosin light-chain kinases (MLCK), a portion of which are non-functional
and lack a CAM binding domain. It is with in these non CAM-activated kinases
where the titin-like family of kinases falls. The titin-like proteins include titin and
obscurin in mammals; twitchin, the obscurin homolog UNC-89, and small titin
(TTN-1) in nematodes and molluscs; projectin and stretchin in insects (Bullard et al.,
2002; Kontrogianni-Konstantopoulos et al., 2009). One of the key abilities of muscle
tissue is to constantly remodel itself in adaptation to mechanical demand, and
although there is no defined understanding of how this process works, there is
increasing evidence for titin-like kinases to have a mechanosensory activation
mechanism which allows them to act as transducers of mechanical signals in muscle
tissue readaptation (Lange et al., 2005; Butler & Siegman, 2011).
Most of the focus into the mechanosensory role of titin like kinases has been
on titin kinase (TK), and twitchin kinase (TwcK), using them as representatives of
the family. All members of the titin-like kinase family have a conserved locus near
the C-terminus that is comprised of Ig-Ig-Fn-linker-kinase-tail-Ig domains (Figure
3.1). This conserved region acts as a signaling hub by recruiting regulatory
molecules into the formation of a signalosome. In titin, this is the M-line
signalosome that is involved in transcriptional feedback pathways (Lange et al.,

!"#$%&'(5*TUA%@"A2(3A2#H&( ( 01(.'#23&(
:5(
2006). The crystal structures of both TK (Mayans et al., 1998) and TwcK (Hu et al.,
1994; Kobe et al., 1996) show that the kinase domain is autoinhibited by a C-
terminal regulatory tail domain (CRD). Several studies that combined atomic force
microscopy (AFM) and molecular dynamic simulations (MD) have suggested that
stretch activation of the kinase domain may be possible by the unfolding and
rearrangement of the CRD, leaving an active kinase core (Grater et al., 2005;
Puchner et al., 2008; Puchner & Gaub, 2010; Stahl et al., 2011). Such a
mechanically-induced rearrangement of the kinase domain puts TK in a position to
translate mechanical signals into biochemical pathways through components of the
signalosome that assembles on its vicinity.
Fig 3.1. Domain composition of the conserved kinase region of titin-like filaments, (represented by the kinase region of titin). The domains fibronectin (Fn), N-terminal linker (NL), kinase (kin), C-terminal regulatory tail domain (CRD), and Immunoglobulin (Ig) are shown. Titin kinase region domain arrangement, showing the proposed binding site for MuRF1 helical domain
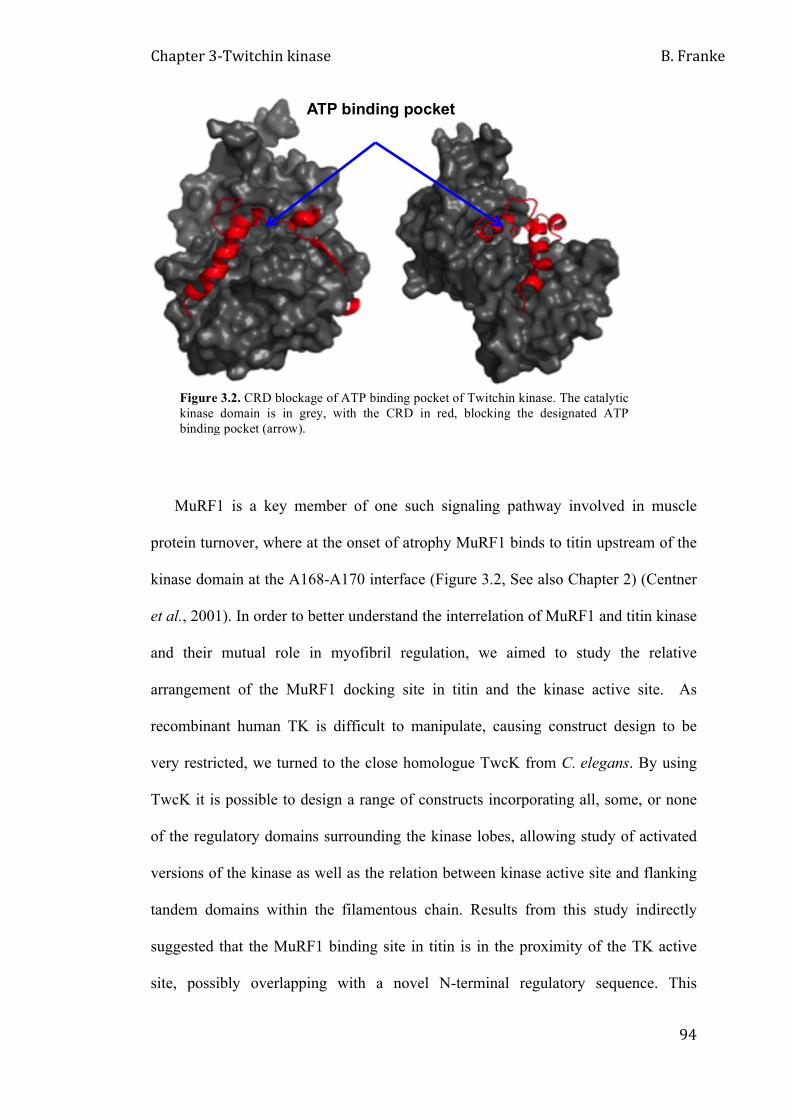
!"#$%&'(5*TUA%@"A2(3A2#H&( ( 01(.'#23&(
:6(
MuRF1 is a key member of one such signaling pathway involved in muscle
protein turnover, where at the onset of atrophy MuRF1 binds to titin upstream of the
kinase domain at the A168-A170 interface (Figure 3.2, See also Chapter 2) (Centner
et al., 2001). In order to better understand the interrelation of MuRF1 and titin kinase
and their mutual role in myofibril regulation, we aimed to study the relative
arrangement of the MuRF1 docking site in titin and the kinase active site. As
recombinant human TK is difficult to manipulate, causing construct design to be
very restricted, we turned to the close homologue TwcK from C. elegans. By using
TwcK it is possible to design a range of constructs incorporating all, some, or none
of the regulatory domains surrounding the kinase lobes, allowing study of activated
versions of the kinase as well as the relation between kinase active site and flanking
tandem domains within the filamentous chain. Results from this study indirectly
suggested that the MuRF1 binding site in titin is in the proximity of the TK active
site, possibly overlapping with a novel N-terminal regulatory sequence. This
ATP binding pocket
Figure 3.2. CRD blockage of ATP binding pocket of Twitchin kinase. The catalytic kinase domain is in grey, with the CRD in red, blocking the designated ATP binding pocket (arrow).

!"#$%&'(5*TUA%@"A2(3A2#H&( ( 01(.'#23&(
:4(
interaction points to a possible functional association (substrate and/or regulator)
between TK and MuRF1.

!"#$%&'(5*TUA%@"A2(3A2#H&( ( 01(.'#23&(
:7(
3.2 Characterization of regulatory domains in twitchin kinase and
molecular insights into its mechanical activation.
This work has been published as part of:
“Identification of an N-terminal inhibitory extension as the primary mechanosensory regulator of
twitchin kinase” Eleonore von Castelmur, Johan Strümpfer, Barbara Franke, Julijus Bogomolovas, Sonia Barbieri, Hiroshi Qadota, Petr V. Konarev, Dmitri I. Svergun, Siegfried Labeit, Guy M. Benian, Klaus Schulten, and Olga Mayans,
Proc Natl Acad Sci U S A. 2012 Aug 21;109(34):13608-13. Epub 2012 Aug 6.
Personal contribution to this manuscript has included: recombinant protein
expression and chromatographic purification of the twitchin kinase region (TwcKR),
which includes the kinase and the flanking FNIII and Ig domains. in E. coli, small
angle x-ray scattering data collection at beamline X33 (EMBL c/o DESY, Hamburg)
and analysis of scattering data using the ATSAS software suite to calculate
molecular parameters and low resolution molecular models. Contributions also
involved the design of recombinant protein production protocols for NL-CRD, NL-
Kin, Kin-CRD and Kin samples (see article for construct composition and definition)
utilized in catalytic assays.
Contributions can be seen in the following sections: Conformation of TwcKR
in solution; Protein production; X-Ray solution scattering. Contribution to figure
preparation includes panels A, B, and C of Fig 3.

!"#$%&'(5*TUA%@"A2(3A2#H&( ( 01(.'#23&(
:8(
This text box is where the unabridged thesis included the following third party copyright material: von Castelmur, E., Strumpfer, J., Franke, B., Bogomolovas, J., Barbieri, S., Qadota, H., Konarev, P.V., Svergun, D.I., Labeit, S., Benian, G.M., Schulten, K., Mayans, O. 2012. “Identification of an N-terminal inhibitory extension as the primary mechanosensory regulator of twitchin kinase.” Proceedings of the National Academy of Sciences of the United States of America 109(34): 13608-13613doi: http://dx.doi.org/10.1073/pnas.1200697109 (

!"#$%&'(5*TUA%@"A2(3A2#H&( ( 01(.'#23&(
//4(
3.3 Preliminary studies towards the characterization of the
catalytically active conformation of twitchin kinase
Kinases are known to undergo a closure of their N- and C-terminal lobes onto
the ATP substrate during their catalytic cycle (Hubbard, 1997; Johnson et al., 2001;
Nolen et al., 2003; Lee et al., 2005; Masterson et al., 2011). However, in titin-like
kinases such domain closure is difficult to reconcile with the principle of activation
by stretch, where both lobes are pulled in opposite directions. Furthermore, the
catalytic domain of titin-like kinases already exist in a semi-primed active state only
prevented of executing catalysis by the steric blockage exerted by the regulatory
extensions. Thus, it is difficult to foresee to what extent these kinases undergo active
site closure during catalysis. To date, none of the kinase members of this family have
been studied in their active conformation and all available models correspond to
sterically inhibited states. Thus, little is known about the conformational cycle
undergone by these kinases during catalysis. Human TK is known to become fully
unstable upon removal of its C-terminal tail (Julijus Bogomolovas & Olga Mayans,
personal communication) and, thus, it is not apt for studies addressing this question.
On the other hand, TwcK has proven to be robust and as shown in previous work
(see section 3.2) the isolated kinase domain can be produced in soluble form, high-
yield and catalytically active. This opens now the opportunity to analyze the
conformation of these kinases upon binding to the ATP and peptide substrates.

!"#$%&'(5*TUA%@"A2(3A2#H&( ( 01(.'#23&(
//7(
3.3.1 Production and analysis of 15N labeled recombinant twitchin kinase
The twitchin kinase construct, consisting of only the kinase domain without
regulatory extensions (Kin), was overexpressed in E. coli Rosetta 2 (DE3) (Novagen)
cells as 15N labeled sample. Overnight cultures were grown at 37°C and used to
inoculate M9 media supplemented with 1g/L 15NH4Cl as a nitrogen source, 20µg/mL
chloramphenicol and 30µg/mL kanamycin, then grown at 30°C to an OD600 of 0.6
Expression was induced by addition of IPTG to a final concentration of 0.5mM.
Cultures were grown at 20°C for further 20 hours post-induction. Cells were
harvested by centrifugation at 6000rpm (6640.92g) for 15 minutes at 4°C. Bacterial
cell pellet was resuspended in 20mL lysis buffer (50mM Tris-HCl pH 7.9, 500mM
NaCl), containing a protease inhibitor cocktail (Roche). Lysis was carried out by
French pressing at 1000 PSIG in the presence of DNAse. The homogenate was
clarified by centrifugation at 18000rpm (41656.68g) for 45 minutes at 4°C. The
supernatant was applied to a Ni2+-chelating His trap column (GE Healthcare)
equilibrated in lysis buffer containing 20mM imidazol and eluted using 200mM
imidazol. The eluate was dialyzed against 50mM Tris-HCl pH 7.9, 200mM NaCl, in
the presence of His-tagged TEV protease at 4°C overnight. The protein was then
subjected to subtractive affinity chromatography. The 15N Twc-kin sample was then
dialyzed against 20mM phosphate pH 7.9, 100mM NaCl.
A Heteronuclear Single Quantum Coherence (HSQC) spectroscopy
experiment was carried out on Kin at a concentration of 169%M at 25°C on a Bruker
AVANCE-II 600MHz spectrometers equipped with a CryoProbe. The buffer
contained 20mM NaPO4 pH7.9, 100mM NaCl, 5% 2H20. Proton chemical shifts were
referenced to external DSS. The 15N chemical shifts were referenced indirectly using

!"#$%&'(5*TUA%@"A2(3A2#H&( ( 01(.'#23&(
//8(
recommended gyromagnetic ratio (Wishart et al., 1995). Spectra were processed
with TopSpin (Bruker).
The resulting spectra can be seen in Fig 3.4. Two distinct groups of signals
are observed in the spectrum of the free protein. One group includes severely
broadened cross-peaks with low intensity, while the other includes much stronger
cross-peaks with smaller line-widths. The dispersion of the chemical shifts in each of
the groups is high and corresponds to the expected for folded proteins. These
characteristics indicate that the kinase is folded, but has internal mobility in the
protein region corresponding to the broadened resonances. Clear two-lobe structure
of the kinase suggests that the internal dynamics localized in one of the lobes that
may be destabilized in the apo form. In an attempt to stabilize the kinase domain
through the binding of AppCp (Jena Bioscience), the experiment was then carried
out again but with the addition of the ATP non-hydrolysable analogue and MgCl2 to
a final concentration of 800%M each. There was no detectable difference in the
resulting spectra. The experiment was then repeated with the addition of ADP to a
final concentration of 800%M. In this instance, there were noticeable changes to the
resulting spectrum with respect to that of the apo form, showing an increase in order
of the Twc-kin structure. However, the ADP spectrum was collected 2 days later and
showed indications of incipient degradation of the sample (Fig 3.4, boxed region).
(NMR experiments were carried out by Dr. Igor Barsukov, University of Liverpool)

!"#$%&'(5*TUA%@"A2(3A2#H&( ( 01(.'#23&(
//9(
Figure 3.3. Chemical structure of ATP and AppCp. The AppCp (Jena Bioscience) analogue has a methyl group at the junction between the !, & phosphate groups.

!"#$%&'(5*TUA%@"A2(3A2#H&( ( 01(.'#23&(
//:(
+ADP
Figure 3.4. HSQC spectra of apo Kin (top) and in the presence of 1mM ADP (bottom). The data show an increase in order in Kin structure upon ADP binding.
Apo

!"#$%&'(5*TUA%@"A2(3A2#H&( ( 01(.'#23&(
/);(
3.4 Summary
For this study, we planned to crystallize the kinase domain in complex with
the ATP analog AppCp (Fig 3.3). However, an initial inspection of the sample using
NMR (Fig 3.4) revealed that the catalytic domain in isolation is, in fact, structurally
compromised. NMR data were supported by the observation that the sample
degrades progressively upon storage at 4oC. This highlights the important role of the
C-terminal tail in providing stability to these kinases. Furthermore, titration
experiments that used ITC (data not shown) and NMR indicated that the chosen
analog AppCp does not interact with Kin, leading us to conclude that this analog is
not suitable for trapping the active conformation in crystallization assays. To address
speculations in this field, we also validated that the kinase sample produced
recombinantly was not autophosphorylated by using P31-NMR (400MHz Bruker
AdvanceII Sectromoeter, 25min accumulation time). No phosphorous group could be
detected after overnight accumulation of Kin sample at a concentration of 1.2mg/mL
As a result of this preliminary study, we concluded that a future strategy to elucidate
the crystal structure of a trapped active TwcK should include the testing of other
non-hydrolysable and phosphate modified analogs such as AMP-PNP, ATP'S,
(Sigma), AppNHp, ApCpp(Nic), ADP!S (Jena Bioscience), as well as ADP, and
metal ion coupled ADP, shown to work with other kinases (Allison et al., 2000;
Bong et al., 2008; Chetnani et al., 2009; Xiaoxia et al., 2011).

!"#$%&'(5*TUA%@"A2(3A2#H&( ( 01(.'#23&(
/)/(
3.5 Future perspectives
This work has revealed fundamental differences in the regulatory regions of
invertebrate and vertebrate titin-like kinases. Twitchin is a protein specific of
nematodes that plays vital roles in sarcomere assembly and maintenance in the worm
(Ferrara et al., 2005). Mutations in the twitchin gene lead to worm phenotypes
ranging from impaired movement to total paralysis (Waterston et al., 1980) and
halved brood populations (Prof. Guy Benian, personal communication). Genomic
data show that twitchin kinase is highly conserved (approx. 75% sequence identity)
across all nematodes (von Castelmur et al., 2012). This suggests that C. elegans is a
good representative model of parasitic nematodes and nematode pests. Related titin-
like kinases have not been identified in plants or bacteria and vertebrate variants (as
those found in human, cattle or fish) are functionally and histologically distant.
Taken together, this suggests that TwcK might serve as a drug target to develop
broad-spectrum nematocides. Based on unique structural features identified in the crystal structure of TwcK,
we estimate that this enzyme can be subject to selective catalytic blockage. Such
blockage can be predicted to impair muscle function, assisting to contain population
numbers and spread. The catalytic inhibition of TwcK is being pursued in
collaboration with Dr Neil Berry (Dept of Chemistry, University of Liverpool) and
Prof Guy Benian (Emory University, Atlanta).

!"#$%&'(6*!#'IA#@(%A%A2( ( 01(.'#23&(
/))(
Chapter 4
Titin elasticity in constitutively expressed Ig arrays
4.1 Introduction
The best characterized physiological function of titin is its development of
passive tension in the sarcomere (Horowits, 1992; Bartoo et al., 1997; Granzier &
Labeit, 2004; Linke & Kruger, 2010; Tskhovrebova & Trinick, 2010). There are
several isoforms of this giant protein where spring elements are differentially spliced,
each providing a varying degree of elasticity to the muscle system they are in.
Differential expression of these isoforms can modify the elastic properties of titin in
a matter of weeks. Additional rapid adjustment mechanisms also exist, as e.g.
phosphorylation of and calcium binding to spring sequences, contributing to
variations in the elastic response of titin to mechanical and physiological demands
(Granzier & Labeit, 2004; Prado et al., 2005; Bassel-Duby & Olson, 2006; Linke &
Kruger, 2010).
It is the elastic region of titin, located in the I-band of the sarcomere, which
provides the myofibril with passive tension. Upon myofibrillar stretch, spring
elements in this region straighten, developing an entropic tension that contributes to
restore the sarcomere to its resting length. Titin elasticity also maintains the thick
filaments centered in the sarcomere ensuring a regular distribution of force and aids
the positioning of active motor filaments (Helmes et al., 2003; Tskhovrebova &
Trinick, 2010). I-band titin contains two main spring components which contribute to
passive tension: the PEVK-rich segment and a poly-Ig array comprising up to 105

!"#$%&'(6*!#'IA#@(%A%A2( ( 01(.'#23&(
/)5(
modules (Bang et al., 2001) (Fig 4.1). Differential splicing of the central section of
the poly-Ig tandem controls the size of the titin isoforms (Freiburg et al., 2000). This
differentially-spliced central region is flanked by two constitutively expressed Ig
tandem arrays: proximal I1-I15, and distal I84-I105, found in all titin isoforms. Both
PEVK and poly-Ig springs are organized in a modular fashion, and function at
different sarcomeric lengths upon stretch. The Ig-tandem is a succession of quasi-
independent globular domains that extend at low force, while the PEVK segment
contains short secondary structure elements such as polyproline type-II helices and
!-turns but no tertiary structure (Gutierrez-Cruz et al., 2001; Ma et al., 2001; Ma &
Wang, 2003) and unravels at higher load. The combined action of both springs
defines the mechanical stiffness of the sarcomere. Finally, heart muscle contains a
third, cardiac-specific spring, so-called N2B which is inserted C-terminally to
domain I15 (Helmes et al., 1999). This is an additional compliant spring that
prevents heart muscle from over-stretch (Helmes et al., 1999; Linke et al., 1999), and
provides a scaffold for the assembly of cardiac-specific stress signaling pathways via
its interaction with &/!-crystalline and FHL1 (Bullard et al., 2004; Sheikh et al.,
2008). Together these spring elements allow titin to contibute to the sarcomeric
stretch mechanism.
The molecular basis of the response to stretch of titin’s I-band components
continues to be poorly understood. Although this phenomenon has been extensively
Figure 4.1. Domain structure of skeletal titin. Domains are: Ig, red; FnIII, white; PEVK segment, yellow; TK, black; unique sequences, blue. The constitutive poly-Ig arrays of the I-band are underlined with a continuous line, differentially spliced regions by a dotted line, both in blue. The end filament forming region according to Houmeida et al., 2008 is underlined in green. (Numbering of titin domains is as in Bang et al., 2001.) Figure provided by O. Mayans. (

!"#$%&'(6*!#'IA#@(%A%A2( ( 01(.'#23&(
/)6(
studied using nanotools, these methodologies finger-print unfolding phenotypes
determined by the secondary structure elements of the Ig fold of individual domains,
(i.e. analyze events at the module level) but do not report on the behaviour of the
chain. Since it has been established that domain unfolding is not a primary
physiological mechanism of titin elasticity (Watanabe et al., 2002; Trombitas et al.,
2003), elucidating the structure and dynamics of the poly-domain chain (at a level
higher than the Ig module) is crucial to establish its mechanistic principles. Previous
members of our laboratory elucidated the first atomic model of an elastic poly-Ig
tandem from titin, namely the 6Ig fragment I65-I70 from the differentially-spliced
central array, which is representative of skeletal muscle isoforms (von Castelmur et
al., 2008). The findings suggested that conserved Ig-Ig transition motifs generate a
certain high-order in the titin filament and led to formulating the first structure-based
mechanistic model of titin, where the mechanics of this polymer was described by a
freely-jointed segmented chain (FJSC) formalism. In this, conformationally stiff
segments interspersed with pliant hinges form a regular pattern of dynamic super-
motifs resulting in segmental flexibility in the chain (in an “accordion”-like mode)
(von Castelmur et al., 2008). This mechanical model, however, does not explain the
behavior of the constitutive Ig-arrays dominating the cardiac isoforms of titin. A
sequence comparison of Ig domains in constitutive and spliced tandems (Marino et
al., 2005), shows pronounced differences in their patterns of conservation,
particularly at the domain interfaces. Marino et al., 2005 subdivided the Ig domains
from titin’s I-band into N-conserved and N-variable according to the following
criteria: (i) the presence of a PPxf motif at the N-terminus in strand A of the tandem
(P=proline, x=any residue, f=hydrophic residue); (ii) the presence of a lengthened
FG !-hirpin with a NxxG motif at its turn (N=asparagine, x=any residue, G-glycine);
!"#$%&'(6*!#'IA#@(%A%A2( ( 01(.'#23&(
/)4(
(iii) a conserved negatively charged group (often glutamate) in the linker sequence;
(iv) length of linkers (Fig 4.2). This showed that all domains from the differentially
spliced regions as well as six domains from the constitutive regions have conserved
features in their N-terminal loop region (N-conserved), while the large majority of
the domains in the constitutive tandems have shorter apical loops, and are also
variable in sequence (N-variable). As a consequence, the conserved features that led
to the proposal of the FJSC mechanical model for the central tandem are not present
in the constitutitive arrays, indicating that the model is not applicable to describe
chain stretch in the latter. This has important physiological connotations as cardiac
muscle is rich in titin isoforms lacking the central tandem. Thus, the study of
constitutive poly-Ig arrays is required to develop a molecular model of titin
mechanics in the heart.

!"#$%&'(6*!#'IA#@(%A%A2( ( 01(.'#23&(
/)7(
Of the constitutively expressed poly-Ig arrays, the distal tandem (at the
junction between the I- and A-bands (Fig. 4.1)) is the most enigmatic. It forms so-
called “end-filament” formations, where six titin molecules associate laterally into an
apparently tubular structure (Houmeida et al., 2008). End-filament formations are
about 100nm long and 6nm wide, and are stalk-like structures that join the tip of each
individual thick myosin filament with the Z-disc (Fig. 4.3a) The number of titin
molecules forming end-filaments has been determined to be six using scanning
transmission microscopy mass measurements on native end filaments in situ
(Liversage et al., 2001). Although the role of these structures is unclear, it is thought
Figure 4.2. Conservation of sequence motifs in Ig tandems from I-band titin: Ig domains and linker segments are represented as 'lled boxes (as indicated). For simplicity, the PEVK region has been excluded. The presence of an extended FG !-hairpin is given as stars, where red shows conservation of the NxxG motif and black represents any other sequence. The conserved E/D group is displayed on top of the correspondinglinker boxes, where blue refers to the C-terminus of strand G and red indicates one additional position (i+1). Linkers are classi'ed as short if containing less than three residues and long otherwise.‘‘Linker’’ sequences are de'ned as those inter-domain residues which could not be reliably predicted to form part of !-strands. In the differentially-expressed tandem a two-residue linker corresponds to a zero inter-domain separation. The conservation of a PP motif in strand A is displayed, as well as proline-rich sequences at the BC loop. Modules for which an atomic structure has been elucidated are marked by a thick bar. Segments for which domain arrangement has been analyzed by SAXS are boxed. Super-repeats of 6–10 Ig domains within the central tandem are marked with a capped-bar (•–•). Taken and adapted from Marino et al., 2005.
!"#$!%&'

!"#$%&'(6*!#'IA#@(%A%A2( ( 01(.'#23&(
/)8(
that they prevent titin interference with the acto-myosin cross-bridges during muscle
contraction (Bennett et al., 1997; Houmeida et al., 2008). Houmeida et al. suggested
that the distal I-band domains would mediate end-filament formation by establishing
electrostatic interactions between neighboring titin molecules during early stages of
sarcomere assembly. It has been proposed that the electrostatic attraction is caused
by each Ig domain having a largely positively charged side, whilst the other side of
the domain is predominately negative (Houmeida et al., 2008) (Fig. 4.3b and c).
Predictably, the large end-filaments quternary structure must be stiff and
inextensible, influencing the elastic properties of titin in that region. Given that
aberrations in titin are emerging as a causative factor of heart failure, a need for
further knowledge of the structure and mechanical-response of cardiac titin exists
(Watanabe et al., 2002; Granzier et al., 2005; Gerull et al., 2006; Yoskovitz et al.,
2012) .
&"#
$"#
!"#
Figure 4.3. End-filaments and their proposed electrostatic association. a) Native end-filament at the tip of a thick filament. b) Space-filling models showing complementary electrostatic potentials on opposite sides of domain I27 (red, positive, blue negative), the four views are related by 90° rotations. c) Diagrams showing end-on views of three possible packing models of titin strands in end-filaments. Adapted from Houmeida et al., 2008

!"#$%&'(6*!#'IA#@(%A%A2( ( 01(.'#23&(
/)9(
4.2 Aims
Currently, no knowledge exists of the atomic structure of end-filament
formations from titin. Here, we aim to reveal the architecture of these formations by
studying the structure of poly-domain fragments from the I/A band junction.
Previous work in our laboratory (Eleonore von Castelmur & O. Mayans,
unpublished) has been successful in establishing the overexpression in E.coli of the
recombinant 6-domain fragment Ig101-Fn106, including the last five Ig domains of
the I-band and the first FnIII domain of the I/A junction. Gel filtration data indicated
that this protein fragment self-assembles into high molecular weight formations (so
that it serves as reference in the following, the gel filtration chromatogram of that
construct is reproduced in this document; Fig. 4.4 with permission). Initial
crystallization conditions were identified that yielded crystals with thin plate
morphology (approx. 300x100x5mm3) and in an irradiation test at beamline I04
(DIAMOND, Didcot) the crystals showed diffraction patterns to resolutions of ~8Å
(the low-resolution predictably due to the thin habit of the crystals). In addition of
being of limited diffraction quality, the crystals were also poorly reproducible. To
overcome these problems, two alternate constructs were designed, I102-I106 and
I102-I106OVH (description below), and these are the subject of the current study. This
is a preliminary study aimed to test the suitability of these samples to explore the
formation of end-filaments by titin.

!"#$%&'(6*!#'IA#@(%A%A2( ( 01(.'#23&(
/):(
4.3 Methods
4.3.1 Cloning
Two constructs from human titin (uni-prot Q8WZ42) were created: I102-I106
(residues 13660-14119) and I102-I106OVH (residues 13648-14120).
The I102-I106 construct was amplified with Phusion High-Fidelity DNA Polymerase
(NEB) with the following primer pair:
T I 102-I106 forward primer: 5’ CAT GCC ATG GAC CTT AGG ATT GTT G 3’
T I 102-I106 reverse primer 5’ CATG GGT ACC TTA TAC AGG ATT GTC AGT TT 3’
PCR products were inserted into the PETM-11 expression vector using the
Nco1 and Kpn1 restriction sites (in bold above). The vector pETM-11 includes an N-
terminal His-tag and a TEV protease cleavage site prior to the insterted sequence.
Both constructs were verified by sequencing (Geneservice).
The I102-I106OVH construct was provided by Prof. Siegfried Labeit
(Universitätsklinikum Mannheim) in a pETM-11 expression vector. It spans the full
sequence of I102-I106 plus an extra 12 residues at the N- terminus (corresponding to
!-strand G of I101) and 10 residues at the C-terminus (corresponding to !-strands A-
A’ of I107) (OVH refers to the presence of overhangs in this fragment).

!"#$%&'(6*!#'IA#@(%A%A2( ( 01(.'#23&(
/5;(
4.3.2 Protein production
Samples were overexpressed in E. coli Rosetta 2 (DE3) (Novagen) cells.
Cultures were grown at 30°C up to an OD600 of 0.6 in Luria Bertani medium
supplemented with 20µg/mL chloramphenicol and 30µg/mL kanamycin. Expression
was induced by addition of IPTG to a final concentration of 1mM. Cultures were
grown at 20°C for a further 20 hours post-induction. Cells were harvested by
centrifugation at 6000rpm (6640.92g) for 15 minutes at 4°C. Bacterial cell pellet was
resuspended in 20mL lysis buffer containing 25mM MOPS, pH 7.4, 300mM NaCl,
0.5mM !-ME. Clarified cell supernatant was applied to a Ni2+-chelating Histrap
column (GE Healthcare) equilibrated in lysis buffer containing 10mM imidazol and
eluted using 100-200mM imidazol. The eluant was dialyzed against 25mM MOPS,
pH 7.4, 150mM NaCl, 1mM !-ME in the presence of his-tagged TEV protease at
4°C overnight. The proteins were then subjected to subtractive affinity
chromatography, prior to anion exchange chromatography on a Mono Q 5/50 GL
(GE Healthcare) column. The latter was in 25mM MOPS, pH 7.4, 50mM NaCl, and
elution was carried out with an increasing NaCl gradient ranging from 50mM to 1M.
A final size exclusion chromatography step used a Superdex 200 16/60 prep grade
Hi-load (GE Healthcare) column in 25mM MOPS, pH 7.4 100mM NaCl, 0.5mM !-
ME. Titin I102-I106OVH was concentrated to 10 and 15mg/mL, whilst I102-I106 was
concentrated to ~17mg/mL, and both stored at 4°C until further use.

!"#$%&'(6*!#'IA#@(%A%A2( ( 01(.'#23&(
/5/(
4.3.3 Small angle X-ray scattering
SAXS data were collected on the EMBL beamline X33 (DESY, Hamburg)
using a photon counting Pilatus 1M detector (DECTRIS, Switzerland). I102-I106OVH
samples were measured at solute concentrations of 0.76, 1.54, 4.58, 9.87mg/mL. The
scattering intensity I in the range of momentum transfer 0.01 < s < 0.45 Å-1 was
recorded (s = 4) sin"/*, where * = 1.5Å is the X-ray wavelength and 2" is the
scattering angle) at a sample-detector distance of 2.7m. Radiation damage, monitored
by repetitive 15 sec exposures, was negligible. Background scattering was subtracted
and data reduced, normalized and extrapolated to infinite dilution using PRIMUS
(Konarev et al., 2003). Also in PRIMUS, the forward scattering I(0) and the radius of
gyration Rg were evaluated using the Guinier approximation (Guinier, 1939). These
parameters were also computed from the entire scattering patterns using the indirect
transform package GNOM (Svergun, 1992), providing also the pair distribution
function of the particle p(r) and the maximum size Dmax. The molecular mass (MM)
was estimated from I(0) by normalization against reference solutions of bovine
serum albumin and it indicated the sample to be a multimer made up of, possibly, 4-5
molecules.
Ab initio models were created in DAMMIF (Franke & Svergun, 2009), where
a simulated annealing algorithm is employed to construct a model with a "chain"-like
distribution of beads that provides the best fit to the experimental data. The 12 ab
initio models produced with DAMMIF were aligned and averaged in DAMAVER
(Volkov & Svergun, 2003) to produce an averaged “filtered” model. Ab initio models
were produced by Dr. Petr Konarev (EMBL c/o DESY, Hamburg).

!"#$%&'(6*!#'IA#@(%A%A2( ( 01(.'#23&(
/5)(
4.3.4 Size Exclusion Chromatography coupled to Multiangle Laser Light
Scattering
SEC-MALLS measurements were carried out at the Wellcome Trust Centre
for Cell-Matrix Research of the Univeristy of Manchester with the assistance of
Marjorie Howard. For this, 500%L of purified I102-I106 at a concentration of
0.78mg/mL was applied to a Superdex 200 10/300GL gel filtration column (GE
Healthcare) running at a flow rate of 0.75mL/min in a buffer containing 25mM
MOPS pH 7.4, 100mM NaCl, 0.5mM !-ME. Samples eluting from the column
passed through an in-line DAWN HELEOS-II (Wyatt) laser photometer (laser
wavelength 658 nm) and an Optilab rEX refractometer (Wyatt) with a QELS
dynamic light scattering attachment. Light scattering intensity and eluant refractive
index (concentration) were analyzed using ASTRA v5.3.4.13 software (Wyatt
technologies) to give a weight-averaged molecular mass (MW). A specific refractive
index increment (dn/dc) value of 0.180mL/g was used. To determine the detector
delay volumes and normalization coefficients for the MALLS detector, a BSA
sample (Sigma A-8531) was used as reference.
4.3.5 Crystallization
Titin I102-I106OVH was screened against 288 different conditions at two
concentrations (10 and 15mg/mL). Crystallization was carried out at room
temperature (~22°C) using the sitting drop vapour diffusion method with 70mL
reservoir and a 1:1 protein:reservoir drop with a final volume of 2µL, using 96-well

!"#$%&'(6*!#'IA#@(%A%A2( ( 01(.'#23&(
/55(
MRC plates (Molecular Dimensions). Crystallization matrices used for initial
screening of this construct were: Hampton Crystal I and II (Hampton Research);
Wizard I and II (Emerald Biosystems); CRYO I and II (Emerald Biosystems). Some
initial hits were obtained in PEG and ammonium sulfate based conditions.
Refinement of these conditions, which included varying PEG type and concentration
and varying AmSO4 concentrations, did not improve the quality of the crystals.
The crystalizability of I102-I106 was screened using a Screenmaker 96+8
nanorobot (Innovadyne) and the sitting drop vapour difussion method at room
temprature (~22°C), with 80µL reservoir and a 1:1 protein:reservoir drop with a final
volume of 200nL using 96-well Intelliplates (Alpha Biotech). Crystallization
matrices used for screening were: Hampton Crystal I & II, PEG Rx I & II (Hampton
Research); Wizard I & II, CRYO I & II (Emerald Biosystems); JCSG+, PEGs,
PACT, pH Clear II, Anions, Cations; MPD, Classics; Classics II, and Cryos Suites
(QIAGEN).

!"#$%&'(6*!#'IA#@(%A%A2( ( 01(.'#23&(
/56(
4.4 Results and Discussion
4.4.1 Production and characterization of I102-I106 & I102-I106OVH
I102-I106 and I102-I106OVH were overexpressed in E. coli in soluble form.
Both samples were purified to high homogeneity using chromatographic approaches
(Fig 4.5 and 4.6, Fig 4.4 shows chromatogram of I101-I106) and final yields were
between 15-20 mg of purified protein per L bacterial culture for both constructs.
A comparison of exclusion volumes in size exclusion chromatograms of
samples I102-I106 and I102-I106OVH (Fig 4.2 and 4.3) indicates that the OVH
version is of a higher oligomeric state, as the extra 22 residues would not account for
the large difference in exclusion volume (approx. 11mL).

!"#$%&'(6*!#'IA#@(%A%A2( ( 01(.'#23&(
/54(
Figure 4.4. Size exclusion chromatography of titin I101- I106 on superdex 200 (16/60 PG) column. The column void volume (Vo) and the exclusion volume (Ve) of titin I101-I106 are indicated . Inset SDS-PAGE shows purity of sample ,theoretical molecular weight of this construct is 63.94kDa. Figure provided by E. von Castelmur.
Figure 4.5. Size exclusion chromatography of titin I102- I106OVH on a Superdex 200 (16/60 PG) column. The column void volume (Vo) and the exclusion volume (Ve) of titin I102-I106 OVH are indicated .The red box outlines pure fractions visualized in the inset SDS-PAGE that were utilized for biophysical characterisation (
Figure 4.6. Size exclusion chromatography of titin I102-I106 on a Superdex 200 (16/60 PG) column. The column void volume (Vo) and the exclusion volume (Ve) of titin I102-I106 are indicated. The red box outlines pure fractions visualized in the inset SDS-PAGE that were utilized for biophysical characterization. (

!"#$%&'(6*!#'IA#@(%A%A2( ( 01(.'#23&(
/57(
4.4.2 Oligomeric state determination of I102-I106
As both I102-I106 and I102-I106OVH samples are anisometric, their molecular
weight cannot be reliably estimated using gel filtration chromatography, where their
weight will appear larger. Thus, we instead used SEC-MALLS to estimate the
oligomerization state, a method that is independent of the molecular hydrodynamic
radius. SEC-MALLS data of I102-I106 (Fig 4.7) were of high quality and showed
that the sample is monomeric and monodisperse in solution. The molecular mass
measured experimentally was 53.55kDa, which was in excellent agreement with that
calculated from sequence data of 51.7kDa. During this preliminary study, SEC-
MALLS data for samples I102-I106OVH and I101-I106 could not be acquired and,
thus, their level of assembly remains unknown. The acquisition of these data will be
subject of future work.
!"#
-./012# @*A*# BCD*+GVVS(F&#H,'&F&2%(B>( %A%A2( =/;)*/;71(GK&'#D&(FB?&@,?#'(F#HH( W'&I(?A2&M(#2I(2B'F#?AX&I('&>'#@%AK&(A2I&Q(W@B2%A2,B,H(L?#@3(?A2&M(#'&(H"BU21(T"&(%"&B'&%A@#?(F#HH(B>(#(FB2BF&'(B>(%"AH(@B2H%',@%(AH(A2IA@#%&I(UA%"(#(D'&E(I#H"&I(?A2&1(#

!"#$%&'(6*!#'IA#@(%A%A2( ( 01(.'#23&(
/58(
These data strongly suggest that the higher association of I101-I106 is
mediated by domain I101. This finding is highly unexpected and opposes the current
belief that all domains in the I/A junction are believed to contribute similarly to end-
filament formation, namely by presenting a relatively low affinity that could add
over long stretches of the titin chain to result in a cooperative association. Further, it
can also be deduced that the self-assembly of I102-I106OVH is induced by the
presence of the overhang sequences. These correspond to the last and first !+strands
of Ig domains flanking I102-I106. !-strands contain a number of unsatisfied
hydrogen bond donors and acceptors and are well-known to self-associate into !-
sheets to form a stable state. Crystallographic structures of Ig-domains from titin in
complex with their sarcomeric binding partners indicate that the primary mode of
interaction in these domains is by the formation of an intermolecular !-sheet,
commonly involving !-strand G (Pinotsis et al., 2006; Pernigo et al., 2010; Sauer et
al., 2010). It is to be seen whether inter-strand association is also involved in end-
filament formation in titin and, thus, whether the overhang strands in I102-I106OVH
can induce a native-like state of association. Although the comparable migration in
size exclusion chromatography of I102-I106OVH and I101-I106, 60.2mL and 57.8mL
respectively, suggest that indeed their oligomeric states might be similar (see Fig 4.4
and 4.5).

!"#$%&'(6*!#'IA#@(%A%A2( ( 01(.'#23&(
/59(
4.3.4 Preliminary crystallographic analysis of I102-I106
The monodispersity of the I102-I106 fragment monitored by SEC-MALLS
suggested that this sample is ameneable to crystallization. Effectively, a nanodrop
multi-screening of this sample yielded crystalline formations under a range of
conditions (Table 4.1). Example images of these crystal morphologies can be seen in
Fig 4.8.
Table 4.1. Initial crystallization hits obtained for Titin I102-I106.
Condition Mother liquor Crystal Morphology
CSII-2 0.5M NaCl, 0.01M CTAB, 0.01M MgCl2 Spherulites
CSII-44 20% ethanol, 0.1M Tris, pH 8.5 Spherulites
CSII-46 20% PEG MME 550, 0.1M Bicine, pH 9.0, 0.1M NaCl Spherulites
WizI-12 20% PEG 1000, 0.1M imidazole, pH 8.0, Ca(OAc)2 Intergrown clusters
Wiz1-42 15% ethanol, 0.1M Tris, pH 7.0 Sphererulites
WizII-8 10% PEG 8000, Na/K phosphate, pH 6.2, 0.2M NaCl Microneedles
WizII-18 20% PEG 3000, 0.1M Tris pH 7.0, 0.2M Ca(OAc)2 Needle
WizII-19 1.6M NaH2PO4/0.4M K2HPO4, phosphate-citrate pH 4.2 Microneedles
WizII-32 20% PEG 1000, Tris pH 8.5 Intergrown clusters
CryoI-7 40% ethanol, Tris pH8.5, 0.05M MgCl2 Intergrown clusters
CryoI-18 35% 2-ethoxyethanol, imidazole pH 8.0, 0.05M Ca(OAc)2 Microneedles
CryoI-35 40% ethylene glycol, HEPES pH 7.5, 5% PEG 3000 Intergrown clusters
PEGRxI-9 0.1M Tris ph 8.0, 30% PEG 400 Needle
PEGRxI-10 0.1M sodium citrate tribasic dihydrate pH 5.0, 30% PEG MME
550
Needle
PEGRxI-12 0.1M Bis-Tris propane pH 9.0, 20% PEG MME 550 Needle
PEGRxI-18 0.1M HEPES pH 7.5, 30% PEG 1000 Needle
PEGRxI-22 0.1M sodium acetate trihydrate pH 4.0, 20% PEG MME 2000 Needle
PEGRxII-43 5%v/v (+/-)-2-Methyl-2-4-pentandiol, 0.1M Bis-Tris pH 6.5,
10% PEG 10000
Needle clusters
CLASII-85 0.2M MgCL2 0.1M Tris pH 8.5, 25% PEG 3350 Blade
CryoQ-64 0.085M Hepes pH 7.5, 8.% PEG 8000, 15% Glycerol Intergrown clusters
PACT-76 0.2M potassium thiocyanate, 0.1M Bis Tris propane pH 7.5, 20%
PEG 3350
Needle
CS: Crystal Screen (Hampton Research); Wiz: Wizard Screen (Emerald Biosystems); Cryo: CRYO Screen (Emerald Biosystems); PEGRx (Hampton Research);CLASII: Classics II Screen (Qiagen); CryoQ: Cryo Screen (Qiagen); PACT: PACT Premier Screen (Molecular Dimensions). In bold are the conditions which yielded crystals of diffraction quality.

!"#$%&'(6*!#'IA#@(%A%A2( ( 01(.'#23&(
/5:(
Figure 4.8. Titin I102-I106 crystals obtained from screening conditions. a) intergrown clusters, CryoI-35; b) Needles, PACT-76; c) blade, CLASII-85; d) needle clusters PEGRxII-43; e) needle, PEGRxI-9; f) needle, PEGRxI-12. Designations correspond to those given in Table 5.1
!"#
2"#
$"# %"#
&"#
7"#

!"#$%&'(6*!#'IA#@(%A%A2( ( 01(.'#23&(
/6;(
Crystals from two conditions (indicated in Table 4.1) could be harvested by
flash freezing in liquid nitrogen and subjected to diffraction tests at the DIAMOND
synchrotron (Oxford, UK) (Fig. 4.9 and 4.10). Crystals from CLASSII-85 had a thin
plate morphology and showed ordered diffraction patterns to ~2.9Å resolution (prior
cryo-protection used mother liquor supplemented with 20% PEG400). Crystals in the
form of thin needes were recovered from condition PEGRxI-9 and yielded weak
diffraction data to ~6-8Å resolution. This result strongly indicates that the
crystallographic elucidation of the structure of I102-I106 is feasible upon refinement
of crystallization media.
On the other hand, a brief screening of the I102-I106OVH fragment did not
result in crystalline formations being obtained.

!"#$%&'(6*!#'IA#@(%A%A2( ( 01(.'#23&(
/6/(
Figure 4.9. X-ray diffraction pattern of I102-I106 crystals fom condition CLASSII-85. X-ray diffraction tests were carried out at beamline I24 in Diamond (Oxford), at a wavelength of 0.9686Å. Diffraction patterns were recorded on a Pilatus 6M detector (

!"#$%&'(6*!#'IA#@(%A%A2( ( 01(.'#23&(
/6)(
Figure 4.10 X-ray diffraction pattern of I102-I106 crystals fom condition PEGRxI-10. X-ray diffraction tests were carried out at the fixed monochromatic beamline I04-1 in Diamond (Oxford), at a wavelength of 0.9163Å. Diffraction patterns were recorded on a Pilatus 2M detector

!"#$%&'(6*!#'IA#@(%A%A2( ( 01(.'#23&(
/65(
4.4.2 Conformational analysis of I102-I106OVH in solution
We explored the overall molecular parameters of the I102-I106OVH assembly
in solution using SAXS. The overall molecular parameters derived from scattering
data, the experimental scattering pattern, and the particle distance distribution
function are given in Table 4.2, Fig. 4.11, and 4.12 respectively.
Table 4.2 SAXS analysis of titin I102-I106OVH
sdsdsds
2-1/A1OVH
ddfdfdfd
MM (kDa) 222.4±10.6
MMcalc (kDa) 54.2
Rg (Å) 57.5±4
Dmax 185
#AB 1.28
Molecular mass (MM), Radius of gyration (Rg), maximum dimension (Dmax), and goodness of fit (#) are given. Calc refers to values calculated from sequence, AB to the ab initio model.

!"#$%&'(6*!#'IA#@(%A%A2( ( 01(.'#23&(
/66(
-./012# @*??*( .A%%A2D(B>( #L( A2A%AB(FBI&?(B2%B( &Q$&'AF&2%#?( @,'K&H( B>( =/;)*=/;7RYC1(T"&( #L(A2A%AB( ( (FBI&?( WL?#@3( ?A2&M( @#?@,?#%&I(UA%"(JG++GYZ-(U#H( >A%%&I( B2%B( &Q$&'AF&2%#?(I#%#(WL?,&(@A'@?&HM[(&''B'(L#'&H(#'&(H"BU21((
-./012#@*?+*(JAH%#2@&(IAH%'AL,%AB2(>,2@%AB2(B>(%A%A2(=/;)*=/;7RYC(T"&(JF#Q(B>(%"&(FB?&@,?&(AH(/9142F1((T"&(E(*#QAH(,2A%H(#'&(#'L'A%'#'E1(

!"#$%&'(6*!#'IA#@(%A%A2( ( 01(.'#23&(
/64(
The characterization of the modified I102-I106OVH fragment using SAXS
showed that the molecule is monodisperse at high concentration in solution (0.7-
15.5mg/mL assayed). The molecular mass estimated from scattering data indicates
that the oligomeric state of the sample is likely to be tetrameric or higher, although
analytical data are required to establish this point. Ab initio sphere models computed
to date suggest that in I102-I106OVH formations poly-Ig titin chains associate
laterally to form a semi-hollow cylindrical object (Fig 4.13). This agrees excellently
with expectations for “end-filaments”, and is the first time that the lateral association
of titin has been reproduced in vitro as is suitable for further analysis.
Taken together, crystallographic and SAXS results to date suggest that the
fitting of an atomic crystallographic structure of I102-I106 to SAXS data using rigid-
body protocols at those implemented in SASREF and/or fitting onto low resolution
envelopes might be a viable strategy to reconstruct an overall model of the end-
filament formations of titin.
-./012#@*?31(GL(A2A%AB(FBI&?(B>(%A%A2(=/;)*=/;7RYC1(

!"#$%&'(6*!#'IA#@(%A%A2( ( 01(.'#23&(
/67(
4.5 Conclusion
Previous biochemical and biophysical studies on fragments from the distal I-
band tandem of titin used short constructs (2-4 domains in length) that did not exhibit
a tendency to self-interact (Improta et al., 1998). To our knowledge, the current
study of I101-I106 and I102-I106 is the first, where the higher-level association of
distal I-band arrays has been observed using recombinant samples. The features of
the assembly possibly indicate that “end-filament”-like structures can be
reconstituted in vitro in conditions compatible with their atomic analysis.
Importantly, we have obtained diffracting crystals of the monomeric I102-I106
sample that can lead to structural elucidation. This will illustrate the packing
principle of the distinct N-variable Ig type along the titin chain as well as opening the
opportunity to reconstruct models of assemblies from SAXS data. These data prove
the feasibility and promise of this project.
Moreover, contrary to current belief, our preliminary data indicate that not all
domains from the I-A junction of titin have a similar capability to induce chain
assembly. Our preliminary data suggest that certain domains (as possibly I101) might
be deterministic of inducing assembly, we term these “catch” domains. Other
domains might only self-associate weakly and when brought in close contact through
vicinal confinement. Based on this concept, we propose a novel “catch and zipper”
model of cooperative end-filament formation. The validity of this model will be
investigated using structural and biophysical techniques in future work.

!"#$%&'(4*-&>&'&2@&H( ( 01(.'#23&(
/68(
Chapter 5:
References
Adams PD, Afonine PV, Bunkoczi G, Chen VB, Davis IW, Echols N, Headd JJ, Hung LW, Kapral GJ, Grosse-Kunstleve RW, McCoy AJ, Moriarty NW, Oeffner R, Read RJ, Richardson DC, Richardson JS, Terwilliger TC, Zwart PH. 2010. PHENIX: a comprehensive Python-based system for macromolecular structure solution. Acta Crystallographica Section D, Biological crystallography 66(2): 213-221.
Allison WS, Ren H, Dou C. 2000. Inhibitory Mg-ADP-fluoroaluminate complexes bound to catalytic sites of F(1)-ATPases: are they ground-state or transition-state analogs? Journal of Bioenergetics and Biomembranes 32(5): 531-538.
Altschul SF, Gish W, Miller W, Myers EW, Lipman DJ. 1990. Basic local alignment search tool. Journal of Molecular Biology 215(3): 403-410.
Argiles JM, Busquets S, Felipe A, Lopez-Soriano FJ. 2005. Molecular mechanisms involved in muscle wasting in cancer and ageing: cachexia versus sarcopenia. The International Journal of Biochemistry & Cell Biology 37(5): 1084-1104.
Arndt KM, Pelletier JN, Muller KM, Alber T, Michnick SW, Pluckthun A. 2000. A heterodimeric coiled-coil peptide pair selected in vivo from a designed library-versus-library ensemble. Journal of Molecular Biology 295(3): 627-639.
Arndt KM, Pelletier JN, Muller KM, Pluckthun A, Alber T. 2002. Comparison of in vivo selection and rational design of heterodimeric coiled coils. Structure 10(9): 1235-1248.
Arya R, Kedar V, Hwang JR, McDonough H, Li HH, Taylor J, Patterson C. 2004. Muscle ring finger protein-1 inhibits PKC{epsilon} activation and prevents cardiomyocyte hypertrophy. The Journal of Cell Biology 167(6): 1147-1159.
Bailey S. 1994. The Ccp4 Suite - Programs for Protein Crystallography. Acta Crystallographica Section D, Biological Crystallography 50(5): 760-763.
Bang ML, Centner T, Fornoff F, Geach AJ, Gotthardt M, McNabb M, Witt CC, Labeit D, Gregorio CC, Granzier H, Labeit S. 2001. The complete gene sequence of titin, expression of an unusual approximately 700-kDa titin isoform, and its interaction with obscurin identify a novel Z-line to I-band linking system. Circulation Research 89(11): 1065-1072.
Bartoo ML, Linke WA, Pollack GH. 1997. Basis of passive tension and stiffness in isolated rabbit myofibrils. The American Journal of Physiology 273(1): C266-276.

!"#$%&'(4*-&>&'&2@&H( ( 01(.'#23&(
/69(
Bassel-Duby R, Olson EN. 2006. Signaling pathways in skeletal muscle remodeling. Annual Review of Biochemistry 75: 19-37.
Bennett PM, Hodkin TE, Hawkins C. 1997. Evidence that the tandem Ig domains near the end of the muscle thick filament form an inelastic part of the I-band titin. Journal of Structural Biology 120(1): 93-104.
Bernado P, Mylonas E, Petoukhov MV, Blackledge M, Svergun DI. 2007. Structural characterization of flexible proteins using small-angle X-ray scattering. Journal of the American Chemical Society 129(17): 5656-5664.
Bibby J, Keegan RM, Mayans O, Winn MD, Rigden DJ. 2012. AMPLE: A cluster-and-truncate approach to solve crystal structures of small proteins using rapidly computed ab initio models. Acta Crystallographica Section D, Biological Crystallography 68(12):1622-1631.
Bodine SC, Latres E, Baumhueter S, Lai VK, Nunez L, Clarke BA, Poueymirou WT, Panaro FJ, Na E, Dharmarajan K, Pan ZQ, Valenzuela DM, DeChiara TM, Stitt TN, Yancopoulos GD, Glass DJ. 2001. Identification of ubiquitin ligases required for skeletal muscle atrophy. Science 294(5547): 1704-1708.
Bong SM, Moon JH, Nam KH, Lee KS, Chi YM, Hwang KY. 2008. Structural studies of human brain-type creatine kinase complexed with the ADP-Mg2+-NO3- -creatine transition-state analogue complex. FEBS Letters 582(28): 3959-3965.
Bonneau R, Strauss CE, Rohl CA, Chivian D, Bradley P, Malmstrom L, Robertson T, Baker D. 2002. De novo prediction of three-dimensional structures for major protein families. Journal of Molecular Biology 322(1): 65-78.
Brown JH, Cohen C, Parry DA. 1996. Heptad breaks in alpha-helical coiled coils: stutters and stammers. Proteins 26(2): 134-145.
Brunger AT. 1992. Free R value: a novel statistical quantity for assessing the accuracy of crystal structures. Nature 355(6359): 472-475.
Brunger AT. 1997. Free R value: cross-validation in crystallography. Methods in Enzymology 277: 366-396.
Budhidarmo R, Nakatani Y, Day CL. 2012. RINGs hold the key to ubiquitin transfer. Trends in Biochemical Sciences 37(2): 58-65.
Bullard B, Ferguson C, Minajeva A, Leake MC, Gautel M, Labeit D, Ding L, Labeit S, Horwitz J, Leonard KR, Linke WA. 2004. Association of the chaperone alphaB-crystallin with titin in heart muscle. The Journal of Biological Chemistry 279(9): 7917-7924.
Bullard B, Linke WA, Leonard K. 2002. Varieties of elastic protein in invertebrate muscles. Journal of Muscle Research and Cell Motility 23(5-6): 435-447.
Burkhard P, Stetefeld J, Strelkov SV. 2001. Coiled coils: a highly versatile protein folding motif. Trends in Cell Biology 11(2): 82-88.

!"#$%&'(4*-&>&'&2@&H( ( 01(.'#23&(
/6:(
Butler TM, Siegman MJ. 2011. A force-activated kinase in a catch smooth muscle. Journal of Muscle Research and Cell Motility 31(5-6): 349-358.
Centner T, Yano J, Kimura E, McElhinny AS, Pelin K, Witt CC, Bang ML, Trombitas K, Granzier H, Gregorio CC, Sorimachi H, Labeit S. 2001. Identification of muscle specific ring finger proteins as potential regulators of the titin kinase domain. Journal of Molecular Biology 306(4): 717-726.
Chen SN, Czernuszewicz G, Tan Y, Lombardi R, Jin J, Willerson JT, Marian AJ. 2012. Human Molecular Genetic and Functional Studies Identify TRIM63, Encoding Muscle RING Finger Protein 1, as a Novel Gene for Human Hypertrophic Cardiomyopathy. Circulation Research 111(7): 907-919.
Chetnani B, Das S, Kumar P, Surolia A, Vijayan M. 2009. Mycobacterium tuberculosis pantothenate kinase: possible changes in location of ligands during enzyme action. Acta Crystallographica Section D, Biological Crystallography 65(4): 312-325.
Clark KA, McElhinny AS, Beckerle MC, Gregorio CC. 2002. Striated muscle cytoarchitecture: an intricate web of form and function. Annual Review of Cell and Developmental Biology 18: 637-706.
Cohen S, Brault JJ, Gygi SP, Glass DJ, Valenzuela DM, Gartner C, Latres E, Goldberg AL. 2009. During muscle atrophy, thick, but not thin, filament components are degraded by MuRF1-dependent ubiquitylation. The Journal of Cell Biology 185(6): 1083-1095.
Cole C, Barber JD, Barton GJ. 2008. The Jpred 3 secondary structure prediction server. Nucleic Acids Research 36(Web Server issue): W197-201.
Crick FHC. 1953. The Packing of Alpha-Helices - Simple Coiled-Coils. Acta Crystallographica 6(8-9): 689-697.
Dai KS, Liew CC. 2001. A novel human striated muscle RING zinc finger protein, SMRZ, interacts with SMT3b via its RING domain. The Journal of Biological Chemistry 276(26): 23992-23999.
Diaz-Griffero F, Qin XR, Hayashi F, Kigawa T, Finzi A, Sarnak Z, Lienlaf M, Yokoyama S, Sodroski J. 2009. A B-box 2 surface patch important for TRIM5alpha self-association, capsid binding avidity, and retrovirus restriction. Journal of Virology 83(20): 10737-10751.
Emsley P, Lohkamp B, Scott WG, Cowtan K. 2010. Features and development of Coot. Acta Crystallographica Section D, Biological Crystallography 66(4): 486-501.
Evans G, Pettifer RF. 2001. CHOOCH: a program for deriving anomalous-scattering factors from X-ray fluorescence spectra. Journal of Applied Crystallography 34: 82-86.
Faulkner JA, Davis CS, Mendias CL, Brooks SV. 2008. The aging of elite male athletes: age-related changes in performance and skeletal muscle structure

!"#$%&'(4*-&>&'&2@&H( ( 01(.'#23&(
/4;(
and function. Clinical Journal of Sport Medicine : official journal of the Canadian Academy of Sport Medicine 18(6): 501-507.
Ferrara TM, Flaherty DB, Benian GM. 2005. Titin/connectin-related proteins in C. elegans: a review and new findings. Journal of Muscle Research and Cell Motility 26(6-8): 435-447.
Fielitz J, van Rooij E, Spencer JA, Shelton JM, Latif S, van der Nagel R, Bezprozvannaya S, de Windt L, Richardson JA, Bassel-Duby R, Olson EN. 2007. Loss of muscle-specific RING-finger 3 predisposes the heart to cardiac rupture after myocardial infarction. Proceedings of the National Academy of Sciences of the United States of America 104(11): 4377-4382.
Franke D, Svergun DI. 2009. DAMMIF, a program for rapid ab-initio shape determination in small-angle scattering. Journal of Applied Crystallography 42(2): 342-346.
Freiburg A, Trombitas K, Hell W, Cazorla O, Fougerousse F, Centner T, Kolmerer B, Witt C, Beckmann JS, Gregorio CC, Granzier H, Labeit S. 2000. Series of exon-skipping events in the elastic spring region of titin as the structural basis for myofibrillar elastic diversity. Circulation Research 86(11): 1114-1121.
Garcia P, Ucurum Z, Bucher R, Svergun DI, Huber T, Lustig A, Konarev PV, Marino M, Mayans O. 2006. Molecular insights into the self-assembly mechanism of dystrophia myotonica kinase. FASEB Journal : official publication of the Federation of American Societies for Experimental Biology 20(8): 1142-1151.
Garcia-Mayoral MF, Castano R, Fanarraga ML, Zabala JC, Rico M, Bruix M. 2011. The solution structure of the N-terminal domain of human tubulin binding cofactor C reveals a platform for tubulin interaction. PloS one 6(10): e25912.
Garman E, Murray JW. 2003. Heavy-atom derivatization. Acta Crystallographica Section D, Biological Crystallography 59: 1903-1913.
Gerull B, Atherton J, Geupel A, Sasse-Klaassen S, Heuser A, Frenneaux M, McNabb M, Granzier H, Labeit S, Thierfelder L. 2006. Identification of a novel frameshift mutation in the giant muscle filament titin in a large Australian family with dilated cardiomyopathy. Journal of Molecular Medicine (Berl) 84(6): 478-483.
Goujon M, McWilliam H, Li W, Valentin F, Squizzato S, Paern J, Lopez R. 2010. A new bioinformatics analysis tools framework at EMBL-EBI. Nucleic Acids Research 38(Web Server issue): W695-699.
Granzier H, Wu YM, Siegfried L, LeWinter M. 2005. Thin: Physiological function and role in cardiomyopathy and failure. Heart Failure Reviews 10(3): 211-223.
Granzier HL, Labeit S. 2004. The giant protein titin: a major player in myocardial mechanics, signaling, and disease. Circulation Research 94(3): 284-295.

!"#$%&'(4*-&>&'&2@&H( ( 01(.'#23&(
/4/(
Grater F, Shen J, Jiang H, Gautel M, Grubmuller H. 2005. Mechanically induced titin kinase activation studied by force-probe molecular dynamics simulations. Biophysical Journal 88(2): 790-804.
Gregorio CC, Perry CN, McElhinny AS. 2005. Functional properties of the titin/connectin-associated proteins, the muscle-specific RING finger proteins (MURFs), in striated muscle. Journal of Muscle Research and Cell Motility 26(6-8): 389-400.
Gruber M, Lupas AN. 2003. Historical review: another 50th anniversary--new periodicities in coiled coils. Trends in Biochemical Sciences 28(12): 679-685.
Guinier, A. 1939. La diffraction des rayons X aux tres petits angles; application a l'etude de phenomenes ultramicroscopiques. Annales de Physique. 12(S): 161-237.
Gutierrez-Cruz G, Van Heerden AH, Wang K. 2001. Modular motif, structural folds and affinity profiles of the PEVK segment of human fetal skeletal muscle titin. The Journal of Biological Chemistry 276(10): 7442-7449.
Harbury PB, Zhang T, Kim PS, Alber T. 1993. A Switch between 2-Stranded, 3-Stranded and 4-Stranded Coiled Coils in Gcn4 Leucine-Zipper Mutants. Science 262(5138): 1401-1407.
Hayashi MK, Tang C, Verpelli C, Narayanan R, Stearns MH, Xu RM, Li H, Sala C, Hayashi Y. 2009. The postsynaptic density proteins Homer and Shank form a polymeric network structure. Cell 137(1): 159-171.
Helmes M, Lim CC, Liao R, Bharti A, Cui L, Sawyer DB. 2003. Titin determines the Frank-Starling relation in early diastole. The Journal of General Physiology 121(2): 97-110.
Helmes M, Trombitas K, Centner T, Kellermayer M, Labeit S, Linke WA, Granzier H. 1999. Mechanically driven contour-length adjustment in rat cardiac titin's unique N2B sequence: titin is an adjustable spring. Circulation Research 84(11): 1339-1352.
Hirner S, Krohne C, Schuster A, Hoffmann S, Witt S, Erber R, Sticht C, Gasch A, Labeit S, Labeit D. 2008. MuRF1-dependent regulation of systemic carbohydrate metabolism as revealed from transgenic mouse studies. Journal of Molecular Biology 379(4): 666-677.
Hornemann T, Kempa S, Himmel M, Hayess K, Furst DO, Wallimann T. 2003. Muscle-type creatine kinase interacts with central domains of the M-band proteins myomesin and M-protein. Journal of Molecular Biology 332(4): 877-887.
Horowits R. 1992. Passive force generation and titin isoforms in mammalian skeletal muscle. Biophysical Journal 61(2): 392-398.
Houmeida A, Baron A, Keen J, Khan GN, Knight PJ, Stafford WF, 3rd, Thirumurugan K, Thompson B, Tskhovrebova L, Trinick J. 2008. Evidence

!"#$%&'(4*-&>&'&2@&H( ( 01(.'#23&(
/4)(
for the oligomeric state of 'elastic' titin in muscle sarcomeres. Journal of Molecular Biology 384(2): 299-312.
Hu SH, Parker MW, Lei JY, Wilce MCJ, Benian GM, Kemp BE. 1994. Insights into Autoregulation from the Crystal-Structure of Twitchin Kinase. Nature 369(6481): 581-584.
Hubbard SR. 1997. Crystal structure of the activated insulin receptor tyrosine kinase in complex with peptide substrate and ATP analog. The EMBO Journal 16(18): 5572-5581.
Improta S, Krueger JK, Gautel M, Atkinson RA, Lefevre JF, Moulton S, Trewhella J, Pastore A. 1998. The assembly of immunoglobulin-like modules in titin: implications for muscle elasticity. Journal of Molecular Biology 284(3): 761-777.
Johnson DA, Akamine P, Radzio-Andzelm E, Madhusudan M, Taylor SS. 2001. Dynamics of cAMP-dependent protein kinase. Chemical reviews 101(8): 2243-2270.
Kabsch W. 2010. Xds. Acta Crystallographica Section D, Biological Crystallography 66(2): 125-132.
Kedar V, McDonough H, Arya R, Li HH, Rockman HA, Patterson C. 2004. Muscle-specific RING finger 1 is a bona fide ubiquitin ligase that degrades cardiac troponin I. Proceedings of the National Academy of Sciences of the United States of America 101(52): 18135-18140.
Kobe B, Heierhorst J, Feil SC, Parker MW, Benian GM, Weiss KR, Kemp BE. 1996. Giant protein kinases: domain interactions and structural basis of autoregulation. The EMBO Journal 15(24): 6810-6821.
Konarev PV, Petoukhov MV, Volkov VV, Svergun DI. 2006. ATSAS 2.1, a program package for small-angle scattering data analysis. Journal of Applied Crystallography 39: 277-286.
Konarev PV, Volkov VV, Sokolova AV, Koch MHJ, Svergun DI. 2003. PRIMUS: a Windows PC-based system for small-angle scattering data analysis. Journal of Applied Crystallography 36(5): 1277-1282.
Kontrogianni-Konstantopoulos A, Ackermann MA, Bowman AL, Yap SV, Bloch RJ. 2009. Muscle giants: molecular scaffolds in sarcomerogenesis. Physiological Reviews 89(4): 1217-1267.
Koyama S, Hata S, Witt CC, Ono Y, Lerche S, Ojima K, Chiba T, Doi N, Kitamura F, Tanaka K, Abe K, Witt SH, Rybin V, Gasch A, Franz T, Labeit S, Sorimachi H. 2008. Muscle RING-finger protein-1 (MuRF1) as a connector of muscle energy metabolism and protein synthesis. Journal of Molecular Biology 376(5): 1224-1236.
Krissinel E, Henrick K. 2007. Inference of macromolecular assemblies from crystalline state. Journal of Molecular Biology 372(3): 774-797.

!"#$%&'(4*-&>&'&2@&H( ( 01(.'#23&(
/45(
Krylov D, Mikhailenko I, Vinson C. 1994. A thermodynamic scale for leucine zipper stability and dimerization specificity: e and g interhelical interactions. The EMBO Journal 13(12): 2849-2861.
Labeit S, Kohl CH, Witt CC, Labeit D, Jung J, Granzier H. 2010. Modulation of muscle atrophy, fatigue and MLC phosphorylation by MuRF1 as indicated by hindlimb suspension studies on MuRF1-KO mice. Journal of Biomedicine & Biotechnology 2010: 693741.
Lange S, Ehler E, Gautel M. 2006. From A to Z and back? Multicompartment proteins in the sarcomere. Trends in cell biology 16(1): 11-18.
Lange S, Xiang F, Yakovenko A, Vihola A, Hackman P, Rostkova E, Kristensen J, Brandmeier B, Franzen G, Hedberg B, Gunnarsson LG, Hughes SM, Marchand S, Sejersen T, Richard I, Edstrom L, Ehler E, Udd B, Gautel M. 2005. The kinase domain of titin controls muscle gene expression and protein turnover. Science 308(5728): 1599-1603.
Langer G, Cohen SX, Lamzin VS, Perrakis A. 2008. Automated macromolecular model building for X-ray crystallography using ARP/wARP version 7. Nature Protocols 3(7): 1171-1179.
Larkin MA, Blackshields G, Brown NP, Chenna R, McGettigan PA, McWilliam H, Valentin F, Wallace IM, Wilm A, Lopez R, Thompson JD, Gibson TJ, Higgins DG. 2007. Clustal W and Clustal X version 2.0. Bioinformatics 23(21): 2947-2948.
Le Rumeur E, Hubert JF, Winder SJ. 2012. A new twist to coiled coil. FEBS Letters 586(17): 2717-2722.
Lecker SH, Solomon V, Mitch WE, Goldberg AL. 1999. Muscle protein breakdown and the critical role of the ubiquitin-proteasome pathway in normal and disease states. The Journal of Nutrition 129(1S Suppl): 227S-237S.
Lee T, Hoofnagle AN, Resing KA, Ahn NG. 2005. Hydrogen exchange solvent protection by an ATP analogue reveals conformational changes in ERK2 upon activation. Journal of Molecular Biology 353(3): 600-612.
Li HH, Du J, Fan YN, Zhang ML, Liu DP, Li L, Lockyer P, Kang EY, Patterson C, Willis MS. 2011a. The ubiquitin ligase MuRF1 protects against cardiac ischemia/reperfusion injury by its proteasome-dependent degradation of phospho-c-Jun. The American Journal of pathology 178(3): 1043-1058.
Li X, Sodroski J. 2008. The TRIM5alpha B-box 2 domain promotes cooperative binding to the retroviral capsid by mediating higher-order self-association. Journal of Virology 82(23): 11495-11502.
Li X, Yeung DF, Fiegen AM, Sodroski J. 2011b. Determinants of the higher order association of the restriction factor TRIM5alpha and other tripartite motif (TRIM) proteins. The Journal of Biological Chemistry 286(32): 27959-27970.

!"#$%&'(4*-&>&'&2@&H( ( 01(.'#23&(
/46(
Linke WA, Kruger M. 2010. The Giant Protein Titin as an Integrator of Myocyte Signaling Pathways. Physiology 25(3): 186-198.
Linke WA, Rudy DE, Centner T, Gautel M, Witt C, Labeit S, Gregorio CC. 1999. I-band titin in cardiac muscle is a three-element molecular spring and is critical for maintaining thin filament structure. The Journal of Cell Biology 146(3): 631-644.
Liversage AD, Holmes D, Knight PJ, Tskhovrebova L, Trinick J. 2001. Titin and the sarcomere symmetry paradox. Journal of Molecular Biology 305(3): 401-409.
Lupas AN, Gruber M. 2005. The structure of alpha-helical coiled coils. Advances in Protein Chemistry 70: 37-78.
Ma K, Kan L, Wang K. 2001. Polyproline II helix is a key structural motif of the elastic PEVK segment of titin. Biochemistry 40(12): 3427-3438.
Ma K, Wang K. 2003. Malleable conformation of the elastic PEVK segment of titin: non-co-operative interconversion of polyproline II helix, beta-turn and unordered structures. The Biochemical Journal 374(3): 687-695.
Marino M, Svergun DI, Kreplak L, Konarev PV, Maco B, Labeit D, Mayans O. 2005. Poly-Ig tandems from I-band titin share extended domain arrangements irrespective of the distinct features of their modular constituents. Journal of Muscle Research and Cell Motility 26(6-8): 355-365.
Mason JM, Hagemann UB, Arndt KM. 2009. Role of hydrophobic and electrostatic interactions in coiled coil stability and specificity. Biochemistry 48(43): 10380-10388.
Masterson LR, Shi L, Metcalfe E, Gao J, Taylor SS, Veglia G. 2011. Dynamically committed, uncommitted, and quenched states encoded in protein kinase A revealed by NMR spectroscopy. Proceedings of the National Academy of Sciences of the United States of America 108(17): 6969-6974.
Matthews BW. 1968. Solvent Content of Protein Crystals. Journal of Molecular Biology 33(2): 491-&.
Mayans O, Labeit S. 2012. MuRFs: Specialized Members of the TRIM/RBCC Family with Roles in the Regulation of the Trophic State of Muscle and Its Metabolism. In TRIM/RBCC Proteins, Vol 770 (ed. G Meroni). Landes Biosciences.
Mayans O, van der Ven PF, Wilm M, Mues A, Young P, Furst DO, Wilmanns M, Gautel M. 1998. Structural basis for activation of the titin kinase domain during myofibrillogenesis. Nature 395(6705): 863-869.
McCoy AJ, Grosse-Kunstleve RW, Adams PD, Winn MD, Storoni LC, Read RJ. 2007. Phaser crystallographic software. Journal of Applied Crystallography 40(4): 658-674.

!"#$%&'(4*-&>&'&2@&H( ( 01(.'#23&(
/44(
McElhinny AS, Kakinuma K, Sorimachi H, Labeit S, Gregorio CC. 2002. Muscle-specific RING finger-1 interacts with titin to regulate sarcomeric M-line and thick filament structure and may have nuclear functions via its interaction with glucocorticoid modulatory element binding protein-1. The Journal of Cell Biology 157(1): 125-136.
McElhinny AS, Perry CN, Witt CC, Labeit S, Gregorio CC. 2004. Muscle-specific RING finger-2 (MURF-2) is important for microtubule, intermediate filament and sarcomeric M-line maintenance in striated muscle development. Journal of Cell Science 117(15): 3175-3188.
Mearini G, Gedicke C, Schlossarek S, Witt CC, Kramer E, Cao P, Gomes MD, Lecker SH, Labeit S, Willis MS, Eschenhagen T, Carrier L. 2010. Atrogin-1 and MuRF1 regulate cardiac MyBP-C levels via different mechanisms. Cardiovascular Research 85(2): 357-366.
Meroni G, Diez-Roux G. 2005. TRIM/RBCC, a novel class of 'single protein RING finger' E3 ubiquitin ligases. BioEssays : News and Reviews in Molecular, Cellular and Developmental Biology 27(11): 1147-1157.
Monera OD, Zhou NE, Lavigne P, Kay CM, Hodges RS. 1996. Formation of parallel and antiparallel coiled-coils controlled by the relative positions of alanine residues in the hydrophobic core. The Journal of Biological Chemistry 271(8): 3995-4001.
Moriscot AS, Baptista IL, Bogomolovas J, Witt C, Hirner S, Granzier H, Labeit S. 2010. MuRF1 is a muscle fiber-type II associated factor and together with MuRF2 regulates type-II fiber trophicity and maintenance. Journal of Structural Biology 170(2): 344-353.
Mrosek M, Labeit D, Witt S, Heerklotz H, von Castelmur E, Labeit S, Mayans O. 2007. Molecular determinants for the recruitment of the ubiquitin-ligase MuRF-1 onto M-line titin. FASEB Journal : official publication of the Federation of American Societies for Experimental Biology 21(7): 1383-1392.
Mrosek M, Meier S, Ucurum-Fotiadis Z, von Castelmur E, Hedbom E, Lustig A, Grzesiek S, Labeit D, Labeit S, Mayans O. 2008. Structural analysis of B-Box 2 from MuRF1: identification of a novel self-association pattern in a RING-like fold. Biochemistry 47(40): 10722-10730.
Murshudov GN, Vagin AA, Dodson EJ. 1997. Refinement of macromolecular structures by the maximum-likelihood method. Acta Crystallographica Section D, Biological Crystallography 53(3): 240-255.
Murton AJ, Constantin D, Greenhaff PL. 2008. The involvement of the ubiquitin proteasome system in human skeletal muscle remodelling and atrophy. Biochimica et Biophysica Acta 1782(12): 730-743.

!"#$%&'(4*-&>&'&2@&H( ( 01(.'#23&(
/47(
Napolitano LM, Meroni G. 2012. TRIM family: Pleiotropy and diversification through homomultimer and heteromultimer formation. IUBMB Life 64(1): 64-71.
Nolen B, Ngo J, Chakrabarti S, Vu D, Adams JA, Ghosh G. 2003. Nucleotide-induced conformational changes in the Saccharomyces cerevisiae SR protein kinase, Sky1p, revealed by X-ray crystallography. Biochemistry 42(32): 9575-9585.
O'Shea EK, Klemm JD, Kim PS, Alber T. 1991. X-ray structure of the GCN4 leucine zipper, a two-stranded, parallel coiled coil. Science 254(5031): 539-544.
Parry DA, Fraser RD, Squire JM. 2008. Fifty years of coiled-coils and alpha-helical bundles: a close relationship between sequence and structure. Journal of Structural Biology 163(3): 258-269.
Parry DAD. 1982. Coiled-Coils in Alpha-Helix-Containing Proteins - Analysis of the Residue Types within the Heptad Repeat and the Use of These Data in the Prediction of Coiled-Coils in Other Proteins. Bioscience Rep 2(12): 1017-1024.
Pernigo S, Fukuzawa A, Bertz M, Holt M, Rief M, Steiner RA, Gautel M. 2010. Structural insight into M-band assembly and mechanics from the titin-obscurin-like-1 complex. Proceedings of the National Academy of Sciences of the United States of America 107(7): 2908-2913.
Petoukhov MV, Franke D, Shkumatov AV, Tria G, Kikhney AG, Gajda M, Gorba C, Mertens HDT, Konarev PV, Svergun DI. 2012. New developments in the ATSAS program package for small-angle scattering data analysis. Journal of Applied Crystallography 45: 342-350.
Petoukhov MV, Svergun DI. 2005. Global rigid body modeling of macromolecular complexes against small-angle scattering data. Biophysical Journal 89(2): 1237-1250.
Pinotsis N, Petoukhov M, Lange S, Svergun D, Zou P, Gautel M, Wilmanns M. 2006. Evidence for a dimeric assembly of two titin/telethonin complexes induced by the telethonin C-terminus. Journal of Structural Biology 155(2): 239-250.
Pizon V, Iakovenko A, Van Der Ven PF, Kelly R, Fatu C, Furst DO, Karsenti E, Gautel M. 2002. Transient association of titin and myosin with microtubules in nascent myofibrils directed by the MURF2 RING-finger protein. Journal of Cell Science 115(23): 4469-4482.
Prado LG, Makarenko I, Andresen C, Kruger M, Opitz CA, Linke WA. 2005. Isoform diversity of giant proteins in relation to passive and active contractile properties of rabbit skeletal muscles. The Journal of General Physiology 126(5): 461-480.
Puchner EM, Alexandrovich A, Kho AL, Hensen U, Schafer LV, Brandmeier B, Grater F, Grubmuller H, Gaub HE, Gautel M. 2008. Mechanoenzymatics of

!"#$%&'(4*-&>&'&2@&H( ( 01(.'#23&(
/48(
titin kinase. Proceedings of the National Academy of Sciences of the United States of America 105(36): 13385-13390.
Puchner EM, Gaub HE. 2010. Exploring the conformation-regulated function of titin kinase by mechanical pump and probe experiments with single molecules. Angewandte Chemie Internationa Edition English 49(6): 1147-1150.
Reymond A, Meroni G, Fantozzi A, Merla G, Cairo S, Luzi L, Riganelli D, Zanaria E, Messali S, Cainarca S, Guffanti A, Minucci S, Pelicci PG, Ballabio A. 2001. The tripartite motif family identifies cell compartments. The EMBO Journal 20(9): 2140-2151.
Rigden DJ, Galperin MY. 2008. Sequence analysis of GerM and SpoVS, uncharacterized bacterial 'sporulation' proteins with widespread phylogenetic distribution. Bioinformatics 24(16): 1793-1797.
Rodriguez DD, Grosse C, Himmel S, Gonzalez C, de Ilarduya IM, Becker S, Sheldrick GM, Uson I. 2009. Crystallographic ab initio protein structure solution below atomic resolution. Nature Methods 6(9): 651-653.
Rudolf R, Bogomolovas J, Strack S, Choi KR, Khan MM, Wagner A, Brohm K, Hanashima A, Gasch A, Labeit D, Labeit S. 2012. Regulation of nicotinic acetylcholine receptor turnover by MuRF1 connects muscle activity to endo/lysosomal and atrophy pathways. Age (Dordr).
Sanger JW, Chowrashi P, Shaner NC, Spalthoff S, Wang J, Freeman NL, Sanger JM. 2002. Myofibrillogenesis in skeletal muscle cells. Clinical Orthopaedics and Related Research(403 Suppl): S153-162.
Sardiello M, Cairo S, Fontanella B, Ballabio A, Meroni G. 2008. Genomic analysis of the TRIM family reveals two groups of genes with distinct evolutionary properties. BMC Evolutionary Biology 8: 225.
Sauer F, Vahokoski J, Song YH, Wilmanns M. 2010. Molecular basis of the head-to-tail assembly of giant muscle proteins obscurin-like 1 and titin. EMBO Reports 11(7): 534-540.
Seo J, Cohen C. 1993. Pitch diversity in alpha-helical coiled coils. Proteins 15(3): 223-234.
Sheikh F, Raskin A, Chu PH, Lange S, Domenighetti AA, Zheng M, Liang X, Zhang T, Yajima T, Gu Y, Dalton ND, Mahata SK, Dorn GW, 2nd, Brown JH, Peterson KL, Omens JH, McCulloch AD, Chen J. 2008. An FHL1-containing complex within the cardiomyocyte sarcomere mediates hypertrophic biomechanical stress responses in mice. The Journal of Clinical Investigation 118(12): 3870-3880.
Sheldrick GM. 2010. Experimental phasing with SHELXC/D/E: combining chain tracing with density modification. Acta Crystallographica Section D, Biological Crystallography 66(4): 479-485.

!"#$%&'(4*-&>&'&2@&H( ( 01(.'#23&(
/49(
Short KM, Cox TC. 2006. Subclassification of the RBCC/TRIM superfamily reveals a novel motif necessary for microtubule binding. The Journal of Biological Chemistry 281(13): 8970-8980.
Short KM, Hopwood B, Yi Z, Cox TC. 2002. MID1 and MID2 homo- and heterodimerise to tether the rapamycin-sensitive PP2A regulatory subunit, alpha 4, to microtubules: implications for the clinical variability of X-linked Opitz GBBB syndrome and other developmental disorders. BMC Cell Biology 3: 1.
Shortle D, Simons KT, Baker D. 1998. Clustering of low-energy conformations near the native structures of small proteins. Proceedings of the National Academy of Sciences of the United States of America 95(19): 11158-11162.
Simons KT, Kooperberg C, Huang E, Baker D. 1997. Assembly of protein tertiary structures from fragments with similar local sequences using simulated annealing and Bayesian scoring functions. Journal of Molecular Biology 268(1): 209-225.
Simons KT, Ruczinski I, Kooperberg C, Fox BA, Bystroff C, Baker D. 1999. Improved recognition of native-like protein structures using a combination of sequence-dependent and sequence-independent features of proteins. Proteins 34(1): 82-95.
Sjostrom M, Squire JM. 1977. Cryo-ultramicrotomy and myofibrillar fine structure: a review. Journal of Microscopy 111(3): 239-278.
Smith PK, Krohn RI, Hermanson GT, Mallia AK, Gartner FH, Provenzano MD, Fujimoto EK, Goeke NM, Olson BJ, Klenk DC. 1985. Measurement of protein using bicinchoninic acid. Analytical Biochemistry 150(1): 76-85.
Spencer JA, Eliazer S, Ilaria RL, Jr., Richardson JA, Olson EN. 2000. Regulation of microtubule dynamics and myogenic differentiation by MURF, a striated muscle RING-finger protein. The Journal of Cell Biology 150(4): 771-784.
Squire JM. 1997. Architecture and function in the muscle sarcomere. Current Opinion in Structural Biology 7(2): 247-257.
Squire JM, Al-Khayat HA, Knupp C, Luther PK. 2005. Molecular architecture in muscle contractile assemblies. Advances in Protein Chemistry 71: 17-87.
Stahl SW, Puchner EM, Alexandrovich A, Gautel M, Gaub HE. 2011. A conditional gating mechanism assures the integrity of the molecular force-sensor titin kinase. Biophysical Journal 101(8): 1978-1986.
Strelkov SV, Burkhard P. 2002. Analysis of alpha-helical coiled coils with the program TWISTER reveals a structural mechanism for stutter compensation. Journal of Structural Biology 137(1-2): 54-64.
Subramanian R, Wilson-Kubalek EM, Arthur CP, Bick MJ, Campbell EA, Darst SA, Milligan RA, Kapoor TM. 2010. Insights into antiparallel microtubule

!"#$%&'(4*-&>&'&2@&H( ( 01(.'#23&(
/4:(
crosslinking by PRC1, a conserved nonmotor microtubule binding protein. Cell 142(3): 433-443.
Svergun D. 1992. Determination of the regularization parameter in indirect-transform methods using perceptual criteria. Journal of Applied Crystallography 25(4): 495-503.
Svergun D, Barberato C, Koch MHJ. 1995. CRYSOL - A program to evaluate x-ray solution scattering of biological macromolecules from atomic coordinates. Journal of Applied Crystallography 28: 768-773.
Svergun DI, Koch MHJ. 2003. Small-angle scattering studies of biological macromolecules in solution. Reports on Progress in Physics 66(10): 1735.
Terwilliger TC. 2000. Maximum-likelihood density modification. Acta Crystallographica Section D, Biological Crystallography 56(8): 965-972.
Terwilliger TC. 2003. Automated main-chain model building by template matching and iterative fragment extension. Acta Crystallographica Section D, Biological Crystallography 59(1): 38-44.
Terwilliger TC, Berendzen J. 1999. Automated MAD and MIR structure solution. Acta Crystallographica Section D, Biological Crystallography 55: 849-861.
Trombitas K, Wu Y, McNabb M, Greaser M, Kellermayer MS, Labeit S, Granzier H. 2003. Molecular basis of passive stress relaxation in human soleus fibers: assessment of the role of immunoglobulin-like domain unfolding. Biophysical Journal 85(5): 3142-3153.
Tskhovrebova L, Trinick J. 2010. Roles of titin in the structure and elasticity of the sarcomere. Journal of Biomedicine & Biotechnology 2010: 612482.
Volkov VV, Svergun DI. 2003. Uniqueness of ab initio shape determination in small-angle scattering. Journal of Applied Crystallography 36(3 Part 1): 860-864.
von Castelmur E, Marino M, Svergun DI, Kreplak L, Ucurum-Fotiadis Z, Konarev PV, Urzhumtsev A, Labeit D, Labeit S, Mayans O. 2008. A regular pattern of Ig super-motifs defines segmental flexibility as the elastic mechanism of the titin chain. Proceedings of the National Academy of Sciences of the United States of America 105(4): 1186-1191.
von Castelmur E, Strumpfer J, Franke B, Bogomolovas J, Barbieri S, Qadota H, Konarev PV, Svergun DI, Labeit S, Benian GM, Schulten K, Mayans O. 2012. Identification of an N-terminal inhibitory extension as the primary mechanosensory regulator of twitchin kinase. Proceedings of the National Academy of Sciences of the United States of America 109(34): 13608-13613.
Walshaw J, Woolfson DN. 2001. Socket: a program for identifying and analysing coiled-coil motifs within protein structures. Journal of Molecular Biology 307(5): 1427-1450.

!"#$%&'(4*-&>&'&2@&H( ( 01(.'#23&(
/7;(
Walshaw J, Woolfson DN. 2003. Extended knobs-into-holes packing in classical and complex coiled-coil assemblies. Journal of Structural Biology 144(3): 349-361.
Watanabe K, Nair P, Labeit D, Kellermayer MS, Greaser M, Labeit S, Granzier H. 2002. Molecular mechanics of cardiac titin's PEVK and N2B spring elements. The Journal of Biological Chemistry 277(13): 11549-11558.
Waterston RH, Thomson JN, Brenner S. 1980. Mutants with Altered Muscle Structure in Caenorhabditis-Elegans. Developmental Biology 77(2): 271-302.
Willis MS, Ike C, Li L, Wang DZ, Glass DJ, Patterson C. 2007. Muscle ring finger 1, but not muscle ring finger 2, regulates cardiac hypertrophy in vivo. Circulation Research 100(4): 456-459.
Winn MD, Ballard CC, Cowtan KD, Dodson EJ, Emsley P, Evans PR, Keegan RM, Krissinel EB, Leslie AGW, McCoy A, McNicholas SJ, Murshudov GN, Pannu NS, Potterton EA, Powell HR, Read RJ, Vagin A, Wilson KS. 2011. Overview of the CCP4 suite and current developments. Acta Crystallographica Section D, Biological Crystallography 67: 235-242.
Wishart DS, Bigam CG, Yao J, Abildgaard F, Dyson HJ, Oldfield E, Markley JL, Sykes BD. 1995. 1H, 13C and 15N chemical shift referencing in biomolecular NMR. Journal of Biomolecular NMR 6(2): 135-140.
Witt CC, Witt SH, Lerche S, Labeit D, Back W, Labeit S. 2008. Cooperative control of striated muscle mass and metabolism by MuRF1 and MuRF2. The EMBO Journal 27(2): 350-360.
Witt SH, Granzier H, Witt CC, Labeit S. 2005. MURF-1 and MURF-2 target a specific subset of myofibrillar proteins redundantly: towards understanding MURF-dependent muscle ubiquitination. Journal of Molecular Biology 350(4): 713-722.
Wolf E, Kim PS, Berger B. 1997. MultiCoil: a program for predicting two- and three-stranded coiled coils. Protein science : a publication of the Protein Society 6(6): 1179-1189.
Xiaoxia L, Marston JP, Baxter NJ, Hounslow AM, Yufen Z, Blackburn GM, Cliff MJ, Waltho JP. 2011. Prioritization of charge over geometry in transition state analogues of a dual specificity protein kinase. Journal of the American Chemical Society 133(11): 3989-3994.
Xu D, Zhang Y. 2012. Ab initio protein structure assembly using continuous structure fragments and optimized knowledge-based force field. Proteins 80(7): 1715-1735.
Yoskovitz G, Peled Y, Gramlich M, Lahat H, Resnik-Wolf H, Feinberg MS, Afek A, Pras E, Arad M, Gerull B, Freimark D. 2012. A novel titin mutation in adult-onset familial dilated cardiomyopathy. The American Journal of Cardiology 109(11): 1644-1650.

!"#$%&'(4*-&>&'&2@&H( ( 01(.'#23&(
/7/(
Zhang Y, Skolnick J. 2004. Scoring function for automated assessment of protein structure template quality. Proteins 57(4): 702-710.
Zhao TJ, Yan YB, Liu Y, Zhou HM. 2007. The generation of the oxidized form of creatine kinase is a negative regulation on muscle creatine kinase. The Journal of Biological Chemistry 282(16): 12022-12029.

!"#$%&'(7*G$$&2IA@&H( ( 01(.'#23&(
/7)(
Chapter 6 :
Appendix
6.1 Appendix I - MultiCoil output
6.1.1 MuRF1
Input file is temp/multicoil/wwwmulti.95750/data.seq Scores by MultiCoil. The probability cutoff for the coiled-coil locater is 0.50. The scoring distances are: For dimeric table: 2 3 4 For trimeric table: 1 2 3 1 WebInput, Unnamed sequence, Maximum coiled-coil residue probability: 0.832 in position 87. Maximum dimeric residue probability: 0.551 in position 85. Maximum trimeric residue probability: 0.388 in position 78. Res 1 0123456789012345678901234567890123456789012345678901234567890123456789 Sequence IHKACEVAPLQSVFQGQKTELNNCISMLVAGNDRVQTIITQLEDSRRVTKENSHQVKEELSQKFDTLYAI Dimer ...................................................................... Trimer ...................................................................... Coil ...................................................................... Res 71 0123456789012345678901234567890123456789012345678901234567890 Sequence LDEKKSELLQRITQEQEKKLSFIEALIQQYQEQLDKSTKLVETAIQSLDEPGGATFLLTAK Dimer ............................................................. Trimer ............................................................. Coil ......bcdefgabcdefgabcdefgabcdefgabcdefgabcdefgabc........... Coil 0.77@ 77- 120:b,2

!"#$%&'(7*G$$&2IA@&H( ( 01(.'#23&(
/75(
Figure 6.1. MuRF1 coiled-coil probability scores
6.1.2 MuRF2
Input file is temp/multicoil/wwwmulti.17080/data.seq Scores by MultiCoil. The probability cutoff for the coiled-coil locater is 0.50. The scoring distances are: For dimeric table: 2 3 4 For trimeric table: 1 2 3 1 WebInput, Unnamed sequence, Maximum coiled-coil residue probability: 0.771 in position 95. Maximum dimeric residue probability: 0.424 in position 88. Maximum trimeric residue probability: 0.365 in position 115. Res 1 0123456789012345678901234567890123456789012345678901234567890123456789 Sequence FGAHKDCQVAPLTHVFQRQKSELSDGIAILVGSNDRVQGVISQLEDTCKTIEECCRKQKQELCEKFDYLY Dimer ...................................................................... Trimer ...................................................................... Coil ...................................................................... Res 71 0123456789012345678901234567890123456789012345678901234567890 Sequence GILEERKNEMTQVITRTQEEKLEHVRALIKKYSDHLENVSKLVESGIQFMDEPEMAVFLQN Dimer ............................................................. Trimer ............................................................. Coil ...............bcdefgabcdefgabcdefgabcdefgabcd............... Coil 0.75@ 86- 116:b,0

!"#$%&'(7*G$$&2IA@&H( ( 01(.'#23&(
/76(
Figure 6.2. MuRF2 coiled-coil probability scores
6.1.3 MuRF3
Input file is temp/multicoil/wwwmulti.80112/data.seq Scores by MultiCoil. The probability cutoff for the coiled-coil locater is 0.50. The scoring distances are: For dimeric table: 2 3 4 For trimeric table: 1 2 3 1 WebInput, Unnamed sequence, Maximum coiled-coil residue probability: 0.893 in position 91. Maximum dimeric residue probability: 0.350 in position 83. Maximum trimeric residue probability: 0.622 in position 104. Res 1 0123456789012345678901234567890123456789012345678901234567890123456789 Sequence KVFGAHKDCEVAPLPTIYKRQKSELSDGIAMLVAGNDRVQAVITQMEEVCQTIEDNSRRQKQLLNQRFES Dimer ...................................................................... Trimer ...................................................................... Coil ...................................................................... Res 71 0123456789012345678901234567890123456789012345678901234567890 Sequence LCAVLEERKGELLQALAREQEEKLQRVRGLIRQYGDHLEASSKLVESAIQSMEEPQMALYL Dimer ............................................................. Trimer .....defgabcdefgabcdefgabcdefgabcdefgabc..................... Coil .....defgabcdefgabcdefgabcdefgabcdefgabc..................... Trim 0.54@ 76- 110:d,5 Coil 0.80@ 76- 110:d,5

!"#$%&'(7*G$$&2IA@&H( ( 01(.'#23&(
/74(
Figure 6.3. MuRF3 coiled-coil probability scores
6.2 Appendix II - Twister output for MuRF1-CC
6.2.1 Dimer AC
********************************************************************* * TWISTER: Analysis of coiled-coil geometry S.Strelkov 2000-2 * * E-mail:[email protected] * * Reference: Strelkov,S.V., and Burkhard,P. (2002) J. Struct. Biol. * ********************************************************************* Title cc214_P21_A-C-renum Input pdb_file cc214_final_AC-renum.pdb 2-stranded coiled coil, chains A C First_res 1, last_res 60 Output pdb_file cc214_P21_A-C-renum_tw.out ********* Sequence and heptad assignment ********* 10 20 30 40 50 60 XXXXXXXGA MDTLYAILDE KKSELLQRIT QEQEEKLSFI EALIQQYQEQ LDKSTKLVET A zzzzzzzzz zdefgabcde fgabcdefga bcdefgabcd efgabcdefg defgabcdef g

!"#$%&'(7*G$$&2IA@&H( ( 01(.'#23&(
/77(
********* Coiled-coil parameters per residue ********* Res cc_phase cc_rad cc_rise cc_pit cc_dang pos Cr_ang a_rad a_ris res/tur a_dang axis_cur 2 nan nan nan nan R nan z nan nan nan nan nan 0.0000 3 nan nan nan nan R nan z nan nan nan nan nan 0.0000 4 nan nan nan nan R nan z nan nan nan nan nan 0.0000 5 nan nan nan nan R nan z nan nan nan nan nan 0.0000 6 nan nan nan nan R nan z nan nan nan nan nan 0.0000 7 nan 42.72 nan nan R nan z 137.9 15.63 nan nan nan nan 8 nan 14.03 20.77 148.8 -50.24 z 52.1 16.03 22.33 3.20 113.89 nan 9 nan 7.25 7.69 64.2 -43.06 z 131.4 1.57 8.43 3.85 93.72 nan 10 nan 6.73 1.64 240.0 -2.46 z -129.8 2.27 1.69 3.60 99.88 nan 11 nan 6.59 1.53 325.7 -1.69 d -30.3 2.26 1.55 3.60 99.96 nan 12 nan 6.48 1.51 332.5 -1.63 e 72.9 2.31 1.52 3.61 99.73 nan 13 nan 6.31 1.45 327.3 -1.60 f 170.8 2.30 1.47 3.65 98.57 0.0496 14 nan 6.16 1.47 308.0 -1.72 g -87.0 2.32 1.49 3.62 99.35 0.0154 15 nan 5.96 1.50 268.7 -2.01 a 18.1 2.28 1.53 3.59 100.17 0.0091 16 nan 5.77 1.49 234.3 -2.29 b 117.0 2.29 1.52 3.61 99.85 0.0092 17 nan 5.59 1.48 210.6 -2.52 c -139.8 2.28 1.51 3.62 99.55 0.0094 18 nan 5.43 1.45 187.5 -2.77 d -39.1 2.31 1.48 3.61 99.77 0.0102 19 nan 5.29 1.45 170.8 -3.06 e 64.5 2.28 1.48 3.58 100.68 0.0112 20 nan 5.18 1.46 154.0 -3.42 f 168.1 2.30 1.50 3.58 100.69 0.0111 21 nan 5.08 1.45 142.3 -3.67 g -87.7 2.29 1.49 3.62 99.32 0.0106 22 nan 5.02 1.48 138.3 -3.85 a 14.6 2.30 1.52 3.63 99.10 0.0095 23 nan 4.98 1.48 138.8 -3.84 b 118.0 2.30 1.52 3.62 99.38 0.0087 24 nan 4.98 1.48 143.9 -3.69 c -139.3 2.29 1.51 3.60 99.94 0.0082 25 nan 4.98 1.50 155.5 -3.46 d -35.1 2.29 1.53 3.58 100.56 0.0084 26 nan 5.00 1.48 168.0 -3.17 e 68.4 2.31 1.51 3.64 99.02 0.0093 27 nan 5.01 1.44 162.3 -3.20 f 169.1 2.31 1.47 3.70 97.42 0.0110 28 nan 5.01 1.46 150.2 -3.51 g -90.6 2.34 1.49 3.66 98.36 0.0130 29 nan 4.99 1.51 142.4 -3.82 a 12.6 2.28 1.55 3.61 99.71 0.0137 30 nan 4.98 1.46 135.2 -3.90 b 116.1 2.32 1.50 3.65 98.62 0.0138 31 nan 4.95 1.45 134.0 -3.90 c -142.7 2.31 1.49 3.67 98.19 0.0123 32 nan 4.93 1.48 128.5 -4.13 d -40.1 2.31 1.52 3.64 98.96 0.0091 33 nan 4.91 1.45 121.9 -4.29 e 63.2 2.27 1.50 3.61 99.79 0.0067 34 nan 4.91 1.44 124.0 -4.18 f 166.7 2.32 1.48 3.58 100.44 0.0067 35 nan 4.93 1.47 128.4 -4.12 g -88.1 2.26 1.51 3.60 99.93 0.0064 36 nan 4.98 1.49 139.1 -3.84 a 16.0 2.30 1.52 3.64 98.85 0.0067 37 nan 5.03 1.49 149.7 -3.58 b 117.2 2.29 1.52 3.66 98.40 0.0050 38 nan 5.10 1.48 150.1 -3.55 c -140.2 2.33 1.51 3.66 98.43 0.0029 39 nan 5.18 1.47 149.2 -3.55 d -39.5 2.30 1.51 3.66 98.46 0.0025 40 nan 5.29 1.45 153.2 -3.40 e 63.2 2.31 1.48 3.64 99.04 0.0043 41 nan 5.38 1.44 168.7 -3.07 f 164.8 2.32 1.47 3.60 99.87 0.0053 42 nan 5.50 1.44 186.5 -2.79 g -91.1 2.29 1.47 3.61 99.78 0.0052 43 nan 5.65 1.47 194.6 -2.72 a 12.3 2.32 1.50 3.63 99.04 0.0052 44 nan 5.82 1.48 197.5 -2.70 b 111.9 2.27 1.51 3.67 98.04 0.0051 45 nan 5.97 1.47 206.8 -2.56 c -147.7 2.35 1.50 3.67 98.03 0.0048 46 nan 6.12 1.50 213.0 -2.53 d -47.0 2.27 1.53 3.65 98.68 0.0060 47 nan 6.26 1.48 222.8 -2.38 e 54.6 2.32 1.50 3.64 98.97 0.0064 48 nan 6.39 1.46 238.5 -2.20 f 155.0 2.30 1.49 3.63 99.08 0.0064 49 nan 6.53 1.42 243.6 -2.11 g -103.1 2.31 1.45 3.64 98.80 0.0062 50 nan 6.69 1.44 227.9 -2.28 d -8.7 2.33 1.48 3.63 99.05 0.0069 51 nan 6.88 1.46 217.5 -2.42 e 98.9 2.27 1.50 3.65 98.84 0.0075 52 nan 7.05 1.45 218.4 -2.39 f -159.1 2.34 1.49 3.64 99.01 0.0067 53 nan 7.26 1.47 224.5 -2.36 g -58.5 2.30 1.52 3.66 98.41 0.0265 54 nan 7.47 1.47 229.3 -2.31 a 41.8 2.32 1.52 3.70 97.42 0.0252 55 nan 7.74 1.52 236.2 -2.32 b 140.5 2.25 1.58 3.61 99.81 0.0000 56 nan 8.06 1.60 255.1 -2.26 c -113.9 2.32 1.65 3.59 100.43 0.0000 57 nan 7.94 4.51 71.7 -22.62 d -5.3 1.78 4.56 3.52 102.82 0.0000 58 nan 8.79 7.23 78.0 -33.37 e 57.3 8.75 7.33 3.07 122.30 0.0000 59 nan 12.64 7.07 144.2 -17.66 f 166.2 14.46 7.19 3.82 94.36 0.0000 Ave nan nan nan nan nan nan nan nan nan Std nan nan nan nan nan nan nan nan nan Overall ccpitch is estimated as 2Pi*<cc_rise>/<cc_angle_per_res> Overall roc of the a-helix axis (1/<curv>) nan A with curvature smoothing base 5 ********* Crick angles for heptad position a ********* Res Crick_angle 15 18.14 22 14.59 29 12.59 36 16.02 43 12.27

!"#$%&'(7*G$$&2IA@&H( ( 01(.'#23&(
/78(
54 41.82 Ave 19.24 Std 10.30 ********* Crick angles for heptad position d ********* Res Crick_angle 11 -30.28 18 -39.06 25 -35.07 32 -40.06 39 -39.47 46 -47.04 50 -8.67 57 -5.27 Ave -30.62 Std 14.37
6.2.2 Dimer BD
********************************************************************* * TWISTER: Analysis of coiled-coil geometry S.Strelkov 2000-2 * * E-mail:[email protected] * * Reference: Strelkov,S.V., and Burkhard,P. (2002) J. Struct. Biol. * ********************************************************************* Title cc214_P21_D-B-renum Input pdb_file cc214_final_DB-renum.pdb 2-stranded coiled coil, chains B D First_res 12, last_res 58 Output pdb_file cc214_P21_D-B-renum_tw.out ********* Sequence and heptad assignment ********* 20 30 40 50 EKKSELLQ RITQEQEEKL SFIEALIQQY QEQLDKSTKL VETAIQSLD efgabcde fgabcdefga bcdefgabcd efgabcdefg abczabczz ********* Coiled-coil parameters per residue ********* Res cc_phase cc_rad cc_rise cc_pit cc_dang pos Cr_ang a_rad a_ris res/tur a_dang axis_cur 13 -5.86 4.99 1.48 90.7 -5.86 f 156.3 2.24 1.57 3.64 98.83 0.0000 14 -11.98 4.87 1.48 87.2 -6.13 g -98.0 2.28 1.58 3.59 100.36 0.0000 15 -17.77 4.85 1.43 89.2 -5.79 a 10.3 2.31 1.52 3.59 100.25 0.0000 16 -23.00 4.88 1.36 94.0 -5.22 b 113.1 2.29 1.43 3.66 98.39 0.0000 17 -27.89 4.93 1.43 105.4 -4.89 c -143.9 2.32 1.49 3.60 100.11 0.0000 18 -32.51 4.96 1.51 117.6 -4.62 d -37.4 2.22 1.56 3.54 101.81 0.0187 19 -36.66 4.99 1.46 126.3 -4.15 e 68.6 2.30 1.50 3.59 100.19 0.0188 20 -40.60 4.96 1.43 130.7 -3.95 f 170.5 2.30 1.47 3.64 98.85 0.0155 21 -44.82 4.94 1.47 125.2 -4.21 g -86.2 2.31 1.51 3.65 98.63 0.0128 22 -49.01 4.92 1.48 126.8 -4.20 a 16.3 2.26 1.52 3.63 99.29 0.0105 23 -52.84 4.91 1.45 136.2 -3.83 b 120.4 2.36 1.48 3.63 99.09 0.0091

!"#$%&'(7*G$$&2IA@&H( ( 01(.'#23&(
/79(
24 -56.32 4.93 1.47 152.5 -3.48 c -138.2 2.22 1.50 3.62 99.57 0.0091 25 -59.45 4.95 1.53 175.6 -3.13 d -33.7 2.33 1.55 3.57 100.89 0.0089 26 -62.15 5.00 1.50 199.3 -2.70 e 69.5 2.27 1.51 3.65 98.66 0.0094 27 -65.04 5.04 1.44 179.5 -2.89 f 168.2 2.33 1.46 3.70 97.27 0.0118 28 -68.33 5.07 1.45 158.2 -3.29 g -90.6 2.35 1.47 3.65 98.69 0.0140 29 -71.79 5.03 1.48 153.7 -3.46 a 12.4 2.26 1.51 3.62 99.36 0.0136 30 -75.43 5.01 1.47 145.3 -3.63 b 114.8 2.33 1.50 3.64 99.00 0.0125 31 -79.08 4.98 1.46 143.8 -3.65 c -142.7 2.29 1.49 3.66 98.33 0.0095 32 -82.80 4.95 1.48 142.9 -3.72 d -41.6 2.29 1.51 3.61 99.60 0.0078 33 -86.61 4.92 1.46 137.8 -3.82 e 63.5 2.29 1.50 3.56 101.05 0.0062 34 -90.35 4.91 1.45 139.4 -3.74 f 167.1 2.29 1.48 3.58 100.64 0.0048 35 -93.97 4.91 1.45 144.8 -3.61 g -88.1 2.27 1.49 3.60 99.88 0.0035 36 -97.52 4.98 1.46 148.3 -3.55 a 15.5 2.32 1.50 3.62 99.58 0.0029 37 -101.10 5.06 1.49 150.1 -3.57 b 117.8 2.28 1.52 3.63 99.29 0.0020 38 -104.58 5.16 1.48 153.0 -3.49 c -139.3 2.33 1.52 3.68 97.96 0.0018 39 -107.91 5.25 1.50 162.0 -3.33 d -40.1 2.26 1.53 3.66 98.26 0.0017 40 -110.99 5.36 1.47 171.4 -3.08 e 63.3 2.35 1.50 3.63 99.17 0.0028 41 -113.77 5.47 1.44 186.8 -2.78 f 162.1 2.28 1.47 3.63 99.18 0.0036 42 -116.35 5.60 1.47 205.4 -2.58 g -93.6 2.32 1.50 3.63 99.11 0.0051 43 -118.97 5.76 1.48 203.3 -2.62 a 9.6 2.29 1.51 3.65 98.64 0.0070 44 -121.70 5.93 1.44 190.1 -2.73 b 108.6 2.27 1.48 3.65 98.59 0.0088 45 -124.28 6.05 1.45 202.9 -2.58 c -149.5 2.35 1.48 3.62 99.42 0.0089 46 -126.72 6.18 1.49 218.7 -2.45 d -47.4 2.24 1.51 3.64 98.95 0.0089 47 -129.16 6.28 1.51 223.1 -2.44 e 53.3 2.31 1.54 3.63 99.25 0.0075 48 -131.46 6.39 1.50 235.5 -2.30 f 155.2 2.28 1.53 3.62 99.46 0.0065 49 -133.64 6.51 1.44 237.7 -2.18 g -103.7 2.29 1.47 3.64 98.92 0.0070 50 -135.93 6.68 1.46 229.2 -2.29 a 0.8 2.33 1.49 3.61 99.81 0.0078 51 -138.26 6.87 1.47 227.0 -2.33 b 99.9 2.27 1.51 3.63 99.19 0.0070 52 -140.63 7.06 1.43 217.8 -2.37 c -158.3 2.31 1.48 3.63 99.15 0.0074 53 -143.08 7.28 1.43 210.1 -2.46 z -57.3 2.33 1.48 3.64 99.04 0.0000 54 -145.41 7.50 1.43 220.6 -2.33 a 43.9 2.28 1.48 3.67 98.20 0.0000 55 -147.39 7.74 1.52 276.5 -1.98 b 143.2 2.31 1.57 3.59 100.29 0.0000 56 -149.10 8.09 1.59 336.1 -1.70 c -111.0 2.20 1.64 3.59 100.33 0.0000 57 -150.71 8.41 1.55 345.2 -1.62 z -8.8 2.28 1.60 3.64 99.17 0.0000 Ave 5.63 1.47 157.9 -3.35 2.29 1.51 3.63 99.33 0.0084 Std 0.98 0.04 50.3 1.06 0.04 0.04 0.03 0.86 0.0043 Overall ccpitch is estimated as 2Pi*<cc_rise>/<cc_angle_per_res> Overall roc of the a-helix axis (1/<curv>) 119.42 A with curvature smoothing base 5 ********* Crick angles for heptad position a ********* Res Crick_angle 15 10.25 22 16.33 29 12.37 36 15.50 43 9.65 50 0.85 54 43.92 Ave 15.55 Std 12.50 ********* Crick angles for heptad position d ********* Res Crick_angle 18 -37.42 25 -33.70 32 -41.64 39 -40.13 46 -47.39 Ave -40.06 Std 4.55

!"#$%&'(7*G$$&2IA@&H( ( 01(.'#23&(
/7:(
6.2.3 Tetramer
********************************************************************* * TWISTER: Analysis of coiled-coil geometry S.Strelkov 2000-2 * * E-mail:[email protected] * * Reference: Strelkov,S.V., and Burkhard,P. (2002) J. Struct. Biol. * ********************************************************************* Title cc214_ABCD_42-59 Input pdb_file ABCD_renumALL_CAonly.pdb 4-stranded coiled coil, chains A C B D First_res 42, last_res 59 Output pdb_file cc214_ABCD_42-59_tw.out ********* Sequence and heptad assignment ********* 50 LIQQYQEQ LDKSTKLVET cdefgabc zabcdefgab ********* Coiled-coil parameters per residue ********* Res cc_phase cc_rad cc_rise cc_pit cc_dang pos Cr_ang a_rad a_ris res/tur a_dang axis_cur 43 -5.81 5.25 1.58 98.1 -5.81 d -37.7 1.77 1.97 4.18 89.59 0.0000 44 -10.46 5.82 1.58 122.2 -4.66 e 63.6 1.94 1.81 3.56 101.48 0.0000 45 -13.15 6.06 1.57 210.5 -2.69 f 163.3 2.28 1.63 3.63 99.18 0.0000 46 -15.45 6.23 1.51 236.6 -2.30 g -94.5 2.29 1.55 3.62 99.49 0.0000 47 -17.81 6.41 1.45 221.2 -2.36 a 6.1 2.30 1.49 3.65 98.58 0.0000 48 -20.14 6.57 1.45 223.3 -2.33 b 106.9 2.32 1.48 3.63 99.06 0.0108 49 -22.39 6.74 1.43 228.7 -2.25 c -151.6 2.31 1.47 3.64 98.97 0.0083 50 -24.70 6.96 1.45 226.6 -2.31 z -52.2 2.30 1.49 3.63 99.12 0.0069 51 -27.05 7.21 1.46 223.0 -2.35 a 49.8 2.30 1.50 3.63 99.33 0.0076 52 -29.34 7.43 1.44 227.5 -2.29 b 151.6 2.31 1.48 3.64 98.96 0.0071 53 -31.67 7.67 1.49 229.8 -2.33 c -107.4 2.29 1.52 3.64 98.94 0.0062 54 -34.04 7.90 1.49 226.1 -2.37 d -6.3 2.31 1.53 3.66 98.33 0.0000 55 -36.44 8.18 1.50 225.7 -2.40 e 93.9 2.25 1.55 3.62 99.38 0.0000 56 -38.91 8.45 1.52 221.7 -2.48 f -162.9 2.34 1.56 3.60 99.92 0.0000 57 -42.07 8.48 1.59 181.4 -3.16 g -65.4 2.03 1.65 3.59 100.70 0.0000 58 -45.73 8.95 1.67 164.7 -3.65 a 38.7 2.35 1.75 3.38 110.07 0.0000 Ave 7.14 1.51 190.5 -2.86 2.23 1.59 3.64 99.45 0.0078 Std 1.04 0.07 66.5 0.99 0.16 0.14 0.15 3.70 0.0015 Overall ccpitch is estimated as 2Pi*<cc_rise>/<cc_angle_per_res> Overall roc of the a-helix axis (1/<curv>) 127.64 A with curvature smoothing base 5 ********* Crick angles for heptad position a ********* Res Crick_angle 47 6.09 51 49.82 58 38.73 Ave 31.55 Std 18.56 ********* Crick angles for heptad position d *********

!"#$%&'(7*G$$&2IA@&H( ( 01(.'#23&(
/8;(
Res Crick_angle 43 -37.66 54 -6.25 Ave -21.96 Std 15.70

!"#$%&'(7*G$$&2IA@&H( ( 01(.'#23&(
/8/(
6.3 Appendix III - Socket output for MuRF1-CC
SOCKET v3.02 02-11-01 John Walshaw, University of Sussex using cutoff of 7.0 Angstroms for centre of mass distances attempting to open "MOD_9.pdb" opened "MOD_9.pdb" (input) opened "MOD_9.dssp" (input) opened "MOD_9.7.0.long.socket" (output) Found beginning of residue data There are 215 alpha-helical residues in this structure chain A starts at residue 1, iCode=' ' chain C starts at residue 2, iCode=' ' chain B starts at residue 1, iCode=' ' chain D starts at residue 5, iCode=' ' These are the knobs and holes: knobs in helix 0: 1) 16 (LEU 18:A, iCode=' ', helix 0) type 4 (hole: THR 22:C iCode=' ', GLN 25:C iCode=' ', GLU 26:C iCode=' ', LEU 29:C iCode=' ' helix 1) packing angle 99.059 2) 20 (THR 22:A, iCode=' ', helix 0) type 4 (hole: GLN 25:C iCode=' ', LYS 28:C iCode=' ', LEU 29:C iCode=' ', ILE 32:C iCode=' ' helix 1) packing angle 29.740 3) 23 (GLN 25:A, iCode=' ', helix 0) type 3 (hole: LEU 29:C iCode=' ', ILE 32:C iCode=' ', GLU 33:C iCode=' ', ILE 36:C iCode=' ' helix 1) packing angle 102.214 4) 27 (LEU 29:A, iCode=' ', helix 0) type 4 (hole: ILE 32:C iCode=' ', LEU 35:C iCode=' ', ILE 36:C iCode=' ', TYR 39:C iCode=' ' helix 1) packing angle 25.575 knobs in helix 1: 6) 78 (GLN 25:C, iCode=' ', helix 1) type 4 (hole: SER 15:A iCode=' ', LEU 18:A iCode=' ', GLN 19:A iCode=' ', THR 22:A iCode=' ' helix 0) packing angle 86.855 7) 82 (LEU 29:C, iCode=' ', helix 1) type 4 (hole: LEU 18:A iCode=' ', ILE 21:A iCode=' ', THR 22:A iCode=' ', GLN 25:A iCode=' ' helix 0) packing angle 25.120 8) 85 (ILE 32:C, iCode=' ', helix 1) type 4 (hole: THR 22:A iCode=' ', GLN 25:A iCode=' ', GLU 26:A iCode=' ', LEU 29:A iCode=' ' helix 0) packing angle 91.364 9) 89 (ILE 36:C, iCode=' ', helix 1) type 4 (hole: GLN 25:A iCode=' ', LYS 28:A iCode=' ', LEU 29:A iCode=' ', ILE 32:A iCode=' ' helix 0) packing angle 26.353 knobs in helix 2: 20) 126 (LEU 18:B, iCode=' ', helix 2) type 4 (hole: ALA 8:D iCode=' ', ASP 11:D iCode=' ', GLU 12:D iCode=' ', SER 15:D iCode=' ' helix 3) packing angle 87.697 21) 130 (THR 22:B, iCode=' ', helix 2) type 4 (hole: ASP 11:D iCode=' ', LYS 14:D iCode=' ', SER 15:D iCode=' ', LEU 18:D iCode=' ' helix 3) packing angle 30.194 22) 133 (GLN 25:B, iCode=' ', helix 2) type 4 (hole: SER 15:D iCode=' ', LEU 18:D iCode=' ', GLN 19:D iCode=' ', THR 22:D iCode=' ' helix 3) packing angle 91.182 23) 137 (LEU 29:B, iCode=' ', helix 2) type 4 (hole: LEU 18:D iCode=' ', ILE 21:D iCode=' ', THR 22:D iCode=' ', GLN 25:D iCode=' ' helix 3) packing angle 29.725 24) 140 (ILE 32:B, iCode=' ', helix 2) type 4 (hole: THR 22:D iCode=' ', GLN 25:D iCode=' ', GLU 26:D iCode=' ', LEU 29:D iCode=' ' helix 3) packing angle 94.160 25) 144 (ILE 36:B, iCode=' ', helix 2) type 4 (hole: GLN 25:D iCode=' ', LYS 28:D iCode=' ', LEU 29:D iCode=' ', ILE 32:D iCode=' ' helix 3) packing angle 25.039 knobs in helix 3: 28) 170 (ASP 11:D, iCode=' ', helix 3) type 4 (hole: SER 15:B iCode=' ', LEU 18:B iCode=' ', GLN 19:B iCode=' ', THR 22:B iCode=' ' helix 2) packing angle 110.000 29) 174 (SER 15:D, iCode=' ', helix 3) type 4 (hole: LEU 18:B iCode=' ', ILE 21:B iCode=' ', THR 22:B iCode=' ', GLN 25:B iCode=' ' helix 2) packing angle 31.337 30) 177 (LEU 18:D, iCode=' ', helix 3) type 4 (hole: THR 22:B iCode=' ', GLN 25:B iCode=' ', GLU 26:B iCode=' ', LEU 29:B iCode=' ' helix 2) packing angle 93.801 31) 181 (THR 22:D, iCode=' ', helix 3) type 4 (hole: GLN 25:B iCode=' ', LYS 28:B iCode=' ', LEU 29:B iCode=' ', ILE 32:B iCode=' ' helix 2) packing angle 25.807

!"#$%&'(7*G$$&2IA@&H( ( 01(.'#23&(
/8)(
32) 184 (GLN 25:D, iCode=' ', helix 3) type 3 (hole: LEU 29:B iCode=' ', ILE 32:B iCode=' ', GLU 33:B iCode=' ', ILE 36:B iCode=' ' helix 2) packing angle 103.911 33) 188 (LEU 29:D, iCode=' ', helix 3) type 4 (hole: ILE 32:B iCode=' ', LEU 35:B iCode=' ', ILE 36:B iCode=' ', TYR 39:B iCode=' ' helix 2) packing angle 26.322 holes in helix 0: SER 15:A iCode=' ', LEU 18:A iCode=' ', GLN 19:A iCode=' ', THR 22:A iCode=' ' (knob: 78 (GLN 25:C, helix 1)) LEU 18:A iCode=' ', ILE 21:A iCode=' ', THR 22:A iCode=' ', GLN 25:A iCode=' ' (knob: 82 (LEU 29:C, helix 1)) THR 22:A iCode=' ', GLN 25:A iCode=' ', GLU 26:A iCode=' ', LEU 29:A iCode=' ' (knob: 85 (ILE 32:C, helix 1)) GLN 25:A iCode=' ', LYS 28:A iCode=' ', LEU 29:A iCode=' ', ILE 32:A iCode=' ' (knob: 89 (ILE 36:C, helix 1)) holes in helix 1: THR 22:C iCode=' ', GLN 25:C iCode=' ', GLU 26:C iCode=' ', LEU 29:C iCode=' ' (knob: 16 (LEU 18:A, helix 0)) GLN 25:C iCode=' ', LYS 28:C iCode=' ', LEU 29:C iCode=' ', ILE 32:C iCode=' ' (knob: 20 (THR 22:A, helix 0)) LEU 29:C iCode=' ', ILE 32:C iCode=' ', GLU 33:C iCode=' ', ILE 36:C iCode=' ' (knob: 23 (GLN 25:A, helix 0)) ILE 32:C iCode=' ', LEU 35:C iCode=' ', ILE 36:C iCode=' ', TYR 39:C iCode=' ' (knob: 27 (LEU 29:A, helix 0)) holes in helix 2: SER 15:B iCode=' ', LEU 18:B iCode=' ', GLN 19:B iCode=' ', THR 22:B iCode=' ' (knob: 170 (ASP 11:D, helix 3)) LEU 18:B iCode=' ', ILE 21:B iCode=' ', THR 22:B iCode=' ', GLN 25:B iCode=' ' (knob: 174 (SER 15:D, helix 3)) THR 22:B iCode=' ', GLN 25:B iCode=' ', GLU 26:B iCode=' ', LEU 29:B iCode=' ' (knob: 177 (LEU 18:D, helix 3)) GLN 25:B iCode=' ', LYS 28:B iCode=' ', LEU 29:B iCode=' ', ILE 32:B iCode=' ' (knob: 181 (THR 22:D, helix 3)) LEU 29:B iCode=' ', ILE 32:B iCode=' ', GLU 33:B iCode=' ', ILE 36:B iCode=' ' (knob: 184 (GLN 25:D, helix 3)) ILE 32:B iCode=' ', LEU 35:B iCode=' ', ILE 36:B iCode=' ', TYR 39:B iCode=' ' (knob: 188 (LEU 29:D, helix 3)) holes in helix 3: ALA 8:D iCode=' ', ASP 11:D iCode=' ', GLU 12:D iCode=' ', SER 15:D iCode=' ' (knob: 126 (LEU 18:B, helix 2)) ASP 11:D iCode=' ', LYS 14:D iCode=' ', SER 15:D iCode=' ', LEU 18:D iCode=' ' (knob: 130 (THR 22:B, helix 2)) SER 15:D iCode=' ', LEU 18:D iCode=' ', GLN 19:D iCode=' ', THR 22:D iCode=' ' (knob: 133 (GLN 25:B, helix 2)) LEU 18:D iCode=' ', ILE 21:D iCode=' ', THR 22:D iCode=' ', GLN 25:D iCode=' ' (knob: 137 (LEU 29:B, helix 2)) THR 22:D iCode=' ', GLN 25:D iCode=' ', GLU 26:D iCode=' ', LEU 29:D iCode=' ' (knob: 140 (ILE 32:B, helix 2)) GLN 25:D iCode=' ', LYS 28:D iCode=' ', LEU 29:D iCode=' ', ILE 32:D iCode=' ' (knob: 144 (ILE 36:B, helix 2)) knob 0 (residue 13 = SER 15:A iCode=' ') type 2 order -1 knob 1 (residue 16 = LEU 18:A iCode=' ') type 4 order 2 knob 2 (residue 20 = THR 22:A iCode=' ') type 4 order 2 knob 3 (residue 23 = GLN 25:A iCode=' ') type 3 order 2 knob 4 (residue 27 = LEU 29:A iCode=' ') type 4 order 2 knob 5 (residue 37 = TYR 39:A iCode=' ') type 2 order -1 knob 6 (residue 78 = GLN 25:C iCode=' ') type 4 order 2 knob 7 (residue 82 = LEU 29:C iCode=' ') type 4 order 2 knob 8 (residue 85 = ILE 32:C iCode=' ') type 4 order 2 knob 9 (residue 89 = ILE 36:C iCode=' ') type 4 order 2 knob 10 (residue 92 = TYR 39:C iCode=' ') type 1 order -1 knob 11 (residue 45 = THR 47:A iCode=' ') type 2 order -1 knob 12 (residue 162 = ILE 54:B iCode=' ') type 2 order -1 knob 13 (residue 44 = SER 46:A iCode=' ') type 2 order -1 knob 14 (residue 205 = SER 46:D iCode=' ') type 2 order -1 knob 15 (residue 102 = LEU 49:C iCode=' ') type 2 order -1 knob 16 (residue 157 = LEU 49:B iCode=' ') type 2 order -1 knob 17 (residue 164 = SER 56:B iCode=' ') type 2 order -1 knob 18 (residue 107 = ILE 54:C iCode=' ') type 2 order -1 knob 19 (residue 206 = THR 47:D iCode=' ') type 2 order -1 knob 20 (residue 126 = LEU 18:B iCode=' ') type 4 order 2 knob 21 (residue 130 = THR 22:B iCode=' ') type 4 order 2

!"#$%&'(7*G$$&2IA@&H( ( 01(.'#23&(
/85(
knob 22 (residue 133 = GLN 25:B iCode=' ') type 4 order 2 knob 23 (residue 137 = LEU 29:B iCode=' ') type 4 order 2 knob 24 (residue 140 = ILE 32:B iCode=' ') type 4 order 2 knob 25 (residue 144 = ILE 36:B iCode=' ') type 4 order 2 knob 26 (residue 147 = TYR 39:B iCode=' ') type 1 order -1 knob 27 (residue 167 = ALA 8:D iCode=' ') type 2 order -1 knob 28 (residue 170 = ASP 11:D iCode=' ') type 4 order 2 knob 29 (residue 174 = SER 15:D iCode=' ') type 4 order 2 knob 30 (residue 177 = LEU 18:D iCode=' ') type 4 order 2 knob 31 (residue 181 = THR 22:D iCode=' ') type 4 order 2 knob 32 (residue 184 = GLN 25:D iCode=' ') type 3 order 2 knob 33 (residue 188 = LEU 29:D iCode=' ') type 4 order 2 knob 34 (residue 198 = TYR 39:D iCode=' ') type 2 order -1 coiled coil 0: 2 helices 0 1 frequency 4 coiled coil 1: 2 helices 2 3 frequency 6 helix 0 is in a 2-stranded coiled coil helix 1 is in a 2-stranded coiled coil helix 2 is in a 2-stranded coiled coil helix 3 is in a 2-stranded coiled coil coiled coil 0: angle between helices 0 and 1 is 21.040 parallel this coiled coil is parallel MOD_9.pdb 7.0 0 coiled coil (i) 0 (parallel 2-stranded, length max 18 mean 18.00): assigning heptad to helix 0 (X) 2-57:A extent of coiled coil packing: 15- 32:A sequence AMDTLYAILDEKKSELLQRITQEQEEKLSFIEALIQQYQEQLDKSTKLVETAIQSL register abcdefgabcdefgabcd partner -------------Y--Y---Y--Y---Y---------Y------!!---------- knobtype -------------2--4---4--3---4---------2------22---------- repeats 0 non-canonical interrupts in 18 residues: 7,7,4 assigning heptad to helix 1 (Y) 3-56:C extent of coiled coil packing: 22- 39:C sequence MDTLYAILDEKKSELLQRITQEQEEKLSFIEALIQQYQEQLDKSTKLVETAIQS register abcdefgabcdefgabcd partner ----------------------X---X--X---X--X---------!----!-- knobtype ----------------------4---4--4---4--1---------2----2-- repeats 0 non-canonical interrupts in 18 residues: 7,7,4 coiled coil 1: angle between helices 2 and 3 is 26.460 parallel this coiled coil is parallel MOD_9.pdb 7.0 0 coiled coil (ii) 1 (parallel 2-stranded, length max 25 mean 25.00): assigning heptad to helix 2 (X) 2-56:B extent of coiled coil packing: 15- 39:B sequence AMDTLYAILDEKKSELLQRITQEQEEKLSFIEALIQQYQEQLDKSTKLVETAIQS

!"#$%&'(7*G$$&2IA@&H( ( 01(.'#23&(
/86(
register abcdefgabcdefgabcdefgabcd partner ----------------Y---Y--Y---Y--Y---Y--Y---------!----!-! knobtype ----------------4---4--4---4--4---4--1---------2----2-2 repeats 0 non-canonical interrupts in 25 residues: 7,7,7,4 assigning heptad to helix 3 (Y) 6-55:D extent of coiled coil packing: 8- 32:D sequence LYAILDEKKSELLQRITQEQEEKLSFIEALIQQYQEQLDKSTKLVETAIQ register abcdefgabcdefgabcdefgabcd partner --X--X---X--X---X--X---X---------X------!!-------- knobtype --2--4---4--4---4--3---4---------2------22-------- repeats 0 non-canonical interrupts in 25 residues: 7,7,7,4 MOD_9.pdb c 7.00 e 0 result 2 COILED COILS PRESENT Finished

!"#$%&'(7*G$$&2IA@&H( ( 01(.'#23&(
/84(
6.4 Appendix IV - Published papers
6.4.1 “Assembly of a protein “brush” by end-grafting titin fragments to
liposomes”
Mohamed Chami, Barbara Franke, Olga Mayans, and Laurent Kreplak
Personal contribution included production and chromatographic purification
of protein samples.

!"#$%&'(7*G$$&2IA@&H( ( 01(.'#23&(
/87(
This text box is where the unabridged thesis included the following third party copyright material: Chami, M., Franke, B., Mayans, O., Kreplak. (2011). “Assembly of a protein “brush” by end-grafting titin filaments to liposomes. Journal of Bioscience and Bioengineering 112 (2):178-9. doi: http://dx.doi.org/10.1016/j.jbiosc.2011.04.014 (

!"#$%&'(7*G$$&2IA@&H( ( 01(.'#23&(
/89(
6.4.2 “The intracellular Ig fold: a robust protein scaffold for the engineering
of molecular recognition”
Marc Bruning, Igor Barsukov, Barbara Franke, Sonia Barbieri, Martin Volk,
Sonja Leopoldseder, Zohre Ucurum and Olga Mayans
Personal contributions to this paper include production, chromatographic
purification, and preparation of Z1 and Z1 variant samples for: Fourier transform
infrared spectroscopy, Nuclear magnetic resonance spectroscopy (labelled samples),
and Differential scanning fluorimetry, as well as contributing to differential scanning
fluorimetry experiments, and analyses. Contributions also included preparation of
Fig 2.

!"#$%&'(7*G$$&2IA@&H( ( 01(.'#23&(
/8:(
This text box is where the unabridged thesis included the following third party copyright material: Bruning, M., Barsuko, I., Franke, B., Barbieri, S., Volk, M., Leopoldseder, S., Ucurum, Z., Mayans, O. (2012). “The intracellular Ig fold: a robust protein scaffold for the engineering of molecular recognition.” Protein engineering design & selection 25 (5):205-212. doi: http://dx.doi.org/10.1093/protein/gzs007 (

!"#$%&'(7*G$$&2IA@&H( ( 01(.'#23&(
/:9(
6.5 Apendix V - Copyright permissions and statements
Copyright permissions were obtained for the following figures:
Figure 1.1 was reprinted from Advances in Protein Chemistry, 71, Squire JM, Al-Khayat HA, Knupp C, Luther PK., Molecular architecture in muscle contractile assemblies, 17-87, 2005, with permission from Elsevier
Figure 2.3 was reprinted from Circulation Research, 100, Willis MS, Ike C, Li L, Wang DZ, Glass DJ, Patterson C. Muscle ring finger 1, but not muscle ring finger 2, regulates cardiac hypertrophy in vivo. 456-459, 2007, with permission of Wolters Kluwer Health.
Figure 4.2 was reprinted with kind permission from Springer Science and Business Media, from Springer and Journal of Muscle Research and Cell Motility, 26, 2005, 355-365, Poly-Ig tandems from I-band titin share extended domain arrangements irrespective of the distinct features of their modular constituents, Marino M, Svergun DI, Kreplak L, Konarev PV, Maco B, Labeit D, Mayans O., Figure 1, original copyright notice is given to the publication in which the material was originally published.
Figure 4.3 was reprinted from Journal of Molecular Biology, 384, Houmeida A, Baron A, Keen J, Khan GN, Knight PJ, Stafford WF, 3rd, Thirumurugan K, Thompson B, Tskhovrebova L, Trinick J. Evidence for the oligomeric state of 'elastic' titin in muscle sarcomeres 299-312, 2008, with permission from Elsevier