
Deep-bed filtration model with multistage deposition kinetics
Multistage Combined Ellipse and LineDetection
Geoff A.W. West k Paul L. RosinCognitive Systems Group
School of Computing Science Curtin University of TechnologyGPO U1987, Perth, 6000, Western Australia
email: [email protected] [email protected]
AbstractThis paper describes an algorithm for the detection of ellipses and lines
in image edge data. Connected edge pixels are transformed into polygo-nal approximations by a two stage algorithm. Then a second two stagealgorithm replaces combinations of lines by ellipses if the ellipse fit isbetter. For each algorithm a combination of splitting and merging of thedata is used to enable global and local constraints to fit different rep-resentations to the pixel data. All merging decisions use a significancemeasure to replace a number of representations by a single representationwhich removes the need for thresholds in the algorithms. The structureof the algorithm allows any particular representation to describe the datae.g. parabolae, splines, etc. instead of ellipses.
1 Introduction
In computer vision the extraction of meaningful features from images is animportant technigue. The most popular approach is based on edge detection.For model based object recognition, edges must be represented in a more man-ageable form than simply pixels. The type of representation required is highlyapplication dependent but is typically based on a combination of straight lineapproximations and higher order curves such as arcs, conic sections, spline andcurvature primitives.
A number of techniques have been proposed for determining polygonal ap-proximations [5] [10]. However it is only recently that attention has been con-centrated on the extraction of higher order representations because of the in-creased number of parameters or degrees of freedom and the ill-conditionednature of the problem [8] [4].
This paper describes a technique for generating a higher order descriptionby segmenting the edge data into combinations of ellipses and lines. Thereare four stages used: (1) lines are fitted to connected lists of edge pixels usingLowe's technique [3], (2) lines are grown by combining adjacent lines, (3) ellipsesreplace lines and finally (4) ellipses are grown by combining with adjacentlines and/or ellipses. In all stages replacement occurs only if the resultantfit is better. The concept of better fit is that suggested by Lowe which istermed a measure of significance. Significance is the maximum error betweenthe fitted representation and the data (a line fitted to pixels or an ellipse fittedto lines) normalised by the length of the representation. The significance is a

198
scale invariant measure which allows the replacing of (i) pixels by a line, (ii)combinations of lines by a line, (iii) combinations of lines by ellipses and (iv)combinations of lines and ellipses by ellipses. The same measure of significanceis used in all four stages removing the requirement for any thresholds.
Previously published results [8] have demonstrated the utility of ellipse andline detection based on stages (1) and (3) of the technique described above.In this paper an improved version of the line and ellipse fitting algorithmsis described which overcomes the disadvantages of using a binary search treefor stages (1) and (3) by adding new stages (2) and (4). It is shown that theaddition of these stages improves the performance of the algorithm. In additionthe improvements have been added to the algorithm for detecting arcs and lines(the LAD algorithm [11]).
2 Finding Representations
The problem of finding the optimum segmentation and hence representationfor any curve has resulted in a number of proposed solutions. Simple localtechniques such as segmenting at points of high curvature (vertices) and pointsof change in the rate of change of curvature have been proposed as have moreglobal techniques such as segmenting at the point of maximum distance fromthe curve to the representation. These usually result in a sub-optimal result. Toovercome the problem of using local constraints, context dependent local andglobal techniques have been proposed. Fischler [2] investigated the performanceof people for segmenting curves for a number of objectives and discovered thatthe points of segmentation varied depending on the objective. From the resultshe proposed a technique that processed curves using large windows to attemptto capture more global information. In fact it is only possible to correctlysegment a curve by taking into account the process that formed the curve e.g.the resulting 2D projections of 3D objects under certain viewing conditions. Inaddition a large number of curve models need to be available e.g. sine waves,parabolas, etc.
Where the objective is to fit a particular representation, an almost optimaltechnique can be formulated. All possible combinations of a particular repre-sentation such as a line can be fitted to the curve and the combination withthe best goodness of fit chosen. Consider the case of dividing a curve up inton segments of equal numbers of pixels. The task is to determine which of thepossible segmentation points can be removed, e.g. by combining two adjacentsegments to form one line. This is a combinatorially expensive process of orderO(2"~1). For example, for a curve 40 pixels long where n=8, eight 5 pixel longlines is the maximum number of lines that can fit the curve and the minimumis one. To determine the best combination, 128 combinations need to be con-sidered. The combinatorics are compounded if an attempt is made to replacecombinations of lines by ellipses or some other representation in a second stageof processing, or if different length segments are considered.
It would appear the best technique would be to restrict the number of com-binations that need to be tested. This can be achieved by using a binary searchtree as proposed by many researchers [3] [6]. However this has disadvantagesas shown in section 3 because some combinations of adjacent representationsare never compared as they are in different branches of the tree. To improve
199
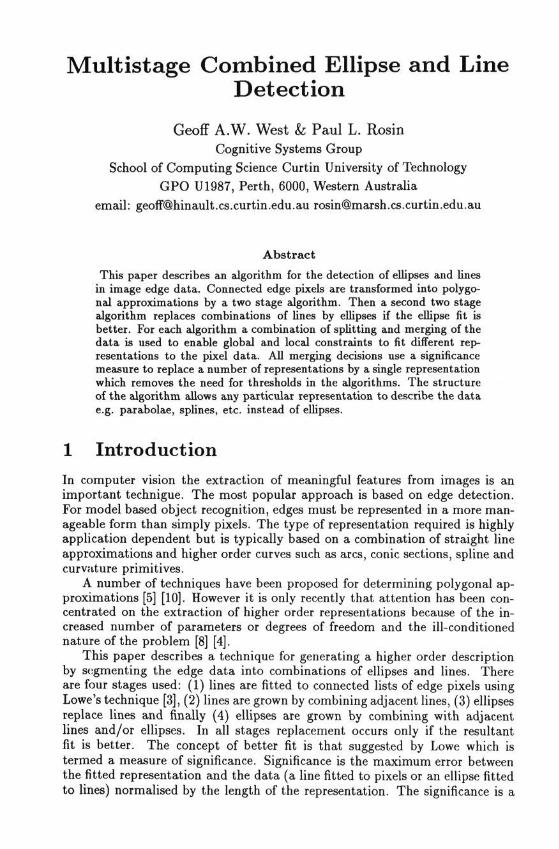
Figure 1. Segmentation of curves
the results a second stage is added that compares these representations.
There are a number of other issues that have to be addressed when con-sidering the segmentation of edge data into higher order representations. Themajority of algorithms, with the exception of [1], depend on pre-set parametersto determine such things as the accuracy of fit, the scale at which breakpointsare located, where breakpoints are, and thresholds for selecting the breakpoints.However, the results obtained are dependent on the parameters. For the lineand ellipse fitting algorithm [8], breakpoints for the two stages are the wellknown points of maximum error between the fitted straight line and the data.These have the advantage of not requiring any parameters for their detection.A subset of these become the vertices in the polygonal representation resultingfrom the first stage. In the second stage groups of lines are replaced by ellipsesso the breakpoints between representations are still effectively vertices. How-ever, these may not be optimal breakpoints for higher order representationssuch as ellipses and it can be argued that other breakpoints such as points ofinflection should also be used. Most higher order representations have con-tinuously varying curvature so the detection of breakpoints based on changesin curvature is not valid. Higher order differentials are necessary which aredifficult to determine in discrete data.
3 Line Fitting
3.1 Stage (1): binary search tree
The line fitting technique used is the familiar recursive binary tree search.Each curve is hypothesised to be a straight line, figure 1, and segmented atthe point of maximum deviation from the curve to the straight line. Theprocess is then repeated for each of the two curves recursively. When thebottom of the tree is reached and the curve cannot be subdivided anymore,tail recursion is used to combine together those lines for which the combinedline is a better representation than the other lines. This algorithm has beendescribed in detail elsewhere [11]. The important points to note are (1) the useof points of maximum deviation for breakpoints and (2) the binary search treepreventing all adjacent combinations of lines from being compared. Considerthe curve of figure 2a, the result of the algorithm is shown in 2b whereas theintuitively correct result is that in 2c. Figure 3 shows the interpretation treefor this curve. The tree shows that the curve has been segmented into the linesa,b,c,d,e and f, some of which have been combined under tail recursion to givethe result of figure 2b.

200
[cUd]
[a] [f] [a]
[bcde]
f] [a]
Figure 2. (a) original curve, (b) incorrect interpretation and (c) correctinterpretation
[abcdef]
[b] [c] [d] [e]
Figure 3. The interpretation tree for figure 2
3.2 Stage (2): combining adjacent lines
To overcome deficiencies such as shown in figure 2 a second stage is used thatcompares all adjacent lines and combines them if possible. Consider the ex-ample of figure 1 again. Figure 3 shows the tree that results from processingthis curve. Note the two lines that replace parts of the original curve [be] and[de] are not compared at all in the tree, hence the incorrect result. The secondstage takes the representations [a], [be], [de] and [f] and computes the goodnessof fit for combinations of a selected representation and its neighbours. Possiblerepresentations centred on [be] when compared and possibly combined with itsneighbours are: [abede], [abc]&[de], [a]&[bcde], and [a]&[bc]&[de] (unchanged)where [AB] indicates one representation made up of previous representations[A] and [B]. Note that [abc] has already been tested as [a] and [be] are adjacentin the tree. The new representation is the one that gives the lowest signifi-cance, the same measure used for the first stage. By iterating over the wholecurve until no further improvements can be made, all adjacent combinationsare tested. Using the second stage on the example of figure 2b should result inrepresentations [be] and [de] being combined resulting in the result of figure 2c- the intuitively correct result. This is because the combination of [be] and [de]should result in a lower significance than [be] and [de] individually.
For part of the curve of figure 2b, segment [be] and [de] each have a sig-nificance of approximately 1/6 and segment [bede] has a significance of 1/12.Hence [bcde] is a better representation that [be] or [de]. For a number of realimages, table 1 shows results for the total number of lines that result fromthe original and improved line fitting algorithm. Each of these images containa number of generalised cylinders. iccv32 is the image for which results havepreviously been presented for line and ellipse fitting [8].

201
Imagename
mugs6iccv32
can3cyl21
Inputdata
Numberof pixels
20870143911288717659
After 1ststage
Numberof lines
11958979171257
After 2ndstage
Numberof lines
11097287741166
Table 1. Results for line fitting.
Stage (2) has improved the results in all three images reducing the totalnumber of lines. The use of significance means that the algorithm favours linesthat are more significant than others. Note a weighting factor can be used toforce the algorithm to favour new combinations i.e. longer lines. Weighting thenew combinations by a factor less than 1.0 will give the new line an artificiallylower significance forcing the replacement by a longer line.
Figure 4 shows results for the image cyl21. For the original image of fig-ure 4a, figure 4b shows the results of the new algorithm. The differences be-tween the results of the old and new algorithms are shown in figures 4c and 4d.Figure 4d shows the lines that replace the lines shown in figure 4c. Note thatmany old lines have been replaced by fewer longer new lines.
4 Ellipse Fitting
4.1 Stage(3): binary search tree
The basic ellipse fitting algorithm has been presented elsewhere [8]. Howevera short description is required for completeness. The result of the line fittingalgorithm is used as the input of the ellipse fitting algorithm which is, like theline fitting algorithm, based on a binary search. Figure 5a shows the output ofline fitting for a curve consisting of two straight lines and one ellipse. In theoriginal algorithm, an iterative Kalman filter was used to fit an ellipse to theendpoints of the curve. A standard least mean square conic fitting algorithmis now used. Although this can generate hyperbolae and parabolae, it usuallygenerates ellipses if the curve is an ellipse. Non-ellipse fits are ignored by givingthe result a high significance value so it is always replaced. Replacing theKalman filter has not altered the results significantly but the algorithm is nowfaster. Then the list of lines is split into two lists at the vertex of maximumdeviation from the ellipse. The algorithm is then repeated for the two lists.Figure 5b shows the resulting interpretation after ellipse fitting which is notcorrect. The single elliptic arc has been segmented into two elliptic arcs. Theintuitively correct result is shown in figure 5c. Figure 6 shows the interpretationtree for figure 5b. Note that the two elliptic arcs [bed] and [efg] do not getcompared in the tree.
When the length of a list of lines reduces to only 5 lines (or 6 vertices) theellipse fitting is halted and tail recursion used to choose the combination oflines and ellipses that best describe the list of lines in the sense of significance.At each node in the tree the single ellipse describing the list of lines is chosen ifit has a better significance than any of the representations below it in the tree.

202
[c]* [ a l m [bed] [a] ..
[h] [h] tbcdefg]
Figure 5. (a) result of line fitting, (b) incorrect oversegmentation, (c) correctsegmentation
[abedefgh]
:]\
[b] [c] [f]Figure 6. Interpretation tree for figure 5
A number of limitations occur with the algorithm which can be minimisedby the following techniques.
4.2 The use of soft breakpoints
Fitting ellipses to line data is more efficient that fitting to pixel data because ofthe reduction in the number of points for ellipse fitting. However this preventsattempts to fit an ellipse to less that 5 lines (6 vertices) since the fit will beunderdetermined. This leads to poor results as ellipses may be missed. It maybe that an ellipse would be a better fit to the pixel data than the line. Toovercome the problem of not being able to fit an ellipse to less that 5 lines, theconcept of soft breakpoints (edge pixel coordinates) is introduced. Consider thehypothesis that an ellipse fits the pixel data better than one line. To confirm thehypothesis 6 data points are required so 4 soft breaks points taken equidistantalong the pixel data are used along with the two vertices of the line. If theellipse is a good fit to the data, a lower significance value should occur. Thisis the worst case scenario and the algorithm is adaptive such that soft breakpoints are only used when less that 5 lines are used. With three lines onlyfour vertices are available so one additional soft break point is needed for eachline. For two lines, two soft breakpoints per line are required. As such it avariable resolution technique that adapts to the amount of data present usingthe minimum required for the fitting so reducing computation. The alternativeof always fitting an ellipse directly to the pixel data is rejected because of theincreased computation in the least mean square conic fitting.

203
4.3 Stage (4): combining ellipses with adjacent ellipses/lines
To overcome the problem of using a binary tree, combinations of adjacentellipses and lines are tested in a way similar to that described for stage (2) ofline fitting. An ellipse will be combined with one or both of its neighbouringlines/ellipses if the significance is better.
Stage (4) is an iterative process that examines each ellipse and determinesif it can be extended by combining it with the adjacent representation (line orellipse). There are four possible outcomes: (i) do not combine, (ii) combinewith the left representation, (iii) combine with the right representation and(iv) combine with both representations. For each of these possibilities, thesignificance measure (as used in the previous three stages) is determined. Theresulting representation chosen is the one that results in lower significances(and hence more accurate fits). Iterating over all the ellipses until no furtherchanges can be made results in ellipses growing until further increase in sizeresults in reduced accuracy of fit.
Imagename
mugs6iccv32
can3cyl21
Input dataNo. oflines11087287741166
After stage 3No. oflines489393451664
No. ofellipses
1327689142
After stage 4No. oflines447381432620
No. ofellipses
13072
140
Table 2. Results for ellipse fitting.
The results of table 2 show that the additional stage of ellipse growingresults in reduced numbers of ellipses and straight lines. Longer ellipses arebeing generated by combining with lines and with some other ellipses. It isinteresting to note that there is an appreciable reduction in the number of lineswhich implies the use of the point of maximum deviation is not an optimalsegmentation method for ellipses. However the shortcomings are reduced bythe use of the new stage. The effect of the new algorithm is shown in figure 7for image cyl21. Figure 7a shows the results of the improved algorithm. Figures7b and 7c show the differences between the two algorithms. Note that in mostcases one ellipse has been grown by combining it with lines. However, in somecases, an ellipse has been grown by combining with ellipses and lines.
5 Results
To further demonstrate the performance of the new algorithm, results for anumber of images are shown in table 3. The results of the new algorithm areshown along with the differences between the new four stage algorithm and theoriginal two stage algorithm. The differences show the original combinationsof features and those replaced by the new stages.

204
Imagename
mugs6cyl21
iccv32can3cup 3
Two stage algorithmAfter
stage 1
No. oflines11951257897917518
Afterstage 2
No. oflines597924550626358
Afterstage 2
No. ofellipses
11877564833
Four stage algorithmAfterstagesl a n d 2No. oflines11091166728774477
Afterstages
3 and 4No. oflines447620381432270
Afterstages
3 and 4No. ofellipses
130140728853
Table 3. Results for the old two stage algorithm and the new four stagealgorithm.
For all the images, the number of lines has been reduced and the numberof ellipses has increased. This is expected because more ellipses are beingdetected at the expense of lines. Figure 8 shows some of a sequence of imagesof a predominantly circular object. The straight lines and ellipses have beenextracted in all the images and can be tracked reasonably well.
6 ConclusionThe new four stage algorithm shows a significant improvement in performanceover the original two stage algorithm [8] for a small increase in computation. Inthe spirit of the original algorithm, the new algorithm avoids the need for anyparameters. There are two reasons for the improvement. The first reason isthe use of soft breakpoints meaning that ellipses are adaptively fitted to whatcan be regarded as the minimum number of points. For a curve consisting ofa large number of lines, just the vertices are used. For a part of the curveconsisting of less than 5 lines, other points are used to allow an ellipse to befitted in the overdetermined sense. The effect of soft breakpoints is to enableellipses to be fitted to more parts of the data than before resulting in moreellipses being detected. The second reason is the use of the extra stages toovercome the shortcomings of using a binary search tree. Lines and ellipsesalready detected can be extended by combining with other ellipses and/or lines.Currently a minor extension to deal with closed boundaries is being carriedout. The combining of adjacent lines/ellipses needs to be performed betweenthe first and last elements of a closed list. Although this is a minor extensionit is necessary for completeness. A further extension which can be used is torefit the hypothesised ellipses to the original pixel data to get a better estimateof each ellipse. Hence a good estimate of each ellipse can be determined aftersegmentation.
The algorithm is made up of a number of stages that can be regarded assplits and merges. The sequence of operations is split and merge (stage 1),merge (stage 2), split and merge (stage 3) and merge (stage 4). Each splituses global information to determine breakpoints and each merge uses localinformation to remove breakpoints.
The improvements increase the usefulness of the algorithm for many appli-cations which require the detection of ellipses in the 2D image (circles in 3D

205
space) such as detection of generalised cylinders [9] and for bottom up percep-tual grouping [7] [12].
Finally the algorithm can be easily modified such that any parametric curvecan be detected if a fitting algorithm is available e.g. splines and parabolae,and has been extended to 3D curve data [13].
References[1] C.-H.Teh and R.T. Chin. On the detection of dominant points on digital
curves. IEEE Trans. PAMI, 11:859-872, 1989.
[2] M.A. Fischler and R.C. Bolles. Perceptual organisation and curve parti-tioning. Trans. IEEE PAMI, 8:100-105,1986.
[3] D.L. Lowe. Three-dimensional object recognition from single two-dimensional views. AI, 31:355-395, 1987.
[4] T. Pavlidis. Curve fitting with conic splines. ACM Trans. Graphics, 2:1-32,1983.
[5] T. Pavlidis and S.L. Horowitz. Segmentation of plane curves. IEEE Trans,on Computers, 23:860-870, 1974.
[6] P.L. Rosin and G.A.W. West. Segmentation of edges into lines and arcs.IVC, 7:109-114, 1989.
[7] P.L. Rosin and G.A.W. West. Perceptual grouping of circular arcs underprojection. Proc. 1st British Machine Vision Conf., pages 379-382, 1990.
[8] P.L. Rosin and G.A.W. West. Segmenting curves into elliptic arcs andstraight lines. Proc. IEEE 3rd Int. Conf. on Comp. Vision, pages 75-78,1990.
[9] P.L. Rosin and G.A.W. West. Extracting surfaces of revolution by percep-tual grouping of ellipses. Proc. IEEE Comp. Soc. Conf. on Comp. Visionand Pat. Rec, pages 677-678, 1991.
[10] Ramer U. An iterative procedure for the polygonal approximation of planecurves. CGIP, 1:244-256, 1972.
[11] G.A.W. West and P.L. Rosin. Techniques for segmenting image curvesinto meaningful descriptions. Pattern Recognition, 24:643-652, 1991.
[12] G.A.W. West and P.L. Rosin. Non-parametric segmentation of 2d and 3dcurves into lines and arcs. Proc. 2nd Int. Conf. of Automation, Roboticsand Computer Vision - ICARV92, 1992.
[13] G.A.W. West and P.L. Rosin. Perceptual grouping of parallel planar el-lipses for the recognition of 3d objects. Proc. 2nd Int. Conf. on ImageProcessing - ICIP92, 1992.

206
Figure 4 ("•) Raytraced image of cylinders.
Figure 4 (b) Lines detected by improved algorithm.Old lines (c) replaced by new algorithm with single lines (d)
Figure 7 (a) Ellipses and lines detected by improved algorithmOld lines and ellipses (b) replaced by single ellipses (c).
Figure 8. Results for scene from different viewpoints.
Copyright © 2022 FDOKUMEN