Multiple signal representation simulation of photonic devices, systems, and networks
15
282 IEEE JOURNAL OF SELECTED TOPICS IN QUANTUM ELECTRONICS, VOL. 6, NO. 2, MARCH/APRIL 2000 Multiple Signal Representation Simulation of Photonic Devices, Systems, and Networks Arthur Lowery, Senior Member, IEEE, Olaf Lenzmann, Member, IEEE, Igor Koltchanov, Rudi Moosburger, Ronald Freund, André Richter, Stefan Georgi, Dirk Breuer, and Harald Hamster Abstract—Photonic systems design requires simulation over a wide range of scales; from wavelength-sized resonances in lasers and filters, to interactions in global networks. To design these global systems, while considering the effects of the smallest component, requires sophisticated simulation technology. We have developed the Photonic Transmission Design Suite, which includes five different signal representations, so that the details of device performance can be efficiently considered within a large network simulation. Alternatively, a design can be studied using a coarse signal representation before switching to a detailed representation for further refinement. We give examples of the application of these representations, and show how the representation of a signal is adapted as it propagates through a system to optimize simulation efficiency. Index Terms—Communication systems, data communication, design automation, intersymbol interference, optical amplifiers, optical crosstalk, optical fiber communication, optical propagation in nonlinear media, semiconductor lasers. I. INTRODUCTION T HE DESIGN of photonic systems has reached a stage in which simulation is no longer a luxury, but a necessity. This situation has developed over only a few years, because sys- tems performance has reached a number of limits. Until the last decade, optical communications systems were chiefly limited by loss, dispersion, and transmitter and receiver performance [1]. However, loss is easy to calculate on the back of an enve- lope, and dispersion can be estimated by rule of thumb, aided by experience. It is the advent of optical amplifiers, enabling high powers and long unregenerated distances that have caused significant fiber nonlinearity that necessitated the use of nu- merical modeling: to calculate crosstalk caused by four-wave mixing and the interplay of nonlinearity and dispersion, such as in near-soliton and soliton systems [2]. In addition, long unre- generated systems suffer from polarization mode dispersion as a system limitation. Furthermore, new problems requiring computer-aided design are beginning to come to light [3]. These problems include the design of components for dense wavelegnth-division mul- tiplexing (WDM) systems, with several tens of channels. To Manuscript received July 20, 1999; revised February 7, 2000. This work was supported in part by the European Union’s ACTS DEMON Project. A. Lowery is with Virtual Photonics Inc., Carlton 3053, Australia. O. Lenzmann, I. Koltchanov, R. Moosburger, R. Freund, A. Richter, S. Georgi, and D. Breuer are with Virtual Photonics Inc., D10587 Berlin, Germany. H. Hamster is with Virtual Photonics Inc., San Bruno, CA 94066 USA. Publisher Item Identifier S 1077-260X(00)03856-9. continue an exponential growth in fiber capacity, denser WDM systems will be required as the fiber bandwidth is used up, which will have to operate with channel spacings reduced to a few times the channel bit rate [4]. These systems will require sophisticated modulation techniques, such as phase/ampli- tude/polarization modulation, perhaps including duobinary [5] or single-side band modulation [6]. Furthermore, the design of optical filters for wavelength multiplexers will have to become more sophisticated, because the filters will have to have flat passbands, good rejection, and low differential group delays (low dispersion). This design becomes problematic as the channel bandwidths become a significant fraction of channel spacing. A push to all-photonic networks, or at least networks with photonic switching, will require careful consideration of optical crosstalk and multipath interference [7]. Low levels of crosstalk can have a significant effect because of the coherent mixing of optical fields. Even if the fields are from different transmitters, or carrying different data, or even from the same transmitter but over a ghost path longer by more than the coherence length of the laser, coherent mixing will cause large penalties. Thus, all paths should be considered in a photonic network, and this re- quires significant computation if all possible phase combina- tions are considered in networks with complex switch topolo- gies [8]. All-photonic networks will require optical amplification to compensate for losses in switches and multiplexers on top of fiber losses. Cascades of amplifiers could cause power transients and strong interaction between WDM channels as the channels are switched on and off [9]. Transients are caused by the mil- lisecond dynamics of the amplifiers, but they have nanosecond features, which is a difficult modeling problem because of the range of time scales. In the steady-state condition, the gain spec- trum of amplifiers should be flattened to avoid large differences in signal-to-noise ratio (SNR) between channels [10]. Fig. 1 summarizes the challenges to modeling a photonic communications system, from transmitter, through add–drop multiplexers, optical cross connects, long-haul links, and, finally, at the receiver. The design of an optical component can directly and significantly affect the performance of an optical system. The system being affected could cost hundreds of millions of dollars: the component could cost tens of dollars. It would be too expensive to develop every component and optimize it by testing within a whole system. It would also take considerable time to optimize component designs by developing a series of prototypes. It may be impossible to 1077–260X/00$10.00 © 2000 IEEE
Transcript of Multiple signal representation simulation of photonic devices, systems, and networks
282 IEEE JOURNAL OF SELECTED TOPICS IN QUANTUM ELECTRONICS, VOL. 6, NO. 2, MARCH/APRIL 2000
Multiple Signal Representation Simulation ofPhotonic Devices, Systems, and Networks
Arthur Lowery, Senior Member, IEEE, Olaf Lenzmann, Member, IEEE, Igor Koltchanov, Rudi Moosburger,Ronald Freund, André Richter, Stefan Georgi, Dirk Breuer, and Harald Hamster
Abstract—Photonic systems design requires simulation overa wide range of scales; from wavelength-sized resonances inlasers and filters, to interactions in global networks. To designthese global systems, while considering the effects of the smallestcomponent, requires sophisticated simulation technology. We havedeveloped the Photonic Transmission Design Suite, which includesfive different signal representations, so that the details of deviceperformance can be efficiently considered within a large networksimulation. Alternatively, a design can be studied using a coarsesignal representation before switching to a detailed representationfor further refinement. We give examples of the application ofthese representations, and show how the representation of asignal is adapted as it propagates through a system to optimizesimulation efficiency.
Index Terms—Communication systems, data communication,design automation, intersymbol interference, optical amplifiers,optical crosstalk, optical fiber communication, optical propagationin nonlinear media, semiconductor lasers.
I. INTRODUCTION
T HE DESIGN of photonic systems has reached a stage inwhich simulation is no longer a luxury, but a necessity.
This situation has developed over only a few years, because sys-tems performance has reached a number of limits. Until the lastdecade, optical communications systems were chiefly limitedby loss, dispersion, and transmitter and receiver performance[1]. However, loss is easy to calculate on the back of an enve-lope, and dispersion can be estimated by rule of thumb, aidedby experience. It is the advent of optical amplifiers, enablinghigh powers and long unregenerated distances that have causedsignificant fiber nonlinearity that necessitated the use of nu-merical modeling: to calculate crosstalk caused by four-wavemixing and the interplay of nonlinearity and dispersion, such asin near-soliton and soliton systems [2]. In addition, long unre-generated systems suffer from polarization mode dispersion asa system limitation.
Furthermore, new problems requiring computer-aided designare beginning to come to light [3]. These problems includethe design of components for dense wavelegnth-division mul-tiplexing (WDM) systems, with several tens of channels. To
Manuscript received July 20, 1999; revised February 7, 2000. This work wassupported in part by the European Union’s ACTS DEMON Project.
A. Lowery is with Virtual Photonics Inc., Carlton 3053, Australia.O. Lenzmann, I. Koltchanov, R. Moosburger, R. Freund, A. Richter, S.
Georgi, and D. Breuer are with Virtual Photonics Inc., D10587 Berlin,Germany.
H. Hamster is with Virtual Photonics Inc., San Bruno, CA 94066 USA.Publisher Item Identifier S 1077-260X(00)03856-9.
continue an exponential growth in fiber capacity,denserWDMsystems will be required as the fiber bandwidth is used up,which will have to operate with channel spacings reduced to afew times the channel bit rate [4]. These systems will requiresophisticated modulation techniques, such as phase/ampli-tude/polarization modulation, perhaps including duobinary [5]or single-side band modulation [6]. Furthermore, the design ofoptical filters for wavelength multiplexers will have to becomemore sophisticated, because the filters will have to have flatpassbands, good rejection, and low differential group delays(low dispersion). This design becomes problematic as thechannel bandwidths become a significant fraction of channelspacing.
A push to all-photonic networks, or at least networks withphotonic switching, will require careful consideration of opticalcrosstalk and multipath interference [7]. Low levels of crosstalkcan have a significant effect because of the coherent mixing ofoptical fields. Even if the fields are from different transmitters,or carrying different data, or even from the same transmitter butover a ghost path longer by more than the coherence length ofthe laser, coherent mixing will cause large penalties. Thus, allpaths should be considered in a photonic network, and this re-quires significant computation if all possible phase combina-tions are considered in networks with complex switch topolo-gies [8].
All-photonic networks will require optical amplification tocompensate for losses in switches and multiplexers on top offiber losses. Cascades of amplifiers could cause power transientsand strong interaction between WDM channels as the channelsare switched on and off [9]. Transients are caused by the mil-lisecond dynamics of the amplifiers, but they have nanosecondfeatures, which is a difficult modeling problem because of therange of time scales. In the steady-state condition, the gain spec-trum of amplifiers should be flattened to avoid large differencesin signal-to-noise ratio (SNR) between channels [10].
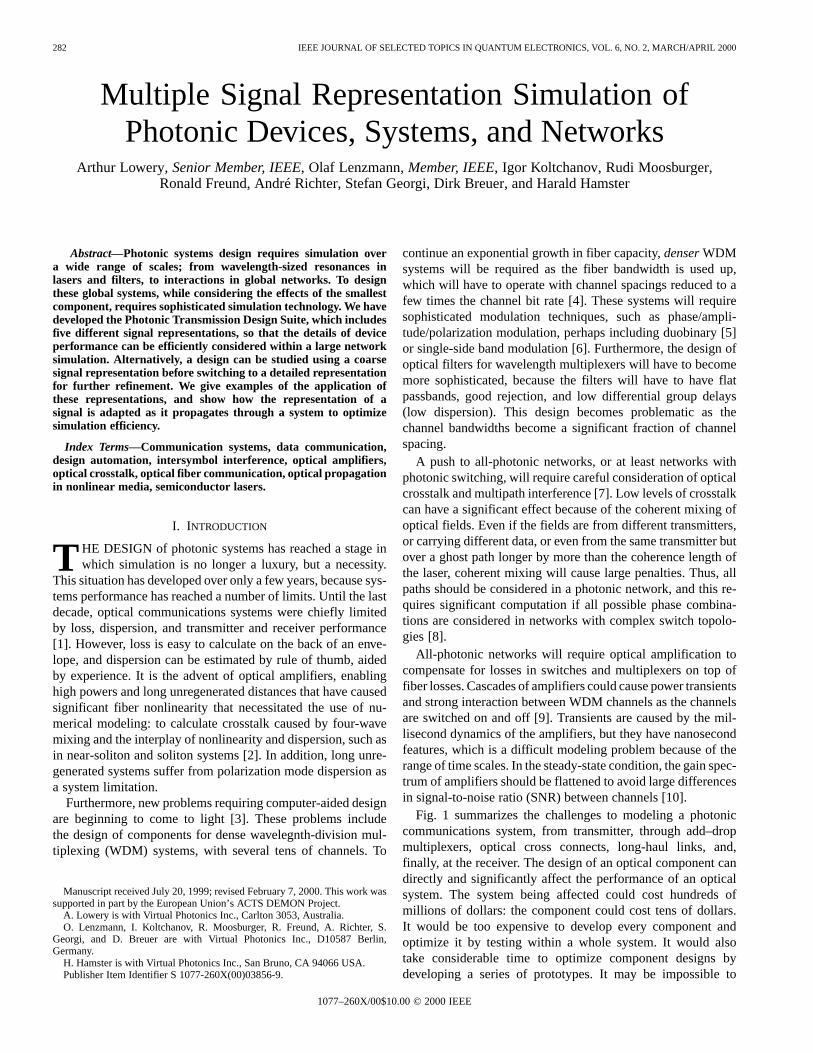
Fig. 1 summarizes the challenges to modeling a photoniccommunications system, from transmitter, through add–dropmultiplexers, optical cross connects, long-haul links, and,finally, at the receiver. The design of an optical component candirectly and significantly affect the performance of an opticalsystem. The system being affected could cost hundreds ofmillions of dollars: the component could cost tens of dollars.It would be too expensive to develop every component andoptimize it by testing within a whole system. It would alsotake considerable time to optimize component designs bydeveloping a series of prototypes. It may be impossible to
1077–260X/00$10.00 © 2000 IEEE
LOWERY et al.: MULTIPLE SIGNAL REPRESENTATION SIMULATION OF PHOTONIC SYSTEMS 283
Fig. 1. Example of the modeling challenges within a photonic communications network.
compare component technologies not yet in mass productionin large systems. However, the telecommunications industry isdemanding rapid improvements and lower costs.
Because of the pressures of increased performance, increas-ingly sophisticated systems, and reduced design cycles, new de-sign methods must be found [11]. One possibility would be totightly specify the performance of each component to ensurethe successful operation of the system as a whole. However, thisprocess would lead to overly conservative design, which is notsustainable in a highly competitive industry. An attractive al-ternative is to employ computer-aided design and optimizationto photonic systems and to replace the hardware prototype withsoftware simulations. This replacement brings with it severaladvantages, not forgetting the ease of communicating and doc-umenting software simulations.
This paper discusses the design philosophy that led to the de-velopment of a sophisticated photonic design automation (PDA)product [12], which is based on many tens of years of originalresearch. The importance of having a wide range of signal rep-resentations is discussed in Section II. The provision of a rangeof models from abstract to physical is discussed in Section III.Examples of systems and network simulation are given in Sec-tion IV.
II. SIGNAL REPRESENTATIONS FORINTERCONNECTINGMODELS
Photonic simulation is not new: over the years, many re-searchers, scientists, and engineers have developed numericaland semi-analytical models to solve particular problems.Groups of engineers have also worked on simulators for sys-tems, for large design projects, such as transoceanic systems.What is new, however, is the recent emergence of commercialsoftware for photonic simulation: first-generation commercialsoftware focused on specific design problems, such as inte-grated optics and wave propagation. Second-generation toolsallowed systems or components to be simulated using a singlesignal representation or simulation paradigm [13]. Third-gen-eration tools provide flexible platforms for modeling at many
scales of abstraction, from component to large network, eachwith the optimum simulation regime.
Third-generation tools require a mixture of signal represen-tations, because it is often necessary to consider a componentin a system in great detail, while treating the system or networkmore abstractly. Furthermore, in frequency space, it may be nec-essary to treat some WDM channels in great detail while onlyconsidering theeffectof other channels on the channels underconsideration. A further example, it is the separate treatment ofsignals and noise: the signal channels may occupy far less band-width than the noise from, say, an erbium-doped fiber amplifier(EDFA), but the noise can saturate other amplifiers or produceelectrical noise on detection.
The key to developing a third-generation simulator, opposedto a solitary model, is to provide a flexible data interface repre-sentation between the modules [14]. Each module can representa component or subsystem, but the key to a powerful and fu-ture-proof simulator is the ability for many modules to interact,providing novel solutions, or highlighting potential pitfalls in adesign.
With this in mind, we have developed a flexible basis fortreating signals and noise for our simulator photonic transmis-sion design suite (PTDS). PTDS is based on the Ptolemy simu-lation engine [15], with a proprietary graphical user interfaceand proprietary signal representations. Furthermore, we havedeveloped an extensive library of optical and electronic mod-ules, covering many levels of abstraction. Ptolemy gives sophis-ticated control of the sequencing of modules during a simulationand provides a large library of communications and signal pro-cessing models. Itstcl scripting language [16] allows parame-ters to be specified as functions of higher level parameters or asrandom variables, which gives several powerful features as fol-lows.
• Parameters can be made functions of global variables,such as a global filter bandwidth.
• Parameters can include any form of temperature sensi-tivity.
284 IEEE JOURNAL OF SELECTED TOPICS IN QUANTUM ELECTRONICS, VOL. 6, NO. 2, MARCH/APRIL 2000
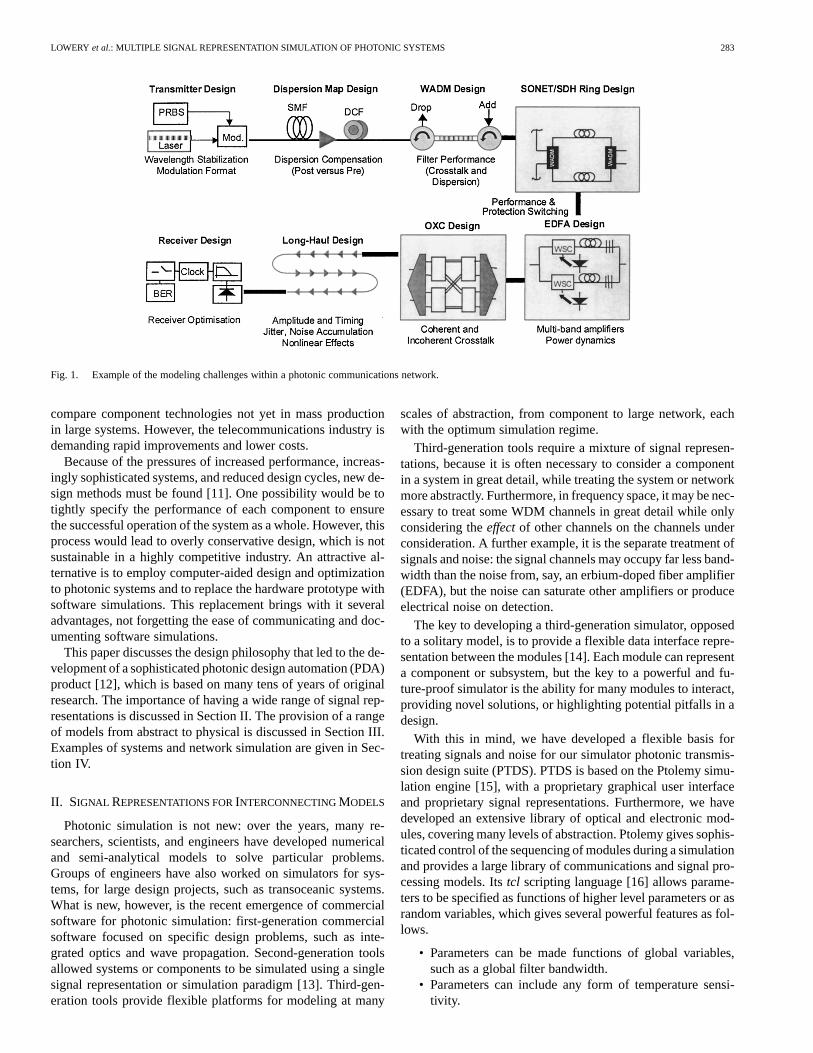
Fig. 2. Block and sample modes of simulation, showing unidirectional and bidirectional propagation and the firing sequence of modules.
• Parameters can be swept (using any functional form, froma central control) to analyze sensitivities.
• Parameters can be optimized automatically using itera-tion.
Two modesof simulation exist in PTDS: sample modeand block mode. Sample mode is for bidirectional simu-lation of closely coupled components, similar to that usedin Optoelectronic, Photonic and Advanced Laser Simulator(OPALS) [11], but with a complex envelope signal represen-tation for phase accuracy over the whole optical bandwidth.Block Mode passes data as arrays (blocks) of the complexenvelope of the optical field, restricting bidirectionality tocomponents spaced by more than a block length, such asoptical switches separated by fibers, or to within a modules,such as in filters. The iteration schemes for block mode andsample mode are shown in Fig. 2. In block mode, the simu-lation progresses module by module. Usually, the module isrun only once, with one block propagating from transmitterto receiver. However, multiple iteration can be performed,particularly if the system undergoes state changes, such asoptical switching. The data within the blocks can be con-sidered to be periodic or aperiodic. In the aperiodic case,the models remember their state from run to run, and linearconvolution is performed in all filters. In periodic mode, thedata within each block is considered to be independent, andcircular convolution is used in the models.
In sample mode, modules communicate bidirectionallyduring iteration to simulate complex interactions and reso-nances between the components. Thus, every module must befired to provide up-to-date information to its neighbors. Samplemode allows complex devices to be constructed from primitivecomponents, such as mirrors, delays, gratings, and active re-gion. It has been applied to many modeling problems, includinghigh-speed, single-mode, Bragg-grating, stabilized and tunablelasers, picosecond pulse sources, clock regenerators, opticalfilter designs, and many more [17].
Sample mode has a single signal representation, covering allsimulated optical frequencies and commonly assuming a singlepolarization. Block mode has both sampled and statistical sig-nals, containing polarization information and center frequency,
allowing a simulation to be partitioned spectrally into appro-priate signal representations as follows.
• Sampled optical field signals, which contain full infor-mation from which optical and detected waveforms andspectra can be reconstructed. A single frequency band(SFB) can be used to cover all data channels (so that fullinteractions are calculated), or these can be represented in-dividually using multiple frequency bands (MFB’s), eachwith a center frequency and each covering one or morechannels. MFB’s, thus, can save on memory and compu-tation when large unused gaps are in the spectrum.
• Statistical signals carrying average and deviations overthe time-window of the block. Noise Bins (NB’s) repre-sent broad noise spectra efficiently as a mean power spec-tral density within a defined frequency range. NB’s areeffective for the amplified spontaneous emission (ASE)in an optical amplifier. Parameterized signals representcontinuous wave (CW) signals or defined pulse shapeswith mean power and jitter characteristics. They are usefulfor signal-to-noise calculations and to represent pumps orsaturating signals in amplified systems. Noise generatedwithin the spectral range of SFB or MFB signals can ei-ther be added to these signals or propagated separately asNB’s.
In addition, PTDS passes logical information along a system,which can be used to identify the transmitter in a switchedsystem, the modulation sequence, center frequency, and pulseshape (if applicable). Logical information is used in someforms of bit error rate (BER) estimation to compare transmittedand received sequences. BER’s are estimated as follows:
• fitting distribution functions to received bit sequences, in-cluding noise, after they have been grouped into pattern se-quences to isolate deterministic intersymbol interferencefrom the stochastic noise [18];
• propagating noise and signal separately (using SFB/MFBand NB’s) so that the noise statistics are presented de-terministically to the receiver model [19]. This processneglects the interaction of noise and signal in nonlinearfibers, but it is deterministic.
LOWERY et al.: MULTIPLE SIGNAL REPRESENTATION SIMULATION OF PHOTONIC SYSTEMS 285
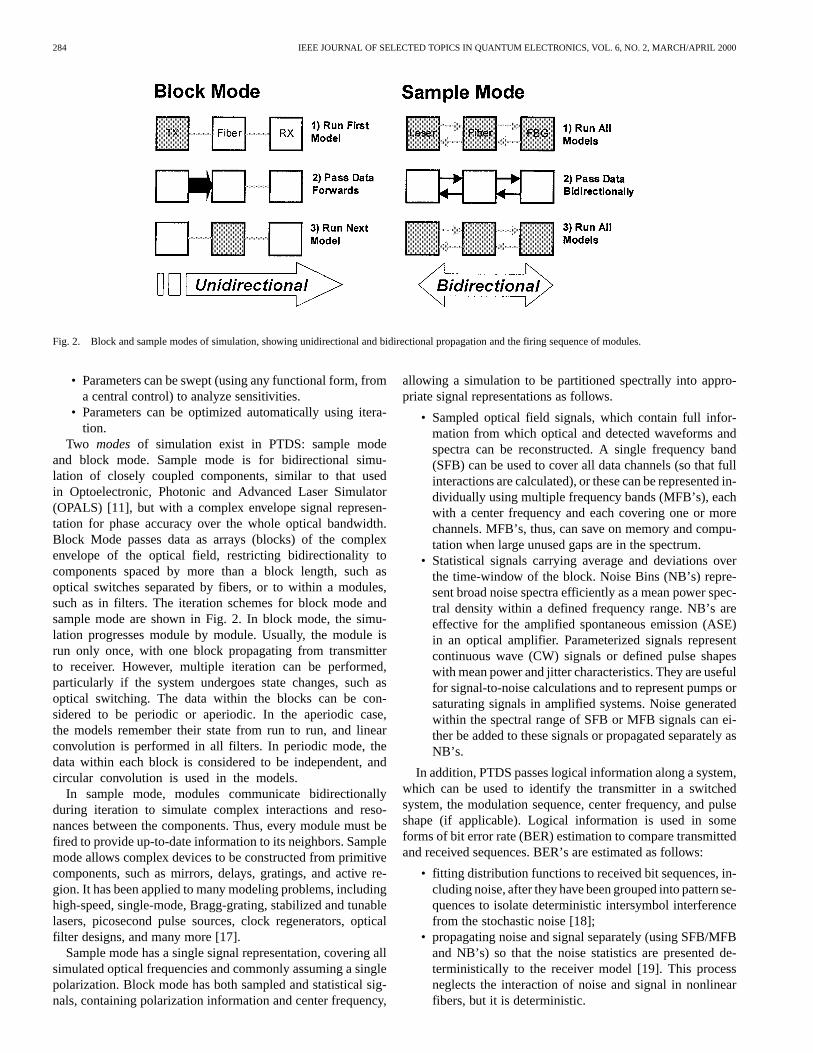
Fig. 3. Tree of simulation modes (sample, block) and signal representations. Inblock mode, the spectrum can be covered by four different signal representationsfor efficiency.
A. Conversion Between Signal Representations
Fig. 3 showed how the simulated spectrum can be divided intodifferent block-mode signal representations according to opticalfrequency. A simulation can also be divided into different signalrepresentations along its length, which implies conversion be-tween representations along the signal path. This conversioncan be done automatically or can be forced, using “nonphys-ical” modules. Furthermore, sampling rates can be changed, forexample:
• to increase the simulation bandwidth, to accommodatefour-wave mixing products during a nonlinear optical fibersimulation;
• to reduce data size when the optical or electrical band-widths are reduced by filtering.
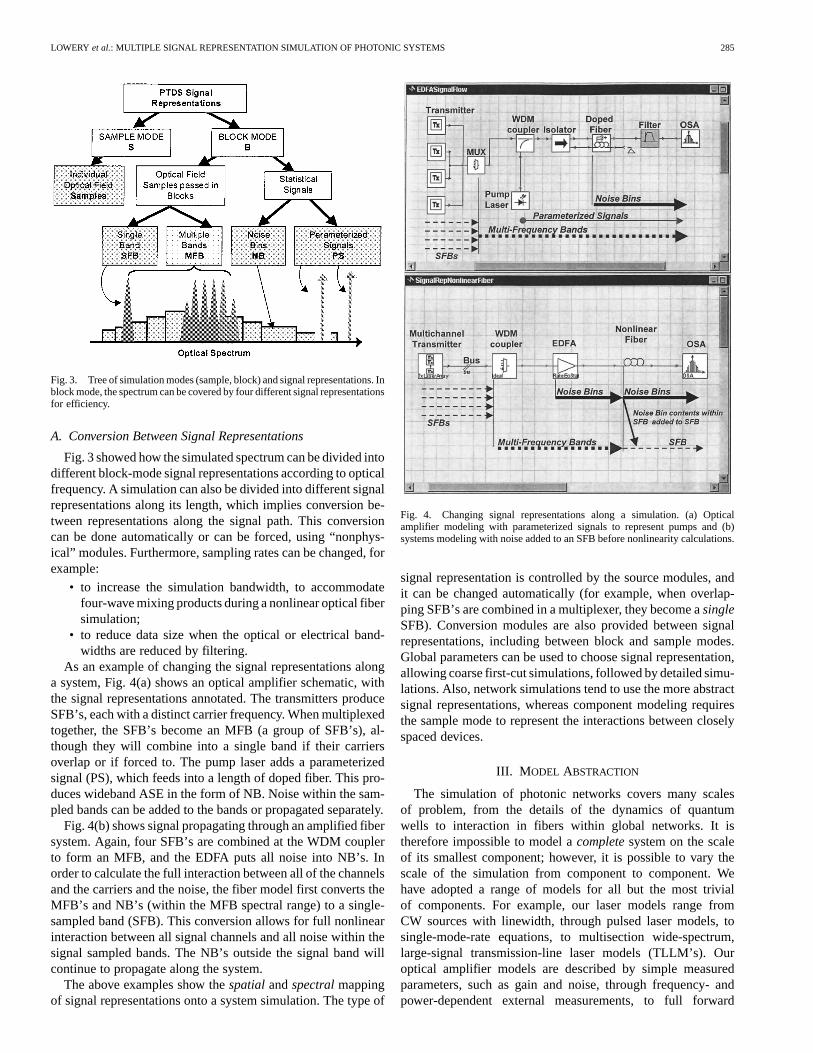
As an example of changing the signal representations alonga system, Fig. 4(a) shows an optical amplifier schematic, withthe signal representations annotated. The transmitters produceSFB’s, each with a distinct carrier frequency. When multiplexedtogether, the SFB’s become an MFB (a group of SFB’s), al-though they will combine into a single band if their carriersoverlap or if forced to. The pump laser adds a parameterizedsignal (PS), which feeds into a length of doped fiber. This pro-duces wideband ASE in the form of NB. Noise within the sam-pled bands can be added to the bands or propagated separately.
Fig. 4(b) shows signal propagating through an amplified fibersystem. Again, four SFB’s are combined at the WDM couplerto form an MFB, and the EDFA puts all noise into NB’s. Inorder to calculate the full interaction between all of the channelsand the carriers and the noise, the fiber model first converts theMFB’s and NB’s (within the MFB spectral range) to a single-sampled band (SFB). This conversion allows for full nonlinearinteraction between all signal channels and all noise within thesignal sampled bands. The NB’s outside the signal band willcontinue to propagate along the system.
The above examples show thespatialandspectralmappingof signal representations onto a system simulation. The type of
Fig. 4. Changing signal representations along a simulation. (a) Opticalamplifier modeling with parameterized signals to represent pumps and (b)systems modeling with noise added to an SFB before nonlinearity calculations.
signal representation is controlled by the source modules, andit can be changed automatically (for example, when overlap-ping SFB’s are combined in a multiplexer, they become asingleSFB). Conversion modules are also provided between signalrepresentations, including between block and sample modes.Global parameters can be used to choose signal representation,allowing coarse first-cut simulations, followed by detailed simu-lations. Also, network simulations tend to use the more abstractsignal representations, whereas component modeling requiresthe sample mode to represent the interactions between closelyspaced devices.
III. M ODEL ABSTRACTION
The simulation of photonic networks covers many scalesof problem, from the details of the dynamics of quantumwells to interaction in fibers within global networks. It istherefore impossible to model acompletesystem on the scaleof its smallest component; however, it is possible to vary thescale of the simulation from component to component. Wehave adopted a range of models for all but the most trivialof components. For example, our laser models range fromCW sources with linewidth, through pulsed laser models, tosingle-mode-rate equations, to multisection wide-spectrum,large-signal transmission-line laser models (TLLM’s). Ouroptical amplifier models are described by simple measuredparameters, such as gain and noise, through frequency- andpower-dependent external measurements, to full forward
286 IEEE JOURNAL OF SELECTED TOPICS IN QUANTUM ELECTRONICS, VOL. 6, NO. 2, MARCH/APRIL 2000
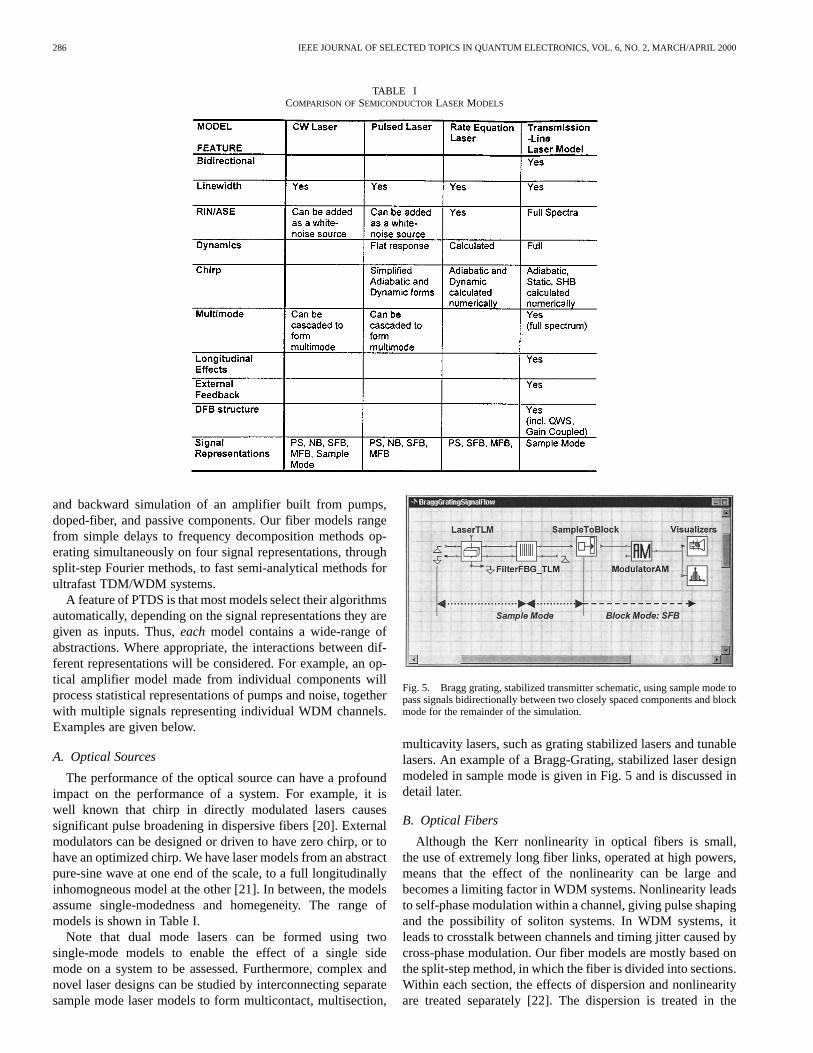
TABLE ICOMPARISON OFSEMICONDUCTORLASER MODELS
and backward simulation of an amplifier built from pumps,doped-fiber, and passive components. Our fiber models rangefrom simple delays to frequency decomposition methods op-erating simultaneously on four signal representations, throughsplit-step Fourier methods, to fast semi-analytical methods forultrafast TDM/WDM systems.
A feature of PTDS is that most models select their algorithmsautomatically, depending on the signal representations they aregiven as inputs. Thus,eachmodel contains a wide-range ofabstractions. Where appropriate, the interactions between dif-ferent representations will be considered. For example, an op-tical amplifier model made from individual components willprocess statistical representations of pumps and noise, togetherwith multiple signals representing individual WDM channels.Examples are given below.
A. Optical Sources
The performance of the optical source can have a profoundimpact on the performance of a system. For example, it iswell known that chirp in directly modulated lasers causessignificant pulse broadening in dispersive fibers [20]. Externalmodulators can be designed or driven to have zero chirp, or tohave an optimized chirp. We have laser models from an abstractpure-sine wave at one end of the scale, to a full longitudinallyinhomogneous model at the other [21]. In between, the modelsassume single-modedness and homegeneity. The range ofmodels is shown in Table I.
Note that dual mode lasers can be formed using twosingle-mode models to enable the effect of a single sidemode on a system to be assessed. Furthermore, complex andnovel laser designs can be studied by interconnecting separatesample mode laser models to form multicontact, multisection,
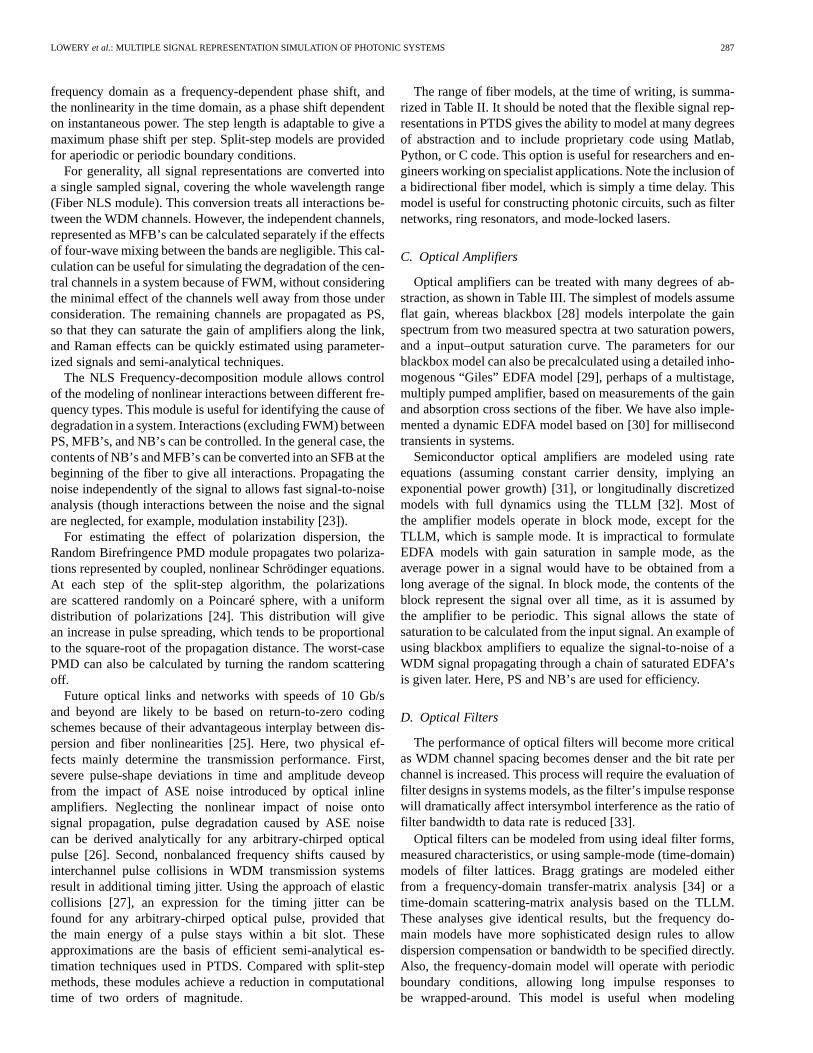
Fig. 5. Bragg grating, stabilized transmitter schematic, using sample mode topass signals bidirectionally between two closely spaced components and blockmode for the remainder of the simulation.
multicavity lasers, such as grating stabilized lasers and tunablelasers. An example of a Bragg-Grating, stabilized laser designmodeled in sample mode is given in Fig. 5 and is discussed indetail later.
B. Optical Fibers
Although the Kerr nonlinearity in optical fibers is small,the use of extremely long fiber links, operated at high powers,means that the effect of the nonlinearity can be large andbecomes a limiting factor in WDM systems. Nonlinearity leadsto self-phase modulation within a channel, giving pulse shapingand the possibility of soliton systems. In WDM systems, itleads to crosstalk between channels and timing jitter caused bycross-phase modulation. Our fiber models are mostly based onthe split-step method, in which the fiber is divided into sections.Within each section, the effects of dispersion and nonlinearityare treated separately [22]. The dispersion is treated in the
LOWERY et al.: MULTIPLE SIGNAL REPRESENTATION SIMULATION OF PHOTONIC SYSTEMS 287
frequency domain as a frequency-dependent phase shift, andthe nonlinearity in the time domain, as a phase shift dependenton instantaneous power. The step length is adaptable to give amaximum phase shift per step. Split-step models are providedfor aperiodic or periodic boundary conditions.
For generality, all signal representations are converted intoa single sampled signal, covering the whole wavelength range(Fiber NLS module). This conversion treats all interactions be-tween the WDM channels. However, the independent channels,represented as MFB’s can be calculated separately if the effectsof four-wave mixing between the bands are negligible. This cal-culation can be useful for simulating the degradation of the cen-tral channels in a system because of FWM, without consideringthe minimal effect of the channels well away from those underconsideration. The remaining channels are propagated as PS,so that they can saturate the gain of amplifiers along the link,and Raman effects can be quickly estimated using parameter-ized signals and semi-analytical techniques.
The NLS Frequency-decomposition module allows controlof the modeling of nonlinear interactions between different fre-quency types. This module is useful for identifying the cause ofdegradation in a system. Interactions (excluding FWM) betweenPS, MFB’s, and NB’s can be controlled. In the general case, thecontents of NB’s and MFB’s can be converted into an SFB at thebeginning of the fiber to give all interactions. Propagating thenoise independently of the signal to allows fast signal-to-noiseanalysis (though interactions between the noise and the signalare neglected, for example, modulation instability [23]).
For estimating the effect of polarization dispersion, theRandom Birefringence PMD module propagates two polariza-tions represented by coupled, nonlinear Schrödinger equations.At each step of the split-step algorithm, the polarizationsare scattered randomly on a Poincaré sphere, with a uniformdistribution of polarizations [24]. This distribution will givean increase in pulse spreading, which tends to be proportionalto the square-root of the propagation distance. The worst-casePMD can also be calculated by turning the random scatteringoff.
Future optical links and networks with speeds of 10 Gb/sand beyond are likely to be based on return-to-zero codingschemes because of their advantageous interplay between dis-persion and fiber nonlinearities [25]. Here, two physical ef-fects mainly determine the transmission performance. First,severe pulse-shape deviations in time and amplitude deveopfrom the impact of ASE noise introduced by optical inlineamplifiers. Neglecting the nonlinear impact of noise ontosignal propagation, pulse degradation caused by ASE noisecan be derived analytically for any arbitrary-chirped opticalpulse [26]. Second, nonbalanced frequency shifts caused byinterchannel pulse collisions in WDM transmission systemsresult in additional timing jitter. Using the approach of elasticcollisions [27], an expression for the timing jitter can befound for any arbitrary-chirped optical pulse, provided thatthe main energy of a pulse stays within a bit slot. Theseapproximations are the basis of efficient semi-analytical es-timation techniques used in PTDS. Compared with split-stepmethods, these modules achieve a reduction in computationaltime of two orders of magnitude.
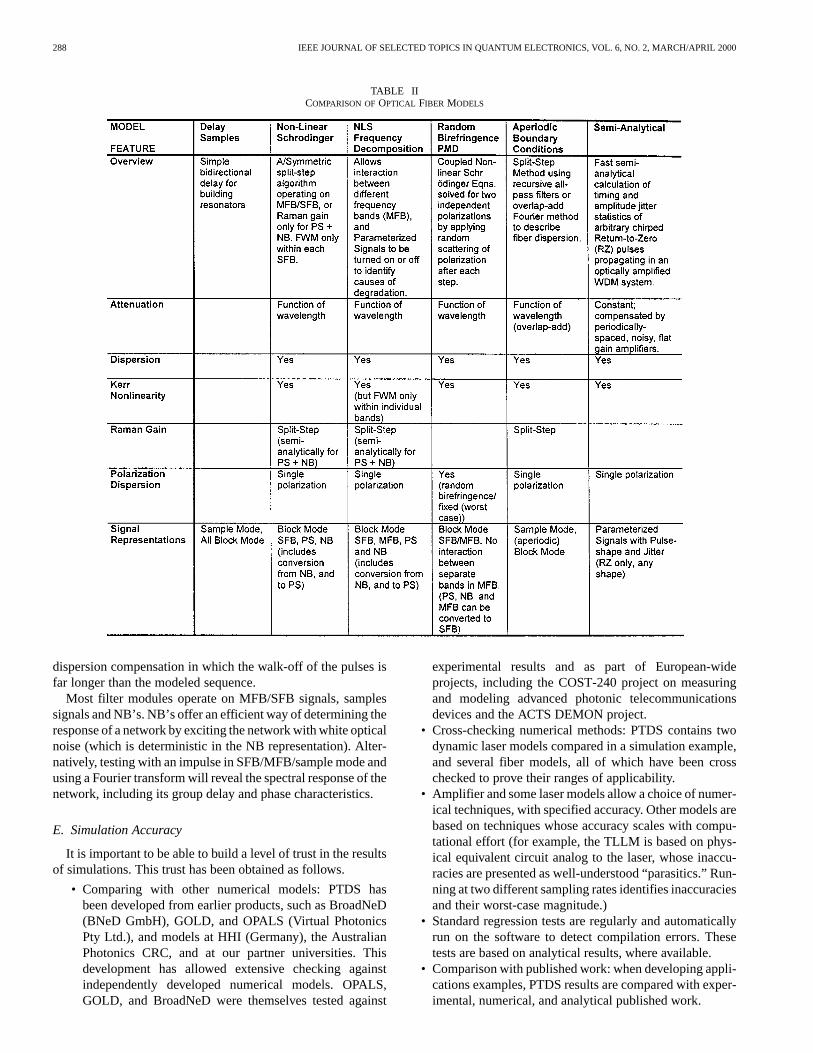
The range of fiber models, at the time of writing, is summa-rized in Table II. It should be noted that the flexible signal rep-resentations in PTDS gives the ability to model at many degreesof abstraction and to include proprietary code using Matlab,Python, or C code. This option is useful for researchers and en-gineers working on specialist applications. Note the inclusion ofa bidirectional fiber model, which is simply a time delay. Thismodel is useful for constructing photonic circuits, such as filternetworks, ring resonators, and mode-locked lasers.
C. Optical Amplifiers
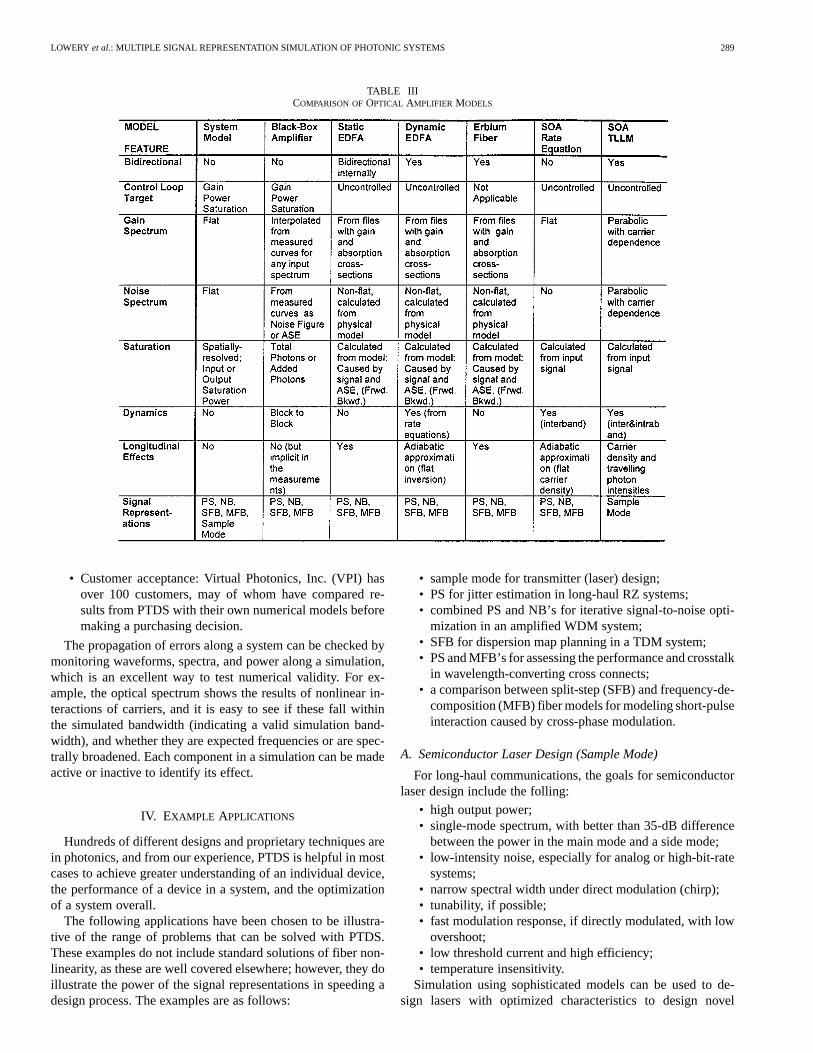
Optical amplifiers can be treated with many degrees of ab-straction, as shown in Table III. The simplest of models assumeflat gain, whereas blackbox [28] models interpolate the gainspectrum from two measured spectra at two saturation powers,and a input–output saturation curve. The parameters for ourblackbox model can also be precalculated using a detailed inho-mogenous “Giles” EDFA model [29], perhaps of a multistage,multiply pumped amplifier, based on measurements of the gainand absorption cross sections of the fiber. We have also imple-mented a dynamic EDFA model based on [30] for millisecondtransients in systems.
Semiconductor optical amplifiers are modeled using rateequations (assuming constant carrier density, implying anexponential power growth) [31], or longitudinally discretizedmodels with full dynamics using the TLLM [32]. Most ofthe amplifier models operate in block mode, except for theTLLM, which is sample mode. It is impractical to formulateEDFA models with gain saturation in sample mode, as theaverage power in a signal would have to be obtained from along average of the signal. In block mode, the contents of theblock represent the signal over all time, as it is assumed bythe amplifier to be periodic. This signal allows the state ofsaturation to be calculated from the input signal. An example ofusing blackbox amplifiers to equalize the signal-to-noise of aWDM signal propagating through a chain of saturated EDFA’sis given later. Here, PS and NB’s are used for efficiency.
D. Optical Filters
The performance of optical filters will become more criticalas WDM channel spacing becomes denser and the bit rate perchannel is increased. This process will require the evaluation offilter designs in systems models, as the filter’s impulse responsewill dramatically affect intersymbol interference as the ratio offilter bandwidth to data rate is reduced [33].
Optical filters can be modeled from using ideal filter forms,measured characteristics, or using sample-mode (time-domain)models of filter lattices. Bragg gratings are modeled eitherfrom a frequency-domain transfer-matrix analysis [34] or atime-domain scattering-matrix analysis based on the TLLM.These analyses give identical results, but the frequency do-main models have more sophisticated design rules to allowdispersion compensation or bandwidth to be specified directly.Also, the frequency-domain model will operate with periodicboundary conditions, allowing long impulse responses tobe wrapped-around. This model is useful when modeling
288 IEEE JOURNAL OF SELECTED TOPICS IN QUANTUM ELECTRONICS, VOL. 6, NO. 2, MARCH/APRIL 2000
TABLE IICOMPARISON OFOPTICAL FIBER MODELS
dispersion compensation in which the walk-off of the pulses isfar longer than the modeled sequence.
Most filter modules operate on MFB/SFB signals, samplessignals and NB’s. NB’s offer an efficient way of determining theresponse of a network by exciting the network with white opticalnoise (which is deterministic in the NB representation). Alter-natively, testing with an impulse in SFB/MFB/sample mode andusing a Fourier transform will reveal the spectral response of thenetwork, including its group delay and phase characteristics.
E. Simulation Accuracy
It is important to be able to build a level of trust in the resultsof simulations. This trust has been obtained as follows.
• Comparing with other numerical models: PTDS hasbeen developed from earlier products, such as BroadNeD(BNeD GmbH), GOLD, and OPALS (Virtual PhotonicsPty Ltd.), and models at HHI (Germany), the AustralianPhotonics CRC, and at our partner universities. Thisdevelopment has allowed extensive checking againstindependently developed numerical models. OPALS,GOLD, and BroadNeD were themselves tested against
experimental results and as part of European-wideprojects, including the COST-240 project on measuringand modeling advanced photonic telecommunicationsdevices and the ACTS DEMON project.
• Cross-checking numerical methods: PTDS contains twodynamic laser models compared in a simulation example,and several fiber models, all of which have been crosschecked to prove their ranges of applicability.
• Amplifier and some laser models allow a choice of numer-ical techniques, with specified accuracy. Other models arebased on techniques whose accuracy scales with compu-tational effort (for example, the TLLM is based on phys-ical equivalent circuit analog to the laser, whose inaccu-racies are presented as well-understood “parasitics.” Run-ning at two different sampling rates identifies inaccuraciesand their worst-case magnitude.)
• Standard regression tests are regularly and automaticallyrun on the software to detect compilation errors. Thesetests are based on analytical results, where available.
• Comparison with published work: when developing appli-cations examples, PTDS results are compared with exper-imental, numerical, and analytical published work.
LOWERY et al.: MULTIPLE SIGNAL REPRESENTATION SIMULATION OF PHOTONIC SYSTEMS 289
TABLE IIICOMPARISON OFOPTICAL AMPLIFIER MODELS
• Customer acceptance: Virtual Photonics, Inc. (VPI) hasover 100 customers, may of whom have compared re-sults from PTDS with their own numerical models beforemaking a purchasing decision.
The propagation of errors along a system can be checked bymonitoring waveforms, spectra, and power along a simulation,which is an excellent way to test numerical validity. For ex-ample, the optical spectrum shows the results of nonlinear in-teractions of carriers, and it is easy to see if these fall withinthe simulated bandwidth (indicating a valid simulation band-width), and whether they are expected frequencies or are spec-trally broadened. Each component in a simulation can be madeactive or inactive to identify its effect.
IV. EXAMPLE APPLICATIONS
Hundreds of different designs and proprietary techniques arein photonics, and from our experience, PTDS is helpful in mostcases to achieve greater understanding of an individual device,the performance of a device in a system, and the optimizationof a system overall.
The following applications have been chosen to be illustra-tive of the range of problems that can be solved with PTDS.These examples do not include standard solutions of fiber non-linearity, as these are well covered elsewhere; however, they doillustrate the power of the signal representations in speeding adesign process. The examples are as follows:
• sample mode for transmitter (laser) design;• PS for jitter estimation in long-haul RZ systems;• combined PS and NB’s for iterative signal-to-noise opti-
mization in an amplified WDM system;• SFB for dispersion map planning in a TDM system;• PS and MFB’s for assessing the performance and crosstalk
in wavelength-converting cross connects;• a comparison between split-step (SFB) and frequency-de-
composition (MFB) fiber models for modeling short-pulseinteraction caused by cross-phase modulation.
A. Semiconductor Laser Design (Sample Mode)
For long-haul communications, the goals for semiconductorlaser design include the folling:
• high output power;• single-mode spectrum, with better than 35-dB difference
between the power in the main mode and a side mode;• low-intensity noise, especially for analog or high-bit-rate
systems;• narrow spectral width under direct modulation (chirp);• tunability, if possible;• fast modulation response, if directly modulated, with low
overshoot;• low threshold current and high efficiency;• temperature insensitivity.
Simulation using sophisticated models can be used to de-sign lasers with optimized characteristics to design novel
290 IEEE JOURNAL OF SELECTED TOPICS IN QUANTUM ELECTRONICS, VOL. 6, NO. 2, MARCH/APRIL 2000
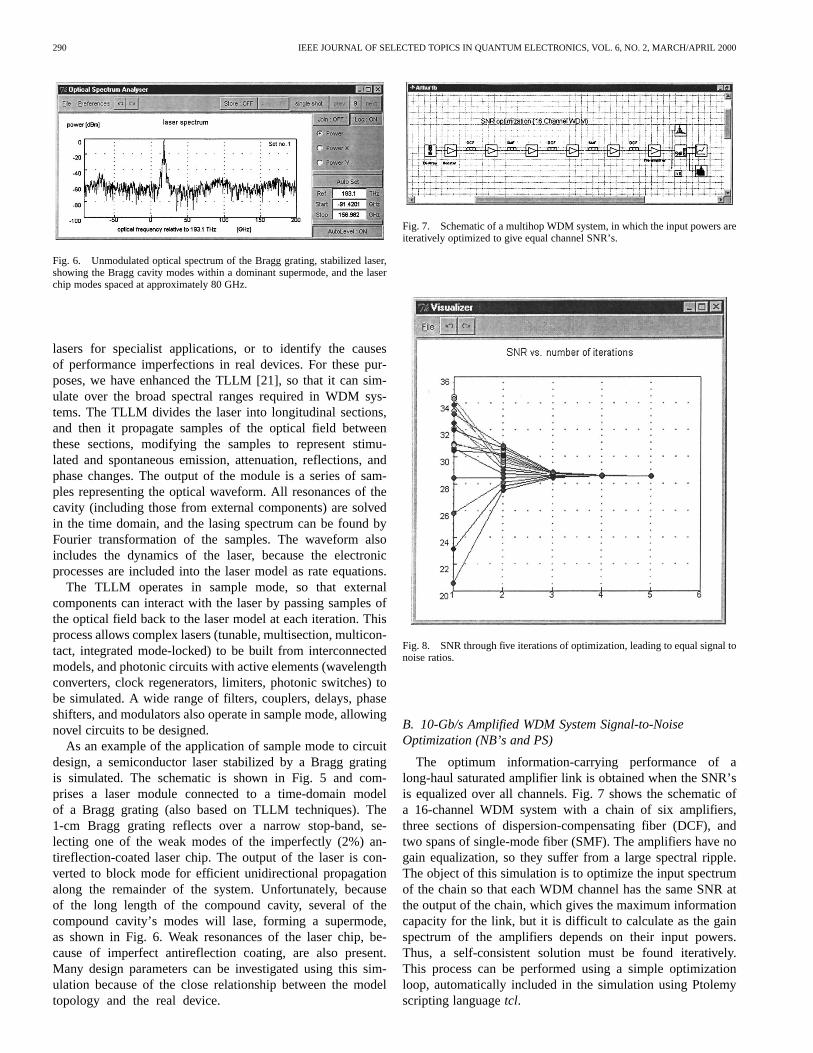
Fig. 6. Unmodulated optical spectrum of the Bragg grating, stabilized laser,showing the Bragg cavity modes within a dominant supermode, and the laserchip modes spaced at approximately 80 GHz.
lasers for specialist applications, or to identify the causesof performance imperfections in real devices. For these pur-poses, we have enhanced the TLLM [21], so that it can sim-ulate over the broad spectral ranges required in WDM sys-tems. The TLLM divides the laser into longitudinal sections,and then it propagate samples of the optical field betweenthese sections, modifying the samples to represent stimu-lated and spontaneous emission, attenuation, reflections, andphase changes. The output of the module is a series of sam-ples representing the optical waveform. All resonances of thecavity (including those from external components) are solvedin the time domain, and the lasing spectrum can be found byFourier transformation of the samples. The waveform alsoincludes the dynamics of the laser, because the electronicprocesses are included into the laser model as rate equations.
The TLLM operates in sample mode, so that externalcomponents can interact with the laser by passing samples ofthe optical field back to the laser model at each iteration. Thisprocess allows complex lasers (tunable, multisection, multicon-tact, integrated mode-locked) to be built from interconnectedmodels, and photonic circuits with active elements (wavelengthconverters, clock regenerators, limiters, photonic switches) tobe simulated. A wide range of filters, couplers, delays, phaseshifters, and modulators also operate in sample mode, allowingnovel circuits to be designed.
As an example of the application of sample mode to circuitdesign, a semiconductor laser stabilized by a Bragg gratingis simulated. The schematic is shown in Fig. 5 and com-prises a laser module connected to a time-domain modelof a Bragg grating (also based on TLLM techniques). The1-cm Bragg grating reflects over a narrow stop-band, se-lecting one of the weak modes of the imperfectly (2%) an-tireflection-coated laser chip. The output of the laser is con-verted to block mode for efficient unidirectional propagationalong the remainder of the system. Unfortunately, becauseof the long length of the compound cavity, several of thecompound cavity’s modes will lase, forming a supermode,as shown in Fig. 6. Weak resonances of the laser chip, be-cause of imperfect antireflection coating, are also present.Many design parameters can be investigated using this sim-ulation because of the close relationship between the modeltopology and the real device.
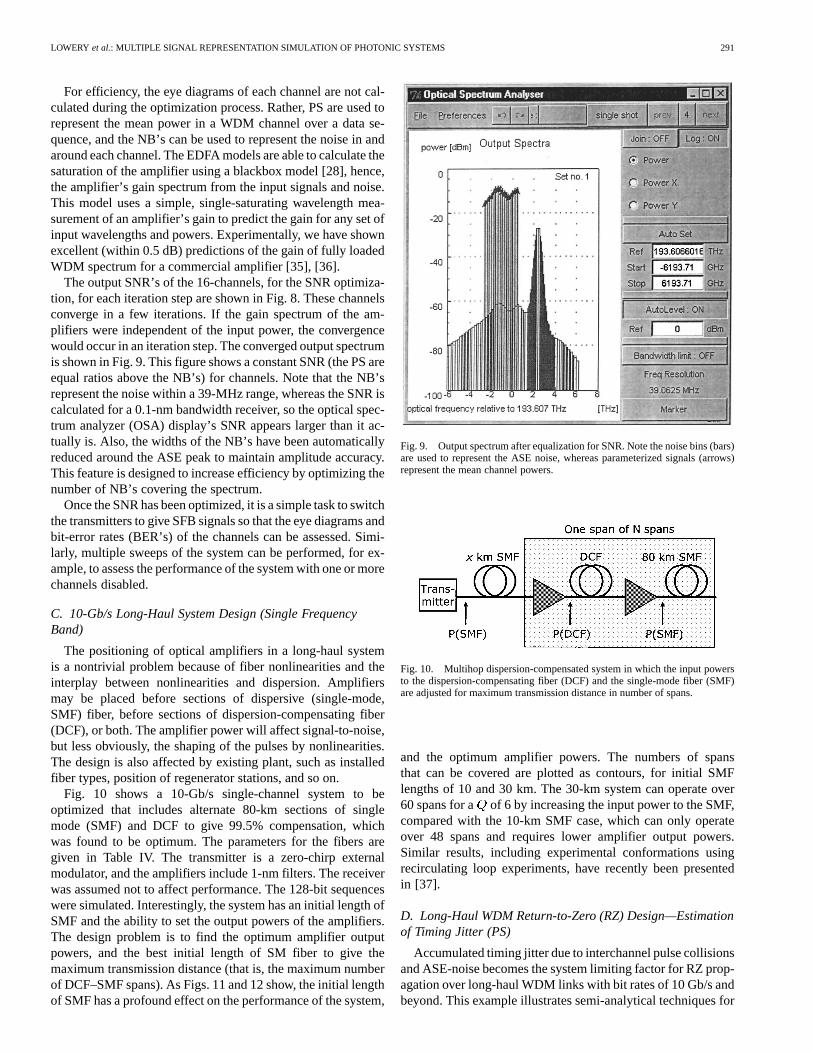
Fig. 7. Schematic of a multihop WDM system, in which the input powers areiteratively optimized to give equal channel SNR’s.
Fig. 8. SNR through five iterations of optimization, leading to equal signal tonoise ratios.
B. 10-Gb/s Amplified WDM System Signal-to-NoiseOptimization (NB’s and PS)
The optimum information-carrying performance of along-haul saturated amplifier link is obtained when the SNR’sis equalized over all channels. Fig. 7 shows the schematic ofa 16-channel WDM system with a chain of six amplifiers,three sections of dispersion-compensating fiber (DCF), andtwo spans of single-mode fiber (SMF). The amplifiers have nogain equalization, so they suffer from a large spectral ripple.The object of this simulation is to optimize the input spectrumof the chain so that each WDM channel has the same SNR atthe output of the chain, which gives the maximum informationcapacity for the link, but it is difficult to calculate as the gainspectrum of the amplifiers depends on their input powers.Thus, a self-consistent solution must be found iteratively.This process can be performed using a simple optimizationloop, automatically included in the simulation using Ptolemyscripting languagetcl.
LOWERY et al.: MULTIPLE SIGNAL REPRESENTATION SIMULATION OF PHOTONIC SYSTEMS 291
For efficiency, the eye diagrams of each channel are not cal-culated during the optimization process. Rather, PS are used torepresent the mean power in a WDM channel over a data se-quence, and the NB’s can be used to represent the noise in andaround each channel. The EDFA models are able to calculate thesaturation of the amplifier using a blackbox model [28], hence,the amplifier’s gain spectrum from the input signals and noise.This model uses a simple, single-saturating wavelength mea-surement of an amplifier’s gain to predict the gain for any set ofinput wavelengths and powers. Experimentally, we have shownexcellent (within 0.5 dB) predictions of the gain of fully loadedWDM spectrum for a commercial amplifier [35], [36].
The output SNR’s of the 16-channels, for the SNR optimiza-tion, for each iteration step are shown in Fig. 8. These channelsconverge in a few iterations. If the gain spectrum of the am-plifiers were independent of the input power, the convergencewould occur in an iteration step. The converged output spectrumis shown in Fig. 9. This figure shows a constant SNR (the PS areequal ratios above the NB’s) for channels. Note that the NB’srepresent the noise within a 39-MHz range, whereas the SNR iscalculated for a 0.1-nm bandwidth receiver, so the optical spec-trum analyzer (OSA) display’s SNR appears larger than it ac-tually is. Also, the widths of the NB’s have been automaticallyreduced around the ASE peak to maintain amplitude accuracy.This feature is designed to increase efficiency by optimizing thenumber of NB’s covering the spectrum.
Once the SNR has been optimized, it is a simple task to switchthe transmitters to give SFB signals so that the eye diagrams andbit-error rates (BER’s) of the channels can be assessed. Simi-larly, multiple sweeps of the system can be performed, for ex-ample, to assess the performance of the system with one or morechannels disabled.
C. 10-Gb/s Long-Haul System Design (Single FrequencyBand)
The positioning of optical amplifiers in a long-haul systemis a nontrivial problem because of fiber nonlinearities and theinterplay between nonlinearities and dispersion. Amplifiersmay be placed before sections of dispersive (single-mode,SMF) fiber, before sections of dispersion-compensating fiber(DCF), or both. The amplifier power will affect signal-to-noise,but less obviously, the shaping of the pulses by nonlinearities.The design is also affected by existing plant, such as installedfiber types, position of regenerator stations, and so on.
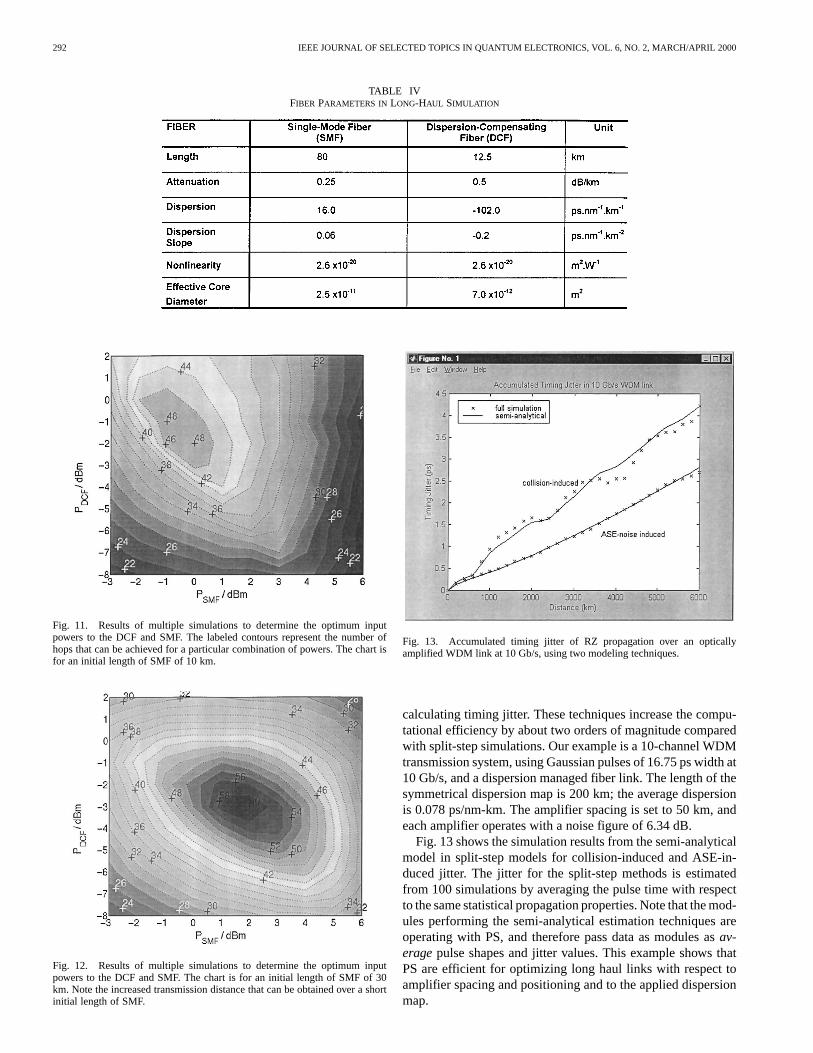
Fig. 10 shows a 10-Gb/s single-channel system to beoptimized that includes alternate 80-km sections of singlemode (SMF) and DCF to give 99.5% compensation, whichwas found to be optimum. The parameters for the fibers aregiven in Table IV. The transmitter is a zero-chirp externalmodulator, and the amplifiers include 1-nm filters. The receiverwas assumed not to affect performance. The 128-bit sequenceswere simulated. Interestingly, the system has an initial length ofSMF and the ability to set the output powers of the amplifiers.The design problem is to find the optimum amplifier outputpowers, and the best initial length of SM fiber to give themaximum transmission distance (that is, the maximum numberof DCF–SMF spans). As Figs. 11 and 12 show, the initial lengthof SMF has a profound effect on the performance of the system,
Fig. 9. Output spectrum after equalization for SNR. Note the noise bins (bars)are used to represent the ASE noise, whereas parameterized signals (arrows)represent the mean channel powers.
Fig. 10. Multihop dispersion-compensated system in which the input powersto the dispersion-compensating fiber (DCF) and the single-mode fiber (SMF)are adjusted for maximum transmission distance in number of spans.
and the optimum amplifier powers. The numbers of spansthat can be covered are plotted as contours, for initial SMFlengths of 10 and 30 km. The 30-km system can operate over60 spans for a of 6 by increasing the input power to the SMF,compared with the 10-km SMF case, which can only operateover 48 spans and requires lower amplifier output powers.Similar results, including experimental conformations usingrecirculating loop experiments, have recently been presentedin [37].
D. Long-Haul WDM Return-to-Zero (RZ) Design—Estimationof Timing Jitter (PS)
Accumulated timing jitter due to interchannel pulse collisionsand ASE-noise becomes the system limiting factor for RZ prop-agation over long-haul WDM links with bit rates of 10 Gb/s andbeyond. This example illustrates semi-analytical techniques for
292 IEEE JOURNAL OF SELECTED TOPICS IN QUANTUM ELECTRONICS, VOL. 6, NO. 2, MARCH/APRIL 2000
TABLE IVFIBER PARAMETERS IN LONG-HAUL SIMULATION
Fig. 11. Results of multiple simulations to determine the optimum inputpowers to the DCF and SMF. The labeled contours represent the number ofhops that can be achieved for a particular combination of powers. The chart isfor an initial length of SMF of 10 km.
Fig. 12. Results of multiple simulations to determine the optimum inputpowers to the DCF and SMF. The chart is for an initial length of SMF of 30km. Note the increased transmission distance that can be obtained over a shortinitial length of SMF.
Fig. 13. Accumulated timing jitter of RZ propagation over an opticallyamplified WDM link at 10 Gb/s, using two modeling techniques.
calculating timing jitter. These techniques increase the compu-tational efficiency by about two orders of magnitude comparedwith split-step simulations. Our example is a 10-channel WDMtransmission system, using Gaussian pulses of 16.75 ps width at10 Gb/s, and a dispersion managed fiber link. The length of thesymmetrical dispersion map is 200 km; the average dispersionis 0.078 ps/nm-km. The amplifier spacing is set to 50 km, andeach amplifier operates with a noise figure of 6.34 dB.
Fig. 13 shows the simulation results from the semi-analyticalmodel in split-step models for collision-induced and ASE-in-duced jitter. The jitter for the split-step methods is estimatedfrom 100 simulations by averaging the pulse time with respectto the same statistical propagation properties. Note that the mod-ules performing the semi-analytical estimation techniques areoperating with PS, and therefore pass data as modules asav-eragepulse shapes and jitter values. This example shows thatPS are efficient for optimizing long haul links with respect toamplifier spacing and positioning and to the applied dispersionmap.
LOWERY et al.: MULTIPLE SIGNAL REPRESENTATION SIMULATION OF PHOTONIC SYSTEMS 293
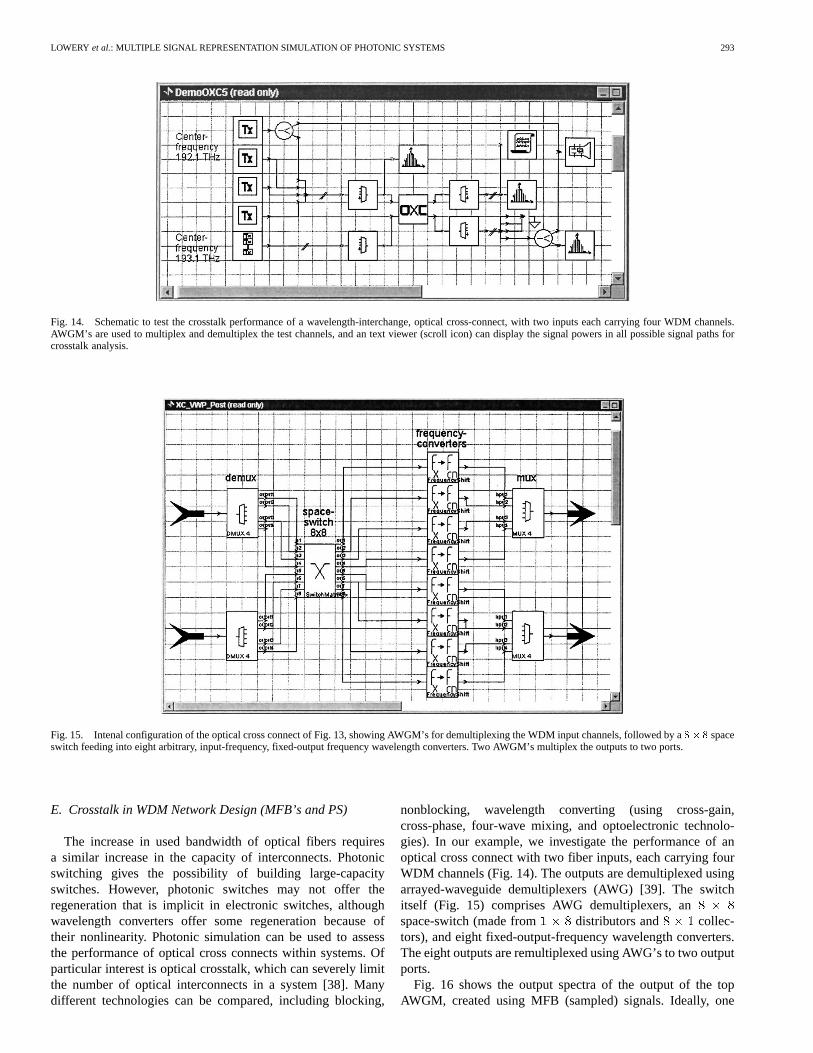
Fig. 14. Schematic to test the crosstalk performance of a wavelength-interchange, optical cross-connect, with two inputs each carrying four WDM channels.AWGM’s are used to multiplex and demultiplex the test channels, and an text viewer (scroll icon) can display the signal powers in all possible signal paths forcrosstalk analysis.
Fig. 15. Intenal configuration of the optical cross connect of Fig. 13, showing AWGM’s for demultiplexing the WDM input channels, followed by a8� 8 spaceswitch feeding into eight arbitrary, input-frequency, fixed-output frequency wavelength converters. Two AWGM’s multiplex the outputs to two ports.
E. Crosstalk in WDM Network Design (MFB’s and PS)
The increase in used bandwidth of optical fibers requiresa similar increase in the capacity of interconnects. Photonicswitching gives the possibility of building large-capacityswitches. However, photonic switches may not offer theregeneration that is implicit in electronic switches, althoughwavelength converters offer some regeneration because oftheir nonlinearity. Photonic simulation can be used to assessthe performance of optical cross connects within systems. Ofparticular interest is optical crosstalk, which can severely limitthe number of optical interconnects in a system [38]. Manydifferent technologies can be compared, including blocking,
nonblocking, wavelength converting (using cross-gain,cross-phase, four-wave mixing, and optoelectronic technolo-gies). In our example, we investigate the performance of anoptical cross connect with two fiber inputs, each carrying fourWDM channels (Fig. 14). The outputs are demultiplexed usingarrayed-waveguide demultiplexers (AWG) [39]. The switchitself (Fig. 15) comprises AWG demultiplexers, anspace-switch (made from distributors and collec-tors), and eight fixed-output-frequency wavelength converters.The eight outputs are remultiplexed using AWG’s to two outputports.
Fig. 16 shows the output spectra of the output of the topAWGM, created using MFB (sampled) signals. Ideally, one
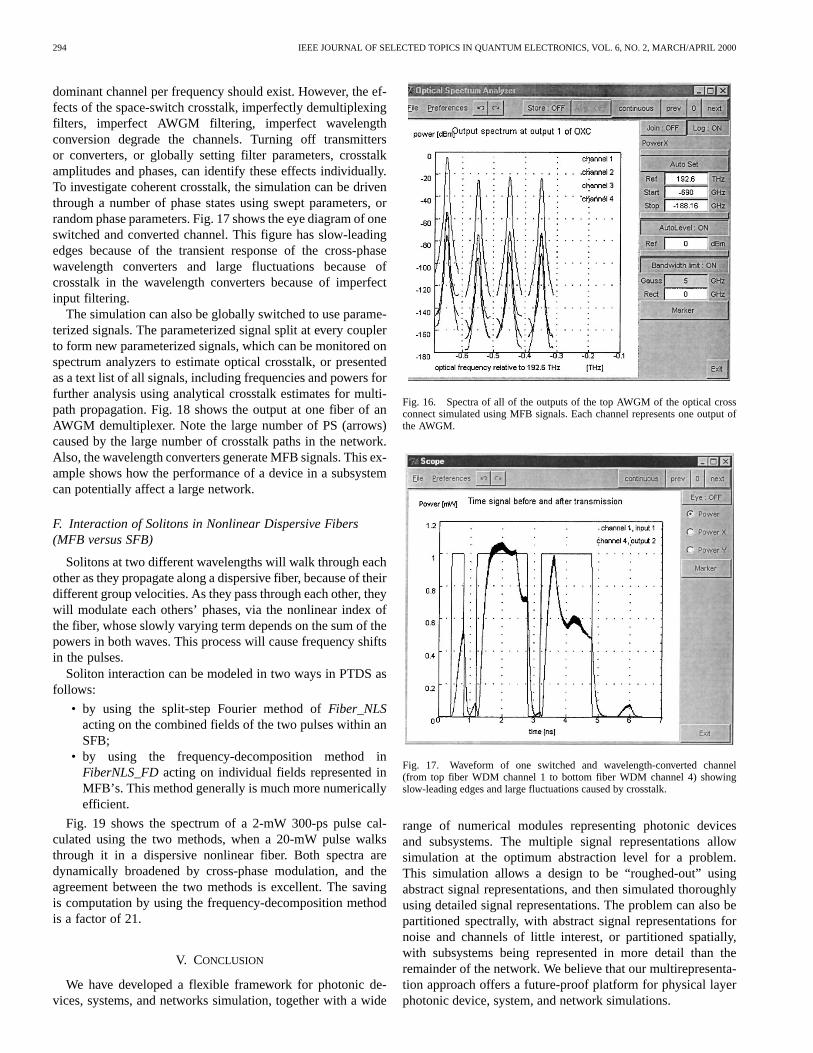
294 IEEE JOURNAL OF SELECTED TOPICS IN QUANTUM ELECTRONICS, VOL. 6, NO. 2, MARCH/APRIL 2000
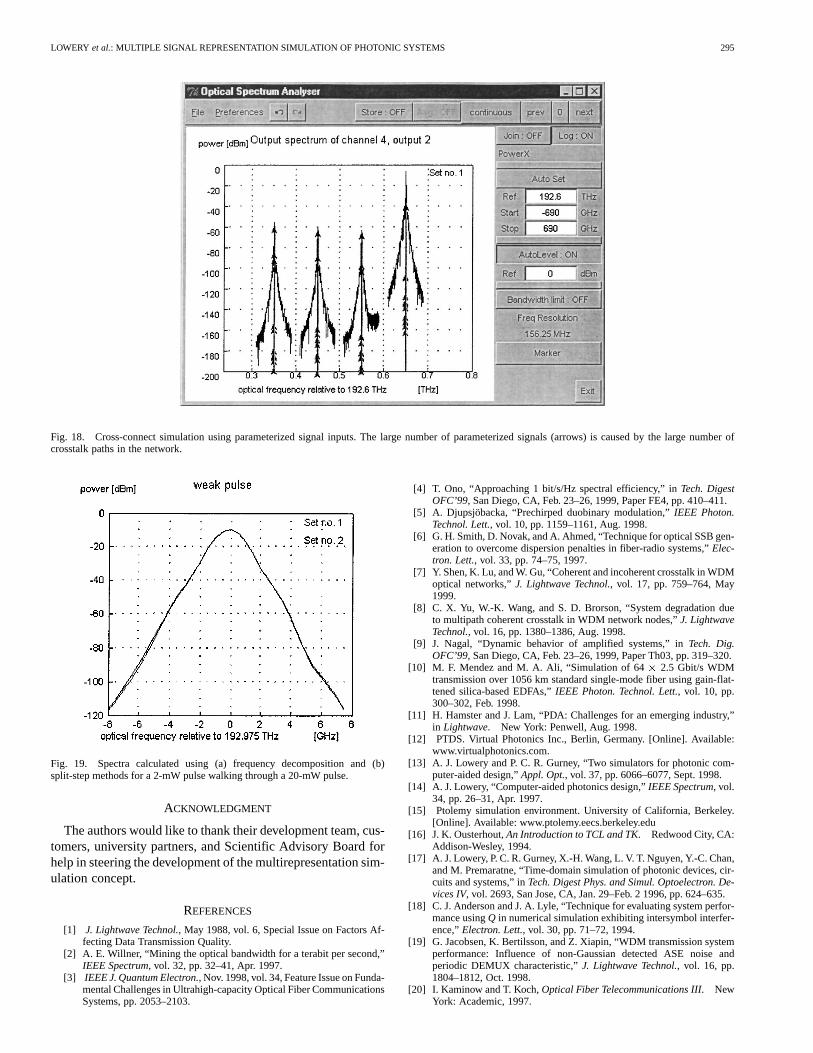
dominant channel per frequency should exist. However, the ef-fects of the space-switch crosstalk, imperfectly demultiplexingfilters, imperfect AWGM filtering, imperfect wavelengthconversion degrade the channels. Turning off transmittersor converters, or globally setting filter parameters, crosstalkamplitudes and phases, can identify these effects individually.To investigate coherent crosstalk, the simulation can be driventhrough a number of phase states using swept parameters, orrandom phase parameters. Fig. 17 shows the eye diagram of oneswitched and converted channel. This figure has slow-leadingedges because of the transient response of the cross-phasewavelength converters and large fluctuations because ofcrosstalk in the wavelength converters because of imperfectinput filtering.
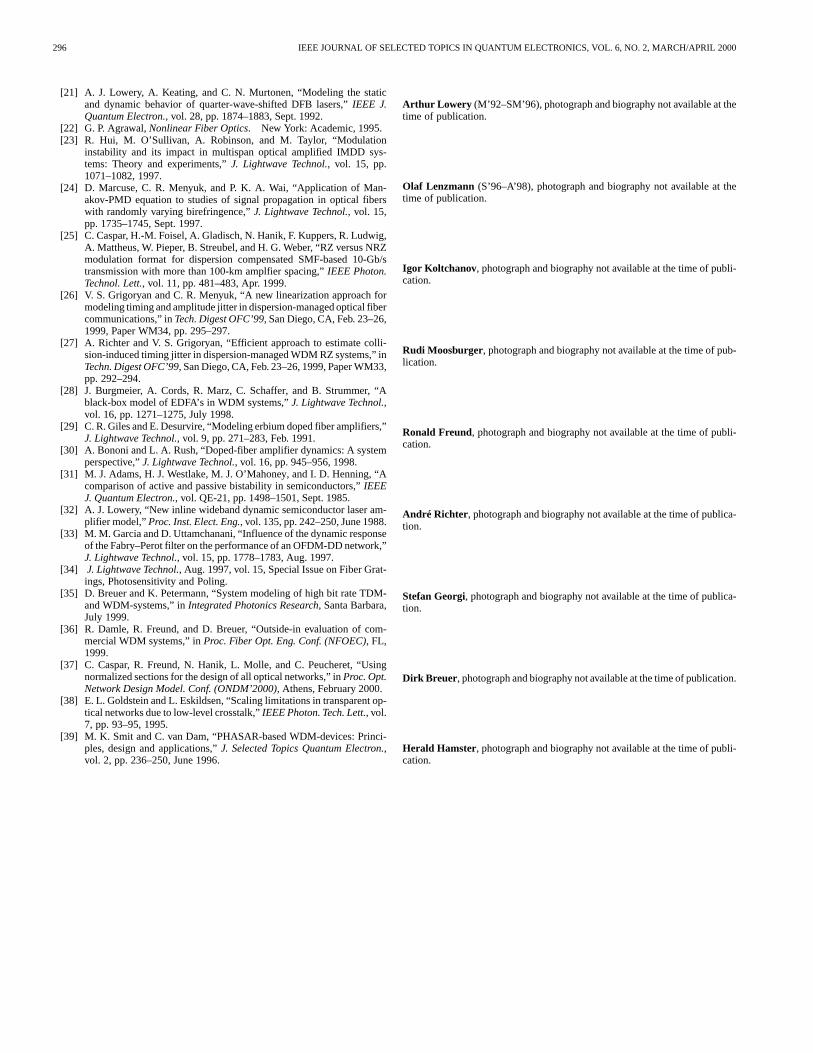
The simulation can also be globally switched to use parame-terized signals. The parameterized signal split at every couplerto form new parameterized signals, which can be monitored onspectrum analyzers to estimate optical crosstalk, or presentedas a text list of all signals, including frequencies and powers forfurther analysis using analytical crosstalk estimates for multi-path propagation. Fig. 18 shows the output at one fiber of anAWGM demultiplexer. Note the large number of PS (arrows)caused by the large number of crosstalk paths in the network.Also, the wavelength converters generate MFB signals. This ex-ample shows how the performance of a device in a subsystemcan potentially affect a large network.
F. Interaction of Solitons in Nonlinear Dispersive Fibers(MFB versus SFB)
Solitons at two different wavelengths will walk through eachother as they propagate along a dispersive fiber, because of theirdifferent group velocities. As they pass through each other, theywill modulate each others’ phases, via the nonlinear index ofthe fiber, whose slowly varying term depends on the sum of thepowers in both waves. This process will cause frequency shiftsin the pulses.
Soliton interaction can be modeled in two ways in PTDS asfollows:
• by using the split-step Fourier method ofFiber_NLSacting on the combined fields of the two pulses within anSFB;
• by using the frequency-decomposition method inFiberNLS_FDacting on individual fields represented inMFB’s. This method generally is much more numericallyefficient.
Fig. 19 shows the spectrum of a 2-mW 300-ps pulse cal-culated using the two methods, when a 20-mW pulse walksthrough it in a dispersive nonlinear fiber. Both spectra aredynamically broadened by cross-phase modulation, and theagreement between the two methods is excellent. The savingis computation by using the frequency-decomposition methodis a factor of 21.
V. CONCLUSION
We have developed a flexible framework for photonic de-vices, systems, and networks simulation, together with a wide
Fig. 16. Spectra of all of the outputs of the top AWGM of the optical crossconnect simulated using MFB signals. Each channel represents one output ofthe AWGM.
Fig. 17. Waveform of one switched and wavelength-converted channel(from top fiber WDM channel 1 to bottom fiber WDM channel 4) showingslow-leading edges and large fluctuations caused by crosstalk.
range of numerical modules representing photonic devicesand subsystems. The multiple signal representations allowsimulation at the optimum abstraction level for a problem.This simulation allows a design to be “roughed-out” usingabstract signal representations, and then simulated thoroughlyusing detailed signal representations. The problem can also bepartitioned spectrally, with abstract signal representations fornoise and channels of little interest, or partitioned spatially,with subsystems being represented in more detail than theremainder of the network. We believe that our multirepresenta-tion approach offers a future-proof platform for physical layerphotonic device, system, and network simulations.
LOWERY et al.: MULTIPLE SIGNAL REPRESENTATION SIMULATION OF PHOTONIC SYSTEMS 295
Fig. 18. Cross-connect simulation using parameterized signal inputs. The large number of parameterized signals (arrows) is caused by the large number ofcrosstalk paths in the network.
Fig. 19. Spectra calculated using (a) frequency decomposition and (b)split-step methods for a 2-mW pulse walking through a 20-mW pulse.
ACKNOWLEDGMENT
The authors would like to thank their development team, cus-tomers, university partners, and Scientific Advisory Board forhelp in steering the development of the multirepresentation sim-ulation concept.
REFERENCES
[1] J. Lightwave Technol., May 1988, vol. 6, Special Issue on Factors Af-fecting Data Transmission Quality.
[2] A. E. Willner, “Mining the optical bandwidth for a terabit per second,”IEEE Spectrum, vol. 32, pp. 32–41, Apr. 1997.
[3] IEEE J. Quantum Electron., Nov. 1998, vol. 34, Feature Issue on Funda-mental Challenges in Ultrahigh-capacity Optical Fiber CommunicationsSystems, pp. 2053–2103.
[4] T. Ono, “Approaching 1 bit/s/Hz spectral efficiency,” inTech. DigestOFC’99, San Diego, CA, Feb. 23–26, 1999, Paper FE4, pp. 410–411.
[5] A. Djupsjöbacka, “Prechirped duobinary modulation,”IEEE Photon.Technol. Lett., vol. 10, pp. 1159–1161, Aug. 1998.
[6] G. H. Smith, D. Novak, and A. Ahmed, “Technique for optical SSB gen-eration to overcome dispersion penalties in fiber-radio systems,”Elec-tron. Lett., vol. 33, pp. 74–75, 1997.
[7] Y. Shen, K. Lu, and W. Gu, “Coherent and incoherent crosstalk in WDMoptical networks,”J. Lightwave Technol., vol. 17, pp. 759–764, May1999.
[8] C. X. Yu, W.-K. Wang, and S. D. Brorson, “System degradation dueto multipath coherent crosstalk in WDM network nodes,”J. LightwaveTechnol., vol. 16, pp. 1380–1386, Aug. 1998.
[9] J. Nagal, “Dynamic behavior of amplified systems,” inTech. Dig.OFC’99, San Diego, CA, Feb. 23–26, 1999, Paper Th03, pp. 319–320.
[10] M. F. Mendez and M. A. Ali, “Simulation of 64� 2.5 Gbit/s WDMtransmission over 1056 km standard single-mode fiber using gain-flat-tened silica-based EDFAs,”IEEE Photon. Technol. Lett., vol. 10, pp.300–302, Feb. 1998.
[11] H. Hamster and J. Lam, “PDA: Challenges for an emerging industry,”in Lightwave. New York: Penwell, Aug. 1998.
[12] PTDS. Virtual Photonics Inc., Berlin, Germany. [Online]. Available:www.virtualphotonics.com.
[13] A. J. Lowery and P. C. R. Gurney, “Two simulators for photonic com-puter-aided design,”Appl. Opt., vol. 37, pp. 6066–6077, Sept. 1998.
[14] A. J. Lowery, “Computer-aided photonics design,”IEEE Spectrum, vol.34, pp. 26–31, Apr. 1997.
[15] Ptolemy simulation environment. University of California, Berkeley.[Online]. Available: www.ptolemy.eecs.berkeley.edu
[16] J. K. Ousterhout,An Introduction to TCL and TK. Redwood City, CA:Addison-Wesley, 1994.
[17] A. J. Lowery, P. C. R. Gurney, X.-H. Wang, L. V. T. Nguyen, Y.-C. Chan,and M. Premaratne, “Time-domain simulation of photonic devices, cir-cuits and systems,” inTech. Digest Phys. and Simul. Optoelectron. De-vices IV, vol. 2693, San Jose, CA, Jan. 29–Feb. 2 1996, pp. 624–635.
[18] C. J. Anderson and J. A. Lyle, “Technique for evaluating system perfor-mance usingQ in numerical simulation exhibiting intersymbol interfer-ence,”Electron. Lett., vol. 30, pp. 71–72, 1994.
[19] G. Jacobsen, K. Bertilsson, and Z. Xiapin, “WDM transmission systemperformance: Influence of non-Gaussian detected ASE noise andperiodic DEMUX characteristic,”J. Lightwave Technol., vol. 16, pp.1804–1812, Oct. 1998.
[20] I. Kaminow and T. Koch,Optical Fiber Telecommunications III. NewYork: Academic, 1997.
296 IEEE JOURNAL OF SELECTED TOPICS IN QUANTUM ELECTRONICS, VOL. 6, NO. 2, MARCH/APRIL 2000
[21] A. J. Lowery, A. Keating, and C. N. Murtonen, “Modeling the staticand dynamic behavior of quarter-wave-shifted DFB lasers,”IEEE J.Quantum Electron., vol. 28, pp. 1874–1883, Sept. 1992.
[22] G. P. Agrawal,Nonlinear Fiber Optics. New York: Academic, 1995.[23] R. Hui, M. O’Sullivan, A. Robinson, and M. Taylor, “Modulation
instability and its impact in multispan optical amplified IMDD sys-tems: Theory and experiments,”J. Lightwave Technol., vol. 15, pp.1071–1082, 1997.
[24] D. Marcuse, C. R. Menyuk, and P. K. A. Wai, “Application of Man-akov-PMD equation to studies of signal propagation in optical fiberswith randomly varying birefringence,”J. Lightwave Technol., vol. 15,pp. 1735–1745, Sept. 1997.
[25] C. Caspar, H.-M. Foisel, A. Gladisch, N. Hanik, F. Kuppers, R. Ludwig,A. Mattheus, W. Pieper, B. Streubel, and H. G. Weber, “RZ versus NRZmodulation format for dispersion compensated SMF-based 10-Gb/stransmission with more than 100-km amplfier spacing,”IEEE Photon.Technol. Lett., vol. 11, pp. 481–483, Apr. 1999.
[26] V. S. Grigoryan and C. R. Menyuk, “A new linearization approach formodeling timing and amplitude jitter in dispersion-managed optical fibercommunications,” inTech. Digest OFC’99, San Diego, CA, Feb. 23–26,1999, Paper WM34, pp. 295–297.
[27] A. Richter and V. S. Grigoryan, “Efficient approach to estimate colli-sion-induced timing jitter in dispersion-managed WDM RZ systems,” inTechn. Digest OFC’99, San Diego, CA, Feb. 23–26, 1999, Paper WM33,pp. 292–294.
[28] J. Burgmeier, A. Cords, R. Marz, C. Schaffer, and B. Strummer, “Ablack-box model of EDFA’s in WDM systems,”J. Lightwave Technol.,vol. 16, pp. 1271–1275, July 1998.
[29] C. R. Giles and E. Desurvire, “Modeling erbium doped fiber amplifiers,”J. Lightwave Technol., vol. 9, pp. 271–283, Feb. 1991.
[30] A. Bononi and L. A. Rush, “Doped-fiber amplifier dynamics: A systemperspective,”J. Lightwave Technol., vol. 16, pp. 945–956, 1998.
[31] M. J. Adams, H. J. Westlake, M. J. O’Mahoney, and I. D. Henning, “Acomparison of active and passive bistability in semiconductors,”IEEEJ. Quantum Electron., vol. QE-21, pp. 1498–1501, Sept. 1985.
[32] A. J. Lowery, “New inline wideband dynamic semiconductor laser am-plifier model,”Proc. Inst. Elect. Eng., vol. 135, pp. 242–250, June 1988.
[33] M. M. Garcia and D. Uttamchanani, “Influence of the dynamic responseof the Fabry–Perot filter on the performance of an OFDM-DD network,”J. Lightwave Technol., vol. 15, pp. 1778–1783, Aug. 1997.
[34] J. Lightwave Technol., Aug. 1997, vol. 15, Special Issue on Fiber Grat-ings, Photosensitivity and Poling.
[35] D. Breuer and K. Petermann, “System modeling of high bit rate TDM-and WDM-systems,” inIntegrated Photonics Research, Santa Barbara,July 1999.
[36] R. Damle, R. Freund, and D. Breuer, “Outside-in evaluation of com-mercial WDM systems,” inProc. Fiber Opt. Eng. Conf. (NFOEC), FL,1999.
[37] C. Caspar, R. Freund, N. Hanik, L. Molle, and C. Peucheret, “Usingnormalized sections for the design of all optical networks,” inProc. Opt.Network Design Model. Conf. (ONDM’2000), Athens, February 2000.
[38] E. L. Goldstein and L. Eskildsen, “Scaling limitations in transparent op-tical networks due to low-level crosstalk,”IEEE Photon. Tech. Lett., vol.7, pp. 93–95, 1995.
[39] M. K. Smit and C. van Dam, “PHASAR-based WDM-devices: Princi-ples, design and applications,”J. Selected Topics Quantum Electron.,vol. 2, pp. 236–250, June 1996.
Arthur Lowery (M’92–SM’96), photograph and biography not available at thetime of publication.
Olaf Lenzmann (S’96–A’98), photograph and biography not available at thetime of publication.
Igor Koltchanov , photograph and biography not available at the time of publi-cation.
Rudi Moosburger, photograph and biography not available at the time of pub-lication.
Ronald Freund, photograph and biography not available at the time of publi-cation.
André Richter , photograph and biography not available at the time of publica-tion.
Stefan Georgi, photograph and biography not available at the time of publica-tion.
Dirk Breuer , photograph and biography not available at the time of publication.
Herald Hamster, photograph and biography not available at the time of publi-cation.