Multiple receptor conformation docking and dock pose clustering as tool for CoMFA and CoMSIA...
14
ORIGINAL PAPER Multiple receptor conformation docking and dock pose clustering as tool for CoMFA and CoMSIA analysis – a case study on HIV-1 protease inhibitors Sree Kanth Sivan & Vijjulatha Manga Received: 11 December 2010 /Accepted: 18 March 2011 / Published online: 6 May 2011 # Springer-Verlag 2011 Abstract Multiple receptors conformation docking (MRCD) and clustering of dock poses allows seamless incorporation of receptor binding conformation of the molecules on wide range of ligands with varied structural scaffold. The accuracy of the approach was tested on a set of 120 cyclic urea molecules having HIV-1 protease inhibitory activity using 12 high resolution X-ray crystal structures and one NMR resolved conformation of HIV-1 protease extracted from protein data bank. A cross validation was performed on 25 non-cyclic urea HIV-1 protease inhibitor having varied structures. The compara- tive molecular field analysis (CoMFA) and comparative molecular similarity indices analysis (CoMSIA) models were generated using 60 molecules in the training set by applying leave one out cross validation method, r loo 2 values of 0.598 and 0.674 for CoMFA and CoMSIA respectively and non-cross validated regression coefficient r 2 values of 0.983 and 0.985 were obtained for CoMFA and CoMSIA respectively. The predictive ability of these models was determined using a test set of 60 cyclic urea molecules that gave predictive correlation (r pred 2 ) of 0.684 and 0.64 respectively for CoMFA and CoMSIA indicating good internal predictive ability. Based on this information 25 non-cyclic urea molecules were taken as a test set to check the external predictive ability of these models. This gave remarkable out come with r pred 2 of 0.61 and 0.53 for CoMFA and CoMSIA respectively. The results invariably show that this method is useful for performing 3D QSAR analysis on molecules having different structural motifs. Keywords AIDS (acquired immunodeficiency syndrome) . CoMFA (Comparative molecular field analysis) . CoMSIA (Comparative molecular similarity indices analysis) . HIV- 1 (Human immunodeficiency virus type1) . MRCD (Multiple receptor conformation docking) . PLS (partial least square) analysis . PR (aspartic protease) Introduction Human immunodeficiency virus type1 (HIV-1) is responsible for human acquired immunodeficiency syndrome (AIDS) [1, 2], one of the most urgent world health threats. With ca. 42 million HIV/AIDS patients worldwide, only 20 anti-HIV drugs are currently available for clinical use. HIV-1 genome encodes for three major enzymes protease, reverse transcrip- tase and integrase for HIV-1 replication. The aspartic protease (PR) of the human immunodeficiency virus type 1 (HIV-1) cleaves the viral gag-pol fusion precursor poly- protein into active viral structural proteins and replicative enzymes such as reverse transcriptase, endonuclease, and integrase, thus playing an essential role in the maturation of HIV-1 particles and virus replication [3]. Therefore, PR is an important target for the design of specific antiviral agents dedicated to treatment of HIV-1 infection and acquired immunodeficiency syndrome (AIDS) [4–8]. cyclic urea molecules have been reported to constitute an entirely new class of potent and perspective nonpeptidic inhibitors of PR, fundamental feature of the cyclic urea inhibitors is the carbonyl oxygen that mimics the hydrogen-bonding features of the key structural water molecule present in the active site of the PR [9]. In the present study 120 cyclic urea molecules Electronic supplementary material The online version of this article (doi:10.1007/s00894-011-1048-x) contains supplementary material, which is available to authorized users. S. K. Sivan : V. Manga (*) Department of Chemistry, Nizam College, Osmania University, Hyderabad 500001, India e-mail: [email protected] J Mol Model (2012) 18:569–582 DOI 10.1007/s00894-011-1048-x
-
Upload
independent -
Category
Documents
-
view
0 -
download
0
Transcript of Multiple receptor conformation docking and dock pose clustering as tool for CoMFA and CoMSIA...

ORIGINAL PAPER
Multiple receptor conformation docking and dock poseclustering as tool for CoMFA and CoMSIA analysis – a casestudy on HIV-1 protease inhibitors
Sree Kanth Sivan & Vijjulatha Manga
Received: 11 December 2010 /Accepted: 18 March 2011 /Published online: 6 May 2011# Springer-Verlag 2011
Abstract Multiple receptors conformation docking(MRCD) and clustering of dock poses allows seamlessincorporation of receptor binding conformation of themolecules on wide range of ligands with varied structuralscaffold. The accuracy of the approach was tested on a setof 120 cyclic urea molecules having HIV-1 proteaseinhibitory activity using 12 high resolution X-ray crystalstructures and one NMR resolved conformation of HIV-1protease extracted from protein data bank. A crossvalidation was performed on 25 non-cyclic urea HIV-1protease inhibitor having varied structures. The compara-tive molecular field analysis (CoMFA) and comparativemolecular similarity indices analysis (CoMSIA) modelswere generated using 60 molecules in the training set byapplying leave one out cross validation method, rloo
2 valuesof 0.598 and 0.674 for CoMFA and CoMSIA respectivelyand non-cross validated regression coefficient r2 values of0.983 and 0.985 were obtained for CoMFA and CoMSIArespectively. The predictive ability of these models wasdetermined using a test set of 60 cyclic urea molecules thatgave predictive correlation (rpred
2) of 0.684 and 0.64respectively for CoMFA and CoMSIA indicating goodinternal predictive ability. Based on this information 25non-cyclic urea molecules were taken as a test set to checkthe external predictive ability of these models. This gaveremarkable out come with rpred
2 of 0.61 and 0.53 forCoMFA and CoMSIA respectively. The results invariably
show that this method is useful for performing 3D QSARanalysis on molecules having different structural motifs.
Keywords AIDS (acquired immunodeficiency syndrome) .
CoMFA (Comparative molecular field analysis) . CoMSIA(Comparative molecular similarity indices analysis) . HIV- 1(Human immunodeficiency virus type1) .MRCD (Multiplereceptor conformation docking) . PLS (partial least square)analysis . PR (aspartic protease)
Introduction
Human immunodeficiency virus type1 (HIV-1) is responsiblefor human acquired immunodeficiency syndrome (AIDS) [1,2], one of the most urgent world health threats. With ca. 42million HIV/AIDS patients worldwide, only 20 anti-HIVdrugs are currently available for clinical use. HIV-1 genomeencodes for three major enzymes protease, reverse transcrip-tase and integrase for HIV-1 replication. The asparticprotease (PR) of the human immunodeficiency virus type 1(HIV-1) cleaves the viral gag-pol fusion precursor poly-protein into active viral structural proteins and replicativeenzymes such as reverse transcriptase, endonuclease, andintegrase, thus playing an essential role in the maturation ofHIV-1 particles and virus replication [3]. Therefore, PR is animportant target for the design of specific antiviral agentsdedicated to treatment of HIV-1 infection and acquiredimmunodeficiency syndrome (AIDS) [4–8]. cyclic ureamolecules have been reported to constitute an entirely newclass of potent and perspective nonpeptidic inhibitors of PR,fundamental feature of the cyclic urea inhibitors is thecarbonyl oxygen that mimics the hydrogen-bonding featuresof the key structural water molecule present in the active siteof the PR [9]. In the present study 120 cyclic urea molecules
Electronic supplementary material The online version of this article(doi:10.1007/s00894-011-1048-x) contains supplementary material,which is available to authorized users.
S. K. Sivan :V. Manga (*)Department of Chemistry, Nizam College, Osmania University,Hyderabad 500001, Indiae-mail: [email protected]
J Mol Model (2012) 18:569–582DOI 10.1007/s00894-011-1048-x

are taken into consideration apart from that, another 25 non-cyclic urea molecules having HIV-1 protease inhibitoryactivity are used for comparative molecular field analysis(CoMFA) [10] and comparative similarity indices analysis(CoMSIA) [11] based 3D QSAR analysis.
3D QSAR techniques, such as the CoMFA and CoMSIA,are based on the experimental structure-activity relationshipon specific bio-macromolecule and ligand pair. This method isbased only on the ligand structure and thus the spatialalignment is crucial in determining the accuracy of theseapproaches. Another reason for the inaccuracy in traditionalligand-based 3D QSAR [12] lies in the fact that theconformation used in the alignment may not be the activeconformer of that ligand. One way to surmount such inherentimperfection is to introduce three-dimensional structures ofthe target bio-macromolecule during alignment process thisstrategy is called receptor-based 3D QSAR analysis [13–16].The three-dimensional structures of the target can beobtained either from experimentally derived X-ray crystal-lography, NMR spectroscopy or from homology modeling.
Different methods have been employed for receptor-based alignment of the ligands. In general, the X-raycrystal structure of inhibitor complexed with the enzymeis used as a template for superimposition, assuming thatthis conformation represents the most probable bioactiveconformation.
Receptor-docked alignment derived from the structure-based docking algorithms like GOLD, FlexX, GLIDE, andAutodock are used as such [17] or a rigid realignment ofthe poses from the receptor-docked alignment is performed,or the use of best docked mode of the smallest compoundas template and modified for the other compounds [18].These compounds were minimized and minimized struc-tures at this binding mode were superimposed to get themolecular alignment for CoMFA and CoMSIA. To incor-porate receptor flexibility, docking followed by moleculardynamics and minimization of protein ligand complex isperformed and the ligand conformation obtained is used astemplate for alignment [19].
All these methods are helpful for the alignment ofmolecules having maximum common substructure, butcannot be employed for ligands having diverse structures.Here in this article we report a method to incorporateprotein flexibility by applying multiple receptor conforma-tion docking (MRCD) [20–22] and clustering of dockedpose for obtaining the alignment of compounds which canhave a diverse substructure.
Methodology
Twelve high resolution X-ray crystal structure and oneNMR resolved crystal structure of HIV-1 protease in
complex with inhibitors (pdb id: 1PRO, 1BV9, 1AJX,1AJV, 1T7K, 1QBR, 1QBS, 1QBU, 1HVR, 1HVH, 1DMP,1G35, 1BVG) [23–32] were downloaded from the proteindata bank. GLIDE 5.6 [33] was used for moleculardocking. The resolution of the crystal structure is given inTable 1. The proteins were prepared using protein prepa-ration module applying the default parameters, grids weregenerated around the active site of the protease withreceptor Van der Waals scaling for the non-polar atoms as0.9 [34].
A set 145 known HIV-1 protease inhibitors that includes120 cyclic urea and 25 non cyclic urea molecules withdiverse structures and varied range of inhibition constants(Ki) were selected from literature [4, 9, 27, 28, 35–40],these were built using maestro build panel and prepared byLigPrep application in Schrödinger 2010 suite. Structuresof cyclic urea molecules are given in Table 2. LigPrepproduces the low energy conformer of the ligand using theMMFF94s force field. The lower energy RSSR conforma-tions of the ligands were selected and docked into the gridgenerated from the 13 protein structures using the standardprecision docking mode [34]. The crystal structure ligandswere also docked and its RMSD was calculated to validatethe docking process.
The best dock pose (low binding energy conformeraccording to the glide dock score) of each ligand from 13docking runs performed on 13 receptors grids were analyzedfor their hydrogen bond interactions with the receptor. Thepose with the required hydrogen bonding namely withcarboxylate of Asp25 and amine of Ile50 were selected forfurther clustering. The dock poses were clustered usingclustering of conformer’s script in Schrödinger 2010 suite.
Table 1 PDB ids of crystal structure of HIV-1 protease, theirresolution and RMSD of redocked co-crystallized ligand
S.No.
Protein PDBid
X-ray crystal structureresolution (Å)
RMSD(Å)
1 1AJV 2.00 0.942
2 1AJX 1.85 0.497
3 1BV9 2.00 2.115
4 1DMP 2.00 0.456
5 1G35 1.80 2.05
6 1HVH 1.80 2.24
7 1HVR 1.80 0.537
8 1QBR 1.80 0.421
9 1QBS 1.80 0.521
10 1QBU 1.80 0.863
11 1T7K 2.10 0.77
12 1PRO 1.80 1.115
13 1BVG NMR resolved 0.508
570 J Mol Model (2012) 18:569–582

The clustering was performed using atomic RMSD, in thisRMSD was calculated in place which does not alter the dockpose of each conformer. The lowest binding energy confor-mation from the most populated cluster was chosen forCoMFA and CoMSIA analysis without further alignment, i.e.,super imposition of ligands based on the common substructurefor a set of molecules was not done, instead the dockedconformer pose obtained form clustering were taken as is forall ligands. This imparts the flexible receptor bindinginformation of each ligand in data set. The resulting dockedpose orientations is shown in Fig. 1.
The molecules were imported into Sybyl 6.9 molecularmodeling program package [41] Gasteiger-Hückel [42]charges were assigned. The standard Tripos force fieldswere employed for the CoMFA and CoMSIA analysis. A3D cubic lattice of dimension 4Å in each direction witheach lattice intersection of regularly spaced grid of 2.0 Åwas created. The steric and electrostatic parameters werecalculated in case of the CoMFA fields while hydrophobic,acceptor and donor parameters in addition to steric andelectrostatic were calculated in case of the CoMSIA fieldsat each lattice. The sp3 carbon was used as a probe atom togenerate steric (Lennard-Jones potential) field energies and
a charge of +1 to generate electrostatic (Coulombicpotential) field energies. A distance dependent dielectricconstant of 1.00 was used. The steric and electrostaticcontributions were cut off at 30 kcal mol-1.
A partial least squares (PLS) regression was used togenerate a linear relationship that correlates changes in thecomputed fields with changes in the corresponding exper-imental values of biological activity (pKi) for the data set ofligands. One hundred twenty cyclic urea molecules weredivided into training and test set of 60 molecules eachrespectively, considering the set had a balanced distributionof more and less active compounds. Twenty five non cyclicinhibitors were taken as external test set. Biological activityvalues of ligands were used as dependent variables in a PLSstatistical analysis. The column filtering value (s) was set to2.0 kcal mol-1 to improve the signal-to-noise ratio byomitting those lattice points whose energy variations werebelow this threshold. Cross-validations were performed bythe leave-one-out (LOO) procedure to determine theoptimum number of components (ONC) and the coefficientrloo
2. The optimum number of components obtained is thenused to derive the final QSAR model using all of thetraining set compounds with non-cross validation and to
Table 2 Structures of cyclic urea molecules with their experimental pKi and predicted pKi
N N
O
OH OH
R2
R2
R1
R1
R2
lyzneBBenzyl
lyzneBBenzyl Benzyl
lyzneBBenzyl
lyzneBlyzneB
Benzyl lyzneB
Benzyl lyzneB
Benzyl lyzneBlyzneB
Benzyl Benzyl
Mol R1
lyteM12t Ethyl
lyporP-nt34 n-butyl5 n-pentyl
lyxeh-nt67 2-methoxy ethyl
lyhteyxohte-2t8lytub-osIt9
10t Iso-pentyllyxeh-osI11
12t Iso-heptyllyllAt31
14t 2-methylpropen-3-yllynerp-osI51
lyhte)yxolynehte(t6117t cyclopropyl methyl18 Cyclobutyl methyl19 Cyclopentyl methyl Benzyl
Expt.pKi *
Pred pKiCoMFA
Pred pKiCoMSIA
5.240 5.307 5.3287.000 7.736 8.505
996.8179.7790.88.854 8.083 8.6248.796 8.951 8.902
334.8953.8733.86.097 6.441 5.9965.958 7.130 6.493
826.8228.7003.77.921 8.438 8.3968.155 8.346 8.2197.523 8.499 8.3468.284 7.726 8.6338.136 7.926 8.931
109.8206.8547.8500.8337.7222.7
8.677 8.185 8.5618.886 8.686 8.8798.366 8.432 8.807
J Mol Model (2012) 18:569–582 571
obtain the conventional regression coefficient (r2). Since thestatistical parameters were found to be the best for themodel from the LOO method, it was employed for furtherpredictions of activity of test molecules for cross validationof the model. The schematic representation of the multiple
receptor conformation docking (MRCD), clustering and 3DQSAR is given in Fig. 2.
Multiple receptors conformation docking is a methodemployed for incorporating the receptor flexibility whiledocking analysis. In this method different conformations of
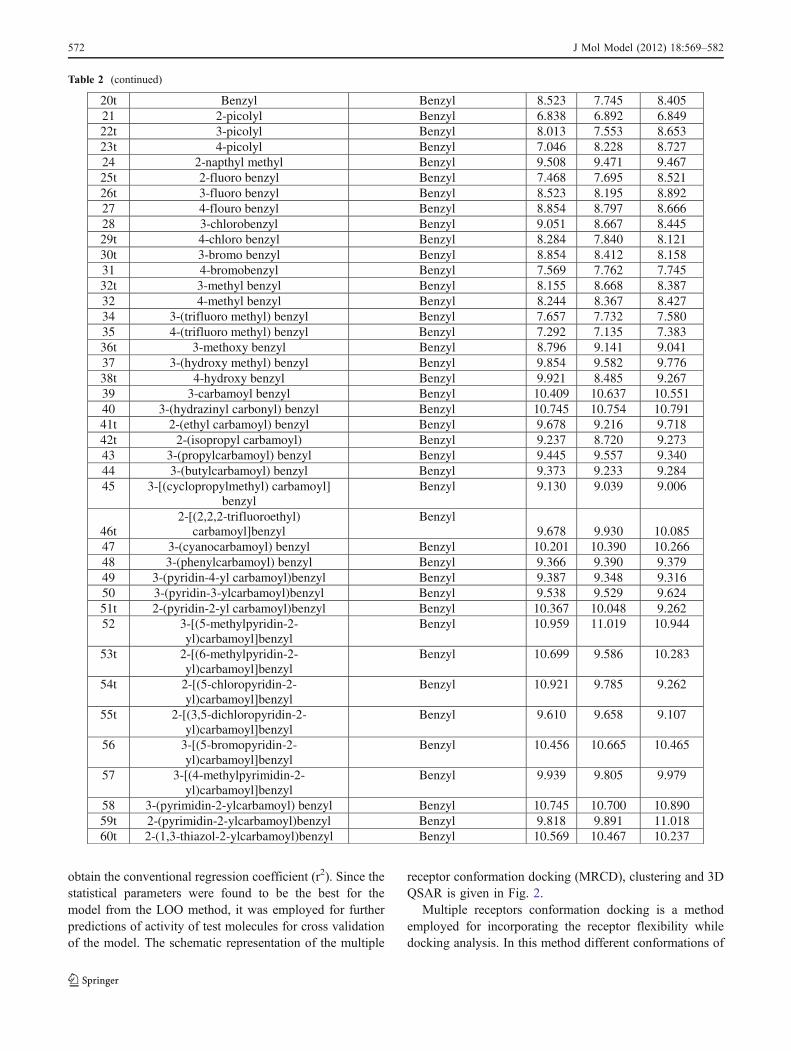
Table 2 (continued)
20t Benzyl Benzyl 8.523 7.745 8.405948.6298.6838.6lyzneBlylocip-212
22t 3-picolyl Benzyl 8.013 7.553 8.65323t 4-picolyl Benzyl 7.046 8.228 8.72724 2-napthyl methyl Benzyl 9.508 9.471 9.467
lyzneBlyzneboroulf-2t52 7.468 7.695 8.521lyzneBlyzneboroulf-3t62 8.523 8.195 8.892
27 4-flouro benzyl Benzyl 8.854 8.797 8.66628 3-chlorobenzyl Benzyl 9.051 8.667 8.44529t 4-chloro benzyl Benzyl 8.284 7.840 8.121
851.8214.8458.8lyzneBlyznebomorb-3t0331 4-bromobenzyl Benzyl 7.569 7.762 7.74532t 3-methyl benzyl Benzyl 8.155 8.668 8.387
724.8763.8442.8lyzneBlyzneblyhtem-42334 3-(trifluoro methyl) benzyl Benzyl 7.657 7.732 7.58035 4-(trifluoro methyl) benzyl Benzyl 7.292 7.135 7.383
140.9141.9697.8lyzneBlyznebyxohtem-3t6337 3-(hydroxy methyl) benzyl Benzyl 9.854 9.582 9.77638t 4-hydroxy benzyl Benzyl 9.921 8.485 9.26739 3-carbamoyl benzyl Benzyl 10.409 10.637 10.55140 3-(hydrazinyl carbonyl) benzyl Benzyl 10.745 10.754 10.79141t 2-(ethyl carbamoyl) benzyl Benzyl 9.678 9.216 9.71842t 2-(isopropyl carbamoyl) Benzyl 9.237 8.720 9.27343 3-(propylcarbamoyl) benzyl Benzyl 9.445 9.557 9.34044 3-(butylcarbamoyl) benzyl Benzyl 9.373 9.233 9.28445 3-[(cyclopropylmethyl) carbamoyl]
benzylBenzyl 9.130 9.039 9.006
46t2-[(2,2,2-trifluoroethyl)
carbamoyl]benzylBenzyl
9.678 9.930 10.08547 3-(cyanocarbamoyl) benzyl Benzyl 10.201 10.390 10.26648 3-(phenylcarbamoyl) benzyl Benzyl 9.366 9.390 9.37949 3-(pyridin-4-yl carbamoyl)benzyl Benzyl 9.387 9.348 9.31650 3-(pyridin-3-ylcarbamoyl)benzyl Benzyl 9.538 9.529 9.62451t 2-(pyridin-2-yl carbamoyl)benzyl Benzyl 10.367 10.048 9.26252 3-[(5-methylpyridin-2-
yl)carbamoyl]benzylBenzyl 10.959 11.019 10.944
53t 2-[(6-methylpyridin-2-yl)carbamoyl]benzyl
Benzyl 10.699 9.586 10.283
54t 2-[(5-chloropyridin-2-yl)carbamoyl]benzyl
Benzyl 10.921 9.785 9.262
55t 2-[(3,5-dichloropyridin-2-yl)carbamoyl]benzyl
Benzyl 9.610 9.658 9.107
56 3-[(5-bromopyridin-2-yl)carbamoyl]benzyl
Benzyl 10.456 10.665 10.465
57 3-[(4-methylpyrimidin-2-yl)carbamoyl]benzyl
Benzyl 9.939 9.805 9.979
58 3-(pyrimidin-2-ylcarbamoyl) benzyl Benzyl 10.745 10.700 10.89059t 2-(pyrimidin-2-ylcarbamoyl)benzyl Benzyl 9.818 9.891 11.01860t 2-(1,3-thiazol-2-ylcarbamoyl)benzyl Benzyl 10.569 10.467 10.237
572 J Mol Model (2012) 18:569–582

Table 2 (continued)
61t 2-[(5-methyl-1,3-thiazol-2-yl)carbamoyl]
Benzyl
Benzyl 10.602 9.115 9.070
62t 2-[(4-methyl-1,3-thiazol-2-yl)carbamoyl]benzyl
Benzyl 10.854 10.426 9.894
63 3-(1H-benzimidazol-2-ylcarbamoyl)benzyl
Benzyl 10.620 10.537 10.643
64 3-{[5-(trifluoromethyl)-1,3,4-thiadiazol-2-yl] carbamoyl}benzyl
Benzyl 9.745 9.874 9.684
65 3-(1,3,4-thiadiazol-2-ylcarbamoyl)benzyl
Benzyl 9.959 9.984 9.962
66t 3-(1H-pyrazol-5-yl) benzyl Benzyl 10.569 9.891 11.424
67 [3-(ethylamino)-1H-indazol-6-
yl]methylBenzyl
10.387 10.357 10.268
68t[3-(propan-2-ylamino)-1H-indazol-5-
yl]methylBenzyl
10.046 10.637 10.909
69t{3-[(cyclopropyl methyl) amino]-1H-
indazol-5-yl}methylBenzyl
9.469 9.925 8.756
70 [3-(propylamino)-1H-indazol-6-
yl]methylBenzyl
9.638 9.648 9.47971 3-(2-hydroxypropan-2-yl) benzyl Benzyl 10.100 10.318 10.09472t 1H-indazol-5-yl ethyl Benzyl 10.745 9.517 9.78673t (3-methoxy-1H-indazol-5-yl)methyl Benzyl 9.750 9.636 9.87074 3-[(aminoacetyl) amino] benzyl Benzyl 10.530 10.451 10.51375 Benzyl Methyl 5.301 5.223 5.30576t Benzyl 4-isopropyl benzyl 8.959 8.840 9.31577 Benzyl 4-(methylthio)benzyl 8.469 8.346 8.30478 Benzyl Iso-butyl 5.770 6.067 6.41279t Benzyl 2-(methyl thio) ethyl 5.959 6.665 6.96280t Benzyl Cyclohexyl methyl 7.553 8.257 7.98681t Benzyl Phenethyl 6.495 7.162 7.91782 Benzyl (napthalene-2-yl) methyl 8.009 7.977 8.14483 Benzyl (4-methyl sulfanyl ) benzyl 8.602 8.519 8.45584 Benzyl (4-methyl sulfonyl ) benzyl 8.602 8.577 8.54085t Benzyl 2-methoxy benzyl 7.222 8.914 8.27586t Benzyl 2-hydroxy benzyl 7.456 8.164 8.26187 Benzyl 3-methoxy benzyl 8.328 8.493 8.30088t Benzyl 4-methoxy benzyl 8.066 8.606 8.55289t Benzyl 4-hydroxy benzyl 8.959 8.251 8.13990 Benzyl 3-amino benzyl 8.553 8.596 8.44791 Benzyl (3-dimethyl amino) benzyl 8.367 8.514 8.51492 Benzyl 4-amino benzyl 8.071 8.220 8.10993t Benzyl 4-picolyl 7.658 7.214 7.84394 Benzyl (1,3-benzodioxol-5-yl) methyl 8.886 8.691 8.69795t Benzyl 4-(2-hydroxyethoxy)benzyl 9.119 8.924 9.44796t Benzyl 4-(pyridin-4-ylmethoxy)benzyl 9.076 8.877 8.92497 Cyclopropyl methyl Iso-butyl 7.066 7.171 7.11398 Cyclopropyl l methyl Iso-propyl 6.602 6.613 6.26399t Cyclopropyl methyl (3-methyl sulfanyl) propyl 5.602 7.676 7.100
J Mol Model (2012) 18:569–582 573
the same protein are taken and ligands are docked into thegrids generated from these conformations. The accuracy ofa docking procedure lies in how closely the lowest energypose (binding conformation) predicted by the object scoringfunction (Glide score), resembles an experimental bindingmode as determined by X-ray crystallography. In thepresent study, standard precision glide docking procedurewas validated by removing crystal structure ligand from thebinding site and redocking it to the binding site of HIV-1protease for each of the receptor conformations.
Results and discussion
We found a very good agreement between the localizationof the inhibitor upon docking and from the crystal structure,i.e., having similar hydrogen bonding interactions withAsp 25 and Ile 50. The root mean square deviationsbetween the predicted conformation and the observed X-ray crystallographic conformation for the ligands rangedfrom 0.4Åto 2.24Å, the values are provided in Table 1,these values suggests the reliability of Glide docking in
Table 2 (continued)
100t Cyclopropyl methyl 4-fluorobenzyl 8.237 8.047 8.300101t Cyclopropyl methyl 3-methoxy benzyl 9.060 8.662 8.332102 Cyclopropyl methyl 3-hydroxy benzyl 7.886 8.045 7.751103 Cyclopropyl methyl 4-methoxy benzyl 8.538 8.756 8.804104t Cyclopropyl methyl 2-naphthylmethyl 8.367 8.675 9.190105t Cyclopropyl methyl 2-thienyl methyl 8.041 7.392 7.483106t 4-hydroxy benzyl 2-(methylthio) ethyl 5.409 7.101 7.007107t 4-hydroxy benzyl Cyclohexyl methyl 7.495 8.443 8.757108t 4-hydroxy benzyl 4-fluorobenzyl 9.357 8.468 8.895109t 4-hydroxy benzyl 3-methoxy benzyl 9.959 9.305 9.364110t 4-hydroxy benzyl 3,4 difluoro benzyl 9.328 8.205 8.885111 4-hydroxy benzyl Pyridine-4-yl methyl 8.319 8.126 8.407112 4-hydroxy benzyl 4-methoxy benzyl 9.620 9.672 9.512113 4-hydroxy benzyl Iso-butyl 7.420 7.119 7.299114t 3-butanoyl benzyl Phenyl 8.860 8.204 8.354115 3-(2,2-dimethyl propanoyl)benzyl Phenyl 8.450 8.391 8.524116 3-(1H-imidazol-5-ylmethyl)benzyl Phenyl 9.730 9.831 9.694117t 3-(1H-benzimidazol-2-yl
carbamoyl)benzylEthyl 8.347 8.462 7.958
118 3-(1H-benzimidazol-2-ylcarbamoyl)benzyl
4-amino benzyl10.796 10.660 10.836
119 3-(1H-pyrazol-3-yl) benzyl 4-hydroxy benzyl 10.796 10.876 10.854120 3-(1H-pyrazol-3-yl) benzyl 4-methoxy benzyl 10.108 9.993 10.211
Fig. 1 (a) clustered pose of cyclic urea molecules from MRCD (b) clustered pose of non-cyclic urea molecules from MRCD
574 J Mol Model (2012) 18:569–582

reproducing the experimentally observed binding modefor HIV-1 protease inhibitor and the parameter set forthe Glide docking is reasonable to reproduce the X-raystructure.
The advantage of MRCD is clearly understood wheneach molecules dock pose was analyzed to confirm thepresence of required hydrogen bond interaction with theactive site amino acids namely with carboxylate of Asp25and amine of Ile50. In some receptor confirmation theinteractions were missing or inverse, in this manner theredundant poses of the molecules can be screened out andthe biologically active conformation of the ligand can beobtained. To obtain the most preferred biologically activeconformer of the ligand, a cluster analysis of the dock posesof each ligand was performed using clustering of con-former’s script. Pose from the most frequent cluster havinglowest binding energy was selected. This pose of eachmolecule were taken as the basis for the CoMFA andCoMSIA analysis, these conformation provide the mostvital information for the binding of ligand into the proteinactive site.
3D QSAR analysis was done by dividing the moleculesinto training and test set having 60 molecules each, keepingin view that the activity range is at least 5 log units differentin both the sets. The CoMFA and CoMSIA statisticalanalysis is summarized in Table 3. Statistical data showsrloo
2 0.598 for CoMFA and 0.674 for the CoMSIA models,respectively, which indicates a good internal predictiveability of both models. The models developed alsoexhibited r2 of 0.983 and 0.985 for CoMFA and CoMSIA,respectively. To test the predictive ability of the models, atest set of 60 molecules excluded from the model derivationwas used. The predictive correlation coefficient rpred
2 of
High resolution protein structures from PDB.
Grid generation and Multiple receptor
conformation docking of ligands
Dock poses analysis, removal of non
interactive poses
Clustering of dock poses using clustering of conformer’s script
Lowest binding energy conformation in most
frequent cluster
Generation of CoMFA and CoMSIA fields, PLS analysis, 3D QSAR Model generation
Cross validation of Model
Application of model on diverse molecules
Fig. 2 Schematic representation of the multiple receptor conformationdocking, clustering and 3D QSAR
Table 3 Summary of CoMFA and CoMSIA statistical analysis
Statistical parameters CoMFA CoMSIA
PLS result summary for modelderived from cyclic urea molecules
r2looa 0.598 0.674
Number of cyclic urea moleculesin training set
60 60
Number of cyclic urea moleculesin test set
60 60
Number of non-cyclic urea moleculesin test set for external validation
25 25
ONCb 8 10
SEEc 0.199 0.189
r2 d 0.983 0.985
Fratioe 153.166 311.772
r2predf 0.684 0.640
rpred2 on non-cyclic urea molecules 0.61 0.53
Fraction of field contributions
Steric 56.2 14.2
Electrostatic 43.8 28.8
Hydrophobic – 23.3
Acceptor – 18.6
Donor – 14.8
PLS result summary for model derivedfrom non cyclic urea molecules
r2looa 0.595 0.568
Number of non-cyclic urea moleculesin training set
25 25
Number of cyclic urea molecules intest set
60 60
ONCb 10 10
SEEc 0.048 0.076
r2 d 0.997 0.998
Fratioe 225.814 895.159
r2predf 0.42 0.41
Fraction of field contributions
Steric 57.8 14.9
Electrostatic 42.2 21.7
Hydrophobic – 17.7
Acceptor – 20.2
Donor – 25.5
a correlation coefficient from leave one out methodb optimum number of componentsc standard error of estimated conventional regression coefficiente Fisher test valuef predictive r2 on test set using equation (r2 =(SD-PRESS)/SD) where SDis the sum of the squared deviations between the biological activities of thetest molecules and the mean of training set. PRESS is the sum of thesquared deviation between the observed and the predicted activities of thetest set
J Mol Model (2012) 18:569–582 575

0.684 for CoMFA and 0.640 for CoMSIA models indicategood external predictive ability of the model. The experi-mental and predicted activity from CoMFA and CoMSIAmodel is given in Table 2.
Based on this information 25 non-cyclic urea mole-cules were taken as a test set to check the externalpredictive ability of these models on diverse set ofmolecules (structure are given in Fig. 3). This gaveremarkable outcome with rpred
2 of 0.61 and 0.53 forCoMFA and CoMSIA respectively. The results invariablyshow that this method is useful for performing 3D QSARanalysis on molecules having different structural motifs.The experimental and predicted activity is given inTable 4. Further, these diverse structures were used togenerate a QSAR model, that gave statistical data of rloo
2
0.595 for CoMFA and 0.568 for the CoMSIA modelsrespectively, gave an r2 of 0.997 and 0.998 for CoMFAand CoMSIA, respectively. The graph for the experi-mental and predicted pKi values for training set, test setand external data set of non-cyclic urea molecules areshown in Fig. 4. The 60 cyclic urea molecule of thetraining set was used to check the predictive ability ofthis model; it showed an acceptable but not veryenthusiastic result of 0.42 and 0.41 for CoMFA andCoMSIA respectively. The probable reason for this resultcould be the smaller training set of 25 non cyclic urea
molecules and larger test set of 60 cyclic urea molecules.By using the QSAR ANALYSIS LIST command theintercept for the PLS equations were obtained, thecommand does not provide the regression equation,hence a method followed by Wheelock and Nakagawaet al. [43] was used to obtain the QSAR equation wherethe intercept was used. The equations derived for theCoMFA and CoMSIA analysis is provided below (Eqs. 1,2, 3, 4) where n is number of molecules involved in themodel generation and r is the correlation coefficient for theequations obtained.
PLS derived from cyclic urea molecules
pKi ¼ CoMFA terms½ � þ 5:118 n ¼ 60; r ¼ 0:991 ð1ÞpKi ¼ CoMSIA terms½ � þ 6:214 n ¼ 60; r ¼ 0:992 ð2Þ
PLS derived from non-cyclic urea molecules
pKi ¼ CoMFA terms½ � þ 5:193 n ¼ 25; r ¼ 0:965 ð3ÞpKi ¼ CoMSIA terms½ � þ 6:192 n ¼ 25; r ¼ 0:936 ð4Þ
The contour generated from the above two QSARmodels for cyclic and non-cyclic urea molecules usingdocking and clustering as a prerequisite gave results thatinvariably reveal that this method is useful for performing 3DQSAR analysis onmolecules having different structural motifs.
Fig. 3 Structure of non-cyclic urea molecule
576 J Mol Model (2012) 18:569–582

The contour maps of CoMFA (electrostatic and steric)and CoMSIA (electrostatic, steric, hydrophobic, donor andacceptor) are represented by color codes. The contour mapsof CoMFA denote the region in the space where the alignedmolecules would favorably or unfavorably interact with thereceptor while the CoMSIA contour maps denote thoseareas within the specified region where the presence of agroup with a particular physicochemical activity binds tothe receptor. The CoMFA/CoMSIA results were graphicallyinterpreted by field contribution maps using the ‘STDEV *COEFF’ field type.
Steric and electrostatic contour maps
To visualize the information content of the derived 3DQSAR models, CoMFA contours maps were generated torationalize the regions of 3D space around the cyclic ureaand non-cyclic urea molecules, where changes in thesteric and electrostatic fields would influence the increaseor decrease in inhibitory activity. All of the contoursrepresented the default 80 and 20% level contributionsfor favored and disfavored regions, respectively. The
CoMFA steric and electrostatic contour maps are shownin Figs. 5 and 6 respectively.
The steric field is characterized by green and yellowcontours, in which green contours indicate the region wherebulkier group would be favorable, while the yellowrepresents region were bulkier group would decrease theactivity. The most potent cyclic urea analogue from theseries, compound 52 was embedded in the map (Fig. 5a),and compound NCU16 (Fig. 5b) was embedded for non-cyclic urea molecule, to demonstrate their affinity for thesteric regions of inhibitors. The steric contours for bothcyclic and non-cyclic urea molecules showed sameregions, having a large green contour at the R2 and R1
positions of the cyclic urea molecule suggesting anincrease in the bulkiness would increase the activity ofthe molecules, similar kind of contour was obtained fornon-cyclic urea molecule where the green contour wasenvisaged at the same position as in cyclic urea. Substitu-tion on the phenyl ring at R1 would decrease the activity incyclic urea molecules, a similar kind of contour wasobserved for non-cyclic urea where the yellow contours isobserved all over the molecule expect at R2 position
Table 4 Experimental and predicted pKi values of non-cyclic urea molecules
Mol. ExperimentalpKi
Predicted pKi CoMFAcyclic urea PLS
Predicted pKi CoMSIAcyclic urea PLS
Predicted pKi CoMFAnon cyclic urea PLS
Predicted pKi CoMSIAnon cyclic urea PLS
NCU 1 6 5.648 6.972 5.993 5.958
NCU 2 5.44 7.685 8.186 5.425 5.462
NCU 3 6.24 6.353 7.199 6.323 6.459
NCU 4 6.77 6.267 7.194 6.683 6.583
NCU 5 7.55 8.972 8.501 7.505 7.542
NCU 6 5.47 7.145 8.282 5.486 5.465
NCU 7 6.4 7.484 9.042 6.405 6.375
NCU 8 7.36 7.021 7.216 7.381 7.346
NCU 9 7.42 7.915 7.699 7.748 7.386
NCU 10 5.6 7.797 8.116 5.614 5.599
NCU 11 8.52 8.217 8.015 8.512 8.506
NCU 12 7.72 8.691 8.183 7.722 7.73
NCU 13 9.31 7.614 9.062 9.305 9.3
NCU 14 8.7 7.995 8.306 8.66 8.716
NCU 15 9.66 9.081 9.216 9.713 9.629
NCU 16 11.3 9.129 10.062 11.3 11.331
NCU 17 8.92 8.616 8.908 8.002 7.085
NCU 18 7.89 7.9 8.668 7.941 7.803
NCU 19 8.51 8.531 8.861 8.141 8.315
NCU 20 8.52 9.042 9.716 8.528 8.523
NCU 21 9 10.257 8.634 9.002 8.994
NCU 22 7.77 7.62 7.393 8.148 7.617
NCU 23 8 7.373 8.005 8.07 8.241
NCU 24 9.7 8.418 9.447 8.315 7.861
NCU 25 7.82 7.829 8.336 7.01 7.383
J Mol Model (2012) 18:569–582 577

Fig. 5 CoMFA steric standarddeviation (S.D.* coefficient)contour maps illustrating stericfeatures in combination withcompound (a) 52 and (b)NCU16. Green contours showfavorable bulky groupsubstitution at that point whileyellow regions showdisfavorable bulky group foractivity
Fig. 4 (a) and (b) Scatter plot of experimental vs predicted pKivalues for cyclic urea molecules using (PLS) derived from cyclic ureaset (test set is represented in triangles), (c) and (d) Scatter plot ofexperimental vs predicted pKi values for non-cyclic urea molecules
using (PLS) derived from cyclic urea set, (e) and (f) Scatter plot ofexperimental vs predicted pKi values for non-cyclic urea moleculesusing PLS derived from non-cyclic urea set
578 J Mol Model (2012) 18:569–582
showing that the two contours for cyclic and non-cyclicurea molecules are similar. This depicts that in cyclic ureamolecule substitution on the benzyl ring at R2 positionwill increase the activity, in non-cyclic urea moleculesincrease in bulkiness at R2 position for triazalinones, diazasulfoxide, substitution at 3rd and 7th position of coumarinmoiety and 5,6 position of pyranones will increase theenzyme inhibitory activity.
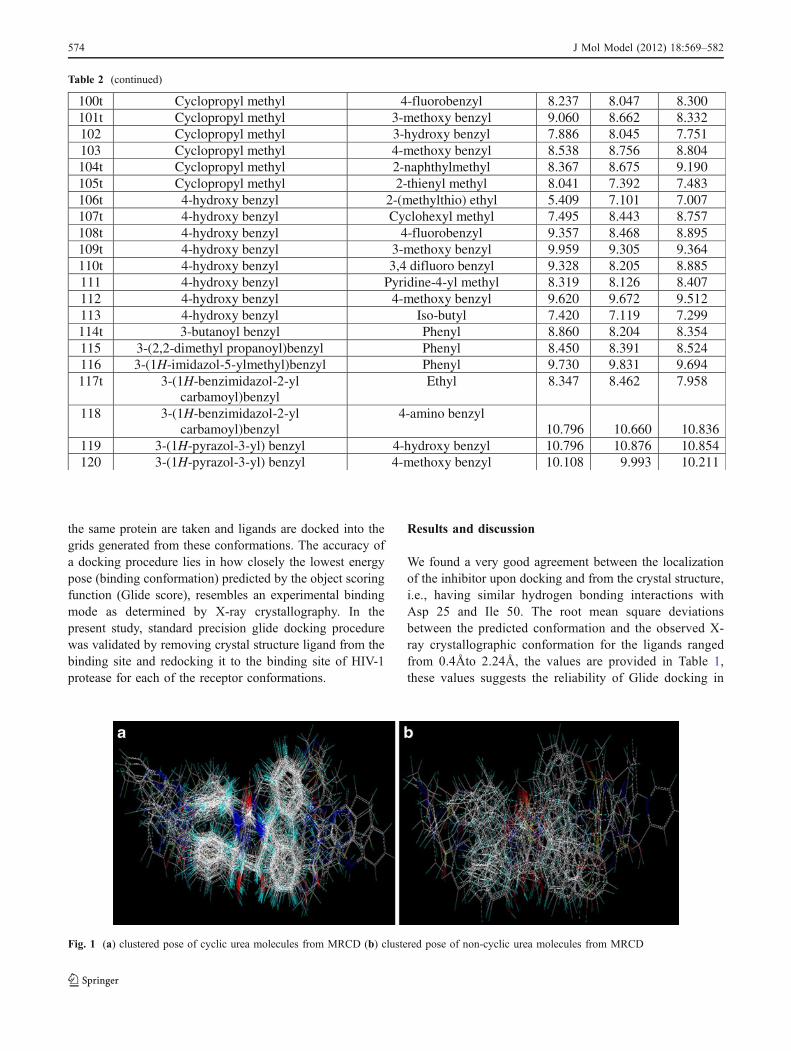
Figure 6a, b shows the CoMFA electrostatic contourmaps for cyclic urea and non-cyclic urea moleculesrespectively. The blue and red contours depict the positionswhere positively charged groups and negatively chargedgroups would be beneficial for inhibitory activity. In boththe contours a red region is seen near the carbonyl andhydroxyl groups of the cyclic urea scaffold and non-cyclicurea molecules, suggesting an electron withdrawing groupwill be preferred at this position.
The huge blue region around the two amino groupssuggests, electron donating group will be beneficial. Thered contour region around the side chain atoms of R1 nearerto the carbonyl group also suggests that an electro negativegroup will be a potential substituent. In non-cyclic ureamolecule there is a disparity in the contour’s suggesting aflip in the molecules toward the right where the contoursare more concentrated. This suggests that carbonyl groupand the hydroxyl group are the pivotal substituents for the
increase of inhibitory activity. The CoMSIA steric andelectrostatic field contour maps were almost similar to thecorresponding CoMFA contour maps
Hydrophobic contour maps
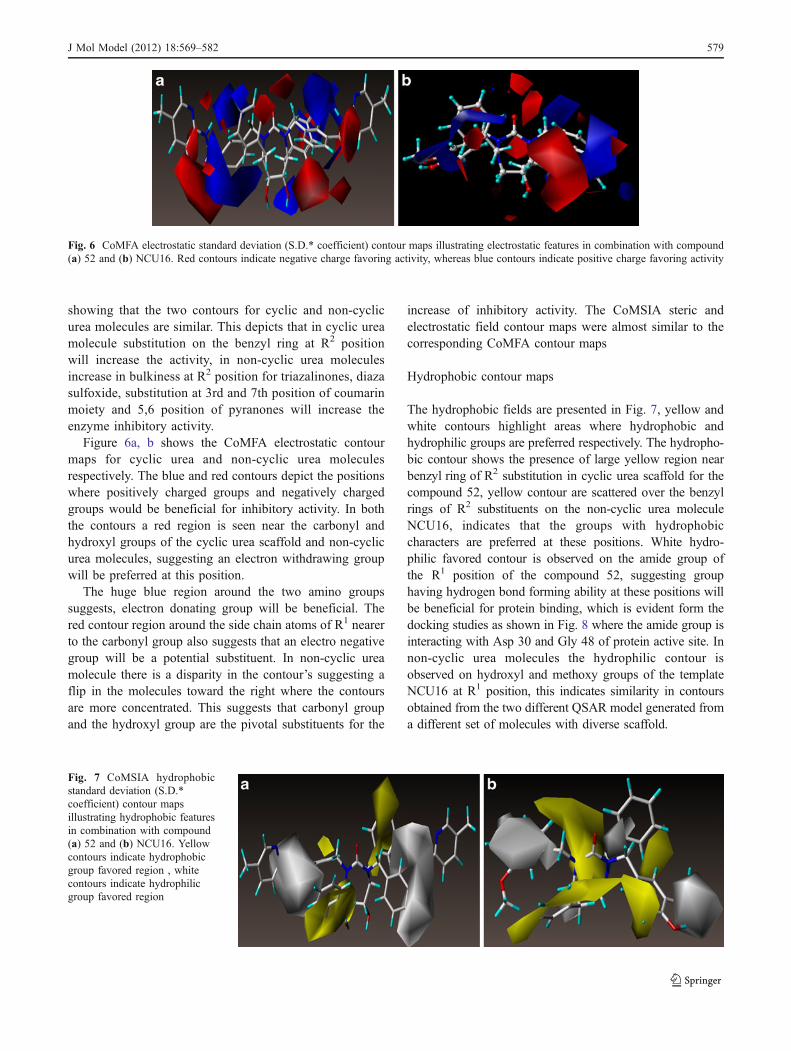
The hydrophobic fields are presented in Fig. 7, yellow andwhite contours highlight areas where hydrophobic andhydrophilic groups are preferred respectively. The hydropho-bic contour shows the presence of large yellow region nearbenzyl ring of R2 substitution in cyclic urea scaffold for thecompound 52, yellow contour are scattered over the benzylrings of R2 substituents on the non-cyclic urea moleculeNCU16, indicates that the groups with hydrophobiccharacters are preferred at these positions. White hydro-philic favored contour is observed on the amide group ofthe R1 position of the compound 52, suggesting grouphaving hydrogen bond forming ability at these positions willbe beneficial for protein binding, which is evident form thedocking studies as shown in Fig. 8 where the amide group isinteracting with Asp 30 and Gly 48 of protein active site. Innon-cyclic urea molecules the hydrophilic contour isobserved on hydroxyl and methoxy groups of the templateNCU16 at R1 position, this indicates similarity in contoursobtained from the two different QSAR model generated froma different set of molecules with diverse scaffold.
Fig. 6 CoMFA electrostatic standard deviation (S.D.* coefficient) contour maps illustrating electrostatic features in combination with compound(a) 52 and (b) NCU16. Red contours indicate negative charge favoring activity, whereas blue contours indicate positive charge favoring activity
Fig. 7 CoMSIA hydrophobicstandard deviation (S.D.*coefficient) contour mapsillustrating hydrophobic featuresin combination with compound(a) 52 and (b) NCU16. Yellowcontours indicate hydrophobicgroup favored region , whitecontours indicate hydrophilicgroup favored region
J Mol Model (2012) 18:569–582 579
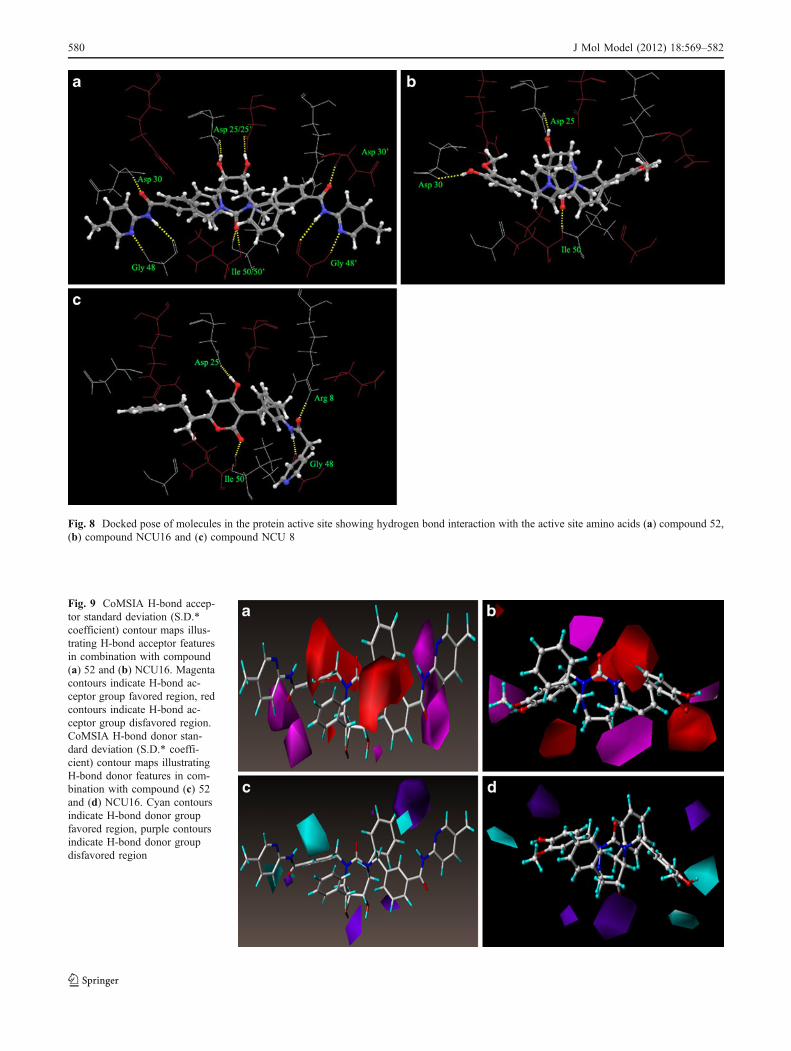
Fig. 8 Docked pose of molecules in the protein active site showing hydrogen bond interaction with the active site amino acids (a) compound 52,(b) compound NCU16 and (c) compound NCU 8
Fig. 9 CoMSIA H-bond accep-tor standard deviation (S.D.*coefficient) contour maps illus-trating H-bond acceptor featuresin combination with compound(a) 52 and (b) NCU16. Magentacontours indicate H-bond ac-ceptor group favored region, redcontours indicate H-bond ac-ceptor group disfavored region.CoMSIA H-bond donor stan-dard deviation (S.D.* coeffi-cient) contour maps illustratingH-bond donor features in com-bination with compound (c) 52and (d) NCU16. Cyan contoursindicate H-bond donor groupfavored region, purple contoursindicate H-bond donor groupdisfavored region
580 J Mol Model (2012) 18:569–582

Acceptor and donor contour maps
The hydrogen bond acceptor and donor field contour mapsof CoMSIA is shown in Fig. 9a-d using the same templatesof cyclic and non-cyclic urea. The magenta and redcontours represent favorable and unfavorable hydrogenbond acceptor groups respectively, cyan and purple con-tours represent favorable and disfavorable hydrogen bonddonor groups respectively.
The magenta contour near the carbonyl of the amidegroup on substituent at R1 position reveals that hydrogenbond acceptor group may increase the inhibitory activity.This is in agreement with the donor contour where a smallpurple region for hydrogen bond donor disfavored is seenat the same position. This is in accordance with thedocking results as shown in Fig. 8 where the carbonyl ofthe amide group on substituent at R1 position in compound52 shows hydrogen bond interaction with Asp 30 inprotein active site. There is a big acceptor disfavored redcontour near NH of amide group and surrounding thecarbonyl of the cyclic scaffold, this is similar to thehydrogen bond donor contour were a cyan contour is seenat the same region which is favored for hydrogen bonddonor groups. The NH group at this position shows ahydrogen bond interaction with Gly 48. Hydrogen bondacceptor and donor contours for non-cyclic urea obtainedare similar to the cyclic urea showing same contourregions. The contour map analysis indeed show that thederived 3D QSAR model from the two set of moleculeshaving diverse structural motifs which were aligned basedon multiple receptor conformation docking and clusteringas a prerequisite have consensus.
The present reported approach of multiple receptorconformation docking and clustering for obtaining receptorbased conformation of ligands for CoMFA and CoMSIAanalysis, is applicable for ligands having specific proteintargets with at least eight to ten experimental three dimen-sional structures, but not for the targets having less or none.For such cases a homology modeling can be performed anddifferent receptor conformations can be obtained for docking.
Conclusions
A new approach of multiple receptor conformation dockingand clustering was employed to obtain a flexible receptorbased alignment of molecules having diverse motifs, whichcould not be aligned based on common substructure that is aprerequisite for CoMFA and CoMSIA analysis. The statisticalresults and contours obtained invariably show that the methodemployed is having an adequate accuracy, and providesvaluable information for the structural requirements forimproving inhibitory activity of the molecules. This advanced
and novel approach is appropriate for receptor basedalignment for molecules having varied structural motifs,recommending an increase in accuracy of 3D QSARpredictions for considering diverse scaffolds while screeningand designing molecules for specific targets.
Acknowledgments We gratefully acknowledge support for thisresearch from Department of Science and Technology, New Delhi,India, University Grants Commission, New Delhi, India and Depart-ment of chemistry, Nizam College, Hyderabad, India. We are greatlythankful to Dr. G. N. Shastry, Scientist, Indian Institute of ChemicalTechnology for Sybyl 6.9 software and his useful suggestions. We alsoacknowledge Schrödinger Inc. for GLIDE software.
References
1. Gallo RC, Sarin PS, Gelmann EP, Robert-Guroff M, RichardsonE, Kalyanaraman VS, Mann D, Sidhu GD, Stahl RE, Zolla-PaznerS, Leibowitch J, Popovic M (1983) Isolation of human T-cellleukemia virus in acquired immune deficiency syndrome (AIDS).Science 220:865–867
2. Barré-Sinoussi F, Chermann JC, Rey F, Nugeyre MT, Chamaret S,Gruest J, Dauguet C, Axler-Blin C, Vézinet-Brun F, Rouzioux C,Rozenbaum W, Montagnier L (1983) Isolation of a T-lymphotropic retrovirus from a patient at risk for acquired immunedeficiency syndrome (AIDS). Science 220:868–871
3. Kohl NE, Emini EA, Schleif WA, Davis LJ, Heimbach JC, DixonRAF, Scolnick EM, Sigal IS (1988) Active human immunodefi-ciency virus protease is required for viral infectivity. Proc NatlAcad Sci USA 85:4686–4690
4. Tomasselli AG, Howe WJ, Sawyer TK, Wlodawer A, HeinriksonRL (1991) The complexities of AIDS: An assessment of the HIVprotease as a Therapeutic Target. Chim Oggi 9:6–27
5. Huff JR (1991) HIV Protease A Novel chemotherapeutic Targetfor AIDS. J Med Chem 34:2305–2314
6. Norbeck DW, Kempf DJ (1991) HIV Protease Inhibitors. AnnuRep Med Chem 26:141–160
7. Debouck C (1992) The HIV-1 protease as a therapeutic target forAIDS. AIDS Res Hum Retroviruses 8:153–164
8. Katz RA, Skalka AM (1994) The Retroviral Enzymes. Annu RevBiochem 63:133–173
9. Lam PYS, Jadhav PK, Eyermann CJ, Hodge CN, Ru Y, BachelerLT, Meek JL, Otto MJ, Rayner MM, Wong YN, Chang CH,Weber PC, Sharpe TR, Jackson DA, Erickson-Viitanen S (1994)Rational design of potent bioavailable, nonpeptide cyclic ureas asHIV protease inhibitors. Science 263:380–384
10. Cramer RD, Patterson DE, Bunce JD (1988) Comparativemolecular field analysis (CoMFA). 1. Effect of shape on bindingof steroids to carrier proteins. J Am Chem Soc 110:5959–5967
11. Klebe G, Abraham U, Mietzner T (1994) Molecular similarityindices in a comparative analysis (CoMSIA) of drug molecules tocorrelate and predict their biological activity. J Med Chem37:4130–4146
12. Kubinyi H, Folkers G, Martin YC (eds) (1998) 3D-QSAR in drugdesign, vol 2. Kluwer,Dordrecht, the Netherlands
13. Veerapandian P (ed) (1997) Structure-Based Drug Design.Dekker, New York
14. Cho SJ, Garsia MLS, Bier J, Tropsha A (1996) Structure-BasedAlignment and Comparative Molecular Field Analysis ofAcetylcholinesterase Inhibitors. J Med Chem 39:5064–5071
15. Sippl W, Contreras JM, Parrot I, Rival YM, Wermuth CG (2001)Structure-based 3D QSAR and design of novel acetylcholinesteraseinhibitors. J Comput-Aided Mol Des 15:395–410
J Mol Model (2012) 18:569–582 581

16. Sippl W (2000) Receptor-based 3D QSAR analysis of estrogenreceptor ligands –merging the accuracy of receptor-based alignmentswith the computational efficiency of ligand-based methods. JComput-Aided Mol Des 14:559–572
17. McGovern DL, Mosier PD, Roth BL, Westkaemper RBK (2010)CoMFA analyses of C-2 position Salvinorin A analogs at thekappa-opioid receptor provides insights into epimer selectivity. JMol Graph Model 28:612–625
18. Muddassar M, Pasha FA, Chung HW, Yoo KH, Oh CH, Cho SJ(2008) Receptor guided 3D-QSAR: a yseful approach fordesigning of IGF-1R inhibitors. J Biomed Biotechnol, vol. 2008,Article ID 837653. doi:10.1155/2008/837653
19. Jojart B, Marki A (2007) Receptor-based QSAR studies of non-peptide human oxytocin receptor antagonists. J Mol Graph Model25:711–720
20. Carlson HA, Masukawa KM, McCammon JA (1999) Method forincluding the dynamic fluctuations of a protein in computer-aideddrug design. J Phys Chem 103:10213–10219
21. Carlson HA, Masukawa KM, Rubins K, Bushman FD, JorgensenWL, Lins RD, Briggs JM, McCammon JA (2000) Developing adynamic pharmacophore model for HIV-1 integrase. J Med Chem43:2100–2114
22. Kanth SS, Vijjulatha M (2008) Tetrahydroxy cyclic urea-potentinhibitor for HIV-1 protease wild type and mutant type - acomputational design. E-J Chem 5:584–592
23. Sham HL, Zhao C, Stewart KD, Betebenner DA, Lin S, Park CH,Kong XP, Rosenbrook W Jr, Herrin T, Madigan D, Vasavanonda S,Lyons N, Molla A, Saldivar A, Marsh KC, McDonald E, WideburgNE, Denissen JF, Robins T, Kempf DJ, Plattner JJ, Norbeck DW(1996) A novel, picomolar inhibitor of human immunodeficiencyvirus type 1 protease. J Med Chem 39:392–397
24. Ala PJ, Huston EE, Klabe RM, Jadhav PK, Lam PY, Chang CH(1998) Counteracting HIV-1 protease drug resistance: structuralanalysis of mutant proteases complexed with XV638 and SD146,cyclic urea amides with broad specificities. Biochemistry37:15042–15049
25. Backbro K, Lowgren S, Osterlund K, Atepo J, Unge T, Hulten J,Bonham NM, Schaal W, Karlen A, Hallberg A (1997) Unexpectedbinding mode of a cyclic sulfamide HIV-1 protease inhibitor. JMed Chem 40:898–902
26. Huang PP, Randolph JT, Klein LL, Vasavanonda S, Dekhtyar T,Stoll VS, Kempf DJ (2004) Synthesis and antiviral activity of P1'arylsulfonamide azacyclic urea HIV protease inhibitors. BioorgMed Chem Lett 14:4075–4078
27. Jadhav PK, Ala P, Woerner FJ, Chang CH, Garber SS, Anton ED,Bacheler LT (1997) Cyclic urea amides: HIV-1 protease inhibitorswith low nanomolar potency against both wild type and proteaseinhibitor resistant mutants of HIV. J Med Chem 40:181–191
28. Lam PY, Ru Y, Jadhav PK, Aldrich PE, DeLucca GV, EyermannCJ, Chang CH, Emmett G, Holler ER, Daneker WF, Li L,Confalone PN, McHugh RJ, Han Q, Li R, Markwalder JA, SeitzSP, Sharpe TR, Bacheler LT, Rayner MM, Klabe RM, Shum L,Winslow DL, Kornhauser DM, Hodge CN (1996) Cyclic HIVprotease inhibitors: synthesis, conformational analysis, P2/P2'structure-activity relationship, and molecular recognition of cyclicureas. J Med Chem 39:3514–3525
29. Jadhav PK, Woerner FJ, Lam PY, Hodge CN, Eyermann CJ, ManHW, Daneker WF, Bacheler LT, Rayner MM, Meek JL, Erickson-Viitanen S, Jackson DA, Calabrese JC, Schadt M, Chang CH(1998) Nonpeptide cyclic cyanoguanidines as HIV-1 proteaseinhibitors: synthesis, structure-activity relationships, and X-raycrystal structure studies. J Med Chem 41:1446–1455
30. Hodge CN, Aldrich PE, Bacheler LT, Chang CH, Eyermann CJ,Garber S, Grubb M, Jackson DA, Jadhav PK, Korant B, Lam PY,Maurin MB, Meek JL, Otto MJ, Rayner MM, Reid C, Sharpe TR,Shum L, Winslow DL, Erickson-Viitanen S (1996) Improvedcyclic urea inhibitors of the HIV-1 protease: synthesis, potency,resistance profile, human pharmacokinetics and X-ray crystalstructure of DMP 450. Chem Biol 3:301–314
31. Schaal W, Karlsson A, Ahlsen G, Lindberg J, Andersson HO,Danielson UH, Classon B, Unge T, Samuelsson B, Hulten J,Hallberg A, Karlen A (2001) Synthesis and comparative molec-ular field analysis (CoMFA) of symmetric and nonsymmetriccyclic sulfamide HIV-1 protease inhibitors. J Med Chem 44:155–169
32. Yamazaki T, Hinck AP, Wang YX, Nicholson LK, Torchia DA,Wingfield P, Stahl SJ, Kaufman JD, Chang CH, Domaille PJ, LamPY (1996) Three-dimensional solution structure of the HIV-1protease complexed with DMP323, a novel cyclic urea-typeinhibitor, determined by nuclear magnetic resonance spectroscopy.Protein Sci 5:495–506
33. Schrödinger LLC (2005) Glide, Version 4.0. New York, NY34. Friesner RA, Banks JL, Murphy RB, Halgren TA, Klicic JJ,
Mainz DT, Repasky MP, Knoll EH, Shelley M, Perry JK, ShawED, Francis P, Shenkin PS (2004) Glide: a new approach forrapid, accurate docking and scoring. 1. method and assessment ofdocking accuracy. J Med Chem 47:1739–1749
35. Nugiel DA, Jacobs K, Worley T, Patel M, Kaltenbach RF III, MeyerDT, Jadhav PK, de Lucca GV, Smyser TE, Klabe RM, Bacheler LT,Rayner MM, Seitz SP (1996) Preparation and structure-activityrelationship of novel P1/P1‘-substituted cyclic urea-based humanimmunodeficiency virus type-1 protease inhibitors. J Med Chem39:2156–2169
36. Patel M, Kaltenbach RF III, Nugie DA, Mchugh RJ Jr, JadhavPK, Bacheler LT, Cordova BC, Klabe RM, Erickson-Viitanen S,Garber SS, Ried C, Sitz SP (1998) The synthesis of symmetircaland unsymmetrical P1/P1’ Cyclic ureas as HIV protease inhibitors.Bioorg Med Chem Lett 8:1077–1082
37. Patel M, Bacheler LT, Rayner MM, Cordova BC, Klabe RM,Erickson Viitanen S, Sitz SP (1998) The synthesis and evaluationof cyclic ureas as HIV protease inhibitors: modification of the P1/P1’ groups. Bioorg Med Chem Lett 8:823–828
38. Rodgers JD, Johnson BL, Wang H, Erickson-Viitanen S, KlabeRM, Bacheler LT, Cordova BC, Chang CH (1998) Potent cyclicurea HIV protease inhibitors with 3-aminoindazole P2/P2’groups.Bioorg Med Chem Lett 8:715–720
39. Ax A, Schaal W, Vrang L, Samuelsson B, Hallberg A, KarlénA (2005) Cyclic sulfamide HIV-1 protease inhibitors, withsidechains spanning from P2/P2′ to P1/P1′. Bioorg Med Chem13:755–764
40. Hultén J, Andersson HO, Schaal W, Danielson HU, Classon B,Kvarnström I, Karlén A, Unge T, Samuelsson B, Hallberg A(1999) Inhibitors of the C2-symmetric HIV-1 protease: nonsym-metric binding of a symmetric cyclic sulfamide with ketoximegroups in the P2/P2‘ side chains. J Med Chem 42:4054–4061
41. Sybyl version 6.9 (1999) Tripos Associates, St. Louis (MO)42. Gasteiger J, Marsili M (1980) Iterative partial equalization of
orbital electronegativity – a rapid access to atomic charges.Tetrahedron 36:3219–3228
43. Wheelock CE, Nakagawa Y, Harada T, Oikawa N, Akamatsu M,Smagghe G, Stefanou D, Iatrou K, Swevers L (2006) High-throughput screening of ecdysone agonists using a reporter geneassay followed by 3-D QSAR analysis of the molting hormonalactivity. Bioorg Med Chem 14:1143–1159
582 J Mol Model (2012) 18:569–582