
RESONANCE CONDITIONS IN N°.l DOCK OF LUANDA ...
32
Chapter 48 RESONANCE CONDITIONS IN N°.l DOCK OF LUANDA HARBOUR Fernando Manzanares Abecasis Research Engineer, Head, Hydraulics Department Laboratories Nacional de Engenharia Civil, Lisboa, Portugal 1. OBJECT OF THE PAPER About 900 m of berth length arranged around a single pier are at present available in the port of Luanda. Due to the constant increase of traffic through the port, the "Brigada de Estudos do Porto de Luanda" (Brigade of Stud ies of the Luanda Harbour) decided to prepare a general plan of extension of the port facilities. The extension planned comprises the construction of a new pier, which together with the exist- ing one will delimit a triangular dock - dock n°-.l —, and of a se ries of rectangular basins between the new dock and the area of S.Pedro da Barra fortress (fig.l). The danger of possible resonance phenomena and the fact that this problem can be dealt with before construction begins, led the Brigade to undertake a detailed analysis of it before tak ing decisions on the extension works of the port. This analysis comprised three stages: a) Observation in nature of long-period waves in Luanda bay. b) Analytic study of the behaviour of the planned docks under the action of possible long-period waves . c) Experimental study in model of the same phenomenon. The author, as consulting engineer of the Brigade of Stud ies, programmed observations a) and analysed their results,per- formed the analytic study b) [l] , [2] , [3] and, as head of the Hydraulic Department of Laboratorio Nacional de Engenharia Ci vil, planned, supervised and interpreted the model studies (!'. These concerned dock n2 1 alone because, on one hand, this is the structure whose construction will begin first and, on t h e 1) - These model tests were directed by Mr. «J. Pires Castanho 800
-
Upload
khangminh22 -
Category
Documents
-
view
0 -
download
0
Transcript of RESONANCE CONDITIONS IN N°.l DOCK OF LUANDA ...

Chapter 48
RESONANCE CONDITIONS IN N°.l
DOCK OF LUANDA HARBOUR
Fernando Manzanares Abecasis Research Engineer, Head, Hydraulics Department
Laboratories Nacional de Engenharia Civil, Lisboa, Portugal
1. OBJECT OF THE PAPER
About 900 m of berth length arranged around a single pier are at present available in the port of Luanda.
Due to the constant increase of traffic through the port, the "Brigada de Estudos do Porto de Luanda" (Brigade of Stud ies of the Luanda Harbour) decided to prepare a general plan of extension of the port facilities. The extension planned comprises the construction of a new pier, which together with the exist- ing one will delimit a triangular dock - dock n°-.l —, and of a se ries of rectangular basins between the new dock and the area of S.Pedro da Barra fortress (fig.l).
The danger of possible resonance phenomena and the fact that this problem can be dealt with before construction begins, led the Brigade to undertake a detailed analysis of it before tak ing decisions on the extension works of the port. This analysis comprised three stages:
a) Observation in nature of long-period waves in Luanda bay.
b) Analytic study of the behaviour of the planned docks under the action of possible long-period waves .
c) Experimental study in model of the same phenomenon.
The author, as consulting engineer of the Brigade of Stud ies, programmed observations a) and analysed their results,per- formed the analytic study b) [l] , [2] , [3] and, as head of the Hydraulic Department of Laboratorio Nacional de Engenharia Ci vil, planned, supervised and interpreted the model studies (!'. These concerned dock n2 1 alone because, on one hand, this is the structure whose construction will begin first and, on t h e
1) - These model tests were directed by Mr. «J. Pires Castanho
800

RESONANCE CONDITIONS 801
r&\
i
v\v\
^._
« o m «
< a < J
O
i->
§ S •8 a - o a 3
o
< J fit Q Z
ft

802 COASTAL ENGINEERING
other, due to its shape, the conclusions of the analytic study- about this dock are to be viewed with great reservations.
In the present paper the author presents the results of the studies in reference on dock n°- 1, seeking in special to com pare the results of the analytic study and of the model tests , stressing agreements and differences, trying to explain the lat ter and drawing conclusions applicable in practical cases.
2 - OBSERVATIONS IN NATURE
2.1 - Observations carried out in 1958 - Ouick rotation tide recorders were installed after 1959 > so that their records were not available for the first analytic studies. This lack was made good by means of a standard rotation tide recorder instal led in the pier of Departamento Maritimo (fig. 2). The supplied data concern the period between 4th December 1957 and 1st Jan uary 1959-
These tide records, to a scale of time of 1 mm-2 min and of heights of 1:20, were analysed by direct observation methods as follows: whenever a certain regularity was observed in the distances between peaks of recorded curves, the time during which this regularity lasted was determined and by dividing this time by the number of intervals between peaks, the wave pe- riod was obtained. The amplitude was not taken into account as it remained fairly uniform between 6 and 9 cm. The last figure was rarely exceeded, the maximum recorded value being about 20 cm.
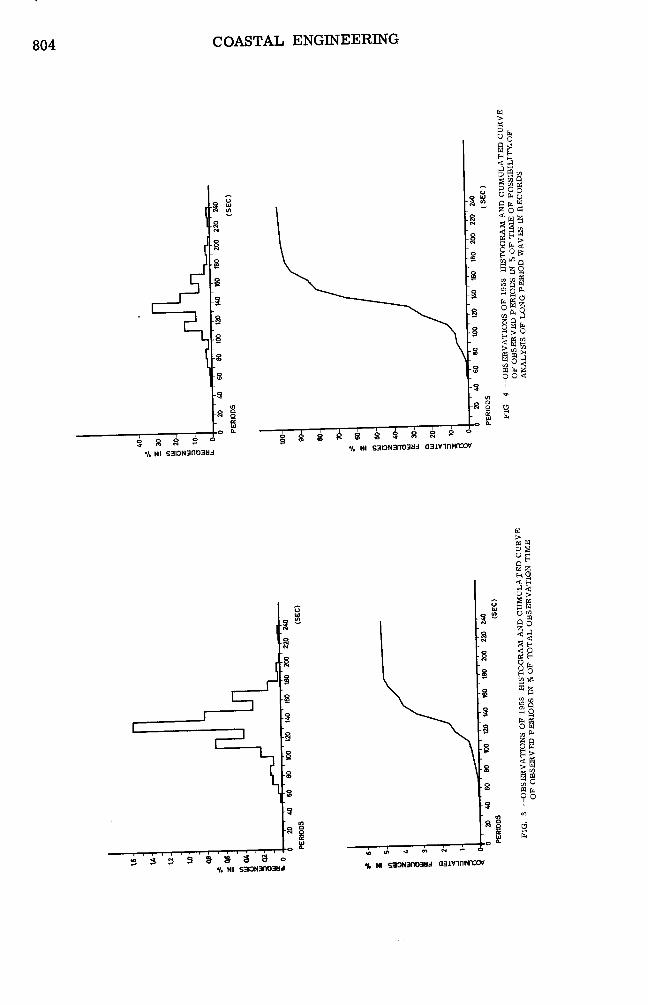
The results of this analysis are indicated in Table 1 which lists the times during which the waves, classified according to their periods in classes of 10 s, were observed; the cumulated times during which waves with periods inside a certain interval were observed are then determined. Then the percentages of durations in each class and of cumulated durations are calculat ed, both for the total time of observation (565 920 minutes ) and the time during which regular long-period waves lasted ( 28 82+2+ minutes) .These data enable two histograms and two cumu- lated frequency curves to be plotted for the two total dura - tions indicated above (fig. 3 and 2+) .
According to the histograms, the long-period waves most frequent in Luanda harbour range from 130 to 12+0 seconds ( 30 per cent of the recorded values), followed by those between 12+0 and 150 seconds and between 110 and 120 seconds. The first cu

RESONANCE CONDITIONS 803
03 « Q K O U GJ K
I
Q H fe O
|
<
O
804 COASTAL ENGINEERING
•/. Ni saiONanoaad
S S S § •i. NI saiDNarroaad aaivinwrow
n
,1111111—I 1 r-
3 8 8 3 3° •I. NI S3l0N3nO3Ud
a a
P & > § «
< 2
P n
rS 2 o
•8 to & - £ Q 8 o a
•8
-8 So ffl ps,
• OO •3 '
w> co
•as d
% M saoNanoaoj aannnwiocw

RESONANCE CONDITIONS 805
TABLE 1
10-sec period ranges
Obser - vation times (min)
Cumu- lated times (min)
Percentage with respect to
Percentage of cumulated times with respect to
28 844m 565 920m 28 844m 565 920m
41 to 50 s 51 to 60 s 76 76 0.26 0.013 0.26 0.013 61 to 70 s I64 240 0.57 0.028 0.83 0.041 71 to 80 s 660 900 2.29 0.116 3.12 0.157 81 to 90 s 692 1592 2.40 0.122 5.52 0.279 91 to 100 s 418 2 010 1.45 0.073 6.97 0.352
101 to 110 s 1 282 3 292 4.44 0.226 11.41 0.578 111 to 120 s 3 946 7 238 13.68 0.697 25.09 1.275 121 to 130 s 2 262 9 500 7-84 0.399 32.93 1.674 131 to 140 s 8 934 18 434 30.97 1.578 63.90 3.252 141 to 150 s 4 588 23 022 15.90 0.810 79-80 4.062 151 to 160 s 1 650 24 672 5.72 0.291 85-50 4-353 161 to 170 s 2 756 27 428 9-55 0.486 95-07 4.839 171 to 180 s 802 28 230 2.78 0.141 97-85 4-980 181 to 190 s 198 28 428 0.69 0.034 98.54 5.014 191 to 200 s 278 28 706 O.96 0.049 99.50 5.063 201 to 210 s 28 28 734 0.10 0.004 99.60 5.067 211 to 220 s - 28 734 - - 99-60 5-067 221 to 230 s 42 28 776 0.16 0.007 99-76 5-074 231 to 240 s 68 28 844 0.24 0.012 100.00 5.086

806 COASTAL ENGINEERING
mulated frequency curve shows that 90 per cent of the observ ed periods are concentrated in the interval 100-170 sec.
It should be noted however that:
a) It is very likely, from the general look of the tide re cords, that waves of long period in Luanda bay have been more frequent than the preceding results seem to show but, due to the scale of the records and the apparenthy irregular distribu- tion of peaks, their presence could not be analysed.
b) As said, the amplitude of the oscillations recorded by the tide-recorders do not exceed a few centimeters, as a rule , but in three exceptional cases amplitudes of 15-20 cm (with pe- riods of 130-I60sec) were recorded. It is noteworthy that long - -period waves with periods of the same order of magnitude were observed on the same occasions at Lobito, 1+00 km to the south, and also that the external regular normal-period waves of the swell type had a small amplitude (0.2+0 to 0.60 m).
2.2 - The observations of i960 - Two quick-rotation tide recorders installed in Luanda bay were observed during several months: one in the cabotage quay (to be called hereafter "cabo- tage-tide recorder") and another in the eastern portion of the pier (to be called "pier tide recorder"). A standard rotation tide recorder was installed in the coal wharf (f ig.2) . The location of the two quick rotation tide recorders was chosen bearing in mind two basic requirements: first to avoid disturbances due to waves generated by local winds or by the frequent passage of ships nearly; second to avoid sites likely to lie in nodal zones of pos - sible long-period stationary oscillating systems which,in that case, would not be recorded.
The results obtained show that the position of the "cabo tage tide-recorder" was not very favourable as regards the for mer requirement which rendered more difficult the analysis of the records; on the other hand the location of the pier tide - -recorder proved excellent in this connexion.
The pier tide-recorder started operating on the 19th March I960, the cabotage tide recorder on the 5th April i960 and the coal wharf tide recorder on the 31st December 1959 • The tide records used in the study concern a period of time from the dates above up to 28th June i960.
Experience showed that due to the time scale chosen, the
RESONANCE CONDITIONS 807
coal wharf tide records were not worthwhile using as they could yield reliable data on the amplitudes alone.
The other two tide records were on the contrary excel lent: the scale of time was 1 mm - 17.15 seconds and of height 1.5. Yet, due no doubt to the preceding reasons,the values of the pier tide recorder were much clearer than those of the ca botage tide-recorder (fig . 5) , and so they alone were used in the analysis of long-period waves in the harbour.
The cabotage tide-records were used merely for compar ison of periods and amplitudes notably in the case of marked os dilations in the pier tide-records. The results obtained in the coal wharf served only for comparison of amplitudes.
2.3 - Analysis of the tide records - As precedingly ex- plained, long -period waves in Luanda bay and tneir frequency were studied on basis of the values of the piti .ride-record a- lone, between 19th March and 28th June I960, i.e. about 100 days .
The records were carefully analysed all the time save for some short periods in which this proved impo^s'^ole due to gaps or superpositions in the records.
The indicated period was deemed sufficiently significant as neither trends for concentration of long-period waves in cer tain epochs nor deviations of the results of the analysis with re- spect to the results of 2.1 were observed.
The records were studied according to the rules indicat- ed above.
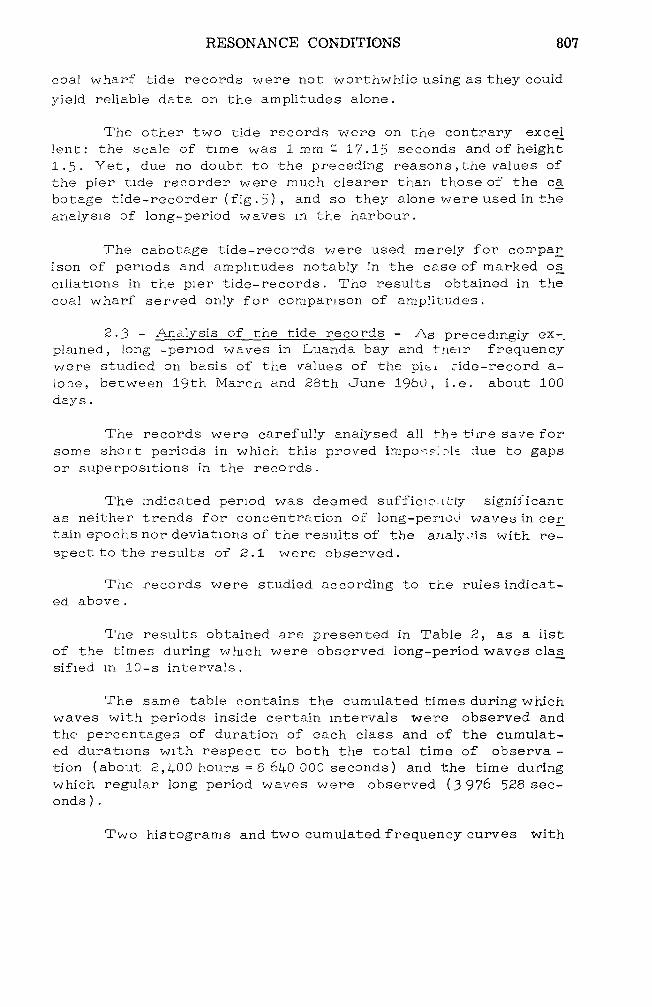
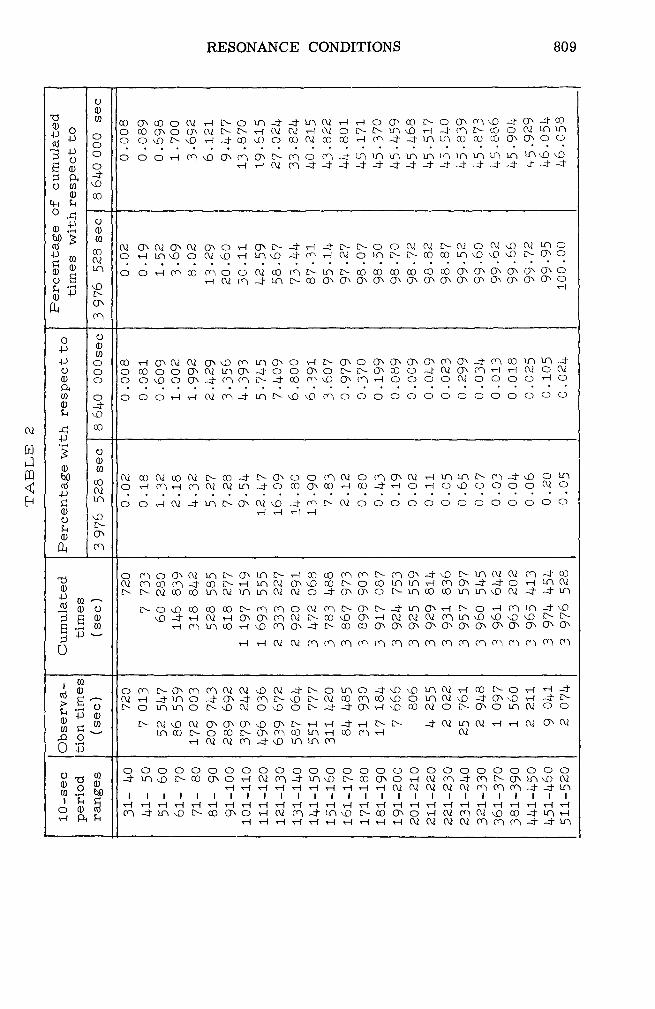
The results obtained are presented in Table 2, as a list of the times during which were observed long-period waves clas_ sif led in 10-s intervals .
The same table contains the cumulated times during which waves with periods inside certain intervals were observed and the percentages of duration of each class and of the cumulat- ed durations with respect to both the total time of observa - tion (about 2,400 hours = 8 62+0 000 seconds) and the time during which regular long period waves were observed (3 976 528 sec- onds ) .
Two histograms and two cumulated frequency curves with

808 COASTAL ENGINEERING
a « o
w Q
§
o «
p
< to o to O
g «
J P, S ?!
a fa
RESONANCE CONDITIONS 809
"0
o 0 co CO ON 03 O 02 i-l !N 0 in 4- 4- m 02 r-\ H O O CO IN O ON rn vO 4- ON 4" CO
O CO ON O ON 02 EN !N vH 02 02 •H 02 O IN IN in \£> •H 4- rn IN CO O 02 m in o o O O \Q CN \£> T-I 4- CO ^0 O CO 02 CO CO H m 4- 4- in m co ro co ON ON 0 0
3 £ S 0
o o o o T-\ m vo 0 rn O CN rn 0 m 4- in m m in m m m m m m m ^£> yQ o vH -H 02 rn 4- 4- 4- 4- 4- 4- 4- 4- 4-4-4-4-4- 4 4-4-
3 ft 4- o w v£)
0 00
e o
f it
h r
O 0
^ co (\2 O W (^ W ON 0 TH O IN 4- •H 4" EN !N O 0 02 02 CN 02 O 02 vD 02 m 0
« S OD O H lA* O N ^0 H irno 4 m TH 02 0 m IN IN CO CO m v£> v£i \D IN ON 0
o S LO o o -H m co cn 0 0 02 co m £N in CN CO CO CO CO CO CO ON ON ON ON ON ON 0
•H 02 cn 4- in CN co O O 0 0 O O ON ON ON ON ON ON ON ON 0
0 "^ ^D •H t>-
Oj cn
o -p •p
o 0 co o CO H CT>M W 0^\D m m 0 0 •H IN O 0 0 ON O ON cn ON 4- rn co in m 4-
o o O CO O O 0 02 m 0 4- 0 0 O O IN !N 0> co 0 4- 02 ON rn TH vH 02 0 02 0 ft (0
o O O vO O ON 4" cn cn CN 4- co m NO ON m w 0 0 O 0 02 0 0 0 0 <H 0
o O O O -H -H 02 m 4- in IN vo vO m 0 0 0 0 0 O 00000 000 0 4- Pi v£>
X! CO
-P
1 O 0
0 CO M
CO 02 CO 02 CO w r- CO 4" £N O O 0 m 02 0 rn O 02 H mmiNcn4-^o 0 in
-p o TW m VH m 02 02 in 4- 0 co ON CO -H CO 4- •H O •H O \0 0 0 0 0 02 0
LTi o o w N 4 m IN OOJvfl 4 m IN 02 0 0 O O O 00000 0 0 0 0 o
0
EN
v-J v-i vH •H
O
0, rn
0
,5 0 O
o m o ON 02 in IN ON m IN -H CO co rn cn CN rn ON 4- v£) CN m 02 02 m 4- co 02 cn co CM 4- co CN H in W (T>vO CO IN 0 co m m •H m ON 4- 4- 0 ^ m 02 !> EN 02 CO co m 02 m in 02 02 0 4- 0^ o> 0 CN m CO co m m \0 02 4- -4- m
r- 0 \£> co 00 co IN- m m 0 02 m IN 0^ CN 4- m 0^ •H CN 0 1-1 cn m 4- ^0 pi g 0 p £ M § -P~ 0
\D4HN rH ON ON m 02 EN CO vO 0 r-t 02 02 02 rn in \D \D \0 ^0 CN CN •H cn in co •H v£) cn 0 4- CN CO CO 0 O ON ON ON ON ON ON ON ON ON ON
r) d W W m m rn m rn <x^ m m rn rn m m m m m rn
tim
es
ec)
0 cn EN o> cn rn 02 02 N£> 02 4" EN 0 m O 4vO\0 m 02 vH CO CN 0 iH <H 4- w H 4- m 0 4- 0 4" m CN vD £N 02 CO m co KO 0 m W vO 4 ON\D •H 4- IN IN 0 m m 0 CN NO W Oil) 0 CN 4- 4- O -H vO CO 02 0 CN ON 0 m 02 O O
v rn 0) PI !t
.£> O 0 +3
IN 02 vO 02 O ON ON s0 O EN •H TH 4- H £N CN 4- N in W rl H 02 ON 02 in co CN 0 CO IN ON rn co in •H CO m TH 02
T-I 02 02 rn 4- vd m m m
O T-J CO
® O ® ra .2 M
000000 0 0000 0 0 0 0 0 0 0 0 00000 OOO 4" in v£> !N CO O 0 •H 02 m 4- invo N CO o> O vH 02 m 4- m CN ON m vo 02
1 1 1 1 1 1 •H •H H TH vH
1 1 1 1 •H
1 1 1 1 1 02 02
1 1 02 02 02 m m m
1 1 1 1 1 4- 4- m
1 1 1 1 U P!
o 0 nj •H ft JH
r-i -H vH TH H -H H iH r-f TH H r-t TH lH r-f T-\ •H >H •H rl H H rl H •H TH I-I
m 4- in ^o EN co ON 0 TH 02 rn 4" m vo !>- CO ON O •H 02 CO 02 vO CO 4- m -H TH -H H TH <H rH iH •H rH iH 02 02 02 02 rn m rn 4- 4- m

810 COASTAL ENGINEERING
respect to the above-mentioned total durations were plotted on basis of these data (figs.6 to 9)-The curve of observed values in 1958 (see 2.1) was superposed to the last cumulated curve.
A comparison of the records of the two rapid rotation tide recorders shows that:
a) As said, the pier tide records are much smoother and clearer than the cabotage tide records; the location of the for- mer recorder seems excellent.
b) The wave-periods recorded in both instruments are ap_ proximately the same, although occasionally somewhat imprecise in the cabotage tide-recorder.
c) When absent in one tide-recorder,long-period waves are also absent in the other.
d) As a rule, amplitudes are larger in the pier tide-re- corder. Thus, for instance, amplitudes were maximum (0.60m) in the pier tide-recorder on the 19th June I960 , whereas they did not exceed 0,35m in the cabotage tide-recorder that same day. The simultaneous maximum amplitude value in the coal wharf tide-recorder was O.lfOm. These facts show that amplitudes in crease in the area of the pier tide-recorder. At first sight this could apparently be ascribed to resonance but a careful analysis of the phenomenon shows it to be due to a mere concentration of ene rgy in the funnel-shaped zone where the pier tide-record er was installed, as selectivity for certain periods is not observ ed.
A comparison of the values observed in 1958 and in I960 shows that:
a) Long-period waves in Luanda bay are much more fre- quent than the analysis of the 1958 records would indicate.
Thus, whereas long-period waves could be clearly detected in the former in no more than 5% of the total observation time due to the scales used, these same waves were observed during about 14.6$ of the time in the i960 records.
b) A remarkable agreement is observed between the re - suits of 1958 and I960, in spite of a slight deviation towards the shortest periods . The most frequent periods ranged from 120 to 130 seconds (from 130 to 11+0 seconds in the 1958 results) , fo_l

RESONANCE CONDITIONS 811
J
XL —I—I—!—l—I ' I—I—i—i—I—i—[—i—F=^—i—i—F=
80 200 20 A0 60 80 300 20 40 60 40 60 eo JQO 20 *" 6"
PERIODS 400 20 40 60 80 500 20 40
(SEC)
FIG 6 --OBSERVATIONS OF I960 HISTOGRAM OF OBSERVED PERIODS IN % OF TOTAL OBSERVED TIME
200 20 40 60 300 20 40 60 80 400 20 40 60 80 500 40 60 80 I0Q 20 40 60 80
PERIODS
FIG 7 --OBSERVATIONS OF I960 CUMULATED CURVE OF OBSERVED PERIODS IN % OF TOTAL OBSERVATION TIME
(SEC)

812 COASTAL ENGINEERING
(V
40 60 «0 ^ 20 40 ' 60 ' 80 V00 *> ' « ' 60 ' 80 '3^' 20 ' 40 ' (JT 80 ' ^ 20 i'^O ' M ' 500' 20 '
( SEC )
FIG 8. --OBSERVATIONS OF 1960 HISTOGRAM OF OBSERVED PERIODS IN % OF TIME OF POSSIBILITY OF ANALYSIS OF LONG PERIOD WAVES IN RECORDS
0 20
PERIODS
I 1 1 1 1 1 1 1 i- 1 I 1 1 I 1 I 1 1
40 60 80 JQQ 20 40 60 80 200 20 *° 60 80 300 20 40 60 80 400 20 40 60 eo 500 20
FIG. 9 --OBSERVATIONS OF I960- CUMULATED CURVE OF OBSERVED PERIODS IN % OF TIME OF POSSIBILITY OF ANALYSIS OF LONG TERIOD WAVES IN RECORDS
(SEC
FIG 10. --SOLUTIONS O and I

RESONANCE CONDITIONS 813
lowed by those between 130 and 140 seconds and between 140 and 150 seconds. According to the cumulated frequency curve,90$ of the periods (between the 5% and the 95$ ordinates) range from 74 to 160 seconds.
3 - ANALYTIC PREDICTIONS
3.1 - Solution 0 - As indicated above ^although analytic stud ies were performed for all the docks, the results presented con cern n°- 1 dock alone, because on one hand only this one was test ed in model so far and, on the other, the remaining docks being rectangular, no difficulties arose in connexion with the analytic calculation of their natural periods of oscillation.
The solution proposed by "Brigada de Estudos do Porto de Luanda", for n2 1 dock, presented in fig.10, will be called solu- tion 0. When the analytic study presented below was carried out^ only the 1958 observations in nature were available .
Given the irregular shape of the dock, an accurate analyt- ic study of its resonant conditions was not feasible. Neverthe- less, the dock could be roughly assimilated to a constant-depth solid, sector-shaped in plan. The natural period of oscillation of basins with this shape is given by the expression (see [2+] , [5] ) :
T= 2TC
VgK th Kh
where h is the depth of the basin and K is a coefficient depend ing on the shape of the basin that can be obtained as follows.
Let us denote by 9 the angle at the center of the sector and by R its radius.
Let us consider
n= *
The values of the coefficient K in the expression above are the results of the division by R of the roots of the derivatives of the Bessel functions of 0, n, 2n, 3n, ... order.

814 COASTAL ENGINEERING
In the present case , 0 = —=— , R = 920 m and h = 11, 5
Consequently
Tl = 5
and the roots of the derivatives of Bessel functions <J , J_ , <J„ ... o 5 10
equal to KR were the unknowns from which the values of K could be obtained.
The zeroes of functions O"1 (x) are: o
x1 = 3.8317
x2 = 7-0156
x3 =10.1735
x, =13.3237
xr =16.1+706 5
Those of function <J' (x) are: 5
xj_ = 6.i+15
x2 =10.520
x3 =13-985
x, =17.310
For lack of tabulated values, only the order of magnitude of the zeroes of <J' (x) could be determined
x, =12 1
x2 =16.5
The bottom of the dock lying at a depth (-10.5m) and the maximum range of the tide being about 1.5m, the study was performed for a constant depth of 11.5m, roughly corre- sponding to the mean level depth.

RESONANCE CONDITIONS 815
The values of K corresponding to the zeroes of «J' (x) are:
K1 = 0 .001+120
K2 = 0 .007544
S = 0 .010939
\ = 0 .014327
K = 0.017710
The corresponding periods of resonance are:
T = H4/3 seconds 1 -^
Tg = 79
T3 = 54
T, = 41 " 4
Tc = 34
To the values of x = KR of about 13 there correspond periods of resonance of about 40 seconds, of no interest in the case in reference, and so only the roots x and x of «J' (x)
12 5 were taken into account. The corresponding natural periods of oscillation are:
T = 86 seconds 1 —
T = 47 seconds
The fundamental period of oscillation of the basin(143 sec onds) falls within a range of periods somewhat frequent in Luan da bay, so that the dimensions of the basin were considered un suitable.
3.2- Solution I - In order to prepare recomendations on how to change the characteristics of the dock,the following data were considered according to the directions of "Brigada de Es- tudos do Porto de Luanda":
- The bottom of the dock should remain at a depth of (-10.5) ;

816 COASTAL ENGINEERING
- the location of the end quay should remain unchanged al though its length could be altered;
- even if displaced, the western quay in the second pier should remain perpendicular to the above mentioned end quay;
- it was desirable that neither the length of the end quay (500 m) nor the free width of the entrance to the dock were diminished.
Thus the only possible change was an eastward displace - ment of the second pier, which amounted to maintaining the an- gle at the center (and therefore n) increasing the radius of the sector and consequently the fundamental period of resonance of the basin. Another consequence to be taken into account, never theless, was that the period of oscillation corresponding to the first root of vJ1 (x) was also increased and so it was advis - able to avoid for it values falling in the range of frequently ob served wave periods in Luanda bay.
In order to determine dimensions of the basin enabling this disadvantage to be avoided, the radius of the sector was chosen so that
2TC
Vg K th K h >• 175 seconds,
as oscillation periods exceeding this value are very seldom observ ed in Luanda.
The equation above, apparently difficult to solve due to the presence of the transcendent function th Kh, can be sim- plified taking into account that the values of Kh of interest in this case are very small, and consequently it is possible to take
th Kh = Kh
up to the fourth decimal place. The equation then becomes
^ >
K/g-h > 1?5>
from which
K^ 6.28 ^ 175 x 10.60
RESONANCE CONDITIONS 817
Now the value x=KR corresponding to the fundamental os
dilation period is, as indicated
K R = 3.8317
whence
R > 1,120 m
Thus a radius of 1,120 m would be required for the sector, in order to ensure a fundamental period of oscillation of 175 sec.
It was first advisable to determine the period of oscilla- tion corresponding to this radius for the first root of J1^ (x) which, as is known, is x = 6.J+15 = KR.
The value of K is:
K =-|Ji|5_= 0.005728
and the corresponding period:
T = s/g K 2th Kh = 103 seconds
falls within a range of infrequent periods in Luanda bay and so is aceptable, above all bearing in mind that this is not the f unda mental oscillation.
A radius of 1,120 m for the sector implied for the south ern quay of nS 1 dock a length of 620 m, i.e. more 120 m than the planned value. These characteristics, recommended for n°- 1 dock, gave rise to solution I.
3-3 - Solution III - Meanwhile "Brigada de Estudos do Por to de Luanda", on basis of the first model tests of solution I, prepared solution III (presented in fig. 11) that, while maintain ing the general shape of solution I, eliminated the small rectan- gular dock which, according to the experimental studies, proved very harmful.
Before testing this solution in model, its resonance con- ditions were investigated in an analytic study briefly presented below .

818 COASTAL ENGINEERING
^
_ 180m_
C D
f E o
E F
FIG. 11. --SOLUTION III
FIG. 12. VIEW OF MODEL

RESONANCE CONDITIONS 819
The basic data of solution III were:
R = 1,150 m 6 36^
The periods of natural oscillation corresponding to the ze roes of the derivatives of the Bessel function are:
= KR T 2TC
X v'gK th Kh
<J» (x) 3-8317 177 seg 0 7.0156 97 11
10.1735 67 " 13.3237 51 " 16.2+706 i+1 "
J\ (x) 5
6.U5 106 " 10.520 65 » 13-985 49 "
The result of the analytic study was deemed satisfactory as no period of natural oscillation of solution III was contained in the range of most frequent periods in Luanda bay - 105 to 175 sec.
4 - MODEL TESTS: 1st stage
4.1 - General - A detailed description or discussion of the experimental conditions in which these tests were carried out being outside the scope of the present paper, the only indication given about them is that the scales of the model were 1/400 in plan and 1/200 in height (fig. 12).
The coeficient of amplification of the response curves ob tained in the tests is the ratio of the maximum amplitude observ ed inside the dock to the mean amplitude in the neighbourhood of the entrance.
The tide records of i960 were already available when the model tests were carried out. So, although the analytic study was based on the observations of 1958, the response curves ob tained in the tests are superposed to the histograms of the pe riods determined in the observations of i960.
4-2 - Model test of solution I - The response curve ob- tained in the model test of solution I is presented in fig. 13, su perposed on the histogram of the periods of the tide records of
820 COASTAL ENGINEERING
a+
Ul > (X. D O Ul Ul z o Q. W tli
""^^
\ 1
, frMM...«nl. --___
—cz^.
in u
o o CM
o
» J
r- o fa
o o « > «
N p u a
a en S3 (> fc
to ia « s ^
o 5 s fc
S1N3IOIJJ3O0 NOIiVDUndNV aNV •/. Nl S3IDN3n03«J

RESONANCE CONDITIONS 821
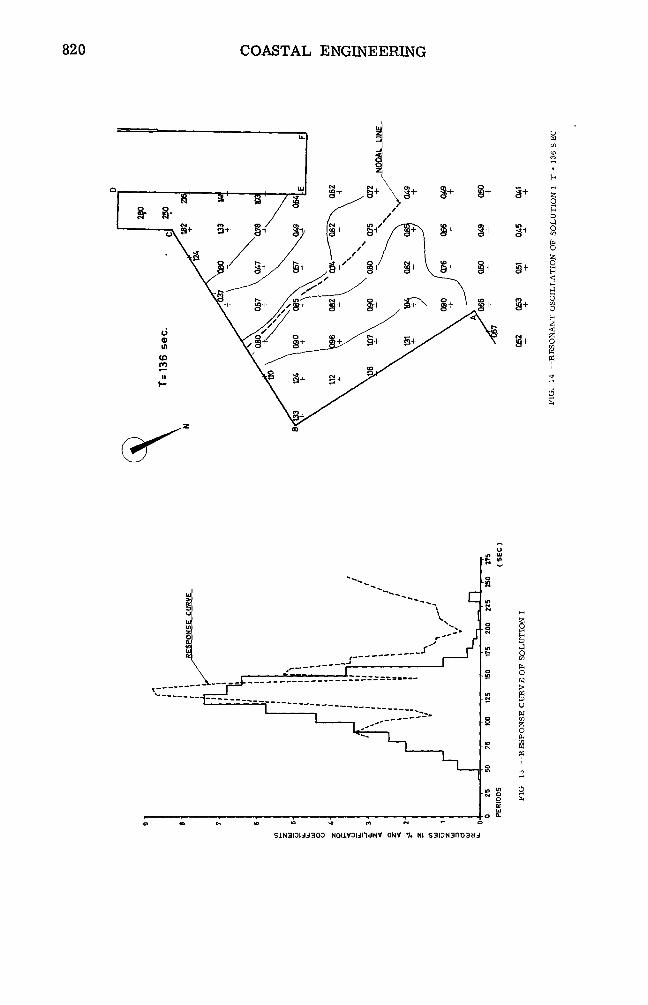
i960. As shown, contrary to the predictions of the analytic study, according to which no period of oscillation between 103 and 170 sec. would be present in the harbour, the maximum amplification oc- curred for a period of 136 seconds (with a band of periods above and below where amplification remained considerable) . According to fig. 14, in which the amplitudes at the different points and the lines of equal ampl itude are indicated, this resonance correspond ed to a one-node oscillation between the area of the small rec - tangular dock and quay AB.
The tests also showed that, independently of resonance , the rectangular dock had the worst possible effects on the water movement in n°- 1 dock. In fact the entrance to the dock lay in an area where the existant pier (DE) would meet quay BC. The increased amplitudes thus generated together with the strong in flow due to the rectangular dock gave rise to extremely strong currents which, on being reflected inside the dock, originated al- ternate water movements, not only near the entrance to the rec tangular dock but also everywhere in n°- 1 dock, in special along quay BC. Fig.14 shows the extremely rough conditions inside the rectangular dock. It is noteworthy that this same phenomenon took place even for non-resonant oscillations in n°- 1 dock. On the oth er hand, when the rectangular dock was closed in the model, the alternate water movements along quay BC were considerably re- duced .
A first and obvious conclusion of these tests is the need to eliminate the rectangular dock and that was why "Brigada de Estudos do Porto de Luanda", as indicated above, presented so lution III (fig. 11) .
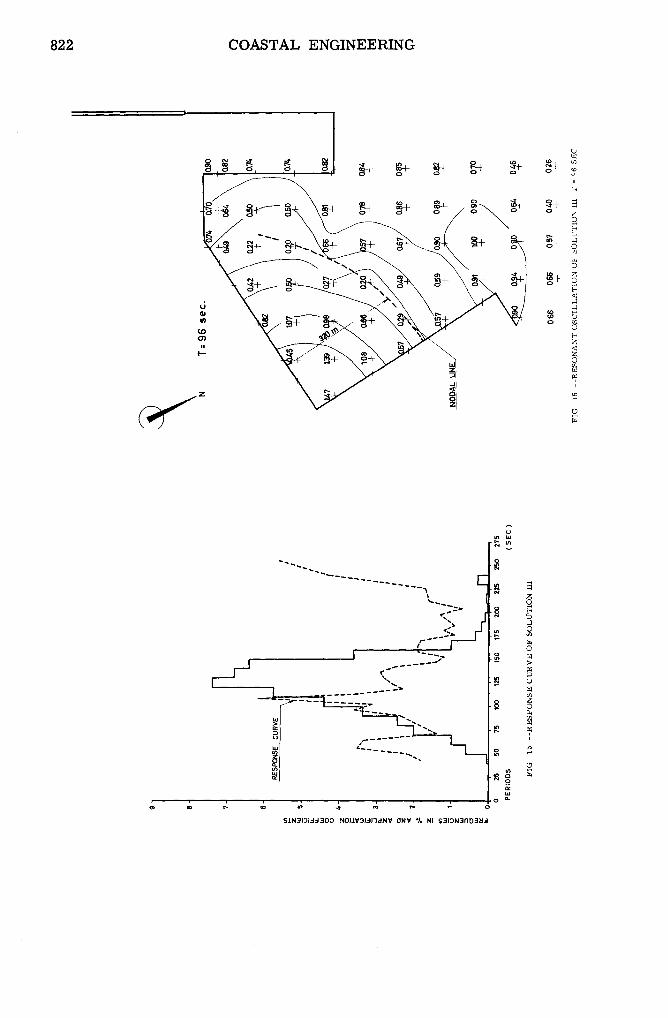
4.3 - Model test of solution III - The response curve ob tained in this test (fig.15) presented k more or less marked peaks with periods of 56, 96, 108 and I36 sec. in the period range of interest, each corresponding no doubt to a different resonance mode. The three latter periods fall in a range of very frequent periods in Luanda bay.
Curves of equal amplitude for periods of 96, 108 and I36 seconds are presented in figs. 16, 17 and 18.
Solution III proved much better than solution I. In addi- tion to the elimination of the above-mentioned disturbances due to the small rectangular dock, the coefficients of amplification were appreciably reduced, assuming acceptable values (the "coefficient
822 COASTAL ENGINEERING
s+ a
in
«+
(O-f-
SlN3l3Ud300 N0UV3IJIldWV ONV V. Nl S3ION3fl03aJ

RESONANCE CONDITIONS 823
3+
3+
§+
3+

824 COASTAL ENGINEERING
of amplification" was defined as the ratio of the maximum inter nal amplitude to the mean external amplitude). Nevertheless, as some periods of resonance corresponded to waves frequently oc curring in Luanda bay, the shape of n°- 1 dock had to be chang_ ed.
5 - COMPARISON AND ANALYSIS OF THE RESULTS OB TAINED
5.1 - Comparison of analytic and experimental results-As shown in figs. 13 and 15, the analytic predictions were not con firmed by the tests, notably as regards solution I, possibly on account of the disturbances due to the small rectangular dock . On one hand the response curve displayed peaks for periods non- -predicted in the analytic study, whereas for some predicted re sonance periods moderate amplification coefficients were obtained. Only for solution III, in which deviations are slighter, peaks of the response curve for periods approaching the predicted values could be obtained. Thus, resonance had been predicted for pe- riods of 97 and 106 seconds and the response curve displayed peaks for 96 and 108 seconds; in the zone of k9, 51, 65, 67 se conds, where resonance phenomenon were anticipated, consider- ably high amplification coefficients and a peak for 56 seconds were obtained. On the contrary, for the period of 77 seconds, where resonance had been predicted, the response curve presented a min imum .
The deviations just described should be ascribed to the non- -validity of assimilating the dock to a sector.
5.2 - Interpretation of the experimental results - A care ful analysis of the equal amplitude curves (figs. 16, 17, 18) is extremely useful for the interpretation of the experimental re- sults .
Thus, according to fig. 16, the oscillation with a period of 96 seconds corresponds to a quarter-wave-length oscillation in an open basin with respect to the larger quay at the end of the dock the nodal line is removed slightly more than a quarter-wave-lengtl from this quay. In fact the wave length for a period of 96 se- conds is
L = CT = \/gh x T = 79-8 x 11.5 x 96 = 1,020 m

RESONANCE CONDITIONS 825
and
L = 255 m 4
The oscillation of 108 seconds (fig.17) corresponds to a half - -wave-length oscillation in a closed basin between the new pier and a line near the angle of the present pier with the new quay. In fact the wave length is now
L = CT = \/g h x T = V9.8 x 11,5 x 108 = 1,150m
and
L, = 575 m,
that is the distance between the two lines.
The oscillation of 136 sec. (fig. 18) corresponds to a quar- ter-wave-length oscillation in an open basin with respect to the smaller quay at the end of the dock, a line parallel to the quay through the end of the present pier behaving roughly as the en trance to the dock. In fact, the wave length for a period of 136 seconds is
L = CT = N/9 .8 x 11.5 x 136 = 1,446 m
and
L k
= 361 m,
which is sensibly the distance between the quay and the above- -mentioned line.
Finally, the 56 sec oscillation, whose equal-amplitude cur ves are not presented due to their minor interest, proved to be a binodal oscillation, with nodal lines roughly parallel to the large quay at the end of the dock. This oscillation was neglected for the following reasons:
a) It was a binodal oscillation, which in itself at once made it of minor importa nee as it tended to be damped much faster than uninodal oscillations.
826 COASTAL ENGINEERING
b) its amplification coefficient was not high;
c) its period fell in an interval of very rare periods in Luan da bay.
6 - SOLUTION IVAND ITS EXPERIMENTAL STUDY
6.1 - Solution IV - From the foregoing and from an anal ysis of the shape of n°- 1 dock (fig .19) it is clear that distances d , d , d conditioned resonances corresponding to the periods
X *~ j>
of 136, 108 and 96 seconds respectively. So it was decided to investigate how to change these distances so as to obtain a sat- isfactory solution.
It was proved that some advantages could be derived from a change in d . In fact, its value gives rise to a quarter-wave- -length resonance which, although slight, corresponds to a very frequent period (136 seconds) in Luanda bay. The problem never- theless was difficult to solve. In fact,for this resonance to fall in the period range of 170 seconds, comparatively rare in the bay, distance d should obey the condition
L = 2+ d =Vg hx T = v/9.8 x 11,5 x 170 = 1,800 m
and
d1 = 450 m
This value had the disadvantage of extending the present pier, eliminating its end quay and giving rise to a resonance with a period of 96 seconds (with a higher amplification coefficient), therefore in the range of the most frequent wave periods in Luan da bay.
In order to solve the problem by means of a resonance in the low periods (about 60 seconds) ,which are infrequent,it would be necessary to have
L = k d = v/gh x T = >/9.8 x 11,5 x 60 = 638 m
and
d± = 159 m,
which is obviously unacceptable.

RESONANCE CONDITIONS 827
FIG 19 -DISTANCES COMMANDING RESONANT OSCILLATIONS -SOLUTION IV
FIG 21 --RESPONSE CURVE OF SOLUTION IV

828 COASTAL ENGINEERING
Nevertheless, given its small amplification coefficient that probably could be further reduced by the increase of distance d (which,as will be seen below, was necessary for other reasons), this resonance did not seem very dangerous.
Distance d had to be changed so that the corresponding half-wave-length resonance, that was marked, would fall in an infrequent period. This could be done by decreasing or increas- ing d and consequently the corresponding resonance period. In the former case, reducing the resonance period to 70 seconds, which is an infrequent period, d should be such that:
L = 2 d2 => Vghx T = \/9.8 x 11,5 x 70 = 7^+2 m
and
dg = 371 m
This value was deemed unacceptable as it would reduce too much both the length of the end quay and the entrance width. It was thus necessary to increase d , so as to obtain a resonance pe- riod of about 170 seconds . Consequently :
L, = 2 d = \/ihx T = 1/9.81 11,5 x 170 =1,800 m
and
dg = 900 m; 1.2 d = 1,080 m
Therefore d had to be increased by about 320 m.
As for distance d , it gave rise to a not very marked quar- ter-wave-length resonance with a period of 96 seconds which is not very frequent. Nevertheless only a short reduction of d , and consequently of d connected with it, was advantageous.
The foregoing reasons led to solution IV presented in fig. 20. The angle of the end quay was suggested by "Brigada de Estu - dos do Porto de Luanda".
6.2 - Model test of solution IV - The model test of so - lution IV yielded the response curve presented in fig.21 that dis plays two comparatively marked peaks. One, for a period of 165

RESONANCE CONDITIONS 829
seconds, is due to the half-wave-length resonance between quays AB and DE that had been predicted for a period of about 170 seconds; the other, with a period of 96 seconds, corresponds to the first harmonic of the former. In fact, the equal-amplitude curves (fig.22, 23) show that in the former case two lines of maxima (loop lines) are generated near the quay walls and a node line roughly in the middle dock; in the latter case the oscillation is binodal with two loop lines near the quays and another roughly in the middle dock.
The quarter-wave-length oscillation of solution III were not conspicuous in solution IV, probably due to the increased width of the dock entrance and the reduced ratio of its cross dimen - sion (distances d or d ) to its length (distance d ).
The superposition of the response curve on the histogram of long-period waves observed in Luanda (fig.21) shows a shift between the peaks of both graphs, which means that the prob- abilities of resonance are minimum . The peak in the uninodal os- cillation corresponds to a very small frequency of the long-period waves; as for the binodal oscillation, its frequency is slightly high- er but anyhow this is always less dangerous than the fundamen- tal oscillation. For all these reasons, solution IV was considered as satisfactory.
7 - CONCLUSIONS
In addition to enabling the determination of a suitable shape for n2 1 dock of Luanda port, we believe that from the studies presented the following general conclusions of practical interest can be drawn:
a) Special care is required when choosing the location of quick rotation tide recorders for long-period waves. It is neces sary not only to prefer locations in or near loop zones for all the periods but also to avoid at all costs the disturbing inf lu - ences of normal waves coming from the open sea or locally gen*- erated by the wind or ships passing nearby. Without these pre- cautions the interpretation of the obtained results will be very difficult.
b) In the analytic study of oscillations in an irregular shap- ed basin, an extreme prudence is recommended in the assimila - tion of the basin to another with simpler geometric shapes mak ing an analytic study possible.
c) The consideration of half-wave length and one-quarter

830 COASTAL ENGINEERING
RESONANCE CONDITIONS 831
wave length oscillations and their harmonics between roughly re- gular reflecting surfaces can be very useful when predicting os cillation conditions in an irregular shaped basin.
d) The presence of small docks near loop zones is extreme ly harmful as regards oscillations in a wider space.
e) The intensity of one-quarter wave length oscillations is substantially reduced when the opening increases. The latter con elusion, in fact, agrees with others obtained by analytic or ex- perimental means [6] , [7] .
REFERENCES
[l] Abecasis , F .M. - "Consulta de Hidraulica Marltima para a Bri gada de Estudos do Porto de Luanda" - 1st rep .,1960 e 3rd rep.,196l (unpublished).
[2] Abecasis, F .M. - "2& Consulta Hidraulica Marltima para a Bri gada de Estudos do Porto de Luanda"- 1st rep.,1961 (unpublished) .
[3] Abecasis, F.M. - "Estudo do problema das ondulaqoes de Ion go perlodo na ampliagao do porto de Luanda", Tecnica, n°. 303, I960.
[i).] Lamb,H. - "Hydrodynamics" Cambridge University Press 6th edition, pag.284 following.
[5] Le Mehaute,B. - "Agitation dans les ports" ,1' Ingenieur (Ca- nada) Winter 1958.
[6J Biesel et Le Mehaute - "Mouvements de resonance a deux di- mensions dans une enceinte sous 1'action d'ondes inci- dentes" La Houille Blanche n2 3 - 1956.
[7] Ippen and Goda - "Wave induced oscillations in harbors; the solution for a rectangular harbor connected to the open- -sea" MIT. Hydrodynamics Laboratory. Report n2 59 1963.