Multiparameter monitoring of Fogo Island, Cape Verde, for volcanic risk mitigation
18
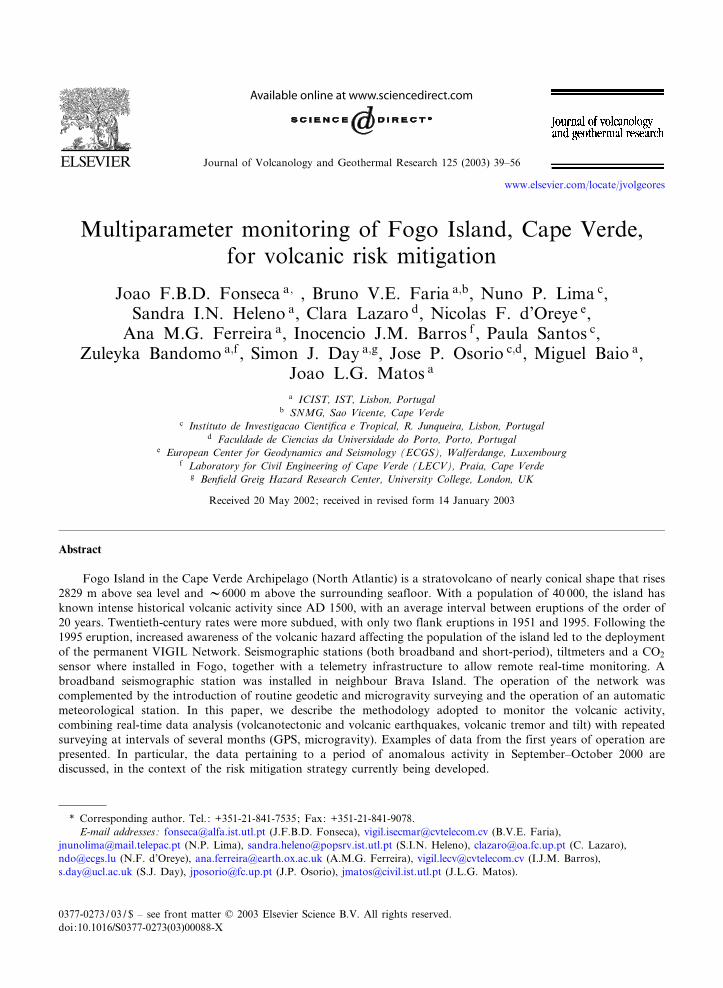
Multiparameter monitoring of Fogo Island, Cape Verde, for volcanic risk mitigation Joao F.B.D. Fonseca a; , Bruno V.E. Faria a;b , Nuno P. Lima c , Sandra I.N. Heleno a , Clara Lazaro d , Nicolas F. d’Oreye e , Ana M.G. Ferreira a , Inocencio J.M. Barros f , Paula Santos c , Zuleyka Bandomo a;f , Simon J. Day a;g , Jose P. Osorio c;d , Miguel Baio a , Joao L.G. Matos a a ICIST, IST, Lisbon, Portugal b SNMG, Sao Vicente, Cape Verde c Instituto de Investigacao Cienti¢ca e Tropical, R. Junqueira, Lisbon, Portugal d Faculdade de Ciencias da Universidade do Porto, Porto, Portugal e European Center for Geodynamics and Seismology (ECGS), Walferdange, Luxembourg f Laboratory for Civil Engineering of Cape Verde (LECV), Praia, Cape Verde g Ben¢eld Greig Hazard Research Center, University College, London, UK Received 20 May 2002; received in revised form 14 January 2003 Abstract Fogo Island in the Cape Verde Archipelago (North Atlantic) is a stratovolcano of nearly conical shape that rises 2829 m above sea level and V6000 m above the surrounding seafloor. With a population of 40 000, the island has known intense historical volcanic activity since AD 1500, with an average interval between eruptions of the order of 20 years. Twentieth-century rates were more subdued, with only two flank eruptions in 1951 and 1995. Following the 1995 eruption, increased awareness of the volcanic hazard affecting the population of the island led to the deployment of the permanent VIGIL Network. Seismographic stations (both broadband and short-period), tiltmeters and a CO 2 sensor where installed in Fogo, together with a telemetry infrastructure to allow remote real-time monitoring. A broadband seismographic station was installed in neighbour Brava Island. The operation of the network was complemented by the introduction of routine geodetic and microgravity surveying and the operation of an automatic meteorological station. In this paper, we describe the methodology adopted to monitor the volcanic activity, combining real-time data analysis (volcanotectonic and volcanic earthquakes, volcanic tremor and tilt) with repeated surveying at intervals of several months (GPS, microgravity). Examples of data from the first years of operation are presented. In particular, the data pertaining to a period of anomalous activity in September^October 2000 are discussed, in the context of the risk mitigation strategy currently being developed. 0377-0273 / 03 / $ ^ see front matter ȣ 2003 Elsevier Science B.V. All rights reserved. doi :10.1016/S0377-0273(03)00088-X * Corresponding author. Tel.: +351-21-841-7535; Fax: +351-21-841-9078. E-mail addresses: [email protected] (J.F.B.D. Fonseca), [email protected] (B.V.E. Faria), [email protected] (N.P. Lima), [email protected] (S.I.N. Heleno), [email protected] (C. Lazaro), [email protected] (N.F. d’Oreye), [email protected] (A.M.G. Ferreira), [email protected] (I.J.M. Barros), [email protected] (S.J. Day), [email protected] (J.P. Osorio), [email protected] (J.L.G. Matos). Journal of Volcanology and Geothermal Research 125 (2003) 39^56 R Available online at www.sciencedirect.com www.elsevier.com/locate/jvolgeores
-
Upload
independent -
Category
Documents
-
view
0 -
download
0
Transcript of Multiparameter monitoring of Fogo Island, Cape Verde, for volcanic risk mitigation
Multiparameter monitoring of Fogo Island, Cape Verde,for volcanic risk mitigation
Joao F.B.D. Fonseca a;�, Bruno V.E. Faria a;b, Nuno P. Lima c,Sandra I.N. Heleno a, Clara Lazaro d, Nicolas F. d’Oreye e,Ana M.G. Ferreira a, Inocencio J.M. Barros f , Paula Santos c,
Zuleyka Bandomo a;f , Simon J. Day a;g, Jose P. Osorio c;d, Miguel Baio a,Joao L.G. Matos a
a ICIST, IST, Lisbon, Portugalb SNMG, Sao Vicente, Cape Verde
c Instituto de Investigacao Cienti¢ca e Tropical, R. Junqueira, Lisbon, Portugald Faculdade de Ciencias da Universidade do Porto, Porto, Portugal
e European Center for Geodynamics and Seismology (ECGS), Walferdange, Luxembourgf Laboratory for Civil Engineering of Cape Verde (LECV), Praia, Cape Verde
g Ben¢eld Greig Hazard Research Center, University College, London, UK
Received 20 May 2002; received in revised form 14 January 2003
Abstract
Fogo Island in the Cape Verde Archipelago (North Atlantic) is a stratovolcano of nearly conical shape that rises2829 m above sea level and V6000 m above the surrounding seafloor. With a population of 40 000, the island hasknown intense historical volcanic activity since AD 1500, with an average interval between eruptions of the order of20 years. Twentieth-century rates were more subdued, with only two flank eruptions in 1951 and 1995. Following the1995 eruption, increased awareness of the volcanic hazard affecting the population of the island led to the deploymentof the permanent VIGIL Network. Seismographic stations (both broadband and short-period), tiltmeters and a CO2
sensor where installed in Fogo, together with a telemetry infrastructure to allow remote real-time monitoring. Abroadband seismographic station was installed in neighbour Brava Island. The operation of the network wascomplemented by the introduction of routine geodetic and microgravity surveying and the operation of an automaticmeteorological station. In this paper, we describe the methodology adopted to monitor the volcanic activity,combining real-time data analysis (volcanotectonic and volcanic earthquakes, volcanic tremor and tilt) with repeatedsurveying at intervals of several months (GPS, microgravity). Examples of data from the first years of operation arepresented. In particular, the data pertaining to a period of anomalous activity in September^October 2000 arediscussed, in the context of the risk mitigation strategy currently being developed.
0377-0273 / 03 / $ ^ see front matter C 2003 Elsevier Science B.V. All rights reserved.doi:10.1016/S0377-0273(03)00088-X
* Corresponding author. Tel. : +351-21-841-7535; Fax: +351-21-841-9078.E-mail addresses: [email protected] (J.F.B.D. Fonseca), [email protected] (B.V.E. Faria),
[email protected] (N.P. Lima), [email protected] (S.I.N. Heleno), [email protected] (C. Lazaro),[email protected] (N.F. d’Oreye), [email protected] (A.M.G. Ferreira), [email protected] (I.J.M. Barros),[email protected] (S.J. Day), [email protected] (J.P. Osorio), [email protected] (J.L.G. Matos).
VOLGEO 2605 19-6-03
Journal of Volcanology and Geothermal Research 125 (2003) 39^56
R
Available online at www.sciencedirect.com
www.elsevier.com/locate/jvolgeores
C 2003 Elsevier Science B.V. All rights reserved.
Keywords: Fogo Island; volcano; monitoring; eruption; forecast; hazard
1. Geological and structural setting
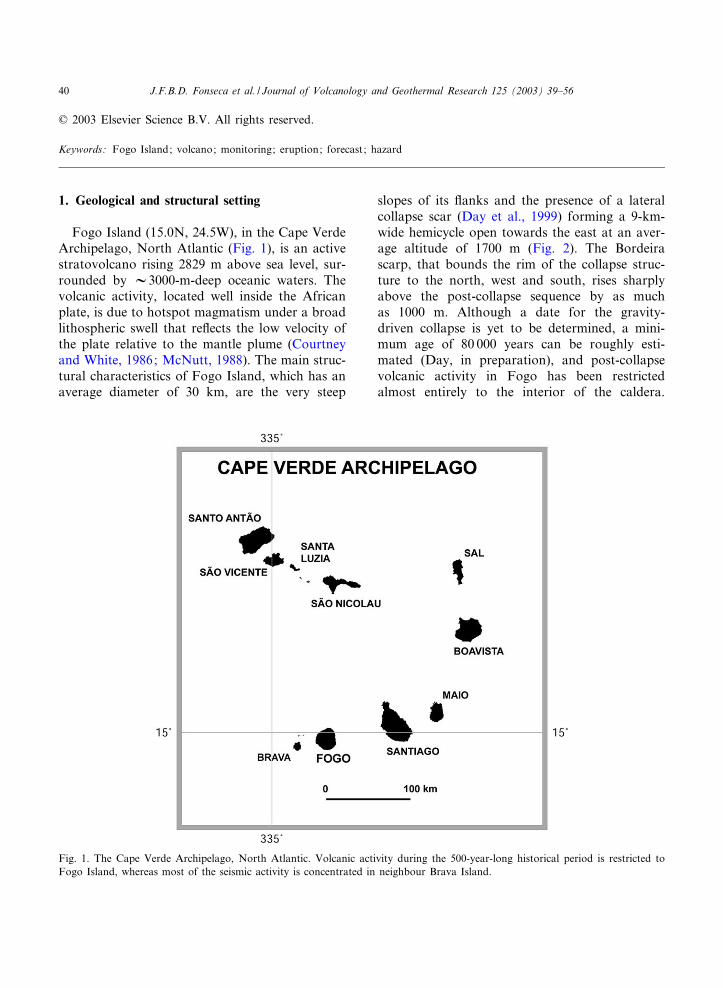
Fogo Island (15.0N, 24.5W), in the Cape VerdeArchipelago, North Atlantic (Fig. 1), is an activestratovolcano rising 2829 m above sea level, sur-rounded by V3000-m-deep oceanic waters. Thevolcanic activity, located well inside the Africanplate, is due to hotspot magmatism under a broadlithospheric swell that re£ects the low velocity ofthe plate relative to the mantle plume (Courtneyand White, 1986; McNutt, 1988). The main struc-tural characteristics of Fogo Island, which has anaverage diameter of 30 km, are the very steep
slopes of its £anks and the presence of a lateralcollapse scar (Day et al., 1999) forming a 9-km-wide hemicycle open towards the east at an aver-age altitude of 1700 m (Fig. 2). The Bordeirascarp, that bounds the rim of the collapse struc-ture to the north, west and south, rises sharplyabove the post-collapse sequence by as muchas 1000 m. Although a date for the gravity-driven collapse is yet to be determined, a mini-mum age of 80 000 years can be roughly esti-mated (Day, in preparation), and post-collapsevolcanic activity in Fogo has been restrictedalmost entirely to the interior of the caldera.
Fig. 1. The Cape Verde Archipelago, North Atlantic. Volcanic activity during the 500-year-long historical period is restricted toFogo Island, whereas most of the seismic activity is concentrated in neighbour Brava Island.
VOLGEO 2605 19-6-03
J.F.B.D. Fonseca et al. / Journal of Volcanology and Geothermal Research 125 (2003) 39^5640
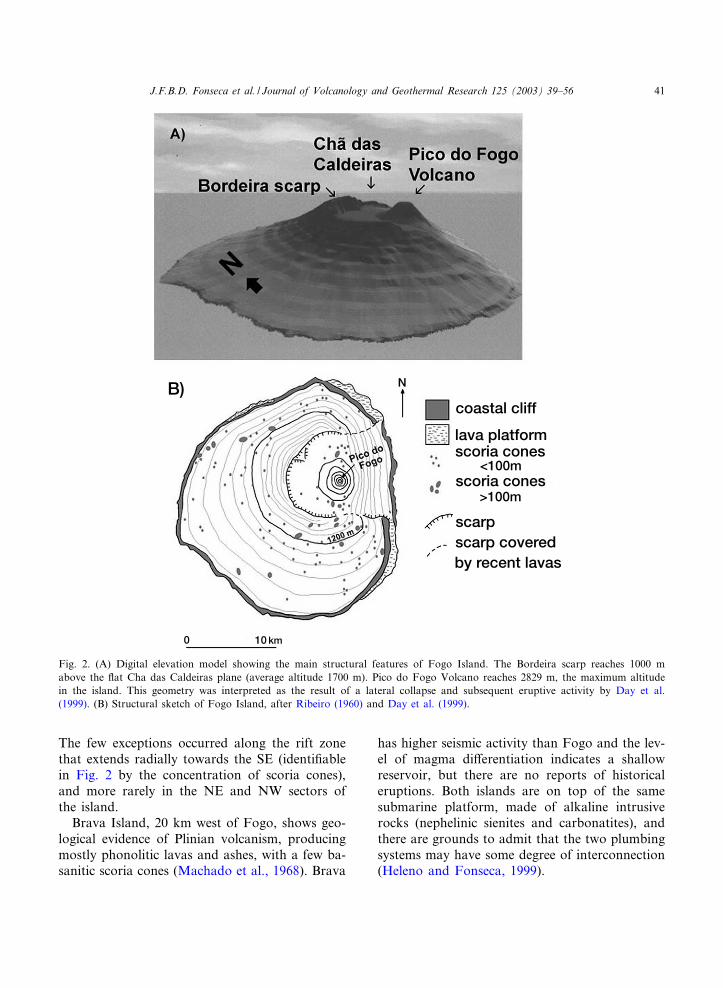
The few exceptions occurred along the rift zonethat extends radially towards the SE (identi¢ablein Fig. 2 by the concentration of scoria cones),and more rarely in the NE and NW sectors ofthe island.Brava Island, 20 km west of Fogo, shows geo-
logical evidence of Plinian volcanism, producingmostly phonolitic lavas and ashes, with a few ba-sanitic scoria cones (Machado et al., 1968). Brava
has higher seismic activity than Fogo and the lev-el of magma di¡erentiation indicates a shallowreservoir, but there are no reports of historicaleruptions. Both islands are on top of the samesubmarine platform, made of alkaline intrusiverocks (nephelinic sienites and carbonatites), andthere are grounds to admit that the two plumbingsystems may have some degree of interconnection(Heleno and Fonseca, 1999).
Fig. 2. (A) Digital elevation model showing the main structural features of Fogo Island. The Bordeira scarp reaches 1000 mabove the £at Cha das Caldeiras plane (average altitude 1700 m). Pico do Fogo Volcano reaches 2829 m, the maximum altitudein the island. This geometry was interpreted as the result of a lateral collapse and subsequent eruptive activity by Day et al.(1999). (B) Structural sketch of Fogo Island, after Ribeiro (1960) and Day et al. (1999).
VOLGEO 2605 19-6-03
J.F.B.D. Fonseca et al. / Journal of Volcanology and Geothermal Research 125 (2003) 39^56 41

2. Volcanic activity
Of the ten islands that make up the archipela-go, only Fogo had eruptions after the arrival ofthe ¢rst settlers at the end of the ¢fteenth century.During the last ¢ve centuries, eruptions in thecaldera, both through the summit of Pico doFogo and through ¢ssures near its base, havebeen reported with an average spacing of about20 years (Ribeiro, 1960, Day et al., 2000). In thetwentieth century events were more spaced, withonly two strombolian £ank eruptions in 1951(Ribeiro, 1960) and 1995 (Heleno et al., 1999).Reports of summital eruptions were frequent until1785, and since then the volcanic activity hasconsisted exclusively of ¢ssure eruptions on the£oor of the caldera. Erupted products are mainlybasanites and nephelinites with almost no di¡er-entiation, and rare phonolites, tephrites and meli-lites (Assuncao, 1954; Machado, 1965a,b; Assun-cao et al., 1967). Based on the abundance of
pyroxene-rich xenoliths, Munha et al. (1997) pro-pose a deep magma reservoir probably near thetop of the mantle, with no signi¢cant shallowchamber.Very little volcanotectonic seismicity is associ-
ated with the Fogo eruptions, and even lower lev-els are observed between eruptions. This is prob-ably due to the lack of a shallow magma reservoirunder Fogo (Day et al., 2000; Heleno, 2001).From twentieth-century evidence, the levels ofseismic activity can remain extremely low up tothe onset of eruptions, virtually without feltevents, thus posing a major challenge to forecast-ing even at a very short time-range. In fact, bothin 1951 and 1995 the initial explosions of theeruptions caught the population of the calderaby surprise. Assessing the evolution of pre-erup-tive microearthquake activity is di⁄cult becauseinstrumental seismicity data prior to 1999 areonly episodic. A temporary network deployedfrom January to April 1994 (Heleno and Fonseca,
Fig. 3. Current con¢guration of the Fogo Volcano monitoring network.
VOLGEO 2605 19-6-03
J.F.B.D. Fonseca et al. / Journal of Volcanology and Geothermal Research 125 (2003) 39^5642

1999) allowed the detection of signi¢cant volcano-tectonic activity underneath Brava and under thechannel between Brava and Fogo, but virtually noearthquakes in Fogo. On the other hand, volcanictremor was recorded in the Fogo caldera duringthat period. With the bene¢t of hindsight, a fewvolcanic earthquakes under the channel recordedat that time might have indicated lateral transportof magma between the islands from a deep mag-ma chamber under Brava to a network of dykesunder Fogo, in preparation of the 1995 eruption(Heleno and Fonseca, 1999; Heleno, 2001). But acorrelation between the seismic crises in Bravaand the eruptions in Fogo (Silveira et al., 1995)is not supported by the available macroseismicreports for the twentieth century (Heleno andFonseca, 1999).
3. Volcanic hazard in Fogo Island
Published studies of the volcanic hazard ofFogo Island are non-existent. Torres et al. (1997)provide a map of historical lava £ows, and Quen-tal (1999) proposes a model for lava-£ow simula-tion given the eruptive source. However, a thor-
ough study of the volcanic hazard and risk is stillto be accomplished, and only a rough overviewwill be given here.Due to the concentration of volcanic activity
inside the caldera and the natural protection pro-vided by the caldera scarp, villages outside thecollapsed zone have low levels of volcanic hazard.Only in one occasion (following the explosiveeruption of 1680) was the population forced to£ee Fogo, after intense ash-fall rendered the ¢eldsimproper for agriculture island-wide (Ribeiro,1960). The main towns in the east (Mosteirosand Cova Figueira) are protected by the topogra-phy from the products of summital or £ank erup-tions of Pico do Fogo (while exposed to lava£ows from less likely vents on the SE rift or onthe NE sector). Accordingly, volcanic hazard ismainly an issue inside the caldera and on the col-lapsed sector of the Eastern coast.A population of 800 dwell in two villages inside
the fertile caldera (a third village having been de-stroyed by the lava £ows in 1995, without casu-alties). Here, e¡usive or mildly explosive £ankeruptions such as those reported since 1785 donot pose great threat to human life, since thelava £ows progress slowly in the £at grounds
Fig. 4. (A) Entrance to the FPPC lava tunnel site. (B) Thermally insulated CMG-40T seismometer inside the lava tunnel. (C) Apair of bi-axial AGI701 tiltmeters installed inside the lava tunnel (in normal operation conditions the styrofoam box is closed).
VOLGEO 2605 19-6-03
J.F.B.D. Fonseca et al. / Journal of Volcanology and Geothermal Research 125 (2003) 39^56 43
and allow evacuation. Damage to property andloss of agricultural land are therefore the mainthreats in that scenario. Pre-1785 style eruptionsthrough the summit of Pico do Fogo, however,are a direct threat to the population of the calderadue to ballistic projection of piroclasts. Settle-ment of population inside the caldera dates fromthe late-nineteenth century, and the local cul-ture regarding volcanic activity is based on theexperience of the 1951 and 1995 £ank eruptionsonly.Several small villages on the eastern coast be-
tween the two E^W collapse scars can be reachedwithin a short time (typically a few hours) by lava£ows coming directly from the summit of Pico doFogo or from the overspill of the £at caldera£oor, due to the extreme steepness of the eastern£ank, which reaches a maximum of 28‡ averageslope. These villages are highly exposed to bothsummital and ¢ssure eruptions, making the haz-ard in this zone the highest of the island.
4. The VIGIL Network
Due to increased awareness of volcanic hazardin Fogo Island following the 1995 eruption, it waspossible to install and operate a network of in-struments to monitor the inter-eruptive volcanicactivity and detect signi¢cant deviations fromthe background levels (Project VIGIL). The goalof the project is to monitor remotely and in real-time volcanotectonic and volcanic earthquakes,volcanic tremor, short-term ground deformationsand CO2 concentration. In addition to the real-time monitoring, a network of 23 geodetic monu-ments was built (Berberan, 1997) to conduct GPSand microgravity surveys with intervals of the or-der of eight months, to detect long-term grounddeformation and mass changes (Lima, 2001).Fig. 3 shows the equipment currently in oper-
ation in Fogo and Brava islands, consisting of:b two broadband triaxial seismic stations
(CMG-40T), at FPPC and BCCH;b ¢ve short-period triaxial seismic stations, at
FMLN, FPVC, FCVT, FBAL, and FMVE;b four bi-axial tilt stations (AGI701), at
FMLN, FPPC, FLAN and FMVE.
A CO2 sensor (Zirox) was installed at a laterstage in station FLAN, but due to data recoveryproblems this component of the monitoring willnot be discussed. Whenever possible, the sensorswere installed inside lava tunnels or natural caves,to achieve good environmental protection. Thenetwork was complemented by an automatic me-teorological station (Opus2), recording air and
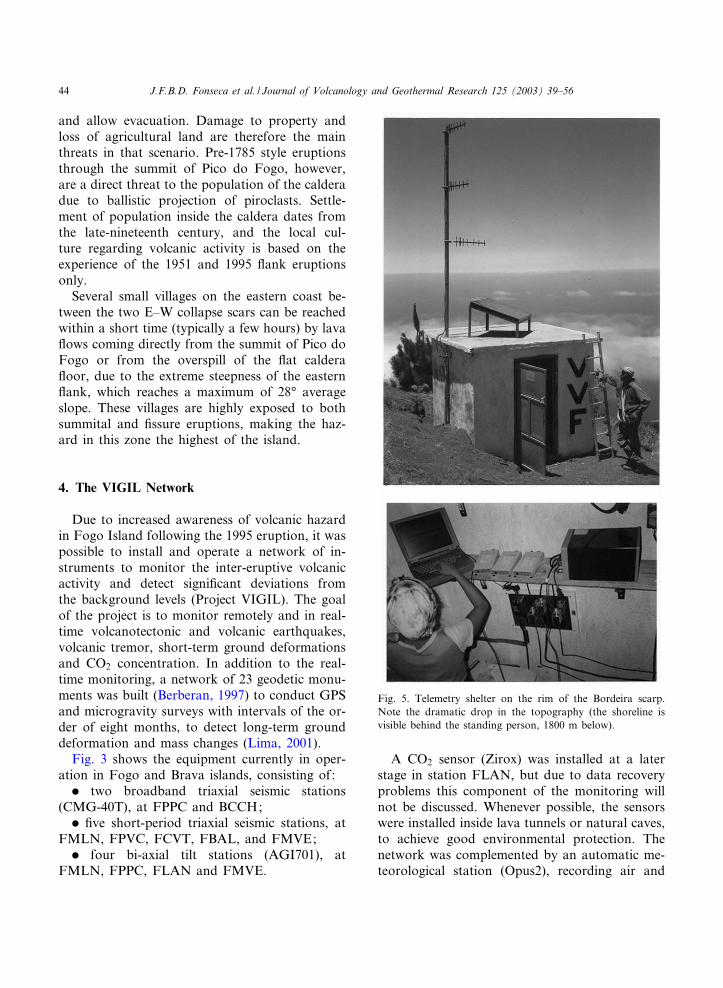
Fig. 5. Telemetry shelter on the rim of the Bordeira scarp.Note the dramatic drop in the topography (the shoreline isvisible behind the standing person, 1800 m below).
VOLGEO 2605 19-6-03
J.F.B.D. Fonseca et al. / Journal of Volcanology and Geothermal Research 125 (2003) 39^5644
ground temperature, humidity, solar radiation,rainfall, wind speed and direction, as well as airpressure. A telemetry infrastructure based onspread-spectrum radio-links with three separaterepeaters was installed to transmit the data inreal-time over a distance of V100 km to the cen-tral laboratory in the capital (Praia, Santiago Is-land). Additional facilities in Fogo Island includea shelter in the caldera with capacity for a crew ofseven, a 4WD vehicle and a private VHF networkfor voice communication. Figs. 4 and 5 show ex-amples of the instrumentation setup, and Fig. 6shows a detail of a geodetic monument. Fig. 7 isthe record of a quarry blast by the VIGIL seismo-graphic network, which was used to calibrate thecrustal velocity model in use for hypocentral lo-cations.
5. Monitoring routine and strategy
5.1. Data processing and analysis
In the central laboratory (LECV headquarters,Praia) the real-time data are routinely inspected
both in time and frequency-domain, to detect sig-ni¢cant deviations from background levels of ac-tivity rates, volcanic tremor episodes or unusualdeformations. Next, the data are stored on CDsfor backup. Recent data (last 15 days) are mir-rored in a communications-dedicated Linux PC toallow remote access from other participating lab-oratories. Further processing and analysis ^ hypo-central locations and magnitude estimates ^ areconducted at SNMG (S. Vicente Island), usingthe SEISAN software package (Havskov, 1995).Tilt data are treated in depth at the ECGS (Lux-embourg). In addition, broadband seismic dataare made available in real-time to the ORFEUSData Center (The Netherlands) for global seismo-logical cover.
5.2. Seismicity
Sustained volcanic tremor, related to £uid mo-tion at the source (Chouet, 1985, 1996), is fre-quently recorded in Fogo and plays an importantrole in the monitoring strategy. High-frequencytremor (Fig. 8), typically above 10 Hz, is themost common observation, frequently recorded
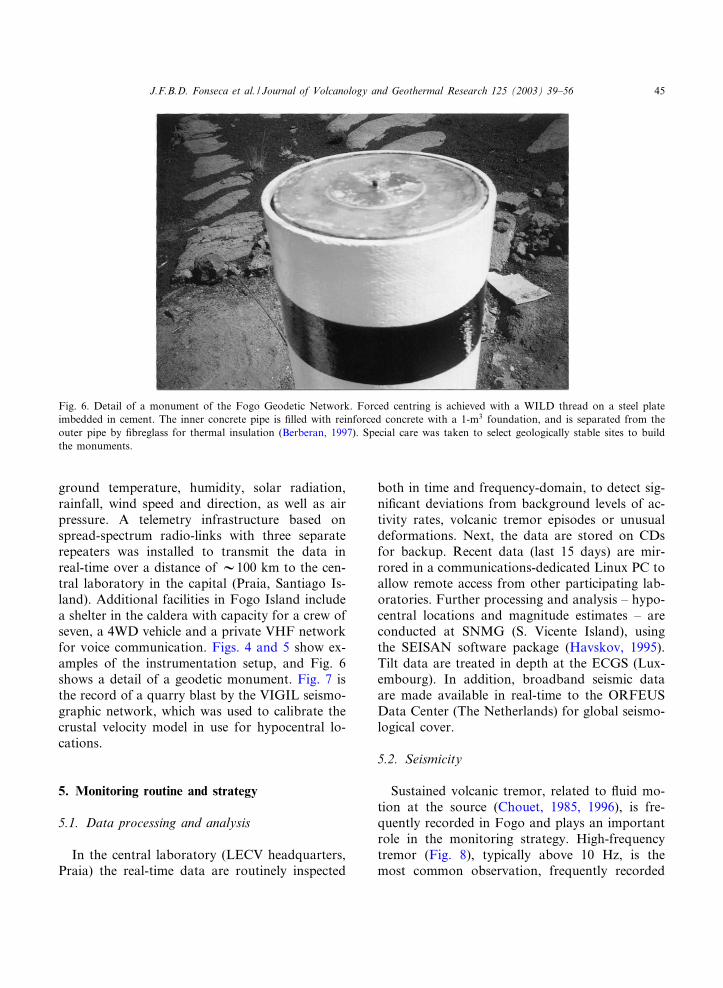
Fig. 6. Detail of a monument of the Fogo Geodetic Network. Forced centring is achieved with a WILD thread on a steel plateimbedded in cement. The inner concrete pipe is ¢lled with reinforced concrete with a 1-m3 foundation, and is separated from theouter pipe by ¢breglass for thermal insulation (Berberan, 1997). Special care was taken to select geologically stable sites to buildthe monuments.
VOLGEO 2605 19-6-03
J.F.B.D. Fonseca et al. / Journal of Volcanology and Geothermal Research 125 (2003) 39^56 45

simultaneously at stations that are several (up to15) km apart (Heleno, 2001). This is an unusualobservation, since these frequencies are stronglyattenuated in the crust and normally can onlybe recorded much closer to the source. For thisreason, the mechanism of generation and propa-gation of this tremor is currently being investi-gated, and its monitoring is the object of partic-ular attention. Sustained high-frequency tremorwas observed also in 1994 (i.e. one year beforethe last eruption). While volcanotectonic earth-quakes are extremely rare in Fogo (although fre-quent in Brava), long-period volcanic events with
frequencies around 2 Hz are a common observa-tion (Fig. 9). For the latter events, also associatedwith motions of £uids inside the conduits of thevolcano (Chouet, 1996), source location is chal-lenging due to the absence of clear phases. Thewavelet transform (Chui, 1992) is being integratedin the analysis to circumvent this di⁄culty, withpromising results. Taking advantage of the factthat the frequency content in seismic signals isnot stationary in time and changes with the arriv-al of new phases, the wavelet transform of a vol-canic earthquake record is inspected to identifychanges in frequency that may be associated
Fig. 7. Quarry blast (1.2 ton gelamonite) recorded in the VIGIL Network, which allowed the adjustment of the velocity modelused for hypocentral location.
VOLGEO 2605 19-6-03
J.F.B.D. Fonseca et al. / Journal of Volcanology and Geothermal Research 125 (2003) 39^5646
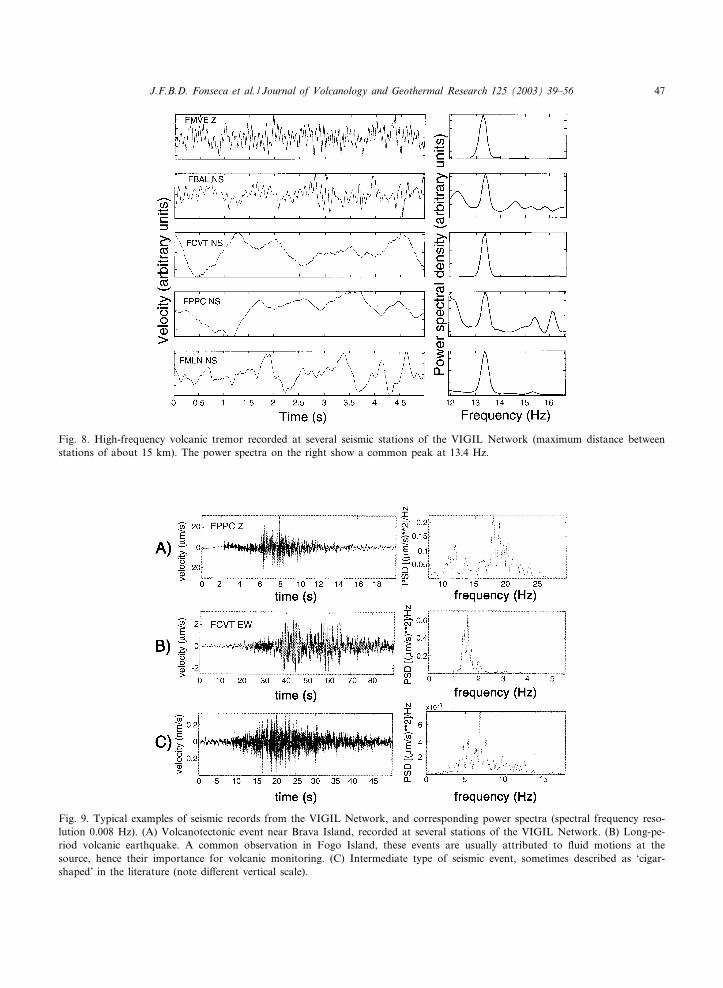
Fig. 8. High-frequency volcanic tremor recorded at several seismic stations of the VIGIL Network (maximum distance betweenstations of about 15 km). The power spectra on the right show a common peak at 13.4 Hz.
Fig. 9. Typical examples of seismic records from the VIGIL Network, and corresponding power spectra (spectral frequency reso-lution 0.008 Hz). (A) Volcanotectonic event near Brava Island, recorded at several stations of the VIGIL Network. (B) Long-pe-riod volcanic earthquake. A common observation in Fogo Island, these events are usually attributed to £uid motions at thesource, hence their importance for volcanic monitoring. (C) Intermediate type of seismic event, sometimes described as ‘cigar-shaped’ in the literature (note di¡erent vertical scale).
VOLGEO 2605 19-6-03
J.F.B.D. Fonseca et al. / Journal of Volcanology and Geothermal Research 125 (2003) 39^56 47

with the arrival of P (on the vertical component)and S phases (on the horizontal components).Once the frequency that best highlights a partic-ular phase is selected, the amplitude of the wave-let transform for the corresponding scale is plot-ted as a function of translation, and the arrival ispicked from the transformed trace (Fig. 10).
5.3. Tilt data
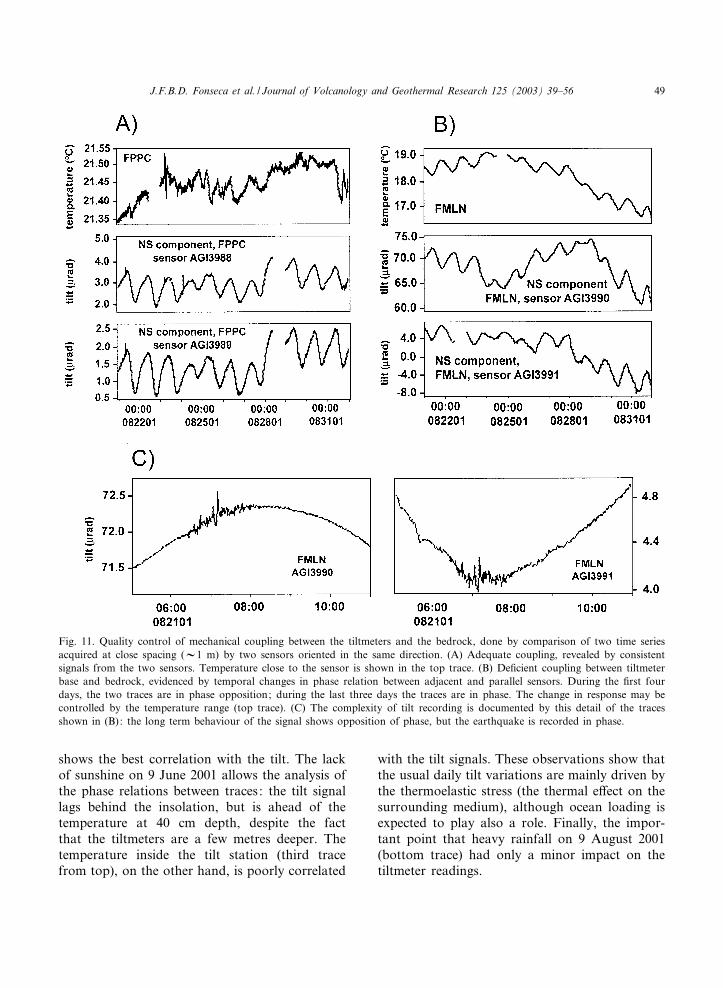
Bi-axial AGI701 tiltmeters with 0.005 Wrad sen-sitivity were installed in pairs at each site, with aseparation of the order of 1 m, to control thecoupling between the instruments and the rockmasses. Fig. 11 is an example of the quality con-trol performed for the tilt data. Fig. 11A showsan example of data from a successful installation,with the parallel components of two separate sen-sors displaying the same behaviour over a periodof 10 days (a similar agreement is also observedfor seasonal variations). Fig. 11B shows a case of
defective coupling: on the left side of the traces (3¢rst days) the two instruments show opposition ofphase in the daily variation, but the teleseismicrecord shown in Fig. 11C (M7.1 New Zealandearthquake of 21 August 2001) does not show areversal of polarity. On the right side of the traces(last 3 days) the daily variation is recorded inphase by the two sensors. As a result, this sitewas abandoned. Similar analyses were conductedfor the long-term seasonal behaviour of the in-struments. Besides signal quality control, currentresearch is focused on the characterisation of en-vironmental e¡ects on tilt observations, usingtemperature, atmospheric pressure, rainfall andseveral other meteorological variables that arealso recorded (D’Oreye, 2001). Fig. 12 shows sev-eral days of tilt data from a lava tunnel (twoupper traces) in conjunction with meteorologicalvariables. The fourth trace from the top is thetemperature 40 cm below the surface (at the me-teo station, V1000 m from the tilt station), and
Fig. 10. The di⁄culty of identifying seismic phases in the emergent waveforms that characterise volcanic earthquakes may be at-tenuated with the use of the wavelet transform. Above are shown seismograms of a volcanic earthquake (vertical component tothe left and N^S component to the right), and below the amplitude of the wavelet transform for a ¢xed scale, previously selectedby inspection of the scalegram.
VOLGEO 2605 19-6-03
J.F.B.D. Fonseca et al. / Journal of Volcanology and Geothermal Research 125 (2003) 39^5648
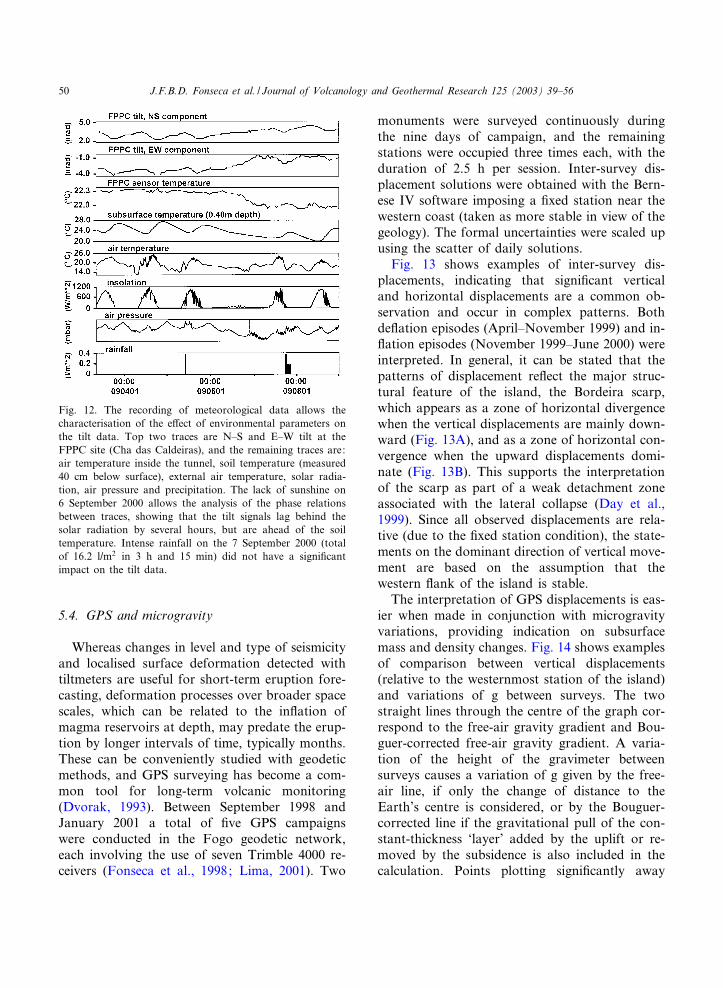
shows the best correlation with the tilt. The lackof sunshine on 9 June 2001 allows the analysis ofthe phase relations between traces: the tilt signallags behind the insolation, but is ahead of thetemperature at 40 cm depth, despite the factthat the tiltmeters are a few metres deeper. Thetemperature inside the tilt station (third tracefrom top), on the other hand, is poorly correlated
with the tilt signals. These observations show thatthe usual daily tilt variations are mainly driven bythe thermoelastic stress (the thermal e¡ect on thesurrounding medium), although ocean loading isexpected to play also a role. Finally, the impor-tant point that heavy rainfall on 9 August 2001(bottom trace) had only a minor impact on thetiltmeter readings.
Fig. 11. Quality control of mechanical coupling between the tiltmeters and the bedrock, done by comparison of two time seriesacquired at close spacing (V1 m) by two sensors oriented in the same direction. (A) Adequate coupling, revealed by consistentsignals from the two sensors. Temperature close to the sensor is shown in the top trace. (B) De¢cient coupling between tiltmeterbase and bedrock, evidenced by temporal changes in phase relation between adjacent and parallel sensors. During the ¢rst fourdays, the two traces are in phase opposition; during the last three days the traces are in phase. The change in response may becontrolled by the temperature range (top trace). (C) The complexity of tilt recording is documented by this detail of the tracesshown in (B): the long term behaviour of the signal shows opposition of phase, but the earthquake is recorded in phase.
VOLGEO 2605 19-6-03
J.F.B.D. Fonseca et al. / Journal of Volcanology and Geothermal Research 125 (2003) 39^56 49
5.4. GPS and microgravity
Whereas changes in level and type of seismicityand localised surface deformation detected withtiltmeters are useful for short-term eruption fore-casting, deformation processes over broader spacescales, which can be related to the in£ation ofmagma reservoirs at depth, may predate the erup-tion by longer intervals of time, typically months.These can be conveniently studied with geodeticmethods, and GPS surveying has become a com-mon tool for long-term volcanic monitoring(Dvorak, 1993). Between September 1998 andJanuary 2001 a total of ¢ve GPS campaignswere conducted in the Fogo geodetic network,each involving the use of seven Trimble 4000 re-ceivers (Fonseca et al., 1998; Lima, 2001). Two
monuments were surveyed continuously duringthe nine days of campaign, and the remainingstations were occupied three times each, with theduration of 2.5 h per session. Inter-survey dis-placement solutions were obtained with the Bern-ese IV software imposing a ¢xed station near thewestern coast (taken as more stable in view of thegeology). The formal uncertainties were scaled upusing the scatter of daily solutions.Fig. 13 shows examples of inter-survey dis-
placements, indicating that signi¢cant verticaland horizontal displacements are a common ob-servation and occur in complex patterns. Bothde£ation episodes (April^November 1999) and in-£ation episodes (November 1999^June 2000) wereinterpreted. In general, it can be stated that thepatterns of displacement re£ect the major struc-tural feature of the island, the Bordeira scarp,which appears as a zone of horizontal divergencewhen the vertical displacements are mainly down-ward (Fig. 13A), and as a zone of horizontal con-vergence when the upward displacements domi-nate (Fig. 13B). This supports the interpretationof the scarp as part of a weak detachment zoneassociated with the lateral collapse (Day et al.,1999). Since all observed displacements are rela-tive (due to the ¢xed station condition), the state-ments on the dominant direction of vertical move-ment are based on the assumption that thewestern £ank of the island is stable.The interpretation of GPS displacements is eas-
ier when made in conjunction with microgravityvariations, providing indication on subsurfacemass and density changes. Fig. 14 shows examplesof comparison between vertical displacements(relative to the westernmost station of the island)and variations of g between surveys. The twostraight lines through the centre of the graph cor-respond to the free-air gravity gradient and Bou-guer-corrected free-air gravity gradient. A varia-tion of the height of the gravimeter betweensurveys causes a variation of g given by the free-air line, if only the change of distance to theEarth’s centre is considered, or by the Bouguer-corrected line if the gravitational pull of the con-stant-thickness ‘layer’ added by the uplift or re-moved by the subsidence is also included in thecalculation. Points plotting signi¢cantly away
Fig. 12. The recording of meteorological data allows thecharacterisation of the e¡ect of environmental parameters onthe tilt data. Top two traces are N^S and E^W tilt at theFPPC site (Cha das Caldeiras), and the remaining traces are:air temperature inside the tunnel, soil temperature (measured40 cm below surface), external air temperature, solar radia-tion, air pressure and precipitation. The lack of sunshine on6 September 2000 allows the analysis of the phase relationsbetween traces, showing that the tilt signals lag behind thesolar radiation by several hours, but are ahead of the soiltemperature. Intense rainfall on the 7 September 2000 (totalof 16.2 l/m2 in 3 h and 15 min) did not have a signi¢cantimpact on the tilt data.
VOLGEO 2605 19-6-03
J.F.B.D. Fonseca et al. / Journal of Volcanology and Geothermal Research 125 (2003) 39^5650

from those lines and towards the up and rightsides of the diagram indicate that mass was addedor density increased in the region a¡ecting themeasurement; conversely, points deviating signi¢-cantly towards the left and lower parts indicateloss of mass or reduction of density (Berrino et
al., 1992; Williams-Jones and Rymer, 2002). Thedata in Fig. 14A) do not indicate signi¢cant massor density variations. But Fig. 14B) documents asigni¢cant increase of mass or density in the shal-low crust underneath the SE sector of the islandand inside the caldera in the time interval between
Fig. 13. Examples of inter-survey displacements detected in the Fogo geodetic Network. A point close to the western coast was¢xed arbitrarily.
VOLGEO 2605 19-6-03
J.F.B.D. Fonseca et al. / Journal of Volcanology and Geothermal Research 125 (2003) 39^56 51

Fig. 14. The joint analysis of elevation changes and gravity changes between surveys allows a better insight into the mass or den-sity changes taking place below the surface. Symbols with a cross and a diagonal correspond to geodetic monuments and (lessreliable) levelling benchmarks, respectively. Only one pair of error bars is shown for each type of data point, for simplicity.(A) The points are within one error bar from the free air gradient line, and no signi¢cant mass or density change can be inferred.(B) Most points plot signi¢cantly above the free air gradient line, indicating an increase of mass or density under the surface.
VOLGEO 2605 19-6-03
J.F.B.D. Fonseca et al. / Journal of Volcanology and Geothermal Research 125 (2003) 39^5652

the two surveys, adding a new meaning to theinterpreted in£ation.
5.5. Visual observations by local sta¡
LECV hires a supervisor and several guardswho reside permanently in the vicinity of the vol-cano and report any unusual observations or oc-currences to the central laboratory.
6. The September 2000 crisis
The methodology implemented to monitorFogo Volcano was put to the test at the end ofSeptember 2000, when a series of anomalous sig-nals were recorded in the VIGIL Network. Themain observations were:
b anomalous surface deformation recorded intwo tiltmeter stations, FPPC and FMLN, from27 to 29 September 2000 (Fig. 15), the distancebetween the two stations being about 3 km;
b episodes of very strong sustained seismic sig-nal recorded at station FBAL, in the east £ank of
Fig. 15. Anomalous tilt and temperature data recorded attwo separate sites in Cha das Caldeiras from 27 to 29 Sep-tember 2000.
Fig. 16. Anomalous tilt data recorded on 28 and 29 September 2000 at two separate sites, and comparison with the r.m.s. seismicnoise (top trace). The r.m.s. was computed on a 2-min-long window, moving with a time-step of 1 min.
VOLGEO 2605 19-6-03
J.F.B.D. Fonseca et al. / Journal of Volcanology and Geothermal Research 125 (2003) 39^56 53
the island, correlated with surface deformation atFPPC and FMLN (Fig. 16);
b on a longer time scale, the GPS-microgravityresults for the period September 1999^June 2000,indicating that during that time interval magmahad been stored at shallow levels in the plumbingsystem.In addition, an earthquake was felt inside the
caldera on 20 September 2000, and a question-naire revealed a very localised felt area, suggestinga shallow focus (this event was not recorded dueto a mains power failure at the central laborato-ry). Also, in mid-September 2000 an unusual sul-phurous smell was reported on the SE rift zone(outside the caldera). Due to the convergence ofindependent indications pointing to shallow mag-matic activity, a warning of increased probabilityof eruption was issued to the authorities on the29 September 2000, according to the followingchain: project coordinators director of the Lab-oratory for Engineering of Cape VerdesHead ofthe National Civil Protection ServicesMinisterof Defence and Regional Civil Protection Service.The anomalous activity lasted until 30 September2000, when all the observations subsided andeventually returned to the background values.On 2 October 2000, the crisis was interpreted asa shallow magma intrusion that had been accom-modated without reaching the surface, and thewarning to the authorities was withdrawn. Thesubsisting indications of magma storage givenby the long-term GPS-microgravity observationscorrespond to a level of concern that is managedinternally by the project’s team, and the warningsto the authorities are issued only in the combinedpresence of short-term indicators such as anoma-lous tilt or increased long-period earthquakes ortremor.
7. Discussion
The experience gained in the ¢rst years of mon-itoring Fogo Volcano con¢rms the widely ac-cepted idea that only through the integration ofdi¡erent types of data can some insight be gainedabout the evolution of a volcanic system. Broad-band seismic data have proved very useful in the
detection and study of sustained volcanic tremorand long-period volcanic events, important indi-cators of magma or gas movements under thesurface. While tiltmeter observations providedan e¡ective means of quickly detecting anomaloussurface deformation, great care had to be exer-cised in the selection of sites and quality controlof the data, due to mechanical coupling problemsthat are likely to occur in a heterogeneous me-dium such as a stratovolcano. Joint GPS and mi-crogravity surveying can provide important infor-mation on the evolution of the volcanic system onthe time scale of several months to one year. Butground deformation monitoring could be substan-tially improved by the introduction of continuousGPS and InSAR.One of the main lessons from the operation of
the VIGIL Network concerns the need to recordmeteorological data together with the geophysicaldata. In particular, the interpretation of tiltmeterdata must be made in conjunction with meteoro-logical data, because at 0.005 Wrad sensitivity thevariations of environmental parameters are re-£ected on the data. This corresponds to real de-formations in the region around the site and notto the direct e¡ect on the sensor, and thereforecannot be eliminated completely by the selectionof well-insulated sites.In hindsight, the in£ation recorded by the GPS
surveys from November 1999 to June 2000, andthe accompanying mass/density increase recordedby the gravity surveys, may be regarded as a me-dium-term precursor to the September 2000 crisis.Whilst continued observation of the volcano overa period of years will be required to establish thetrue signi¢cance of these observations, the eventspointed out the value of combining continuous-monitoring techniques with the long-term dataprovided by epochal geodetic and gravity surveys.The anomalous observations of September 2000
coincided with the rainy season in Fogo Island,and in the absence of remotely-accessible informa-tion about the weather conditions (the meteo sta-tion having been installed in the Summer of 2001only) the ambiguity subsisted as to whether astorm could be responsible for such signals. Inparticular, the episode of very strong seismic noiseshown in Fig. 16, recorded on the steep eastern
VOLGEO 2605 19-6-03
J.F.B.D. Fonseca et al. / Journal of Volcanology and Geothermal Research 125 (2003) 39^5654
£ank of the volcano, could be due to transientwaterfalls near the seismic station. However, theanomalous tilt recorded simultaneously at FMLNand FPPC led us to dismiss that interpretation.Alternatively, the observations could point to aninteraction between the gradually recharging aqui-fers and shallow magma.
Acknowledgements
This research was supported by the Portuguesegovernment through FCT (Programme PRAXIS,Contracts PCNA/C/CTE/25/96 and P/CTE/12269/1998), and ICP. Further support was granted bythe Gulbenkian Foundation (Lisbon), the ECGS(Luxembourg), the Ministry of Foreign A¡airsand Cooperation of Luxembourg, and the NGO‘Amities Luxembourg Cap Verd’. S.I.N.H. ac-knowledges a post-doctoral grant from FCT,and B.V.E.F. acknowledges a Ph.D. grant fromGRICES (Lisbon). Peggy Hellweg and Horst Ra-demacher (Geo Enterprises Orinda) assisted insite selection and instrument testing, and GillesCelli (ECGS) provided informatics expertise. L.Fisher helped with the shot-point recording ofthe quarry blast in Fig. 7. Susana Vilanova andPaulo Rodrigues participated in the deployment.Two anonymous reviewers helped improve themanuscript, and Michele Soares assisted withthe production of the ¢gures. The authors areindebted to Teresa Leyens (Fogo Natural Park)for her continual support. Our thanks go also tothe sta¡ of LECV, Praia, for their support, andto the population of Cha das Caldeiras for theirhospitality.
References
Assuncao, C.F.T., 1954. Expedicao Cienti¢ca a Ilha do Fogo(Estudos Petrogra¢cos). Junta de Investigacoes do Ultra-mar, Lisbon.
Assuncao, C.F.T., Machado, F., Silva, L.C., 1967. Petrologia evulcanismo da Ilha do Fogo (Cabo Verde). Garcia Orta 15,99^110.
Berberan, A., 1997. Preliminary Design for the Geodetic Mon-itoring Network of Fogo Volcano. Internal Report 13/97-NMG/DB, LNEC, Lisbon.
Berrino, G., Rymer, H., Brown, G.C., Corado, G., 1992.Gravity-height correlations for unrest at calderas. J. Volca-nol. Geotherm. Res. 53, 11^26.
Chouet, B.A., 1985. Excitation of a buried magmatic pipe: aseismic source model for volcanic tremor. J. Geophys. Res.90, 1881^1893.
Chouet, B.A., 1996. Long-period volcanic seismicity: its sourceand use in eruption forecasting. Nature 380, 309^315.
Chui, C., 1992. An Introduction to Wavelets. Academic Press,San Diego.
Courtney, R.C., White, R.S., 1986. Anomalous heat-£ow andgeoid across the Cape Verde Rise: Evidence for dynamicsupport from a thermal plume in the mantle. Geophys. J.R. Astron. Soc. 87, 815^867.
Day, S.J., Heleno, S.I.N., Fonseca, J.F.B.D., 1999. A pastgiant lateral collapse and present-day £ank instability ofFogo, Cape Verde Islands. J. Volcanol. Geotherm. Res.94, 191^218.
Day, S., Carracedo, J.C., Gillou, H., Fonseca, J.F.B.D., Hel-eno, S.I.N., Pais, J., Badiola, E., 2000. Comparison andcross-checking of evidence for the location and type of his-torical eruptions in ocean island volcanoes. In: McGuire, W.(Ed.), Volcanoes, Earthquakes and Archeology. SpecialPublication, Geological Society, London.
D’Oreye, N.F., 2001. Conclusions preliminaires sur les donnesinclinometriques et meteorologiques du reseau de surveil-lance VIGIL pour le volcan Pico de Fogo, archipel duCap Vert. Internal report, ECGS, Luxembourg.
Dvorak, J.J., 1993. Volcano geodesy: results of 100 years ofsurveillance. Cah. ECGS 8, 1^19.
Fonseca, J.F.B.D., Day, S.J., Matos, J.L.G., Lima, J.N.P.,Berberan, A., Heleno, S.I.N., Amelung, F., d’Oreye, N.,1998. Ground deformation monitoring in the Fogo Volcano,Cape Verde Islands. Comptes Rendus 83rd Journe¤es Luxem-bourgeoises de Ge¤odynamique, ECGS, Luxembourg.
Havskov, J., 1995. The SEISAN Earthquake Analysis Soft-ware for the IBM PC and SUN, Version 5.0. ISEP, Bergen.
Heleno, S.I.N., 2001. Estudo Sismologico do Vulcao do Fogo.Ph.D. Thesis, Instituto Superior Tecnico, Lisbon.
Heleno, S.I.N., Fonseca, J.F.B.D., 1999. A seismological in-vestigation of the Fogo Volcano: Preliminary results. Vol-canol. Seismol. 20, 199^217.
Heleno, S.I.N., Day, S.J., Fonseca, J.F.B.D., 1999. Fogo Vol-cano, Cape Verde Islands: seismicity-derived constraints onthe mechanism of the 1995 eruption. J. Volcanol. Geotherm.Res. 94, 219^231.
Lima, J.N.P., 2001. O Sistema Global de Posicionamento naMonitorizacao Geodesica da Ilha do Fogo. Ph.D. Thesis,IICT, Lisbon.
Machado, F., 1965a. Mechanism of Fogo Volcano, CapeVerde Islands. Garcia Orta 13, 51^56.
Machado F., 1965b. Vulcanismo das Ilhas de Cabo Verde e deoutras Ilhas Atlantidas. Ed. Junta de Investigacoes do Ul-taramar, Lisbon.
Machado, F., Leme, J.A., Monjardino, J., Seita, M.F., 1968.Carta geologica de Cabo Verde, noticia explicativa da folhada ilha Brava e Ilheus Secos. Garcia Orta 16, 123^130.
VOLGEO 2605 19-6-03
J.F.B.D. Fonseca et al. / Journal of Volcanology and Geothermal Research 125 (2003) 39^56 55
McNutt, M., 1988. Thermal and mechanical properties of theCape Verde Rise. J. Geophys. Res. 93, 2784^2794.
Munha, J.M., Mendes, M.H., Palacios, T., Silva, L.C., Torres,P.C., 1997. Petrologia e geoquimica da erupcao de 1995 e deoutras lavas historicas na ilha do Fogo, Cabo Verde. In:Re¡ega, A. (Ed.), A Erupcao Vulcanica de 1995 na Ilhado Fogo, Cabo Verde. IICT, Lisbon, pp. 171^176.
Quental, L.M.A.R., 1999. Modelo para a Avaliacao de Hazarde Risco Vulcanico na Ilha do Fogo, Cabo Verde, M.Sc.Thesis, Instituto Superior Tecnico, Lisbon.
Ribeiro, O., 1960. A Ilha do Fogo e as suas Erupcoes. Junta deInvestigacoes do Ultramar, Lisbon.
Silveira, A.B., Serralheiro, A., Martins, I., Cruz, J., Munha, J.,
Pena, J., Matias, L., Senos, L., 1995. A erupcao da Cha dasCaldeiras (Ilha do Fogo) de 2 de Abril de 1995. ProteccaoCivil 7, 3^14.
Torres, P.C., Madeira, J., Silva, L.C., Brum da Silveira, A.,Serralheiro, A., Mota Gomes, A., 1997. Carta geolo¤gica daserupcoes historicas da ilha do Fogo: revisao e actualizacao.In: Re¡ega, A. (Ed.), A Erupcao Vulcanica de 1995 na Ilhado Fogo, Cabo Verde. IICT, Lisbon, pp. 119^132.
Williams-Jones, G., Rymer, H., 2002. Detecting volcanic erup-tion precursors: A new method using gravity and deforma-tion methods. J. Volcanol. Geotherm. Res. 113, 379^389 (inpress).
VOLGEO 2605 19-6-03
J.F.B.D. Fonseca et al. / Journal of Volcanology and Geothermal Research 125 (2003) 39^5656