


Basic Algebra: Second Semester - Tanque Verde Unified ...
350
-
Upload
khangminh22 -
Category
Documents
-
view
0 -
download
0
Transcript of Basic Algebra: Second Semester - Tanque Verde Unified ...


Basic Algebra: SecondSemester
Emily Gray
Say Thanks to the AuthorsClick http://www.ck12.org/saythanks
(No sign in required)

www.ck12.org
To access a customizable version of this book, as well as otherinteractive content, visit www.ck12.org
CK-12 Foundation is a non-profit organization with a mission toreduce the cost of textbook materials for the K-12 market both inthe U.S. and worldwide. Using an open-source, collaborative, andweb-based compilation model, CK-12 pioneers and promotes thecreation and distribution of high-quality, adaptive online textbooksthat can be mixed, modified and printed (i.e., the FlexBook®textbooks).
Copyright © 2018 CK-12 Foundation, www.ck12.org
The names “CK-12” and “CK12” and associated logos and theterms “FlexBook®” and “FlexBook Platform®” (collectively“CK-12 Marks”) are trademarks and service marks of CK-12Foundation and are protected by federal, state, and internationallaws.
Any form of reproduction of this book in any format or medium,in whole or in sections must include the referral attribution linkhttp://www.ck12.org/saythanks (placed in a visible location) inaddition to the following terms.
Except as otherwise noted, all CK-12 Content (including CK-12Curriculum Material) is made available to Users in accordancewith the Creative Commons Attribution-Non-Commercial 3.0Unported (CC BY-NC 3.0) License (http://creativecommons.org/licenses/by-nc/3.0/), as amended and updated by Creative Com-mons from time to time (the “CC License”), which is incorporatedherein by this reference.
Complete terms can be found at http://www.ck12.org/about/terms-of-use.
Printed: January 12, 2018
AUTHOREmily Gray
iii

Contents www.ck12.org
Contents
1 Real Number System 1
2 Solving Equations 2
3 Rates, Ratios, Proportions, and Percents 3
4 Functions 4
5 Introduction to Linearity 5
6 Systems of Linear Equations 6
7 Patterns of Association in Bivariate 77.1 Writing Linear Equations Review . . . . . . . . . . . . . . . . . . . . . . . . . . . . . . . . . . 87.2 Scatter Plots . . . . . . . . . . . . . . . . . . . . . . . . . . . . . . . . . . . . . . . . . . . . . 167.3 Model Linear Equations with Scatter Plots and Lines of Best Fit . . . . . . . . . . . . . . . . . 297.4 Linear Models of Bivariate Data . . . . . . . . . . . . . . . . . . . . . . . . . . . . . . . . . . 407.5 Two-Way Frequency Tables . . . . . . . . . . . . . . . . . . . . . . . . . . . . . . . . . . . . . 507.6 Mean, Median, Mode, Range, and M.A.D . . . . . . . . . . . . . . . . . . . . . . . . . . . . . 607.7 Double Stem-and-Leaf Plots . . . . . . . . . . . . . . . . . . . . . . . . . . . . . . . . . . . . 677.8 Interpreting Box-and-Whisker Plots . . . . . . . . . . . . . . . . . . . . . . . . . . . . . . . . 767.9 References . . . . . . . . . . . . . . . . . . . . . . . . . . . . . . . . . . . . . . . . . . . . . . 83
8 Geometric Relationships 848.1 Angle Pairs . . . . . . . . . . . . . . . . . . . . . . . . . . . . . . . . . . . . . . . . . . . . . 858.2 Angles and Triangles . . . . . . . . . . . . . . . . . . . . . . . . . . . . . . . . . . . . . . . . 978.3 Quadrilaterals . . . . . . . . . . . . . . . . . . . . . . . . . . . . . . . . . . . . . . . . . . . . 1088.4 Polygons and Angles . . . . . . . . . . . . . . . . . . . . . . . . . . . . . . . . . . . . . . . . 1188.5 Congruent Polygons . . . . . . . . . . . . . . . . . . . . . . . . . . . . . . . . . . . . . . . . . 1298.6 References . . . . . . . . . . . . . . . . . . . . . . . . . . . . . . . . . . . . . . . . . . . . . . 137
9 Transformations 1389.1 Reflections and Symmetry . . . . . . . . . . . . . . . . . . . . . . . . . . . . . . . . . . . . . 1399.2 Translations and Rotations . . . . . . . . . . . . . . . . . . . . . . . . . . . . . . . . . . . . . 1509.3 Similarity and Dilations . . . . . . . . . . . . . . . . . . . . . . . . . . . . . . . . . . . . . . . 1659.4 Transformation Sequences . . . . . . . . . . . . . . . . . . . . . . . . . . . . . . . . . . . . . 1769.5 References . . . . . . . . . . . . . . . . . . . . . . . . . . . . . . . . . . . . . . . . . . . . . . 189
10 Pythagorean Theorem 19010.1 Simplest Radical Form . . . . . . . . . . . . . . . . . . . . . . . . . . . . . . . . . . . . . . . 19110.2 Estimating Square Roots . . . . . . . . . . . . . . . . . . . . . . . . . . . . . . . . . . . . . . 19510.3 Solving equations with Square Roots . . . . . . . . . . . . . . . . . . . . . . . . . . . . . . . . 20110.4 The Pythagorean Theorem . . . . . . . . . . . . . . . . . . . . . . . . . . . . . . . . . . . . . 205
iv

www.ck12.org Contents
10.5 Distance in Coordinate System & Pythagorean Triple . . . . . . . . . . . . . . . . . . . . . . . 22010.6 References . . . . . . . . . . . . . . . . . . . . . . . . . . . . . . . . . . . . . . . . . . . . . . 230
11 Surface Area and Volume 23111.1 Three-Dimensional Figures . . . . . . . . . . . . . . . . . . . . . . . . . . . . . . . . . . . . . 23211.2 Lines and Segments of Circles . . . . . . . . . . . . . . . . . . . . . . . . . . . . . . . . . . . 24311.3 Surface Area of Prisms and Cylinders . . . . . . . . . . . . . . . . . . . . . . . . . . . . . . . 25111.4 Surface Areas of Pyramids and Cones . . . . . . . . . . . . . . . . . . . . . . . . . . . . . . . 26411.5 Volume of Prisms and Cylinders . . . . . . . . . . . . . . . . . . . . . . . . . . . . . . . . . . 27211.6 Volume of Pyramids and Cones . . . . . . . . . . . . . . . . . . . . . . . . . . . . . . . . . . . 28111.7 Volume of Spheres . . . . . . . . . . . . . . . . . . . . . . . . . . . . . . . . . . . . . . . . . . 29211.8 References . . . . . . . . . . . . . . . . . . . . . . . . . . . . . . . . . . . . . . . . . . . . . . 301
12 Probability and Odds 30212.1 Counting Methods . . . . . . . . . . . . . . . . . . . . . . . . . . . . . . . . . . . . . . . . . . 30312.2 Permutations . . . . . . . . . . . . . . . . . . . . . . . . . . . . . . . . . . . . . . . . . . . . . 31112.3 Combinations . . . . . . . . . . . . . . . . . . . . . . . . . . . . . . . . . . . . . . . . . . . . 31912.4 Probability and Odds . . . . . . . . . . . . . . . . . . . . . . . . . . . . . . . . . . . . . . . . 32712.5 Independent and Dependent Events . . . . . . . . . . . . . . . . . . . . . . . . . . . . . . . . . 33612.6 References . . . . . . . . . . . . . . . . . . . . . . . . . . . . . . . . . . . . . . . . . . . . . . 344
v

www.ck12.org Concept 3. Rates, Ratios, Proportions, and Percents
CONCEPT 3 Rates, Ratios, Proportions,and Percents
3

www.ck12.org Concept 5. Introduction to Linearity
CONCEPT 5 Introduction to Linearity
5

www.ck12.org Chapter 7. Patterns of Association in Bivariate
CHAPTER 7 Patterns of Association inBivariate
Chapter Outline7.1 WRITING LINEAR EQUATIONS REVIEW
7.2 SCATTER PLOTS
7.3 MODEL LINEAR EQUATIONS WITH SCATTER PLOTS AND LINES OF BEST FIT
7.4 LINEAR MODELS OF BIVARIATE DATA
7.5 TWO-WAY FREQUENCY TABLES
7.6 MEAN, MEDIAN, MODE, RANGE, AND M.A.D
7.7 DOUBLE STEM-AND-LEAF PLOTS
7.8 INTERPRETING BOX-AND-WHISKER PLOTS
7.9 REFERENCES
7

7.1. Writing Linear Equations Review www.ck12.org
7.1 Writing Linear Equations Review
Write linear equations using tables of data, ordered pairs, and linear graphs.
Write a linear equation in slope-intercept form using the following data.
Find the slope (m) of the line.
m = riserun = y2−y1
x2−x1= 1.5−1
3−2 = 0.51 = 0.5 = 1
2
Note: any two ordered pairs from a straight line can be used to find the slope; the answer will always be thesame.
Substitute an ordered pair (x, y) from the table of values and slope (m) into the equation y = mx+ b to find they-intercept (b).
1 =12(2)+b
1 = 1+b
0 = b
Note: any ordered pair from the straight line can be used to find the y-intercept; the answer will always be thesame.
Write the equation in slope-intercept form by plugging in the values for m ( 12 or 0.5) and b (0) into the slope-intercept
equation y = mx+b.
y = 12 x+0 or y = 1
2 x
8

www.ck12.org Chapter 7. Patterns of Association in Bivariate
Write an equation in slope-intercept form using the following data.
Find the slope (m) of the line by choosing two points on the line to substitute into the slope formula. In this case,we’re using points (-2, 4) and (1, -5).
m = riserun = y2−y1
x2−x1= −5−4
1−(−2) =−93 = −3
1 =−3
Note: any two ordered pairs from a straight line can be used to find the slope; the answer will always be thesame.
Substitute an ordered pair (x, y) on the straight line and slope (m) into the equation y = mx+b to find the y-intercept(b).
4 =−3(−2)+b
4 = 6+b
−2 = b
Note: any ordered pair from the straight line can be used to find the y-intercept; the answer will always be thesame.
Write the equation in slope-intercept form by plugging in the values for m (-3) and b (-2) into the slope-interceptequation y = mx+b.
y =−3x−2
9

7.1. Writing Linear Equations Review www.ck12.org
• Slope-Intercept Form: y = mx+b
– m = slope (the ratio of rise over run or rate of change of a nonvertical line)– b = y-intercept
• The slope of a line is the same no matter which two points you choose to use in the slope equation.
10

www.ck12.org Chapter 7. Patterns of Association in Bivariate
1. Write a linear equation in slope - intercept form using the following data.
2. Write a linear equation in slope - intercept form using the following data.
3. True or False. y = 13 x−1 is the equation of the line for the following data set. If false, correct the errors to write
the true equation of the line.
4. Write a linear equation in slope - intercept form using the following data.
(-5, -10) and (5, -4)
11

7.1. Writing Linear Equations Review www.ck12.org
5. Write a linear equation in slope - intercept form using the following data.
(-3, 3.5) and (1, -0.5)
6. Write a linear equation in slope - intercept form using the following data.
7. Write a linear equation in slope - intercept form using the following data.
12

www.ck12.org Chapter 7. Patterns of Association in Bivariate
1. Solve the following linear system.{x = 2yx = 3y−3
2. Write 0.26 as a rational number (ab).
3. Write 811 as a decimal.
1. Write a linear equation in slope - intercept form using the following data.
(4, 5) and (1, −14 )
2. Write a linear equation in slope-intercept form using the following data.
13

7.1. Writing Linear Equations Review www.ck12.org
3. Write a linear equation in slope-intercept form using the following data.
For more videos and practice problems,
• click here to go to Khan Academy.• search for "Slope intercept form" on Khan Academy (www.khanacademy.org ).
Watch this video to further review finding the equation of a line given a table of values.
MEDIAClick image to the left or use the URL below.URL: http://www.ck12.org/flx/render/embeddedobject/117236
14

www.ck12.org Chapter 7. Patterns of Association in Bivariate
1. y = 2x + 4
2. y = 34 x−3 or y = 0.75x−3
3. False, y =−13 x−1. The slope is negative.
4. y = 35 x−7
5. y =−x+0.5
6. y = 4x+2
7. y =−54 +8
Bobcat Review
1. (6, 3)
2. 2699
3. 0.72
Bobcat Stretch
1. y = 74 x−2
2. y = 0.75x+2.00
3. y =−6x+8
15

7.2. Scatter Plots www.ck12.org
7.2 Scatter Plots
By the end of this lesson, you should be able to define and give an example of the following vocabulary words:
• Scatter Plot - a visual representation of the relationship between variables. In a scatter plot, each pointrepresents a paired measurement of two variables for a specific subject, and each subject is represented by onepoint on the scatter plot.
• Positive, Negative, or No Relationship Correlation - measures the relationship between bivariate data. Bi-variate data are data sets in which each subject has two observations associated with it.
– Positive Correlation - the values increase together. The data points have a positive linear association.
– Negative Correlation - when one value decreases, the other value increases. The data points have anegative linear association.
• – No Correlation - there is no relationship between the two values. The data points are nonlinear (do notfall along a line).
16

www.ck12.org Chapter 7. Patterns of Association in Bivariate
• Degree of Relationship - the degree to which bivariate data show a tendency to vary together.
– Strong - the points are close to one another. There is a strong linear association between the data points.
• – Weak - the points are further from each other, but still correlate. There is a weak linear associationbetween the data points.
• – Perfect - the points fall on a straight line. There is a perfect linear association between the data points.
• Outliers - Data points that don’t seem to fit with the rest of the data.
• Clustering - A group of points that fall in the same general area of the graph.
• Linear Associations - Data sets that are arranged in or extending along a straight or nearly straight line. Note:Nonlinear Associations are data sets that are arranged in or extending along a curved line.
17

7.2. Scatter Plots www.ck12.org
Make a scatter plot of the data. What conclusions can you make?
TABLE 7.1: A table of verbal SAT values and GPAs for seven students.
Student SAT Score GPA1 595 3.42 520 3.23 715 3.94 405 2.35 680 3.96 490 2.57 565 3.5
Plot the points from the table on a graph. In this case, SAT Score represents the x - axis and GPA is the y-axis, soplot (595, 3.4), (520, 3.2), etc... on the graph.
Examining a scatter plot graph allows us to obtain some idea about the relationship between two variables.
The data goes from the lower-left-to-upper-right, which is a positive pattern. This means that both valuesincrease together.
The data points are also close to one another and more-or-less in a straight line, so the correlation is strongbetween the variables.
So, the graph represents a strong, positive linear relationship between verbal SAT scores and GPA. Note: Theredoesn’t appear to be any outliers. There is a cluster of two points around 700.
From this chart, you can conclude that if a student has a high GPA, then they will probably score high on theverbal SAT and vice versa.
18

7.2. Scatter Plots www.ck12.org
1. Give 2 scenarios or research questions where you would use bivariate data sets.
2. Draw and label four scatter plot graphs. One should show:
a. a strong, positive correlation
b. a weak, negative correlation
c. a perfect, positive correlation
d. a zero correlation
3. The data below is from the Consumer Reports website. Make a scatter plot of the data to answer the question,where x = price and y = Consumer Reports quality rating. Is there a relationship between price and the quality ofathletic shoes? Explain your reasoning.
20

www.ck12.org Chapter 7. Patterns of Association in Bivariate
4. The following observations were taken for five students measuring grade and reading level.
TABLE 7.2: A table of grade and reading level for five students.
Student Number Grade Reading Level1 2 62 6 143 5 124 4 105 1 4
a. Draw a scatterplot for these data.
b. What type of relationship does this correlation have? Why?
c. Is it a strong or weak correlation? Why?
5. A teacher gives two quizzes to his class of 10 students. The following are the scores of the 10 students.
TABLE 7.3: Quiz results for ten students.
Student Quiz 1 Quiz 21 15 202 12 153 10 124 14 185 10 106 8 137 6 128 15 109 16 1810 13 15
a. Draw a scatterplot for these data. (x-axis: Quiz 1; y-axis: Quiz 2)
b. What type of relationship does this correlation have? Why?
c. Is it a strong or weak correlation? Why?
21
7.2. Scatter Plots www.ck12.org
6. For each of the following pairs of variables, is there likely to be a positive correlation, a negative correlation, orno correlation. Explain.
a. Mt. Lemmon’s daily snow fall and the number of skiers at Mt. Lemmon’s Ski Valley
b. Mean annual temperature and elevation
c. 100m World Record Time and Year
d. Missing Assignments and test grades for Basic Algebra students.
e. Height and grade point average for 8th grade students.
f. Miles of running per week and time in a marathon.
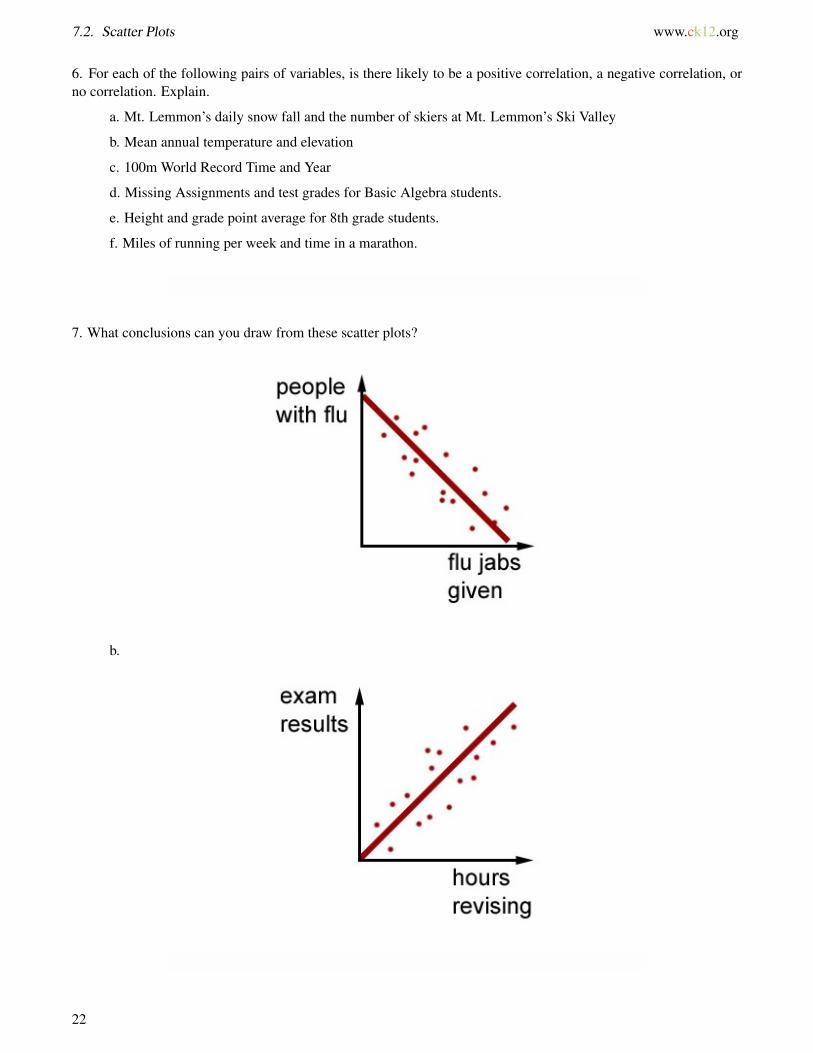
7. What conclusions can you draw from these scatter plots?
b.
22

www.ck12.org Chapter 7. Patterns of Association in Bivariate
8. The scatter plot below was constructed using data from a study of Rocky Mountain elk "Estimating Elk Weightfrom Chest Girth".
a. Are there any outliers in the scatter plot? If so, which one(s)?
b. Are there any clusters in the scatter plot? If so, where are the cluster(s) and give a possible reason why theyhave occurred in the data set?
9. Make a scatter plot of the data. Describe the relationship between x and y. Use the relationship to find the nextordered pair.
23

7.2. Scatter Plots www.ck12.org
10. Make a scatter plot of the data. Describe the relationship between hours of sleep and math test scores.
1. Estimate the value of√
10 to the nearest hundredth.
2. Simplify 68
68 .
3. Given the linear function y =−35 x+312.
a. Determine the rate of change.
b. Determine the initial value of the function.
24

www.ck12.org Chapter 7. Patterns of Association in Bivariate
1. Make a scatter plot of the data. Describe the relationship between % receiving reduced-fee lunch and % wearingbicycle helmets.
For more videos and practice problems,
• click here to go to Khan Academy.• search for "constructing scatter plots" on Khan Academy (www.khanacademy.org ).• go to Khan Academy’s Common Core page standard 8.SP.A.1 (www.khanacademy.org/commoncore/grade-
8-SP).
Watch this video to further review constructing scatter plots.
MEDIAClick image to the left or use the URL below.URL: http://www.ck12.org/flx/render/embeddedobject/98961
25

7.2. Scatter Plots www.ck12.org
1. Examples: student bed times and student grades; number of times eating out and obesity
2. See tips and tricks graphic to check your answers.
3. There is no correlation between price and quality rating of athletic shoes because the points are scattered acrossthe scatter plot. There is a nonlinear association between the data points.
4. Strong Positive Correlation
5. Weak Positive Correlation
6. a. Weak Positive Correlation
b. Strong Negative Correlation
c. Strong Positive Correlation
d. Strong Negative Correlation
e. No Correlation
f. Strong Positive Correlation
7. a. This graph represents a negative strong negative correlation between people with flu and flu jabs given. Whenmore jabs are given, the number of people with flu falls. Flu jabs prevent flu.
b. This graph represents a strong positive correlation between exam results and hours revising. The people whodo more revisions get higher exam results, so revising increases test scores.
8. a. Variable answers - The point in the lower left hand corner of the plot (96, 100) could be described as an outlier.There are no other points in the scatter plot that are near this one.
b. Variable answers - There appear to be 3 clusters. One cluster between 105 cm to 115 cm, another between 120cm to 145 cm, and a third one between 150 cm and 165 cm. It may be that age and gender play a role - maybe thefirst cluster includes young elk, the second one to females, and the third one to males.
26

www.ck12.org Chapter 7. Patterns of Association in Bivariate
9. The graph represents a perfect negative correlation between the variables x and y. This means as x increases, ydecreases. The next ordered pairs are (6, 5) and (7, 2). As x increases by 1, then y decreases by 3.
10. There is a strong, positive correlation between hours of sleep and math test scores. This means that the moresleep you get before a math test, then the better you will do on the test.
27

7.2. Scatter Plots www.ck12.org
Bobcat Review
1. 3.16
2. 1
3. a. −35
b. 312 (inital value is the y-intercept or when x =0)
Bobcat Stretch
1. There is strong, negative correlation between % receiving reduced-fee lunch and % using bicycle helmets. Thereis an outlier to the data. So the higher percentage of kids receiving reduced-fee lunch in a neighborhood correlatesto a lower percentage of kids using bicycle helmets.
28

www.ck12.org Chapter 7. Patterns of Association in Bivariate
7.3 Model Linear Equations with Scatter Plotsand Lines of Best Fit
Informally find the line of best fit. Write the equation of a linear model (slope-intercept form) using two points fromthe line of best fit and assess the model fit by judging the closeness of the data points to the line.
By the end of this lesson, you should be able to define and give an example of the following vocabulary word(s):
• Line of Best Fit / Trend Line - A straight line that best represents the data on a scatter plot and can be helpfulwhen making predictions based on the data. It can also determine the degree of linear relationship to the databy judging the closeness of the data ponts to the line. This line may pass through some of the points, none ofthe points, or all of the points.
• Outliers - Data points that don’t seem to fit with the rest of the data. When placing line of best fit, ignore theoutliers.
29

7.3. Model Linear Equations with Scatter Plots and Lines of Best Fit www.ck12.org
In reality, the relationship between dependent and independent variables can be linear, but not perfectly so (becausereality isn’t perfect). This means there are usually data points that don’t quite fit on a straight line, but we can stillassess the model using trend lines and line of best fit.
Make a scatter plot using the following data set. Draw a line of best fit, then use two points on the line to findthe equation of the line. Assess the accuracy linear model.
(0, 2); (1, 4.5); (2, 9); (3, 11); (4, 13); (5, 18); (6, 19.5)
Notice that the points look like they might be part of a straight line, although they wouldn’t fit perfectly on a straightline. When the points aren’t lined up perfectly, we just have to find a line that is as close to all the points as possible.
Here you can see that we could draw many lines through the points in our data set. However, the red line A is theline that best fits the points. You want to draw a line that has the least (sum of) distances between the data points andthe line of best fit.
30

www.ck12.org Chapter 7. Patterns of Association in Bivariate
Choose two data points that are on or very close to the line of best fit to find the slope of the line. Note: Do notchoose any two points from the data set. You must choose points along the line of best fit. In this case, let’s usepoints (3, 11) and (5, 18).
m = y2−y1x2−x1
m = 18−115−3 = 7
2
Substitute one of the order pairs into the formula to find the y-intercept (b). Let’s use point (3, 11).
11 = 72(3)+b
11 = 212 +b
11( 221) = b
2221 = b
Plug the slope and y-intercept into the equation of the line formula (slope-intercept form).
y = mx+b
y = 72 x+ 22
21
The data points are fairly close to the line of best fit, so you can use this linear equation to make fairly accuratepredictions based on the data.
• If the data set is close to the line, then there is a strong relationship between the variables. This means you canmore accurately assess the model and estimate other data points.
• If the data set is farther from the line of best fit, then there is a weaker relationship between the variables. Thismeans your model assessments will not be as accurate and you’ll have a more difficult time estimating otherdata points.
31

7.3. Model Linear Equations with Scatter Plots and Lines of Best Fit www.ck12.org
1. Nadia is training for a 5K race. The following table shows her times for each month of her training program.
TABLE 7.4:
Month Month number Average time (minutes)January 0 40February 1 38March 2 39April 3 38May 4 33June 5 30
a. Make a scatter plot of Nadia’s running times. (The independent variable, x, is the month and the dependentvariable, y, is the running time)
b. Draw a line of best fit on the scatter plot.
c. Find the equation of the line using two points from the line of best fit.
d. Assess the accuracy of the model to make predictions.
2. Peter is testing the burning time of “BriteGlo” candles. The following table shows how long it takes to burncandles of different weights.
TABLE 7.5:
Candle weight (oz) Time (hours)2 153 204 355 3610 8016 10022 12026 180
a. Make a scatter plot of BriteGlo’s burning times. (The independent variable, x, is the candle weight and thedependent variable, y, is the burning time)
b. Draw a Line of Best Fit on the scatter plot.
c. Find the equation of the line using two points from the line of best fit.
d. Assess the accuracy of the model to make predictions.
32

www.ck12.org Chapter 7. Patterns of Association in Bivariate
3. The plot below is a scatter plot of mean temperature in July and mean inches of rain per year for a sample ofmidwestern cities.
a. Choose a point in the scatter plot and explain what it represents.
b. Use the line provided to predict the mean number of inches of rain per year for a city that has a meantemperature of 70 degrees in July.
c. Given points (72, 34.9) and (65.5, 31), find the equation of the line and use it to check your estimation fromthe previous question (3b).
d. Assess the accuracy of the model to make predictions.
33

7.3. Model Linear Equations with Scatter Plots and Lines of Best Fit www.ck12.org
4. Scientists are interested in finding how different species adapt to finding food sources. One group studiedcrocodiles to find how their bite force was related to body mass and diet. The scatter plots below display thedata they collected. Four students drew lines to represent the trend in the data. For each student, write down whetheror not your think the line would be a good line to use to make predictions. Explain your reasoning.
5. Shiva is trying to beat the S’mores-eating record. The current record is 53.5 S’mores in 12 minutes. Each day hepractices and the following table shows how many s’mores he eats each day for the first week of his training.
TABLE 7.6:
Day No. of S’mores1 302 343 364 365 406 437 45
a. Draw a scatter plot and plot the data.
b. Draw a line of best fit.
c. Find the equation of the line.
d. Assess the accuracy of the model to make predictions.
34
www.ck12.org Chapter 7. Patterns of Association in Bivariate
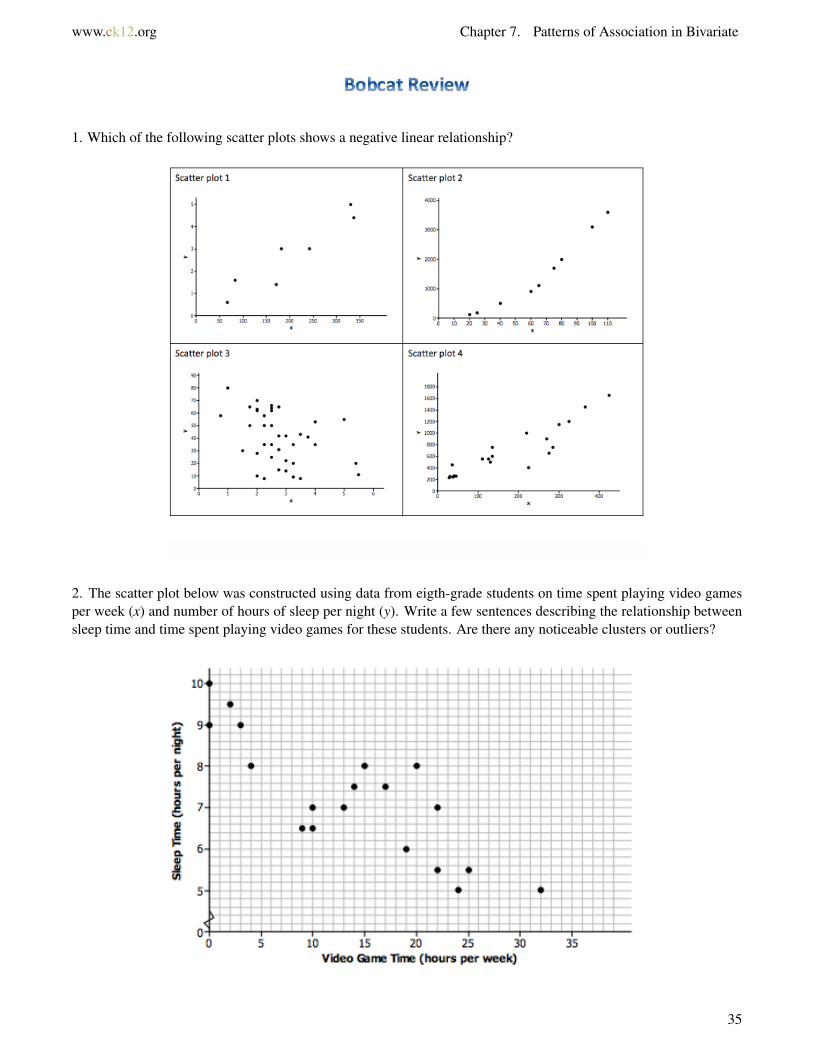
1. Which of the following scatter plots shows a negative linear relationship?
2. The scatter plot below was constructed using data from eigth-grade students on time spent playing video gamesper week (x) and number of hours of sleep per night (y). Write a few sentences describing the relationship betweensleep time and time spent playing video games for these students. Are there any noticeable clusters or outliers?
35

7.3. Model Linear Equations with Scatter Plots and Lines of Best Fit www.ck12.org
3. In a scatter plot, if the values of y tend to increase as the value of x increases, would you say that there is a positiverelationship or a negative relationship between x and y? Explain your answer.
1. Given the data set, (57.5, 45.7); (65.3, 61.5); (34.2, 30.8); (87.6, 78.2); (42.3, 41.7); (35.6, 36.1); (59, 35.8); (61.2,57.3); (25.8, 23.2); (35.5, 34.5).
a. Draw a scatter plot and draw the line of best fit. Label the best line of fit "A", then find the equation of theline A.
b. Add three new data points (80.3, 60.5), (90.7, 65.3), and (85.3, 58.8). Draw a second line of best fit takinginto account the new data points, label the new line "B". Find the equation of the line B.
d. How did the new data points change the line of best fit? Which model is more accurate? Explain yourreasoning.
For more videos and practice problems,
• click here to go to Khan Academy.• search for "Estimating the line of best fit" on Khan Academy (www.khanacademy.org ).• go to Khan Academy’s Common Core page standard 8.SP.A.2 (www.khanacademy.org/commoncore/grade
-8-SP).• Click here to go to a great website where you can easily create your own data sets and see how data points
affect the line of best fit (down at the very bottom of the page). (http://staff.argyll.epsb.ca/jreed/math9/strand4/scatterPlot.htm )
Watch this video for further review of lines of best fit and scatter plots.
MEDIAClick image to the left or use the URL below.URL: http://www.ck12.org/flx/render/embeddedobject/100857
36
www.ck12.org Chapter 7. Patterns of Association in Bivariate
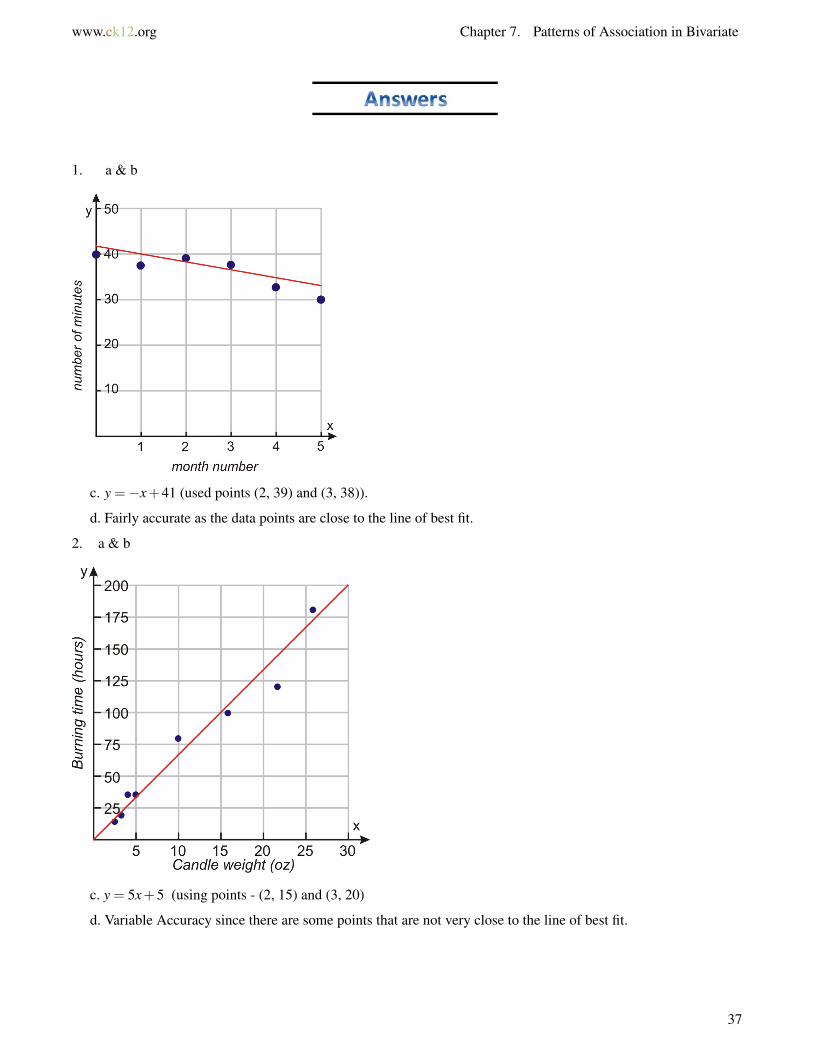
1. a & b
c. y =−x+41 (used points (2, 39) and (3, 38)).
d. Fairly accurate as the data points are close to the line of best fit.
2. a & b
c. y = 5x+5 (using points - (2, 15) and (3, 20)
d. Variable Accuracy since there are some points that are not very close to the line of best fit.
37

7.3. Model Linear Equations with Scatter Plots and Lines of Best Fit www.ck12.org
3. a. Variable answers - The point at about (72.35) represents a midwestern city where the mean temperature in Julyis about 72 degrees and where the rainfall per year is about 35 inches.
b. ~ 33 inches of rain per year.
c. y = 0.6x−8.3 , 33.7 inches of rain per year.
d. Yes, the line follows the general pattern in the scatter plot, and it does not look like there is another area in thescatter plot where the points would be any closer to the line.
4. a. It looks like Sal’s line overestimates the bit force for heavier crocodiles and underestimates the bite force forcrocodiles that do not weigh as much.
b. It looks like Patti’s line fits the data well, it would probably produce good predictions. The line goes throughthe middle of the points in the scatter plot, and the points are fairly close to the line.
c. It looks like Martha’s line overestimates the bite force because almost all of the points are below the line.
d. It looks like Taylor’s line tends to underestimate the bite force. There are many points above the line.
5. a & b.
c. y = 2x+28
d. Variable Accuracy since there are some points that are not very close to the line of best fit.
Bobcat Review
1. Scatter plot 3, because it is the only one where the y-values are decreasing as the value of x increases.
2. Variable answers - There appears to be a negative linear relationship between the number of hours per weeka student plays video games and the number of hours per night the student sleeps. As video game time increase,number of hours of sleep tends to decrease. There is one observation that might be considered an outlier - the pointcorresponding to a student who plays video games 32 hours per week. Other than the outlier, there are two clusters- one corresponding to students who spend very little time playing video games and a second corresponding tostudents who play video games between about 10 and 25 hours per week.
38
www.ck12.org Chapter 7. Patterns of Association in Bivariate
3. A positive relationship. If the value of y increases as the value of x increases, the points go up on the scatter plotas you go left to right.
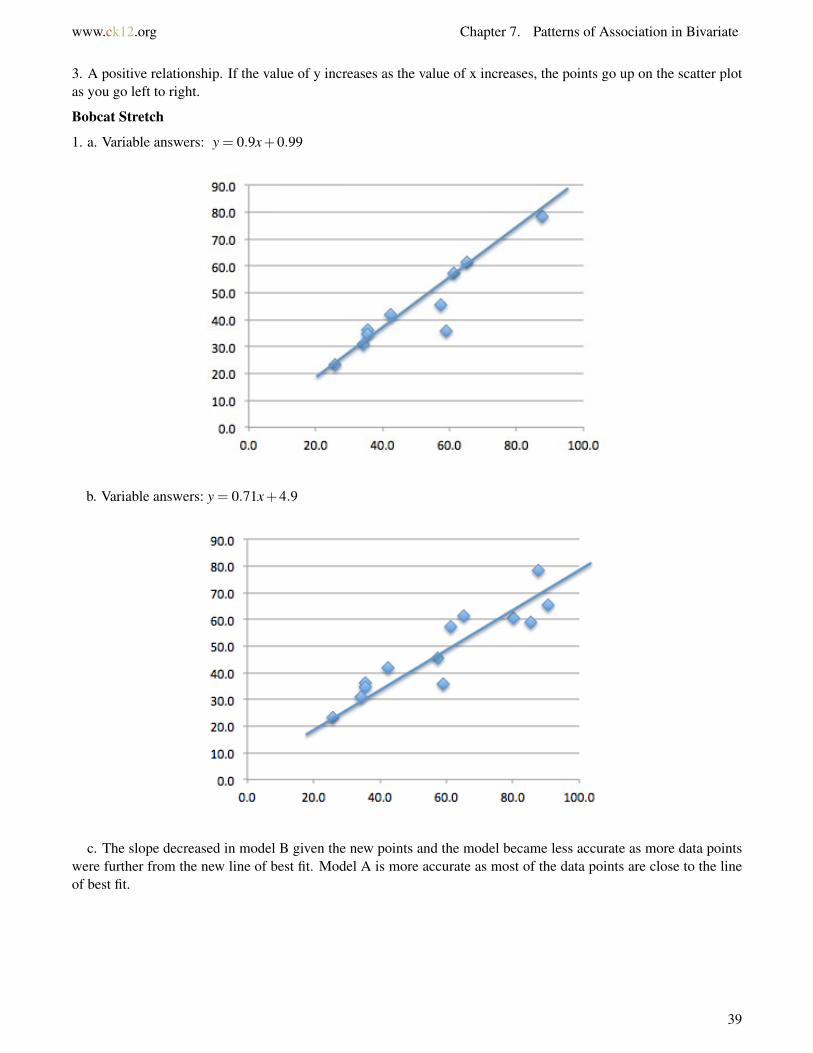
Bobcat Stretch
1. a. Variable answers: y = 0.9x+0.99
b. Variable answers: y = 0.71x+4.9
c. The slope decreased in model B given the new points and the model became less accurate as more data pointswere further from the new line of best fit. Model A is more accurate as most of the data points are close to the lineof best fit.
39

7.4. Linear Models of Bivariate Data www.ck12.org
7.4 Linear Models of Bivariate Data
Model linear equations of bivariate data, then interpret the slope and intercept and use the model to make predictions.
The following data represents data collected from a child’s reading contest at school. The x-values representthe number of days of the contest and the y-values represent # of books read.
(0, 2); (1, 5); (2, 9); (3, 11); (4, 13); (5, 18); (6, 19.5)
a. Make a scatter plot of the following ordered pairs and draw a line of best fit.
b. Find the equation of the line and explain what the slope and y-intercept mean given the context ofthe situation.
c. Use the equation to predict how many books were read on day 7. Assess the accuracy of theprediction.
a. Plot the points on a scatter plot and draw a line of best fit.
40

www.ck12.org Chapter 7. Patterns of Association in Bivariate
b. Once you draw the line of best fit, you can find its equation by using two points on the line (Note: you must usetwo points on the line of best fit, which is usually not 2 points from the data set).
In this example, it happens that two of the data points are very close to the line of best fit, so we can just usethese points to find the equation of the line: (1, 5) and (3, 11).
Start with the slope-intercept form of a line: y = mx+b, where m = slope and b = y-intercept.
Find the slope, where m = y2−y1x2−x1
.
m = 11−53−1 = 6
2 = 3.
So y = 3x+b.
Plug (3, 11) into the equation: 11 = 3(3)+b⇒ b = 2
So the equation for the line that fits the data best is y = 3x+2. This means that the student started the contest(day 0) having read 2 books (b = 2) and then read 3 books per day during the contest (m = 3).
Note: Sometimes predictive linear models have y-intercepts that do not make sense given the context of the situation.In this case, the y-intercept should be 0 as on day 0 of the reading contest, 0 books have been read. Two does notmake sense in this linear model.
c. Use the given linear equation to determine how many total books were read by day 7. Substitute 7 for x and solvefor y.
y = 3(7)+2
y = 21+2
y = 23
This linear model predicts that the student will have read 24 books by day 7, which is represented by plotpoint (7, 24) on the scatter plot. It should be a fairly accurate prediction since the data points are pretty closeto the line of best fit.
• Caution: Make sure you don’t get caught making a common mistake. Sometimes the line of best fit won’tpass straight through any of the points in the original data set. This means that you can’t just use two pointsfrom the data set - you need to use two points that are on (or very close to) the line, which might not be inthe data set at all.
• Sometimes predictive linear models have y-intercepts that do not make sense given the context of the situation.
41

7.4. Linear Models of Bivariate Data www.ck12.org
1. Old Faithful is a geyser in Yellowstone National Park. The following table offers some rough estimates of thelength of an eruption (in minutes) and the amount of water (in gallons) in that eruption.
a. Which of the following two scatter plots should be used to build the linear model to make accuratepredictions about future eruptions? Explain your reasoning.
b. Use the first and last data points in the table to create a linear prediction model.
c. A amateur travel blog site says that Old Faithful produces about 3,000 gallons of water for every minutethat it erupts. Does the linear model from part (b) support this claim? Explain your reasoning.
d. Using the linear model from part (b), does it makes sense to intepret the y-intercept in the context of thisproblem? Explain your reasoning.
2. According to the Bureau of Vital Statistics for the NYC Department of Health, the life expectancy at birth (nyears) for New York City babies is as follows.
a. Draw a scatter plot to determine if there appears to be a linear relationship between year of birth and lifeexpectancy. Fit a line to the data.
b. Determine an approximate linear equation that models the given data.
c. Based on the context of the problem, interpret in words the intercept and slope of the line you found in part(b).
d. Use your line to predict life expectancy for babies born in New York City in 2010.
42

www.ck12.org Chapter 7. Patterns of Association in Bivariate
3. Basketball players who score a lot of points also tend to be strong in other areas of the game, such as number ofrebounds, number of blocks, number of steals, and number of assists. Below are scatter plots and linear models forprofessional NBA players last season.
a. The line that models the association between points scored and number of rebounds is y = 3.833x+21.54, wherey = points scored and x = number of rebounds. Give an interpretation, in context, of the slope of this line.
b. An increase in which of the variables (rebounds, block, steals, or assists) tends to have the largest impacton the predicted points scored by an NBA player?
c. Which of the four linear models shown in the scatter plots above has the worst line of best fit? Explain yourreasoning.
d. If a player had 144 steals, then use the provided linear model (y = 98.03+ 9.558x) to predict how manypoints the player scored for the season.
43

7.4. Linear Models of Bivariate Data www.ck12.org
4. Anne is trying to find the elasticity coefficient of a Superball. She drops the ball from different heights andmeasures the maximum height of the ball after the bounce. The table below shows the data she collected.
TABLE 7.7:
Initial height (cm) Bounce height (cm)30 2235 2640 2945 3450 3855 4060 4565 5070 52
a. Draw a scatter plot and construct a linear model of the data.
b. Using a line of best fit, what height would she have to drop the ball from for it to bounce 65 cm?
c. Write a linear prediction model. What are the meanings of the slope and the y-intercept in this problem?
d. Does the y-intercept make sense?
5. The following table shows the median California family income from 1995 to 2002 as reported by the US CensusBureau.
TABLE 7.8:
Year Income1995 53,8071996 55,2171997 55,2091998 55,4151999 63,1002000 63,2062001 63,7612002 65,766
a. Draw a scatter plot and construct a linear model of the data.
b. What would you expect the median annual income of a Californian family to be in year 2010?
c. What are the meanings of the slope and the y-intercept in this problem?
d. Inflation in the U.S. is measured by the Consumer Price Index, which increased by 20% between 1995 and2002. Did the median income of California families keep up with inflation over that time period? (In otherwords, did it increase by at least 20%?) Explain.
44

www.ck12.org Chapter 7. Patterns of Association in Bivariate
6. Jack planted a bean stalk and recorded its height each week. Here’s the linear model of the bean stalk’s growth,where h = height in feet and w = weeks since the stalk was first planted.
h = 112 w+ 5
2
a. What does the slope of the linear model represent?
b. What does the y-intercept of the linear model represent? Does it make sense?
c. The linear model predicts the height of the bean stalk will be 125 ft after how many weeks?
d. How many feet tall does the linear model predict the bean stalk will be after 5 weeks?
1. Calculate each of the following:
a. 4.6×10⁴ +5.3×10⁵
b. 4.7×10⁻³−2.4×10⁻⁴
c. (7.3×105)× (6.8×104)
d. (4.8×10⁹)÷ (5.79×10⁷)
2. Plot 1.25, 72 , and 2
√6 on a number line.
45
7.4. Linear Models of Bivariate Data www.ck12.org
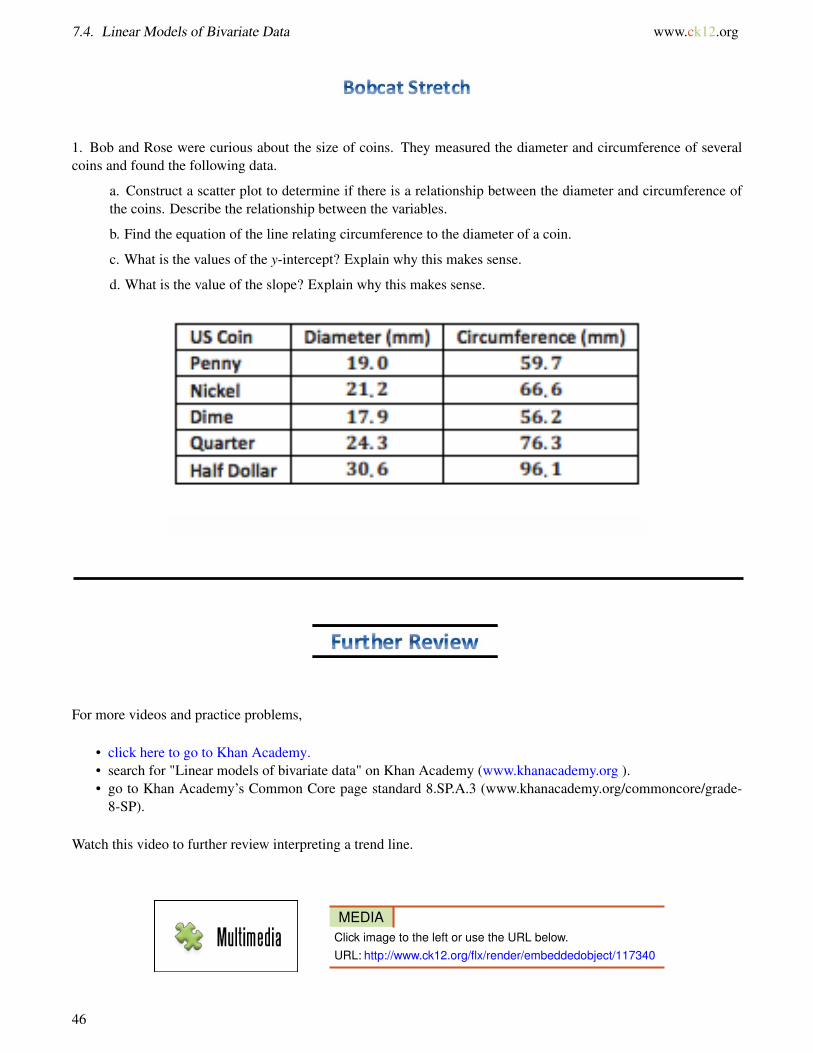
1. Bob and Rose were curious about the size of coins. They measured the diameter and circumference of severalcoins and found the following data.
a. Construct a scatter plot to determine if there is a relationship between the diameter and circumference ofthe coins. Describe the relationship between the variables.
b. Find the equation of the line relating circumference to the diameter of a coin.
c. What is the values of the y-intercept? Explain why this makes sense.
d. What is the value of the slope? Explain why this makes sense.
For more videos and practice problems,
• click here to go to Khan Academy.• search for "Linear models of bivariate data" on Khan Academy (www.khanacademy.org ).• go to Khan Academy’s Common Core page standard 8.SP.A.3 (www.khanacademy.org/commoncore/grade-
8-SP).
Watch this video to further review interpreting a trend line.
MEDIAClick image to the left or use the URL below.URL: http://www.ck12.org/flx/render/embeddedobject/117340
46

www.ck12.org Chapter 7. Patterns of Association in Bivariate
1. a. The predicted variable goes on the vertical axis and the predictor on the horizontal axis. So, the amount ofwater goes on the y-axis and the length (minutes) goes on the x-axis. The plot on the graph on the right should beused.
b. y = 1566.7x+1350
c. The slope in the linear model is 1566.7, which means that 1566.7 gallons of water erupts every 1 minute. Thisis different than the claim made by the blog site (3,000 gallons per minute). The blog site must be thinking of adifferent geyser.
d. No, because the length of an eruption is 0, then it cannot produce 1350 gallons of water. Some predictive linearmodels will have y-intercepts that do not make sense within the context of a problem.
2. a. Life expectancy and year of birth appear to be linearly related.
b. Variable answers: y = 0.34x−597.4 (for line through (2001, 77.9) and (2009, 80.6)).
y = 0.34x−77.4 (for line through (1, 77.9) and (9, 80.6)).
c. The intercept says that babies born in NYC in Year 0 should expect to live around -597 year. This isobviously ridiculous, so interpreting the intercept is meaningless in this problem. As for slope, life expectancyincreases 0.34 years per 1 year, which is a little over four months. This makes sense.
d. Variable answers: 80.9 years, which is also the value given on the website. Needless to say, this is a prettyaccurate linear model.
3. a. If the number of rebounds increases by one, then the model predicts the number of points increases by 3.833.
b. Each additional block corresponds to 22.45 more points, the largest slope or rate of increase.
c. Probably number of blocks because the association is weaker. There is more scatter of the points away fromthe line.
47

7.4. Linear Models of Bivariate Data www.ck12.org
d. 1474
4. a.
b. about 89cm
c & d. y= 0.767x+(−1.02)The slope tells us that the bounce height increased 0.767 cm per cm of ball height. They-intercept tells us that when the ball is bounced at 0 height, then it bounces -1.02 cm, which doesn’t make sense. Asthe ball should bounce at 0cm (0,0). Remember you’re working with a line of best fit, which is an approximation.
5. a. Good Luck!
b. $79,140.20
c. The slope tells us that income increases $1708.80 per year. The y-intercept tells us that at year 0, income was-3,355,547.80, which isn’t a very helpful data point when answering the current question.
d. Yes
6. a. The slope 112 or 5.5 means that the bean stalk grows 5.5 feet every week.
b. The y-intercept means the bean stalk was 52 or 2.5 feet tall when it was planted. This makes sense given the
bean stalk grows very tall.
c. 24511 or 22.27 weeks. 125 = 11
2 w+ 52
d. 30 feet tall or 602 . h = 11
2 (5)+52
Bobcat Review
1. a. 5.76×10⁵
b. 4.46×10⁻³
c. 4.964×10¹⁰
d. 8.29×101
Remember:
48

www.ck12.org Chapter 7. Patterns of Association in Bivariate
2.
Bobcat Stretch
1. a.
Circumference and diameter are linearly related because the data points fall along a line.
b. y = 3.14 x or (C = 3.14 d, where C = circumference and d = diameter)
c. If the diameter of a circle is 0, then according to the equation, its circumference is 0. That is true, so interpretingthe intercept of 0 makes sense in this problem.
d. The slope is 3.14 or pi. This makes sense because if the circumference of a circle is divided by its diameter, theresult is a constant, namely 3.14 or pi. This is true no matter what circle is being considered. In this case, for everymm the diameter increases on a coin, then the circumference increases by 3.14 cm.
49

7.5. Two-Way Frequency Tables www.ck12.org
7.5 Two-Way Frequency Tables
Construct and interpret a two-way table summarizing data in two different categories.
By the end of this lesson, you should be able to define and give an example of the following vocabulary words:
• Two-Way Frequency Table - Similar to a Venn diagram. It shows data that pertains to two differencecategories. The data from one sample group is shown as it relates to two different categories. One category isrepresented by rows and the other category is represented by columns.
• Relative Frequency - the ratio of the value of a subtotal to the value of the total or how often somethinghappens divided by outcomes. Relative frequency can be written as a ratio or percent.
– For example, if you won 5 games out of 10 games, then your relative frequency of winning is 5/10, or50%.
Suppose you conduct a survey where you ask each person two questions. Once you have finished conducting thesurvey, you will have two pieces of data from each person. Whenever you have two pieces of data from each person,you can organize the data into a two-way frequency table.
The table illustrates the results when 100 students were asked the survey questions: “Do you have a curfew?” and“Do you have assigned chores?” Is there evidence that those who have a curfew also tend to have chores?
Of the students who answered that they had a curfew, 40 had chores and 10 did not. Of the students who answeredthey did not have a curfew, 10 had chores and 40 did not. From this sample, there appears to be a positive correlationbetween having a curfew and having chores.
50

www.ck12.org Chapter 7. Patterns of Association in Bivariate
A group of people were surveyed about 1) whether they have cable TV and 2) whether they went on a vacation inthe past year.
The numbers in the frequency table show the number of people that fit each pair of preferences. For example, 97people have cable TV and took a vacation last year. 38 people have cable TV but did not take a vacation last yearout of a sample size of 166.
The totals of the rows and columns have been added to the frequency table for convenience. To help you interpretthe data more easily, you can calculate the relative frequency for each preference.
Now let’s ask a more specific question. For the people who didn’t take a vacation, are they more likely or less likelyto have cable TV? You can use the two-way frequency table to conclude that there is a positive correlation betweenpeople who have cable TV and people who take vacations. So, if you have cable TV, you are more likely to take avacation than people who don’t have cable TV.
Let’s figure out the relatively frequency for the column, no vacation. Interpreting the results, if you didn’t take avacation, odds are that you have Cable TV (because 69% of the people who didn’t take a vacation, have Cable TVversus 31% of people who do not).
51

7.5. Two-Way Frequency Tables www.ck12.org
• You can calculate relatively frequency within the row or column depending on which data you want tointerpret.
1. A group of 112 students were surveyed about what grade they were in and whether they preferred dogs or cats.32 seventh graders preferred dogs, 28 seventh graders preferred cats, 31 eighth graders preferred dogs, 21 eighthgraders preferred cats. Construct a two-way frequency table to organize this data.
2. Using the Two-Way Frequency table from practice problem 1, answer the following questions. Be sure youinclude the calculated relative frequencies you used to answer the question.
a. Are 7th graders more likely or less likely to prefer dogs? Why?
b. Are cats or dogs more preferred? Why?
c. Is there a correlation between grades and a preference for a dog or cat?
3. A group of 55 people were surveyed about the type of movies they prefer. 12 females preferred romanticcomedies, 10 females preferred action movies, 8 males preferred romantic comedies, and 25 males preferred actionmovies. Construct a two-way frequency table to organize this data.
4. Using the Two-Way Frequency table from practice problem 3, answer the following questions. Be sure youinclude the calculated relative frequencies you used to answer the question.
a. Are males more likely or less likely to prefer action movies? Why?
b. Are action movies or romatic comedies more preferred? Why?
c. Is there a correlation between gender and type of movie preferred? Why?
d. Which has the strongest correlation between gender and movie type preferred? Why?
e. Which has the weakest correlation between gender and movie type preferred? Why?
52

www.ck12.org Chapter 7. Patterns of Association in Bivariate
5. Based on the following data, should William Wallace III take Calculus if he wants to increase his chances ofgoing to college? Why?
6. The middle school students in your town were surveyed and classified according to grade level and response tothe question: “How do you usually get to school?". The data is summarized in the two-way table below.
a. For 7th graders what is the relative frequency that he/she takes the bus?
b. For 7th graders, what is the relative frequency that he/she rides in a car to school?
c. What is the relative frequency that a student who rides a bus to school is a 7th grader?
d. What is the relative frequency that a student who rides in a car to school is a 8th grader?
e. Is there a correlation between grade and mode of transportation to school? If there is a correlation is itstrong or weak? Why?
53
7.5. Two-Way Frequency Tables www.ck12.org
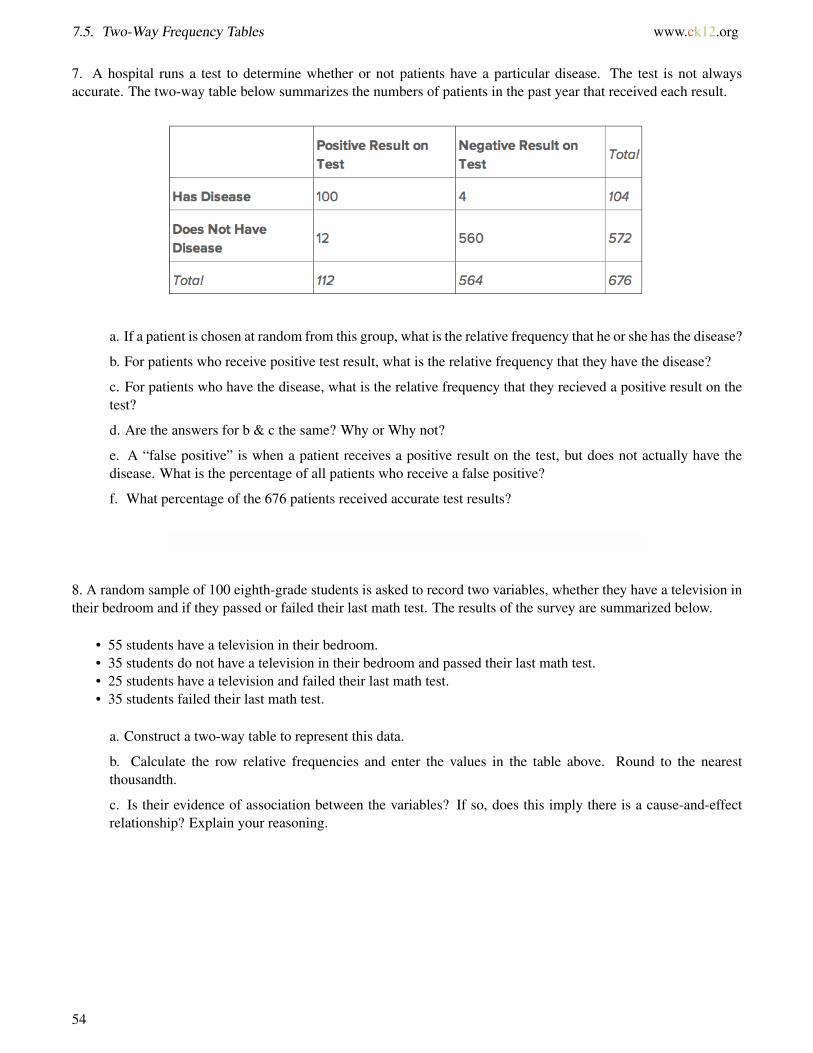
7. A hospital runs a test to determine whether or not patients have a particular disease. The test is not alwaysaccurate. The two-way table below summarizes the numbers of patients in the past year that received each result.
a. If a patient is chosen at random from this group, what is the relative frequency that he or she has the disease?
b. For patients who receive positive test result, what is the relative frequency that they have the disease?
c. For patients who have the disease, what is the relative frequency that they recieved a positive result on thetest?
d. Are the answers for b & c the same? Why or Why not?
e. A “false positive” is when a patient receives a positive result on the test, but does not actually have thedisease. What is the percentage of all patients who receive a false positive?
f. What percentage of the 676 patients received accurate test results?
8. A random sample of 100 eighth-grade students is asked to record two variables, whether they have a television intheir bedroom and if they passed or failed their last math test. The results of the survey are summarized below.
• 55 students have a television in their bedroom.• 35 students do not have a television in their bedroom and passed their last math test.• 25 students have a television and failed their last math test.• 35 students failed their last math test.
a. Construct a two-way table to represent this data.
b. Calculate the row relative frequencies and enter the values in the table above. Round to the nearestthousandth.
c. Is their evidence of association between the variables? If so, does this imply there is a cause-and-effectrelationship? Explain your reasoning.
54
www.ck12.org Chapter 7. Patterns of Association in Bivariate
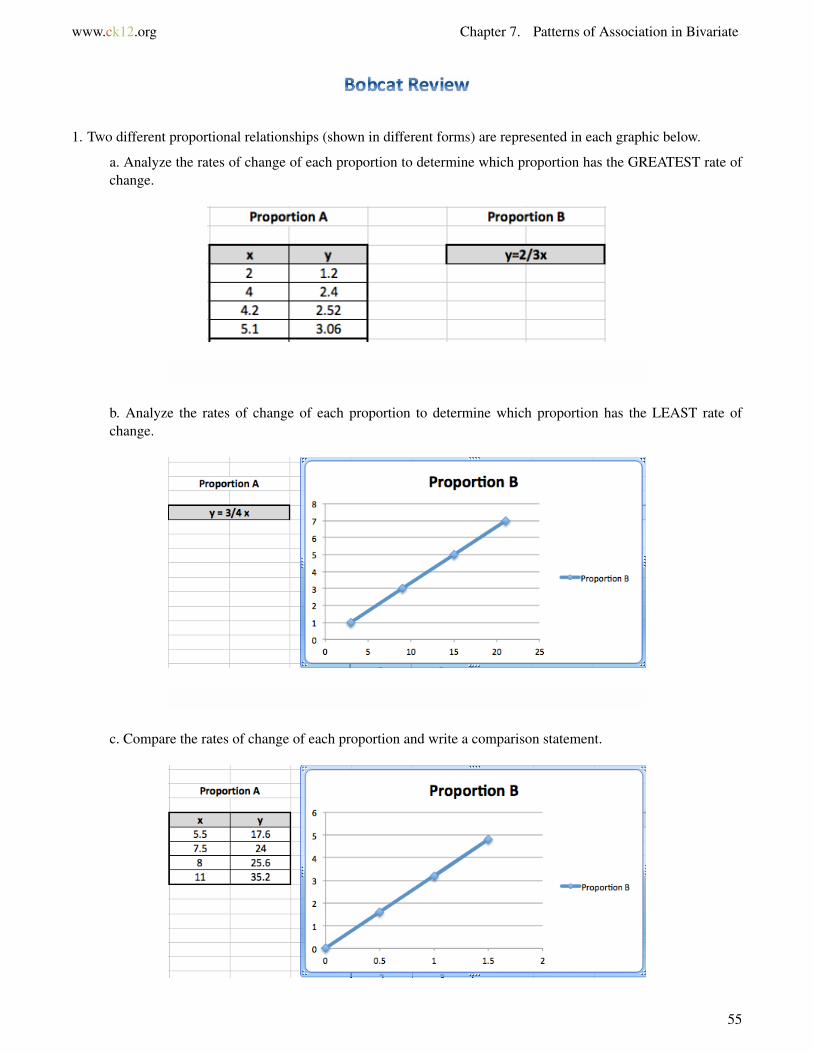
1. Two different proportional relationships (shown in different forms) are represented in each graphic below.
a. Analyze the rates of change of each proportion to determine which proportion has the GREATEST rate ofchange.
b. Analyze the rates of change of each proportion to determine which proportion has the LEAST rate ofchange.
c. Compare the rates of change of each proportion and write a comparison statement.
55
7.5. Two-Way Frequency Tables www.ck12.org
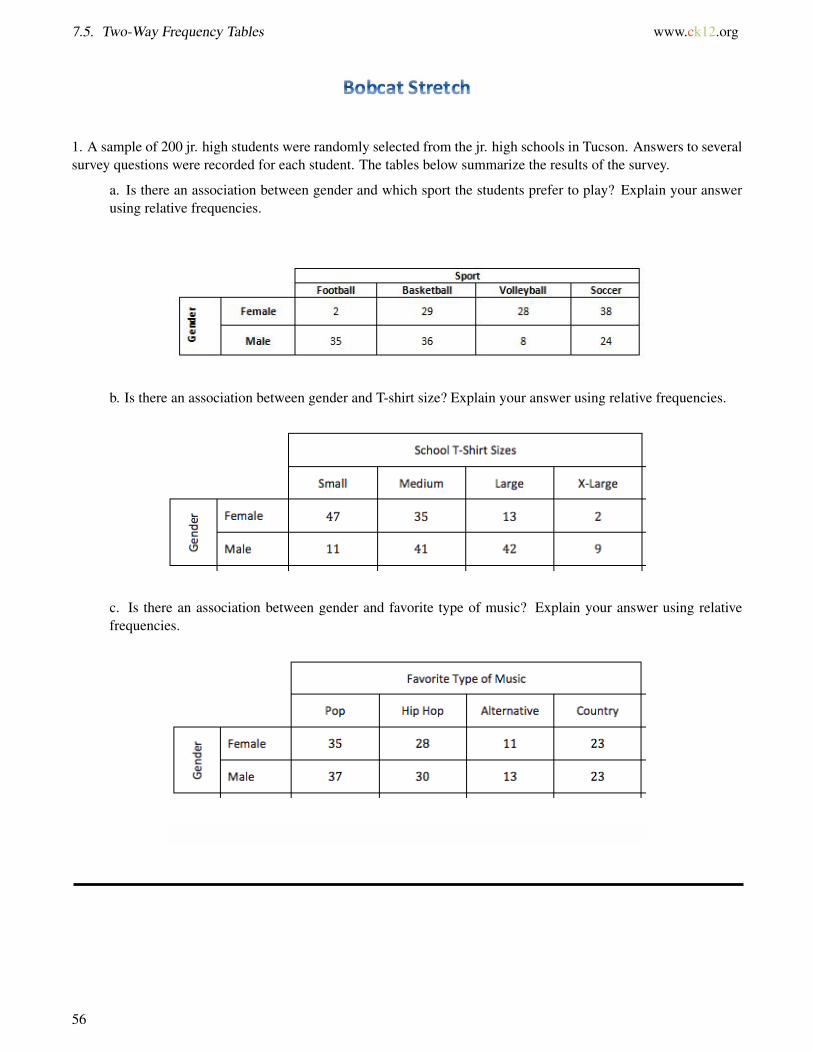
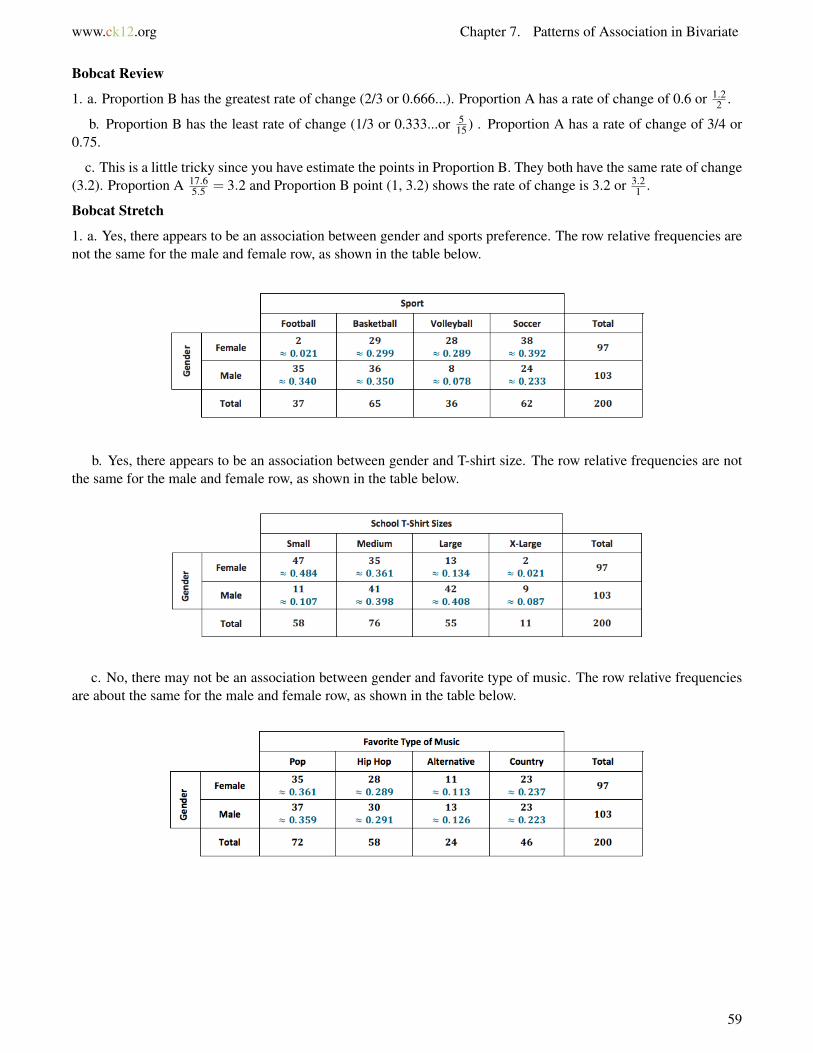
1. A sample of 200 jr. high students were randomly selected from the jr. high schools in Tucson. Answers to severalsurvey questions were recorded for each student. The tables below summarize the results of the survey.
a. Is there an association between gender and which sport the students prefer to play? Explain your answerusing relative frequencies.
b. Is there an association between gender and T-shirt size? Explain your answer using relative frequencies.
c. Is there an association between gender and favorite type of music? Explain your answer using relativefrequencies.
56

www.ck12.org Chapter 7. Patterns of Association in Bivariate
For more videos and practice problems,
• click here to go to Khan Academy.• search for "Frequencies of bivariate data" on Khan Academy (www.khanacademy.org ).• go to Khan Academy’s Common Core page standard 8.SP.A.4 (www.khanacademy.org/commoncore/grade-
8-SP).
Watch this video for more review on two-way tables.
MEDIAClick image to the left or use the URL below.URL: http://www.ck12.org/flx/render/embeddedobject/100904
1. a
TABLE 7.9:
Dogs Cats7th Grade 32 288th Grade 31 21
2. a. More likely to prefer dogs. 32/60 or ~ 53% of 7th graders preferred dogs.
b. Dogs are more preferred. 63/112 or ~56% of both 7th and 8th graders preferred dogs.
c. No, there is no correlation. Regardless of grade level, dogs were preferred.
3. a.
TABLE 7.10:
Romantic Comedies Action MoviesFemale 12 10Male 8 25
57

7.5. Two-Way Frequency Tables www.ck12.org
4. a. More likely. 25.33 ~ 76% of men prefer action movies.
b. Action Movies. 35/55 ~64% of both females and males preferred action movies.
c. Yes. 12/22 ~55% of women prefer romantic comedies. Higher percent of females preferred romantic comedies,higher percent of males preferred action movies.
d. Males and Action Movies at 76%
e. Females and Romantic Comedies at 55%
5. Yes. 45/57 ~ 79% who went to college took calculus or 62/63 ~98% who didn’t go to college didn’t take calculus.
6. a. 61% or 122/200
b. 39% or 78/200
c. 56% or 122/218
d. 57% or 104/182
e. Yes, strong correlation (61%) for a 7th grader to ride a bus and a weaker correlation (57%) for 8th grader toride in a car.
7. a. 15% or 104/676
b. 89% or 100/112
c. 96% or 100/104
d. No. Different base amount. 112 vs. 104
e. 2%, 12/676 of all patients
f. 98%, 660/676, 100 + 560 = 660
8. a & b
c. Yes, there is evidence of association between the variables because the relative frequencies are different amongrows. However, this does not necessarily imply a cause-and-effect relationship. The fact that a student has a T.V. intheir room does not cause the student to fail a test. Rather, it may be that the student is spending more time watchingT.V. or playing video games instead of studying.
58
www.ck12.org Chapter 7. Patterns of Association in Bivariate
Bobcat Review
1. a. Proportion B has the greatest rate of change (2/3 or 0.666...). Proportion A has a rate of change of 0.6 or 1.22 .
b. Proportion B has the least rate of change (1/3 or 0.333...or 515 ) . Proportion A has a rate of change of 3/4 or
0.75.
c. This is a little tricky since you have estimate the points in Proportion B. They both have the same rate of change(3.2). Proportion A 17.6
5.5 = 3.2 and Proportion B point (1, 3.2) shows the rate of change is 3.2 or 3.21 .
Bobcat Stretch
1. a. Yes, there appears to be an association between gender and sports preference. The row relative frequencies arenot the same for the male and female row, as shown in the table below.
b. Yes, there appears to be an association between gender and T-shirt size. The row relative frequencies are notthe same for the male and female row, as shown in the table below.
c. No, there may not be an association between gender and favorite type of music. The row relative frequenciesare about the same for the male and female row, as shown in the table below.
59

7.6. Mean, Median, Mode, Range, and M.A.D www.ck12.org
7.6 Mean, Median, Mode, Range, and M.A.D
Identify and find different measures: mean, median, mode, and range, so you can describe and analyze data sets.
By the end of this lesson, you should be able to define and give an example of the following vocabulary word(s):
• Mean - commonly referred to as the average, is the sum of all the data items divided by the number of dataitems.
• Median - the middle number in the set of data that is ordered from lowest to highest. If there is an evennumber of data, we take the average of the middle two numbers to find the median.
• Mode - the number that occurs most often.• Mean Absolute Deviation (MAD) - the average distance between each data value and the mean.• Range - the breadth of the data, the difference between the largest and smallest values.• Measures of Central Tendancy - or measures of central location are used to identify the central position
within a data set, which may include mean, median, and mode.
In the real world, there are many situations in which a large group of data is collected. In order to make sense ofthe data, we use a number of statistical measures. These measures help us to generalize a group of data, makeinferences about it, and compare it with other groups of data. Depending on the situation, certain measures may bemore helpful than others in interpreting data.
60

www.ck12.org Chapter 7. Patterns of Association in Bivariate
A manager at a small movie theater was analyzing the number of people who came to the movies during the week.Over nine days, he found the following data: 81, 89, 92, 85, 93, 62, 85, 105, and 90. Find Measures of CentralTendency and the range of the following data set.
Find the Mean: First, let’s find the mean. Remember that the mean is the same as the average. Add all of the dataitems and divide by the number of items. The average or mean is 86.8 which could be rounded up to 87.
=81+89+92+85+93+62+85+105+90
9
=782
9= 86.8
Find the Median: Next, let’s find the median. The median is the middle number when the data is ordered fromlowest to highest. First reorder the data from least to greatest. The median is 89.
62,81,85,85,89,90,92,93,105
↑The middle number, 89, is the median.
Find the Mode: Let’s find the mode. The mode is the number that occurs most often. In this case, 85 occurs twotimes and all of the other number only once. The number 85 is the mode.
Find the Range: And finally, let’s find the range. The range is the difference between the highest value and thelowest value in a data set. In this case, the highest value is 105 and the lowest value is 62 for a difference of 43.
105−62 = 43
Finding MAD!
Determine the mean of the following set of grades on a quiz for a math quiz: 90, 95, 80, 89, 90, 85, 93, 90
The mean is used as a guide to make a prediction. Using the example above, if I were to guess the average gradeon the math quiz, the mean would be a good guess.
If the numbers are all spread apart, the mean might not be a good measure of predicting outcomes. For example,if someone in the class gets a 0 on a the quiz, but everyone else in the class gets a B or an A, the mean of the testgrades would probably be somewhere close to 70.
Would it make sense for me to guess that on average, students got 70% on the quiz?
61
7.6. Mean, Median, Mode, Range, and M.A.D www.ck12.org
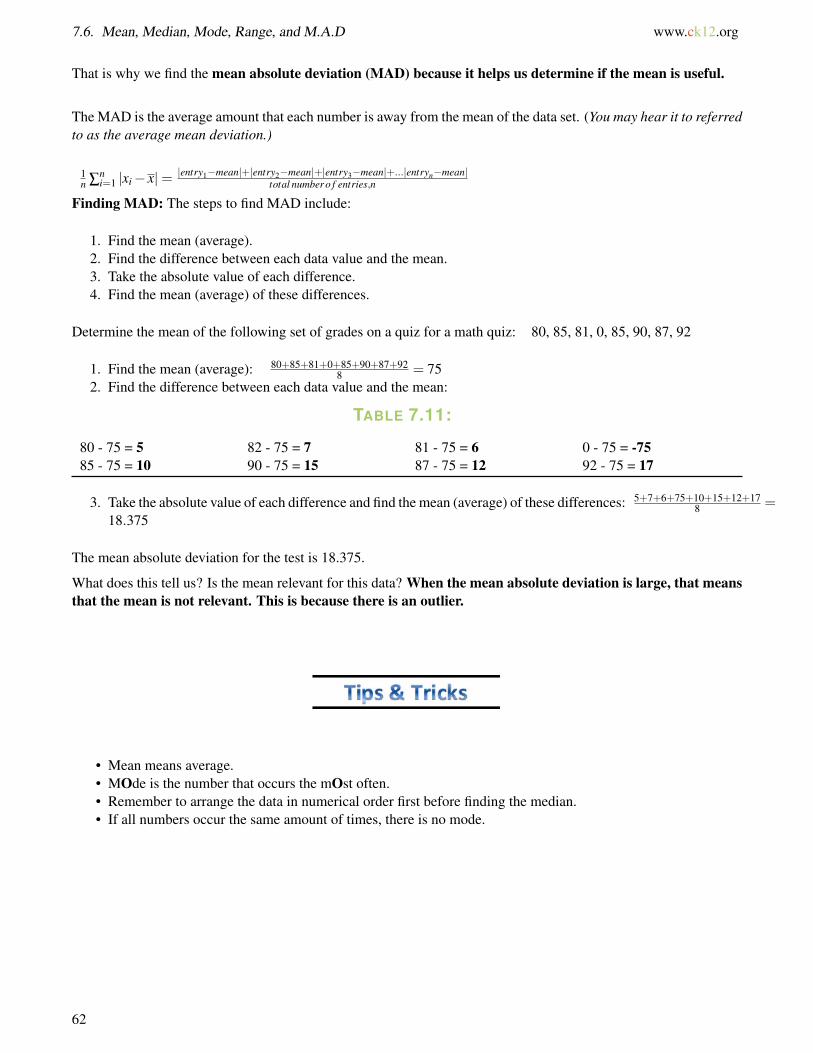
That is why we find the mean absolute deviation (MAD) because it helps us determine if the mean is useful.
The MAD is the average amount that each number is away from the mean of the data set. (You may hear it to referredto as the average mean deviation.)
1n ∑
ni=1 |xi− x|= |entry1−mean|+|entry2−mean|+|entry3−mean|+...|entryn−mean|
total number o f entries,n
Finding MAD: The steps to find MAD include:
1. Find the mean (average).2. Find the difference between each data value and the mean.3. Take the absolute value of each difference.4. Find the mean (average) of these differences.
Determine the mean of the following set of grades on a quiz for a math quiz: 80, 85, 81, 0, 85, 90, 87, 92
1. Find the mean (average): 80+85+81+0+85+90+87+928 = 75
2. Find the difference between each data value and the mean:
TABLE 7.11:
80 - 75 = 5 82 - 75 = 7 81 - 75 = 6 0 - 75 = -7585 - 75 = 10 90 - 75 = 15 87 - 75 = 12 92 - 75 = 17
3. Take the absolute value of each difference and find the mean (average) of these differences: 5+7+6+75+10+15+12+178 =
18.375
The mean absolute deviation for the test is 18.375.
What does this tell us? Is the mean relevant for this data? When the mean absolute deviation is large, that meansthat the mean is not relevant. This is because there is an outlier.
• Mean means average.• MOde is the number that occurs the mOst often.• Remember to arrange the data in numerical order first before finding the median.• If all numbers occur the same amount of times, there is no mode.
62
www.ck12.org Chapter 7. Patterns of Association in Bivariate
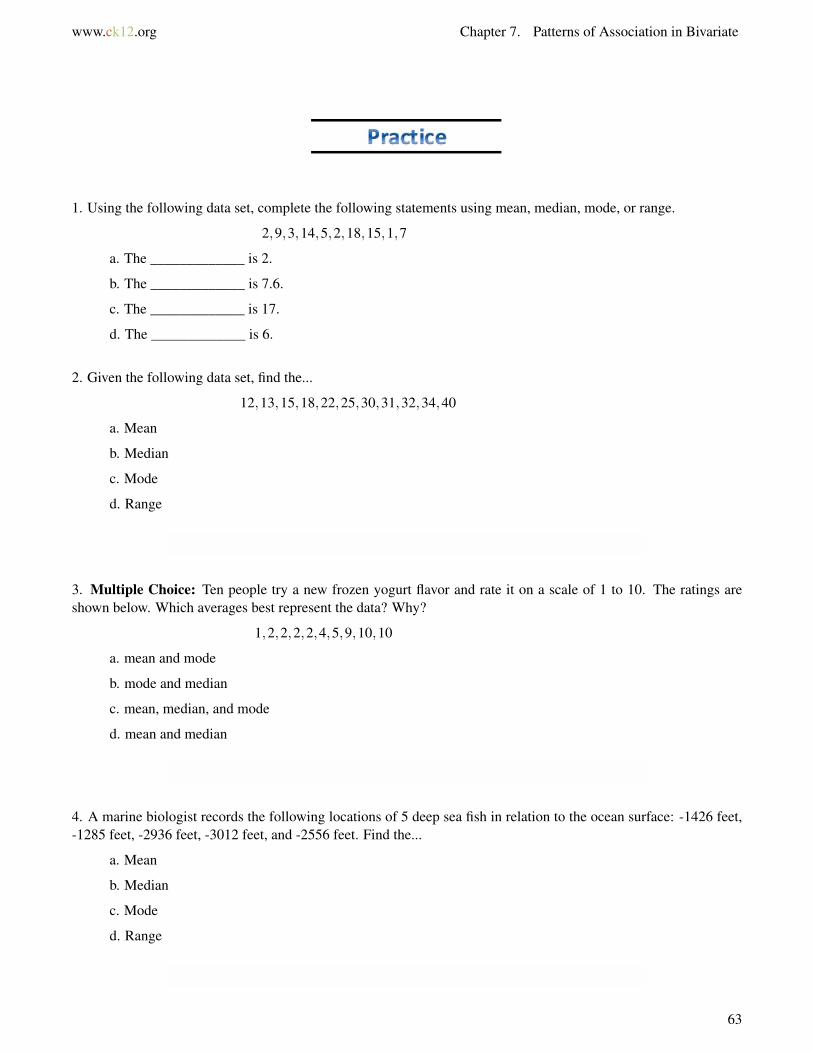
1. Using the following data set, complete the following statements using mean, median, mode, or range.
2,9,3,14,5,2,18,15,1,7
a. The _____________ is 2.
b. The _____________ is 7.6.
c. The _____________ is 17.
d. The _____________ is 6.
2. Given the following data set, find the...
12,13,15,18,22,25,30,31,32,34,40
a. Mean
b. Median
c. Mode
d. Range
3. Multiple Choice: Ten people try a new frozen yogurt flavor and rate it on a scale of 1 to 10. The ratings areshown below. Which averages best represent the data? Why?
1,2,2,2,2,4,5,9,10,10
a. mean and mode
b. mode and median
c. mean, median, and mode
d. mean and median
4. A marine biologist records the following locations of 5 deep sea fish in relation to the ocean surface: -1426 feet,-1285 feet, -2936 feet, -3012 feet, and -2556 feet. Find the...
a. Mean
b. Median
c. Mode
d. Range
63
7.6. Mean, Median, Mode, Range, and M.A.D www.ck12.org
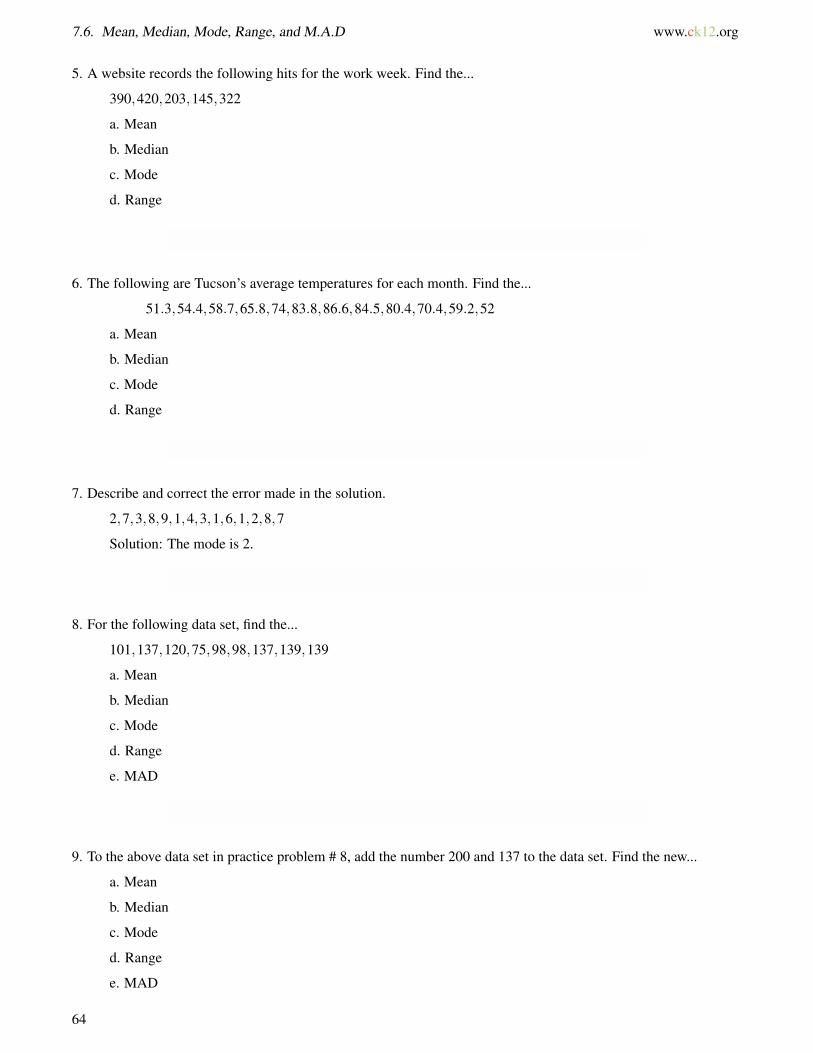
5. A website records the following hits for the work week. Find the...
390,420,203,145,322
a. Mean
b. Median
c. Mode
d. Range
6. The following are Tucson’s average temperatures for each month. Find the...
51.3,54.4,58.7,65.8,74,83.8,86.6,84.5,80.4,70.4,59.2,52
a. Mean
b. Median
c. Mode
d. Range
7. Describe and correct the error made in the solution.
2,7,3,8,9,1,4,3,1,6,1,2,8,7
Solution: The mode is 2.
8. For the following data set, find the...
101,137,120,75,98,98,137,139,139
a. Mean
b. Median
c. Mode
d. Range
e. MAD
9. To the above data set in practice problem # 8, add the number 200 and 137 to the data set. Find the new...
a. Mean
b. Median
c. Mode
d. Range
e. MAD
64

www.ck12.org Chapter 7. Patterns of Association in Bivariate
10. How did the new data points in practice problem #9 affect the mean, median, mode and range?
For more videos and practice problems,
• click here to go to Khan Academy.• search for "Mean, median, and mode" on Khan Academy (www.khanacademy.org ).
This video reviews mean, median, and mode.
MEDIAClick image to the left or use the URL below.URL: http://www.ck12.org/flx/render/embeddedobject/104739
1. a. mode
b. mean
c. range
d. median
2.a. 24.72
b. 25
c. none
d. 28
3.b. mode and median (2,3). The mean is 4.7, but 7 of the responses are below 5, so this is not a good representationof the data.
65

7.6. Mean, Median, Mode, Range, and M.A.D www.ck12.org
4.a. -2243
b. -2556
c. none
d. 1727
5.a. 296
b. 322
c. none
d. 275
6.a. 68.425
b. 68.1
c. none
d. 35.3
7. mode is 1 (occurs 3 times)
8.a. 116
b. 120
c. 98, 137, 139
d. 64
e. 20.4
9.a. 125.545
b. 137
c. 137
d. 125
e. 24.67
10. The mean, median and range all increased from the outlier data point 200 added. The mode changed to 137,since it occurred 3 times in the new data set. The MAD increased, which devalues the use of the mean.
66

www.ck12.org Chapter 7. Patterns of Association in Bivariate
7.7 Double Stem-and-Leaf Plots
Interpret Double Stem-Leaf Plots to analyze data sets.
By the end of this lesson, you should be able to define and give an example of the following vocabulary word:
• Stem-Leaf - A model used to display data to show detailed distribution and to easily identify the mode.
The girls and boys in one of EGJH’s English classes are having a contest. They want to see which group can read themost number of books.Their English teacher says that the class will tally the number of books each group has read,and the highest mode will be the winner. The following data was collected at the end of the year of AP English:
Girls 11 12 12 17 18 23 23 23 24 33 34 35 44 45 47 50 51 51
Boys 15 18 22 22 23 26 34 35 35 35 40 40 42 47 49 50 50 51
They draw a two-sided stem-and-leaf plot to help her determine the winner.
Analyzing the data, the class sees that the mode for the girls is 23 and the mode for the boys is 35. Also, the girlshave a higer frequency of low number (10s and 20s), while the boys have a higher frequency of high numbers (20s,30s, 40s).
So, who won the contest? You guessed it, the boys took home the prize this time.
67

7.7. Double Stem-and-Leaf Plots www.ck12.org
1. At teacher at EGJH recently wrote down the class marks for her 2009 and 2010 8th grade classes. The data canbe found below.
2010 class 70 70 70 71 72 74 74 74 74 75 76 76 77 78 79 80 81
82 82 82 83 84 85 85 86 87 93 98 100
2009 class 76 76 76 76 77 78 78 78 79 80 80 82 82 83 83 83 85
85 88 91 95
a. Construct a two-sided stem-and-leaf plot for the data and compare the distributions.
b. What is the range for the each class?
c. What is the median and mode for the 2009 class?
d. What is the median and mode for the 2010 class?
e. Whose class received higher grades?
68

www.ck12.org Chapter 7. Patterns of Association in Bivariate
2. The following data was collected in a survey done by Connor and Scott for their statistics project. The datarepresents the ages of people who entered into a new hardware store within its first half hour of opening on itsopening weekend. The M’s in the data represent males, and the F’s represent females.
12M 18F 15F 15M 10M 21F 25M 21M
26F 29F 29F 31M 33M 35M 35M 35M
41F 42F 42M 45M 46F 48F 51M 51M
55F 56M 58M 59M 60M 60F 61F 65M
65M 66M 70M 70M 71M 71M 72M 72F
a. Construct a back-to-back stem-and-leaf plot showing the ages of male customers and the ages of femalecustomers. Compare the distributions.
b. What were the age ranges of the males and females?
c. What was the median and mode for males?
d. What was the median and mode for females?
e. Who was the oldest customer? Who was the youngest customer?
3. The boys and girls basketball teams at a high school had their heights measured at practice. The following datawas recorded for their heights (in centimeters):
Girls 171 170 176 176 177 179 162 172 160 157 155
168 178 174 170 155 155 154 164 145 171 161
Boys 168 170 162 153 176 167 158 180 181 176 172
168 167 165 159 185 184 173 177 167 169 177
a. Construct a two-sided stem-and-leaf plot for the data.
b. Determine the median and mode using the two-sided stem-and-leaf plot for each distribution.
c. What can you conclude from the distributions?
69
7.7. Double Stem-and-Leaf Plots www.ck12.org
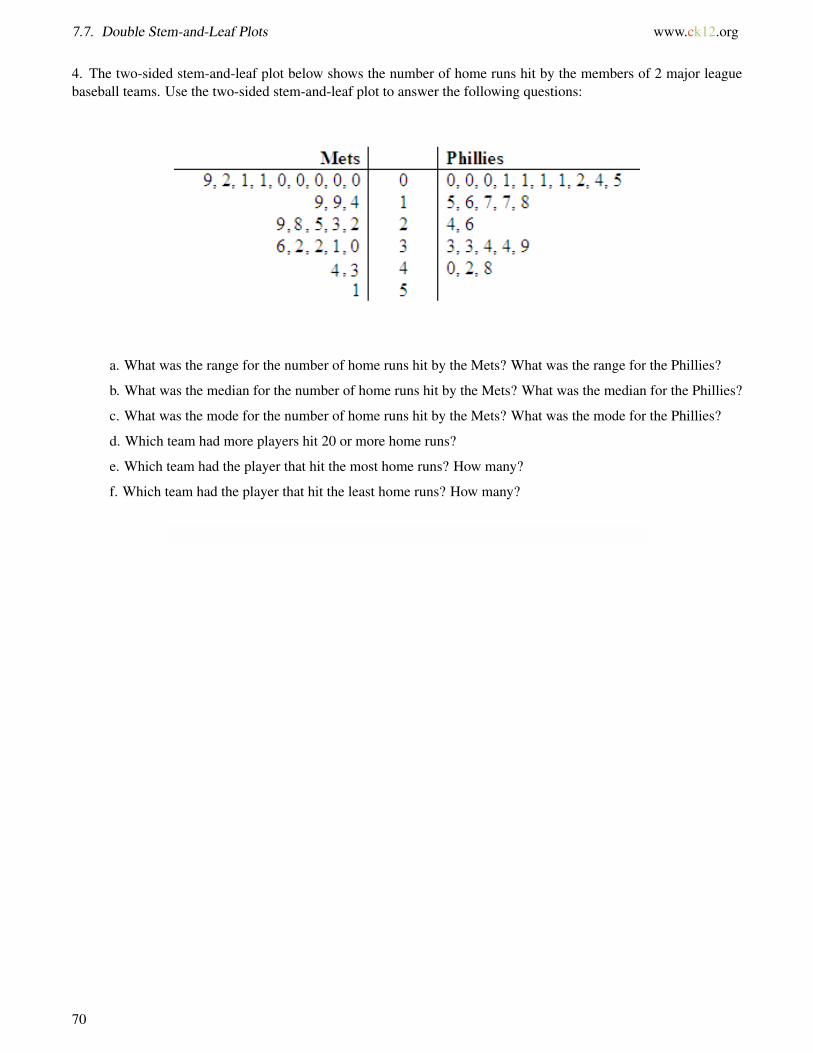
4. The two-sided stem-and-leaf plot below shows the number of home runs hit by the members of 2 major leaguebaseball teams. Use the two-sided stem-and-leaf plot to answer the following questions:
a. What was the range for the number of home runs hit by the Mets? What was the range for the Phillies?
b. What was the median for the number of home runs hit by the Mets? What was the median for the Phillies?
c. What was the mode for the number of home runs hit by the Mets? What was the mode for the Phillies?
d. Which team had more players hit 20 or more home runs?
e. Which team had the player that hit the most home runs? How many?
f. Which team had the player that hit the least home runs? How many?
70
www.ck12.org Chapter 7. Patterns of Association in Bivariate
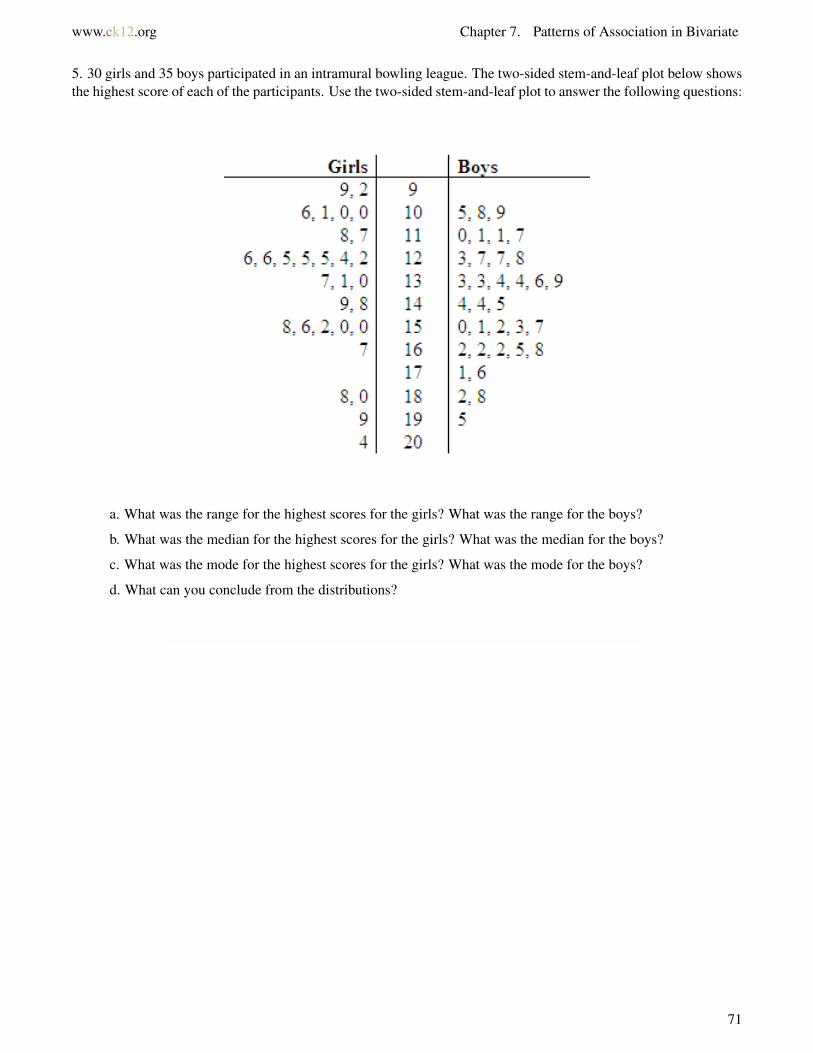
5. 30 girls and 35 boys participated in an intramural bowling league. The two-sided stem-and-leaf plot below showsthe highest score of each of the participants. Use the two-sided stem-and-leaf plot to answer the following questions:
a. What was the range for the highest scores for the girls? What was the range for the boys?
b. What was the median for the highest scores for the girls? What was the median for the boys?
c. What was the mode for the highest scores for the girls? What was the mode for the boys?
d. What can you conclude from the distributions?
71

7.7. Double Stem-and-Leaf Plots www.ck12.org
6. The P.E. teacher is doing fitness testing this week in gym class. After each test, students are required to take theirpulse rate and record it on the chart in the front of the gym. At the end of the week, they look at the data in order toanalyze it. The data is shown below:
Girls 70 88 80 76 76 77 89 72 72 76 72 75 77 80 76 68 68
82 78 60 64 64 65 81 84 84 79 78 70
Boys 76 88 87 86 85 70 76 70 70 79 80 82 82 82 83 84 85
85 78 81 85
a. Construct a two-sided stem-and-leaf plot for the data and compare the distributions.
b. What was the median for the highest scores for the girls? What was the median for the boys?
c. What was the mode for the highest scores for the girls? What was the mode for the boys?
d. What can you conclude from the distributions?
7. Starbucks prides itself on its low line-up times in order to be served. A new coffee house in town has also boastedthat it will have your order in your hands and have you on your way quicker than the competition. The followingdata was collected for the line-up times (in minutes) for both coffee houses:
Starbucks 20 26 26 27 19 12 12 16 12 15 17 20 8 8 18
Just Us Coffee 17 16 15 10 16 10 10 29 20 22 22 12 13 24 15
a. Construct a two-sided stem-and-leaf plot for the data.
b. Determine the median and mode using the two-sided stem-and-leaf plot.
c. What can you conclude from the distributions?
72
www.ck12.org Chapter 7. Patterns of Association in Bivariate
For more videos and practice problems,
• click here to go to Khan Academy.• search for "Reading stem and leaf plots" on Khan Academy (www.khanacademy.org ).
Watch this video for a review of stem-and-leaf plots.
MEDIAClick image to the left or use the URL below.URL: http://www.ck12.org/flx/render/embeddedobject/104591
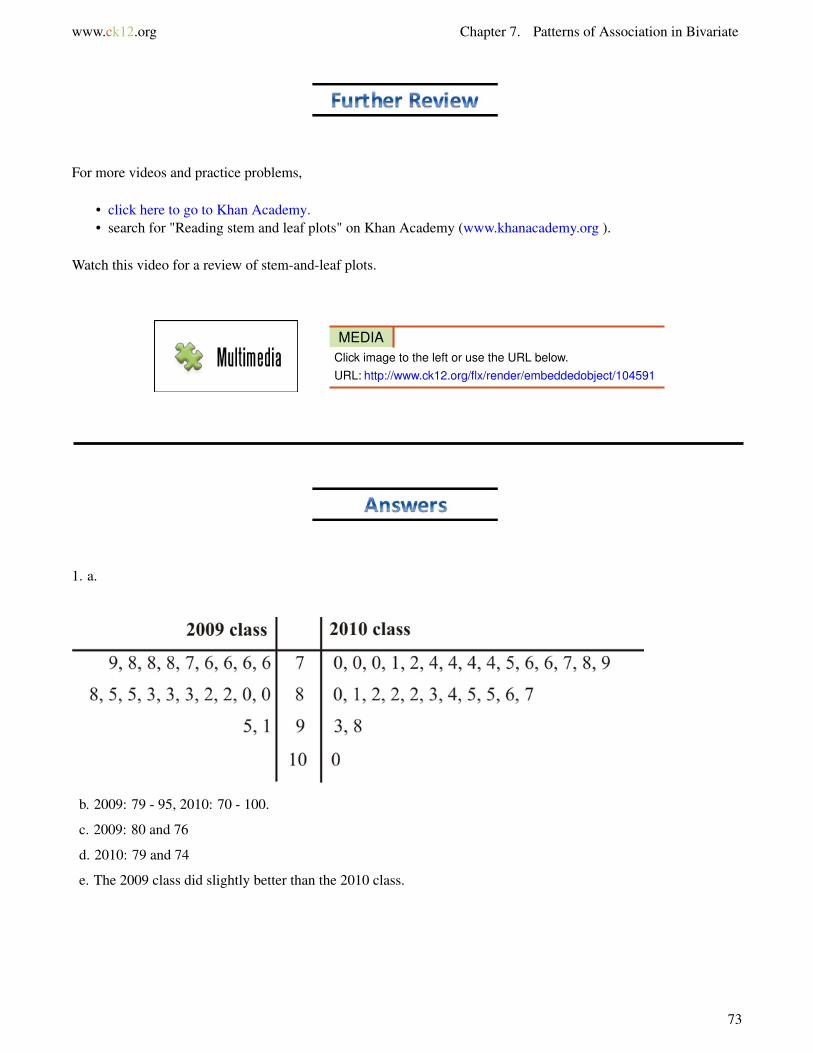
1. a.
b. 2009: 79 - 95, 2010: 70 - 100.
c. 2009: 80 and 76
d. 2010: 79 and 74
e. The 2009 class did slightly better than the 2010 class.
73
7.7. Double Stem-and-Leaf Plots www.ck12.org
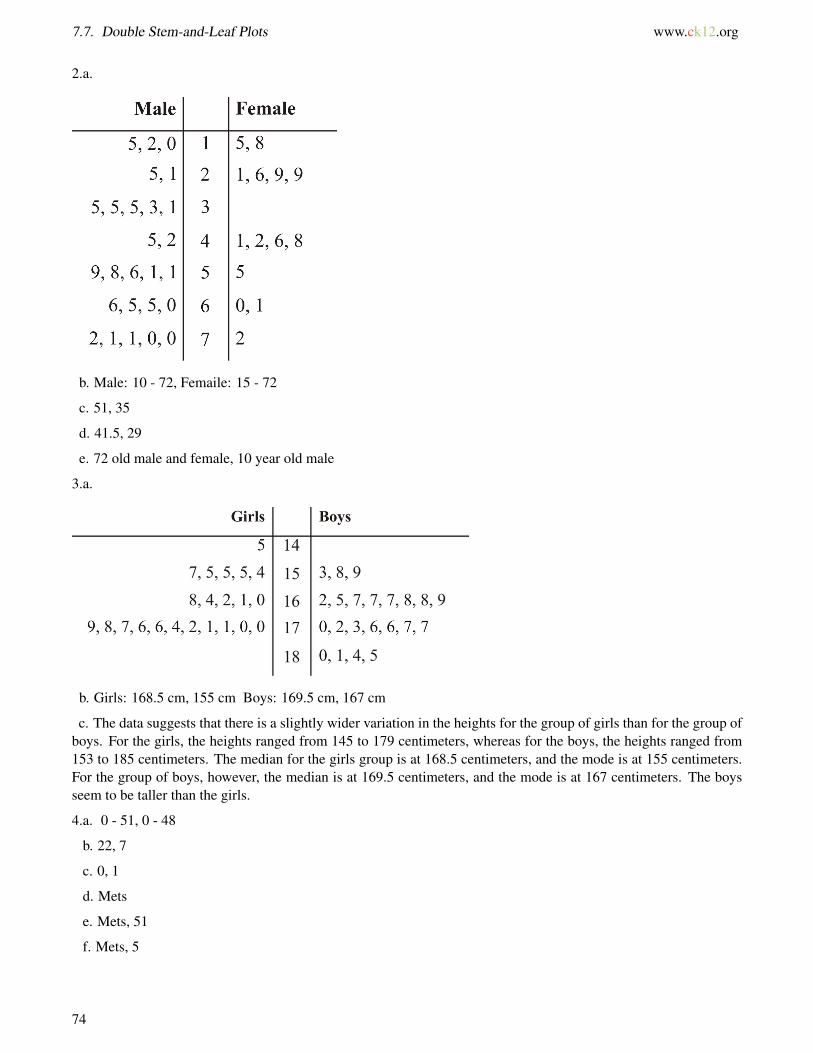
2.a.
b. Male: 10 - 72, Femaile: 15 - 72
c. 51, 35
d. 41.5, 29
e. 72 old male and female, 10 year old male
3.a.
b. Girls: 168.5 cm, 155 cm Boys: 169.5 cm, 167 cm
c. The data suggests that there is a slightly wider variation in the heights for the group of girls than for the group ofboys. For the girls, the heights ranged from 145 to 179 centimeters, whereas for the boys, the heights ranged from153 to 185 centimeters. The median for the girls group is at 168.5 centimeters, and the mode is at 155 centimeters.For the group of boys, however, the median is at 169.5 centimeters, and the mode is at 167 centimeters. The boysseem to be taller than the girls.
4.a. 0 - 51, 0 - 48
b. 22, 7
c. 0, 1
d. Mets
e. Mets, 51
f. Mets, 5
74

www.ck12.org Chapter 7. Patterns of Association in Bivariate
5.a. 92-204, 105-195
b. 131.5, 144
c. 125, 162
d. A girl scored the higest score (204), but the boys overall scored higer in the tournament.
6. a. Good luck!
b. 76, 82
c. 76, 70
d. Boys had higher pulse rates overall after each test, even though a girl had the higest pulse rate (89).
7. a. Good luck!
b. Starbucks: median - 17, mode - 12 / Just Coffee: median - 16, mode - 10
c. Just us Coffee has the overall highest wait time (29 min) and no times less than 10 minutes, but in general it isgetting coffee into customer’s hands faster than Starbucks.
75

7.8. Interpreting Box-and-Whisker Plots www.ck12.org
7.8 Interpreting Box-and-Whisker Plots
Interpret Box-and-Whisker Plots to analyze data sets.
By the end of this lesson, you should be able to define and give an example of the following vocabulary word(s):
• Box-and-Whisker - A model used to display data to show how the data is dispersed around a median. Thistype of graph is often used when the number of data values is large or when two or more data sets are beingcompared.
• Quartiles - Divide (cut) a list of numbers into quarters: Lower, Middle (median) and Upper• Median - The middle number of a data set.• Range - The difference between the greatest and lowest numbers in a data set.• Upper and Lower Extremes - the greatest and smallest numbers in a data set.
You have a summer job working at Paddy’s Pond. Your job is to measure as many salmon as possible and record theresults. Here are the lengths (in inches) of the first 15 fish you found: 13, 14, 6, 9, 10, 21, 17, 15, 15, 7, 10, 13, 13,8, 11
Create a box-and-whisker plot.
Find the median: Since a box-and-whisker plot is based on medians, the first step is to organize the data in orderfrom smallest to largest. Since there are 15 numbers, the median will be the 8th number in the data set, which is 13.
6, 7, 8, 9, 10, 10, 11, 13 , 13, 13, 14, 15, 15, 17, 21
Find the lower quartile: Now, let’s find the lower median, which is the median of the lower half of the data. It isalso called the lower quartile or Q1. There are 7 numbers in the lower quartile, so the median is the 4th number inthis data set, which is 9.
6, 7, 8, 9 , 10, 10, 11
Q1 = 9
Find the upper quartile: Let’s do the same for the upper quartile or Q3, which is the median of the upper halfof the data. Like the lower quartile, it also has 7 numbers in the data set, so the median number is the 4th number,which is 15.
13, 13, 14, 15 , 15, 17, 21
Q3 = 15
76

www.ck12.org Chapter 7. Patterns of Association in Bivariate
Draw the box plot: The numbers needed to construct a box-and-whisker plot are called the five-number summary.
The five-number summary are: the minimum value, Q1, the median, Q3, and the maximum value.
Minimum = 6; Q1 = 9; median = 13; Q3 = 15; maximum = 21
The three medians divide the data into four equal parts. In other words:
• One-quarter of the data values are located between 6 and 9.• One-quarter of the data values are located between 9 and 13.• One-quarter of the data values are located between 13 and 15.• One-quarter of the data values are located between 15 and 21.
From its whiskers, any outliers (unusual data values that can be either low or high) can be easily seen on a box-and-whisker plot. An outlier would create a whisker that would be very long.
Each whisker contains 25% of the data and the remaining 50% of the data is contained within the box. It is easy tosee the range of the values as well as how these values are distributed around the middle value.
• Box and Whisker plots help you interpret general data distribution, which is helpful when assessing orcomparing data sets with large values.
• The smaller the box plot, the more consistent the data values are with the median of the data.
77

7.8. Interpreting Box-and-Whisker Plots www.ck12.org
1. After one month of growing, the heights of 24 parsley seed plants were measured and recorded. Here is the boxplot of the data.
a. What is the median of the data set?
b. What is the lower quartile of data set?
c. What is the upper quartile of the data set?
d. What is the lower extreme?
e. What is the upper extreme?
f. What are the ranges of the four quartiles?
g. Is the grower good at growing parsley plots? Why or Why not?
2. Use the box plot and data below to answer the following questions. Data represents mileage driven per tank ofgas.
a. What is the approximate median of the mileage driven with regular gasoline?
b. What is the approximate median of the mileage driven with premium gasoline?
c. What is the lower extreme for the premium gas?
d. What is the upper extreme for the regular gas?
e. What is the upper quartile for the premium gas?
f. What is the upper quartile for the regular gas?
g. Which data set contains more consistent data? Why?
78

www.ck12.org Chapter 7. Patterns of Association in Bivariate
h. Based on this data, which gas should you purchase if you want to increase your mileage driven per tank?
i. Give a possible explanation for one of the outliers?
3. Forty students took a college algebra entrance test and the results are summarized in the box-and-whisker plotbelow. Use this box plot to answer the following questions:
a. What percentage of students would be allowed to enroll in the class if the pass mark was set at 60%?
b. What percentage of students would be allowed to enroll if the pass mark was set at 65%?
c. What percentage of students would be allowed to enroll if the pass mark was set at 77%?
d. What was the higest score on the test?
e. What was the lowest score on the test?
4. The box-and-whisker plots below represent the times taken by a school class to complete a 150-yard obstaclecourse. The times have been separated into boys and girls. The boys and the girls both think that they did best.Determine the five-number summary for both the boys and the girls and give a convincing argument for each ofthem.
5. The box-and-whisker plots below represent the percentage of people living below the poverty line by county inboth Texas and California. Determine the five-number summary for each state, and comment on the spread of eachdistribution.
79

7.8. Interpreting Box-and-Whisker Plots www.ck12.org
6. In a recent survey done at a high school cafeteria, a random selection of males and females were asked how muchmoney they spent each month on school lunches. The following box-and-whisker plots compare the responses ofmales to those of females. The lower one is the response by males.
a. How much money did the middle 50% of each gender spend on school lunches each month?
b. What is the significance of the value of $42 for females and $46 for males?
c. What conclusions can be drawn from the above plots? Explain.
7. A math teacher at TVHS put together the following box-and-whisker plots to show the number of missingassignments per class.
a. Compare the different box-and-whisker plots and list 5 facts/conclusions you can draw from this chart.
b. If you were in his period 5 math class, what would be the main take away message for you from this chart?
c. What chart would be helpful to create next?
80

www.ck12.org Chapter 7. Patterns of Association in Bivariate
For more videos and practice problems,
• click here to go to Khan Academy.• search for "Creating box and whisker plots" on Khan Academy (www.khanacademy.org ).
Watch this video for a review of box-and-whisker plots.
MEDIAClick image to the left or use the URL below.URL: http://www.ck12.org/flx/render/embeddedobject/101039
1. a. 26
b. 17
c. 37
d. 6
e. 49
f. Q1: 6 - 17, Q2: 17-26, Q3: 26-37, Q4: 37-49
2. a - f
TABLE 7.12:
Regular Gasoline Premium GasolineSmallest # 540 500Q1 570 619Median 587 637Q3 610 664Largest # 660 709
g. Regular gas
h. Premium gas
i. Variable answers. One explanation for the lower extreme is that the car was driven in heavy stop-and-go traffic
81

7.8. Interpreting Box-and-Whisker Plots www.ck12.org
in the city, which reduced the mileage for that tank of gas.
3. a. 75%
b. 50%
c. 25%
d. 97
e. 50
4. Boys: 1m 30s, 2m, median: 2m 30s, 3m 30s, 5m 10s - they would argue that the boys overall had the lowest time- their average time was 2 min 30 secs.
Girls: 1m 40s, 2m 30s, median: 2 m 55s, 3m 20s, 4m 10s - they would argue that a girl had the overall best time- 4 min 10 sec
5. California: 6, 9.5, 13, 15.5, 22 - they have a lower range of poverty levels between coutnies and a slightly lowermedian poverty rate than Texas (13%).
Texas: 5, 13, 16, 19.5, 35 - they have the widest range of poverty levels between counties and a slightly higermedian poverty rate than California (16%).
6. a. Females: 28 - 68, Males: 22 - 38
b. Median spent by each gender
c. Girls spent less overall on lunches, but had the widest range of money spent on lunches.
7.a. Variable answers. There are 3 outliers: 2 in period 4 and 1 in period 2 - they have a lot of assignments missing.Period 5 has the most assignments missing overall. Period 7 has the least missing assignments overall. 50% of period2 has between 2 and 7 missing assignments. Period 4 has the widest distribution for the middle 50% - between 1 - 9missing assignments.
b. Your class has the most missing assignments with 50 % of the class missing between 4 and 11. You should startto turn in assignments.
c. Variable answers. A scatter plot showing missing assignments and overall 1st semester grade data points.
82

www.ck12.org Chapter 7. Patterns of Association in Bivariate
7.9 References
1. . http://www.pbs.org/teacherline/courses/math170/session5/pounds/poundsans.htm .2. . http://www.cstephenmurray.com/onlinequizes/physics/slope/MeaningOfGraphs.htm .3. Engage NY, Module 6, Lesson 6, p 69. http://www.engageny.org/sites/default/files/resource/attachments/mat
h-g8-m6-teacher-materials.pdf .4. Stephen Claydon. http://scienceaid.co.uk/psychology/approaches/representing.html .5. Engage NY, Module 6, Lesson 7, p 85. http://www.engageny.org/sites/default/files/resource/attachments/mat
h-g8-m6-teacher-materials.pdf .6. . http://jan.ucc.nau.edu/~pjp/AEPA/03MathTest.htm .7. . http://www.sjsu.edu/faculty/gerstman/StatPrimer/correlation.pdf .8. . Engage NY Module 6, Lesson 8, p104 .9. . Engage NY, Module 6, Lesson 9, pg 110 .
10. . Engage NY, Module 6, Lesson 7, p87 .11. . Engage NY Module 6, Lesson 7, p88 .12. . Engage NY, Module 6, Lesson 11, p 142 .13. . Engage NY, Module 6, Lesson 11, p143 .14. . Engage NY, Module 6, Lesson 6, p146 .15. . Engage NY, Module 6, End of module assessment .16. . Engage NY, Module 6, Lesson 10, p136 .17. . Engage NY Module6 .18. . Engage NY, Module 6, Lesson 10, p136 .19. . Engage NY, Module 6, Lesson 14, s119 .20. . Engage NY, Module 6, Lesson 14, p s119 .21. . Engage NY, Module 6, Lesson 14, p187 .
83

www.ck12.org
CHAPTER 8 Geometric RelationshipsChapter Outline
8.1 ANGLE PAIRS
8.2 ANGLES AND TRIANGLES
8.3 QUADRILATERALS
8.4 POLYGONS AND ANGLES
8.5 CONGRUENT POLYGONS
8.6 REFERENCES
84

www.ck12.org Chapter 8. Geometric Relationships
8.1 Angle Pairs
Solve equations to find angle measures. Find angle measures of parallel lines.
By the end of this lesson, you should be able to define and give an example of the following vocabulary words:
• Straight angle - A straight angle measures 180◦.
• Right angle - A right angle measures 90◦.
• Supplementary angles - Two angles that add up to 180◦. They do not have to be adjacent.
• Complementary angles - Two angles that add up to 90◦. They do not have to be adjacent.
• Vertical angles - intersecting lines form 2 pairs of vertical angles. The pairs are opposite each other, don’tshare a common side. Vertical angles always have the same measure.
• Perpendicular lines - Two lines that intersect to form 4 right angles.
• Parallel lines - Lines in the same plane that never intersect (never cross each other).
• Corresponding angles - Angles that are in the same position in respect to the parallel lines, when a transversalline intersects two parallel lines.
– Alternate interior angles - interior angles that lie on opposite sides of a transversal line are equal.– Alternate exterior angles - exterior angles that lie on the opposite sides of a transversal line are equal.
85

8.1. Angle Pairs www.ck12.org
What is m 6 X ?
Remember 6 is the symbol for angle and m stands for measure, so m 6 X means measure of angle X.
We know that supplementary angles add up to 180◦, and that 180◦ is a straight line. Looking at the diagram,the 80◦ angle and 6 X together form a straight line, so they are supplementary angles. That means we can set up anequation to solve for X .
80+X = 180
The equation shows what we already know: the sum of supplementary angles is 180◦. We can find the measure ofthe unknown angle by solving for X .
80+m6 X = 180
m6 X = 180−80
m 6 X = 100◦
The measure of the unknown angle in this supplementary pair is 100◦.
We can check our work by putting this value in for X in the equation. 80+100 = 180
86

www.ck12.org Chapter 8. Geometric Relationships
When the transversal line y intersects two lines that are parallel (lines a and b), it forms the same angles ofintersection with the first parallel line and the second.
When line y intersects with line a, it forms 100◦ angles and 80◦ angles. When it intersects with line b, it alsoforms 100◦ angles and 80◦ angles! This is because lines a and b are parallel, so any transversal line will intersectwith them in the same way and form corresponding angles, for example, 6 Q and 6 E.
Now let’s label the various angle sets.
Interior angles = 6 G, 6 F, 6 P, 6 Q
Exterior angles = 6 D, 6 E, 6 S, 6 R
Alternate interior angles = 6 F and 6 P (notice they are also congruent), 6 G and 6 Q
Alternate exterior angles = 6 E and 6 S (notice they are also congruent), 6 D and 6 R
Vertical angles = 6 D and 6 F, 6 E and 6 G, 6 P and 6 R, 6 Q and 6 S
87

8.1. Angle Pairs www.ck12.org
• A straight angle measures exactly 180◦ = a straight line.
• Remember: Complementary = Corner. Complementary angles are two angles whose measurements add upto exactly 90◦ = right angle.
• Remember: Supplementary = Straight Line. Supplementary angles are two angles whose measurementsadd up to exactly 180◦ = straight line.
88

www.ck12.org Chapter 8. Geometric Relationships
1. Identify whether the pairs below are complementary or supplementary or neither.
a.
b.
c.
89

8.1. Angle Pairs www.ck12.org
2. Use the picture below to answer the following questions.
a. What is the alternate interior angle to 6 4?
b. What is the alternate exterior angle to 6 1?
c. What is the alternate exterior angle to 6 2?
d. What is the alternate interior angle to 6 3?
e. If m6 1 = 112◦, then what are the measures for angles 2 through 8.
3. Write the appropriate equations and find the missing measures for angles 1 through 7.
90

www.ck12.org Chapter 8. Geometric Relationships
4. Are the lines parallel? Why or why not?
5. Write an equation and solve for x.
91

8.1. Angle Pairs www.ck12.org
6. Use the picture below to answer the following questions.
a. Name 4 sets of alternate exterior angles.
b. Name 4 sets of alternate interior angles.
c. Name 4 sets of supplementary angles.
d. If m6 16 = 123◦, then what are the measures for angles 1 through 15.
7. What does the value of x have to be to make the lines parallel?
a. If m6 1 = (6x−5)◦ and m 6 5 = (5x+7)◦.
b. If m 6 2 = (3x−4)◦ and m6 6 = (4x−10)◦.
c. If m6 1 = (6x−5)◦ and m 6 6 = (11x+15)◦.
92

www.ck12.org Chapter 8. Geometric Relationships
8. Write the appropriate equations and solve for x and y.
9. Write the appropriate equations and solve for x and y.
93

8.1. Angle Pairs www.ck12.org
1. True or False. A function is a rule that assigns each input more than one output. Explain your reasoning.
2. Given y =−13 x−19,
a. What is the slope of this line? What does it mean?
b. What is the y-intercept of this line? What does it mean?
3. Which has a greater rate of change?
a. y = 5.5x+7
b.
1. What does the value of x have to be to make the lines parallel?
a. If m6 5 = (4x+9.8)◦ and m6 4 = (2.5x+25.7)◦.
b. If m 6 2 = (35 x+1 4
5)◦ and m6 7 = (3
4 x−29 710)◦.
c. If m6 4 = (8.2x+10.6)◦ and m 6 6 = (20.4x+40.7)◦.
94
www.ck12.org Chapter 8. Geometric Relationships
For more videos and practice problems,
• click here to go to Khan Academy.• search for "Parallel lines 1" on Khan Academy (www.khanacademy.org ).• go to Khan Academy’s Common Core page standard 8.G.A.5 (www.khanacademy.org/commoncore/grade-8-
G).
Watch this video to further review angles formed by parallel lines and transversals.
MEDIAClick image to the left or use the URL below.URL: http://www.ck12.org/flx/render/embeddedobject/117478
1. a. Complementary - 45º + 45º = 90◦
b. Complementary - 80º + 10º = 90º
c. Supplementary - 125º + 55º = 180º
2. a. 6 8
b. 6 7
c. 6 6
d. 6 5
e. m6 2 = 68◦, m6 3 = 112◦, m6 4 = 68◦, m6 5 = 112◦
m6 6 = 68◦, m6 7 = 112◦, m6 8 = 68◦
3. m6 1 = 120◦, m 6 2 = 60◦, m6 3 = 120◦, m 6 4 = 120◦
m6 5 = 60◦, m6 6 = 60◦, m6 7 = 120◦
4. No, 180º - 106º = 74º. Since the interior angle is 73◦, it is not congruent (the same) as 74◦. This means these linesare not parallel and will eventually intersect.
5. x = 26,( 68◦ + 86º + x = 180◦)
95

8.1. Angle Pairs www.ck12.org
6. a. Various answers. .6 1 and 6 2, 6 3 and 6 4, 6 9 and 6 10, 6 15 and 6 16
b. Various answers. 6 11 and 6 14, 6 2 and 6 7, 6 10 and 6 15, 6 6 and 6 9.
c. Various answers. .
d. m6 1 = 123◦, m 6 2 = 57◦, m6 3 = 123◦, m 6 4 = 57◦
m6 5 = 57◦, m6 6 = 123◦, m6 7 = 57◦, m6 8 = 123◦
m6 9 = 123◦, m6 10 = 57◦, m6 11 = 123◦, m6 12 = 57◦
m 6 13 = 57◦, m6 14 = 123◦, m 6 15 = 57◦, m6 16 = 123◦
7. a. x = 12; 6x−5 = 5x+7
3x−4 = 4x−10; x = 6 b.
6x−5+11x+15 = 180; x = 10 c.
x+40+96+25 = 180; y = 96, x = 198.
65+ y = 90 and 90− x = 25; y = 25, x = 659.
Bobcat Review
output.one1. False. A function is a rule that assigns to each input exactly
- unit. x unit per 1 −13 , it means that the line decreases −1
3 2. a.
= 0).x-axis at (-19) (when y-intercept is (-19), which means the line crosses the y b. The
= 5.5. 6 >5.5.a = 6, while the rate of change for b3. b - The rate of change for
Bobcat Stretch
= 10.6x1. a.
= 210x b.
= 4.5x c.
96

www.ck12.org Chapter 8. Geometric Relationships
8.2 Angles and Triangles
Classify angles and triangles and use the angle-sum theorem to solve for unknown angle measures in triangles.
By the end of this lesson, you should be able to define and give an example of the following vocabulary words:
• Acute angle - An angle whose measure is less than 90◦.
• Right angle - An angle whose measure is exactly 90◦.
• Obtuse angle - An angle whose measure is between 90◦ and 180◦.
• Acute triangle - A triangle where each angle is less than 90◦.
• Obtuse triangle -A triangle where one angle is more than 90◦.
• Right triangle - A triangle where one angle that measures exactly 90◦.
• Equilateral/Equiangular triangle - A triangle where all three sides and angles are congruent (always 60◦).
• Isosceles triangle - A triangle where two sides and angles are congruent.
• Scalene triangle - A triangle where there are no congruent sides or angles.
• Angle-sum Theorem - The sum of the measures of a triangle is 180◦.
97

8.2. Angles and Triangles www.ck12.org
If m 6 1 = 77◦ and m 6 4 = 30◦, then what is the measure of 6 2, 6 3, and 6 5? Note: graphic is not to scale.
Notice the triangle is formed by two transversals crossing parallel lines l and m6 3. When the sides of the trianglesare extended above, pairs of angles are formed; an interior angle and an exterior angle, which together form a straightangle (180◦).
Let’s look for special angle pairs to help find the measures of 6 2, 6 3, and 6 5.
6 2 and 6 4 are alternate interior angles, so m6 2 = 30◦ too.
6 1 and 6 5 are corresponding angles, so m6 5 = 77◦ too.
Next investigate the straight angle that includes 6 1, 6 2, and 6 3. We know straight angles = 180◦.
So m6 1+m6 2+m6 3 = 180◦
In fact the sum of a triangle’s interior angles always equals 180◦ (angle-sum theorem).
To find m 6 3, substitute the known values for 6 1 and 6 2, and solve for 6 3 using the angle-sum theorem.
77◦+30◦+m6 3 = 180◦
m 6 3 = 73◦
So m 6 2 = 30◦, m6 3 = 73◦, and m6 5 = 77◦ .
98

www.ck12.org Chapter 8. Geometric Relationships
What if you wanted to classify the Bermuda Triangle by its sides and angles? You are probably familiar with themyth of this triangle; how several ships and planes passed through and mysteriously disappeared.
Looking at the graphic below, what type of triangle is the Bermuda Triangle?
The Bermuda Triangle is an acute scalene triangle because all angles are < 90◦ and are all different.
Now let’s investiage the angles further...
1. Draw the Bermuda triangle on a piece of paper. We’ll color the three interior angles three different colors andlabel each one, 6 1, 6 2, and 6 3.
2. Now we’ll tear off the three colored angles, so you have three separate angles.
3. Let’s match the angles so their vertices match up. What happens? What measure do the three angles add upto?
This investigation shows us that the sum of the angles in a triangle is 180◦ because the three angles fit together toform a straight line. Recall that a line is also a straight angle and all straight angles are 180◦.
As proof, add the Bermuda Triangle angles: 55.6◦+61.8◦+62.6◦ = 180◦
Remember: The interior angles of any triangle ALWAYS add up to 180◦.
99

8.2. Angles and Triangles www.ck12.org
• If one angle = 90◦, then it is a right triangle
• If all angles are < 90◦, then it is an acute triangle.
• If one angle is > 90◦, then it is an obtuse triangle.
• If all the angles are different, then it is a scalene triangle because the sides opposite the different angles willautomatically be different lengths too (hint: scales on a fish are different).
• If 2 sides and angles are the same (as noted by the dash mark on each congruent side), then it is an isoscelestriangle (hint: 2 "eyes" are the same)
– GH=HI, means these lines are congruent (same).– If GH=HI, then the angles that are opposite each congruent side are also congruent - m6 G = m6 I
• If all 3 sides and angles are the same (always 60◦), then it is an equilateral triangle (notice the dash marksagain on each side to show the sides are equal).
• A triangle may be classified by more than 1 category. For example, an obtuse isosceles or an acute scalene.
• Remember for triangles, the sum of all interior angles is always 180◦.
100

www.ck12.org Chapter 8. Geometric Relationships
1. Two sides of a triangle measure 13 cm and the third side measures 12 cm, what type of triangle is it?
2. What type of triangle is this? Write an equation and find m 6 A,m6 B,and m 6 C.
3. What type of triangle is this? Write an equation and find m 6 D.
4. Given m6 1 = 42◦ and m6 2 = 68◦, find the measures of 6 3, 6 4, and 6 5.
101

8.2. Angles and Triangles www.ck12.org
5. Determine m 6 1 in each triangle and name each type of triangle.
a.
b.
c.
d.
6. Solve for x, then classify the triangle and explain your reasoning by showing the measures of the 3 angles.
a.
b.
c.
102

www.ck12.org Chapter 8. Geometric Relationships
7. For each statement below, write True or False. If false, correct the statement to make the the statement true andexplain your reasoning.
a. A triangle’s interior angles measure 32◦, 112◦, and 36◦, so it is an acute triangle.
b. A triangle is formed that has the following interior angles: 62◦, 67◦, and 43◦, 90◦,.
c. A right triangle is formed that has the following interior angles: 43◦, 90◦, and 47◦.
8. Given lines 1 and 2 are parallel (L1‖L2) and lines 3 and 4 are parallel (L3‖L4), find the measures of 6 1, 6 2, 6 3, 6 4, 6 5, and 6 6.
9. Find the value of x.
103

8.2. Angles and Triangles www.ck12.org
1. Draw these 3 lines on a coordinate plane that meets the following conditions.
a. A slope of 25 that passes through (2, 5).
b. A slope of −25 that passes through (7, 3).
c. A slope of 0 that passes through (0, 3).
d. Name the vertices (x, y) of the triangle drawn from the intersection of these 3 lines and classify the type oftriangle drawn.
1. Find the three interior measures of the triangle and classify the triangle
2. Find the measures for x, y, and z in the tiny middle triangle.
104

www.ck12.org Chapter 8. Geometric Relationships
3. Line k is parallel to line l. m 6 EDC = 41◦ and m6 ABC = 32◦. Find the m 6 BCD. Explain in detail how you knowyou are correct. Add additional lines and points as needed for your explanation.
For more videos and practice problems,
• click here to go to Khan Academy.• search for "Angles 1" on Khan Academy (www.khanacademy.org ).• go to Khan Academy’s Common Core page standard 8.G.A.5 (www.khanacademy.org/commoncore/grade-8-
G).
Watch this video to for more review on triangle angles.
MEDIAClick image to the left or use the URL below.URL: http://www.ck12.org/flx/render/embeddedobject/117501
105

8.2. Angles and Triangles www.ck12.org
Practice 1
1. Acute isosceles triangle
2. Equiangular triangle, 60◦
3. Right triangle, 49◦
4. m6 3 = 70◦, m6 4 = 42◦, m6 5 = 68◦
5. a. 41◦; obtuse, scalene triangle
b. 86◦; acute, isosceles triangle
c. 61◦; acute, isosceles triangle
d. 13◦; scalene, right triangle
6. a. x = 22, so the angle measures are 65◦, 65◦, 50◦. This means it is an acute triangle because all the angles areless than 90 and it is isosceles because 2 sides are the same length because 2 angles are the same measurement.
b. x = 17, so the angle measures are 90◦, 52◦, 38◦. This means it is a right triangle because one of the anglesequals 90 and it is scalene because all 3 angles are different and so all three side lengths will be different.
c. x = 12, so the angles are 90◦, 65◦, 25◦. This means it is a right triangle because one of the angles equals 90and it is scalene because all 3 angles are different and so all three side lengths will be different.
7. a. False, it is an obtuse triangle because one of the measures is greater than 90 degrees.
b. False, this does not form a triangle because the three interior angles do not add up to 180 degrees. The givenangles add-up to 181 degrees. A triangle is formed that has the following interior angles: 62◦, 67◦, and 51◦ (oranything that adds up to 180 degrees).
c. True
8. m6 1 = 29◦,m6 2 = 61◦,m6 3 = 29◦,m6 4 = 61◦,m6 5 = 90◦,m6 6 = 29◦
9. x = 206◦
106

www.ck12.org Chapter 8. Geometric Relationships
Bobcat Review
1. a - c. a is the uphill line (m = 2/5), b is the downhill line (m = -2/5) and c is the horizontal line (m = 0).
b. The vertices are (7, 3), (-3, 3), and (2, 5). The triangle is an obtuse triangle since 2 angles are equal and oneangle is greater than 90.
Bobcat Stretch
1. 70◦, 50◦, and 60◦ (x = 20).
2. x = 30◦, z = 50◦, and y = 100◦.
3. m6 BCD = 73◦.
Let F be a point on line k so that 6 DCF is a straight angle. Then because line k and l are parallel, 6 EDC and6 CFA are congruent and have equal measure. We know 32◦ + 41◦ + m6 BCF = 180◦, so m6 BCF = 107◦. 6 BCF and6 BCD form a straight angle. So 107◦ + m6 BCD = 73◦.
107

8.3. Quadrilaterals www.ck12.org
8.3 Quadrilaterals
Classify quadrilaterals and find missing angle measures using quadrilateral characteristics.
By the end of this lesson, you should be able to define and give an example of the following vocabulary words:
• Quadrilateral - A closed figure (polygon) with four sides that are line segments.
– Trapezoid - A quadrilateral with exactly 1 pair of parallel sides.– Parallelogram - A quadrilateral with both pairs of opposite sides parallel and 2 pairs of congruent angles
opposite each other.
* Rhombus - A parallelogram with 4 sides of equal length.* Rectangle - A parallelogram with 4 right angles.* Square - A parallelogram with 4 sides of equal length and 4 right angles.
What is the sum of the interior angles of a quadrilateral?
To best understand this, let’s look at a square.
A square has four right angles. Each right angle is 90◦. We can add up the sum of the interior angles of a square andsee how this is related to all quadrilaterals.
90◦+90◦+90◦+90◦ = 360◦
The sum of the interior angles of all quadrilaterals is 360◦.
108

www.ck12.org Chapter 8. Geometric Relationships
Classify the shape below and find the missing measure "x".
The sum of the interior angles of all quadrilaterals is 360◦.
Write an equation using the variable and given measurements and figure out the measure of the missing angle.
80+75+105+ x = 360
260+ x = 360
360−260 = x
100 = x
The missing angle is equal to 100◦.
109

8.3. Quadrilaterals www.ck12.org
• Here is a chart summarizing different quadrilaterals.
• The quadrilateral angle-sum theorum only works for regular "convex" quadrilaterals (no angles point inwardsor no internal angle is more than 180◦).
110

www.ck12.org Chapter 8. Geometric Relationships
1. True or False. Classify each statement below as true or false. If false, correct any errors to make the statementtrue.
a. A square is a quadrilateral and a parallelogram.
b. A rhombus is a square.
c. A quadrilateral is a polygon.
d. A rectangle is a square.
e. Any closed three-sided shape is a quadrilateral.
2. Name the shape described below.
a. A parallelogram where all sides and angles are equal.
b. A polygon made up of four line segments, two of which are parallel. There are no equal angles.
c. A quadrilateral with 4 equal parallel sides and two sets of congruent angles.
3. Fill in the blank. The interior angles of a quadrilateral add up to be ____________________ degrees.
4. If the sum of the interior angles of a quadrilateral is equal to 360◦, how many triangles can you draw inside aquadrilateral? Explain your reasoning.
111

8.3. Quadrilaterals www.ck12.org
5. Find the missing measure "x" in the following quadrilaterals. Note: they are not drawn to scale.
a.
b.
c.
d.
112

www.ck12.org Chapter 8. Geometric Relationships
6. Solve for the given variables to find the missing measures.
a.
b.
7. Solve for the missing measures. Explain how you know you are correct.
113

8.3. Quadrilaterals www.ck12.org
8. Solve for x to find the missing measures.
1. How many degrees are in a triangle?
2. Draw these 4 lines on a coordinate plane that meets the following conditions.
a. A slope of −27 that passes through (6, -4).
b. A slope of −73 that passes through (-1, -2).
c. A slope of −27 that passes through (-4, 5).
d. A slope of −73 that passes through (3, -3).
114

www.ck12.org Chapter 8. Geometric Relationships
1. If m6 a= 23.6◦ and quadrilateral ABCD is a square, find the measures of 6 BAM, 6 DAN, 6 AMB, 6 AMC, 6 ANC, and 6 AND.Explain your reasoning.
2. Use the diagram below to find the angle measures w, y, and z and the side length x. Note: The two quadrilateralsthat share a side are parallelograms and this diagram is not drawn to scale.
115

8.3. Quadrilaterals www.ck12.org
For more videos and practice problems,
• click here to go to Khan Academy.• search for "Quadrilateral angles" on Khan Academy (www.khanacademy.org ).
Watch this video to further review quadrilaterals.
MEDIAClick image to the left or use the URL below.URL: http://www.ck12.org/flx/render/embeddedobject/132392
1. a. True
b. False, a rhombus can be a square when all four angles are 90 degrees.
c. True
d. False, a rectangle can be a square when all four sides are equal.
e. False, any closed four-sided shape is a quadrilateral.
2. a. Square
b. Trapezoid
c. Rhombus
3. 360◦
4. 2 triangles because the sum of a triangle is 180 degrees (m 6 AMC = 123.2◦).
5. a. 65◦
b. 70◦
c. 105◦
d. 110◦
6. a. x = 60, so the missing measures are 60◦, 60◦, 120◦, and 120◦. [ 2(2x + x) = 360]
b. x = 28, so the missing measures are 132◦ and 88◦. [89 + 51 + (5x-8) + (3x + 4) = 360].
7. m6 x = 70◦,m6 y = 70◦,and m6 z = 90◦
8. x = 45, so the angle measures are 45◦, 45◦, 135◦, and 135◦.
116

www.ck12.org Chapter 8. Geometric Relationships
Bobcat Review
1. 180 degrees
2.
Bobcat Stretch
1. m6 BAM = 33.2◦, m6 DAN = 33.2◦, m 6 AMB = 56.8◦, m6 AMC = 123.2◦, m6 ANC = 123.2◦, m6 AND = 56.8◦
Use the following facts to solve for angles BAM and DAN.
Since the quadrilateral is a square, the m 6 BAD = 90◦.
The angles BAM and DAN are congruent since the transversal line is equal distance (x) from each corner ofthe square.
Use the triangle sum theorem to solve for angles AMB and AND.
Since a straight angle equals 180 degrees, then you can solve for angles AMC and ANC.
2. m6 w = 135◦,m6 y = 105◦,m6 z = 60◦ and x = 16.
117

8.4. Polygons and Angles www.ck12.org
8.4 Polygons and Angles
Find angle measures in polygons.
By the end of this lesson, you should be able to define and give an example of the following vocabulary words:
• Polygon - A closed figure made up of straight line segments that intersect only at their endpoints. Polygonshave three or more sides.
– The sum of the interior angles of a polygon = (n−2)×180◦, where n = the number of sides.
• – Regular Polygon - A polygon where all the angles have the same measure and all sides have the samelength.
* Measure of one angle in a regular polygon = (n−2)×180◦
n
• – Irregular Polygon - A polygon that does not have all sides equal and does not have all angles equal.
Find the sum of the interior angles in a hexagon.
First, count the number of angles or sides. This polygon has six sides and six angles. We will put 6 in for n in theformula and solve.
(n−2)×180◦
(6−2)×180◦
4×180◦ = 720◦
The sum of the interior angles in a hexagon is 720◦.
Note: the formula shows that a hexagon contains 4 triangles. When we multiply by 180◦, we find that the sum of theinterior angles in a hexagon is 720◦. This is true for any (convex) hexagon, regular or irregular.
118

www.ck12.org Chapter 8. Geometric Relationships
What is the measure of each angle in a regular octagon?
Substitute the number of sides in the sum of interior angles of a polygon formula to find the total of the angles.
(n−2)×180◦
n(8−2)×180◦
86×180◦
81,080◦
8
If it is a regular octagon, all of the angles are congruent, which means they all have the same measure. So, dividethe total number of degrees by 8 (the number of angles) to find the measure of each angle..
1,080◦÷8 = 135◦
Each angle in a regular octagon, no matter how big or small, always measures 135◦.
119
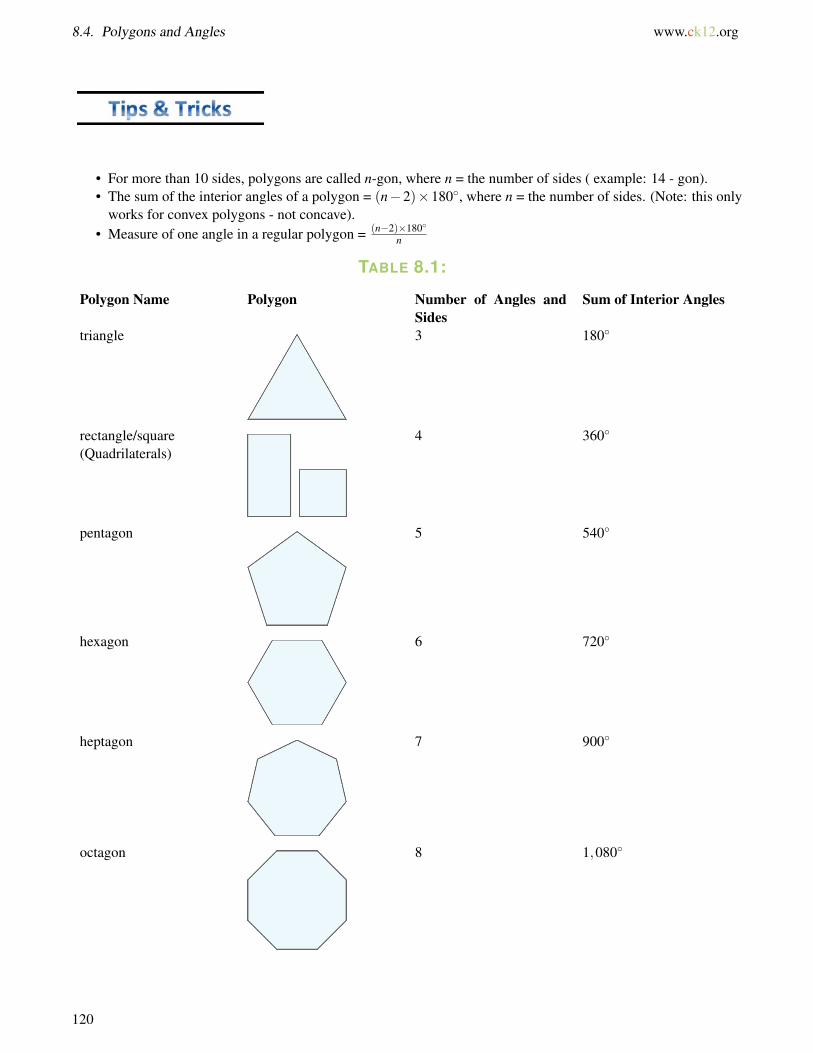
8.4. Polygons and Angles www.ck12.org
• For more than 10 sides, polygons are called n-gon, where n = the number of sides ( example: 14 - gon).• The sum of the interior angles of a polygon = (n−2)×180◦, where n = the number of sides. (Note: this only
works for convex polygons - not concave).• Measure of one angle in a regular polygon = (n−2)×180◦
n
TABLE 8.1:
Polygon Name Polygon Number of Angles andSides
Sum of Interior Angles
triangle 3 180◦
rectangle/square(Quadrilaterals)
4 360◦
pentagon 5 540◦
hexagon 6 720◦
heptagon 7 900◦
octagon 8 1,080◦
120

www.ck12.org Chapter 8. Geometric Relationships
TABLE 8.1: (continued)
Polygon Name Polygon Number of Angles andSides
Sum of Interior Angles
nonagon 9 1,260◦
decagon 10 1,440◦
•
121
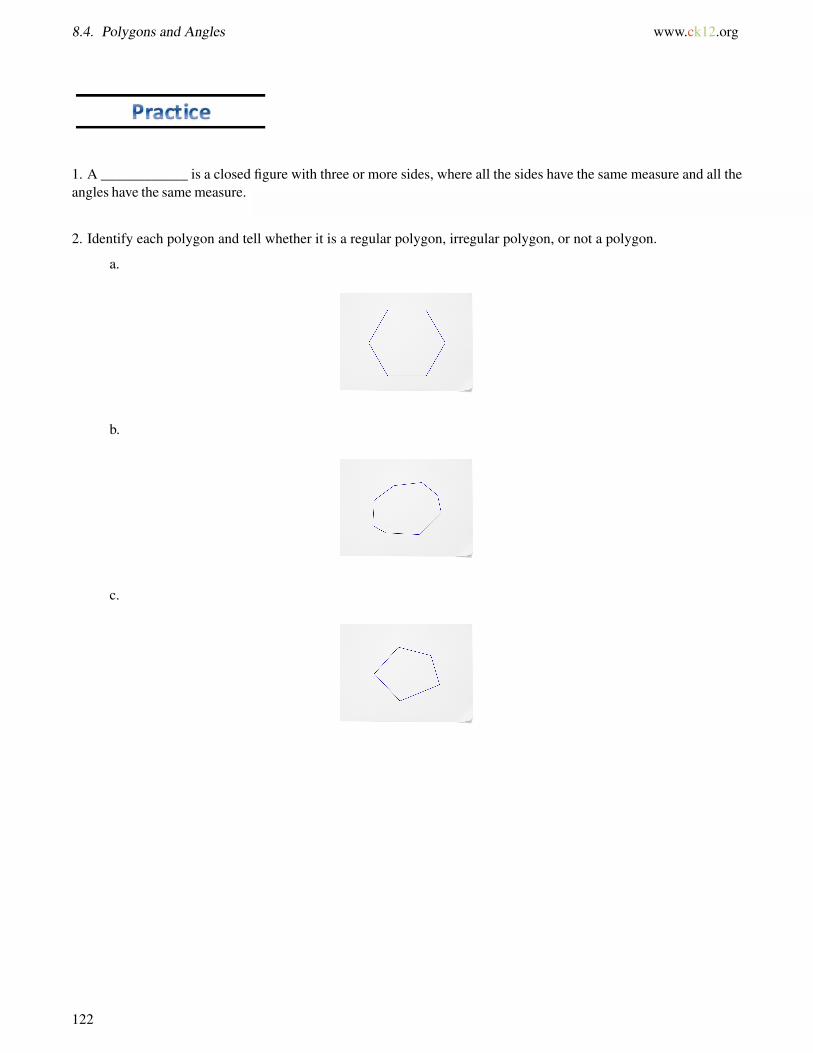
8.4. Polygons and Angles www.ck12.org
1. A ____________ is a closed figure with three or more sides, where all the sides have the same measure and all theangles have the same measure.
2. Identify each polygon and tell whether it is a regular polygon, irregular polygon, or not a polygon.
a.
b.
c.
122

www.ck12.org Chapter 8. Geometric Relationships
d.
e.
3. Find the sum of the angle measures for each of the following polygons.
a. 11-gon
b. 20-gon
c. 100-gon
4. Find the measure of one angle for each of the regular polygons below.
a. 12-gon
b. 15-gon
c. 22-gon
123

8.4. Polygons and Angles www.ck12.org
5. Find the value of the variable, and then calculate the missing measure(s).
a.
b.
c.
d.
124
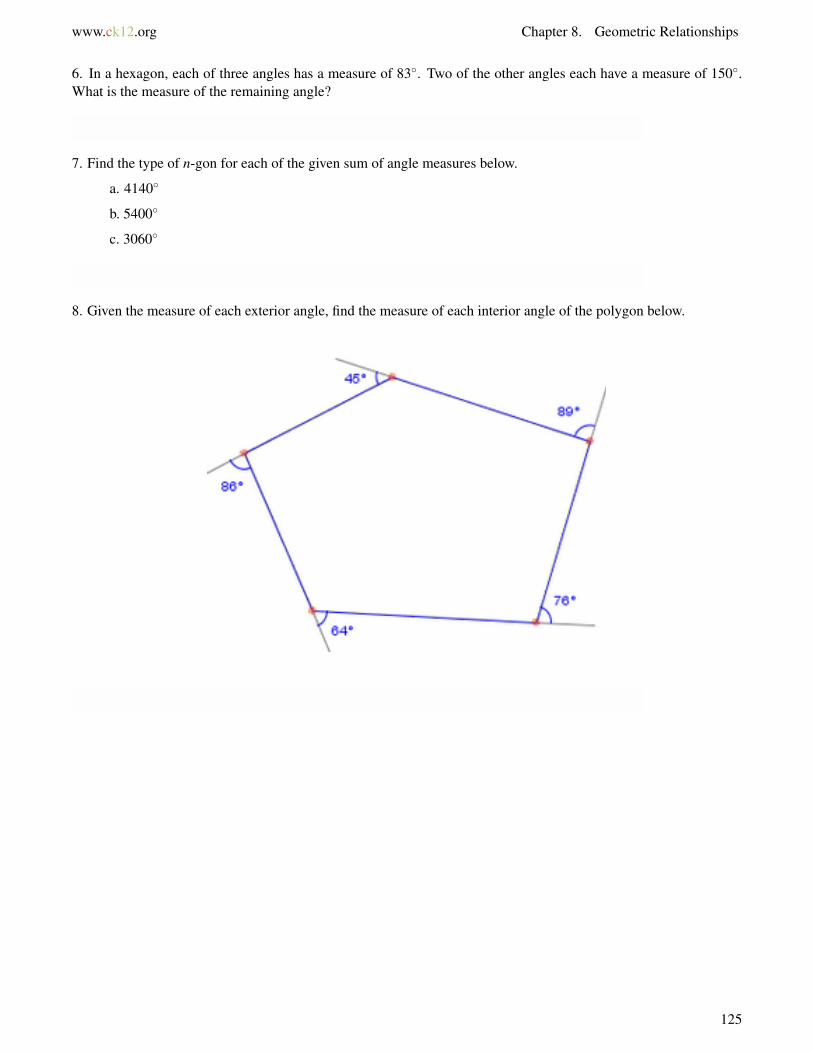
www.ck12.org Chapter 8. Geometric Relationships
6. In a hexagon, each of three angles has a measure of 83◦. Two of the other angles each have a measure of 150◦.What is the measure of the remaining angle?
7. Find the type of n-gon for each of the given sum of angle measures below.
a. 4140◦
b. 5400◦
c. 3060◦
8. Given the measure of each exterior angle, find the measure of each interior angle of the polygon below.
125

8.4. Polygons and Angles www.ck12.org
1. Write the diameter of an insect’s cell in scientific notation. The diameter of an insect’s cell is about 0.00000000017.
2. Write 4.5×10⁸ in standard form.
3. Earth is 887 million miles from Saturn. Write this distance in standard form and in scientific notation.
1.The expressions (−6x+24)◦ and (−5x+38)◦ represent the measures of two interior angles in a regular pentagon.What is the measure of one interior angle of the pentagon and the value of x?
2. The expressions (−2x−6)◦ and (−9x−531)◦ represent the measures of two interior angles in a regular decagon.What is the measure of one interior angle of the decagon and the value of x?
3. The expressions (6x+14)◦ and (−2x+182)◦ represent the measures of two interior angles in a regular nonagon.What is the measure of one interior angle of the nonagon?
4. Find the value of x and y, and then find the measure of each angle.
126

www.ck12.org Chapter 8. Geometric Relationships
For more videos and practice problems,
• click here to go to Khan Academy.• search for "angles of a polygon" on Khan Academy (www.khanacademy.org ).
Watch this video to further review sum of interior angles of a polygon.
MEDIAClick image to the left or use the URL below.URL: http://www.ck12.org/flx/render/embeddedobject/132643
1. regular polygon
2. a. Regular hexagon
b. Irregular octagon
c. Irregular pentagon
d. Irregular decagon
e. not a polygon
3. a. 1620◦
b. 3240◦
c. 17640◦
4. a. 150◦
b. 156◦
c. 163.64◦
5. a. x = 3, 93◦
b. x = 10, 120◦, 120◦, 120◦, 90◦, 90◦
c. x = 105, 105◦ and 116◦
d. x = 35, 100◦ and 132◦
6. 171◦
7. a. 25-gon
127

8.4. Polygons and Angles www.ck12.org
b. 32-gon
c. 19-gon
8. 91◦,135◦,94◦,116◦, and 104◦.
Bobcat Review
1. 1.7×10⁻¹⁰
2. 450,000,000
3. 887,000,000; 8.87×10⁸
Bobcat Stretch
1. x = -14, 108◦ degrees
2. x = -75, 144◦ degrees
3. x = 21, 140◦ degrees
4. x = 51; y = 108; 108◦
128

www.ck12.org Chapter 8. Geometric Relationships
8.5 Congruent Polygons
Identify and name congruent polygons.
By the end of this lesson, you should be able to define and give an example of the following vocabulary words:
• Congruent sides - The sides are the same length.• Congruent angles - The angles have the same measure.• Corresponding parts - The parts are in the same relative position in different figures.
Here’s an example of congruent polygons. It is important to name line segments correctly to identify which segmentsare equal in length and to see which angles have the same measures. Notice the congruent symbol marks in thediagram below to show which angles and sides are equal. If two polygons have markings that confirm they arecongruent, then you can create a congruency statement such as: ABC =DEF .
129

8.5. Congruent Polygons www.ck12.org
• Congruent sides have to be named in the exact order they are shown. So if AB∼= EF , then AB��@@∼= FE, but BA∼=FE.
1. _________ angles are angles that have the same measure.
2. List the corresponding angles and sides and write a congruency statement.
3. If4HFI ∼=4MLK, then label the missing measures (sides and angles) in4MLK.
130

www.ck12.org Chapter 8. Geometric Relationships
4. Which of the following case(s) represents a pair of congruent triangles?
131

8.5. Congruent Polygons www.ck12.org
5. Given the following triangles, which are congruent?
132

www.ck12.org Chapter 8. Geometric Relationships
6. True or False. The polygon below ABCD =FEHG . In the polygon, AB ∼= EF . If false, correct the statement tomake the statement true.
7. Given the figures below ABCDEF =LMNOPQ , find the value of m, n, and, p. Explain your reasoning. (Hint:which congruent relationships did you use to determine the values of each variable?)
8. Given the figures below ABCDE =PQRST , find the value of x, y, and QR. Explain your reasoning.
133
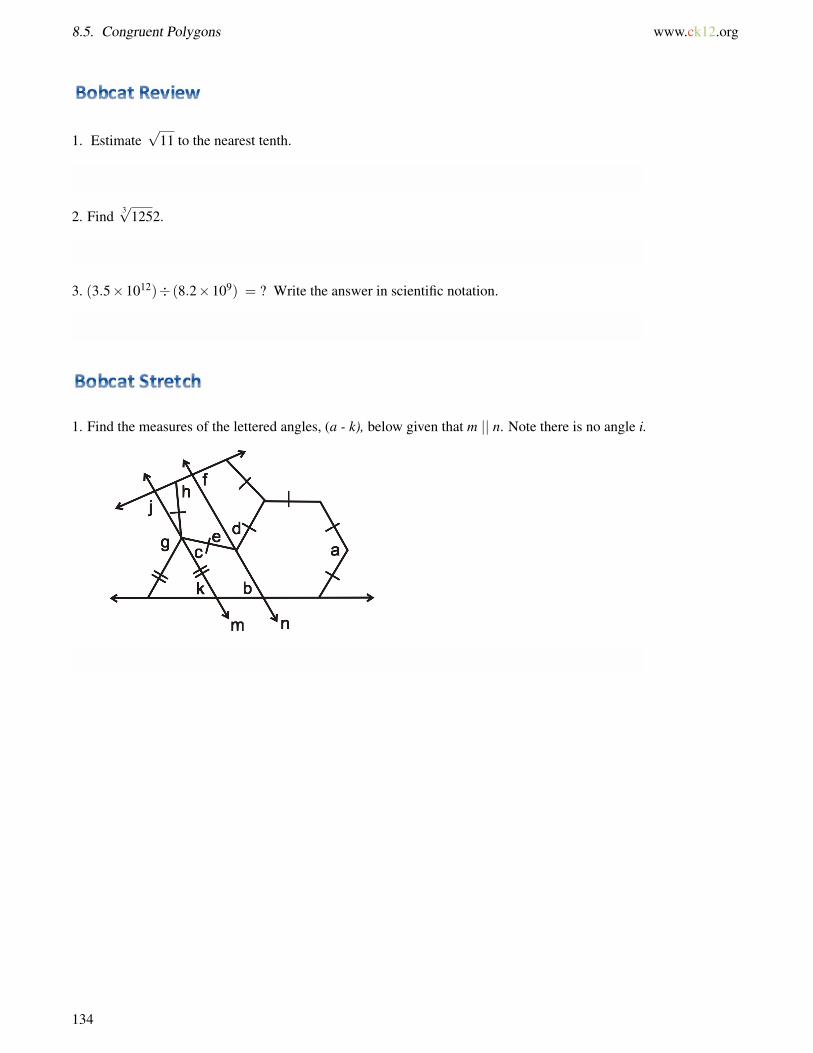
8.5. Congruent Polygons www.ck12.org
1. Estimate√
11 to the nearest tenth.
2. Find3√
1252.
3. (3.5×10¹²)÷ (8.2×10⁹) = ? Write the answer in scientific notation.
1. Find the measures of the lettered angles, (a - k), below given that m || n. Note there is no angle i.
134

www.ck12.org Chapter 8. Geometric Relationships
For more videos and practice problems,
• click here to go to Khan Academy.• search for "congruent triangles 2" on Khan Academy (www.khanacademy.org ).
Watch this video to further review congruence.
MEDIAClick image to the left or use the URL below.URL: http://www.ck12.org/flx/render/embeddedobject/132722
1. Congruent
2. T S∼= YO
T R∼= Y J
RS∼= JO
6 T ∼= 6 Y
6 R∼= 6 J
6 O∼= 6 S
For example: ST R =OJY
3. LK = 6 yd
MK = 7 yd
ML = 10 yd
6 L = 40◦
6 M = 30◦
6 K = 110◦
4. They are all congruent.
135

8.5. Congruent Polygons www.ck12.org
5. The first and second triangles are congruent. The third one is not the same.
6. False, AB ∼= FEBA ∼= EF . Remember you have to label the line segments in the exact order they are shown. Inthis case from the base of the trapezoid to the smaller top.
7. 6 B∼= 6 M, so 11m = 154.
m = 14 and m6 M = 154◦
6 A∼= 6 L, so p = 64
n = 32 because 6 P∼= 6 E
8. x = 19 because 6 A∼= 6 P
y = 27 because 6 D∼= 6 S
QR = 5.7 because QR∼= BC
Bobcat Review
1. 3.3
2. 5
3. 4.27×10²
Bobcat Stretch
1. m6 a = 120◦, m 6 b = 60◦, m6 c = 48◦, m6 d = 60◦, m6 e = 48◦, m6 f = 84◦,
m 6 g = 120◦, m6 h = 108◦, m6 j = 96◦, and m6 k = 60◦.
136

www.ck12.org Chapter 8. Geometric Relationships
8.6 References
1. Bill Zahner and Lori Jordan. http://www.ck12.org/editor/concept/Corresponding-Angles-Intermediate/r18/#edit_content .
2. . http://www.ck12.org/editor/concept/Corresponding-Angles-Intermediate/r18/#edit_content .3. Bill Zahner and Lori Jordan. http://www.ck12.org/editor/concept/Corresponding-Angles-Intermediate/r18/ .4. . http://www.azed.gov/azccrs/files/2013/11/azccrs-grade8-math-finalstd_111113.pdf .5. . Engage NY, Module 2, Lesson 13, pg 151 .6. catman 3000. http://catman3000.hubpages.com/hub/Basic-math-angle-facts-angles-in-a-triangle-on-a-straight
-line-and-around-a-point .7. Mr. Thornton. http://eclass1.wsd.k12.ca.us/moodle/mod/resource/view.php?id=501 .8. . http://eclass1.wsd.k12.ca.us/moodle/mod/resource/view.php?id=501 .9. Engage NY, Module 2, lesson 13, p 152. http://www.engageny.org/sites/default/files/resource/attachments/g8-
m2-copy_ready_materials.pdf .10. . CK-12 Quadrilaterals and angles .11. Jim Wysocki. http://www.ck12.org/user:d3lzb2NraWpAY2F0bGluLmVkdQ../section/Angles-in-Polygons/ .12. Jim Wysocki. http://www.ck12.org/user:d3lzb2NraWpAY2F0bGluLmVkdQ../section/Angles-in-Polygons/ .13. . http://www.ck12.org/user:d3lzb2NraWpAY2F0bGluLmVkdQ../section/Angles-in-Polygons/ .14. . CK-12 Properties of Parallelograms .15. Dr Abdelkader Dendane. http://www.analyzemath.com/Geometry/challenge/kite_square.html .16. . CK-12 Properties of Parallelograms .17. . CK12 .18. Pierce, Rod. (21 Jul 2013). "Polygons". Math Is Fun. Retrieved 11 Sep 2014 from http://www.mathsisfun.com/geometry/polygons.html.
http://www.mathsisfun.com/citation.php .19. . http://www.math-worksheet.org/angles .20. . http://www.matermiddlehigh.org/ourpages/auto/2013/9/18/54847949/polygons%20and%20angles%20quiz.p
df .21. . CK-12 Angles in convex polygons .22. . CK-12 Interior Angles of Convex polygons .23. . http://www.exeter.k12.pa.us/cms/lib6/PA01000700/Centricity/Domain/290/WS_-_angle_measures_in_polygon
s_1.pdf .24. . http://basicmathtutor.jimdo.com/geometry/exterior-angle-of-a-pentagon/ .25. . CK-12 Interior Angles of Convex polygons .
137

www.ck12.org
CHAPTER 9 TransformationsChapter Outline
9.1 REFLECTIONS AND SYMMETRY
9.2 TRANSLATIONS AND ROTATIONS
9.3 SIMILARITY AND DILATIONS
9.4 TRANSFORMATION SEQUENCES
9.5 REFERENCES
138

www.ck12.org Chapter 9. Transformations
9.1 Reflections and Symmetry
Reflect figures and identify lines of symmetry.
By the end of this lesson, you should be able to define and give an example of the following vocabulary words:
• Reflection - A transformation known as a flip where a mirror image of each point of a figure is created.
• Transformation - A way of shifting or moving a geometric figure on the coordinate plane.
• Image - The new figure made by the transformation.
• Symmetry - When an object has the ability to be divided into matching parts (one half of the figure is a mirrorimage of the other half).
• Line of Symmetry - The line that divides an object into matching parts.
A triangle with vertices A(-1, 1), B(-3, 1), and C(-1, 6) is reflected across the y-axis. Find the coordinates of thevertices of the image.
To visualize the problem, graph the given triangle on a coordinate plane.
139

9.1. Reflections and Symmetry www.ck12.org
Reflect the triangle across the y-axis and write down the reflected image vertices. Reflecting a point across the y-axisis a horizontal change where the image point is the same distance from the y-axis as the original point, but on theopposite side.
The reflected triangle’s vertice coordinates are A’(1, 1), B’(3, 1), and C’(1, 6) when reflected over the y-axis.
As with all things in math, look for a pattern.
(-1, 1) reflected across the y-axis is (1, 1). The x-coordinate has the opposite sign.
(-3, 1) reflected across the y-axis is (3, 1). The x-coordinate has the opposite sign.
(-1, 6) reflected across the y-axis is (1, 6). The x-coordinate has the opposite sign.
Given this information, what would the vertices be if the triangle was reflected across the x-axis?
(-1, 1) reflected across the x-axis is (-1, -1). The y-coordinate has the opposite sign.
(-3, 1) reflected across the x-axis is (-3, -1). The x-coordinate has the opposite sign.
(-1, 6) reflected across the x-axis is (-1, -6). The x-coordinate has the opposite sign.
The reflected triangle’s vertice coordinates are A’(-1, -1), B’(-3, -1), and C’(-1, -6) when reflected over thex-axis.
140

www.ck12.org Chapter 9. Transformations
A trapezoid with vertices A(2, 1), B(7, 1), C (3, 3), and D (6, 3) is reflected in the x-axis. Find the coordinatesof the vertices of the image.
To visualize the problem, graph the given trapezoid on a coordinate plane.
Reflect the trapezoid across the x-axis and write down the reflected image vertices. Note: Reflected images arecongruent to the original.
The reflected trapezoid’s vertice coordinates are A’(2, -1), B’(7, -1), C’(3, -3) and D’(6, -3) when reflected overthe x-axis.
Again, look for a pattern.
(2, 1) reflected across the x-axis is (2, -1).
(7, 1) reflected across the x-axis is (7, -1). All the y-coordinates have the opposite sign.
(3, 3) reflected across the x-axis is (3, -3).
(6, 3) reflected across the x-axis is (6, -3).
Given this information, what would the vertices be if the trapezoid was reflected across the y-axis?
(2, 1) reflected across the y-axis is (-2, 1).
(7, 1) reflected across the y-axis is (-7, 1). All the x-coordinates have the opposite sign.
(3, 3) reflected across the y-axis is (-3, 3).
(6, 3) reflected across the y-axis is (-6, 3).
141

9.1. Reflections and Symmetry www.ck12.org
The reflected triangle’s vertice coordinates are A’(-2, 1), B’(-7, 1), C’(-3, 3) and D’(-6, 3) when reflected overthe x-axis.
Does the figure below have symmetry? Can it be a reflection?
Yes, this figure has symmetry and can be a reflection. There are many lines of symmetry in this figure - oneexample is shown.
Do these figures have symmetry?
No, these figures do not have symmetry. There is no line of symmetry that can be drawn to divide the object intocongruent parts.
142

www.ck12.org Chapter 9. Transformations
• When a figure is reflected over the y-axis, the x-coordinates are the opposite sign in the reflection.
• When a figure is reflected over the x-axis, the y-coordinates are the opposite sign in the reflection.
• When a figure is reflected over either axis, the image is congruent to the figure.
1. Tell whether the dashed figure is a reflection of the solid figure.
a.
b.
c.
143

9.1. Reflections and Symmetry www.ck12.org
2. How many lines of symmetry does each figure have?
a.
b.
c.
3. Find the coordinates of the vertices of the image without graphing the triangle. Label the image verticesappropriately.
a. A triangle with vertices A (2, -2), B (2, -5), and C (7, -5) is reflected in the x-axis. Find the coordinates ofthe vertices of the image.
b. A triangle with vertices X (-3, -1), Y (-4, -5), and Z (2, 3) is reflected in the y-axis. Find the coordinates ofthe vertices of the image.
144

www.ck12.org Chapter 9. Transformations
4. Reflect the polygon in the given axis. Graph the figure and its image. Label the vertices correctly so that theoriginal can be identified from the reflected image.
a.A (4, 3), B (1, 7), C ;(1, 0), D (4, 0); x-axis
b. W (-1, 1), X (0, 4), Y (-3, 2), Z (-5, -2); y-axis
c. J (2, -1), K (4, 2), L (7, 1), M (9, -2), N (5, -5); y-axis
d. E (-2, 2), F (2, 2), G (5, 0), H (5, -3), I (0, -2), J (0, 0); x-axis
5. Give an example of a letter with the given number of lines of symmetry.
a. 1
b. 2
145

9.1. Reflections and Symmetry www.ck12.org
6. How many lines of symmetry does each quilt square have?
a.
b.
c.
146

www.ck12.org Chapter 9. Transformations
1. The chance of winning a big lottery prize is about 10−8, and the chance of being struck by lightning in the US inany given year is about 0.000001. Which do you have a greater chance of experiencing? Explain.
2. Place each of the following numbers on a number line in its approximate location. (Hint: estimate the distances -it doesn’t have to be exact or to-scale.)
105, 10−99, 10−17, 1014, 10−5, 1030
3. A conservative estimate of the number of stars in the universe is 6×10²². The average human can see about 3,000stars at night with the naked eye. About how many times more stars are there in the universe, compared to the starsa human can actually see?
147

9.1. Reflections and Symmetry www.ck12.org
1. Draw a polygon on a coordinate plane. Draw its image somewhere else on the coordinate plane. Describe,informally, how you moved (transformed) the figure from the original position to the image position. (Hint: useterms like "slid figure three units to the right and then flipped it" or "turned figure to the left and then slid it 2 unitsto the left").
2. Is this image (shadow) a reflection of the original figure? Explain your reasoning.
For more videos and practice problems,
• click here to go to Khan Academy.• search for "axis of symmetry" on Khan Academy (www.khanacademy.org ).
Watch this video to further review symmetry.
MEDIAClick image to the left or use the URL below.URL: http://www.ck12.org/flx/render/embeddedobject/132802
148

www.ck12.org Chapter 9. Transformations
1. a. no
b. yes
c. yes
2. a. 4
b. 1
c. 2
3. a. A (2, 2), B (2, 5), C (7, 5)
b. X (3, -1), Y (4, -5), Z (-2, 3)
4. a. Image - A’ (4, -3), B’ (1, -7), C’ (1, 0), D’ (4, 0) - x-axis
b. Image - W’ (1, 1), X’ (0, 4),Y’ (3, 2), Z’ (5, -2) - y-axis
c. Image - J’ (-2, -1), K’ (-4, 2), L’ (-7, 1), M’ (-9, -2), N’ (-5, -5) - y-axis
d. Image - E’ (-2, -2), F’ (2, -2), G’ (5, 0), H’ (5, 3), I’ (0, 2), J’ (0, 0) - x-axis
5. a. Variable answers - A, M
b. Variable answers - I, H
6. a. 2
b. 4
c. 1
Bobcat Review
1. There is a greater chance of experiencing a lightning strike. On a number line, 10−8 is to the left of 10−6. Bothnumbers are less than one. Therefore, the probability of the event that is greater is 10−6 (getting struck by lightning).
2.
3. There are about 2×10¹⁹ times more stars in the universe compared to the number we can actually see. 6×10²²
3×10³
Bobcat Stretch
1. Any answer is correct as long as the original figure and the image figure are the same size and shape (congruent).
2. Yes, it’s just not reflected across the x- or y-axis. Instead it’s reflected across another "mirror" line - the reflectionline falls on coordinates (0, 0) and (5, 5). For each corner of the shape - measure from the point to the mirror line.Measure the same distance again on the other side and place a dot. Connect the new image dots.
149

9.2. Translations and Rotations www.ck12.org
9.2 Translations and Rotations
Translate or rotate figures in a coordinate plane.
By the end of this lesson, you should be able to define and give an example of the following vocabulary words:
• Translation- A slide - when a figure moves up, down, left or right on the coordinate plane, but does not changeposition. The image is congruent to the original figure.
– Slide to the Right a units: x + a.– Slide to the Left a units: x - a.– Slide Up b units: y + b.– Slide Down b units: y - b.– Translation rule = (x,y)⇒ (x+a,y+b)
• Rotation- A turn - when a figure is turned 90◦ or 180◦ on the coordinate plane.
– 90◦ Clockwise Rotation around the origin - For a point, switch the coordinates, then multiply the newy-coordinate by -1.
– 90◦ Counterclockwise Rotation around the origin - For a point, switch the coordinates, then multiply thenew x-coordinate by -1.
– 180◦ Rotation around the origin - For a point, multiply both its coordinates by -1. Note: Do not switchcoordinates as you do with 90◦ rotations.
150

www.ck12.org Chapter 9. Transformations
A triangle has vertices of (-1, 5), (-1, 2), and (-5, 2). Find the vertices of its image after the translation(x,y)⇒ (x+0,y−3).
The translation, x + 0, says to slide the figure 0 units (along the x-axis), which means the figure does not move leftor right.
The translation, y - 3, says to slide the figure 3 units down (along the y-axis), which means subtract 3 from eachy-coordinate in the original figure to arrive at its translated image.
(−1,5)⇒ (−1+0,5−3)⇒ (−1,2)
(−1,2)⇒ (−1+0,2−3)⇒ (−1,−1)
(−5,2)⇒ (−5+0,2−3)⇒ (−5,−1)
This means all of its vertices will shift 3 places down the y−axis. The y−coordinate changed from 5 to 2 and from2 to -1.
The vertices of the translated image are (-1, 2), (-1, -1), and (-5, -1). Note: The figure and its image arecongruent.
Note: If the translation was (x,y)⇒ (x+0,y+3), then the y−coordinate values would increase by three units andthe translated imaged would be above the original figure.
151

9.2. Translations and Rotations www.ck12.org
A square has vertices of (-4, 3), (-1, 3), (-1, 6), and (-4, 6). Find the vertices of its image after the translation (x,y)⇒(x+5,y+0).
The translation, x + 5, says to slide the figure 5 units to the right (along the x-axis), which means add 5 to eachx-coordinate in the original figure to arrive at its translated image.
The translation, y + 0, says to slide the figure 0 units (along the y-axis), which means the figure does not move up ordown.
(−4,3)⇒ (−4+5,3+0)⇒ (1,3)
(−1,3)⇒ (−1+5,3+0)⇒ (4,3)
(−1,6)⇒ (−1+5,6+0)⇒ (4,6)
(−4,6)⇒ (−4+5,6+0)⇒ (1,6)
This means all of its vertices will shift 5 places to the right along the x−axis. The x−coordinate changed from -4 to1 and from -1 to 4.
152

www.ck12.org Chapter 9. Transformations
The vertices of the translated image are (1, 3), (4, 3), (4, 6), and (1, 6). Note: The figure and its image arecongruent.
Note: If the translation was (x,y)⇒ (x− 5,y+ 0), then the x−coordinate values would decrease by five units andthe translated imaged would be to the left of the original figure.
Rotate this figure 90◦ clockwise on the coordinate plane.
Write down the coordinates for each of the points of this pentagon.
A(−3,5)
B(−4,4)
C(−3,3)
D(−1,2)
E(−1,4)
153

9.2. Translations and Rotations www.ck12.org
The easiest way to think about rotating any figure is to think about it moving around a fixed point. In this case, rotatethe figure around the center point or origin (0, 0).
To figure out the coordinates of the new rotated figure, switch the coordinates and then, multiply the y-coordinatesby -1.
A(−3,5)⇒ (5,−3)⇒ A′(5,3)
B(−4,4)⇒ (4,−4)⇒ B′(4,4)
C(−3,3)⇒ (3,−3)⇒C′(3,3)
D(−1,2)⇒ (2,−1)⇒ D′(2,1)
E(−1,4)⇒ (4,−1)⇒ E ′(4,1)
Graph the 90◦ clockwise rotated image. Notice that A′ is used to represent the rotated figure.
154

www.ck12.org Chapter 9. Transformations
Rotate this figure 90◦ counterclockwise on the coordinate plane.
To figure out the coordinates of the new rotated figure, switch the coordinates and then, multiply the x-coordinate by-1.
A(−3,5)→ (5,−3)→ A′(−5,−3)
B(−4,4)→ (4,−4)→ B′(−4,−4)
C(−3,3)→ (3,−3)→C′(−3,−3)
D(−1,2)→ (2,−1)→ D′(−2,−1)
E(−1,4)→ (4,−1)→ E ′(−4,−1)
Graph the 90◦ counterclockwise rotated image.
155

9.2. Translations and Rotations www.ck12.org
Rotate this figure 180◦ on the coordinate plane.
To figure out the coordinates of the new rotated figure, multiply both coordinates (x and y) by -1. *Remember!Do not switch the coordinates!
A(−3,5)⇒ A′(3,−5)
B(−4,4)⇒ B′(4,−4)
C(−3,3)⇒C′(3,−3)
D(−1,2)⇒ D′(1,−2)
E(−1,4)⇒ E ′(1,−4)
Graph the 180◦ rotated image.
156

www.ck12.org Chapter 9. Transformations
• Figures can translate in other ways too - figures can move diagonally by changing both their x− and ;y−coordinates.One way to recognize translations, then, is to compare their points. The x−coordinates will all change the sameway, and the y−coordinates will all change the same way.
• Translation rule (x,y)⇒ (x−1,y+2). In this example, the translation rule states to move the x-coordinate tothe left one and the y-coordinate up two to arrive at the translated image vertices.
• Reflection over the Axes Theorem: If you compose two reflections over each axis, then the final image is arotation of 180◦ of the original.
157

9.2. Translations and Rotations www.ck12.org
1. 6 ABC underwent a sequence of rotations. The original size of 6 ABC = 37◦. What was the size of the angle after thesequence of rotations? Explain.
2. Write the translation from the solid figure to the dashed figure.
a.
b.
158

www.ck12.org Chapter 9. Transformations
c.
3. Name the transformation shown in the graph.
a.
159

9.2. Translations and Rotations www.ck12.org
b.
c.
4. 4XY Z has vertices X (2, 2), Y (-3, 5), and Z (-7, -4). Find the vertices of its image after the translation (x,y)⇒(x−3,y−2).
5. 4LMN has vertices L (-2, 3), M (2, 6), and N (0, -1). Find the vertices of its image after the translation (x,y)⇒(x−1,y+4).
160

www.ck12.org Chapter 9. Transformations
6. Graph 4ABC with vertices A (-4, -1), B (-6, -5), and C (-1, -8), then graph the following images after the giventransformation.
a. Rotate4ABC 180◦.
b. Rotate4ABC 90◦ counterclockwise.
c. Translate4ABC using (x,y)⇒ (x+3,y−1).
d. Rotate4ABC 180◦ then translate using (x,y)⇒ (x+1,y+3).
7. Graph 4ABC with vertices A (-1, 7), B (-5, 5), and C (-3, 0), then graph the following images after the giventransformation.
a. Translate4ABC using (x,y)⇒ (x+5,y−3).
b. Rotate4ABC 90◦ clockwise three times.
1. The average person takes about 30,000 breaths per day. If the average American lives about 80 years (or about30,000 days), how many total breaths will a person take in a lifetime? Write and solve the problem using scientificnotation.
2. Most English-speaking countries use the short-scale naming system, in which a trillion is expressed as 1,000,000,000,000.Some other countries use the long-scale naming system, in which a trillion is expressed as 1,000,000,000,000,000,000,000.How many times greater is the long-scale naming system than the short-scale? Write and solve the problem usingscientific notation.
3. The Atlantic Ocean region contains approximately 2× 10¹⁶ gallons of water. Lake Ontario has approximately8,000,000,000,000 gallons of water. How many Lake Ontarios would it take to fill the Atlantic Ocean region interms of gallons of water? Use standard form to write your answer.
161

9.2. Translations and Rotations www.ck12.org
1. Rotate 4XY Z with vertices [ X (5, 5), Y (6, 2), and Z (2, 3)] around the point (1, 0), clockwise 90◦. Label theimage of the triangle with X’, Y’, and Z’ and write down the vertices of the rotated image.
2. Translate 4ABC along vector FG and then translate its image along vector JK. Be sure to label the imagesappropriately. (Hint: Use the coordinates on the vector to define the translation rule.)
162

www.ck12.org Chapter 9. Transformations
For more videos and practice problems,
• click here to to review translations of polygons.• click here to review rotation of polygons.• search for "Translation of polygons" or "Rotation of polygons" on Khan Academy (www.khanacademy.org ).• go to Khan Academy’s Common Core page standard 8.G.A.1, 8.G.A.2, 8.G.A.3, and 8.G.A.4 (www.khanacademy.org/commoncore/grade-
8-G).
Watch this video to further review translations.
MEDIAClick image to the left or use the URL below.URL: http://www.ck12.org/flx/render/embeddedobject/133360
1. The angle remains the same (37 degrees). A rotation only rotates the figure (changes position of the figure) - itdoesn’t change the size of the figure.
2. a. (x + 5, y + 1)
b. (x + 2, y - 3)
c. (x - 3, y - 6)
3. a. reflection (about the x-axis)
b. translation
c. rotation (180◦)
4. X ′(−1,0),Y ′(−6,3),Z′(−10,−6)
5. L′(−3,7),M′(1,10),N′(−1,3)
6. a. A′(4,1),B′(6,5),C′(1,8)
b. A′(1,−4),B′(5,−6),C′(8,−1)
c. A′(−1,−2),B′(−3,−6),C′(2,−9)
d. A′(4,1),B
′(6,5),C
′(1,8)→ A
7. a. A′(4,4),B
′(0,2),C
′(2,−3)
b. A′(−7,−1),B
′(−5,−5),C
′(0,−3) *same as going counterclockwise 90◦
163

9.2. Translations and Rotations www.ck12.org
Bobcat Review
1. (3×104)× (3×104) = 9×10⁸
2. 1021
1012 = 109
3. 2,500 Lake Ontario’s would be needed to fill the Atlantic Ocean region. 2×10¹⁶
8×10¹²
Bobcat Stretch
1. The rotated image vertices are X’(6, -4), Y’(3, -5), and Z’(4, -1).
2. The first translation rule: (x,y)⇒ (x+2,y+3). The second translation rule: (x,y)⇒ (x+3,y+1)
164
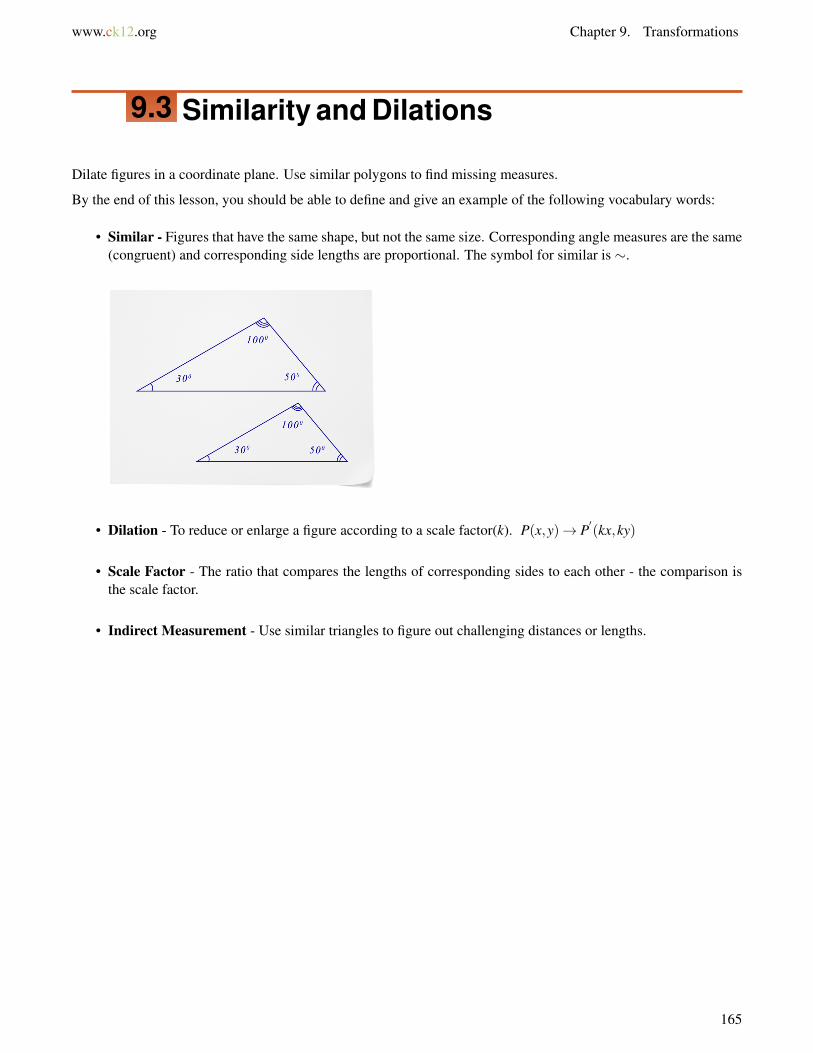
www.ck12.org Chapter 9. Transformations
9.3 Similarity and Dilations
Dilate figures in a coordinate plane. Use similar polygons to find missing measures.
By the end of this lesson, you should be able to define and give an example of the following vocabulary words:
• Similar - Figures that have the same shape, but not the same size. Corresponding angle measures are the same(congruent) and corresponding side lengths are proportional. The symbol for similar is ∼.
• Dilation - To reduce or enlarge a figure according to a scale factor(k). P(x,y)→ P′(kx,ky)
• Scale Factor - The ratio that compares the lengths of corresponding sides to each other - the comparison isthe scale factor.
• Indirect Measurement - Use similar triangles to figure out challenging distances or lengths.
165

9.3. Similarity and Dilations www.ck12.org
Given4ABC ∼4DEF and the following measures: a = 12, c = 3, d = 4, e = 3, and f = 1, find b.
Similar polygons have congruent corresponding angles and proportional corresponding sides. Set-up ratios for eachcorresponding side to solve for the missing side measure b. (Only two ratios are needed, but this shows each of theratios that can be used to solve for b.)
ad = b
e = cf
124 = b
3 = 31
Set-up a proportion with two of the ratios and solve for b.124 = b
3
Cross - multiply and solve the proportion.
4b4
=364
b = 9
The value of b is 9.
166

www.ck12.org Chapter 9. Transformations
Graph an enlargement of the following figure using a scale factor (k) of 3.
For enlargments, multiply both x and y coordinates for each vertex by the scale factor of (3) to produce newcoordinates.
(3×−2,3×−3)→ (−6,−9)
(3×−2,3×3)→ (−6,9)
(3×2,3×3)→ (6,9)
(3×2,3×−3)→ (6,−9)
Graph the enlarged coordinates on the coordinate plane.
167

9.3. Similarity and Dilations www.ck12.org
The coordinates of the enlarged figure, which is now three times the size of the original figure, are (-6, -9), (-6,9), (6, 9), and (6, -9).
Note: Enlargements have scale factors greater than 1. Reductions have scale factors greater than 0, but less than 1.For reductions, multiply both x and y coordinates for each vertex by the scale factor(k).
A girl is three feet tall and casts a shadow of 4 feet. She is standing 36 feet away from a lighthouse. What isthe height of the lighthouse?
Draw a picture to help visualize the problem.
Use the measures from the similar triangles to set-up ratios to find the height of the lighthouse.personshadow = 3 f t
4 f t
lighthouseshadow = x
40 f t (Note: 36 + 4 = 40 ft)
Since these triangles are similar, set-up a proportion with the two ratios.3 f t4 f t =
x40 f t
Cross - multiply and solve the proportion.
4x4
=1204
f t
x = 30 f t
The lighthouse is 30 feet tall.
168

www.ck12.org Chapter 9. Transformations
• The symbol for similar is ∼.• If the scale factor is greater than 1, the figure becomes larger(enlargement).• If the scale factor is greater than 0, but less than 1, the figure becomes smaller(reduction).
1. A dilation is ______________________ to the original figure.
2. Identify whether or not each pair of polygons is similar. Explain your reasoning.
a. Triangle A has side lengths of 8, 16, and 20. Triangle B has side lengths of 2, 4 and 5.
b. Triangle B has side lengths of 9, 15, and 21. Triangle C has side lengths of 3, 5 and 8.
c. Triangle C has side lengths of 4, 5, and 10. Triangle B has side lengths of 10, 12.5 and 25.
d.
e.
169

9.3. Similarity and Dilations www.ck12.org
3. Use the similar polygons to find the value of the variable.
a.
b.
4. Refer to the similar triangles below to find the missing measures.
a. Find AB.
b. Find RP.
c. Find 6 A.
d. Find 6 Q.
e. Find 6 C.
170

www.ck12.org Chapter 9. Transformations
5. Quadrilateral A′B′C′D′
is a dilation of quadrilateral ABCD. Find the scale factor. Classify the dilation as anenlargement or a reduction.
6. Graph the polygon with the given vertices, and then graph its image after dilation using the given scale factor.
a. Triangle ABC has vertices A (0, 2), B (4, 4), and C (-1, 4). It is dilated by a scale factor of 3.
b. Quadrilateral PQRS has vertices P (-2, 4), Q (4, 4), R (4, -2), and S(-4, -4). It is dilated by a scale factorof 1
2 .
c. Polygon ABCDE has vertices A (-1, 3), B (1, 1), C (-1, -1), D (-3, 0), E (-3, 3). It is dilated by a scale factorof 1.5.
d. Polygon WXYZ has vertices W (4, 0), X (3, -3), Y (-4, -2), and Z(4, 0). It is dilated by a scale factor of 14 .
7. A totem pole casts a shadow that is 45 feet long at the same time a 6’ 6" tall man casts a shadow that is 3 feetlong. What is the height of the totem pole?
171

9.3. Similarity and Dilations www.ck12.org
1. Solve 6(2k+5)−3k = 66
2. Based on the given drawing, complete the following tasks.
a. Draw and label the image of the figure after a reflection over the x-axis.
b. Draw and label the image of the figure after a reflection over the y-axis.
172
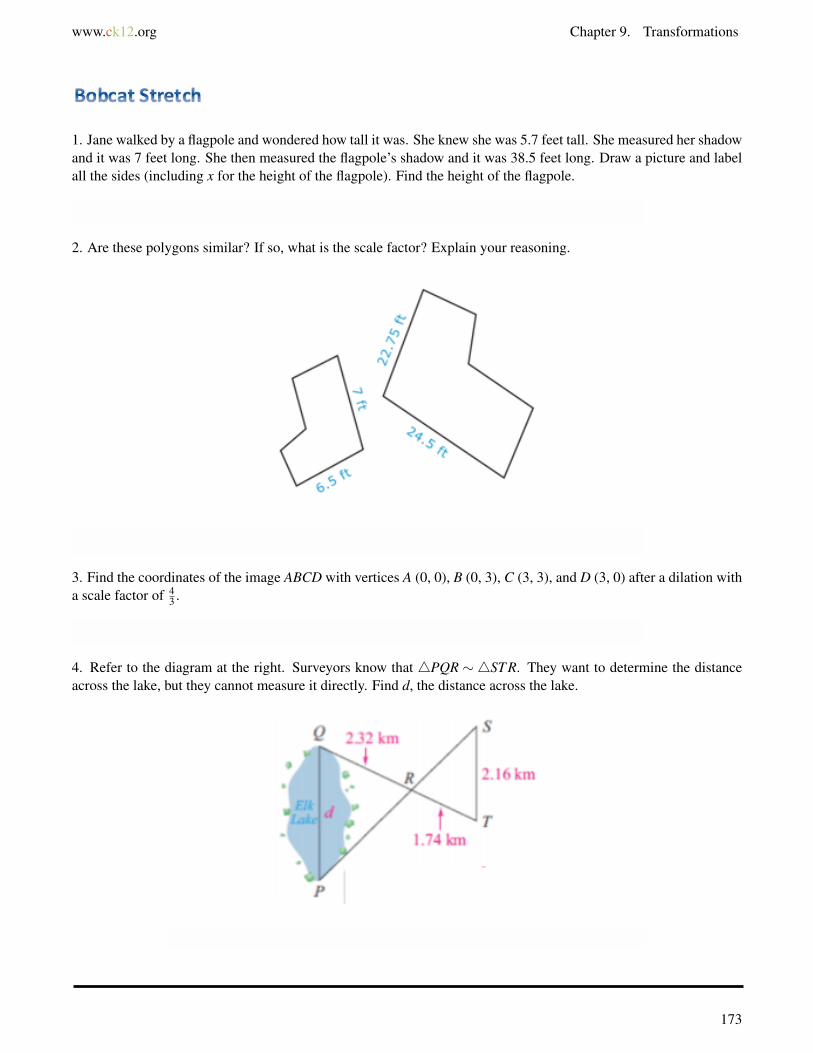
www.ck12.org Chapter 9. Transformations
1. Jane walked by a flagpole and wondered how tall it was. She knew she was 5.7 feet tall. She measured her shadowand it was 7 feet long. She then measured the flagpole’s shadow and it was 38.5 feet long. Draw a picture and labelall the sides (including x for the height of the flagpole). Find the height of the flagpole.
2. Are these polygons similar? If so, what is the scale factor? Explain your reasoning.
3. Find the coordinates of the image ABCD with vertices A (0, 0), B (0, 3), C (3, 3), and D (3, 0) after a dilation witha scale factor of 4
3 .
4. Refer to the diagram at the right. Surveyors know that 4PQR ∼ 4ST R. They want to determine the distanceacross the lake, but they cannot measure it directly. Find d, the distance across the lake.
173

9.3. Similarity and Dilations www.ck12.org
For more videos and practice problems,
• click here to go to Khan Academy.• search for "solving similar triangles 1" on Khan Academy (www.khanacademy.org ).• go to Khan Academy’s Common Core page standard 8.G.4 (www.khanacademy.org/commoncore/grade-8-G).
Watch this video to further review similarity.
MEDIAClick image to the left or use the URL below.URL: http://www.ck12.org/flx/render/embeddedobject/133473
1. Similar2. a. Yes, 8
2 = 164 = 20
5 = 41
b. No, 93 = 15
5 6=218
c. Yes, 1:2.5d. Yes, 1:6e. Yes, 1.6: 13. a. x = 2.8b. y = 81
4. a. 12 ft
b. 11.2 ft
c. 92◦
d. 53◦
e. 35◦ 5. The scale factor is 13 , which means the dilation is a reduction or 1/3 the size of the original figure.
6. a. Triangle A′B′C′has vertices A
′(0,6),B
′(12,12), and C
′(−3,12).
b. Quadrilateral P’Q’R’S’ has vertices P′(−1,2),Q
′(2,2),R
′(2,−1), and S
′(−2,−2).
c. Polygon A′B′C′D′E′has vertices A
′(−1.5,4.5),B
′(1.5,1.5),C
′(−1.5,−1.5),D
′(−4.5,0),E
′(−4.5,4.5).
d. Polygon W′X′Y′Z′has vertices W
′(1,0),X
′(3
4 ,−34),Y
′(−1,−1
2), and Z′(1,0). It is dilated by a scale factor of 1
4 .7. The totem pole is 97’ 6 " tall or 97.5 ft tall.
174

www.ck12.org Chapter 9. Transformations
Bobcat Review
1. k = 4
2. a. Image vertices: (0, -2), (1, -1), (1, 1), (0, 0), (-1, 1), and (-1, -1). Circle in "square" below x-axis between 0 and-1.
b. Image vertices virtually the same as the orginial, but swapped order. Circle in "square" to the the left ofthe y-axis between 0 and -1.
Bobcat Stretch
1. The flagpole is 31.35 ft tall.
2. Yes, 1: 3.5
3. A′(0,0),B
′(0,4),C
′(4,4),D
′(4,0)
4. The distance across the lake is 2.88 km.
175
9.4. Transformation Sequences www.ck12.org
9.4 Transformation Sequences
Describe sequences of transformations. Determine if figures exhibit congruency or similarity.
By the end of this lesson, you should be able to define and give an example of the following vocabulary word:
• Sequence of Transformations - To perform more than one transformation on a figure. The resulting image isfound through a combination of translation, rotation, reflection, and/or dilation moves.
176

www.ck12.org Chapter 9. Transformations
Reflect ∆ABC over the y-axis and then translate the image (x,y)⇒ (x+0,y−8). Is the image congruent or similarto the original figure?
First, reflect ∆ABC over the y-axis.
A(8,8)→ A′(−8,8)B(2,4)→ B′(−2,4)C(10,2)→C′(−10,2)
This red triangle labeled "reflection" shows this transformation.
Second, translate ∆ABC using the rule (x,y)⇒ (x+ 0,y− 8). This means to move the image down eight units orsubtract eight from each y-coordinate.
A′(−8,8)→ A′′(−8,0)B′(−2,4)→ B′′(−2,−4)C′(−10,2)→C′′(−10,−6)
After the sequence of transformations (reflection, and then translation), the vertices of 4A′′B′′C′′ are A” (-8,0), B” (-2, -4), and C” (-10, -6). The image is congruent with the original figure as all the corresponding sidesand corresponding angles are the same.
177

9.4. Transformation Sequences www.ck12.org
Parallelogram ABCD and parallelogram A"B"C"D" are plotted on the coordinate plane below. Describe asequence of transformations to determine how parallelogram ABCD matches to parallelogram A"B"C"D". Isthe image congruent or similar to the original figure?
Look at the image and note the differences between the parallelograms.
First, notice the notation on parallelogram A"B"C"D". The "tic" marks show that a sequence of two transformations(two "tic" marks) occurred to arrive at the final image.
Second, notice the vertices are flipped, so one of the transformations was either rotating the figure 180◦ or reflectingit.
Third, notice the image is smaller than the original figure, so one of the transformations was reducing the figure(dilation) by a certain scale factor.
Since the image is smaller, we know the scale factor is less than 1.
To figure the scale factor, compare the vertices between the original figure and the final image.
A(−2,−6)→ A′′(1,−3)
B(2,4)→ B′′(−1,−2)
C(2,−2)→C′′(−1,−1)
D(−2,0)→ D′′(1,0)
It easy to see that each coordinate is half of the first coordinate, so the scale factor is 12 . ( 1
2 = 36 , 1
2 = 24 , etc...)
Rotate parallelogram ABCD 180◦, and then reduce the image by a scale factor of 12 to arrive at parallelo-
gram A"B"C"D". The final image is similar to the original figure as the corresponding angles are the same,but the corresponding sides are proportional.
178

www.ck12.org Chapter 9. Transformations
• Figures are congruent if all the corresponding angles and corresponding sides are the same.
• Figures are similar if all the corresponding angles are the same, but all the corresponding sides are propor-tional.
• In many cases, a variety of transformation sequence can arrive at the same final image.
1. Square ABCD is reflected over the y-axis and then dilated using a scale factor or 14 . Which parts are congruent
and which are similar between square ABCD and square A"B"C"D"? Explain
2. Point X (-3, -2) is translated using the rule (x,y)→ (x+ 3,y+ 4), then reflected over the x-axis. What is thecoordinate of X"?
179

9.4. Transformation Sequences www.ck12.org
3. Describe the transformation shown in each graph. If a reflection, find the reflection line. If a translation, write thetranslation rule. If a rotation, find the degree of the rotation and direction. If a dilation, find the scale factor.a.
b.
180

9.4. Transformation Sequences www.ck12.org
4. Describe specifically a sequence of transformations (translations, reflections, rotations, and/or dilations) to moverectangle ABCD to rectangle A"B"C"D". Is the image congruent or similar to the original figure?
5. 4ABC and 4A′′B′′C′′ are plotted on the coordinate plane below. Describe a sequence of transformations(translations, reflections, rotations, and/or dilations) to determine how 4ABC matches to 4A′′B′′C′′. Is the imagecongruent or similar to the original figure?
182
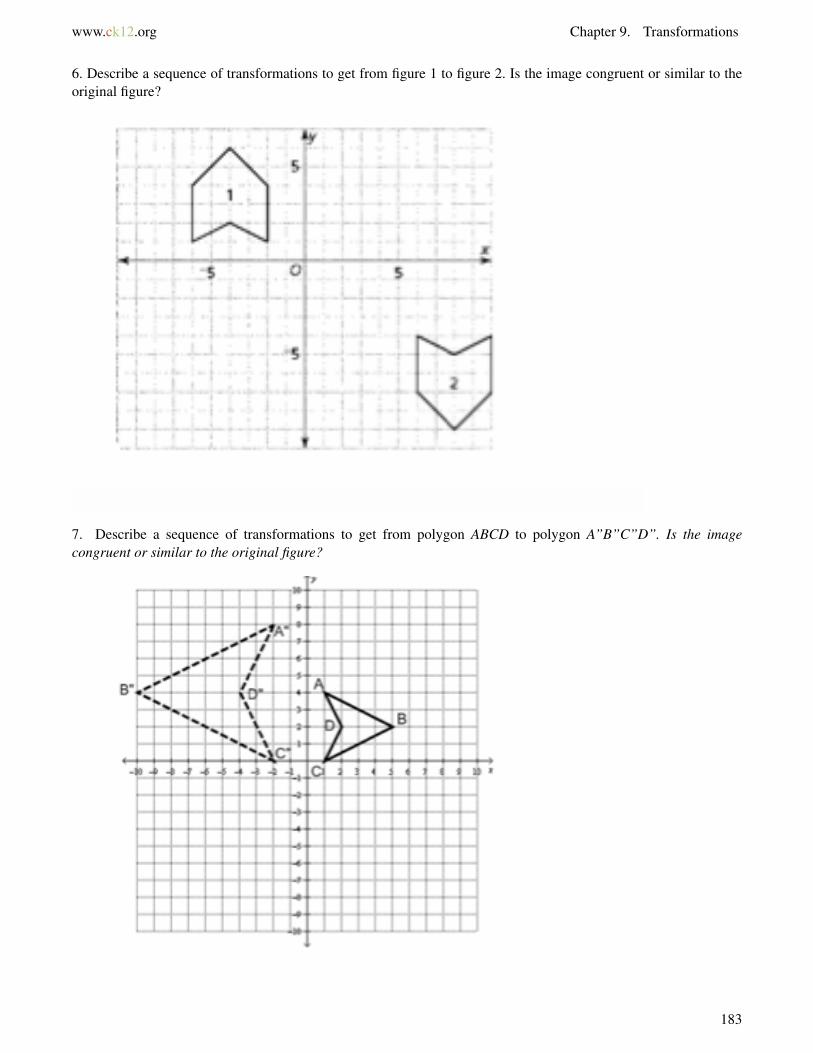
www.ck12.org Chapter 9. Transformations
6. Describe a sequence of transformations to get from figure 1 to figure 2. Is the image congruent or similar to theoriginal figure?
7. Describe a sequence of transformations to get from polygon ABCD to polygon A”B”C”D”. Is the imagecongruent or similar to the original figure?
183

9.4. Transformation Sequences www.ck12.org
8. Describe a sequence of two transformations (translations, reflections, rotations, and/or dilations) to move the solidpolygon to the dashed polygons position. Is the image congruent or similar to the original figure?
9. 4ABC and 4A′′′B′′′C′′′ are plotted on the coordinate plane below. Describe a sequence of transformations(translations, reflections, rotations, and/or dilations) to determine how 4ABC matches to 4A′′′B′′′C′′′. Is the imagecongruent or similar to the original figure? (Note: the vertices are A (2, -2), B (2, 3), C (-4, -2).)
184

www.ck12.org Chapter 9. Transformations
1. In the figure ABCD shown below, the total length of the sides equals 93 inches. Find the length of side AB.
2. Solve for p. 3(p+6) = 5p+4
3. Line l is parallel to Line m. Find the degree measure of both angles. (Hint: One angle is 6y and the other angle is90 - 9y - in case the numbers are difficult to read).
4. Find the missing angle measures (a, b, and c).
185

9.4. Transformation Sequences www.ck12.org
1. Reflect4ABC over y = 3 and y =−5. Write a single rule for4ABC to4A′′B′′C′′.
2. Describe specifically a sequence of transformations to move polygon with point E to the polygon image withpoint E”’. Is the image congruent, similar, or neither to the original figure?
186

www.ck12.org Chapter 9. Transformations
For more videos and practice problems,
• click here to go to Khan Academy to explore transformation sequences and similarity.• click here to go to Khan Academy to explore rigid transformations and congruence.• search for "exploring angle-preserving transformations and similarity" on Khan Academy (www.khanacad
emy.org ).• search for "exploring rigid transformations and congruence" on Khan Academy.• go to Khan Academy’s Common Core page standard 8.G.A.2 and 8.G.A.4 (www.khanacademy.org/commoncore/grade-
8-G).
Watch this video to further review testing similarity through transformations.
MEDIAClick image to the left or use the URL below.URL: http://www.ck12.org/flx/render/embeddedobject/133481
1. Corresponding angles are congruent (∼=) and the corresponding sides are similar (∼).
2. X” = (0, -2)
3. a. Reflection over the the x-axis.
b. Translation (x,y)→ (x+3,y−4)
c. Dilation - Enlarged figure by a scale factor of 4.
d. Rotation - 90◦ clockwise rotation.
4. Reflect rectangle ABCD across the y-axis. Translate A’B’C’D’ using rule (x,y)→ (x + 5,y+ 6) to arrive atimage A”B”C”D”.
5. Answer will vary. Translate4ABC using the rule (x,y)→ (x−4,y+2), then reflect over the x-axis. Or, reflect overthe x-axis and then translate (x,y)→ (x−4,y−2). Or, reflect over the line y = -1, then translate (x,y)→ (x−4,y),etc... The triangles are congruent as no dilation occurred, so the all the angles and sides are still the same in the finalimage.
6. Various answers. Reflect, then translate: Reflect the figure over the x-axis, then translate using (x,y)→ (x+12,y−3). The figures are congruent as no dilation occurred, so the all the angles and sides are still the same in thefinal image.
187

9.4. Transformation Sequences www.ck12.org
7. Various answers. Reflect, then dilate: Reflect over the y-axis and dilate using a scale factor of 2. Or, Dilate, thenreflect: Dilate using a scale factor of 2, then reflect over the y-axis. The figures are similar as all the angles are thesame, but the sides are proportional.
8. Various answers. Translate, then reflect: use the rule (x,y)→ (x+ 9,y+ 1), then reflect over the x-axis. (Note:you can also reflect, then translate.) The figures are congruent as no dilation occurred, so the all the angles and sidesare still the same in the final image.
9.4ABC is reflected over the x-axis, rotated 90◦ clockwise about the origin, and then translated (x,y)→ (x−2,y−3).The triangles are congruent as no dilation occurred, so the all the angles and sides are still the same in the final image.
Bobcat Review
1. x = 10, so AB = 25 inches
2. p = 7
3. y = 6, so the angles are 36 degrees.
4. a = 55◦, b = 40◦, and c = 85◦.
Bobcat Stretch
1. Remember order matters - therefore, reflect over y= 3 first, (red triangle) then reflect over y=−5 (green triangle).
In the graph, the two lines are 8 units apart (3− (−5) = 8). The figures are 16 units apart. The double reflection isthe same as a translation that is double the distance between the parallel lines.
(x,y)→ (x,y−16)
2. Rotate 90◦ clockwise, then translate the figure (x,y)→ (x− 0.5,y+ 0.3) to arrive at image with point E’. Next,translate translate the figure (x,y)→ (x+10,y+2.4) to arrive at image with point E”. Finally, reflect image over x =2 to arrive at image with point E”’, but wait! Point E”’ is not similar or congruent as the x-coordinate is the same,but the y-coordinate is different by 0.1. The image is neither similar or congruent to the original figure.
ˆ
188

www.ck12.org Chapter 9. Transformations
9.5 References
1. Pierce, Rod. "Geometry - Reflection" Math Is Fun. Ed. Rod Pierce. 3 Feb 2014. 13 Sep 20142. . Engage NY, Module 1, p 83 .3. . Engage NY, Module 2, p 116 .4. . Engage NY, Module 2, Lesson 7 .5. . Engage NY, Module 2, p 123 .6. . Engage NY, Module 2, Lesson 7 .7. . http://eclass1.wsd.k12.ca.us/moodle/mod/resource/view.php?id=494 .8. . http://eclass1.wsd.k12.ca.us/moodle/mod/resource/view.php?id=494 .9. . http://www.painesville-township.k12.oh.us/userfiles/913/Classes/11039/Geometry%201%20key.pdf .
10. . http://www.painesville-township.k12.oh.us/userfiles/913/Classes/11039/Geometry%201%20key.pdf .11. . http://www.painesville-township.k12.oh.us/userfiles/913/Classes/11039/Geometry%201%20key.pdf .12. . https://mrallens.wikispaces.com/Unit+3+-+Transformational+Geometry .13. . https://mrallens.wikispaces.com/file/view/U3%20-%205%20notes-hw%20answers.pdf/461751180/U3%20-
%205%20notes-hw%20answers.pdf .14. . CK-12 .
189

www.ck12.org
CHAPTER 10 Pythagorean TheoremChapter Outline
10.1 SIMPLEST RADICAL FORM
10.2 ESTIMATING SQUARE ROOTS
10.3 SOLVING EQUATIONS WITH SQUARE ROOTS
10.4 THE PYTHAGOREAN THEOREM
10.5 DISTANCE IN COORDINATE SYSTEM & PYTHAGOREAN TRIPLE
10.6 REFERENCES
190

www.ck12.org Chapter 10. Pythagorean Theorem
10.1 Simplest Radical Form
Estimate square roots by finding simplest radical form.
By the end of this lesson, you should be able to define and give an example of the following vocabulary words:
• Radical Expression - An expression that contains a radical sign (√).
–√
50,√
x+ y,√
3xy,√
5x , 3
√5, etc...
• Radicand- The number(s) and/or variable(s) under the radical sign.
– 50, x+y, 3xy, 5, etc...
Simplify√
50x2 .
To simplify the square root, separate the square root into its factors (still under the radical sign!).√
50×√
x2
Continue to separate each square root factor into smaller factors, looking for "perfect" squares to simplify.
Look for factors of 50 that are "perfect" squares: 4, 9, 16, 25... 25 is a factor of 50 and a "perfect square", sobreak the factors apart and simplify the perfect square factor.√
50 =√
25 ·2 =√
25 ·√
2 = 5√
2.
The square root of a square equals the radicand.√
x2 = x
So, 5√
2× x = 5x√
2.√
50x2 in simplest form is 5x√
2.
•√
ab =√
a ·b =√
a ·√
b Any two radicals can be multiplied together, where a≥ 0 and b≥ 0.
•(√
a)2
=√
a2= a The square and square root undo each other.
• An expression containing square roots is in simplest form when the radicand has no perfect square factorsother than 1.
191

10.1. Simplest Radical Form www.ck12.org
1. Simplify the following radicals
a.√
27
b.√
20
c.√
75
d.√
72
e.√
60
2. True or False - the following expression is shown in its simplest terms. If false, correct any errors to make thestatement true.√
40x2y3 =√
4×√
10×√
x2×√
y3 = 2x√
10y3
3. Simplify the following radicals.
a.√
18x2
b.√
48y3
c.√
150x2y2
d.√
160b2
e.√
92a2b2c2
4. Jose simplified√
450 as 15√
2. Is he correct? Explain why or why not.
5. Simplify the following radicals.
a. 4√
18
b. −3√
80
c. −2√
99x2y2
d. 5√
200a4b3c
e. 6√
121x2y7
192

www.ck12.org Chapter 10. Pythagorean Theorem
1. Solve for x.
a. x3 +9x = 12(18x+54)
b. x(x−3)−51 =−3x+13
c. x(x−1) = 121− x
2. A square has a side length of 3x and an area of 324 in2. What is the value of x?
1. Simplify the radical.
a.(
4√
5)2
b.√
24 ·√
27
c. 4√
3 ·√
21
d. 6√
605x8y3z5
e. −9√
2420x3y9z4
For more videos and practice problems,
• click here to go to Khan Academy.• search for "simplifying square roots" on Khan Academy (www.khanacademy.org ).
Watch this video to further review simplifying square roots.
MEDIAClick image to the left or use the URL below.URL: http://www.ck12.org/flx/render/embeddedobject/132497
193

10.1. Simplest Radical Form www.ck12.org
1. a. 3√
3
b. 2√
5
c. 5√
3
d. 6√
2
e. 2√
15
2. False, the expression can still be simplified to 2xy√
10y.
3. a. 3x√
2
b. 4y√
3y
c. 5xy√
6
d. 4b√
10
e. 2abc√
23
4. Yes, Jose is correct because the number 450 = 2× 32× 52. The factors that are perfect squares simplify to 15leaving just the factor of 2 that cannot be simplified.
5. a. 12√
2
b. −12√
5
c. −6xy√
11
d. 50a2b√
2bc
e. 66xy3√y
Bobcat Review
1. a. x = 3
b. x =±8
c. x =±11
2. x =±6; (3x)2 = 324
Bobcat Stretch
1. a. 80
b. 18√
2
c. 12√
7
d. 66x4yz2√
5yz
e. −198xy4z2√
5xy
194

www.ck12.org Chapter 10. Pythagorean Theorem
10.2 Estimating Square Roots
Estimate values of square roots. Find the simplest radical form.
By the end of this lesson, you should be able to define and give an example of the following vocabulary words:
• Radical - The symbol √ is called a radical sign. It is used to represent a positive square root. The symbol−√ represents the negative square root.
• Radical Expression - An expression that involves a radical sign.
• Perfect Square - Any number that has integer square roots.
• Radicand - The expression under a radical sign.
• Simplest Radical Form - The radicand has no perfect square factors other than 1.
Find√
9144
. Determine whether it is rational or irrational.
To simplify the square root, separate the square root into its dividend and divisor (still under the radical sign).√
9√144
Simplify each square root.√
9√144
= 312 = 1
4
The square root is 14 , which is a rational number because it is written as a fraction.
195
10.2. Estimating Square Roots www.ck12.org
Approximate√
30 to the nearest whole number and find the simplest radical form. Determine whether it isrational or irrational.
To approximate the square root to the nearest whole number, identify the nearest perfect squares.√
25 = 5√
36 = 6
Compare the square roots and use the one closest to the square root you are approximating.√
30 is closer to√
25 than√
36, so√
30 is closer to 5 than to 6.
Find the simplest radical form by separating the square root into "perfect square" factors, if possible.
In this case the factors of 30 are 3, 10, 5, and 6 - none of which are perfect squares.
So√
30 is in its simplest radical form.√
30 ≈ 5 - since the actual square root cannot be written as a fraction,√
30 is irrational and in its simplestform
• A rational number is any number that can be written as a fraction, including repeating decimals.
• An irrational number is any number that is not rational. When written as a decimal, these numbers are non-terminating and non-repeating.
196

www.ck12.org Chapter 10. Pythagorean Theorem
1. Find the square root. Determine whether it is rational or irrational.
a. −√
144
b.√
400
c.
√16964
2. Approximate the square root to the nearest whole number and find the simplest radical form. Determine whetherit is rational or irrational.
a.√
200
b.√
180
c.√
118
d. −√
72
e.√
24
f. −√
45
g.√
80
3. Evaluate√
a+ c when a = 2, b = 4, and c = 10. Approximate the square root to the nearest whole number andfind the simplest radical form. Determine whether it is rational or irrational.
4. Evaluate√
c2−b2 +1 when a = 2, b = 4, and c = 9. Approximate the square root to the nearest whole numberand find the simplest radical form. Determine whether it is rational or irrational.
5. Evaluate√
a2−b+ c when a = 2, b = 4, and c = 9. Approximate the square root to the nearest whole numberand find the simplest radical form. Determine whether it is rational or irrational.
197

10.2. Estimating Square Roots www.ck12.org
1. Place the following numbers on the number line below:√
16,√
9,√
11, 3.5.
2. Solve for x.
3. Evaluate3√
216.
1. Place the following list of numbers in their approximate locations on a number line:√
32,√
12,√
27,√
18,√
23,√
50.
2. Solve for x.
x2 = 49−1
3. Approximate√
504 to the nearest whole number and find the simplest radical form. Determine whether it isrational or irrational.
198
www.ck12.org Chapter 10. Pythagorean Theorem
For more videos and practice problems,
• click here to go to Khan Academy.• search for "estimating square roots" on Khan Academy (www.khanacademy.org ).• go to Khan Academy’s Common Core page standard 8.NS.A.2 (www.khanacademy.org/commoncore/grade-
8-NS).
Watch this video to further review approximating square roots.
MEDIAClick image to the left or use the URL below.URL: http://www.ck12.org/flx/render/embeddedobject/133507
1. a. -12, rational
b. 20, rational
c. 138 , rational
2. a. ≈ 14, 10√
2, irrational
b. ≈ 13, 6√
5, irrational
c. ≈ 11,√
118, irrational
d. ≈−8, −6√
2, irrational
e. ≈ 5, 2√
6, irrational
f. ≈−7, −3√
5, irrational
g. ≈ 9, 4√
5, irrational
3.√
12≈ 3, 2√
3, irrational
4.√
66≈ 8,√
66, irrational
5.√
9 = 3, rational
199

10.2. Estimating Square Roots www.ck12.org
Bobcat Review
1.
2. x =±7
3. 6
Bobcat Stretch
1.
2. x =±17
3. 22, 6√
14, irrational
200
www.ck12.org Chapter 10. Pythagorean Theorem
10.3 Solving equations with Square Roots
Solve equations containing square roots. Find solutions in simplest radical form and approximate square roots.
By the end of this lesson, you should be able to define and give an example of the following vocabulary word:
• Square Roots - A square root of a number n is a number m that, when multiplied by itself, equals n.
– m2 =√
n, so if m = 3, then n = 9.
Solve x2+10 = 0. Write the answer in simplest radical form and approximate the answer to the nearest tenth.
Use inverse operations to isolate the variable.
x2−10 = 0
+10 =+10
x2 = 10
Take the square root of both sides of the equation to further isolate the variable.
HHH√
x2 =√
10
x =±√
10
±√
10 is in simplest radical form because none of its factors are perfect squares (1, 2, 5, and 10).
Estimate ±√
10.
The perfect square below 10 is 9, and the perfect square above 10 is 16.
Therefore, 9 < 10 < 16, so√
10 is between√
9 and√
16 or 3 <√
10 < 4
Because 10 is closer to 9 than 16, the decimal is a low value:
±√
10≈±3.2
Check the approximation, 3.22 = 10.24. If you wanted to, you could keep repeating this process to approximate aneven closer square root.
The final answer is x =±√
10≈±3.2.
• For square root equations, the answer can be both a positive or a negative number.
201

10.3. Solving equations with Square Roots www.ck12.org
1. Solve for the variable. Write each answer in simplest radical form and approximate each answer to the nearesttenth.
a. b2−50 = 0
b. c2−20 = 0
c. x2 = 0
d. y2 = 81
2. You have a square piece of fabric for the front of a square pillow. The fabric has an area of 289 square inches.You use all the fabric. What is the length of the one side of the pillow?
a. Write an equation using the formula for the area of the square.
b. Use the definition of square root to solve the equation.
c. Evaluate the positive square root.
3. Solve for the variable. Write each answer in simplest radical form and approximate answer to the nearest tenth.
a. y2 +7 = 56
b. x2−31 = 36
c. 59+m2 = 253
d. p2 +0.06 = 1.27
4. You want to put a fence around a square plot of land that has an area of 6,250 square yards. What is the length ofa side, to the nearest tenth of a yard?
a. 19.8 yards
b. 79.1 yards
c. 3,125 yards
d. 625 yards
202

www.ck12.org Chapter 10. Pythagorean Theorem
1. Solve x3 = 27.
2. Solve m3 +10 = 135.
3. Solve 7+ y3 = 71.
1. x3 +9x = 12(18x+54)
2. x(x−3)−51 =−3x+13
3. A square has a side length of 3x and an area of 324 in2. What is the value of x?
For more videos and practice problems,
• click here to go to Khan Academy.• search for "simplifying square roots 2" on Khan Academy (www.khanacademy.org ).
Watch this video to further review square roots and real numbers.
MEDIAClick image to the left or use the URL below.URL: http://www.ck12.org/flx/render/embeddedobject/133535
203
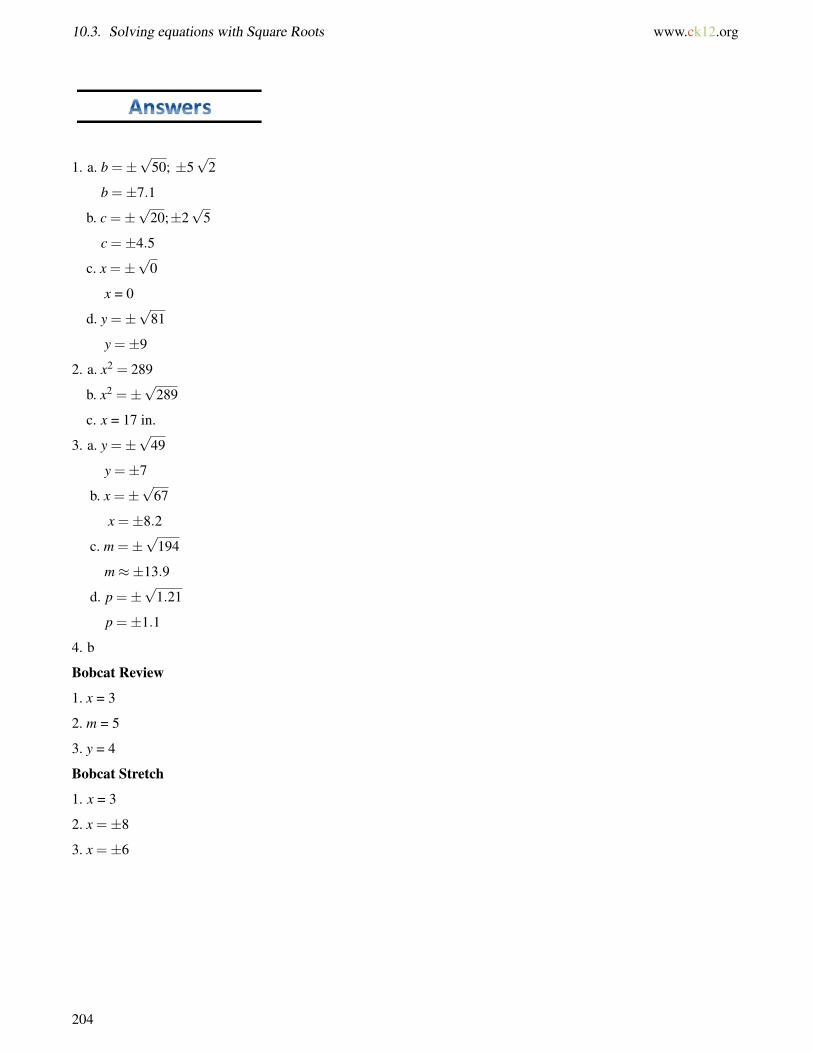
10.3. Solving equations with Square Roots www.ck12.org
1. a. b =±√
50; ±5√
2
b =±7.1
b. c =±√
20;±2√
5
c =±4.5
c. x =±√
0
x = 0
d. y =±√
81
y =±9
2. a. x2 = 289
b. x2 =±√
289
c. x = 17 in.
3. a. y =±√
49
y =±7
b. x =±√
67
x =±8.2
c. m =±√
194
m≈±13.9
d. p =±√
1.21
p =±1.1
4. b
Bobcat Review
1. x = 3
2. m = 5
3. y = 4
Bobcat Stretch
1. x = 3
2. x =±8
3. x =±6
204

www.ck12.org Chapter 10. Pythagorean Theorem
10.4 The Pythagorean Theorem
Prove and use the Pythagorean Theorem to find the side lengths of a right triangle in two and three dimensions.Use the converse of the Pythagorean Theory to prove a triangle is a right triangle.
By the end of this lesson, you should be able to define and give an example of the following vocabulary words:
• Hypotenuse - The side opposite the right angle in a right triangle is the hypotenuse. The other two sides arecalled legs.
• Pythagorean Theorem - For any right triangle: a2 +b2 = c2.
– * (leg)2× (leg)2 = (hypotenuse)2
• Converse of the Pythagorean Theorem - If a triangle with side lengths a, b, c, satisfies a2 + b2 = c2, thenthe triangle is a right triangle.
205

10.4. The Pythagorean Theorem www.ck12.org
If a = 9 mm, b = 12 mm, and c = 15 mm, prove the Pythagorean Theorem is true using4ABC.
Draw a picture of the given triangle.
Using the right triangle, create 3 right triangles -4ABC, 4CBD, and 4ACD.
206

www.ck12.org Chapter 10. Pythagorean Theorem
Here are each of the triangles shown individually.
the triangles and write similarity statements. Explain your reasoning.Compare
4ABC∼4CBD because each one has a right triangle, and they all share 6 B. So by the angle-angle criterion,these two triangles are similar.
4ABC ∼4ACD because each one has a right triangle, and they all share 6 A. So by the angle-angle criterion,these two triangles are similar.
4ACD∼4CBD because each are similar to4ABC (transitive property).
Since the triangles are similar, they have corresponding sides that are equal in ratio.
Prove the Pythagorean Theorem using the similar triangles’ measures.
4ABC ∼4CBD9
15 = |BD|9 , so 92 = 15(‖BD|)
4ABC ∼4ACD1215 = |AD|
12 , so 122 = 15(‖AD|)
Add these two equations together:
92 +122 = 15( |BD|)+15( |AD|)
92 +122 = 15( |BD|+ |AD|) (using the distributive property)
Given ( |BD|)+( |AD|) = ( |AC|) = 15, substitute this value in for the line segments.
So 92 +122 = 15(15) or 92 +122 = 152.
This proves the Pythagorean Theorem or a2 +b2 = c2 is true.
207

10.4. The Pythagorean Theorem www.ck12.org
Note: You can also use squares to prove the Pythagorean Theorem.
The sum of the areas of the smallest squares is 152 +202 = 625 cm2 .
The area of the largest square is 252 = 625 cm2 .
The sum of the areas of the squares off of the legs is equal to the area of the square off of the hypotenuses; therefore,a2 +b2 = c2.
208

www.ck12.org Chapter 10. Pythagorean Theorem
Find the length of the unknown side of the right triangle shown below. Provide an exact answer and anapproximate answer rounded to the tenths place.
Substitute the known measures into the Pythagorean Theorem and solve for b.
a2 +b2 = c2
22 +b2 = 82
4+b2 = 64
4−4+b2 = 64−4
b2 = 60√
b2 =√
60
b =√
60
Simplify√
60.
√60 =
√4×√
15√
60 = 2√
15
Approximate the value of 2√
15.
The nearest perfect squares are 49 (72) and 64 (82), so the approximated answer is closer to 8.
2√
15≈ 7.7
The unknown side length is 2√
15≈ 7.7 in.
209

10.4. The Pythagorean Theorem www.ck12.org
Is the triangle with leg lengths of 7 mm and 7 mm and a hypotenuse of length 10 mm a right triangle?
Substitute the given measures into the Pythogorean Theorem and solve.
a2 +b2 = c2
72 +72 = 102
49+49 = 100
98 6= 100
Since 98 does not equal 100, then this triangle is not a right triangle. The given lengths do not satisfy thePythagorean Theorem.
What would the hypotenuse need to be so that the triangle would be a right triangle?
Substitute the given lengths into the Pythogorean Theorem and solve for c.
a2 +b2 = c2
72 +72 = c2
49+49 = c2
98 = c2
√98 =
√c2
√98 = c
Simplify the square root.
√98 =
√49×
√2
√98 = 7
√2
The hypotenuse would need to be 7√
2 mm for the triangle with sides of 7 mm and 7 mm to be a right triangle.
• Pythagorean Theorem - For any right triangle: a2 +b2 = c2.
– (leg)2× (leg)2 = (hypotenuse)2
210

www.ck12.org Chapter 10. Pythagorean Theorem
1. If the legs of a right triangle are x and y, then the hypotenuse is _______________.
2. Find the length of the unknown side shown in each of the right triangle shown below. Provide an exact answer (insimplest form) and, if needed, an approximate answer rounded to the tenths place.
a.
b.
211
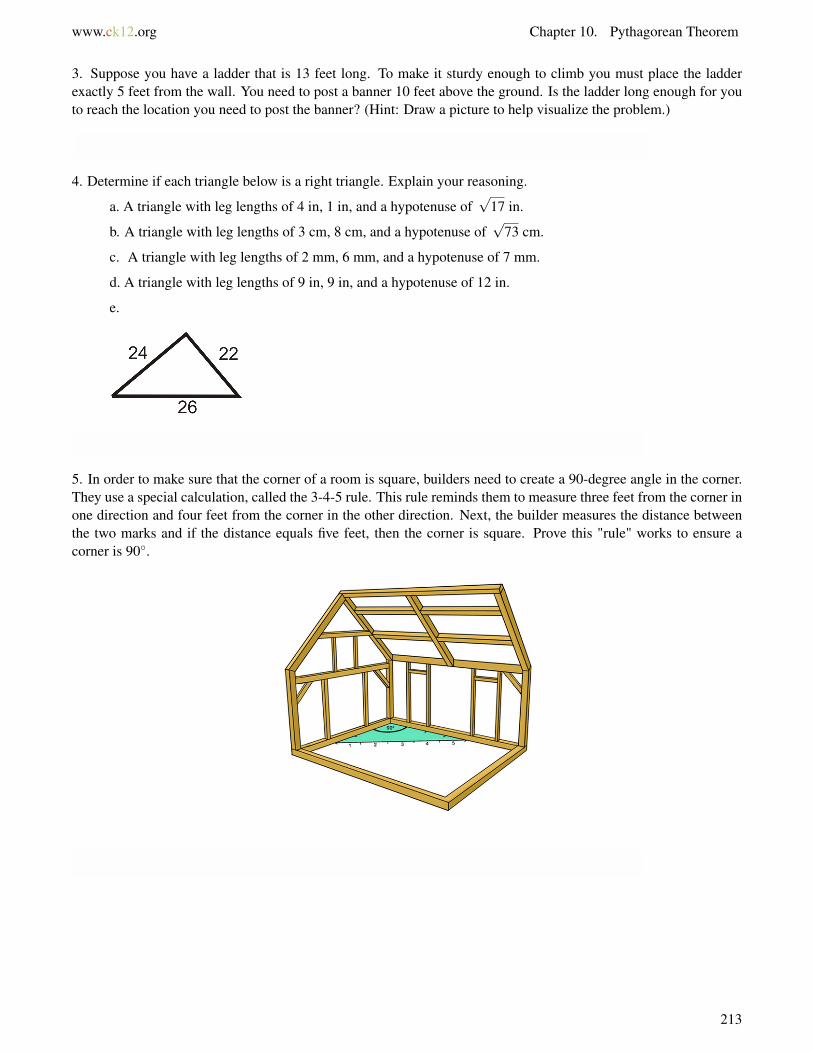
www.ck12.org Chapter 10. Pythagorean Theorem
3. Suppose you have a ladder that is 13 feet long. To make it sturdy enough to climb you must place the ladderexactly 5 feet from the wall. You need to post a banner 10 feet above the ground. Is the ladder long enough for youto reach the location you need to post the banner? (Hint: Draw a picture to help visualize the problem.)
4. Determine if each triangle below is a right triangle. Explain your reasoning.
a. A triangle with leg lengths of 4 in, 1 in, and a hypotenuse of√
17 in.
b. A triangle with leg lengths of 3 cm, 8 cm, and a hypotenuse of√
73 cm.
c. A triangle with leg lengths of 2 mm, 6 mm, and a hypotenuse of 7 mm.
d. A triangle with leg lengths of 9 in, 9 in, and a hypotenuse of 12 in.
e.
5. In order to make sure that the corner of a room is square, builders need to create a 90-degree angle in the corner.They use a special calculation, called the 3-4-5 rule. This rule reminds them to measure three feet from the corner inone direction and four feet from the corner in the other direction. Next, the builder measures the distance betweenthe two marks and if the distance equals five feet, then the corner is square. Prove this "rule" works to ensure acorner is 90◦.
213

10.4. The Pythagorean Theorem www.ck12.org
6. Given each of the following measures of a right triangle, find the exact unknown length. (Note: you do not needto approximate the answer.)
a. a = 1.5 in, b = 2 in, c = ?
b. a = 3.5 mm, b = ? mm, c =√
28.25
c. a = 2.1 cm, b = 3.6 cm, c = ?
d. a = ? , b = 2 ft, c = 2.5 ft
e. a =√
27 m, b = ?, c = 6 m
1. The point A = (7, 4) is dilated from the origin by a scale factor of 3. What are the coordinates of A’?
2. The triangle ABC, shown on the coordinate plane below, is dilated from the origin by a scale factor of 12 . What
is the new location of triangle A’B’C’? Name the coordinates for triangle A’B’C’.
214

www.ck12.org Chapter 10. Pythagorean Theorem
3. Find the scale factor of the dilation of quadrilateral PQRS.
1. Determine the value of x and check your answer.
215

10.4. The Pythagorean Theorem www.ck12.org
2. Reese claimed that any figure can be drawn off the side of a right triangle and that as long as they are similarfigures, then the sum of the areas off of the legs will equal the area off of the hypotenuse. She drew the diagrambelow by constructing rectangles. Is Reese’s claim correct for this example. In order to prove or disprove Reese’sclaim, you must first show that the rectangles are similar. If they are, then you can use computations to show thesum of the areas of the figures off of the sides a and b equal the area of the figure off of side c.
216

www.ck12.org Chapter 10. Pythagorean Theorem
3. Does this example prove the Pythagorean Theorem? Why or why not?
217

10.4. The Pythagorean Theorem www.ck12.org
For more videos and practice problems,
• click here to go to Khan Academy.• search for "Pythagorean theorem" on Khan Academy (www.khanacademy.org ).• go to Khan Academy’s Common Core page standard 8.G.B.6 and 8.G.B.7 (www.khanacademy.org/commoncore/grade-
8-G).
Watch this video to further review the Pythagorean Theorem.
MEDIAClick image to the left or use the URL below.URL: http://www.ck12.org/flx/render/embeddedobject/133587
1. x2 + y2
2. a. c = 5√
2≈ 7.1
b. c =√
29≈ 5.4
c. b = 12
d. b =√
105≈ 10.2
e. a = 2√
6≈ 4.9
3. Yes, the ladder allows us to reach 12 feet up the wall.
218

www.ck12.org Chapter 10. Pythagorean Theorem
4. a. Yes
b. Yes
c. No, 40 does not equal 49 (the sum of the squares of the sides does not equal the square of the hypotenuse.)
d. No, 162 does not equal 144 (the sum of the squares of the sides does not equal the square of the hypotenuse.)
e. No,
a2 +b2 = c2
222 +242 = 262
484+576 = 676
1060 6= 676
5. This rule works because it is applying the Pythagorean Theorem - 32+42 = 52. If the third measurement is greaterthan 5 feet, the angle has a measure of more than 90 degrees. If the measurement is less than five feet, the angle isless than 90◦. On a 90-degree angle produces a perfect corner - builders try to get as close to perfect as possible.
6. a.√
6.25 in2
b. 4 mm
c.√
17.37 cm2
d. 1.5 ft
e. b = 3 m
Bobcat Review
1. a. A’ = (21, 12)
2. A = (3, 4), so A’ = (1.5, 2), B = (-7, 2), so B’ = (-3.5, 1), C = (2, 1), so C’ = (1, 0.5)
3. The scale factor is 3.
Bobcat Stretch
1. x = 6 (Remember you can’t have negative numbers when measuring length.)
2. The rectangles are similar because their corresponding side lengths are equal in scale factor (1.6). So, 14.4+24.6 = 40 and 40 = 40. This means Reese’s claim is correct.
3. No, because the triangle used to prove the theorem is not a right triangle, so it can’t be used to prove the theoremis correct. The Pythagorean Theorem only applies to right triangles.
219

10.5. Distance in Coordinate System & Pythagorean Triple www.ck12.org
10.5 Distance in Coordinate System &Pythagorean Triple
Find distance between two points in the coordinate system. Determine whether the sides of right triangles are aPythagorean Triple.
By the end of this lesson, you should be able to define and give an example of the following vocabulary words:
• Triangle Inequality Theorem - To form any triangle, the sum of two sides must be greater than the third side.
• Pythagorean Triple - A set of three positive, nonzero whole numbers, a, b, and c such that a2+ b2 = c2.
220

www.ck12.org Chapter 10. Pythagorean Theorem
Find the distance between points (8, 2) and (2, 4).
Plot the points (8, 2) and (2, 4) on the coordinate plane and draw a line between the two points.
Draw vertical line through B and a horizontal line through A and mark the point of intersection of the two lines withpoint C. (Or, draw a vertical line through A and a horizontal line through B.)
See a triangle has been formed and AB is the hypotenuse of a right triangle.
Apply the Pythagorean Theorem, where a = BC = 2 (the distance between B and C) and b =CA = 6 (the distancebetween C and A). Solve for c, which is the hypotenuse AB of the right triangle .
221

10.5. Distance in Coordinate System & Pythagorean Triple www.ck12.org
a2 +b2 = c2
22 +62 = c2
4+36 = c2
40 = c2
√40 = c
6.3≈ c
The distance between points A and B is approximately 6.3 units.
222

www.ck12.org Chapter 10. Pythagorean Theorem
Find the missing side length. Tell if the side lengths form a Pythagorean triple. Explain.
Use the Pythagorean Theorem, where a = 8 and b = 15. Solve for c.
82 +152 = c2
64+225 = c2
289 = c2
√289 =
√c2
17 = c
The missing side length is 17. A right triangle with sides 8, 15, and 17 represents a Pythagorean triple becausea, b, and c are positive integers, such that a2 +b2 = c2.
• When finding unknown lengths, only consider the positive value of the square root because a negative lengthdoesn’t make sense. Think about it!
• Remember to form a triangle, the sum of two sides must be greater than the third side.
223

10.5. Distance in Coordinate System & Pythagorean Triple www.ck12.org
1. Tell whether a triangle can have sides with lengths 3, 4, and 8. Explain your reasoning.
2. Find the missing side length. Tell if the side lengths form a Pythagorean Triple. Explain.
3. Do the side lengths 2.7, 3.6, and 4.5 form a Pythagorean Triple? Explain why or why not.
4. Find the length of AB, BC, and AC. Give your answers in simplest radical form and to the nearest tenth.
224

www.ck12.org Chapter 10. Pythagorean Theorem
5. Find the length of LI, IP, and LP. Give your answers in simplest radical form and to the nearest tenth.
6. Using the Pythagorean Formula, find CD and EF: Then determine if CD = EF .
225

10.5. Distance in Coordinate System & Pythagorean Triple www.ck12.org
7. Use the Pythagorean Theorem to find the distance, to the nearest tenth, from T (4, -2) to U (-2, 3).
8. There are four fruit trees in the corner of a square backyard with 30-ft sides. What is the distance between theapple tree A and the plum tree P to the nearest tenth?
226

www.ck12.org Chapter 10. Pythagorean Theorem
1. The sum of four consecutive even integers is −28. Write an equation to represent the situation and find the fourconsecutive even integers.
2. A number is four times larger than the square of half the number. Write an equation to represent the situationonly. You do not need to solve.
3. Steven has some money. If he spends nine dollars, then he will have 35 of the amount he started with initially. Write
an equation to represent the situation and find the amount of money Steven had initially.
1. Is the triangle formed by points A, B, C a right triangle? Why or why not?
227

10.5. Distance in Coordinate System & Pythagorean Triple www.ck12.org
For more videos and practice problems,
• click here to go to Khan Academy.• search for "Distance formula" on Khan Academy (www.khanacademy.org ).• go to Khan Academy’s Common Core page standard 8.G.B.8 (www.khanacademy.org/commoncore/grade-8-
G).
Watch this video to further review finding the distance between two points on a coordinate plane.
MEDIAClick image to the left or use the URL below.URL: http://www.ck12.org/flx/render/embeddedobject/133927
1. No, because the Triangle Inequality Theorem states that to form any triangle, the sum of two sides must be greaterthan the third side. 3+4��ZZ>8 ( 7 is not greater than 8, so it can’t be a triangle).
2. The missing side length is 15. The side lengths form a Pythagorean Triple because they are nonzero wholenumbers that satisfy the equation a2+ b2 = c2.
3. No; although it is true (2.7)2 + (3.6)2 = (4.5)2, the numbers 2.7, 3.6, and 4.5 are not whole numbers.
4. AB = 7, BC =√
74≈ 8.6, AC = 5
5. LI = 6, IP = 5, LP =√
61≈ 7.8
6. CD =√
13, EF =√
13, CD∼= EF
7. 7.8 units
8. 42.4 ft
228

www.ck12.org Chapter 10. Pythagorean Theorem
Bobcat Review
1. -10, -8, -6, -4, let x represent the first integer to set-up the equation like this:
x+(x+2)+(x+4)+(x+6) =−28
4x+12 =−28
x =−10
2. Let x be the number. Then, x = 4( x2)
2.
3. $22.50, let x be the initial amount of Steven’s money - x−9 = 35 x
Bobcat Stretch
1. No, the points do not form a right triangle.
Form 3 triangles and then solve for the hypotenuse. Then plug lengths into the Pythagorean Theorem to see if theyequal. In this case,
(√
45)2 +(√
34)2 = (√
73)2
45+34 = 73
79 6= 73
229
10.6. References www.ck12.org
10.6 References
1. . Engage NY, Module 7, Lesson 2, p32 .2. . Engage NY, Module 7, Lesson 2 .3. . Engage NY, Module 7 .4. . Engage NY, Module 7, Lesson 2 .5. . Engage NY, Module 7, p 227 .6. . Engage NY, Module 7, Lesson 17 .7. . CK-12 .8. . Engage NY, Module 7, Lesson 17, p 240 .
230

www.ck12.org Chapter 11. Surface Area and Volume
CHAPTER 11 Surface Area and VolumeChapter Outline
11.1 THREE-DIMENSIONAL FIGURES
11.2 LINES AND SEGMENTS OF CIRCLES
11.3 SURFACE AREA OF PRISMS AND CYLINDERS
11.4 SURFACE AREAS OF PYRAMIDS AND CONES
11.5 VOLUME OF PRISMS AND CYLINDERS
11.6 VOLUME OF PYRAMIDS AND CONES
11.7 VOLUME OF SPHERES
11.8 REFERENCES
231

11.1. Three-Dimensional Figures www.ck12.org
11.1 Three-Dimensional Figures
Classify solid figures and identify and count faces, edges, and vertices. Sketch representations of solid figures asperspective of top, front, and side views.
By the end of this lesson, you should be able to define and give an example of the following vocabulary words:
• Solid- A three-dimensional figure with length, width, and height that encloses a part of space.
– Cylinder - A solid with two congruent circular bases that lie in parallel planes.
• – Cone - A solid with one circular base.
• – - A solid formed by all points in space that are the same distance from a fixed point called the cen-ter.Sphere
• Polyhedron- A solid that is enclosed by polygons.
– Prism - A polyhedron that has two congruent bases that lie in parallel planes. The other faces arerectangeles.
232

www.ck12.org Chapter 11. Surface Area and Volume
Note: Notice there are two common bases in each of the shapes - hexagons, pentagons, and triangles, so theseprisms are called (in order) a hexagonal prism, a pentagonal prism, and a triangle prism.
• – - A polyhedron that has one base. The other faces are triangles. The pyramid is identified by its base,so this is a rectangular pyramid and a pentagonal pyramid.Pyramid
• - The flat surfaces of a three-dimensional figure. Faces are in the form of plane shapes, such as triangles,rectangles, and pentagons.Face
• - The place where two line segments meet in a three-dimensional figure. Edges are straight; they cannot becurved.Edge
• - The point where edges meet in a three-dimensional figure. Vertex
233

11.1. Three-Dimensional Figures www.ck12.org
Classify the solid and tell whether it is a polyhedron. Then count the number of faces, edges, and vertices.
To classify the solid, identify the properties of the figure. This figure has...
• two common bases that are hexagons.• six sides that are rectangles• all planes of the figure are polygons.
There are two common bases that are hexagons and all the sides are rectangles, so this is a hexagonal prism.
Since all the faces are polygons, this solid is a polyhedron.
Next, count the number of faces, edges, and vertices.
Remember, each face is a flat plane shape. In this figure, the bases, or top and bottom, are hexagons and thesides are all rectangles. There are six faces around the sides and two bases. This figure has eight faces in all.
There are six edges around the top hexagon where it meets each side, and six more around the bottom hexagonwhere it meets each side. And there are six more where each side meets another. This figure has 18 edges (6+ 6 + 6).
Remember, a vertex is like a corner. This figure has six corners, or vertices, on the top and six on the bottom.It has twelve vertices in all.
234

www.ck12.org Chapter 11. Surface Area and Volume
Sketch a triangular prism.
To draw the triangular prism, begin by drawing its base. Since it is a triangular prism, the base is a triangle.
Next, draw the sides. Given that this is a prism, each side is a rectangle. The bottom edge of each rectangular sideconnects to one edge of the base, so draw each rectangular face attached to the base. Connecting them togetherforms the solid figure.
• Remember edges cannot be curved. For example, cylinders do not have any edges.
235

11.1. Three-Dimensional Figures www.ck12.org
1. Classify the solid (be as specific as possible) and tell whether it is a polyhedron.
a.
b.
c.
d.
e.
236
www.ck12.org Chapter 11. Surface Area and Volume
2. Sketch each figure listed in the table below, and then complete the table (count the number of faces, edges, andvertices in each solid figure).
TABLE 11.1:
Figure Name Number of Bases/Faces Number of Edges Number of Verticestriangular pyramidconecylindersphereoctagonal prismhexagonal pyramid
3. Identify each figure describe below.
a. A figure has one circular face, no edges, and one vertex. What kind of figure is it?
b. A figure has one pair of parallel bases that are circular. What kind of figure is it?
c. A figure has three triangular faces and one triangular base. What kind of figure is it?
d. A figure has no faces, edges, or vertices. What kind of figure is it?
e. A figure has six rectangular faces in addition to 2 bases. What kind of figure is it?
237

11.1. Three-Dimensional Figures www.ck12.org
4. Identify the solid from the given views.
a.
b.
Top View
Side View
238
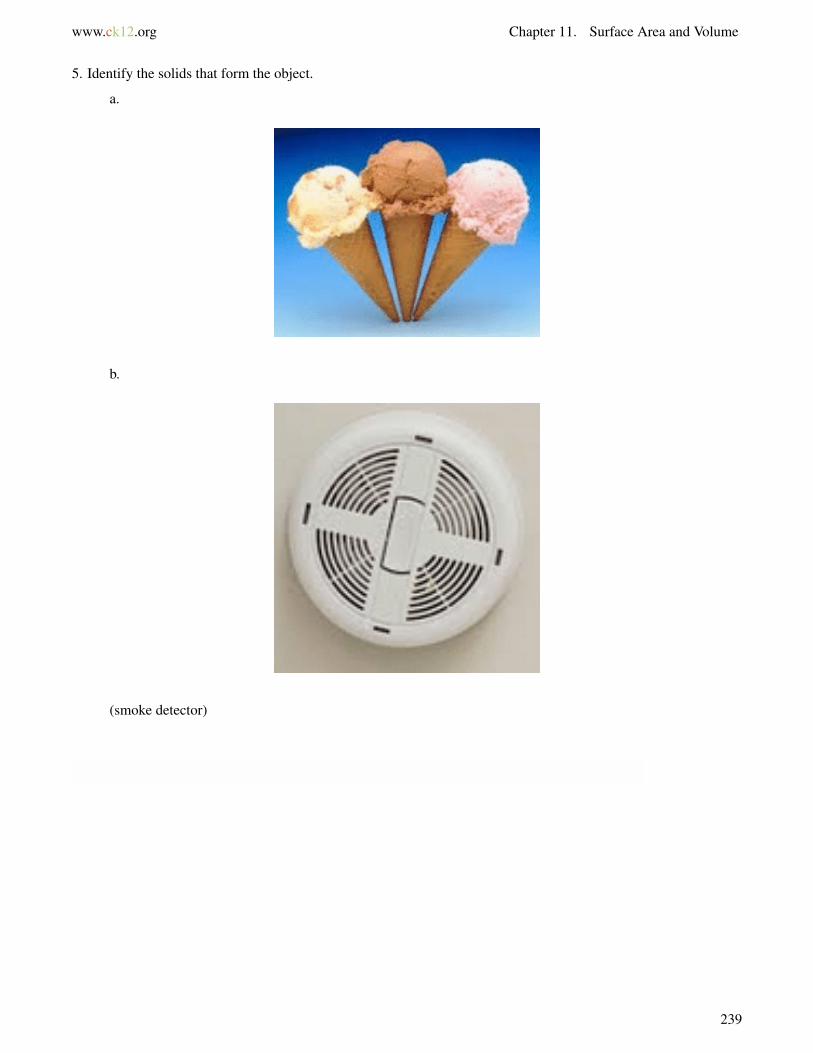
www.ck12.org Chapter 11. Surface Area and Volume
5. Identify the solids that form the object.
a.
b.
(smoke detector)
239

11.1. Three-Dimensional Figures www.ck12.org
1. Solve for x.
x−9 = 35 x
2. One angle is five less than three times the size of another angle. Together they have a sum of 143◦. What are thesizes of each angle?
3. Given a right triangle, find the size of the angles if one angle is ten more than four times the other angle and thethird angle is the right angle.
1. What is the minimum number of faces, edges, and vertices that a prism must have to be considered a prism?
2. Sketch a dodecagonal prism and count the number of faces, edges, and vertices.
3. Write three "rules" on how to find the number of faces, edges, and vertices of a prism without counting them(using algebra).
240
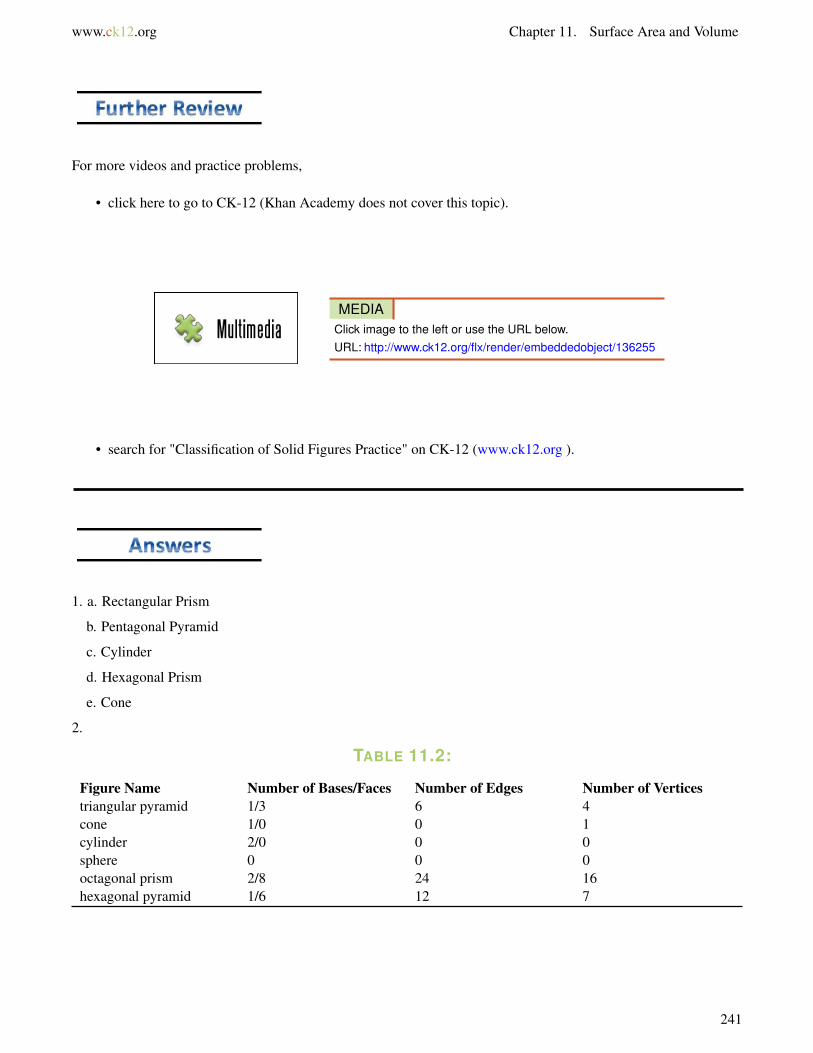
www.ck12.org Chapter 11. Surface Area and Volume
For more videos and practice problems,
• click here to go to CK-12 (Khan Academy does not cover this topic).
MEDIAClick image to the left or use the URL below.URL: http://www.ck12.org/flx/render/embeddedobject/136255
• search for "Classification of Solid Figures Practice" on CK-12 (www.ck12.org ).
1. a. Rectangular Prism
b. Pentagonal Pyramid
c. Cylinder
d. Hexagonal Prism
e. Cone
2.
TABLE 11.2:
Figure Name Number of Bases/Faces Number of Edges Number of Verticestriangular pyramid 1/3 6 4cone 1/0 0 1cylinder 2/0 0 0sphere 0 0 0octagonal prism 2/8 24 16hexagonal pyramid 1/6 12 7
241

11.1. Three-Dimensional Figures www.ck12.org
3. a. cone
b. cylinder
c. triangular pyramid
d. sphere
e. hexagonal prism
4. a. cylinder
b. pentagonal pyramid
5. a. cone and sphere
b. cylinder
Bobcat Review452 or 22.5 = x1.
2. The size of the first angle is 37 degrees. The second angle is 106 degrees. x+ 3x− 5 = 143, where x equals thesize of the smaller angle.
3. The measure of the first angle is 16 degrees; the measure of the second angle is 74 degrees; and the third angle is90 degrees. x+4x+10+90 = 180, where x equals the size of the first angle.
Bobcat Stretch
1. A prism must have a minimum of 5 faces, 9 edges, and 6 vertices to be considered a prism. Note: This representsa triangular prism.
2. It has 14 faces, 36 edges, and 24 vertices.
3. Faces = n + 2 (n = number of sides)
Edges = 3n
Vertices = 2n
242
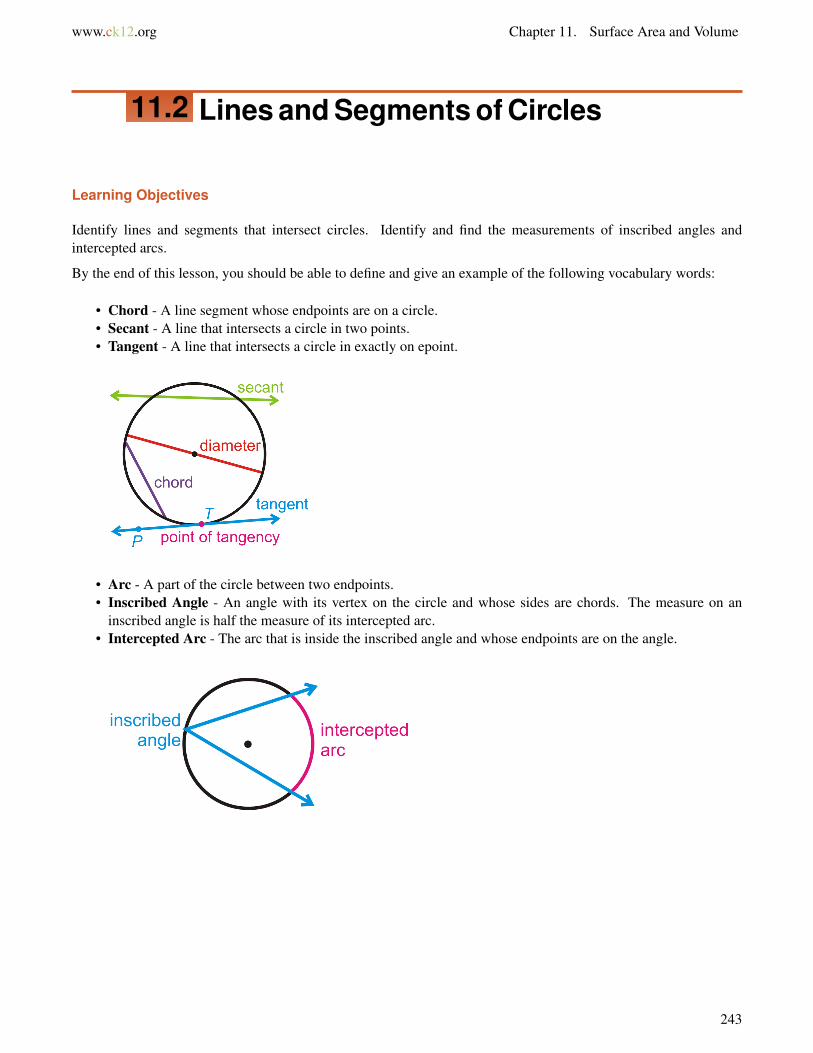
www.ck12.org Chapter 11. Surface Area and Volume
11.2 Lines and Segments of Circles
Learning Objectives
Identify lines and segments that intersect circles. Identify and find the measurements of inscribed angles andintercepted arcs.
By the end of this lesson, you should be able to define and give an example of the following vocabulary words:
• Chord - A line segment whose endpoints are on a circle.• Secant - A line that intersects a circle in two points.• Tangent - A line that intersects a circle in exactly on epoint.
• Arc - A part of the circle between two endpoints.• Inscribed Angle - An angle with its vertex on the circle and whose sides are chords. The measure on an
inscribed angle is half the measure of its intercepted arc.• Intercepted Arc - The arc that is inside the inscribed angle and whose endpoints are on the angle.
243

11.2. Lines and Segments of Circles www.ck12.org
Find the parts of⊙
A that best fit each description.
a. A radius
b. A chord
c. A tangent line
d. A diameter
e. A secant
f. A inscribed angle
g. An intercepted arc
To answer part a, remember the radius (r) is the distance from the center to any point on the circle. The radius is 1/2of the diameter. This means the radius can be identified as either HA or AF .
To answer part b, remember a chord is a segment that joins two points on a circle. There are several chords shownin this circle, so an example of a chord can be either CD, HF , or DG.
To answer part c, remember the tangent line is any line or ray that touches the circle in exactly one point. Theremeans the tangent line is←→BJ .
To answer part d, remember the diameter (d) is the distance across a circle through its center. This means thediameter is HF .
To answer part e, remember a secant is a line or ray that contains a chord. It must pass through a circle. This meansthe secant is←→BD.
To answer part f, remember an inscribed angle is an angle whose vertex is on a circle and whose sides contain chordsof the circle. This means the inscribed angle is 6 CDG .
To answer part g, remember an intercepted arc is the arc that lies inside of an inscribed angle and has endpoints onthe angle. This means the intercepted arc is GC .
244

www.ck12.org Chapter 11. Surface Area and Volume
Given the circle from Example 1, if CG has an angle of 170◦ , what is the measure of 6 GCD ?
Given an inscribed angle is half the measure of its intercepted arc, this means m6 PMN,mPN,m6 LNP is half themeasure of CG or 170◦ .
1702 = 85
This means the measure of 6 GCD is 85◦.
• Inscribed Angle Theorem: The measure of an inscribed angle is half the measure of its intercepted arc.
m6 ADC = 12 mAC
245
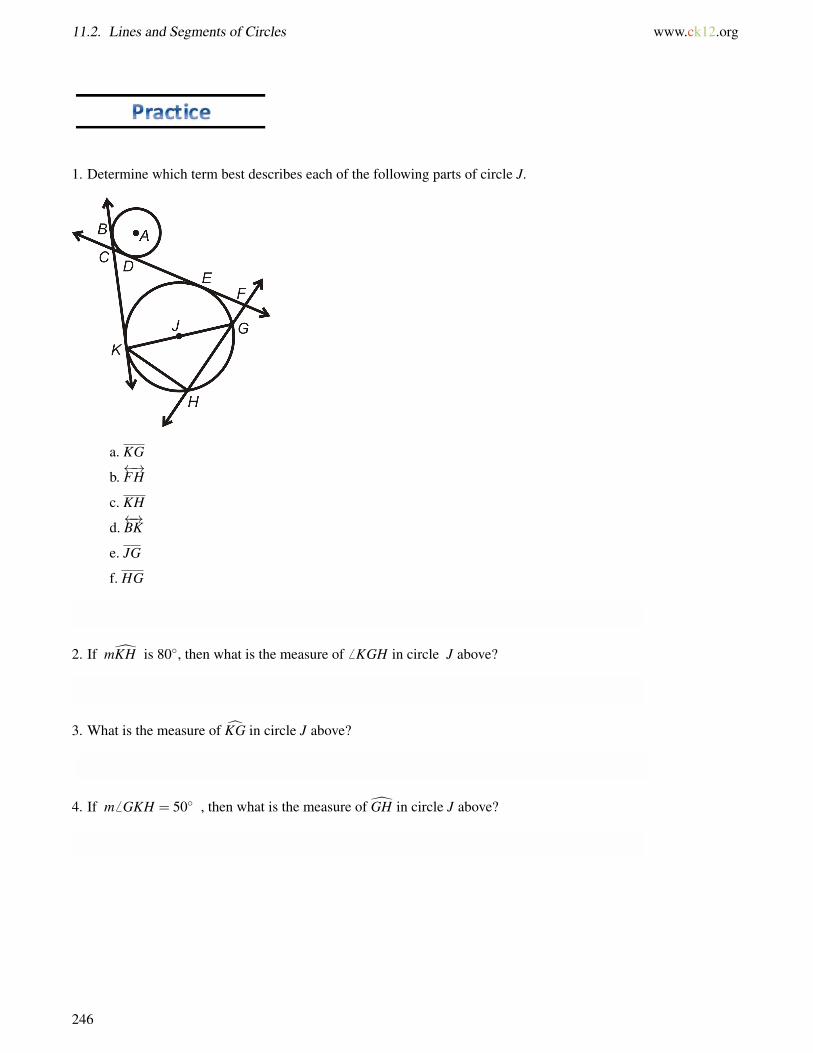
11.2. Lines and Segments of Circles www.ck12.org
1. Determine which term best describes each of the following parts of circle J.
a. KG
b.←→FH
c. KH
d.←→BK
e. JG
f. HG
2. If mKH is 80◦, then what is the measure of 6 KGH in circle J above?
3. What is the measure of KG in circle J above?
4. If m 6 GKH = 50◦ , then what is the measure of GH in circle J above?
246

www.ck12.org Chapter 11. Surface Area and Volume
5. Given circle O, answer the following questions.
a. Name a tangent of circle O.
b. Name a secant of circle O.
c. Name an arc of circle O.
d. Name an inscribed angle of circle O.
e. Name an intercepted arc of circle O.
1. Identify if the following expressions are linear or non-linear. Explain your reasoning.
a. 5x+3
b. 4x2−9
c. −8x+ 79 −33
d. ( x2)
3 +1
e. 0.31x+7−4.2x
f. 7+ x−4 +3x
2. Does x = -3 satisfy the following equation? Explain Your reasoning.
6x+5 = 5x+8+2x
247

11.2. Lines and Segments of Circles www.ck12.org
3. Chad solved the equation 24x+4+2x = 3(10x−1) and is claiming that x = 2 makes the equation true. Is Chadcorrect? Explain.
1. Find m6 PMN,mPN,mPM,m6 LNP , and mLN .
For more videos and practice problems go to CK-12 (Khan Academy doesn’t cover this topic),
• search for "Parts of Circle Practice" on CK-12 (www.ck12.org ).
MEDIAClick image to the left or use the URL below.URL: http://www.ck12.org/flx/render/embeddedobject/136308
248
www.ck12.org Chapter 11. Surface Area and Volume
1. a. diameter
b. secant
c. chord
d. tangent line
e. radius
f. chord
2. m6 KGH = 40◦
3. 180 degrees
4. 100 degrees
5. a. line AP
b. line AR
c. variable answers, arc QR, arc RA, arc AQ
d. angle QAR
e. arc QR
Bobcat Review
1. a. Linear - Linear expressions are sums of constants and products of constants and x raised to a power of 0 or 1.
b. Non-linear - Non-linear expressions are also sums of constants and products of constants and x raised to apower that is not 0 or 1. For example, x2.
c. Linear
d. Non-linear - x has a 3 exponent
e. Linear
f. Non-linear - x has a -4 exponent
2. x = -3 is a solution to the equation because -13=-13 (both sides equal).
3. No, Chad is not correct. x = 2 does not make the equation true. 56 6= 57(the sides do not equal).
Bobcat Stretch
1. m6 PMN = m6 PLN = 68◦ by the Congruent Inscribed Angle Theorem. Since they both share the chord PN, theirangles are the same.
mPN = 2 ·68◦ = 136◦ from the Inscribed Angle Theorem.
mPM = 180◦ since it is the diameter of the circle, so is half the circumference 360/2 = 180.
m6 LNP = 12 ·92◦ = 46◦ from the Inscribed Angle Theorem.
To find mLN, we need to find m6 LPN. 6 LPN is the third angle in4LPN, so 68◦+46◦+m6 LPN = 180◦. m6 LPN =66◦, which means that mLN = 2 ·66◦ = 132◦.
249

www.ck12.org Chapter 11. Surface Area and Volume
11.3 Surface Area of Prisms and Cylinders
Find the surface areas of prisms and cylinders.
By the end of this lesson, you should be able to define and give an example of the following vocabulary words:
• Net - A two-dimensional pattern that can be folded to make a model of a three-dimensional solid shape.
– Here is a net of a cube. Notice, when folded, this pattern forms a 3D cube.
• Surface Area - The total area of all of the surfaces of a solid shape.
– Surface Area of a Prism - The sum of twice the area of the base (B) and the product of the base’sperimeter (P) and the height.
* Rectangular Prism - SA = 2(lw+ lh+wh)* All Prisms - S = 2B+Ph
• – Surface Area of a Cylinder - The sum of twice the area of the base (B) and the product of the base’scircumference (C) and the height.
* SA = 2(πr2)+2πrh* S = 2B+Ch = 2πr2 +2πrh
251

11.3. Surface Area of Prisms and Cylinders www.ck12.org
Identify the solid shown by the net, and then find the surface area.
First, identify the solid shown by the net by identifying the properties of the net. Given the net shows two trianglesand three rectangles, it fits the definition of a triangular prism (triangle parallel bases and rectangle sides).
To find the surface area of the triangular prism, find the area of all the surfaces shown in the net.
The center (or bottom of the prism) is a rectangle. It has a length of 7 cm and a width of 3 cm.
A = lw
A = 7(3)
A = 21 sq. cm.
The left side is a rectangle. It has a length of 7 cm and a width of 4 cm.
A = lw
A = 7(4)
A = 28 sq. cm.
The right side is a rectangle. It has a length of 7 cm and a width of 5 cm.
A = lw
A = 7(5)
A = 35 sq. cm.
The bases are two triangles. They have a base of 3 cm and a height of 4 cm.
A =12
bh
A =12(3)(4)
A =12(12)
A = 6 sq. cm
252

www.ck12.org Chapter 11. Surface Area and Volume
There are two triangles, so multiply this base by two.
A = 2(6)
A = 12 sq. cm.
Now add up all of the areas.
SA = 12+35+28+21
SA = 96 sq. cm.
The net shows a triangular prism that has a surface area of 96 sq. cm.
Another way to solve is to use this formula, where B is the area of the base and P is the perimeter of the base. S =2B+Ph
Use the triangle area formula to find the area of the base. 12 bh = 1
2(3)(4) = 6 sq.cm.
Add all the base side lengths together to find the perimeter of the base. 3+4+5 = 12 cm
The height of the prism is 7 cm.
Substitute the given values into the formula.
S = 2B+Ph
S = 2(6)+(12)(7)
S = 12+84
S = 96 sq.cm
This confirms the answer, the surface area of this triangular prism is 96 sq. cm.
253

11.3. Surface Area of Prisms and Cylinders www.ck12.org
Find the surface area of this cylinder. Use 3.14 for π .
The formula for finding the surface area of a cylinder combines the formula for the area of the top and bottom circleswith the formula for finding the area of the rectangular ’wrap’ around the side. Remember that the wrap has a lengthequal to the circumference of the circular end, and a width equal to the height of the cylinder.
Substitute the given values into the formula. 4 centimeters is the radius of the circular bases. 8 centimeters is theheight of the cylinder.
SA = 2πr2 +2πrh
SA = 2(3.14)(42)+2(3.14)(4)(8)
SA = 2(3.14)(16)+2(3.14)(32)
SA = 2(50.24)+2(100.48)
SA = 100.48+200.96
SA = 301.44 cm2
The surface area of the cylinder is 301.44 cm2. Notice that this works well whether a net or a picture of a cylinderis given, as long as the radius and height of the cylinder are given.
254

www.ck12.org Chapter 11. Surface Area and Volume
• If you look at the net, the curved surface of the cylinder is rectangular in shape. The length of the rectangleis the same as the circumference of the circle. Since the length of the rectangle wraps around the circlerim, it is the same length as the circumference of the circle. In this example, the circumference is 18.84in. (2πr = 2(3.14)(3)) . 2πr = 2(3.14)(3)
255

11.3. Surface Area of Prisms and Cylinders www.ck12.org
1. What is the surface area of a rectangular prism with a length of 15 in, width of 5 in and a height of 8 inches?
2. Find the surface area of each prism, where B is the area of the base, P is the perimeter of the base, and h is theheight.
a. B = 6 m2, P = 10 m2, h = 6 m
b. B = 28 in2, P = 24 in2, h = 2 in
c. B = 110 ft2, P = 40 ft2, h = 3 ft
3. Sketch a cylinder with the given radius (r) and height (h), and then find its surface area. Use 3.14 for π .
a. r = 2 in, h = 12 in
b. r = 5 m, h = 10 m
c. r = 8 in, h = 12 in
4. Identify the solid shown by the net and find the surface area. Use 3.14 for π .
a.
FIGURE 11.1
b.
256
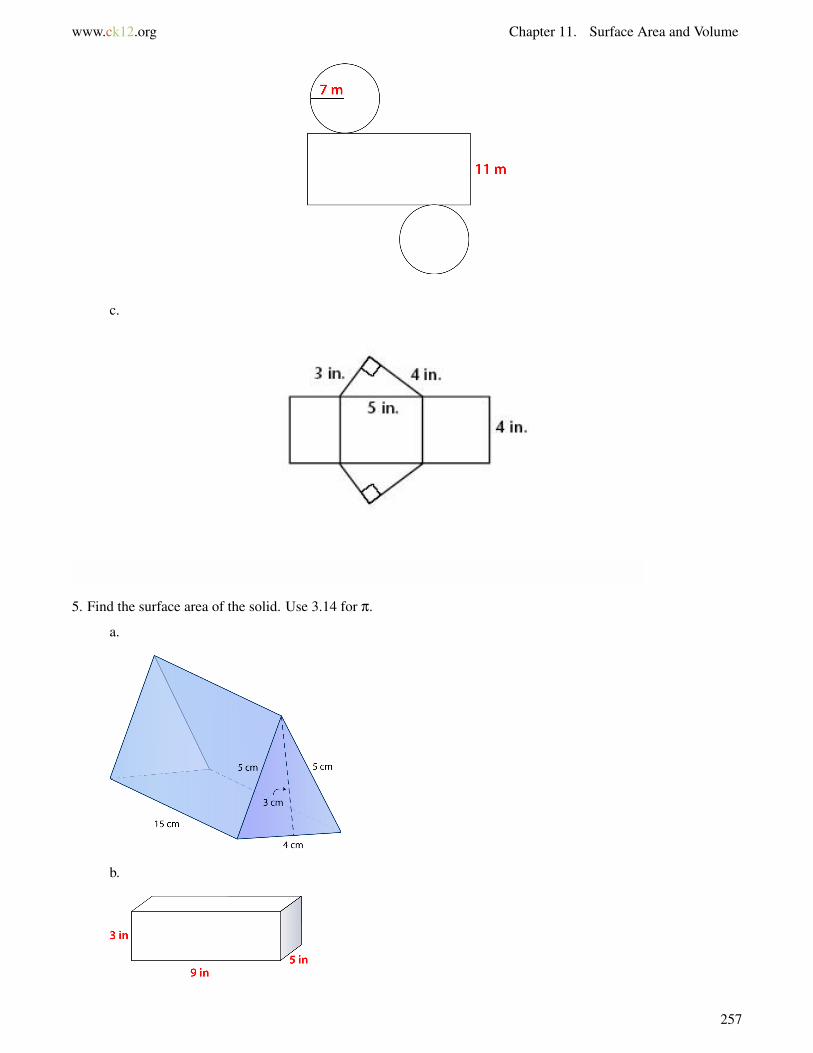
www.ck12.org Chapter 11. Surface Area and Volume
c.
5. Find the surface area of the solid. Use 3.14 for π.
a.
b.
257

11.3. Surface Area of Prisms and Cylinders www.ck12.org
c.
d.
e.
FIGURE 11.2
258
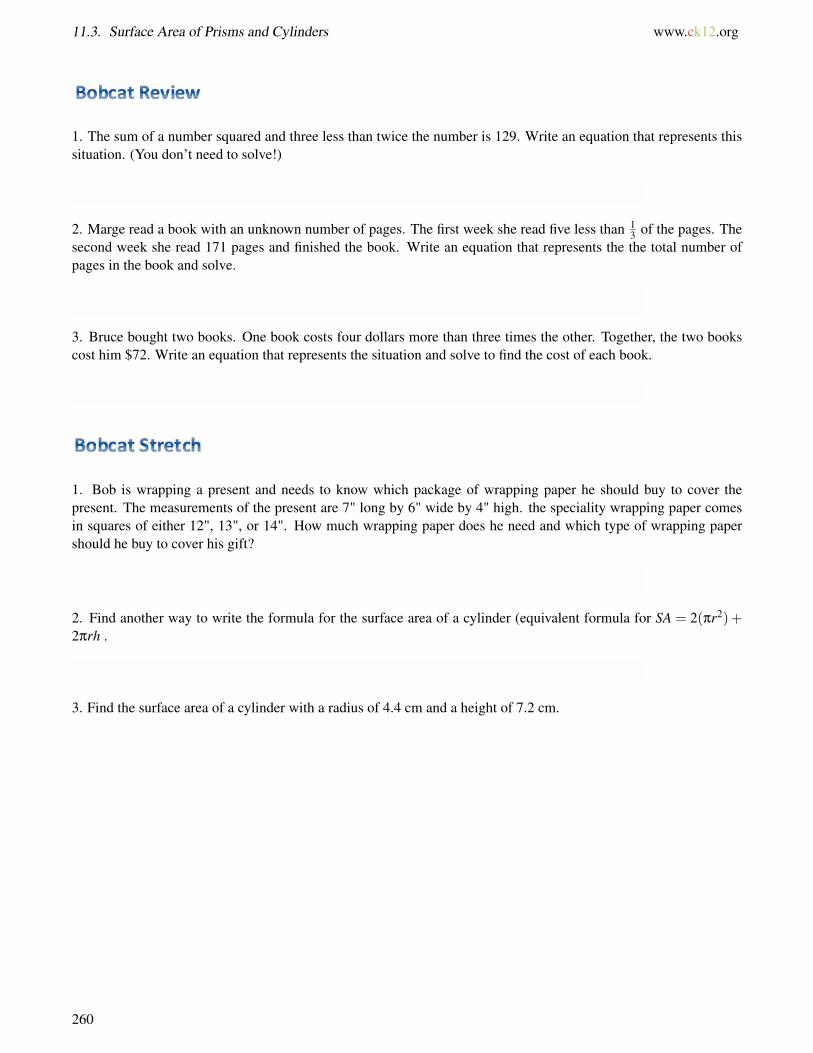
11.3. Surface Area of Prisms and Cylinders www.ck12.org
1. The sum of a number squared and three less than twice the number is 129. Write an equation that represents thissituation. (You don’t need to solve!)
2. Marge read a book with an unknown number of pages. The first week she read five less than 13 of the pages. The
second week she read 171 pages and finished the book. Write an equation that represents the the total number ofpages in the book and solve.
3. Bruce bought two books. One book costs four dollars more than three times the other. Together, the two bookscost him $72. Write an equation that represents the situation and solve to find the cost of each book.
1. Bob is wrapping a present and needs to know which package of wrapping paper he should buy to cover thepresent. The measurements of the present are 7" long by 6" wide by 4" high. the speciality wrapping paper comesin squares of either 12", 13", or 14". How much wrapping paper does he need and which type of wrapping papershould he buy to cover his gift?
2. Find another way to write the formula for the surface area of a cylinder (equivalent formula for SA = 2(πr2)+2πrh .
3. Find the surface area of a cylinder with a radius of 4.4 cm and a height of 7.2 cm.
260

www.ck12.org Chapter 11. Surface Area and Volume
For more videos and practice problems,
• click here to go to Khan Academy.• search for "Surface area using nets" on Khan Academy (www.khanacademy.org ).
Watch this video to further review surface area.
MEDIAClick image to the left or use the URL below.URL: http://www.ck12.org/flx/render/embeddedobject/130305
1. 470 sq. inches
2. a. 72 sq. meters
b. 104 sq. inches
c. 340 sq. feet
3. a. 175. 84 sq. in.
b. 471 sq. m
261
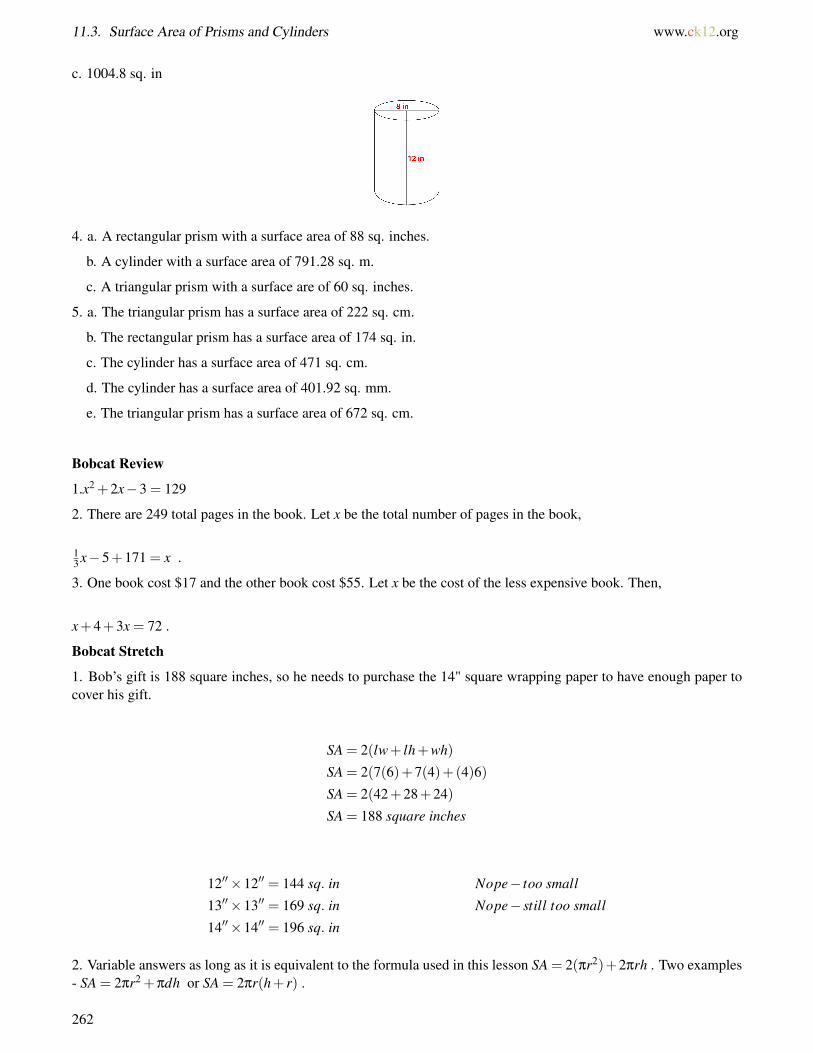
11.3. Surface Area of Prisms and Cylinders www.ck12.org
c. 1004.8 sq. in
4. a. A rectangular prism with a surface area of 88 sq. inches.
b. A cylinder with a surface area of 791.28 sq. m.
c. A triangular prism with a surface are of 60 sq. inches.
5. a. The triangular prism has a surface area of 222 sq. cm.
b. The rectangular prism has a surface area of 174 sq. in.
c. The cylinder has a surface area of 471 sq. cm.
d. The cylinder has a surface area of 401.92 sq. mm.
e. The triangular prism has a surface area of 672 sq. cm.
Bobcat Review
1.x2 +2x−3 = 129
2. There are 249 total pages in the book. Let x be the total number of pages in the book,
13 x−5+171 = x .
3. One book cost $17 and the other book cost $55. Let x be the cost of the less expensive book. Then,
x+4+3x = 72 .
Bobcat Stretch
1. Bob’s gift is 188 square inches, so he needs to purchase the 14" square wrapping paper to have enough paper tocover his gift.
SA = 2(lw+ lh+wh)
SA = 2(7(6)+7(4)+(4)6)
SA = 2(42+28+24)
SA = 188 square inches
12′′×12′′ = 144 sq. in Nope− too small
13′′×13′′ = 169 sq. in Nope− still too small
14′′×14′′ = 196 sq. in
2. Variable answers as long as it is equivalent to the formula used in this lesson SA = 2(πr2)+2πrh . Two examples- SA = 2πr2 +πdh or SA = 2πr(h+ r) .
262

11.4. Surface Areas of Pyramids and Cones www.ck12.org
11.4 Surface Areas of Pyramids and Cones
Find the surface areas of pyramids and cones.
By the end of this lesson, you should be able to define and give an example of the following vocabulary words:
• Surface Area of a Pyramid - Using the slant height (l), area of the base ( B), and perimeter of the base (P),the surface area of a pyramid is S = B+ 1
2 Pl.
• Slant Height - This is the height of a lateral face (l).
• Surface Area of a Cone - The surface area of a right cone with slant height l and base radius r is S = πr2+πrl.
264

www.ck12.org Chapter 11. Surface Area and Volume
Find the surface area of a square pyramid with a base side length of 8 in and slant height (l) of 9 in.
To find the surface area of a square (regular) pyramid, use the formula S = B+ 12 Pl.
First, find the values to substitute into the formula.
To find B, the area of the square base, multiply the two base side lengths together, which is 8×8 = 64 in.
To find P, the perimeter, multiply the square base side length by four (4 sides), which is 8×4 = 32 in.
The slant height (l), which is already given, is 9 in.
Substitute the values into the formula and solve.
S = B+12
Pl
S = 64+12(32)(9)
S = 64+144
S = 208 in2
The surface area of the square pyramid is 208 in2.
265
11.4. Surface Areas of Pyramids and Cones www.ck12.org
Find the surface area of a cone with a radius (r) of 3 in and slant height (l) of 9 in.
To find the surface area of a cone, use the formula S = πr2 +πrs.
Substitute the values into the formula and solve.
S = πr2 +πrs
S = π(32)+π(3)(9)
S = 9π+27π
S = 36πS = 113.04 in2
The surface area of the cone is 113.04 in2.
• Note: these formulas only work for regular pyramids and right circular cones.
– When a pyramid has a height that is directly in the center of the base, the pyramid is said to be regular.Because of the nature of regular pyramids, all slant heights are congruent.
– When a cone has a height that forms a right angle (90 degrees) to the base, the cone is said to be a rightcircular cone.
266

www.ck12.org Chapter 11. Surface Area and Volume
1. Find the surface area of each square pyramid with base side length (s) and slant height (l).
a. s = 6 m and l = 5 m
b. s = 9 yd and l = 7 yd
c. s = 8 ft and l = 12.5 ft
d. s = 12 cm and l = 13 cm
2. Find the surface area of each cone with radius (r) and slant height (l). Use 3.14 for π.
a. r = 4 in and l = 6 in
b. r = 5 m and l = 7 m
c. r = 3.5 ft and l = 5 ft
d. r = 21 yd and l = 4.8 yd
3. Find the surface area of the solid. Round to the nearest tenth.
a.
267

11.4. Surface Areas of Pyramids and Cones www.ck12.org
b.
Note: 6 inches represents the slant height.
c.
1. Identify each of the following numbers as rational or irrational. If the number is irrational, explain how youknow.
a.√
29
b. 3.52
c. 163
d.√
64
e.3√
125
f. π
268

www.ck12.org Chapter 11. Surface Area and Volume
2. Solve for x.
−5x−2 =−45
3. Solve for x.
3.2(x−5) = 36
1. Find the shown (exposed) surface area of the traffic cone with the given information. The cone is cut off at thetop (4 inch cone) and the base is a square with sides of length 24 inches. Round answer to the nearest hundredth.
2. Find the surface area of this pyramid.
269

11.4. Surface Areas of Pyramids and Cones www.ck12.org
3. Find the surface area of this cone.
For more practice problems reviewing surface area of solids,
• click here to go to Khan Academy.• search for "Surface area" on Khan Academy (www.khanacademy.org ).
1. a. 96 cm2
b. 207 yd2
c. 264 ft2
d. 456 cm2
2. a. 125.6 sq. in.
b. 93.42 sq. ft.
c. 188.4 sq. m
d. 1701.252 sq. yd.
3. a. 112 sq. in.
b. 21.98 sq. in.
c. 357.96 sq. ft
270

www.ck12.org Chapter 11. Surface Area and Volume
Bobcat Review
1. a. Irrational because 29 is not a perfect square and the square root of 29 has an infinite decimal expansion (doesn’tterminate) that does not repeat.
b. Rational
c. Rational
d. Rational
e. Rational
f. Irrational because pi has an infinite decimal expansion that does not repeat.
2. x = 8.6
3. x = 16.25
Bobcat Stretch
a. 1326.46 sq. in
Hint: Find the surface area of the entire square, and then subtract the area of the base of the cone. This is 321.66 sq.in.
Find the lateral area of the cone portion (include the 4 inch cut off top of the cone). This is 1017.35 sq. in..
Subtract the cut-off top of the cone, to only have the lateral area of the cone portion of the traffic cone. 1017.35 -12.56 = 1004.8 sq. in.
Now add the cone surface area to the base surface area - 321.66 + 1004.8 = 1326.46 sq. in.
2. 699.52 sq. cm.
3. 262.19 sq. in.
271

11.5. Volume of Prisms and Cylinders www.ck12.org
11.5 Volume of Prisms and Cylinders
Find the volume of prisms and cylinders.
By the end of this lesson, you should be able to define and give an example of the following vocabulary words:
• Volume - The amount of space inside a solid figure.• Volume (V) of a prism - The product of the area of the base (B) and the height (h).
– V = Bh– V = lwh (rectangular prism)– V = 1
2(lwh) (triangular prism)
• Volume (V) of a cylinder - The product of the area of the base (B) and the height (h).
– V = Bh
– V = πr2h
272

www.ck12.org Chapter 11. Surface Area and Volume
Find the volume of a triangular prism with the following dimensions.
• length = 15 cm• width = 2 cm• height = 6 cm
To find the volume of a triangular prism, multiply the area of the base (B) with the height of the prism.
To find the area of a triangular base (B), use the formula for area of a triangle.
A =12
bh
A =12(15×6)
A =12(90)
A = 45 sq. units
Substitute the known values into the formula to find the volume of the triangular prism.
V = Bh
V = (45)h
V = 45(2)
V = 90 cubic centimeters or cm3
The volume of the prism is 90 cm3.
Note: Here’s another way to answer the question.
V =12(l ·w ·h)
V =12(15 ·2 ·6)
V =12(180)
V = 90
This confirms the answer is correct.
273

11.5. Volume of Prisms and Cylinders www.ck12.org
Find the volume of this cylinder.
The radius of the circular base is 2 inches. The height of the cylinder is 7 inches. Take the given measures andsubstitute them into the formula, and then solve for the volume of the cylinder.
V = πr2h
V = (3.14)(22)(7)
V = (3.14)(4)(7)
V = (3.14)(28)
V = 87.92 in3
The volume of the cylinder is 87.92 in3.
• Remember that volume is always measured in cubic units, so the exponent on the measurement unit is always3 (cm3, m3, in3, etc...).
274

www.ck12.org Chapter 11. Surface Area and Volume
1. Find the volume of the each rectangular prism with the given length l, width w, and height h.
a. l = 5 m, w = 8 m, h = 9 m
b. l = 10 in, w = 14 in, h = 15 in
c. l = 16 yd, w = 10.2 yd, h = 4.3 yd
2. Find the volume of the each cylinder with the given radius r and height h.
a. r = 6 in and h = 12 in
b. r = 2 cm and h = 13 cm
c. r = 1.9 m and h = 8.7 m
3. A water tank (cylinder) has a radius of 50 feet and a height of 400 feet. How many cubic feet of water will thetank hold when it is full?
4. Find the volume of the solids. Round your answer to the nearest hundredth.
a.
b.
275

www.ck12.org Chapter 11. Surface Area and Volume
f.
1. Determine the length of the legs in the right triangle below. (Hint: Use the Pythagorean Theorem.)
2. Find the decimal expansion of the following rational numbers.
a. 5420
b. 78
c. 89
3. Find the fraction that is equal to 0.81.
277

11.5. Volume of Prisms and Cylinders www.ck12.org
1. A layered cake is being made to celebrate the end of the school year. What is the total volume of the cake shownbelow? Use 3.14 for π.
2. What is the volume of the rectangle prism with a cylinderical hole shown below? Use 3.14 for π. Round theanswer to the tenth place.
278

www.ck12.org Chapter 11. Surface Area and Volume
For more videos and practice problems,
• click here to go to CK-12’s braingenie.• search for "Volume of Cylinder" on CK-12’s braingenie (www.braingenie.ck12.org ).• go to Khan Academy’s Common Core page standard 8.G.C.9 (www.khanacademy.org/commoncore/grade-8-
G).
Watch this video to further review cylinder volume and surface area.
MEDIAClick image to the left or use the URL below.URL: http://www.ck12.org/flx/render/embeddedobject/130388
1. a. 360 m3
b. 2100 in3
c. 701.76 yd3
2. a. 1356.48 in3
b. 163.28 cm3
c. 98.62 m3
3. 3,140,000 ft3
4. a. 48 in3
b. 150.72 mm3 (did you remember to use the radius 2 - not the diameter 4?)
c. 5176.5 m3
d. 17.28 cm3
e. 244.37 in3
f. 86.8 mm3
279
11.5. Volume of Prisms and Cylinders www.ck12.org
Bobcat Review
1. x = 14 cm (x2 + x2 = (14√
2)2)
2. a. 2.7
b. 0.875
c. 0.8
3. 0.81 = 911
Bobcat Stretch
1. 1055.04 in3
2. 988.4 in3
280
www.ck12.org Chapter 11. Surface Area and Volume
11.6 Volume of Pyramids and Cones
a picture
Find the volume of pyramids and cones.
By the end of this lesson, you should be able to define and give an example of the following vocabulary words:
• Volume (V) of a pyramid - One-third the product of the area of the base (B) and the height (h).
– V = 13 Bh
• Volume (V) of a cone - One-third the product of the area of the base (B) and the height (h).
– V = 13 Bh
– V = 13 πr2h
281

11.6. Volume of Pyramids and Cones www.ck12.org
What is the volume of the pyramid below?
First, decide what shape the base of the pyramid is. There are two pairs of parallel sides that meet at right angles, soit must be a rectangle. Use the area formula for rectangles to find B, the base area.
B = lw
B = 11(6.3)
B = 69.3 cm2
The area of this pyramid’s base is 69.3 square centimeters. Now multiply this by the height and 13 , according to the
formula.
V =13
Bh
V =13(69.3)(15)
V = 23.1(15)
V = 346.5 cm3
The volume of this pyramid is 346.5 cm3.
282

www.ck12.org Chapter 11. Surface Area and Volume
What is the volume of the cone below?
First, find the base area. The base is a circle, so use the area formula for circles.
B = πr2
B = π(3.52)
B = 12.25π
B = 38.47 cm2
The circular base has an area of 38.47 square centimeters. Now put this measurement into the formula for volume.
V =13
Bh
V =13(38.47)(22)
V = 12.82(22)
V = 282.04 cm3
The volume of this cone is 282.04 cm3.
283

11.6. Volume of Pyramids and Cones www.ck12.org
• The square pyramid and cube have bases with the same area, as do the cone and the cylinder. A squarepyramid has exactly one-third the volume of a cube. A cone has exactly one-third the volume of a cylinder.
284

www.ck12.org Chapter 11. Surface Area and Volume
1. Write the volume formula for each solid below. Draw an example of each solid.
a. Prism
b. Cylinder
c. Pyramid
d. Cone
2. Find the volume of the rectangular pyramid given the area of the length (l), width (w), height (h). Round answersto the nearest hundredth.
a. l = 9m, w = 3m, and h = 10m
b. l = 5in, w = 6in, and h = 7in
c. l = 5.5ft, w = 6.2ft, and h = 4ft
3. Find the volume of the cone given the radius (r) and height (h). Round answers to the nearest hundredth. Use3.14 for π.
a. r = 5 cm and h = 12 cm
b. r = 8 in and h = 6 in
c. r = 2 ft and h = 4.2 ft
4. Find the volume of the solid. Round answers to the nearest hundredth. Use 3.14 for π.
a.
285

11.6. Volume of Pyramids and Cones www.ck12.org
b.
c.
d. Note: this is a square pyramid.
286

www.ck12.org Chapter 11. Surface Area and Volume
5. A triangular pyramid has a volume of 266 cubic feet and a base area of 42 square feet. What is its height?
6. What is the height of a cone whose radius is 1.6 meters and volume is 20.1 cubic meters?
1. Place the following numbers on the number line below:√
16,√
9,√
11, 3.5
2. Solve for x.
x2 = 25−1
3. Solve for x.
x3 = 64
1. Brianna bought the candle below for her friend’s birthday. The package says that the candle burns one hour forevery 20 cubic centimeters of wax. How many hours will it take for the entire candle to burn?
287

11.6. Volume of Pyramids and Cones www.ck12.org
2. Andrew bought a new pencil like the one shown below on the left. He used the pencil every day in his math classfor a week, and now his pencil looks like the one shown below on the right. How much of the pencil, in terms ofvolume, did he use? Use 3.14 for π. Round answer to the nearest hundredth.
3. Find the volume of the prism with the pyramid portion removed.
288

www.ck12.org Chapter 11. Surface Area and Volume
For more videos and practice problems,
• click here to go to CK-12’s braingenie.• search for "Volume of Cone" on CK-12’s braingenie (https://braingenie.ck12.org/skills/102884 ).• go to Khan Academy’s Common Core page standard 8.G.C.9 (www.khanacademy.org/commoncore/grade-8-
G).
Watch this video to further review volume of a cone.
MEDIAClick image to the left or use the URL below.URL: http://www.ck12.org/flx/render/embeddedobject/137104
1. a. V = Bh
b. V = Bh = πr2h
c. V = 13 Bh
d. V = 13 Bh = 1
3 πr2h
2. a. 90 m3
b. 70 in3
c. 45.47 ft3
3. a. 314 cm3
b. 401.92 in3
c. 17.58 ft3
4. a. 803.84 in3
b. 480 in3
c. 37.68 units3
d. 170.67 in3
289

11.6. Volume of Pyramids and Cones www.ck12.org
5. The height of the pyramid is 19 feet.
V =13
Bh
266 =13(42)h
266 = 14h
266÷14 = h
19 = h
6. The height of the cone is 7.5 meters.
V =13
Bh
20.1 =13(8.04)h
20.1 = 2.68h
20.1÷2.68 = h
7.5 m = h
Bobcat Review
1.
2. x = 15
3. x = 4
290

www.ck12.org Chapter 11. Surface Area and Volume
Bobcat Stretch
1. The candle will burn for 57.6 hours. (1152 / 20 = 57.6).
2. Andrew used 2.32 in3 of the pencil’s total volume.
3. The volume of the prism with the pyramid removed is 1,152 units3. (1,728 - 576 = 1,152)
291
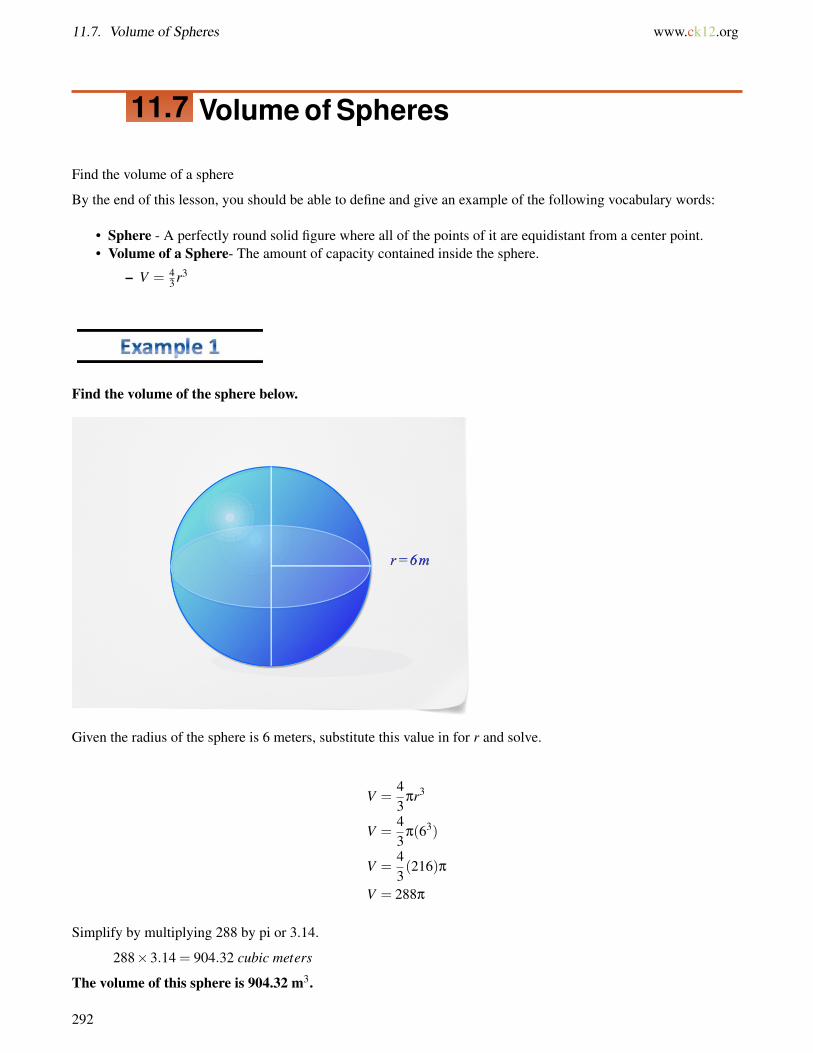
11.7. Volume of Spheres www.ck12.org
11.7 Volume of Spheres
Find the volume of a sphere
By the end of this lesson, you should be able to define and give an example of the following vocabulary words:
• Sphere - A perfectly round solid figure where all of the points of it are equidistant from a center point.• Volume of a Sphere- The amount of capacity contained inside the sphere.
– V = 43 r3
Find the volume of the sphere below.
Given the radius of the sphere is 6 meters, substitute this value in for r and solve.
V =43
πr3
V =43
π(63)
V =43(216)π
V = 288π
Simplify by multiplying 288 by pi or 3.14.
288×3.14 = 904.32 cubic meters
The volume of this sphere is 904.32 m3.
292

www.ck12.org Chapter 11. Surface Area and Volume
What is the relationship between the volume measurements of each of these?
As this picture shows, there is a definite relationship between these figures.
• Each figure has the same "base" as shown by the 3 smaller rectangles (same diameter / radius).• Each figure has the same height as shown by the large rectangle.
Because they have the same radius and height, the cone will fit inside the cylinder. In fact, the volume of 3 coneswill fit inside a cylinder with the same radius and height measurements.
So, the volume of a cone is 13 the volume of the cylinder.
Once again, because they have the same radius and height, the sphere will also fit inside the cylinder with the sameradius and height. The volume of the sphere is one-third smaller than the cylinder.
So, the volume of a sphere is 23 the volume of the cylinder.
293
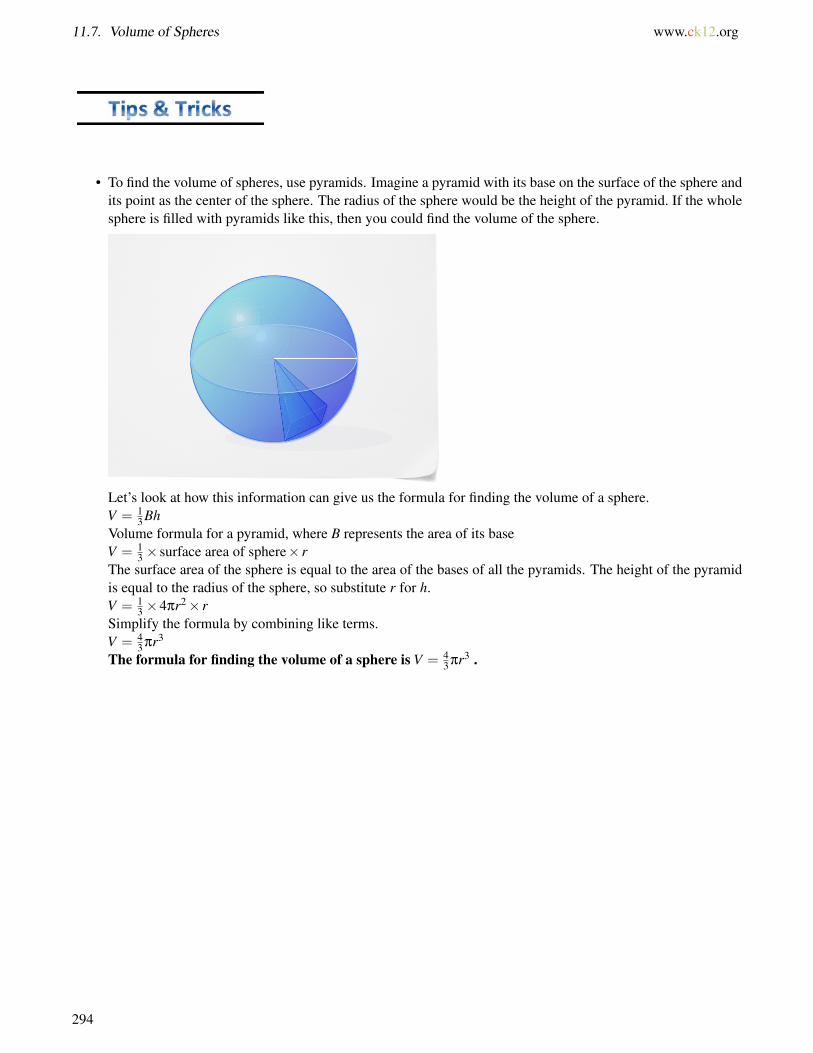
11.7. Volume of Spheres www.ck12.org
• To find the volume of spheres, use pyramids. Imagine a pyramid with its base on the surface of the sphere andits point as the center of the sphere. The radius of the sphere would be the height of the pyramid. If the wholesphere is filled with pyramids like this, then you could find the volume of the sphere.
Let’s look at how this information can give us the formula for finding the volume of a sphere.V = 1
3 BhVolume formula for a pyramid, where B represents the area of its baseV = 1
3 × surface area of sphere× rThe surface area of the sphere is equal to the area of the bases of all the pyramids. The height of the pyramidis equal to the radius of the sphere, so substitute r for h.V = 1
3 ×4πr2× rSimplify the formula by combining like terms.V = 4
3 πr3
The formula for finding the volume of a sphere is V = 43 πr3 .
294

www.ck12.org Chapter 11. Surface Area and Volume
1. Find the volume of each sphere below. Use 3.14 for π. Round to the nearest tenth.
a.
b.
c.
295

11.7. Volume of Spheres www.ck12.org
2. Given the following measurements, find the volume of each sphere.
a. A sphere that has a radius of 9 in.
b. A sphere that has a diameter of 12 m.
c. A sphere that has a diameter of 16 km.
3. Write the volume of each figure below. Find the relationship between the three volumes and write a word equationthat represents the relationships.
1. What is the length of the chord of the sphere shown below? Give an exact answer using a square root. (Hint: Usethe Pythagorean Theorem.)
296

www.ck12.org Chapter 11. Surface Area and Volume
(Hint: Use the Pythagorean Theorem.)2. Find the distance between points A and B on the coordinate plane.
3. Is the triangle with leg lengths of 9 in, 9 in, and hypotenuse of length√
175 in. a right triangle? Why or why not?
1. Write an expression that can be used to find the volume of the figure shown below. Assuming every part of thecone and sphere can be filled with ice cream, what is the volume of this ice cream cone? Round answer to the nearesthundredth.
297

11.7. Volume of Spheres www.ck12.org
2. Write an expression that can be used to find the volume of the figure shown below. Assuming every part of thistrophy is made out of silver, how much silver was used to make this trophy? Round answer to the nearest hundredth.
3. Eight congruent spheres are placed inside a cube and fit perfectly. If the side length of the cube is 8 inches, findthe difference of the volume of the cube and the total volume of the spheres. Use 3.14 for π and round values to thenearest tenth.
298

www.ck12.org Chapter 11. Surface Area and Volume
For more videos and practice problems,
• click here to go to Khan Academy.• search for "Volume word problems with cones, cylinders, and spheres" on Khan Academy (www.khanacad
emy.org ).• go to Khan Academy’s Common Core page standard 8.G.C.9 (www.khanacademy.org/commoncore/grade-8-
G).
Watch this video to further review volume of a sphere.
MEDIAClick image to the left or use the URL below.URL: http://www.ck12.org/flx/render/embeddedobject/137160
1. a. 267.95 in3
b. 33.5 ft3
c. 4.2 yd3
2. a. 3052.08 in3
b. 904.3 m3
c. 2143.6 km3
3. V = 43 πr3, 2
3 πr3, 2πr3
volume of sphere = volume of cylinder - (minus) volume of cone
Remember the volume of a sphere is 2/3 the volume of a cylinder and the volume of a cone is 1/3 the volume ofthe cylinder. So if you add the volume of a cone and sphere (with the same radius and height), you’ll get the volumeof a cylinder.
299

11.7. Volume of Spheres www.ck12.org
Bobcat Review
1. The chord length is 11√
2 cm.
2. The distance between points A and B is approximately 4.2 units. (Remember distance can never be in negativeunits.)
3. No, the triangle is not a right triangle because the lengths do not satisfy the Pythagorean Theorem.
92 +92 = (√
175)2
81+81 = 175162 6= 175
Bobcat Stretch43 π13 + 1
3 π12(3)1. , so 7.33 in3 of ice cream is in the ice cream cone.
2. (5 ·5 ·2)+π(12)
2(6)+ 4
3 π(2.5)3, so the trophy is made of 120.13 in3 of silver.
3. The volume difference is 244 in3. (cube volume = 512 in3, 1 sphere volume = 33.5 in3, 8 sphere volume = 268in3) and round values to the nearest tenth.
300

www.ck12.org Chapter 11. Surface Area and Volume
11.8 References
1. . http://becuo.com/sphere-volume .2. . CK-12 .3. . Tomruen - http://en.wikipedia.org/wiki/Image:dodecagonal_prism.png .4. . http://p12.bvsd.org/monarchhigh/faculty/tshannon/old/Geometry/Chapter%207/Notes%207.2.html .5. . http://www.mathatube.com/surface-area-of-cylinders.html .6. . http://spmath81611.blogspot.com/2012/03/angelas-surface-area-post.html .7. . http://openstudy.com/updates/4fdb80aae4b0f2662fd1b475 .8. . Engage NY, Module 7, Lesson 5, p67 .9. . Engage NY, Module 7, Lesson 22, p 295 .
10. . Engage NY, Module 7, Lesson 22, p 295 .11. . Engage NY, Module 7, p 295 .12. . Engage Ny .13. . Engage NY, Module 7, Lesson 19, p 256 .14. . Engage NY, Module 7, Lesson 19, p 258 .15. . Engage NY, Module 7, Lesson 19, p 258 .16. . Engage NY, Module 7, Lesson 19, p 259 .17. . Engage NY, Module 7, Lesson 2, p32 .18. . Engage NY, Module 7, Lesson 21, p 292 .19. . Engage NY, Module 7, Lesson 21, p 294 .20. . Engage NY .21. . Engage NY, Module 7, Lesson 19, p 261 .22. . Engage NY, Module 7, Lesson 19, p 261 .23. . Engage NY, Module 7, Lesson 17, p 228 .24. . Engage NY, Module 7, Lesson 21, p 288 .25. . Engage NY, Module 7, Lesson 21, p 288 .26. . Engage NY, Module 7, Lesson 19, p 261 .27. . Engage NY, Module 7, Lesson 17, p 230 .
301

www.ck12.org
CHAPTER 12 Probability and OddsChapter Outline
12.1 COUNTING METHODS
12.2 PERMUTATIONS
12.3 COMBINATIONS
12.4 PROBABILITY AND ODDS
12.5 INDEPENDENT AND DEPENDENT EVENTS
12.6 REFERENCES
302

www.ck12.org Chapter 12. Probability and Odds
12.1 Counting Methods
Use tree diagrams or the Counting Principle to find all possible outcomes of a series of events involving two or morechoices or results.
By the end of this lesson, you should be able to define and give an example of the following vocabulary words:
• Tree Diagram - A branching diagram that shows all the possible combinations of outcomes for an event.
• The Counting Principle- To find the total number of outcomes in a sample space, multiply the number ofpossible outcomes in each event category together.
– If one event occurs in m ways and a second event occurs in n ways, then the number of ways that the twoevents can occur is m×n.
• – The principle can be extended to 3 or more events.
303

12.1. Counting Methods www.ck12.org
If you flip a coin three times, how many different outcomes are possible?
To find out, make a tree diagram.
Split the different events into either-or choices that branch from the first choice (flip 1).
The first choice breaks flip 1 down into heads or tails.
Each outcome of flip 1 is broken down again for flip 2, which is heads or tails again.
Each outcome of flip 2 is broken down yet again for flip 3, which is still heads or tails.
The pink box shows the total number of outcomes for both flips:
In all, there are now 8 total outcomes.
HHH HT H T HH T T H
HHT HT T T HT T T T
What happens when you increase the number of flips to four? Just add another section to your tree diagram thatbranches from "Flip 3" to "Flip 4".
304

www.ck12.org Chapter 12. Probability and Odds
Telly is working in a bicycle shop over spring vacation, so she can earn a free bike. Ms. Kelley, the shop owner,said that she would let Telly design her own bike so she can choose seat color and type of handlebars as well ascolor of the bike. Telly already knows that she wants a mountain bike. How many different bike combinationsdoes Telly have from which to choose?
Mountain bike
Colors = Red, Green, Blue or Purple
Seat = normal or extra cushion
Handlebars = straight or curved
Use the Counting Principle to figure out the total number of options that Telly has for her bike.
First, count the number options in each choice category.
There are four colors = 4
There are two seat options = 2
There are two handlebar options = 2
Multiply the number of choices within each category together to find the total number of bike choices.
4×2×2 = 16
The Counting Principle shows Telly that she has 16 different bike combinations from which to choose.
• Counting Principle: outcomes×outcomes = total outcomes
305

12.1. Counting Methods www.ck12.org
1. You can have a sandwich (turkey, ham or beef) and a drink (milk or juice) for lunch.
a. Use the Counting Principle to determine the number of choices.
b. Make a tree diagram to show all the possible lunch options and check your answer from 1a.
2. Answering three questions on a test. The first two are true-false questions (T or F), and the third question is amultiple-choice question, A, B, C or D.
a. Use the Counting Principle to determine the number of choices.
b. Make a tree diagram to show all the possible test answer options and check your answer from 2a.
3. True or False. Read each statement below and write down if it is true or false. If false, correct any errors to makethe statement true.
The Counting Principle states that outcomes+outcomes = total outcomes.
4. The Gotham Gazette offers the following newspaper choices:
• home or office delivery• weekdays only, weekends only, or all seven day delivery• monthly or weekly payments
How many different kinds of choices can you get? Use a tree diagram to list them all.
5. Lloyd is trying to guess a 2-digit number. He knows that the tens digit is 1, 2, or 3 and the ones digit is 4 or 5.
a. Use the Counting Principle to determine the number of choices.
b. Make a tree diagram to show all the possible "guesses" and check your answer from 2a.
c. How many outcomes are possible if Lloyd finds out the number is even?
6. At Nico’s Taco Shop you can order 4 types of tacos, 3 types of burritos and choose from 6 types of drinks. Howmany different combinations can you make for lunch?
7. An ice cream shop has 31 flavors of ice cream, five different toppings and three different sizes of sundaes. Howmany different ice cream sundaes can they make?
306

www.ck12.org Chapter 12. Probability and Odds
8. In France, some license plates consist of 4 numbers, 2 letters, then 2 more numbers. How many different licenseplates are possible?
1. Write the equation of the line that passes through the points (3,7) and (5,11).
2. Write the linear equation for this table of values.
TABLE 12.1:
x y0 51 72 93 114 13
3. You buy a banana tree that is 8 inches tall. It grows 4 inches per day. Its height (in inches) h is a function of time(in days) d. Write an equation and draw a graph of the banana tree’s growth over time.
1. A diner has 144 possible meal combination with each meal including a main course, a salad, and a piece of pie.The menu lists 8 main courses and 3 salads. How many different pie choices are available? Explain your reasoning.
2. According to the Math Land Lottery’s website for its "Math Land Double" instant scratch game, the chance ofwinning a prize on a given ticket is about 17%. Imagine that a person stops at a convenience store on the way homefrom work every Monday, Tuesday, and Wednesday to buy a "scratcher" ticket and plays the game.
a. Develop a tree diagram showing the eight possible outcomes of playing over these three days.
b. What is the probability that the player will not win on Monday, but will win on Tuesday and Wednesday?
c. What is the probability that the player will win at least once during the 3-day period?
307

12.1. Counting Methods www.ck12.org
For more videos and practice problems,
• click here to go to Khan Academy.• search for "sample spaces of compound events" on Khan Academy (www.khanacademy.org ).
Watch this video to further review counting outcomes using tree diagrams.
MEDIAClick image to the left or use the URL below.URL: http://www.ck12.org/flx/render/embeddedobject/127461
1. a. 3×2 = 6, There are 6 lunch choices, which are all shown by the tree diagram.
b. First branch: 3 choices - turkey, ham or beef.
Second branch from each meat choice: 2 choices - milk or juice
Total 6 Combinations: Turkey / milk, Turkey / juice, ham / milk, ham / juice, beef / milk, and beef / juice.
2. a. 2×2×4 = 16
b. First branch: 2 choices - T or F
Second branch from each 1st question choice: 2 choices - T or F
Third branch from each 2nd question choice: 4 choices - A, B, C, or D.
Total Combinations: T / T / A, T/T/B, T/T/C, T/T/D, T/F/A, T/F/B, T/F/C, T/F/D, F/T/A, F/T/B, F/T/C, F/T/D,F/F/A, F/F/B, F/F/C, F/F/D
3. False, you multiply the outcomes (not add). outcomes×outcomes = total outcomes
4. First Branch: home (h) or office (o) delivery
Second Branch off of each first branch choice: weekdays only (d), weekends only (e), or all seven day (7) delivery
Third Branch off of each second branch choice: monthly (m) or weekly (w) payments
12 combinations: h/d/m, h/d/w, h/e/m, h/e/w, h/7/m, h/7/w, o/d/m, o/d/w, o/e/m, o/e/w, o/7/m, o/7/w
5. a. 3×2 = 6
b. First branch: 1, 2, or 3
Second branch off each first branch option: 4 or 5
308

www.ck12.org Chapter 12. Probability and Odds
Combinations: 14, 15, 24, 25, 34, 35
c. 3 options (3×1 = 3)
6. 4×3×6 = 72
7. 31×5×3 = 465
8. 10×10×10×10×26×26×10×10 = 676,000,000
Bobcat Review
1. y = 2x - 11
First we will find the slope using the slope formula for x1 = 3,y1 = 7,x2 = 5,y2 = 11.
m =y2− y1
x2− x1
m =11−75−3
m =42
m = 2
Now plug in our known values of m,x1, and y1.
m =y− y1
x− x121=
y−3x−7
Do you see that we have a proportion? This can be solved by cross multiplying.
21=
y−3x−7
1(y−3) = 2(x−7)
y−3 = 2x−14
y = 2x−11
2. y = 2x + 5
3. First, we need to write an equation. We can use the h to represent the height of the banana tree. We can usethe d to represent the number of days. The 8 is the height that the tree started with. Here is our equation.
h = 4d +8
Let’s use slope-intercept form to show its graph.
m = 4,b = 8
Notice that we only need the first quadrant of the coordinate plane because negative values would not make sense.
309

12.1. Counting Methods www.ck12.org
Bobcat Stretch
1. There are 6 different pie choices. 8×3× p = 144, where p = the number of pie choices.
2. First Branch: W (17%) and L (83%)
Second Branch off each first branch options: W (17%) and L (83%)
Third Branch off each second branch options: W (17%) and L (83%)
6 combinations: W/W/W, W/L/W, W/L/L, L/W/W, L/L/W, L/L/L
b. LWW outcome: 0.83×0.17×0.17 = 0.024
c. "Winning at least once" would include all outcomes except LLL (which has about a 0.5718 probability 0.83×0.83×0.83 ). The probabilities of these outcomes would sum to about 0.4282 ( 1−0.5718) .
310

www.ck12.org Chapter 12. Probability and Odds
12.2 Permutations
Use permutations to count possibilities.
By the end of this lesson, you should be able to define and give an example of the following vocabulary words:
• Factorial- A special number that represents the product of a series of descending values.
– 4!= 4×3×2×1 = 24– 4! is read 4 factorial.
• Permutation - A selection of items in which order is important.
– The number of permutations of n objects take r at a time is written:– nPr =
n!(n−r)!
– If 4 items are selected 4 at a time, the permutation is 4!(4−4)! =
240! =
241 = 24.
311
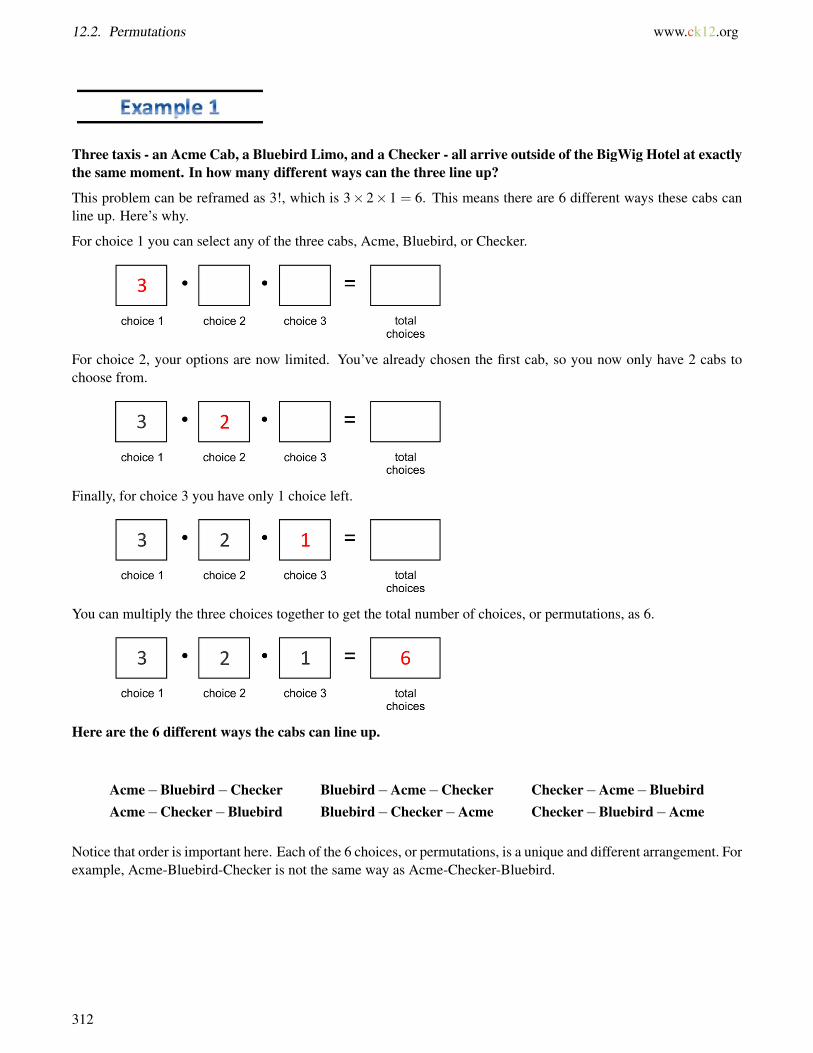
12.2. Permutations www.ck12.org
Three taxis - an Acme Cab, a Bluebird Limo, and a Checker - all arrive outside of the BigWig Hotel at exactlythe same moment. In how many different ways can the three line up?
This problem can be reframed as 3!, which is 3× 2× 1 = 6. This means there are 6 different ways these cabs canline up. Here’s why.
For choice 1 you can select any of the three cabs, Acme, Bluebird, or Checker.
For choice 2, your options are now limited. You’ve already chosen the first cab, so you now only have 2 cabs tochoose from.
Finally, for choice 3 you have only 1 choice left.
You can multiply the three choices together to get the total number of choices, or permutations, as 6.
Here are the 6 different ways the cabs can line up.
Acme−Bluebird−Checker Bluebird−Acme−Checker Checker−Acme−BluebirdAcme−Checker−Bluebird Bluebird−Checker−Acme Checker−Bluebird−Acme
Notice that order is important here. Each of the 6 choices, or permutations, is a unique and different arrangement. Forexample, Acme-Bluebird-Checker is not the same way as Acme-Checker-Bluebird.
312

www.ck12.org Chapter 12. Probability and Odds
What happens when you increase the number of cabs by adding a Decker Taxi? How many different waysare there now?
Starting over, you can now see that there are 4 choices for the first cab, followed by 3 choices, 2 choices, and 1choice.
There are seven contestants on a reality show. Only three will make it to the finale. How many different wayscan the 3 finalists be selected for the finale?
This problem can be reframed as 7P3, which means 7 items taken 3 at a time (or seven contestants where only threeare selected to continue).
7P3 ⇐= 7 items taken 3 at a time
Set up the problem.
7P3 =7!
(7−3)!=
⇐= total items!⇐= (total items− items taken at a time)!
Fill in the numbers and simplify.
7P3 =7!
(7−3)!=
7!4!
=7×6×5×(((((
(4×3×2×1
((((((4×3×2×1
=7×6×5
1= 210
There are 210 possible permutations or 210 ways the top three contestants can be selected for the finale.
You can also solve this using the Counting Principle and stop after the first 3 places.
7×6×5 = 210
• Remember, when order is important, it is a permutation.• The value of 0! is 1.
313

12.2. Permutations www.ck12.org
1. A _______________________ is an arrangement in which order is important.
2. 5! can be written as _____ × _____ × _____ × _____ × _____, which is equivalent to _______.
3. Evaluate the following factorials.
a. 6!
b. 1!
c. 0!
4. Find the number of permutations.
a. 4P1
b. 7P6
c. 9P4
d. 15P3
e. 8P3
5. You and three friends are waiting in line to ride a roller coaster. In how many different orders can you stand in theline for the ride?
6. A college student must choose between 10 dorms to live in. He must write down his first, second, and thirdchoices. How many different arrangements are possible?
7. There are 8 movies at the theater that you want to see. In how many different orders can you go watch the movies?
8. Awards are given to 8 floats in a parade. The local newspaper wants to put pictures in the paper of only the firstand second place floats. Find the number of different ways in which 2 pictures could be selected for the paper.
314

www.ck12.org Chapter 12. Probability and Odds
9. Emily Gray Jr. high has 50 members belonging to the National Jr. Honor Society. They meet to vote for aPresident, Secretary, and Treasurer. Find the numbers of different ways in which these 3 positions could be elected.Write the answer first in permutation format and then evaluate it.
1. Which ordered pair makes both equations true?
x+ y = 8
4x− y =−3
a. (2, 6)
b. (3, 15)
c. (4, 4)
d. (1, 7)
2. Does this this linear system have no solutions, one solution or infinitely many solutions? Describe the graph ofthis system.
x+ y =−8
2x+2y =−16
3. Solve the following system by graphing.
y = 2x−4
y =−2x+8
315
12.2. Permutations www.ck12.org
1. Denise needs to buy a lock for her school locker. One of the locks Denise considers is a circular lock with 20numbers. To open it she turns the dial to the first number, then she turns the dial to the second number, and then sheturns it to the third number. She may not repeat numbers in her locker combo.
a. Why does this situation represent a Permutation?
b. Write an expression for the number of different combination codes that are possible with this lock?
c. If Denise could use four numbers in her locker combo, how would you approach this task?
d. If Denise could choose from 40 different number, rather than 20, how would you approach this task?
e. What would need to change in the problem in order for it to represent a Combination?
f. Why doesn’t it make sense for locks to be “Combination Locks”?
g. If Denise could repeat numbers in her locker combo, how would you approach this task?
For more videos and practice problems,
• click here to go to Khan Academy.• search for "permutations" on Khan Academy (www.khanacademy.org ).
Watch this video to further review permutations.
MEDIAClick image to the left or use the URL below.URL: http://www.ck12.org/flx/render/embeddedobject/131720
316

www.ck12.org Chapter 12. Probability and Odds
1. permutation
2. 5, 4, 3, 2, 1 = 120
3. a. 720
b. 1
c. 1
4. a. 4
b. 5040
c. 3024
d. 2730
e. 336
5. 24 different orders
6. 720 arrangements
7. 40,320 different orders
8. 56 different ways
9. 50P3 = 117,600 different ways
Bobcat Review
1. d
2. Infinite number of solutions, which means these are coincidental lines (lines that lie exactly on top of each other)on a graph.
3. To work on this system, we will graph both of these lines and look for the point of intersection. That point ofintersection will be the solution to the system. The point of intersection is (3, 2).
317

12.2. Permutations www.ck12.org
Bobcat Stretch
1. a. This situation is a Permutation because the order of the three numbers makes a difference in the lockercombination code. For example the code 10, 15, 8 is a different code than 8, 10, 15.
b. 20P3 or 20 ·19 ·18 are examples of expressions for this lock’s combination code.
c. In the nPr expression r would equal 4 instead of 3. Or, if you used the counting principle then you wouldmultiply four numbers instead of three, such as 20 ·19 ·18 ·17.
d. In the nPr expression n would equal 40 instead of 20. Or, if you used the counting principle then you wouldstart your multiplication expression with 40, such as 40 ·39 ·38.
e. In order for this to be a Combination problem, the order of the numbers in the combination lock wouldn’tmatter. If you put the code 10, 15, 8 in, it would be the same locker code as 8, 10, 15.
f. It doesn’t make sense because it isn’t a Combination, it is a Permutation. They should be called “PermutationLocks.”
g. Using the counting principle it would be 20 ·20 ·20 = 203.
318

www.ck12.org Chapter 12. Probability and Odds
12.3 Combinations
Recognize combinations as arrangements in which order is not important and evaluate combinations using combi-nation notation.
By the end of this lesson, you should be able to define and give an example of the following vocabulary word:
• Combination - An arrangement of items or events where the order is not important.
– The notation for combinations is similar to the notation for permutations.– nCr ⇐= n items taken r at a time
To compute nCr use the formula:nCr =
n!r!(n−r)! =
nPrr!
For his top tennis doubles team, Coach Yin is considering 3 players: Joyce, Rose, and Nica. How manydifferent doubles teams can the coach consider?
Use a tree diagram to find the different double team combinations that are possible.
The first tree diagram shows all 6 permutations of the 3 players.
But order doesn’t matter in this problem. For example, the team of Joyce-Rose is no different than the team ofRose-Joyce.
319

12.3. Combinations www.ck12.org
So in the second tree diagram cross out all outcomes that are repeats.
This leaves 3 combinations that are not repeats.
Joyce-Rose, Joyce-Nica, Rose-Nica
Note: This method of making a tree diagram and crossing out repeats is reliable, but it is not the only way to findcombinations. You can use a list or a table to show the combinations too.
320

www.ck12.org Chapter 12. Probability and Odds
How many different violin duos can Ben, Jen, Ren, Wen, and Ken form?
Use combinations to solve problems when order is not important. One way to find the number of combinations is tomake a list.
Start with Ben. Add all combinations that begin with Ben to the list.
Combination List
Ben, Jen, Ren, Wen, Ken Ben-Jen
Ben, Jen, Ren, Wen, Ken Ben-Ren
Ben, Jen, Ren, Wen, Ken Ben-Wen
Ben, Jen, Ren, Wen, Ken Ben-Ken
All combinations that begin with Ben are covered, so now go through all combinations that begin with Jen, Ren, andWen.
Combination List
Ben, Jen, Ren, Wen, Ken Ben-Jen
Ben, Jen, Ren, Wen, Ken Ben-Ren
Ben, Jen, Ren, Wen, Ken Ben-Wen
Ben, Jen, Ren, Wen, Ken Ben-Ken
Ben, Jen, Ren, Wen, Ken Jen-Ren
Ben, Jen, Ren, Wen, Ken Jen-Wen
Ben, Jen, Ren, Wen, Ken Jen-Ken
Ben, Jen, Ren, Wen, Ken Ren-Wen
Ben, Jen, Ren, Wen, Ken Ren-Ken
Ben, Jen, Ren, Wen, Ken Wen-Ken
The list is now complete. In all, there are 10 combinations.
321

12.3. Combinations www.ck12.org
The 5 last people at a movie must compete for the last 2 empty seats. How many different groups of 2 can sitand watch the movie?
In this case, it doesn’t matter which order the people sit in the seats, so use the combination formula to find thenumber of different groups that can fill the seats.
Written in combination format, the problem looks like this 5C2.
5C2 ⇐= 5 items taken 2 at a time
Set up the problem by writing the combination formula for this situation.
5C2 =5!
2!(5−2)! or 5C2 = 5P22!
Fill in the numbers and simplify.
5C2 =5!
2!(3!) =5×
2
�4×�����3×2×1
�2×�1×������(3×2×1)
= 5×21 = 10 or 5C2 =
5×2
�4�2×1
= 5×21 = 10
There are 10 different possible combinations.
Note: This is the algebraic way to solve example 2 too. The numbers are the same - you have 5 items (violin players)where only 2 items are going to be selected (a duo).
• A combination is an arrangement of items where the order is not important while a permutation is an arrange-ment of items where the order is important.
322

www.ck12.org Chapter 12. Probability and Odds
1. A __________ is an arrangement in which order is not important.
2. Evaluate the following combinations:
a. 5C3
b. 6C2
c. 10C3
d. 7C5
3. You are going to plant 6 different types of flowers. You can choose from 11 different types of flowers. Find thenumber combinations of 6 flower types that are possible.
4. Evaluate the following combinations:
a. 20C18
b. 8C5
c. 12C5
d. 6C5
5. There are 28 students in your math class. Your teacher wants to choose 4 students to work together on a project.How many different groups of 4 students are possible.
6. You want to ride the Ferris wheel at the carnival. You are there with 19 friends. Only 5 people fit into a car at atime. How many different groups can be the first to go on the Ferris wheel? Write the answer first in combinationformat and then evaluate it.
323

12.3. Combinations www.ck12.org
1. Is .34 a rational number? Explain.
2. What fraction (in simplest form) is equivalent to the decimal 0.3125?
3. What fraction is equivalent to 3.92?
1. The California Fantasy 5 game is a state lottery game played across the state. All you have to do is pick fivelucky numbers from 1 to 39 on a Fantasy 5 slip. Then every day at 6:30pm entries are closed and the state drawsthe five Fantasy 5 numbers for the day. You win if you get one of the four following outcomes. You pick 2 of the 5winning numbers, you pick 3 of the 5 winning numbers, you pick 4 of the 5 winning numbers, and you pick 5 of the5 winning numbers. What is the probability of picking 5 of the 5 winning numbers?
a. Why does this situation represent a Combination?
b. How many different ways can all five of the Fantasy 5 numbers be picked?
c. How many different ways can four of the five Fantasy 5 numbers be picked?
d. If you were analyzing how many ways that two of the five numbers could be picked, how would youapproach solving this problem differently?
e. What would need to change in the problem in order for it to represent a Permutation?
f. If you were asked to find the probability of picking four of the five Fantasy 5 numbers correctly, how wouldyou approach that task?
324

www.ck12.org Chapter 12. Probability and Odds
For more videos and practice problems,
• click here to go to Khan Academy.• search for "combinations" on Khan Academy (www.khanacademy.org ).
Watch this video to further review combinations.
MEDIAClick image to the left or use the URL below.URL: http://www.ck12.org/flx/render/embeddedobject/131728
325
12.3. Combinations www.ck12.org
1. combination
2. a. 10
b. 15
c. 120
d. 21
3. 462
4. a. 190
b. 56
c. 792
d. 6
5. 20,475
6. 20C5, 15,504
Bobcat Review
1. Yes, it is a terminating decimal.
2. 312510000 = 125
400 = 516
3. 38999 = 3.92
Bobcat Stretch
1. a. It is a Combination because the order that the numbers are picked doesn’t matter, it is only important thatyou picked the correct numbers. If it were to be a Permutation then you would also need to pick the numbers in thecorrect order, in addition to picking the correct numbers.
b. # of ways to pick the 5 numbers from the 39 is: 39C5 = 575,757
c. # of ways to pick the 4 numbers from the 39 is: 39C4 = 82,251
d. For this problem you would set up the problem as r = 2 instead of r = 4 or 5.
e. If it were to be a Permutation, then you would also need to pick the numbers in the correct order, in addition topicking the correct numbers.
f. You would need to find the number of ways to pick four numbers from the 39 numbers and then set that numberup as the denominator and one as the numerator, as there is one way to correctly pick 4 of the Fantasy 5 numbers.
326

www.ck12.org Chapter 12. Probability and Odds
12.4 Probability and Odds
Find probabilities of events and find the odds in favor of events.
By the end of this lesson, you should be able to define and give an example of the following vocabulary words:
• Outcome- A possible result of a probability experiment.
– The outcomes that you specify are called favorable outcomes.– The remaining outcomes are unfavorable outcomes.
• Event- A set of outcomes.
– Complementary events are events whose probability sum adds up to 1 or 100%.
• Probability- A number 0 to 1 (or 0% to 100%) that represents the likelihood that an outcome will occur.
– Abbreviated as (P).– It can be written as a fraction, decimal or percent. For example, the probability of flipping tails is 1
2 or0.5 or 50%.
– There are two types of Probability:
* Theoretical Probability - This is what is expected to happen in an experiment.* Experimental Probability - This is what actually happens in an experiment.
–
P(event) =f avorable outcomes
total outcomes
• Odds- The ratio of favorable outcomes to unfavorable outcomes.
–
Odds(in favor of red) =f avorable outcomes
un f avorable outcomes=
12
327

12.4. Probability and Odds www.ck12.org
Given the following spinner, what is the probability and odds of the spinner landing on red? What are theodds against landing on red? (Hint: Red is the bottom third section of the spinner.)
Identify the favorable outcomes (landing on red), unfavorable outcomes (landing on blue or yellow), and totaloutcomes.
favorable outcomes = 1(red)
unfavorable outcomes = 2(blue, yellow)
total outcomes = 3
Find the probability of spinning red.
P(red) =f avorable outcomes
total outcomes=
13
Find the odds in favor of red.
Odds(in favor of red) =f avorable outcomes
un f avorable outcomes=
12
Find the odds against red occurring.
Odds(against red) =un f avorable outcomes
f avorable outcomes=
21
The probability of spinning red is 33% while the odds in favor of landing on red is 1 to 2 and the odds againstlanding on red are 2 to 1.
328
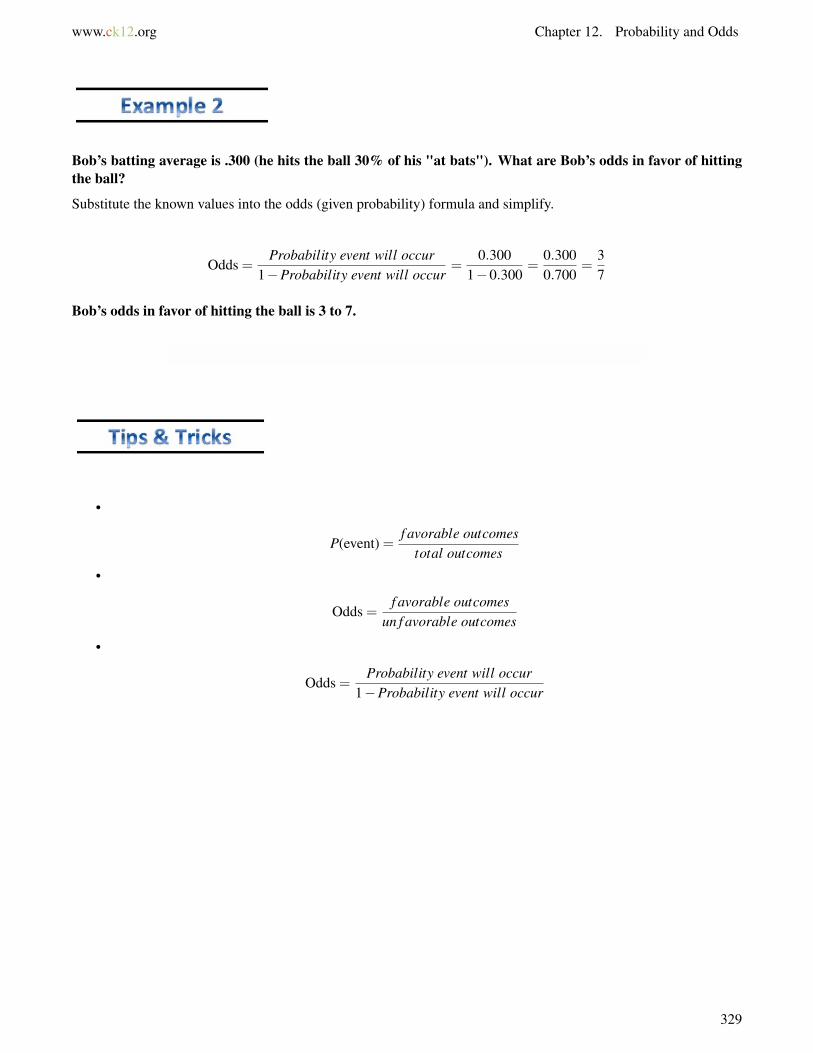
www.ck12.org Chapter 12. Probability and Odds
Bob’s batting average is .300 (he hits the ball 30% of his "at bats"). What are Bob’s odds in favor of hittingthe ball?
Substitute the known values into the odds (given probability) formula and simplify.
Odds =Probability event will occur
1−Probability event will occur=
0.3001−0.300
=0.3000.700
=37
Bob’s odds in favor of hitting the ball is 3 to 7.
•
P(event) =f avorable outcomes
total outcomes
•
Odds =f avorable outcomes
un f avorable outcomes
•
Odds =Probability event will occur
1−Probability event will occur
329
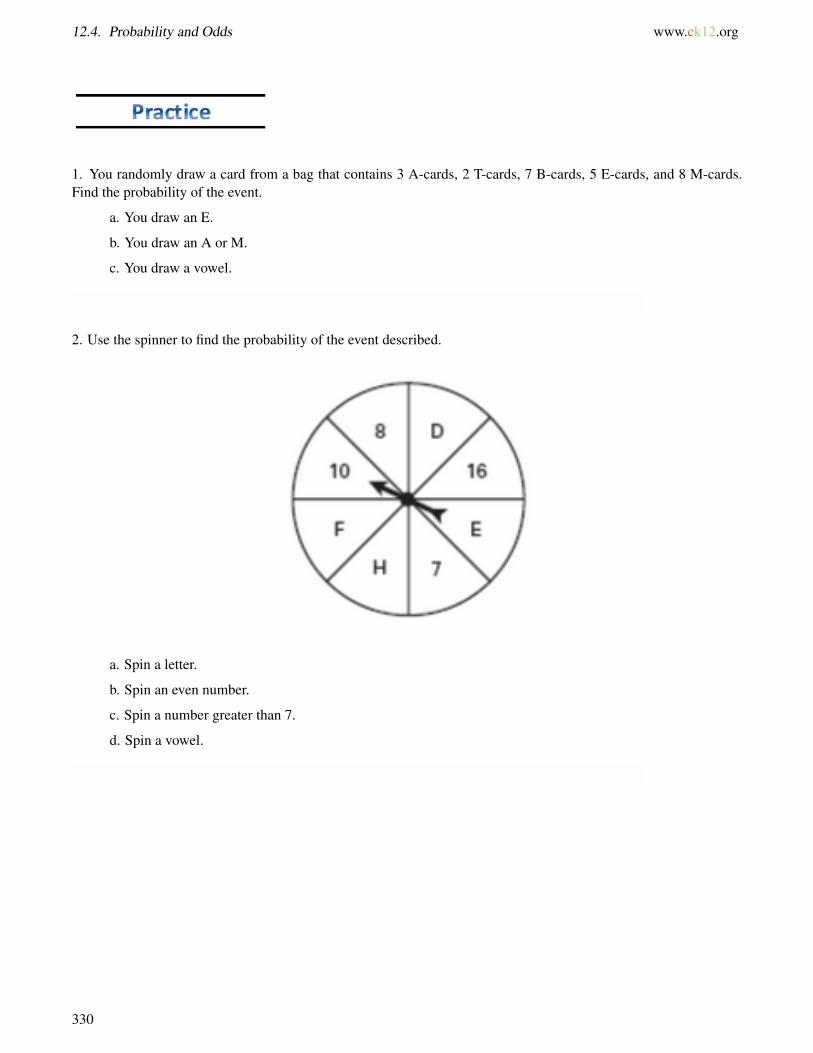
12.4. Probability and Odds www.ck12.org
1. You randomly draw a card from a bag that contains 3 A-cards, 2 T-cards, 7 B-cards, 5 E-cards, and 8 M-cards.Find the probability of the event.
a. You draw an E.
b. You draw an A or M.
c. You draw a vowel.
2. Use the spinner to find the probability of the event described.
a. Spin a letter.
b. Spin an even number.
c. Spin a number greater than 7.
d. Spin a vowel.
330

www.ck12.org Chapter 12. Probability and Odds
3. You randomly draw a marble from a bag of 320 marbles. You record its color and replace it. Use the resultsshown in the table to estimate the number of marbles in the bag that are the given color.
a. Blue
b. Purple
c. Green
4. In a survey of 1240 people, 1054 people said that they had a pet. Also in the survey, 465 people said that they hada cat.
a. What is the probability that a randomly chosen person from this survey has a pet?
b. What is the probability that a randomly chosen person from this survey has a cat?
c. Write each probability (4a and 4b) as percents.
5. You have wrapped 5 presents that are for adults and 4 presents that are for children. You want to give your cousinSara a gift for a child, but you don’t remember which presents are for adults or children. What is the probability thatyou choose a present at random and it’s for a child?
6. You are given the probability that an event will occur. Find the probability that the event will not occur?
a. P(A) = 73%
b. P(A) = 35
c. P(A) = 0.41
7. You randomly draw a letter tile from a bag. The 11 letters in the word MATHEMATICS are in the bag. Find theprobability of choosing the letter described from the bag, and then find the odds in favor of the event.
a. You choose an H.
b. You choose an A.
c. You choose an O.
331

12.4. Probability and Odds www.ck12.org
8. Find the odds in favor of the event described when rolling a number cube.
a. Roll a 4 or a 5.
b. Roll a 6 or an 8.
c. Roll a number less than 1.
d. Roll a number greater than 1.
9. Use the circle graph that shows the number of people who purchased a T-shirt and the size that they purchased.
a. What is the probability that a randomly chosen person purchasing a T-shirt will buy a medium T-shirt?
b. What are the odds that a randomly chosen person who purchases a T-shirt will purchase an extra largeT-shirt?
1. Nina owns a printing shop. The expression 12 x+ 22
3 represents her profits each hour, where x is the number ofpages she prints. If she made $15 in the last hour, how many pages did she print?
pp? points. On Thursday and Friday, the stock moved 0.75 points up each day. If the price of the stock was $45at the end of the week, what is the value of 2. Ben bought one share of stock for $40. He watched the price of hisstock every day for a week. On Monday, the stock moved 2.5 points up. On Tuesday, it moved 1.75 points down.On Wednesday, it moved
3. Trevor and Kelly are running a snack shop at Udall Park. The first week they made $130.25, the second week theymade $75.18, the third week they earned d (dollars - they lost the piece of paper that week that had the amount), andthe fourth week they earned $85.00 for a grand total of $380.43 for the month. How much did they earn the thirdweek?
332

www.ck12.org Chapter 12. Probability and Odds
1. At Tanque Verde HS, 90% of the students take Physics and 35% of the students take both Physics and Statistics.What is the probability that a student from Tanque Verde HS who is taking Physics is also taking Statistics?
At Tanque Verde HS, 75% of the students take Geometry and 15% of the students take both Chemistry and Geometry.What is the probability that a student from Tanque Verde HS who is taking Chemistry is also taking Geometry?2.
For more videos and practice problems,
• click here to go to Khan Academy.• search for "Probability 1" on Khan Academy (www.khanacademy.org ).
Watch this video to further review probability.
MEDIAClick image to the left or use the URL below.URL: http://www.ck12.org/flx/render/embeddedobject/132097
333

12.4. Probability and Odds www.ck12.org
1. a. 15
b. 1125
c. 825
2. a. 12
b. 38
c. 38
d. 18
3. a. 160
b. 32
c. 128
4. a. 10541240 = 527
620
b. 4651240 = 93
248
c. a = 85%, b = 37.5%
5. 49
6. a. 27%
b. 25
c. 0.59
7. a. 111 ,
110
b. 211 ,
29
c. 0, 011
8. a. 12
b. 15
c. 06
d. 51
9. a. 23100 = 23%
b. 619
334
www.ck12.org Chapter 12. Probability and Odds
Bobcat Review
1. x = 23, so she printed 23 pages.13 x+ 22
3 = 15
Now solve for x. The fractions make this equation more difficult to solve. So, use properties to take away thefractions. The reciprocal property states that any number multiplied by its reciprocal is equal to 1. Since bothfractions are thirds, multiply both sides of the equation by the reciprocal, 3
1 , to take away the fraction.31
(13 x+ 22
3
)= 3
1(15)
Now use the distributive property to simplify the left side of the equation.(31
)(13 x)+(3
1
)(223
)= 3
1(15)
x+22 = 45
Now you can easily solve the equation. Subtract 22 from both sides to isolate the variable.
x+22−22 = 45−22
x+0 = 23
x = 23
2. p = 2.75, so the stock moved 2.75 points up on Wednesday. 40+2.5−1.75+ p+2(0.75) = 45
3. They made $90 in the third week.
Bobcat Stretch
1. The probability that a student from Tanque Verde HS who is taking Physics is also taking Statistics is 39%.
Step 1: List what you know.
P(physics) = 0.90
P(physics and statistics) = 0.35
Step 2: Calculate the probability of choosing Statistics as a second course when Physics is chosen as a first course.
P(statistics|physics) =P(physics and statistics)
P(physics)
P(statistics|physics) =0.350.90
P(statistics|physics) = 0.388
P(statistics|physics) = 39%
Step 3: Write your conclusion.
Therefore, the probability that a student from Bluenose High School who is taking Physics is also taking Statisticsis 39%.
2. The probability that a student from Tanque Verde HS who is taking Geometry is also taking Chemistry is 20%.0.150.75 = .2
335

12.5. Independent and Dependent Events www.ck12.org
12.5 Independent and Dependent Events
Recognize and distinguish among independent and dependent events. Calculate the probability of compound events.
By the end of this lesson, you should be able to define and give an example of the following vocabulary words:
• Compound Event - The probability of two or more events happening at once.
– Independent Events - Events for which the outcome of one event does not affect the outcome of thesecond event.
– Dependent Events - Events for which the outcome of one event affects the outcome of the second event.
• Conditional Probability - The outcome of one event affects the outcome of a second event.
336
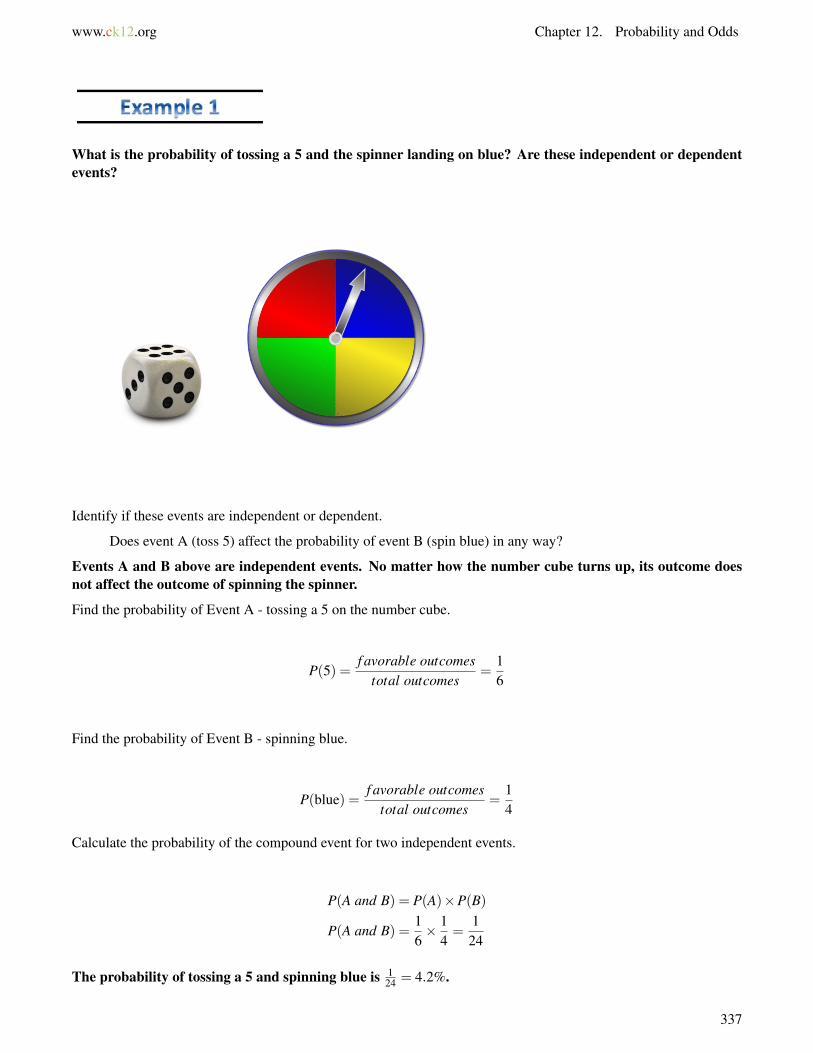
www.ck12.org Chapter 12. Probability and Odds
What is the probability of tossing a 5 and the spinner landing on blue? Are these independent or dependentevents?
Identify if these events are independent or dependent.
Does event A (toss 5) affect the probability of event B (spin blue) in any way?
Events A and B above are independent events. No matter how the number cube turns up, its outcome doesnot affect the outcome of spinning the spinner.
Find the probability of Event A - tossing a 5 on the number cube.
P(5) =f avorable outcomes
total outcomes=
16
Find the probability of Event B - spinning blue.
P(blue) =f avorable outcomes
total outcomes=
14
Calculate the probability of the compound event for two independent events.
P(A and B) = P(A)×P(B)
P(A and B) =16× 1
4=
124
The probability of tossing a 5 and spinning blue is 124 = 4.2%.
337
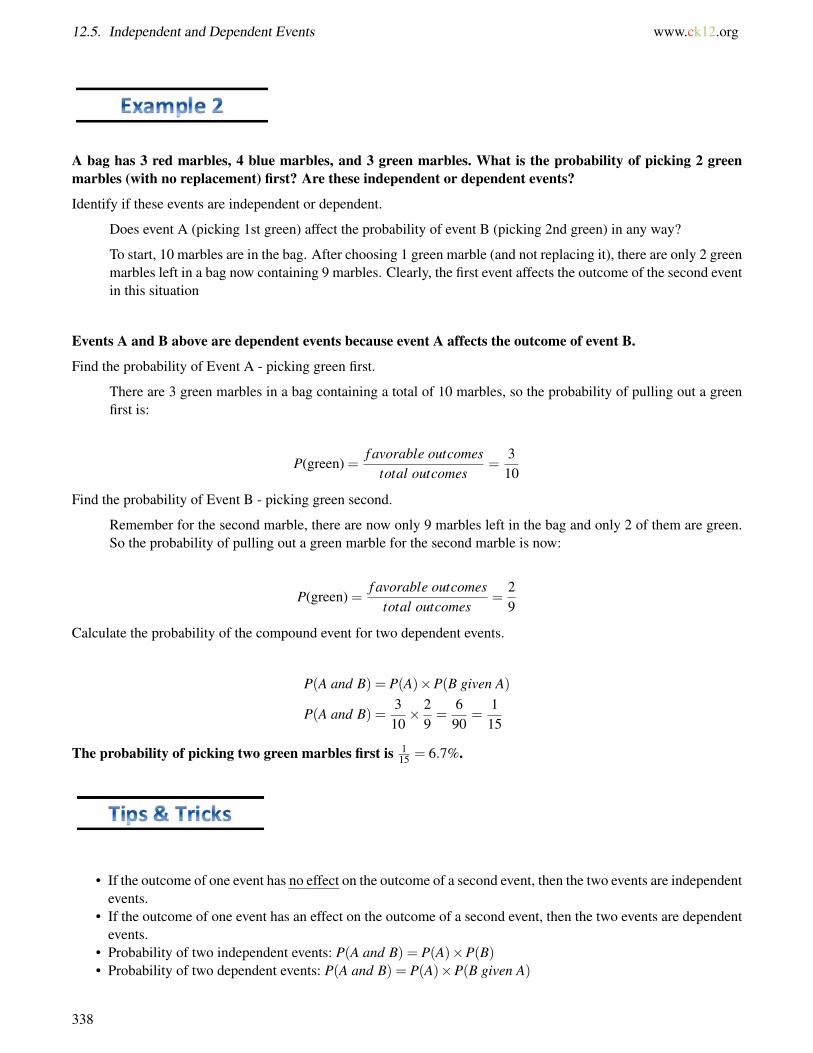
12.5. Independent and Dependent Events www.ck12.org
A bag has 3 red marbles, 4 blue marbles, and 3 green marbles. What is the probability of picking 2 greenmarbles (with no replacement) first? Are these independent or dependent events?
Identify if these events are independent or dependent.
Does event A (picking 1st green) affect the probability of event B (picking 2nd green) in any way?
To start, 10 marbles are in the bag. After choosing 1 green marble (and not replacing it), there are only 2 greenmarbles left in a bag now containing 9 marbles. Clearly, the first event affects the outcome of the second eventin this situation
Events A and B above are dependent events because event A affects the outcome of event B.
Find the probability of Event A - picking green first.
There are 3 green marbles in a bag containing a total of 10 marbles, so the probability of pulling out a greenfirst is:
P(green) =f avorable outcomes
total outcomes=
310
Find the probability of Event B - picking green second.
Remember for the second marble, there are now only 9 marbles left in the bag and only 2 of them are green.So the probability of pulling out a green marble for the second marble is now:
P(green) =f avorable outcomes
total outcomes=
29
Calculate the probability of the compound event for two dependent events.
P(A and B) = P(A)×P(B given A)
P(A and B) =310× 2
9=
690
=115
The probability of picking two green marbles first is 115 = 6.7%.
• If the outcome of one event has no effect on the outcome of a second event, then the two events are independentevents.
• If the outcome of one event has an effect on the outcome of a second event, then the two events are dependentevents.
• Probability of two independent events: P(A and B) = P(A)×P(B)• Probability of two dependent events: P(A and B) = P(A)×P(B given A)
338

www.ck12.org Chapter 12. Probability and Odds
1. If the outcome of one event has ___________ on the outcome of a second event, then the two events are indepen-dent events.
2. If the outcome of one event has an effect on the outcome of a second event, then the two events are ___________.
3. Identify if the events are independent or dependent.
a. A: Eddie chooses the color blue for his new bike. B: Eddie chooses lasagne from the dinner menu.
b. A: The probability of a spinner landing on blue 6 times in a row. B: The probability of the spinner landingon blue on the next spin.
c. A: The probability that it will rain tomorrow. B: The probability that the Wildcats basketball team will wintheir game tomorrow.
d. A: From a deck of cards, the probability of one player drawing a heart from the deck. B: On the nextplayer’s turn, the probability of drawing another heart.
4. Identify if the events are independent or dependent, and then find the probability.
a. A stack of 12 cards has 4 Aces, 4 Kings, and 4 Queens. What is the probability of picking 2 Aces from thestack at random?
b. On a game show, there are 16 questions: 8 easy, 5 medium-hard, and 3 hard. If contestants are givenquestions randomly, what is the probability that the first two contestants will get easy questions?
c. If you toss 2 number cubes, predict how likely they are to match.
d. What is the probability that a sum of a pair of number cubes will be 11 if the first cube lands on 5?
5. True or False. Read each statement below and write down if it is true or false. If false, correct any errors to makethe statement true.
The probability of picking an Ace then a King from a 52-card deck is 452 ×
452 = 16
2704 = 1169 .
6. What would be the probability or rolling a 5, given that you know you rolled an odd number?
7. What would be the probability of flipping tails four times in a row on a two-sided coin?
339

12.5. Independent and Dependent Events www.ck12.org
8. Jack’s Catering Service is accepting weekday appointments for Monday through Thursday, and weekend appoint-ments for Friday through Sunday. If appointment dates are made randomly, what is the probability that 2 weekdayswill be the first 2 days to be booked?
9. There are 2 white, 5 blue, and 8 red marbles in a bag. Rachel Lou picks marbles out of this bag to answerquestions for her math homework. Find the probability that she picks..
a. two blue marbles in a row without replacement.
b. two white marbles in a row with replacement.
c. a red marble, then a blue marble without replacement.
d. a white marble, then a red marble with replacement.
e. a red marble, then a white marble, and then a blue marble without replacement.
10. Which of these number(s) cannot represent a probability of a compound event?
a. -0.01
b. 0.5
c. 1.001
d. 0
e. 1
f. 20%
1. Evaluate the expression 8h2 +[51÷ (4 ·4.25)]−52÷5. Let h = 4.
2. Evaluate the expression 4x3− (3y÷9)+12. Let x = 3 and y = 9.
340

www.ck12.org Chapter 12. Probability and Odds
1. What is the probability that you could roll a standard die and get a 6, then grab a deck of cards and pull the Kingof Clubs, keep it, and then pull the Jack of Hearts?
2. What is the probability of rolling snake eyes (double ones) and then rolling a sum of seven on a pair of dice?
3. What is the probability of drawing a hand of three cards that contains at least one spade? (Note: a deck of cardscontains 52 cards and there are 13 cards of each suit (spades, hearts, etc...).
For more videos and practice problems,
• click here to go to Khan Academy.• search for "identifying dependent and independent events" on Khan Academy (www.khanacademy.org ).
Watch this video to further review independent or dependent probability events.
MEDIAClick image to the left or use the URL below.URL: http://www.ck12.org/flx/render/embeddedobject/132100
341

12.5. Independent and Dependent Events www.ck12.org
1. no effect
2. dependent
3. a. Independent
b. Independent
c. Independent
d. Dependent
4. a. Dependent: 13 ×
311 = 3
33 = 111
b. Dependent: 12 ×
715 = 7
30
c. Independent: 16 ×
16 = 1
36
d. Independent: 16
5. False, the probability of picking an Ace then a King from a 52-card deck is 452 ×
351 = 12
2652 = 1221 since the events
are dependent.
6. 13
7. 12 ×
12 ×
12 ×
12 = 1
16
8.
P(weekday and weekday) = P(weekday 1st) ·P(weekday 2nd)
=47· 1
2
=27
9. a.P(Blue)×P(Blue) = 13 ×
414 = 4
42 = 221 .
b. P(White)×P(White) = 215 ×
215 = 4
225
c. P(Red)×P(Blue) = 815 ×
514 = 40
210 = 421
d. P(White)×P(Red) = 215 ×
815 = 16
225
e. P(Red)×P(White)×P(Blue) = 815 ×
214 ×
513 = 80
2730 = 8273
10. a and c. A probability can ony be between 0% and 100% (or between 0 and 1, as a decimal). 0% means itwill not happen, 100% means it will happen, and every number between represents some shade of "it may happen".Choice "a" is negative, and choice "c" is greater than 100%, so neither are possible.
342

www.ck12.org Chapter 12. Probability and Odds
Bobcat Review
1. The answer is 126.
P Step 1 : Substitute 4 for “h.′′
8h2 +[51÷ (4 ·4.25)]−52÷5
8(4)2 +[51÷ (4 ·4.25)]−52÷5
Step 2 : Remember PEMDAS. Therefore, perform the operation inside the
grouping symbols first. Recall that order of operations must be followed
inside grouping symbols also. In this case, multiply 4×4.25 before dividing
by 51.
8(4)2 +[51÷ (4 ·4.25)]−52÷5
8(4)2 +[51÷17]−52÷5
8(4)2 +3−52÷5
E Step 3 : The next step in order of operations is to simplify the numbers with
exponents.
8(4)2 +3−52÷5
8(4 ·4)+3−5 ·5÷5
8(16)+3−25÷5
M Step 4 : Multiply
8(16)+3−25÷5
128+3−25÷5
D Step 5 : Divide
128+3−25÷5
128+3−5
A Step 6 : Add
128+3−5
131−5
S Step 6 : Subtract
131−5 = 126
2. The answer is 117.
Bobcat Stretch
1.
P(roll 6|King|Jack) = P(roll 6)×P(King)×P(Jack)
P(roll 6 then pull King then pull Jack) =16× 1
52× 1
51=
115912
OR .167× .019× .020 = .000063
2. P(snake eyes)×P(seven) = 136 ×
16 = 1
216
3. P(Spade)×P(anycard)×P(anycard) = 1352 ×
5151 ×
5050 = 13
52
343

12.6. References www.ck12.org
12.6 References
1. http://eclass1.wsd.k12.ca.us/moodle/mod/resource/view.php?id=511. Mr. Thornton’s Class .
344