Flow cytometric quantification of HIV1 Tat protein in tat-transfected Jurkat T cell lines
Upload
independentCategory
view
0download
0
doi:10.1182/blood-2008-05-158196Prepublished online July 7, 2009;
Peter J. Valk, Jurgen Lohler, Robert K. Slany, Eric N. Olson and Carol StockingMaike Schwieger, Andrea Schuler, Martin Forster, Afra Engelmann, Michael A. Arnold, Ruud Delwel, MEF2CHoming and invasiveness of MLL/ENL leukemic cells is regulated by
http://bloodjournal.hematologylibrary.org/site/misc/rights.xhtml#repub_requestsInformation about reproducing this article in parts or in its entirety may be found online at:
http://bloodjournal.hematologylibrary.org/site/misc/rights.xhtml#reprintsInformation about ordering reprints may be found online at:
http://bloodjournal.hematologylibrary.org/site/subscriptions/index.xhtmlInformation about subscriptions and ASH membership may be found online at:
digital object identifier (DOIs) and date of initial publication. theindexed by PubMed from initial publication. Citations to Advance online articles must include
final publication). Advance online articles are citable and establish publication priority; they areappeared in the paper journal (edited, typeset versions may be posted when available prior to Advance online articles have been peer reviewed and accepted for publication but have not yet
Copyright 2011 by The American Society of Hematology; all rights reserved.20036.the American Society of Hematology, 2021 L St, NW, Suite 900, Washington DC Blood (print ISSN 0006-4971, online ISSN 1528-0020), is published weekly by
For personal use only. by guest on May 18, 2011. bloodjournal.hematologylibrary.orgFrom
Homing and invasiveness of MLL/ENL leukemic cells is
regulated by MEF2C
Maike Schwieger,1,* Andrea Schüler,1,* Martin Forster,1 Afra Engelmann,1 Michael A. Arnold,2
Ruud Delwel,3 Peter J. Valk,3 Jürgen Löhler,1 Robert K. Slany,4 Eric N. Olson,2 and Carol
Stocking1
1Heinrich-Pette-Institute, 20251 Hamburg, Germany; 2Department of Molecular Biology, University of
Texas Southwestern Medical Center, Dallas, TX 75390, USA; 3Department of Hematology, Erasmus
University Medical Center, 3000 DR Rotterdam, The Netherlands; 4Department of Genetics, University
of Erlangen, 91058 Erlangen, Germany
Keywords: MADS transcription factors, chemokine receptor, mixed-lineage leukemia, retroviral
insertional mutagenesis
Running title: MEF2C imparts invasiveness to MLL leukemic cells
Category: Myeloid Neoplasia
* These authors contributed equally to this work
Correspondence should be addressed to: Carol Stocking, Ph.D., Heinrich-Pette-Institut, PO Box 201652,
D-20206 Hamburg, Germany. Tel: +49-40-480 51 273; Fax: +49-40-480 51 187; email:
Blood First Edition Paper, prepublished online July 7, 2009; DOI 10.1182/blood-2008-05-158196
Copyright © 2009 American Society of Hematology
For personal use only. by guest on May 18, 2011. bloodjournal.hematologylibrary.orgFrom

2
Abstract
Acute myelogenous leukemia (AML) is driven by leukemic stem cells (LSC) generated by
mutations that confer (or maintain) self-renewal potential coupled to an aberrant differentiation
program. Using retroviral mutagenesis, we identified genes that generate LSC in collaboration
with genetic disruption of the gene encoding interferon response factor 8 (Irf8), which induces a
myeloproliferation in vivo. Amongst the targeted genes, we identified Mef2c, encoding a MADS
transcription factor, and confirmed that over-expression induced a myelomonocytic leukemia in
cooperation with Irf8 deficiency. Strikingly, several of the genes identified in our screen have
been reported to be upregulated in the mixed-lineage leukemia (MLL) subtype. High MEF2C
expression levels were confirmed in AML patient samples with MLL gene disruptions,
prompting an investigation of the causal interplay. Using a conditional mouse strain, we
demonstrated that Mef2c deficiency does not impair the establishment nor maintenance of LSC
generated in vitro by MLL/ENL fusion proteins – however, its loss led to compromised homing
and invasiveness of the tumor cells. Mef2c-dependent targets included several genes encoding
matrix metalloproteinases and chemokine ligands and receptors, providing a mechanistic link to
increased homing and motility. Thus an early event in LSC generation may be responsible for the
aggressive nature of this leukemia subtype.
For personal use only. by guest on May 18, 2011. bloodjournal.hematologylibrary.orgFrom

3
Introduction
Acute myelogenous leukemia (AML) is maintained by a small population of leukemic stem cells
(LSC), which share two main characteristics with hematopoietic stem cells (HSC): 1) self-renew
ability, thereby creating daughter cells with the capacity to replicate almost indefinitely; and 2)
differentiation capacity, by which progressively differentiating cells are generated – and which is
responsible for the cellular heterogeneity found in leukemia.1,2 Fusion proteins generated from
translocations involving the MLL gene on chromosome 11q23, which are associated with infant
mixed-lineage leukemia (MLL) and adult AML with poor prognosis, have been shown to
generate LSC from committed myeloid progenitors.3,4 MLL regulates gene transcription at the
chromatin level and MLL leukemias are invariably associated with aberrant expression of
selected HOX and TALE homeobox genes, which have been implicated in the establishment of
the LSC in a cooperative manner.5-7 More recently, the Mef2c transcription factor, encoded by a
member of the (MCM1-agamous-deficiens-serum response factor) MADS family of homeotic
genes, has also been implicated in the establishment of MLL-induced LSC.3 Nevertheless, the
role of these proteins or other downstream effectors in the conversion of a progenitor cell into an
LSC capable of inducing an aggressive clinical leukemia is not well defined.
We initiated this study to identify novel mechanisms in the generation of AML LSC by
using a genetic approach, in which mice deficient for the interferon regulatory factor-8 (Irf8)
were infected with murine leukemia virus (MuLV) to induce acute leukemia. Irf8-/- mice
spontaneously develop a chronic myeloproliferative syndrome,8 most likely due to the combined
effects of impaired apoptosis and increased sensitivity to proliferation stimuli in the myeloid
compartment.9-11 Infection with MuLV would be expected to accelerate the progression to an
acute phase by activating cooperating oncogenes (or inactivating tumor suppressors) through
random integration into the cellular DNA, resulting in the selective outgrowth of LSC that feed
For personal use only. by guest on May 18, 2011. bloodjournal.hematologylibrary.orgFrom

4
an overt AML. Using this approach, we identified integrations in several genes that have been
implicated in the generation of LSC by MLL-fusion protein, such as HoxA9, Meis1, and Myb, but
also Mef2c. This result prompted us to not only confirm the cooperative action of Mef2c
overexpression and Irf8 deficiency, but also to explore the correlation between Mef2c and MLL.
Mef2c is one of four "myocyte enhancer factor 2" (MEF2) proteins, which make up one
of three distinct classes of MADS-box transcription factors. Mef2 proteins are central regulators
of diverse developmental programs,12 although a role in hematopoiesis was unappreciated until
recently. We have previously demonstrated that Mef2c is an important determinant of myeloid
cell fate,13 a result supported by the demonstration that Mef2c is regulated by the microRNA-223
during granulocytic differentiation.14 In addition, a critical role of Mef2c in mature B-cell
proliferation, survival, and homeostasis has recently been demonstrated.15-17
We show here that Mef2c induces myelomonocytic leukemia in cooperation with Irf8
deficiency, and also confirm that high Mef2c expression levels are found in patient samples with
disrupted MLL. However, taking advantage of mice in which Mef2c can be inducibly
inactivated, we show that Mef2c is dispensable for both establishment and maintenance of LSC
generated by MLL fusion proteins. Instead, we provide evidence that demonstrates the
importance of Mef2c for modulating the homing and invasive properties of MLL-AML.
For personal use only. by guest on May 18, 2011. bloodjournal.hematologylibrary.orgFrom

5
Material and methods
Mouse strains
The generation of conditional (Mef2cfl) and non-conditional (Mef2c-) inactivating alleles of Mef2c have
been previously described.18,19 Mef2cfl/+ and Mef2c-/+ mice were backcrossed into the C57BL/6J
PtprccPepca (here called B6) mouse strain (for over 10 generations) and then crossed to generate Mef2cfl/-
and Mef2c+/+ B6 littermates, which were used for these studies. To induce Mef2c excision, mice were
crossed to MxCre B6 mice20 and newborns were injected with a double dose of 500 µg polyinosinic-
polycytidylic (pIpC) acid (Sigma-Aldrich Chemicals, Munich, Germany) dissolved in PBS. Alternatively,
bone marrow (BM) cells were infected with a retroviral vector coexpressing the CRE recombinase and
eGFP (pSF91-CRE-iGFP; R860).21 In transplantated mice, pIpC (300 µg) was injected three times at two
day intervals, as indicated. To validate Mef2c excision, DNA from blood or harvested cells was subjected
to PCR, as previously described.13 B6.SJL-PtprcaPep3b/BoyJ (here called B6-Ptprca) mice were used as
hosts for all BM transplantations. Irf8-/- B6 mice8 (also known as Icsbp-/-) and NOD.CB17-Prkdcscid/J
mice (here called NOD/scid) were originally obtained from Ivan Horak (Berlin, Germany) and Charles
River Laboratories (Sulzfeld, Germany), respectively, and were maintained in the Heinrich-Pette-Institut
animal facilities. All animal experiments were approved by the Commission for Animal Experiments at
the Heinrich-Pette-Institute together with Hamburg Office of Health. Survival curves of experimental
animals were calculated by the method of Kaplan-Meier and statistical analysis was performed using the
SPSS 15.0 software (SPSS, Chicago).
MuLV infections and isolation of integration sites
Newborn Irf8-/- B6 mice were infected i.p. with circa 5x10⁵ infectious units of Moloney (Mo)-MuLV
harvested from SC1 fibroblasts as previously described.22 Retroviral integration sites were isolated from
genomic DNA of tumors using a modified protocol of the “ligase-mediated extension-primer tag
selection” PCR reaction.23
For personal use only. by guest on May 18, 2011. bloodjournal.hematologylibrary.orgFrom

6
Retroviral gene transduction and BM transplantation
Retroviral vectors were used to transduce the murine Mef2c-α1 isoform (SF91-iGFP)24 or the MLL/ENL
fusion protein (MSCVneo25, MYs-GFP26or an MYs-Venus variant) into murine BM progenitors.
Retroviral pseudotypes were generated in 293T cells transiently transfected with the retroviral vector
plasmid plus plasmids expressing MoMuLV env and gagpol genes. For BM infections, virus particles
were fixed onto 35mm plates coated with Retronectin® (Cambrex, Verviers, Belgium) before the addition
of BM progenitors suspended in StemSpan SFEM medium (StemCells Technologies, Vancouver)
supplemented with 1% glutamine, 50ng/ml mSCF (Peprotech, Hamburg), 100ng/ml each hFlt3-L and
hIL-11 (StemCells Technologies), and 10ng/ml mIL-3 (Strathmann, Hamburg). Infections were repeated
after 24 hours. For Mef2c transductions, BM was isolated from mice that received i.p. injections of 5-
fluorouracil (150mg/kg) four days prior to isolation. For MLL/ENL transductions, BM was isolated from
untreated mice and progenitors (Linneg) were enriched using the Midi MAX Lineage Depletion Kit
(Miltenyi Biotec, Bergisch-Gladbach, Germany).
Transduced BM cells (1x10⁶) supplemented with untreated whole BM cells (1x10⁵) were
transplantated into lethally irradiated (9Gy) B6-Ptprca mice. For retransplantation experiments, 5x10⁶
cells isolated from spleens of diseased mice were injected i.v. into either non-treated recipients. Mice
were monitored regularly for disease symptoms. FACS and histological analysis of hematopoietic cells
and organs were performed as previously described.24,27 The following antibody clones were used: mouse
anti-CD44 APC-conjugated (clone IM7), mouse anti-CD184 PE-conjugated (clone CXCR4), mouse anti-
CD11b APC-conjugated (clone M1/70), mouse anti-Gr1 PE-conjugated (clone RB6-8C5), and mouse
anti-F4/80 PE-conjugated (clone MCA497PEB). Unconjugated anti-CD16/32 (clone 93) was used to
block unspecific binding.
Establishment of cell M/E cell lines and colony forming assay
Two independent sets of MLL/ENL expressing cell lines (M/E cells) were generated. In the first set, BM
from Mef2cfl/- or Mef2c+/+ littermates were transformed with MSCVneo-MLL/ENL, as previously
For personal use only. by guest on May 18, 2011. bloodjournal.hematologylibrary.orgFrom

7
described.24,28 These were subsequently infected with either with SF91-iGFP or SF91-CREiGFP. The
second set was generated from BM from Mef2cfl/-MxCRE and Mef2c+/+MxCRE littermates (treated with
pIpC as newborns) and infected with MYs-MLL/ENL-GFP. Transformed cells were isolated by serial
replating (7-day intervals) in Methocult M3434 (StemCell Technologies). Single colonies from the
quaternary cloning assay were picked at culture in RPMI 1640 medium, supplemented with 10% FCS, 1%
Glutamine, 10ng/ml each mIL3 (Strathmann), mGM-CSF, hIL-6 (Peprotech) and 100ng/ml mSCF
(generously supplied by Ursula Just, University Kiel). Several independent clones were analyzed, but no
difference in phenotype or proliferation was observed. For subsequent studies Mef2cΔ/-M/E-cells were
infected with MYs-iPac vectors, expressing a puromycin resistance marker alone, or with wild-type
Mef2c or a previously characterized HDAC-binding Mef2c mutant29 (Mef2c-VLL65-67ASR, here called
Mef2cASR), which retains the ability of Mef2c to induce differentiation (A.S. and C.S., unpublished
results). Both sets of cell lines were analyzed extensively in vitro (differentiation markers, proliferation,
and migration assays). The first set (M/E-Mef2cΔ/--CRE/GFP and M/E-Mef2c+/+-CRE/GFP cells) were
used to test tumorigenicity in vivo by i.p. injection of 106 cells into non-irradiated NOD/scid mice.
Gene expression analysis of AML samples and MLL/ENL-transformed cells
A total of 285 AML cases have been analyzed using Affymetrix HGU133A GeneChips (Affymetrix,
Santa Clara, CA).30 Relative expression values for IRF8 and MEF2C for each patient was used to
determine mean values for patient clusters. For gene expression profiling of M/E cells, RNA was isolated
from M/E-Mef2cΔ/- cells infected with MYs-iPAC or MYs-pMef2cASR (see above) after puromycin
selection at three different time points, pooled, and hybridized against the Agilent Whole Mouse Genome
Microarray 4x44K using the one-color service of Miltenyi. Transcript levels were verified by real-time
RT-PCR using the SYBRGreen Reaction Mix (Roche Mannheim) in a Roche Light-Cycler. cDNA levels
were normalized against Hprt transcript levels. Primers and amplification conditions are available upon
request. The microarray data is available in the GEO public database under accession number GSE1159.
For personal use only. by guest on May 18, 2011. bloodjournal.hematologylibrary.orgFrom

8
In vivo and in vitro homing and proliferation assays
In vivo hematopoietic cell homing assay was performed as described.31 Briefly, freshly isolated BM cells
were labeled with the fluorescent dye carboxyfluorescein succinimidyl ester (CFSE; Molecular Probes,
Eugene, OR), washed, and then 107 cells were injected per recipient mouse irradiated (9Gy) 1h before
transplantation. Mice were killed 4 hours after the transplantation, and the percentage of CFSE+ cells in
the BM and spleen were determined by FACS. In order to obtain a statistical reproducibility, at least
7×10⁶ events were analyzed for each sample. Transmigration-assays were performed using Transwells (5
µm pore size; Costar, Corning, NY) in 24-well tissue culture plates. Briefly, 1-2x10⁵ M/E cells (see
above) were plated in upper chamber of each Transwell in medium without chemoattractant. The medium
in the lower chambers was supplemented with either 100ng/ml SDF1α or 1xPBS. Cell numbers were
determined after 3-5h. Cobblestone formation assays were performed by plating 106 M/E-Mef2c/GFP or
M/E-GFP cells onto a monolayer of stromal MS-5 cells in 6 well plates (Falcon) for 24h.
To determine the proliferation rate in vivo, Linneg BM progenitors isolated from pIpC treated
Mef2c+/+MxCre and Mef2c-/flMxCre littermates were infected with MYs-MLL/ENL-Venus. Infected BM
cells (1.2x10⁶) were transplanted into lethally irradiated (9Gy) B6-Ptprca mice. Thirteen days after
transplantation, mice were injected i.p. with 2mg BrdU and analyzed two hours later. BM cells were
sorted for Venus positive cells and these cells were subsequently stained with the APC BrdU Flow Kit
(BD Biosciences, Heidelberg) following the manufacturer's instructions.
Results
Identification and confirmation of Mef2c oncogenic activity in a mouse model
To identify novel genes that cooperate with other genetic mutations to generate AML, we
performed retroviral insertional mutagenesis on Irf8-/- mice, which spontaneously develop a mild
chronic myeloproliferative disease due to Irf8 deficiency.8 Newborn Irf8+/+ and Irf8-/- B6 mice
were infected with Mo-MuLV and monitored for leukemia development. MuLV-induced
For personal use only. by guest on May 18, 2011. bloodjournal.hematologylibrary.orgFrom

9
leukemia was accelerated in Irf8-/- as compared to Irf8+/+ B6 mice (Figure 1A). Furthermore,
although Mo-MuLV induced a T-cell leukemia (CD3+) in 100% of the control mice, myeloid
leukemia (CD11b+) was observed in 29% of Irf8-/- mice. These results confirm a cooperative
effect between Irf8 deficiency and MuLV insertional mutagenesis. Retroviral integration sites
mapping to the HoxA7, HoxA9, Meis1, and Myb gene loci were found in several independent
myeloid tumors, similar to other mouse models.32 In addition, integrations in the Mef2c gene
locus, mapping within 4kb upstream of the first coding exon, were found in circa 20% of the
tumors analyzed (Figure 1B). A 5-fold increase in Mef2c mRNA was observed in tumors
carrying proviral integrations in the Mef2c locus, as compared to tumors with the same
phenotype but without apparent disruption of the Mef2c gene (Figure 1C).
To determine whether constitutive and high expression levels of Mef2c were causative in
leukemia development, BM cells from Irf8-/- and Irf8+/+ were infected with retroviral vectors
expressing Mef2c and transplanted into syngenic hosts. With a median latency of 79 days post-
transplantation, all mice receiving Irf8-/- BM expressing Mef2c succumbed to AML (Figure 2A).
Moribund mice were characterized by cachexia and dyspnea, and suffered from
hepatosplenomegaly. Consistent with a diagnosis of acute leukemia, most mice were anemic and
peripheral blood (PB) and BM contained a high proportion of blasts and immature monocytic and
granulocytic forms (Figure 2B-D). Peripheral white blood counts were highly elevated in 90% of
the animals (mean value of 170x106 cells/ml; range 5x10⁶ to 800x106 cells/ml) compared with
the GFP controls (range 3.5x10⁶ to 9x10⁶). The leukemia was highly invasive, and a striking
accumulation of crystal-storing macrophages was observed (Figure 2E-K). Flow cytometric
analyses of PB and BM confirmed that 80 to 95% of the organs were positive for both GFP (as a
surrogate marker for Mef2c), and the majority of the tumor cells were CD11bhiGr1lo and
expressed the monocytic marker F4/80 in the BM compartment – consistent with a high
For personal use only. by guest on May 18, 2011. bloodjournal.hematologylibrary.orgFrom

10
incidence of immature monocytes and blasts (Figure 2L). Notably, no disease was observed over
a 9-month period in mice receiving Irf8+/+ BM cells that had been transduced with Mef2c vectors
with similar efficiencies (18 and 40% GFP+ cells, two independent experiments). These results
demonstrate a striking synergy between high Mef2c expression and Irf8 deficiency in the
induction of invasive acute myelomonocytic leukemia.
Relatively high levels of MEF2C transcripts in specific AML subtypes
To address the potential relevance of our findings to human disease, we analyzed MEF2C
transcript levels in a data set of leukemic BM and PB cells of 285 individuals with AML.30
Previous analysis of this data set identified 16 groups of AML with distinct gene expression
profiles. Surprisingly, we found a strong positive correlation (r = 0.40) between IRF8 and
MEF2C gene expression. These results contrast to our experimental system, in which Irf8
deficiency synergized with Mef2c over-expression, and thus suggests alternative mechanisms or
cooperating partners in human AML. A likely cooperating mechanism is the deregulation of the
MLL gene, as suggested by the high mean expression levels of MEF2C in patients carrying MLL
gene disruptions, which are found in both patient clusters #1 and #16 (Figure 3). MLL-associated
AML is predominately associated with a monocytic phenotype, however, high levels of MEF2C
expression was not found in clusters #5 or #9, which also contain high levels of monocytic and
myelomonocytic cells, refuting the theory that high MEF2C levels correlate strictly with the
differentiation phenotype. A relatively high mean expression level was also found in cluster #10
(with a predominantly M1 phenotype) but this was significantly less than that found in MLL-
associated AML. Interestingly, other common integration sites found in our screen (Meis1,
HoxA7, HoxA9, and Myb) have also been shown to be important players in MLL-associated
leukemogenesis.6,33 Furthermore, the high levels of MEF2C expression in MLL-leukemia
For personal use only. by guest on May 18, 2011. bloodjournal.hematologylibrary.orgFrom
11
samples agrees with recent findings, in which MEF2C was identified as a direct target of the
MLL/AF9 fusion protein within the LSC compartment.3
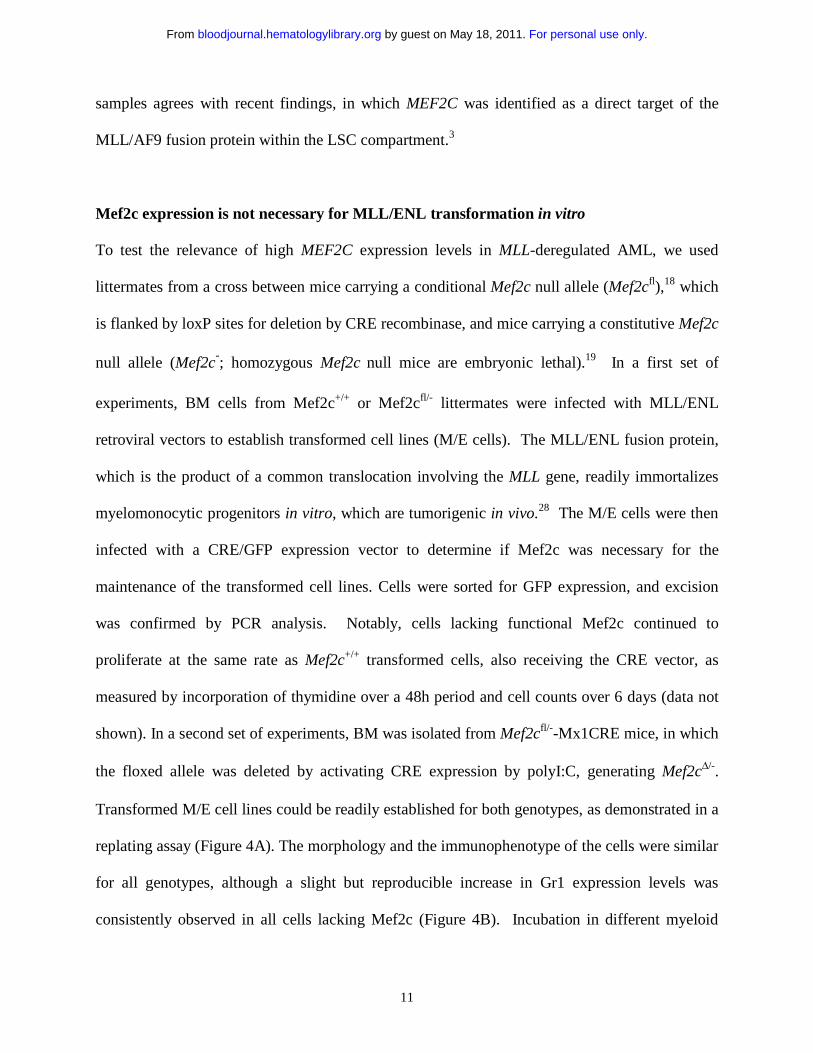
Mef2c expression is not necessary for MLL/ENL transformation in vitro
To test the relevance of high MEF2C expression levels in MLL-deregulated AML, we used
littermates from a cross between mice carrying a conditional Mef2c null allele (Mef2cfl),18 which
is flanked by loxP sites for deletion by CRE recombinase, and mice carrying a constitutive Mef2c
null allele (Mef2c-; homozygous Mef2c null mice are embryonic lethal).19 In a first set of
experiments, BM cells from Mef2c+/+ or Mef2cfl/- littermates were infected with MLL/ENL
retroviral vectors to establish transformed cell lines (M/E cells). The MLL/ENL fusion protein,
which is the product of a common translocation involving the MLL gene, readily immortalizes
myelomonocytic progenitors in vitro, which are tumorigenic in vivo.28 The M/E cells were then
infected with a CRE/GFP expression vector to determine if Mef2c was necessary for the
maintenance of the transformed cell lines. Cells were sorted for GFP expression, and excision
was confirmed by PCR analysis. Notably, cells lacking functional Mef2c continued to
proliferate at the same rate as Mef2c+/+ transformed cells, also receiving the CRE vector, as
measured by incorporation of thymidine over a 48h period and cell counts over 6 days (data not
shown). In a second set of experiments, BM was isolated from Mef2cfl/--Mx1CRE mice, in which
the floxed allele was deleted by activating CRE expression by polyI:C, generating Mef2cΔ/-.
Transformed M/E cell lines could be readily established for both genotypes, as demonstrated in a
replating assay (Figure 4A). The morphology and the immunophenotype of the cells were similar
for all genotypes, although a slight but reproducible increase in Gr1 expression levels was
consistently observed in all cells lacking Mef2c (Figure 4B). Incubation in different myeloid
For personal use only. by guest on May 18, 2011. bloodjournal.hematologylibrary.orgFrom

12
cytokines (singly or as cocktails) did not change either their morphology or surface antigen
expression. In all cases, the excised allele was confirmed by PCR analysis of cellular DNA (data
not shown). Thus Mef2c is not necessary for either the establishment or maintenance of the
immortalized state, nor for the block in terminal differentiation in MLL/ENL transformed
cultures.
Mef2c is not required for MLL/ENL-induced leukemia, but shortens the disease latency
and increases the dissemination of leukemic cells in vivo.
To determine if Mef2c expression was necessary for tumorigenesis in vivo, mice were injected
i.p. with cells from the established Mef2cΔ/- or Mef2c+/+ M/E cell lines (both carrying a CRE
retroviral vector) and monitored for disease induction. Mice of each cohort developed large
tumor masses within the peritoneal cavity with similar size and kinetics (Figure 4C and data not
shown). These results demonstrated that loss of functional Mef2c did not impair tumor/leukemia
formation in vivo, even if the M/E cells were initially transformed in the presence of Mef2c
However, post mortem inspection of hematopoietic organs within these mice revealed a striking
difference between mice receiving Mef2cΔ/- or Mef2c+/+-M/E cells. In contrast to mice receiving
M/E-Mef2c+/+ cells, in which infiltrating tumor cells were readily observed in the spleen, as
monitored by GFP positivity (median 89%; range 66% to 100%) and size (Figure 4D), mice
receiving M/E-Mef2cΔ/- cells had smaller spleens with lower GFP levels (median 29%, range 8%
to 85%; Figure 4D). A similar reduction in the spread to BM was also observed, as measured by
proportion of GFP+ cells (mean 13.5±8% for Mef2cΔ/- cells, n=6, compared to 82±16% for
Mef2c+/+ cells, n=7). Normal hematocrit levels (range 34% to 43%) and leukocyte counts (range
2-12x 06 cells / ml) were observed in both cohorts.
For personal use only. by guest on May 18, 2011. bloodjournal.hematologylibrary.orgFrom
13
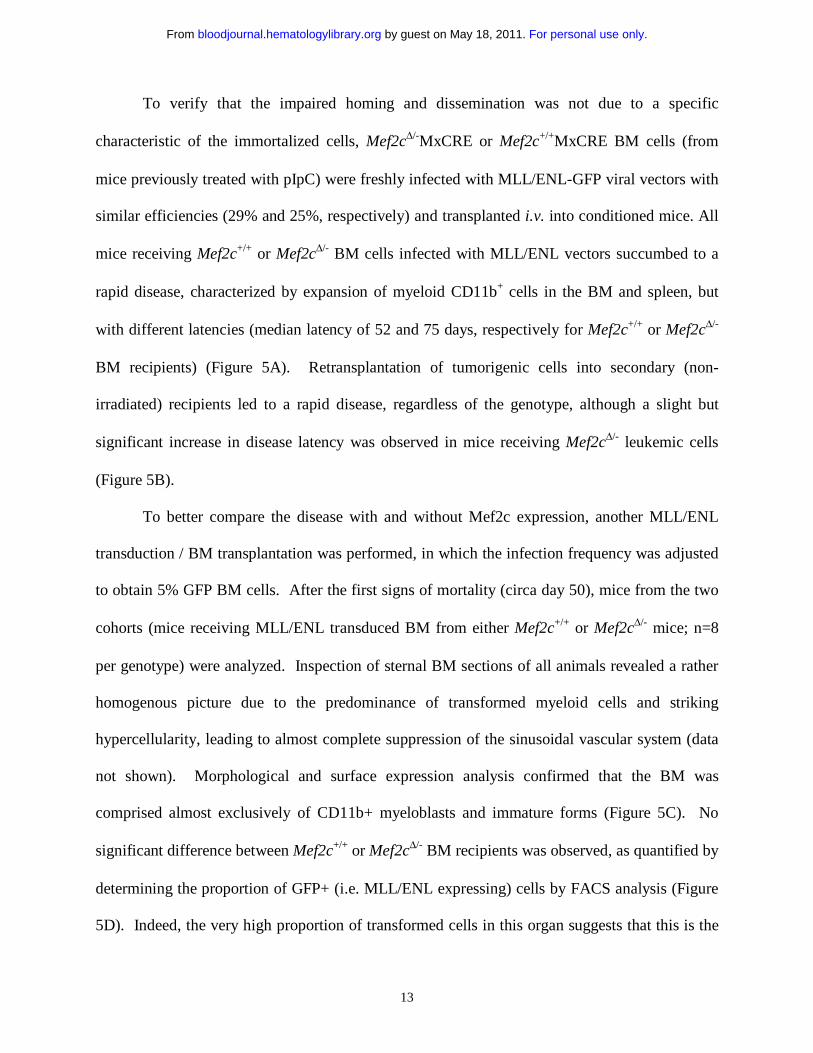
To verify that the impaired homing and dissemination was not due to a specific
characteristic of the immortalized cells, Mef2cΔ/-MxCRE or Mef2c+/+MxCRE BM cells (from
mice previously treated with pIpC) were freshly infected with MLL/ENL-GFP viral vectors with
similar efficiencies (29% and 25%, respectively) and transplanted i.v. into conditioned mice. All
mice receiving Mef2c+/+ or Mef2cΔ/- BM cells infected with MLL/ENL vectors succumbed to a
rapid disease, characterized by expansion of myeloid CD11b+ cells in the BM and spleen, but
with different latencies (median latency of 52 and 75 days, respectively for Mef2c+/+ or Mef2cΔ/-
BM recipients) (Figure 5A). Retransplantation of tumorigenic cells into secondary (non-
irradiated) recipients led to a rapid disease, regardless of the genotype, although a slight but
significant increase in disease latency was observed in mice receiving Mef2cΔ/- leukemic cells
(Figure 5B).
To better compare the disease with and without Mef2c expression, another MLL/ENL
transduction / BM transplantation was performed, in which the infection frequency was adjusted
to obtain 5% GFP BM cells. After the first signs of mortality (circa day 50), mice from the two
cohorts (mice receiving MLL/ENL transduced BM from either Mef2c+/+ or Mef2cΔ/- mice; n=8
per genotype) were analyzed. Inspection of sternal BM sections of all animals revealed a rather
homogenous picture due to the predominance of transformed myeloid cells and striking
hypercellularity, leading to almost complete suppression of the sinusoidal vascular system (data
not shown). Morphological and surface expression analysis confirmed that the BM was
comprised almost exclusively of CD11b+ myeloblasts and immature forms (Figure 5C). No
significant difference between Mef2c+/+ or Mef2cΔ/- BM recipients was observed, as quantified by
determining the proportion of GFP+ (i.e. MLL/ENL expressing) cells by FACS analysis (Figure
5D). Indeed, the very high proportion of transformed cells in this organ suggests that this is the
For personal use only. by guest on May 18, 2011. bloodjournal.hematologylibrary.orgFrom

14
origin of the leukemic cell transformation. However, the spread of the transformed cells to the
periphery, and to other lymphoid or non-hematopoietic organs was strikingly different between
the two cohorts, manifesting in two distinct clinical diseases in the two genotypic cohorts. First
of all, whereas all mice showed splenomegaly, the median spleen weight of Mef2c+/+ recipients
was significantly higher than mice receiving Mef2cΔ/- (Figure 5E). Although, in both cohorts,
histological analysis of the splenic sections showed complete effacement of the normal
architecture due to myeloid hyperplasia of the red pulp (Figure 5F). FACS analysis demonstrated
a high incidence of MLL/ENL (GFP+) transformed myeloblasts (CD11b+) in the both cohorts,
although a significantly lower proportion was observed in Mef2cΔ/- BM recipients (Figure 5G).
Furthermore, whereas hepatomegaly was observed in 6 out of 7 mice receiving MLL/ENL
Mef2c+/+ BM, this was observed in only 2 out of 8 Mef2cΔ/- recipients. Histological inspection
showed that the normal liver lobular architecture was destroyed in all mice with enlarged livers;
the periportal and pervenous liver parenchyma being replaced by infiltrating leukemic
myeloblasts and immature forms (Figure 5H). In contrast, the non-enlarged livers of Mef2cΔ/-
BM recipients showed only limited myeloblasts infiltration (Figure 5H). Similarly,
lymphadenopathy was only observed in 2 out of 8 mice of the MLL/ENL Mef2cΔ/- cohort, but in
5 out of 7 Mef2c+/+. Finally, analysis of the blood also revealed a significant difference in the
spread of the transformed cells, as evidenced by the extremely high leukocyte counts in the
Mef2c+/+ but not Mef2cΔ/- cohort (Figure 5I). Blood smears and FACS analysis confirmed that
this was due to abnormal egression of MLL/ENL-infected Mef2c+/+ myeloblasts and abnormal
myeloid forms from the BM (Figure 5J, and data not shown). Taken together these results
support the hypothesis that Mef2c is important for either the engraftment / mobilization / or
proliferation of leukemic cells into permissive environments.
For personal use only. by guest on May 18, 2011. bloodjournal.hematologylibrary.orgFrom

15
Mef2c expression correlates with increased homing and motility properties and with
increased expression levels of chemokines and receptors
The importance of Mef2c in proliferation, homing, engraftment and/or mobilization was
investigated in a number of different assays. Firstly, although in vitro proliferation assays of M/E
cells did not reveal a difference between Mef2c+/+ and Mef2cΔ/- cells, we sought to investigate the
proliferation of MLL/ENL transformed cells in the BM. Two weeks after transplantation of
freshly infected MLL/ENL-Venus Mef2c+/+ and Mef2cΔ/- cells BM progenitors, mice were
injected with BrdU and the levels of incorporation were assayed in Venus+ cells isolated from
the BM two hours later. As shown in Figure 6A, no significant difference in BrdU uptake and
thus proliferation between Mef2c+/+ and Mef2cΔ/- cells was observed.
In a second set of experiments, the homing potential of Mef2cΔ/- or Mef2c+/+ BM cells was
directly assayed by tracking transplanted cells labeled with a fluorescent dye (CFSE). Four hours
after transplantation into conditioned mice, significantly lower numbers of transplanted Mef2cΔ/-
as compared to Mef2c+/+ cells could be detected in both BM and spleen (Figure 6B), suggesting
impaired homing in the absence of Mef2c. Similarly, a strikingly reduced ability of Mef2c-
deficient MLL/ENL transformed cells to form cobblestone clusters underneath a stroma cell
layer in vitro was observed (Figure 6C), a characteristic ascribed to the interaction of the homing
factor SDF1α (CXCL12) secreted by stroma and its receptor CXCR4.34 To quantitate this
observation, and to ensure that the difference was due to Mef2c itself, a migration assay in the
presence of the SDF1α chemoattractant was performed on M/E Mef2c+/+, M/E Mef2cΔ/-, as well
as M/E Mef2cΔ/-+Pac (conferring resistance to puromycin) and M/E Mef2cΔ/-+Mef2c/Pac (in
which Mef2c was reintroduced into the Mef2c deficient cells). These experiments demonstrated
For personal use only. by guest on May 18, 2011. bloodjournal.hematologylibrary.orgFrom
16
that loss of Mef2c lead to decreased migration capacity, whereas reintroduction of Mef2c could
rescue this effect (Figure 6D). As Mef2c protein activity is highly dependent on type IIa HDAC
binding (which is controlled by extracellular cues), we sought to determine if relief of HDAC
inhibition may reveal a stronger migration activity. To test this, a Mef2c mutant (Mef2cASR),
which retains transcription activity but can no longer be repressed by type IIa HDACs,29 was
tested in our assay. Expression of this HDAC-binding mutant in Mef2c-deficient cells resulted in
a high migration index relative to control cells in the absence of SDF1α (Figure 6E), possibly
reflecting an autocrine mechanism. However, this activity was inhibited by addition of SDF1α
(Figure 6E), suggesting reciprocal inhibition with other chemokines, as previously described.35
To determine if loss of effective homing to various hematopoietic organs was the key
mechanism by which loss of Mef2c function impaired MLL/ENL induced disease, a
transduction/ BM transplantation assay was performed on Mef2cfl/fl MxCRE BM cells not
exposed to pIpC. One week after transplantation of MLL/EENL-transduced BM cells, half of
the mice (n =7) were injected with pIpC to induce Mef2c excision. The disease latency of these
mice were comparable to that of mice expressing functional Mef2c (Figure 6F). PCR analysis
confirmed the efficient recombination of the floxed alleles in the developing tumors (Figure 6G).
No significant difference in spleen weights or GFP percentage was observed in these two mouse
cohorts (data not shown), although a higher incidence of hepatomegaly was observed in mice
with tumors expressing functional versus inactivated Mef2c (+pIpC) (0.8 versus 0.3). These
results demonstrate that defective homing capacity of MLL/ENL BM cells lacking functional
Mef2c is a key factor in the increased disease latency of MLL/ENL induced leukemia in these
cells.
For personal use only. by guest on May 18, 2011. bloodjournal.hematologylibrary.orgFrom
17
Microarray gene expression profiling reveals upregulation of several chemokine ligands
and receptors, as well as matrix metalloproteinase genes in Mef2c+ cells
To determine the mechanism behind the defective homing capacity of Mef2c deficient cells, the
surface expression of CXCR4 and CD44, both known to be important in homing and engraftment
of hematopoietic cells, was determined (Figure 7A). CD44 was detected at high levels on all
MLL/ENL transformed cells, regardless of Mef2c status. In contrast, a small but consistent
subpopulation (up to 15%) of MLL/ENL-transformed Mef2c+/+ cells expressed high levels of
CXCR4, whereas CXCR4 could not be detected on transformed cells lacking Mef2c (Figure 7A).
Somewhat surprisingly, although CXCR4 was not detected on the surface of Mef2c-/- cells, high
levels of CXCR4 transcripts were detected (see below), suggesting a more complex regulation of
CXCR4 surface expression.
To gain insight into the possible mechanism by which Mef2c may impart increased
homing and invasion properties to the MLL/ENL transformed cells, microarray analysis was
used to compare gene expression profiles. For this assay, we used the Mef2cASR mutant, in which
the protein sites known to interact with Type IIa HDACs were mutated, to ensure that Mef2c
transcriptional activity was not repressed.29 A striking upregulation of transcripts encoding
chemokine ligands and receptors was observed in cells engineered to express Mef2cASR, which
was confirmed by RT-PCR in most cases (Figure 7B and C). Most prominent was the close to 3-
fold upregulation of CCR2, a shared receptor for several ligands of the CC family, including
CCL2. The closely related CCR5 receptor was also upregulated, but overall expression levels
were one-tenth of that of CCR2, as judged by signal intensity on microarrays. Indeed, CCR2 and
CXCR4 were the only two chemokine-receptor genes expressed at high levels in the MLL/ENL
transformed cells, giving signals that were more than 70-fold higher than background levels on
the arrays. In agreement with our analysis of M/E Mef2cΔ/- and Mef2c+/+cells, only a minor
For personal use only. by guest on May 18, 2011. bloodjournal.hematologylibrary.orgFrom

18
difference in CXCR4 transcript levels were observed when Mef2c was expressed in the null
background (Figure 7A and B).
In addition to chemokine receptors, we observed increased expression of a number of CC
ligands (Figure 7B). In addition to CCL2, which belongs to the monocytic chemotactic protein
(MCP) family of CC-ligands, several members (CCL3, CCL4, and CCL6) of the macrophage
inflammatory protein (MIP) of CC ligands were highly expressed and upregulated in Mef2c+
cells. No significant signals for CXCL12 (SDF1α) transcript levels, or for other CXC ligands,
were observed in these cells.
Finally, analysis of the microarray data also revealed significant increases in transcripts
encoding several matrix metalloproteinases (Figure 7D), which have also been repeatedly
implicated in cell motility, tissue invasion, and metastasis.36 Highest expression levels were
observed for Mmp8 and Mmp9 (over 30-fold above background signals). Although only slightly
higher levels of Mmp9 was observed in Mef2c+ cells, an over 5-fold increase of Mmp8
transcripts were observed in these cells. In addition, up to 4-fold higher levels of Mmp12 and
Mmp25 was also observed.
Discussion
The study presented here provides new insight into the role of the MADS Mef2 transcription
factors in leukemia induction. Two observations were made in our study: 1) In the absence of the
tumor suppressor Irf8 (but not in its presence), deregulation of the Mef2c gene induces a rapid
and aggressive myelomonocytic leukemia with close to 100% penetrance, demonstrating the
Mef2c can act as a cooperating oncogene; and 2) High levels of Mef2c are found in the
myelomonocytic leukemia associated with MLL transformation, but Mef2c was neither
For personal use only. by guest on May 18, 2011. bloodjournal.hematologylibrary.orgFrom

19
necessary for the establishment nor maintenance of the LSC that drives MLL leukemia induction
in an experimental model, but rather modulated the clinical manifestations of the disease by
imparting motility and invasive properties. It is of interest to note that many of the downstream
oncogenes of MLL fusion proteins characterized to date have been identified by retroviral
insertional mutagenesis in Irf8 deficient mice (either in the mouse strain we used or in BXH-2
mice.)37 We propose that this primarily reflects the relatively large number of genes that are
deregulated by MLL disruption and that alone cannot induce leukemia – however, either in
concert with other MLL targets or in cooperation with the Irf8-deficient "pre-leukemic"
phenotype are potent disease inducers. A key component of the Irf8 system is most likely related
to its decrease sensitivity to apoptotic stimuli, providing a cellular environment where secondary
events leading to acute leukemia can occur.9-11
By what mechanism does Mef2c act as an oncogene in leukemia induction?
The strong oncogenic potential of Mef2c was clearly manifested in the Irf8 deficient background.
Earlier work has also demonstrated cooperation between ectopic Mef2c expression and Sox4
activation in leukemia induction.39 Somewhat unexpectedly, our study showed that Mef2c
expression is not required for MLL/ENL transformation in vitro or in vivo, although disruption of
the MLL locus is associated with high levels of Mef2c expression. Even if transformation in
vitro initially occurred in the presence of Mef2c+ cells, subsequent excision of functional Mef2c
did not impact on its ability to induce tumors in vivo. The most likely explanation is that Mef2c
oncogenic function is redundant with other downstream targets of MLL fusion proteins, such as
HoxA9, Meis1, and Myb. Notably, many of the downstream targets of MLL fusion proteins
have complementary but also overlapping transforming properties.5,6,38 Alternatively, loss of
Mef2c may be compensated by upregulation of other Mef2 proteins in these cells. We did not
For personal use only. by guest on May 18, 2011. bloodjournal.hematologylibrary.orgFrom

20
observe upregulation of Mef2d expression in these tumors (MS, S. Roscher, CS, unpublished
results), but we cannot rule out that expression of Mef2a or Mef2b is affected.
What is the mechanism behind the transforming capacity of Mef2c observed in the Ir8
deficient BM? Recent studies of both AML and ALL have shown that transcription factors
playing pivotal roles in differentiation are frequently deregulated in acute leukemia.40,41 We thus
hypothesize that upregulated Mef2c expression also contributes to the leukemogenic process by
deregulating the normal controls of myelomonocytic differentiation. This hypothesis is primarily
based on our recent findings showing that Mef2c is a critical modulator of monocytic
differentiation in response to external stimuli13 – in the absence of Mef2c, a reduction in
macrophage/monocytic progenitors is observed in the presence of various cytokines; whereas
ectopic Mef2c expression leads to increased levels of monopoiesis at the expense of
granulopoiesis. The ability of Mef2c to modulate monocytic differentiation is also observed in
the striking monocytic phenotype of the leukemia induced by enforced Mef2c expression in Irf8-
/- BM cells. In light of the fact that the Irf8-/- background is associated with increased
granulopoiesis and defective monopoiesis,8,42,43 this was clearly unexpected. It may be these
contradicting or incomplete signaling pathways, stipulating decisions between monocytic and
granulocytic differentiation, that lead to the observed block in myeloid differentiation in our
mouse model, and which is the hallmark of acute myelogenous leukemia. An important
downstream target of Mef2c for modulating monocytic differentiation is Jun,13 which has also
been identified as a critical target in the differentiation block observed in leukemic mice with
hypomorphic mutations affecting the PU.1 transcription factor.44 However, other genes that are
normally upregulated in activated macrophages were also shown to be upregulated in Mef2c+
transformed cells (see below), which may also be key to the aggressive nature of these tumors.
For personal use only. by guest on May 18, 2011. bloodjournal.hematologylibrary.orgFrom

21
Finally, it is important to note that high levels of Mef2c transcripts are found in the
hematopoietic stem cell compartment,3,13 and thus Mef2c may impart specific features found in
HSC to the LSC. Competitive repopulation assays have revealed a small but consistent
disadvantage to Mef2cΔ/- hematopoietic stem cells, which is at least partly attributable to their
reduced homing capacity of these cells (AE, MS, and CS, unpublished results). Although studies
by Krivtsov et al. suggested the importance of Mef2c in imparting "self-renewal," as
demonstrated in a single plating assay of MLL/AF9 transformed BM progenitors, our studies do
not support this hypothesis. – although we cannot rule out that this discrepancy is due to the
different transforming fusion proteins or perhaps different target cells.
How may Mef2c regulate homing and invasiveness?
Although functional Mef2c was found to be not necessary for either initiating or maintaining
MLL/ENL induced transformation, its expression did impact on the clinical symptoms (e.g.
increased dissemination to other organs) and disease latency of the leukemia. The earlier study
of Krivtsov et al. also observed an increased latency of leukemia induction by MLL/AF9 in the
absence of Mef2c (using siRNA technology).3 Although they predicted that Mef2c up-regulation
is necessary for establishment of MLL-induced LSC, our cumulative results suggest that a more
likely interpretation is that Mef2c expression modulates the clinical disease by impinging on
homing, motility, and invasive properties of the leukemic cells. This hypothesis is supported by
the highly aggressive and metastatic nature of the AML induced by Mef2c expression in Irf8-
deficient cells, but also by various in vitro assays and animal experiments demonstrating
impaired homing and motility of cells deficient for Mef2c. Homing and engraftment of
hematopoietic stem cells to the bone marrow and extramedullary tissue – and presumably also
For personal use only. by guest on May 18, 2011. bloodjournal.hematologylibrary.orgFrom

22
the homing and spread of LSCs – involves common mechanisms of adhesion, migration
signaling through cytokines and chemoattractants, and MMP activation.45-47 Whereas we
observed no difference in surface expression levels of CD44 on MLL/ENL transformed cells, we
consistently observed upregulated surface expression of CXCR4, the receptor for CXCL12
(SDF1α), in a subset of Mef2c+ cells, which was not observed in Mef2cΔ/- cells. However, this
regulation was not at the transcriptional level, as similar high levels of CXCR4 transcripts was
observed in Mef2c+/+ or Mef2cΔ/-, with or without enforced expression of Mef2c. Surface
expression levels of CXCR4 has been shown to be regulated by a number of different
mechanisms, including ubiquitination,48 cytokine stimulation,49,50 and by the formation of
heterodimers.48 Notably, both CCR2 and CCR5, which were down-regulated in the absence of
Mef2c, have been demonstrated to form dimers with CXCR4, leading to increased cell surface
expression and/or increased activity,51,52 suggesting a mechanism by which surface levels of
CXCR4 may be differentially regulated in cells expressing Mef2c.
We cannot rule out, however, the contribution of other Mef2c target genes. For instance,
the increased expression levels of several CC chemokines observed in our analysis may
contribute to the increased motility and invasiveness of the Mef2c+ tumors by either auto- or
paracrine mechanism by increasing chemotaxis, stimulating proliferation and/or survival, or
altering the stroma environment.53-55 Notably, increased levels of CCR2 and its ligands have
been observed in AML with a myelomonocytic or monocytic phenotype, and correlated with
increased extramedullary involvement.54 Furthermore, CCL3, 4, 6 and 9 are all highly expressed
in the MLL/ENL transformed cells, and also in activated macrophages, providing an additional
link between the leukemic phenotype and the importance of Mef2c during normal macrophage
differentiation. Similarly, our microarray analysis also revealed a number of MMPs that were
For personal use only. by guest on May 18, 2011. bloodjournal.hematologylibrary.orgFrom
23
upregulated in Mef2c+ cells, which have often been linked to tumor metastasis and leukemic
survival rates.56,57 In analogy to the highly related MMP10 gene, which has been shown to be
directly activated by Mef2 transcription factors,58 a conserved Mef2c-binding site within the first
intron of MMP8 suggests that it may also be targeted by Mef2c.
Implications for deregulated Mef2 transcription factors and human leukemia
Taken together, our study has clearly demonstrated the oncogenic role of Mef2c in acute
myeloid leukemia, which is most likely attributable to its important role in modulating myeloid
differentiation, but also regulating migration and homing of hematopoietic progenitors to the
bone marrow and spleen. Although high expression levels of MEF2C in AML patients samples
was limited to a few patient clusters, it is well established that Mef2c is tightly regulated at a
post-transcriptional level by a number of different mechanisms.14,59 This includes regulation by
the microRNA-223, a newly recognized target of AML1-ETO, the fusion product of the
relatively common t(8;21) AML.60 Thus deregulation of Mef2 proteins may be critically
involved in a wide range of acute leukemias.
Acknowledgments
We acknowledge all members of the Stocking laboratory for help in this study, with special
thanks to Ulla Bergholz, Arne Düsedau, Gundula Pilnitz-Stolze, Ulla Müller, Susanne Roscher,
Sylvia Wegerich, and Marion Ziegler for in valuable assistance in many of the experiments. We
also acknowledge the expert assistance of Daniel Bayer in the statistical analysis. Financial
support from the Deutsche José Carreras Leukämie Stiftung and the Japanese Human Science
Foundation (in collaboration with T. Hara) is gratefully acknowledged. The Heinrich-Pette-
For personal use only. by guest on May 18, 2011. bloodjournal.hematologylibrary.orgFrom

24
Institut is supported by the Freie und Hansestadt Hamburg and the Bundesministerium für
Gesundheit und soziale Sicherung.
Authorship
Contribution: M.S., A.S., M.F., and A.E. designed and performed the majority of the
experiments, analyzed data, and helped write the manuscript; R.D. and P.J.V. performed analysis
of AML patient material; M.A.A. and E.N.O. provided the Mef2c conditional mouse strain; J.L.
provided pathology and histology expertise; R.S. designed and performed experiments and
analyzed data; C.S. designed, performed, and supervised the research and wrote the manuscript.
The authors have no conflicts of interest to declare.
References
1. Passegue E, Weisman IL. Leukemic stem cells: where do they come from? Stem Cell Rev. 2005;1(3):181-188.
2. Warner J, Wang J, Hope K, Jin L, Dick JE. Concepts of human leukemic development. Oncogene.
2004;23(10):7164-7177.
3. Krivtsov A, Twomey D, Feng Z, et al. Transformation from committed progenitor to leukaemia stem cell
initiated by MLL-AF9. Nature. 2006;441(7104):818-822.
4. Cozzio A, Passegué E, Ayton P, Karsunky H, Cleary M, Weissman I. Similar MLL-associated leukemias
arising from self-renewing stem cells and short-lived myeloid progenitors. Genes Dev. 2003;17(24):3029-3035.
5. Wong P, Iwasaki M, Somervaille T, So C, Cleary ML. Meis1 is an essential and rate-limiting regulator of MLL
leukemia stem cell potential. Genes Dev. 2007;21(21):2762-2774.
6. Zeisig B, Milne T, Garcia-Cuellar M, et al. Hoxa9 and Meis1 are key targets for MLL-ENL-mediated cellular
immortalization. Mol Cell Biol. 2004;24(2):617-628.
7. Kumar A, Hudson W, Chen W, Nishiuchi R, Yao Q, Kesey J. Hoxa9 influences the phenotype but not the
incidence of MLL-AF9 fusion gene leukemia. Blood. 2004;103(5):1823-1828.
8. Holtschke T, Löhler J, Kanno Y, et al. Immunodeficiency and chronic myelogenous leukemia-like syndrome in
mice with a targeted mutation of the ICSBP gene. Cell. 1996;87(2):307-317.
9. Burchert A, Cai D, Hofbauer L, et al. Interferon consensus sequence binding protein (ICSBP; IRF8)
antagonizes BCR/ABL and down-regulates bcl-2. Blood. 2004;103(9):3480-3489.
For personal use only. by guest on May 18, 2011. bloodjournal.hematologylibrary.orgFrom

25
10. Schmidt M, Bies J, Tamura T, Ozato K, Wolff L. The interferon regulatory factor ICSBP/IRF-8 in combination
with PU.1 up-regulates expression of tumor suppressor p15(Ink4b) in murine myeloid cells. Blood.
2004;103(11):4142-4149.
11. Zhu C, Saberwal G, Lu Y, Platanias L, Eklund E. The interferon consensus sequence-binding protein activates
transcription of the gene encoding neurofibromin 1. J Biol Chem. 2004;279(49):50874-50885.
12. Potthoff M, Olson E. MEF2: a central regulator of diverse developmental programs. Development.
2007;134(23):4131-4140.
13. Schüler A, Schwieger M, Engelmann A, et al. The MADS transcription factor Mef2c is a pivotal modulator of
myeloid cell fate. Blood. 2008;111(9):4532-4541.
14. Johnnidis JB, Harris MH, Wheeler RT, et al. Regulation of progenitor cell proliferation and granulocyte
function by microRNA-223. Nature. 2008;451(7182):1125-1129.
15. Wilker PR, Kohyama M, Sandau MM, et al. Transcription factor Mef2c is required for B cell proliferation and
survival after antigen receptor stimulation. Nat Immunol. 2008;9(6):603-612.
16. Khiem D, Cyster J, Schwarz J, Black B. A p38 MAPK-MEF2C pathway regulates B-cell proliferation. Proc
Natl Acad Sci USA. 2008;105(44):17067-17072.
17. Gekas C, Rhodes K, Gereige L, et al. Mef2C is a lineage-restricted target of Scl/Tal1 and regulates
megakaryopoiesis and B-cell homeostasis. Blood. 2009;113(15):3461-3471.
18. Arnold M, Kim Y, Czubryt M, et al. MEF2C transcription factor controls chondrocyte hypertrophy and bone
development. Dev Cell. 2007;12(3):377-389.
19. Lin Q, Schwarz J, Bucana C, Olson E. Control of mouse cardiac morphogenesis, myogenesis by transcription
factor MEF2C. Science. 1997;276(5317):1404-1407.
20. Kuhn R, Schwenk F, Aguet M, Rajewsky K. Inducible gene targeting in mice. Science. 1995;269(5229):1427-
1429.
21. Schwieger M, Löhler J, Fischer M, Herwig U, Tenen D, Stocking C. A dominant-negative mutant of C/EBPα,
associated with acute myeloid leukemias, inhibits differentiation of myeloid and erythroid progenitors of man
but not mouse. Blood. 2004;103(7):2744-2752.
22. Rodenburg M, Fischer M, Engelmann A, et al. Importance of receptor usage, Fli1 activation, and mouse strain
for the stem cell specificity of 10A1 murine leukemia virus leukemogenicity. J Virol. 2007;81(2):732-742.
23. Schmidt M, Hoffmann G, Wissler M, et al. Detection and direct genomic sequencing of multiple rare unknown
flanking DNA in highly complex samples. Hum Gene Ther. 2001;12(7):743-749.
24. Schwieger M, Löhler J, Friel J, Scheller M, Horak I, Stocking C. AML1-ETO inhibits maturation of multiple
lymphohematopoietic lineages and induces myeloblast transformation in synergy with ICSBP deficiency. J Exp
Med. 2002;196(9):1227-1240.
25. Zeisig B, Garcia-Cuellar M, Winkler T, Slany R. The oncoprotein MLL-ENL disturbs hematopoietic lineage
determination and transforms a biphenotypic lymphoid/myeloid cell. Oncogene. 2003;22(11):1629-1637.
26. Kitamura T, Koshino Y, Shibata F, et al. Retrovirus-mediated gene transfer and expression cloning: powerful
tools in functional genomics. Exp Hematol. 2003;31(11):1007-1014.
For personal use only. by guest on May 18, 2011. bloodjournal.hematologylibrary.orgFrom

26
27. Cammenga J, Niebuhr B, Horn S, et al. RUNX1 DNA-binding mutants, associated with minimally
differentiated acute myeloid leukemia, disrupt myeloid differentiation. Cancer Res. 2007;67(2):537-545.
28. Lavau C, Szilvassy SJ, Slany R, Cleary ML. Immortalization and leukemic transformation of a
myelomonocytic precursor by retrovirally transduced HRX-ENL. EMBO J. 1997;16(14):4226-4237.
29. Lu J, McKinsey T, Zhang C, Olson E. Regulation of skeletal myogenesis by association of the MEF2
transcription factor with class II histone deacetylases. Mol Cell. 2000;6(2):233-244.
30. Valk P, Verhaak R, Beijen M, et al. Prognostically useful gene-expression profiles in acute myeloid leukemia.
N Engl J Med. 2004;350(16):1617-1628.
31. Oostendorp R, Ghaffari S, Eaves C. Kinetics of in vivo homing and recruitment into cycle of hematopoietic
cells are organ-specific but CD44-independent. Bone Marrow Transplant. 2000;26(5):559-566.
32. Li J, Shen H, Himmel KL, et al. Leukaemia disease genes: large-scale cloning and pathway predictions. Nat
Genet. 1999;23(3):348-353.
33. Hess JL, Bittner CB, Zeisig DT, et al. c-Myb is an essential downstream target for homeobox-mediated
transformation of hematopoietic cells. Blood. 2006;108(1):297-304.
34. Möhle R, Bautz F, Rafii S, Moore M, Brugger W, Kanz L. The chemokine receptor CXCR-4 is expressed on
CD34+ hematopoietic progenitors and leukemic cells and mediates transendothelial migration induced by
stromal cell-derived factor-1. Blood. 1998;91(12):4523-4530.
35. Broxmeyer H, Pelus L, Kim C, Hangoc G, Cooper S, Hromas R. Synergistic inhibition in vivo of bone marrow
myeloid progenitors by myelosuppressive chemokines and chemokine-accelerated recovery of progenitors after
treatment of mice with Ara-C. Exp Hematol. 2006;34(8):1069-1077.
36. Somerville R, Oblander S, Apte S. Matrix metalloproteinases: old dogs with new tricks. Genome Biology.
2003;4(6):216.
37. Turcotte K, Gauthier S, Tuite A, Mullick A, Malo D, Gros P. A mutation in the Icsbp1 gene causes
susceptibility to infection and a chronic myeloid leukemia-like syndrome in BXH-2 mice. J Exp Med.
2005;201(6):881–890.
38. Du Y, Spence SE, Jenkins NA, Copeland NG. Cooperating cancer-gene identification through oncogenic-
retrovirus-induced insertional mutagenesis. Blood. 2005;106(7):2498-2505.
39. Hara T, Schwieger M, Kazama R, et al. Acceleration of chronic myeloproliferation by enforced expression of
Meis1 or Meis3 in Icsbp-deficient bone marrow cells. Oncogene. 2008;27(27):3865-3869.
40. Mullighan C, Goorha S, Radtke I, et al. Genome-wide analysis of genetic alterations in acute lymphoblastic
leukaemia. Nature. 2007;446(7137):758-764.
41. Rosenbauer F, Koschmieder S, Steidl U, Tenen DG. Effect of transcription-factor concentrations on leukemic
stem cells. Blood. 2005;106(5):1519-1524.
42. Scheller M, Foerster J, Heyworth C, et al. Altered development and cytokine responses of myeloid progenitors
in the absence of transcription factor, interferon consensus sequence binding protein. Blood. 1999;94(11):3764-
3771.
For personal use only. by guest on May 18, 2011. bloodjournal.hematologylibrary.orgFrom

27
43. Tsujimura H, Nagamura-Inoue T, Tamura T, Ozato K. IFN consensus sequence binding protein/IFN regulatory
factor-8 guides bone marrow progenitor cells toward the macrophage lineage. J Immunol. 2002;169(3):1261-
1269.
44. Steidl U, Rosenbauer F, Verhaak RG, et al. Essential role of Jun family transcription factors in PU.1
knockdown-induced leukemic stem cells. Nat Genet. 2006;38(11):1269-1277.
45. Lapidot T, Dar A, Kollet O. How do stem cells find their way home? Blood. 2005;106(6):1901-1910.
46. Jin L, Hope KJ, Zhai Q, Smadja-Joffe F, Dick JE. Targeting of CD44 eradicates human acute myeloid leukemic
stem cells. Nat Med. 2006;12(10):1167-1174.
47. Krause D, Lazarides K, von Andrian U, Van Etten R. Requirement for CD44 in homing an engraftment of
BCR-ABL --expressing leukemic stem cells. Nat Med. 2006;12(10):1175-1180.
48. Busillo J, Benovic J. Regulation of CXCR4 signaling. Biochim Biophys Acta. 2006;1768(4):952-963.
49. Brühl H, Cohen C, Linder S, Kretzler M, Schlöndorff D, Mack M. Post-translational and cell type-specific
regulation of CXCR4 expression by cytokines. Eur J Immunol. 2003;33(11):3028-3037.
50. Kim H, De La Luz Sierra M, Williams C, Gulino A, Tosato G. G-CSF down-regulation of CXCR4 expression
identified as a mechanism for mobilization of myeloid cells. Blood. 2006;108(812-820.
51. Issafras H, Angers S, Bulenger S, et al. Constitutive agonist-independent CCR5 oligomerization and antibody-
mediated clustering occurring at physiological levels of receptors. J Biol Chem. 2002;277(38):34666-34673.
52. Wang J, Alvarez R, Roderiquez G, Guan E, Norcross M. Constitutive association of cell surface CCR5 and
CXCR4 in the presence of CD4. J Cell Biochem. 2004;93(4):753-760.
53. Kulbe H, Levinson NR, Balkwill F, Wilson JL. The chemokine network in cancer - much more than directing
cell movement. Int J Dev Biol. 2004;48(5-6):489-496.
54. Cignetti A, Vallario A, Roato I, et al. The characterization of chemokine production and chemokine receptor
expression reveals possible functional cross-talks in AML blasts with monocytic differentiation. Exp Hematol.
2003;31(6):495-503.
55. Yi F, Jaffe R, Prochownik E. The CCL6 chemokine is differentiatlly regulated by c-Myc and L-Myc, and
promotes tumorigenesis and metstasis. Cancer Res. 2003;63(11):2923-2932.
56. de Visser K, Eichten A, Coussens L. Paradoxical roles of the immune system during cancer development. Nat
Rev Cancer. 2006;6(1):24-37.
57. Stefanidakis M, Koivunen E. Cell-surface association between matrix mealloproteinases and integrins: role of
the complexes in leukocyte migration and cancer progresssion. Blood. 2006;108(5):1441-1450.
58. Chang S, Young B, Li S, Qi X, Richardson J, Olson E. Histone deacetylase 7 maintains vascular integrity be
repressing matrix metalloproteinase 10. Cell. 2006;126(2):321-334.
59. McKinsey T, Zhang C, Olson E. MEF2: a calcium-dependent regulator of cell division, differentiation and
death. Trends Biochem Sci. 2002;27(1):40-47.
60. Fazi F, Racanicchi S, Zardo G, et al. Epigenetic silencing of the myelopoiesis regulator microRNA-223 by the
AML1/ETO oncoprotein. Cancer Cell. 2007;12(5):457-466.
For personal use only. by guest on May 18, 2011. bloodjournal.hematologylibrary.orgFrom
28
Figure Legends
Figure 1. Identification of Mef2c as a common integration site in MuLV-induced myeloid tumors of
Irf8-/- mice.
(A) Kaplan-Meier survival curves of Irf8-/- (n = 47) or Irf8+/+ (n = 28) B6 mice infected with Mo-MuLV.
The log-rank test for comparison of cumulative incidence curves confirmed a significant (p < 0.001)
increase in disease latency in the Irf8-deficient background. The mean survival was 125 ± 6 (± s.e.) and
184 ± 15 days, respectively.
(B) Cloning and analysis of sequences flanking retroviral integration sites revealed integrations upstream
of the first coding exon of Mef2c, in both 5' and 3' orientation to the gene, as indicated. Southern blot
analysis of HindIII digested genomic DNA isolated from myeloid tumors originating from MuLV-
infected Irf8-/- mice confirmed disruption of the Mef2c locus, as indicated by arrows.
(C) Tumor samples with Mef2c integrations have high levels of Mef2c transcripts. The mean levels of
Mef2c transcripts in different tumors (IC) relative to the level in heart tissue were determined by
quantitative RT-PCR in two independent experiments performed in duplicate. Sequence analysis of RT-
PCR fragments demonstrated coding sequences for both α1 and α1-β-γ isoforms in normal BM and
tumors, the former being the more prominent form.
Figure 2. Ectopic expression of Mef2c into Irf8-/- BM progenitors induces acute myelomonocytic
leukemia in recipient mice
(A) Kaplan-Meier survival curves of mice receiving Irf8-/- BM cells after infection with retroviral vectors
carrying Mef2c/GFP or GFP alone, or uninfected controls, are shown.
(B) Blood smear of moribund mouse receiving Mef2c-Irf-/- BM cells shows leukocytosis composed
predominately of immature blast-like monocytic and granulocytic cells. The heterochromatic erythrocytes
reflect a moderate anemia, confirmed by hematocrit values between 27 and 42 (normal values 42 to 48).
Pappenheim stain.
For personal use only. by guest on May 18, 2011. bloodjournal.hematologylibrary.orgFrom

29
(C and D) Cytospin of BM cells from mice transplanted with either Mef2c/GFP (C) or GFP (D) Irf8-/-
BM. The accumulation of blast-like cells and immature monocytes is observed in BM with ectopic Mef2c
expression, in contrast to controls, which show the typical increase in granulopoiesis and immature
erythropoiesis characteristic of Irf8-/- mice. In addition to juvenile forms, mature banded granulocytes are
the prominent form. Pappenheim stain.
(E and F) Sternal BM of mouse transplanted with Mef2c-Irf8-/- BM showing considerable hypercellularity
associated with left-shifted mono- and granulocytosis and reduced numbers of erythroid cells. The
sinusoidal vascular system is compressed and obscured and an eruption of leukemic cells through the
nutrient foramina, which normally allows vascularization of the bone marrow cavity, is observed –
leading to the invasion of leukemic BM cells into the neighboring thoracical musculature (upper half of
microphotograph). Higher magnification clearly shows myeloid blast and immature forms of the invasive
cells and the numerous phagocytic cells with an eosinophilic storage phenomenon in their cytoplasm. H &
E stain.
(G – I) Splenic sections of mice receiving either Mef2c (G,I) or control GFP (H) Irf8-/- BM. The regular
splenic architecture observed in control mice (H) is completely effaced in Mef2c mice due to the myeloid
hyperplasia of the red pulp. As in the BM, an abundance of pseudo pseudo-Gaucher cells with
intracellular accumulation of para-crystalline substance at different stages of development can be
observed. Large storage cells showing hemophagocytosis are also present (I). Pockets of erythroid cells
are observed, which compensates for the loss of erythropoiesis in the BM. H & E stain.
(J and K) The highly invasive behavior of the leukemic cells is evidenced by infiltration into non-
hematopoietic tissue. (J) Similar to the spleen, the normal liver lobular architecture is completely
destroyed and periportal and perivenous liver parenchyma is replaced by infiltrating leukemic myeloblasts
and immature forms, as well as phagocytic histocytes. H & E stain. (K). Pulmonary infiltration with
hematopoietic cells was observed in all animals analyzed. Focal peribronchial and perivascular
accumulation of immature myeloid and phagocytic histocytes is seen, as well as the diffuse thickening of
the avelolar septa by leukemic infiltration. H & E stain.
For personal use only. by guest on May 18, 2011. bloodjournal.hematologylibrary.orgFrom

30
(L) Flow cytometirc analysis of cells isolated from BM and PB from Mef2C and control GFP transduced
mice. Expression analysis of CD11b, Gr1, and F4/80 confirm the prominent monocytic component of the
AML induced by Mef2c. Only GFP-positive cells are shown. The results are representative of all mice
analyzed.
Figure 3. High levels of MEF2C gene expression found in clusters of AML patients with high
incidence of MLL. Shown are pair-wise correlations of gene expression profiles between AML patients
calculated by OmiViz software (version 3.6; Maynard, MA) and viewed by HeatMapper, as previously
described.30 The cells in the visualization are colored by Pearson correlation coefficient values, with
deeper colors indicating higher positive (red) or negative (blue) correlations. Histograms next to each
tumor represent expression levels for the IRF8 or MEF2C probe sets (bars are proportional to the level of
expression). Six of 16 clusters identified in the cohort of 285 AML patients on the basis of the
unsupervised clustering results and other parameters, such as clinical and molecular characteristics of the
AML patients, are indicated.30 These correspond to clusters with a high incidence of t(11q23) (percentage
is indicated), FAB classifications for myelomonocytic (M4) or monocytic (M5) AML, or aberrant high
EVI1 expression. The bar diagram shows the mean expression levels (±s.e.) of MEF2C for patient
samples with known MLL gene rearrangements (MLL) are compared with all other patiient samples
(other), or with that in the patients samples within the indicated clusters. Patient numbers are indicated.
P-values were determined by the Student`s t-test; **, p<0.0001; *, p =0.02 as compared to patients with
11q23 (MLL) disruptions.
Figure 4. Mef2c is not necessary for MLL/ENL-induced transformation or maintenance in culture,
but for homing and/or spread of the MLL/ENL leukemic cells in vivo.
(A) Establishment of transformed cell lines with MLL/ENL is not impaired after deletion of the floxed
Mef2c allele by CRE recombinase. Results show the mean colony number (±s.d.) of serially replated
cultures seeded with 2 x 10⁴ cells in methylcellulose each week. The first plating was done immediately
For personal use only. by guest on May 18, 2011. bloodjournal.hematologylibrary.orgFrom

31
after MLL/ENL transduction, so that variation in the colony numbers reflects also infection efficiencies.
Similarly results were obtained for two independent M/E cell lines.
(B) Inactivation of Mef2c in MLL/ENL transformed Mef2cfl/- cells did not alter their morphology
(Pappenheim stain) or gross immunophenotype, as assessed by FACS analysis.
(C) Survival curves of NOD/scid mice injected i.p. with 106 M/E cells with indicated genotype and
infected with a CRE vector. Mice were sacrificed when large tumors in abdominal cavity were clearly
visible.
(D) Spleen weights of animals receiving M/E cells with the indicated genetic background. Vertical line
indicates median value. P-value was calculated by the Student's t-test.
Figure 5. Mef2c is not required for in the induction of leukemia in vivo
(A) Kaplan-Meier survival curves of B6 mice receiving BM from mice with indicated genotype after
transduction with retroviral vectors coexpressing MLL/ENL and GFP. The log-rank test for comparison
of cumulative incidence curves confirmed a significant (p < 0.008) increase in disease latency in mice
receiving Mef2 deficient BM.
(B) Survival curves of B6 mice receiving 5x10⁶ tumor cells (i.v.) from one of three independent mice (for
each genotype) from experiment shown in Panel A. The log-rank test for comparison of cumulative
incidence curves confirmed a significant (p < 0.001) increase in disease latency in mice retransplaned
with Mef2 deficient tumors.
(C) Cytospin of BM cells from mice transplanted with MLL/ENL infected Mef2cΔ/- BM (5% efficiency)
and sacrificed 50 days later. An accumulation of blast-like cells and immature myeloid forms is clearly
seen. Pappenheim stain.
(D) Flow cytometric analysis of cells isolated from BM of mice 50 days after receiving BM (with the
indicated genotype) infected with MLL/ENL vector (5% efficiency). High proportion of GFP+ cells was
observed in all mice. Each symbol in the dot diagram to the right represents an independent mouse.
Horizontal line indicates median value. P-value was calculated by the Student's t-test. Gating on the
For personal use only. by guest on May 18, 2011. bloodjournal.hematologylibrary.orgFrom

32
GFP+ population of the BM (lower panels) demonstrates that the MLL/ENL/GFP+ cells are
CD11b+Gr1neg /lo.
(E) Dot diagram showing the spleen weights of mice analyzed 50 days after BM transplantation.
Horizontal line indicates median value. P-value was calculated by the Student's t-test.
(F) Splenic section of mice receiving Mef2cΔ/- BM infected with MLL/ENL vectors. The regular splenic
architecture is completely effaced in mice receiving MLL/ENL-infected BM due to the myeloid
hyperplasia of the red pulp. Pockets of erythroid cells are observed, which compensates for the loss of
erythropoiesis in the BM. H+E stain.
(G) Flow cytometric analysis of cells isolated from spleens of mice 50 days after receiving BM (with the
indicated genotype) infected with MLL/ENL vector (5% efficiency). A higher proportion of GFP+ cells
was observed in mice receiving Mef2c+/+ BM as compared to Mef2cΔ/- BM. Each symbol in the dot
diagram to the right represents an independent mouse. P-value was calculated by the Student's t-test.
Gating on the GFP population of the BM (lower panels) demonstrates that the MLL/ENL/GFP+ cells are
CD11b+Gr1neg /lo.
(H) The highly invasive behavior of the MLL/ENL Mef2c+/+ leukemic cells is evidenced by infiltration
into the liver. The normal liver lobular architecture is completely destroyed and periportal and perivenous
liver parenchyma is replaced by infiltrating leukemic myeloblasts and immature forms (upper panel). In
contrast, invading cells are limited to periportal regions in mice receiving MLL/ENL Mef2cΔ/- BM. H+E
staining.
(I) Leukocyte counts of mice 50 days after receiving BM (with the indicated genotype) infected with
MLL/ENL vector (5% efficiency).
(J) Blood smears of mice receiving MLL/ENL Mef2c+/+ (upper panel) or Mef2cΔ/- BM (lower panel). The
leukocytosis is predominantly composed of immature blast-like monocytic and granulocytic cells.
Pappenheim stain.
For personal use only. by guest on May 18, 2011. bloodjournal.hematologylibrary.orgFrom

33
Figure 6. Mef2c deficient cells proliferate in vivo but show reduced homing and motility
(A) Percentage of BrdU incorporation after a two-hour pulse in MLL/ENL-YFP-infected Mef2cΔ/-
MxCRE or Mef2c+/+ MxCRE BM cells transplanted into irradiated mice. Each square represents an
independent mouse receiving BM with the indicated phenotype. Cells were sorted for YFP expression
(19 – 34% of total BM) before staining for BrdU.
(B) BM cells from Mef2cΔ/- MxCRE or Mef2c+/+ MxCRE mice (treated with polyIC) were labeled in vitro
with CFSE and then injected via the tail vein into lethally irradiated syngeneic recipient mice. Shown is
the relative mean proportion (±s.e.) of dye positive cells from BM or spleen isolated 4h after
transplantation from 4 mice from two independent experiments. An average of 68±9.5 and 78±32 CFSE+
Mef2c+/+ cells per 105 total spleen or bone marrow cells, respectively, were detected.
(C) Visualization of MS-5 stroma cell cultures 24h after 106 M/E Mef2c+/+ or Mef2cΔ/- cells were seeded
onto monolayer. Cells transcending the monolayer are clearly seen as phase-dark cells (indicated by
arrows). White translucent cells are above the stroma layer. Experiment was repeated three times with
identical results.
(D) Migration studies were compared between M/E cells in culture in which Mef2c was either deleted (by
infection with CRE vector) or in which Mef2c was reintroduced with a Mef2c vector. Migration index
was calculated 3-5h after cells from freshly infected and selected cultures were seeded into the upper well
of a Transwell with SDF1α in the bottom chamber. Shown is the mean (±s.e.) of two independent
experiments, each performed in duplicate. P-values were calculated by the Student's t-test for each pair.
(E) Migration index of M/E cells deficient for Mef2c that were either infected with an empty (pac) vector
or a vector expressing the HDAC-biding mutant Mef2cASR. Migration index was calculated 3-5h after
cells from freshly infected and selected cultures were seeded into the upper well of a Transwell with
either PBS or SDF1α in the bottom chamber, as indicated. Shown is the mean (±s.e.) of two independent
experiments, each performed in duplicate. P-values were calculated by the Student's t-test for each pair.
For personal use only. by guest on May 18, 2011. bloodjournal.hematologylibrary.orgFrom

34
(F) Survival curves of mice receiving MLL/ENL transduced Mef2fl/fl BM, half of which received pIpC
injections at the indicated times.
(G) Verification of complete excision of the Mef2c floxed alleles after pIpC injection, PCR analysis was
performed on DNA isolated from BM cells of diseased mice (3 from each cohort). Primers were designed
to detect either the floxed (fl) or wild-type (wt) allele. Faint wt alleles can be detected in all animals, due
to residual host cells. Tail DNA from different genotypes was used as positive controls.
Figure 7. Mef2c expression in MLL/ENL Mef2cΔ/- transformed cells results in increased expression
of several genes implicated in homing and invasive growth.
(A) FACS analysis detected increase levels of CXCR4 expression on a subset of M/E cells of the
indicated genotype immediately after recloning in methylcellulose cultures, which enriches for clonogenic
or engrafting cells. Shown is one representative experiment of three.
(B-D) Microarray analysis was performed on RNA isolated from M/E Mef2cΔ/- cells infected with
Mef2cASR/pac or pac vectors and subjected to puromycin selection. The relative expression levels (±s.d.)
of the indicated gene for cultures expressing either Mef2cASR/pac (grey bars) or pac (black bars) vectors
are indicated. For some genes (marked with a Q), the results shown are that from quantitative RT-PCR,
which in all cases confirmed the results obtained from the microarray. Results are shown for only genes
that showed signals >4-fold above background. (B) Several chemokine receptors are upregulated in
Mef2c+ cultures. Asteriks denote genes with mean signal intensities greater than 50-fold over
background. (C) Several chemokines are highly expressed in MLL/ENL cultures and show upregulation
in Mef2c+ cultures. Asteriks denote genes with mean signal intensities greater than 100-fold above
background. (D) The expression of several MMP genes is upregulated in Mef2c+ cultures. Asteriks
denote genes with mean signal intensities greater that 20-fold above background.
For personal use only. by guest on May 18, 2011. bloodjournal.hematologylibrary.orgFrom

Figure 1 – Schwieger et al.
heartKM Lin-
IC 50IC397
IC 402IC406
IC409IC425
Mef
2c m
RN
A in
arb
itrar
y un
its
0
1
2
3
4
5
6
7
spleenIC 394
IC395IC396
IC402IC404
IC407IC408
IC19IC50
IC54IC63
6.6 kb
9.6 kb
A
B
C
Time (days)0 50 100 150 200 250 300 350
Cum
mul
ativ
e Su
rviv
al
0,0
0,2
0,4
0,6
0,8
1,0Irf8 -/-
Irf8+/+
p<.001
For personal use only. by guest on May 18, 2011. bloodjournal.hematologylibrary.orgFrom

A
C
F
I
D
G
J
E
H
K
PB
BM
L
n=29
n=14
n=7
Mef2C GFP Mef2C GFP
CD
11b
Gr-1 F4/80
Figure 2 – Schwieger et al.
B
For personal use only. by guest on May 18, 2011. bloodjournal.hematologylibrary.orgFrom

Figure 3 – Schwieger et al.
MEF2CMEF2C
cluster 5:FAB M5/M4
cluster 16:t(11q23) – >45%FAB M5/M4
cluster 1:t(11q23) – > 43%FAB M1/M5
IRF8
clusters 9:inv(16)FAB M4/M5
AML patients
AM
L patients
clusters 10:EVI1 (45%) FAB M1/M5
clusters
0
100
200
300
400
500
600
700
800
11q23 other #5 #9 #10
Aver
age
MEF
2C E
xpre
ssio
n
****
***n=22
n=14
n=40n=245
n=13
For personal use only. by guest on May 18, 2011. bloodjournal.hematologylibrary.orgFrom

Days0 20 40 60 80 100 120 140
Sur
viva
l
0,0
0,2
0,4
0,6
0,8
1,0
Mef2c+/+
Mef2cΔ/−
num
ber o
f col
onie
s / 2
x 1
04 cel
ls
0
200
400
600
800
1000
Mef2cΔ/- Mef2c+/+
M/E-Mef2c Δ/−M/E-Mef2c +/+
CD
11b
Gr-1
B M/E-Mef2c Δ/-
AFigure 4 – Schwieger et al.
1st 2nd 3rd 4thplating
C
Spl
een
wei
ght (
mg)
0
100
200
300
400
500
600 p<.001
Mef2c+/+Mef2cΔ/-
D
For personal use only. by guest on May 18, 2011. bloodjournal.hematologylibrary.orgFrom

Leuk
ocyt
e co
unt (
10 p
er m
l)
25
50
75
100
125
150
175
Mef2c+/+ Mef2cΔ/-
6
Pro
porti
on G
FP in
BM
0,2
0,4
0,6
0,8
1,0
Mef2c+/+Mef2cΔ/-
p=0.45
Figure 5 – Schwieger et al.
C
Spl
een
wei
ght (
mg)
100200300400500600700800 p<.05
Mef2c+/+Mef2cΔ/-
E G
Mef2c+/+
Mef2cΔ/-
p=.011
IH
Days0 10 20 30 40 50 60
Sur
viva
l
0,0
0,2
0,4
0,6
0,8
1,0
Mef2c+/+
Mef2cΔ/−
D
p =.001
Days0 20 40 60 80 100 120 140
Sur
viva
l
0,0
0,2
0,4
0,6
0,8
1,0
Mef2c+/+
Mef2cΔ/−
A B
p =.008
Pro
porti
on G
FP in
spl
een
0,2
0,4
0,6
0,8
1,0
Mef2c+/+Mef2cΔ/-
p<.001
Mef2cΔ/-Mef2c+/+
CD
11b
Gr-1
GFP
FSC-A
91%84%C
D11
b
Gr-1
Mef2cΔ/-Mef2c+/+
GFP
FSC-A
70% 47%F
J
For personal use only. by guest on May 18, 2011. bloodjournal.hematologylibrary.orgFrom

Days0 10 20 30 40 50 60 70 80
Sur
viva
l
0,0
0,2
0,4
0,6
0,8
1,0
Mef2cfl/f
Mef2cfl/fl + pIpC
pIpC
0,00
0,25
0,50
0,75
1,00
1,25
1,50M
igra
tion
Inde
x
+Mef2c
+pac
+CRE
+CRE
M/E-Mef2c
p<.01
p<.05
+/+ fl/- Δ/- Δ/-
0,00
0,25
0,50
0,75
1,00
1,25
1,50
1,75
2,00
Mig
ratio
n In
dex
Rel
ativ
e pr
opor
tion
of C
FSE
+ ce
lls
0,0
0,5
1,0 Mef2c+/+
Mef2cΔ/-
% B
rdU
inco
rpor
atio
n
5101520253035404550
Mef2c+/+ Mef2cΔ/-
Figure 6 – Schwieger et al.
Bp=.66
BM spleen
M/E-Mef2c +/+
M/E-Mef2c Δ/−
D
F
flwt
#1 #2 #3 #11 #13 #14 -/fl fl/wt-/fl
-/wt
M/E-Mef2cfl/fl BM+pIpC no pIpC controls
#1 #2 #3 #11 #13 #14 -/fl fl/wt-/fl
-/wt
M/E-Mef2cfl/fl BM+pIpC no pIpC controls
#1 #2 #3 #11 #13 #14 -/fl fl/wt-/fl
-/wt
M/E-Mef2cfl/fl BM+pIpC no pIpC controls
G
A
C
+Mef2c ASR
+pac
+PBS+SDF1α
+Mef2c ASR
+pac
Ep<0.03
p=0.71
+SDF1α
For personal use only. by guest on May 18, 2011. bloodjournal.hematologylibrary.orgFrom

Figure 7 – Schwieger et al.
A0,8%15%
CD
44
CXCR4
M/E-Mef2c +/+ M/E-Mef2c Δ/− B
CXCR4* CCR2* CCR5
Rel
ativ
e ex
pres
sion
leve
ls
0
1
2
3
CCL2 CCL3* CCL4* CCL6* CCL9* CCL25*
Rel
ativ
e ex
pres
sion
leve
ls
0
1
2
3
4
5
Mmp8* Mmp9* Mmp12 Mmp23 Mmp25
Rel
ativ
e ex
pres
sion
leve
ls
0
1
2
3
4
5
C D (Q) (Q) (Q)
(Q)(Q) (Q)(Q)
For personal use only. by guest on May 18, 2011. bloodjournal.hematologylibrary.orgFrom
Copyright © 2022 FDOKUMEN