Multicenter Study of Acetaminophen Hepatotoxicity Reveals the Importance of Biological Endpoints in...
12
TOXICOLOGICAL SCIENCES 99(1), 326–337 (2007) doi:10.1093/toxsci/kfm150 Advance Access publication June 11, 2007 Multicenter Study of Acetaminophen Hepatotoxicity Reveals the Importance of Biological Endpoints in Genomic Analyses Richard P. Beyer,* ,1 Rebecca C. Fry,† ,1 Michael R. Lasarev,‡ ,1 Lisa A. McConnachie,* ,1 Lisiane B. Meira,† ,1 Valerie S. Palmer,‡ ,1 Christine L. Powell,§ ,1 Pamela K. Ross,§ ,1 Theo K. Bammler,* Blair U. Bradford,§ Alex B. Cranson,‡ Michael L. Cunningham, { Rickie D. Fannin, { Gregory M. Higgins,‡ Patrick Hurban,k Robert J. Kayton,‡ Kathleen F. Kerr,* Oksana Kosyk,§ Edward K. Lobenhofer,k Stella O. Sieber, { Portia A. Vliet,* Brenda K. Weis, { Russel Wolfinger,kj Courtney G. Woods,§ Jonathan H. Freedman,kk ,2 Elwood Linney,kk ,2 William K. Kaufmann,§ ,2 Terrance J. Kavanagh,* ,2 Richard S. Paules, {,2 Ivan Rusyn,§ ,2,3 Leona D. Samson,† ,2 Peter S. Spencer,‡ ,2 William Suk, {,2 Raymond J. Tennant, {,2 Helmut Zarbl, #,2 and Members of the Toxicogenomics Research Consortium *University of Washington, Seattle, Washington 98195; †Massachusetts Institute of Technology, Cambridge, Massachusetts 02139; ‡Oregon Health & Science University, Portland, Oregon 97239;§University of North Carolina, Chapel Hill, North Carolina 27599; { National Institute of Environmental Health Sciences, Research Triangle Park, North Carolina 27709; kCogenics, a Division of Clinical Data, Inc., Morrisville, North Carolina 27560; kjSAS Institute, Inc., Cary, North Carolina 27513; kkDuke University Medical Center, Durham, North Carolina 27710; and # Fred Hutchinson Cancer Research Center, Seattle, Washington 98109 Received April 19, 2007; accepted June 5, 2007 Gene expression profiling is a widely used technique with data from the majority of published microarray studies being publicly available. These data are being used for meta-analyses and in silico discovery; however, the comparability of toxicogenomic data generated in multiple laboratories has not been critically evaluated. Using the power of prospective multilaboratory investigations, seven centers individually conducted a common toxicogenomics experiment designed to advance understanding of molecular pathways perturbed in liver by an acute toxic dose of N-acetyl-p-aminophenol (APAP) and to uncover reproducible genomic signatures of APAP-induced toxicity. The nonhepato- toxic APAP isomer N-acetyl-m-aminophenol was used to identify gene expression changes unique to APAP. Our data show that c-Myc is induced by APAP and that c-Myc–centered interactomes are the most significant networks of proteins associated with liver injury. Furthermore, sources of error and data variability among Centers and methods to accommodate this variability were identified by coupling gene expression with extensive toxicological evaluation of the toxic responses. We show that phenotypic anchoring of gene expression data is required for biologically meaningful analysis of toxicogenomic experiments. Key Words: liver injury; toxicogenomics; phenotypic anchoring. The biology of liver and other tissues in normal and disease states increasingly is being probed using global approaches such as microarray transcriptional profiling. Acceptance of this technology is based principally on a satisfactory level of reproducibility of data among laboratories and across platforms (Bammler et al., 2005; Shi et al., 2006). Achieving reasonable concordance in expression data among laboratories requires standardized protocols for RNA labeling, hybridization, microarray process- ing, data acquisition, and normalization (Bammler et al., 2005). The majority of standardization efforts have focused on (1) comparing gene expression data from the analysis of reference samples distributed among several laboratories (Bammler et al., 2005; Pennie et al., 2004), or (2) developing guidelines for documenting experimental details and results when publishing microarray data (Ball et al., 2002). The issue of reproducibility and reliability of genomics data obtained from similar (standardized) biological experiments performed in different laboratories is crucial to the generation and utility of large databases of microarray results (Becker, 2001; Miles, 2001). While several recent studies uncovered important lim- itations of expression profiling of chemical injury to cells and tissues (Baker et al., 2004; Beekman et al., 2006; Ulrich et al., 2004), determining the effects of intralaboratory variables on the reproducibility, validity, and general applicability of the re- sults that are generated by different laboratories and deposited into publicly available databases remains a gap. The National Institute of Environmental Health Sciences (NIEHS) established the Toxicogenomics Research Consor- tium to apply the collective and specialized expertise from academic institutions to address issues in integrating gene expression profiling, bioinformatics, and general toxicology. Key elements include developing standardized practices for 1 Equally contributing first author. 2 Equally contributing senior author. 3 To whom correspondence should be addressed at Department of Environmental Sciences and Engineering, School of Public Health, University of North Carolina at Chapel Hill, CB #7431, Chapel Hill, NC 27599. Fax: (919) 843-2596. E-mail: [email protected]. Ó The Author 2007. Published by Oxford University Press on behalf of the Society of Toxicology. All rights reserved. For Permissions, please email: [email protected] by guest on July 3, 2014 http://toxsci.oxfordjournals.org/ Downloaded from
Transcript of Multicenter Study of Acetaminophen Hepatotoxicity Reveals the Importance of Biological Endpoints in...

TOXICOLOGICAL SCIENCES 99(1), 326–337 (2007)
doi:10.1093/toxsci/kfm150
Advance Access publication June 11, 2007
Multicenter Study of Acetaminophen Hepatotoxicity Reveals theImportance of Biological Endpoints in Genomic Analyses
Richard P. Beyer,*,1 Rebecca C. Fry,†,1 Michael R. Lasarev,‡,1 Lisa A. McConnachie,*,1 Lisiane B. Meira,†,1
Valerie S. Palmer,‡,1 Christine L. Powell,§,1 Pamela K. Ross,§,1 Theo K. Bammler,* Blair U. Bradford,§ Alex B. Cranson,‡Michael L. Cunningham,{ Rickie D. Fannin,{ Gregory M. Higgins,‡ Patrick Hurban,k Robert J. Kayton,‡
Kathleen F. Kerr,* Oksana Kosyk,§ Edward K. Lobenhofer,k Stella O. Sieber,{ Portia A. Vliet,* Brenda K. Weis,{
Russel Wolfinger,kj Courtney G. Woods,§ Jonathan H. Freedman,kk,2 Elwood Linney,kk,2 William K. Kaufmann,§,2
Terrance J. Kavanagh,*,2 Richard S. Paules,{,2 Ivan Rusyn,§,2,3 Leona D. Samson,†,2 Peter S. Spencer,‡,2 William Suk,{,2
Raymond J. Tennant,{,2 Helmut Zarbl,#,2 and Members of the Toxicogenomics Research Consortium
*University of Washington, Seattle, Washington 98195; †Massachusetts Institute of Technology, Cambridge, Massachusetts 02139;
‡Oregon Health & Science University, Portland, Oregon 97239; §University of North Carolina, Chapel Hill, North Carolina 27599;{National Institute of Environmental Health Sciences, Research Triangle Park, North Carolina 27709; kCogenics, a Division of Clinical Data, Inc.,
Morrisville, North Carolina 27560; kjSAS Institute, Inc., Cary, North Carolina 27513; kkDuke University Medical Center, Durham, North Carolina 27710;
and #Fred Hutchinson Cancer Research Center, Seattle, Washington 98109
Received April 19, 2007; accepted June 5, 2007
Gene expression profiling is a widely used technique with data
from the majority of published microarray studies being publicly
available. These data are being used for meta-analyses and
in silico discovery; however, the comparability of toxicogenomic
data generated in multiple laboratories has not been critically
evaluated. Using the power of prospective multilaboratory
investigations, seven centers individually conducted a common
toxicogenomics experiment designed to advance understanding of
molecular pathways perturbed in liver by an acute toxic dose of
N-acetyl-p-aminophenol (APAP) and to uncover reproducible
genomic signatures of APAP-induced toxicity. The nonhepato-
toxic APAP isomer N-acetyl-m-aminophenol was used to identify
gene expression changes unique to APAP. Our data show that
c-Myc is induced by APAP and that c-Myc–centered interactomes
are the most significant networks of proteins associated with liver
injury. Furthermore, sources of error and data variability among
Centers and methods to accommodate this variability were
identified by coupling gene expression with extensive toxicological
evaluation of the toxic responses. We show that phenotypic
anchoring of gene expression data is required for biologically
meaningful analysis of toxicogenomic experiments.
Key Words: liver injury; toxicogenomics; phenotypic anchoring.
The biology of liver and other tissues in normal and disease
states increasingly is being probed using global approaches such as
microarray transcriptional profiling. Acceptance of this technology
is based principally on a satisfactory level of reproducibility of
data among laboratories and across platforms (Bammler et al.,2005; Shi et al., 2006). Achieving reasonable concordance in
expression data among laboratories requires standardized
protocols for RNA labeling, hybridization, microarray process-
ing, data acquisition, and normalization (Bammler et al., 2005).
The majority of standardization efforts have focused on
(1) comparing gene expression data from the analysis of
reference samples distributed among several laboratories
(Bammler et al., 2005; Pennie et al., 2004), or (2) developing
guidelines for documenting experimental details and results
when publishing microarray data (Ball et al., 2002). The issue
of reproducibility and reliability of genomics data obtained
from similar (standardized) biological experiments performed
in different laboratories is crucial to the generation and utility
of large databases of microarray results (Becker, 2001; Miles,
2001). While several recent studies uncovered important lim-
itations of expression profiling of chemical injury to cells and
tissues (Baker et al., 2004; Beekman et al., 2006; Ulrich et al.,2004), determining the effects of intralaboratory variables on
the reproducibility, validity, and general applicability of the re-
sults that are generated by different laboratories and deposited
into publicly available databases remains a gap.
The National Institute of Environmental Health Sciences
(NIEHS) established the Toxicogenomics Research Consor-
tium to apply the collective and specialized expertise from
academic institutions to address issues in integrating gene
expression profiling, bioinformatics, and general toxicology.
Key elements include developing standardized practices for
1 Equally contributing first author.2 Equally contributing senior author.3 To whom correspondence should be addressed at Department of
Environmental Sciences and Engineering, School of Public Health,
University of North Carolina at Chapel Hill, CB #7431, Chapel Hill, NC
27599. Fax: (919) 843-2596. E-mail: [email protected].
� The Author 2007. Published by Oxford University Press on behalf of the Society of Toxicology. All rights reserved.For Permissions, please email: [email protected]
by guest on July 3, 2014http://toxsci.oxfordjournals.org/
Dow
nloaded from

gene expression studies, and conducting systematic assess-
ments of the reproducibility of traditional toxicity endpoints
and microarray data within and among laboratories. To this
end, the consortium selected the classical hepatotoxicant acet-
aminophen (APAP) (James et al., 2003; Kaplowitz, 2005), for
its proof-of-concept experiments. Despite more than 30 years
of research on APAP, we are far from a complete under-
standing of the mechanisms of liver injury, risk factors, and
molecular markers that predict clinical outcome after poisoning
(Watkins et al., 2006).
To evaluate both mechanisms and interlaboratory variation in
injury response, the toxicogenomic analysis of APAP-induced
hepatotoxicity was performed at seven geographically dispersed
Centers. Parallel studies with N-acetyl-m-aminophenol (AMAP),
the nonhepatotoxic isomer of APAP, provided a method to
isolate transcripts associated with hepatotoxicity. This study
identified potential sources of interlaboratory variability when
microarray analyses are conducted on samples generated in
different laboratories. The results also show that phenotypic
anchoring of gene expression data is required for biologically
meaningful meta-analysis of genomic experiments. This study
reports an extensive temporal pathway map of APAP- and
AMAP-specific, as well as aminophenol-nonspecific responses
in mouse liver, and uncovers a central role of Myc-regulated
signaling networks in APAP-induced acute liver injury.
Furthermore, we demonstrate that transcriptional responses in
livers of mice and rats are similar when equitoxic doses of APAP
are considered.
MATERIALS AND METHODS
Animals and treatments. To minimize the potential effects of environ-
mental and genetic variables, all participating laboratories received animals,
feed, bedding, and test article preparations from centralized sources. Each
participating laboratory used 45 10- to 11-week-old male isogenic C57BL/6J
mice (Jackson Labs, Bar Harbor, ME, or Sacramento, CA). The mice were
housed individually in an environmentally controlled area with temperature
(69–75�F), humidity control (35–65%), and a 12-h light/dark cycle under
pathogen-free conditions. The bedding and animal chow used by all
laboratories were provided by Battelle (Columbus, OH). Mice were maintained
on irradiated NTP-2000 chow (Ziegler Brothers, Inc., East Berlin, PA) and
bedding was on Sani-Chips (P.J. Murphy, Montville, NJ).
All participating laboratories were required to adhere to a standard protocol
for treatments, treatment termination, specimen collection, and processing, and
all endpoints were measured at centralized locations. After acclimation (12–15
days), animals were fasted for 18-h overnight prior to treatment and for 3 h after
dosing; water was given ad libitum. Mice, randomly assigned to treatment
groups (five per treatment, per time point, per center), were dosed (between
8 and 10 A.M. local time) by oral gavage with 10 ml/kg body weight of vehicle
(methylcellulose, 0.5% wt/vol), AMAP (300 mg/kg), or N-acetyl-p-amino-
phenol (APAP; 300 mg/kg). The experimental conditions were selected based
on the dose (300–600 mg/kg) and time (up to 48 h) finding study conducted at
one of the participating laboratories prior to the experiment (Supplemental
Table 1). The formulations of vehicle and test compounds used in this study
were prepared at Battelle and supplied to all laboratories to assure consistency
in drug concentrations. Before treatment, solutions were stirred continuously to
assure that proper mixing occurred while dosing. Mice were terminated under
Nembutal anesthesia (100 mg/kg, i.p.) at 6, 12, and 24 h after treatment.
At termination, whole blood was collected from the vena cava or by cardiac
puncture, transferred to 1.1-ml microcentrifuge tubes with gel additive carrier/
clot activator for serum separation (Sarstedt, Aktlengesellschaft & Co.,
Numbrecht, Germany), and centrifuged at 16,000 3 g for 20 min at room tem-
perature. Serum was collected from the supernatant above the gel, transferred to
a new tube, frozen in liquid nitrogen, and then stored at �80�C until analyses.
Liver samples were sectioned according to the standard operating procedure to
assure consistency of the collections. The left lateral lobe was used for
histopathological evaluation and RNA isolation, the median lobe was collected
for histopathological evaluation, and the remainder of the median lobe and right
anterior lobe was collected for glutathione measurements. Liver samples for
histopathology (3- to 5-mm-thick tissue slice) were fixed in 10% neutral
buffered formalin. All other liver samples were immediately frozen in liquid
nitrogen and stored at �80�C until analyses. Leftover solutions of the vehicle
and test chemicals, serum samples, as well as liver samples designated for
histopathology and glutathione measurements, were shipped on dry ice to
Battelle for further processing. RNA was extracted from each liver sample at
the treatment center, flash frozen, and stored at �80�C for shipment to
Paradigm Array Labs (Now Cogenics, a Division of Clinical Data, Inc.,
Morrisville, NC) where microarray experiments were performed. All animal
studies for this project were approved by each Institution’s respective Animal
Care and Use Committee prior to the start of the study.
Clinical chemistry. All serum samples were analyzed with a centrifugal
analyzer (Hitachi 911, Chula Vista, CA) at Battelle using procedures supplied
by the manufacturer. Variables analyzed included alanine aminotransferase
(ALT, historical control values from male B6C3F1 mice: 51 ± 25 U/l,
minimum/maximum: 21/112 U/l, n ¼ 34), aspartate aminotransferase (no
historical control available), sorbitol dehydrogenase (30 ± 9 U/l, min/max: 20/
63 U/l, n ¼ 36), and bile salts/acids (23 ± 5lM/l, min/max: 15/35lM/l, n ¼ 35).
The complete data set is provided in Supplemental Table 2. Serum enzyme
measurements were not performed on a small number of animals (15 in total)
from which blood samples were not available.
Histological methods. Liver tissue samples were embedded in paraffin,
sectioned, stained with hematoxylin and eosin (H&E), and examined for
pathological changes at Battelle where the diagnoses were subject to Quality
assurance and pathology peer review following standard National Toxicology
Program (NTP) procedure (Boorman et al., 2002). In addition to standard
qualitative pathology reads of the liver sections, a semiquantitative method of
estimating a fraction of necrotic tissue in histopathological sections of the liver
was applied (Mauton, 2002). For this purpose, a grid with 100 evenly spaced
points was overlaid on printed images of H&E-stained liver sections taken at
3100 magnification. All of the tissues available on each slide were evaluated.
The percent liver necrosis score was determined as the number of points lying
within necrotic areas divided by a total number of points within the tissue section.
Histopathological sections from all Centers were assessed for percent liver
necrosis score in a blinded fashion by one trained individual. These results were
independently verified by a board certified veterinary pathologist. These data are
provided in Supplemental Table 2.
Hepatic glutathione analysis. The method was based on the determination
of thiols by high-performance liquid chromatography with fluorescence
detection (Toyo’oka et al., 2001). Liver samples (median and right anterior
lobes) from individual animals were analyzed for reduced and total glutathione
at Battelle. Briefly, 1 mg of liver was placed in a test tube with 1 ml of 5%
trichloroacetic acid containing 5mM ethylenediaminetetraacetic acid (EDTA),
homogenized, vortexed, and centrifuged. Next, 50 ll of homogenate was
transferred to a test tube with 950 ll of 5mM EDTA containing 0.1M borax
(pH 9.3). Then, 100-ll aliquots were placed in duplicate tubes for each liver
sample. Fluorobenzofurazan-4-sulfonic acid ammonium salt was added for
reduced glutathione and tri-n-butylphosphine in acetonitrile was added to the
other tube for total glutathione. High-performance liquid chromatography with
fluorescence detection was used to determine total and reduced glutathione and
compared against calibration standards that were processed with each assay.
These data are provided in Supplemental Table 2.
MULTICENTER STUDY OF ACETAMINOPHEN HEPATOTOXICITY 327
by guest on July 3, 2014http://toxsci.oxfordjournals.org/
Dow
nloaded from

RNA isolation. Total RNA was isolated at each Center according to the
standardized protocol. Frozen liver samples (~30 mg from the left lateral lobe)
of four randomly selected mice from each study group were homogenized in
the extraction buffer supplied in the RNeasy mini kit (Qiagen, Valencia, CA).
Then, RNA was isolated using the spin column technology as detailed by the
manufacturer. RNA quality and quantity were determined spectrophotometri-
cally from the absorbance at 260 and 280 nm. Aliquots of 25 lg RNA were
frozen at �70�C and shipped to Cogenics for microarray analysis.
Microarray hybridizations. All gene expression profiling was performed
at Cogenics. One microgram of total RNA from individual mouse liver samples
was amplified and labeled with a fluorescent dye (Cy3), and a common
reference—pooled mouse liver messenger RNA (mRNA) isolated from the
livers of 100 male C57BL6/J mice (see Bammler et al., 2005 for details)—was
amplified and labeled with Cy5 using Agilent Technologies (Palo Alto, CA)
Low RNA Input Linear Amplification labeling kit following the manufacturer’s
protocol. The quantity of the resulting fluorescently labeled cRNA was
evaluated using a Nanodrop ND-100 spectrophometer (Nanodrop Technolo-
gies, Wilmington, DE) and its integrity measured using an Agilent Bioanalyzer.
Equal amounts of Cy3 and Cy5-labeled cRNA (750 ng) from the individual
animals and from the pooled control, respectively, were hybridized to an
Agilent Mouse Oligo Microarray (~21,000 features, catalogue# G4121) for
17 h at 65�C. The hybridized microarrays were washed and scanned using an
Agilent G2565BA scanner. Data were extracted from the scanned image using
Agilent Feature Extraction software version 7.5. There were two noted study
protocol deviations due to technical issues: Center #6 supplied RNA samples
for only one time point (6 h), and two samples from AMAP-treated animals
(one each for 12- and 24-h time points) from Center #3 were not included in
follow-up analyses due to poor microarray data quality as determined by
Feature Extraction software (excessive background signal intensity and large
number of saturated features).
Data analysis. Raw microarray data were processed and analyzed with
tools in the Bioconductor (Gentleman et al., 2004) software package.
Following the recommendations of the Toxicogenomics Research Con-
sortium’s standardization experiment (Bammler et al., 2005; Qin and Kerr,
2004), median Cy3 and Cy5 fluorescence intensities for each spot on the array
were used as the signal and no background adjustment was performed. Two
microarrays (Center 3) were excluded from further processing and analysis due
to poor quality. Intensities flagged as saturated signal by the Feature Extraction
software (Agilent Technologies) were treated as missing values. This resulted
in less than 1% missing data per array (median 0.1%, maximum 0.9%). Cy3/
Cy5 ratios were generated for each spot and these values were normalized for
intensity and spatially dependent systematic variation by regional lowess smooth-
ing (Cui et al., 2003). This data set (raw and normalized data files) is publicly
available from cebs.niehs.nih.gov (accession number 009-00001-0010-000-1).
Using the normalized data, genes with significant evidence for differential ex-
pression were identified using the Significance Analysis of Microarrays (SAM)
methodology (Tusher et al., 2001), as implemented in the Bioconductor package
‘‘samr.’’ The k-nearest-neighbor method was used to impute missing values
(Troyanskaya et al., 2001). For each of the three time points (6, 12, and 24 h) we
compared each pair of the three treatment groups for a total of nine pairwise
group comparisons. For each pairwise comparison, we treated ‘‘Center’’ as a
blocking factor and used 500 permutations (permuting the treatment labels
within Center) to estimate the reference null distributions for the significance
tests.
Correlations between liver toxicity and gene expression. The Spearman
correlation coefficient between gene expression and percent liver necrosis was
computed separately for each Center. A weighted median (Birkes and Dodge,
1993) of these individual correlation coefficients was computed with weights
proportional to the sample size from each Center (giving greater weight to
correlation coefficients from Centers with more data). Significance for this
(weighted) median correlation was determined by an approximate permutation
test (199 random permutations plus the original configuration). The p value
summarizes the proportion of random permutations that produced a (weighted)
median correlation coefficient at least as extreme as the one observed.
The number of permutations considered led to a resolution for the p value of
1/200 ¼ 0.005; a 95% confidence interval (Wilson’s interval; Agresti and
Coull, 1998) for p was computed to provide limits on the actual p value.
A (weighted) median correlation was deemed significant if p < 0.01 together
with an upper confidence limit for p strictly less than 0.05, a condition that
provides some assurance that a higher number of permutations would still pro-
duce small p values. The dashed-gray lines on Figure 4a show a robust linear fit
(Frees, 1991) applied to each Center’s data.
Variability analysis. An analysis of the variability of the microarray data
was conducted by fitting a random effects analysis of variance (ANOVA)
model on a feature-by-feature basis to the normalized log ratios (Jin et al.,
2001; Wolfinger et al., 2001). Eight variance components in the model
correspond to treatment, time, Center, their two- and three-way interactions,
and the residual variance. Since each animal was observed only once, the latter
is a confounded effect of animal-to-animal and technical variability. All effects
are considered random in this analysis in order to obtain a balanced partitioning
of estimated total variability. All effects are assumed to be normally distributed,
and variance components were estimated using restricted maximum likelihood
via JMP Microarray software (SAS Institute Inc., Cary, NC).
Analysis of biological networks. Network analysis was performed on lists
of genes generated from the earlier analyses described above as being
differentially expressed. Ingenuity Pathways Knowledge Base software (In-
genuity Systems, Inc., Redwood City, CA) was used for the analysis of significant
interactions. Ingenuity Pathways Knowledge Base is a database that contains data
of individually curated relationships between gene objects (e.g., genes, mRNAs,
and proteins) to generate significant biological networks and pathways.
A significance score ( p value) for each network and/or canonical pathway is
calculated according to the fit of the test gene set versus genes in the particular
pathway. The score of each identified network is calculated as the negative log
p value which indicates the likelihood that the genes in a test gene list can be
found together in a network due to random chance. In this study, a score
corresponding to p < 10�20 or lower was used to select highly significant
biological networks.
Gene ontology analysis. Lists of genes generated by various statistical
analyses of the microarray data were submitted to the GoMiner web-based
(http://discover.nci.nih.gov/gominer/) tool (Zeeberg et al., 2003) for identifi-
cation of the biological processes that are overrepresented. Statistical
significance of the biological process enrichment was determined using
Fisher’s exact p value based on the relative overrepresentation of genes within
a given gene ontology (GO) category as compared to a random sample of genes
probed on the array that was used in these experiments (see above). GO
pathways with a p < 0.05 and a minimum of five gene transcripts represented
from that category were considered for further analysis.
Species comparison of gene expression and toxicity data. Publicly
available (ntp.niehs.nih.gov/go/15716) gene expression and liver toxicity data
generated from F344/N rats that were exposed to either subtoxic (50 or 150
mg/kg) or toxic (1500 or 2000 mg/kg) doses of APAP for 6, 18, 24, or 48 h
were used. In order to identify APAP-responsive genes in both species, each of
the probes present on the Rat Oligonucleotide Array (Agilent G4130A) used in
the above study, and the Mouse Oligonucleotide Array used in this work, were
mapped to Entrez Gene IDs (where possible). Homologous genes present on
both microarray platforms were identified by using National Center for
Biotechnology Information HomoloGene tool by requiring that both Entrez
Gene IDs provided reciprocal BLAST hits. This resulted in the identification in
3076 candidate homologs that were measured on both microarrays. These
results were further restricted to 962 candidates by selecting genes with
a twofold or higher APAP-induced expression difference (as compared to time-
matched vehicle control animals separately for each species/time/dose group)
and a log ratio p value less than 0.001 in at least six treated animals (either rat
or mouse, see Supplemental Table 7 for a complete list of transcripts).
328 BEYER ET AL.
by guest on July 3, 2014http://toxsci.oxfordjournals.org/
Dow
nloaded from

RESULTS
Reducing Variability and Assuring Confidencein Gene Expression Studies
This study was designed to (1) advance understanding of the
molecular pathways perturbed in the liver by a toxic dose of
APAP by contrasting toxic compound-specific responses with
those of a nontoxic structural analog (AMAP), and (2) apply
the power of a multiple laboratory investigation to uncover
a stereotypic genomic signature of APAP-induced toxicity. The
experiment achieved the overall goal of inducing liver injury
with APAP (300 mg/kg, ig), while both vehicle and AMAP
showed no adverse effects (Figs. 1a and 1b, Supplemental
Table 2). Greater than 20% necrosis was observed in ~55% of
the APAP-treated animals at each time point and correlated
well (rPearson ¼ 0.846) with serum ALT (Fig. 1c). However,
toxic injury induced by APAP showed variability across
Centers and animals. Animal-to-animal variability within in-
dividual Centers was less than variation among centers, and
one Center (#2) did not induce liver injury in 12 out of 15 mice
treated with APAP. Furthermore, serum ALT levels in vehicle-
treated animals from Center 3 were elevated, about threefold
higher than in other Centers. Other clinical chemistry data
largely followed the trends of changes in ALT (Supplemental
Table 2). A decrease in reduced glutathione content at 6 h
following APAP treatment was observed (Fig. 1d, samples
from Center #2 were not provided). However, the magnitude of
glutathione depletion varied considerably from< 5% (Center #5)
FIG. 1. Toxicological assessment of APAP-induced injury in mouse liver. Severity and time-course (6, 12, and 24 h) of liver necrosis (a) and elevations in
serum ALT activity (b) associated with APAP treatment across Centers that performed the in vivo portion of the study. Mean values for up to five animals per
treatment group are shown for APAP-treated animals. An average of up to 15 measurements (all time points) is shown for the vehicle category. (c) Correlation plot
between liver necrosis and serum ALT measurements at the level of the individual animal. Data from vehicle- and APAP-treated animals (all centers combined) are
plotted according to the time point (n ¼ 6 h, þ ¼ 12 h, 3 ¼ 24 h). (d) Fraction (mean values for up to five animals) of reduced glutathione (GSH, reported as % of
glutathione content in vehicle-treated mice at each corresponding time point) in livers of APAP-treated animals. See Supplemental Table 2 for a complete data table
on the clinical chemistry and histopathology measurements collected in this study.
MULTICENTER STUDY OF ACETAMINOPHEN HEPATOTOXICITY 329
by guest on July 3, 2014http://toxsci.oxfordjournals.org/
Dow
nloaded from

to> 60% (Center #7). A weak negative correlation was observed
between the fraction of the reduced glutathione and necrosis
(rPearson: �0.537 [6 h], �0.413 [12 h], and �0.377 [24 h]);
however, it should be noted that glutathione depletion in mouse
liver after a hepatotoxic dose of APAP is known to occur within
60 min of dosing (Mitchell et al., 1973) and the time points in this
study may be less informative.
The statistical significance of changes in gene expression
was determined in pairwise comparisons between treatments
for each time point and a Venn diagram of the overlap was
constructed (Fig. 2a, Table 1, Supplemental Table 3). Genes in
the m5 sector, those differentially expressed between APAP-
and vehicle-treated mice and also between the APAP- and
AMAP-treated mice, were considered to represent an APAP-
selective transcriptional response in mouse liver. Thus, a non-
redundant list of genes (7806 transcripts) whose expression
changed significantly and specifically due to APAP treatment
at any of the time points was compiled and the transcriptional
response was visualized (Fig. 2b, top). When measurements of
liver necrosis and serum ALT in the same animals are also
displayed in a yellow–blue heat map (Fig. 2b), a pronounced
concordance between APAP hepatotoxicity and transcriptional
response is evident.
To assess the relative contributions of the different sources
of biological, technical, and experimental variability, we fitted
a random effects ANOVA model separately to data from each
feature in the normalized microarray data. Through this
statistical test, overall observed variability for each feature on
the microarray was partitioned into components corresponding
to the effects of treatment, time, Center, two- and three-way
interactions, and the residual variability (a combination of
biological and technical variability). Figure 3 shows the
distribution of R2 (the proportion of total variability explained
for each feature), as well as box plots for each of the eight
sources of variability detailed above. Results are shown for
(1) all 21,318 features on the Agilent array (Figs. 3a and 3b),
and (2) the 7806 transcripts (see Fig. 2) representing the
APAP-specific expression profile in liver (Figs. 3a inset and
3c). When all transcripts on the array are considered, R2
distribution is bimodal and centered on 20% and 70% of
explained variability. On average, less than half of the overall
variability observed in this standardization experiment can be
attributed to the effects of time, treatments, and Center, or their
combinations. However, genes in the selectively APAP-
hepatotoxic signature fall clearly in the upper R2 mode where
considerably more variation is due to the effects of time,
FIG. 2. Toxicogenomic assessment of APAP-, AMAP-selective, and
‘‘aminophenol-like’’ responses in mouse liver. (a) Venn diagram illustrating
the distribution of gene expression alterations associated with APAP, AMAP or
vehicle treatment in liver. Gene lists were generated using SAM (false
discovery rate < 0.01) for each comparison between treatments. m sectors
designate groups of genes selected in each pairwise comparison (see Table 1 for
the total number of transcripts in each sector; sector assignment for each gene
on the microarray is provided in supplemental materials). (b) Heat maps of
toxicological phenotypes (yellow–blue, liver necrosis, serum ALT activity) and
gene expression (red–green) for genes identified in sectors m5 (APAP-specific,
top), m3 (AMAP-specific, middle), and m6 (aminophenol-like nonspecific,
bottom). Samples are ordered by Center (1–7), treatment (Vehicle, AMAP, and
APAP), and time (6, 12, 24 h). Genes are clustered (average linkage) according
to correlation (centered).
330 BEYER ET AL.
by guest on July 3, 2014http://toxsci.oxfordjournals.org/
Dow
nloaded from
treatments, and Center, or their combinations. Furthermore, the
residual variability in these APAP hepatotoxicity–associated
genes is reduced to 40% and treatment- and Center-specific
effects are more pronounced than those of time and the two-
and three-way interactions.
Probing Mechanisms by Linking Gene Expressionwith Phenotypic Endpoints
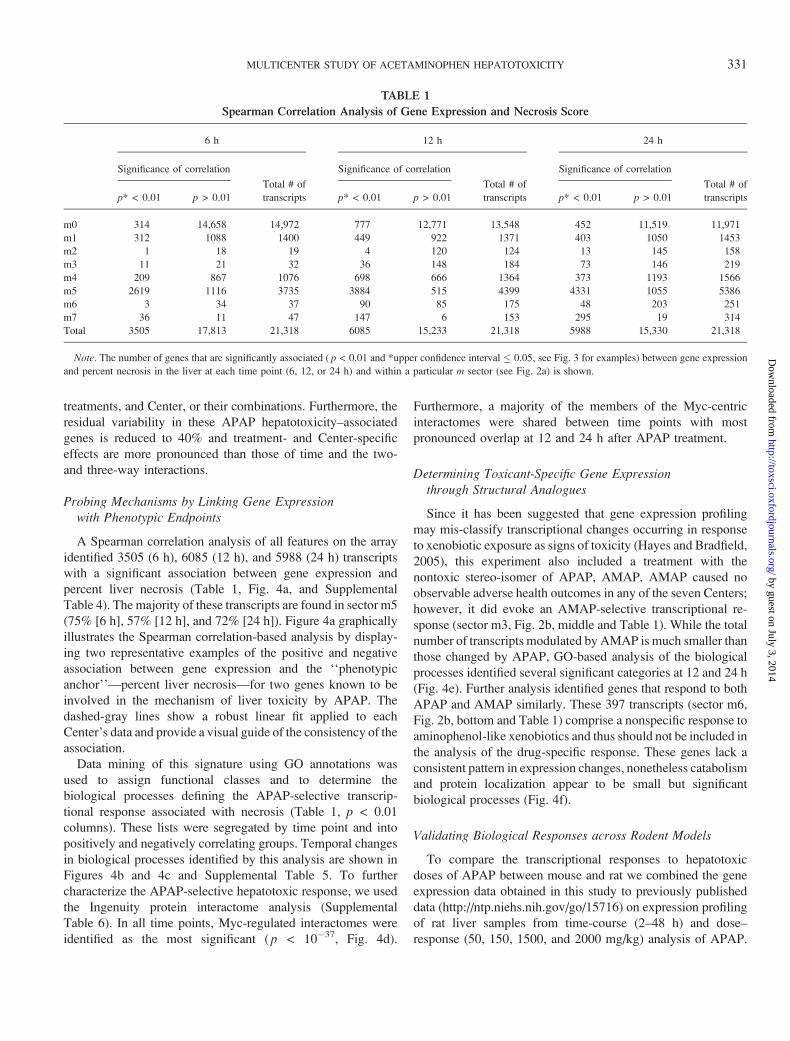
A Spearman correlation analysis of all features on the array
identified 3505 (6 h), 6085 (12 h), and 5988 (24 h) transcripts
with a significant association between gene expression and
percent liver necrosis (Table 1, Fig. 4a, and Supplemental
Table 4). The majority of these transcripts are found in sector m5
(75% [6 h], 57% [12 h], and 72% [24 h]). Figure 4a graphically
illustrates the Spearman correlation-based analysis by display-
ing two representative examples of the positive and negative
association between gene expression and the ‘‘phenotypic
anchor’’—percent liver necrosis—for two genes known to be
involved in the mechanism of liver toxicity by APAP. The
dashed-gray lines show a robust linear fit applied to each
Center’s data and provide a visual guide of the consistency of the
association.
Data mining of this signature using GO annotations was
used to assign functional classes and to determine the
biological processes defining the APAP-selective transcrip-
tional response associated with necrosis (Table 1, p < 0.01
columns). These lists were segregated by time point and into
positively and negatively correlating groups. Temporal changes
in biological processes identified by this analysis are shown in
Figures 4b and 4c and Supplemental Table 5. To further
characterize the APAP-selective hepatotoxic response, we used
the Ingenuity protein interactome analysis (Supplemental
Table 6). In all time points, Myc-regulated interactomes were
identified as the most significant (p < 10�37, Fig. 4d).
Furthermore, a majority of the members of the Myc-centric
interactomes were shared between time points with most
pronounced overlap at 12 and 24 h after APAP treatment.
Determining Toxicant-Specific Gene Expressionthrough Structural Analogues
Since it has been suggested that gene expression profiling
may mis-classify transcriptional changes occurring in response
to xenobiotic exposure as signs of toxicity (Hayes and Bradfield,
2005), this experiment also included a treatment with the
nontoxic stereo-isomer of APAP, AMAP. AMAP caused no
observable adverse health outcomes in any of the seven Centers;
however, it did evoke an AMAP-selective transcriptional re-
sponse (sector m3, Fig. 2b, middle and Table 1). While the total
number of transcripts modulated by AMAP is much smaller than
those changed by APAP, GO-based analysis of the biological
processes identified several significant categories at 12 and 24 h
(Fig. 4e). Further analysis identified genes that respond to both
APAP and AMAP similarly. These 397 transcripts (sector m6,
Fig. 2b, bottom and Table 1) comprise a nonspecific response to
aminophenol-like xenobiotics and thus should not be included in
the analysis of the drug-specific response. These genes lack a
consistent pattern in expression changes, nonetheless catabolism
and protein localization appear to be small but significant
biological processes (Fig. 4f).
Validating Biological Responses across Rodent Models
To compare the transcriptional responses to hepatotoxic
doses of APAP between mouse and rat we combined the gene
expression data obtained in this study to previously published
data (http://ntp.niehs.nih.gov/go/15716) on expression profiling
of rat liver samples from time-course (2–48 h) and dose–
response (50, 150, 1500, and 2000 mg/kg) analysis of APAP.
TABLE 1
Spearman Correlation Analysis of Gene Expression and Necrosis Score
6 h 12 h 24 h
Significance of correlation
Total # of
transcripts
Significance of correlation
Total # of
transcripts
Significance of correlation
Total # of
transcriptsp* < 0.01 p > 0.01 p* < 0.01 p > 0.01 p* < 0.01 p > 0.01
m0 314 14,658 14,972 777 12,771 13,548 452 11,519 11,971
m1 312 1088 1400 449 922 1371 403 1050 1453
m2 1 18 19 4 120 124 13 145 158
m3 11 21 32 36 148 184 73 146 219
m4 209 867 1076 698 666 1364 373 1193 1566
m5 2619 1116 3735 3884 515 4399 4331 1055 5386
m6 3 34 37 90 85 175 48 203 251
m7 36 11 47 147 6 153 295 19 314
Total 3505 17,813 21,318 6085 15,233 21,318 5988 15,330 21,318
Note. The number of genes that are significantly associated ( p < 0.01 and *upper confidence interval � 0.05, see Fig. 3 for examples) between gene expression
and percent necrosis in the liver at each time point (6, 12, or 24 h) and within a particular m sector (see Fig. 2a) is shown.
MULTICENTER STUDY OF ACETAMINOPHEN HEPATOTOXICITY 331
by guest on July 3, 2014http://toxsci.oxfordjournals.org/
Dow
nloaded from

Even though the data sets were generated using two different
microarrays, albeit of the same platform and at the same
reference laboratory, it was possible to compare and contrast
gene expression results at the level of individual genes (Fig. 5).
A yellow–blue heat map in Figure 5 displays measurements of
necrosis and serum ALT activity from the same animals in both
data sets (Supplemental Table 8). Similar to the data that were
obtained with mice (Fig. 2b), a high degree of concordance
between APAP-induced toxicity and transcriptional response is
evident in individual animals, both mice and rats. Seventy-one
transcripts (r¼ 0.83) constitute a species-independent universal
transcriptional response to APAP (Fig. 5, red box). The
transcripts for both Myc and Jun oncogenes are located within
this signature. Several GO processes were downregulated
following treatment with APAP as exemplified by a set of
52 transcripts (r ¼ 0.76, Fig. 5, green box).
DISCUSSION
The use of genomics has created both opportunities and
challenges. The concept of gene expression profiles as sig-
natures of toxicant classes, disease subtypes, or other biological
endpoints (Hamadeh et al., 2002a,b), together with public
availability of expression data from multiple studies, has
spurred the development of multiple databases and meta-
analysis for comparative study of toxicity based on reference
compounds (Waters et al., 2003). Disparate data streams may
include gene expression, body and organ-weight measure-
ments, clinical chemistry, and histopathology findings for
several tissues and require careful collection, management, and
integration (Mattes et al., 2004). While it has been recognized
that validated biological endpoints, phenotypic anchors, are
essential for interpreting toxicological outcomes (Paules, 2003;
Powell et al., 2006), no study has systematically approached
the issue of the variability in expression and toxicity data
through multilaboratory comparisons.
The effects of early and/or low-dose effects of APAP in the
rodent liver were considered recently and it was shown that
gene expression is a sensitive means of identifying indicators
of adverse effects that precede overt toxicity (Heinloth et al.,2004). The design of the current study was weighted toward
uncovering robust genomic signatures of APAP-induced tox-
icity that were reproducible in studies conducted across
multiple laboratories by focusing on doses and time points
that were selected to result in a clear phenotype (i.e., liver
injury) that would facilitate anchoring pathobiologicalFIG. 3. Variability analysis of microarray data. (a) Histogram showing
a distribution of R2 statistic (proportion of total variability explained by the
statistical model) across transcripts considered in this experiment. A three-way
variance components model was fit separately to all 21,318 (light green
histogram) transcripts on the microarray, or only 7806 transcripts from Venn
sector m5 (dark green inset). Corresponding box plot is also shown—top and
bottom of the box are the 25th and 75th percentiles, inside the box is a mean
bar, red bracket indicates shortest half of the data. (b) Box plots of variance
component estimates, standardized (sum ¼ 1) within each transcript (21,318
transcripts). (c) Box plots of standardized variance component estimates for the
7806 m5 transcripts. Animal/Tech—the residual variance, which is a combina-
tion of animal-to-animal and technical variability. Other variance components
correspond to the effects of Treatment, Time, Center, and their two- and three-
way interactions.
332 BEYER ET AL.
by guest on July 3, 2014http://toxsci.oxfordjournals.org/
Dow
nloaded from

endpoints with microarray data. Furthermore, this study firmly
establishes that careful consideration of the traditional toxicity
measurements, so-called ‘‘phenotypic anchors,’’ adds confi-
dence to the interpretation of data from novel technologies,
such as gene expression profiling. However, while ‘‘pheno-
typic anchoring’’ provides insights regarding mechanism of
FIG. 4. Phenotypic anchoring of gene expression and liver pathology reveals common biological pathways across Centers. (a) Plots show examples of the
positive (top, glutamate-cysteine ligase, catalytic subunit, Gclc) and negative (bottom, cytochrome P450 2e1, Cyp2e1) association between gene expression and
necrosis in the liver at 6 h after treatment. Points show individual animal’s response to APAP (red), AMAP (blue), or vehicle (green) treatment; gray dotted lines
show a robust linear fit to data from each of seven Centers. The (weighted) median Spearman correlation value (rs) is indicated together with a p value determined
from a permutation test (95% confidence interval for p is provided in parentheses). (b, c) Gene ontology analysis of transcripts in m5 sector that significantly
correlate with liver necrosis. The number of genes associated with each process is given in parentheses. Biological pathways affected in all time points are
highlighted by a box. (d) Ingenuity pathway analysis of transcripts in m5 sector that significantly correlate (positively, red, or negatively, green) with liver necrosis
identifies Myc-centered interactome as the top scoring network. Significant network interactions were identified for gene sets (same as in c and d) representing 6-h
post-APAP treatment (inner blue circle), 12-h post-APAP treatment (middle circle), and 24-h post-APAP treatment (outer circle). Temporality of the response is
displayed by line connections. Proteins connected to Myc by lines were found to be common between two and three time points. Solid lines represent physical
interactions (i.e., binding), whereas arrows represent any other type of indirect cellular interactions. Proteins that are not connected to Myc were found in the
interactomes specific for each particular time point. Different shapes of the nodes represent functional classification of the proteins that are shown: square,
cytokines; vertical rhombus, enzymes; horizontal rhombus, peptidases; triangle, phosphatases; inverted triangle, kinases; vertical oval, transmembrane receptors;
horizontal oval, transcription regulators; trapezoid, transporters; circle, other. (e, f) Gene ontology analysis of transcripts significantly correlating with AMAP (m3)
or aminophenol-like compound response (m6), respectively.
MULTICENTER STUDY OF ACETAMINOPHEN HEPATOTOXICITY 333
by guest on July 3, 2014http://toxsci.oxfordjournals.org/
Dow
nloaded from

toxicity, it may not provide additional value in terms of
prediction.
Despite our best efforts to standardize the study a consider-
able degree of animal-to-animal variability in the extent of liver
injury was observed. While the overwhelming majority of
studies in the literature report data on toxic effects in the form of
mean ± standard error, we chose to consider and display clinical
chemistry and histopathology data for individual animals,
which clearly demonstrates that a treatment-specific gene
expression signature is only present in subjects that exhibited
the pathologic effect of treatment. Furthermore, our study used
a correlation-based analytical approach to associate the extent of
liver toxicity caused by APAP (as % liver necrosis) with gene
expression. We argue that such correlation-based analytical
approach to associate the extent of liver toxicity with gene
expression is especially powerful for the selection of genes that
change in expression at a certain statistical significance and that
respond to treatment and/or pathophysiological endpoints.
Thus, despite the lack of evident toxicity in some APAP-
treated animals, a signature could be determined and used with
confidence to map gene expression profiles to pathways.
Previous studies indicated that comparability of gene
expression experiments among laboratories can be affected by
numerous technical variables (Bammler et al., 2005). An ad-
ditional layer of complexity arises when entire biological
experiments are performed in parallel, introducing additional
sources of variability stemming from technical, genetic, epi-
genetic, or stochastic factors. While this study did not consider
effects of genetics (since all mice were from an inbred line) or
microarray platform (since all experiments were performed on
the same commercial platform at a centralized location), we
found that the largest source of variability in a real-life biological
experiment was technical/animal whereby animal-to-animal
technical or biological deviations affected the outcome. Possible
contributors to this variability include differences in animal
husbandry, duration, and dose of anesthesia, methods, and
timing of blood draws, timing of tissue excision, storage, and
preparation, etc. Overall, this result underscores the convolution
of biological responses in complex systems and the importance
of taking each step of the experiment into consideration.
Inevitably, the high sensitivity of new assays creates additional
noise in the measurements and makes it more challenging to
extract meaningful knowledge with confidence. However, when
only those genes that constitute a phenotypically anchored
signature are considered, as shown in this work, the relative
proportion of uncontrolled variability diminishes. Thus, our
results argue strongly that the biological response–based filters
increase confidence and reduce variability in the microarray data
even if animal-to-animal variability is considerable.
This work, with the added confidence of a multilaboratory-
based investigation, reveals a number of biological pathways
that are responsive to APAP in mouse liver; however, current
study design does not allow one to conclude that other
centrilobular hepatotoxicants might produce a similar or
overlapping pattern of gene expression as seen for APAP
(i.e., the specificity of the response). Furthermore, our analysis
identifies genes that are not only consistently up-/down-
regulated, but also are significantly correlated with the toxicity
FIG. 5. Biological pathways affected by APAP in mouse and rat liver. Heat map of toxicological phenotypes (liver necrosis, serum ALT activity) and gene
expression from integrated mouse (this study) and rat (National Center for Toxicogenomics, NIEHS) data sets. See ‘‘Experimental Procedures’’ for the description
of the process of gene selection. A complete list of genes used in this analysis is available in Supplementary Table 7. Samples are ordered by Center (1–7, mouse
data only), treatment (AMAP or APAP, where applicable), and time (mouse: 6, 12, 24 h; rat: 2, 18, 24, and 48 h). Genes are clustered (average linkage) according
to correlation (centered).
334 BEYER ET AL.
by guest on July 3, 2014http://toxsci.oxfordjournals.org/
Dow
nloaded from

phenotype. While this work considered transcriptional
responses to APAP-induced liver injury and did not include
proteomic analysis, we argue that gene expression changes are
key secondary indicators of the cell’s response to stress and
thus can be used successfully to identify important biological
pathways involved in causation of, or response to, tissue
damage. It has been postulated that loss of mitochondrial
function (Donnelly et al., 1994) and concomitant generation of
oxidative stress (Jaeschke, 1990), as well as activation of
inflammatory cytokine and chemokine cascades, are all in-
volved in APAP-induced hepatotoxicity (James et al., 2003;
Kaplowitz, 2005; Watkins et al., 2006). We show that APAP-
related induction of programmed cell death accompanied by
inflammatory response and the parallel upregulation of the cell
cycle, activation of kinases, and metabolism are prominent at
all time points considered in this study. A number of in-
flammatory cells and mediator molecules are thought to be
involved in parenchymal cell damage. Neutrophils are an
essential component of the innate immune response at both the
initiation and progression levels. Recently, direct evidence that
neutrophil accumulation in the liver contributes to the
progression and severity of APAP-induced liver injury was
presented (Liu et al., 2006). Our data confirm that neutrophil
chemotaxis (i.e., Fcgr3, Itgb2, and Fcer1g) is one of the
significant biological processes that is induced by APAP
treatment and correlates significantly with liver necrosis.
The c-Jun N-terminal kinase (Jnk) signaling pathway is
primarily activated by proinflammatory cytokines and stress
stimuli. In vitro and in vivo studies have shown that APAP
induces a sustained activation of Jnk that contributes to
hepatocellular necrosis (Gunawan et al., 2006). The propensity
for Jnk to mediate cell death has been postulated to be
mediated by the antagonistic cross-talk between Jnk and nu-
clear factor kappa B (NF-jB). APAP has been shown to inhibit
NF-jB transactivation in the liver and in turn amplify Jnk
tipping the scale from cell survival to cell death (Matsumaru
et al., 2003). Our data show that MAP kinases, including
members of the Jnk signaling pathway (Traf2, Mapk8ip3, and
Dusp10), are positively associated with APAP-induced liver
necrosis. As expected, this pathway is most active at 6 h when
oxidative stress and the production of proinflammatory cyto-
kines from the influx of inflammatory cells are at their peak.
Liver regeneration after damage depends on the ability of
cells to progress through the cell cycle and proliferate (Fausto
et al., 1995). In vitro, it has been shown that APAP interferes
with the ability of cells to respond to growth factor stimuli since
APAP prevented degradation of inhibitor of jB, thus blocking
activation of NF-jB, phosphorylation of Raf1, and upregulation
ofMyc (Boulares et al., 1999). While in vitro data should be con-
sidered with caution, data from this in vivo study also show that
c-Myc is induced by APAP and that c-Myc–centered inter-
actomes are the most significant networks of proteins associated
with liver injury. Jun and Fos are also induced in liver by
APAP treatment, and networks that encompass these two key
regulators of AP-1–specific transcriptional response are second-
most significant at all three time points. Indeed, the relationship
between chemical stress and the synthesis of glutathione,
including the role of these genes, transcription factors, and
glutathione-synthesizing enzymes (e.g., glutamate-cysteine
ligase) has been documented (Kitteringham et al., 2000).
Most of the significantly downregulated biological processes
were found as early as 6 h after treatment with APAP. Lipid
metabolism, electron transport, and cofactor metabolism are
repressed at all time points. This observation likely reflects
a temporary suspension of physiological functioning of the
liver that occurs under conditions of massive necrosis. Indeed,
it was previously suggested that transcript levels of enzymes
involved in major energy-consuming biochemical pathways are
downregulated after APAP treatment (Heinloth et al., 2004),
and the mitochondrial dysfunction in liver after APAP
treatment is well known (Hinson et al., 2004; Knight and
Jaeschke, 2002; Ruepp et al., 2002).
Use of toxic and nontoxic structural analogues is a helpful
method to isolate gene expression changes that are most likely
to be associated with the phenotype of interest—in this case,
liver damage. AMAP and APAP are structurally similar com-
pounds and both are metabolized to reactive intermediates
(Rashed and Nelson, 1989). AMAP is believed to be nontoxic
(Nelson, 1980), even though it is known to produce protein
adducts, glutathione depletion, and other effects (Rashed et al.,1990) postulated as contributors to APAP-mediated liver in-
jury. The difference in the response to these isomers is thought
to reflect lower and shorter depletion of glutathione by AMAP
(Rashed et al., 1990). AMAP was also shown to have an effect
on the liver proteome qualitatively similar to APAP (Fountou-
lakis et al., 2000). Even though the response to AMAP was less
pronounced, it was most extensive at 12 and 24 h after treat-
ment and many of the biological processes are shared between
the two chemicals.
Rat and mouse models have been used extensively to
investigate organ-specific effects and mechanisms of toxicity.
The availability of detailed genetic information in these model
systems and humans provides greater utility of the toxicity data
obtained in animals (Cohen, 2004). Since regulatory elements
of evolutionarily related species are conserved, gene expression
signatures reflecting similar phenotypes in the species are also
likely to be conserved. Indeed, the cross-species comparison of
gene expression patterns revealed great similarity in the effects
of toxic doses of APAP in both species. When the extent of liver
injury was compared to the transcriptional response, it was clear
that similar expression changes occur in rat and mouse liver
under conditions of acute organ damage by APAP. Apoptosis,
cell cycle, stress, and transcriptional response, coupled with
downregulation of metabolism and transport, are common
biological processes between mouse and rat in response to
APAP and are likely to be in humans as well. For example, Mycand Jun signify a representative cross-species APAP-induced
response. Although it is yet to be determined whether these
MULTICENTER STUDY OF ACETAMINOPHEN HEPATOTOXICITY 335
by guest on July 3, 2014http://toxsci.oxfordjournals.org/
Dow
nloaded from

molecular events drive liver injury in humans as well, the
relative similarity of the sequence of liver injury events, its
dependency on glutathione content and inflammatory response,
and the overall phenotype shared among rodents and man
indicates that the signaling pathways driven by the mobilization
of energy resources and activation of tissue repair may have
a role in prognosis for human acute drug-induced liver injury.
The clear gain realized from this comparative genomics
approach is connecting molecular and histopathological fea-
tures of human liver injury to mouse and rat models with greater
confidence. Establishing this molecular relationship between
species should provide new opportunities to explore research
avenues into molecular pathogenesis, treatment, and prevention
of adverse drug-induced liver toxicity in humans.
SUPPLEMENTARY DATA
Supplementary data are available online at http://toxsci.
oxfordjournals.org/.
FUNDING
National Institutes of Health (U19-ES011384, U19-
ES011375, U19-ES011387, U19-ES011391, U19-ES011399,
and N01-ES25497).
ACKNOWLEDGMENTS
The authors wish to thank David Schwartz (NIEHS) for contributing to
the study design. The members of the Toxicogenomics Research Consortium
also acknowledge the efforts of David Balshaw and Michael Humble of the
NIEHS, and support of Molly Vallant of the NTP and the technical assistance
of Laurene Fomby, Tammy Wheat, Daphne Vasconcelos, Michael Ryan, Brian
Burback, and Milton Hejtacik (all from Battelle), and the Investigation
Genomics Group of Cogenics. This work was supported (in part) by the
Intramural Research Program of the National Institutes of Health and NIEHS.
REFERENCES
Agresti, A., and Coull, B. A. (1998). ‘‘Approximate’’ is better than ‘‘exact’’ for
interval estimation of binomial proportions. Am. Stat. 52, 119–126.
Baker, V. A., Harries, H. M., Waring, J. F., Duggan, C. M., Ni, H. A.,
Jolly, R. A., Yoon, L. W., De Souza, A. T., Schmid, J. E., Brown, R. H.,
et al. (2004). Clofibrate-induced gene expression changes in rat liver:
A cross-laboratory analysis using membrane cDNA arrays. Environ. Health
Perspect. 112, 428–438.
Ball, C. A., Sherlock, G., Parkinson, H., Rocca-Sera, P., Brooksbank, C.,
Causton, H. C., Cavalieri, D., Gaasterland, T., Hingamp, P., Holstege, F.,
et al. (2002). Standards for microarray data. Science 298, 539.
Bammler, T., Beyer, R. P., Bhattacharya, S., Boorman, G. A., Boyles, A.,
Bradford, B. U., Bumgarner, R. E., Bushel, P. R., Chaturvedi, K., Choi, D.,
et al. (2005). Standardizing global gene expression analysis between
laboratories and across platforms. Nat. Methods. 2, 351–356.
Becker, K. G. (2001). The sharing of cDNA microarray data. Nat. Rev.
Neurosci. 2, 438–440.
Beekman, J. M., Boess, F., Hildebrand, H., Kalkuhl, A., and Suter, L. (2006).
Gene expression analysis of the hepatotoxicant methapyrilene in primary rat
hepatocytes: An interlaboratory study. Environ. Health Perspect. 114,
92–99.
Birkes, D., and Dodge, Y. (1993). Alternative Methods of Regression. John
Wiley, New York, NY.
Boorman, G. A., Haseman, J. K., Waters, M. D., Hardisty, J. F., and Sills, R. C.
(2002). Quality review procedures necessary for rodent pathology databases
and toxicogenomic studies: The National Toxicology Program experience.
Toxicol. Pathol. 30, 88–92.
Boulares, H. A., Giardina, C., Navarro, C. L., Khairallah, E. A., and
Cohen, S. D. (1999). Modulation of serum growth factor signal transduction
in Hepa 1-6 cells by acetaminophen: An inhibition of c-myc expression,
NF-kappaB activation, and Raf-1 kinase activity. Toxicol. Sci. 48, 264–274.
Cohen, S. M. (2004). Risk assessment in the genomic era. Toxicol. Pathol.
32(Suppl. 1), 3–8.
Cui, X., Kerr, M. K., and Churchill, G. A. (2003). Transformations for cDNA
microarray data. Stat. Appl. Genet. Mol. Biol.2, Article4
Donnelly, P. J., Walker, R. M., and Racz, W. J. (1994). Inhibition of
mitochondrial respiration in vivo is an early event in acetaminophen-induced
hepatotoxicity. Arch. Toxicol. 68, 110–118.
Fausto, N., Laird, A. D., and Webber, E. M. (1995). Liver regeneration. 2. Role
of growth factors and cytokines in hepatic regeneration. FASEB J. 9,
1527–1536.
Fountoulakis, M., Berndt, P., Boelsterli, U. A., Crameri, F., Winter, M.,
Albertini, S., and Suter, L. (2000). Two-dimensional database of mouse liver
proteins: Changes in hepatic protein levels following treatment with
acetaminophen or its nontoxic regioisomer 3-acetamidophenol. Electropho-
resis 21, 2148–2161.
Frees, E. W. (1991). Trimmed slope estimates for simple linear regression.
J. Stat. Plann. Infer. 27, 203–221.
Gentleman, R. C., Carey, V. J., Bates, D. M., Bolstad, B., Dettling, M.,
Dudoit, S., Ellis, B., Gautier, L., Ge, Y., Gentry, J., et al. (2004).
Bioconductor: Open software development for computational biology and
bioinformatics. Genome Biol. 5, R80.
Gunawan, B. K., Liu, Z. X., Han, D., Hanawa, N., Gaarde, W. A., and
Kaplowitz, N. (2006). c-Jun N-terminal kinase plays a major role in murine
acetaminophen hepatotoxicity. Gastroenterology 131, 165–178.
Hamadeh, H. K., Bushel, P. R., Jayadev, S., DiSorbo, O., Bennett, L., Li, L.,
Tennant, R., Stoll, R., Barrett, J. C., Paules, R. S., et al. (2002a). Prediction
of compound signature using high density gene expression profiling. Toxicol.
Sci. 67, 232–240.
Hamadeh, H. K., Bushel, P. R., Jayadev, S., Martin, K., DiSorbo, O., Sieber, S.,
Bennett, L., Tennant, R., Stoll, R., Barrett, J. C., et al. (2002b). Gene
expression analysis reveals chemical-specific profiles. Toxicol. Sci. 67,
219–231.
Hayes, K. R., and Bradfield, C. A. (2005). Advances in toxicogenomics. Chem.
Res. Toxicol. 18, 403–414.
Heinloth, A. N., Irwin, R. D., Boorman, G. A., Nettesheim, P., Fannin, R. D.,
Sieber, S. O., Snell, M. L., Tucker, C. J., Li, L., Travlos, G. S., et al. (2004).
Gene expression profiling of rat livers reveals indicators of potential adverse
effects. Toxicol. Sci. 80, 193–202.
Hinson, J. A., Reid, A. B., McCullough, S. S., and James, L. P. (2004).
Acetaminophen-induced hepatotoxicity: Role of metabolic activation,
reactive oxygen/nitrogen species, and mitochondrial permeability transition.
Drug Metab. Rev. 36, 805–822.
Jaeschke, H. (1990). Glutathione disulfide formation and oxidant stress during
acetaminophen-induced hepatotoxicity in mice in vivo: The protective effect
of allopurinol. J Pharmacol. Exp. Ther. 255, 935–941.
336 BEYER ET AL.
by guest on July 3, 2014http://toxsci.oxfordjournals.org/
Dow
nloaded from

James, L. P., Mayeux, P. R., and Hinson, J. A. (2003). Acetaminophen-induced
hepatotoxicity. Drug Metab. Dispos. 31, 1499–1506.
Jin, W., Riley, R. M., Wolfinger, R. D., White, K. P., Passador-Gurgel, G., and
Gibson, G. (2001). The contributions of sex, genotype and age to tran-
scriptional variance in Drosophila melanogaster. Nat. Genet. 29, 389–395.
Kaplowitz, N. (2005). Idiosyncratic drug hepatotoxicity. Nat. Rev. DrugDiscov. 4, 489–499.
Kitteringham, N. R., Powell, H., Clement, Y. N., Dodd, C. C., Tettey, J. N.,
Pirmohamed, M., Smith, D. A., McLellan, L. I., and Kevin, P. B. (2000).
Hepatocellular response to chemical stress in CD-1 mice: Induction of early
genes and gamma-glutamylcysteine synthetase. Hepatology 32, 321–333.
Knight, T. R., and Jaeschke, H. (2002). Acetaminophen-induced inhibition of
Fas receptor-mediated liver cell apoptosis: Mitochondrial dysfunction versus
glutathione depletion. Toxicol. Appl. Pharmacol. 181, 133–141.
Liu, Z. X., Han, D., Gunawan, B., and Kaplowitz, N. (2006). Neutrophil
depletion protects against murine acetaminophen hepatotoxicity. Hepatology
43, 1220–1230.
Matsumaru, K., Ji, C., and Kaplowitz, N. (2003). Mechanisms for sensitization
to TNF-induced apoptosis by acute glutathione depletion in murine
hepatocytes. Hepatology 37, 1425–1434.
Mattes, W. B., Pettit, S. D., Sansone, S. A., Bushel, P. R., and Waters, M. D.
(2004). Database development in toxicogenomics: Issues and efforts.
Environ. Health Perspect. 112, 495–505.
Mauton, P.R. (2002). Principles and Practices of Unbiased Stereology: AnIntroduction for Bioscientists. The Johns Hopkins University Press,
Baltimore, MD.
Miles, M. F. (2001). Microarrays: Lost in a storm of data? Nat. Rev. Neurosci. 2,
441–443.
Mitchell, J. R., Jollow, D. J., Potter, W. Z., Gillette, J. R., and Brodie, B. B.
(1973). Acetaminophen-induced hepatic necrosis. IV. Protective role of
glutathione. J. Pharmacol. Exp. Ther. 187, 211–217.
Nelson, E. B. (1980). The pharmacology and toxicology of meta-substituted
acetanilide I: Acute toxicity of 3-hydroxyacetanilide in mice. Res. Commun.Chem. Pathol. Pharmacol. 28, 447–456.
Paules, R. (2003). Phenotypic anchoring: Linking cause and effect. Environ.
Health Perspect. 111, A338–A339.
Pennie, W., Pettit, S. D., and Lord, P. G. (2004). Toxicogenomics in risk
assessment: An overview of an HESI collaborative research program.
Environ. Health Perspect. 112, 417–419.
Powell, C. L., Kosyk, O., Ross, P. K., Schoonhoven, R., Boysen, G.,
Swenberg, J. A., Heinloth, A. N., Boorman, G. A., Cunningham, M. L.,
Paules, R. S., et al. (2006). Phenotypic anchoring of acetaminophen-induced
oxidative stress with gene expression profiles in rat liver. Toxicol. Sci. 93,
213–222.
Qin, L. X., and Kerr, K. F. (2004). Empirical evaluation of data transformations
and ranking statistics for microarray analysis. Nucleic Acids Res. 32,
5471–5479.
Rashed, M. S., Myers, T. G., and Nelson, S. D. (1990). Hepatic protein
arylation, glutathione depletion, and metabolite profiles of acetaminophen
and a non-hepatotoxic regioisomer, 3#-hydroxyacetanilide, in the mouse.
Drug Metab. Dispos. 18, 765–770.
Rashed, M. S., and Nelson, S. D. (1989). Characterization of glutathione
conjugates of reactive metabolites of 3#-hydroxyacetanilide, a non-
hepatotoxic positional isomer of acetaminophen. Chem. Res. Toxicol. 2,
41–45.
Ruepp, S. U., Tonge, R. P., Shaw, J., Wallis, N., and Pognan, F. (2002).
Genomics and proteomics analysis of acetaminophen toxicity in mouse liver.
Toxicol. Sci. 65, 135–150.
Shi, L., Reid, L. H., Jones, W. D., Shippy, R., Warrington, J. A., Baker, S. C.,
Collins, P. J., de Longueville, F., Kawasaki, E. S., Lee, K. Y., et al. (2006).
The MicroArray Quality Control (MAQC) project shows inter- and intra-
platform reproducibility of gene expression measurements. Nat. Biotechnol.
24, 1151–1161.
Toyo’oka, T., Tanabe, J., and Jinno, H. (2001). Determination of rat
hepatocellular glutathione by reversed-phase liquid chromatography with
fluorescence detection and cytotoxicity evaluation of environmental pol-
lutants based on the concentration change. Biomed. Chromatogr. 15,
240–247.
Troyanskaya, O., Cantor, M., Sherlock, G., Brown, P., Hastie, T.,
Tibshirani, R., Botstein, D., and Altman, R. B. (2001). Missing value
estimation methods for DNA microarrays. Bioinformatics 17, 520–525.
Tusher, V. G., Tibshirani, R., and Chu, G. (2001). Significance analysis of
microarrays applied to the ionizing radiation response. Proc. Natl. Acad. Sci.
U.S.A. 98, 5116–5121.
Ulrich, R. G., Rockett, J. C., Gibson, G. G., and Pettit, S. D. (2004). Overview
of an interlaboratory collaboration on evaluating the effects of model
hepatotoxicants on hepatic gene expression. Environ. Health Perspect. 112,
423–427.
Waters, M., Boorman, G., Bushel, P., Cunningham, M., Irwin, R., Merrick, A.,
Olden, K., Paules, R., Selkirk, J., Stasiewicz, S., et al. (2003). Systems
toxicology and the Chemical Effects in Biological Systems (CEBS)
knowledge base. EHP Toxicogenomics 111, 15–28.
Watkins, P. B., Kaplowitz, N., Slattery, J. T., Colonese, C. R., Colucci, S. V.,
Stewart, P. W., and Harris, S. C. (2006). Aminotransferase elevations in
healthy adults receiving 4 grams of acetaminophen daily: A randomized
controlled trial. J. Am. Med. Assoc. 296, 87–93.
Wolfinger, R. D., Gibson, G., Wolfinger, E. D., Bennett, L., Hamadeh, H.,
Bushel, P., Afshari, C., and Paules, R. S. (2001). Assessing gene significance
from cDNA microarray expression data via mixed models. J. Comput. Biol.
8, 625–637.
Zeeberg, B. R., Feng, W., Wang, G., Wang, M. D., Fojo, A. T., Sunshine, M.,
Narasimhan, S., Kane, D. W., Reinhold, W. C., Lababidi, S., et al. (2003).
GoMiner: A resource for biological interpretation of genomic and proteomic
data. Genome Biol. 4, R28.
MULTICENTER STUDY OF ACETAMINOPHEN HEPATOTOXICITY 337
by guest on July 3, 2014http://toxsci.oxfordjournals.org/
Dow
nloaded from