Mechanisms of Paracetamol (Acetaminophen) induced ...
182
Mechanisms of Paracetamol (Acetaminophen) induced Hypothermia Shazma Bashir A thesis submitted in partial fulfilment of the requirements of the University of East London for the degree of Doctor of Philosophy Jan 2018
-
Upload
khangminh22 -
Category
Documents
-
view
0 -
download
0
Transcript of Mechanisms of Paracetamol (Acetaminophen) induced ...
Mechanisms of Paracetamol
(Acetaminophen) induced
Hypothermia
Shazma Bashir
A thesis submitted in partial fulfilment of the requirements of
the University of East London for the degree of Doctor of
Philosophy
Jan 2018
i
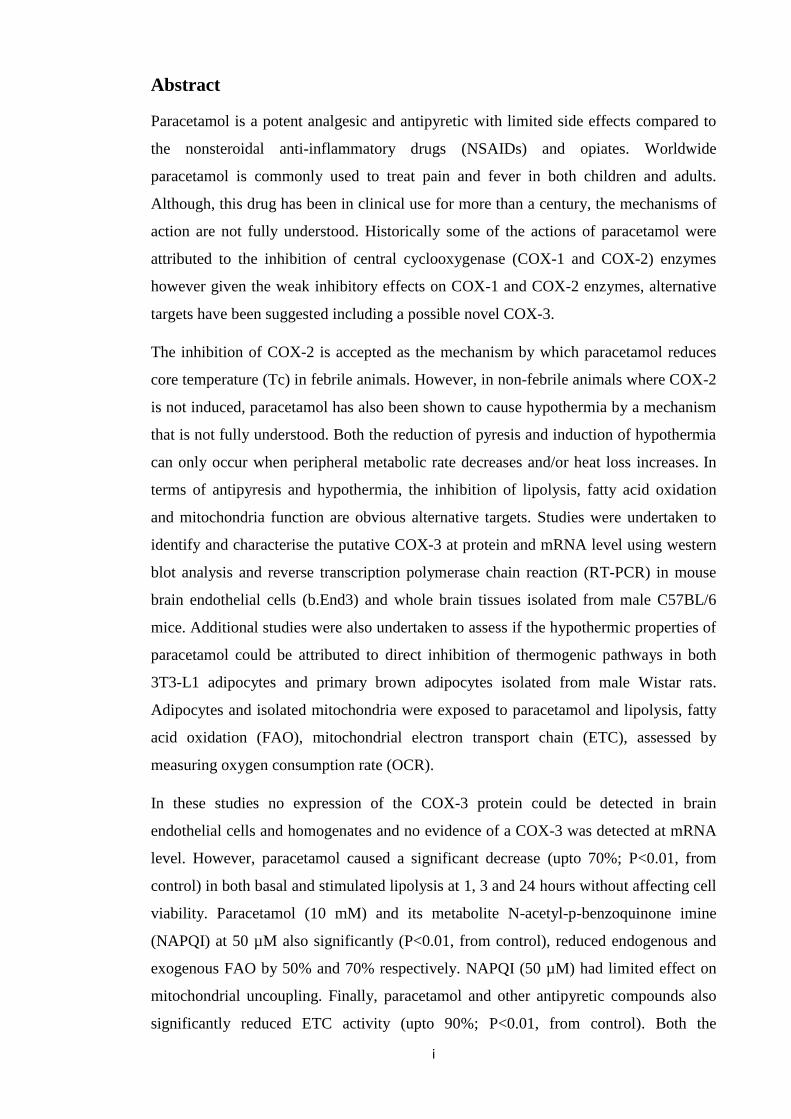
Abstract
Paracetamol is a potent analgesic and antipyretic with limited side effects compared to
the nonsteroidal anti-inflammatory drugs (NSAIDs) and opiates. Worldwide
paracetamol is commonly used to treat pain and fever in both children and adults.
Although, this drug has been in clinical use for more than a century, the mechanisms of
action are not fully understood. Historically some of the actions of paracetamol were
attributed to the inhibition of central cyclooxygenase (COX-1 and COX-2) enzymes
however given the weak inhibitory effects on COX-1 and COX-2 enzymes, alternative
targets have been suggested including a possible novel COX-3.
The inhibition of COX-2 is accepted as the mechanism by which paracetamol reduces
core temperature (Tc) in febrile animals. However, in non-febrile animals where COX-2
is not induced, paracetamol has also been shown to cause hypothermia by a mechanism
that is not fully understood. Both the reduction of pyresis and induction of hypothermia
can only occur when peripheral metabolic rate decreases and/or heat loss increases. In
terms of antipyresis and hypothermia, the inhibition of lipolysis, fatty acid oxidation
and mitochondria function are obvious alternative targets. Studies were undertaken to
identify and characterise the putative COX-3 at protein and mRNA level using western
blot analysis and reverse transcription polymerase chain reaction (RT-PCR) in mouse
brain endothelial cells (b.End3) and whole brain tissues isolated from male C57BL/6
mice. Additional studies were also undertaken to assess if the hypothermic properties of
paracetamol could be attributed to direct inhibition of thermogenic pathways in both
3T3-L1 adipocytes and primary brown adipocytes isolated from male Wistar rats.
Adipocytes and isolated mitochondria were exposed to paracetamol and lipolysis, fatty
acid oxidation (FAO), mitochondrial electron transport chain (ETC), assessed by
measuring oxygen consumption rate (OCR).
In these studies no expression of the COX-3 protein could be detected in brain
endothelial cells and homogenates and no evidence of a COX-3 was detected at mRNA
level. However, paracetamol caused a significant decrease (upto 70%; P<0.01, from
control) in both basal and stimulated lipolysis at 1, 3 and 24 hours without affecting cell
viability. Paracetamol (10 mM) and its metabolite N-acetyl-p-benzoquinone imine
(NAPQI) at 50 µM also significantly (P<0.01, from control), reduced endogenous and
exogenous FAO by 50% and 70% respectively. NAPQI (50 µM) had limited effect on
mitochondrial uncoupling. Finally, paracetamol and other antipyretic compounds also
significantly reduced ETC activity (upto 90%; P<0.01, from control). Both the

ii
maintenance of normal body temperature (Tb) and the induction of pyresis require
increased mitochondrial ETC activity normally initiated centrally and driven
peripherally by reduction of substrates such as fatty acids and glucose. The failure to
identify the COX-3 protein and the direct inhibition of lipolysis, FAO and ETC activity
indicate that antipyretic actions of paracetamol could partly be attributed to it actions on
peripheral energy generation systems and provide new drug targets for reducing fever
and chemically inducing hypothermia.
Keywords: paracetamol, acetaminophen, hypothermia, COX-3, lipolysis, fatty acid
oxidation, electron transport chain
iii
Table of contents
Abstract……………………………………………………………………………….…i
Table of contents……………………………………………………………………….iii
List of tables……..………………………………………………………...………..…vii
List of figures……………………………………………………………...……….…viii
Abbreviations……………………………………………………………………….....xii
Acknowledgements………………………………………………………………......xvii
Dedication……………………………………………………………………….......xviii
1. Introduction……………………………………………………………………….....1
1.1. Paracetamol…………………………………………………………………......1
1.2. Paracetamol: Proposed mechanisms of action……………………………...…..2
1.3. Paracetamol absorption and metabolism………………………………………..2
1.4. Paracetamol Toxicity……………………………………………………….......4
1.5. Cyclooxygenases (COX)………………………………………………………..5
1.6. Existence of COX variants………………………………………………...……6
1.7. Evidence for COX-3…………………………………………………………….7
1.8. Evidence for the involvement of COX-3 in thermoregulation…………..…….11
1.9. Evidence for COX-3; questions about experimental design………………..…12
1.10. Paracetamol induced hypothermia: the role of COX enzymes……………....15
1.11. Paracetamol induced hypothermia: other than COX?……………...……...…16
1.12. Thermoregulation………………………………………………………...…..17
1.13. Basic concept of thermogenesis and thermoneutral zone…………….………19
1.14. Thermogenic Mechanisms…………………………………………….……...20
1.15. The Adipose Tissue…………………………………………………………..21
1.16. Types of Adipose tissue………………………………………………….…...21
1.17. Adipocytes…………………………………………………………………....21
1.18. Adipogenesis and its regulation………………………………………...…….22
1.19. Lipolysis………………………………………………………………..….....23
1.20. Brown and beige fat mediated non-shivering thermogenesis………………...25
1.21. Paracetamol and thermogenesis…………………………………………...….25
1.22. Cellular Respiration…………………………………………………………..27
1.23. Fatty Acid β-Oxidation (FAO)……...……………………………….…...…..27
1.24. Electron Transport Chain (ETC)……………………………………………..28
1.25. Inhibitors of Oxidative Phosphorylation (OXPHOS)……………………......29
1.26. Regulated uncoupling and Heat Generation…………………………............29
1.27. Research Aims and Hypothesis……………………………………..………..30
1.28. Research Plan……………………………………………………………..….31
2. Materials and Methods………………………………………….………………….32
2.1. Suppliers……………………………………………………………………….32
2.2. Materials……………………………………………………………………….33
2.3. Equipment…………………………………………………………………..…34
2.4. Methods……………………………………………………………................37
2.4.1. Cell culture……………………………………………………….........38
2.4.2. Sample preparation to determine COX protein expression………….…38
2.4.3. Bradford assay and Western blotting to determine COX protein
iv
expression………………………………………………………………39
2.4.4. Dot blots………………………………………………………………..41
2.4.5. Sample preparation for mRNA extraction…………………………......41
2.4.6. Direct mRNA extraction…………………………………………...…..42
2.4.7. Expression of COX mRNA using RT-PCR…………………………....43
2.4.8. Differentiation of 3T3-L1 pre-adipocytes ……………………………..46
2.4.9. Oil Red O staining……………………………………….…………..…47
2.4.10. MTT assay on 3T3-L1 differentiated adipocytes ……….………….....47
2.4.11. Lipolysis assay in 3T3-L1 differentiated adipocytes………………...…47
2.4.12. Isolation of rat primary brown adipocytes………………………….…..48
2.4.13. MTT assay on rat primary brown adipocytes………………………..…49
2.4.14. Lipolysis assay in rat primary brown adipocytes……………………....49
2.4.15. Measurement of oxygen consumption rate (OCR) using XFp Seahorse
Analyser………………………………………………………………...50
2.4.15.1. Seeding 3T3-L1 cells in Seahorse XFp cell culture
miniplates…………………………………………………………….....52
2.4.15.2. Hydration of Seahorse XFp sensor cartridge……………....…52
2.4.15.3. Loading the Seahorse XFp sensor cartridge with
compounds……………………………………………………………...53
2.4.15.4 Washing cells in Seahorse XFp cell culture miniplates…........54
2.4.16. XFp Experiments…………………………………………………...…..54
2.4.16.1. Effect of paracetamol on fatty acid oxidation (FAO)…….…..54
2.4.16.2. Mitochondrial bioenergetic profile of 3T3-L1 adipocytes using
Seahorse XFp cell Mito Stress Test………………………………….....56
2.4.16.3. Effect of paracetamol on basal and norepinephrine and
isoproterenol stimulated OCR in 3T3-L1 adipocytes…..………………57
2.4.16.4. Effect of paracetamol, aminopyrine and antipyrine on basal and
norepinephrine and isoproterenol stimulated OCR in 3T3-L1
adipocytes…………………………………………………………….....57
2.4.16.5. Elucidation of mechanistic activity of inhibitors that affect
mitochondrial function using electron flow assay……………………....58
2.5.Statistical analysis…………………………………………………………...….60
3. Identification of COX-3 mRNA and protein in rodents ……………….................61
3.1. Introduction………………………………………………………………...….61
3.2. Methods…………………………………………………………………….….62
3.3. Results…………………………………………………………………………63
3.3.1. Detection of COX-1 and COX-3 protein expression in b.End3 cells…..63
3.3.2. Detection of COX-1 and COX-3 protein expression in C57BL/6 mice
brain homogenates……………………………………………………...…64
3.3.3. Detection of COX immunoreactivity using Dot blots……………...…..65
3.3.4. Expression of COX mRNA in naive and LPS stimulated b.End3
cells……………………………………………………………………...65
3.3.5. Expression of COX mRNA in C57BL/6 mice brain homogenates...…..67
3.3.6. Expression of COX-1 and COX-3 mRNA in b.End3
cells…………………………………………………………………….….68
3.3.7. Expression of COX-1 and COX-3 mRNA in C57BL/6 mice brain
homogenates…………………………………………………………..…..69
3.4. Discussion………………………………………………………………………70
4. Effect of paracetamol, aminopyrine and antipyrine on lipolysis in rodent
adipocytes……………………………………………………………………………72
4.1. Introduction……………………………………………………………………72
4.2. Methods………………………………………………………………………..73
v
4.3. Results…………………………………………………………………………74
4.3.1. 3T3-L1 differentiation………………………………………………...…74
4.3.2. Effect of paracetamol on basal lipolysis in 3T3-L1 adipocytes…….…...75
4.3.3. Effect of paracetamol on norepinephrine stimulated lipolysis in 3T3-L1
adipocytes……………………………………………………………….....77
4.3.4. Effect of paracetamol on isoproterenol stimulated lipolysis in 3T3-L1
adipocytes (added simultaneously)………………………………………...78
4.3.5. Effect of paracetamol pre-treatment on isoproterenol stimulated lipolysis
in 3T3-L1 adipocytes……………………………………………………....80
4.3.6. Chronic effect of paracetamol pre-treatment on isoproterenol stimulated
lipolysis in 3T3-L1 adipocytes……………………………………...……..84
4.3.7. Effect of paracetamol on forskolin stimulated lipolysis in 3T3-L1
adipocytes…………………………………………………………………..85
4.3.8. Effect of paracetamol on 8-Br-cAMP stimulated lipolysis in 3T3-L1
adipocytes………………………………………………………………......87
4.3.9. Effect of aminopyrine and antipyrine on basal lipolysis in 3T3-L1
adipocytes……………………………………………………………...…..88
4.3.10. Effect of paracetamol, aminopyrine and antipyrine on basal lipolysis in
rat primary brown adipocytes………………………………………….….89
4.3.11. Effect of paracetamol, aminopyrine and antipyrine on basal lipolysis in
rat primary brown adipocytes………………………………………….….90
4.3.12. Effect of paracetamol, aminopyrine and antipyrine on norepinephrine
stimulated lipolysis in rat primary brown adipocytes……………………92
4.4. Discussion……………………………………………………………………...94
5. Effect of Paracetamol on Mitochondrial Fatty Acid uptake and Oxidation………...98
5.1. Introduction………………………………………………………………...…..98
5.2. Methods……………………………………………………………………….100
5.3. Results…………………………………………………………………...……100
5.3.1. Effect of paracetamol on FAO…………………….…………...………100
5.3.2. Effect of paracetamol on individual parameters of mitochondrial function
using FAO assay……………………………………………….…………103
5.3.3. Effect of paracetamol and N-acetyl-p-benzoquinone imine (NAPQI) on
FAO………………………………………………………………….…..105
5.3.4. Comparison of the effect of paracetamol and NAPQI on FAO………...107
5.3.5. Effect of paracetamol and NAPQI on individual parameters of
mitochondrial function using FAO assay………………………………...110
5.4. Discussion…………………………………………………………....………113
6. Effect of Paracetamol, Aminopyrine and Antipyrine on cellular and mitochondrial
oxygen consumption……………………………………………………….…….....116
6.1. Introduction………………………………………………………………….116
6.2. Methods…………………………………………………………………...…117
6.3. Results………………………………………………………………….…....118
6.3.1. Mitochondrial bioenergetic profile of 3T3-L1 adipocytes…………...…118
6.3.2. Effect of paracetamol on basal OCR……………………………………119
6.3.3. Effect of paracetamol on norepinephrine and isoproterenol stimulated
OCR…………………………………………………………………….....120
6.3.4. Effect of paracetamol, aminopyrine and antipyrine on basal OCR……..121
6.3.5. Effect of paracetamol, aminopyrine and antipyrine on isoproterenol
stimulated OCR……………………………………………………….......122
6.3.6. Elucidation of mechanistic activity of inhibitors that affect mitochondrial
function…………………………………………………………...……….124
6.3.7. Elucidation of the mitochondrial target of hypothermic agents……...…126
vi
6.2.8. Elucidation of the mechanistic activity of hypothermic agents…………127
6.4. Discussion…………………………………………………………………....130
7. Final discussion and future work…………………………………………………...133
8. List of abstracts…………………………………………………...………...………141
9. References……………………………………………………………….………....142
vii
List of Tables
Table 1.1: COX-3 experimental data related studies
Table 2.1: COX-1 and COX-3 antibodies
Table 2.2: Published primers
Table 2.3: RT-PCR conditions for published primers
Table 2.4: Custom made primers for COX-1 and COX-3
Table 2.5: RT-PCR conditions for custom made primers for COX-1 and COX-3
Table 2.6: Mitochondrial function parameters
Table 2.7: XF FAO assay parameters
Table 7.1: Key findings of current research

viii
List of Figures
Figure 1.1: Paracetamol metabolism.
Figure 1.2: The arachidonic acid (AA) pathways.
Figure 1.3: Thermoregulatory circuitry.
Figure 1.4: Types of thermogenesis in homeothermic species.
Figure 1.5: Differentiation of preadipocytes into adipocytes.
Figure 1.6: Regulation of lipid metabolism by adipose tissue.
Figure 1.7: Mechanism of fatty acid induced activation of uncoupling protein
(UCP) and increased heat generation.
Figure 1.8: The FAO pathway.
Figure 2.1: Primers used for RT-PCR.
Figure 2.2: Schematic of Agilent Seahorse XF Cell Mito Stress Test Profile.
Figure 3.1: Detection of COX-1, COX-3, β-actin protein expression, COX-1
control peptide, secondary antibody control by Western blotting in b.End3 cells.
Figure 3.2: Detection of COX-1, COX-3, COX-1 control peptide, β-actin protein
expression by Western blotting in C57BL/6 mice brain homogenates.
Figure 3.3: Detection of immunoreactivity of COX-1 and COX-3 using dot
blots.
Figure 3.4: mRNA expression of COX-1 and GAPDH by RT-PCR in naive and
LPS stimulated b.End3 cells for 1 and 3 hours.
Figure 3.5: mRNA expression of COX-2 and GAPDH by RT-PCR in naive and
LPS stimulated b.End3 cells for 1 and 3 hours.
Figure 3.6: mRNA expression of COX-3 and GAPDH by RT-PCR in naive and
LPS stimulated b.End3 cells for 1 and 3 hours.
Figure 3.7: mRNA expression of GAPDH, COX-1 and COX-3 by RT-PCR in
mice brain homogenate.
Figure 3.8: mRNA expression of GAPDH, COX-1, COX-2 and COX-3 by RT-
PCR in mice brain homogenate.
Figure 3.9: mRNA expression of GAPDH, COX-1 and COX-3 by RT-PCR in
b.End3 cells.
Figure 3.10: mRNA expression of GAPDH, COX-1 and COX-3 by RT-PCR in
mice brain homogenate.
Figure 4.1: Microscopic images of Oil Red O stained 3T3-L1 cells (passage 8)
subjected to adipocyte differentiation for 7 days (Qualitative).

ix
Figure 4.2: Quantitative analysis of 3T3-L1 cells differentiation using Oil Red O
staining.
Figure 4.3: Effect of paracetamol on basal lipolysis in 3T3-L1 adipocytes at 1, 3
and 24 hours.
Figure 4.4: Effect of paracetamol on norepinephrine stimulated lipolysis in 3T3-
L1 adipocytes at 1 and 3 hours.
Figure 4.5: Effect of paracetamol on isoproterenol stimulated lipolysis in 3T3-
L1 adipocytes at 1 hour.
Figure 4.6: Effect of paracetamol on isoproterenol stimulated lipolysis in 3T3-
L1 adipocytes at 3 hours.
Figure 4.7: Effect of paracetamol on isoproterenol stimulated lipolysis in 3T3-
L1 adipocytes after 24 hours.
Figure 4.8: Effect of paracetamol pre-treatment on isoproterenol stimulated
lipolysis in 3T3-L1 adipocytes at 1 hour.
Figure 4.9: Effect of paracetamol pre-treatment on isoproterenol stimulated
lipolysis in 3T3-L1 adipocytes at 3 hours.
Figure 4.10: Effect of paracetamol pre-treatment on isoproterenol stimulated
lipolysis in 3T3-L1 adipocytes at 24 hours.
Figure 4.11: Chronic effect of paracetamol pre-treatment on isoproterenol
stimulated lipolysis in 3T3-L1 adipocytes after 24 and 48 hours.
Figure 4.12: Effect of paracetamol on forskolin stimulated lipolysis in 3T3-L1
adipocytes at 1, 3 and 24 hours.
Figure 4.13: Effect of paracetamol on 8-Br-cAMP stimulated lipolysis in 3T3-
L1 adipocytes at 3 and 24 hours.
Figure 4.14: Effect of aminopyrine and antipyrine on basal lipolysis in 3T3-L1
adipocytes at 1, 3 and 24 hours.
Figure 4.15: Effect of paracetamol, aminopyrine and antipyrine on basal
lipolysis in rat primary brown adipocytes at 1 hour.
Figure 4.16: Effect of paracetamol on basal lipolysis in rat primary brown
adipocytes at 1 and 24 hours.
Figure 4.17: Effect of aminopyrine on basal lipolysis in rat primary brown
adipocytes at 1 and 24 hours.
Figure 4.18: Effect of antipyrine on basal lipolysis in rat primary brown
adipocytes at 1 and 24 hours.
x
Figure 4.19: Effect of paracetamol on norepinephrine stimulated lipolysis in rat
primary brown adipocytes at 1 and 24 hours.
Figure 4.20: Effect of aminopyrine on norepinephrine stimulated lipolysis in rat
primary brown adipocytes at 1 and 24 hours.
Figure 4.21: Effect of antipyrine on norepinephrine stimulated lipolysis in rat
primary brown adipocytes at 1 and 24 hours.
Figure 5.1: Effect of paracetamol on FAO during basal and after oligomycin
addition in 3T3-L1 adipocytes.
Figure 5.2: Effect of paracetamol on FAO after FCCP and rotenone/ antimycin
A addition in 3T3-L1 adipocytes.
Figure 5.3: Effect of paracetamol on individual parameters of mitochondrial
function using FAO assay in 3T3-L1 adipocytes.
Figure 5.4: Effect of paracetamol on individual parameters of mitochondrial
function using FAO assay in 3T3-L1 adipocytes.
Figure 5.5: Effect of paracetamol and NAPQI on FAO during basal and after
oligomycin addition in 3T3-L1 adipocytes.
Figure 5.6: Effect of paracetamol and NAPQI on FAO after FCCP and rotenone/
antimycin A addition in 3T3-L1 adipocytes.
Figure 5.7: Comparison of the effect of paracetamol and NAPQI on FAO during
basal and after oligomycin addition in 3T3-L1 adipocytes.
Figure 5.8: Comparison of the effect of paracetamol and NAPQI on FAO after
FCCP and rotenone/ antimycin A addition in 3T3-L1 adipocytes.
Figure 5.9: Effect of paracetamol and NAPQI on individual parameters of
mitochondrial function using FAO assay in 3T3-L1 adipocytes.
Figure 5.10: Effect of paracetamol and NAPQI on individual parameters of
mitochondrial function using FAO assay in 3T3-L1 adipocytes.
Figure 6.1: Bioenergetic profile of 3T3-L1 adipocytes.
Figure 6.2: Effect of paracetamol on basal OCR in 3T3-L1 adipocytes.
Figure 6.3: Effect of paracetamol on norepinephrine and isoproterenol
stimulated OCR in 3T3-L1 adipocytes.
Figure 6.4: Effect of paracetamol, aminopyrine and antipyrine on basal OCR in
3T3-L1 adipocytes.
Figure 6.5: Effect of paracetamol on isoproterenol stimulated OCR in 3T3-L1
adipocytes.
xi
Figure 6.6: Effect of aminopyrine and antipyrine on isoproterenol stimulated
OCR in 3T3-L1 adipocytes.
Figure 6.7: Elucidation of mechanistic activity of inhibitors that affect
mitochondrial function (5 µg mitochondria).
Figure 6.8: Elucidation of the mitochondrial target of hypothermic agents (5 µg
mitochondria).
Figure 6.9: Elucidation of the mechanistic activity of hypothermic agents (2.5 µg
mitochondria).

xii
Abbreviations
AC Adenylyl cyclase
ACS Acyl-CoA synthetases
ADP Adenosine diphosphate
ATP Adenosine triphosphate
ATGL Adipocyte triglyceride lipase
AR Adrenergic receptor
XFp Agilent Seahorse Analyzer
ALT Alanine transaminase
α Alpha
α₁ Alpha-1 adrenergic receptor
α₂ Alpha-2 adrenergic receptor
Ta Ambient temperature
AM Aminopyrine
AT Antipyrine
A Ampere
∼ Approximately
AA Arachidonic acid
AST Aspartate transaminase
N3- Azide
bp Base pairs
β Beta
β₁ Beta-1 adrenergic receptor
β₂ Beta-2 adrenergic receptor
β₃ Beta-3 adrenergic receptor
Tb Body temperature
BAT Brown adipose tissue
C57BL/6 C57 black 6
CB₁ Cannabinoid-1 receptor
CO Carbon monoxide
CCCP Carbonyl cyanide m-chlorophenyl hydrazone
FCCP Carbonyl cyanide-4-(trifluoromethoxy)phenylhydrazone
CPT Carnitine palmitoyl transferase
CPT1 Carnitine palmitoyltransferase 1

xiii
CPT2 Carnitine palmitoyltransferase 2
CAT Carnitine translocase
CGI-58 Comparative gene identification-58
cm Centimetre
CNS Central nervous system
CoA Coenzyme A
cDNA Complementary Deoxyribonucleic Acid
TC Core temperature
CN- Cyanide
cAMP Cyclic adenosine monophosphate; 3',5'-cyclic adenosine
monophosphate
COX Cyclooxygenase
COX-1 Cyclooxygenase-1
COX-1b Cyclooxygenase-1b
COX-1+/–
Cyclooxygenase-1-heterozygous-knockout
COX-1–/–
Cyclooxygenase-1-homozygous-knockout
COX-2 Cyclooxygenase-2
COX-2+/–
Cyclooxygenase-2-heterozygous-knockout
COX-2–/–
Cyclooxygenase-2-homozygous-knockout
COX-3 Cyclooxygenase-3
COX-3–/–
Cyclooxygenase-3-homozygous-knockout
CYP450 Cytochrome P450
CYP 1A2 Cytochrome P450 1A2
CYP 2E1 Cytochrome P450 2E1
CYP 3A4 Cytochrome P450 3A4
°C Degree Celsius
DNA Deoxyribonucleic acid
DGs Diglycerides
DILI Drug induced liver injury
ETC Electron transport chain
Eto Etomoxir
XF Extracellular flux
ERK Extracellular signal regulated kinases
FAAH Fatty acid amide hydrolase
FAO Fatty acid oxidation

xiv
FAT/CD36 Fatty acid translocase/ cluster of differentiation 36
FACS Fatty acyl CoA synthase
Fe4+=OPP*+ Ferryl protoporphyrin IX radical cation
FFA Free fatty acid
GABA Gamma-aminobutyric acid
GAPDH Glyceraldehyde 3-phosphate dehydrogenase
GSH Glutathione
Gαs Gs alpha subunit
Gαi Gi alpha subunit
g/day Grams/day
> Greater than
IC₅₀ Half maximal inhibitory concentration
h Hour
HSL Hormone sensitive lipase
H+ Hydrogen ions
H₂O₂ Hydrogen peroxide
PGG₂ Hydroperoxy endoperoxide
PGH₂ Hydroxy endoperoxide
IMM Inner mitochondrial membrane
IU/L International Units/Litre
Iso Isoproterenol
kb Kilobyte
kDa Kilodaltons
KO Knockout
LPS Lipopolysaccharide
LCFA Long-chain (C14–C18) fatty acids
M Molar
MAPK Mitogen activated protein kinase
MnSOD Manganese superoxide dismutase
MPTP Membrane permeability transition pore
FABPpm Membrane associated fatty acid binding protein
mRNA Messenger Ribonucleic Acid
µg/mL Microgram/millilitre
μm Micrometer
μM Micromolar
xv
mg/kg Milligram/kilogram
mM Millimolar
mV Millivolts
Δψ Mitochondrial membrane potential
MGs Monoglycerides
NAC N-acetylcysteine
APAP N-acetyl-p-aminophenol
NAPQI N-acetyl-p-benzoquinone imine
NADPH Nicotinamide adenine dinucleotide phosphate (reduced form)
NOX4 NADPH oxidase isoform
AM404 N-arachidonoylphenolamine
NADH Nicotinamide adenine dinucleotide (reduced form)
NOP Nociceptin/orphanin FQ peptide
NSAIDs Nonsteroidal anti-inflammatory drugs
NE Norepinephrine
n Number of replicates
redox Oxidation/reduction
OXPHOS Oxidative phosphorylation
OCR Oxygen consumption rate
PA Paracetamol
PCOX-1a Partial cyclooxygenase-1a
PCOX-1b Partial cyclooxygenase-1b
% Percentage
POX Peroxidase
PGC-1α Peroxisome proliferator-activated receptor γ coactivator 1α
POA Preoptic area of anterior hypothalamus
PGI₂ Prostacyclin I₂
PGD₂ Prostaglandin D₂
PGE₂ Prostaglandin E₂
PGF2α Prostaglandin F2α
6-keto PGF1α 6-keto prostaglandin F1α
PGHS Prostaglandin H synthase
PGHS-1 Prostaglandin-endoperoxide synthase 1
PGHS-2 Prostaglandin-endoperoxide synthase 2
PGs Prostaglandins
xvi
PKA Protein kinase A
FADH₂ Reduced flavin adenine dinucleotide
RNA Ribonucleic acid
RCR Respiratory control ratio
RT-PCR Reverse transcription polymerase chain reaction
SD Standard deviation
SNPs Single-nucleotide polymorphisms
Gi Inhibitory regulative G-protein
Gs Stimulative regulative G-protein
SULT Sulfotransferase
SNS Sympathetic nervous system
TXs Thromboxanes
TXA2 Thromboxanes A2
TXB2 Thromboxanes B2
TRPA1 Transient receptor potential ankyrin 1
TRPA1−/− Transient receptor potential ankyrin 1 knockout
TRPV1 Transient receptor potential vanilloid 1
TRPV1−/− Transient receptor potential vanilloid 1 knockout
TCA Tricarboxylic acid cycle
TGs Triglycerides
UDP Uridine 5'-diphospho
UGT UDP-glucuronosyl transferases
UCPs Uncoupling proteins
UCP1 Uncoupling protein 1
UCP2 Uncoupling protein 2
UCP3 Uncoupling protein 3
U.K. United Kingdom
U.S.A. United States of America
V Volts
WAT White adipose tissue
WT Wild type
xvii
Acknowledgements
In the name of God, the Most Gracious, the Most Merciful.
I would like to sincerely acknowledge Dr Winston A. Morgan for always being very
supportive, encouraging and motivating. My learning experience was exceptional under
his kind supervision and guidance. I would also like to express my gratitude to Dr Samir
S. Ayoub for his excellent skills, experience and additional support. Also, special thanks
go to Dr Mohammed S. Meah and Dr Elizabeth K. Westhead for their unlimited support
and encouragement throughout my studies. I greatly appreciate Ms Elizabeth Wood for
providing b.End3 cells, Dr Steven Millership for his guidance in culturing and
differentiating 3T3-L1 pre-adipocytes and Prof Michael P. Seed for his help with animal
tissues. Lastly, big thanks to Mr Nick Howe and Agilent Seahorse for an instrument
loan and providing great technical support during the final stages of my PhD.

xviii
Dedication
This PhD thesis is dedicated to my beloved family.
1
Chapter 1: Introduction
1.1. Paracetamol
Paracetamol, (acetaminophen) or N-acetyl-p-aminophenol (APAP) is one of the most
widely used antipyretic and analgesic drugs worldwide (Yoon et al., 2016; Jóźwiak-
Bebenista and Nowak, 2014). Paracetamol related compounds first came to notice in the
1880s when acetanilide was dispensed by mistake to a patient in place of naphthalene
and caused a significant reduction in fever.
Phenacetin and paracetamol were originally synthesized by Morse in 1878 (Morse,
1878), however clinical trials by Von Mering concluded by error that paracetamol was
more toxic therefore phenacetin was introduced into medical practice in 1887 and
became the most widely used analgesic until it was discovered to be nephrotoxic (Von
Mering, 1893). In 1948, paracetamol was rediscovered (Brodie and Axelrod, 1948) and
by 1955, paracetamol was being marketed by McNeil Laboratories in the form of a
prescribed medication (Tylenol) for children (Jóźwiak-Bebenista and Nowak, 2014).
One year later, paracetamol was available as an over the counter medication (Panadol)
in the United Kingdom (U.K.) produced by Frederick Stearns & Co (Jóźwiak-Bebenista
and Nowak, 2014). Today many prescription and non-prescription formulations contain
paracetamol alone or in combination with other drugs (Ghanem et al., 2016).
Paracetamol is available as tablets, effervescent tablets, suspension, powder (sachets)
and rectal suppositories (Jóźwiak-Bebenista and Nowak, 2014). When administered
orally the clinical actions of paracetamol can be seen by 30 minutes or after 15 minutes
using fast-release tablets.
Since the 1980’s paracetamol has become the first drug of choice for treating pain and
fever in children in situations where use of nonsteroidal anti-inflammatory drugs
(NSAIDs) are contraindicated (Cranswick and Coghlan, 2000; Leung, 2012). After of
over a century of discovery and use some of the mechanism of actions of paracetamol
particularly around the impact on cyclooxygenase (COX) enzymes remains a matter
fierce of debate (Gentry et al., 2015; Eberhardt et al., 2017). It is generally accepted that
paracetamol has similar analgesic and antipyretic properties as NSAIDs, without anti-
inflammatory activity. By contrast paracetamol is associated with fewer side effects
than the NSAIDs (Jóźwiak-Bebenista and Nowak, 2014).
2
1.2. Paracetamol: Proposed mechanisms of action
In terms of their main actions, traditionally both paracetamol and the NSAIDs were
thought to inhibit the conversion of arachidonic acid (AA) into prostaglandin H - PGH₂,
catalysed by prostaglandin H synthase (PGHS) or cyclooxygenase (COX). Historically
two isoenzymes of PGHS termed COX-1 (PGHS-1) and COX-2 (PGHS-2) (Hinz and
Brune, 2002) have been discovered.
Traditional NSAIDs and COX-2 inhibiting drugs exert their actions by inhibiting the
COX enzyme by competing with arachidonic acid to bind to the enzyme active site
(Anderson, 2008). By contrast paracetamol is thought to act by reducing a ferryl
protoporphyrin IX radical cation (Fe4+=OPP*+) at peroxidase site.
1.3. Paracetamol absorption and metabolism
The absorption of paracetamol occurs rapidly in the duodenum (McGill and Jaeschke,
2013). At safe doses, peak concentrations will be achieved within 1.5 hours and half-life
of 1.5 – 3 hours, at overdose peak serum concentrations is observed within 4 hours
(McGill and Jaeschke, 2013). Paracetamol goes through the blood brain barrier with
ease and is distributed uniformly in the central nervous system (CNS) at all doses
(Courad et al., 2001; Kumpulainen et al., 2007; Ara and Ahmad, 1980; Massey et al.,
1982; Fischer et al., 1981). In man a plasma concentration of 200-300 µg/mL is
considered toxic and the patient is in need of serious treatment. Similarly in rodent
studies doses of 100 mg/kg and above are associated with some biomarkers of toxicity,
by 300 mg/kg there is gross evidence of toxicity. In addition doses of 100-500 mg/kg
have been linked to plasma concentration of 1-10 mM in rodents. In vitro, similar
concentrations are normally associated with alterations of cellular and mitochondrial
function (Fischer et al., 1981; Orbach et al., 2017).
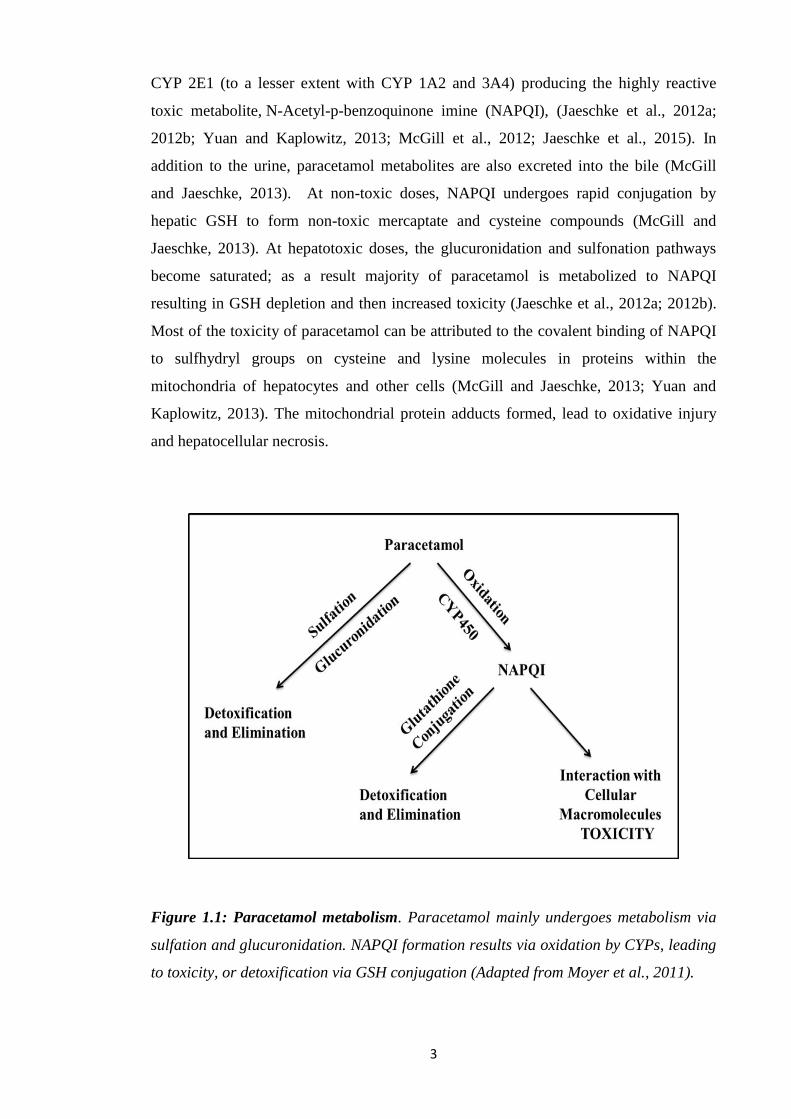
Metabolism primarily occurs within liver and involves three major routes (Figure 1.1).
The majority (∼90%) of the drug enters phase II metabolic pathways, where
paracetamol is conjugated via UDP-glucuronosyl transferases (UGT) or sulfotransferase
(SULT), with conversion to glucuronidated and sulfated metabolites eliminated in the
urine (McGill and Jaeschke, 2013). About 2% of the drug is excreted in the urine
without having undergone any metabolism (McGill and Jaeschke, 2013). Another
portion of paracetamol (∼10%) undergoes phase I oxidation by hepatic cytochrome
3
CYP 2E1 (to a lesser extent with CYP 1A2 and 3A4) producing the highly reactive
toxic metabolite, N-Acetyl-p-benzoquinone imine (NAPQI), (Jaeschke et al., 2012a;
2012b; Yuan and Kaplowitz, 2013; McGill et al., 2012; Jaeschke et al., 2015). In
addition to the urine, paracetamol metabolites are also excreted into the bile (McGill
and Jaeschke, 2013). At non-toxic doses, NAPQI undergoes rapid conjugation by
hepatic GSH to form non-toxic mercaptate and cysteine compounds (McGill and
Jaeschke, 2013). At hepatotoxic doses, the glucuronidation and sulfonation pathways
become saturated; as a result majority of paracetamol is metabolized to NAPQI
resulting in GSH depletion and then increased toxicity (Jaeschke et al., 2012a; 2012b).
Most of the toxicity of paracetamol can be attributed to the covalent binding of NAPQI
to sulfhydryl groups on cysteine and lysine molecules in proteins within the
mitochondria of hepatocytes and other cells (McGill and Jaeschke, 2013; Yuan and
Kaplowitz, 2013). The mitochondrial protein adducts formed, lead to oxidative injury
and hepatocellular necrosis.
Figure 1.1: Paracetamol metabolism. Paracetamol mainly undergoes metabolism via
sulfation and glucuronidation. NAPQI formation results via oxidation by CYPs, leading
to toxicity, or detoxification via GSH conjugation (Adapted from Moyer et al., 2011).
4
In the CNS paracetamol undergoes other important reactions which are beyond the
scope of this thesis, for example interaction with fatty acid amide hydrolase (FAAH)
and AA and producing fatty acid amide N-(4-hydroxyphenyl) arachidonylamide
(AM404) in the CNS of rodents (Rivera et al., 2017; Muramatsu et al., 2016).
1.4. Paracetamol Toxicity
Paracetamol induced liver injury is the most common form of drug induced liver injury
(DILI) in humans and a leading cause for almost 50% of the cases of acute liver failure
around the world (Lee, 2012). This damage can be demonstrated in rodents after acute
administration of doses above 100mg/kg (Riveria et al., 2017).
Several studies involving mouse models have been conducted. Paracetamol metabolite
protein adducts seem to cause disruption of the electron transport chain (ETC) and
results in reactive oxygen and reactive nitrogen species formation in mitochondria
(Jaeschke et al., 2012a). In C57BL/6 mice (150 mg/kg) other actions include opening of
membrane permeability transition pore (MPTP) and deoxyribonucleic acid (DNA)
breakage linked to mitochondrial dysfunction in hepatocytes with no alanine
transaminase (ALT) release. However, high dose (300 mg/kg) resulted irreversible
mitochondrial dysfunction and necrosis (Jaeschke et al., 2012a; Kon et al., 2004; Gujral
et al., 2002; Hu et al., 2016).
In relating the animal studies to humans the Rumack-Matthew nomogram suggest that
patients with levels of 200 μg/mL at 4 hours and 25 μg/mL at 16 hours falls under
“probable toxicity line”, with 60% incidence of severe hepatotoxicity (defined as
aspartate transaminase (AST) > 1000 IU/L) and 5% mortality (Rumack 2002; Heard,
2008; Prescott et al., 1979; Harrison et al., 1991; Smilkstein et al., 1988; Kerr et al.,
2005; de Andrade et al., 2015; McGovern et al., 2015). A “high toxicity line” starting
with 300 μg/mL at 4 hours shows 90% incidence of severe hepatotoxicity and 24%
mortality (Heard, 2008). In the United States of America (U.S.A), Australia and New
Zealand, a different “treatment line,” was introduced beginning at a 4-hour paracetamol
concentration of 150 μg/mL to avoid errors in intake history and lab results (Rumack
2002; Smilkstein et al., 1988).
5
1.5. Cyclooxygenases
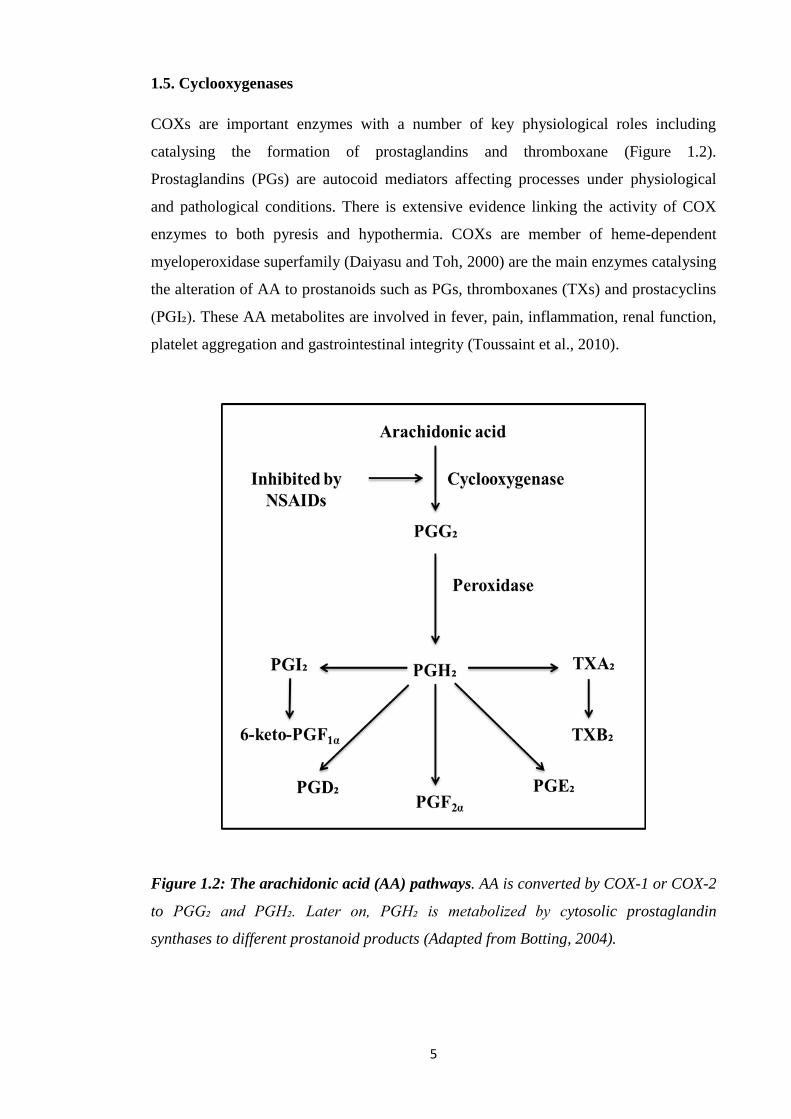
COXs are important enzymes with a number of key physiological roles including
catalysing the formation of prostaglandins and thromboxane (Figure 1.2).
Prostaglandins (PGs) are autocoid mediators affecting processes under physiological
and pathological conditions. There is extensive evidence linking the activity of COX
enzymes to both pyresis and hypothermia. COXs are member of heme-dependent
myeloperoxidase superfamily (Daiyasu and Toh, 2000) are the main enzymes catalysing
the alteration of AA to prostanoids such as PGs, thromboxanes (TXs) and prostacyclins
(PGI₂). These AA metabolites are involved in fever, pain, inflammation, renal function,
platelet aggregation and gastrointestinal integrity (Toussaint et al., 2010).
Figure 1.2: The arachidonic acid (AA) pathways. AA is converted by COX-1 or COX-2
to PGG₂ and PGH₂. Later on, PGH₂ is metabolized by cytosolic prostaglandin
synthases to different prostanoid products (Adapted from Botting, 2004).
6
Based on the phylogenetic analysis, both isoforms of COXs appeared to arise from a
duplication of an ancestral COX gene which occurred early on or before origin of
vertebrate species (Kawamura et al., 2014; Jarving et al., 2004). Both enzymes are
almost identical in their structures with 60-65% homology, 85%-90% between species
(Kawamura et al., 2014) and contain 600 amino acids (Simmons et al., 1991). Three
high mannose oligosaccharides are present in both COX-1 and COX-2, thus helps in
folding of protein whereas a fourth is only present in COX-2, responsible for
degradation (Rouzer and Marnett, 2009).
Both COX isoforms are located in the lumen of nuclear membrane and endoplasmic
reticulum (Simmons et al., 2004); however, COX-1 is also found in lipid bodies in cells
(Bozza et al., 1996). The hydrophobic signal peptides are different in size in both
isoforms (Simmons et al., 2004). COX-1 contains eight amino acids after the signal
peptide unlike COX-2. In 2010, Xu et al. showed that removal of these 7 amino acids in
human COX-1 resulted in enzymatically active mutant and sensitive to aspirin to a
similar extent. In COX-1, glycosylation of asparagine at 410 is crucial for COX and
POX functions and to fold protein properly (Otto et al., 1993).
The gene for human COX-1 and COX-2 is found on chromosome 9q32–q33.3 and
1q25.2–q25.3. A large human COX-1 gene (>28 kb) has 11 exons and 10 introns. In
case of COX-2, the gene (∼8 kb) is short (Simmons et al., 2004). COX-2 consists of 10
exons and 9 introns. In the COX-1 gene (5′ end), signal peptide is encoded by exon 1
and 2, dimerization domain by exon 3 and membrane-binding domain by exon 4.
Encoding of catalytic domain occur by exon 6–11 (Roos and Simmons, 2005).
Therefore, complete exon skipping intron retention would affect the resulting protein
(Roos and Simmons 2005).
1.6. Existence of COX variants
Various types of alternative splicing have been proposed for the COXs isoforms. COX-
1 alternative transcripts are thought to be more common than COX-2 (Roos and
Simmons, 2005). Diaz et al. (1992) first reported a COX-1 splice variant that lacked
exon 9 in human fibroblasts, thus eliminating the N-glycosylation site at residue 409,
essential for proper folding and enzyme activity. The protein resulting from partially
deleted exon 9 was detected in mammalian as well as insect cells; however, no COX

7
products were observed in vivo (Schneider et al., 2005). In addition, a splice variant of
COX-1 was identified that lacked exon 1 with partially retained intron 2 in rat and
thought to form nonsense enzyme (Kitzler et al., 1995). Another variant of COX-1 was
observed in endothelial cells (Hla, 1996).
In an attempt to evaluate the biological relevance of COX splice variants, Roos and
Simmons (2005) emphasised that such variants should represent physiologically
relevant concentrations and cell-specificity, that COX translation must be identified as a
functional protein in vivo. In 2018, in almost all cases these requirements have yet to be
achieved.
1.7. Evidence for COX-3
The somewhat different properties of paracetamol to classical NSAIDs led to the
suggestion of a previously unknown COX isoform more sensitive to paracetamol than
COX-1 or COX-2 and named as COX-3 (Vane and Botting, 1996; Botting et al., 2000).
Furthermore, it was proposed that the activity of this inducible enzyme could accounts
for the antipyretic and analgesic actions of paracetamol (Simmons et al., 1999).
The evidence for a COX-3 has been supported by the cloning, characterisation and
expression of COX-1 splice variant initially named as COX-3 from dog and human
brain (Chandrasekharan et al., 2002). It differs from COX-1 only in the retention of
intron 1, resulting in a potential in-frame insertion of 30 amino acids to the N-terminal
hydrophobic signal peptide of the COX-3 molecule. COX-3 is thought to have similar
catalytic and structural features to that of the other two COX isoforms
(Chandrasekharan et al., 2002).
COX-1 contains 10 introns, whereas COX-2 has 9 introns with the difference in the
placement of intron 1. There is a high degree of conservation of the intron 1 sequence
from species such as dog, human and mouse. Further investigations revealed retention
of intron 1 results in the insertion of 90 nucleotides with 75% sequence matching to
COX-1 of human or mouse intron 1 sequences. However, alignment of the gene
sequences from the start codon with no gaps showed little sequence homology and
would result in a totally different protein in different species (Kis et al., 2005).
The COX messenger ribonucleic acid (mRNA) transcript corresponded to the 2.6 kb
complementary deoxyribonucleic acid (cDNA) clone with unspliced intron 1; termed as

8
COX-3. COX-3 mRNA is found at about 5% of COX-1 mRNA in canine cerebral
cortex (Chandrasekharan et al., 2002). Like COX-1, canine COX-3 was thought to be
regulated during development due to its high expression in some cells and tissues
(Schwab et al., 2003a). As canine COX-3 matches to COX-1, apart from the N-
terminus which does not contribute to the enzymatic activity, it was proposed that
canine COX-3 would have similar activity to other COX enzymes (Simmons et al.,
2004).
The presence of two previously uncharacterized COX-1-related mRNA transcripts (5.2
and 2.8 kb) was also reported in human tissues with human intron-1-targeting probe
with highest levels of 5.2 kb transcript hybridised in the cerebral cortex and then heart
(Chandrasekharan et al., 2002). However, these observations were different from
previously reported COX-1 mRNA expression patterns (O’Neill and Ford-Hutchinson,
1993).
Retention of intron 1 in COX-1 in humans would result in the addition of 94
nucleotides, thus shifting the downstream COX-3 sequence out of frame, a strong
argument against a functional protein (Dinchuk et al., 2003). However, those who
proposed the active COX-3 protein argue that processes such as ribosomal frame
shifting could result an active COX-3 protein (Chandrasekharan et al., 2002). However,
it was argued that no downstream alternative splices would be able to rescue the reading
frame and a catalytically active form of this enzyme making it unlikely to present in
humans (Schwab et al., 2003b; Dinchuck et al., 2003). Moreover, COX-3 is more likely
to simply be a splice error (Shaftel et al., 2003).
Another argument against the reported COX-3 protein is that using antibodies raised in
one species targeting another species. This primarily due to the minimal sequence
homology between human and canine COX-3 if we consider the actual reading frame
following inclusion of intron 1. It would only be 7 out of the 12 amino acids from the
target peptide that would match between human and canine COX-3, making unlikely for
an antibody targeting N-terminus of human COX-3 to identify canine COX-3 (Kis et al.,
2005; Davies et al., 2004). However, using antibodies specific to intron 1 amino acid
sequence (MSREXDPXA) predicted in mammals, expression of both COX-3 and
PCOX-1a was detected in insect cells (Chandrasekharan et al., 2002). Looking at the
actual published data some argue that it is difficult to interpretate the cropped western
blots due to lack of molecular weight marker (Kis et al., 2005) whereas the author
justified the cropped blots due to space limitations (Simmons et al., 2005). In terms of
9
activity, the PGE₂ levels produced by COX-3 were found to be 20% of that of COX-1
(about 20% of the activity of COX-2). However, lack of appropriate controls made it
difficult to conclude if the low levels of PGE₂ production actually represented canine
COX-3 activity (Kis et al., 2005).
The half-life of COX-3 mRNA in humans was similar to COX-1 (Cui et al., 2004) and
human COX-3 protein was expected to be only 8.7 kDa. However, using either COX-1
monoclonal or COX-3 polyclonal antibodies, a COX-3 65 kDa protein was detected in
human aorta and about 25% of the level of COX-1. Moving from the molecular
evidence to enzyme activity, the IC₅₀ value of paracetamol was 64 μM at 5 µM of
arachidonic acid as a substrate and the order of selectivity was COX-3> COX-1> COX-
2. At higher substrate concentrations (30 μM), dipyrone was slightly more potent
inhibitor of COX-3 with an IC₅₀ of 52 μM different to phenacetin (102 μM) and
paracetamol (460 μM) (Chandrasekharan et al., 2002). Interestingly, antipyrine and
aminopyrine showed a reduced ability to inhibit this enzyme. However, these
analgesic/antipyretic drugs with low anti-inflammatory activity were demonstrated to
preferentially inhibit COX-3. The enzyme activity also confirm that although
paracetamol inhibits the putative COX-3, it is not unique or the most sensitive drug.
Those who advocate the unique activity of paracetamol against COX-3 argue that the
altered sub-cellular localisation of COX-3 could change redox environments and
substrate concentrations, thus affecting inhibition by paracetamol (Simmons, 2003).
Differences in the IC₅₀ of COX-1 and canine COX-3 in vitro only suggest the possibility
of specific inhibition of canine COX-3 by paracetamol.
Among NSAIDs, diclofenac was the most potent COX-3 inhibitor (IC₅₀ value 0.008)
followed by indomethacin, ibuprofen, aspirin. Although these drugs (except aspirin)
inhibited COX-3 preferably over COX-1 and COX-2 they were far more potent than
paracetamol against COX-3. However, it has been proposed that the polar nature of
diclofenac and ibuprofen make them less likely to reach COX-3 expressed in brain
effectively (Chandrasekharan et al., 2002; Botting and Ayoub, 2005; Berenbaum, 2004).
One explanation from the frameshifting argument is that alternative polyadenylation is
considered to overcome the impact of frameshift in intron-1, resulting in intron-1
antibody-identified proteins (Simmons, 2003). However, others argue that although, two
stem-loop structures which are thought to be relevant in splicing intron-1 and
transcription of COX-1 or COX-3 cannot also explain the possible -1 frameshifting (Kis
et al., 2005). In 2003, Shaftel et al. confirmed the existence of COX-3 mRNA in
10
multiple C57BL/6 mice tissues such as spleen, astrocyte, brain and cultured glial cells
using standard RT-PCR. COX-1 expression was greater than COX-3. The primers
designed for this study was COX-1/3 that would anneal within exon 1 and 3 of COX-1,
resulting in COX-3 (349 base pairs) and COX-1 (247 base pairs) products whereas
COX-3 specific primers would be confined to the first intron of COX-1 and within exon
3 resulting in 164 base pair COX-3 product. Using COX-3 specific primers, abundance
of this splice variant was observed in spleen, brain and microglial samples. Retention of
intron 1 resulted in addition of 102 nucleotides in-frame in the mouse. It was pointed
out that intron 1 in mice and rats is 98 nucleotides and expected to cause a frameshift
and resulting in a protein entirely different than COX-1, and with doubtful COX
activity. Theoretically, another site of initiation or downstream alternative splicing
could cause restoration of the reading frame and a functional COX-3 (Kis et al., 2005).
As COX-3 mRNA matches to COX-1 but retains intron 1, the sense primer targeted
intron 1 and antisense primer anneals to exon 5 (497 base pairs). There was highest
mRNA expression of COX-3 in cerebral endothelial cells (Kis et al., 2003), and
suggesting the target for antipyretic the actions of paracetamol may be due to the key
role of cerebral endothelial cells in mediating temperature regulation (Matsumura et al.,
1998).
Schwab et al. (2003c) assumed that the analgesic effect of paracetamol is answered in
the form of COX-3, however the results demonstrated by Kis group could not support
this idea due to lack of COX-3 mRNA expressed in neurons. By contrast paracetamol
does not seem to inhibit COX-3 at standard oral doses (0.5–1 g/day) (Schwab et al.,
2003c). Also, there is no correlation between the site of COX-3 expression (cerebral
cortex) and temperature regulation in the hypothalamus. From the height of the COX-3
research to the present day, an active COX-3 protein has yet to be proven in humans
(Berenbaum, 2004).
Evaluation of the appearance of three COXs after lipopolysaccharide (LPS) treatment in
endothelial cells, astrocytes, epithelial cells, and pericytes showed an increase in COX-2
mRNA expressed but COX-1 and COX-3 did not alter, confirming constitutive COX-3
expressed in rat brain at mRNA level similar to COX-1 (Kis et al., 2003). The results
indicate involvement of COX-3 in membrane-based COX signalling or when basal
COX-1 or COX-2 expression levels persist. Using an anti-human COX-3 antibody
raised against the N-terminal peptides (first 13 amino acids of COX-3 in humans)
(MSRECDPGARWGC), COX-3 protein immunoreactivity was detected in human
11
hippocampus and stressed neurons without any specific information about the COX-3
band size (Cui et al., 2004).
In 2004, Kis et al. went a step ahead and demonstrated the presence of COX-3 mRNA
in male Wistar rat brain in vivo using primers that could differ COX-1 and COX-3.
Furthermore, this study showed regional demonstration of COX-3 mRNA in different
brain regions with considerable variability. In addition to Kis’s findings, COX-3 (497
base pairs) expressed in aorta, brain, cerebellum, heart, and lung of male Wistar rats.
However, western blot analysis showed that commercially available anti-canine or anti-
human antibodies could not detect COX-3 protein (data not shown in the article), COX-
1 protein expression was demonstrated in all tissues whereas only brain and cerebellum
were COX-2 immunopositive. It was noted that commercially available anti-COX-3
antibodies are species-selective (Warner et al., 2004).
Another study suggested there was no evidence of paracetamol sensitive COX activity
in cerebellum or brain when compared to naproxen, rofecoxib and SC560. They also
argue that COX-3 mRNA if expressed would lead to a production of a different protein
and may explain the absence of COX-3 activity (Warner et al., 2004).
1.8. Evidence for the involvement of COX-3 in thermoregulation
Considering the hypothesis that COX-3 in rodents would have a totally altered amino
acid sequence than COX-1 and COX-2 without being active (Snipes et al., 2005), some
found the findings of Ayoub et al. (2004) surprising (Davies et al., 2004). In the same
year, a study was published by Ayoub et al. suggested COX-3 inhibition is associated
with paracetamol induced hypothermia. Under basal conditions, when paracetamol is
administered intraperitoneally (100–300 mg/kg) in C57/BL6 male mice, it resulted in a
dose dependent decrease of 0.4°C, 0.8°C, and 2°C in rectal temperature. Although no
toxicity was assessed, these doses correlate with reported toxic doses of paracetamol
(Jollow et al., 1973; James et al., 2003; Williams et al., 2010; Agarwal et al., 2011;
Ramachandran et al., 2011; Bajit et al., 2011; McGill et al., 2012; McGill et al., 2013;
Ramachandran et al., 2013; Xie et al., 2015; Noh et al., 2015; Zhang et al., 2015; Du et
al., 2017).
A time course study showed a maximum hypothermic effect 1 hour after taking 300
mg/kg paracetamol and returned to normal after 4–5 hours. The hypothermic effects
were suggested to correlate with paracetamol plasma concentrations (Fischer et al.,

12
1981). Other putative COX-3 inhibitors showed the greatest hypothermic response with
50 mg/kg aminopyrine after 30 minutes with the same recovery time as that of
paracetamol treatment. Similarly 100 mg/kg antipyrine showed maximum hypothermia
after 30 minutes to the same extent as shown by paracetamol treatment; however the
recovery was inconsistent after 4-5 hours. Furthermore, there seemed to be a direct
relationship between body temperature and PGE₂ levels in brain with maximum effect
after 1 hour resulting in 96% reduction in PGE₂ levels in paracetamol treated group and
60% after 30 minutes of antipyrine and aminopyrine treatment (data not shown in the
article) (Ayoub et al., 2004).
At doses of 300 mg/kg, COX-1 KO mice showed a decrease in the hypothermic effect
of paracetamol, whereas it was unaltered in COX-2+/–
and COX-2–/–
mice. Interestingly,
the greatest drop in body temperature was noticed in COX-2–/–
paracetamol treated
group. However, paracetamol induced hypothermia was not fully diminished in COX-1–
/– group (–2.05°C in COX-1
–/– and –3.9°C in WT group) suggesting only partial
involvement of COX-independent mechanisms.
Reduction of brain PGE₂ levels after 1 hour of administration of 300 mg/kg paracetamol
was completely disappeared in COX-1–/–
mice. In COX-1–/–
group, the basal PGE₂ levels
were 30% of those in WT mice, demonstrating COX-1 as a major source of PGE₂
production in brain. Changes in PGE₂ levels in vehicle treated wild-type, COX-1+/–
and
COX-1–/–
groups was not very clear. Also, if paracetamol exerts its hypothermic actions
through COX-1 gene derived protein then one would expect a dramatic decrease in the
PGE₂ levels in COX-2+/–
or COX-2–/–
versus WT mice.
1.9. Evidence for COX-3; questions about experimental design
COX-3 mRNA was detected as 290 base pairs product in whole brain tissues of all
genotypes of COX-2 KO and WT mice. This study also suggested that constitutive
COX-3 is a target for hypothermic action of paracetamol and this COX-1 gene derived
enzyme is located most probably in brain endothelial cells and involved in regulation of
body temperature in mice through COX-3 derived PGE₂ (Ayoub et al., 2004). It was
speculated that COX-3 is present in hypothalamic region of the CNS and responsible for
a constant PGE₂ release for thought to be required for temperature regulation. As a
majority of laboratory animals are kept at 22°C and the thermoneutral temperature of
13
mice is 32–34°C and, a constant biosynthesis of PGE₂ is proposed to be required to
maintain body temperature (Botting and Ayoub, 2005).
The techniques used to determine the COX-3 data prompt a few questions. Given that
COX-3, a splice variant of COX-1 there has to be a question whether a COX-1–/–
mouse
is also a COX-3–/–
mouse. The disruption of C-terminus of COX-1 by the retention of
intron-1 would possibly result in a protein without the C-terminus sequence of 120
amino acids responsible for COX-1 activity, but would still retain the full sequence of
COX-3 protein (Kis et al., 2005). mRNA data of COX-1+/–
and COX-1–/–
mice in Ayoub
et al. (2004) and Dou et al. (2004) studies would have been helpful (Davies et al., 2004)
to conclude whether paracetamol induced hypothermia is mediated by COX-3
inhibition. In addition, the primer sets used in the COX-3 mRNA studies targeted
PCOXa (Ayoub et al., 2004; Dou et al., 2004). More importantly, COX-3 remain
unidentified in Western blot analysis and immunohistochemistry data was not
considered as conclusive considering the non-specificity of the technique and polyclonal
antibodies used (Kis et al., 2005). There seemed to be an issue with anti-mouse COX-3
antibody used specific to sequence of 13-amino acids (MSREFDPEAPRNC); being
more than 50% different from the actual sequence for COX-3 in mouse or rat
(MSRESDPSGAPTR), thus COX-3 remain unrecognised in mouse or rat (Davies,
2004). Simmons et al. (2005) clarified that the antibody used was a human and mouse
peptides mixture (50:50) corresponding to first 12 amino acids encoded by exon 1 and
the retained intron 1.
In an attempt to better reflect the role of COX-3, Snipes et al. (2005) preferably called
COX-1 variant as COX-1b. Sequence analysis has shown the generation of COX-1b
mRNA (573 base pairs) from cerebral endothelial cells (CECs) and cerebral
microvessels retaining 98 bp intron 1. This encodes an expected protein of 127 amino
acid without homology to existing COX sequence. An anti-rat polyclonal antibody
corresponding to 2–17 amino acids (SRESDPSGAPTRPGIR) was generated. The
highest expression of COX-1b protein was detected in heart, kidney, and neuronal
tissues. This finding was further confirmed by immunostaining of rat primary CECs
(Snipes et al., 2005).
However using exogenous arachidonic acid in COS-7 cells, rat COX-1b was found not
to be catalytically active and sensitive to paracetamol inhibition. Two COX-1
transcripts retaining intron 1 (>4.5 kb and 2.8 kb) was found in majority of human
tissues using an intron 1-specific probe (26 to 63 base pair within intron 1) were

14
reported. In brain, the expression was highest in the cerebral cortex. Using anti-human
COX-1 intron 1 targeted antibody, COX-1b (75 kDa) and PCOX-1a (55 kDa) proteins
alongside two smaller uncharacterized proteins (15 kDa) were detected (Qin et al.,
2005).
To generate a protein there could be two possibilities as to how the reading frameshift
was restored; single-nucleotide polymorphisms (SNPs) or RNA editing resulting in
removal of a single nucleotide. DNA sequencing study showed the presence of three
splice variants of COX-1b. Major COX-1b₁ retains entire intron 1, leading to a
frameshift and addition of a stop codon approximately after 249 bp which would most
likely form a COX-inactive protein. COX-1b₂ and COX-1b₃ contain almost the full
intron 1 with only exception of guanidine or cytosine, which would lead to a self-
rectifying frameshift and thus encoding probably a full length COX-active protein.
These variants showed less than 25% identity between human and canine versions (Qin
et al., 2005).
When COX-1b₂ was expressed in insect Sf9 cells, COX-1 was found to be more active
in conversion of arachidonic acid to PGF₂α. Paracetamol, dipyrone and phenacetin did
not show varied potency between human COX-1 and COX-1b₂. It was suggested that
retention of intron 1 may change protein topology resulting in a different glycosylation
pattern, enzyme activity and selectivity. When human COX-1 and COX-1b₂ were
compared, it showed no significant differences, proposing human COX-1b₂ is not the
target for paracetamol’s actions (Qin et al., 2005). The key publications related to COX-
3 is presented in Table 1.1.
Table 1.1: COX-3 experimental data related studies
Canine Mouse Rat Human
Chandrasekharan
et al., 2002.
Shaftel et al., 2003; Dou
et al., 2004; Ayoub et al.,
2004; Cui et al., 2004;
Kis et al., 2006; Ayoub et
al., 2006.
Kis et al., 2003;
Kis et al., 2004;
Warner et al., 2004;
Kis et al., 2005;
Snipes et al., 2005;
Abd el-aleem et al.,
2009; Oksuz et al.,
2016.
Chandrasekharan
et al., 2002; Qin
et al., 2005;
Nurmi et al.,
2005; Censarek
et al., 2006;
Reinauer et al.,
2013.
15
1.10. Paracetamol induced hypothermia: the role of COX enzymes
The antipyretic action of paracetamol during fever has been extensively studied over the
last 30 years and there is general consensus about this aspect of the mechanisms
involved. The most widely accepted view is that paracetamol inhibits the COX-2
enzyme which is normally expressed following infection or trauma which leads to fever
(Engström et al., 2013). It has also been known for some time that in many small
mammals paracetamol can cause hypothermia (Walker et al., 1981; Massey et al., 1982;
Ayoub et al., 2004; Li et al., 2008; Corley et al., 2009; Ayoub et al., 2011; Briyal and
Glutai 2013; Gentry et al., 2015; Ahangar et al., 2016; Fukushima et al., 2017).
Over the last 15 years there has been increased interest in paracetamol induced
hypothermia in non-febrile rodents (rats and mice). This phenomenon has been noted at
doses >100mg/kg which is the same dose required to reduce LPS induced fever in these
animals. However in non-febrile animals there is no involvement of the COX-2 enzyme
(Ayoub et al., 2004, 2011; Ayoub and Botting 2005). Another point for consideration is
that the equivalent of the therapeutic dose (>100 mg/kg) of paracetamol in mice, at least
in terms of antipyresis is very close to the dose where there is clear evidence of
biomarkers of toxicity, particularly in mice.
The mechanism by which paracetamol causes hypothermia in pyrogen free rodents has
been the subject of fierce debate, primarily around the role of the COX-1 enzyme. In
particular the suggestion that the hypothermia was due to the inhibition of the COX-1
variant enzyme (Ayoub et al., 2004). The suggestion was that the expression of this
novel variant COX-1 was to regulate core temperature (Tc) in rodents housed at
temperatures which require them to produce extra heat to maintain normal body
temperature (Ayoub et al., 2004). A more detailed discussion on the regulation of Tc
will be undertaken later in this chapter. However, this interpretation of the data has been
challenged and there have been numerous studies to determine both the existence and
role of the COX-1 variant termed COX-3 in paracetamol induced hypothermia (Kis et
al., 2005; Li et al., 2008). Confirmation of the existence and role of COX-3 could
transform our understanding of how both paracetamol and the NSAIDs work, with
obvious implications.
16
1.11. Paracetamol induced hypothermia: other than COX?
Walker et al. (1981) demonstrated a central mechanism of action of paracetamol
induced hypothermia and proposed that hypothermia and hepatotoxicity are two
separate events in mice as administration of paracetamol (125–750 mg/kg) in Swiss
white mice resulted in decreased body temperature (Tb) before liver injury and hepatic
congestion became evident. However it is possible for the hypothermic of paracetamol
to be evident before gross toxicity. When N-acetylcysteine (NAC) coadministered with
paracetamol, hepatotoxicity was prevented and to some extent hypothermia was
protected confirming the above (Walker et al., 1981).
The same research group indicated that the parent compound is responsible for causing
early hypothermia in mice rather than its toxic reactive metabolite as mice pre-treated
with phenobarbital that induces oxidative drug metabolism did not have any effect on
paracetamol induced hypothermia. However, this hypothermic effect was enhanced
when pre-treated with mixed-function oxidase blockers. In the same study, it was also
indicated that paracetamol induced hypothermia is mediated centrally as the levels of
parent compound in brain was associated with the degree of hypothermia, while it was
not the case in liver. Paracetamol administered intracerebroventricularly caused
significant hypothermic effect within 20 minutes (Massey et al., 1982).
In 2009, Corley et al. hypothesised that paracetamol induced hypothermia might be
dependent on opioid and cannabinoid (CB₁) or activating nociceptin/orphanin FQ
peptide (NOP) receptor. Dose dependent hypothermia was observed with paracetamol
administered intraperitoneally (100, 250, 375 or 500 mg/kg) in rats. Pre-treatment with
an opioid, CB₁ or NOP antagonists could not alter the hypothermic effect of
paracetamol (400 mg/kg).
After presenting findings that paracetamol induced hypothermia may be mediated
through COX-1 gene derived protein in mice, Ayoub et al. (2011) showed this
phenomena does not rely on CB and transient receptor potential vanilloid 1 (TRPV1).
BQ123, an endothelin-A receptor antagonist and paracetamol resulted in a significant
increase (41%) in hypothermic response as opposed to paracetamol group alone (Briyal
and Glutai, 2013).
Other researchers further investigated the hypothermic activity of paracetamol.
Subcutaneous, but not intrathecal, administration of this drug has shown to decrease
17
body temperature in WT mice dose dependently. Pre-treatment with resiniferatoxin that
destroy or defunctionalize peripheral TRPV1 expressing terminals, but resistant to COX
inhibition abolished the hypothermic effect. As paracetamol evoked hypothermia was
identical in wildtype and TRPV1−/− mice, and not reduced by the maximum effective
dose of a TRPV1 antagonist, it was concluded that this phenomena is independent of
TRPV1. Since Transient receptor potential ankyrin 1 (TRPA1) is co-expressed with
TRPV1, it was predicted to cause hypothermia similar to TRPV1 agonists. Interestingly,
a TRPA1 antagonist inhibited the hypothermic effect of paracetamol and this drug did
not have an effect on body temperature in TRPA1−/− mice (Gentry et al., 2015).
The hypothermic effect of paracetamol has also been linked to Gamma-aminobutyric
acid (GABA) and benzodiazepine receptors (Ahangar et al., 2016). An acute therapeutic
dose of paracetamol (20 mg/kg lean body mass) was shown to impact on Tc of non-
febrile humans in a sub-neutral environment. This observation suggested that
paracetamol might cause an inhibition of the mechanisms involved in thermogenesis
which are important to maintain Tc in humans (Foster et al., 2016).
1.12. Thermoregulation
There is clear evidence that paracetamol and the NSAIDs have an impact on body
temperature either in febrile or non-febrile animals. Thermoregulation is a complex
process involving both temperature receptors and receptors located centrally and
peripherally. Regulation of Tb depends on the ability of a thermoregulatory circuitry to
sense and integrate thermal information from the external environment and deep within
the body core (Bicego et al., 2007), thus involving various relatively independent
thermoeffector loops along with afferent and efferent pathways (Romanovsky, 2007)
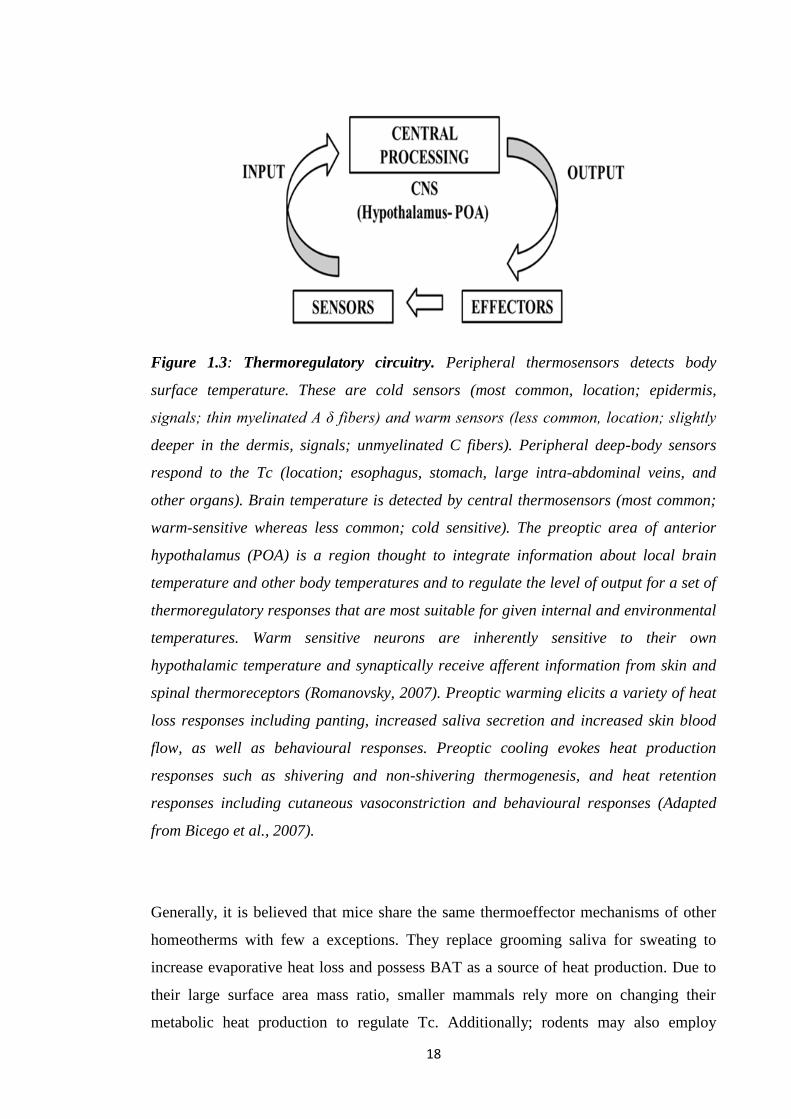
(Figure 1.3).
Homeotherms are capable of maintaining their Tc within a fairly constant range (36.0-
37.5°C) through the process of thermoregulation. The reference or set-point temperature
is established by the firing rate of thermoregulatory neurons in the hypothalamus
(Boulant, 2000). However, certain environmental and biological factors such as time of
day, site of temperature measurements, level of physical activity, age, sex and race can
cause slight variations.
18
Figure 1.3: Thermoregulatory circuitry. Peripheral thermosensors detects body
surface temperature. These are cold sensors (most common, location; epidermis,
signals; thin myelinated A δ fibers) and warm sensors (less common, location; slightly
deeper in the dermis, signals; unmyelinated C fibers). Peripheral deep-body sensors
respond to the Tc (location; esophagus, stomach, large intra-abdominal veins, and
other organs). Brain temperature is detected by central thermosensors (most common;
warm-sensitive whereas less common; cold sensitive). The preoptic area of anterior
hypothalamus (POA) is a region thought to integrate information about local brain
temperature and other body temperatures and to regulate the level of output for a set of
thermoregulatory responses that are most suitable for given internal and environmental
temperatures. Warm sensitive neurons are inherently sensitive to their own
hypothalamic temperature and synaptically receive afferent information from skin and
spinal thermoreceptors (Romanovsky, 2007). Preoptic warming elicits a variety of heat
loss responses including panting, increased saliva secretion and increased skin blood
flow, as well as behavioural responses. Preoptic cooling evokes heat production
responses such as shivering and non-shivering thermogenesis, and heat retention
responses including cutaneous vasoconstriction and behavioural responses (Adapted
from Bicego et al., 2007).
Generally, it is believed that mice share the same thermoeffector mechanisms of other
homeotherms with few a exceptions. They replace grooming saliva for sweating to
increase evaporative heat loss and possess BAT as a source of heat production. Due to
their large surface area mass ratio, smaller mammals rely more on changing their
metabolic heat production to regulate Tc. Additionally; rodents may also employ
19
behavioural thermoregulation strategies such as huddling and nest building to respond
to changes in ambient temperature (Ta). Mice are nocturnal and exhibit a circadian
rhythm, the average daytime Tc of laboratory mice at midday is 36.0°C whereas during
the night due to increased activity this increases to 37°C. Laboratory mice tend to
regulate their Tc approximately 1°C below that of laboratory rats. They prefer warm Ta
during the daytime when the animal is inactive and cooler temperature at night during
the time of higher activity and elevated Tc.
1.13. Basic concept of thermogenesis and thermoneutral zone
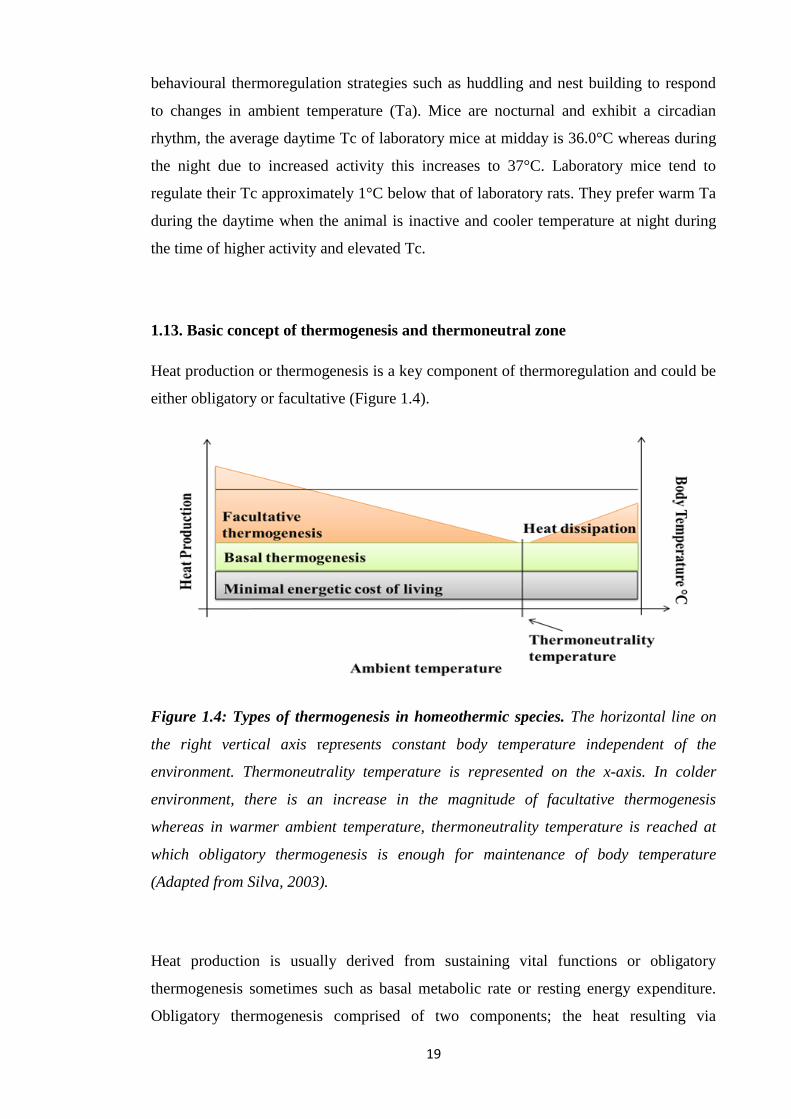
Heat production or thermogenesis is a key component of thermoregulation and could be
either obligatory or facultative (Figure 1.4).
Figure 1.4: Types of thermogenesis in homeothermic species. The horizontal line on
the right vertical axis represents constant body temperature independent of the
environment. Thermoneutrality temperature is represented on the x-axis. In colder
environment, there is an increase in the magnitude of facultative thermogenesis
whereas in warmer ambient temperature, thermoneutrality temperature is reached at
which obligatory thermogenesis is enough for maintenance of body temperature
(Adapted from Silva, 2003).
Heat production is usually derived from sustaining vital functions or obligatory
thermogenesis sometimes such as basal metabolic rate or resting energy expenditure.
Obligatory thermogenesis comprised of two components; the heat resulting via

20
minimum energy cost of living that is not enough for maintaining Tb in cold
environments. Secondly, the excess heat results from basal metabolic activity called
basal thermogenesis and it is independent of Ta (Silva, 2003). Basal thermogenesis
could be explained by more active metabolism of homeothermic species than
poikilotherms, thus sustaining greater energy transactions/time (Silva, 2003; Else and
Hulbert, 1981).
A number of strategies are used to augment obligatory thermogenesis; these include
vasoconstriction, piloerection, changed posture and reduced mobility. Due to the
limitations of these mechanisms, additional facultative or adaptive thermogenesis is
needed. In birds, the major site of this form of thermogenesis is likely to be the skeletal
muscle and in case of mammals, it is brown adipose tissue (BAT) (Silva, 2006;
Duchamp, 1993; Cannon and Nedergaard, 2004). Apart from cold stimuli, facultative
thermogenesis can be activated by food, dissipating excess calories (Silva, 2003).
Thermoneutrality or thermoneutral zone is a range of Ta where the obligatory
thermogenesis is enough to maintain a stable Tc. The thermoneutral temperature of an
animal varies according to body surface area-to-volume ratio resulting in a value of
about 23°C in an adult man, 28°C in rats and 30°C in mice (Silva, 2003; Gordon, 1993).
1.14. Thermogenic Mechanisms
Homeotherms generally use two major mechanisms to increase heat generation.
Increased production and utilization of adenosine triphosphate (ATP) (same amount of
heat per ATP), most notably by accelerating ion movement against gradients. Ironically
increased heat generation occur by reducing the efficiency of the mitochondrial ATP
production through regulated proton leak in many tissues including brown adipose.
Although mechanism is still not clear it involves uncoupling proteins (UCPs)
particularly uncoupling protein 1 (UCP1). Hormones such as thyroid hormone may also
be a regulator of thermogenesis (Silva, 2006). All the varying forms of thermogenesis
require the supply of substrates to the mitochondria; the greater the demand for heat, the
more substrate is required. Substrate supply relies on the catabolism/metabolism of
glucose and triglycerides (TGs) producing primarily NADH for the ETC. The greater
the demand for heat the more susceptible the substrate supply or ETC is to disruption.
21
1.15. The Adipose Tissue:
Adipose tissue plays a major role in metabolic regulation (Luo and Liu, 2016). Adipose
tissue acts as the fuel reservoir, involved in conservation of heat and responsible for
regulating lipid utilization (Luo and Liu, 2016). Excess energy is stored as neutral TGs
via lipogenesis (Vaughan, 1962). When energy intake is insufficient or increased
demands are stimulated, glycerol and fatty acids can be released from TGs into the
blood and penetrate into different organs, thus distributing lipids and control energy
balance (Luo and Liu, 2016). In addition to a fuel reservoir, adipose tissue is a major
endocrine organ secreting various bioactive compounds that affect muscles, liver,
pancreas and brain thus acts as a modulator of systemic metabolism (Luo and Liu,
2016).
1.16. Types of Adipose tissue
Adipose tissue is divided into two main categories: white adipose tissue (WAT) and
BAT. WAT stores excess energy as TGs whereas BAT which contain abundant UCP1,
also called thermogenin, short-circuits the coupling of the respiratory chain to ATP
synthetase (Ràfols, 2014). As a result, it dissipates chemical energy as heat (Cannon and
Nedergaard, 2004) and prevents hypothermia and obesity via oxidation of lipids (Luo
and Liu, 2016).
1.17. Adipocytes
Adipocytes are the main cell type in adipose tissue (Luo and Liu, 2016). They can vary
in origin, morphology, mitochondria number and genes expressed in thermogenesis
(Luo and Liu, 2016). Primarily based in WAT, white adipocytes vary in size from 25–
200 μm, appear as unilocular lipid droplet, and possess a small number of mitochondria
with limited rate of oxidation (Luo and Liu, 2016). They possess high capacity of
storing energy as TGs (Tan and Vidal-Puig, 2008).
Brown adipocytes appeared as multilocular, abundant mitochondria as well as UCP1,
and dissipate stored energy as heat via uncoupling ATP synthesis from the ETC (Luo
and Liu, 2016). Increased expression of β-adrenergic receptors mediate cold-induced
lipolysis in adipose tissues. Also, during cold stress, movement of large amounts of
22
lipids occur from WAT into BAT is accompanied by mitochondrial biogenesis (Blüher
et al., 2004). As a result of β-adrenergic signalling in BAT, peroxisome proliferator-
activated receptor γ coactivator 1α (PGC-1α) is expressed, this stimulates UCP1
expression and mitochondrial genes (Fortier et al., 2005).
Unlike WAT, BAT is only found in mammals (Ràfols, 2014). In rodents, BAT is
particularly abundant in the perinatal period, but persists throughout their adult life
(Ràfols, 2014). In rodents, brown adipocytes mainly present in the interscapular and
peri-renal sections whereas in humans and infants, it is located in abdominal sites which
have a good blood supply (Luo and Liu, 2016).
1.18. Adipogenesis and its regulation
Differentiation of preadipocytes into mature fat cells is called adipogenesis, an
important process for adipose tissue growth and energy balance (Lefterova and Lazar
2009; Ali et al., 2013). Preadipocytes are small cells with fibroblasts morphology which
upon stimulation form mature adipocytes. Adipocyte volume reflects the balance
between lipogenesis and lipolysis whereas adipocyte number reflects the balance
between preadipocyte proliferation, differentiation, and apoptosis, and apoptosis of
adipocytes depending on tissue sites (Ràfols, 2014; Tchkonia et al., 2005). Various cell
models of white preadipocytes (3T3-L1, 3T3-F442A) and immortal lines of brown
preadipocytes have been used to investigate the differentiation process (Rosen, 2000).
The four stages reported includes proliferation arrest induced by contact inhibition
indicates confluence (Figure 1.5). Clonal expansion induced by hormone signals and
represented by a few mitotic divisions for cell cycle synchronisation. Early
differentiation stage arresting cell division, expressing characteristic adipocyte genes
and initiating lipid accumulation. Lastly, typical adipocyte morphology is finally
reached with the terminal differentiation phase with induction of transcription of genes,
typical of mature adipocytes. In addition to the heterogeneity of the preadipocyte
population when cultured in vitro, differences between mature adipocytes in a same
WAT site have also been reported (Ràfols, 2014).
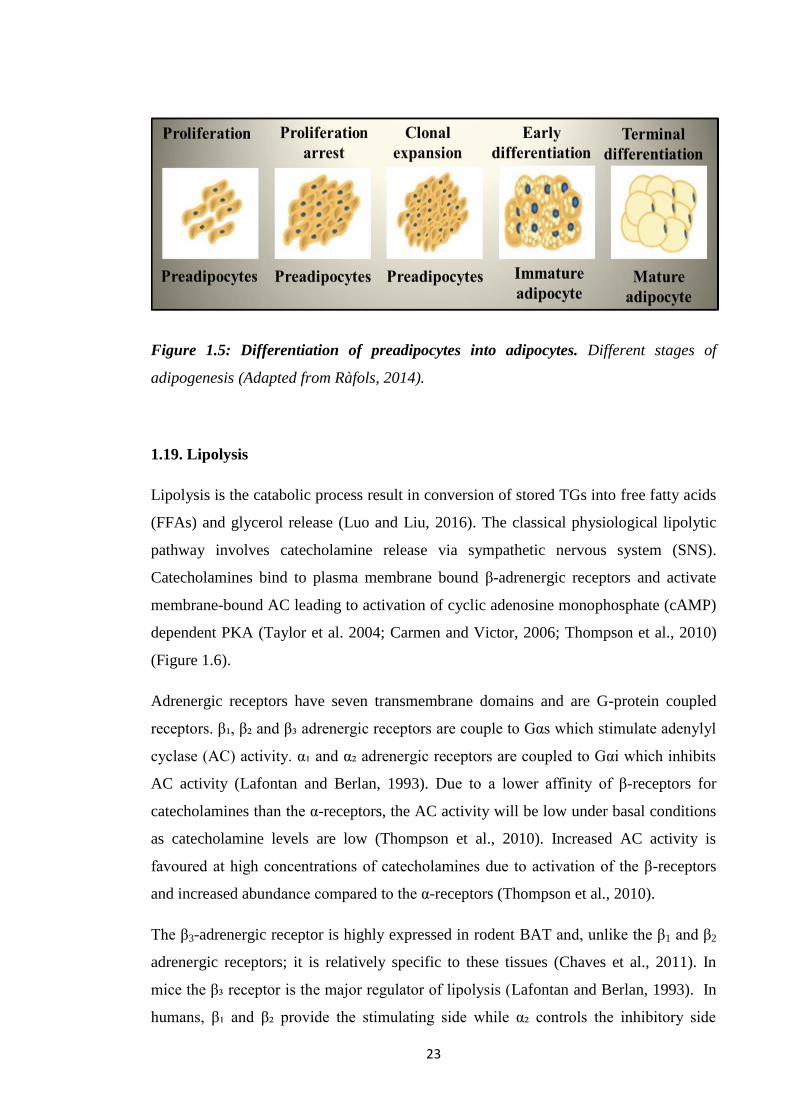
23
Figure 1.5: Differentiation of preadipocytes into adipocytes. Different stages of
adipogenesis (Adapted from Ràfols, 2014).
1.19. Lipolysis
Lipolysis is the catabolic process result in conversion of stored TGs into free fatty acids
(FFAs) and glycerol release (Luo and Liu, 2016). The classical physiological lipolytic
pathway involves catecholamine release via sympathetic nervous system (SNS).
Catecholamines bind to plasma membrane bound β-adrenergic receptors and activate
membrane-bound AC leading to activation of cyclic adenosine monophosphate (cAMP)
dependent PKA (Taylor et al. 2004; Carmen and Victor, 2006; Thompson et al., 2010)
(Figure 1.6).
Adrenergic receptors have seven transmembrane domains and are G-protein coupled
receptors. β₁, β₂ and β₃ adrenergic receptors are couple to Gαs which stimulate adenylyl
cyclase (AC) activity. α₁ and α₂ adrenergic receptors are coupled to Gαi which inhibits
AC activity (Lafontan and Berlan, 1993). Due to a lower affinity of β-receptors for
catecholamines than the α-receptors, the AC activity will be low under basal conditions
as catecholamine levels are low (Thompson et al., 2010). Increased AC activity is
favoured at high concentrations of catecholamines due to activation of the β-receptors
and increased abundance compared to the α-receptors (Thompson et al., 2010).
The β3-adrenergic receptor is highly expressed in rodent BAT and, unlike the β1 and β2
adrenergic receptors; it is relatively specific to these tissues (Chaves et al., 2011). In
mice the β₃ receptor is the major regulator of lipolysis (Lafontan and Berlan, 1993). In
humans, β₁ and β₂ provide the stimulating side while α₂ controls the inhibitory side

24
(Lafontan and Berlan, 1993). The main mechanism in the regulation of lipolysis in
adipocytes is the balance of AC activity (Thompson et al., 2010).
Figure 1.6: Regulation of lipid metabolism by adipose tissue. Lipolysis converts TG to
FFA and glycerol that undergoes oxidation. SNS =sympathetic nervous system; AR =
adrenergic receptor; cAMP= cyclic adenosine monophosphate; PKA = protein kinase
A; TG = Triglyceride; DG = Diglyceride; HSL = Hormone sensitive lipase; MG =
Monoglyceride; FFA = Free fatty acid (Adapted from Luo and Liu, 2016).
During basal state, hormone sensitive lipase (HSL) is present in the cytoplasm. Perilipin
A (perilipin 1) is a structural protein coating lipid droplets, thus protecting TG
molecules from HSL access and thus inhibits basal lipolysis (Zhang et al., 2008).
Adipose triglyceride lipase (ATGL) is located in the cytosol as well as on the surface
(MacPherson and Peters, 2015). A key coactivator of ATGL is comparative gene
identification-58 (CGI-58), (MacPherson and Peters, 2015), its binding to perilipin A
restrict CGI-58-ATGL interaction. This results in low lipolytic activity and fatty acids
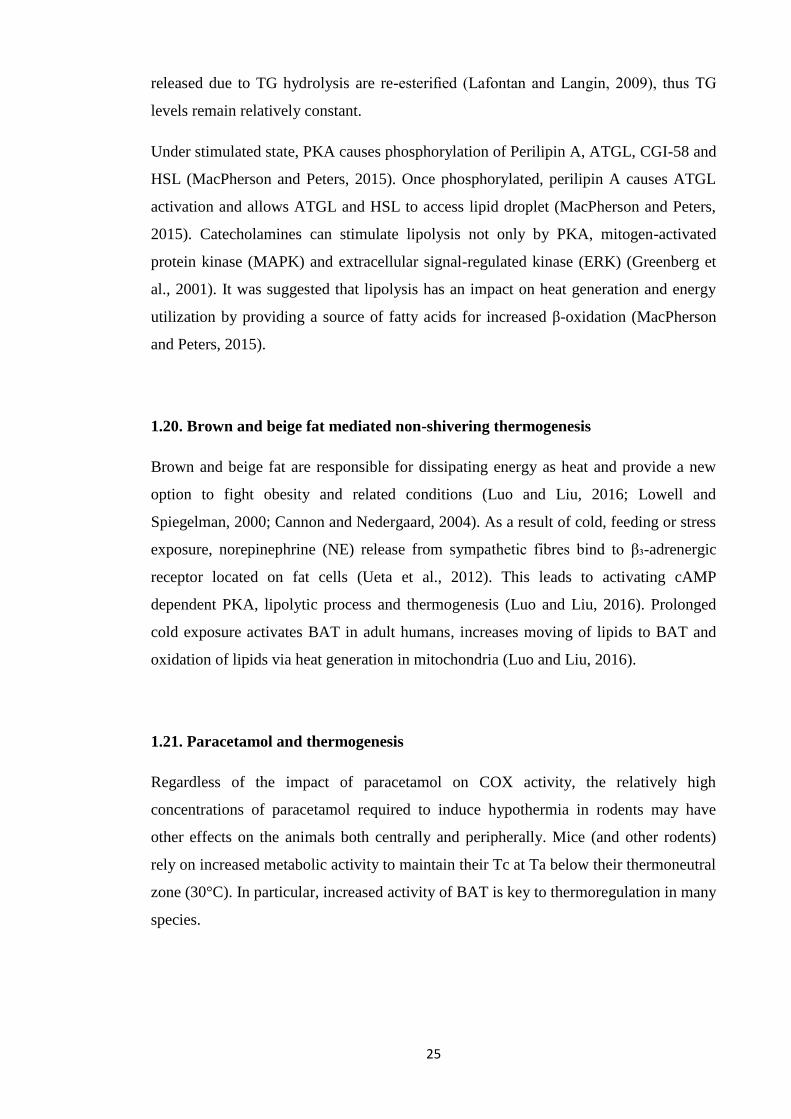
25
released due to TG hydrolysis are re-esterified (Lafontan and Langin, 2009), thus TG
levels remain relatively constant.
Under stimulated state, PKA causes phosphorylation of Perilipin A, ATGL, CGI-58 and
HSL (MacPherson and Peters, 2015). Once phosphorylated, perilipin A causes ATGL
activation and allows ATGL and HSL to access lipid droplet (MacPherson and Peters,
2015). Catecholamines can stimulate lipolysis not only by PKA, mitogen-activated
protein kinase (MAPK) and extracellular signal-regulated kinase (ERK) (Greenberg et
al., 2001). It was suggested that lipolysis has an impact on heat generation and energy
utilization by providing a source of fatty acids for increased β-oxidation (MacPherson
and Peters, 2015).
1.20. Brown and beige fat mediated non-shivering thermogenesis
Brown and beige fat are responsible for dissipating energy as heat and provide a new
option to fight obesity and related conditions (Luo and Liu, 2016; Lowell and
Spiegelman, 2000; Cannon and Nedergaard, 2004). As a result of cold, feeding or stress
exposure, norepinephrine (NE) release from sympathetic fibres bind to β₃-adrenergic
receptor located on fat cells (Ueta et al., 2012). This leads to activating cAMP
dependent PKA, lipolytic process and thermogenesis (Luo and Liu, 2016). Prolonged
cold exposure activates BAT in adult humans, increases moving of lipids to BAT and
oxidation of lipids via heat generation in mitochondria (Luo and Liu, 2016).
1.21. Paracetamol and thermogenesis
Regardless of the impact of paracetamol on COX activity, the relatively high
concentrations of paracetamol required to induce hypothermia in rodents may have
other effects on the animals both centrally and peripherally. Mice (and other rodents)
rely on increased metabolic activity to maintain their Tc at Ta below their thermoneutral
zone (30°C). In particular, increased activity of BAT is key to thermoregulation in many
species.
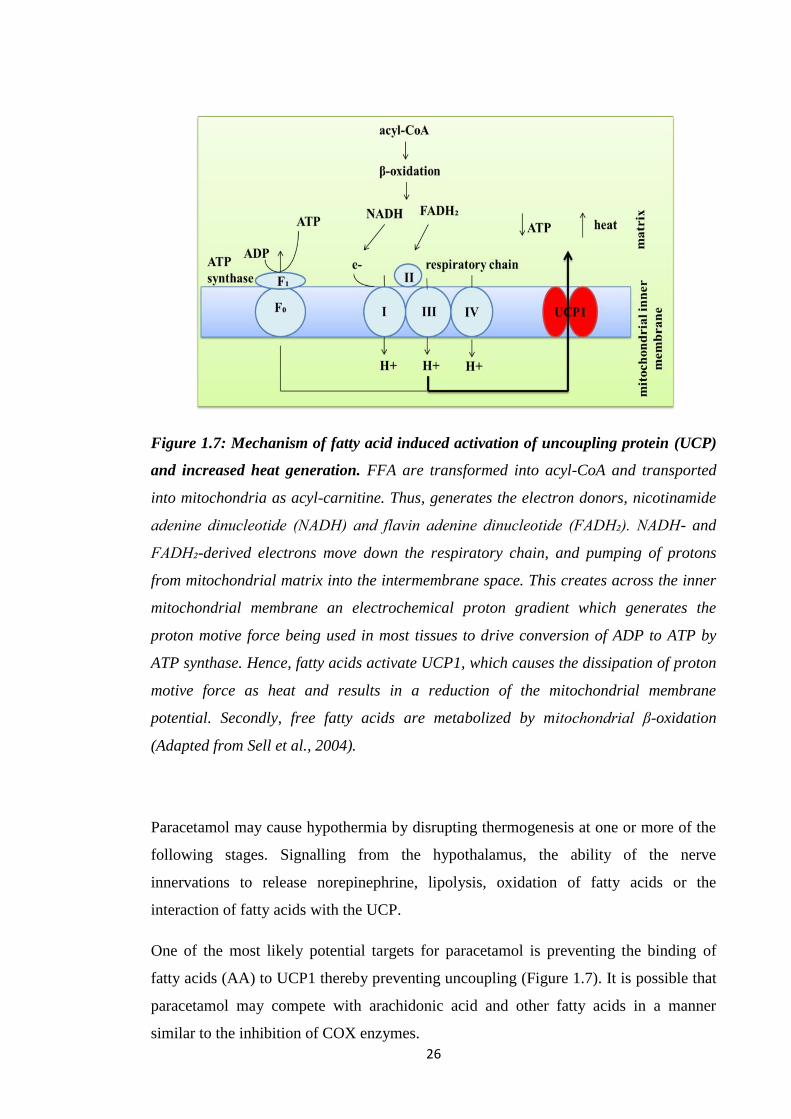
26
Figure 1.7: Mechanism of fatty acid induced activation of uncoupling protein (UCP)
and increased heat generation. FFA are transformed into acyl-CoA and transported
into mitochondria as acyl-carnitine. Thus, generates the electron donors, nicotinamide
adenine dinucleotide (NADH) and flavin adenine dinucleotide (FADH₂). NADH- and
FADH₂-derived electrons move down the respiratory chain, and pumping of protons
from mitochondrial matrix into the intermembrane space. This creates across the inner
mitochondrial membrane an electrochemical proton gradient which generates the
proton motive force being used in most tissues to drive conversion of ADP to ATP by
ATP synthase. Hence, fatty acids activate UCP1, which causes the dissipation of proton
motive force as heat and results in a reduction of the mitochondrial membrane
potential. Secondly, free fatty acids are metabolized by mitochondrial β-oxidation
(Adapted from Sell et al., 2004).
Paracetamol may cause hypothermia by disrupting thermogenesis at one or more of the
following stages. Signalling from the hypothalamus, the ability of the nerve
innervations to release norepinephrine, lipolysis, oxidation of fatty acids or the
interaction of fatty acids with the UCP.
One of the most likely potential targets for paracetamol is preventing the binding of
fatty acids (AA) to UCP1 thereby preventing uncoupling (Figure 1.7). It is possible that
paracetamol may compete with arachidonic acid and other fatty acids in a manner
similar to the inhibition of COX enzymes.

27
1.22. Cellular Respiration
Energy is a pre-requisite for all life processes including biological and molecular events
as well as for various cellular functions (Owen et al., 2011) and made available via a
process of cellular respiration (Hill, 2014). The chemical energy in food is stored as
ATP through slow combustion of carbohydrates, fats, and proteins or released as heat
(Shutt and McBride, 2013). The majority of ATP production occurs via aerobic cellular
respiration of glucose that represents 80% of carbohydrate metabolism (Owen et al.,
2011).
1.23. Fatty Acid β-Oxidation
Fatty acid oxidation involves breaking long chain acyl-CoA to acetyl-CoA in
mitochondria. Fatty acids require protein transporters located on the cell surface to enter
a cell (Lopaschuk et al., 2010) (Figure 1.8). These transporters are fatty acid translocase
(FAT/CD36), and plasma membrane bound fatty acid binding protein (FABPpm)
(Lopaschuk et al., 2010).
The next step involves addition of a CoA to the molecule of fatty acid via fatty acyl-
CoA synthase (FACS) and leads to long chain acyl-CoA formation and then long chain
acylcarnitine via carnitine palmitoyltransferase 1 (CPT1). This would allow the
transportation of fatty acid moiety across the inner membrane of the mitochondria via
carnitine translocase (CAT), thus exchanging long chain acylcarnitines and carnitine.
The former then converts again to long chain acyl-CoA via inner mitochondrial
membrane carnitine palmitoyltransferase 2 (CPT2) which then enters the β-oxidation
pathway. This would form one acetyl-CoA per β-oxidation cycle.
The final step in fatty acid β-oxidation involves a series of complex enzyme catalysed
steps including acyl-CoA dehydrogenase, enoyl-CoA hydratase, hydroxyacyl-CoA
dehydrogenase, and ketoacyl-CoA thiolase enzymes ((Fillmore et al., 2017; Schulz,
2008). NADH and FADH₂ formation occur during β-oxidation which then utilized by
ETC to generate ATP.
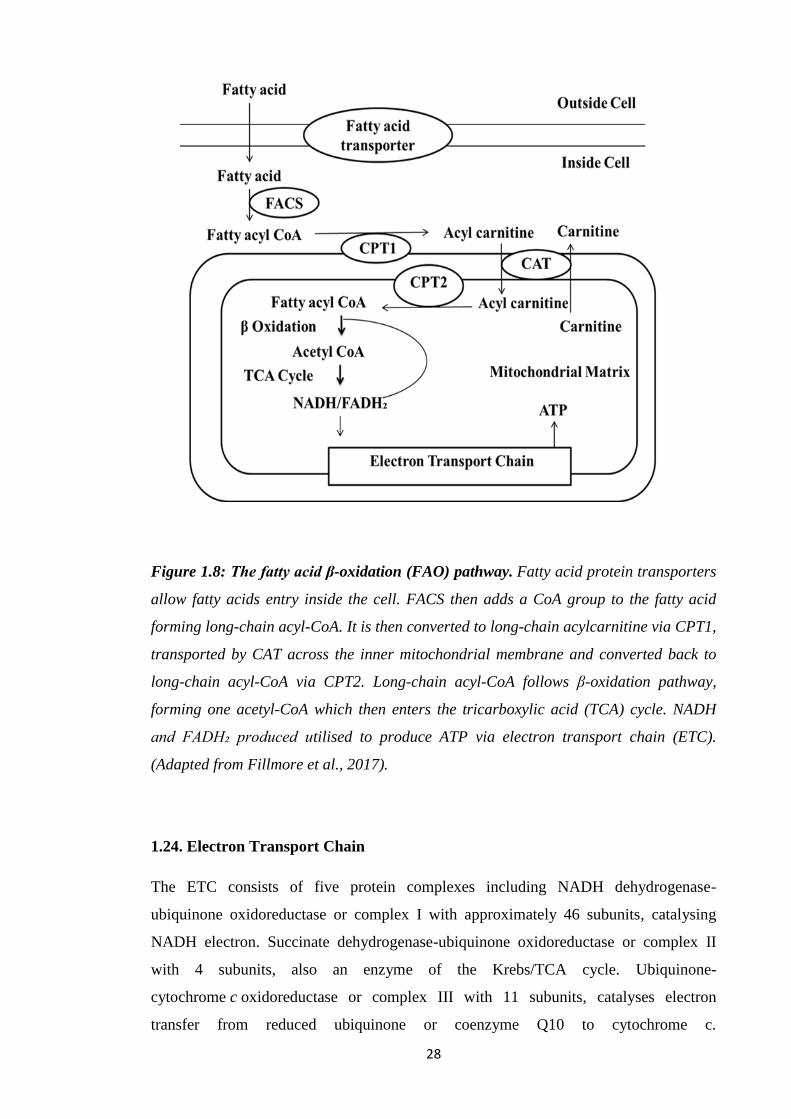
28
Figure 1.8: The fatty acid β-oxidation (FAO) pathway. Fatty acid protein transporters
allow fatty acids entry inside the cell. FACS then adds a CoA group to the fatty acid
forming long-chain acyl-CoA. It is then converted to long-chain acylcarnitine via CPT1,
transported by CAT across the inner mitochondrial membrane and converted back to
long-chain acyl-CoA via CPT2. Long-chain acyl-CoA follows β-oxidation pathway,
forming one acetyl-CoA which then enters the tricarboxylic acid (TCA) cycle. NADH
and FADH₂ produced utilised to produce ATP via electron transport chain (ETC).
(Adapted from Fillmore et al., 2017).
1.24. Electron Transport Chain
The ETC consists of five protein complexes including NADH dehydrogenase-
ubiquinone oxidoreductase or complex I with approximately 46 subunits, catalysing
NADH electron. Succinate dehydrogenase-ubiquinone oxidoreductase or complex II
with 4 subunits, also an enzyme of the Krebs/TCA cycle. Ubiquinone-
cytochrome c oxidoreductase or complex III with 11 subunits, catalyses electron
transfer from reduced ubiquinone or coenzyme Q10 to cytochrome c.
29
Cytochrome c oxidase or complex IV with 13 subunits and ATP synthase or complex V,
with approximately 16 subunits. The ETC also need two small electron carriers,
ubiquinone/coenzyme Q and cytochrome c (Perier and Vila, 2012). Coenzyme Q
(CoQ), or ubiquinone, is unique in that it is a carrier that is not a protein-bound
prosthetic group. It only carries hydrogen atoms (protons plus electrons).
Electrons formed via energy substrates (such as NADH and FADH₂) formed in
glycolysis, β-oxidation and the TCA cycle pass through different complexes to
molecular oxygen and produce water. Also, proton pumping out of the mitochondria
via complexes I, III, and IV, generates an electrochemical gradient called mitochondrial
membrane potential, Δψ or the proton motive force which promotes the ADP
phosphorylation via the ATP synthase (FoF1 ATPase — complex V) (Perier and Vila,
2012; Bratic and Trifunovic, 2010). Fo domain of complex V couples proton
translocation across the inner mitochondrial membrane (IMM) with the phosphorylation
of ADP to ATP (Bratic and Trifunovic, 2010).
1.25. Inhibitors of Oxidative Phosphorylation
Rotenone and amytal block electron transfer at Complex I, thus preventing NADH
utilization. However, oxidation of succinate remains unimpaired as these electrons enter
via Complex II. Malonate blocks Complex II. Antimycin A interferes with electron flow
from Complex III whereas cyanide (CN-) blocks complex IV. Other agents include
azide (N3-) or carbon monoxide (CO). As a result of ETC inhibition, ATP synthesis is
also inhibited as there is no proton-motive force generated. Oligomycin prevent protons
entering through ATP synthase, thus ceasing ETC to operate which clearly illustrates
tight coupling between electron transport and ATP synthesis (Berg et al., 2002).
1.26. Regulated Uncoupling and Heat Generation
Proton leaking or mitochondrial uncoupling occurs with the re-entry of protons into
mitochondrial matrix and releasing energy of proton electrochemical gradient as heat
instead of ATP production (Cannon et al., 2006). Protonophores (such as FCCP) and
UCPs can facilitate this process (Voet and Voet, 2004; Mozo et al., 2005). It is an
important process to generate heat during hibernation, in newborns and cold adapted
mammals. Adipose tissue specializes in non-shivering thermogenesis with high levels
30
of UCP1 or thermogenin of 33 kDa subunits and resembling ATP-ADP translocase.
UCP1 short-circuits the mitochondrial proton battery to produce heat and primarily
relies on FFAs for its activation. These fatty acids are released from TGs via signals
such as β-agonists (Berg et al., 2002).
UCP2 and UCP3 have also been identified. The former shows 56% sequence similarity
to UCP1, present in various tissues. UCP3, exhibits 57% sequence similarity with UCP1
and 73% with UCP2 and found in the skeletal muscle and brown fat. UCP2 and UCP3
may be involved in energy homeostasis. The use of uncoupling proteins is not restricted
to animals (Osellame et al., 2012; Berg et al., 2002).
The ability of electrons to leak from the ETC prematurely allows their access to oxygen
as opposed to being transferred to oxygen to produce water at complex IV, causing thus
superoxide formation and oxidative stress (Osellame et al., 2012).
1.27. Research Aims and Hypothesis
Current understanding and research shows that the administration of paracetamol to
mammals leads to the attenuation of increased temperature during fever and to
hypothermia in non-febrile animals. The attenuation of increased temperature in humans
can be achieved at non-toxic concentrations making paracetamol a safe antipyretic
medication. This action is thought to be linked to the inhibition of COX-2. By contrast,
the induction of hypothermia observed in non-febrile small mammals is at paracetamol
concentrations where markers of toxicity are also detected. One explanation for the
hypothermia is the inhibition of a variant of the COX-1 gene called COX-3. However,
the evidence for the existence and biological activity of the COX-3 protein is
inconclusive and disputed. Given the toxicity associated with hypothermia in non-
febrile mammals, other mechanisms may be involved and must be investigated.
Elucidation of this pathway could lead to the development of more effective novel
antipyretic agents.
The aim of this research is to investigate the mechanisms by which paracetamol induces
hypothermia in non-febrile rodents (mice and rats). The working hypothesis:
paracetamol induced hypothermia in rodents is due to the inhibition of a novel COX-1
variant protein (COX-3) expressed in brain endothelial cells. The alternative hypothesis
is that paracetamol induced hypothermia is linked to inhibition of peripheral
thermogenic pathways.

31
1.28. Research Plan
In order to test the above hypothesis, two approaches are being used:
1. Identification and Characterisation of the putative variant COX-3 enzyme:
Studies were undertaken to isolate and identify the COX-3 mRNA and
protein in endothelial cells and tissues from mice.
The successful isolation of the protein would have been followed by
characterisation of the putative COX-3 protein in terms of effect of
paracetamol and other antipyretic compounds on the catalytic activity of
the enzyme. No COX-3 protein was isolated so studies switched to the
effect of paracetamol on peripheral thermogenesis.
2. Investigation of the effect of paracetamol on peripheral thermogenesis:
Studies on the peripheral pathways involved assessing the effect of paracetamol
and other putative specific COX-3 inhibitors on thermogenesis pathways
including:
Lipolysis by measuring the release of glycerol from triglycerides.
Mitochondrial fatty acid uptake and oxidation.
The impact on the function of the mitochondrial ETC.
32
Chapter 2: Materials & Methods
2.1. Suppliers
Ms Elizabeth Wood, Queen Mary University of London, U.K.
Sigma-Aldrich, Dorset, U.K.
Envigo, Huntingdon, U.K.
Melford, Suffolk, U.K.
Bio-Rad, Watford, U.K.
Fisher Scientific, Loughborough, U.K.
Cayman Chemical, Michigan, U.S.A. (U.K. Distributor: Cambridge Bioscience,
Cambridge, U.K.).
Alpha Diagnostics International, San Antonio, U.S.A. (U.K. Distributor: Source
Bioscience, Nottingham, U.K.).
Eurofin Genomics, Wolverhampton, U.K.
Life Technologies, Thermo Fisher Scientific, Loughborough, U.K.
Promega, Southampton, U.K.
Roche Diagnostics, Basel, Switzerland.
Agilent Technologies, Cheshire, U.K.
Nuaire, Caerphilly, U.K.
RS Biotech, Irvine, U.K.
Beckman Coulter, High Wycombe, U.K.
B.Braun, Sheffield, U.K.
OPTIKA, Bergamo, Italy.
AMG, Mill Creek, U.S.A.
Edmund Bühler, Bodelshausen, Germany.
BioTek, Winooski, U.S.A.
Eppendrof , Hamburg, Germany.
Thermo Scientific, Waltham, U.S.A.
HANNA instruments, Leighton Buzzard, U.K.
Hettich, Manchester, U.K.
Nanodrop Technologies, Wilmington, U.S.A.
Janke & Kunkel (IKA), Staufen im Breisgau, Germany.
Scie-Plas, Cambridge, U.K.
GraphPad Software, San Diego, U.S.A.
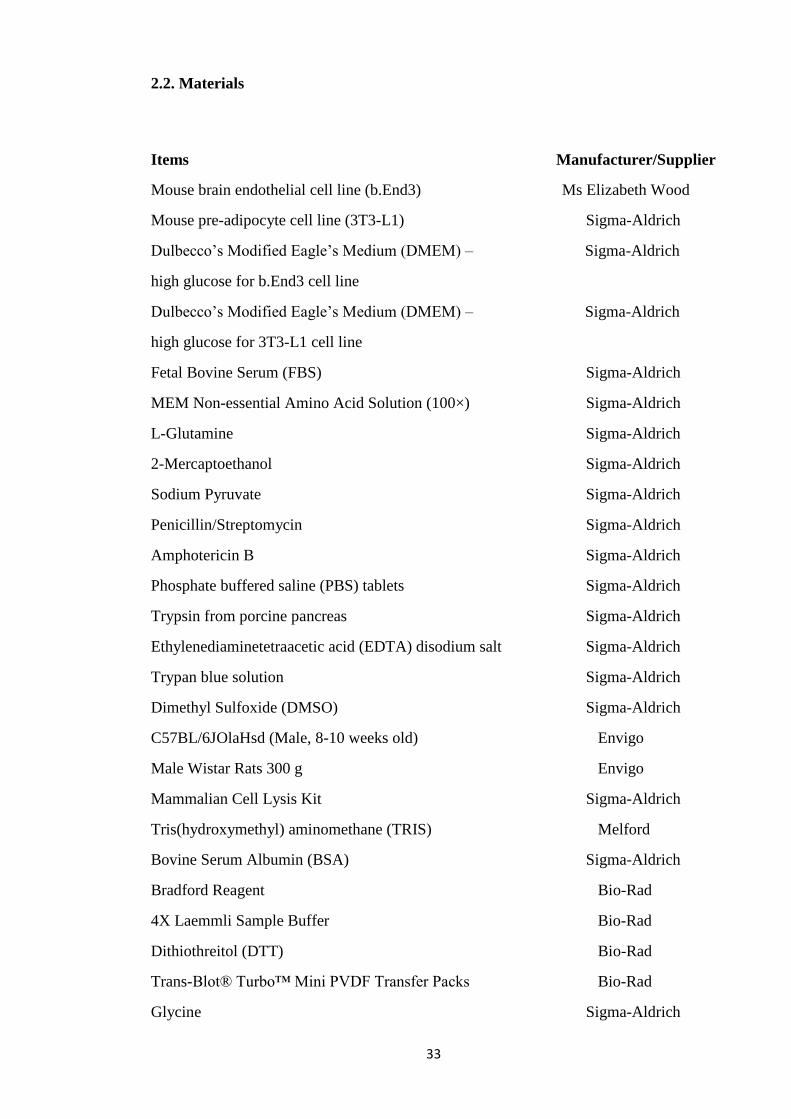
33
2.2. Materials
Items Manufacturer/Supplier
Mouse brain endothelial cell line (b.End3) Ms Elizabeth Wood
Mouse pre-adipocyte cell line (3T3-L1) Sigma-Aldrich
Dulbecco’s Modified Eagle’s Medium (DMEM) – Sigma-Aldrich
high glucose for b.End3 cell line
Dulbecco’s Modified Eagle’s Medium (DMEM) – Sigma-Aldrich
high glucose for 3T3-L1 cell line
Fetal Bovine Serum (FBS) Sigma-Aldrich
MEM Non-essential Amino Acid Solution (100×) Sigma-Aldrich
L-Glutamine Sigma-Aldrich
2-Mercaptoethanol Sigma-Aldrich
Sodium Pyruvate Sigma-Aldrich
Penicillin/Streptomycin Sigma-Aldrich
Amphotericin B Sigma-Aldrich
Phosphate buffered saline (PBS) tablets Sigma-Aldrich
Trypsin from porcine pancreas Sigma-Aldrich
Ethylenediaminetetraacetic acid (EDTA) disodium salt Sigma-Aldrich
Trypan blue solution Sigma-Aldrich
Dimethyl Sulfoxide (DMSO) Sigma-Aldrich
C57BL/6JOlaHsd (Male, 8-10 weeks old) Envigo
Male Wistar Rats 300 g Envigo
Mammalian Cell Lysis Kit Sigma-Aldrich
Tris(hydroxymethyl) aminomethane (TRIS) Melford
Bovine Serum Albumin (BSA) Sigma-Aldrich
Bradford Reagent Bio-Rad
4X Laemmli Sample Buffer Bio-Rad
Dithiothreitol (DTT) Bio-Rad
Trans-Blot® Turbo™ Mini PVDF Transfer Packs Bio-Rad
Glycine Sigma-Aldrich

34
Sodium dodecyl sulfate (SDS) Fisher Scientific
Methanol Fisher Scientific
Sodium Chloride (NaCl) Fisher Scientific
Triton x-100 Sigma-Aldrich
Clarity Western ECL Substrate Bio-Rad
COX-1 mouse Polyclonal antibody Cayman Chemical
COX-1 mouse blocking peptide Cayman Chemical
Goat anti-rabbit IgG HRP Cayman Chemical
Goat anti-mouse IgG HRP Cayman Chemical
Anti-Mouse Cyclooxygenase 3 (COX-3), Alpha Diagnostics
(Polyclonal) International
Mouse Monoclonal Anti-β-Actin antibody Sigma-Aldrich
Mouse Cyclooxygenase 3 (COX-3) Control/blocking peptide Alpha Diagnostics
International
Precision Plus Protein™ Dual Color Standards Bio-Rad
Lipopolysaccharides from Escherichia coli 0111:B4 Sigma-Aldrich
GenElute™ Direct mRNA Miniprep Kit Sigma-Aldrich
Custom-made oligonucleotides Eurofin Genomics
Agarose Melford
SYBR® Safe DNA Gel Stain Life Technologies
Blue/orange 6X loading dye Promega
DNA Molecular Weight Marker VI Roche Diagnostics
AccessQuick™ RT-PCR System Promega
Nuclease-Free Water Promega
Acetic acid Fisher Scientific
Insulin solution from bovine pancreas Sigma-Aldrich
Isobutylmethylxanthine (IBMX) Sigma-Aldrich
Dexamethasone Sigma-Aldrich
Rosiglitazone Cayman Chemical
Formaldehyde, Pure, Solution, Fisher Scientific
10% (v/v) in 0.9% Sodium Chloride Solution
Isopropanol Fisher Scientific
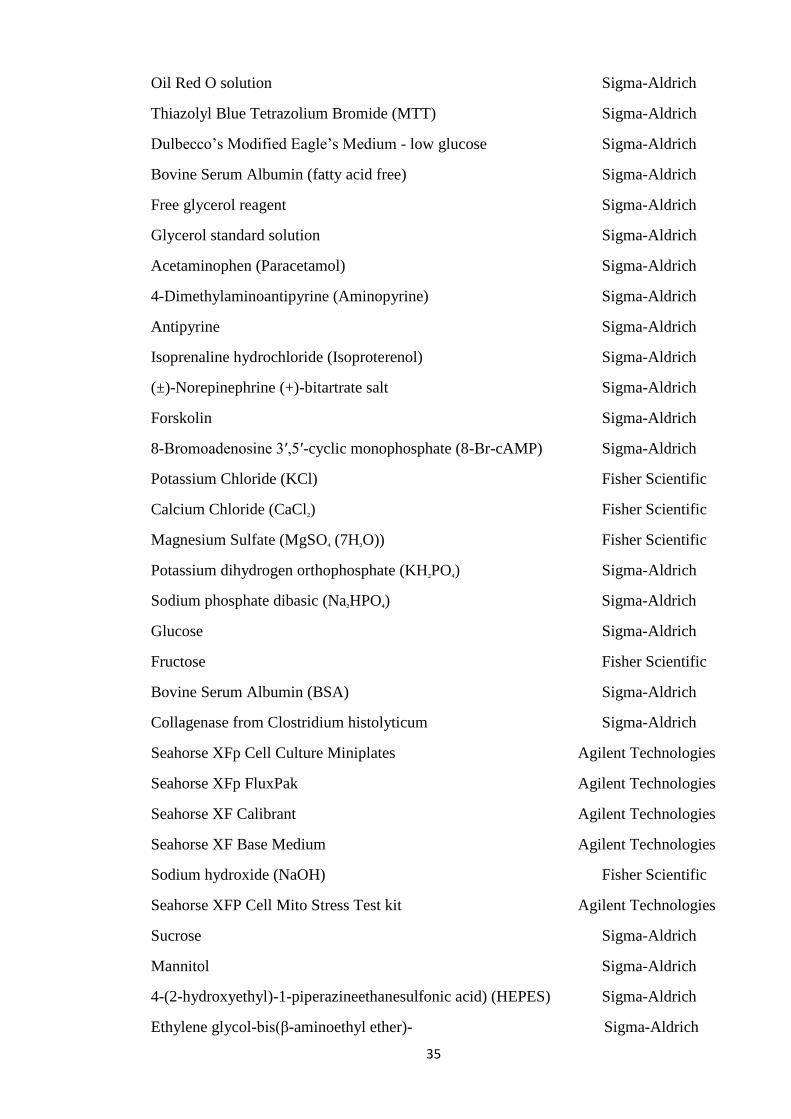
35
Oil Red O solution Sigma-Aldrich
Thiazolyl Blue Tetrazolium Bromide (MTT) Sigma-Aldrich
Dulbecco’s Modified Eagle’s Medium - low glucose Sigma-Aldrich
Bovine Serum Albumin (fatty acid free) Sigma-Aldrich
Free glycerol reagent Sigma-Aldrich
Glycerol standard solution Sigma-Aldrich
Acetaminophen (Paracetamol) Sigma-Aldrich
4-Dimethylaminoantipyrine (Aminopyrine) Sigma-Aldrich
Antipyrine Sigma-Aldrich
Isoprenaline hydrochloride (Isoproterenol) Sigma-Aldrich
(±)-Norepinephrine (+)-bitartrate salt Sigma-Aldrich
Forskolin Sigma-Aldrich
8-Bromoadenosine 3′,5′-cyclic monophosphate (8-Br-cAMP) Sigma-Aldrich
Potassium Chloride (KCl) Fisher Scientific
Calcium Chloride (CaCl₂) Fisher Scientific
Magnesium Sulfate (MgSO₄ (7H₂O)) Fisher Scientific
Potassium dihydrogen orthophosphate (KH₂PO₄) Sigma-Aldrich
Sodium phosphate dibasic (Na₂HPO₄) Sigma-Aldrich
Glucose Sigma-Aldrich
Fructose Fisher Scientific
Bovine Serum Albumin (BSA) Sigma-Aldrich
Collagenase from Clostridium histolyticum Sigma-Aldrich
Seahorse XFp Cell Culture Miniplates Agilent Technologies
Seahorse XFp FluxPak Agilent Technologies
Seahorse XF Calibrant Agilent Technologies
Seahorse XF Base Medium Agilent Technologies
Sodium hydroxide (NaOH) Fisher Scientific
Seahorse XFP Cell Mito Stress Test kit Agilent Technologies
Sucrose Sigma-Aldrich
Mannitol Sigma-Aldrich
4-(2-hydroxyethyl)-1-piperazineethanesulfonic acid) (HEPES) Sigma-Aldrich
Ethylene glycol-bis(β-aminoethyl ether)- Sigma-Aldrich
36
N,N,N',N'-tetraacetic acid) (EGTA)
Magnesium chloride (MgCl₂) Sigma-Aldrich
Sodium succinate dibasic hexahydrate Sigma-Aldrich
D-(+)-Malic acid Sigma-Aldrich
Potassium hydroxide (KOH) Fisher Scientific
Carbonyl cyanide 4-(trifluoromethoxy)phenylhydrazone (FCCP) Sigma-Aldrich
Rotenone Sigma-Aldrich
Oligomycin A Sigma-Aldrich
Antimycin A from Streptomyces sp Sigma-Aldrich
Ethanol Fisher Scientific
L-Ascorbic acid Sigma-Aldrich
N1,N1,N1,N1tetramethyl-1,4-phenylene diamine (TMPD) Sigma-Aldrich
Malonate Sigma-Aldrich
Sodium Azide Sigma-Aldrich
Dulbecco’s Modified Eagle’s Medium (DMEM) –
no glucose, no glutamine, no phenol red for FAO Assay Fisher Scientific
L-Carnitine hydrochloride Sigma-Aldrich
(+)-Etomoxir sodium salt hydrate Sigma-Aldrich
XF Palmitate-BSA FAO Substrate Agilent Technologies
XF BSA control FAO Agilent Technologies
N-Acetyl-p-benzoquinone imine (NAPQI) Cayman Chemical
4–15% Mini-PROTEAN® TGX™ Precast Protein Gels, Bio-Rad
10-well

37
2.3. Equipment
Equipment (model) Manufacturer
Class II Biological Safety Cabinet (CELLGARD) Nuaire
CO₂ Incubator (Galaxy R+) RS Biotech
Centrifuge (Avanti J-26S XP) Beckman Coulter
Waterbath (Thermomix® Me) B.Braun
LED Microscope (B-190) OPTIKA
Digital Inverted Microscope (EVOS® XI) AMG
Orbital shaker (KS 10) Edmund Bühler
Tissue homogeniser (Ultra Turrax TP 18/10) Janke & Kunkel
Multi-Mode Reader (Synergy HTX) BioTek
Thermomixer Comfort (Comfort) Eppendrof
Electrophoresis System (Mini-PROTEAN® Tetra Cell) Bio-Rad
Power Supply (PowerPac™ Basic) Bio-Rad
Imaging System for immunoblots (ChemiDoc™ XRS+) Bio-Rad
Western Blotting Transfer System (Trans-Blot® Turbo™) Bio-Rad
Imaging System for nucleic acids (Gel Doc™ EZ) Bio-Rad
Horizontal gel electrophoresis unit (HU6 Mini) Scie-Plas
Non-CO₂ 37°C incubator (Heratherm™) Thermo Scientific
Seahorse Analyzer (XFp) Agilent Technologies
Multiparameter pH Meter (edge® 2210) HANNA instruments
Centrifuge (5920R) Eppendrof
Benchtop Centrifuge (Mikro 120) Hettich
Thermal Cycler (T100) Bio-Rad
Nanodrop spectrophotometer (ND-1000) Nanodrop
Technologies
38
2.4. Methods
2.4.1. Cell culture
The mouse brain endothelial cell line (b.End3) was maintained under standard culture
conditions (37°C, 5% CO₂, 95% air) with medium containing DMEM supplemented
with 10% fetal bovine serum (FBS), 1% w/v non-essential amino acids, 2 mM
glutamine, 1 mM sodium pyruvate, 5 µM 2-mercaptoethanol, 10,000 units
penicillin/mL, 10 mg streptomycin/mL (5 mL/500 mL of medium) and 250 μg/mL
amphotericin B (5 mL/500 mL of medium) (Public Health England, U.K.). Sub-
confluent cultures (70-80%) were seeded at 20-40,000 cells/cm² using 0.25% trypsin
and 0.03% EDTA. The confluency of cells was at 60%-70% in experiments. Cell
viability was assessed by trypan blue dye assay.
The mouse 3T3-L1 pre-adipocyte cell line was maintained in the same manner as the
b.End3 cells with medium containing DMEM supplemented with 10% FBS, 2 mM
glutamine, 10,000 units penicillin/mL, 10 mg streptomycin/mL (5 mL/500 mL of
medium) and 250 μg/mL amphotericin B (5 mL/500 mL of medium) (Public Health
England, U.K.). Sub-confluent cultures (70-80%) were seeded at 10-20,000/ cm² using
0.25% trypsin and 0.03% EDTA. The culture was not allowed to become fully
confluent and subcultured every 3 days. Cell viability was assessed by trypan blue dye
assay.
2.4.2. Sample preparation to determine COX protein expression
Mouse brain endothelial cells at 60%-70% confluent were removed by gentle scraping,
placed in a centrifuge tube and spun at 500 x g for 5 minutes at 4°C to remove the
medium. Cells were resuspended in 1 ml of PBS at 4°C, spun at 13000 x g for 2 minutes
at 4°C and the cell pellet was kept at -20°C.
Animals (male C57BL/6 mice) were killed by cervical dislocation and whole brain
tissues were removed immediately, washed in PBS at 4°C and stored immediately in -
80°C.
39
2.4.3. Bradford protein assay and western blotting to determine COX protein
expression
Samples (cells or tissues) were incubated with cell lysis buffer for 15 minutes at 4°C on
an orbital shaker according to manufacturer’s instructions (Sigma-Aldrich, U.K.). In
case of tissues, samples were then homogenized at 4°C (Sigma-Aldrich, U.K.). Protein
concentration was determined using Bradford assay. BSA stock (1 mg/mL) was
prepared by dissolving BSA in distilled water. BSA standards (0.05 mg/mL, 0.1
mg/mL, 0.2 mg/mL, 0.3 mg/mL, 0.4 mg/mL, and 0.5 mg/mL) were prepared. The
samples were diluted in 50 mM tris buffer (pH 7.5) and 10 µL of this was transferred to
a 96-well plate. 200 µL Bradford reagent (1:4 dilution) was added and the plate was
read at 595 nm (Bradford, 1976).
For western blotting, samples were reconstituted in 4X Laemmli sample buffer (25 µL
of 2 M DTT added) and then heated at 99°C for 5 minutes in a thermomixer. 4-15%
Mini-PROTEAN® TGX™ precast gels were placed in the frames of the protean system
after taking out the bottom tape. The gel plate frames were filled with 1X running buffer
(25 mM Tris base, 250 mM Glycine, 0.1% (w/v) SDS dissolved in distilled water and
the pH was 8.3). 10 µL of prestained molecular weight marker was added in the 1st well
and the rest of the wells were loaded with samples according to the plan of each
experiment. The gel plate frames were placed in the tank and 1X running buffer was
added upto the mark according to the total number of the gels in the tank. The lid was
placed and tank was attached to the Power Pac set at 100 V and was switched off as
samples were 2 cm from the bottom of the gel.
The prepackaged transfer pack was opened and the bottom of the pack containing the
membrane was placed on the Bio-Rad transfer cassette. After removing the gels
between the glass plates, the stacking gel was removed and placed on the top of the
membrane followed by the top portion of the pack. The transfer sandwich was rolled
using a roller to avoid air bubbles. The lid of the transfer cassette was placed and
inserted in the Trans-Blot® Turbo™ Transfer System and Bio-Rad mini tgx 3 minutes
transfer (2.5 A; upto 25 V) was selected. Once transfer was completed, membranes were
placed in a container containing small volume of 1X washing buffer (50 mM Tris base,
150 mM Sodium Chloride, 0.1% (v/v) Triton x-100 dissolved in distilled water) to
cover the membrane.
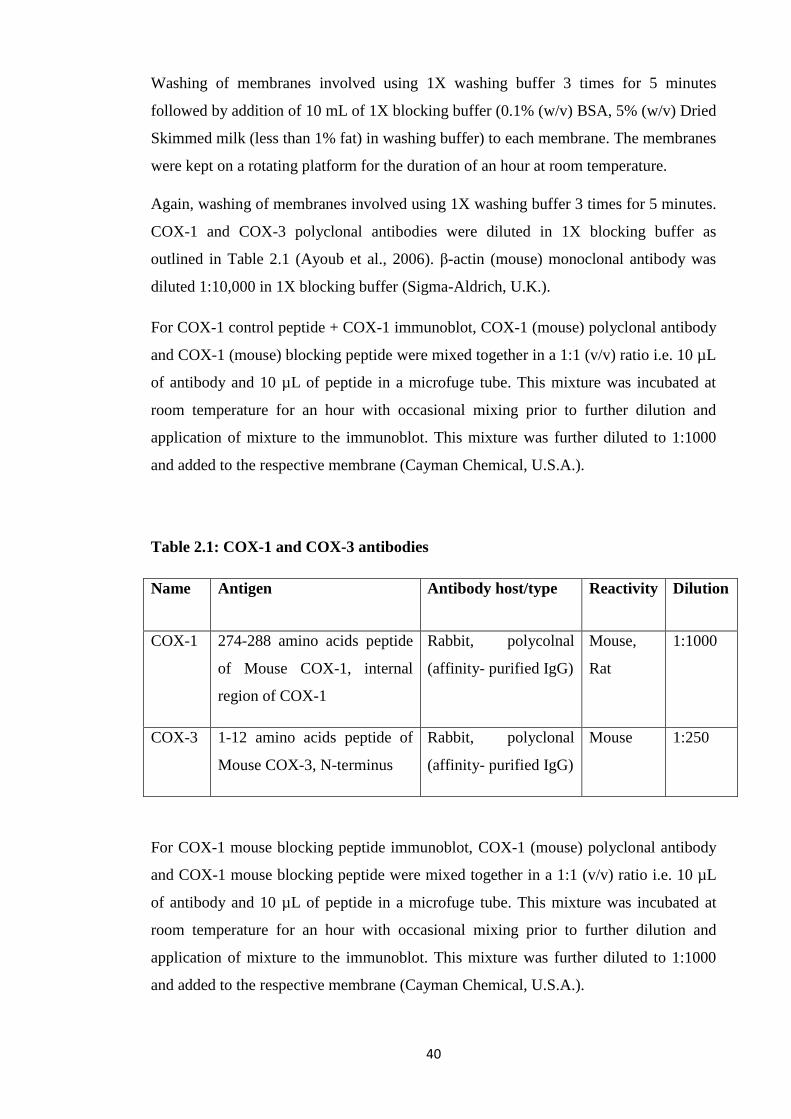
40
Washing of membranes involved using 1X washing buffer 3 times for 5 minutes
followed by addition of 10 mL of 1X blocking buffer (0.1% (w/v) BSA, 5% (w/v) Dried
Skimmed milk (less than 1% fat) in washing buffer) to each membrane. The membranes
were kept on a rotating platform for the duration of an hour at room temperature.
Again, washing of membranes involved using 1X washing buffer 3 times for 5 minutes.
COX-1 and COX-3 polyclonal antibodies were diluted in 1X blocking buffer as
outlined in Table 2.1 (Ayoub et al., 2006). β-actin (mouse) monoclonal antibody was
diluted 1:10,000 in 1X blocking buffer (Sigma-Aldrich, U.K.).
For COX-1 control peptide + COX-1 immunoblot, COX-1 (mouse) polyclonal antibody
and COX-1 (mouse) blocking peptide were mixed together in a 1:1 (v/v) ratio i.e. 10 µL
of antibody and 10 µL of peptide in a microfuge tube. This mixture was incubated at
room temperature for an hour with occasional mixing prior to further dilution and
application of mixture to the immunoblot. This mixture was further diluted to 1:1000
and added to the respective membrane (Cayman Chemical, U.S.A.).
Table 2.1: COX-1 and COX-3 antibodies
Name Antigen Antibody host/type Reactivity Dilution
COX-1 274-288 amino acids peptide
of Mouse COX-1, internal
region of COX-1
Rabbit, polycolnal
(affinity- purified IgG)
Mouse,
Rat
1:1000
COX-3 1-12 amino acids peptide of
Mouse COX-3, N-terminus
Rabbit, polyclonal
(affinity- purified IgG)
Mouse 1:250
For COX-1 mouse blocking peptide immunoblot, COX-1 (mouse) polyclonal antibody
and COX-1 mouse blocking peptide were mixed together in a 1:1 (v/v) ratio i.e. 10 µL
of antibody and 10 µL of peptide in a microfuge tube. This mixture was incubated at
room temperature for an hour with occasional mixing prior to further dilution and
application of mixture to the immunoblot. This mixture was further diluted to 1:1000
and added to the respective membrane (Cayman Chemical, U.S.A.).
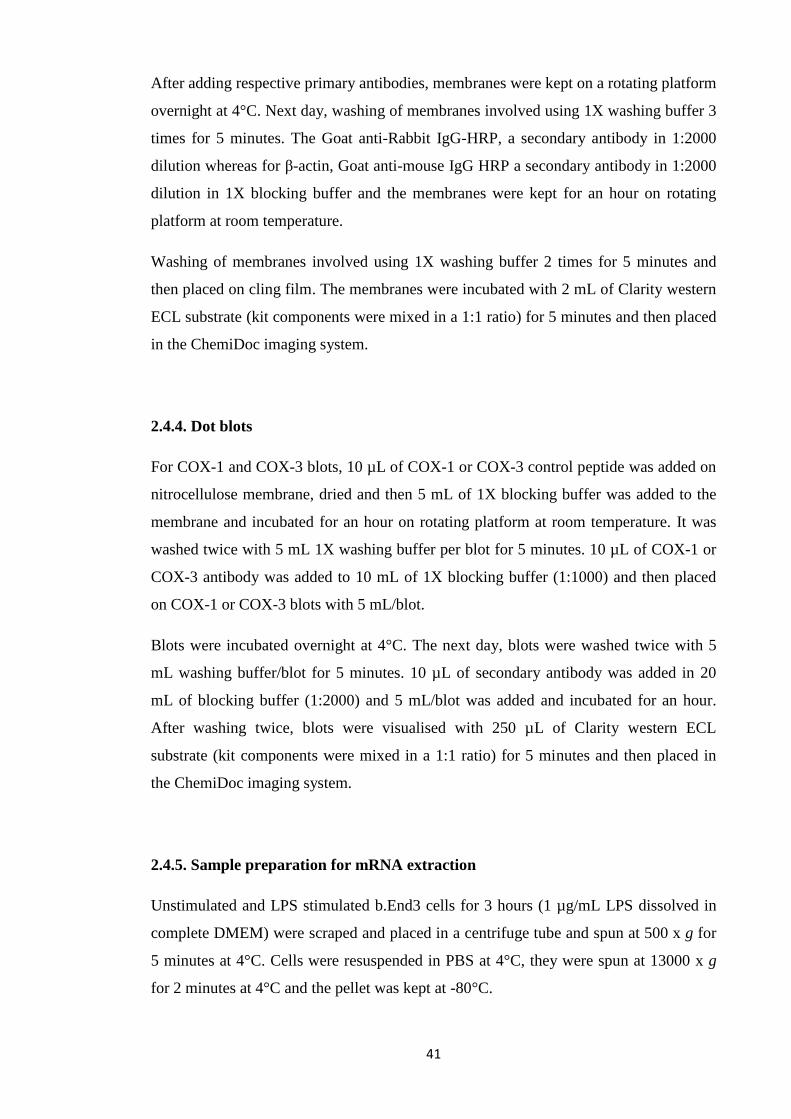
41
After adding respective primary antibodies, membranes were kept on a rotating platform
overnight at 4°C. Next day, washing of membranes involved using 1X washing buffer 3
times for 5 minutes. The Goat anti-Rabbit IgG-HRP, a secondary antibody in 1:2000
dilution whereas for β-actin, Goat anti-mouse IgG HRP a secondary antibody in 1:2000
dilution in 1X blocking buffer and the membranes were kept for an hour on rotating
platform at room temperature.
Washing of membranes involved using 1X washing buffer 2 times for 5 minutes and
then placed on cling film. The membranes were incubated with 2 mL of Clarity western
ECL substrate (kit components were mixed in a 1:1 ratio) for 5 minutes and then placed
in the ChemiDoc imaging system.
2.4.4. Dot blots
For COX-1 and COX-3 blots, 10 µL of COX-1 or COX-3 control peptide was added on
nitrocellulose membrane, dried and then 5 mL of 1X blocking buffer was added to the
membrane and incubated for an hour on rotating platform at room temperature. It was
washed twice with 5 mL 1X washing buffer per blot for 5 minutes. 10 µL of COX-1 or
COX-3 antibody was added to 10 mL of 1X blocking buffer (1:1000) and then placed
on COX-1 or COX-3 blots with 5 mL/blot.
Blots were incubated overnight at 4°C. The next day, blots were washed twice with 5
mL washing buffer/blot for 5 minutes. 10 µL of secondary antibody was added in 20
mL of blocking buffer (1:2000) and 5 mL/blot was added and incubated for an hour.
After washing twice, blots were visualised with 250 µL of Clarity western ECL
substrate (kit components were mixed in a 1:1 ratio) for 5 minutes and then placed in
the ChemiDoc imaging system.
2.4.5. Sample preparation for mRNA extraction
Unstimulated and LPS stimulated b.End3 cells for 3 hours (1 µg/mL LPS dissolved in
complete DMEM) were scraped and placed in a centrifuge tube and spun at 500 x g for
5 minutes at 4°C. Cells were resuspended in PBS at 4°C, they were spun at 13000 x g
for 2 minutes at 4°C and the pellet was kept at -80°C.

42
2.4.6. Direct mRNA extraction
Direct mRNA extraction was performed with the help of manufacturer’s kit instructions
(Sigma Aldrich, U.K). For b.End3 cells, the cells were lysed using lysis solution,
pipetted thoroughly until all clumps disappeared and then transferred into a filtration
column and spun at 16,000 x g for 2 minutes. The homogenized lysate (flow-through
liquid) was then incubated at 65 °C for 10 minutes. Sodium chloride solution was added
to the digested cell lysate and then resuspended oligo(dT) beads were added to the
lysate-sodium chloride mixture and mixed thoroughly by vortexing until homogenous.
The lysate/bead mixture was kept at room temperature for 10 minutes. The oligo(dT)
beads:mRNA complex was pelleted by centrifuging for 5 minutes at 16,000 x g and the
supernatant was carefully removed and discarded by pipetting without disturbing the
pellet.
For mRNA enrichment, initially the bound material first set free from beads into fresh
lysis solution; mRNA is then rebounded to the same beads by adding lysis solution and
sodium chloride solution and vortexed thoroughly. The suspension was kept at 65 °C
for 5 minutes followed by at room temperature for 5 minutes. The bead:mRNA complex
was pelleted for 2 min and the supernatant was removed and discarded. The pellet was
resuspended in wash solution and transferred to spin filter-collection tube assembly by
pipetting and spun for 1-2 minutes at 16,000 x g. The flow through liquid was discarded
but retained the collection tube. Same steps were repeated for second and third wash
using low salt wash solution. The spin filter was placed into a fresh collection tube and
preheated elution solution (65°C) was added onto the spin filter ensuring that it contacts
the bead:mRNA complex and incubated for 2-5 minutes at 65°C, spun for 1-2 minutes
and the flow-through liquid contained most of the purified mRNA. Same steps were
repeated for second elution. For qualitative and quantitative measurements, samples
were analysed using Nanodrop and stored at -80°C.
For frozen whole brain tissues, samples were quickly sliced and weighed upto 40 mg
per preparation. The tissues were homogenised using the lysis solution immediately
until no visible pieces remained and same steps were performed as above.
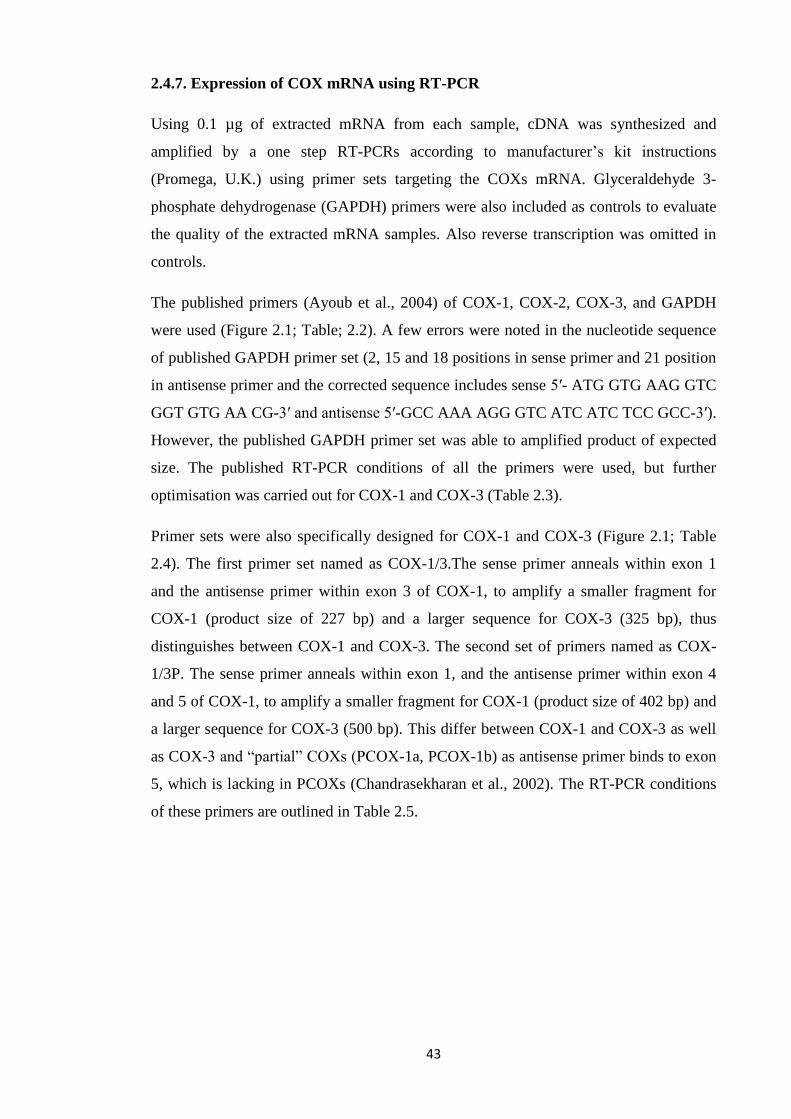
43
2.4.7. Expression of COX mRNA using RT-PCR
Using 0.1 µg of extracted mRNA from each sample, cDNA was synthesized and
amplified by a one step RT-PCRs according to manufacturer’s kit instructions
(Promega, U.K.) using primer sets targeting the COXs mRNA. Glyceraldehyde 3-
phosphate dehydrogenase (GAPDH) primers were also included as controls to evaluate
the quality of the extracted mRNA samples. Also reverse transcription was omitted in
controls.
The published primers (Ayoub et al., 2004) of COX-1, COX-2, COX-3, and GAPDH
were used (Figure 2.1; Table; 2.2). A few errors were noted in the nucleotide sequence
of published GAPDH primer set (2, 15 and 18 positions in sense primer and 21 position
in antisense primer and the corrected sequence includes sense 5′- ATG GTG AAG GTC
GGT GTG AA CG-3′ and antisense 5′-GCC AAA AGG GTC ATC ATC TCC GCC-3′).
However, the published GAPDH primer set was able to amplified product of expected
size. The published RT-PCR conditions of all the primers were used, but further
optimisation was carried out for COX-1 and COX-3 (Table 2.3).
Primer sets were also specifically designed for COX-1 and COX-3 (Figure 2.1; Table
2.4). The first primer set named as COX-1/3.The sense primer anneals within exon 1
and the antisense primer within exon 3 of COX-1, to amplify a smaller fragment for
COX-1 (product size of 227 bp) and a larger sequence for COX-3 (325 bp), thus
distinguishes between COX-1 and COX-3. The second set of primers named as COX-
1/3P. The sense primer anneals within exon 1, and the antisense primer within exon 4
and 5 of COX-1, to amplify a smaller fragment for COX-1 (product size of 402 bp) and
a larger sequence for COX-3 (500 bp). This differ between COX-1 and COX-3 as well
as COX-3 and “partial” COXs (PCOX-1a, PCOX-1b) as antisense primer binds to exon
5, which is lacking in PCOXs (Chandrasekharan et al., 2002). The RT-PCR conditions
of these primers are outlined in Table 2.5.

44
A. COX-1
B. COX-2
C. COX-3
D. COX-1
E. COX-1/3
F. COX-1/3P
Exon Intron
Figure 2.1: Primers used for RT-PCR: A,B,C. Published primers for COX-1, COX-2
and COX-3 (Ayoub et al., 2004). C,D,E. Custom made primers for COX-1 and COX-3.
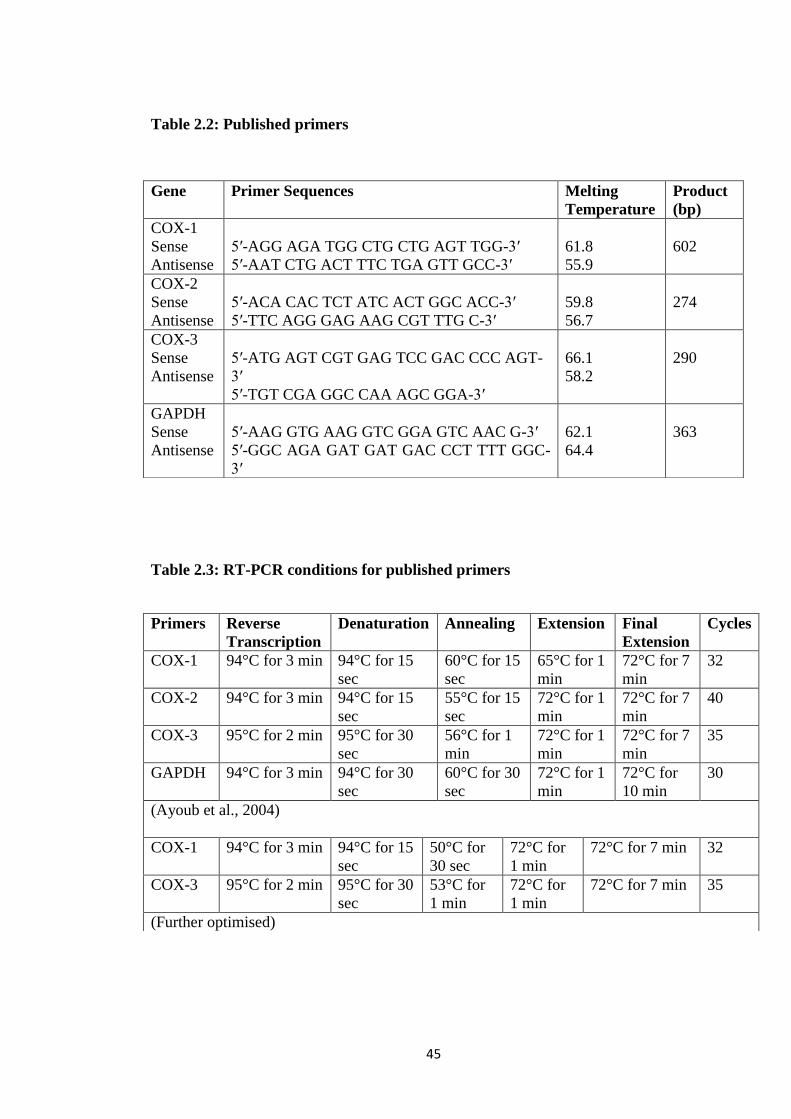
45
Table 2.2: Published primers
Table 2.3: RT-PCR conditions for published primers
Gene Primer Sequences Melting
Temperature
Product
(bp)
COX-1
Sense
Antisense
5′-AGG AGA TGG CTG CTG AGT TGG-3′
5′-AAT CTG ACT TTC TGA GTT GCC-3′
61.8
55.9
602
COX-2
Sense
Antisense
5′-ACA CAC TCT ATC ACT GGC ACC-3′
5′-TTC AGG GAG AAG CGT TTG C-3′
59.8
56.7
274
COX-3
Sense
Antisense
5′-ATG AGT CGT GAG TCC GAC CCC AGT-
3′
5′-TGT CGA GGC CAA AGC GGA-3′
66.1
58.2
290
GAPDH
Sense
Antisense
5′-AAG GTG AAG GTC GGA GTC AAC G-3′
5′-GGC AGA GAT GAT GAC CCT TTT GGC-
3′
62.1
64.4
363
Primers Reverse
Transcription
Denaturation Annealing Extension Final
Extension
Cycles
COX-1 94°C for 3 min 94°C for 15
sec
60°C for 15
sec
65°C for 1
min
72°C for 7
min
32
COX-2 94°C for 3 min 94°C for 15
sec
55°C for 15
sec
72°C for 1
min
72°C for 7
min
40
COX-3 95°C for 2 min 95°C for 30
sec
56°C for 1
min
72°C for 1
min
72°C for 7
min
35
GAPDH 94°C for 3 min 94°C for 30
sec
60°C for 30
sec
72°C for 1
min
72°C for
10 min
30
(Ayoub et al., 2004)
COX-1 94°C for 3 min 94°C for 15
sec
50°C for
30 sec
72°C for
1 min
72°C for 7 min 32
COX-3 95°C for 2 min 95°C for 30
sec
53°C for
1 min
72°C for
1 min
72°C for 7 min 35
(Further optimised)

46
Table 2.4: Custom made primers for COX-1 and COX-3:
Gene Primer Sequences Melting
temperature
Product
length (bp)
COX-1
Sense
Antisense
5′-GGC TTC GTG AAC ATA ACC GC-3′
5′-ATC CAC AGC CAC ATG CAG AA-3′
59.4
57.3
437
COX-1/3
Sense
Antisense
5′-GGC ATT GCA CAT CCA TCC AC-3′
5′-TAG CCC GTG CGA GTA CAA TC-3′
59.4
59.4
COX-1 (227)
COX-3 (325)
COX-1/3P
Sense
Antisense
5′-GGC ATT GCA CAT CCA TCC AC-3′
5′-GTT GGA CCG CAC TGT GAG TA-3′
59.4
59.4
COX-1 (402)
COX-3 (500)
(NCBI Reference Sequence: NM_008969.4)
Table 2.5: RT-PCR conditions for custom made primers for COX-1 and COX-3:
The cDNA products were viewed on 2% (w/v) agarose gel. The gel was directly
prepared in SYBR Safe gel stain. The stain was diluted in 1X TAE buffer (40 mM Tris,
20 mM acetic acid, 1 mM EDTA, pH 8.0), added to the powdered agarose and heated in
a microwave for 2 minutes to dissolve. The gel was left to set for 30 minutes. The gel
was placed in a tank filled with 1X TAE buffer and loaded with 10 µL PCR product
mixed with blue/orange 6X loading dye and 5 µL of DNA ladder. The gel was run at
100 V for 30 minutes and the bands were visualised using Gel Doc™ EZ system.
2.4.8. Differentiation of 3T3-L1 pre-adipocytes
For the differentiation of pre-adipocytes, once cells become confluent, they were further
allowed to grow for four additional days and this was treated as Day 0. At Day 1, cells
were placed in DMEM differentiation medium with 10% fetal bovine serum, 1 µg/mL
insulin, 0.5 mM isobutylmethylxanthine (IBMX), 1 µM dexamethasone, 2 µM
Primers Reverse
Transcription
Denaturation Annealing Extension Final
Extension
Cycles
COX-1 94°C for 3 min 94°C for 15
sec
52°C for
30 sec
72°C for 1
min
72°C for 7
min
32
COX-
1/3 and
COX-
1/3P
95°C for 2 min 95°C for 30
sec
54°C for 1
min
72°C for 1
min
72°C for 7
min
35
47
rosiglitazone for 48 hours. On day 3, the differentiation medium was switched to
DMEM containing 10% FBS and 1 µg/mL insulin and changed after every 48 hours
from this stage until fully differentiated 3T3-L1 adipocytes formation (Public Health
England, U.K.; Zebisch et al., 2012; Zenbio, U.S.A).
2.4.9. Oil Red O staining
The differentiation process was confirmed by Oil Red O staining. The culture medium
was removed and after washing cells twice with sterile PBS and fixed with 10%
formalin for 30 minutes at room temperature. Washing step involved using sterile water
and incubated with 60% isopropanol solution. After 5 minutes, 60% isopropanol was
removed and working solution of Oil Red O was prepared by mixing 3 parts of stock
solution to 2 parts of sterile water was filtered and added to the cells. After 15-20
minutes, the cells were again washed twice with sterile water and the staining of lipid
droplets and cell morphology was observed under microscope. For quantification,
sterile water was removed and the stain was extracted with 100% isopropanol by adding
100 µL of 100% isopropanol in each well and placed on orbital shaker at room
temperature for 5 minutes with gentle rocking. The absorbance was read at 510 nm
(BioVision, U.S.A.).
2.4.10. MTT assay on 3T3-L1 differentiated adipocytes
The 3T3-L1 adipocytes were exposed to different concentrations of test compounds in
24-well plates. After 24 or 48 hours, 50 µL MTT solution (5 mg/mL in PBS and filter
sterilised) was added to cells and kept for an hour. After an hour exposure with MTT,
the medium was aspirated and 100% isopropanol was added to each well and mixed
until the formazan crystal product get dissolved. The absorbance was measured at
570 nm.
2.4.11. Lipolysis assay in 3T3-L1 differentiated adipocytes
After two hours of serum-free incubation (Schweiger et al., 2014) for all experiments,
the differentiated cells were exposed to different concentrations of paracetamol or
48
aminopyrine or antipyrine (1 mM or 10 mM) with 2% BSA (fatty acid free) and
glycerol release was measured after 1, 3 and 24 hours for basal lipolysis.
For norepinephrine stimulated lipolysis, cells were pre-incubated with different
concentrations of paracetamol (1 mM or 10 mM) with 2% BSA (fatty acid free) for 30
minutes and then incubated with norepinephrine (1 µM) with 2% BSA (fatty acid free)
and glycerol release was measured after 1, 3 hours.
For isoproterenol stimulated lipolysis, cells were treated with different concentrations of
paracetamol (1 mM or 10 mM) and isoproterenol (0.001 - 0.1 µM) with 2% BSA (fatty
acid free) added simultaneously. Alternatively, cells were pre-incubated with different
concentrations of paracetamol (1 mM or 10 mM) with 2% BSA (fatty acid free) for 30
minutes and then incubated with different concentrations of isoproterenol (0.001 - 10
µM) with 2% BSA (fatty acid free) and glycerol release was measured after 1, 3, 24 and
48 hours.
For forskolin and 8-Br-cAMP stimulated lipolysis, cells were pre-incubated with
different concentrations of paracetamol (1 mM or 10 mM) with 2% BSA (fatty acid
free) for 30 minutes and then incubated with forskolin (100 µM) or 8-Br-cAMP (1 mM)
with 2% BSA (fatty acid free) and glycerol release was measured after 1, 3 and 24
hours.
Glycerol standards (1.95 µg/mL, 3.9 µg/mL, 7.8 µg/mL, 15.6 µg/mL, 31.25 µg/mL,
62.5 µg/mL, 125 µg/mL) were prepared using glycerol standard solution (260 µg/mL)
in distilled water. 25 µL of each sample or standard was transferred to a new 96-well
plate and 100 µL of glycerol reagent was added and read at 540 nm (Sigma-Aldrich,
U.K.).
2.4.12. Isolation of rat primary brown adipocytes
2 rats were killed by cervical dislocation and brown adipose tissue from the
interscapular depots was dissected out and placed on a parafilm in a small volume of
Krebs/Ringer phosphate buffer (114.7 mM NaCl, 1.3 mM KCl, 1.5 mM CaCl₂, 1.4 mM
MgSO₄ (7H₂O), 5.6 mM KH₂PO₄, 16.7 mM Na₂HPO₄, 10 mM glucose, 10 mM
fructose; pH was adjusted with Tris-OH or HCl to 7.4). The tissue was cleaned from
white fat and connective tissue, and pooled (Cannon and Nedergaard, 2008). The brown
adipose tissue was minced with scissors and placed in a centrifuge tube containing 3 mL

49
Krebs/Ringer phosphate buffer with 4% crude bovine serum albumin and 0.83 mg/mL
collagenase. The first incubation was carried out for 5 minutes in a water bath set at
37°C and the tube was vortexed for 5 seconds after the addition of 7 mL of
Krebs/Ringer phosphate buffer.
The tissue fragments were filtered through a cell strainer and the filtrate was discarded.
The tissue fragments were transferred to a small volume of Krebs/Ringer phosphate
buffer on a square of parafilm and minced with scissors. The second incubation was
carried out for in 3 mL fresh, albumin and collagenase containing buffer as above for 25
minutes, with 5 seconds vortexing every fifth minute. The contents of the vial were
filtered after adding 7 mL of Krebs/Ringer phosphate buffer and vortexing the vial for
15 seconds.
The filtrate was collected and centrifuged at 65 x g for 5 minutes. The remaining tissue
pieces were incubated as above for 15 minutes and the cells were collected in order to
increase the yield. The infranatants in all tubes were discarded and the cells were
combined and washed with 10 mL of Krebs/Ringer phosphate buffer and centrifuged at
65 x g for 2 minutes and allowed to stand at room temperature. The cells were counted
and used immediately for experiments.
2.4.13. MTT assay on rat primary brown adipocytes
Isolated rat primary brown adipocytes were cultured in 96-well plates and then treated
with different concentrations of test compounds. After 2 and 24 hours, 10 µL MTT
solution (5 mg/mL in PBS and filter sterilised) added to cells and kept for an hour. After
an hour exposure with MTT, 100% isopropanol was added to each well and mixed until
the formazan crystal product get dissolved. The absorbance was measured at 570 nm.
2.4.14. Lipolysis assay in rat primary brown adipocytes
Brown adipocytes were treated with different concentrations of paracetamol or
aminopyrine or antipyrine (250 µM - 10 mM) and glycerol release was measured after 1
and 24 hours as in section 2.4.11.
For norepinephrine stimulated lipolysis, brown adipocytes were pre-incubated with
different concentrations of paracetamol or aminopyrine or antipyrine (1 mM or 10 mM)
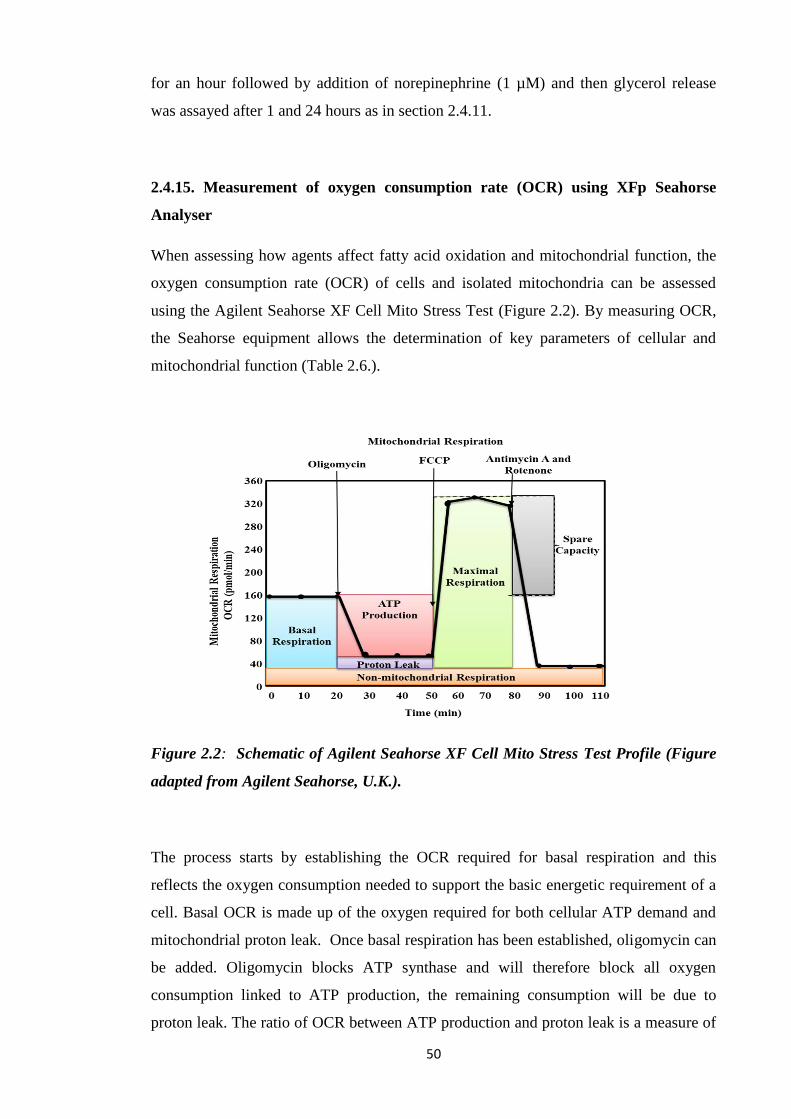
50
for an hour followed by addition of norepinephrine (1 µM) and then glycerol release
was assayed after 1 and 24 hours as in section 2.4.11.
2.4.15. Measurement of oxygen consumption rate (OCR) using XFp Seahorse
Analyser
When assessing how agents affect fatty acid oxidation and mitochondrial function, the
oxygen consumption rate (OCR) of cells and isolated mitochondria can be assessed
using the Agilent Seahorse XF Cell Mito Stress Test (Figure 2.2). By measuring OCR,
the Seahorse equipment allows the determination of key parameters of cellular and
mitochondrial function (Table 2.6.).
Figure 2.2: Schematic of Agilent Seahorse XF Cell Mito Stress Test Profile (Figure
adapted from Agilent Seahorse, U.K.).
The process starts by establishing the OCR required for basal respiration and this
reflects the oxygen consumption needed to support the basic energetic requirement of a
cell. Basal OCR is made up of the oxygen required for both cellular ATP demand and
mitochondrial proton leak. Once basal respiration has been established, oligomycin can
be added. Oligomycin blocks ATP synthase and will therefore block all oxygen
consumption linked to ATP production, the remaining consumption will be due to
proton leak. The ratio of OCR between ATP production and proton leak is a measure of

51
coupling efficiency with adipocytes having very low (<30%) coupling efficiency. A
high rate of proton leak in the absence of an exogenous chemical will normally indicate
damaged mitochondria possibly during preparation or storage. Carbonyl cyanide-4
(trifluoromethoxy) phenylhydrazone (FCCP) is then added to determine the OCR at
maximal respiration. FCCP is known as an uncoupler as it breaks the link between
oxidation from the production of ATP in the mitochondria. Oxygen consumption in the
presence of FCCP demonstrates the theoretical maximum capacity of mitochondrial
ETC. The addition of rotenone and antimycin A will completely block any substrate
driven oxygen consumption. Any oxygen consumption observed following the addition
of rotenone and antimycin A will be due to non-mitochondrial respiration.
Determination of non-mitochondrial respiration is necessary to accurately assess other
cellular enzyme activity which consumes oxygen. The system also allows the
measurement of spare respiratory capacity which indicates how closely cells respire to
their maximum respiration rate.
Table 2.6: Mitochondrial function parameters
Parameter Value Equation
Non-mitochondrial Oxygen
Consumption
Minimum rate measurement after Rotenone/antimycin
A injection
Basal Respiration (Last rate measurement before first injection) – (Non-
Mitochondrial Respiration Rate)
Maximal Respiration (Maximum rate measurement after FCCP injection) –
(Non-Mitochondrial Respiration)
Proton Leak (Minimum rate measurement after Oligomycin
injection) – (Non-Mitochondrial Respiration)
ATP Production (Last rate measurement before Oligomycin injection) –
(Minimum rate measurement after Oligomycin
injection)
Spare Respiratory Capacity (Maximal Respiration) – (Basal Respiration)
Spare Respiratory Capacity
(%)
(Maximal Respiration) – (Basal Respiration) x 100
Coupling Efficiency (%) (ATP Production Rate) / (Basal Respiration Rate) x 100
(Table adapted from Agilent Seahorse, U.K.).
52
2.4.15.1. General Setup: seeding 3T3-L1 cells in Seahorse XFp cell culture
miniplates
Model no. 1:
In an XFp cell culture miniplate, using 8-channel pipettor set to 180 μL, sterile water
was added to both sides of the moat (two tips will fit into each chamber) around the cell
culture wells. 100 μL of growth medium only (no cells) was added to background
correction wells A and H. Cells were harvested and resuspended in growth medium,
counted and then diluted to the desired seeding concentration (5000 cells/well). 100 μL
of cell suspension was added to wells B-G. Cells were allowed to grow in a cell culture
incubator and differentiated. Cells were monitored to ensure that the moat did not dry
out during this period. The growth and health of cells were checked using a microscope
(Agilent Seahorse, U.K.).
Model no. 2:
3T3-L1 cells were differentiated in 24-well plates. In an XFp cell culture miniplate,
using 8-channel pipettor set to 180 μL, sterile water was added to both sides of the moat
(two tips will fit into each chamber) around the cell culture wells. 100 μL of growth
medium only (no cells) was added to background correction wells A and H.
Differentiated cells were then harvested and resuspended in growth medium, counted
and then diluted to the desired seeding concentration (5000 cells/well). 100 μL of cell
suspension was added to wells B-G. Cells were placed in a cell culture incubator
overnight. Cells were monitored to ensure that the moat did not dry out during this
period. The growth and health of cells were checked using a microscope.
2.4.15.2. Hydration of Seahorse XFp sensor cartridge
Procedure no.1
The day prior to assay, the utility plate and sensor cartridge were separated and the
sensor cartridge was placed upside down on the bench. Each well of the utility plate was
filled with 200 μL of Seahorse XF calibrant whereas the moats around the outside of the
wells were filled with 400 μL per chamber. The Seahorse XFp sensor cartridge was
returned to the utility plate that now contains calibrant. The cartridge assembly was
placed in a non-CO₂ 37°C incubator overnight. To prevent evaporation of the Seahorse

53
XF calibrant, the incubator was humidified. Following the overnight incubation and on
the day of assay, the cartridge assembly was removed from the incubator. The sensor
cartridge was lifted completely out of the calibrant and utility plate and was then
immediately returned back onto the utility plate, submerging the sensors in calibrant.
This step eliminated any bubbles that might had formed during the overnight hydration
(Agilent Seahorse, U.K.).
Procedure no.2
The day prior to assay, 5 mL of Seahorse XF calibrant was aliquoted into a 15 mL
conical tube and placed in a non-CO₂ 37°C incubator overnight. The sensor cartridge
was placed upside down next to the utility plate. Each well of the utility plate was filled
with 200 μL of sterile water and moats around the outside of the wells were filled with
400 μL per chamber. The sensor cartridge placed on the utility plate submerging the
sensors in water. The water level was verified as high enough to keep the sensors
submerged and was placed in a non-CO₂ 37°C incubator overnight. To prevent
evaporation, the incubator was humidified.
On the assay day, the conical tube of calibrant and assembled sensor cartridge with
utility plate was removed from incubator. The sensor cartridge was placed upside down
next to the utility plate and the water was removed from the utility plate. Each well of
the utility plate was filled with 200 μL of pre-warmed Seahorse XF calibrant and the
moats around the outside of the wells with 400 μL of calibrant per chamber. The sensor
cartridge was placed on the utility plate submerging the sensors in calibrant and was
placed in a non-CO₂ 37°C incubator for 45 – 60 minutes prior to loading drug ports of
the sensor cartridge (Agilent Seahorse, U.K.).
2.4.15.3. Loading the Seahorse XFp sensor cartridge with compounds
Before starting the compound loading process, the compounds were prepared in the
assay medium of choice and a loading plan based on the experimental design. The
Seahorse XFp assay cartridge was placed on bench with well labels (A-H) to the left
and the triangular notch in the bottom left-hand corner. A constant compound
concentration (10X of the final port concentration) and variable loading volume
approach was selected. Using p100 or p200 μL pipette, the desired volume of
compound to be injected was dispensed into the desired port at an angle (<5°). The
54
assay template based on the experimental design was selected on the Seahorse XFp.
Unless specified, the default Mix-Wait-Measure times of 3 minutes – 0 minute – 3
minutes were selected. Each measurement cycle consisted of a mixing time of 3 minutes
and a data acquisition period of 3 minutes (data points). 3 basal measurements were
taken prior to the addition of each reagent, and 3 response measurements were taken
after the addition of each compound. OCR data points referred to the average rates
during the measurement cycles. OCR reported as absolute rates (pmoles/min for OCR).
On the Run Screen, ‘Start’ option was selected. The plate lid of the cartridge/utility
plate assembly was removed before inserting the cartridge into the Seahorse XFp
Analyzer to start calibration (Agilent Seahorse, U.K.).
2.4.15.4. Washing cells in Seahorse XFp cell culture miniplates
The growth medium was replaced with assay medium for adherent cells grown in
Seahorse XFp cell culture miniplates prior to being assayed using a Seahorse XFp
Analyzer. The assay medium was warmed up to 37°C and the Seahorse XFp cell culture
miniplate was removed from the tissue culture incubator. The time was noted and cells
were checked under the microscope. It was made sure that the background wells (A and
H) did not contain cells. The culture medium was removed from each well leaving
behind 20 μL to keep the cells from drying out. Approximately 200 μL of assay medium
was added and then removed but again leaving behind 20 μL. Assay medium to a total
volume of 180 µL or the volume recommended by the particular assay protocol was
added. The assay wells were observed under the microscope to ensure that cells were
attached. The plate was placed in a 37°C incubator without CO₂ for one hour prior to
the assay. When prompted by the XFp Seahorse Analyser, the utility plate was replaced
with the cell plate and assay was initiated (Agilent Seahorse, U.K.).
2.4.16. XFp Experiments
2.4.16.1. Effect of paracetamol on fatty acid oxidation (FAO):
Reagents preparation:
Substrate-Limited Medium: DMEM containing 0.5 mM glucose, 1 mM glutamine, 0.5
mM carnitine, and 1% FBS. Carnitine was included fresh on the day of media change.
55
FAO Assay Medium: Krebs Henseleit Buffer (KHB): (111 mM NaCl, 4.7 mM KCl,
1.25 mM CaCl₂, 2 mM MgSO₄, 1.2 mM NaH₂PO₄ dissolved in H₂O and filter sterilized)
and 2.5 mM glucose, 0.5 mM carnitine, and 5 mM HEPES was added on assay day; pH
7.4 at 37°C. Respiration Reagent Stocks: 10 mM FCCP, 2 mM rotenone, 5 mg/mL
oligomycin and 40 mM antimycin A in 95% ethanol were prepared. 0.5 mM carnitine
and 10 mM etomoxir dissolved in H₂O with pH 7.4. XF Palmitate-BSA FAO Substrate
and stock respiration reagents were kept at -20°C (Agilent Seahorse, U.K.).
Assay preparation:
In this assay, model no. 2 was used for seeding cells and procedure no.2 for hydrating
XFp sensor cartridges. The growth medium was removed and substrate-limited medium
added 24 hours prior to the assay. The cells were washed twice with FAO assay
medium 45 min before the assay (t = -45 min). 135 μL FAO assay medium was added
to the each well of cells and kept in a non-CO₂ incubator for 30-45 min at 37°C. The
assay cartridge was loaded with XFp Cell Mito Stress Test reagents using FAO assay
medium as port A, 20 µL of 25 µg/mL oligomycin (2.5 µg/mL, final); port B, 22 µL of
40 μM FCCP (4 µM, final); port C, 24 µL of 20 µM rotenone/ 40 µM antimycin A (2
μM/4 μM, final, respectively). The default template of the Seahorse XFp Cell Mito
Stress Test was selected on the Seahorse XFp. The plate lid of the cartridge/utility plate
assembly was removed before inserting the cartridge into the Seahorse XFp Analyzer to
start calibration. 10 mM stock solution of etomoxir was diluted to 400 μM in FAO assay
medium 15 minutes before initiating prior the assay (t = -15 minutes). 15 μL etomoxir
was added or vehicle to each well (final concentration; 40 µM). For paracetamol group,
100 mM paracetamol (final concentration in the wells was 10 mM) was added. For
NAPQI group, 500 µM NAPQI (final concentration in the wells was 50 µM) was added.
The XFp cell culture miniplate was incubated for 15 minutes min at 37°C in a non-CO₂
incubator. Before initiating the assay (t = 0 minute), 30 μL XF Palmitate-BSA FAO
Substrate (1 mM: 0.17 mM) or BSA control (0.17 mM) was added to the appropriate
wells. The XFp cell culture miniplate was immediately inserted into the XFp Analyzer
and the assay was initiated (Agilent Seahorse, U.K.). Different XF FAO assay
parameters were measured as outlined in Table 2.7.

56
Table 2.7: XF FAO assay parameters
Parameter Value Equation
Oxygen Consumption due to
uncoupling by FFA
Oligomycin Palm:BSA-Eto rate minus
Oligomycin BSA-Eto rate.
Basal Respiration due to utilization
of exogenous FAs
Basal Palm:BSA-Eto rate minus Basal BSA-
Eto rate minus OCR due to uncoupling by
FFA.
Basal Respiration due to utilization
of endogenous FAs
Basal BSA-Eto rate minus basal BSA+Eto rate.
Maximal Respiration due to
utilization of endogenous FAs
Maximal BSA-ETO rate minus maximal
BSA+Eto rate
Maximal Respiration due to
utilization of endogenous FAs
Maximal Palm:BSA-Eto rate minus Maximal
BSA-Eto rate - OCR due to uncoupling by
FFA.
(Table adapted from Agilent Seahorse, U.K.).
2.4.16.2. Mitochondrial bioenergetic profile of 3T3-L1 adipocytes using Seahorse
XFp Cell Mito Stress Test
In this assay, model no. 1 was used for seeding cells and procedure no.1 for hydrating
XFp sensor cartridges. 10 mM glucose, 2 mM glutamine and 1 mM pyruvate was added
in the required volume of XF Seahorse base medium and allowed to dissolve; pH 7.4
using 1 N NaOH and this medium was filter sterilized. The medium was warmed at
37°C until use. The contents of each reagent of Seahorse XFP Cell Mito Stress Test kit
was re-suspended with prepared assay medium and loaded as port A, 20 µL of 50 µM
oligomycin (5 µM, final); port B, 22 µL of 50 μM FCCP (5 µM, final); port C, 25 µL of
25 µM rotenone/ antimycin A (2.5 µM, final, respectively). The default template of the
Seahorse XFp Cell Mito Stress Test was selected on the Seahorse XFp (Agilent
Seahorse, U.K.).
57
2.4.16.3. Effect of paracetamol on basal and norepinephrine and isoproterenol
stimulated OCR in 3T3-L1 adipocytes:
In this assay, model no. 1 was used for seeding cells and procedure no.1 for hydrating
XFp sensor cartridges. Using assay medium, the port injections were: port A, 20 µL of
50 mM (5 mM, final) or 100 mM (10 mM, final) paracetamol (Agilent Seahorse, U.K.).
For norepinephrine or isoproterenol stimulated OCR and using assay medium, the port
injections were: port A, 20 µL of 10 µM (1 µM, final) norepinephrine or 10 µM (1 µM,
final) isoproterenol (Agilent Seahorse, U.K.).
In subsequent assays, using assay medium, the port injections were: port A, 20 µL of 10
µM (1 µM, final) norepinephrine or 10 µM (1 µM, final) isoproterenol, port B, 22 µL of
10 mM (1 mM, final); port C, 25 µL of 40 mM (4 mM, final); port D, 27 µL of 50 mM
(5 mM, final) paracetamol (Agilent Seahorse, U.K.).
2.4.16.4. Effect of paracetamol, aminopyrine and antipyrine on basal and
norepinephrine and isoproterenol stimulated OCR in 3T3-L1 adipocytes:
In this assay, model no. 2 was used for seeding cells and procedure no.2 for hydrating
XFp sensor cartridges. Using assay medium, the port injections were: port A, 20 µL of
10 mM (1 mM, final); port B, 22 µL of 40 mM (4 mM, final); port C, 25 µL of 50 mM
(5 mM, final); 27 µL of 10 mM (10 mM, final) paracetamol. In subsequent assays, port
A, 20 µL of 10 mM (1 mM, final); port B, 22 µL of 40 mM (4 mM, final); port C, 25
µL of 50 mM (5 mM, final) aminopyrine or antipyrine (Agilent Seahorse, U.K.).
For isoproterenol stimulated OCR and using assay medium, the port injections were:
port A, 20 µL of 0.1 µM (0.01 µM, final); port B, 22 µL of 1 µM (0.1 µM, final); port
C, 25 µL of 10 µM (1 µM, final); 27 µL of 100 µM (10 µM, final) isoproterenol
(Agilent Seahorse, U.K.).
In subsequent assays, port A, 20 µL of 50 mM (5 mM, final) or 100 mM (10 mM, final)
paracetamol or aminopyrine or antipyrine, port B, 22 µL of 1 µM (0.1 µM, final); port
C, 25 µL of 10 µM (1 µM, final); 27 µL of 100 µM (10 µM, final) isoproterenol
(Agilent Seahorse, U.K.).
58
2.4.16.5. Elucidation of mechanistic activity of inhibitors that affect mitochondrial
function using electron flow assay:
Reagents preparation:
Mitochondrial Isolation Buffer consists of 70 mM sucrose, 210 mM mannitol, 5 mM
HEPES, 1 mM EGTA and 0.5% (w/v) fatty acid-free BSA, pH 7.2. Mitochondrial
Assay Solution (MAS, 1X) consists of 70 mM sucrose, 220 mM mannitol, 10 mM
KH₂PO₄, 5 mM MgCl₂, 2 mM HEPES, 1 mM EGTA and 0.2% (w/v) fatty acid-free
BSA, pH 7.2 and kept at 37°C. 3X stock MAS was used to dilute substrates and
respiratory reagents. Substrate stocks: 0.5 M succinate, 0.5 M malate, 0.5 M glutamic
acid, 0.5 M pyruvic acid made in water; pH 7.2 with potassium hydroxide. Pyruvate
stock was made fresh on assay day. Respiration Reagent Stocks: 10 mM FCCP, 2 mM
rotenone, 5 mg/mL oligomycin and 40 mM antimycin A in 95% ethanol. 1.0 M
ascorbate in H₂O, pH 7.2 was mixed with 10 mM N1,N1,N1,N1tetramethyl-1,4-
phenylene diamine (TMPD) in H₂O, pH 7.2. All reagents were kept at -20°C (Agilent
Seahorse, U.K.).
Isolation of Rat Liver Mitochondria:
The liver was extracted from male Wistar rat and placed in a chilled beaker, weighed
and washed with PBS 2-3 times. It was finely chopped with scissors, washed with small
volume of isolation buffer twice, minced with 7X volume of isolation buffer at 4°C.
All steps were carried out on ice. The tissue was then homogenised using a glass tissue
homogenizer using 2-3 strokes. The homogenate was spun at 800 x g for 5 minutes at
4°C. Supernatant was placed in another tube and spun at 8000 x g for 10 minutes at 4°C.
This time, the supernatant was removed whereas the pellet was dissolved in small
volume of isolation buffer. Total protein (mg/mL) was assessed by Bradford reagent
(Agilent Seahorse, U.K.).
Assay Preparation:
After diluting mitochondria 10X in 1X MAS containing substrate at 4°C, further
dilution was made based on the concentration needed to plate them. The substrate was
added during the initial dilution steps and centrifugation. 25 µL of mitochondrial
59
preparation was added to each well (excluding background correction wells) of plate
kept on ice. It was then spun in a centrifuge containing a microplate swinging bucket, at
2000 x g for 20 minutes at 4°C (Agilent Seahorse, U.K.). Using the procedure no.2 for
hydrating XFp sensor cartridges, the port injections were loaded as follows:
With 2.5 and 5 μg isolated rat liver mitochondria
For control group, with isolated rat liver mitochondria per well, initial substrate mix of
10 mM and 2 mM of pyruvate and malate + 4 µM FCCP. For known ETC inhibitors
controls, 2 µM rotenone, 10 mM malonate, 4 µM antimycin A, 20 mM sodium azide,
2.5 µg/ml oligomycin were also added in the initial substrate mix. Port injections were
made as: port A, 20 µL of 20 µM rotenone (2 µM, final); port B, 22 µL of 100 mM
succinate (10 mM, final); port C, 24 µL of 40 µM antimycin A (4 µM, final); port D, 26
µL of 100 mM ascorbate and 1 mM TMPD (10 mM and 100 µM final) (Agilent
Seahorse, U.K.).
For paracetamol groups, 1-10 mM paracetamol was also added in the initial substrate
mix. Port injections were made as: port A, 20 µL of 40 mM paracetamol (4 mM, final)
or 20 µL of 50 mM paracetamol (5 mM, final) or 20 µL of 100 mM paracetamol (10
mM, final); port B, 22 µL of 100 mM succinate (10 mM, final); port C, 24 µL of 50
mM paracetamol (5 mM, final) or 24 µL of 100 mM paracetamol (10 mM, final); port
D, 26 µL of 100 mM ascorbate and 1 mM TMPD (10 mM and 100 µM final) (Agilent
Seahorse, U.K.).
For aminopyrine group, 10 mM aminopyrine was also added in the initial substrate mix.
Port injections were made as: port A, 20 µL of 100 mM aminopyrine (10 mM, final);
port B, 22 µL of 100 mM succinate (10 mM, final); port C, 24 µL of 100 mM
aminopyrine (10 mM, final); port D, 26 µL of 100 mM ascorbate and 1 mM TMPD (10
mM and 100 µM final) (Agilent Seahorse, U.K.).
For antipyrine group, 10 mM antipyrine was also added in the initial substrate mix. Port
injections were made as: port A, 20 µL of 100 mM antipyrine (10 mM, final); port B, 22
µL of 100 mM succinate (10 mM, final); port C, 24 µL of 100 mM antipyrine (10 mM,
final); port D, 26 µL of 100 mM ascorbate and 1 mM TMPD (10 mM and 100 µM
final) (Agilent Seahorse, U.K.).

60
With isolated rat liver mitochondria per well, compounds that affect mitochondrial
function were added as initial conditions. The initial substrate mix of 10 mM and 2 mM
pyruvate and malate + 4 µM FCCP allows for the evaluation of maximal respiration
driven by Complex I, while the injection of rotenone (2 µM) followed by succinate (10
mM) allows for the assessment of maximal respiration driven by Complex II. The
injection of Antimycin A (4 µM), an inhibitor of Complex III, followed by the injection
of ascorbate and TMPD (10 mM and 100 µM) allow for the evaluation of respiration
driven by Complex IV since the Ascorbate and TMPD is an electron donor to Complex
IV (Rogers et al., 2011).
The Mix-Wait-Measure times of 1 minute – 0 minute – 2.5 minutes were selected. 3
basal measurements were taken prior to the addition of each reagent, and 2 response
measurements were taken after the addition of each compound. On the Run Screen,
‘Start’ option was selected. The plate lid of the cartridge/utility plate assembly was
removed before inserting the cartridge into the Seahorse XFp Analyzer to start
calibration. Once centrifuged, 155 µL pre-warmed (37°C) 1X MAS + substrate + initial
conditions were transferred to each well. Also, plates were checked using microscope at
20X to confirm that mitochondria were still attached and then plates were placed in the
Seahorse XFp Analyzer and the experiment begun (Agilent Seahorse, U.K.).
2.5. Statistical analysis
The results were analysed using GraphPad Prism 4.02 and presented as mean ± standard
deviation (SD). The results were analysed with analysis of variance (ANOVA),
followed by Dunnett's Multiple Comparison Test or Bonferroni's Multiple Comparison
Test. A *P < 0.05, ** P<0.01, *** P<0.001 from control was considered statistically
significant.

61
Chapter 3: Identification of COX-3 mRNA and protein in rodents
3.1. Introduction
Historically pharmacologists have struggled to explain the varying degrees to which
paracetamol inhibits the synthesis of PGs in different tissues. It is generally accepted
that paracetamol has a greater impact on COX activity in CNS particularly the brain
when compared to peripheral tissues (Flower and Vane, 1972). One possible
explanation was that there may be subtle variations in the COX enzymes expressed in
the different tissues. In 2002, Chandrasekharan et al. characterised and cloned a COX
enzyme from canine brain which they argued was more sensitive to paracetamol
inhibition than COX-1 or COX-2. They argued that this enzyme was a variant of COX-
1 gene and designated it COX-3. They further argued that the activity of this variant
enzyme could explain the pharmacological actions of antipyretic analgesic drugs such
as paracetamol which were weak inhibitors of COX-1 and COX-2. The in vivo actions
of paracetamol on this putative COX-1 variant enzyme were suggested to be due to the
ability of this group compounds to easily penetrate the CNS where this variant enzyme
was thought to be primarily expressed. By contrast NSAIDs including diclofenac or
ibuprofen which also potently inhibited the variant enzyme do not accumulate in the
CNS in sufficient concentrations to have a physiological effect (Chandrasekharan et al.,
2002; Botting and Ayoub 2005).
The variant enzyme is thought to result from a splice variant which results in the
translation of the COX-1 gene with an N-terminus extended due to retained intron-1 and
the signal peptide (Chandrasekharan et al., 2002). If intron 1 is retained, it would result
in a protein with extra 30-34 amino acids in mammals. The group also claimed COX-3
mRNA appeared to be selectively expressed in tissues and greatest in the heart and brain
in humans (Chandrasekharan et al., 2002). The story then moved on when it was
suggested that in rodents particularly mice, paracetamol induces hypothermia (in the
absence of fever) by a mechanism that did not involve COX-2 inhibition (Ayoub et al.,
2004). The potential discovery of a COX-3 mRNA in whole brain tissues of mice was
used to suggest that paracetamol induced hypothermia was due to the inhibition of
COX-3 in the CNS. It was proposed that in order for mice to maintain their normal Tb
at Ta (22°C) which is significantly below their thermoneutral zone (32-34°C), COX-3
was constitutively expressed, most likely in brain endothelial cells, involved in the

62
PGE₂ synthesis. However, the hypothermic action of paracetamol was only partially
decreased in COX-1 knockout animals and the brain levels of PGE₂ were only
approximately 30% of those of controls and these were not reduced further by
paracetamol treatment. This finding suggested that the hypothermic actions of
paracetamol could involve another mechanism not related to COX inhibition (Ayoub et
al., 2004).
Despite a series of publications led by the Simmon’s group supporting the existence and
possible function of the COX-3 enzyme. Other groups argued that at the molecular level
even if the COX-3 mRNA existed, it would be unlikely to be expressed in many species
including mouse, rat and humans (Schwab et al., 2003b; Kis et al., 2005). In addition to
the molecular biology arguments, there were issues with experimental design and the
quality of the data presentation (Schwab et al., 2003b; Kis et al., 2005). One of the key
issues was around primer design and the fact that there were very few studies which
showed COX-3 at protein level. In an attempt to determine the role of the COX-1
variant protein (COX-3) in paracetamol induced hypothermia, studies were undertaken
to determine the level of COX-3 protein and mRNA level in mouse b.End3 cells and
brain tissues.
3.2 Methods
3.2.1. Studies were undertaken to detect the level of COX-1 and COX-3 protein in
mouse b.End3 cells and brain homogenates as described in sections 2.42 -2.44.
3.2.2. Studies were undertaken to detect the level of COX-1 and COX-3 mRNA in
mouse b.End3 cells and brain homogenates as described in sections 2.45 -2.47.
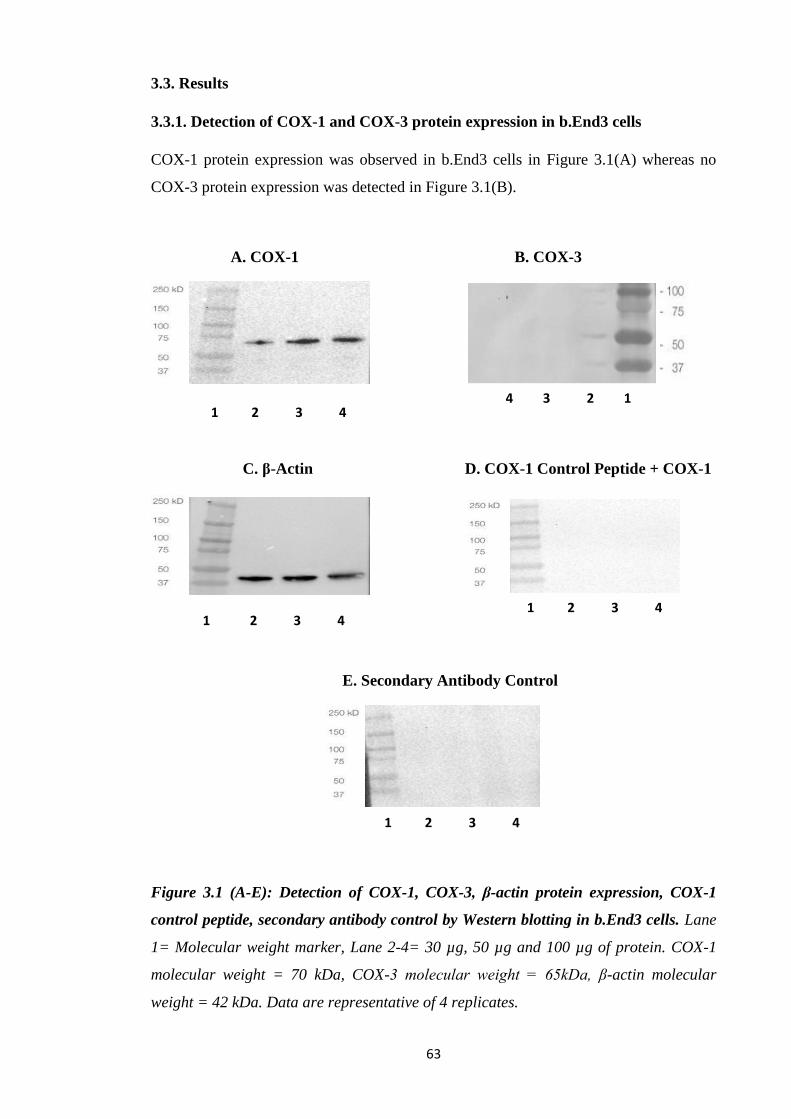
63
3.3. Results
3.3.1. Detection of COX-1 and COX-3 protein expression in b.End3 cells
COX-1 protein expression was observed in b.End3 cells in Figure 3.1(A) whereas no
COX-3 protein expression was detected in Figure 3.1(B).
A. COX-1 B. COX-3
C. β-Actin D. COX-1 Control Peptide + COX-1
E. Secondary Antibody Control
Figure 3.1 (A-E): Detection of COX-1, COX-3, β-actin protein expression, COX-1
control peptide, secondary antibody control by Western blotting in b.End3 cells. Lane
1= Molecular weight marker, Lane 2-4= 30 µg, 50 µg and 100 µg of protein. COX-1
molecular weight = 70 kDa, COX-3 molecular weight = 65kDa, β-actin molecular
weight = 42 kDa. Data are representative of 4 replicates.
1 2 3 4
1 2 3 4
1 2 3 4
4 3 2 1
1 2 3 4

64
β-actin protein expression has been detected in the protein loaded in Figure 3.1(C).
Absence of bands in Figure 3.1(D) confirmed that the bands observed in Figure 3.1(A)
were specific to COX-1 primary antibody immunoreactivity. Absence of bands in
Figure 3.1(E) further confirmed that the secondary antibody is specific to the COX-1
primary antibody.
3.3.2. Detection of COX-1 and COX-3 protein expression in C57BL/6 mice brain
homogenates
Two distinct bands of approx. 100 kDa and 45 kDa were detected with COX-1
immunoreactivity in Figure 3.2(A), whereas no COX-3 protein expression was detected
in Figure 3.2(B). Absence of bands in the presence of COX-1 control peptide in Figure
3.2(C) further confirmed that the bands observed in Figure 3.2(A) were specific to
COX-1 primary antibody immunoreactivity. Increased β-actin protein expression has
been detected with an increase for protein loaded in Figure 3.2(D).
A. COX-1 B. COX-3
C. COX-1 Control Peptide + COX-1 D. β-Actin
Figure 3.2 (A-D): Detection of COX-1, COX-3, COX-1 control peptide, β-actin
protein expression by Western blotting in C57BL/6 mice brain homogenates. Lane 1=
Molecular weight Marker, Lane 2-5= 15 µg, 30 µg, 50 µg and 100 µg of protein. COX-
1 molecular weight = 70 kDa, β-actin molecular weight = 42 kDa, COX-3 molecular
weight = 65kDa. Data are representative of 4 replicates.
1 2 3 4 5 1 2 3 4 5
1 2 3 4 5 1 2 3 4 5
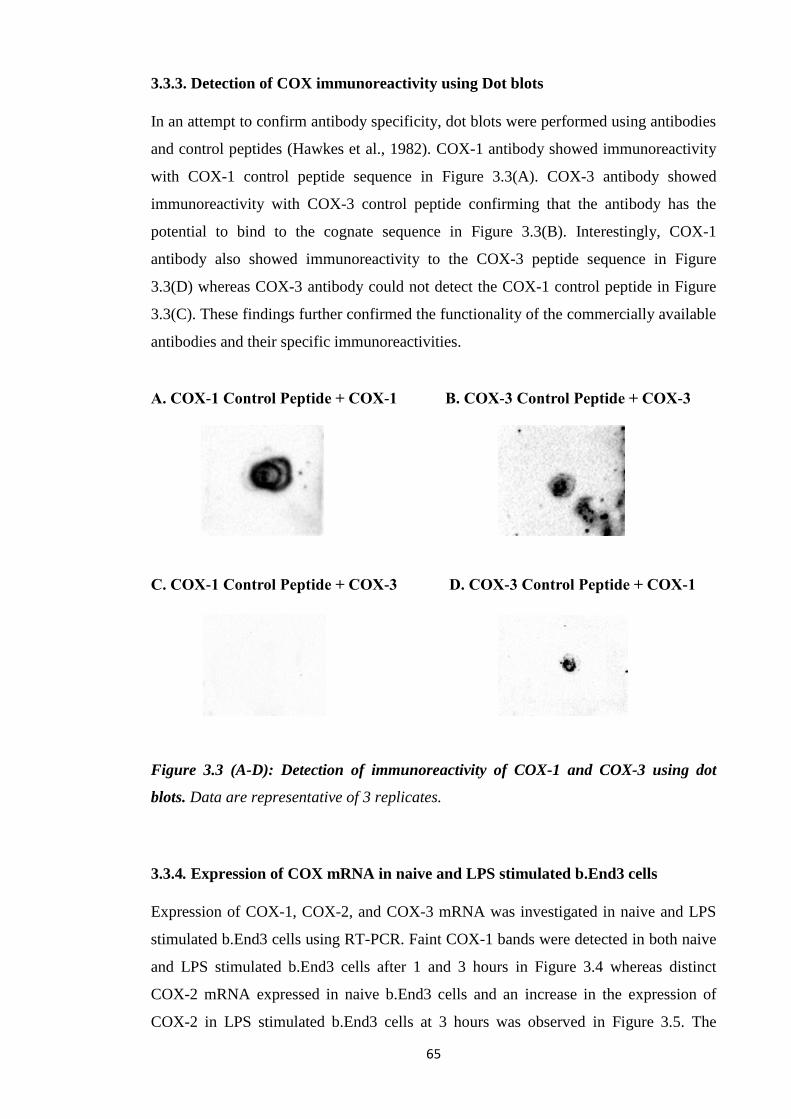
65
3.3.3. Detection of COX immunoreactivity using Dot blots
In an attempt to confirm antibody specificity, dot blots were performed using antibodies
and control peptides (Hawkes et al., 1982). COX-1 antibody showed immunoreactivity
with COX-1 control peptide sequence in Figure 3.3(A). COX-3 antibody showed
immunoreactivity with COX-3 control peptide confirming that the antibody has the
potential to bind to the cognate sequence in Figure 3.3(B). Interestingly, COX-1
antibody also showed immunoreactivity to the COX-3 peptide sequence in Figure
3.3(D) whereas COX-3 antibody could not detect the COX-1 control peptide in Figure
3.3(C). These findings further confirmed the functionality of the commercially available
antibodies and their specific immunoreactivities.
A. COX-1 Control Peptide + COX-1 B. COX-3 Control Peptide + COX-3
C. COX-1 Control Peptide + COX-3 D. COX-3 Control Peptide + COX-1
Figure 3.3 (A-D): Detection of immunoreactivity of COX-1 and COX-3 using dot
blots. Data are representative of 3 replicates.
3.3.4. Expression of COX mRNA in naive and LPS stimulated b.End3 cells
Expression of COX-1, COX-2, and COX-3 mRNA was investigated in naive and LPS
stimulated b.End3 cells using RT-PCR. Faint COX-1 bands were detected in both naive
and LPS stimulated b.End3 cells after 1 and 3 hours in Figure 3.4 whereas distinct
COX-2 mRNA expressed in naive b.End3 cells and an increase in the expression of
COX-2 in LPS stimulated b.End3 cells at 3 hours was observed in Figure 3.5. The
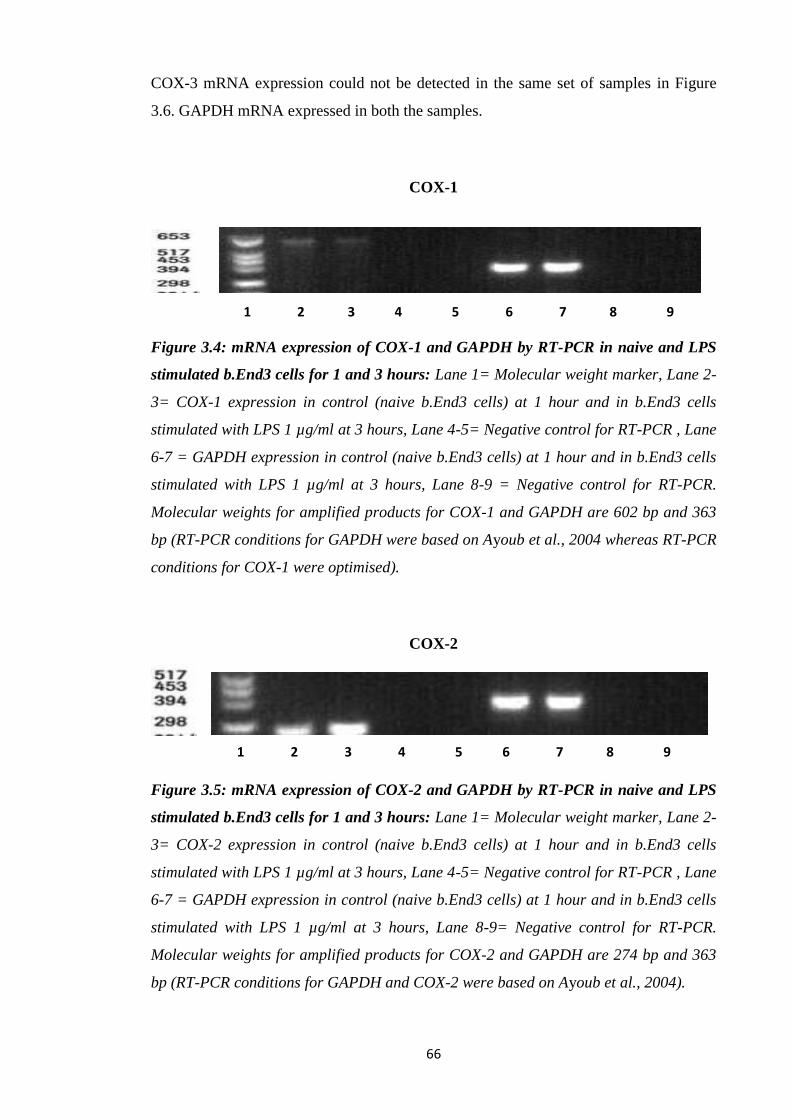
66
COX-3 mRNA expression could not be detected in the same set of samples in Figure
3.6. GAPDH mRNA expressed in both the samples.
COX-1
Figure 3.4: mRNA expression of COX-1 and GAPDH by RT-PCR in naive and LPS
stimulated b.End3 cells for 1 and 3 hours: Lane 1= Molecular weight marker, Lane 2-
3= COX-1 expression in control (naive b.End3 cells) at 1 hour and in b.End3 cells
stimulated with LPS 1 µg/ml at 3 hours, Lane 4-5= Negative control for RT-PCR , Lane
6-7 = GAPDH expression in control (naive b.End3 cells) at 1 hour and in b.End3 cells
stimulated with LPS 1 µg/ml at 3 hours, Lane 8-9 = Negative control for RT-PCR.
Molecular weights for amplified products for COX-1 and GAPDH are 602 bp and 363
bp (RT-PCR conditions for GAPDH were based on Ayoub et al., 2004 whereas RT-PCR
conditions for COX-1 were optimised).
COX-2
Figure 3.5: mRNA expression of COX-2 and GAPDH by RT-PCR in naive and LPS
stimulated b.End3 cells for 1 and 3 hours: Lane 1= Molecular weight marker, Lane 2-
3= COX-2 expression in control (naive b.End3 cells) at 1 hour and in b.End3 cells
stimulated with LPS 1 µg/ml at 3 hours, Lane 4-5= Negative control for RT-PCR , Lane
6-7 = GAPDH expression in control (naive b.End3 cells) at 1 hour and in b.End3 cells
stimulated with LPS 1 µg/ml at 3 hours, Lane 8-9= Negative control for RT-PCR.
Molecular weights for amplified products for COX-2 and GAPDH are 274 bp and 363
bp (RT-PCR conditions for GAPDH and COX-2 were based on Ayoub et al., 2004).
1 2 3 4 5 6 7 8 9
1 2 3 4 5 6 7 8 9

67
COX-3
Figure 3.6: mRNA expression of COX-3 and GAPDH by RT-PCR in naive and LPS
stimulated b.End3 cells for 1 and 3 hours: Lane 1= Molecular weight marker, Lane 2-
3= COX-3 expression in control (naive b.End3 cells) at 1 hour and in b.End3 cells
stimulated with LPS 1 µg/ml at 3 hours, Lane 4-5= Negative control for RT-PCR , Lane
6-7= GAPDH expression in control (naive b.End3 cells) at 1 hour and in b.End3 cells
stimulated with LPS 1 µg/ml at 3 hours, Lane 8-9 = Negative control for RT-PCR.
Molecular weights for amplified products for COX-3 and GAPDH are 290 bp and 363
bp (RT-PCR conditions for GAPDH and COX-3 were based on Ayoub et al., 2004).
3.3.5. Expression of COX mRNA in C57BL/6 mice brain homogenates
Expression of COX-1, COX-2, and COX-3 mRNA was investigated in C57BL/6 mice
brain homogenate using RT-PCR. Distinct GAPDH (lane 2), however the published set
of COX-1 and COX-3 primers could not detect COX-1 (lane 3) and COX-3 (lane 4) in
mice brain homogenate in Figure 3.7.
Figure 3.7: mRNA expression of GAPDH, COX-1 and COX-3 by RT-PCR in mice
brain homogenate. Lane 1= Molecular weight marker, Lane 2 = GAPDH, Lane 3 =
COX-1 and Lane 4 = COX-3 expression. Molecular weights for amplified products for
GAPDH, COX-1 and COX-3 are 363 bp, 602 bp and 290 bp (RT-PCR conditions for
GAPDH, COX-1 and COX-3 were based on Ayoub et al., 2004).
1 2 3 4 5 6 7 8 9
1 2 3 4
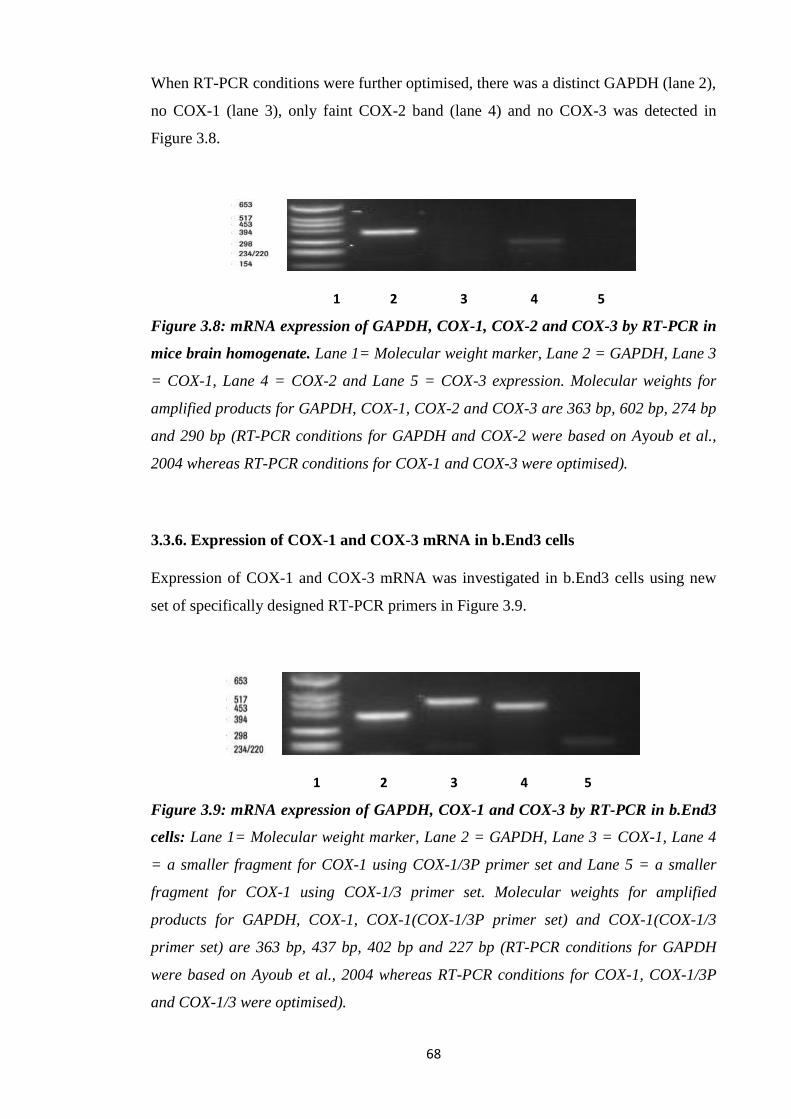
68
When RT-PCR conditions were further optimised, there was a distinct GAPDH (lane 2),
no COX-1 (lane 3), only faint COX-2 band (lane 4) and no COX-3 was detected in
Figure 3.8.
Figure 3.8: mRNA expression of GAPDH, COX-1, COX-2 and COX-3 by RT-PCR in
mice brain homogenate. Lane 1= Molecular weight marker, Lane 2 = GAPDH, Lane 3
= COX-1, Lane 4 = COX-2 and Lane 5 = COX-3 expression. Molecular weights for
amplified products for GAPDH, COX-1, COX-2 and COX-3 are 363 bp, 602 bp, 274 bp
and 290 bp (RT-PCR conditions for GAPDH and COX-2 were based on Ayoub et al.,
2004 whereas RT-PCR conditions for COX-1 and COX-3 were optimised).
3.3.6. Expression of COX-1 and COX-3 mRNA in b.End3 cells
Expression of COX-1 and COX-3 mRNA was investigated in b.End3 cells using new
set of specifically designed RT-PCR primers in Figure 3.9.
Figure 3.9: mRNA expression of GAPDH, COX-1 and COX-3 by RT-PCR in b.End3
cells: Lane 1= Molecular weight marker, Lane 2 = GAPDH, Lane 3 = COX-1, Lane 4
= a smaller fragment for COX-1 using COX-1/3P primer set and Lane 5 = a smaller
fragment for COX-1 using COX-1/3 primer set. Molecular weights for amplified
products for GAPDH, COX-1, COX-1(COX-1/3P primer set) and COX-1(COX-1/3
primer set) are 363 bp, 437 bp, 402 bp and 227 bp (RT-PCR conditions for GAPDH
were based on Ayoub et al., 2004 whereas RT-PCR conditions for COX-1, COX-1/3P
and COX-1/3 were optimised).
1 2 3 4 5
1 2 3 4 5
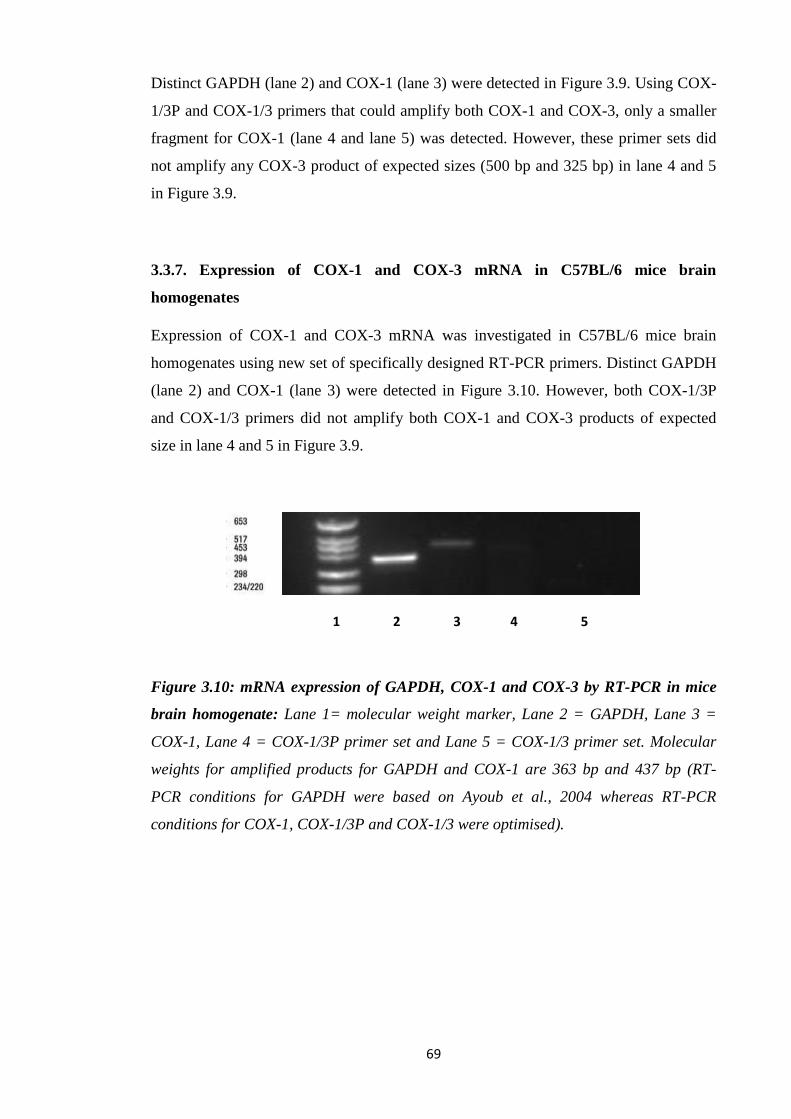
69
Distinct GAPDH (lane 2) and COX-1 (lane 3) were detected in Figure 3.9. Using COX-
1/3P and COX-1/3 primers that could amplify both COX-1 and COX-3, only a smaller
fragment for COX-1 (lane 4 and lane 5) was detected. However, these primer sets did
not amplify any COX-3 product of expected sizes (500 bp and 325 bp) in lane 4 and 5
in Figure 3.9.
3.3.7. Expression of COX-1 and COX-3 mRNA in C57BL/6 mice brain
homogenates
Expression of COX-1 and COX-3 mRNA was investigated in C57BL/6 mice brain
homogenates using new set of specifically designed RT-PCR primers. Distinct GAPDH
(lane 2) and COX-1 (lane 3) were detected in Figure 3.10. However, both COX-1/3P
and COX-1/3 primers did not amplify both COX-1 and COX-3 products of expected
size in lane 4 and 5 in Figure 3.9.
Figure 3.10: mRNA expression of GAPDH, COX-1 and COX-3 by RT-PCR in mice
brain homogenate: Lane 1= molecular weight marker, Lane 2 = GAPDH, Lane 3 =
COX-1, Lane 4 = COX-1/3P primer set and Lane 5 = COX-1/3 primer set. Molecular
weights for amplified products for GAPDH and COX-1 are 363 bp and 437 bp (RT-
PCR conditions for GAPDH were based on Ayoub et al., 2004 whereas RT-PCR
conditions for COX-1, COX-1/3P and COX-1/3 were optimised).
1 2 3 4 5
70
3.4. Discussion:
The possibility of a viable COX-3 protein poses two major questions; what species and
tissues is the protein expressed in and what is the role of the protein? The strongest
evidence for the COX-3 has primarily been at the mRNA level in canine brain, rat,
human and mouse. In terms of a protein (functional) the evidence is less clear. In terms
of the hypothermia induced by paracetamol most studies were undertaken in rats and
mice. In the present study, western blot using the previously reported anti-COX-3
antibody, could not detect the COX-3 protein in mouse brain endothelial cells or mouse
brain homogenates (Figure 3.1-3.2). By contrast in terms of immunoreactivity, there
was clear COX-1 protein detected in cells and tissues. These studies were controlled for
both primary and secondary antibodies for COX-1 and COX-3. Furthermore, the
immunoreactivity of the COX-1 and COX-3 antibody was confirmed with blotting
assays using the COX-1 and COX-3 peptides (Figure 3.3).
The failure to detect the COX-3 protein in mouse brain endothelial cells is not
surprising and in line with what is known about the COX-1 gene where a viable protein
is unlikely (Schwab et al., 2003b; Warner et al., 2004; Snipes et al., 2005). Retention of
intron-1 in the mouse will result in an out of frame sequence and no protein should be
produced. The detection of the COX-3 protein from mouse brain previously may be due
to the use of polyclonal antibody which is more likely to produce cross reactivity
(Ayoub et al., 2006). In the present study, it was demonstrated that the COX-1 antibody
binds to COX-3 peptide. This would also confirm that had the COX-3 protein existed in
mouse brain tissue there was a double chance of seeing it. A similar argument can be
used for the COX-3 in rat.
These studies also failed to confirm the presence of a COX-3 mRNA in the endothelial
cells and in mouse brain (Figure 3.6-3.10). No definitive conclusions can be drawn from
the failure to isolate COX-3 mRNA in these samples in terms of the existence of COX-3
generally. However, given the varying levels of COX-1 observed under the varying
experimental conditions in this study it may be possible that the cells and tissues
analysed in these studies simply did not express COX-3. However, given the proposed
conditions required for COX-3 expression by those who propose a role for COX-3 in
thermoregulation it would have been expected that COX-3 would have seen in the brain
tissue homogenates at the very least (Ayoub et al., 2004). One possible explanation for
the previously reported COX-3 mRNA could be the amplification of incompletely
processed mRNA before intron-1 is spliced. The COX-3 primer is targeted at intron-1
71
so at any given time in a cell expressing COX-1 a small proportion of the mRNA will
be unprocessed and could be amplified. This would explain the widespread expression
of the COX-3 mRNA alongside the COX-1 mRNA but always at a significantly lower
level; around 10% of the COX-1. However, only the final COX-1 mRNA would be
translated into active COX-1 protein.
The initial aim of these studies was to identify and characterise the COX-3 protein at the
molecular level. Studies would then have moved onto enzyme activity and inhibition by
paracetamol, NSAIDs and other antipyretic drugs. However, in the absence of the
protein in cells and tissues, studies were then undertaken to assess how paracetamol
would impact on other aspects of the thermogenesis pathway in particular, lipolysis,
FAO and the ETC.

72
Chapter 4: Effect of paracetamol, aminopyrine and antipyrine on lipolysis in
rodent adipocytes
4.1. Introduction
Fever in mammals is mainly associated with increased COX-2/PGE₂ activity.
Historically it has generally been assumed that paracetamol and NSAID exerts their
antipyretic actions by inhibiting the COX-2 enzyme. Over the last 20 years, many
studies have revealed that the administration of paracetamol (>100 mg/kg) to non-
febrile rodents, for which there is no induction of COX-2 results in hypothermia,
suggesting other mechanisms may be involved. The initial suggestion was that
paracetamol was inhibiting a novel COX-1 variant (COX-3). The COX-3 hypothesis
was supported by the observation that other drugs such as aminopyrine and antipyrine,
which are putative COX-3 inhibitors, also produce hypothermia in mice. However, in
the absence of clear evidence of a COX-3 enzyme in the previous chapter combined
with the prevailing evidence in the literature suggest that the existence of COX-3 cannot
solely explain the hypothermic properties of paracetamol, alternative explanations were
sought.
In terms of thermoregulation, rodents (homeotherms) are capable of maintaining their
Tc within a fairly constant range (36.0-37.5°C). Small mammals at temperatures below
their thermoneutral zone due to their large surface area mass ratio must rely more on
changing their metabolic heat production to regulate Tc (Gordon, 2012). To maintain
Tc, rodents rely on metabolism in BAT to generate fuel for heat production (Gordon,
2012). The process usually starts with the stimulation of lipolysis, a catabolic process
converting TGs stored in adipocytes and causing fatty acids and glycerol release (Luo
and Liu, 2016). Upon cold stress, NE is released from sympathetic fibres. It binds to β₃-
receptor located on adipocytes (Ueta et al., 2012). As a result, a sequence of events is
initiated starting with the release of AC, cAMP/PKA pathway leading to lipolysis (Luo
and Liu, 2016). BAT is also activated following prolonged cold treatment in adult
humans and leads to increase in mobilizing lipids from other fat stores to BAT. In turn,
promoting FAO via heat generation inside mitochondria (Luo and Liu, 2016).
In most laboratory situations, mice are housed at 20–24°C (Gordon, 1993, 2004) but
their thermoneutral zone range is 26–34°C whereas the range for rats is 26–30°C
(Gordon, 1993). However, most researchers agree that the lower critical temperature of
73
a single mouse is around 30°C (Gordon, 2004). When animals are kept at or just below
the standard housing temperatures, such mild cold stressors are enough to increase basal
metabolic rates (Gordon, 1985, 1990, 1993). It is reasonable to hypothesize that
animals housed under conditions where there is increased metabolic stress may be more
sensitive to compounds which could even mildly decrease metabolic activity and lead to
hypothermia.
In an attempt to better understand the possible mechanisms by which paracetamol and
other putative COX-3 inhibitors could induce hypothermia as reported by Ayoub et al.
(2004). Studies were undertaken to assess the impact of paracetamol, aminopyrine and
antipyrine on lipolysis in a mouse pre-adipocyte cell line (3T3-L1) and in rat primary
adipocyte cultures. Lipolysis was assessed in basal and catecholamine stimulated cells
by measuring the level of glycerol release.
4.2. Methods
4.2.1. Studies were initially undertaken to differentiate 3T3-L1 pre-adipocytes and
assess viability as described in sections 2.4.8-2.4.10.
4.2.2. Studies were then undertaken to assess the level of lipolysis in basal and
catecholamine stimulated 3T3-L1 adipocytes. In addition, studies were conducted to
assess the impact of various compounds including paracetamol on lipolysis in these
cells as described in section 2.4.11.
4.2.3. Studies were also undertaken to assess viability and the level of lipolysis in basal
and catecholamine stimulated primary brown adipocytes. In addition, studies were
conducted to assess the impact of various compounds including paracetamol on
lipolysis in these cells as described in sections 2.4.12-2.4.14.
The results were analysed with analysis of variance (ANOVA), followed by Dunnett's
Multiple Comparison Test. A *P < 0.05, ** P<0.01, from control was considered
statistically significant.

74
4.3. Results:
4.3.1. 3T3-L1 differentiation
Modification of the currently available protocols resulted in the complete differentiation
of 3T3-L1 pre-adipocytes into adipocytes (Public Health England; Zebisch et al., 2012).
Within a week from the start of differentiation, lipid droplets increased both in number
and size (Figure 4.1). The extent of adipose conversion was quantitated by staining the
accumulated lipid using Oil Red O (Figure 4.2). The differentiated 3T3-L1 adipocytes
were then used for the lipolysis studies.
A. Day 0 B. Day 1 C. Day 3
C. Day 5 D. Day 7
Figure 4.1: Microscopic images of Oil Red O stained 3T3-L1 cells (passage 8)
subjected to adipocyte differentiation for 7 days (Qualitative). Lipid accumulation in
the adipocytes was measured by oil red o-staining. Lipid droplets increased in both
number, size over the following days, and took a week to become fully differentiated.
Data are representative of 4 replicates.

75
Figure 4.2: Quantitative analysis of 3T3-L1 cells differentiation using Oil Red O
staining: Lipid droplets increased in both number, size over the following days, and
took a week to become fully differentiated. Data are representative of n=3 replicates
expressed as means ± Standard deviations (*P < 0.05, **P < 0.01 from control).
4.3.2. Effect of paracetamol on basal lipolysis in 3T3-L1 adipocytes
Prior to the lipolysis studies, the cells were assessed for the impact of paracetamol,
aminopyrine and antipyrine on cell viability and proliferation over 48 hours. These
compounds had no effect on the viability and proliferation of 3T3-L1 and primary
adipocytes up to 48 hours (data not shown).
TGs hydrolysis results in glycerol and FFA release from adipocytes, glycerol release
was assayed as an indicator of lipolytic pathway (Schweiger et al., 2014). In 3T3-L1
adipocytes incubated with paracetamol at 10 mM there was a significant decrease in
glycerol release indicating a reduction in basal lipolysis. This inhibitory effect began as
early as 1 hour with a 47% decrease in glycerol levels, followed by 57% and 52% at 3
and 24 hours in Figure 4.3.
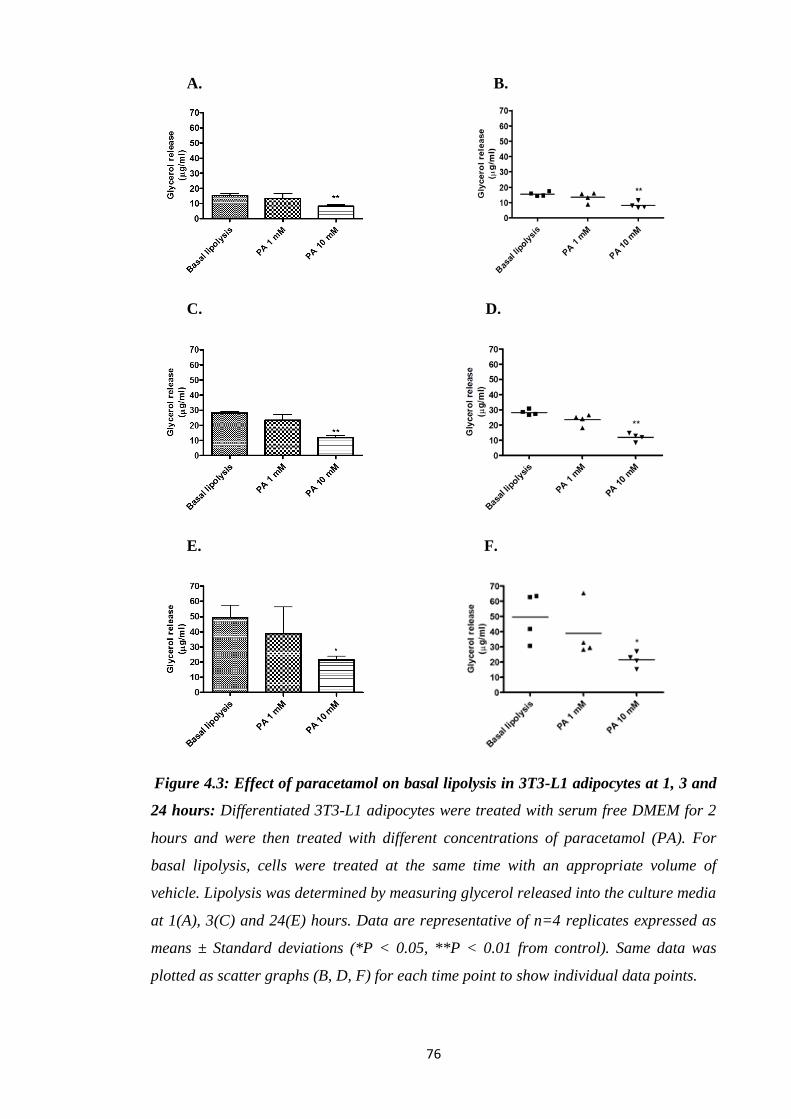
76
A. B.
C. D.
E. F.
Figure 4.3: Effect of paracetamol on basal lipolysis in 3T3-L1 adipocytes at 1, 3 and
24 hours: Differentiated 3T3-L1 adipocytes were treated with serum free DMEM for 2
hours and were then treated with different concentrations of paracetamol (PA). For
basal lipolysis, cells were treated at the same time with an appropriate volume of
vehicle. Lipolysis was determined by measuring glycerol released into the culture media
at 1(A), 3(C) and 24(E) hours. Data are representative of n=4 replicates expressed as
means ± Standard deviations (*P < 0.05, **P < 0.01 from control). Same data was
plotted as scatter graphs (B, D, F) for each time point to show individual data points.
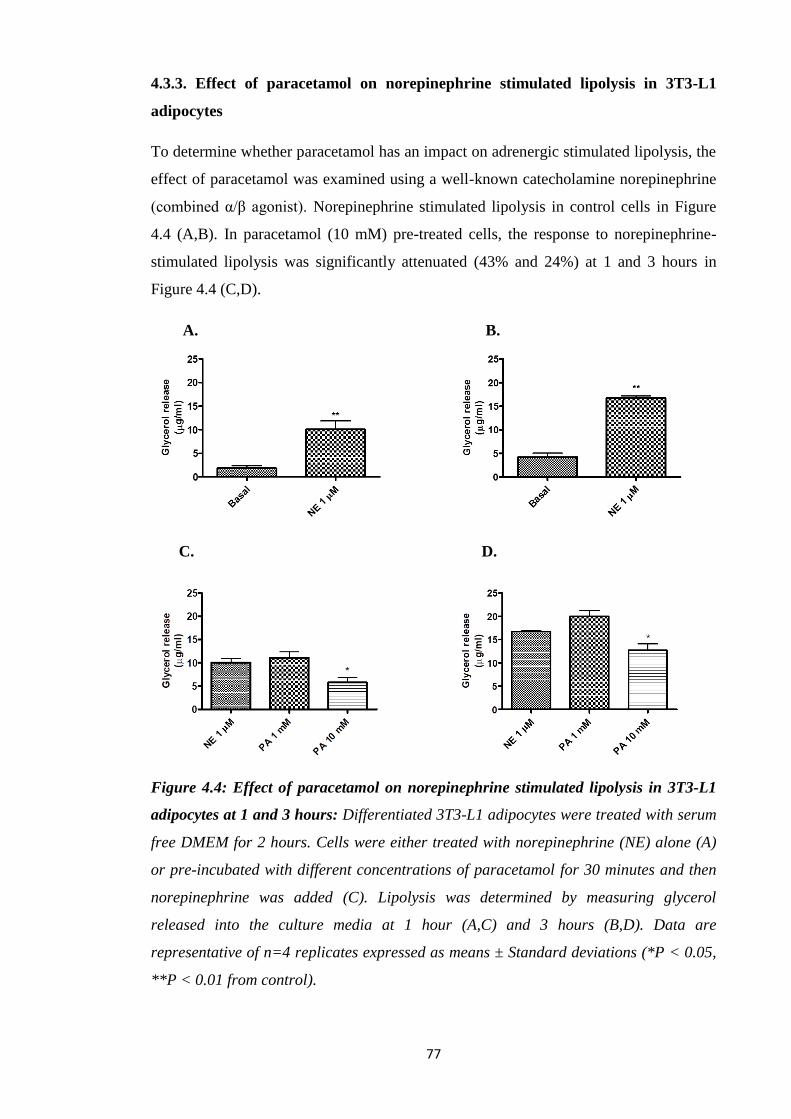
77
4.3.3. Effect of paracetamol on norepinephrine stimulated lipolysis in 3T3-L1
adipocytes
To determine whether paracetamol has an impact on adrenergic stimulated lipolysis, the
effect of paracetamol was examined using a well-known catecholamine norepinephrine
(combined α/β agonist). Norepinephrine stimulated lipolysis in control cells in Figure
4.4 (A,B). In paracetamol (10 mM) pre-treated cells, the response to norepinephrine-
stimulated lipolysis was significantly attenuated (43% and 24%) at 1 and 3 hours in
Figure 4.4 (C,D).
A. B.
C. D.
Figure 4.4: Effect of paracetamol on norepinephrine stimulated lipolysis in 3T3-L1
adipocytes at 1 and 3 hours: Differentiated 3T3-L1 adipocytes were treated with serum
free DMEM for 2 hours. Cells were either treated with norepinephrine (NE) alone (A)
or pre-incubated with different concentrations of paracetamol for 30 minutes and then
norepinephrine was added (C). Lipolysis was determined by measuring glycerol
released into the culture media at 1 hour (A,C) and 3 hours (B,D). Data are
representative of n=4 replicates expressed as means ± Standard deviations (*P < 0.05,
**P < 0.01 from control).
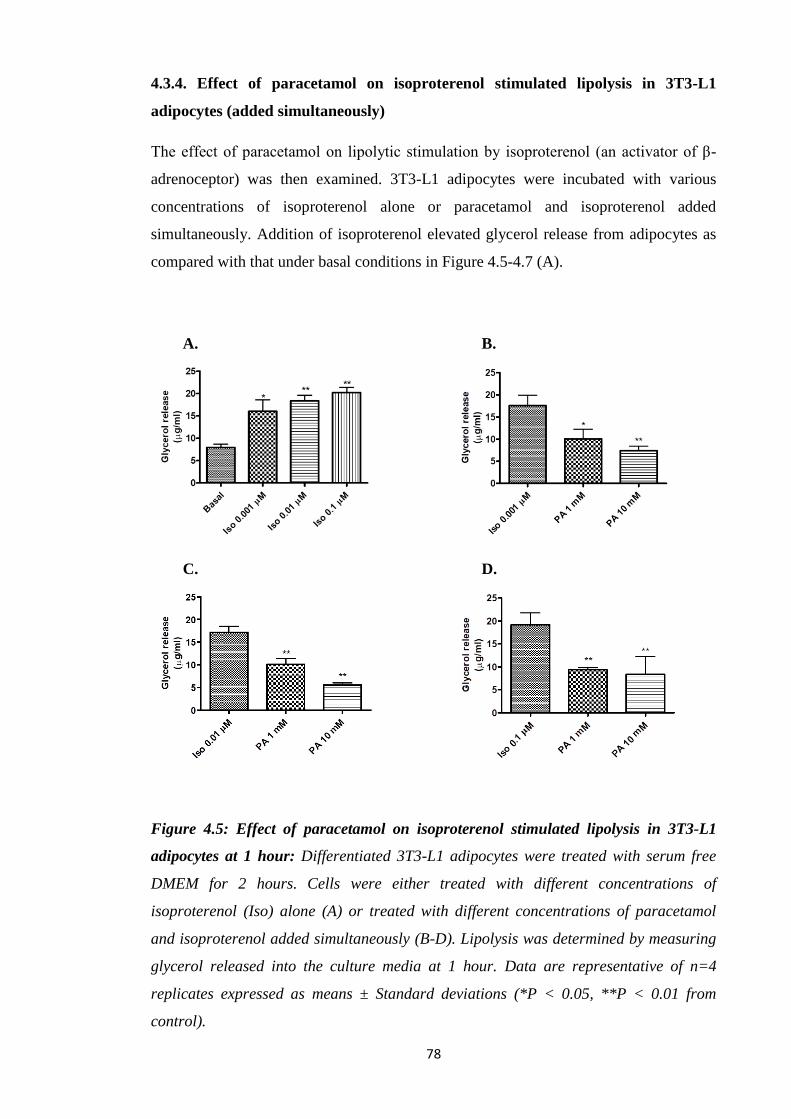
78
4.3.4. Effect of paracetamol on isoproterenol stimulated lipolysis in 3T3-L1
adipocytes (added simultaneously)
The effect of paracetamol on lipolytic stimulation by isoproterenol (an activator of β-
adrenoceptor) was then examined. 3T3-L1 adipocytes were incubated with various
concentrations of isoproterenol alone or paracetamol and isoproterenol added
simultaneously. Addition of isoproterenol elevated glycerol release from adipocytes as
compared with that under basal conditions in Figure 4.5-4.7 (A).
A. B.
C. D.
Figure 4.5: Effect of paracetamol on isoproterenol stimulated lipolysis in 3T3-L1
adipocytes at 1 hour: Differentiated 3T3-L1 adipocytes were treated with serum free
DMEM for 2 hours. Cells were either treated with different concentrations of
isoproterenol (Iso) alone (A) or treated with different concentrations of paracetamol
and isoproterenol added simultaneously (B-D). Lipolysis was determined by measuring
glycerol released into the culture media at 1 hour. Data are representative of n=4
replicates expressed as means ± Standard deviations (*P < 0.05, **P < 0.01 from
control).
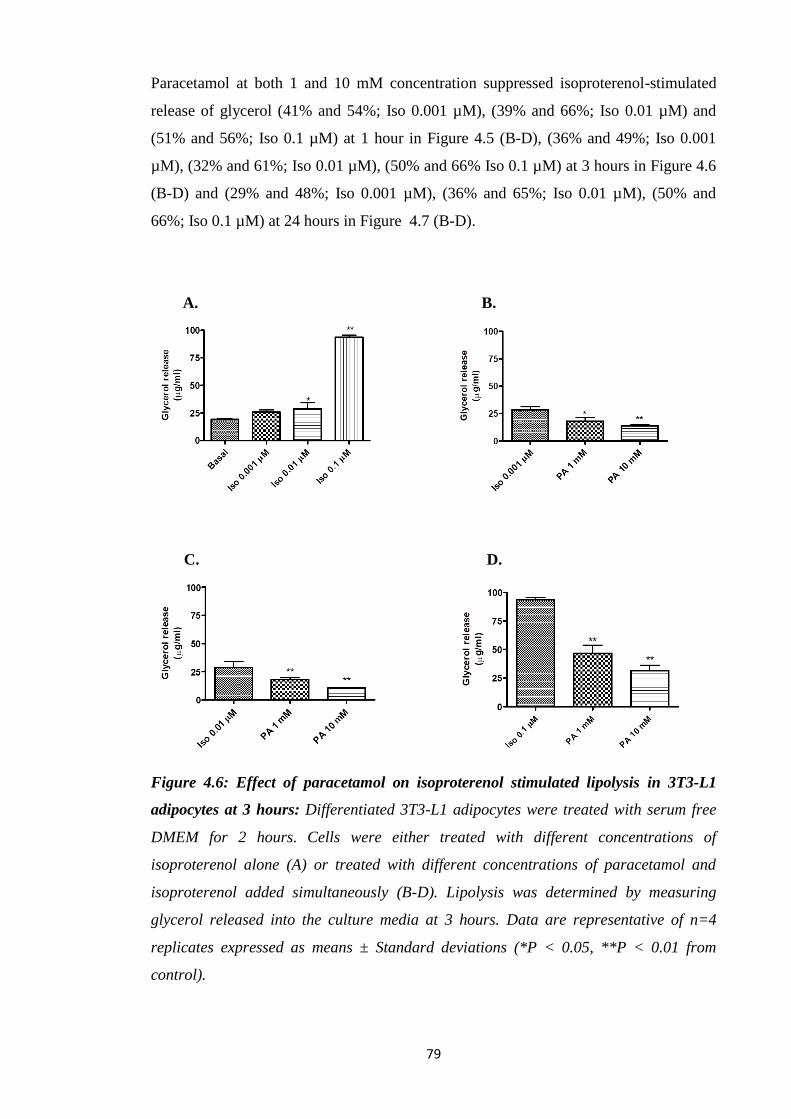
79
Paracetamol at both 1 and 10 mM concentration suppressed isoproterenol-stimulated
release of glycerol (41% and 54%; Iso 0.001 µM), (39% and 66%; Iso 0.01 µM) and
(51% and 56%; Iso 0.1 µM) at 1 hour in Figure 4.5 (B-D), (36% and 49%; Iso 0.001
µM), (32% and 61%; Iso 0.01 µM), (50% and 66% Iso 0.1 µM) at 3 hours in Figure 4.6
(B-D) and (29% and 48%; Iso 0.001 µM), (36% and 65%; Iso 0.01 µM), (50% and
66%; Iso 0.1 µM) at 24 hours in Figure 4.7 (B-D).
A. B.
C. D.
Figure 4.6: Effect of paracetamol on isoproterenol stimulated lipolysis in 3T3-L1
adipocytes at 3 hours: Differentiated 3T3-L1 adipocytes were treated with serum free
DMEM for 2 hours. Cells were either treated with different concentrations of
isoproterenol alone (A) or treated with different concentrations of paracetamol and
isoproterenol added simultaneously (B-D). Lipolysis was determined by measuring
glycerol released into the culture media at 3 hours. Data are representative of n=4
replicates expressed as means ± Standard deviations (*P < 0.05, **P < 0.01 from
control).
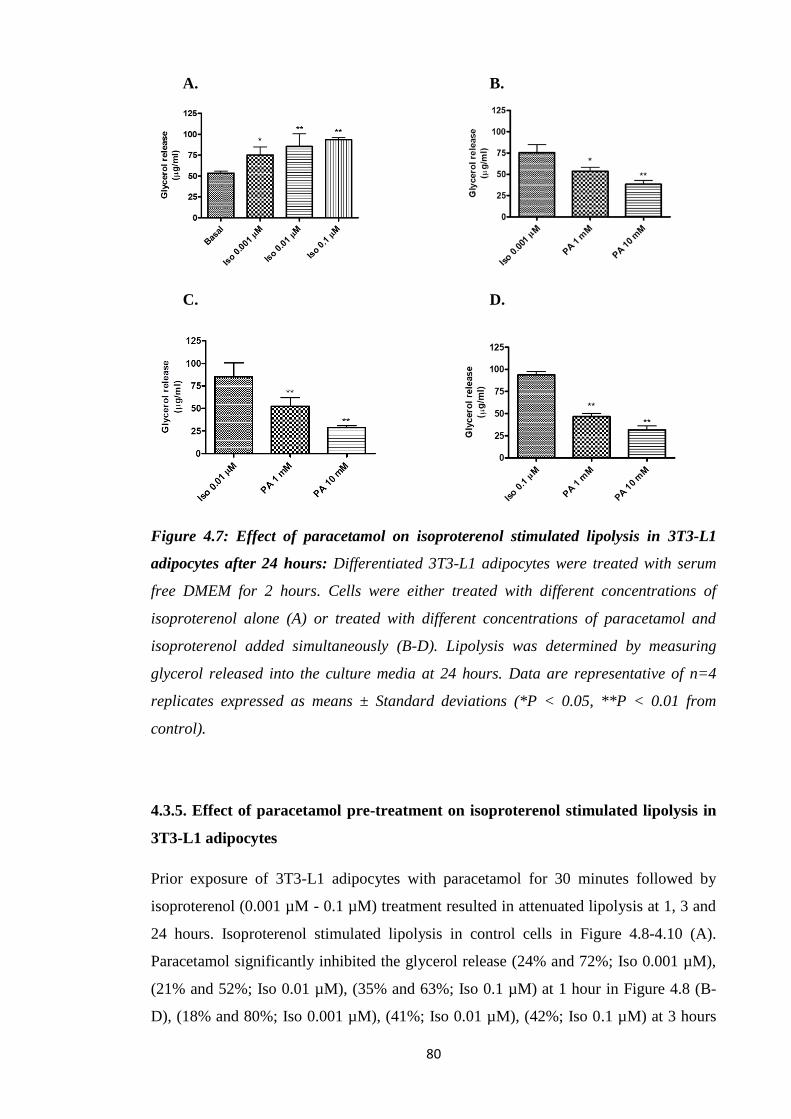
80
A. B.
C. D.
Figure 4.7: Effect of paracetamol on isoproterenol stimulated lipolysis in 3T3-L1
adipocytes after 24 hours: Differentiated 3T3-L1 adipocytes were treated with serum
free DMEM for 2 hours. Cells were either treated with different concentrations of
isoproterenol alone (A) or treated with different concentrations of paracetamol and
isoproterenol added simultaneously (B-D). Lipolysis was determined by measuring
glycerol released into the culture media at 24 hours. Data are representative of n=4
replicates expressed as means ± Standard deviations (*P < 0.05, **P < 0.01 from
control).
4.3.5. Effect of paracetamol pre-treatment on isoproterenol stimulated lipolysis in
3T3-L1 adipocytes
Prior exposure of 3T3-L1 adipocytes with paracetamol for 30 minutes followed by
isoproterenol (0.001 µM - 0.1 µM) treatment resulted in attenuated lipolysis at 1, 3 and
24 hours. Isoproterenol stimulated lipolysis in control cells in Figure 4.8-4.10 (A).
Paracetamol significantly inhibited the glycerol release (24% and 72%; Iso 0.001 µM),
(21% and 52%; Iso 0.01 µM), (35% and 63%; Iso 0.1 µM) at 1 hour in Figure 4.8 (B-
D), (18% and 80%; Iso 0.001 µM), (41%; Iso 0.01 µM), (42%; Iso 0.1 µM) at 3 hours
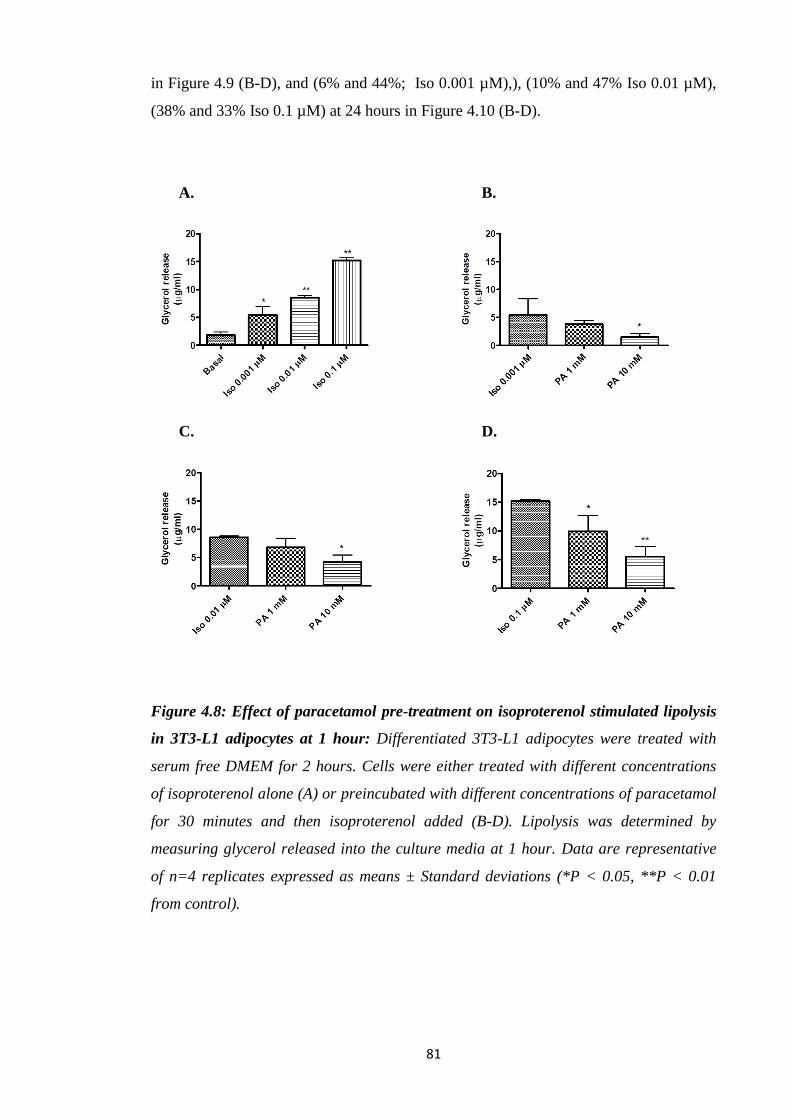
81
in Figure 4.9 (B-D), and (6% and 44%; Iso 0.001 µM),), (10% and 47% Iso 0.01 µM),
(38% and 33% Iso 0.1 µM) at 24 hours in Figure 4.10 (B-D).
A. B.
C. D.
Figure 4.8: Effect of paracetamol pre-treatment on isoproterenol stimulated lipolysis
in 3T3-L1 adipocytes at 1 hour: Differentiated 3T3-L1 adipocytes were treated with
serum free DMEM for 2 hours. Cells were either treated with different concentrations
of isoproterenol alone (A) or preincubated with different concentrations of paracetamol
for 30 minutes and then isoproterenol added (B-D). Lipolysis was determined by
measuring glycerol released into the culture media at 1 hour. Data are representative
of n=4 replicates expressed as means ± Standard deviations (*P < 0.05, **P < 0.01
from control).
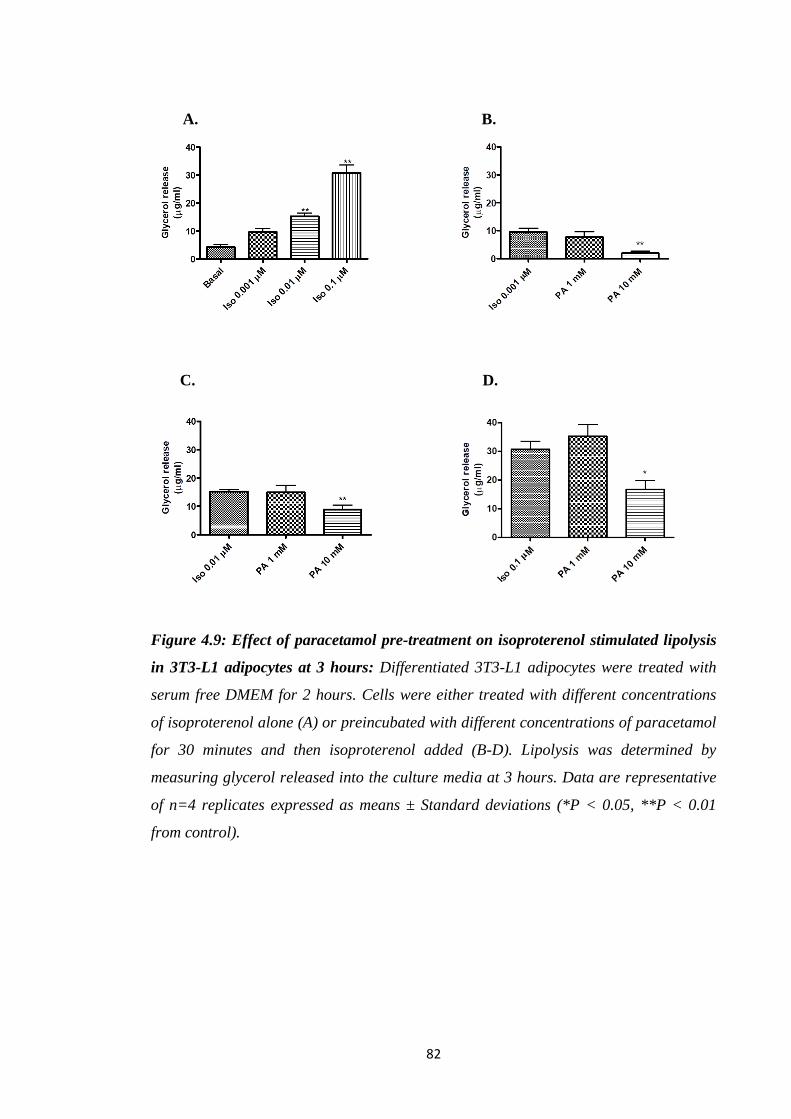
82
A. B.
C. D.
Figure 4.9: Effect of paracetamol pre-treatment on isoproterenol stimulated lipolysis
in 3T3-L1 adipocytes at 3 hours: Differentiated 3T3-L1 adipocytes were treated with
serum free DMEM for 2 hours. Cells were either treated with different concentrations
of isoproterenol alone (A) or preincubated with different concentrations of paracetamol
for 30 minutes and then isoproterenol added (B-D). Lipolysis was determined by
measuring glycerol released into the culture media at 3 hours. Data are representative
of n=4 replicates expressed as means ± Standard deviations (*P < 0.05, **P < 0.01
from control).

83
A. B.
C. D.
Figure 4.10: Effect of paracetamol pre-treatment on isoproterenol stimulated lipolysis
in 3T3-L1 adipocytes at 24 hours: Differentiated 3T3-L1 adipocytes were treated with
serum free DMEM for 2 hours. Cells were either treated with different concentrations
of isoproterenol alone (A) or preincubated with different concentrations of paracetamol
for 30 minutes and then isoproterenol added (B-D). Lipolysis was determined by
measuring glycerol released into the culture media at 24 hours. Data are representative
of n=4 replicates expressed as means ± Standard deviations (*P < 0.05, **P < 0.01
from control).
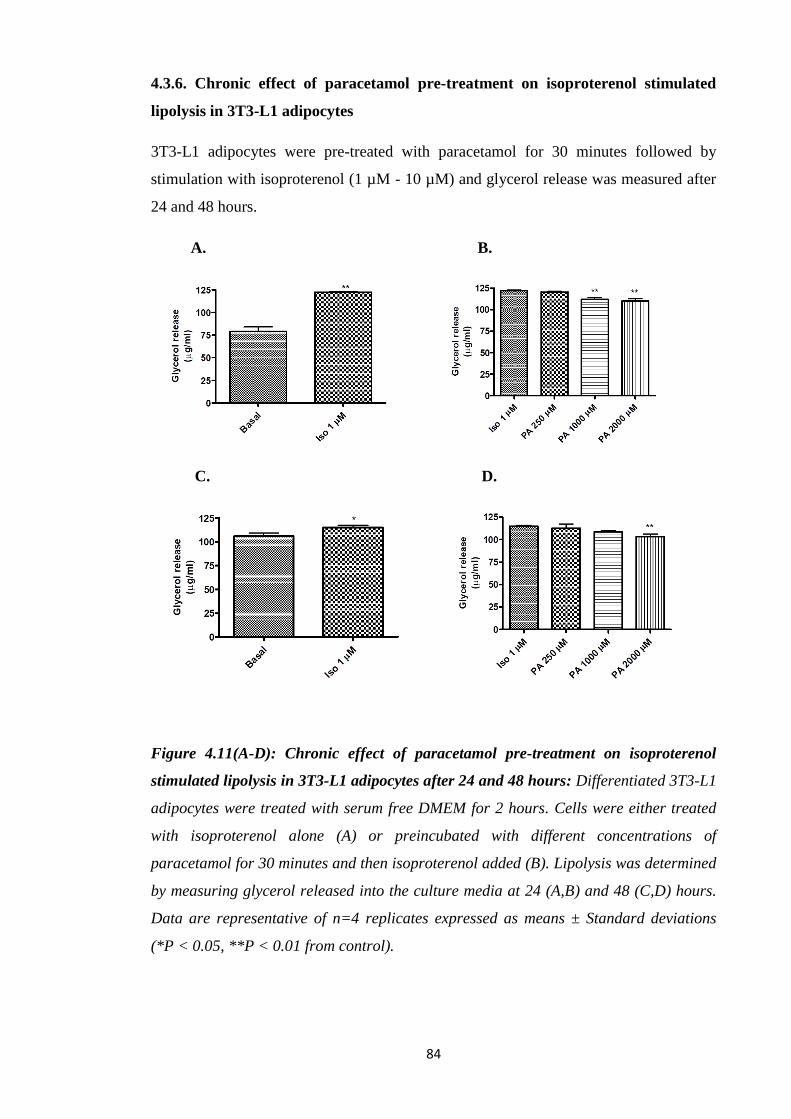
84
4.3.6. Chronic effect of paracetamol pre-treatment on isoproterenol stimulated
lipolysis in 3T3-L1 adipocytes
3T3-L1 adipocytes were pre-treated with paracetamol for 30 minutes followed by
stimulation with isoproterenol (1 µM - 10 µM) and glycerol release was measured after
24 and 48 hours.
A. B.
C. D.
Figure 4.11(A-D): Chronic effect of paracetamol pre-treatment on isoproterenol
stimulated lipolysis in 3T3-L1 adipocytes after 24 and 48 hours: Differentiated 3T3-L1
adipocytes were treated with serum free DMEM for 2 hours. Cells were either treated
with isoproterenol alone (A) or preincubated with different concentrations of
paracetamol for 30 minutes and then isoproterenol added (B). Lipolysis was determined
by measuring glycerol released into the culture media at 24 (A,B) and 48 (C,D) hours.
Data are representative of n=4 replicates expressed as means ± Standard deviations
(*P < 0.05, **P < 0.01 from control).
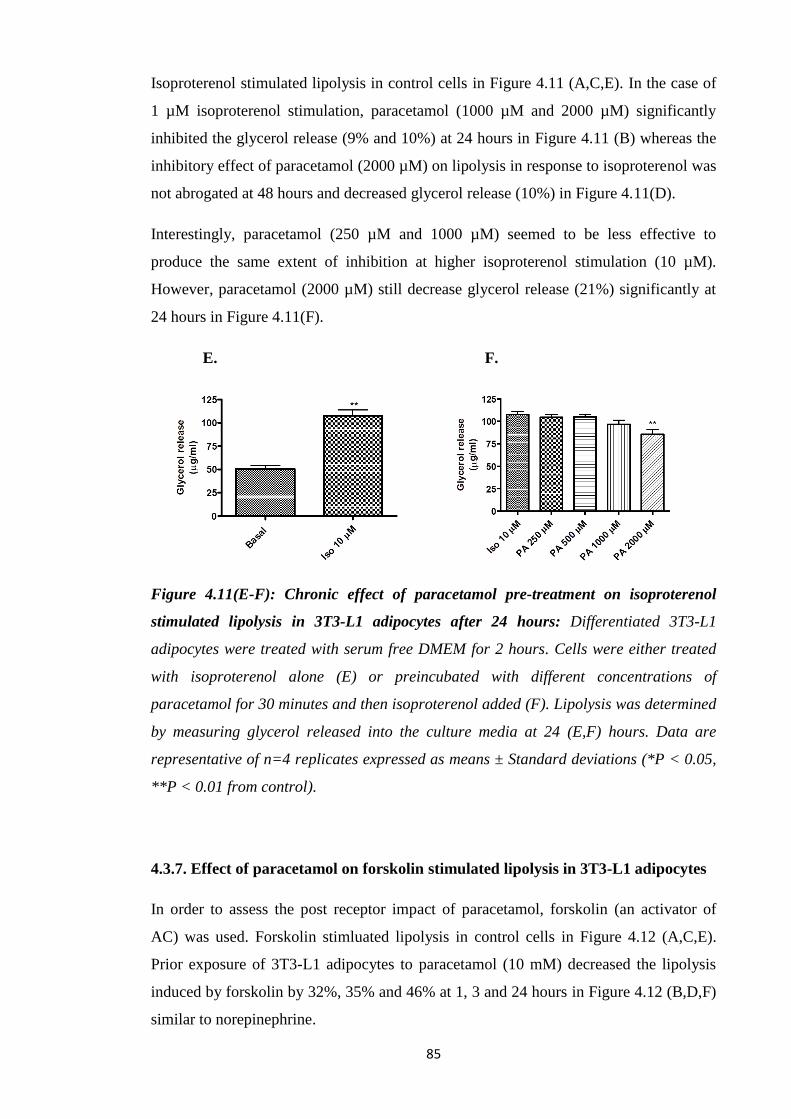
85
Isoproterenol stimulated lipolysis in control cells in Figure 4.11 (A,C,E). In the case of
1 µM isoproterenol stimulation, paracetamol (1000 µM and 2000 µM) significantly
inhibited the glycerol release (9% and 10%) at 24 hours in Figure 4.11 (B) whereas the
inhibitory effect of paracetamol (2000 µM) on lipolysis in response to isoproterenol was
not abrogated at 48 hours and decreased glycerol release (10%) in Figure 4.11(D).
Interestingly, paracetamol (250 µM and 1000 µM) seemed to be less effective to
produce the same extent of inhibition at higher isoproterenol stimulation (10 µM).
However, paracetamol (2000 µM) still decrease glycerol release (21%) significantly at
24 hours in Figure 4.11(F).
E. F.
Figure 4.11(E-F): Chronic effect of paracetamol pre-treatment on isoproterenol
stimulated lipolysis in 3T3-L1 adipocytes after 24 hours: Differentiated 3T3-L1
adipocytes were treated with serum free DMEM for 2 hours. Cells were either treated
with isoproterenol alone (E) or preincubated with different concentrations of
paracetamol for 30 minutes and then isoproterenol added (F). Lipolysis was determined
by measuring glycerol released into the culture media at 24 (E,F) hours. Data are
representative of n=4 replicates expressed as means ± Standard deviations (*P < 0.05,
**P < 0.01 from control).
4.3.7. Effect of paracetamol on forskolin stimulated lipolysis in 3T3-L1 adipocytes
In order to assess the post receptor impact of paracetamol, forskolin (an activator of
AC) was used. Forskolin stimluated lipolysis in control cells in Figure 4.12 (A,C,E).
Prior exposure of 3T3-L1 adipocytes to paracetamol (10 mM) decreased the lipolysis
induced by forskolin by 32%, 35% and 46% at 1, 3 and 24 hours in Figure 4.12 (B,D,F)
similar to norepinephrine.
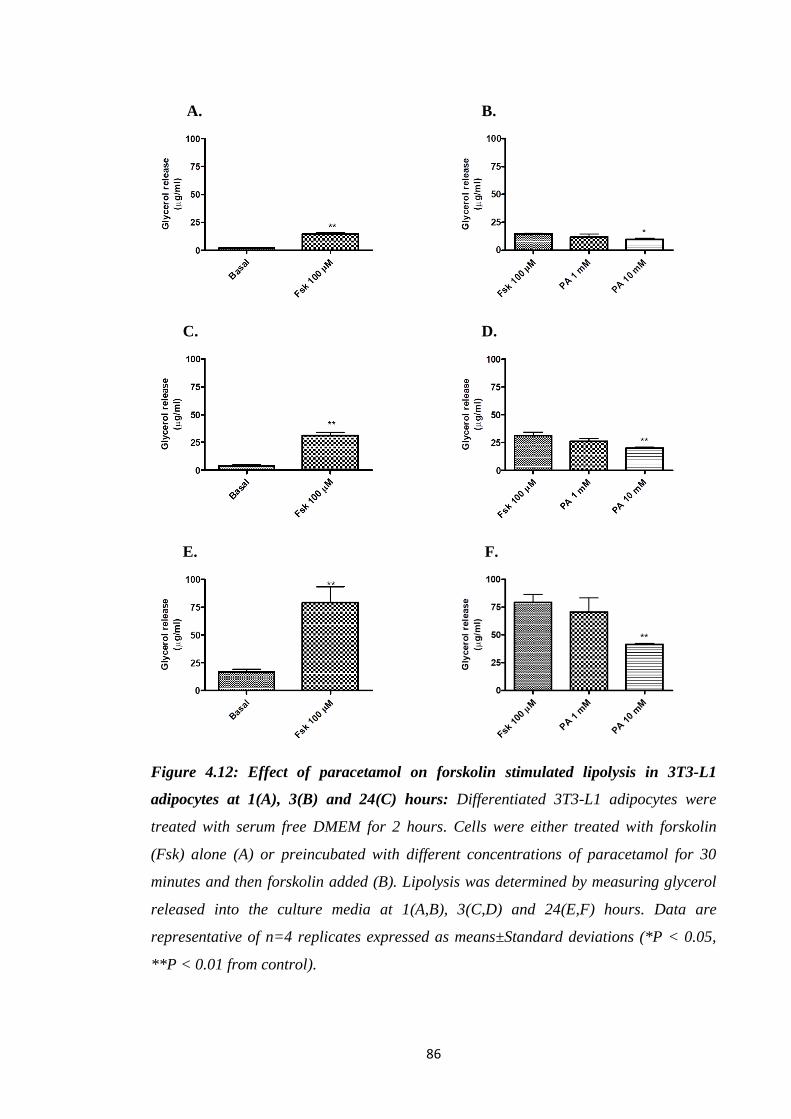
86
A. B.
C. D.
E. F.
Figure 4.12: Effect of paracetamol on forskolin stimulated lipolysis in 3T3-L1
adipocytes at 1(A), 3(B) and 24(C) hours: Differentiated 3T3-L1 adipocytes were
treated with serum free DMEM for 2 hours. Cells were either treated with forskolin
(Fsk) alone (A) or preincubated with different concentrations of paracetamol for 30
minutes and then forskolin added (B). Lipolysis was determined by measuring glycerol
released into the culture media at 1(A,B), 3(C,D) and 24(E,F) hours. Data are
representative of n=4 replicates expressed as means±Standard deviations (*P < 0.05,
**P < 0.01 from control).

87
4.3.8. Effect of paracetamol on 8-Br-cAMP stimulated lipolysis in 3T3-L1
adipocytes
To assess the impact of paracetamol at the level of cAMP, a cAMP analog 8-Br-cAMP
which has greater resistance to phosphodiesterases than cAMP was used.
A. B.
C. D.
Figure 4.13: Effect of paracetamol on 8-Br-cAMP stimulated lipolysis in 3T3-L1
adipocytes at 3 and 24 hours: Differentiated 3T3-L1 adipocytes were treated with
serum free DMEM for 2 hours. Cells were either treated with 8-Br-cAMP alone (A) or
preincubated with different concentrations of paracetamol for 30 minutes and then 8-
Br-cAMP added (C). Lipolysis was determined by measuring glycerol released into the
culture media at 3(A,C) and 24(B,D) hours. Data are representative of n=4 replicates
expressed as means ± Standard deviations (*P < 0.05, **P < 0.01 from control).
8-Br-cAMP stimulated lipolysis in control cells in Figure 4.13 (A,B). Paracetamol (10
mM) still showed marked decrease in glycerol release (45%) at 3 hours and still
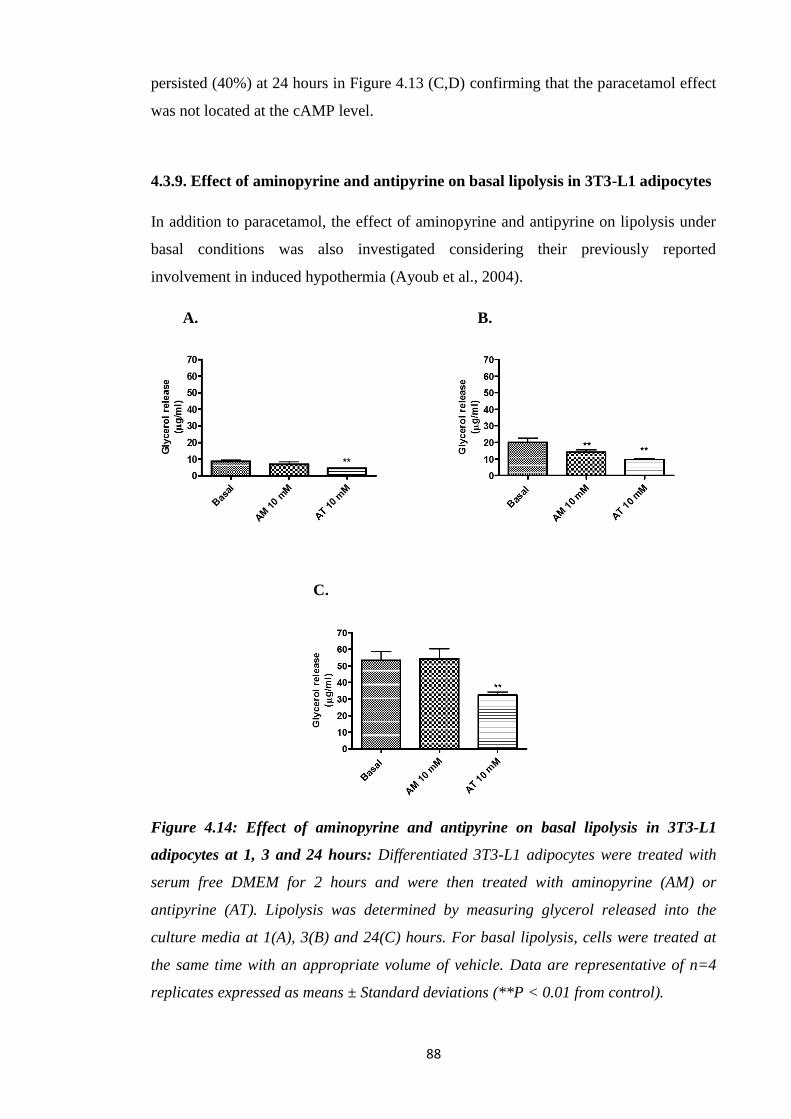
88
persisted (40%) at 24 hours in Figure 4.13 (C,D) confirming that the paracetamol effect
was not located at the cAMP level.
4.3.9. Effect of aminopyrine and antipyrine on basal lipolysis in 3T3-L1 adipocytes
In addition to paracetamol, the effect of aminopyrine and antipyrine on lipolysis under
basal conditions was also investigated considering their previously reported
involvement in induced hypothermia (Ayoub et al., 2004).
A. B.
C.
Figure 4.14: Effect of aminopyrine and antipyrine on basal lipolysis in 3T3-L1
adipocytes at 1, 3 and 24 hours: Differentiated 3T3-L1 adipocytes were treated with
serum free DMEM for 2 hours and were then treated with aminopyrine (AM) or
antipyrine (AT). Lipolysis was determined by measuring glycerol released into the
culture media at 1(A), 3(B) and 24(C) hours. For basal lipolysis, cells were treated at
the same time with an appropriate volume of vehicle. Data are representative of n=4
replicates expressed as means ± Standard deviations (**P < 0.01 from control).
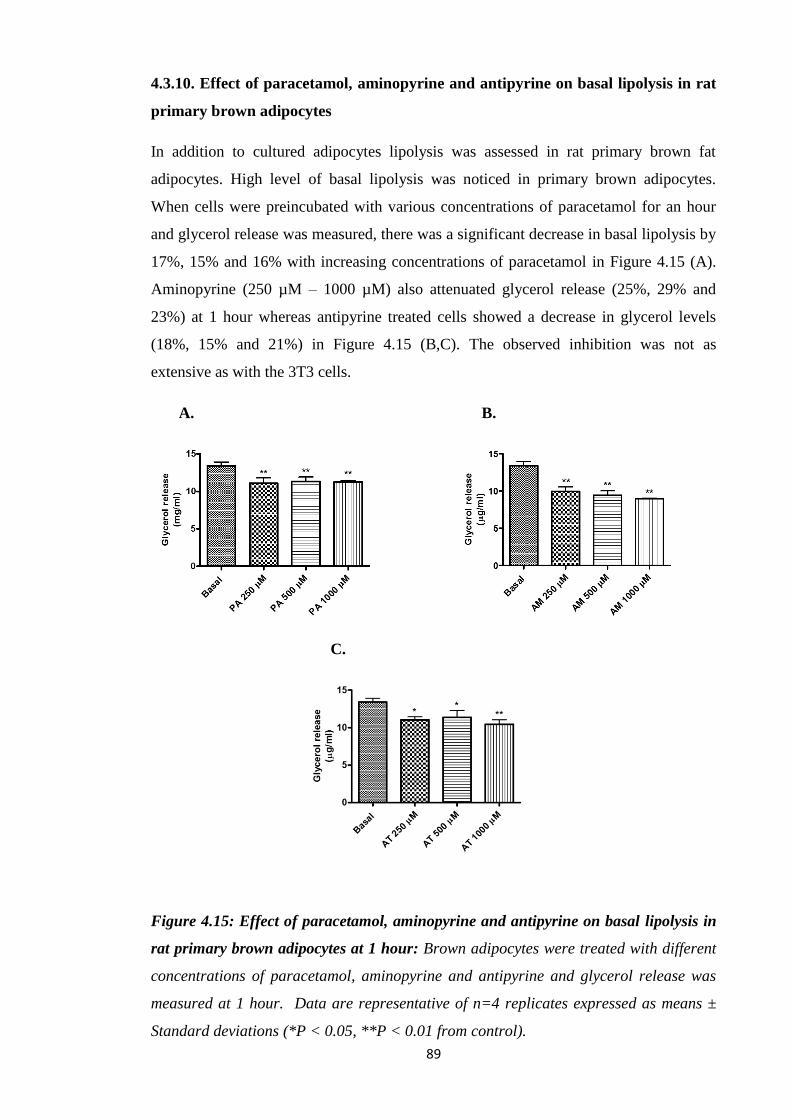
89
4.3.10. Effect of paracetamol, aminopyrine and antipyrine on basal lipolysis in rat
primary brown adipocytes
In addition to cultured adipocytes lipolysis was assessed in rat primary brown fat
adipocytes. High level of basal lipolysis was noticed in primary brown adipocytes.
When cells were preincubated with various concentrations of paracetamol for an hour
and glycerol release was measured, there was a significant decrease in basal lipolysis by
17%, 15% and 16% with increasing concentrations of paracetamol in Figure 4.15 (A).
Aminopyrine (250 µM – 1000 µM) also attenuated glycerol release (25%, 29% and
23%) at 1 hour whereas antipyrine treated cells showed a decrease in glycerol levels
(18%, 15% and 21%) in Figure 4.15 (B,C). The observed inhibition was not as
extensive as with the 3T3 cells.
A. B.
C.
Figure 4.15: Effect of paracetamol, aminopyrine and antipyrine on basal lipolysis in
rat primary brown adipocytes at 1 hour: Brown adipocytes were treated with different
concentrations of paracetamol, aminopyrine and antipyrine and glycerol release was
measured at 1 hour. Data are representative of n=4 replicates expressed as means ±
Standard deviations (*P < 0.05, **P < 0.01 from control).
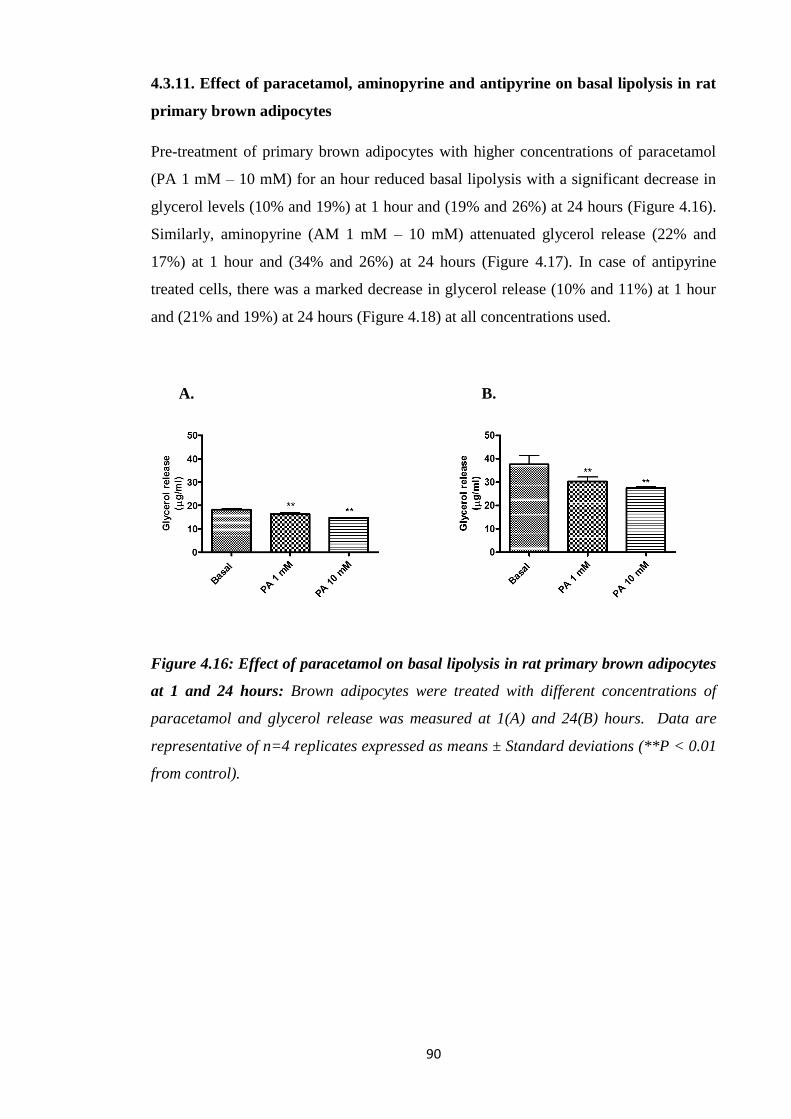
90
4.3.11. Effect of paracetamol, aminopyrine and antipyrine on basal lipolysis in rat
primary brown adipocytes
Pre-treatment of primary brown adipocytes with higher concentrations of paracetamol
(PA 1 mM – 10 mM) for an hour reduced basal lipolysis with a significant decrease in
glycerol levels (10% and 19%) at 1 hour and (19% and 26%) at 24 hours (Figure 4.16).
Similarly, aminopyrine (AM 1 mM – 10 mM) attenuated glycerol release (22% and
17%) at 1 hour and (34% and 26%) at 24 hours (Figure 4.17). In case of antipyrine
treated cells, there was a marked decrease in glycerol release (10% and 11%) at 1 hour
and (21% and 19%) at 24 hours (Figure 4.18) at all concentrations used.
A. B.
Figure 4.16: Effect of paracetamol on basal lipolysis in rat primary brown adipocytes
at 1 and 24 hours: Brown adipocytes were treated with different concentrations of
paracetamol and glycerol release was measured at 1(A) and 24(B) hours. Data are
representative of n=4 replicates expressed as means ± Standard deviations (**P < 0.01
from control).

91
A. B.
Figure 4.17: Effect of aminopyrine on basal lipolysis in rat primary brown adipocytes
at 1 and 24 hours: Brown adipocytes were treated with different concentrations of
aminopyrine and glycerol release was measured at 1(A) and 24(B) hours. Data are
representative of n=4 replicates expressed as means ± Standard deviations (**P < 0.01
from control).
A. B.
Figure 4.18: Effect of antipyrine on basal lipolysis in rat primary brown adipocytes at
1 and 24 hours: Brown adipocytes were treated with different concentrations of
antipyrine and glycerol release was measured at 1(A) and 24(B) hours. Data are
representative of n=4 replicates expressed as means ± Standard deviations (**P < 0.01
from control).
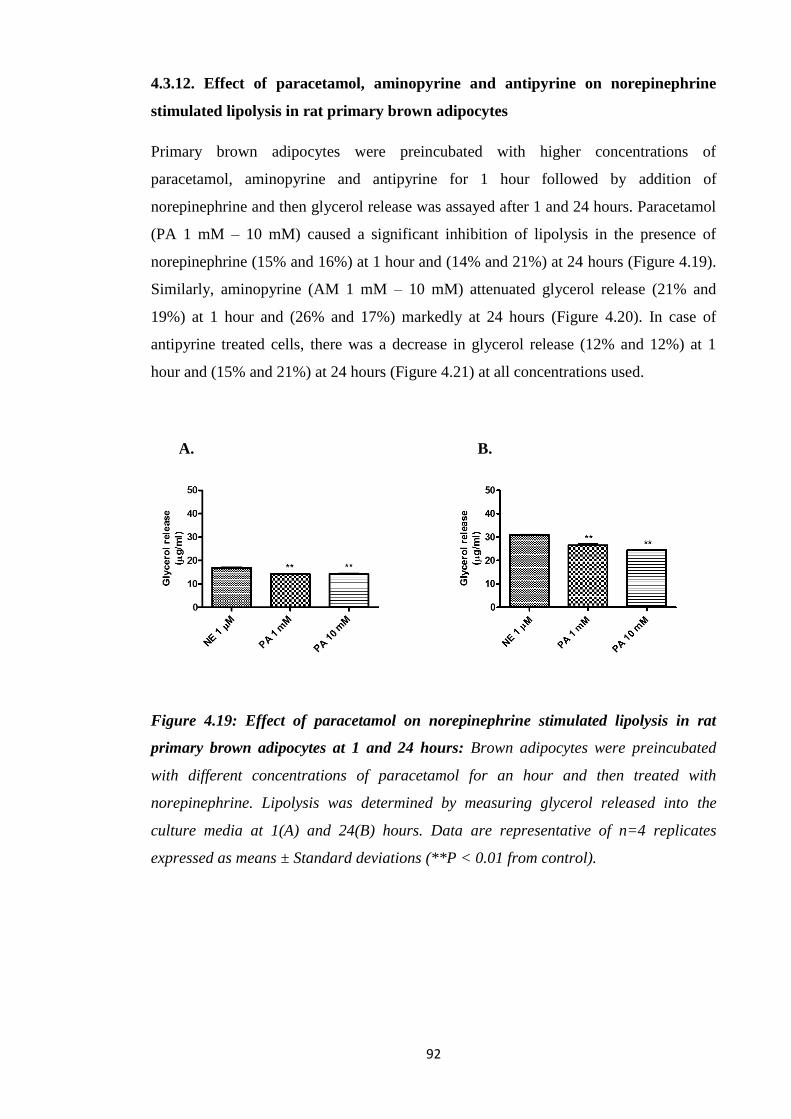
92
4.3.12. Effect of paracetamol, aminopyrine and antipyrine on norepinephrine
stimulated lipolysis in rat primary brown adipocytes
Primary brown adipocytes were preincubated with higher concentrations of
paracetamol, aminopyrine and antipyrine for 1 hour followed by addition of
norepinephrine and then glycerol release was assayed after 1 and 24 hours. Paracetamol
(PA 1 mM – 10 mM) caused a significant inhibition of lipolysis in the presence of
norepinephrine (15% and 16%) at 1 hour and (14% and 21%) at 24 hours (Figure 4.19).
Similarly, aminopyrine (AM 1 mM – 10 mM) attenuated glycerol release (21% and
19%) at 1 hour and (26% and 17%) markedly at 24 hours (Figure 4.20). In case of
antipyrine treated cells, there was a decrease in glycerol release (12% and 12%) at 1
hour and (15% and 21%) at 24 hours (Figure 4.21) at all concentrations used.
A. B.
Figure 4.19: Effect of paracetamol on norepinephrine stimulated lipolysis in rat
primary brown adipocytes at 1 and 24 hours: Brown adipocytes were preincubated
with different concentrations of paracetamol for an hour and then treated with
norepinephrine. Lipolysis was determined by measuring glycerol released into the
culture media at 1(A) and 24(B) hours. Data are representative of n=4 replicates
expressed as means ± Standard deviations (**P < 0.01 from control).

93
A. B.
Figure 4.20: Effect of aminopyrine on norepinephrine stimulated lipolysis in rat
primary brown adipocytes at 1 and 24 hours: Brown adipocytes were preincubated
with different concentrations of aminopyrine for an hour and then treated with
norepinephrine. Lipolysis was determined by measuring glycerol released into the
culture media at 1(A) and 24(B) hours. Data are representative of n=4 replicates
expressed as means ± Standard deviations (**P < 0.01 from control).
A. B.
Figure 4.21: Effect of antipyrine on norepinephrine stimulated lipolysis in rat
primary brown adipocytes at 1 and 24 hours: Brown adipocytes were preincubated
with different concentrations of antipyrine for an hour and then treated with
norepinephrine. Lipolysis was determined by measuring glycerol released into the
culture media at 1(A) and 24(B) hours. Data are representative of n=4 replicates
expressed as means ± Standard deviations (**P < 0.01 from control).
94
4.4. Discussion:
For homeotherms housed at temperature below their thermoneutral zone, heat
generation starts with signals coming from the preoptic area of anterior hypothalamus
(POA) to stimulate peripheral effectors leading to the increased lipolysis, mitochondrial
metabolism and heat generation. Given the lack of agreement about the actions of
paracetamol centrally, it is reasonable to examine its impact at other points along the
heat generation pathway.
Lipolysis is a critical metabolic function of adipocytes and is a key process that
provides fatty acids for combustion and to induce UCP1 activation, thus directly leading
to thermogenesis (Ohlson et al., 2004). Conversion of stored TGs into FFAs through a
process of lipolysis is stimulated by β-adrenergic signalling to activate the cAMP
mediated PKA pathway (Chrysovergis et al., 2014; McKnight et al., 1998). This
mediates phosphorylation and activation of lipolytic enzymes including HSL, ATGL,
and perilipin (MacPherson and Peters, 2015; Schweiger et al., 2006; Heeren and
Münzberg 2013; Marcelin and Chua 2010).
Prior to the lipolysis studies, the 3T3-L1 cells were assessed for the impact of
paracetamol on viability at the concentrations used. The concentrations (up to 10 mM)
were similar to or lower than concentrations known to induce hypothermia in animals in
vivo. At these concentrations over 48 hours, there was no loss of viability indicating that
the effects observed could not be attributed to loss of cell numbers or viability. Prior to
the lipolysis assays, the 3T3-L1 pre-adipocytes were shown to successfully differentiate
into adipocytes.
Although lipolysis can be directly assessed by measuring glycerol release (Schweiger et
al., 2014), the addition of BSA (fatty acid-free) to the culture medium is required to
prevent fatty acid reesterification (Paar et al., 2012). In this study, to examine whether
paracetamol could have an impact on lipolysis, glycerol release was measured in mouse
3T3-L1 adipocytes, the most frequently used an in vitro model of lipolysis. In the model
used, adipocytes were incubated in a low glucose medium to ensure lipolysis. Under
basal conditions, paracetamol at 10 mM was found to significantly reduce glycerol
release as early as 1 hour (Figure 4.3). This initial observation suggests that paracetamol
is impacting on the lipolysis pathway in the absence of any form of external stimulation,
possible indication that the actions of paracetamol may be post receptor. Another
possibility is that paracetamol could act on the α1 or α₂ receptors which are thought to
95
inhibit lipolysis. Stimulation of α₂-receptors is thought to decrease AC activity and thus
cAMP production (Fain et al., 1984) whereas stimulation of α1-receptors activates a
calcium-dependent phosphodiesterase and possibly decrease cAMP (Bronnikov et al.,
1984) and thermogenesis.
To investigate whether stimulation of inhibitory α1 or α₂ pathways was necessary to
observe the inhibitory effect of paracetamol, the effect of paracetamol could have been
compared with α-receptor agonist. When cells were stimulated with NE, a combined α-
/β-agonist for different subtypes of α/β-adrenergic receptors lipolysis was increased.
Again, paracetamol was able to lower NE stimulated lipolysis (43% and 24%) at 1 and
3 hours (Figure 4.4).
To further investigate the impact of paracetamol on the catecholamine receptor, the β-
agonist such as isoproterenol was selected to stimulate lipolysis. Paracetamol also
inhibited isoproterenol induced lipolysis when added simultaneously with the agonist
(Figure 4.5-4.7). This effect was concentration dependent, moreover, paracetamol pre-
treatment of 3T3-L1 adipocytes attenuated isoproterenol stimulated lipolysis, however
the effect was better observed at the higher concentrations and after a short (1,3 hours)
incubation, suggesting an impact of drug metabolism (Figure 4.8-4.10).
The inhibitory effect of paracetamol could be located downstream of the coupling
process between the β-receptor and AC. To investigate whether the paracetamol effect
is located at the level of AC, forskolin a direct activator of AC was used. Forskolin
stimulated lipolysis in the control cells. In the paracetamol preincubated cells, there was
a time dependent decrease in lipolysis and the response to forskolin (Figure 4.12). This
observation confirmed that the paracetamol inhibition was not located at the
receptor/cyclase coupling process and must therefore be distally located.
The next step was to investigate the effect on paracetamol on cAMP levels which would
partly impact on phosphodiesterases activity. To determine the role of increased cAMP
breakdown in paracetamol inhibition, a cAMP analog 8-Br-cAMP with a greater
resistance to phosphodiesterases than cAMP itself was used. 8-Br-cAMP induced an
increase in lipolysis in control cells. The glycerol release was, however, still much
attenuated by paracetamol, about 45% lower than in control cells at 3 hours (Figure
4.13), confirming that the paracetamol effect was not located to phosphodiesterase
function.

96
If time allowed, the effect of paracetamol on the link between a given amount of cAMP
and the resulting lipolysis could had been measured simultaneously in cells stimulated
with the AC activator forskolin. Moreover, to confirm whether paracetamol had a direct
effect on AC, its activity could have been directly measured in membrane preparations
from 3T3-L1 adipocytes. More importantly the effect of paracetamol on other key
enzymes in the lipolysis process such as HSL, ATGL and perilipin activities needs to be
investigated.
In addition to paracetamol, the effect of aminopyrine and antipyrine was also studied
primarily as they were reported to be putative COX-3 inhibitors. These agents are
classified as pyrazolones and considered as oldest synthetic pharmaceuticals. Antipyrine
(phenazone) exhibits analgesic, antipyretic and antirheumatic activity. Aminopyrine
(aminophenazone) is thought to possess greater antipyretic and analgesic activity,
marked anti-inflammatory property but more toxic than antipyrine (Volz and Kellner,
1980). However like paracetamol, little is understood about the impact of these
compounds on lipolysis. In the present studies, both aminopyrine and antipyrine were
effective in significantly reducing glycerol release at 1 and 3 hours in 3T3-L1 cells in a
manner similar to paracetamol (Figure 4.14). In addition, like paracetamol the effect
was most pronounced at the earlier time points suggesting the parent compounds may
be involved rather than metabolites. The results parallel the hypothermic and COX-3
inhibitors action of all three compounds.
Although the differentiated 3T3-L1 cells are a widely used model for lipolysis and fat
metabolism studies, investigations were also undertaken using rat primary brown
adipocytes which are known for their involvement in thermoregulation in small
mammals. In addition, these cells may give a more realistic picture of the effect of the
test compound on lipolysis. The cells showed high levels of basal lipolysis which may
reflect the fact that they have just been removed from an animal below their
thermoneutral zone and simply it may be a reflection of the level of both cold and other
stress in freshly isolated cells. The compounds (paracetamol, aminopyrine and
antipyrine) inhibited lipolysis in the primary cells in a manner similar to the 3T3-L1
cells under basal conditions and to a greater limit when NE was present (4.15-4.21)
Paracetamol, aminopyrine and antipyrine are not the only antipyretic compounds to
inhibit lipolysis. Indomethacin has shown to inhibit enzymes involved in basal and
stimulated lipolysis in the kidney, thus inhibiting PG synthesis via lowering the AA and
through directly interacting (Erman et al., 1980). NSAIDs (aspirin, naproxen,

97
nimesulide, and piroxicam) are known to activate NADPH oxidase (NOX) isoform
(NOX4) in adipocytes to produce hydrogen peroxide (H₂O₂), which impairs cAMP-
dependent PKA-II activation, thus inhibiting isoproterenol activated lipolysis. H₂O₂
signalling is a novel COX independent effect of NSAIDs in adipocytes and may play a
role in antipyresis (Vázquez-Meza et al., 2013).
These studies confirm that hypothermic agents such as paracetamol, aminopyrine and
antipyrine are capable of inhibiting lipolysis. Even at the level of inhibition reported in
this study could negatively impact on a small mammal’s ability to thermoregulate at
temperatures below their thermoneutral zone.
Although lipolysis is a key step in the thermogenesis process, paracetamol and other
hypothermic compounds could also work at sites downstream to the generation of fatty
acids, for example by inhibiting FAO.
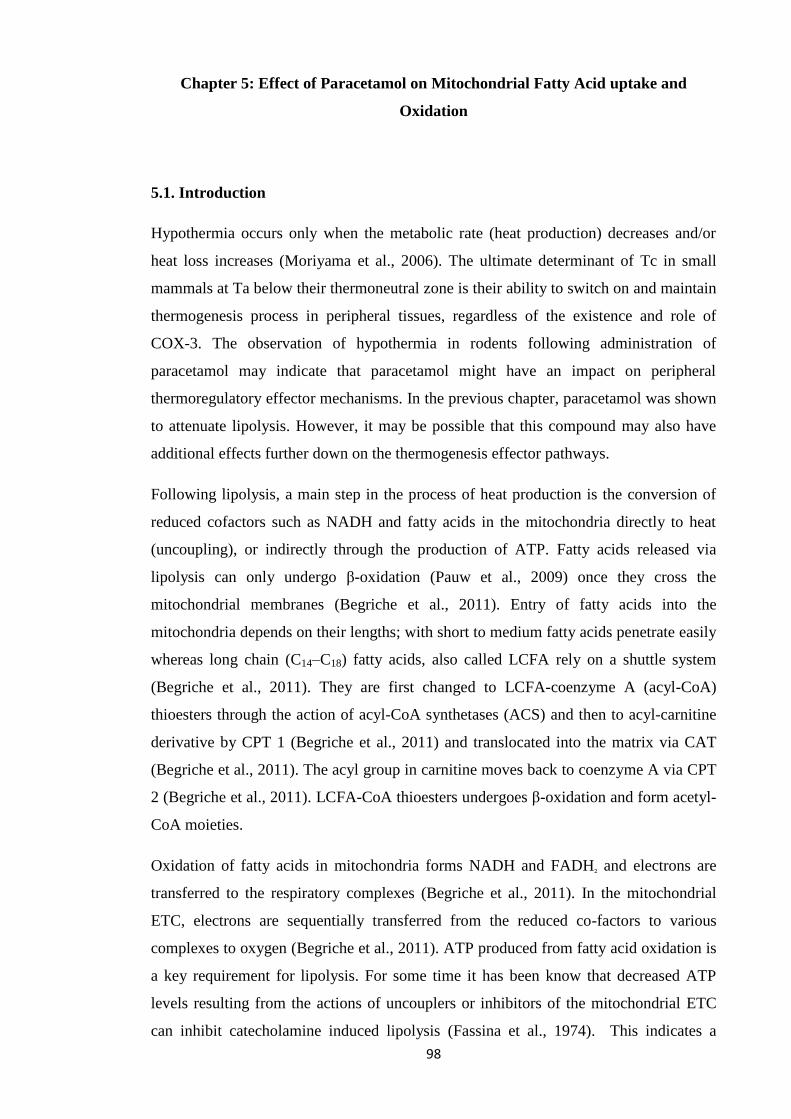
98
Chapter 5: Effect of Paracetamol on Mitochondrial Fatty Acid uptake and
Oxidation
5.1. Introduction
Hypothermia occurs only when the metabolic rate (heat production) decreases and/or
heat loss increases (Moriyama et al., 2006). The ultimate determinant of Tc in small
mammals at Ta below their thermoneutral zone is their ability to switch on and maintain
thermogenesis process in peripheral tissues, regardless of the existence and role of
COX-3. The observation of hypothermia in rodents following administration of
paracetamol may indicate that paracetamol might have an impact on peripheral
thermoregulatory effector mechanisms. In the previous chapter, paracetamol was shown
to attenuate lipolysis. However, it may be possible that this compound may also have
additional effects further down on the thermogenesis effector pathways.
Following lipolysis, a main step in the process of heat production is the conversion of
reduced cofactors such as NADH and fatty acids in the mitochondria directly to heat
(uncoupling), or indirectly through the production of ATP. Fatty acids released via
lipolysis can only undergo β-oxidation (Pauw et al., 2009) once they cross the
mitochondrial membranes (Begriche et al., 2011). Entry of fatty acids into the
mitochondria depends on their lengths; with short to medium fatty acids penetrate easily
whereas long chain (C14–C18) fatty acids, also called LCFA rely on a shuttle system
(Begriche et al., 2011). They are first changed to LCFA-coenzyme A (acyl-CoA)
thioesters through the action of acyl-CoA synthetases (ACS) and then to acyl-carnitine
derivative by CPT 1 (Begriche et al., 2011) and translocated into the matrix via CAT
(Begriche et al., 2011). The acyl group in carnitine moves back to coenzyme A via CPT
2 (Begriche et al., 2011). LCFA-CoA thioesters undergoes β-oxidation and form acetyl-
CoA moieties.
Oxidation of fatty acids in mitochondria forms NADH and FADH₂ and electrons are
transferred to the respiratory complexes (Begriche et al., 2011). In the mitochondrial
ETC, electrons are sequentially transferred from the reduced co-factors to various
complexes to oxygen (Begriche et al., 2011). ATP produced from fatty acid oxidation is
a key requirement for lipolysis. For some time it has been know that decreased ATP
levels resulting from the actions of uncouplers or inhibitors of the mitochondrial ETC
can inhibit catecholamine induced lipolysis (Fassina et al., 1974). This indicates a
99
direct link between lipolysis and the functionality of mitochondrial oxidative
phosphorylation (OXPHOS) system (Pauw et al., 2009).
Drug-induced inhibition of mitochondrial FAO involves various mechanisms and may
require interactions with different mitochondrial enzymes (Fromenty and Pessayre,
1995; Labbe et al., 2008). Drugs including ibuprofen can cause direct inhibition of one
or more mitochondrial FAO enzymes (Fromenty and Pessayre, 1995). Many of the toxic
properties of paracetamol are mediated by the metabolism by cytochrome P450 system
to the highly reactive metabolite NAPQI including the inhibition of FAO
enzymes (Chen et al., 2009). CPT1 could be a key target for these drugs (Begriche et
al., 2011). Drug induced blockade of mitochondrial FAO can also occur via formation
of coenzyme A and l-carnitine esters, decreasing important cofactors involved in FAO
as in case of salicylic acid, and ibuprofen (Fromenty and Pessayre, 1995; Deschamps et
al.,1991; Fréneaux et al., 1990). Severe inhibition of the ETC can directly inhibit
mitochondrial FAO by reducing the level of co-factors and ATP (Fromenty and
Pessayre, 1995; Labbe et al., 2008). Other process that could be considered includes
ETC damage and lactic acidosis via inhibition of the TCA cycle (Labbe et al., 2008;
Cornejo-Juarez et al., 2003; Walker et al., 2004).
In an attempt to establish if the hypothermia caused by paracetamol and related
compounds is due to the inhibition of endogenous or exogenous FAO, oxygen
consumption rate (OCR) was assessed in 3T3-L1 cells in the absence and presence of
palmitate and results compared to etomoxir (Eto), a known inhibitor of fatty acid uptake
into the mitochondria. The Agilent Seahorse XF FAO assay allows the sources of fatty
acid (endogenous or exogenous) to be identified and how specific test compounds affect
mitochondrial function. The rate of oxidation of exogenously added fatty acids to cells
will depend on the availability of other substrates and the demand for ATP. In addition,
fatty acids from exogenous source can also uncouple mitochondria reducing coupling
efficiency. Both can be assessed by measuring OCR in the presence of palmitate-BSA,
an extensively used substrate and the classic inhibitor Eto which inhibits CPT1 (Agilent
Seahorse, U.K.).
100
5.2. Methods
5.2.1. Effect of paracetamol, etomoxir and NAPQI on both endogenous and exogenous
(in the presence of palmitate:BSA) FAO was determined using the Agilent Seahorse XF
FAO Assay as described in section 2.4.15-2.4.16.1.
The results were analysed with analysis of variance (ANOVA), followed by Dunnett's
Multiple Comparison Test or Bonferroni's Multiple Comparison Test. A *P < 0.05, **
P<0.01, *** P<0.001 from control was considered statistically significant.
5.3. Results:
5.3.1. Effect of paracetamol on FAO:
Under conditions of limited substrate concentration, the XF Palmitate-BSA FAO
substrate was used along with Eto, and the XF Cell Mito Stress Test, the XF FAO assay
measures FAO in cells during basal and stressed energy needs (Agilent Seahorse, U.K.).
The effect of paracetamol (10 mM) was investigated under basal conditions and after
oligomycin addition (2.5 µg/ml), FCCP (4 µM) and rotenone/antimycin A (2 µM/4 µM)
versus BSA control and Palmitate: BSA control.
During basal respiration, there was a significant decrease in OCR by 10% and 31% in
BSA+Eto and BSA+PA group. The Palm: BSA+Eto and Palm:BSA+PA group resulted
in a reduction in OCR by 20% and 29% indicating that a small segment of the basal
respiration was as a result of oxidation of endogenous fatty acids in Figure 5.1(A,B).
After the addition of oligomycin, the BSA+Eto and BSA+PA treatment group resulted
in a further decrease by 12% and 15%, whereas reduced OCR was noticed in
Palm:BSA+PA by 17% in Figure 5.1(C,D).
Introduction of FCCP resulted in a significant rise in maximum respiration in the
Palm:BSA treatment group that was supported by oxidizing exogenous fatty acids as
Palm:BSA+Eto and Palm:BSA+PA group has shown a reduction in OCR by 42% and
25% in Figure 5.2(A,B). The BSA+Eto and BSA+PA treatment group attenuated OCR
by 8% and 18%. Finally, rotenone/antimycin A caused a further reduction in OCR by
17% and 16% (BSA+Eto and BSA+PA) and 23% and 14% (Palm:BSA+Eto and
Palm:BSA+PA in Figure 5.2(C,D) respectively.
101
Basal
A. B.
Oligomycin addition
C. D.
Figure 5.1: Effect of paracetamol on FAO during basal and after oligomycin addition
in 3T3-L1 adipocytes. Differentiated 3T3-L1 adipocytes grown in substrate-limited
medium overnight and combination of XF Palmitate-BSA FAO Substrate and the XF
Cell Mito Stress Test was used. Data are representative of n=3 replicates expressed as
means ± Standard deviations (*P < 0.05, **P < 0.01, *** P<0.001 from control).
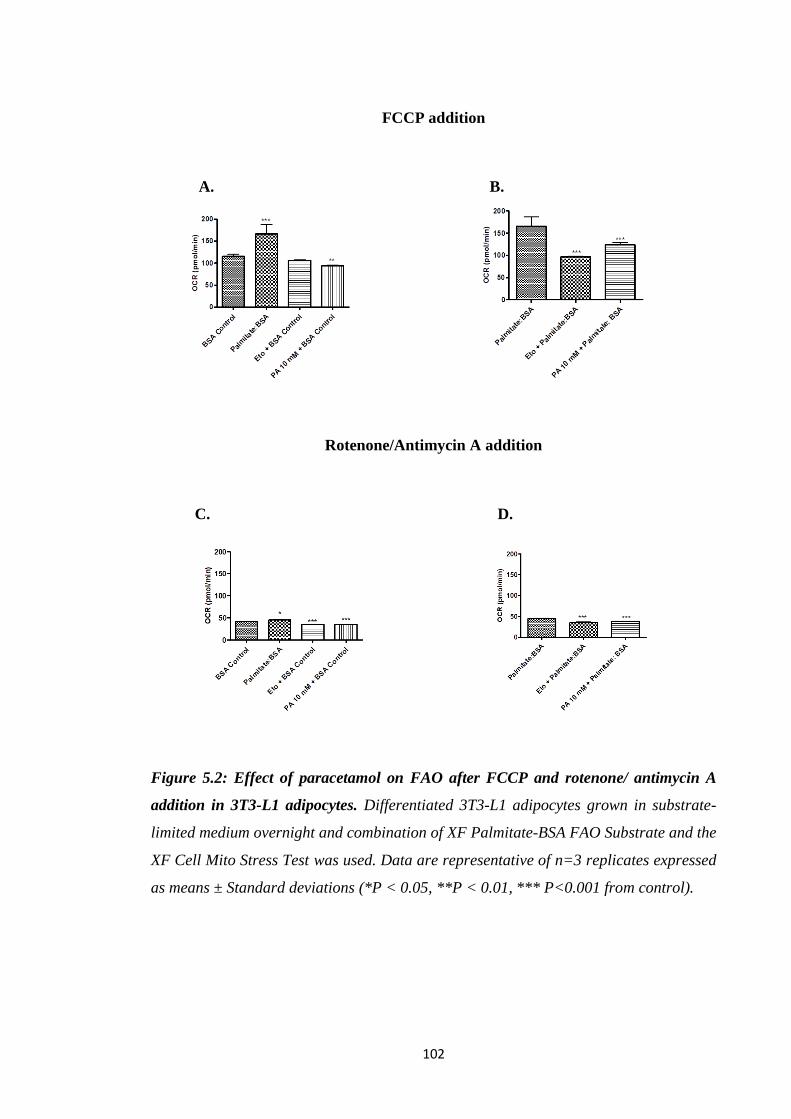
102
FCCP addition
A. B.
Rotenone/Antimycin A addition
C. D.
Figure 5.2: Effect of paracetamol on FAO after FCCP and rotenone/ antimycin A
addition in 3T3-L1 adipocytes. Differentiated 3T3-L1 adipocytes grown in substrate-
limited medium overnight and combination of XF Palmitate-BSA FAO Substrate and the
XF Cell Mito Stress Test was used. Data are representative of n=3 replicates expressed
as means ± Standard deviations (*P < 0.05, **P < 0.01, *** P<0.001 from control).
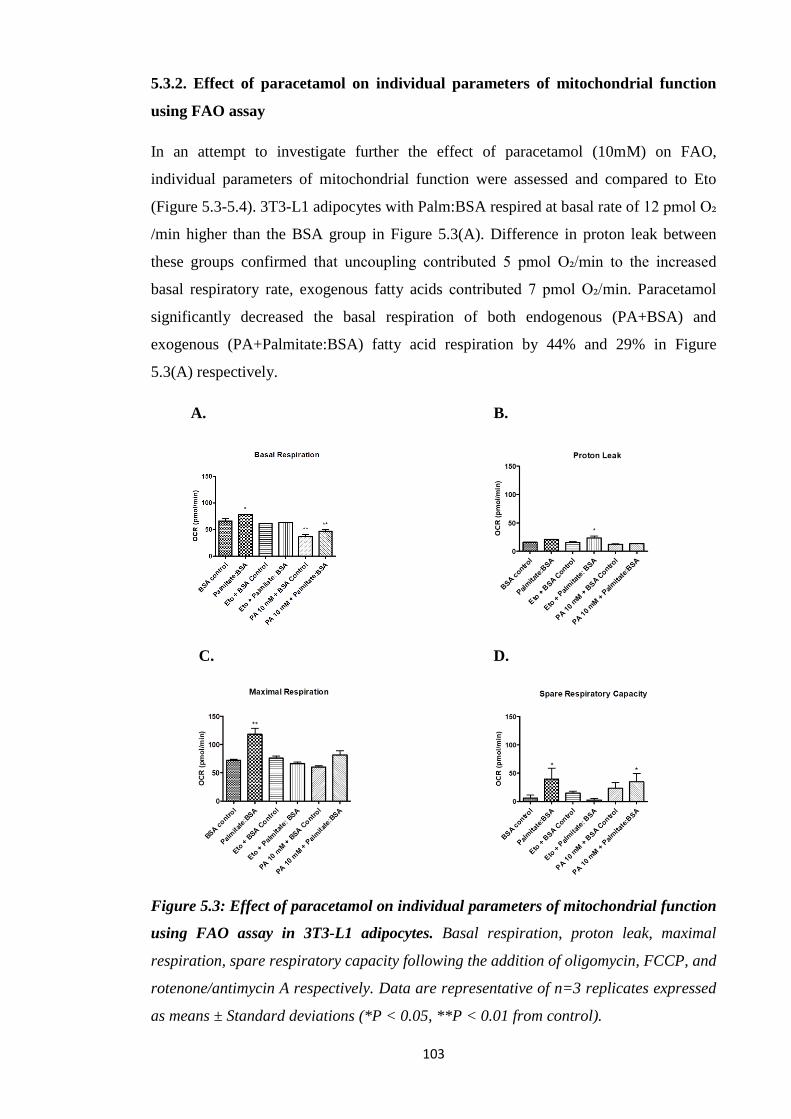
103
5.3.2. Effect of paracetamol on individual parameters of mitochondrial function
using FAO assay
In an attempt to investigate further the effect of paracetamol (10mM) on FAO,
individual parameters of mitochondrial function were assessed and compared to Eto
(Figure 5.3-5.4). 3T3-L1 adipocytes with Palm:BSA respired at basal rate of 12 pmol O₂
/min higher than the BSA group in Figure 5.3(A). Difference in proton leak between
these groups confirmed that uncoupling contributed 5 pmol O₂/min to the increased
basal respiratory rate, exogenous fatty acids contributed 7 pmol O₂/min. Paracetamol
significantly decreased the basal respiration of both endogenous (PA+BSA) and
exogenous (PA+Palmitate:BSA) fatty acid respiration by 44% and 29% in Figure
5.3(A) respectively.
A. B.
C. D.
Figure 5.3: Effect of paracetamol on individual parameters of mitochondrial function
using FAO assay in 3T3-L1 adipocytes. Basal respiration, proton leak, maximal
respiration, spare respiratory capacity following the addition of oligomycin, FCCP, and
rotenone/antimycin A respectively. Data are representative of n=3 replicates expressed
as means ± Standard deviations (*P < 0.05, **P < 0.01 from control).

104
However paracetamol had no effect on proton leak, spare respiratory capacity or
maximal respiration. Paracetamol attenuated non-mitochondrial respiration by 15% in
Figure 5.4(A). Paracetamol hindered ATP production in both endogenous (PA+BSA)
and exogenous (PA+Palmitate:BSA) fatty acid respiration by 51% and 33% in Figure
5.4 (B). Endogenous (PA+BSA) spare respiratory capacity was significantly increased
(59%) by paracetamol in Figure 5.4(D). In the presence of paracetamol there was no
change in maximal respiration in Figure 5.3(C).
A. B.
C. D.
Figure 5.4: Effect of paracetamol on individual parameters of mitochondrial function
using FAO assay in 3T3-L1 adipocytes. Non-mitochondrial respiration and ATP
production following the addition of oligomycin, FCCP, and rotenone/antimycin A
respectively. Coupling efficiency and spare respiratory capacity represented as %. Data
are representative of n=3 replicates expressed as means ± Standard deviations (*P <
0.05, **P < 0.01 from control).
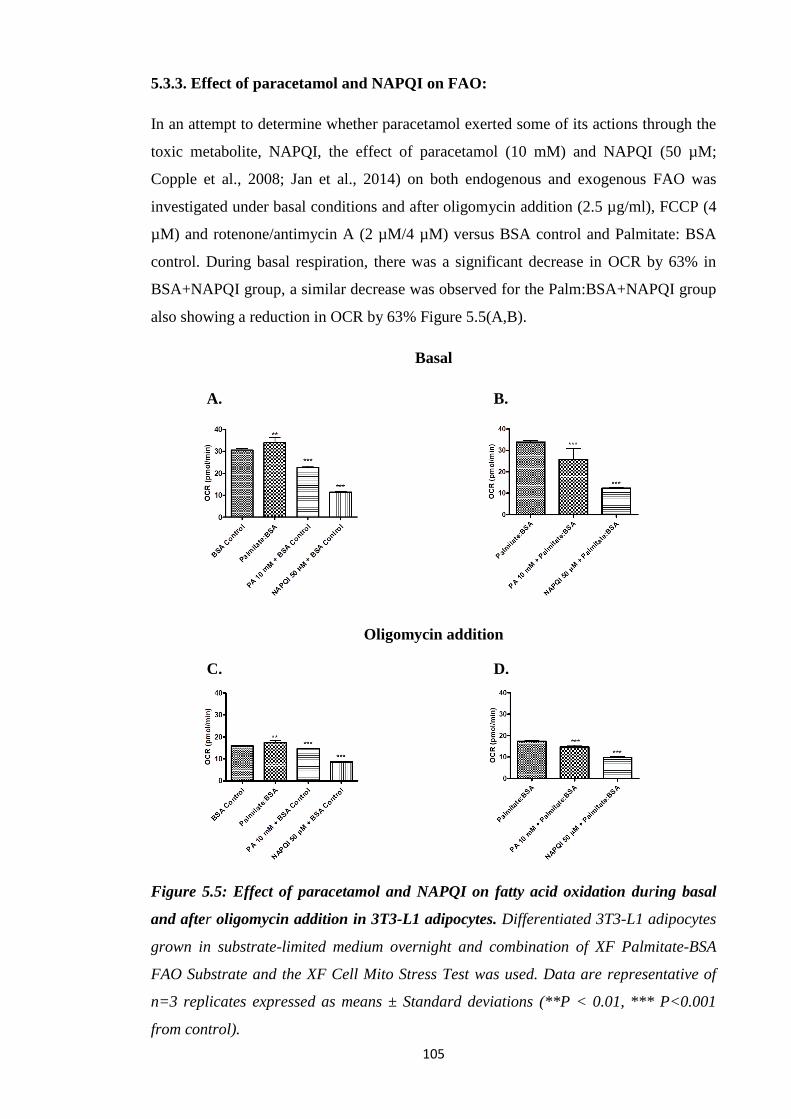
105
5.3.3. Effect of paracetamol and NAPQI on FAO:
In an attempt to determine whether paracetamol exerted some of its actions through the
toxic metabolite, NAPQI, the effect of paracetamol (10 mM) and NAPQI (50 µM;
Copple et al., 2008; Jan et al., 2014) on both endogenous and exogenous FAO was
investigated under basal conditions and after oligomycin addition (2.5 µg/ml), FCCP (4
µM) and rotenone/antimycin A (2 µM/4 µM) versus BSA control and Palmitate: BSA
control. During basal respiration, there was a significant decrease in OCR by 63% in
BSA+NAPQI group, a similar decrease was observed for the Palm:BSA+NAPQI group
also showing a reduction in OCR by 63% Figure 5.5(A,B).
Basal
A. B.
Oligomycin addition
C. D.
Figure 5.5: Effect of paracetamol and NAPQI on fatty acid oxidation during basal
and after oligomycin addition in 3T3-L1 adipocytes. Differentiated 3T3-L1 adipocytes
grown in substrate-limited medium overnight and combination of XF Palmitate-BSA
FAO Substrate and the XF Cell Mito Stress Test was used. Data are representative of
n=3 replicates expressed as means ± Standard deviations (**P < 0.01, *** P<0.001
from control).
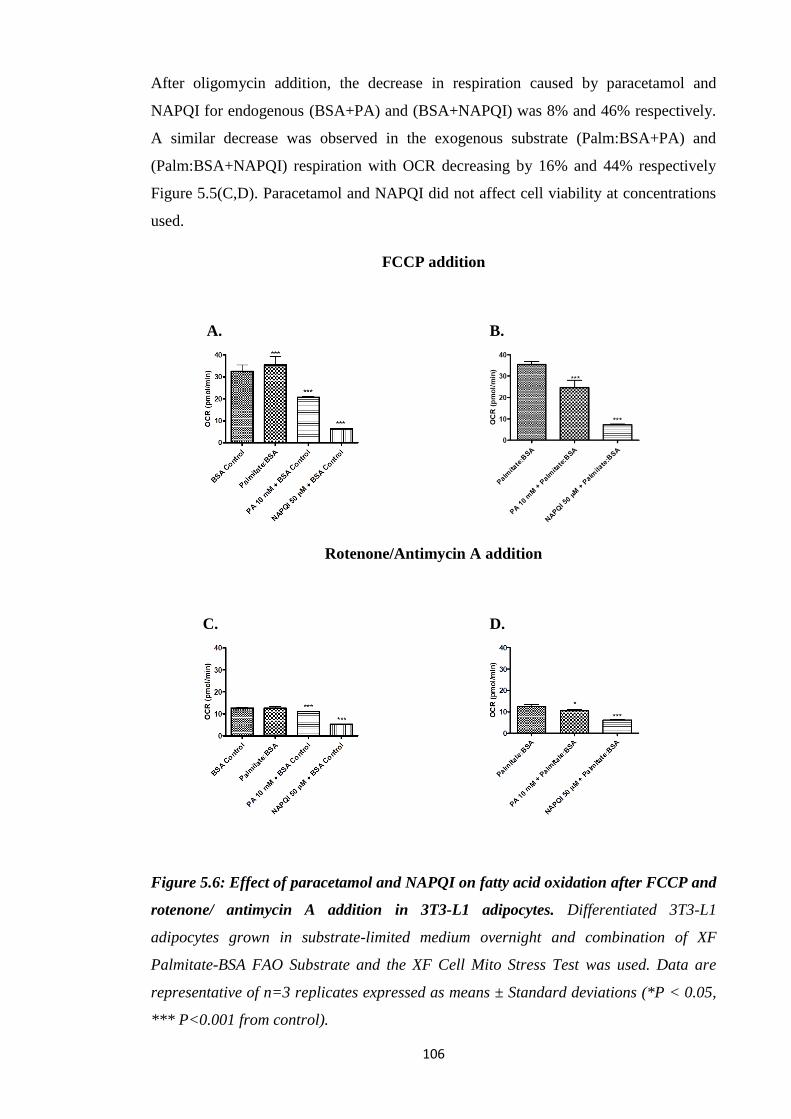
106
After oligomycin addition, the decrease in respiration caused by paracetamol and
NAPQI for endogenous (BSA+PA) and (BSA+NAPQI) was 8% and 46% respectively.
A similar decrease was observed in the exogenous substrate (Palm:BSA+PA) and
(Palm:BSA+NAPQI) respiration with OCR decreasing by 16% and 44% respectively
Figure 5.5(C,D). Paracetamol and NAPQI did not affect cell viability at concentrations
used.
FCCP addition
A. B.
Rotenone/Antimycin A addition
C. D.
Figure 5.6: Effect of paracetamol and NAPQI on fatty acid oxidation after FCCP and
rotenone/ antimycin A addition in 3T3-L1 adipocytes. Differentiated 3T3-L1
adipocytes grown in substrate-limited medium overnight and combination of XF
Palmitate-BSA FAO Substrate and the XF Cell Mito Stress Test was used. Data are
representative of n=3 replicates expressed as means ± Standard deviations (*P < 0.05,
*** P<0.001 from control).
107
Introduction of FCCP resulted in a significantly increased maximal respiration in the
Palm:BSA that was supported due to oxidizing exogenous fatty acids. As
Palm:BSA+PA and Palm:BSA+NAPQI has shown a reduction in OCR by 31% and
80% in Figure 5.6(A,B). BSA+PA and BSA+NAPQI group attenuated OCR by 30%
and 79%.
Finally, rotenone/antimycin A caused a further reduction in OCR by 12% and 58%
(BSA+PA and BSA+NAPQI) and 16% and 51% (Palm:BSA+PA and
Palm:BSA+NAPQI) in Figure 5.6(C,D) respectively.
5.3.4. Comparison of the effect of paracetamol and NAPQI on FAO:
The effect of paracetamol and NAPQI on both endogenous and exogenous fatty acid
oxidation was examined. At basal respiration, treatment with BSA+NAPQI reduced
OCR by 50% compared to BSA+PA and by 52% in the case of Palm:BSA+NAPQI
versus Palm: BSA+PA in Figure 5.7(A,B).
After oligomycin addition, the extent of inhibition of OCR was again significantly
greater in BSA+NAPQI (41%) as compared to BSA+PA as well as in
Palm:BSA+NAPQI (33%) versus Palm: BSA+PA in Figure 5.7(C,D). After FCCP
addition, the extent of inhibition of OCR was again significantly greater in
BSA+NAPQI (70%) as compared to BSA+PA and in Palm:BSA+NAPQI (71%) versus
Palm: BSA+PA in Figure 5.8(A,B).
Finally, after rotenone/antimycin A addition, BSA+NAPQI declined OCR by 53%
versus BSA+PA and by 41% in case of Palm:BSA+NAPQI up versus Palm: BSA+PA
in Figure 5.8(C,D).

108
Basal
A. B.
Oligomycin addition
C. D.
Figure 5.7: Comparison of the effect of paracetamol and NAPQI on fatty acid
oxidation during basal and after oligomycin addition in 3T3-L1 adipocytes.
Differentiated 3T3-L1 adipocytes grown in substrate-limited medium overnight and
combination of XF Palmitate-BSA FAO Substrate and the XF Cell Mito Stress Test was
used. Data are representative of n=3 replicates expressed as means ± Standard
deviations (*** P<0.001 from control).

109
FCCP addition
A. B.
Rotenone/Antimycin A addition
C. D.
Figure 5.8: Comparison of the effect of paracetamol and NAPQI on fatty acid
oxidation after FCCP and rotenone/ antimycin A addition in 3T3-L1 adipocytes.
Differentiated 3T3-L1 adipocytes grown in substrate-limited medium overnight and
combination of XF Palmitate-BSA FAO Substrate and the XF Cell Mito Stress Test was
used. Data are representative of n=3 replicates expressed as means ± Standard
deviations (*** P<0.001 from control).
110
5.3.5. Effect of paracetamol and NAPQI on individual parameters of
mitochondrial function using FAO assay:
In an attempt to investigate further the effect of paracetamol and NAPQI on fatty acid
oxidation, individual parameters of mitochondrial function were assessed as seen in
Figure 5.9 and 5.10. NAPQI at much lower concentrations is a more potent inhibitor of
basal respiration than paracetamol. NAPQI+BSA and NAPQI+Palmitate:BSA seemed
to have a huge impact on basal respiration declined by 64% and 65% whereas PA+BSA
also decreased basal OCR by 14% Figure 5.9(A). There was no effect on proton leak by
PA and NAPQI in Figure 5.9(B). Maximum respiratory rates were greatly attenuated by
NAPQI+BSA and NAPQI+Palmitate:BSA (93% and 94%) while PA+BSA caused a
43% decrease in Figure 5.9(C). NAPQI completely inhibited spare respiratory capacity
in Figure 5.9(D) and reduced non-mitochondrial respiration by 60% (NAPQI+BSA) and
48% (NAPQI+Palmitate:BSA) in Figure 5.10(A). PA+BSA, PA+Palmitate:BSA,
NAPQI+BSA and NAPQI+Palmitate:BSA abolished ATP production by 52%, 26%,
78% and 77% in Figure 5.10(B). PA+BSA decreased coupling efficiency by 19%
whereas NAPQI+BSA and NAPQI+Palmitate:BSA by 39% and 34% in Figure 5.10(C).
Finally, spare respiratory capacity represented in Figure 5.10(D) was significantly
reduced by NAPQI+BSA and NAPQI+Palmitate:BSA by 81% and 84%.
Basal respiration of 3T3-L1 adipocytes with BSA is 6 pmol O₂/min more versus
BSA+PA group and 10 pmol O₂/min more versus BSA+NAPQI indicating that a small
segment of the basal respiratory rate was a result to fatty acids oxidized from
endogenous source and/or remaining fatty acids in the BSA preparation. The
Palm:BSA+PA and Palm:BSA+NAPQI groups confirmed the significant increase in
maximum respiration in the Palm:BSA as a result of oxidation of exogenous fatty acids.
Maximum respiration of these cells with BSA is 7 pmol O₂/min more versus BSA+PA
group and 15 pmol O₂/min more versus BSA+NAPQI group demonstrating that a
segment of maximum respiration was supported due to endogenous oxidation of fatty
acids and/or presence of remaining fatty acids in the BSA preparation.

111
A. B.
C. D.
Figure 5.9: Effect of paracetamol and NAPQI on individual parameters of
mitochondrial function using FAO assay in 3T3-L1 adipocytes. Basal respiration,
proton leak, maximal respiration and spare respiratory capacity following the addition
of oligomycin, FCCP, and rotenone/antimycin A respectively. Data are representative
of n=3 replicates expressed as means ± Standard deviations (*P < 0.05, ** P<0.01
from control).

112
A. B.
C. D.
Figure 5.10: Effect of paracetamol and NAPQI on individual parameters of
mitochondrial function using FAO assay in 3T3-L1 adipocytes. Non-mitochondrial
respiration and ATP production following the addition of oligomycin, FCCP, and
rotenone/antimycin A respectively. Coupling efficiency and spare respiratory capacity
represented as %. Data are representative of n=3 replicates expressed as means ±
Standard deviations (*P < 0.05, ** P<0.01 from control).
113
5.4. Discussion
Increased lipolysis and the utilization of the released fatty acids is the main source of
substrates for thermogenesis in small mammals at temperatures below their
thermoneutral zone. The movement of long chain fatty acids inside mitochondria
through CPT1 on the outer membrane is the main controlling step for FAO. Blocking
the transport of fatty acids into the mitochondria should result in a decrease in the OCR
provided there is no compensatory increase in non-fatty acid substrates. The classical
fatty acid transport inhibitor is Eto, which binds irreversibly to the CPT1 transporter
preventing fatty acid uptake in the mitochondria and ultimately hinders the oxidation
process (Pike et al., 2011).
In terms of the potential impact of paracetamol on the capacity of cells to utilize fatty
acids liberated following lipolysis to support thermogenesis, OCR was assessed under
different conditions and with paracetamol and different mitochondrial stress compounds
(Figure 5.1-5.2). The results confirm that paracetamol was effective at inhibiting OCR
in the presence and absence of palmitate suggesting the compound is capable of
attenuating of both exogenous FAO and OCR driven by other substrates, including
endogenous fatty acids. This conclusion was confirmed by the lack of inhibition of FAO
in cells treated with Eto in the absence of palmitate. The greater inhibition of OCR in
the presence of paracetamol compared to Eto suggest paracetamol may also be directly
inhibiting FAO not just uptake. The observation also confirm that paracetamol is
affecting other mitochondrial processes such as delivering substrates to complex I/II or
the ETC directly. The decrease in OCR in the presence of paracetamol may also
indicate the compound does not uncouple the mitochondria.
To further probe the impact of paracetamol on exogenous FAO and the impact on other
key mitochondrial parameters, other stress molecules were employed (Figure 5.3-5.4).
The use of oligomycin allowed the determination of proton leak. The results confirmed
that paracetamol had little effect on proton leak; further confirmed the lack of
uncoupling by paracetamol. The use of oligomycin confirms paracetamol had a far great
inhibitory effect on ATP production compared to Eto. The reduction of basal ATP
production by 50% confirming a significant direct impact on the mitochondrial ETC.
Although paracetamol was able to attenuate exogenous FAO, it was less effective then
Eto as measured by the inhibition of maximal capacity. Paradoxically in the presence of
the uncoupling agent FCCP, paracetamol appears to not as effective at inhibiting OCR

114
possibly due to the fact that uncoupling by FCCP may reduce the impact of paracetamol
on other aspects of the ETC.
Paracetamol induced toxicity is mediated by initial step of metabolising via cytochrome
P450 system to highly reactive metabolite NAPQI. At low doses of paracetamol, any
NAPQI produced is efficiently detoxified by GSH but at high paracetamol
concentrations the NAPQI produced depletes the GSH (Mitchell et al., 1973a, 1973b)
and this results in covalent binding to cellular proteins to form 3-(cystein-S-yl)-
paracetamol adducts (Cohen et al., 1997) and oxygen/nitrogen stress occurs (Reid et al.,
2005; Burke et al., 2010). NAPQI may also covalently bind to mitochondrial proteins
(Jeaschke and Bajt, 2006). In addition to the reduced or loss of mitochondrial function,
cellular toxicity is considered to result from mitochondrial dysfunction (Burke et al.,
2010). In cellular models, NAPQI (400 μM) caused both GSH reduction and GSH
conjugation of the quinone imine, leading to depletion of the mitochondrial ATP
content (> 80% depletion after 1 minute exposure). NAPQI is much more potent than
the parent drug, inhibiting ADP-stimulated respiration of liver mitochondria (Ramsay et
al., 1989).
Given the high levels of paracetamol in studies where hypothermia is observed, it is
likely that some NAPQI would be generated in the mitochondria of animals given
paracetamol specially at doses above 100 mg/kg. In this study the concentration of
NAPQI selected appeared to have no impact on cell viability. However at micromolar
concentrations, NAPQI had a significant impact on OCR and FAO a clear indication
that once generated NAPQI could attenuate heat generation (Figure 5.5-5.6). NAPQI
proved to be a far more potent inhibitor of OCR than paracetamol at significantly lower
concentrations suggesting a broad spectrum of targets on the membrane and within the
mitochondria (Figure 5.7-5.8). If replicated in vivo this would suggest that once cellular
protective mechanisms were overwhelmed which is likely at concentrations reported to
cause hypothermia only a small amount of NAPQI would be needed to inhibit cellular
respiration leading to hypothermia.
These results also confirm that even at non toxicity concentrations NAPQI will cause
mitochondrial dysfunction including inhibition of FAO. Unlike the parent compound
NAPQI appeared to partly uncouple mitochondria; however this was complicated by the
fact that NAPQI was such a potent inhibitor of the mitochondrial processes.
Interestingly there was no evidence of increased proton leak suggesting no uncoupling
making data interpretation difficult. As with paracetamol the impact of NAPQI on other

115
key mitochondrial parameters was also investigated using stress molecules (Figure 5.9-
5.10). Because NAPQI had such a devastating effect on all the OCR it is difficult to
evaluate the impact on any of the parameters except to say even small amounts of
NAPQI could be devastating for mitochondrial energy generation. The impact of
NAPQI far exceeded that of paracetamol. The inhibition of fatty acid uptake and
oxidation by either paracetamol or NAPQI may explain the accumulation of long chain
acylcarnitines and FFAs in the serum of paracetamol treated WT mice (Chen et al.,
2009).
The direct inhibition of both exogenous and endogenous fatty acid uptake and oxidation
by paracetamol and the metabolite NAPQI has never been reported in adipocytes.
These novel observations add to the possible target of paracetamol and related
compound which cause hypothermia and antipyresis. The observation also provides an
alternative explanation as to why despite their weak inhibition of COX enzymes these
compounds are such potent antipyretic.
Having established that paracetamol and NAPQI both reduce the ability of cells to take
up and utilise fatty acids as substrates for energy production the final step is to assess
the direct impact of these compound on mitochondrial ETC.

116
Chapter 6: Effect of Paracetamol, Aminopyrine and Antipyrine on cellular and
mitochondrial oxygen consumption
6.1. Introduction
The release of catecholamines (norepinephrine) is a key peripheral response of small
mammals to cold stress. The release of norepinephrine is known to stimulate not only
lipolysis in adipocytes but also leads to the release and oxidation of fatty acids and other
reducing cofactors which drive mitochondrial metabolism and heat generation.
Mitochondria are essential in the process of heat production where reduced cofactors
such as NADH, succinate, and fatty acids are converted in the mitochondria directly to
heat (uncoupling), or indirectly through the production of ATP. Regardless of the
mechanism, heat generation is always closely linked to the OCR and can be measured
as an index of the efficiency of mitochondrial and cellular respiration. Compounds
which can be shown to disrupt or inhibit mitochondrial function are therefore potential
hypothermic agents.
The disruption of mitochondrial function can occur at different stages, from attenuating
substrate supply to the mitochondria to direct inhibition of any of the five complexes in
the ETC. Several mechanisms could be involved in drug-induced OXPHOS impairment
(Begriche et al., 2011). Alternatively uncoupling agents may compromise mitochondrial
membrane integrity. Where substrate oxidation is maintained, ATP synthesis can be
hindered leading to direct heat production from the uncoupled mitochondria, provided
there is a constant supply of reduced substrates and ATP. It has been shown that some
NASIDs can affect mitochondrial function. Drugs such as nimesulide (Berson et al.,
2006, 1996), salicylic acid and ibuprofen possess a mild uncoupling effect (Fromenty et
al., 1995; Tokumitsu et al., 1977). Compounds such as diclofenac cause OXPHOS
uncoupling which is associated with more harmful impact on MPTP opening leading to
cell injury (Lim et al., 2006). OXPHOS uncoupling can also occur through blocking of
the ETC activity leading to the loss of substrate oxidation such as observed with
salicylic acid (Deschamps et al., 1994; Doi and Horie, 2010). There is also a long list of
classical inhibitors of the different complexes of the ETC without any prior OXPHOS
uncoupling (Begriche et al., 2011). The classical inhibitors can be used to investigate
where disruption is taking place (Begriche et al., 2011). Using specific complex
inhibitors such as rotenone and amytal which block transfer of electrons at Complex I,
117
Malonate which blocks Complex II, Antimycin A interferes with electron flow from
Complex III and cyanide (CN-) which blocks complex IV. There are also specific
inhibitors such as atractyloside for the ATP-ADP translocase (complex V).
When assessing how potential hypothermic agents affect mitochondrial function, the
OCR of cells and isolated mitochondria can be assessed using the Agilent Seahorse XF
Cell Mito Stress Test.
In an attempt to establish if the hypothermia caused by compounds such as paracetamol,
antipyrine and aminopyrine in rodents could be linked to impairment of mitochondria
function in cells associated with heat generation, studies were undertaken with
adipocytes and isolated mitochondria. Adipocytes play a key role in rodent
thermoregulation, both in direct thermogenesis and the supply of free fatty acids for
mitochondrial oxidation. Differentiated 3T3-L1 adipocytes stimulated with
catecholamines are an ideal model to study the impact of paracetamol and other
compounds on OCR and ultimately hypothermia. Similarly isolated mitochondria are an
ideal model to directly determinate the potential mitochondrial site of action of
compound which impact on mitochondrial bioenergetics and heat production (Rogers et
al., 2011). Electron flow assays allow the sequential electron flow through different
ETC complexes to be examined in an attempt to identify the specific site of action of
the test compounds on mitochondrial function.
6.2. Methods
6.2.1. Mitochondrial bioenergetic profile of 3T3-L1 adipocytes was determined using
Agilent Seahorse XF Mito Stress Test as described in sections 2.4.15 and 2.4.16.2.
6.2.2. The effect of paracetamol and other antipyretic agents on basal and catecholamine
stimulated OCR was determined as described in section 2.4.15 and 2.4.16.3-2.4.16.4.
6.2.3. The effect of classical mitochondrial ETC inhibitors, paracetamol and other
antipyretic agents on isolated rat liver mitochondrial OCR was determined using the
Agilent Seahorse Electron Flow Assay as described in section 2.4.16.5. The results were
analysed with analysis of variance (ANOVA), followed by Dunnett's Multiple
Comparison Test. A *P < 0.05, ** P<0.01, from control was considered statistically
significant.
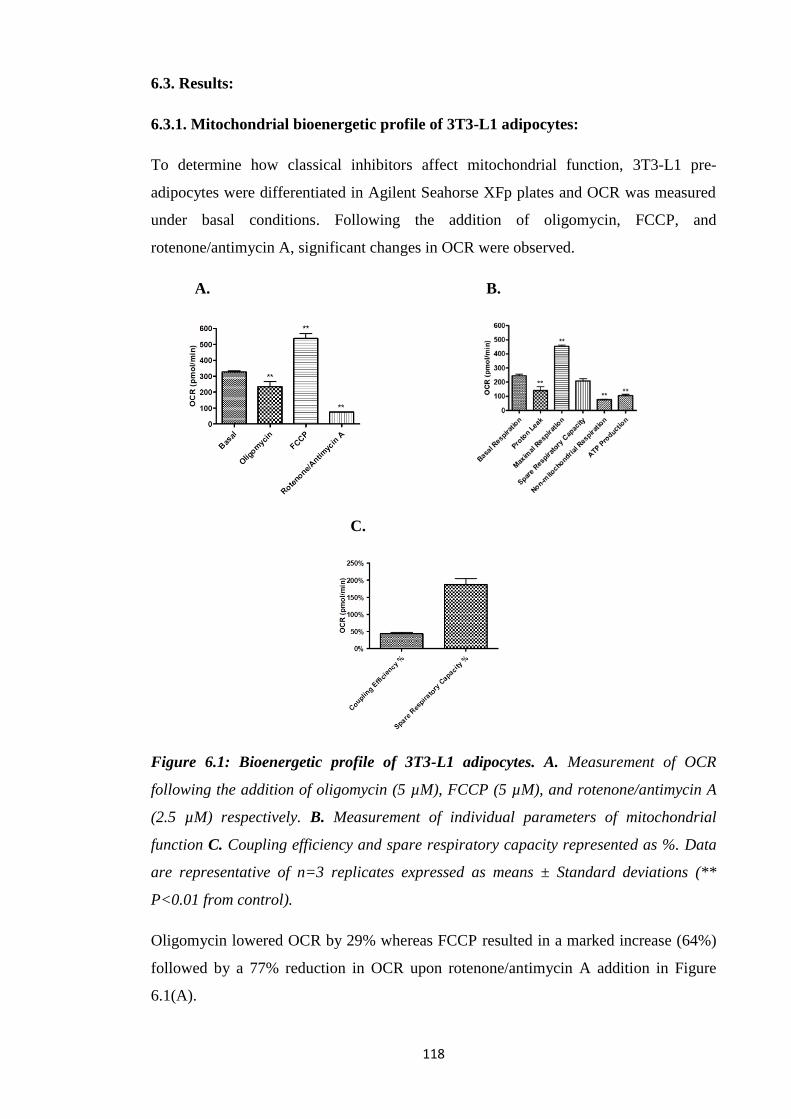
118
6.3. Results:
6.3.1. Mitochondrial bioenergetic profile of 3T3-L1 adipocytes:
To determine how classical inhibitors affect mitochondrial function, 3T3-L1 pre-
adipocytes were differentiated in Agilent Seahorse XFp plates and OCR was measured
under basal conditions. Following the addition of oligomycin, FCCP, and
rotenone/antimycin A, significant changes in OCR were observed.
A. B.
C.
Figure 6.1: Bioenergetic profile of 3T3-L1 adipocytes. A. Measurement of OCR
following the addition of oligomycin (5 µM), FCCP (5 µM), and rotenone/antimycin A
(2.5 µM) respectively. B. Measurement of individual parameters of mitochondrial
function C. Coupling efficiency and spare respiratory capacity represented as %. Data
are representative of n=3 replicates expressed as means ± Standard deviations (**
P<0.01 from control).
Oligomycin lowered OCR by 29% whereas FCCP resulted in a marked increase (64%)
followed by a 77% reduction in OCR upon rotenone/antimycin A addition in Figure
6.1(A).
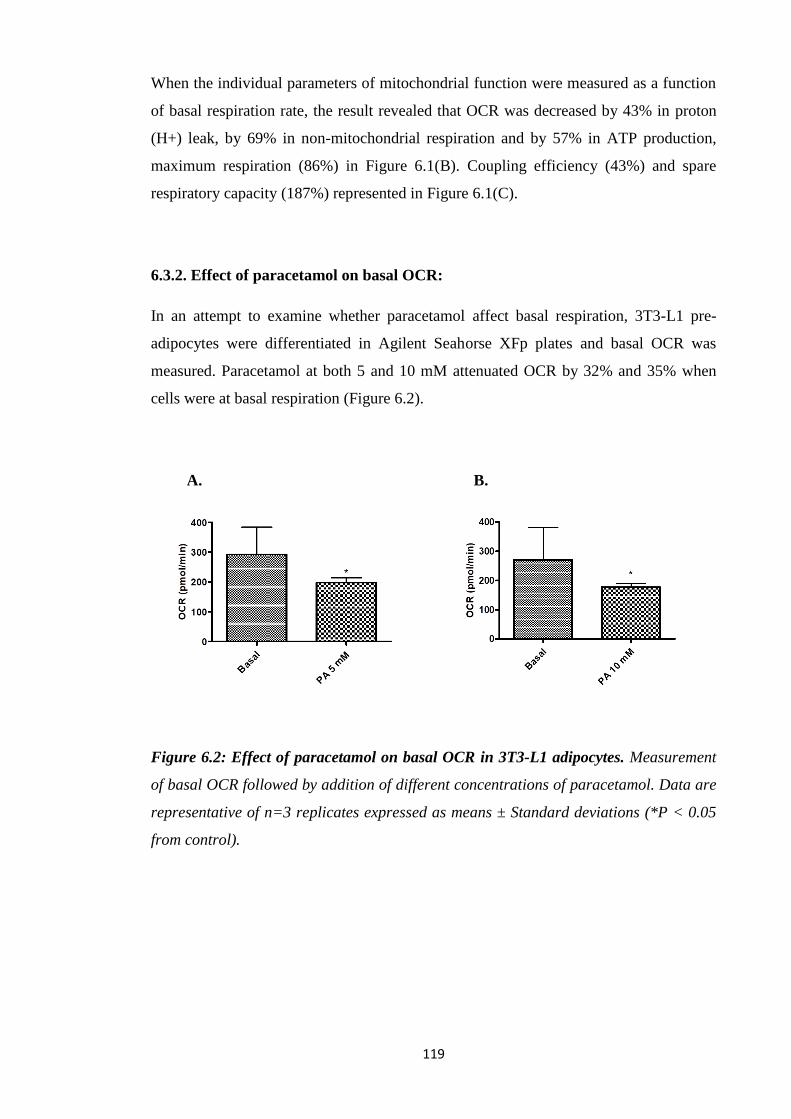
119
When the individual parameters of mitochondrial function were measured as a function
of basal respiration rate, the result revealed that OCR was decreased by 43% in proton
(H+) leak, by 69% in non-mitochondrial respiration and by 57% in ATP production,
maximum respiration (86%) in Figure 6.1(B). Coupling efficiency (43%) and spare
respiratory capacity (187%) represented in Figure 6.1(C).
6.3.2. Effect of paracetamol on basal OCR:
In an attempt to examine whether paracetamol affect basal respiration, 3T3-L1 pre-
adipocytes were differentiated in Agilent Seahorse XFp plates and basal OCR was
measured. Paracetamol at both 5 and 10 mM attenuated OCR by 32% and 35% when
cells were at basal respiration (Figure 6.2).
A. B.
Figure 6.2: Effect of paracetamol on basal OCR in 3T3-L1 adipocytes. Measurement
of basal OCR followed by addition of different concentrations of paracetamol. Data are
representative of n=3 replicates expressed as means ± Standard deviations (*P < 0.05
from control).
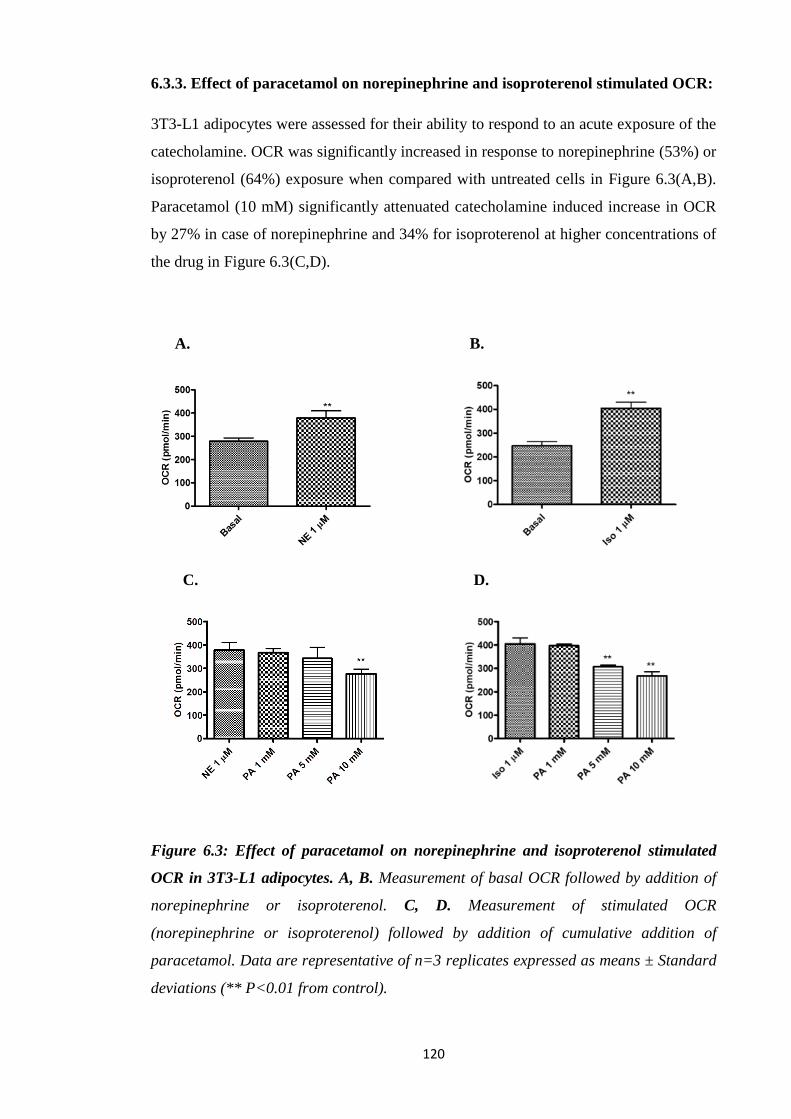
120
6.3.3. Effect of paracetamol on norepinephrine and isoproterenol stimulated OCR:
3T3-L1 adipocytes were assessed for their ability to respond to an acute exposure of the
catecholamine. OCR was significantly increased in response to norepinephrine (53%) or
isoproterenol (64%) exposure when compared with untreated cells in Figure 6.3(A,B).
Paracetamol (10 mM) significantly attenuated catecholamine induced increase in OCR
by 27% in case of norepinephrine and 34% for isoproterenol at higher concentrations of
the drug in Figure 6.3(C,D).
A. B.
C. D.
Figure 6.3: Effect of paracetamol on norepinephrine and isoproterenol stimulated
OCR in 3T3-L1 adipocytes. A, B. Measurement of basal OCR followed by addition of
norepinephrine or isoproterenol. C, D. Measurement of stimulated OCR
(norepinephrine or isoproterenol) followed by addition of cumulative addition of
paracetamol. Data are representative of n=3 replicates expressed as means ± Standard
deviations (** P<0.01 from control).

121
6.3.4. Effect of paracetamol, aminopyrine and antipyrine on basal OCR:
In an alternative model, 3T3-L1 cells were differentiated in 24-well plates and then
seeded in Agilent Seahorse XFp plates. After basal OCR measurements, all three
compounds; paracetamol, aminopyrine and antipyrine were tested. In case of
paracetamol at 1 mM, 5 mM, 10 mM and 20 mM, OCR was significantly lowered by
12%, 42%, 61% and 73% respectively in Figure 6.4(A). Similarly, aminopyrine both at
5 mM and 10 mM attenuated OCR by 13% and 27% respectively Figure 6.4(B). Finally,
antipyrine treated cells at 1 mM, 5 mM and 10 mM showed a marked decrease in OCR
of 9%, 24% and 36% respectively Figure 6.4(C).
A. B.
C.
Figure 6.4: Effect of paracetamol, aminopyrine and antipyrine on basal OCR in 3T3-
L1 adipocytes. Measurement of basal OCR followed by cumulative addition of
paracetamol (A) or aminopyrine (B) or antipyrine (C). Data are representative of n=3
replicates expressed as means ± Standard deviations (*P < 0.05, ** P<0.01 from
control).

122
6.3.5. Effect of paracetamol, aminopyrine and antipyrine on isoproterenol
stimulated OCR:
When cells were treated with isoproterenol (0.01-10 µM), there was no increase in OCR
most probably due to trypsin treatment of these cells in Figure 6.5(A). Paracetamol
reduced the OCR of 3T3-L1 cells by 39% and 54% at 5 mM and 10 mM respectively,
addition of isoproterenol failed to reverse the OCR level to basal levels in Figure 6.5
(B,C).
A.
B. C.
Figure 6.5: Effect of paracetamol on isoproterenol stimulated OCR in 3T3-L1
adipocytes. Measurement of basal OCR followed by addition of different concentrations
of isoproterenol (A). Measurement of basal OCR, followed by cumulative addition of
paracetamol and then isoproterenol added (B,C). Data are representative of n=3
replicates expressed as means ± Standard deviations (*P < 0.05, ** P<0.01 from
control).
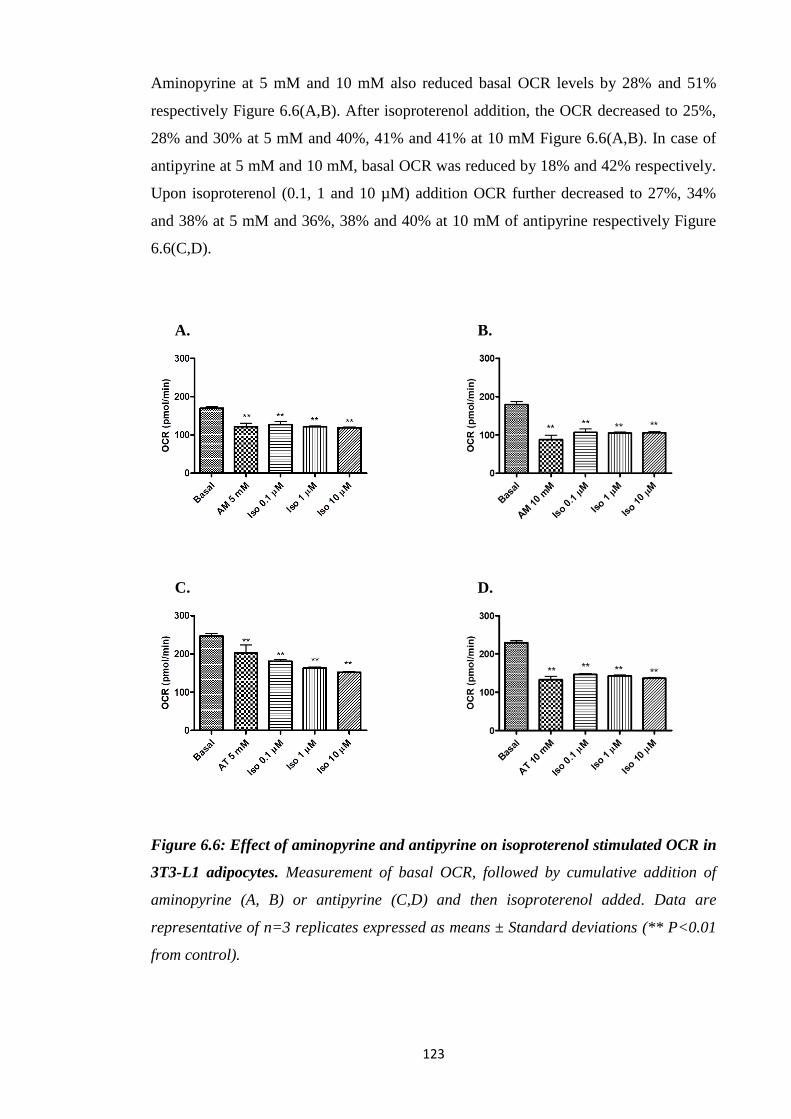
123
Aminopyrine at 5 mM and 10 mM also reduced basal OCR levels by 28% and 51%
respectively Figure 6.6(A,B). After isoproterenol addition, the OCR decreased to 25%,
28% and 30% at 5 mM and 40%, 41% and 41% at 10 mM Figure 6.6(A,B). In case of
antipyrine at 5 mM and 10 mM, basal OCR was reduced by 18% and 42% respectively.
Upon isoproterenol (0.1, 1 and 10 µM) addition OCR further decreased to 27%, 34%
and 38% at 5 mM and 36%, 38% and 40% at 10 mM of antipyrine respectively Figure
6.6(C,D).
A. B.
C. D.
Figure 6.6: Effect of aminopyrine and antipyrine on isoproterenol stimulated OCR in
3T3-L1 adipocytes. Measurement of basal OCR, followed by cumulative addition of
aminopyrine (A, B) or antipyrine (C,D) and then isoproterenol added. Data are
representative of n=3 replicates expressed as means ± Standard deviations (** P<0.01
from control).
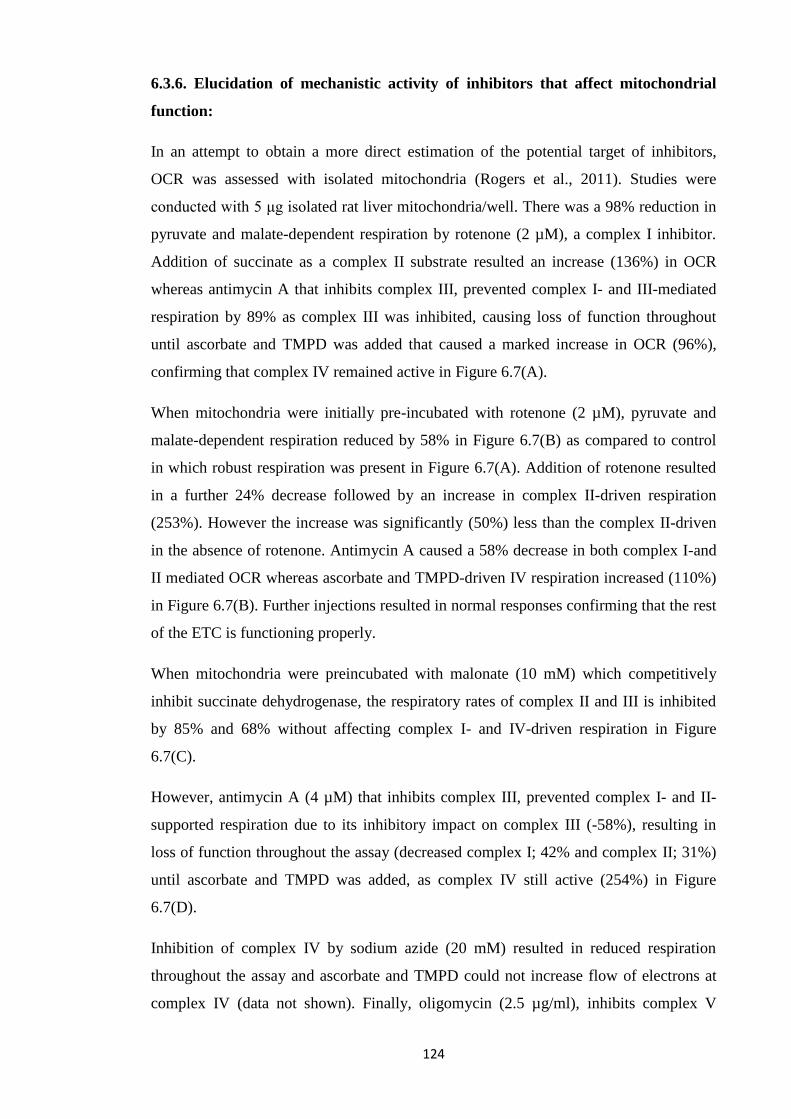
124
6.3.6. Elucidation of mechanistic activity of inhibitors that affect mitochondrial
function:
In an attempt to obtain a more direct estimation of the potential target of inhibitors,
OCR was assessed with isolated mitochondria (Rogers et al., 2011). Studies were
conducted with 5 μg isolated rat liver mitochondria/well. There was a 98% reduction in
pyruvate and malate-dependent respiration by rotenone (2 µM), a complex I inhibitor.
Addition of succinate as a complex II substrate resulted an increase (136%) in OCR
whereas antimycin A that inhibits complex III, prevented complex I- and III-mediated
respiration by 89% as complex III was inhibited, causing loss of function throughout
until ascorbate and TMPD was added that caused a marked increase in OCR (96%),
confirming that complex IV remained active in Figure 6.7(A).
When mitochondria were initially pre-incubated with rotenone (2 µM), pyruvate and
malate-dependent respiration reduced by 58% in Figure 6.7(B) as compared to control
in which robust respiration was present in Figure 6.7(A). Addition of rotenone resulted
in a further 24% decrease followed by an increase in complex II-driven respiration
(253%). However the increase was significantly (50%) less than the complex II-driven
in the absence of rotenone. Antimycin A caused a 58% decrease in both complex I-and
II mediated OCR whereas ascorbate and TMPD-driven IV respiration increased (110%)
in Figure 6.7(B). Further injections resulted in normal responses confirming that the rest
of the ETC is functioning properly.
When mitochondria were preincubated with malonate (10 mM) which competitively
inhibit succinate dehydrogenase, the respiratory rates of complex II and III is inhibited
by 85% and 68% without affecting complex I- and IV-driven respiration in Figure
6.7(C).
However, antimycin A (4 µM) that inhibits complex III, prevented complex I- and II-
supported respiration due to its inhibitory impact on complex III (-58%), resulting in
loss of function throughout the assay (decreased complex I; 42% and complex II; 31%)
until ascorbate and TMPD was added, as complex IV still active (254%) in Figure
6.7(D).
Inhibition of complex IV by sodium azide (20 mM) resulted in reduced respiration
throughout the assay and ascorbate and TMPD could not increase flow of electrons at
complex IV (data not shown). Finally, oligomycin (2.5 µg/ml), inhibits complex V

125
prevented only ATP formation; however it had no effect on the ADP-stimulated rate,
only 53% decrease in complex-IV mediated OCR in Figure 6.7(E).
A.
B. C.
D. E.
Figure 6.7: Elucidation of mechanistic activity of inhibitors that affect mitochondrial
function (5 µg mitochondria). Electron flow experiments were performed as described
in Methods. Initial conditions are as follows: A. Control (no additives), B. 2 µM
rotenone, C. 10 mM malonate, D. 4 µM antimycin-A and E. 2.5 µg/mL oligomycin.
Data are representative of n=3 replicates expressed as means ± Standard deviations.
(*P < 0.05, ** P<0.01 from control).
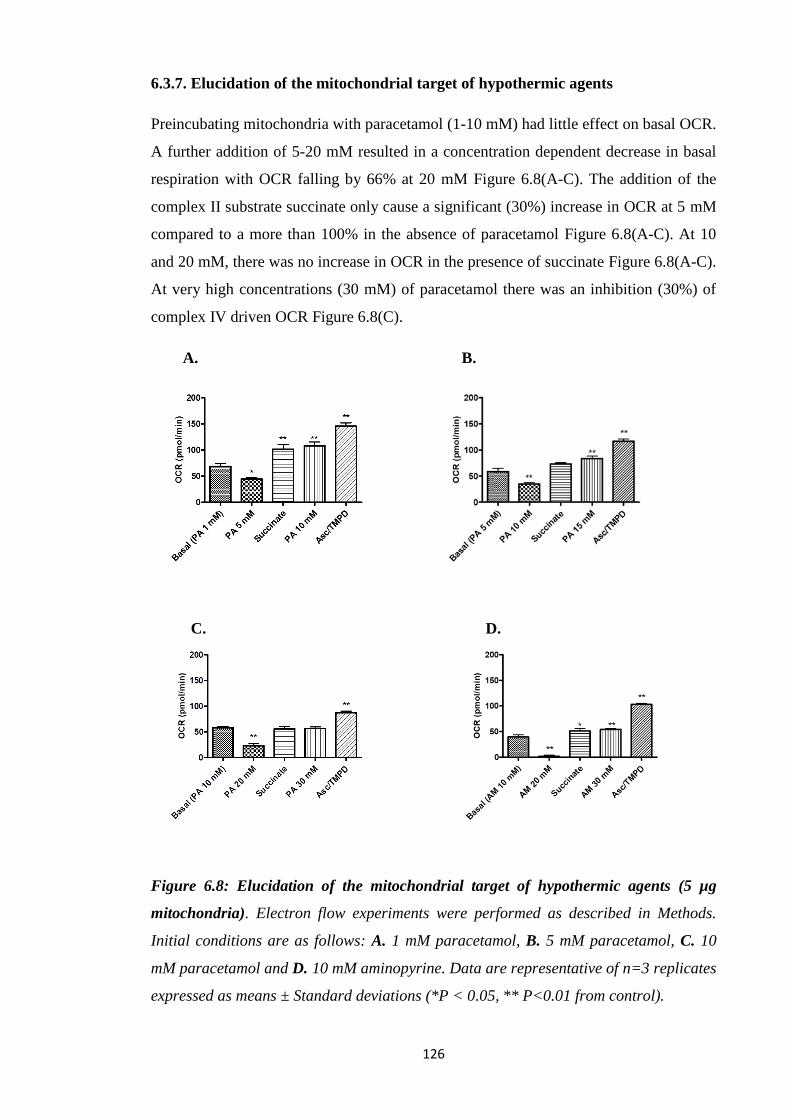
126
6.3.7. Elucidation of the mitochondrial target of hypothermic agents
Preincubating mitochondria with paracetamol (1-10 mM) had little effect on basal OCR.
A further addition of 5-20 mM resulted in a concentration dependent decrease in basal
respiration with OCR falling by 66% at 20 mM Figure 6.8(A-C). The addition of the
complex II substrate succinate only cause a significant (30%) increase in OCR at 5 mM
compared to a more than 100% in the absence of paracetamol Figure 6.8(A-C). At 10
and 20 mM, there was no increase in OCR in the presence of succinate Figure 6.8(A-C).
At very high concentrations (30 mM) of paracetamol there was an inhibition (30%) of
complex IV driven OCR Figure 6.8(C).
A. B.
C. D.
Figure 6.8: Elucidation of the mitochondrial target of hypothermic agents (5 µg
mitochondria). Electron flow experiments were performed as described in Methods.
Initial conditions are as follows: A. 1 mM paracetamol, B. 5 mM paracetamol, C. 10
mM paracetamol and D. 10 mM aminopyrine. Data are representative of n=3 replicates
expressed as means ± Standard deviations (*P < 0.05, ** P<0.01 from control).

127
Paracetamol (5 mM) caused a significant reduction in complex I activity by 36% and
induced a significantly reduced (29%) response to complex II stimulation by succinate
(48%) in Figure 6.8(A). Respiratory rates for complex III and complex IV were 58%
and 113% after cumulative addition of paracetamol (10 mM) in Figure 6.8(A).
Addition of paracetamol (10 mM) resulted in 40% and 49% decrease in complex-I and
II mediated respiration (125%) whereas further addition of paracetamol (15 mM)
followed by complex III (43%) and complex IV (100%) in Figure 6.8(B).
Moreover, this compound appeared to have a greater impact as the concentration of
paracetamol (20 mM) increased, markedly reducing complex I and II-driven respiration
by 60% and 61% with compromised complex II (96%) and III (98%) and IV (151%)
OCR at 30 mM of this drug in Figure 6.8(C).
Furthermore, aminopyrine (20 mM) attenuated complex I and II-mediated respiration by
96% and 64%. Respiratory rates of succinate were completely inhibited and
ascorbate/TMPD OCR was unaffected with OCR increasing to 62% of basal level
Figure 6.8(D).
6.3.8. Elucidation of the mechanistic activity of hypothermic agents
In an attempt to further elucidate the inhibitory effects of test compounds and the impact
of the concentration of mitochondria, studies were carried out in the presence of 2.5 μg
isolated rat liver mitochondria. In control group in Figure 6.9(A), there was a 93%
reduction in pyruvate and malate-dependent respiration by rotenone (2 µM), followed
by an increase in OCR (69%) when succinate was added. Antimycin A prevented
complex I- and III-mediated respiration by 91% as it inhibited complex III, causing loss
of function throughout until ascorbate and TMPD was added that caused a marked
increase in OCR (84%), indicating that complex IV remained active. For malonate (10
mM), the respiratory rates of complex II and III is inhibited by 73% and 58%. No effect
on complex I- and IV-driven respiration (98%) mediated by complex IV in Figure
6.9(B).
Paracetamol (10 mM) caused a significant reduction in complex I activity by 55% at the
start of the assay versus control and induced a further reduced complex I activity by
57% (20 mM). Paracetamol significantly reduced (62%) response to complex II
stimulation by succinate (41%). Respiratory rates for complex III and complex IV were
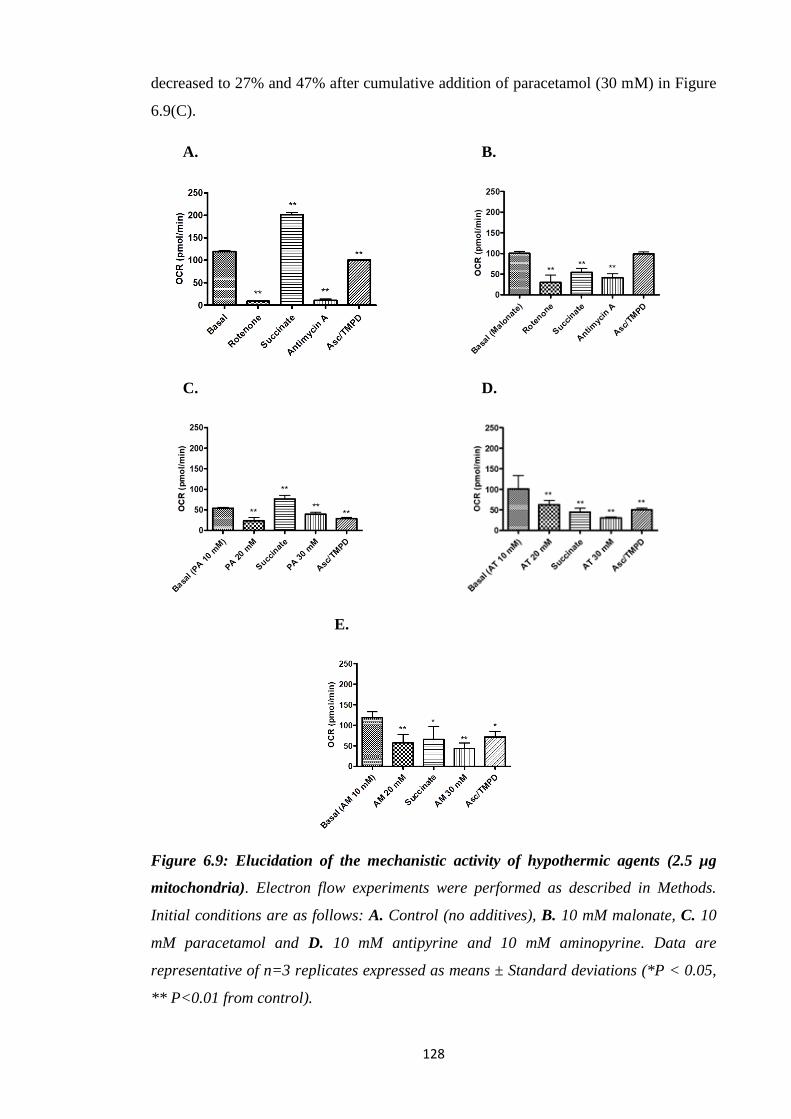
128
decreased to 27% and 47% after cumulative addition of paracetamol (30 mM) in Figure
6.9(C).
A. B.
C. D.
E.
Figure 6.9: Elucidation of the mechanistic activity of hypothermic agents (2.5 µg
mitochondria). Electron flow experiments were performed as described in Methods.
Initial conditions are as follows: A. Control (no additives), B. 10 mM malonate, C. 10
mM paracetamol and D. 10 mM antipyrine and 10 mM aminopyrine. Data are
representative of n=3 replicates expressed as means ± Standard deviations (*P < 0.05,
** P<0.01 from control).
129
In antipyrine treated mitochondria there was a 15% and 38% decrease in complex-I
respiration at 10 mM and 20 mM whereas 78% reduction in case of II mediated
respiration (45%). whereas further addition of antipyrine (30 mM) abolished respiratory
rates of complex III and complex IV by 70% and 51% in Figure 6.9(D).
Furthermore, aminopyrine (10 mM) attenuated complex I activity by 12% whereas
further addition of this drug resulted in 46% decrease at 20 mM. Complex II-mediated
respiration was inhibited by 73% with compromised activity (48%). Respiratory rates of
complex III and ascorbate and TMPD were lowered by 59% and 32% in Figure 6.9(E).

130
6.4. Discussion
In energy metabolism, the mitochondrial ETC plays a central role. Under normal
conditions electrons flow through the complexes I–IV with the pumping out of protons
and reducing oxygen to form water, the proton energy from the gradient drives ATP
production (Bratic and Trifunovic, 2010). Under some conditions, the re-entering of
protons into mitochondrial matrix without associated ATP synthesis can occur resulting
in heat generation (Bratic and Trifunovic, 2010). Thus, uncoupling leads to a low ATP
production with higher electron transfer and cellular respiration requiring a constant
supply of substrates, cofactors and oxygen which is not sustainable (Cannon et al.,
2006). Mammals have evolved mechanisms to deal with cold stress including
adrenergic stimulation of lipolysis. Fatty acids derived from lipolysis increase the UCP1
H+ permeability, and the energy derived from the gradient, normally used for ATP
synthesis, is converted into heat, although this requires substrates to be generated and
supplied to the mitochondria. Drug induced mitochondrial dysfunction can affect
OXPHOS (Chan et al., 2005). Loss of mitochondria function following toxic doses of
paracetamol has been observed in rodent studies dating back to 1970s (Mitchell et al.,
1973a, 1973b).
By using the electron flow assay and the specific complex inhibitors, electron flow
through different ETC complexes was examined in an attempt of a more direct
estimation of the possible target of agents that affect mitochondrial bioenergetics.
Paracetamol (5-30 mM) caused a significant reduction in complex I-IV activities and
depressed the ETC components (Figure 6.8-6.9). Furthermore, aminopyrine (20 mM)
attenuated complex I and II-mediated respiration. The observation confirms that
compounds which caused in vivo hypothermia are potent inhibitors of mitochondrial
function as expressed by OCR. Complex I was most sensitive to paracetamol; however
the compound appeared to be effective against all four complexes. This implies that
paracetamol may be disrupting electron transport generally in the mitochondria.
Antipyrine also affected all complexes but with greatest inhibition of this drug was at
complex-II mediated respiration. A similar pattern was observed for aminopyrine
(Figure 6.8-6.9). This is the first study where the effects of paracetamol, aminopyrine
and antipyrine have demonstrated inhibition of specific mitochondrial function in both
3T3-L1 adipocytes and isolated mitochondria. Additionally these studies have never
been carried out using the Agilent Seahorse XF technology.
131
In vitro and in vivo studies have confirmed the effect of high concentrations of this drug
leading to mitochondrial inhibition affecting membrane potential (Nazareth et al.,
1991), ATP concentration (Martin and McLean, 1995), and slowed the rate of electron
moving from complex I to complex III in isolated kidney mitochondria (Porter and
Dawson, 1979). Paracetamol (up to 10 mM) resulted in inhibition of glucose synthesis
from glutamine or lactate and decreased ATP level, coupled and uncoupled respiration
but not succinate mediated respiration (Porter and Dawson, 1979). Furthermore,
inhibition of state 3 respiration by paracetamol reflects some interference with the ETC
in mitochondria but did not uncouple oxidative phosphorylation in rat kidney and liver
(Mingatto et al., 1996; Somasundaram et al., 1997). In vitro, paracetamol inhibited both
state 3 and 4 respiration and respiratory control ratio (RCR), in a concentration-
dependent manner with glutamate but not succinate as substrate, differing with results
obtained following in vivo exposure to mice and may result from a direct insult of the
parent compound (Meyers et al., 1988).
The impact on mitochondria is not limited to paracetamol but to other drugs with
antipyretic properties. NSAIDs including aspirin, diclofenac sodium, mefenamic acid,
and piroxicam both uncoupled and inhibited OXPHOS in mitochondria with
glutamate/malate or with succinate substrate, while dipyrone only uncoupled and
paracetamol only inhibited it (Somasundaram et al., 1997). The pattern of inhibition of
these compounds was different to paracetamol, but similar to that expressed by the
respiratory chain inhibitors in that the drugs inhibited respiration stimulated by both
ADP (state 3) and the protonophoric uncoupler CCCP. In the former case, drug-
imposed inhibition of state 3 was not released by the CCCP. Paracetamol showed a
pattern similar to that expressed by the FoF1-ATPase (oligomycin) and ADP/ATP
carrier (atractyloside) inhibitors; that of drug-imposed inhibition of state 3 respiration
was released by the uncoupler. Dipyrone only stimulated the state 4 respiration
(Mingatto et al., 1996). Indomethacin, aspirin, naproxen, and piroxicam stimulate
mitochondrial respiration (uncouple OXPHOS) of isolated rat liver mitochondria in
micromolar concentrations whereas paracetamol did not. However, both paracetamol
and NSAIDs at higher concentrations inhibited respiration in coupled mitochondria.
Indomethacin, naproxen, aspirin, and paracetamol inhibit both glutamate/malate and
succinate (with rotenone) stimulated respiration in uncoupled mitochondria. All the
drugs inhibited electron transfer in complex I, and complexes II plus III, in a
concentration dependent manner (data not shown in the article) (Somasundaram et al.,
1997). In vitro respiratory data showed that NSAIDs are inhibitory uncouplers, i.e. they

132
uncouple at low and inhibit respiration at higher concentrations (Somasundaram et al.,
2000).
The concentration of paracetamol and other compounds used in these in vitro studies
relate to the concentrations of paracetamol that have been shown to cause hypothermia
and toxicity in vivo (Orbach et al., 2017; Rivera et al., 2017; Ahmed et al., 2011; Allen
et al., 2005; Khetani and Bhatia 2008; Kikkawa et al., 2006; Messner et al., 2013;
Nastevska et al., 1999; Shen et al., 2007; Toh et al., 2009).
300 mg/kg is a dose that has been shown to cause significant hypothermia in mice and
is a highly toxic dose for mice (Evdokimov et al., 2015). Paracetamol has shown to
decrease MnSOD activity at 100, 200, and 300 mg/kg in mice suggesting this enzyme’s
inactivation as an early effect of paracetamol induced damage again confirming that
doses which cause hypothermia is linked to mitochondria toxicity (Agarwal et al.,
2010).
Despite the widespread observation of the negative impact of paracetamol and related
compounds on various aspects of mitochondrial function this is the first time that these
observations have been linked to hypothermia or antipyresis. Regardless of the extent of
inhibition in vivo, under cold stress conditions only a minor attenuation of energy
production is required to cause hypothermia in small mammals in temperatures below
their thermoneutral zone.
133
Chapter 7: Final discussion and future work
The antipyretic properties of paracetamol have always been one of the main reasons for
its widespread use, particularly to treat children with fever. The general consensus is
that during fever paracetamol inhibits central COX-2 activity which has been
upregulated. However, it has always been accepted that once activated centrally,
increased temperature associated with fever is generated peripherally. This mode of
antipyresis linked to paracetamol is thought to be similar to other COX-2 inhibitors used
as antipyretics. However, researchers have always struggled to reconcile the potent
antipyretic properties of paracetamol with the relatively weak inhibition of COX
activity when compared to NSAIDs (Chandrasekharan et al., 2002).
The situation is complicated by the fact that for some time it has been observed that in
non-febrile small mammals the administration of relatively high levels of paracetamol
(>100 mg/kg) results in a concentration dependent fall of several degrees in Tc within
30 minutes of exposure. After a few hours, the animals usually recover to normal Tb
confirming that the impact on Tb is transient. A fundamental flaw in most of these
studies is the failure to assess the extent and long term toxicity impact during the
hypothermic event or after. However, in other in vivo studies where hypothermia is not
the focus but where similar paracetamol concentrations are used, it is widely
documented that there are varying but clear signs of toxicity in mice and rats exposed to
paracetamol at concentrations greater than 100 mg/kg from 1-24 hours after
administration. Given the generally accepted view that the antipyresis of paracetamol is
due to inhibiting COX-2 and the fact that COX-2 is not normally expressed in non-
febrile animals, an alternative explanation is necessary to explain the hypothermic
properties of paracetamol in non-febrile animals.
Over the last 20 years one of the most strongly asserted although very contentious
explanations proposed in animals where this phenomenon is observed, is that
paracetamol inhibits a novel variant (COX-3) of the COX-1 enzyme. Activation of the
enzyme is thought to be necessary for animals to maintain normal Tb under cold stress.
It was proposed that COX-3 would act like COX-2 during fever where the enzyme is a
key mediator of increased thermogenesis during cold stress, so specific inhibition of
COX-3 (by paracetamol) would result in hypothermia. However, there remained
questions not only about the existence but also the functionality of such protein in a
range of species for which paracetamol was known to cause hypothermia.

134
To address the working hypothesis that paracetamol induced hypothermia in rodents is
due to the inhibition of a novel COX-1 variant protein (COX-3) expressed in brain
endothelial cells, a number of questions had to be addressed. Most fundamental was
about the existence and functionality of the COX-3 protein. If the protein did not exist
or could not be linked to paracetamol induced hypothermia, the alternative question
would then be what effect does paracetamol have on the peripheral thermogenic
pathways downstream of PGE₂ in small mammals housed at temperatures several
degrees below their thermoneutral zone. Given the know effects of paracetamol on
mitochondrial function, studies were focused on the impact on lipolysis and
mitochondrial energy generation pathways which are essential for heat generation
(Table 7.1).
Table 7.1: Key findings of current research
Chapters Research answers
Is there a COX-3?
(chapter 3)
COX-3 mRNA and protein was not identified in mice
b.End3 cells and brain homogenates.
Impact on lipolysis?
(chapter 4)
Paracetamol, aminopyrine and antipyrine inhibits
lipolysis in mice 3T3-L1 adipocytes and rat primary
brown adipocytes.
Impact on FAO?
(chapter 5)
Paracetamol and NAPQI inhibit FAO in mice 3T3-L1
adipocytes.
Impact on mitochondrial
respiration?
(chapter 6)
Paracetamol, aminopyrine and antipyrine inhibits
mitochondrial respiration in mice 3T3-L1 adipocytes.
These compounds also inhibit ETC activity in
isolated rat liver mitochondria.
The search for COX-3
The first physical evidence of a COX-3 protein was provided by Chandrasekharan et al.
in 2002. They expressed and isolated a canine COX-3 protein in insect cells which was
then compared to the activity of murine COX-1 and COX-2. What they failed to address
was that paracetamol was far from the most potent drug in the study with the IC₅₀ for
COX-3 for paracetamol significantly greater than the NSAIDs. It would then follow that
if COX-3 was responsible for temperature regulation in rodents then NSAIDs would

135
also cause hypothermia in non-febrile animals even if the NSAIDs did not accumulate
in the brain at concentrations comparable to paracetamol. The concern was underpinned
at a theoretical level by the molecular biology which ruled out the transcription of a
viable mRNA. At the practical level, there was paucity of COX-3 protein reported in the
literature.
In the present study the main challenge was to confirm the existence of protein with a
view of further characterisation. Mouse endothelial cell line was selected as the brain
endothelial cells were proposed having the highest levels of expression. Similarly, tissue
homogenates particularly brain from animals housed at around 22°C should also reveal
any expressed COX-3 protein if COX-3 was acting as a regulator of Tc in these animals
as proposed. The failure in this study to find any evidence for the expression of the
protein in the endothelial cell line and tissue homogenate could be seen as surprising
given the previous in vivo and in vitro reports. However, a closer look at the literature
on studies related to the COX-3 protein in mammalian cells or tissue reveals that only
very few studies reported actual COX-3 protein. By contrast, most studies reported
COX-3 at mRNA level and this was not established in this study. In this context, the
explanation of results of this and previous studies makes a search to find and
characterise the COX-3 protein less relevant as almost all reported versions of the COX-
3 protein where it has been tested suggest it is non- functional.
The failure to find any COX-3 protein curtailed any experiments to biochemically
characterise the protein. However, an examination of the key Chandrasekaran et al.,
2002 study will reveal that although the COX-3 was more sensitive to paracetamol and
other putative COX-3 inhibitors than COX-1 or COX-2 the protein produced was even
more sensitive to several NSAIDs and a different order of magnitude suggesting these
NSAIDs should also cause hypothermia. However, no such experimentation has been
published to counter or support this idea.
The search for possible paracetamol targets: inhibition of lipolysis
In the absence of a COX-3 protein and a credible explanation for the previously widely
reported COX-3 mRNA observed in several animals. Studies were then undertaken to
provide possible explanations as to how paracetamol could cause hypothermia in non-
febrile mice and other small mammals. It is known that the peripheral pathways for
thermogenesis start with the release of NE from neurons which innervate brown
136
adipocytes or from epinephrine released into the general circulation in response to cold
stress. These act on receptors on the brown adipocytes to trigger lipolysis, this is
thought to play two key roles in thermogenesis. Brown fat mitochondria are uniquely
designed for non-shivering thermogenesis with a high expression of UCP1 which
reduces mitochondrial coupling efficiency causing more energy to be diverted directly
to heat production. The second role is in the liberation of increased levels of FFAs into
the general circulation which is then used to increase general metabolic rate again
driving increased oxygen consumption and heat generation.
Numerous hormones and drugs can lead to lipolysis through different pathways
(Lafontan and Langin, 2009). The major lipolysis signalling pathway starts with the
binding of endogenous or synthetic catecholamines to β-adrenergic receptors on
adipocytes. This leads to activation of AC, catalysing the conversion of ATP to cAMP.
This secondary messenger activates HSL, which hydrolyzes triglycerides to produce
FFAs and glycerol. All the components highlighted above in lipolysis signalling
pathway are potential targets for paracetamol or similar drugs. Elevation of the
concentration of NE in the plasma of animals under cold stress confirms the importance
of this pathway. It can be assumed that in animals functioning at temperatures several
degrees below their thermoneutral zone, even a small reduction in the supply of
substrates (FFAs) as seen in this study could have an adverse effect on
thermoregulation. In this study, paracetamol was shown to reduce both direct
catecholamine stimulated and non-stimulated lipolysis in brown adipocytes and 3T3-L1
cells. This novel observation if repeated in vivo would impact on the ability of small
mammals to maintain sufficient substrate supply and consequently to maintain Tc at
37°C when housed at temperatures several degrees below their thermoneutral zone.
Given the complex signally pathways involved in lipolysis, from binding to the
adrenergic receptor to the release of FFAs, an important objective was to gain an insight
into where in the pathway paracetamol and related drugs may be acting. The use of AC
activator Forskolin or the cAMP analogs, 8-Br-cAMP confirm the paracetamol
inhibition is further downstream of the receptor and secondary messengers and more
likely to affect the lipolysis from HSL. The exact target for HSL inhibition is a matter
for further investigation.
137
The search for possible paracetamol targets: inhibition of fatty acid uptake and β-
oxidation
The novel observation that paracetamol and other hypothermic agents may inhibit
lipolysis in vitro points to one possible explanation of paracetamol induced
hypothermia. However, there are other potential targets in the thermogenesis pathway
that must be explored. In particular the β-oxidation of fatty acids liberated from
lipolysis is an essential substrate to drive non-shivering thermogenesis. Before β-
oxidation, fatty acids must enter the mitochondria which involved a complex inner
mitochondrial membrane shuttle. Paracetamol could either affect the activity of the
shuttle, the β-oxidation process or both.
Many compounds inhibit fatty acids β-oxidation with toxic consequences for example
the hepatotoxicity induced by aspirin and hypoglycin has been linked to fatty acids β-
oxidation. Recently the inhibition of β-oxidation has been implicated in paracetamol-
induced hepatotoxicity with the associated disruption of lipid metabolism. In particular
the increase in microvesicular steatosis and increase of TGs and FFAs has been linked
to disruption of mitochondrial function (Cohen et al., 1998; Buttar et al., 1976). Other
studies have shown that paracetamol or its metabolites can negatively affect fatty acid
β-oxidation in the liver with increased levels of long-chain acylcarnitines the principal
precursors of β-oxidation in the serum following exposure (Sandor et al., 1990).
The present study shows that paracetamol inhibits both exogenously added fatty acids
and endogenous oxidation. It is likely that during cold stress or even during fever
adipocytes will release fatty acids into the general circulation to increase metabolic rate.
However, cells can only metabolise fatty acids if the substrate can freely enter the
mitochondria. Unlike the classical inhibitor of fatty acid oxidation Eto which blocks
fatty acid entry into the mitochondria and therefore indirectly blocks oxidation,
paracetamol appears to have a wider effect. The data shows paracetamol inhibits
oxidation even when the source of the substrate is endogenous. Although many
compounds have been shown to inhibit oxidation of fatty acids this is the first time that
this has been so clearly demonstrated by paracetamol. Further this is the first time the
inhibition of FAO was proposed to be a contributory factor in the hypothermia induced
by paracetamol and related compounds in small mammals.
138
The search for possible paracetamol targets: inhibition of mitochondrial electron
transport chain
In chapters 4 and 5 the focus was on highlighting newly discovered knowledge around
the impact of paracetamol on lipolysis in adipocytes and on FAO in the mitochondria.
In chapter 6, the starting point is that paracetamol has been widely shown to alter or
inhibit mitochondrial function both in vitro and in vivo. In C57BL/6 mice paracetamol
(150 mg/kg) produces reversible MPTP linked mitochondrial dysfunction without
causing ALT release whereas at 300 mg/kg it causes irreversible mitochondrial
dysfunction, ALT release and necrosis (Hu et al., 2016). Mitochondrial dysfunction
was also observed in paracetamol overdose patients where the release of biomarkers for
mitochondrial damage such as mitochondrial DNA (mtDNA), glutamate dehydrogenase
(GDH) and the indirect mitochondrial damage biomarker nuclear DNA fragments
(nDNA) could be measured in plasma (McGill et al., 2012). In vitro, paracetamol (up to
10 mM) has been shown to cause a reversible and concentration based inhibition of
mitochondrial respiration in isolated rat kidney. Experiments with submitochondrial
particles revealed that the drug did not influence the activity of NADH dehydrogenase
but slowed the rate at which electrons were transferred from reduced NADH
dehydrogenase.
The main findings in chapter 6 is that paracetamol has been shown to affect numerous
mitochondrial functions including disrupting the delivery of substrates or electrons to
complex I, II and IV, therefore oxygen consumption is disrupted. There was less
evidence of uncoupling by paracetamol which can be associated with permanent
damage to the mitochondrial membrane. Similarly the relatively low level of reversible
toxicity observed as demonstrated by the attenuation of ETC activity, may explain why
paracetamol is such an effective therapeutic compound. At therapeutic doses, the mild
and reversible “toxic” effects may in fact be part of its mechanism of action at least in
terms of reducing temperature.
In vivo studies of hypothermia all involve animals housed at temperatures which are
several degrees below the animal’s thermoneutral zone. These are undertaken on the
false basis that small mammals used in laboratory experiments have the same
thermoneutral zone as humans. The reality however for most experiments is that such
animals are under continued cold stress and their thermogenic systems are required to
work at elevated levels. Under such circumstances even a small attenuation of
mitochondrial function is likely to have an exaggerated effect on Tb as have been
139
reported in this study. A similar hypothermia phenomenon has recently been observed
in human volunteers exposed to cold stress when given paracetamol (Foster et al.,
2016). The study revealed a slight but significant decrease in body temperature at
relatively low doses of paracetamol (20 mg/kg) when the volunteers were subject to
cold stress for a relatively short period of time. By contrast, most laboratory animals
housed around 22°C are continually under cold stress, making them susceptible to
relatively minor attenuations of thermogenesis process. By contrast, dramatic
temperature changes have been reported in animals exposed to high probably toxic
concentrations of paracetamol. Given the subtle temperature changes brought about by
the low non-toxic doses of paracetamol in human studies, there is a need to assess
temperature changes in non-febrile animals at lower concentrations of paracetamol.
These changes are likely to be subtle requiring more sophisticated monitoring to detect.
These mitochondrial changes may also partly explain the antipyretic effects of
paracetamol where animals and humans are under other forms of temperature stress.
During fever there is a greater demand for metabolic energy to increase Tb; this
involves activating the same mechanisms which are activated during cold stress in
laboratory animals, so it is reasonable to assume that paracetamol would have a similar
attenuating effect on Tc during fever. If correct, this novel interpretation of well-
established observations could lead not only to a better understanding of how
paracetamol and many other antipyretic drugs work, but could provide the impetuous
for designing new drugs to treat pyresis regardless of the cause. Other potential uses
could be for inducing hypothermia for medical reasons such as during surgery.
Another novel finding from the data in Chapter 6 is the sheer potency of the
paracetamol metabolite NAPQI. Although it is widely accepted that the metabolite is
only generated in minute quantities the impact could be far greater than the parent
compound on mitochondrial function. Mitochondrial dysfunction and toxicity is
observed at significantly much lower concentrations when compared with paracetamol
and other compounds. Further the metabolite is far less discriminating, both in the
extent of damage to mitochondria but to the targets. There is clear evidence of extensive
damage to the ETC function. In addition there is clear evidence of uncoupling which
was not seen with the parent compound suggesting the damage is more severe and
likely to be permanent. What can be assumed that at therapeutic doses very little
NAPQI is generated although this has to be fully investigated particularly in adipocytes
where little is understood about the metabolism of paracetamol and NSAIDs.
140
Conclusion and future direction
This study was initiated to answer key questions about the mechanisms underlying
paracetamol induced hypothermia in non-febrile animals. With a working hypothesis
that “paracetamol induced hypothermia in rodents is due to the inhibition of a novel
COX-1 variant protein expressed in brain endothelial cells”. When the putative COX-3
protein could not been found, the focus then changed to possible targets of paracetamol
downstream of the central generation of PGs. The data revealed numerous potential
targets for paracetamol and similar drugs including lipolysis, fatty acid uptake, FAO
and most of the complexes of the ETC. The study revealed both new knowledge and
new understanding about how paracetamol could work. The linking of the energy
demands for pyresis (fever) to the maintenance of Tc when animals are housed several
degrees below their thermoneutral zone provides new opportunities for research.
141
List of Abstracts:
Oral Communications:
1. British Pharmacology Society Annual Meeting Dec 2017. S.Bashir and
W.Morgan. Inhibition of thermogenic pathways: a new target for paracetamol?
Queen Elizabeth II Conference Centre, London, England, U.K.
2. Postgraduate Annual Meeting Mar 2017. University of East London, Stratford,
London, England, U.K.
3. Postgraduate Annual Meeting Feb 2016. University of East London, Stratford,
London, England, U.K.
4. Postgraduate Annual Meeting Oct 2014. University of East London, Stratford,
London, England, U.K.
Poster Communications:
1. Abstract accepted for poster presentation at Mitochondria: form and function.
British Pharmacology Society Meeting Sept 2017. S.Bashir, S.Ayoub and
W.Morgan. Mitochondrial oxygen consumption: a new target for paracetamol?
Mary Ward House, Conference and Exhibition Centre, London, England, U.K.
2. Abstract accepted for poster presentation at British Toxicology Annual Congress
Apr 2017. S.Bashir, S.Ayoub and W.Morgan. The effect of paracetamol on
lipolysis in adipocytes. Hilton Liverpool City Centre, Liverpool, England, U.K.
3. Abstract accepted for poster presentation at Drug Metabolism Group Meeting, Feb
2017. S.Bashir, S.Ayoub and W.Morgan. The effect of paracetamol on lipolysis in
adipocytes. Imperial College London, South Kensington Campus, London,
England, U.K.
4. Abstract accepted for poster presentation at British Pharmacology Society Annual
Meeting Dec 2016. S.Bashir, B. Elegunde and W.Morgan. Antipyresis and the
inhibition of mitochondrial function. Queen Elizabeth II Conference Centre,
London, England, U.K.
142
References
Abdel-aleem S.A., Abdel-hamid M. Simmons D.L., Donaldson L.F. (2009).
Distribution of Cyclooxygenase-3 (Cox-3) in Rat Nervous System. Med. J.
77(3), 245-250.
Agarwal R., MacMillan-Crow L.A., Rafferty T.M., Saba H., Roberts D.W., Fifer
E.K., James L.P., Hinson J.A. (2011). Acetaminophen-induced hepatotoxicity in
mice occurs with inhibition of activity and nitration of mitochondrial manganese
superoxide dismutase. J Pharmacol Exp Ther. 337, 110–6.
Agilent Technologies (2017). Agilent Seahorse XF Cell Mito Stress Test Kit
Available at: https://www.agilent.com/cs/library/usermanuals/public/ XF_Cell_
Mito Stress_Test_Kit User_Guide.pdf [Accessed 2 August 2017].
Agilent Technologies (2017). Agilent Seahorse XF Palmitate-BSA FAO
Substrate Quickstart Guide Available at: https://www.agilent.com/cs/library/
usermanuals/public/XF_Palmitate_BSA_Substrate_Quickstart_Guide.pdf
[Accessed 2 August 2017].
Agilent Technologies (2017). Analyzing Microgram Quantities of Isolated
Mitochondria in the Agilent Seahorse XFe/XF96 Analyzer
https://www.agilent.com/cs/library/applications/5991-7144EN.pdf [Accessed 2
August 2017].
Agilent Technologies (2017). How to Hydrate an Agilent Seahorse XFp Sensor
Cartridge Available at: https://www.agilent.com/cs/library/ usermanuals/public/
Hydrating%20an%20XFp%20Sensor%20Cartridge.pdf [Accessed 2 August
2017].
Agilent Technologies (2017). Loading the Agilent Seahorse XFp Sensor
Cartridge Injection Ports Available at: https://www.agilent.com/cs/library/
usermanuals/public/Loading%20Cartridge%20XFp.pdf [Accessed 2 August
2017].
Agilent Technologies (2017). Preparation of XF assay media Available at:
https://www.agilent.com/cs/library/usermanuals/public/Media%20Prep%20XFp.
pdf [Accessed 2 August 2017].
Agilent Technologies (2017). Report Generator User Guide XF Cell Mito Stress
Test Kit Available at: https://www.agilent.com/ cs/library/usermanuals/public/
Report_Generator_User_Guide_Seahorse_XF_Cell_Mito_Stress_Test_Single_F
ile.pdf [Accessed 2 August 2017].
Agilent Technologies (2017). Seeding Adherent Cells in Agilent Seahorse XFp
Cell Culture Miniplates Available at: https://www.agilent.com/cs/library/
143
usermanuals/public/Seeding%20Adherent%20Cells%20in%20XFp%20Cell%20
Culture%20Miniplates.pdf [Accessed 2 August 2017].
Agilent Technologies (2017). Simultaneously Measuring Oxidation of
Exogenous and Endogenous Fatty Acids using the XF Palmitate-BSA FAO
Substrate with the XF Cell Mito Stress Test Available at:
https://www.agilent.com/cs/pubimages/misc/XF_FAO_Assay_Technical_Brief.
pdf [Accessed 2 August 2017].
Agilent Technologies (2017). Washing Adherent Cells in Agilent Seahorse XFp
Cell Culture Miniplates Available at: https://www.agilent.com/cs/library
/usermanuals/public/Washing%20Cells%20XFp.pdf [Accessed 2 August 2017].
Ahangar N., Esam Z., Bekhradnia A., Ebrahimzadeh M.A. (2016). Hypothermic
activity of acetaminophen; involvement of GABAA receptor, theoretical and
experimental studies. Iran J Basic Med Sci.19(5), 470–475.
Ahmed M.M., Wang T., Luo Y., Ye S., Wu Q., Guo Z., Roebuck B.D., Sutter
T.R., Yang J.Y. (2011). Aldo-keto reductase-7A protects liver cells and tissues
from acetaminophen-induced oxidative stress and hepatotoxicity. Hepatology.
54,1322-1332.
Ali A.T., Hochfeld W.E., Myburgh R., Pepper M.S. (2013). Adipocyte and
adipogenesis. European Journal of Cell Biology. 92, 229–236.
Allen J.W., Khetani S.R., Bhatia S.N. (2005). In vitro zonation and toxicity in a
hepatocyte bioreactor. Toxicol. Sci. 84, 110-119.
Anderson B.J. Paracetamol (Acetaminophen): mechanisms of action. (2008).
Paediatr Anaesth. 18(10), 915-21.
Ara K., Ahmad K. (1980). Uptake of paracetamol into brain and liver of rats.
Bangladesh Med Res Counc Bull. 6, 39–44.
Ayoub S. S., Pryce G., Seed M. P., Bolton C., Flower R. J., Baker D. (2011).
Paracetamol-induced hypothermia is independent of cannabinoids and transient
receptor potential vanilloid-1 and is not mediated by AM404. Drug Metab.
Dispos. 39, 1689–1695.
Ayoub S.S., Botting R.M., Goorha S., Colville-Nash P.R., Willoughby D.A.,
Ballou L.R. (2004). Acetaminophen-induced hypothermia in mice is mediated
by a prostaglandin endoperoxide synthase 1 gene-derived protein. Proc Natl
Acad Sci U S A. 101(30), 11165-9.
144
Ayoub S.S., Colville-Nash P.R., Willoughby D.A., Botting R.M. (2006). The
involvement of a cyclooxygenase 1 gene-derived protein in the antinociceptive
action of paracetamol in mice. Eur J Pharmacol. 538(1-3), 57-65.
Bajt M.L., Ramachandran A., Yan H.M., Lebofsky M., Farhood A., Lemasters
J.J., Jaeschke H. (2011). Apoptosis-inducing factor modulates mitochondrial
oxidant stress in acetaminophen hepatotoxicity. Toxicol Sci.122(2), 598-605.
Begriche K., Massart J., Robin M.A., Borgne-Sanchez A., Fromenty B. (2011).
Drug-induced toxicity on mitochondria and lipid metabolism: mechanistic
diversity and deleterious consequences for the liver. J Hepatol. 54(4), 773-94.
Berenbaum F. (2004). COX-3: fact or fancy? Joint Bone Spine. 71(6), 451-3.
Berg J.M., Tymoczko J.L., Stryer L. (2002). Section 18.6 The Regulation of
Cellular Respiration Is Governed Primarily by the Need for ATP. Biochemistry.
5th edition. New York: W H Freeman.
Berson A., Cazanave S., Descatoire V., Tinel M., Grodet A.,Wolf C., Feldmann
G., Pessayre D. (2006). The anti-inflammatory drug, nimesulide (4-nitro-2-
phenoxymethane-sulfoanilide), uncouples mitochondria and induces
mitochondrial permeability transition in human hepatoma cells: protection by
albumin. J Pharmacol Exp Ther. 318, 444-454.
Berson A., Renault S., Lettéron P., Robin M.A., Fromenty B., Fau D., Le Bot
M.A., Riché C., Durand-Schneider A.M., Feldmann G., Pessayre D. (1996).
Uncoupling of rat and human mitochondria: a possible explanation for tacrine-
induced liver dysfunction. Gastroenterology, 110, 1878-1890.
Bicego K.C., Barros R.C., Branco L.G. (2007). Physiology of temperature
regulation: comparative aspects. Comp Biochem Physiol A Mol Integr Physiol.
147(3), 616-639.
Biovision. (2017). Available at: https://www.biovision.com/documentation/data
sheets/K580.pdf [Accessed 2 Aug. 2017].
Blüher M., Patti M.E., Gesta S., Kahn B.B., Kahn C.R. (2004). Intrinsic het-
erogeneity in adipose tissue of fat-specific insulin receptorknock-out mice is
associated with differences in patterns ofgene expression. J Biol Chem. 279,
31891-901.
Botting R., Ayoub S.S. (2005). COX-3 and the mechanism of action of
paracetamol/acetaminophen. Prostaglandins Leukot Essent Fatty Acids.
72(2):85-7.
145
Botting R.M. (2000). Mechanism of action of acetaminophen: is there a
cyclooxygenase 3? Clin Infect Dis. 5, S202-10.
Botting R.M. (2004). Antipyretic therapy. Front Biosci. 9, 956-66.
Boulant J.A. (2000). Role of the preoptic-anterior hypothalamus in
thermoregulation and fever. Clin Infect Dis. 31 Suppl 5, S157-161.
Bozza P.T., Payne J.L., Morham S.G., Langenbach R., Smithies O., Weller P.F.
(1996). Leukocyte lipid body formation and eicosanoid generation:
cyclooxygenase independent inhibition by aspirin. Proc Natl Acad Sci USA. 93,
11091-11096.
Bradford M.M. (1976). A rapid and sensitive method for the quantitation of
microgram quantities of protein utilizing the principle of protein-dye binding.
Anal Biochem. 72:248-54.
Bratic I., Trifunovic A. (2010). Mitochondrial energy metabolism and ageing.
Biochim Biophys Acta. 1797(6-7), 961-7.
Briyal S., Gulati A. (2010). Endothelin-A receptor antagonist BQ123 potentiates
acetaminophen induced hypothermia and reduces infarction following focal
cerebral ischemia in rats. Eur J Pharmacol. 644(1-3), 73-9.
Brodie B.B., Axelrod J. (1948). The fate of acetanilide in man. J Pharmacol Exp
Ther. 94, 29–38.
Bronnikov G.E., Zhang S-J., Cannon B., Nedergaard J. (1999). A dual
component analysis explains the distinctive kinetics of cAMP accumulation in
brown adipocytes. J Biol Chem. 274, 37770–80.
Burke A.S., MacMillan-Crow L.A., Hinson J.A. (2010). Reactive nitrogen
species in acetaminophen-induced mitochondrial damage and toxicity in mouse
hepatocytes. Chem Res Toxicol. 23, 1286–1292.
Buttar H.S., Nera E.A., Downie R.H. (1976). Serum enzyme activities and
hepatic triglyceride levels in acute and subacute acetaminophen-treated rats.
Toxicology. 6, 9–20.
Cannon B, Nedergaard J. (2008). Studies of thermogenesis and mitochondrial
function in adipose tissues. Methods Mol Biol. 456:109-21.
Cannon B., Nedergaard J. (2004). Brown adipose tissue: function and
physiological significance. Physiol Rev 84, 277–359.
146
Cannon B., Shabalina I.G., Kramarova T.V., Petrovic N., Nedergaard J. (2006).
Uncoupling proteins: a role in protection against reactive oxygen species—or
not? Biochim. Biophys. Acta. 1757, 449-458.
Carmen G.Y., Victor S.M. (2006). Signalling mechanisms regulating lipolysis.
Cellular Signalling. 18, 401–408.
Cayman Chemical (2017). COX-1 (mouse) Blocking Peptide Product
information Available at: https://www.caymanchem.com/pdfs/360109.pdf
[Accessed 2 August 2017].
Censarek P., Freidel K., Hohlfeld T., Schrör K., Weber A.A. (2006). Human
cyclooxygenase-1b is not the elusive target of acetaminophen. Eur J Pharmacol.
551(1-3), 50-3.
Chan K., Truong D., Shangari N., O'Brien P.J. (2005). Drug-induced
mitochondrial toxicity. Expert Opin Drug Metab Toxicol. 1(4), 655-69.
Chandrasekharan N.V., Dai H., Roos K.L., Evanson N.K., Tomsik J., Elton T.S.,
Simmons D.L. (2002). COX-3, a cyclooxygenase-1 variant inhibitied by
acetaminophen and other analgesic/antipyretic drugs: cloning, structure, and
expression. Proc Natl Acad Sci USA. 99, 13926-13931.
Chaves V.E., Frasson D., Kawashita N.H. (2011). Several agents and pathways
regulate lipolysis in adipocytes. Biochimie. 93(10), 1631-40.
Chen C., Krausz K.W., Shah Y.M., Idle J.R., Gonzalez F.J. (2009). Serum
metabolomics reveals irreversible inhibition of fatty acid b-oxidation through the
suppression of PPARa activation as a contributing mechanism of
acetaminophen-induced hepatotoxicity. Chem Res Toxicol. 22, 699–707.
Chrysovergis K., Wang X., Kosak J., Lee S-H., Kim J.S., Foley J.F., Travlos G.,
Singh S., Baek S.J., Eling T.E. (2014). NAG-1/GDF15 prevents obesity by
increasing thermogenesis, lipolysis and oxidative metabolism. Int J Obes
(Lond). 38(12), 1555–1564.
Cohen S.D., Hoivik D.J., Khairallah E.A. (1998). Acetaminophen-Induced
Hepatotoxicity. In: Plaa GL, Hewitt WR, editors. Toxicology of the Liver.
Taylor & Francis. 159–186.
Cohen S.D., Pumford N.R., Khairallah E.A., Boekelheide K., Pohl L.R.,
Amouzadeh H.R., Hinson J.A. (1997). Selective protein covalent binding and
target organ toxicity. Toxicol Appl Pharmacol. 143, 1–12.
Copple I.M., Goldring C.E., Jenkins R.E., Chia A.J., Randle L.E., Hayes J.D.,
Kitteringham N.R., Park B.K. (2008). The hepatotoxic metabolite of
147
acetaminophen directly activates the Keap1-Nrf2 cell defense system.
Hepatology. 48(4), 1292-301.
Corley G., Rawls S.M. (2009). Opioid, Cannabinoid CB1 and NOP Receptors
Do Not Mediate APAP-induced Hypothermia in Rats. Pharmacol Biochem
Behav. 92 (3), 503-507.
Cornejo-Juarez P, Sierra-Madero J, Volkow-Fernandez P. Metabolic acidosis
and hepatic steatosis in two HIV-infected patients on stavudine (d4T) treatment.
Arch Med Res 2003;34:64–69.
Courad J.P., Besse D., Delchambre C., Hanoun N., Hamon M., Eschalier A.,
Caussade F., Cloarec A. (2001). Acetaminophen distribution in the rat central
nervous system. Life Sci. 69, 1455–1464.
Cranswick N., Coghlan D. (2000). Paracetamol efficacy and safety in children:
the first 40 years. Am J Ther. 7, 135–141.
Cui J.G., Kuroda H., Chandrasekharan N.V., Pelaez R.P., Simmons D.L., Bazan
N.G., Lukiw W.J. (2004). Cyclooxygenase-3 gene expression in Alzheimer
hippocampus and in stressed human neural cells. Neurochem Res. 29(9), 1731-
7.
Daiyasu H., Toh H. (2000). Molecular evolution of the myeloperoxidase family.
J Mol Evol. 51, 433–445.
Davies N.M., Good R.L., Roupe K.A., Yáñez J.A. (2004). Cyclooxygenase-3:
axiom, dogma, anomaly, enigma or splice error?--Not as easy as 1, 2, 3. J Pharm
Pharm Sci. 7(2), 217-26.
de Andrade K.Q., Moura F.A., dos Santos J.M., de Araújo O.R., de Farias
Santos J.C., Goulart M.O. (2015). Oxidative stress and inflammation in hepatic
diseases: therapeutic possibilities of N-acetylcysteine. Int J Mol Sci. 16, 30269–
30308.
Deschamps D., DeBeco V., Fisch C., Fromenty B., Guillouzo A., Pessayre D.
(1994). Inhibition by perhexiline of oxidative phosphorylation and the b-
oxidation of fatty acids: possible role in pseudoalcoholic liver lesions.
Hepatology. 19, 948–961.
Deschamps D., Fisch C., Fromenty B., Berson A., Degott C., Pessayre D.
(1991). Inhibition by salicylic acid of the activation and thus oxidation of long
chain fatty acids. Possible role in the development of Reye’s syndrome. J
Pharmacol Exp Ther. 259, 894–904.

148
Diaz A., Reginato A.M., Jimenez S.A. (1992). Alternative splicing of human
prostaglandin G/H synthase in mRNA and evidence of differential regulation of
the resulting transcripts by transforming growth factor beta 1, interleukin 1 beta,
and tumor necrosis factor alpha. J Biol Chem. 267, 10816-10822.
Dinchuk J.E., Liu R.Q., Trzaskos J.M. (2003). COX-3: in the wrong frame in
mind. Immunol Lett. 86, 121.
Doi H., Horie T. (2010). Salicylic acid-induced hepatotoxicity triggered by
oxidative stress. Chem Biol Interact. 183, 363–368.
Dou W., Jiao Y., Goorha S., Raghow R., Ballou L.R. (2004). Nociception and
the differential expression of cyclooxygenase-1 (COX-1), the COX-1 variant
retaining intron-1 (COX-1v), and COX-2 in mouse dorsal root ganglia (DRG).
Prostaglandins Other Lipid Mediat. 74(1-4), 29-43.
Du K., Ramachandran A., McGill M.R., Mansouri A., Asselah T., Farhood A.,
Woolbright B.L., Ding W.X., Jaeschke H. (2017). Induction of mitochondrial
biogenesis protects against acetaminophen hepatotoxicity. Food Chem Toxicol.
108(Pt A), 339-350.
Duchamp C., Barré H. (1993). Skeletal muscle as the major site of nonshivering
thermogenesis in cold-adapted ducklings. Am J Physiol Regul Integr Comp
Physiol. 265, R1076–R1083.
Eberhardt M.J., Schillers F., Eberhardt E.M., Risser L., de la Roche J., Herzog
C., Echtermeyer F., Leffler A. (2017). Reactive metabolites of acetaminophen
activate and sensitize the capsaicin receptor TRPV1. Sci Rep. 7(1), 12775.
Else P.L., Hulbert A.J. (1981). Comparison of the “mammal machine” and the
“reptile machine”: energy production. Am J Physiol. 240, R3-9.
Engstrom RL., Wilhelms D.B., Eskilsson A., Vasilache A.M., Elander L.,
Engblom D., Blomqvist A. (2013). Acetaminophen reduces lipopolysaccharide-
induced fever by inhibiting cyclooxygenase-2. Neuropharmacology. 71, 124-9.
Erman A., Schwartzman M., Raz A. (1980). Indomethacin but not aspirin
inhibits basal and stimulated lipolysis in rabbit kidney. Prostaglandins. 20(4),
689-702.
Evdokimov N.M., Clark P.M., Flores G., Chai T., Faull K.F., Phelps M.E., Witte
O.N., Jung M.E. (2015). Development of 2-deoxy-2-[18F]fluororibose for
positron emission tomography imaging liver function in vivo. J Med Chem. 58,
5538–47.
Fain J.N., Mohell N., Wallace M.A., Mills I. (1984). Metabolic effects of b-, a1-
149
, and a2-adrenoceptor activation on brown adipocytes isolated from the perirenal
adipose tissue of fetal lambs. Metabolism. 33, 289–94.
Fassina G., Dorigo P., Gaion R.M. (1974). Equilibrium between metabolic
pathways producing energy: a key factor in regulating lipolysis. Pharmacol Res
Commun. 6, 1–21.
Fillmore N., Alrob O.A., Lopaschuk G.D. (2017). Fatty Acid beta-Oxidation
Available at http://lipidlibrary.aocs.org/Biochemistry/content.cfm?ItemNumber
=39187 [Accessed 2 August 2017].
Fischer L.J., Green M.D., Harman A.W. (1981). Levels of acetaminophen and
its metabolites in mouse tissues after a toxic dose. J Pharmacol Exp Ther. 219,
281–286.
Flower R.J., Vane J.R. (1972). Inhibition of prostaglandin synthetase in brain
explains the antipyretic activity of paracetamol (4-acetamidophenol). Nature.
240, 410–1.
Fortier M., Soni K., Laurin N., Wang S.P., Maurege P., Jirik F.R., Mitchell G.A.
(2005). Human hormone-sensitive lipase (HSL): expression in white fat corrects
the white adipose phenotype of HSL-deficient mice. JLipid Res. 46, 1860-7.42.
Foster J., Mauger A., Thomasson K., White S., Taylor L. (2016). Effect of
Acetaminophen Ingestion on Thermoregulation of Normothermic, Non-febrile
Humans. Front Pharmacol. 7, 54.
Fréneaux E., Fromenty B., Berson A., Labbe G., Degott C., Lettéron P., Larrey
D., Pessayre D. (1990). Stereoselective and nonstereoselective effects of
ibuprofen enantiomers on mitochondrial beta-oxidation of fatty acids. J
Pharmacol Exp Ther. 255, 529–535.
Fromenty B., Pessayre D. (1995). Inhibition of mitochondrial beta-oxidation as a
mechanism of hepatotoxicity. Pharmacol Ther. 67, 101-154.
Fukushima A., Sekiguchi W., Mamada K., Tohma Y., Ono H. (2017).
Serotonergic system does not contribute to the hypothermic action of
acetaminophen. Biol Pharm Bull. 40(2), 227-233.
Gentry C., Andersson D.A., Bevan S. (2015). TRPA1 mediates the hypothermic
action of acetaminophen. Sci Rep. 5, 12771.
Ghanem I.C., María J.P., Manautou J.E., and Mottino A.D. (2016).
Acetaminophen; from liver to brain: new insights into drug pharmacological
action and toxicity. Pharmacol Res. 109, 119–131.
Gordon C. J. (2012). Thermal physiology of laboratory mice: Defining
150
thermoneutrality. Journal of Thermal Biology 37(8), 654-685.
Gordon C.J. (1985). Relationship between autonomic and behavioral
thermoregulation in the mouse. Physiol. Behav. 34, 687-690.
Gordon C.J. (1990). Thermal biology of the laboratory rat. Physiol. Behav. 47,
963-991.
Gordon C.J. (1993). Temperature regulation in laboratory rodents. New York:
Cambridge University Press. Xii, 276.
Gordon C.J. (2004). Effect of cage bedding on temperature regulation and
metabolism of group-housed female mice. Comp. Med. 54, 51-56.
Greenberg A.S., Shen W.J., Muliro K., Patel S., Souza S.C., Roth R.A, Kraemer
F.B. (2001). Stimulation of lipolysis and hormone-sensitive lipase via the
extracellular signal-regulated kinase pathway. J. Biol. Chem. 276, 45456-45461.
Gujral J.S., Knight T.R., Farhood A., Bajt M.L., Jaeschke H. (2002). Mode of
cell death after acetaminophen overdose in mice: apoptosis or oncotic necrosis?
Toxicol Sci. 67, 322–328.
Harrison P.M., Wendon J.A., Gimson A.E., Alexander G.J., Williams R. (1991).
Improvement by acetylcysteine of hemodynamics and oxygen transport in
fulminant hepatic failure. N Engl J Med. 324, 1852–1857.
Hawkes R., Niday E., Gordon J. (1982). A dot-immunobinding assay for
monoclonal and other antibodies. Anal Biochem. 119(1), 142-7.
Heard K.J. Acetylcysteine for acetaminophen poisoning. (2008). N Engl J Med.
359, 285–292.
Heeren J., Münzberg H. (2013). Novel aspects of brown adipose tissue biology.
Endocrinol Metab Clin. 42, 89–107.
Hill G.E. (2014). Cellular respiration: the nexus of stress, condition, and
ornamentation. Integr Comp Biol. 54(4), 645-57.
Hinz B., Brune K. (2002). Cyclooxygenase-2-10 years later. J Pharmacol Exp
Ther. 300(2), 367-75.
Hla T. (1996). Molecular characterization of the 5.2 KB isoform of the human
cyclooxygenase-1 transcript. Prostaglandins. 51, 81–85.
Hu J., Ramshesh V.K., McGill M. R., Jaeschke H., Lemasters J.J. (2016). Low
dose acetaminophen induces reversible mitochondrial dysfunction associated

151
with transient c-Jun N-terminal kinase activation in mouse liver. Toxicol Sci.
150(1), 204–215.
Jaeschke H., Bajt M.L. (2006). Intracellular signaling mechanisms of
acetaminophen-induced liver cell death. Toxicol Sci. 89, 31–41.
Jaeschke H., McGill M.R. (2015). Cytochrome P450-derived versus
mitochondrial oxidant stress in acetaminophen hepatotoxicity. Toxicol Lett. 235,
216–217.
Jaeschke H., McGill M.R., Ramachandran A. (2012a). Oxidant stress,
mitochondria, and cell death mechanisms in drug-induced liver injury: lessons
learned from acetaminophen hepatotoxicity. Drug Metab Rev. 44, 88–106.
Jaeschke H., Williams C.D., Ramachandran A., Bajt M.L. (2012b).
Acetaminophen hepatotoxicity and repair: the role of sterile inflammation and
innate immunity. Liver Int. 32, 8–20.
James L.P., McCullough S.S., Lamps L.W., Hinson J.A. (2003). Effect of N-
acetylcysteine on acetaminophen toxicity in mice: relationship to reactive
nitrogen and cytokine formation. Toxicol Sci. 75(2), 458-67.
Jan Y.H., Heck D.E., Dragomir A.C., Gardner C.R., Laskin D.L., Laskin J.D.
(2014). Acetaminophen reactive intermediates target hepatic thioredoxin
reductase. Chem Res Toxicol. 27(5), 882-94.
Jarving R., Jarving I., Kurg R., Brash A.R., Samel N. (2004). On the
evolutionary origin of cyclooxygenase (COX) isozymes: characterization of
marine invertebrate COX genes points to independent duplication events in
vertebrate and invertebrate lineages. J Biol Chem. 279, 13624–13633.
Jollow DJ, Mitchell JR, Potter WZ, Davis DC, Gillette JR, Brodie BB. (1973).
Acetaminophen-induced hepatic necrosis. II. Role of covalent binding in vivo. J
Pharmacol Exp Ther. 187(1):195-202.
Jóźwiak-Bebenista M., Nowak J. Z. (2014). Paracetamol: mechanism of action,
applications and safety concern. Acta Pol. Pharm. 71, 11–23.
Kawamura M., Inaoka H., Obata S., Harada Y. (2014). Why do a wide variety of
animals retain multiple isoforms of cyclooxygenase? Prostaglandins Other Lipid
Mediat. 109–111, 14–22.
Kerr F., Dawson A., Whyte I.M., Buckley N., Murray L., Graudins A., et al.
(2005). The Australasian Clinical Toxicology Investigators Collaboration
randomized trial of different loading infusion rates of N-acetylcysteine. Ann
Emerg Med. 45, 402–408.
152
Khetani S.R., Bhatia S.N. (2008). Microscale culture of human liver cells for
drug development. Nat. Biotechnol. 26, 120-126.
Kikkawa R., Fujikawa M., Yamamoto T., Hamada Y., Yamada H., Horii I.
(2006). In vivo hepatotoxicity study of rats in comparison with in vitro
hepatotoxicity screening system. J. Toxicol. Sci. 31, 23-34.
Kis B., Snipes A., Bari F., Busija D.W. (2004). Regional distribution of
cyclooxygenase-3 mRNA in the rat central nervous system. Brain Res Mol
Brain Res. 126(1), 78-80.
Kis B., Snipes J.A., Busija D.W. (2005). Acetaminophen and the
cyclooxygenase-3 puzzle: sorting out facts, fictions, and uncertainties. J
Pharmacol Exp Ther. 315(1), 1-7.
Kis B., Snipes J.A., Isse T., Nagy K., Busija D.W. (2003). Putative
Cyclooxygenase-3 Expression in Rat Brain Cells. J Cereb Blood Flow Metab.
23(11), 1287-92.
Kitzler J., Hill E., Hardman R., Reddy N., Philpot R., Eling T.E. (1995) Analysis
and quantitation of splicing variants of the TPA-inducible PGHS-1 mRNA in rat
tracheal epithelial cells. Arch Biochem Biophys. 316, 856-863.
Kon K., Kim J.S., Jaeschke H., Lemasters J.J. (2004). Mitochondrial
permeability transition in acetaminophen-induced necrosis and apoptosis of
cultured mouse hepatocytes. Hepatology. 40, 1170–1179.
Kumpulainen E., Kokki H., Halonen T., Heikkinen M., Savolainen J., Laisalmi
M. (2007). Paracetamol (acetaminophen) penetrates readily into the
cerebrospinal fluid of children after intravenous administration. Pediatrics. 119,
766–771.
Labbe G., Pessayre D., Fromenty B. (2008). Drug-induced liver injury through
mitochondrial dysfunction: mechanisms and detection during preclinical safety
studies. Fundam Clin Pharmacol. 22, 335–353.
Lafontan M., Berlan M. (1993). Fat cell adrenergic receptors and the control of
white and brown fat cell function. J Lipid Res. 34, 1057–91.
Lafontan M., Langin D. (2009). Lipolysis and lipid mobilization in human
adipose tissue. Progress in Lipid Research. 48, 275–297.
Lee W.M. (2012). Acute liver failure. Semin Respir Crit Care Med. 33, 36–45.
153
Lefterova M.I., Lazar M.A. (2009). New developments in adipogenesis. Trends
in Endocrinology and Metabolism. 20, 107–114.
Leung L. (2012). From ladder to platform: a new concept for pain management.
J Prim Health Care. 4(3), 254-8.
Li S., Dou W., Tang Y., Goorha S., Ballou L.R., Blatteis C.M. (2008).
Acetaminophen: antipyretic or hypothermic in mice? In either case, PGHS-1b
(COX-3) is irrelevant. Prostaglandins Other Lipid Mediat. 85(3-4):89-99.
Lim M.S., Lim P.L., Gupta R., Boelsterli U.A. (2006). Critical role of free
cytosolic calcium, but not uncoupling, in mitochondrial permeability transition
and cell death induced by diclofenac oxidative metabolites in immortalized
human hepatocytes. Toxicol Appl Pharmacol. 217, 322–331.
Lopaschuk G.D., Ussher, J.R., Folmes C.D., Jaswal J.S. and Stanley W.C.
(2010). Myocardial fatty acid metabolism in health and disease. Physiol Rev. 90,
207-258.
Lowell B.B., Spiegelman B.M. (2000). Towards a molecular understanding of
adaptive thermogenesis. Nature. 404, 652–660.
Luo L., Liu M. (2016). Adipose tissue in control of metabolism. J Endocrinol.
231(3), R77-R99.
MacPherson R.E., Peters S.J. (2015). Piecing together the puzzle of perilipin
proteins and skeletal muscle lipolysis. Appl Physiol Nutr Metab. 40(7):641-51.
Marcelin G., Chua S. (2010). Contributions of adipocyte lipid metabolism to
body fat content and implications for the treatment of obesity. Curr Opin
Pharmacol. 10, 588–593.
Martin F.L., McLean A.E. (1995). Adenosine triphosphate (ATP) levels in
paracetamol-induced cell injury in the rat in vivo and in vitro. Toxicology. 104,
91–7.
Massey T.E., Walker R.M., McElligott T.F., Racz W.J. (1982). Acetaminophen-
induced hypothermia in mice: evidence for a central action of the parent
compound. Toxicology. 25, 187–200.
Matsumura K., Cao C., Ozaki M., Morii H., Nakadate K., Watanabe Y. (1998).
Brain endothelial cells express cyclooxygenase-2 during lipopolysaccharide-
induced fever: light and electron microscopic immunocytochemical studies. J
Neurosci. 18, 6279–6289.
154
Muramatsu S., Shiraishi S., Miyano K., Sudo Y., Toda A., Mogi M., Hara M.,
Yokoyama A., Kawasaki Y., Taniguchi M., Uezono Y. (2016). Metabolism of
AM404 From Acetaminophen at Human Therapeutic Dosages in the Rat Brain.
Anesth Pain Med. 6(1), e32873.
McGill M.R., Jaeschke H. (2013). Metabolism and disposition of
acetaminophen: recent advances in relation to hepatotoxicity and diagnosis.
Pharm Res. 30, 2174–2187.
McGill M.R., Lebofsky M., Norris H.R., Slawson M.H., Bajt M.L., Xie Y.,
Williams C.D., Wilkins D.G., Rollins D.E., Jaeschke H. (2013). Plasma and
liver acetaminophen-protein adduct levels in mice after acetaminophen
treatment: dose-response, mechanisms, and clinical implications. Toxicol Appl
Pharmacol. 269, 240–249.
McGill M.R., Sharpe M.R., Williams C.D., Taha M., Curry S.C., Jaeschke H.
(2012). The mechanism underlying acetaminophen-induced hepatotoxicity in
humans and mice involves mitochondrial damage and nuclear DNA
fragmentation. J Clin Invest. 122, 1574–1583.
McGovern A.J., Vitkovitsky I.V., Jones D.L., Mullins M.E. (2015). Can
AST/ALT ratio indicate recovery after acute paracetamol poisoning? Clin
Toxicol (Phila) 53, 164–167.
McKnight G.S., Cummings D.E., Amieux P.S., Sikorski M.A., Brandon E.P.,
Planas J.V., Motamed K., Idzerda R.L. (1998). Cyclic AMP, PKA, and the
physiological regulation of adiposity. Recent Prog Horm Res. 53, 139–59.
Messner S., Agarkova I., Moritz W., Kelm J.M. (2013). Multi-cell type human
liver microtissues for hepatotoxicity testing. Arch. Toxicol. 87, 209-213.
Meyers L.L., Beierschmitt W.P., Khairallah E.A., Cohen S.D. (1988).
Acetaminophen-induced inhibition of hepatic mitochondrial respiration in mice.
Toxicol Appl Pharmacol. 93, 378–87.
Mingatto F.E., Santos A.C., Uyemura S.A., Jordani M.C., Curti C. (1996). In
vitro interaction of nonsteroidal anti-inflammatory drugs on oxidative
phosphorylation of rat kidney mitochondria: respiration and ATP synthesis.
Arch Biochem Biophys. 334(2), 303-8.
Mitchell J.R., Jollow D.J., Potter W.Z., Davis D.C., Gillette J.R., Brodie B.B.
(1973a). Acetaminophen-induced hepatic necrosis. I. Role of drug metabolism. J
Pharmacol Exp Ther. 187, 185–94.
155
Mitchell J.R., Jollow D.J., Potter W.Z., Gillette J.R., Brodie B.B. (1973b).
Acetaminophen-induced hepatic necrosis. IV. Protective role of glutathione. J
Pharmacol Exp Ther. 187, 211–217.
Moriyama N., Miyoshi M., Imoto T., Maruyama M., Shido O., Watanabe T.
(2006). Systemic administration of polymyxin B induces hypothermia in rats via
an inhibitory effect on metabolic rate. Eur J Pharmacol. 541(1-2), 38-43.
Morse H.N. (1878). Ueber eine neue Darstellungsmethode der
Acetylamidophenole. Ber Deutscher Chem Ges. 11, 232–233.
Moyer AM, Fridley BL, Jenkins GD, Batzler AJ, Pelleymounter LL, Kalari KR,
Ji Y, Chai Y, Nordgren K, Weinshilboum RM. (2011). Acetaminophen-NAPQI
Hepatotoxicity: A Cell Line Model System Genome-Wide Association Study.
Toxicol Sci. 120(1), 33–41.
Mozo J., Emre Y., Bouillaud F., Ricquier D., Criscuolo F. (2005).
Thermoregulation: what role for UCPs in mammals and birds? Biosci. Rep. 25,
227-249.
Nastevska C., Gerber E., Horbach M., Röhrdanz E., Kahl R. (1999). Impairment
of TNF-alpha expression and secretion in primary rat liver cell cultures by
acetaminophen treatment. Toxicology. 133, 85-92.
Nazareth W.M., Sethi J.K., McLean A.E. (1991). Effect of paracetamol on
mitochondrial membrane function in rat liver slices. Biochem Pharmacol. 42,
931–36.
Noh J.R., Kim Y.H., Hwang J.H., Choi D.H., Kim K.S., Oh W.K., et al. (2015).
Sulforaphane protects against acetaminophen-induced hepatotoxicity. Food
Chem Toxicol. 80, 193–200.
Nurmi J.T., Puolakkainen P.A., Rautonen N.E. (2005). Intron 1 retaining
cyclooxygenase 1 splice variant is induced by osmotic stress in human intestinal
epithelial cells. Prostaglandins Leukot Essent Fatty Acids. 73(5), 343-50.
Ohlson K.B., Shabalina I.G., Lennström K., Backlund E.C., Mohell N.,
Bronnikov G.E., Lindahl S.G., Cannon B., Nedergaard J. (2004). Inhibitory
effects of halothane on the thermogenic pathway in brown adipocytes:
localization to adenylyl cyclase and mitochondrial fatty acid oxidation.
Biochemical Pharmacology. 68(3), 463-477.
Oksuz E., Atalar F., Tanırverdi G., Bilir A., Shahzadi A., Yazici Z. (2016).
Therapeutic potential of cyclooxygenase-3 inhibitors in the management of
glioblastoma. J Neurooncol. 126(2), 271-8.

156
O'Neill G.P., Ford-Hutchinson A.W. (1993). Expression of mRNA for
cyclooxygenase-1 and cyclooxygenase-2 in human tissues. FEBS. 33, 156–160.
Orbach S.M., Cassin M.E., Ehrich M.F., Rajagopalan P. (2017). Investigating
acetaminophen hepatotoxicity in multi-cellular organotypic liver models.
Toxicol In Vitro. 42, 10-20.
Osellame L.D., Blacker T.S., Duchen M.R. (2012). Cellular and molecular
mechanisms of mitochondrial function. Best Pract Res Clin Endocrinol Metab.
26(6), 711–723.
Otto J.C., DeWitt D.L., Smith W.L. (1993). N-glycosylation of prostaglandin
endoperoxide synthase-1 and -2 and their orientations in the endoplasmic
reticulum. J Biol Chem. 268, 18234-18242.
Owen L., Sunram-Lea S.I. (2011). Metabolic Agents that Enhance ATP can
Improve Cognitive Functioning: A Review of the Evidence for Glucose,
Oxygen, Pyruvate, Creatine, and L-Carnitine. Nutrients. 3(8), 735–755.
Paar M., Jüngst C., Steiner N., Magnes C., Sinner F., Kolb D., Lass A.,
Zimmermann R., Zumbusch A., Kohlwein S.D., Wolinski H. (2012).
Remodeling of lipid droplets during lipolysis and growth in adipocytes. The
Journal of Biological Chemistry. 28, 11164–11173.
Pauw A.D., Tejerina S., Raes M., Keijer J., Arnould T. (2009). Mitochondrial
(Dys)function in Adipocyte (De)differentiation and Systemic Metabolic
Alterations. Am J Pathol. 175(3), 927–939.
Perier C., Vila M. (2012). Mitochondrial biology and Parkinson's disease. Cold
Spring Harb Perspect Med. 2(2), a009332.
Pike L.S., Smift A.L., Croteau N.J., Ferrick D.A., Wu M. (2011). Inhibition of
fatty acid oxidation by etomoxir impairs NADPH production and increases
reactive oxygen species resulting in ATP depletion and cell death in human
glioblastoma cells. Biochim Biophys Acta. 1807(6), 726-34.
Porter K.E., Dawson A.G. (1979). Inhibition of respiration and gluconeogenesis
by paracetamol in rat kidney preparations. Biochem Pharmacol. 28, 3057–62.
Prescott L.F., Illingworth R.N., Critchley J.A., Stewart M.J., Adam R.D.,
Proudfoot A.T. (1979). Intravenous N-acetylcysteine: the treatment of choice for
paracetamol poisoning. Br Med J. 2, 1097–1100.
Promega (2017). AccessQuick™ RT-PCR System Protocol Available at:
file:///C:/Users/User/Downloads/accessquick-rt-pcr-system-protocol.pdf
[Accessed 2 August 2017].

157
Public Health England Culture Collections (2017). ECACC General Cell
Collection: 96091929 b.End3 Available at: https://www.phe-culture
collections.org.uk/products/celllines/generalcell/detail.jsp?refId=96091929&coll
ection=ecacc_gc [Accessed 2 August 2017].
Public Health England Culture Collections (2017). ECACC General Cell
Collection: 86052701 3T3 L1 Available at: https://www.phe-culture
collections.org.uk/products/celllines/generalcell/detail.jsp?refId=86052701&coll
ection=ecacc_gc [Accessed 2 August 2017].
Qin N., Zhang S.P., Reitz T.L., Mei J.M., Flores C.M. (2005). Cloning,
expression, and functional characterization of human cyclooxygenase-1 splicing
variants: evidence for intron 1 retention. J Pharmacol Exp Ther. 315(3), 1298-
305.
Ràfols M.E. (2014). Adipose tissue: Cell heterogeneity and functional diversity
Endocrinol Nutr. 61(2), 100-112.
Ramachandran A., Lebofsky M., Weinman S.A., Jaeschke H. (2011). The
impact of partial manganese superoxide dismutase (SOD2)-deficiency on
mitochondrial oxidant stress, DNA fragmentation and liver injury during
acetaminophen hepatotoxicity. Toxicol Appl Pharmacol. 251(3), 226-33.
Ramachandran A., McGill M.R., Xie Y., Ni H.M., Ding W.X., Jaeschke H.
(2013). Receptor interacting protein kinase 3 is a critical early mediator of
acetaminophen-induced hepatocyte necrosis in mice. Hepatology. 58, 2099–
2108.
Ramsay R. R., Rashed M. S., Nelson S. D. (1989). In vitro effects of
acetaminophen metabolites and analogs on the respiration of mouse liver
mitochondria. Arch. Biochem. Biophys. 273, 449–457.
Reid A.B., Kurten R.C., McCullough S.S., Brock R.W., Hinson J.A. (2005).
Mechanisms of acetaminophen-induced hepatotoxicity: role of oxidative stress
and mitochondrial permeability transition in freshly isolated mouse hepatocytes.
J Pharmacol Exp Ther. 312, 509–516.
Reinauer C., Censarek P., Kaber G., Weber A.A., Steger G., Klamp T., Schrör
K. (2013). Expression and translation of the COX-1b gene in human cells--no
evidence of generation of COX-1b protein. Biol Chem. 394(6), 753-60.
Rivera P., Pastor A., Arrabal S., Decara J., Vargas A., Sánchez-Marín L., Pavón
F.J., Serrano A., Bautista D., Boronat A., Torre R., Baixeras E., Lucena M.I.,
Fonseca F.R., Suárez J. (2017). Acetaminophen-Induced Liver Injury Alters the
158
Acyl Ethanolamine-Based Anti-Inflammatory Signaling System in Liver. Front
Pharmacol. 8, 705.
Rogers G.W., Brand M.D., Petrosyan S., Ashok D., Elorza A.A., Ferrick D.A.
(2011). High throughput microplate respiratory measurements using minimal
quantities of isolated mitochondria. PLoS One. 6, e21746.
Romanovsky A.A. (2007). Thermoregulation: some concepts have changed.
Functional architecture of the thermoregulatory system. Am J Physiol Regul
Integr Comp Physiol. 292(1), R37-46.
Roos K.L., Simmons D.L. (2005). Cyclooxygenase variants: The role of
alternative splicing. Biochemical and Biophysical Research Communications.
338 (1), 62–69.
Rosen E.D., Walkey C.J., Puigserver P., Spiegelman B.M. (2000).
Transcriptional regulation of adipogenesis. Genes and Development. 14, 1293–
1307.
Rouzer C.A., Marnett L.J. (2009). Cyclooxygenases: structural and functional
insights. J Lipid Res. 50, S29–S34.
Rumack B.H. (2002). Acetaminiphen hepatotoxicity: the first 35 years. J
Toxicol Clin Toxicol. 40, 3–20.
Sandor A., Cseko J., Kispal G., Alkonyi I. (1990). Surplus acylcarnitines in the
plasma of starved rats derive from the liver. J Biol Chem. 265, 22313–22316.
Schneider C., Boeglin W.E., Brash A.R. (2005). Human cyclooxygenase-1 and
an alternative splice variant: contrasts in expression of mRNA, protein, and
catalytic activities. Biochem. J. 385, 57–64.
Schulz H. (2008). Oxidation of fatty acids in eukaryotes. In: Biochemistry of
Lipids, Lipoproteins and Membranes (5th Edition). 131-154 (D.E. Vance and J.
Vance (eds.), Elsevier, Amsterdam).
Schwab J.M., Schluesener H.J., Meyermann R., Serhan C.N. (2003a). COX-3
the enzyme and the concept: steps towards highly specialized pathways and
precision therapeutics? Prostaglandins Leukot Essent Fatty Acids. 69(5), 339-43.
Schwab J.M., Beiter T., Linder J.U., Laufer S., Schulz J.E., Meyermann R.,
Schluesener H.J. (2003b). COX-3--a virtual pain target in humans? FASEB J.
17(15), 2174-5.
159
Schwab J.M., Schluesener H.J., Laufer S. (2003c) COX-3: just another COX or
the solitary elusive target of paracetamol? Lancet 361, 981–982.
Schweiger M., Eichmann T.O., Taschler U., Zimmermann R., Zechner R., Lass
A. (2014). Measurement of Lipolysis. Methods Enzymol. 538, 171–193.
Schweiger M., Schreiber R., Haemmerle G., Lass A., Fledelius C., Jacobsen P.,
Tornqvist H., Zechner R., Zimmermann R. (2006). Adipose triglyceride lipase
and hormone-sensitive lipase are the major enzymes in adipose tissue
triacylglycerol catabolism. J Biol Chem. 281, 40236–41.
Sell H., Deshaies Y., Richard D. (2004). The brown adipocyte: update on its
metabolic role. Int J Biochem Cell Biol. 36(11), 2098-2104.
Shaftel S.S., Olschowka J.A., Hurley S.D., Moore A.H., O'Banion M.K. (2003).
COX-3: a splice variant of cyclooxygenase-1 in mouse neural tissue and cells.
Brain Res Mol Brain Res. 119(2), 213-5.
Shen C., Zhang G., Meng Q. (2007). An in vitro model for long-term
hepatotoxicity testing utilizing rat hepatocytes entrapped in micro-hollow fiber
reactor. Biochem. Eng. J. 34, 267-272.
Shutt T.E., McBride H.M. (2013). Staying cool in difficult times: Mitochondrial
dynamics, quality control and the stress response. BBA-Mol Cell Res. 1833,
417-24.
Sigma-Aldrich (2017). Free Glycerol Reagent Bulletin Available at:
https://www.sigmaaldrich.com/content/dam/sigma-aldrich/docs/Sigma/Bulletin/
f6428bul.pdf [Accessed 2 August 2017].
Sigma-Aldrich (2017). Monoclonal Anti-β-Actin antibody Datasheet
Available at: https://www.sigmaaldrich.com/content/dam/sigma-aldrich/docs/
Sigma/Datasheet/6/a5441dat.pdf [Accessed 2 August 2017].
Sigma-Aldrich (2017). GenElute™ Direct mRNA Miniprep Kit Bulletin
Available at: https://www.sigmaaldrich.com/content/dam/sigma-aldrich/docs/
Sigma/Bulletin/dmn10bul.pdf [Accessed 2 August 2017].
Sigma-Aldrich (2017). Mammalian Cell Lysis Kit Bulletin Available at:
https://www.sigmaaldrich.com/content/dam/sigma-aldrich/docs/Sigma/Bulletin/
mcl1bul.pdf [Accessed 2 August 2017].
Silva J.E. (2003). The thermogenic effect of thyroid hormone and its clinical
implications. Ann Intern Med. 139(3), 205-213.
Silva J.E. (2006). Thermogenic mechanisms and their hormonal regulation.

160
Physiol Rev. 86(2), 435-64.
Simmons D.L. (2003). Variants of cyclooxygenase-1 and their roles in medicine.
Thromb Res. 2003. 110(5-6), 265-8.
Simmons D.L., Botting R.M., Hla T. (2004). Cyclooxygenase Isozymes: The
Biology of Prostaglandin Synthesis and Inhibition. Pharmacological Reviews.
56 (3), 387-437.
Simmons D.L., Botting R.M., Robertson P.M., Madsen M.L., Vane J.R. (1999).
Induction of an acetaminophen-sensitive cyclooxygenase with reduced
sensitivity to nonsteroid anti-inflammatory drugs. Proc Natl Acad Sci U S A. 96,
3275–80.
Simmons D.L., Chandrasekharan N.V., Hu D., Roos K.L., Tomsik J. (2005).
Comments on “acetaminophen and the cyclooxygenase-3 puzzle: sorting out
facts, fictions, and uncertainties”. J Pharmacol Exp Ther. 315, 1412–1414;
author reply 1415–1416.
Simmons D.L., Xie W., Chipman J., Evett G. (1991). Multiple cyclooxygenases:
cloning of a mitogen-inducible form. M. Bailey (Ed.), Prostaglandin,
Leukotrienes, Lipoxins and PAF, Plenum Press, London. 67–78.
Smilkstein M.J., Knapp G.L., Kulig K.W., Rumack B.H. (1988). Efficiency of
oral N-acetylcysteine in the treatment of acetaminophen overdose. Analysis of
the national multicenter study (1976 to 1985) N Engl J Med. 319, 1557–1562.
Snipes J.A., Kis B., Shelness G.S., Hewett J.A., Busija D.W. (2005). Cloning
and characterization of cyclooxygenase-1b (putative cyclooxygenase-3) in rat. J
Pharmacol Exp Ther. 313(2), 668-76.
Somasundaram S., Rafi S., Hayllar J., Sigthorsson G., Jacob M., Price A.,
Macpherson A., Mahmod T., Scott D., Wrigglesworth J., Bjarnason I. (1997).
Mitochondrial damage: a possible mechanism of the "topical" phase of NSAID
induced injury to the rat intestine. Gut. 41(3), 344–353.
Somasundaram S., Sigthorsson G., Simpson R.J., Watts J., Jacob M., Tavares
I.A., Rafi S., Roseth A., Foster R., Price A.B., Wrigglesworth J.M., Bjarnason I.
(2000). Uncoupling of intestinal mitochondrial oxidative phosphorylation and
inhibition of cyclooxygenase are required for the development of NSAID-
enteropathy in the rat. Aliment Pharmacol Ther. 14(5), 639-50.
Tan C.Y., Vidal-Puig A. (2008). Adipose tissue expandability: the metabolic
problems of obesity may arise from the inability to become more obese.
Biochemical Society Transactions. 36, 935–940.
161
Taylor S.S., Yang J., Wu J., Haste N.M., Radzio-Andzelm E., Anand G. (2004).
PKA: a portrait of protein kinase dynamics. Biochim. Biophys. Acta. 1697, 259–
269.
Tchkonia T., Tchoukalova Y.D., Giorgadze N., Pirtskhalava T., Karagiannides
I., Forse R.A., Koo A., Stevenson M., Chinnappan D., Cartwright A., Jensen
M.D., Kirkland J.L. (2005). Abundance of two humanpreadipocyte subtypes
with distinct capacities for replication, adipogenesis, and apoptosis varies among
fat depots. Am JPhysiol Endocrinol Metab. 288:E267-77.
Thompson B.R., Lobo S., Bernlohr D.A. (2010). Fatty acid flux in adipocytes;
the in’s and out’s of fat cell lipid trafficking. Mol Cell Endocrinol. 318(1-2), 24–
33.
Toh Y.C., Lim T.C., Tai D., Xiao G., van Noort D., Yu H. (2009). A
microfluidic 3D hepatocyte chip for drug toxicity testing. Lab Chip. 9, 2026-
2035.
Tokumitsu Y., Lee S., Ui M. (1977). In vitro effects of nonsteroidal anti-
inflammatory drugs on oxidative phosphorylation in rats liver mitochondria.
Biochem Pharmacol. 26, 2101-2106.
Toussaint K., Yang X.C., Zielinski M.A., Reigle K.L., Sacavage S.D., Nagar S.,
Raffa R.B. (2010). What do we (not) know about how paracetamol
(acetaminophen) works? J Clin Pharm Ther. 35(6), 617-38.
Ueta C.B., Fernandes G.W., Capelo L.P., Fonseca T.L., Maculan F.D., Gouveia
C.H., Brum P.C., Christoffolete M.A., Aoki M.S., Lancellotti C.L., Kim B.,
Bianco A.C., Ribeiro M.O. (2012). beta(1) Adrenergic receptor is key to cold-
and diet-induced thermogenesis in mice. Journal of Endocrinology. 214, 359–
365.
Vane J.R., Botting R.M. (1996). The history of anti-inflammatory drugs and
their mechanism of action. In: Bazan N, Botting J, Vane J, eds. New targets in
inflammation: inhibitors of COX-2 or adhesion molecules. Dordrecht: Kluwer
Academic. 1–12.
Vaughan M. (1962). The production and release of glycerol by adipose. Tissue
incubated in vitro. J Biol Chem. 237, 3354-3358.
Vázquez-Meza H., de Piña M.Z., Pardo J.P., Riveros-Rosas H., Villalobos-
Molina R., Piña E. (2013). Non-steroidal anti-inflammatory drugs activate
NADPH oxidase in adipocytes and raise the H₂O₂ pool to prevent cAMP-
stimulated protein kinase a activation and inhibit lipolysis. BMC Biochem.14,
13.
162
Voet D., Voet J. (2004). Biochemistry (3rd Edition).
Volz M., Kellner H.M. (1980). Kinetics and metabolism of pyrazolones
(propyphenazone, aminopyrine and dipyrone). Br J Clin Pharmacol. 10 Suppl 2,
299S-308S.
Von Mering J. (1893). Beitrage zur Kenntniss der Antipyretica. Ther Monatsch.
7, 577–587.
Walker R.M., Massey T.E., McElligott T.F., Racz W.J. (1981). Acetaminophen-
induced hypothermia, hepatic congestion, and modification by N-acetylcysteine
in mice. Toxicol Appl Pharmacol. 59(3), 500-7.
Walker U.A., Bäuerle J., Laguno M., Murillas J., Mauss S., Schmutz G., Setzer
B., Miquel R., Gatell J.M., Mallolas J. (2004). Depletion of mitochondrial DNA
in liver under antiretroviral therapy with didanosine, stavudine, or zalcitabine.
Hepatology. 39, 311–317.
Warner T.D., Vojnovic I., Giuliano F., Jiménez R., Bishop-Bailey D., Mitchell
J.A. (2004). Cyclooxygenases 1, 2, and 3 and the production of prostaglandin I2:
investigating the activities of acetaminophen and cyclooxygenase-2-selective
inhibitors in rat tissues. J Pharmacol Exp Ther. 310(2), 642-7.
Williams C.D., Farhood A., Jaeschke H. (2010). Role of caspase-1 and
interleukin-1beta in acetaminophen-induced hepatic inflammation and liver
injury. Toxicol Appl Pharmacol. 247(3), 169-78.
Xie Y., Ramachandran A., Breckenridge D.G., Liles J.T., Lebofsky M., Farhood
A., Jaeschke H. (2015). Inhibitor of apoptosis signal-regulating kinase 1 protects
against acetaminophen-induced liver injury. Toxicol Appl Pharmacol. 286(1),1-
9.
Xu Y., Phipps S., Turner M.J., Simmons D.L. (2010). The N-terminus of COX-1
and its effect on cyclooxygenase-1 catalytic activity. J Genet Genomics. 37(2),
117-23.
Yoon E., Babar A., Choudhary M., Kutner M., and Pyrsopoulos N. (2016).
Acetaminophen-Induced Hepatotoxicity: a Comprehensive Update. J Clin Transl
Hepatol. 4(2), 131–142.
Yuan L., Kaplowitz N. (2013). Mechanisms of drug-induced liver injury. Clin
Liver Dis. 17, 507–518.
Zebisch K., Voigt V., Wabitsch M., Brandsch M. (2012). Protocol for effective
differentiation of 3T3-L1 cells to adipocytes. Anal Biochem. 425(1):88-90.
163
Zen-bio (2017). 3T3-L1 Cell Care Manual Available at: http://www.zen-
bio.com/pdf/ZBM0009.013T3L1CareprotocolRV08.08.pdf [Accessed 2 August
2017].
Zhang J., Song S., Pang Q., Zhang R., Zhou L., Liu S., et al. (2015). Serotonin
deficiency exacerbates acetaminophen-induced liver toxicity in mice. Sci Rep. 5,
8098.
Zhang T., He J., Xu C., Zu L., Jiang H., Pu S., Guo X., Xu G. (2008).
Mechanisms of metformin inhibiting lipolytic response to isoproterenol in
primary rat adipocytes. J Mol Endocrinol. 42(1), 57-66.