Hepatotoxicity of anti-inflammatory and analgesic drugs: ultrastructural aspects
Upload
ua-birminghamCategory
view
1download
0
Identification of Early Biomarkers duringAcetaminophen-Induced Hepatotoxicity by FourierTransform Infrared MicrospectroscopyRekha Gautam1., Bhagawat Chandrasekar2., Mukta Deobagkar-Lele2, Srabanti Rakshit2,
Vinay Kumar B. N.1, Siva Umapathy1*, Dipankar Nandi2*
1 Department of Inorganic and Physical Chemistry, Indian Institute of Science, Bangalore, India, 2 Department of Biochemistry, Indian Institute of Science, Bangalore, India
Abstract
Acetaminophen is a widely prescribed drug used to relieve pain and fever; however, it is a leading cause of drug-inducedliver injury and a burden on public healthcare. In this study, hepatotoxicity in mice post oral dosing of acetaminophen wasinvestigated using liver and sera samples with Fourier Transform Infrared microspectroscopy. The infrared spectra ofacetaminophen treated livers in BALB/c mice show decrease in glycogen, increase in amounts of cholesteryl esters and DNArespectively. Rescue experiments using L-methionine demonstrate that depletion in glycogen and increase in DNA areabrogated with pre-treatment, but not post-treatment, with L-methionine. This indicates that changes in glycogen and DNAare more sensitive to the rapid depletion of glutathione. Importantly, analysis of sera identified lowering of glycogen andincrease in DNA and chlolesteryl esters earlier than increase in alanine aminotransferase, which is routinely used to diagnoseliver damage. In addition, these changes are also observed in C57BL/6 and Nos22/2 mice. There is no difference in thekinetics of expression of these three molecules in both strains of mice, the extent of damage is similar and corroboratedwith ALT and histological analysis. Quantification of cytokines in sera showed increase upon APAP treatment. Although thelevels of Tnfa and Ifnc in sera are not significantly affected, Nos22/2 mice display lower Il6 but higher Il10 levels during thisacute model of hepatotoxicity. Overall, this study reinforces the growing potential of Fourier Transform Infraredmicrospectroscopy as a fast, highly sensitive and label-free technique for non-invasive diagnosis of liver damage. Thecombination of Fourier Transform Infrared microspectroscopy and cytokine analysis is a powerful tool to identify multiplebiomarkers, understand differential host responses and evaluate therapeutic regimens during liver damage and, possibly,other diseases.
Citation: Gautam R, Chandrasekar B, Deobagkar-Lele M, Rakshit S, Kumar B. N. V, et al. (2012) Identification of Early Biomarkers during Acetaminophen-InducedHepatotoxicity by Fourier Transform Infrared Microspectroscopy. PLoS ONE 7(9): e45521. doi:10.1371/journal.pone.0045521
Editor: Partha Mukhopadhyay, National Institutes of Health, United States of America
Received April 16, 2012; Accepted August 20, 2012; Published September 19, 2012
Copyright: � 2012 Gautam et al. This is an open-access article distributed under the terms of the Creative Commons Attribution License, which permitsunrestricted use, distribution, and reproduction in any medium, provided the original author and source are credited.
Funding: This study is funded by Program support from the Department of Biotechnology, Government of India. SU acknowledges the J C Bose fellowship fromDST. RG and BC are supported by student fellowships from CSIR and DBT respectively. MD is supported by SPM fellowship from CSIR. SR is thankful for apostdoctoral fellowship from DBT. The funders had no role in study design, data collection and analysis, decision to publish, or preparation of the manuscript.
Competing Interests: The authors have declared that no competing interests exist.
* E-mail: [email protected] (DN); [email protected] (SU)
. These authors contributed equally to this work.
Introduction
Drug-induced hepatotoxicity has been attributed to be the
cause for a major percentage of patient morbidity and mortality.
It is well established that the liver plays an important role in
drug metabolism and is, thus, highly susceptible to drug toxicity.
Acetaminophen (APAP) is an analgesic and antipyretic drug
which is extensively used for therapeutic purposes. The
probability of developing liver injury due to consumption of
APAP as prescribed is low; however, APAP consumption with
alcohol, during fasting and malnutrition for prolonged periods
may trigger hepatotoxicity. Also, accidental and intentional over
dosing of APAP is a cause of major health concern as it is the
main source of acute liver failure in the Western world.
Suspected APAP hepatotoxicity can be effectively treated with
N-acetylcysteine, yet an estimated 500 patients die each year in
the USA [1,2]. Hence, there is a need to better understand,
diagnose and effectively treat cases of APAP-induced hepato-
toxicity.
APAP is readily absorbed by the gastrointestinal tract and
metabolized by three main pathways: glucuronidation, sulfation
and N-hydroxylation and rearrangement. Most of the final
metabolic products of APAP are non-toxic and excreted by the
urine. However, a minor metabolite known as N-acetyl-p-
benzoquinone imine (NAPQI), which is produced due to the
action of the liver cytochrome P450 system, is harmful. Several
human isoforms of the cytochrome P450 enzymes have been
implicated in the bioactivation of APAP and in the generation
of intermediates during APAP metabolism [3]. NAPQI conju-
gates with glutathione (GSH) and is then further metabolized to
form cysteine and mercapturic acid conjugates. However,
overdose of APAP leads to the saturation of the conjugation
pathways and the depletion of GSH induces oxidative stress.
Consequently, NAPQI forms covalent bonds with several
protein and non-protein thiols leading to cell death [4,5].
PLOS ONE | www.plosone.org 1 September 2012 | Volume 7 | Issue 9 | e45521

Several biochemical and cellular changes occur during APAP-
induced liver damage: increase in free radicals, c-Jun N-terminal
Kinase activation, greater mitochondrial dysfunction, nuclear
DNA fragmentation, etc. Due to necrosis, endogenous adjuvants
are released which trigger the release of cytokines and
chemokines [5]. Despite several biochemical and clinical studies,
APAP-induced hepatotoxicity has not been completely under-
stood. Serum alanine aminotransferase (ALT) and/or aspartate
aminotransferase activity are the most frequently used biomark-
ers to detect hepatocellular injury in clinical practice. However,
there is a crucial need for newer techniques which can provide
molecular-level information on functional groups, bonding types,
and conformations to help detect and, possibly, treat liver injury
at early stages.
A variety of imaging modalities are currently used in
medicine such as Magnetic Resonance Imaging, Positron
Electron Tomography, Computed Tomography, optical biolu-
minescence, fluorescence etc [6]. Some of them use X-rays or
c-rays which are destructive to biological samples apart from
the need for sample to be tagged using specific dyes or contrast
agents that can potentially harm the integrity of the sample
under study. Also, a technique like Nuclear Magnetic Reso-
nance needs sample to be homogenized and metabolites isolated
in a specific manner in order to obtain comprehensible results.
The other main limitations encountered by several imaging
techniques are poor sensitivity and resolution [7–9]. Therefore,
it is not easy to find a single technique which meets the need
for high sensitivity and high spatial resolution for specific
applications. Different analytical techniques have been used to
study APAP-induced toxicity, including Nuclear Magnetic
Resonance spectroscopy [10], Mass Spectrometry [11] and
Magnetic Resonance Imaging [12].
Recent advances in imaging applications with different
degrees of sensitivity and resolution are used in medicine and
label free imaging is an emerging technology [8,13]. Fourier
Transform Infrared (FTIR) spectroscopy is one such label free
method, in which infrared radiations interact with matter and
are selectively absorbed by it according to their chemical
composition, thus creating a molecular fingerprint [14]. FTIR
microspectroscopy, a combination of FTIR spectroscopy and
microscopy, is a proven cutting edge technique applied in the
fields of histology, cytology and clinical chemistry to understand
biological processes at the molecular level [15,16]. In addition,
FTIR imaging technique has been used for early diagnosis and
progression of bacterial and fungal infections and for under-
standing the underlying chemical and morphological changes in
tissue samples such as breast and bone nodal tissues [17–19].
During APAP-induced hepatotoxicity, pro-inflammatory cyto-
kines, e.g. Ifnc, are well known to up-regulate nitric oxide synthase
(Nos) 2, resulting in increase in nitric oxide, a key signalling
mediator. Increase in nitro-tyrosine adducts in the hepatic centro-
lobular cells are observed during APAP-induced liver damage.
Also, regulatory circuits control the production of some cytokines
via Nos2. However, reports on the functional roles of Nos2 during
APAP-induced liver damage are inconsistent [20–24]. Studies with
specific inhibitors to Nos showed the role of nitric oxide in APAP
induced hepatotoxicity [20,21]. Interestingly, intra-peritoneal
injection of APAP in Nos22/2 mice showed reduced [22] or
similar [23,24] susceptibility compared to wild type controls. Also,
no difference in liver damage was found in mice lacking Nos2 in a
cadmium model of liver toxicity [25]. Hence it was important to
address the role of Nos2 in our model of APAP-induced
hepatotoxicity with respect to two aspects: functional consequenc-
es and regulation of biomarkers. In the present study, some aspects
of APAP-induced hepatotoxicity were investigated using FTIR
microspectroscopy. Initial experiments were performed using
BALB/c mice and the role of Nos2 during APAP-induced
hepatotoxicity was addressed using C57BL/6 and Nos22/2 mice.
This study focuses on finding novel markers using FTIR imaging
which, coupled with cytokine responses, will be helpful for rapid
diagnosis and better understanding of host responses during liver
damage.
Results
FTIR Spectra Reveal Changes in Liver upon APAPTreatment
To obtain novel insights in the APAP induced liver injury
process, FTIR spectra were recorded from control and APAP
treated BALB/c mice (6 h) livers. A schematic model repre-
senting the experimental strategies and analysis is shown
(Figure 1). The FTIR spectra (950–3800 cm21) were complex
(Figure S1A) and represented numerous bands arising from the
contribution of different functional groups of macromolecules
[26,27]. The tentative assignments of principle IR bands are
shown in Table 1.
FTIR spectra indicated changes in the region (950–1200 cm21)
(Figure 2A). Control livers exhibited a strong absorption at
1030 cm21 (C–O stretch), 1080 cm21 (PO2– symmetric stretch)
and 1152 cm21 (CO–O–C asymmetric stretch), arising mostly due
to glycogen. However, these specific absorption bands for glycogen
greatly decreased in APAP treated livers. Also, the ratio of the
band intensities at 966 cm21 (C-O stretch, deoxyribose, C-N+-C
stretch) to 996 cm21 (C-O stretch, ribose) increased in APAP
treated mice livers in comparison to their controls. The band at
1171 cm21, corresponding to CO-O-C asymmetric stretching
vibration of ester bonds in cholesteryl esters (phospholipids and
cholesterol), also increased in APAP treated mice liver in
comparison to their controls.
Bands Corresponding to Glycogen, Cholesteryl Esters andDNA are Kinetically Regulated upon APAP Treatment
To understand the regulation of above mentioned markers
upon APAP treatment, kinetic experiments were performed.
Glycogen (IR bands at 1030 cm21, 1080 cm21 and 1152 cm21)
decreased in a time dependent manner upon APAP treatment in
liver (Figure 2B and Figure S1C). This decrease was rapid,
significant and occurred as early as 0.5 h and did not recover until
6 h post APAP treatment. Esters of cholesterol and phospholipids
(IR bands 1171 cm21/1152 cm21) increased rapidly by 0.5 h and
were sustained up to 6 h post APAP treatment (Figure 2C). Also,
DNA/RNA ratio (IR band ratio 966 cm21/996 cm21) increased
significantly by 0.5 h, peaking at about 1.5 h and thereafter was
sustained up to 6 h post APAP treatment (Figure 2D). It is
important to highlight here that the FTIR spectral changes
observed (950–1200 cm21) between control and APAP treated
mice were specific to livers and not to other organs, e.g. spleen
(Figure 3).
The changes observed using FTIR correlated well with
biochemical changes that occur quickly with APAP treatment in
liver, i.e. significant drop in total GSH (Figure 4A) and rise in
malonaldehyde amounts (Figure 4B). On the other hand, liver
damage after APAP dosing, as assessed by the increase in amounts
of ALT in sera (Figure 2E) and histological examination of liver
sections (Figure 2F and Figure 4C), occurred at later time points.
Both the biological assays indicated a substantial rise in liver injury
only from 3 h post APAP treatment that peaked with maximum
damage by 6 h.
FTIR Analysis of APAP-Induced Liver Damage
PLOS ONE | www.plosone.org 2 September 2012 | Volume 7 | Issue 9 | e45521

FTIR Analysis of Amelioration of APAP Hepatotoxicity byL-methionine (L-met)
To delineate the sequence of molecular changes detected by
FTIR, experiments were performed in APAP treated mice with an
antidote, e.g. L-met. Both pre (20.5 h) as well as post (+0.5 h) L-
met treatment of APAP treated mice rescued hepatotoxicity as
revealed by ALT amounts (Figure 5A). FTIR spectra analysis of
livers from these experiments revealed interesting differences
between pre and post L-met treated groups (Figure 5B). L-met pre
treatment, but not post, restored glycogen (Figure 5C and Figure
S2) and DNA (Figure 5E) to levels almost equivalent to control
mice. However, in case of cholesteryl esters, both pre and post L-
met treatment showed significant rescue (Figure 5D). Most likely,
the drop in glycogen levels and increase in DNA amounts are
molecular changes that are sensitive to the early rise in oxidative
stress.
FTIR does not Differentiate any Molecular Changes inAPAP Treated C57BL/6 and Nos22/2 Mice
Next, experiments with another mouse strain, C57BL/6 were
performed. Since the role of Nos2 during APAP induced
hepatotoxicity has been controversial [22–24], a comparative
kinetic analysis of C57BL/6 and Nos22/2 mice treated with APAP
was performed. Importantly, no difference in the pattern of serum
Figure 1. A schematic representation of the experimental strategy and analysis performed in this study.doi:10.1371/journal.pone.0045521.g001
Table 1. Band assignments for the IR spectra [26,27].
Wavenumber (cm–1) Spectral assignments
966 C-O stretch deoxyribose and C-N+-C stretch (mainly from DNA)
996 C-O stretch ribose (mainly from RNA)
1030 C–O stretch (mainly from glycogen)
1080 PO2– symmetric stretch in glycogen and nucleic acids
1152 CO–O–C asymmetric stretch (mainly from glycogen)
1171 CO-O-C asymmetric stretch from ester bonds in cholesteryl esters
1238 PO2– asymmetric stretch (mainly nucleic acids)
1397 COO- symmetric stretch in fatty acids and amino acids
1451 CH2 bending (mainly from lipids)
1542 N–H bending and C–N stretch in proteins (Amide II)
1648 C——O stretch in proteins (Amide I)
1741 C——O stretch in triglycerides and cholesterol esters
2856 CH2 symmetric stretch (mainly from lipids)
2875 CH2 symmetric stretch (mainly from lipids)
2926 CH2 asymmetric stretch (mainly from lipids)
2956 CH3 asymmetric stretch (mainly from lipids)
3012 = C-H stretch (mainly from unsaturated lipids)
doi:10.1371/journal.pone.0045521.t001
FTIR Analysis of APAP-Induced Liver Damage
PLOS ONE | www.plosone.org 3 September 2012 | Volume 7 | Issue 9 | e45521

ALT, liver malonaldehyde and GSH amounts (Figure 6) was
observed. Also, histological examination of liver sections (Figure
S3) indicated that damage was similar in C57BL/6 and Nos22/2
mice treated with APAP. FTIR spectral analysis (Figure 7)
revealed that the pattern of decrease in glycogen levels, increase
in cholesteryl ester levels and increase in DNA levels was similar in
C57BL/6 and Nos22/2 mice treated with APAP.
Figure 2. FTIR analysis of APAP induced liver damage in BALB/c mice. FTIR spectra (950 cm21 to 1200 cm21) of control and APAP treatedmice livers at indicated time points. Arrows indicate the wave numbers where differences were observed (A). Kinetic changes in the liver glycogen (B),Cholesteryl ester (C), DNA (D) and ALT (E) amounts in APAP treated mice. The extent of necrosis in control and APAP treated mice livers at indicatedtime points was quantified after Hematoxylin and eosin staining (F). All the data are shown as mean 6 S.E. with n = 3 mice or more.doi:10.1371/journal.pone.0045521.g002
Figure 3. Kinetic analysis of spleen post oral dosing with APAP in mice using FTIR. Changes in glycogen (1030 cm21/1080 cm21; A),cholesteryl ester (1171 cm21/1152 cm21; B) and DNA (966 cm21/996 cm21; C) in sera from APAP treated BALB/c mice. All the data are represented asmean 6 S.E. with n = 3 mice.doi:10.1371/journal.pone.0045521.g003
FTIR Analysis of APAP-Induced Liver Damage
PLOS ONE | www.plosone.org 4 September 2012 | Volume 7 | Issue 9 | e45521

FTIR Detects Changes in Sera of Mice Dosed with APAPFor ease in detection of liver damage, we used sera of mice
treated with APAP for FTIR analysis. Interestingly, similar
patterns as observed with liver sections, i.e. decrease in glycogen
levels, increase in cholesteryl esters and DNA levels (Figure 8) were
found. These data suggest that the pattern of molecular changes
detected by FTIR at the site of catabolism of APAP, i.e. liver,
could also be detected in sera, although the kinetics was delayed
(1.5 h). In addition, these changes were similar in sera of both
C57BL/6 and Nos22/2 mice treated with APAP (Figure 9).
Modulation of Cytokines during APAP InducedHepatotoxicity
Analysis of the immune response in terms of serological analysis of
cytokines involved in APAP hepatotoxicity was also performed.
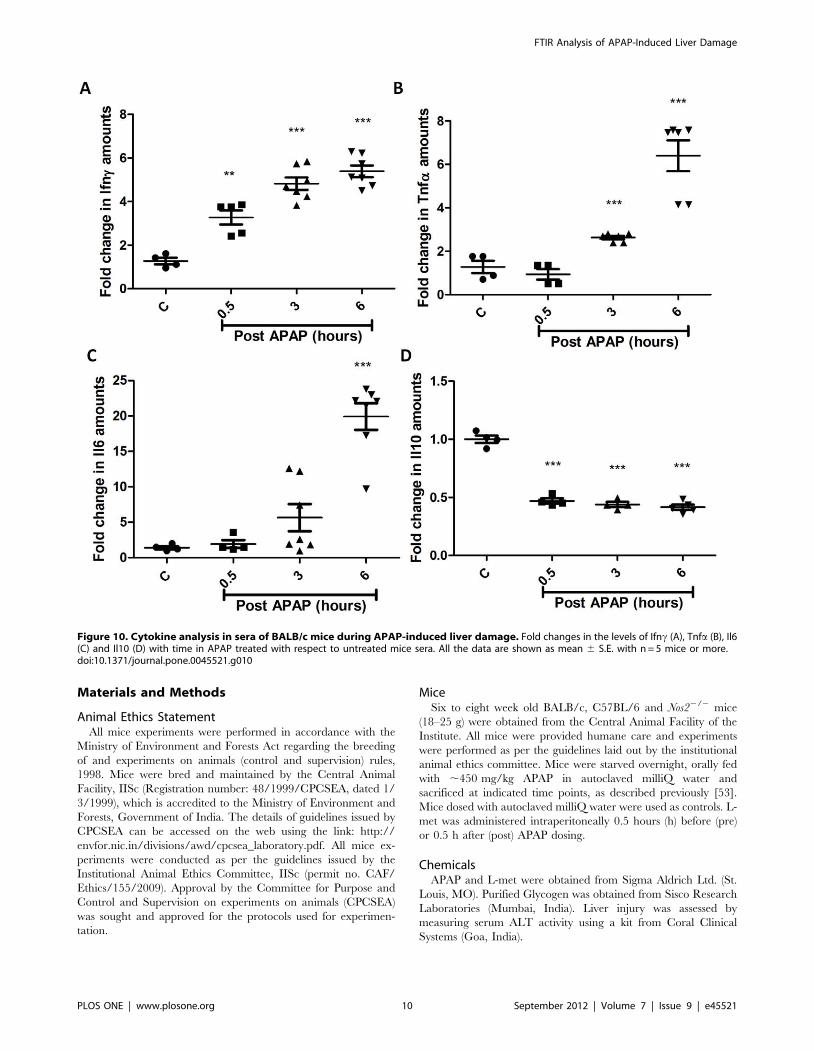
Serum levels of Ifnc, Tnfa and Il6 increased but Il10 levels decreased
with time post APAP treatment in BALB/c mice (Figure 10).
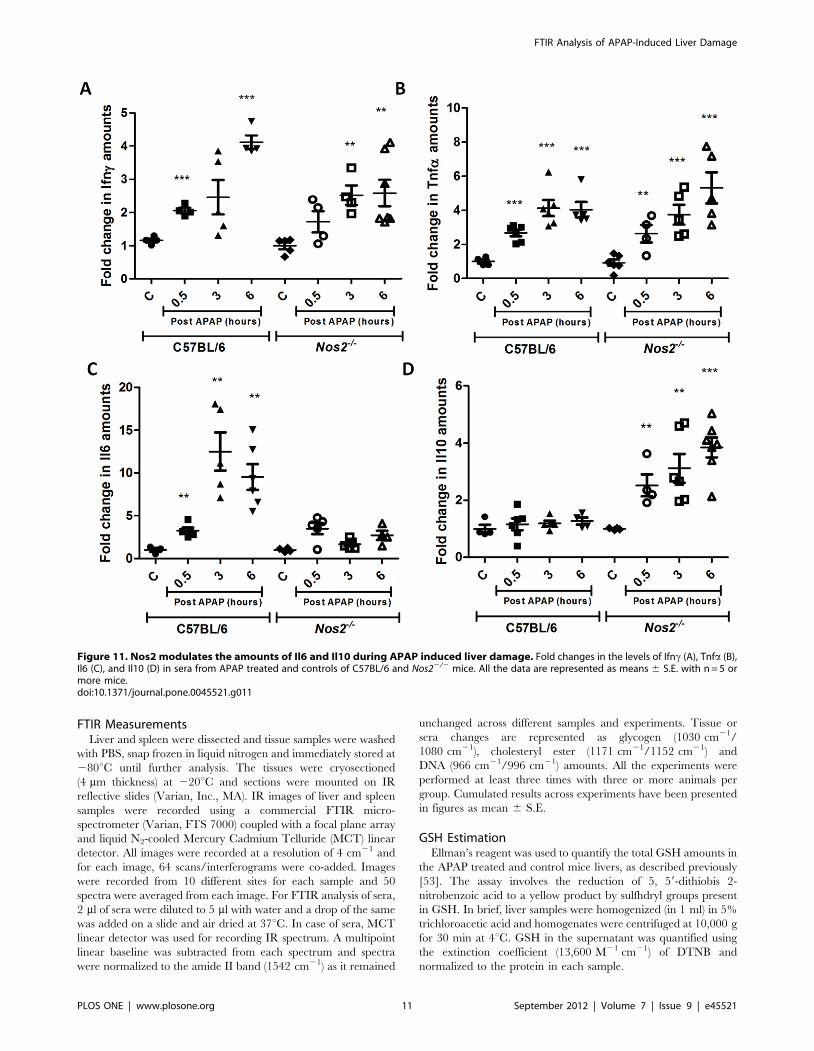
Cytokine analysis in the sera of C57BL/6 and Nos22/2 mice treated
with APAP revealed some differences. The pattern of changes in Ifnc(Figure 11A) and Tnfa (Figure 11B) in sera were not different in
C57BL/6 and Nos22/2 mice treated with APAP. However, Il6 levels
(Figure 11C) increased with time upon APAP treatment in C57BL/6
mice but did not increase as much in Nos22/2 mice at later time
points post APAP dosing. Interestingly, in Nos22/2 mice treated with
APAP, serum Il10 levels (Figure 11D) increased with time unlike in
C57BL/6 mice.
Discussion
There are three aspects to this study involving oral dosing of
mice, the physiological route of entry, with APAP: First is the
feasibility of using FTIR spectroscopy to diagnose APAP induced
liver toxicity with high sensitivity using liver samples or sera.
Second is the decrease in glycogen and increase in DNA as
molecular changes that are highly sensitive to lowering of GSH
amounts which probably leads to oxidative stress. In the third part,
cytokine analysis of sera revealed the role of Nos2 in modulating
some cytokines, i.e. Il6 and Il10.
The FTIR spectral data analysis detected the changes in injured
mice liver as early as 0.5 h (Figure 2 and Figure S1) and these
changes were specific to the liver and not spleen (Figure 3). There
was an early and significant drop in liver glycogen amounts that
remained low over time. While the drop in glycogen was specific to
liver and sera but not spleen, upon APAP-induced hepatotoxicity,
lower glycogen amounts is also observed in CCl4 induced
hepatotoxicity and hepatectomy [28,29]. On the other hand, in
cases of HCV infection and liver cirrhosis, glycogen amounts in
Figure 4. Biochemical and histological analysis of APAP induced liver damage in BALB/c mice. Total GSH amounts (A), malonaldehydeamounts (B) and hematoxylin and eosin staining (C) of livers upon APAP treatment in BALB/c mice. Arrows indicate necrotic lesions (C). Each panelrepresents data from experiments with n = 3 mice.doi:10.1371/journal.pone.0045521.g004
FTIR Analysis of APAP-Induced Liver Damage
PLOS ONE | www.plosone.org 5 September 2012 | Volume 7 | Issue 9 | e45521

liver increases [30,31]. In fact, glycogen indeed corresponds to the
decrease in the ratio of wave numbers 1030 and 1080 using FTIR
microspectroscopy was confirmed using purified glycogen (Figure
S4). Therefore, the drop in glycogen amounts during APAP-
induced hepatotoxicity should be included along with other
markers, e.g. increase in DNA, cholesteryl esters, ALT etc to
diagnose disease progression. The sustained depletion in glycogen
may be due to multiple reasons: First, mitochondrial respiration is
known to be impaired upon APAP induced hepatotoxicity [32],
which may lower glycogen amounts due to enhanced glycolysis.
Second, studies using inhibitors and genetic knockout mice which
results in low glutathione amounts also lowers the cellular glycogen
pool. For example, low glutathione amounts decreases the activity
of enzymes involved in glycogen metabolism (e.g. glycogen
synthase), thus lowering glycogen amounts [33]. Also, in hepato-
cytes, upon treatment with GSH deficiency inducing agents like
menadione and BSO causes decrease in cellular pools of glycogen
[34]. Finally, astrocytes from glutamate cysteine ligase modulatory
subunit knockout mice contain less endogenous amounts of GSH,
also display lower glycogen amounts compared to the wild type
astrocytes [35]. Our studies with pre and post L-met treatment of
mice dosed with APAP also showed that glycogen decrease was
dependent on early GSH depletion and was abolished upon pre–
treatment of mice with L-met (Figure 5). This aspect is important
as both L-met and N-acetylcysteine are well known to feed into
GSH synthesis pathway [36].
The presence of a band at 1171 cm21 due to CO-O-C
asymmetric stretching vibration of ester bonds in cholesteryl esters
indicates disturbance in lipid metabolism. Cholesteryl esters are
formed due to the linkage of cholesterol with fatty acid acyl
coenzyme A. Increase in cholesteryl esters is associated with
obesity, degeneration of the hippocampus and cancerous tissue
due to increased proliferation [37,38]. Interestingly, Toyran et al.
observed that intensity of the band at 1171 cm21 decreases
whereas the band at 1151 cm21 increases in the diabetic group
with respect to the control [26]. Most likely, the increase in the
intensity of the band at 1151 cm21 in the diabetic group is due to
increase in glycogen. It is known that high amounts of plasma non-
esterified fatty acids cause glycogen accumulation due to
alterations in carbohydrate and lipid metabolism during diabetes.
Further studies are required to understand the physiological
implications of the increase in cholesteryl esters during liver
damage.
The increase in 966/996 cm21 ratio i.e. the increase in DNA
has at least three potential explanations: (i) proliferation of cells, (ii)
inflammatory cell infiltration and (iii) necrosis and apoptosis at the
site of liver injury. The probability that the rise in DNA was due to
increased proliferation of cells was low as, only 10 out of 20,000
liver cells undergo division since the majority are mitotically
inactive [39]. Also, liver regeneration occurs much later after
injury, ,72 h after initiation of damage [39,40]. The infiltration
of inflammatory cells during liver damage was negligible in this
Figure 5. Studies with pre and post L-methionine treatment in APAP treated BALB/c mice. Changes in ALT amounts in sera upon pre andpost L-methionine treatment in APAP treated mice (A). FTIR spectra (950 cm21 to 1200 cm21) of pre- and post- L-methionine treatment in APAPtreated mice livers (B). Changes in glycogen (C), cholesteryl ester (D) and DNA (E) amounts upon pre and post L-methionine treatment of APAPtreated mice livers. All data are represented as mean 6 S.E. with n = 5 or more mice.doi:10.1371/journal.pone.0045521.g005
FTIR Analysis of APAP-Induced Liver Damage
PLOS ONE | www.plosone.org 6 September 2012 | Volume 7 | Issue 9 | e45521

model (Figure 4C and Figure S3). Most likely, the increase in
detection of DNA was due to cell death as a possible consequence
of the translocation of Bax into the mitochondria [41].
The role of preventive or therapeutic treatment for liver damage
was addressed by injecting L-met before or after APAP dosing.
Liver damage as assessed by studying ALT amounts in the sera
indicated complete recovery under both conditions. However,
FTIR analysis clearly revealed differences and, with post L-met
treatment, reduction in glycogen and increase in DNA were
clearly observed (Figure 5). Most likely, these two changes were
more sensitive to early increase in oxidative stress. This study has
clearly defined the molecular changes that are differentially
responsive to early or late changes in the GSH amounts in livers
undergoing injury.
The cellular and biochemical processes associated with
APAP-induced liver damage are well studied [1,4,5]. Both
glycogen and GSH are known to be greatly reduced following
APAP administration [42]. Also, DNA is released in the sera
following liver damage and has been used as a marker [43].
Spectral changes observed in case of liver tissue were also
observed with sera although the kinetics were delayed, e.g. 1.5 h
compared to 0.5 h (Figure 2 and Figure 8). However, rise in
ALT amounts in the sera was observed much later, e.g. 3 h
after APAP dosing (Figure 2E and Figure 6). Importantly, in
this model of acute hepatotoxicity, FTIR spectroscopy was able
to consistently identify different molecules, e.g. glycogen, lipids,
nucleic acids etc., while using the same sample. Notably, FTIR
microspectroscopy analysis did not identify other markers that
have been reported to be associated with APAP induced
hepatotoxicity, e.g. increase in collagen (1395 cm21), consistent-
ly across samples [44]. This aspect of using multiple markers to
monitor disease progression may be more reliable than using a
single marker. In fact the addition of new biomarkers to existing
ones to predict disease susceptibility of patients is of growing
interest. For example, in cardiovascular diseases, the use of a
single biomarker is not definitive in predicting the progression
or susceptibility to disease [45]. In addition, this study reinforces
the ability of FTIR to analyze heterogeneous tissue samples to
closely study the complex injury process. FTIR studies related
to liver toxicity due to various chemicals like Cd2+ and CCl4
Figure 6. Changes in sera ALT (A), liver GSH (B) and liver malonaldehyde amounts (C) from APAP treated C57BL/6 and Nos22/2
mice. All the data are represented as mean 6 S.E. with n = 3 or more mice.doi:10.1371/journal.pone.0045521.g006
FTIR Analysis of APAP-Induced Liver Damage
PLOS ONE | www.plosone.org 7 September 2012 | Volume 7 | Issue 9 | e45521
have been reported wherein liver tissue samples were investi-
gated in powdered or homogenized extracts [46,47]. However,
this is the first report of the use of FTIR to study APAP-
induced liver damage using cryosectioned tissue, thereby
avoiding any possible alterations of the sample. FTIR is very
sensitive and detected very early biochemical changes in both
liver as well as sera compared with existing biochemical assays.
This study highlights the potential of using FTIR as a single
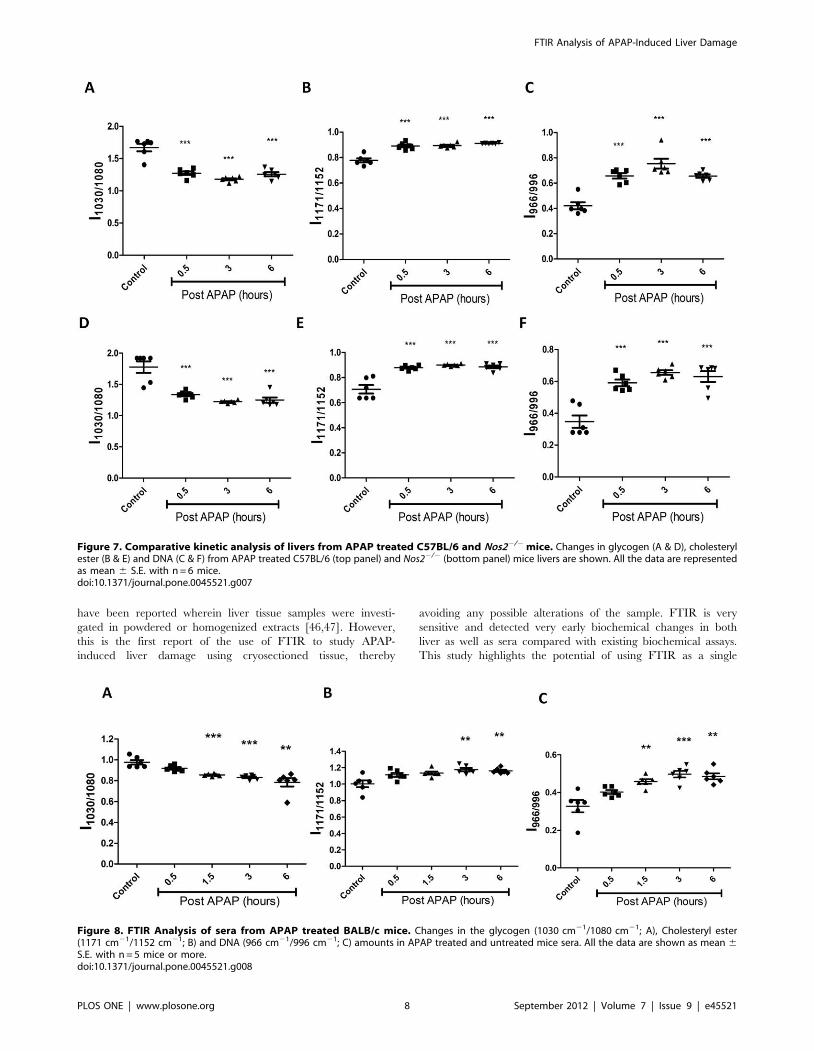
Figure 7. Comparative kinetic analysis of livers from APAP treated C57BL/6 and Nos22/2 mice. Changes in glycogen (A & D), cholesterylester (B & E) and DNA (C & F) from APAP treated C57BL/6 (top panel) and Nos22/2 (bottom panel) mice livers are shown. All the data are representedas mean 6 S.E. with n = 6 mice.doi:10.1371/journal.pone.0045521.g007
Figure 8. FTIR Analysis of sera from APAP treated BALB/c mice. Changes in the glycogen (1030 cm21/1080 cm21; A), Cholesteryl ester(1171 cm21/1152 cm21; B) and DNA (966 cm21/996 cm21; C) amounts in APAP treated and untreated mice sera. All the data are shown as mean 6S.E. with n = 5 mice or more.doi:10.1371/journal.pone.0045521.g008
FTIR Analysis of APAP-Induced Liver Damage
PLOS ONE | www.plosone.org 8 September 2012 | Volume 7 | Issue 9 | e45521

non-invasive alternative to the more established individual
biochemical assays to monitor disease progression. Furthermore,
FTIR microspectroscopy can be used to identify novel
biochemical markers in APAP induced hepatotoxicity and other
diseases that can be eventually validated using standard
biochemical assays or methods. It needs to be highlighted that
the changes in biomarkers observed in this study are only in
mice and cannot be directly extrapolated to human patients
with APAP induced hepatotoxicity. Further studies will be
required to identify and validate these biomarkers using FTIR
microspectroscopy in other liver injury models and, more
importantly, in patients with liver injury and disease.
As there are conflicting reports on the role of Nos2 in
modulating APAP-induced liver damage [22–24], experiments
were designed to address this issue. Unlike a previous report
that showed that ALT amounts are lower but lipid peroxidation
is increased in Nos22/2 mice upon APAP dosing [23], no
differences were observed with respect to FTIR spectroscopy,
GSH, malonaldehyde, ALT amounts and histology between
C57BL/6 and Nos22/2 mice (Figure 6, Figure 7, Figure 9 and
Figure S3); however, differences were observed with some
cytokines (Figure 11). Differential cytokine modulation has been
shown in the APAP model of liver toxicity. In fact, the higher
expression of Il6 in mice has been associated with reduced liver
damage [48]. Il6 is known as a hepatocyte growth factor and is
important for liver regeneration [39]. In fact, Il6 increases faster
in C57BL/6 mice whereas Il10 is reduced in BALB/c mice
(Figure 10 and Figure 11). It appears that Nos2 increased Il6
but decreased Il10 levels during APAP-induced hepatotoxicity
(Figure 11). Interestingly, nitric oxide has been shown to inhibit
the production of Il6 in rat Kupffer cells [49]. In an endotoxin
model of lung inflammation, Nos2 has been shown to be
important in decreasing Il12 and increasing Il10 amounts in the
lung [50]. Also, the presence of Nos2 has been shown to reduce
Tnfa and increase Il10 during APAP-induced liver damage
[22]. Several reports have shown that Il10 reduces Nos2
induction, which in turn reduces inflammatory responses
[51,52]. Nos2 also regulates Il10 and this aspect is interesting
as mice lacking Il10 are shown to be more susceptible to APAP-
induced liver damage most likely due to increased production of
Nos2 and pro-inflammatory cytokines that increase immunopa-
thology [24].
Overall, this study demonstrates the efficacy of using sera
combined with FTIR and cytokine analysis as a non-invasive,
rapid and sensitive assay to diagnose liver damage. The cytokine
studies are important as they reveal the potential role of
differential genetic predispositions in modulating immune re-
sponses during liver diseases. Overall, the combination of FTIR
and cytokine analysis will open new avenues for rapid diagnosis
and a more comprehensive understanding of liver injury and,
perhaps, other diseases.
Figure 9. FTIR Analysis of sera from APAP treated C57BL/6 and Nos22/2 mice. Changes in the glycogen (A, D), Cholesteryl ester (B, E) andDNA (C, F) amounts from C57BL/6 (top panel) and Nos22/2 (bottom panel) mice with time in APAP treated and untreated mice sera. All the data areshown as mean 6 S.E. with n = 7 mice.doi:10.1371/journal.pone.0045521.g009
FTIR Analysis of APAP-Induced Liver Damage
PLOS ONE | www.plosone.org 9 September 2012 | Volume 7 | Issue 9 | e45521
Materials and Methods
Animal Ethics StatementAll mice experiments were performed in accordance with the
Ministry of Environment and Forests Act regarding the breeding
of and experiments on animals (control and supervision) rules,
1998. Mice were bred and maintained by the Central Animal
Facility, IISc (Registration number: 48/1999/CPCSEA, dated 1/
3/1999), which is accredited to the Ministry of Environment and
Forests, Government of India. The details of guidelines issued by
CPCSEA can be accessed on the web using the link: http://
envfor.nic.in/divisions/awd/cpcsea_laboratory.pdf. All mice ex-
periments were conducted as per the guidelines issued by the
Institutional Animal Ethics Committee, IISc (permit no. CAF/
Ethics/155/2009). Approval by the Committee for Purpose and
Control and Supervision on experiments on animals (CPCSEA)
was sought and approved for the protocols used for experimen-
tation.
MiceSix to eight week old BALB/c, C57BL/6 and Nos22/2 mice
(18–25 g) were obtained from the Central Animal Facility of the
Institute. All mice were provided humane care and experiments
were performed as per the guidelines laid out by the institutional
animal ethics committee. Mice were starved overnight, orally fed
with ,450 mg/kg APAP in autoclaved milliQ water and
sacrificed at indicated time points, as described previously [53].
Mice dosed with autoclaved milliQ water were used as controls. L-
met was administered intraperitoneally 0.5 hours (h) before (pre)
or 0.5 h after (post) APAP dosing.
ChemicalsAPAP and L-met were obtained from Sigma Aldrich Ltd. (St.
Louis, MO). Purified Glycogen was obtained from Sisco Research
Laboratories (Mumbai, India). Liver injury was assessed by
measuring serum ALT activity using a kit from Coral Clinical
Systems (Goa, India).
Figure 10. Cytokine analysis in sera of BALB/c mice during APAP-induced liver damage. Fold changes in the levels of Ifnc (A), Tnfa (B), Il6(C) and Il10 (D) with time in APAP treated with respect to untreated mice sera. All the data are shown as mean 6 S.E. with n = 5 mice or more.doi:10.1371/journal.pone.0045521.g010
FTIR Analysis of APAP-Induced Liver Damage
PLOS ONE | www.plosone.org 10 September 2012 | Volume 7 | Issue 9 | e45521
FTIR MeasurementsLiver and spleen were dissected and tissue samples were washed
with PBS, snap frozen in liquid nitrogen and immediately stored at
280uC until further analysis. The tissues were cryosectioned
(4 mm thickness) at 220uC and sections were mounted on IR
reflective slides (Varian, Inc., MA). IR images of liver and spleen
samples were recorded using a commercial FTIR micro-
spectrometer (Varian, FTS 7000) coupled with a focal plane array
and liquid N2-cooled Mercury Cadmium Telluride (MCT) linear
detector. All images were recorded at a resolution of 4 cm21 and
for each image, 64 scans/interferograms were co-added. Images
were recorded from 10 different sites for each sample and 50
spectra were averaged from each image. For FTIR analysis of sera,
2 ml of sera were diluted to 5 ml with water and a drop of the same
was added on a slide and air dried at 37uC. In case of sera, MCT
linear detector was used for recording IR spectrum. A multipoint
linear baseline was subtracted from each spectrum and spectra
were normalized to the amide II band (1542 cm21) as it remained
unchanged across different samples and experiments. Tissue or
sera changes are represented as glycogen (1030 cm21/
1080 cm21), cholesteryl ester (1171 cm21/1152 cm21) and
DNA (966 cm21/996 cm21) amounts. All the experiments were
performed at least three times with three or more animals per
group. Cumulated results across experiments have been presented
in figures as mean 6 S.E.
GSH EstimationEllman’s reagent was used to quantify the total GSH amounts in
the APAP treated and control mice livers, as described previously
[53]. The assay involves the reduction of 5, 59-dithiobis 2-
nitrobenzoic acid to a yellow product by sulfhdryl groups present
in GSH. In brief, liver samples were homogenized (in 1 ml) in 5%
trichloroacetic acid and homogenates were centrifuged at 10,000 g
for 30 min at 4uC. GSH in the supernatant was quantified using
the extinction coefficient (13,600 M21 cm21) of DTNB and
normalized to the protein in each sample.
Figure 11. Nos2 modulates the amounts of Il6 and Il10 during APAP induced liver damage. Fold changes in the levels of Ifnc (A), Tnfa (B),Il6 (C), and Il10 (D) in sera from APAP treated and controls of C57BL/6 and Nos22/2 mice. All the data are represented as means 6 S.E. with n = 5 ormore mice.doi:10.1371/journal.pone.0045521.g011
FTIR Analysis of APAP-Induced Liver Damage
PLOS ONE | www.plosone.org 11 September 2012 | Volume 7 | Issue 9 | e45521
Histological AnalysisLiver tissues were dissected from mice and fixed overnight in
10% neutral formalin buffer. Sample blocks were prepared by
embedding liver tissues in paraffin wax, and sections were stained
with haematoxylin-eosin (H & E). Tissue sections were observed
using a light microscope and photographs were taken using a
Nikon camera fitted to the microscope. Briefly, necrotic lesions
were examined using low-power (250 X) light microscopy and
images were obtained using a digital camera. Quantification of
hepatic necrosis upon APAP treatment was performed as
previously reported [54].
Malonaldehyde QuantificationThe quantification of malonaldehyde amounts in the liver
samples was performed as described previously [55]. Briefly, liver
tissue samples were obtained at different time points and
homogenized in 1.15% KCl buffer. The homogenates were
centrifuged and 0.8% TBA, 0.25 N HCl and 10% TCA were
added to the supernatants. The mixture was incubated in boiling
water bath for 20 min, centrifuged and optical density at 535 nm
was measured using a micro plate reader (Versa Max, Molecular
Devices). The amount of malonaldehyde was calculated using a
1,1,3,3, tetra methoxy propane as external standard. The
malonaldehyde amounts were normalized with the protein content
in each sample.
Cytokine AnalysisSera obtained from mice in different experiments were used to
quantify the amounts of the following individual cytokines using
ELISA kits (eBioscience, U.S.A): Ifnc, Tnfa, Il6 and Il10. The
samples were diluted and the amounts detectable were in the
linear range of standards for each of the cytokines. The
manufacturer’s protocol was followed and the colorimetric
reaction was developed using TMB substrate, the amounts were
calculated from the absorbance measured at 450 nm using a micro
plate reader (Versa Max, Molecular Devices). Amounts were
calculated and represented as fold change with respect to
corresponding controls without APAP.
Statistical TestsData are expressed as mean 6 SE. Statistical analysis was
performed using Student’s t test using GraphPad Prism (5.0)
software. The degree of significance was represented by ‘‘asterisks’’
(*) for p,0.05 = *, p,0.01 = **, p,0.001 = ***, p,0.0001 = ****.
Supporting Information
Figure S1 FTIR spectra (950 cm21 to 3800 cm21) ofcontrol and APAP treated mice livers. Arrows indicate
regions of observable difference (A). Kinetic FTIR spectra
(950 cm21 to 1200 cm21) of control and APAP treated mice
spleen at indicated time points (B). FTIR images of control and
APAP treated mice livers; both white light and glycogen
distribution are shown in following order: (i) Control, (ii) 0.5 h,
(iii) 1.5 h, (iv) 3 h, and (v) 6 h – post APAP treatment (C). Each
image is a representative across experiments with n = 3 to 6 mice.
(TIF)
Figure S2 FTIR images of ,4 mm liver sections of thefollowing order: (i) Control, (ii) pre L-methioninetreatment (20.5 h), (iii) post L-methionine treatment(+0.5 h), (iv) APAP alone. All images represent data across
many experiments with n = 5 or more mice.
(TIF)
Figure S3 Hematoxylin and eosin stained liver sectionsfrom APAP treated and controls of C57BL/6 and Nos22/2
mice. Arrows indicate necrotic lesions. All images represent data
across many experiments with n = 3 or more mice.
(TIF)
Figure S4 FTIR spectra (950 cm21 to 1175 cm21) ofglycogen solution in milliQ water (black), control miceliver (blue) and 6 h post APAP treatment mice liver (red).Arrows indicate regions of observable difference.
(TIF)
Acknowledgments
We thank the Central Animal Facility, IISc for providing mice for
experimentation. The support by all members of the SU and DpN
laboratories is greatly appreciated.
Author Contributions
Conceived and designed the experiments: DN SU. Performed the
experiments: RG BC MD SR VK. Analyzed the data: RG BC MD SR
SU DN. Contributed reagents/materials/analysis tools: DN SU. Wrote the
paper: RG BC DN.
References
1. Fontana RJ (2008) Acute liver failure due to drugs. Semin Liver Dis. 28: 175–
187.
2. Larson MA, Polson J, Fontana JR, Davern JT, Lalani E, et al. (2005)
Acetaminophen-induced acute liver failure: results of a United States
multicenter, prospective study. Hepatology 42: 1364–1372.
3. Dong H, Haining RL, Thummel KE, Rettie AE, Nelson SD (2000) Involvement
of human cytochrome P450 2D6 in the bioactivation of acetaminophen. Drug
Metab Dispos. 28: 1397–1400.
4. Jaeschke H, Bajt ML (2006) Intracellular signalling mechanisms of acetamin-
ophen-induced liver cell death. Toxicol Sci. 89: 31–41.
5. Jaeschke H, Williams CD, Ramachandran A, Bajt ML (2012) Acetaminophen
hepatotoxicity and repair: the role of sterile inflammation and innate immunity.
Liver Int. 32: 8–20.
6. Baker M (2010) Whole-animal imaging: The whole picture. Nature 463: 977–
980.
7. Espina R, Yu L, Wang J, Tong Z, Vashishtha S, et al. (2009) Nuclear magnetic
resonance spectroscopy as a quantitative tool to determine the concentrations of
biologically produced metabolites: implications in metabolites in safety testing.
Chem Res Toxicol. 22: 299–310.
8. Sahu KR, Mordechai S (2005) Fourier Transform Infrared Spectroscopy in
Cancer Detection. Future Oncol. 1: 635–647.
9. Keren S, Zavaleta C, Cheng Z, de la Zerda A, Gheysens O, et al. (2008)
Noninvasive molecular imaging of small living subjects using Raman
spectroscopy. Proc Natl Acad Sci. USA 105: 5844–5849.
10. Schoonen WG, Kloks CP, Ploemen JP, Horbach GJ, Smit MJ, et al. (2007)
Sensitivity of (1)H NMR analysis of rat urine in relation to toxicometabonomics.
Part I: dose-dependent toxic effects of bromobenzene and paracetamol. Toxicol
Sci. 98: 271–285.
11. Sun J, Schnackenberg LK, Beger RD (2009) Studies of acetaminophen and
metabolites in urine and their correlations with toxicity using metabolomics.
Drug Metab Lett. 3: 130–136.
12. Brown AT, Ou X, James LP, Jambhekar K, Pandey T, et al. (2012) Correlation
of MRI findings to histology of acetaminophen toxicity in the mouse. Magn
Reson Imaging. 30: 283–289.
13. Chan JW, Lieu DK (2009) Label-free biochemical characterization of stem cells
using vibrational spectroscopy. J Biophoton. 2: 656–668.
14. Griffiths RP, de Haseth, AJ (2007) Fourier Transform Infrared Spectrometry.
John Wiley & Sons, Inc., Hoboken, New Jersey, USA.
15. Naumann D, Helm D, Labischinski H (1991) Microbiological characterizations
by FT-IR spectroscopy. Nature 351: 81–82.
16. Fernandez CD, Bhargava R, Hewitt MS, Levin WI (2005) Infrared
spectroscopic imaging for histopathologic recognition. Nat Biotechnol. 23:
469–474.
FTIR Analysis of APAP-Induced Liver Damage
PLOS ONE | www.plosone.org 12 September 2012 | Volume 7 | Issue 9 | e45521

17. Erukhimovitch V, Pavlov V, Talyshinsky M, Souprun Y, Huleihel M (2005)
FTIR microscopy as a method for identification of bacterial and fungalinfections. J Pharm Biomed Anal. 37: 1105–1108.
18. Kidder LH, Kalasinsky VF, Luke JL, Levin IW, Lewis EN (1997) Visualization
of silicone gel in human breast tissue using new infrared imaging spectroscopy.Nat Med. 3: 235–237.
19. Aydin HM, Hu B, Suso JS, El Haj A, Yang Y (2011) Study of tissue engineeredbone nodules by Fourier transform infrared spectroscopy. Analyst. 136: 775–
780.
20. Kamanaka Y, Kawabata A, Matsuya H, Taga C, Sekiguchi F, et al. (2003) Effectof a potent iNOS inhibitor (ONO-1714) on acetaminophen-induced hepato-
toxicity in the rat. Life Sci. 74: 793–802.21. Gardner CR, Heck DE, Yang CS, Thomas PE, Zhang XJ, et al. (1998) Role of
nitric oxide in acetaminophen-induced hepatotoxicity in the rat. Hepatology 27:748–754.
22. Gardner CR, Laskin JD, Dambach DM, Sacco M, Durham SK, et al. (2002)
Reduced hepatotoxicity of acetaminophen in mice lacking inducible nitric oxidesynthase: potential role of tumor necrosis factor-alpha and interleukin-10.
Toxicol Appl Pharmacol. 184: 27–36.23. Michael SL, Mayeux PR, Bucci TJ, Warbritton AR, Irwin LK, et al. (2001)
Acetaminophen-induced hepatotoxicity in mice lacking inducible nitric oxide
synthase activity. Nitric Oxide 5: 432–441.24. Bourdi M, Masubuchi Y, Reilly TP, Amouzadeh HR, Martin JL, et al. (2002)
Protection against acetaminophen-induced liver injury and lethality byinterleukin 10: role of inducible nitric oxide synthase. Hepatology 35: 289–298.
25. Harstad EB, Klaassen CD (2002) iNOS-null mice are not resistant to cadmiumchloride-induced hepatotoxicity. Toxicology 175: 83–90.
26. Toyran N, Lasch P, Naumann D, Turan B, Severcan F (2006) Early alterations
in myocardia and vessels of the diabetic rat heart: an FTIR microspectroscopicstudy. Biochem J. 397: 427–436.
27. Movasaghi Z, Rehman S, Rehman ur I (2008) Fourier Transform Infrared(FTIR) Spectroscopy of Biological Tissues. Applied Spectroscopy Reviews 43:
134–179.
28. Lockard VG, Mehendale HM, O’Neal RM (1983) Chlordecone-inducedpotentiation of carbon tetrachloride hepatotoxicity: a light and electron
microscopic study. Exp Mol Pathol. 39: 230–245.29. Kasahara H, Ohyanagi H, Saitoh Y (1988) Changes of gluconeogenesis and
alanine metabolism following partial hepatectomy in normal and cirrhotic rats.Nihon Geka Gakkai Zasshi. 89: 365–375.
30. Chiriboga L, Yee H, Diem M (2000) Infrared Spectroscopy of Human Cells and
Tissue. Part VI: A Comparative Study of Histopathology and InfraredMicrospectroscopy of Normal, Cirrhotic, and Cancerous Liver Tissue. Appl
Spectrosc. 54: 1–8.31. Tarasow E, Wiercinska-Drapało A, Jaroszewicz J, Siergiejczyk L, Orzechowska-
Bobkiewicz A, et al. (2004) Metabolic disturbances in liver 1H MR spectroscopy
in HIV and HCV co-infected patients as a potential marker of hepatocyteactivation. Acta Radiol. 45: 803–809.
32. Katyare SS, Satav JG (1989) Impaired mitochondrial oxidative energymetabolism following paracetamol-induced hepatotoxicity in the rat. Br J
Pharmacol. 96: 51–58.33. Braun L, Csala M, Poussu A, Garzo T, Mandl J, et al. (1996) Glutathione
depletion induces glycogenolysis dependent ascorbate synthesis in isolated
murine hepatocytes. FEBS Letters 388: 173–176.34. Braun L, Kardon T, Puskas F, Csala M, Banhegyi G, et al. (1997) Regulation of
glucuronidation by glutathione redox state through the alteration of UDP-glucose supply originating from glycogen metabolism. Arch Biochem Biophys.
348: 169–173.
35. Lavoie S, Allaman I, Petit JM, Do KQ, Magistretti PJ (2011) Altered glycogenmetabolism in cultured astrocytes from mice with chronic glutathione deficit;
relevance for neuroenergetics in schizophrenia. PLoS One 6: e22875.
36. Lu SC (1999) Regulation of hepatic glutathione synthesis: current concepts and
controversies. FASEB J. 13: 1169–1183.37. Kim JH, Ee SM, Jittiwat J, Ong ES, Farooqui AA, et al. (2011) Increased
expression of acyl-coenzyme A: cholesterol acyltransferase-1 and elevated
cholesteryl esters in the hippocampus after excitotoxic injury. Neuroscience 185:125–134.
38. Tosia RM, Tugnoli V (2005) Cholesteryl esters in malignancy. Clinica ChimicaActa 359: 27–45.
39. James PL, Lamps WL, McCullough S, Hinson AJ (2003) Interleukin 6 and
hepatocyte regeneration in acetaminophen toxicity in the mouse. Biochemicaland Biophysical Research Communications 309: 857–863.
40. Grypioti DA, Theocharis ES, Demopoulos AC, Papadopoulou-Daifoti Z,Basayiannis CA, et al. (2006) Effect of platelet-activating factor (PAF) receptor
antagonist (BN52021) on acetaminophen-induced acute liver injury andregeneration in rats. Liver Int. 26: 97–105.
41. Bajt ML, Farhood A, Lemasters JJ, Jaeschke H (2008) Mitochondrial bax
translocation accelerates DNA fragmentation and cell necrosis in a murinemodel of acetaminophen hepatotoxicity. J Pharmacol Exp Ther. 324: 8–14.
42. Hinson JA, Mays JB, Cameron AM (1983) Acetaminophen-induced hepaticglycogen depletion and hyperglycemia in mice. Biochem Pharmacol. 32: 1979–
1988.
43. Tran TT, Groben P, Pisetsky DS (2008) The release of DNA into the plasma ofmice following hepatic cell death by apoptosis and necrosis. Biomarkers 13: 184–
200.44. Sener G, Toklu HZ, Sehirli AO, Velioglu-Ogunc A, Cetinel S, et al. (2006)
Protective effects of resveratrol against acetaminophen-induced toxicity in mice.Hepatol Res. 35: 62–68.
45. Zethelius B, Berglund L, Sundstrom J, Ingelsson E, Basu S, et al. (2008) Use of
multiple biomarkers to improve the prediction of death from cardiovascularcauses. N Engl J Med. 358: 2107–2116.
46. Henczova M, Aranka Kiss Deer KA, Komlosi V, Mink J (2006) Detection oftoxic effects of Cd2+ on different fish species via liver cytochrome P450-
dependent monooxygenase activities and FTIR spectroscopy. Anal Bioanal
Chem. 385: 652–659.47. Melin AM, Perromat A, Deleris G (2000) Pharmacologic Application of Fourier
Transform IR Spectroscopy: In Vivo Toxicity of Carbon Tetrachloride on RatLiver. Biopolymers 57: 160–168.
48. Masubuchi Y, Sugiyama S, Horie T (2009) Th1/Th2 cytokine balance as adeterminant of acetaminophen-induced liver injury. Chem Biol Interact. 179:
273–279.
49. Stadler J, Harbrecht BG, Di Silvio M, Curran RD, Jordan ML, et al. (1993)Endogenous nitric oxide inhibits the synthesis of cyclooxygenase products and
interleukin-6 by rat Kupffer cells. J Leukoc Biol. 53: 165–172.50. Shanley TP, Zhao B, Macariola DR, Denenberg A, Salzman AL, et al. (2002)
Role of nitric oxide in acute lung inflammation: lessons learned from the
inducible nitric oxide synthase knockout mouse. Crit Care Med. 30: 1960–1968.51. Ameredes BT, Zamora R, Gibson KF, Billiar TR, Dixon-McCarthy B, et al.
(2001) Increased nitric oxide production by airway cells of sensitized andchallenged IL-10 knockout mice. J Leukoc Biol. 70: 730–736.
52. Szalay G, Sauter M, Hald J, Weinzierl A, Kandolf R, et al. (2006) Sustainednitric oxide synthesis contributes to immunopathology in ongoing myocarditis
attributable to interleukin-10 disorders. Am J Pathol. 169: 2085–2093.
53. Saha B, Nandi D (2009) Farnesyltransferase Inhibitors Reduce Ras Activationand Ameliorate Acetaminophen-Induced Liver Injury in Mice. Hepatology 50:
1547–1557.54. Holt PM, Cheng L, Cynthia Ju (2008) Identification and characterization of
infiltrating macrophages in acetaminophen-induced liver injury. J Leukoc Biol.
84: 1410–1421.55. Ohkawa H, Ohishi N, Yagi K (1979) Assay for lipid peroxides in animal tissues
by thiobarbituric acid reaction. Anal Biochem. 95: 351–358.
FTIR Analysis of APAP-Induced Liver Damage
PLOS ONE | www.plosone.org 13 September 2012 | Volume 7 | Issue 9 | e45521
Copyright © 2022 FDOKUMEN