
Fourier transform infrared microspectroscopy identifies early lineage commitment in differentiating...
8
SHORT REPORT Fourier transform infrared microspectroscopy identifies early lineage commitment in differentiating human embryonic stem cells Philip Heraud a,b , Elizabeth S. Ng a , Sally Caine a,b , Qing C. Yu a , Claire Hirst a , Robyn Mayberry a , Amanda Bruce a , Bayden R. Wood b , Don McNaughton b , Edouard G. Stanley a , Andrew G. Elefanty a, ⁎ a Monash Immunology and Stem Cell Laboratories, Monash University, Building 75, STRIP 1, West Ring Road, Clayton, Victoria 3800, Australia b Centre for Biospectroscopy and the School of Chemistry, Monash University, Clayton, Victoria 3800, Australia Received 20 November 2009; accepted 25 November 2009 Abstract Human ESCs (hESCs) are a valuable tool for the study of early human development and represent a source of normal differentiated cells for pharmaceutical and biotechnology applications and ultimately for cell replacement therapies. For all applications, it will be necessary to develop assays to validate the efficacy of hESC differentiation. We explored the capacity for FTIR spectroscopy, a technique that rapidly characterises cellular macromolecular composition, to discriminate mesendoderm or ectoderm committed cells from undifferentiated hESCs. Distinct infrared spectroscopic “signatures” readily distinguished hESCs from these early differentiated progeny, with bioinformatic models able to correctly classify over 97% of spectra. These data identify a role for FTIR spectroscopy as a new modality to complement conventional analyses of hESCs and their derivatives. FTIR spectroscopy has the potential to provide low-cost, automatable measurements for the quality control of stem and differentiated cells to be used in industry and regenerative medicine. Crown Copyright © 2009 Published by Elsevier B.V. All rights reserved. Introduction Differentiating hESCs represent a unique experimental platform for dissecting the regulation of early events in human development. The ability to reproducibly and efficiently direct the differentiation of hESCs toward specific lineages would also have significant therapeutic implications. Normal cells differentiated from hESCs would be valuable for the screening of pharmaceutical agents and ultimately as therapy to replace tissues damaged through disease. However, for many of these applications it will be necessary to have rapid low-cost assays to validate the efficacy and safety of the hESC differentiation process and to “certify” batches of differentiated cells prior to their use as screening tools or for clinical transplantation. Currently, differentiating hESCs are monitored for the loss of stem cell antigens, the acquisition of differentiation markers, and for attributes of the desired differentiated population (Murry and Keller, 2008). The modalities used include flow cytometry, immunohistochemistry, gene ex- pression studies, and in vitro and in vivo assays for functional end cells. Although these assays provide a comprehensive analysis of a cellular population, the application of all these analyses to each aliquot of cells ⁎ Corresponding author. Fax: +61 3 9905 0680. E-mail address: [email protected] (A.G. Elefanty). 1873-5061/$ – see front matter. Crown Copyright © 2009 Published by Elsevier B.V. All rights reserved. doi:10.1016/j.scr.2009.11.002 available at www.sciencedirect.com www.elsevier.com/locate/scr Stem Cell Research (2010) 4, 140–147
Transcript of Fourier transform infrared microspectroscopy identifies early lineage commitment in differentiating...

ava i l ab l e a t www.sc i enced i r ec t . com
www.e l sev i e r . com/ l oca te / sc r
Stem Cell Research (2010) 4, 140–147
SHORT REPORT
Fourier transform infrared microspectroscopyidentifies early lineage commitment indifferentiating human embryonic stem cellsPhilip Heraud a,b, Elizabeth S. Ng a, Sally Caine a,b, Qing C. Yua, Claire Hirst a,Robyn Mayberry a, Amanda Bruce a, Bayden R. Wood b, Don McNaughton b,Edouard G. Stanley a, Andrew G. Elefanty a,⁎
a Monash Immunology and Stem Cell Laboratories, Monash University, Building 75, STRIP 1, West Ring Road, Clayton,Victoria 3800, Australiab Centre for Biospectroscopy and the School of Chemistry, Monash University, Clayton, Victoria 3800, Australia
Received 20 November 2009; accepted 25 November 2009
Abstract Human ESCs (hESCs) are a valuable tool for the study of early human development and represent a source of
normal differentiated cells for pharmaceutical and biotechnology applications and ultimately for cell replacement therapies.For all applications, it will be necessary to develop assays to validate the efficacy of hESC differentiation. We explored thecapacity for FTIR spectroscopy, a technique that rapidly characterises cellular macromolecular composition, to discriminatemesendoderm or ectoderm committed cells from undifferentiated hESCs. Distinct infrared spectroscopic “signatures” readilydistinguished hESCs from these early differentiated progeny, with bioinformatic models able to correctly classify over 97% ofspectra. These data identify a role for FTIR spectroscopy as a new modality to complement conventional analyses of hESCs andtheir derivatives. FTIR spectroscopy has the potential to provide low-cost, automatable measurements for the quality control ofstem and differentiated cells to be used in industry and regenerative medicine. Crown Copyright © 2009 Published by Elsevier B.V. All rights reserved.Introduction
Differentiating hESCs represent a unique experimentalplatform for dissecting the regulation of early events inhuman development. The ability to reproducibly andefficiently direct the differentiation of hESCs towardspecific lineages would also have significant therapeuticimplications. Normal cells differentiated from hESCs wouldbe valuable for the screening of pharmaceutical agents and
⁎ Corresponding author. Fax: +61 3 9905 0680.E-mail address: [email protected]
(A.G. Elefanty).
1873-5061/$ – see front matter. Crown Copyright © 2009 Published bydoi:10.1016/j.scr.2009.11.002
ultimately as therapy to replace tissues damaged throughdisease. However, for many of these applications it will benecessary to have rapid low-cost assays to validate theefficacy and safety of the hESC differentiation process andto “certify” batches of differentiated cells prior to theiruse as screening tools or for clinical transplantation.
Currently, differentiating hESCs are monitored for theloss of stem cell antigens, the acquisition of differentiationmarkers, and for attributes of the desired differentiatedpopulation (Murry and Keller, 2008). The modalities usedinclude flow cytometry, immunohistochemistry, gene ex-pression studies, and in vitro and in vivo assays forfunctional end cells. Although these assays provide acomprehensive analysis of a cellular population, theapplication of all these analyses to each aliquot of cells
Elsevier B.V. All rights reserved.

141Spectroscopic signature of differentiating hESCs
destined for pharmaceutical screening or transplantation isimpractical.
Fourier transform infrared (FTIR) spectroscopy has beenused to study biological molecules and biological systems invitro since the early 1980s (Mantsch et al., 1986). Subse-quently, infrared (IR) biospectroscopy was utilised as a toolto classify bacteria (Naumann et al., 1991) and to show thatdifferent human cells possessed unique infrared spectralsignatures (Wood et al., 1998; Diem et al., 1998). Thesebiospectroscopic studies demonstrated that different celltypes possessed distinct IR spectral phenotypes, whichreflected the contribution of all the macromoleculespresent, including proteins, lipids, carbohydrates, andnucleic acids.
One of the earliest lineage commitment decisions madeduring in vitro differentiation of hESCs is the choice to formmesoderm and endoderm rather than to commit toward a“default” ectodermal outcome (Di-Gregorio et al., 2007). Inthis study we have evaluated the ability of FTIR spectroscopyto distinguish between undifferentiated hESCs and cells thathad committed to mesendoderm (precursor cells of themesodermand endodermgerm layers), orwere differentiatingto ectoderm (precursor cells of the nervous system and skin).We demonstrate that their distinct FTIR spectroscopic“signatures” can be used to characterise and discriminatehESCs fromdifferentiatedprogeny, even at very early stages ofdevelopment. Moreover, the information that is garnered fromthese spectra provides insights into the biochemical andmolecular composition of cells that model very early stages ofhuman embryonic development. These experiments representan important “proof of principle” that indicates the value ofinfrared spectroscopy as a rapid and accessible analytical toolfor the characterisation of hESCs and their derivatives.
Figure 1 Flow diagram demonstrating the generation ofcells analysed by FTIR spectroscopy. UndifferentiatedMIXL1GFP/w hESCs were dissociated and cells analysed byflow cytometry for surface E-CADHERIN and GFP expressionfrom the MIXL1 locus, cytospun onto MirrIR-reflective slidesfor FTIR spectroscopy, or used to set up spin aggregation EBsin medium supplemented with either BMP4/Act A or FGF2.After 4–5 days, spin EBs, shown as bright-field (BF) andfluorescence (GFP) images, were dissociated and cells wereanalysed by flow cytometry for GFP and surface E-CADHERIN,analysed for hematopoietic colony-forming activity in meth-ylcellulose, and cytospun onto MirrIR-reflective slides for FTIRspectroscopy. Magnification: undifferentiated hESCs ×200;Day 4 spin EBs ×100; hematopoietic colonies ×100.
Results
Human ESCs were differentiated toward mesendoderm inserum-free medium supplemented with bone morphogeneticprotein (BMP) 4 and activin A (BMP4/Act A medium) ortoward ectodermal lineages in medium supplemented withfibroblast growth factor (FGF) 2 (Ng et al., 2008b) (Fig. 1).These experiments utilized a genetically modified hESC lineexpressing green fluorescent protein (GFP) from the MIXL1locus (MIXL1GFP/w) (Davis et al., 2008), because it provided ameans to validate and quantify the differentiation of thesamples subsequently used for the FTIR analysis. TheMIXL1GFP/w hESC line enabled objective, quantifiable dis-crimination between GFP+mesendoderm cells and GFP−ec-toderm cells and enabled us to confirm that the emergenceof MIXL1+cells was dependent on BMP/Act A stimulation.
Undifferentiated hESCs expressed pluripotency-relatedgenes (including OCT4, REX1, and NANOG), displayed a suiteof stem cell surface antigens (including E-CADHERIN, SSEA-4,TRA-1-60, and CD9), and did not express GFP from the MIXL1locus (Fig. 1, Supplementary Fig. 1, and SupplementaryTable 1). The majority of MIXL1GFP/w hESCs differentiated inBMP4/Act A medium down-regulated cell surface E-CAD-HERIN and expressed the mesendoderm marker MIXL1 (74±9% GFP+cells; mean±SEM, for 3 experiments analysed byFTIR spectroscopy) (Fig. 1). Gene expression analysis ofMIXL1GFP/w spin embryoid bodies (EBs) differentiated in a
similar manner confirmed down-regulation of stem cellgenes and induction of genes associated with mesendodermincluding MIXL1, BRACHYURY, and GOOSECOID (Supplemen-tary Table 1). Disaggregation and culture of these EBs inmethylcellulose cultures revealed a high frequency ofhematopoietic progenitors (means of 174 and 521 colonyforming cells per 104 cells for triplicate cultures for 2experiments analysed by FTIR spectroscopy), consistentwith the induction of mesoderm.
142 P. Heraud et al.
MIXL1GFP/w spin EBs differentiated in FGF2 mediumretained surface E-CADHERIN and did not express MIXL1(1.5±0.8% GFP+cells; mean ± SEM, for 3 experimentsanalysed by FTIR spectroscopy) (Fig. 1). However, therewas down-regulation of other stem cell surface markers inFGF2-stimulated spin EBs, especially CD9 (SupplementaryFig. 1), a reduction in expression of stem cell genes and theinduction of early neurectodermal genes, notably neuronalpentraxin 1 (NP1) (Supplementary Table 1). Unlike the BMP4and activin A-induced MIXL1GFP/w spin EBs, no hematopoieticcolony forming cells were observed from FGF2-stimulatedspin EBs.
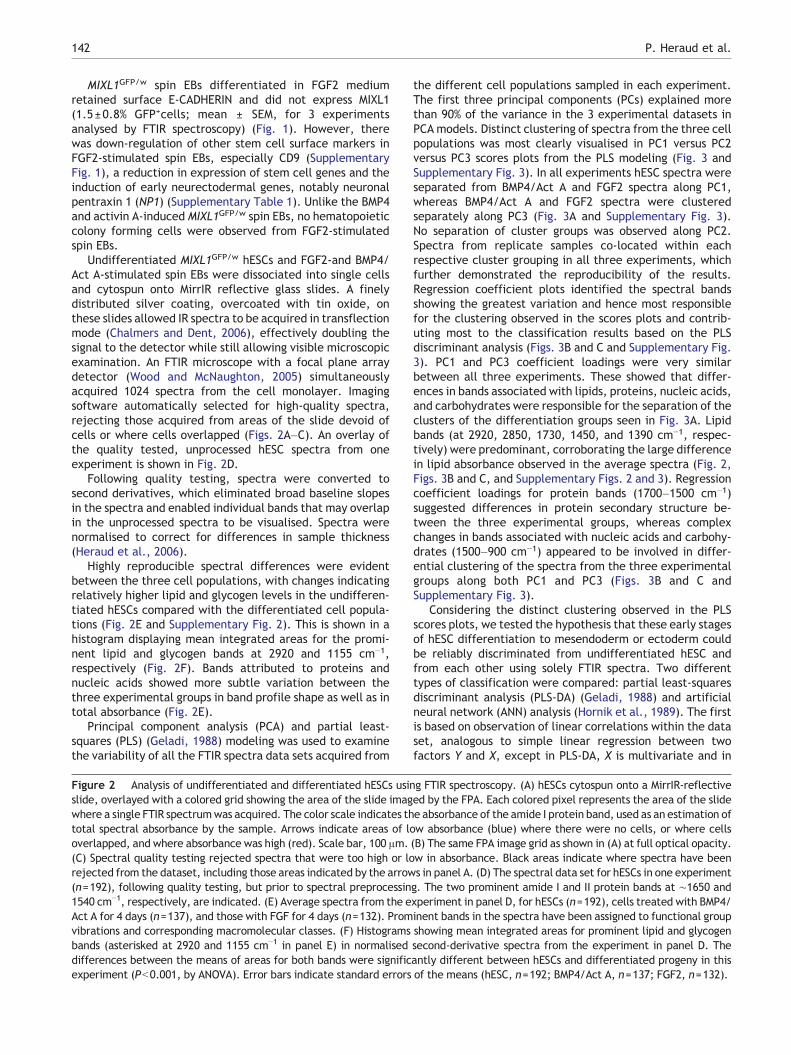
Undifferentiated MIXL1GFP/w hESCs and FGF2-and BMP4/Act A-stimulated spin EBs were dissociated into single cellsand cytospun onto MirrIR reflective glass slides. A finelydistributed silver coating, overcoated with tin oxide, onthese slides allowed IR spectra to be acquired in transflectionmode (Chalmers and Dent, 2006), effectively doubling thesignal to the detector while still allowing visible microscopicexamination. An FTIR microscope with a focal plane arraydetector (Wood and McNaughton, 2005) simultaneouslyacquired 1024 spectra from the cell monolayer. Imagingsoftware automatically selected for high-quality spectra,rejecting those acquired from areas of the slide devoid ofcells or where cells overlapped (Figs. 2A–C). An overlay ofthe quality tested, unprocessed hESC spectra from oneexperiment is shown in Fig. 2D.
Following quality testing, spectra were converted tosecond derivatives, which eliminated broad baseline slopesin the spectra and enabled individual bands that may overlapin the unprocessed spectra to be visualised. Spectra werenormalised to correct for differences in sample thickness(Heraud et al., 2006).
Highly reproducible spectral differences were evidentbetween the three cell populations, with changes indicatingrelatively higher lipid and glycogen levels in the undifferen-tiated hESCs compared with the differentiated cell popula-tions (Fig. 2E and Supplementary Fig. 2). This is shown in ahistogram displaying mean integrated areas for the promi-nent lipid and glycogen bands at 2920 and 1155 cm−1,respectively (Fig. 2F). Bands attributed to proteins andnucleic acids showed more subtle variation between thethree experimental groups in band profile shape as well as intotal absorbance (Fig. 2E).
Principal component analysis (PCA) and partial least-squares (PLS) (Geladi, 1988) modeling was used to examinethe variability of all the FTIR spectra data sets acquired from
Figure 2 Analysis of undifferentiated and differentiated hESCs usinslide, overlayed with a colored grid showing the area of the slide imagwhere a single FTIR spectrumwas acquired. The color scale indicates thtotal spectral absorbance by the sample. Arrows indicate areas of looverlapped, and where absorbance was high (red). Scale bar, 100 μm.(C) Spectral quality testing rejected spectra that were too high or lorejected from the dataset, including those areas indicated by the arrow(n=192), following quality testing, but prior to spectral preprocessin1540 cm−1, respectively, are indicated. (E) Average spectra from the eAct A for 4 days (n=137), and those with FGF for 4 days (n=132). Promvibrations and corresponding macromolecular classes. (F) Histogramsbands (asterisked at 2920 and 1155 cm−1 in panel E) in normaliseddifferences between the means of areas for both bands were significexperiment (Pb0.001, by ANOVA). Error bars indicate standard errors
the different cell populations sampled in each experiment.The first three principal components (PCs) explained morethan 90% of the variance in the 3 experimental datasets inPCA models. Distinct clustering of spectra from the three cellpopulations was most clearly visualised in PC1 versus PC2versus PC3 scores plots from the PLS modeling (Fig. 3 andSupplementary Fig. 3). In all experiments hESC spectra wereseparated from BMP4/Act A and FGF2 spectra along PC1,whereas BMP4/Act A and FGF2 spectra were clusteredseparately along PC3 (Fig. 3A and Supplementary Fig. 3).No separation of cluster groups was observed along PC2.Spectra from replicate samples co-located within eachrespective cluster grouping in all three experiments, whichfurther demonstrated the reproducibility of the results.Regression coefficient plots identified the spectral bandsshowing the greatest variation and hence most responsiblefor the clustering observed in the scores plots and contrib-uting most to the classification results based on the PLSdiscriminant analysis (Figs. 3B and C and Supplementary Fig.3). PC1 and PC3 coefficient loadings were very similarbetween all three experiments. These showed that differ-ences in bands associated with lipids, proteins, nucleic acids,and carbohydrates were responsible for the separation of theclusters of the differentiation groups seen in Fig. 3A. Lipidbands (at 2920, 2850, 1730, 1450, and 1390 cm−1, respec-tively) were predominant, corroborating the large differencein lipid absorbance observed in the average spectra (Fig. 2,Figs. 3B and C, and Supplementary Figs. 2 and 3). Regressioncoefficient loadings for protein bands (1700–1500 cm−1)suggested differences in protein secondary structure be-tween the three experimental groups, whereas complexchanges in bands associated with nucleic acids and carbohy-drates (1500–900 cm−1) appeared to be involved in differ-ential clustering of the spectra from the three experimentalgroups along both PC1 and PC3 (Figs. 3B and C andSupplementary Fig. 3).
Considering the distinct clustering observed in the PLSscores plots, we tested the hypothesis that these early stagesof hESC differentiation to mesendoderm or ectoderm couldbe reliably discriminated from undifferentiated hESC andfrom each other using solely FTIR spectra. Two differenttypes of classification were compared: partial least-squaresdiscriminant analysis (PLS-DA) (Geladi, 1988) and artificialneural network (ANN) analysis (Hornik et al., 1989). The firstis based on observation of linear correlations within the dataset, analogous to simple linear regression between twofactors Y and X, except in PLS-DA, X is multivariate and in
g FTIR spectroscopy. (A) hESCs cytospun onto a MirrIR-reflectiveed by the FPA. Each colored pixel represents the area of the slidee absorbance of the amide I protein band, used as an estimation ofw absorbance (blue) where there were no cells, or where cells(B) The same FPA image grid as shown in (A) at full optical opacity.w in absorbance. Black areas indicate where spectra have beens in panel A. (D) The spectral data set for hESCs in one experimentg. The two prominent amide I and II protein bands at ∼1650 andxperiment in panel D, for hESCs (n=192), cells treated with BMP4/inent bands in the spectra have been assigned to functional groupshowing mean integrated areas for prominent lipid and glycogensecond-derivative spectra from the experiment in panel D. Theantly different between hESCs and differentiated progeny in thisof the means (hESC, n=192; BMP4/Act A, n=137; FGF2, n=132).

143Spectroscopic signature of differentiating hESCs
the present case represents the absorbance for eachwavenumber value in the spectrum. The PLS2 algorithmwas used (Abdi, 2003) with three Y variables coding for classmembership using nominal values of either+1 or 0, with eachY variable indicating hESC, FGF2, or BMP4/Act A spectra,respectively. Spectral data were randomly divided intocalibration (training) and validation sets comprising two-thirds and one-third of spectra, respectively. A regressionplot of the calibration data set for one experiment yielded acorrelation coefficient 0.98, indicating that the PLS closely
modeled the data (Fig. 3D). Y values were then predicted foreach spectrum using the separate validation set of spectra(Fig. 3E and Supplementary Fig. 4). Better than 97% ofspectra from independent validation sets were correctlyclassified into each of the assigned classes in all experiments(Table 1).
An ANN classification was also examined for its predictivevalue, because it is based on an entirely different, nonlinearmode of operation to PLS-DA, thus providing an independentway of testing the validity of the spectroscopic classification

144 P. Heraud et al.

145Spectroscopic signature of differentiating hESCs
approach. For the ANN modeling, feed-forward, backpropa-gation networks were developed. Three neuronal layerswere found to be optimal with neurons in the input layeraccepting absorbance values from the FTIR spectra, one foreach spectral absorbance value used (within the ranges3000–2760 and 1860–900 cm−1), 20 neurons in the hiddenlayer, and 3 output neurons for class outputs. The samecalibration and validation sets used in the PLS-DA analysiswere employed to allow direct comparison. ANNs correctlyclassified better than 98% of spectra with independentvalidation tests in all experiments. A comparison betweenthe accuracy of the PLS-DA and ANN classifications for allthree experiments is shown in Table 1.
Discussion
We have shown that undifferentiated hESCs and cellscommitted to mesendoderm or ectoderm can be readilydiscriminated by their IR spectroscopic profiles. Further-more, this study demonstrated that these profiles could beused in bioinformatic models to classify independentvalidation sets of spectra correctly in over 97% of cases.These observations were validated in three independentexperiments that showed consistent differences betweenthe spectral patterns of hESCs and their differentiatedprogeny. We are expanding our database of spectroscopicprofiles for undifferentiated and differentiated hESCs inorder to develop a classification system that prospectivelyassigns lineage on the basis of FTIR spectra. Thus far, usingour current limited data sets (spectra pooled from experi-ments 1 and 2), undifferentiated hESCs could be prospec-tively distinguished from differentiated samples, with 82% ofspectra from undifferentiated hESCs in experiment 3correctly classified.
Whilst these data were acquired using defined cultureconditions to efficiently direct differentiation towardthese lineage choices, it is clear from our analyses thatthere was heterogeneity in our populations of undifferen-tiated and differentiated hESCs. Future studies, in whichthe spectral profiles of more homogeneous flow cytome-trically sorted subsets of undifferentiated and differenti-ated cells will be examined, will enable more accurateidentification of cell and developmental stage-specificFTIR spectra which we anticipate will also improve the
Figure 3 (A) Scores plots for PLS analysis of the spectral data for thsamples for each cell type. Each spectrum is represented as a point inexplain the clustering observed in the PLS scores plot shown in pdifferences explaining clustering along PC1, which separates hESCregression coefficient loadings explained the separation of the spectLimited spread in the PC2 direction did not contribute significantly tomean spectra shown in Fig. 2E compared with the associated PC1 andloadings indicate up-or down-regulation of the macromolecular compin the PC1 direction. Arrows for PC3 regression coefficient loadings inin the change from the FGF2 state to the BMP4/Act A state in the PC3full in the Supplementary References. (D) Partial least-squares (experiment, which plotted measured Y against predicted Y (hESCs=indicated that the training set was well modeled using PLS analysis.(PLS-DA) for the validation set for the experiment in panel D, showconfidence interval around each predicted Y (center of rectangle). Afrom the FGF2 or BMP4 and Activin A classes were also accurately cl
accuracy of prospective lineage classification using FTIRspectra.
There are only two previous studies in which FTIRspectroscopy has been applied to stem cells and no studiesto date have examined hESCs. In one study, the authorsdemonstrated that IR spectroscopy could distinguish be-tween subpopulations of undifferentiated human mesenchy-mal stem cells and cells differentiated toward osteogeniclineages (Krafft et al., 2007). In a second study, mouse ESCswere examined at intervals during spontaneous differentia-tion in a serum-containing medium (Ami et al., 2008). Whilechanges in the IR spectra were observed in the heteroge-neous cultures in this latter study, they could not becorrelated to either a specific inducing stimulus or adifferentiated cell lineage. In contrast, our study examinedhuman ES cells differentiated under defined serum-freeconditions in response to specific exogenously added growthfactors. The commitment to specific lineages was validatedby evaluation of cell surface markers, gene expression, andthe use of a hESC line carrying a mesendoderm-specificreporter gene. We have shown that commitment tomesendoderm or ectoderm was associated with specificinfrared spectroscopic “signatures” and that these differedfrom the profiles displayed by undifferentiated hESCs.
Infrared spectroscopy complements existing approachesto the classification of stem cells and their differentiatedprogeny because it uses information from a broad range ofcellular macromolecules, rather than relying on informationobtained from the expression of single molecules. Further-more, examination of the spectral loadings that discriminatebetween samples can potentially be directly correlated withchanges in cellular biochemical components. This informa-tion could be usefully employed in future studies to informand efficiently direct complementary proteomic or lipidomicinvestigations, for example, in order to determine thespecific protein or lipid components responsible for spectro-scopic differences.
In conclusion, this study demonstrates that FTIR micro-spectroscopy, combined with multivariate and artificialneural network modeling, has the potential to provide low-cost, potentially automatable measurements for the qualitycontrol of stem cell-derived populations to be used inregenerative medicine. This is analogous to the US Foodand Drug Administration's recent Process Analytical Tech-nologies (PAT) initiative (see http://www.fda.gov/
e three treatment groups from one experiment showing replicatePC1 vs PC2 vs PC3 space. (B) Regression coefficient plots used toanel A. PC1 regression coefficient loadings indicated spectralS from the cells differentiated in FGF2 or BMP4/Act A. PC3ra from FGF2-and BMP4/Act A-treated sample groups along PC3.the clustering of samples. (C) Table of band assignments for thePC3 regression coefficient loadings from Fig. 3B. Arrows for PC1onent in the change from the hESCs to the differentiated progenydicate up-or down-regulation of the macromolecular componentdirection. The references for band assignments are described inPLS) regression plot for the calibration (training) set in one+1; FGF2=0; BMP4/Act A=0). The correlation coefficient (0.98)(E) Predicted Y values for hESCs using PLS discriminant analysisn as box plots (narrow blue rectangles) that indicate the 95%
ll spectra were classified correctly as hESC using PLS-DA. Spectraassified (see Supplementary Fig. 4).

Table 1 The percentage correct classification for spectrain independent validation sets drawn from each of the threetreatments (BMP4 and Activin A, FGF2, or hESCs), usingeither partial least-squares discriminant analysis (PLS-DA)or artificial neural network analysis (ANN), for threeindependent experiments (1–3)
Treatment Experiment PLS-DA ANN
BMP4 and Activin A 1 100 1002 100 983 100 100
FGF2 1 98 982 98 983 97 100
hESCs 1 98 982 98 993 100 100
146 P. Heraud et al.
AboutFDA/CentersOffices/CDER/ucm088828.htm), whichspecifies spectroscopic automation of quality control forpharmaceuticals. We envisage that the spectroscopic-basedclassification system would provide a high-throughputmethodology for the verification of cell differentiationstatus, complementing existing approaches provided byexpression of genes or cell surface markers.
Experimental procedures
Embryonic stem cell culture and differentiation
Undifferentiated hESC adapted to enzymatic passaging(Costa et al., 2008) were differentiated toward ectodermalor mesendodermal lineages by culture for 4–5 days in serum-free APEL medium supplemented with 100 ng/ml FGF2 orwith 30–40 ng/ml BMP4 and 20 ng/ml Activin A, respectively(Davis et al., 2008; Ng et al., 2008a). Single cell suspensionsof undifferentiated or differentiated hESCs were depositedby a cyto-centrifuge (Cytospin III, Thermo Fischer Scientific,Waltham, MA) to produce monolayers of cells on IR reflectiveglass slides (MirrIR slides; Tienta Sciences, OH) and thendried under light vacuum (1 atm less than ambient) in adesiccator. Flow cytometry for stem cell surface markersusing antibodies directed against human E-CADHERIN(Zymed, San Francisco, CA), TRA-1-60 (Millipore Corpora-tion, MA), SSEA-4 (Millipore Corporation), and CD9 (BDBiosciences, CA) was performed as previously described(Davis et al., 2008; Ng et al., 2008b). Hematopoietic colonyforming cells were assayed by seeding 104 cells fromdissociated d4 EBs into 0.5 ml serum-free methylcellulosecultures (Methocult SF H4236, Stem Cell Technologies,Canada) supplemented with 20 ng/ml BMP4 (R & D systems,MN), 50 ng/ml vascular endothelial growth factor (VEGF),100 ng/ml stem cell factor (SCF), 30 ng/ml interleukin (IL)-3,30 ng/ml thrombopoietin (TPO), and 3 units/ml erythropoi-etin (EPO) (all from Peprotech Inc. Haifa) (Ng et al., 2008b).Colonies were counted after 10–12 days. cDNA generatedfrom undifferentiated hESC and d4 FGF2-and BMP4/Act A-stimulated spin EBs was hybridised to Illumina whole genomeexpression bead chips (Illumina Inc., CA) and results analysed
using Bead Studio (Illumina Inc.) and GeneSpring GX (AgilentTechnologies, USA) software.
Infrared microspectroscopy
Analyses were performed on replicate cultures of undiffer-entiated hESCs and compared with analyses performedsimultaneously on hESCs differentiated for 4–5 days towardectodermal lineages or toward mesendodermal precursors.Infrared spectral images were acquired from an area352×352 μm on the sample plane. Each image consisted ofa 32×32 array of 1024 spectra, resulting from binning of thesignal from each square of 4 detectors on a liquid N2 cooled64×64 element MCT Stingray (Varian Inc., Paolo Alto, CA,USA) focal plane array detector, which was coupled to aninfrared microscope (Model 600 UMA, Varian Inc.) and a FTIRspectrometer (Model FTS 7000, Varian Inc.). Accordingly,each spectrum in the data array sampled ∼11×11 μm of thecell monolayer. The acquisition of each FTIR spectral imagedata array was completed in about 2 min. The Varian systemwas controlled by an IBM-compatible computer running WinIR Pro 3.0 software (Varian Inc.). The absorbance spectrawere acquired in reflectance mode at a spectral resolution of8 cm−1 with 64 scans coadded. Apodization was performedusing a Happ-Genzel function.
Spectral imaging selection and preprocessing ofspectral data
Images based on total protein absorbance were interrogatedusing Cytospec 1.03 IR imaging software (Cytospec Inc., NY,USA) to select spectra from sample regions with absorbanceswithin the linear range of the detector (absorbance 0.2 –0.8), with spectra extracted from the data array andexported to Unscrambler 9.2 (Camo, Oslo, Norway) forstatistical analysis and classification. Spectra were prepro-cessed by calculating second derivatives (Savitsky-Golaywith 9 point smoothing), hence minimizing the effects ofvariable baselines and allowing individual bands that wereoverlapping in the raw spectra to be readily visualised asseparate minima bands. Spectra were then normalized toaccount for possible differences in sample thickness usingExtended Multiplicative Signal Correction (EMSC) (Martenset al., 2003).
Statistical analysis
Principal component analysis and partial least-squaresdiscriminant analysisPCA was performed with The Unscrambler 9.2 using meancentered data and employing full cross-validation, with anydata outliers identified and removed from the dataset by theexamination of residual influence plots. Scores plots wereused to visualise any clustering of data, and loadings plotsused to determine which spectral region most contributed tothe variance in the dataset. PLS-DA employed PCA models,with the optimal number of PCs chosen to achieve the lowestresidual variance. Spectral data were randomly divided intocalibration and validation sets comprising two-thirds andone-third of spectra, respectively. The PLS2 training datamatrix comprised the spectra (multivariate X) and three Y

147Spectroscopic signature of differentiating hESCs
variables with integer values of 0 or+1 coding for the threemodeled spectral classes (hESC, FGF2, BMP4/ActA, respec-tively) (Abdi, 2003). PLS discriminant analysis used thespectral ranges containing bands of biological origin between3000–2760 and 1860–900 cm−1.
Artificial neural network classificationANNs (Neurodeveloper 3.4, Synthon GmbH, Heidelberg,Germany ) used to classify individual experiments employedthe same training and validation sets as those used with PLS-DA to allow direct comparison of classification outcomes. Athree-layer feed-forward backpropagation design was used,where the number of input neurons corresponded to thenumber of absorbance measurements in the same wavenum-ber range used in the PLS discriminant analysis (within theranges 3000–2760 and 1860–900 cm-1), and the outputneurons to the groups being classified. The number ofneurons in the hidden layer was varied by trial and errorbased on the root mean square errors of calibration andvalidation (RMSEC and RMSEV) achieved and the efficacy ofthe classification accuracy of the resulting ANN. Thecalibration process employed an internal validation set andthe number of iterations used to establish a model waschosen by minimizing the RSMEC.
Acknowledgments
This work was supported by the Australian Stem Cell Centre,the Juvenile Diabetes Research Foundation, and the NationalHealth and Medical Research Council (NHMRC) of Australia.A.G.E. is a Senior Research Fellow of the NHMRC.
Appendix A. Supplementary data
Supplementary data associatedwith this article can be found,in the online version, at doi:10.1016/j.scr.2009.11.002.
References
Abdi,H., 2003.PLS-regression:multivariateanalysis. In: Lewis-Beck,M.,Bryman, A., Futing, T. (Eds.), Encyclopedia for Research Methodsfor the Social Sciences. Sage, Thousand Oaks, CA.
Ami, I., Neri, T., Natalello, A., Mereghetti, P., Doglia, S.M., Zanoni,M., Zuccotti, M., Garagna, S., Redi, C.A., 2008. Embryonic stemcell differentiation studied by FT-IR spectroscopy. Biochim.Biophys. Acta Mol. Cell Res. 1783, 98–106.
Chalmers, J.M., Dent, G., 2006. Vibrational spectroscopic methodsin pharmaceutical solid-state characterization. In: Hilfiker, R.(Ed.), Polymorphism in the Pharmaceutical Industry. Wiley-VCH,Weinheim, Germany.
Costa, M., Sourris, K., Hatzistavrou, T., Elefanty, A.G., Stanley, E.G.,2008. Expansion of human embryonic stem cells in vitro. Curr.Protoc. Stem Cell Biol. Chap. 1 1C.1.1–1C.1.7.
Davis, R.P., Ng, E.S., Costa, M., Mossman, A.K., Sourris, K., Elefanty,A.G., Stanley, E.G., 2008. Targeting a GFP reporter gene to theMIXL1 locus of human embryonic stem cells identifies humanprimitive streak-like cells and enables isolation of primitivehematopoietic precursors. Blood 111, 1876–1884.
Diem, M., Boydston-White, S., Chiriboga, L., 1998. Infraredspectroscopy of living cells: shining light onto a novel subject.Appl. Spectrosc. 53, 148A–161A.
Di-Gregorio, A., Sancho, M., Stuckey, D.W., Crompton, L.A.,Godwin, J., Mishina, Y., Rodriguez, T.A., 2007. BMP signallinginhibits premature neural differentiation in the mouse embryo.Development 134, 3359–3369.
Geladi, P., 1988. Notes on the history and nature of partial leastsquares (PLS) modelling. J. Chemometrics 2, 231–246.
Heraud, P., Beardall, J., Wood, B.R., McNaughton, D., 2006. Effectsof pre-processing of Raman spectra on in vivo classification ofnutrient status of microalgal cells. J. Chemometrics 20, 193–197.
Hornik, K., Stinchcombe, M., White, H., 1989. Multilayer feedfor-ward networks are universal approximators. Neural Netw. 2,359–366.
Krafft, C., Salzer, R., Seitz, S., Ern, C., Schieker, M., 2007.Differentiation of individual human mesenchymal stem cellsprobed by FT-IR microscopic imaging. Analyst 132, 647–653.
Mantsch, H.H., Yang, P.W., Casal, H.L., 1986. Infrared spectrometryof living systems: current trends and perspectives. J. Mol. Struct.141, 237–242.
Martens, H., Nielsen, J.P., Engelsen, S.B., 2003. Light scattering andlight absorbance separated by extended multiplicative signalcorrection: application to near infrared transmission analysis ofpowder mixtures. Anal. Chem. 75, 394–404.
Murry, C.E., Keller, G., 2008. Differentiation of embryonic stem cellsto clinically relevant populations: lessons from embryonicdevelopment. Cell 132, 661–680.
Naumann, D., Helman, D., Labischinski, H., 1991. Microbiologicalcharacterizations by FT-IR spectroscopy. Nature 351, 81–82.
Ng, E.S., Davis, R., Stanley, E.G., Elefanty, A.G., 2008a. A protocoldescribing the use of a recombinant protein-based, animalproduct free medium (APEL) for human embryonic stem celldifferentiation as spin embryoid bodies. Nat. Protoc. 3,768–776.
Ng, E.S., Davis, R.P., Hatzistavrou, T., Stanley, E.G., Elefanty, A.G.,2008b. Directed differentiation of human embryonic stem cells asspin embryoid bodies and a description of the hematopoieticblast colony forming assay. Curr. Protoc. Stem Cell Biol. Chap. 11D.3.1–1D.3.23.
Wood, B.R., McNaughton, D., 2005. FPA imaging and spectroscopyfor monitoring chemical changes in tissue. In: Bhargave, R.,Levin, I. (Eds.), Spectrochemical Analyses Using MultichannelInfrared Detectors. Blackwell, Oxford.
Wood, B.R., Quinn, M.A., Tait, B., Ashdown, M., Hislop, T., Romeo,M., McNaughton, D., 1998. FT-IR microspectroscopic study of celltypes and potential confounding variables in screening forcervical malignancies. Biospectroscopy 4, 75–91.