Multi-stage Microwave Curing for Manufacturing Alkali ...
249
Multi-stage Microwave Curing for Manufacturing Alkali-activated Fly Ash by Shi Shi A thesis submitted for the degree of Doctor of Philosophy of University College London Faculty of Engineering Department of Civil, Environmental and Geomatic Engineering February 2017
-
Upload
khangminh22 -
Category
Documents
-
view
4 -
download
0
Transcript of Multi-stage Microwave Curing for Manufacturing Alkali ...

Multi-stage Microwave Curing for
Manufacturing Alkali-activated Fly Ash
by
Shi Shi
A thesis submitted for the degree of
Doctor of Philosophy of University College London
Faculty of Engineering
Department of Civil, Environmental and Geomatic Engineering
February 2017

I, Shi Shi confirm that the work presented in this thesis is my own. Where
information has been derived from other sources, I confirm that this has been
indicated in the thesis.
Signature:
Date:

i
Abstract
Fly ash activated by NaOH solution shows comparable performance to Portland cement
(PC) system and demonstrates its potential as a promising alternative cementitious
material with a lower carbon footprint. Conventional thermal curing, typically at 85oC, is
commonly applied to initiate and then to accelerate the chemical reaction. Although
thermal curing can facilitate the strength development of alkali-activated fly ash (AAFA)
products, it may result in greater energy consumption, offsetting its environmental benefits.
In this study, microwave curing was investigated as an alternative thermal curing method
for manufacturing AAFA. A custom-made microwave oven integrated with a fibre Bragg
grating (FBG) sensor was employed to cure AAFA. Microwave power can be regulated
automatically based on real time temperature feedback from an FBG sensor embedded
inside the sample. A multi-stage curing regime consisting of curing temperatures at 65oC,
85oC, 105oC and 125oC was developed through a Central Composite Design (CCD)
method. Optimal multi-stage microwave curing conditions were then identified by
statistical modelling and analysis. The reaction products and microstructure of AAFA
obtained by multi-stage microwave curing and conventional thermal curing were
characterised and compared to identify the advantages and disadvantages of microwave
curing as compared to conventional thermal oven curing. To address the possible
industrial concerns over the insufficient microwave penetration into AAFA products with
large dimension, the effect of sample size on the properties of AAFA under multi-stage
microwave curing was studied, so that the findings from the current study can be scaled
up in the future for industrial applications.
The optimal multi-stage microwave curing regime obtained from statistical study at 2.45
GHz was: Pmax (maximum output power of microwave oven) at 400W, microwave curing
duration at 65oC for 35 minutes, at 85oC for 35 minutes, at 105oC for 35 minutes and at
125oC for 85 minutes. The results showed that with accurate temperature control inside
the sample, the AAFA under microwave curing initially gained equivalent strength with a
much shorter curing duration (6 hours) than that under conventional thermal curing (24
hours). In addition, based on same thermal history (multi-stage curing for 4.5 hours),
microwave curing favoured the higher strength gain and denser structure of AAFA with
an Al-rich N-A-S-H gel, compared to AAFA with a Si-rich N-A-S-H gel under conventional
thermal curing. One of the main issues that needs to be addressed in future studies is the
loss of compressive strength of multi-stage microwave cured AAFA with subsequent
room-temperature curing over time. With the sample size increased, the N-A-S-H formed
in the region with lower temperature was more Al-rich compared to that formed in the
region with higher temperature regardless of curing methods used. In general, multi-stage
microwave curing could be a potential alternative curing method of manufacturing low
carbon AAFA products with low energy consumption in the future.
Key words: alkali-activated fly ash, multi-stage microwave curing, conventional thermal
curing, energy consumption

ii
Acknowledgment
My PhD started in Queen’s University Belfast (QUB) and I transferred to University
College London (UCL) later to continue my research project. I gratefully acknowledge the
China Scholarship Council (CSC), QUB and UCL for supporting this research project.
Five-year’s study and living in the UK has witnessed an unforgettable and precious
experience in my life. All through my PhD study, I was lucky to receive tremendous support
and help from my supervisors, colleagues, friends and my family. Therefore, I would like
to express my greatest gratitude to all of them.
Firstly, I would like to express my sincerest appreciation to my supervisor, Dr Yun Bai for
his insightful guidance, warm support and encouragement throughout my study in QUB
and UCL. Thanks him for offering me this great opportunity to work in the Advanced and
Innovative Materials (AIM) Group in UCL. His enthusiasm and pursuit on scientific
research has inspired me profoundly.
I would like to extend my huge gratitude to Prof Hui Li and Prof Delong Xu in Xi’an
University of Architecture and Technology (XAUAT, China) who have given me immense
support, allowing me to have access to all the advanced analytical equipment in the
Institute of Powder Engineering for my research. Thanks to my colleagues in Xi’an, Miss
Lijun Zhuge, Mr Baojing Shen and Miss Haiyan Liu for their tremendous help on this
project.
Many thanks go to my second supervisor, Prof P.A.M. Basheer in University of Leeds, for
his support and encouragement all through my study in QUB and UCL.
I would like to give my gratification to my examiners, Prof Julia Stegemann and Prof
Marios Soutsos for their discussion on my PhD viva and suggestions for the correction of
my thesis. Particular thanks to Julia and I am very grateful for all her detailed comments.
It feels like we were talking with each other when I was addressing the comments, which
make my thesis with a better logic flow and a clearer structure.
Secondly, I would like to acknowledge all the support from the Department of Civil,
Environmental and Geomatic Engineering (CEGE) in UCL. A huge gratitude goes to Mr
Warren Gaynor, Mr Ian Seaton and Dr Judith Zhou in the laboratory. Without their adept
workmanship and expertise advice, my lab work would not have gone so smoothly. I would
also like to give sincere gratification to Prof Nick Tyler, Mr Lee Philips, Dr Taku Fujiyama
and Ms Sarah Davies for their strong support on every aspect during my study in CEGE.

iii
Many thanks go to colleagues in City University of London (CUL), Dr Matthias Fabian, Dr
Martin Ams, Prof Tong Sun and Prof K.T.V. Grattan for the support and assistance related
to the application of optical fibre sensor.
Equal thanks also go to Mr Gordon Andrews from Gama Consultants and Mr Bob
McKinnon from Industrial Microwave System Ltd., who gave me much valuable
professional advice on the microwave technology.
I would also like to thank Prof David Cleland, Mrs Valene Molloy and Mr James Knox for
all the support and help when I studied in QUB.
Thirdly, I also want to thank all my dearest friends who always cheer me up and help me
fight through obstacles. Special thanks are given to Miss Yanan Zhu, Miss Ran Chen, Ms
Linlin Lu, Mr Jun Ren, Miss Betty Wang and Miss Qianyu Li for sharing my ups and downs
in the past five years.
Last but not least, my deepest love goes to my parents for their unconditional and endless
love, without which I would never be able to keep going on this journey. I also wish to
express my great appreciation to Chin Pang for his companion, support and patience
since we met.

iv
Table of Contents
Abstract……………………………………………………………………………………...........i
Acknowledgement……………………………………………………………………………….ii
Table of Contents………………………………………………………………………………..iv
List of Tables……………………………………………………………………………………..ix
List of Figures……………………………………………………………………… ……………xi
List of Abbreviations……………………………………………………………………………xvi
Glossary………………………………………………………………………………………..xvii
Introduction ....................................................................................................... 1
Background ............................................................................................................... 1
1.1.1 Introduction ........................................................................................................ 1
1.1.2 Alkali-activated fly ash ....................................................................................... 2
1.1.3 Accelerated curing ............................................................................................. 3
Aims and objectives .................................................................................................. 4
Outline of the thesis .................................................................................................. 5
Accelerated Curing for Portland Cement-based Materials............................... 7
Introduction ............................................................................................................... 7
Comparison of heating mechanism .......................................................................... 7
2.2.1 Mechanism of conventional thermal heating ..................................................... 7
2.2.1.1 Conduction heat transfer ............................................................................ 7
2.2.1.2 Limitation of conventional thermal heating ................................................. 8
2.2.2 Mechanism of microwave heating ..................................................................... 8
2.2.2.1 Introduction ................................................................................................. 8
2.2.2.2Microwave oven ........................................................................................... 9
2.2.2.3 Microwave energy conversion .................................................................. 10
2.2.2.4 Dielectric properties .................................................................................. 11
2.2.2.5 Volumetric heating .................................................................................... 13
Conventional thermal curing ................................................................................... 14
2.3.1 Introduction ...................................................................................................... 14
2.3.2 Hydration of Portland cement at ambient temperature ................................... 15
2.3.3 Effect of conventional thermal curing on the properties of Portland cement-
based products ......................................................................................................... 16
2.3.3.1 Introduction ............................................................................................... 16
2.3.3.2 Effect of delay period and rate of temperature rise .................................. 18
2.3.3.3 Effect of the thermal curing period and cooling period ............................. 19
2.3.3.4 Effect of moisture ...................................................................................... 19
2.3.4 Issues arising from conventional thermal curing ............................................. 20
Microwave curing .................................................................................................... 21
2.4.1 Introduction ...................................................................................................... 21
2.4.2 Effect of microwave curing on the properties of Portland cement-based products
.................................................................................................................................. 21
2.4.2.1 Introduction ............................................................................................... 21
2.4.2.2 Effect of delay period ................................................................................ 21
2.4.2.3 Issues with curing concretes using domestic microwave oven ................ 23
2.4.2.4 Pilot industrial microwave systems for curing concrete products ............ 28
2.4.3 Microwave curing process control ................................................................... 33

v
2.4.3.1 Introduction ............................................................................................... 33
2.4.3.2 Temperature monitoring during microwave curing ................................... 34
2.4.3.3 Effect of moisture ...................................................................................... 35
2.4.3.4 Issues arising from microwave curing and proposed solutions ............... 36
2.4.4 Modelling of microwave heating ...................................................................... 37
2.4.4.1 Introduction ............................................................................................... 37
2.4.4.2 Modelling of microwave heating of food ................................................... 37
2.4.4.3 Modelling of Portland cement paste cured by microwave ........................ 40
Summary................................................................................................................. 42
Alkali-activated Fly Ash .................................................................................. 44
Introduction ............................................................................................................. 44
Raw materials of alkali-activated fly ash ................................................................ 44
3.2.1 Fly ash ............................................................................................................. 44
3.2.2 Alkaline activator .............................................................................................. 45
3.2.2.1 Sodium hydroxide ..................................................................................... 45
3.2.2.2 Sodium silicate .......................................................................................... 46
Reaction mechanism of alkali-activated fly ash ..................................................... 46
3.3.1 Introduction ...................................................................................................... 46
3.3.2 Reaction model of alkaline activation .............................................................. 46
3.3.2.1 Proposed reaction models ........................................................................ 46
3.3.2.2 Reaction products ..................................................................................... 51
3.3.3 Activation barrier and reaction kinetics ............................................................ 52
3.3.3.1 Activation barrier ....................................................................................... 52
3.3.3.2 Effect of concentration of NaOH solution on the reaction rate ................. 52
Reaction products and microstructure of alkali-activated fly ash ........................... 55
3.4.1 Introduction ...................................................................................................... 55
3.4.2 Reaction products ............................................................................................ 55
3.4.3 Microstructure .................................................................................................. 63
Accelerated curing in the manufacture of alkali-activated fly ash .......................... 67
3.5.1 Conventional thermal curing for manufacturing alkali-activated fly ash .......... 67
3.5.1.1 Introduction ............................................................................................... 67
3.5.1.2 Effect of delay period ................................................................................ 67
3.5.1.3 Effect of curing temperature ..................................................................... 69
3.5.1.4 Effect of curing duration ............................................................................ 70
3.5.1.5 Effect of moisture ...................................................................................... 71
3.5.2 Microwave curing for manufacturing alkali-activated fly ash ........................... 73
3.5.2.1 Dielectric properties of alkali-activated fly ash ......................................... 73
3.5.2.2 Microwave curing for manufacture of alkali-activated fly ash ................... 74
3.5.3 Discussion........................................................................................................ 76
Challenges facing alkali-activated fly ash .............................................................. 77
Summary................................................................................................................. 78
Experimental and Research Methods ............................................................ 80
Introduction ............................................................................................................. 80
Raw materials and preparation of alkali-activated fly ash ...................................... 80
4.2.1 Raw materials .................................................................................................. 80
4.2.2 Preparation of alkali-activated fly ash samples ............................................... 82
4.2.2.1 Mould ........................................................................................................ 82
4.2.2.2 Mixing and casting of alkali-activated fly ash paste ................................. 83

vi
Accelerated curing .................................................................................................. 83
4.3.1 Introduction ...................................................................................................... 83
4.3.2 Temperature monitoring .................................................................................. 83
4.3.2.1 Introduction ............................................................................................... 83
4.3.2.2 Optical fibre sensor ................................................................................... 84
4.3.2.3 Infrared camera ........................................................................................ 86
4.3.3 Conventional thermal curing ............................................................................ 87
4.3.3.1 Electric oven ............................................................................................. 87
4.3.3.2 Thermal curing control .............................................................................. 88
4.3.4 Microwave Curing ............................................................................................ 89
4.3.4.1 Measurement of dielectric properties of alkali-activated fly ash .............. 89
4.3.4.2 Custom-made microwave oven ................................................................ 90
4.3.4.3 Placement of samples in the microwave oven ......................................... 92
4.3.4.4 Microwave curing regime .......................................................................... 93
4.3.4.5 Microwave curing control .......................................................................... 97
4.3.5 Subsequent curing ........................................................................................... 97
Analysis methods.................................................................................................... 98
4.4.1 Measurement of unconfined compressive strength ........................................ 98
4.4.2 Characterisation of reaction products .............................................................. 98
4.4.2.1 X-ray diffraction ......................................................................................... 98
4.4.2.2 Thermogravimetry ..................................................................................... 99
4.4.2.3 Fourier transform infrared spectroscopy .................................................. 99
4.4.2.4 Nuclear magnetic resonance spectroscopy ............................................. 99
4.4.3 Microstructure analysis .................................................................................. 100
4.4.3.1 Mercury intrusion porosimetry ................................................................ 100
4.4.3.2 Scanning electron microscopy................................................................ 101
Development of Multi-stage Microwave Curing Regime for Manufacturing
Alkali-activated Fly Ash ................................................................................................. 102
Introduction ........................................................................................................... 102
Aims and objectives .............................................................................................. 102
Temperature profile in alkali-activated fly ash cured by conventional thermal
oven………………………………………………………………………………………….102
Central composite experimental design for developing multi-stage microwave curing
regime………………………………………………………………………………………..104
5.4.1 Preliminary study ........................................................................................... 104
5.4.2 Factors contributing to the multi-stage microwave curing regime ................. 105
5.4.3 Central composite design and results ........................................................... 107
Optimisation of the multi-stage microwave curing ............................................... 112
5.5.1 Introduction .................................................................................................... 112
5.5.2 Effects on the compressive strength after microwave curing........................ 113
5.5.2.1 Analysis of variance for the response of compressive strength ............. 113
5.5.2.2 Effect of factors on the compressive strength ........................................ 115
5.5.3 Effects on the energy consumption ............................................................... 121
5.5.3.1 Analysis of variance for the response of energy consumption .............. 121
5.5.3.2 Effect of factors on the energy consumption .......................................... 123
5.5.4 Optimisation of the multi-stage microwave curing regime ............................ 130
5.5.4.1 Desirability method ................................................................................. 130
5.5.4.2 Optimisation of microwave curing regime .............................................. 130

vii
5.5.4.3 Validation of the optimised microwave curing regime ............................ 131
5.5.4.4 Optimised multi-stage curing regime repeated in the conventional thermal
oven .................................................................................................................... 131
Comparison of strength development and energy consumption of two curing
methods ...................................................................................................................... 132
5.6.1 Selection of alkali-activated fly ash samples ................................................. 132
5.6.2 Comparison of strength development and energy consumption .................. 133
5.6.2.1 Strength development ............................................................................ 133
5.6.2.2 Energy consumption ............................................................................... 134
Conclusions .......................................................................................................... 134
Characterisation of Alkali-activated Fly Ash Manufactured by Multi-stage
Microwave Curing Regime ............................................................................................ 136
Introduction ........................................................................................................... 136
Aims and objectives .............................................................................................. 136
Reaction products and microstructure of alkali-activated fly ash immediately after
accelerated curing ...................................................................................................... 137
6.3.1 Introduction .................................................................................................... 137
6.3.2 Comparison of alkali-activated fly ashes with equivalent strength ................ 138
6.3.2.1 Reaction products ................................................................................... 138
6.3.2.2 Microstructure ......................................................................................... 142
6.3.3 Comparison of alkali-activated fly ashes with similar history of curing
temperature ............................................................................................................. 145
6.3.3.1 Reaction products ................................................................................... 145
6.3.3.2 Microstructure ......................................................................................... 149
6.3.4 Discussion...................................................................................................... 152
Evolution of reaction products and microstructure of alkali-activated fly ash over
time…………………………………………………………………………………………..155
6.4.1 Introduction .................................................................................................... 155
6.4.2 Reaction products and microstructure development of O-85oC-24h over time
................................................................................................................................ 155
6.4.2.1 Reaction products ................................................................................... 155
6.4.2.2 Microstructure ......................................................................................... 160
6.4.3 Reaction products and microstructure development of M-Multi-4.5h ........... 163
6.4.3.1 Reaction products ................................................................................... 163
6.4.3.2 Microstructure ......................................................................................... 168
6.4.4 Discussion...................................................................................................... 171
Conclusions .......................................................................................................... 176
Effect of Sample Size on Properties of Alkali-activated Fly Ash Manufactured
by Multi-stage Microwave Curing .................................................................................. 178
Introduction ........................................................................................................... 178
Aims and objectives .............................................................................................. 178
Temperature history of alkali-activated fly ash with three different sizes ............ 179
7.3.1 Alkali-activated fly ash under multi-stage microwave curing......................... 179
7.3.1.1 Real-time temperature monitoring by FBG sensor during microwave curing
process…………………………………………………………………………………179
7.3.1.2 Thermal image of temperature distribution obtained by infrared camera
after multi-stage microwave curing ..................................................................... 181
7.3.2 Alkali-activated fly ash under conventional thermal curing ........................... 182

viii
7.3.2.1 Real-time temperature monitoring by FBG sensor during the conventional
curing process ..................................................................................................... 182
7.3.2.2 Thermal image of temperature distribution obtained by infrared camera
after conventional thermal curing ....................................................................... 185
Compressive strength and energy consumption of alkali-activated fly ash with three
sizes………………………………………………………………………………………….186
7.4.1 Alkali-activated fly ash manufactured by multi-stage microwave curing ....... 186
7.4.2 Alkali-activated fly ash manufactured by conventional thermal curing ......... 189
Characterisation of 100mm alkali-activated fly ash in three temperature regions 190
7.5.1 Alkali-activated fly ash cured by multi-stage microwave curing .................... 190
7.5.1.1 Classification of temperature regions ..................................................... 190
7.5.1.2 Reaction products ................................................................................... 191
7.5.1.3 Microstructure ......................................................................................... 196
7.5.2 Alkali-activated fly ash cured by conventional thermal curing ...................... 199
7.5.2.1 Classification of temperature regions ..................................................... 199
7.5.2.2 Reaction products ................................................................................... 200
7.5.2.3 Microstructure ......................................................................................... 204
Discussion ............................................................................................................ 207
Conclusions .......................................................................................................... 210
Conclusions and Future Work ...................................................................... 211
Conclusions .......................................................................................................... 211
8.1.1 Development of multi-stage microwave curing regime for manufacturing alkali-
activated fly ash ...................................................................................................... 211
8.1.2 Characterisation of alkali-activated fly ash manufactured with multi-stage
microwave curing regime ........................................................................................ 211
8.1.3 Effect of sample size on properties of alkali-activated fly ash manufactured by
multi-stage microwave curing ................................................................................. 212
Future work ........................................................................................................... 212
8.2.1 Modification of design of microwave oven and further optimisation of microwave
curing regime .......................................................................................................... 212
8.2.2 Further study of mechanism of alkaline activation under microwave curing 213
8.2.3 Investigation of alkali-activated fly ash manufactured with various raw materials
and potential industrial application ......................................................................... 213
Reference….……………………………………………………………………………….....214
Appendix A: Measurement of Dielectric Properties………………………………….........217
Appendix B: Simulation of Microwave Curing with COMSOL…………………………….218
ix
List of Tables
Table 1.1 Global production of fly ash in 2013 .................................................................. 1
Table 2.1 Dielectric properties of the constituents in concrete (2.45 GHz) .................... 12
Table 2.2 Conventional thermal curing for concrete products ........................................ 17
Table 2.3 Delay period adopted in the application of microwave curing ........................ 22
Table 2.4 Microwave curing with domestic microwave ovens ........................................ 25
Table 2.5 Microwave curing control (R.G. Hutchison I et al., 1991) ............................... 26
Table 2.6 Microwave curing with pilot industrial microwave systems ............................. 29
Table 3.1 Comparison of the classification of fly ash between BS and ASTM Standards
......................................................................................................................................... 45
Table 3.2 Two new zeolites species formed in alkali-activated fly ash (Criado et al., 2007a,
Fernandez-Jimenez et al., 2008) ..................................................................................... 57
Table 3.3 Bands of FTIR spectra (Criado et al., 2010, Criado et al., 2007b, Fernandez-
Jimenez and Palomo, 2005b) .......................................................................................... 59
Table 3.4 29Si NMR signal ranging from -80 ppm to -110 ppm (Fernandez-Jimenez et al.,
2006d) .............................................................................................................................. 63
Table 3.5 Summary of curing regimes used for conventional thermal curing of alkali-
activated fly ash in the literature ...................................................................................... 68
Table 4.1 Major oxide composition of fly ash (wt/%) ...................................................... 81
Table 4.2 NaOH solution ................................................................................................. 82
Table 4.3 Mix design of alkali-activated paste ................................................................ 83
Table 4.4 Summary of central composite design (5 factors and 5 levels) ...................... 94
Table 4.5 Rate of temperature rise under different Pmaxs ............................................... 94
Table 4.6 Design matrix (coded factor) ........................................................................... 96
Table 5.1 Initial multi-stage microwave curing regime vs strength gain of alkali-activated
fly ash ............................................................................................................................. 105
Table 5.2 Results of the actual design matrix ............................................................... 108
Table 5.3 Analysis of the eight replicates of the compressive strength at the central point
....................................................................................................................................... 112
Table 5.4 ANOVA for the model of compressive strength ............................................ 114
Table 5.5 ANOVA for the model of energy consumption .............................................. 122
Table 5.6 Constraints and solution for the optimisation ................................................ 131
Table 5.7 Validation of the optimum microwave curing regime .................................... 131
Table 5.8 Energy consumption of alkali-activated fly ash with two curing methods
(calculation based on the data from power meter) ........................................................ 134
Table 6.1 Details of the alkali-activated fly ash samples with equivalent compressive
strength after immediately after accelerated curing ...................................................... 137
Table 6.2 Details of the alkali-activated fly ash samples with similar history of curing
temperature ................................................................................................................... 138
Table 6.3 29Si signals of N-A-S-H gel in O-85oC-24h and M-Multi-6h .......................... 142
Table 6.4 Comparison of pore size distribution of O-85oC-24h and M-Multi-6h ........... 144
Table 6.5 29Si signals of N-A-S-H gel in M-Multi-4.5h and O-Multi-4.5h ....................... 149
Table 6.6 Comparison of pore size distribution of M-Multi-4.5h and O-Multi-4.5h ....... 151
Table 6.7 Summary of characterisation of four alkali-activated fly ash samples after
accelerated curing ......................................................................................................... 154
Table 6.8 Strength development of O-85oC-24h and M-Multi-4.5h .............................. 155

x
Table 6.9 29Si signals of N-A-S-H gel in O-85oC-24h at different ages ........................ 160
Table 6.10 Comparison of pore size distribution of O-85oC-24h at different ages ....... 161
Table 6.11 29Si signals of N-A-S-H gel in M-Multi-4.5h at different ages ...................... 168
Table 6.12 Comparison of pore size distribution of M-Multi-4.5h at different ages ...... 170
Table 6.13 Summary of characterisation of O-85oC-24h at three ages ........................ 174
Table 6.14 Summary of characterisaiton of M-Multi-4.5h at three ages ....................... 175
Table 7.1 Strength and energy consumption of alkali-activated fly ash samples with multi-
stage microwave curing ................................................................................................. 189
Table 7.2 Strength and energy consumption of alkali-activated fly ash samples with
conventional thermal curing ........................................................................................... 190
Table 7.3 Temperature distribution of 100mm alkali-activated fly ash sample with multi-
stage microwave curing ................................................................................................. 191
Table 7.4 29Si signals of N-A-S-H gel in 100mm alkali-activated fly ash under multi-stage
microwave curing ........................................................................................................... 195
Table 7.5 Comparison of pore size distribution of multi-stage microwave cured AAFA at
different temperature regions ........................................................................................ 197
Table 7.6 Temperature regions of 100mm alkali-activated fly ash sample under
conventional thermal curing ........................................................................................... 200
Table 7.7 29Si signals of N-A-S-H gel in 100mm alkali-activated fly ash under conventional
thermal curing ................................................................................................................ 203
Table 7.8 Comparison of pore size distribution of conventional thermal cured AAFA at
different temperature regions ........................................................................................ 205
Table 7.9 Comparison of three regions in 100mm alkali-activated fly ash sample with
different curing methods ................................................................................................ 209
Table A1 Dielectric properties of alkali-activated fly ash at the frequency of 2.45
GHz…………………………………………………………………………………………….226
Table B1 Power input of microwave curing for difference size of alkali-activated fly ash
samples………………………………………………………………………………………..228

xi
List of Figures
Figure 2.1 Schematic of one dimensional heat conduction (Holman, 2002) .................... 7
Figure 2.2 Electromagnetic wave (Metaxas and Meredith, 1983) .................................... 8
Figure 2.3 Schematic of a typical domestic microwave oven and cross-section of
magnetron (Metaxas and Meredith, 1983) ........................................................................ 9
Figure 2.4 Schematic of dipolar molecules (a) in the absence and (b) in the presence of
an electric field (Ong and Akbarnezhad, 2015) ............................................................... 10
Figure 2.5 Coaxial probe method .................................................................................... 11
Figure 2.6 Dielectric properties of Portland cement-based materials (Makul et al., 2010a)
......................................................................................................................................... 13
Figure 2.7 Conventional thermal curing (Neville and Brooks, 2010) ............................. 15
Figure 2.8 Heat evolution of hydration of Portland cement (Shi et al., 2006) ................. 16
Figure 2.9 Total energy consumed in steam curing (Adapted from Won et al., 2013) ... 21
Figure 2.10 Effect of microwave power level on compressive strength of Portland cement
mortars (Wu et al., 1987) ................................................................................................. 26
Figure 2.11 Compressive strength of Portland cement mortar (R.G. Hutchison I et al.,
1991) ................................................................................................................................ 27
Figure 2.12 Microwave curing Type III ordinary Portland cement concrete (Leung and
Pheeraphan, 1997) .......................................................................................................... 30
Figure 2.13 Compressive strength of concrete specimens (Adapted from Leung and
Pheeraphan, 1997) .......................................................................................................... 31
Figure 2.14 Cross-sectional view of the 10kW microwave facility with 800x800x100mm
concrete panel element (Mak et al., 2001) (Note: Ports: emitting microwave, Mode stirrer:
making microwave uniformly distributed in the cavity ) ................................................... 32
Figure 2.15 Microwave conveyor belt (Rattanadecho et al., 2008) ................................ 33
Figure 2.16 Power profile and temperature profile (Adapted from Makul and Agrawal, 2011)
......................................................................................................................................... 33
Figure 2.17 Schematic of FBG (Chen and Dong, 2012) ................................................. 34
Figure 2.18 Simulation of minced beef cylinder (central cross-section) heated by
microwave at 2.45GHz (Adapted from Campanone and Zaritzky, 2005) ....................... 38
Figure 2.19 Simulation of heating a beef cylinder (lateral section) in microwave for 120s
at 2.45 GHz (Adpated from Hossan et al., 2010) ............................................................ 39
Figure 2.20 Simulation of cylindrical sample heated by microwave at 2.45 GHz (Santos et
al., 2010) .......................................................................................................................... 39
Figure 2.21 Simulation of 1% gellen gel (analogy to food) heated by microwave at 2.45
GHz (Raj et al., 2011) ...................................................................................................... 40
Figure 2.22 Temperature distribution obtained for the simulation of Portland cement paste
cured by microwave at 2.45 GHz for 30 seconds (Rattanadecho et al., 2009) .............. 41
Figure 2.23 Comparison of temperature changes between simulation results and
experimental results (microwave heating for 45 minutes) (Makul et al., 2010b) ............ 41
Figure 3.1 SEM image of Class F fly ash (Katz, 1998) ................................................... 45
Figure 3.2 Three dimensional structure of poly(sialate) (sialate: silico-aluminate)
(Davidovits, 2011) ............................................................................................................ 47
Figure 3.3 Conceptual model for geopolymerisation (Duxson et al., 2007a) .................. 48
Figure 3.4 Descriptive model of alkali-activated fly ash (Fernandez-Jimenez et al., 2005)
......................................................................................................................................... 49

xii
Figure 3.5 Schematic description of mechanical properties evolution over the reaction
time. The increment of mechanical performances (P) is related to the Si/Al ratio in the gel
(Fernandez-Jimenez et al., 2006d). ................................................................................ 51
Figure 3.6 Schematic structure of Q4(mAl) units (Davidovits, 2011) .............................. 51
Figure 3.7 Effect of the concentration of NaOH solution on the N-A-S-H gel formation
(Note: peak intensity indicates the amount of N-A-S-H gel formed in the alkali-activated
fly ash) (Rees et al., 2007) .............................................................................................. 53
Figure 3.8 Effect of concentration of NaOH solution on the dissolution of Si4+ and Al3+ from
fly ash (Rattanasak and Chindaprasirt, 2009) ................................................................. 54
Figure 3.9 Effect of concentration of NaOH solution on the strength development of alkali-
activated fly ash cured at 75oC (Bakharev, 2005b) ......................................................... 54
Figure 3.10 Schematic representation of the Bragg’s Law (Waseda et al., 2011) ......... 56
Figure 3.11 X-ray powder diffraction spectra of raw fly ash and alkali-activated fly ash with
different reaction durations (Criado et al., 2007a) ........................................................... 56
Figure 3.12 Thermogravimetric analysis of 8M NaOH activated alkali-activated fly ash
(Adapted from Fernandez-Jimenez et al., 2008) ............................................................. 57
Figure 3.13 FTIR spectra for the raw fly ash and alkali-activated fly ash at 85oC for different
reaction durations (Criado et al., 2007b) ......................................................................... 58
Figure 3.14 Structure of zeolite (Dyer, 1988) .................................................................. 59
Figure 3.15 Energy transition of a spinning nucleus in a magnetic field (Adapted from
Abraham et al., 1994) ...................................................................................................... 60
Figure 3.16 29Si and 27Al NMR spectra of raw fly ash and 8M NaOH activated alkali-
activated fly ash cured at 85oC for different durations (Fernandez-Jimenez et al., 2006d)
......................................................................................................................................... 62
Figure 3.17 Pore size distribution of cement paste at different ages (Adapted from Ye,
2003) ................................................................................................................................ 65
Figure 3.18 Pore size distribution of alkali-activated fly ash paste at 7 days (Ma, 2013) 65
Figure 3.19 SEM images of alkali-activated fly ash: activated by 8M NaOH and cured at
85oC (a) for 5h; (b) for 20h (Fernandez-Jimenez et al., 2005) ........................................ 66
Figure 3.20 SEM images of alkali-activated fly ash activated by (a) 4M NaOH; (b) 10M
NaOH and cured by microwave for 120 min (Somaratna et al., 2010) ........................... 66
Figure 3.21 Evolution of the compressive strength of alkali-activated fly ash at 45oC, 65oC
and 85oC (Palomo et al., 2004) ....................................................................................... 69
Figure 3.22 Compressive strength development of alkali-activated fly ash cured at 75oC
and 95oC (Adapted from Bakharev, 2005b) .................................................................... 69
Figure 3.23 Effect of concentration of NaOH solution and curing temperature on
compressive strength of alkali-activated fly ash (Adapted from Atis et al., 2015) .......... 70
Figure 3.24 Compressive strength vs curing duration (Adapted from Criado et al., 2007a)
......................................................................................................................................... 71
Figure 3.25 Compressive strength vs curing duration (Note: P, L, M indicate different fly
ashes activated by 8M NaOH) (Fernandez-Jimenez et al., 2006d) ................................ 71
Figure 3.26 Effect of RH on compressive strength over curing time (Note: Method 1: alkali-
activated fly ash sealed in air-tight containers, RH: ~90%; Method 2: alkali-activated fly
ash exposed to the air in the cavity of thermal oven: RH: 40-50%) ................................ 72
Figure 3.27 Effect of curing condition on the compressive strength and total porosity [Note:
Dry Curing (DC): 2h at 95oC + 6h at 150oC; Steam Curing (SC): 8h at 95oC; Curing in
covered moulds (CCM): 8h at 95oC] (Kovalchuk et al., 2007) ........................................ 73

xiii
Figure 3.28 Variation of dielectric properties of alkali-activated fly ash mortar over time
after mixing (Note: measured at 28-29oC and 2.45 GHz) (Jumrat et al., 2011) ............ 74
Figure 3.29 Temperature distribution along the depth of the alkali-activated fly ash cube
(Somaratna et al., 2010) .................................................................................................. 75
Figure 3.30 Thermal image of cross-section of alkali-activated fly ash samples after
microwave curing (Shi et al., 2014b) ............................................................................... 75
Figure 4.1 SEM image of Class F fly ash from Weihe Power Plant, China .................... 81
Figure 4.2 Particle size distribution of fly ash .................................................................. 81
Figure 4.3 Plastic moulds fabricated for the microwave curing ...................................... 82
Figure 4.4 Configuration of FBG sensor.......................................................................... 84
Figure 4.5 Schematic diagram of three alkali-activated fly ash samples of different sizes
with embedded FBG sensor ............................................................................................ 85
Figure 4.6 Test of the effect of PTFE sleeve on the sensitivity of FBG sensor .............. 86
Figure 4.7 Effect of PTFE sleeve on the temperature reading of the FBG sensor ......... 86
Figure 4.8 FLIR E60bx infrared camera .......................................................................... 87
Figure 4.9 Conventional electric thermal oven ................................................................ 87
Figure 4.10 Power meter for electric thermal oven ......................................................... 88
Figure 4.11 Alkali-activated fly ash samples within their moulds, wrapped with wet hessian
and sealed in plastic bags ............................................................................................... 89
Figure 4.12 Network analyser with dielectric probe ........................................................ 89
Figure 4.13 Setup for the measurement of dielectric properties of alkali-activated fly ash
......................................................................................................................................... 90
Figure 4.14 Custom-made microwave oven with variable power output and fully controlled
temperature profile ........................................................................................................... 90
Figure 4.15 Custom-made microwave oven with integrated sensor system and humidifier
......................................................................................................................................... 91
Figure 4.16 Power meter for microwave oven ................................................................ 92
Figure 4.17 Alkali-activated fly ash cured in the custom-made microwave oven ........... 92
Figure 4.18 Central composite design (three factors) (Fabiano-Tixier et al., 2011) ....... 93
Figure 4.19 The front panel for automatic control of microwave oven (LabVIEW) ......... 97
Figure 4.20 X-ray diffractometer ...................................................................................... 98
Figure 4.21 NETZSCH TG 209 F1 Libra ......................................................................... 99
Figure 4.22 Bruker ALPHA FTIR ..................................................................................... 99
Figure 4.23 Bruker AscendTM-400 nuclear magnetic resonance spectrometer .......... 100
Figure 4.24 AUTOPore IV 9500 Micromeritics Instrument............................................ 100
Figure 4.25 FEI Quanta200 scanning electron microscope .......................................... 101
Figure 5.1 Temperature profile of O-85oC-24h under conventional thermal curing...... 103
Figure 5.2 Initial multi-stage microwave curing regimes on alkali-activated fly ash samples
(data from experiments) ................................................................................................ 105
Figure 5.3 Multi-stage microwave curing regime for manufacturing alkali-activated fly ash
....................................................................................................................................... 107
Figure 5.4 Normal probability plot of residuals for compressive strength (MPa) .......... 115
Figure 5.5 Perturbation plot showing the effect of all factors on the compressive strength
[Pmax (A), t1 (B), t2 (C), t3 (D), t4 (E)] ............................................................................... 116
Figure 5.6 Response surface (upper) and contour plot (lower) showing the effect of Pmax
and t1 on the compressive strength ............................................................................... 117
Figure 5.7 Response surface (upper) and contour plot (lower) showing the effect of Pmax
and t2 on the compressive strength (t1: 60min, t3: 60min, t4: 60min) ............................ 118

xiv
Figure 5.8 Response surface (upper) and contour plot (lower) showing the effect of Pmax
and t3 on the compressive strength (t1: 60min, t2: 60min, t4: 60min) ............................ 119
Figure 5.9 Response surface (upper) and contour plot (lower) showing the effect of Pmax
and t4 on the compressive strength (t1: 60min, t2: 60min, t3: 60min) ............................ 120
Figure 5.10 Normal probability plot of residuals for energy consumption (kJ/MPa) ..... 123
Figure 5.11 Perturbation plot showing the effects of all factors on the energy consumption
[Pmax (A), t1 (B), t2 (C), t3 (D), t4 (E)] ............................................................................... 124
Figure 5.12 Power and temperature profiles of three runs from the design matrix ...... 125
Figure 5.13 Response surface (upper) and contour plot (lower) showing the effect of Pmax
and t4 on the energy consumption (t1: 60min, t2: 60min, t3: 60min) .............................. 127
Figure 5.14 Response surface (upper) and contour plot (lower) showing the effect of t1
and t3 on the energy consumption (Pmax: 575W, t2: 60min, t4: 60min) .......................... 128
Figure 5.15 Response surface (upper) and contour plot (lower) showing the effect of t3
and t4 on the energy consumption (Pmax: 575W, t1: 60min, t2: 60min) .......................... 129
Figure 5.16 Temperature profile of O-Multi-4.5h under conventional thermal curing
(Duplication of the optimum microwave curing regime) ................................................ 132
Figure 5.17 Compressive strength of alkali-activated fly ash samples ......................... 133
Figure 6.1 XRD patterns of raw fly ash, O-85oC-24h and M-Multi-6h (Q-quartz, M-mullite,
F-hematite, H-hydroxysodalite, N-chabazite-Na) .......................................................... 139
Figure 6.2 TG/DTG analysis of raw fly ash, O-85oC-24h and M-Multi-6h..................... 140
Figure 6.3 FTIR spectra of raw fly ash, O-85oC-24h and M-Multi-6h ........................... 141
Figure 6.4 29Si NMR spectra of raw fly ash, O-85oC-24h and M-Multi-6h .................... 142
Figure 6.5 Pore size distributions of O-85oC-24h and M-Multi-6h ................................ 143
Figure 6.6 SEM images of AAFA samples of O-85oC-24h and M-Multi-6h .................. 145
Figure 6.7 XRD patterns of raw fly ash, M-Multi-4.5h and O-Multi-4.5h (Q-quartz, M-mullite,
F-hematite, H-hydroxysodalite, N-chabazite-Na) .......................................................... 146
Figure 6.8 TG/DTG analysis of raw fly ash, M-Multi-4.5h and O-Multi-4.5h ................. 147
Figure 6.9 FTIR spectra of raw fly ash, M-Multi-4.5h and O-Multi-4.5h ........................ 148
Figure 6.10 29Si NMR spectra of raw fly ash, M-Multi-4.5h and O-Multi-4.5h............... 149
Figure 6.11 Pore size distributions of M-Multi-4.5h and O-Multi-4.5h ........................... 150
Figure 6.12 SEM images of M-Multi-4.5h and O-Multi-4.5h .......................................... 152
Figure 6.13 XRD patterns of raw fly ash and O-85oC-24h at different ages (Q-quartz, M-
mullite, F-hematite, H-hydroxysodalite, N-chabazite-Na) ............................................. 156
Figure 6.14 TG/DTG analysis of raw fly ash and O-85oC-24h at different ages ........... 157
Figure 6.15 FTIR spectra for raw fly ash and O-85oC-24h at different ages ................ 158
Figure 6.16 29Si NMR spectra of raw fly ash and O-85oC-24h at different ages .......... 159
Figure 6.17 Pore size distributions of O-85oC-24h at different ages ............................ 161
Figure 6.18 SEM images of O-85oC-24h at different ages ........................................... 163
Figure 6.19 XRD patterns of raw fly ash and M-Multi-4.5h at different ages (Q-quartz, M-
mullite, F-hematite, H-hydroxysodalite, N-chabazite-Na) ............................................. 164
Figure 6.20 TG/DTG analysis of raw fly ash and M-Multi-4.5h at different ages .......... 165
Figure 6.21 FTIR spectra for raw fly ash and M-Multi-4.5h at different ages ............... 166
Figure 6.22 29Si NMR spectra of raw fly ash and M-Multi-4.5h at different ages ......... 167
Figure 6.23 Pore size distributions of M-Multi-4.5h at different ages............................ 169
Figure 6.24 SEM images of M-Multi-4.5h at different ages ........................................... 171
Figure 7.1 Temperature evolution at central axis of alkali-activated fly ash samples under
multi-stage microwave curing ........................................................................................ 180

xv
Figure 7.2 Temperature distribution on the cross section of alkali-activated fly ash samples
immediately after multi-stage microwave curing ........................................................... 182
Figure 7.3 Temperature evolution at central axis of alkali-activated fly ash samples under
conventional thermal curing ........................................................................................... 184
Figure 7.4 Temperature distribution on the cross section of alkali-activated fly ash samples
immediately after conventional thermal curing .............................................................. 186
Figure 7.5 Compressive strength of alkali-activated fly ash samples under multi-stage
microwave curing ........................................................................................................... 187
Figure 7.6 Power profile and temperature profile (core) of alkali-activated fly ash samples
under multi-stage microwave curing .............................................................................. 188
Figure 7.7 Compressive strength of alkali-activated fly ash samples under conventional
thermal curing ................................................................................................................ 189
Figure 7.8 Temperature distribution on the cross section of 100mm alkali-activated fly ash
sample with multi-stage microwave curing .................................................................... 191
Figure 7.9 XRD patterns of raw fly ash and 100mm alkali-activated fly ash sample under
multi-stage microwave curing (Q-quartz, M-mullite, F-hematite, H-hydroxysodalite, N-
chabazite-Na) ................................................................................................................ 192
Figure 7.10 TG/DTG analysis of raw fly ash and 100mm alkali-activated fly ash sample
under multi-stage microwave curing .............................................................................. 193
Figure 7.11 FTIR spectra of raw fly ash and 100mm alkali-activated fly ash sample under
microwave curing ........................................................................................................... 194
Figure 7.12 29Si NMR spectra of raw fly ash and 100mm alkali-activated fly ash sample
under microwave curing ................................................................................................ 195
Figure 7.13 Pore size distributions of 100mm alkali-activated fly ash sample under multi-
stage microwave curing ................................................................................................. 197
Figure 7.14 SEM images of 100mm alkali-activated fly ash sample under multi-stage
microwave curing ........................................................................................................... 198
Figure 7.15 Temperature distribution on the cross section of 100mm alkali-activated fly
ash sample under conventional thermal curing ............................................................. 199
Figure 7.16 XRD patterns of raw fly ash and 100mm alkali-activated fly ash sample under
conventional thermal curing (Q-quartz, M-mullite, F-hematite, H-hydroxysodalite, N-
chabazite-Na) ................................................................................................................ 200
Figure 7.17 TG/DTG analysis of raw fly ash and 100mm alkali-activated fly ash sample
under conventional thermal curing ................................................................................ 201
Figure 7.18 FTIR spectra of raw fly ash and 100mm alkali-activated fly ash sample under
conventional thermal curing ........................................................................................... 202
Figure 7.19 29Si NMR spectra of raw fly ash and 100mm alkali-activated fly ash sample
under conventional thermal curing ................................................................................ 203
Figure 7.20 Pore size distributions of 100mm alkali-activated fly ash sample under
conventional thermal curing ........................................................................................... 205
Figure 7.21 SEM images of 100mm alkali-activated fly ash sample under conventional
thermal curing ................................................................................................................ 206
Figure A1 Dielectric properties of alkali-activated fly ash paste at 20oC………………..226
Figure B1 Configuration of AAFA samples cured in the microwave oven………………229
Figure B2 Simulation results of microwave curing AAFA samples with different sizes..230

xvi
List of Abbreviations
AAFA: alkali-activated fly ash
AAM: alkali-activated materials
ANOVA: analysis of variance
C3S: tricalcium silicate
C2S: dicalcium silicate
C3A: tricalcium aluminate
C4AF: tetracalcium aluminoferrite
CCD: central composite design
FBG: fibre Bragg grating
FTIR: Fourier transform infrared spectroscopy
GGBS: ground granulated blast furnace slag
HVFA: high volume fly ash
LOI: loss on ignition
MIP: mercury intrusion porosimetry
NaOH: sodium hydroxide
N-A-S-H: sodium aluminosilcate (gel)
NMR: nuclear magnetic resonance spectroscopy
PC: Portland cement
PFA: pulverised fuel ash
RH: relative humidity
RSM: response surface methodology
SEM: scanning electronic microscope
TG: thermogravimetry
UHPC: ultra-high performance concrete
XRD: X-ray diffraction

xvii
Glossary
Term Definition
Accelerated curing Methods are adopted to achieve high early strength in the
precast concrete industry, i.e., steam curing, autoclaving,
etc. In this thesis, the accelerated curing is referred to
steam curing or microwave curing unless otherwise stated.
Gel conversion The N-A-S-H gel is converted from Al-rich phase to Si-rich
phase in the process of polymerisation.
Curing cycle A curing cycle is composed of a delay period, a temperature
rise period, a curing period at maximum temperature and
cooling period. At the end of each cycle, the moulds can be
reused.
Factor (Chapter 5) A variable of specific experimental interest is referred to as
a factor when an experiment involves more than one
variable.
Geopolymer Geopolymers are framework structures by condensation of
tetrahedral aluminosilicate units, with alkali metal ions
balancing the charge associated with tetrahedral Al.
Lossy Dielectric loss quantifies dissipation of electromagnetic
energy in a dielectric material.
Optimisation In a design of experiment, optimisation is the selection of a
combination of factors with levels with regard to some
criterion.
Pozzolanic reaction It is a chemical reaction that occurs between Ca(OH)2 from
PC and Si(OH)4 from pozzolans to form C-S-H gel.
Production cycle Production of precast concrete consists of casting concrete
in reusable moulds, curing concretes in a controlled
environment and demoulding concrete components, which
are ready to be transported to a construction site.
Rate of temperature rise It is the rate of temperature rise inside the cement and
concrete samples during curing process.
Steam curing Steam curing is one type of thermal curing by providing
steam at atmospheric pressure to a chamber to cure
concrete components.
Thermal curing External heat is provided to cure concretes for high early
strength gain.

Chapter 1 Introduction
1
Introduction
Background
1.1.1 Introduction
Portland cement (PC) is the most widely used construction material in the world.
Manufacture of PC is responsible for 5% of global CO2 emissions, as well as the high
consumption of virgin mineral and fuel resources (Fonta, 2013). During the production of
PC, the raw materials, mainly limestone and clay, are fed into a kiln to be heated up to a
high temperature of 1450oC, leading to a series of chemical reactions to form reactive
calcium silicate and calcium aluminate phases. The decomposition of limestone leads to
the enormous emission of CO2 to the atmosphere, which typically accounts for 60% of the
CO2 emitted during the PC manufacture (Eq. 1.1).
CaCO3 CaO + CO2 (1.1)
Furthermore, the calcination process is energy intensive at a rate of 4.62 GJ per tonne
PC produced (Worrell et al., 2001). Therefore, considerable efforts have been made to
reduce the carbon footprint and energy consumption.
Fly ash is the residual ash collected from the electrostatic precipitator after pulverised coal
is burnt in coal-fired power stations, which is also called pulverised fuel ash (PFA) in the
UK (Sear, 2001). Table 1.1 shows the global production of fly ash in the year of 2013. It
can be seen that China alone is responsible for over 70% of fly ash produced worldwide.
However, under the pressure to shift to more sustainable energy supply, it is anticipated
that fly ash generation will reduce worldwide in the future. This is particularly the case for
developed countries like the UK because the coal-fired power stations in the UK are to be
decommissioned in order to address the sustainability agenda.
Table 1.1 Global production of fly ash in 2013
Country Fly Ash Production (tonne) Utilisation rate (%)
China (China, 2014) 580,000,000 69
India (Ahmad et al., 2014) 163,560,000 61
USA (ACAA, 2014) 53,400,000 44
UK (Carroll, 2015) 5,800,000 63

Chapter 1 Introduction
2
A large proportion of fly ash produced is stockpiled at coal power plants, landfilled or
disposed of by discharging into old quarry operations, which has negative impacts on the
environment. The main utilisation of fly ash is to use it as addition in concrete, raw material
in manufacturing cement clinker, bricks and tile, land reclamation, etc. (Ahmad et al., 2014,
ACAA, 2014, China, 2014)
Due to its pozzolanic property, a large proportion of fly ash produced is utilised in the
blended PC or as an addition in concrete. There are many benefits of introducing fly ash
in PC and concrete products, e.g. reduction of heat of hydration, decrease of water to
cement ratio, and improvement in durability (Aggarwal et al., 2010, Mehta, 2004). BS 197-
1:2000 allows a maximum replacement of 55% clinker by fly ash (in CEM IV). In respect
of high volume fly ash (HVFA) concrete, the fly ash replacement level can be as high as
70% (Chatterjee, 2011). Although replacing clinker with high level of fly ash can contribute
to the sustainability of the construction industry, the early-strength development of HVFA
concrete is usually low which hinders its cast-in-situ applications. Consequently, the pre-
cast application is considered to be more feasible for HVFA concrete where thermal curing
is often used to accelerate the early hydration in order to increase the early strength.
However, the drawback is that the thermal curing will increase the carbon footprint of the
final products, offsetting the benefits which can be achieved with fly ash.
1.1.2 Alkali-activated fly ash
Due to the environmental issues caused by the manufacture of PC, alternative
cementitious materials have attracted growing attention since the 1950s (Shi et al., 2006,
Provis and Deventer, 2009, Provis and van Deventer, 2014). Glukhovsky firstly named an
alkali-activated system as ‘soil cement’ in the 1950s, which is made of ground granulated
blast furnace slag (GGBS) and alkaline activator. In the 1970s, Davidovits coined the term
‘geopolymer’ to describe another alkaline cementitious material made of metakaolin and
alkaline activator. In the 1990s, Palomo and his research group investigated ‘alkali-
activated fly ash (AAFA)’ using fly ash as raw material activated by alkaline activators. To
avoid the confusion caused by various names for alkaline cementitious materials and to
facilitate the development of alternative cementitious materials, Provis defined all of these
materials as alkali-activated materials (AAM) in 2009. Since fly ash is rich in alumina and
silica, it can be activated directly by alkaline solution without using any PC to produce a
non-clinker cementitious material, AAFA, which consists of fly ash and alkaline activators
and shows comparable cementitious properties to PC. Due to its environmental friendly
nature, AAFA has been considered as a potential alternative to PC in certain industrial
applications (Bakharev, 2005b, Palomo et al., 1999, Miranda et al., 2005).

Chapter 1 Introduction
3
It has been proposed that the alkaline activation of fly ash is a chemical process which
involves two main stages, namely, dissolution and gelation (Fernandez-Jimenez et al.,
2005). In the dissolution stage, the reactive silica and alumina components in fly ash are
dissolved under strong alkaline condition (Bakharev, 2005b), whilst in the gelation stage,
the dissolved reactive silica and alumina undergo polymerisation to produce the main
reaction product, sodium aluminosilicate hydrate (N-A-S-H gel) along with a small quantity
of zeolites (Palomo et al., 1999), leading to the formation of a dense cementitious binding
material.
Compared to PC, it has been claimed that AAFA produces lower CO2 emissions,
consumes less energy, and possesses superior durability (Bakharev, 2005a, Miranda et
al., 2005, Fernandez-Jimenez et al., 2006c). However, the strength development of AAFA
is very slow at room temperature and thermal curing has been considered essential for
the initiation of the chemical reaction and subsequent strength development (Puertas et
al., 2003, Katz, 1998, Criado et al., 2005b). Currently, the prevailing curing method in the
literature for AAFA is thermal curing in oven at 85oC, which, depending on the reactivity
of fly ash, normally takes more than 8 hours to obtain an early strength of above 20 MPa
(Criado et al., 2005b). Consequently, AAFA has been considered to be a suitable material
for pre-cast applications, rather than cast in-situ. However, the main drawback of this
conventional thermal curing is that it inevitably increases the energy consumption,
offsetting the benefits which can be obtained with AAFA.
1.1.3 Accelerated curing
Accelerated curing is initially adopted to facilitate the development of early strength of
precast concretes. The most widely used accelerated curing method in industry is steam
curing (McCall, 1996, ACI, 1980, Hwang et al., 2012). Primarily dependent on the thermal
conduction, this conventional accelerated curing may lead to thermal stress inside the
large or thick concrete products due to non-uniform heating, which is detrimental to the
strength development of concrete products (Levitt, 2008). Moreover, although production
time can be decreased by applying conventional thermal curing, the energy consumed
during the curing process is a major concern, which inevitably increases the production
cost. As a result, alternative curing methods with lower energy consumptions are needed.
Compared to conventional thermal heating, such as thermal oven, it is generally agreed
that microwave is a low energy heating source. The dominant heating mechanism in
thermal oven curing is thermal radiation and thermal conduction, whereby the heat is
conducted from the surface to the core of the samples, which is not only slow, but also
generates a thermal gradient throughout the sample. Consequently, it can potentially lead

Chapter 1 Introduction
4
to thermal cracks, affecting the strength development. In contrast, microwave heating is
a more effective heating method, particularly for heating up dielectric materials. There
have been many applications of microwave heating in the food industry, wood drying,
ceramic sintering, etc. (Sosa-Morales et al., 2010, Vadivambal and Jayas, 2010,
Demirskyi et al., 2013). In the past few decades, microwave heating has also been
considered as a potential curing technique for the manufacture of PC-based products (Wu
et al., 1987, Leung and Pheeraphan, 1997, Makul et al., 2010b). This is because all the
components in concrete, including water, cement and aggregate, are dielectric materials.
As a result, concrete itself can be considered as a dielectric material. Water, in particular,
is a good dielectric material. Under the alternating electromagnetic field of microwaves,
the dipolar molecules of these dielectric materials can vibrate and generate friction
between the molecules, converting the microwave energy into the heat energy instantly
and volumetrically (Metaxas and Meredith, 1983). Thus, the curing duration and energy
consumption of microwave heating can be dramatically less than that for conventional
heating.
However, there are three main issues arising from the previous research on using
microwave to cure PC-based products. Firstly, no accurate temperature and humidity
control of the microwave curing process exists in the previous studies. Secondly, curing
regimes have been arbitrarily chosen without careful investigation. Thirdly, the widely
adopted technique for monitoring the temperature changes, such as thermal couples,
during the microwave curing process are not reliable under the microwave environment
or are themselves affected by the strong microwave.
On the other hand, the demand for accelerated curing to activate AAFA with less impact
on the environment makes microwave curing an attractive potential option for addressing
the sustainability issues facing AAFA. However, the research on microwave curing of
AAFA is not well established. In addition, the three issues as identified in using microwave
to PC system also apply to AAFA. Therefore, in this project the research question being
asked is: is microwave heating an alternative to conventional thermal heating for
manufacturing AAFA? And if a novel microwave curing technique is to be
developed for manufacturing AAFA, in addition to temperature and humidity
control, what other considerations need to be taken into account?
Aims and objectives
The aim of this thesis is, therefore, to develop an optimised microwave curing regime for
manufacturing AAFA. This is achieved through the following objectives:

Chapter 1 Introduction
5
To study the factors affecting microwave curing using a central composite
experimental design in order to identify an optimised microwave curing regime by
the response surface methodology;
To investigate and compare the reaction products and microstructure of AAFAs
after conventional thermal curing and the identified optimised microwave curing;
To study the effect of sample size on the properties of AAFA under conventional
thermal curing and the established optimised microwave curing so that the
optimised microwave curing regime established in this project can be applied in
pre-cast applications through a scale-up approach in the future.
Outline of the thesis
Chapter 2 reviews the application of the conventional thermal curing and microwave
curing to PC-based products. The mechanisms of the two curing methods are also
compared. The drawbacks of both conventional thermal curing and microwave curing are
discussed.
Chapter 3 reviews the state-of-the-art of AAFA, including raw materials for the
manufacture of AAFA, the reaction mechanism, accelerated curing for AAFA, reaction
products and strength development.
Chapter 4 describes the details of the materials and methodology used in this study, i.e.,
mix design for the AAFA sample, the accelerated curing process, methods for
characterisation of AAFA products, etc.
Chapter 5 applies an experimental design to investigate the influence of the experimental
conditions (factors) on microwave curing in order to identify an optimised microwave
curing regime by statistical modelling and analysis.
Chapter 6 examines the reaction products and microstructure of the AAFA cured by the
newly developed microwave curing regime, and also compares with the features of AAFA
cured by conventional thermal curing, to identify the advantages and disadvantages of
the newly developed microwave curing regime for the properties of AAFA.
Chapter 7 presents the results of the investigation on the effect of sample size on the
properties of AAFA with the optimised microwave curing regime. The experimentally-

Chapter 1 Introduction
6
determined temperature profile of AAFA after microwave curing is compared with the
simulation results obtained using the software COMSOL.
Chapter 8 draws the main conclusions of the thesis and suggests future work.

Chapter 2 Accelerated Curing for Portland Cement-based Materials
7
Accelerated Curing for Portland Cement-based
Materials
Introduction
This chapter reviews the application of two accelerated curing methods, namely,
conventional thermal curing and microwave curing, in the manufacture of Portland cement
(PC)-based products. In particular, the mechanism of these two curing methods, the
factors affecting the accelerated curing regime as well as the energy consumption are
presented and discussed in detail. The application of modelling to predict the thermal
behaviour of concrete products with different sizes under microwave curing is also
considered in relation to future industrial application of microwave curing in the
manufacture of precast concrete products.
Comparison of heating mechanism
2.2.1 Mechanism of conventional thermal heating
2.2.1.1 Conduction heat transfer
There are three types of heat transfer: conduction, convection and radiation (Holman,
2002). The predominant mode of heat transfer in conventional thermal curing is
conduction (Ong and Akbarnezhad, 2015). Figure 2.1 shows that under thermal
conduction, heat is transferred from the surface to the core of the sample when it is
exposed to an external heating source (Holman, 2002).
Figure 2.1 Schematic of one dimensional heat conduction (Holman, 2002)

Chapter 2 Accelerated Curing for Portland Cement-based Materials
8
The heat transfer rate is described by Eq. 2.1, which shows that the heat transfer is driven
by the thermal gradient in the x-direction.
q = −kA∂T
∂x (2.1)
where, the minus sign means the heat flow is in the direction of the temperature drop, q
is the heat transfer rate, ∂T/∂x is the temperature gradient in the direction of heat flow, x
is the space variable, k is the thermal conductivity of the material and A is the cross-
sectional area.
2.2.1.2 Limitation of conventional thermal heating
Conventional thermal heating is a slow process relying on heat conduction. Concrete with
a normal density of 2400 kg/m3 is not a good thermal conductor due to its low thermal
conductivity of 2.267 J/m2soC/m (Neville, 2011). As thermal heating proceeds, heat
transferred from the outer layers towards the interior by thermal conduction results in a
thermal gradient. Since the components in concrete have various thermal expansion
coefficients, i.e., 0.214×10⁻³/K for water at 20oC, 3.43×10⁻³/K for air at 20oC, thermal stress
will be caused inside the concrete products, which is detrimental to the strength
development (Levitt, 2008).
2.2.2 Mechanism of microwave heating
2.2.2.1 Introduction
Microwaves are a form of electromagnetic wave with a frequency range from 300 MHz to
300 GHz with a corresponding wavelength range from 1 m to 1 mm. The propagation of
the electromagnetic wave is shown in Figure 2.2 (Metaxas and Meredith, 1983). The
electromagnetic field is composed of an electric field and a magnetic field, which are
perpendicular to each other.
Figure 2.2 Electromagnetic wave (Metaxas and Meredith, 1983)
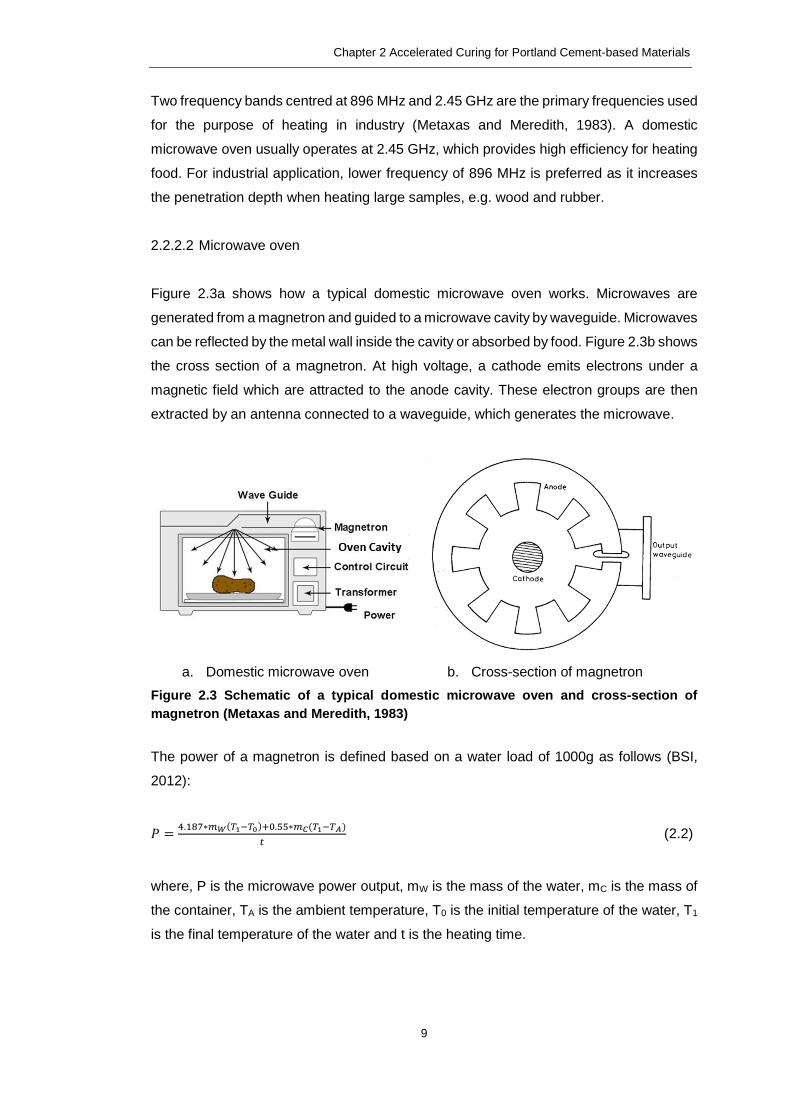
Chapter 2 Accelerated Curing for Portland Cement-based Materials
9
Two frequency bands centred at 896 MHz and 2.45 GHz are the primary frequencies used
for the purpose of heating in industry (Metaxas and Meredith, 1983). A domestic
microwave oven usually operates at 2.45 GHz, which provides high efficiency for heating
food. For industrial application, lower frequency of 896 MHz is preferred as it increases
the penetration depth when heating large samples, e.g. wood and rubber.
2.2.2.2 Microwave oven
Figure 2.3a shows how a typical domestic microwave oven works. Microwaves are
generated from a magnetron and guided to a microwave cavity by waveguide. Microwaves
can be reflected by the metal wall inside the cavity or absorbed by food. Figure 2.3b shows
the cross section of a magnetron. At high voltage, a cathode emits electrons under a
magnetic field which are attracted to the anode cavity. These electron groups are then
extracted by an antenna connected to a waveguide, which generates the microwave.
a. Domestic microwave oven b. Cross-section of magnetron
Figure 2.3 Schematic of a typical domestic microwave oven and cross-section of
magnetron (Metaxas and Meredith, 1983)
The power of a magnetron is defined based on a water load of 1000g as follows (BSI,
2012):
𝑃 =4.187∗𝑚𝑊(𝑇1−𝑇0)+0.55∗𝑚𝐶(𝑇1−𝑇𝐴)
𝑡 (2.2)
where, P is the microwave power output, mW is the mass of the water, mC is the mass of
the container, TA is the ambient temperature, T0 is the initial temperature of the water, T1
is the final temperature of the water and t is the heating time.

Chapter 2 Accelerated Curing for Portland Cement-based Materials
10
2.2.2.3 Microwave energy conversion
The propagation of microwaves inside a cavity of the microwave device is governed by
the Maxwell’s equations (Eq. 2.3 to Eq. 2.6), which describe the relationship between the
fundamental electromagnetic quantities (Ong and Akbarnezhad, 2015). They are also the
basis of numerical simulation work discussed in Section 2.4.4.
∇ × 𝐸 ⃗⃗ ⃗ =𝜕
𝜕𝑡�⃗� (2.3)
∇ × �⃗⃗� = 𝐽 +𝜕
𝜕𝑡�⃗⃗� (2.4)
∇ ∙ �⃗⃗� = 𝜌 (2.5)
∇ ∙ �⃗� = 0 (2.6)
where, 𝐸 ⃗⃗ ⃗ is the electric field intensity, �⃗⃗� is the electric flux intensity, �⃗⃗� is the magnetic
field intensity, �⃗� is the magnetic flux intensity, 𝐽 is the current intensity, ρ is the electric
charge density.
In microwave heating, the electric field is the primary source of energy transfer for the
materials to be heated. When materials are placed in an electric field, the dipolar
molecules within the materials will be reoriented following the alternating electric field
(Figure 2.4). When the displacement of the charged particles from their equilibrium
positions lags behind the alternation of the electric field (AC voltage source), the charged
particles are not able to align themselves with the electric field, which leads to vibration
and friction between the particles. In this way, the electromagnetic energy is converted to
thermal heat energy (Makul et al., 2014, Metaxas and Meredith, 1983).
Figure 2.4 Schematic of dipolar molecules (a) in the absence and (b) in the presence of
an electric field (Ong and Akbarnezhad, 2015)

Chapter 2 Accelerated Curing for Portland Cement-based Materials
11
2.2.2.4 Dielectric properties
The characteristic of microwave propagating in a material can be described by its complex
dielectric constant, ε* (F/m), which consists of a real part, ε’ and an imaginary part, ε’’ (Ong
and Akbarnezhad, 2015).
𝜀∗ = 𝜀′ − 𝑗𝜀′′ (2.7)
where, ε’ is the dielectric constant, which determines the speed of microwave propagating
in the material and ε’’ is the loss factor, which determines the loss of microwave energy,
namely the microwave absorbed by a material. Therefore, the conversion of microwave
energy into thermal energy is more favoured by a material with a higher loss factor.
i) Measurement of dielectric properties
Depending on the microwave properties and working frequencies, there are various
techniques available to measure the dielectric properties of the materials, i.e. transmission
line, resonant cavity, free space and coaxial probe (Agilent, 2006). Among all the
techniques, the coaxial probe is the most commonly adopted technique for concrete
specimens (as shown in Figure 2.5), because it is convenient for different sizes of
concrete products and the samples can be easily prepared for this measurement (Sosa-
Morales et al., 2010, Makul et al., 2010a, Makul et al., 2009). This measurement system
normally consists of a network analyser, which is the signal source, a coaxial probe, which
detects the reflected and transmitted signals from the material and a software, which
calculates the dielectric properties (Makul et al., 2009, Agilent, 2006).
Figure 2.5 Coaxial probe method
In theory, all the components in concrete have dielectric properties, but the ability of
energy conversion for each component varies. Table 2.1 gives the dielectric properties of
some constituents in concrete at 2.45 GHz (Jumrat et al., 2011, Khoylou et al., 2014). It
is clearly seen that water has a much higher dielectric constant and loss factor than the
other components. Therefore, water is the most significant component in concrete that
contributes to the absorption of microwave energy and heat conversion.

Chapter 2 Accelerated Curing for Portland Cement-based Materials
12
Table 2.1 Dielectric properties of the constituents in concrete (2.45 GHz)
Material ε’ ε’’
Water (27oC) 72.18 11.75
PC 3.41 0.01
Fly ash 2.90 0.21
Sand (saturated surface-dry) 2.78 0.20
ii) Factors affecting the dielectric properties
The microwave frequency, temperature and moisture content are the three main factors
affecting the dielectric properties of materials (Metaxas and Meredith, 1983). Taking water
as an example, as the microwave frequency rises, both the dielectric constant and loss
factor decrease. The effect of temperature has a similar trend, i.e. with an increase of
temperature, the dielectric properties of water decline. Therefore, increasing microwave
frequency and increasing temperature reduce heat conversion.
iii) Dielectric properties of paste, mortar and concrete
Based on Table 2.1, it can be seen that water is the most significant component, which
determines the dielectric properties of paste, mortar and concrete. In practice, this is
mainly determined by the water to cement (w/c) ratio and the degree of the hydration of
concrete.
Makul et al. (2010a) compared the dielectric properties of cement paste, mortar and
concrete in the first 24 hours after mixing at a frequency of 2.45 GHz. The effect of w/c
ratio on the PC paste is illustrated in Figure 2.6a. With the increase of w/c ratio, both the
dielectric constant and loss factor were increased. Figure 2.6b shows that cement paste
has the highest dielectric properties compared to mortar and concrete samples, which is
due to the fact that with the addition of aggregate, the water content in the unit volume of
mortar and concrete was lower than that in the paste sample. In addition, for all the three
types of samples, the dielectric properties decreased as the hydration of cement
advanced, which can be explained by the consumption of free water in the samples.
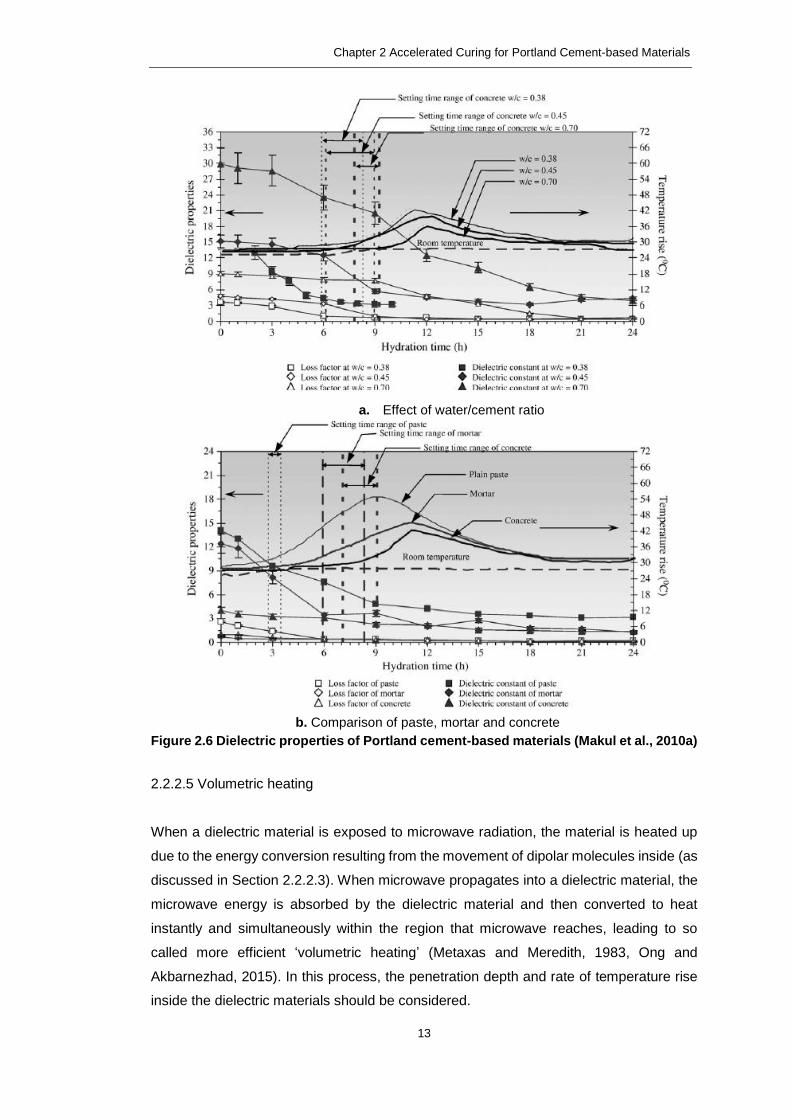
Chapter 2 Accelerated Curing for Portland Cement-based Materials
13
a. Effect of water/cement ratio
b. Comparison of paste, mortar and concrete
Figure 2.6 Dielectric properties of Portland cement-based materials (Makul et al., 2010a)
2.2.2.5 Volumetric heating
When a dielectric material is exposed to microwave radiation, the material is heated up
due to the energy conversion resulting from the movement of dipolar molecules inside (as
discussed in Section 2.2.2.3). When microwave propagates into a dielectric material, the
microwave energy is absorbed by the dielectric material and then converted to heat
instantly and simultaneously within the region that microwave reaches, leading to so
called more efficient ‘volumetric heating’ (Metaxas and Meredith, 1983, Ong and
Akbarnezhad, 2015). In this process, the penetration depth and rate of temperature rise
inside the dielectric materials should be considered.

Chapter 2 Accelerated Curing for Portland Cement-based Materials
14
i) Penetration depth
When a microwave propagates into a dielectric material, the microwave energy decreases
due to the energy loss along the propagation path. The depth at which the microwave
energy decreases to 1/e (approx. 37%) of the original energy is defined as the penetration
depth, Dp (Metaxas and Meredith, 1983).
𝐷𝑝 =𝑐
2𝜋𝑓
√
2𝜀′
(
√√1+(
𝜀′′
𝜀′)2
−1
)
(2.8)
where c is the speed of light, f is the frequency of the microwave.
Given constant dielectric properties, Dp can be increased effectively by decreasing the
microwave frequency applied.
ii) Rate of temperature rise
The rate of temperature rise primarily relies on the dielectric properties and the thermal
properties of the material. It is given by:
∆𝑇
𝑡=
0.556×10⁻¹⁰𝜀′′𝑓𝐸2
𝜌𝑐𝑝 ℃ 𝑠−1 (2.9)
where, ∆T is the temperature difference inside the sample within time period t, ρ is the
density of the material, cp is the thermal capacity of the material.
Conventional thermal curing
2.3.1 Introduction
Conventional thermal curing is widely used for the fabrication of precast concrete products
in order to accelerate the early strength gain. A typical curing cycle for the manufacture of
precast PC-based products is schematically given in Figure 2.7, which generally consists
of four stages: delay period, temperature rise period, curing period at maximum
temperature and cooling period (Saul, 1951, ACI, 1980, Hwang et al., 2012, Mindess et
al., 2002).

Chapter 2 Accelerated Curing for Portland Cement-based Materials
15
Figure 2.7 Conventional thermal curing (Neville and Brooks, 2010)
It is well known that thermal curing can accelerate the hydration of PC to speed up
strength gain. Therefore, the following section reviews the hydration of PC at ambient
temperature first, and then the contribution of conventional thermal curing process to each
stage of PC hydration is explained in the subsequent sections.
2.3.2 Hydration of Portland cement at ambient temperature
There are four major components in PC clinker: tricalcium silicate (C3S), dicalcium silicate
(C2S), tricalcium aluminate (C3A) and tetracalcium aluminoferrite (C4AF). The addition of
~5% gypsum to PC clinker in preparing PC powder is used to regulate the setting time.
Upon contact with water, a series of chemical reactions take place and the main hydration
products formed are calcium silicate hydrate (C-S-H) and calcium hydroxide. C-S-H is the
main hydration product of PC and is primarily responsible for the strength development.
Figure 2.8 shows the heat evolution curve during the hydration of PC, which contains five
periods: (I) pre-induction period (first few minutes), (II) induction period (first few hours),
(III) acceleration period (3-12 hours after mixing), (IV) deceleration period and (V) diffusion
period (Hewlett, 1998, Shi et al., 2006, Mindess et al., 2002). The diffusion period can
sometimes be included in the deceleration period (Hewlett, 1998).

Chapter 2 Accelerated Curing for Portland Cement-based Materials
16
Figure 2.8 Heat evolution of hydration of Portland cement (Shi et al., 2006)
In Figure 2.8, the first peak is usually attributed to the hydration of C3A with the formation
of ettringite (AFt) and the initial hydration of C3S with the formation of amorphous C-S-H.
After the induction period, the second peak is due to the further hydration of C3S. The
heat contribution from the hydration of C2S increases in the deceleration period and the
small peak in this period is assigned to the transformation of AFt to monosulphate (AFm)
(Hewlett, 1998).
2.3.3 Effect of conventional thermal curing on the properties of Portland
cement-based products
2.3.3.1 Introduction
To ensure the quality of concrete products when conventional thermal curing is employed,
factors such as the delay period, the rate of temperate rise, the curing temperature and
the rate of cooling need to be carefully controlled. Table 2.2 summarises the conventional
thermal curing regimes adopted in both research and industrial applications. The effect of
each factor on the curing regime and the properties of concrete is then further discussed
in the following sections.

Chapter 2 Accelerated Curing for Portland Cement-based Materials
17
Table 2.2 Conventional thermal curing for concrete products
Sample Delay period
(hour)
Rate of temp rise
(oC/hour)
Curing
temperature (oC)
Rate of cooling
(oC/hour) Literature
Concrete
(Type I cement) 5 21 80 -- (Hanson, 1963)
Pre-stressed
concrete 2-5 22-33
66-82
(>70 uneconomic) -- (ACI, 1980)
Concrete
(Type I cement)
Until after initial
setting occurs 21 80 11 (Erdem et al., 2003)
Concrete
(Type III cement) 3 18±1 65/85 10±1 (Turkel and Alabas, 2005)
Concrete (CEM I, 30-
40% FA replacement) 2 20 60 40 (Liu et al., 2005)
Concrete (CEM I, 0-70%
FA replacement) 4 11 65 22 (Yazici et al., 2005)
Concrete (CEM I) 4 20 70 20 (MCHW, 2005)
Concrete
(Type I cement) 2 20 60 40 (Long et al., 2012)

Chapter 2 Accelerated Curing for Portland Cement-based Materials
18
2.3.3.2 Effect of delay period and rate of temperature rise
The delay period is the length of time between the casting of the concrete and the start of
the thermal curing, which is adopted to allow the concrete to gain some initial strength
after mixing, in order to better resist the thermal stress in the subsequent thermal curing
stages. Although, in theory, the delay period should last until the concrete reaches its final
setting, it can be seen in Table 2.2 that even the initial setting can hardly be achieved in
practice. Generally, the delay period is set between 2 hours and 5 hours. Following the
delay period, external heat is applied to the concrete products until a maximum curing
temperature is reached.
From the starting point of the temperature rise, the hydration of PC is stimulated (Saul,
1951, Shideler, 1963). Considering the internal heat generated from the hydration of PC,
the rate of temperature rise should be controlled to avoid steep temperature gradient
inside the concrete. Saul (1956) reported that a critical temperature gradient should not
be exceeded and that if concrete was cured at less than 12.5oC/hour, the strength of the
concrete at 28 days approached that cured at 20 ± 2oC and relative humidity (RH) ≥ 95%
(BRE, 2009). However, if the temperature rise was faster than 37.5oC/hour, a 25%
strength loss of the concrete was observed. On the other hand, previous research works
have also shown that the rate of temperature rise is related to the delay period (Saul,
1951). If a delay period is applied, a rate of temperature rise up to 33oC/hour could be
used, while in the absence of a delay period, the rate of temperature rise should not
exceed 11oC/hour (Mindess et al., 2002). Hanson (1963) concluded that the optimum
thermal curing condition for concrete made of Type I cement should consist of a delay
period of 5 hours and a rate of temperature rise of 22oC/hour. It is worth mentioning that,
with the same rate of temperature rise, he found that reducing the delay period to less than
3 hours was detrimental to the long-term strength.
Erdem et al. (2003) investigated the effect of various delay periods on the compressive
strength of concrete products while the rate of temperature rise was fixed as constant.
They found that the optimal delay period was related to the initial setting time. In their
study, the concretes were cured at accelerated temperature immediately after the initial
setting, and at one, two and three hours prior to the initial setting, respectively. The results
showed that the concrete with a delay period equal to the initial setting time gained the
highest strength at one day and 28 days.
It is generally agreed that a lower rate of temperature rise can benefit the strength gain
with less decrease of strength at a later age (Saul, 1951, Thompson and Laing, 1969,

Chapter 2 Accelerated Curing for Portland Cement-based Materials
19
Neville, 2011). The mix design, the size and shape of concrete products also need to be
taken into consideration when the rate of temperature rise is determined. Nonetheless, in
industrial applications, a rate of temperature rise of 20oC/hour is widely adopted (ACI,
1980).
2.3.3.3 Effect of the thermal curing period and cooling period
In the thermal curing period, there are two significant factors to be considered, i.e. the
maximum curing temperature and the curing duration.
The maximum curing temperature ranges widely from 50oC to 95oC (Hwang et al., 2012,
Saul, 1951, Shideler, 1963, Erdem et al., 2003). However, under atmospheric pressure,
a curing temperature above 100oC is never used due to the damage caused to the
microstructure and strength development of concrete (Saul, 1951, Neville, 2011). The
upper limit for the curing temperature is usually 70oC in most industrial applications
(MCHW, 2005), in order to prevent the conversion of AFt phase to AFm phase at higher
temperatures and subsequent delayed ettringite formation (DEF) at later ages (Taylor et
al., 2001, Taylor, 1996).
When the maximum temperature is reached, there are two ways to continue the curing.
Either the maximum temperature is maintained for a period of time or the external heat
supply is cut off and the sample is ‘soaked’ in the residual heating environment (Shideler,
1963, McCall, 1996). As to the former case, the concrete is further cured at the maximum
temperature for a period of time and is allowed to cool slowly to avoid thermal cracks. The
rate of cooling is generally controlled within the range 10-20oC/hour (Levitt, 2008). Usually,
the rate of cooling is kept either the same as the rate of temperature rise or it may be
slower. In the case of soaking, the soaking period can last overnight to match the
production cycle in the precast factory, which allows the temperature inside the product
to drop slowly as well. The heat released from cement hydration also contributes to the
curing temperature during the soaking process. Again, the size and the shape of the
product should be taken into account in order to set the proper rate of cooling.
2.3.3.4 Effect of moisture
Curing requires the concrete products to be placed in an environment where both the
temperature and RH level are regulated. The strength gain of concrete is primarily
attributed to the hydration of cement. Ideally, the moisture should be maintained at the
saturated condition to allow the maximum hydration of cement. The established

Chapter 2 Accelerated Curing for Portland Cement-based Materials
20
consensus is that the hydration rate is not adversely affected at a RH level above 80% in
the capillary pores of concrete (Neville, 2011).
This rule also applies to the manufacture of concrete with accelerated curing for precast
concretes (Levitt, 2008). Under accelerated curing, the concrete is subjected to the
moisture evaporation. The maintenance of RH in the curing environment is, therefore,
critical to the strength gain of concrete products. Steam curing with saturated moisture
can prevent the water loss from inside concrete and provides a moisture supply from
outside, allowing water ingress into the concrete for the continuous hydration (Liu et al.,
2005, Thompson and Laing, 1969).
2.3.4 Issues arising from conventional thermal curing
In the precast concrete industry, the adoption of thermal curing can reduce the duration
of the production cycle and increase the turnover of the moulds (Levitt, 2008, McCall,
1996). However, the main concern is the loss of long-term strength, which may be caused
by the increased porosity or internal fine cracks under thermal curing (Soroka et al., 1978).
This adverse effect can be reduced by applying a prolonged delay period or reducing the
rate of temperature rise and maintaining a high RH level (Hanson, 1963, Thompson and
Laing, 1969).
Although the duration of the production cycle could be decreased by applying
conventional thermal curing, the energy consumed during the curing process is an issue
for sustainability and also increases the production cost. ACI committee 517, thus
recommended the curing cycle for steam curing should not exceed 18 hours (ACI, 1980).
Won et al. (2013) established an algorithm to calculate the energy consumption from
steam curing and their results are presented in Figure 2.9. They demonstrated that the
energy consumption is proportional to the maximum curing temperature and the curing
duration. In addition, Figure 2.9 also clearly indicates the high energy consumption
associated with steam curing. For example, the total energy supply for concrete cured at
70oC for 8 hours even reached 3.79×10⁷ kcal/m3. Therefore, to address the sustainability
agenda facing precast concrete industry, alternative curing methods with lower energy
consumption have to be developed.

Chapter 2 Accelerated Curing for Portland Cement-based Materials
21
Figure 2.9 Total energy consumed in steam curing (Adapted from Won et al., 2013)
Microwave curing
2.4.1 Introduction
Some pilot research has been carried out in the literature on the use of microwaves as an
alternative heat source to cure cement or concrete products (Wu et al., 1987, Leung and
Pheeraphan, 1997, Rattanadecho et al., 2008). The results indicated that microwave is a
potential technique for concrete manufacture. Compared to conventional thermal heating,
it is well accepted that microwave heating is faster due to its unique heating mechanism
as discussed in Section 2.2.2. In the following sections, detailed information on these pilot
investigations is reviewed.
2.4.2 Effect of microwave curing on the properties of Portland cement-based
products
2.4.2.1 Introduction
Similar to the conventional thermal curing, the delay period, microwave power and curing
duration are the three most significant factors affecting the curing process and the
properties of the concrete products in microwave curing. The effect of each factor is
discussed in the following sections.
2.4.2.2 Effect of delay period
In conventional thermal curing, the concrete is placed at the ambient temperature for a
period of time prior to heat treatment. A similar approach has also been adopted in
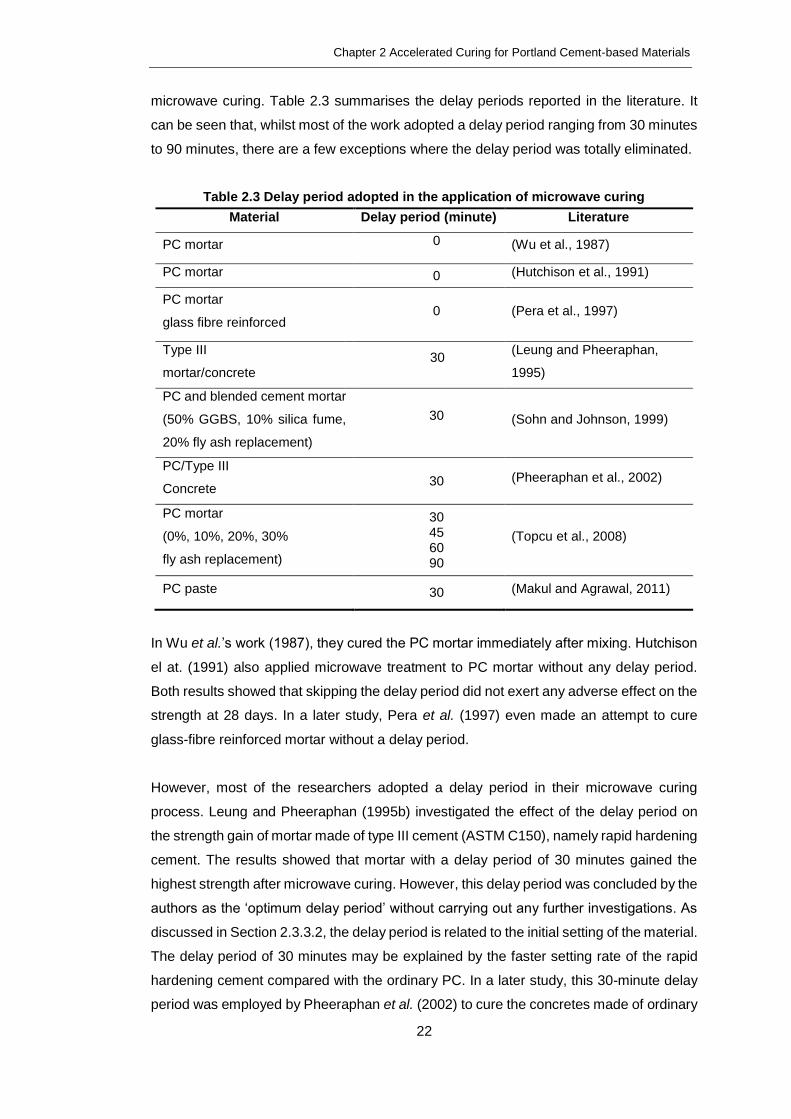
Chapter 2 Accelerated Curing for Portland Cement-based Materials
22
microwave curing. Table 2.3 summarises the delay periods reported in the literature. It
can be seen that, whilst most of the work adopted a delay period ranging from 30 minutes
to 90 minutes, there are a few exceptions where the delay period was totally eliminated.
Table 2.3 Delay period adopted in the application of microwave curing
Material Delay period (minute) Literature
PC mortar 0
(Wu et al., 1987)
PC mortar 0 (Hutchison et al., 1991)
PC mortar
glass fibre reinforced
0
(Pera et al., 1997)
Type III
mortar/concrete 30
(Leung and Pheeraphan,
1995)
PC and blended cement mortar
(50% GGBS, 10% silica fume,
20% fly ash replacement)
30
(Sohn and Johnson, 1999)
PC/Type III
Concrete 30 (Pheeraphan et al., 2002)
PC mortar
(0%, 10%, 20%, 30%
fly ash replacement)
30 45 60 90
(Topcu et al., 2008)
PC paste 30 (Makul and Agrawal, 2011)
In Wu et al.’s work (1987), they cured the PC mortar immediately after mixing. Hutchison
el at. (1991) also applied microwave treatment to PC mortar without any delay period.
Both results showed that skipping the delay period did not exert any adverse effect on the
strength at 28 days. In a later study, Pera et al. (1997) even made an attempt to cure
glass-fibre reinforced mortar without a delay period.
However, most of the researchers adopted a delay period in their microwave curing
process. Leung and Pheeraphan (1995b) investigated the effect of the delay period on
the strength gain of mortar made of type III cement (ASTM C150), namely rapid hardening
cement. The results showed that mortar with a delay period of 30 minutes gained the
highest strength after microwave curing. However, this delay period was concluded by the
authors as the ‘optimum delay period’ without carrying out any further investigations. As
discussed in Section 2.3.3.2, the delay period is related to the initial setting of the material.
The delay period of 30 minutes may be explained by the faster setting rate of the rapid
hardening cement compared with the ordinary PC. In a later study, this 30-minute delay
period was employed by Pheeraphan et al. (2002) to cure the concretes made of ordinary

Chapter 2 Accelerated Curing for Portland Cement-based Materials
23
PC and rapid hardening cement prior to microwave curing. However, as these two types
of cement require different durations to reach initial setting, the 30-minute delay period in
this case cannot be fully justified.
Sohn and Johnson (1999) also applied a 30-minute delay period to mortars prior to
microwave treatment. In their study, the cement was substituted by three types of
additions, i.e., GGBS (50%), fly ash (20%) and silica fume (10%). With the addition of
GGBS and fly ash, it is expected that the early hydration rate of cement would be slowed
down due to the latent hydraulic reaction (GGBS) and pozzolanic reaction (fly ash). As a
consequence, the setting time of blended cement is prolonged. Again, to apply the same
30-minute delay period cannot be fully justified; the delay period should have been
adjusted in line with the initial setting of each individual system.
To overcome the above issue, Topcu et al. (2008) further investigated the effect of the
delay period on the properties of cement mortar under microwave curing. Their results
showed that 30 minutes was the optimum delay period for PC mortar, while 45 minutes
was preferred for blended PC mortar with 10% replacement of fly ash. This result again
corroborates the argument that the delay period should be adjusted based on the initial
setting time (Erdem et al., 2003).
2.4.2.3 Issues with curing concretes using domestic microwave oven
In most of the previous research reported in the literature, the domestic microwave oven
was used, which could be due to the fact that it is the most accessible equipment. However,
the limitations of the domestic microwave oven for curing cement and concrete products
cannot be neglected.
One limitation is that the power output of microwave oven is not adjustable at different
constant levels. Although all the research carried out claimed that different power levels
or power percentages were applied (see Table 2.4), these were achieved by simply
turning on and off the magnetron (i.e. pulsing), the microwave generator, to control the
total energy applied to the sample. This means that even in any given period of time, the
average power level may be considered to be low. However, when the microwave is
turned on, the concrete samples are actually heated under the full microwave power. If
there is no appropriate control, there is a risk that concrete could be overheated during
the ‘turn-on’ period. The proportion of ‘turn-on’ period of the total processing time (i.e. the
sum of the ‘turn-on’ and ‘turn-off’ periods) is expressed as the percentage of the full power

Chapter 2 Accelerated Curing for Portland Cement-based Materials
24
output, which is then converted to an equivalent power level (Yang and Gunasekaran,
2004, Gunasekaran and Yang, 2007).
𝑃𝑜𝑤𝑒𝑟 𝑝𝑒𝑟𝑐𝑒𝑛𝑡𝑎𝑔𝑒 (%) = 𝑇𝑜𝑛
𝑇𝑜𝑛+𝑇𝑜𝑓𝑓 × 100% (2.10)
where, Ton represents the ‘turn-on’ period, Toff indicates the ‘turn-off’ period.
Another limitation is that real-time temperature monitoring is not available during the
curing process and the power output of the microwave cannot be regulated in response
to the rate of temperature rise and maximum curing temperature. As a consequence, the
samples are subjected to overheating and possibly damage under microwave curing.

Chapter 2 Accelerated Curing for Portland Cement-based Materials
25
Table 2.4 Microwave curing with domestic microwave ovens
Material Specimen size
(mm)
Microwave power (Poutput)
(W)
Microwave curing duration
(minute) Literature
PC mortar 40×40×160 150 (650)
N/A (650)
30
15 (Wu et al., 1987)
PC mortar
40×40×160 50 (N/A)
25 (600ml water load)
22 (800ml water load)
40 (1000ml water load)
(Hutchison et al., 1991)
PC mortar
(glass fibre reinforced)
150×400×2000
40 (800)
80 (800)
90
90 (Pera et al., 1997)
PC/Type III
Concrete
Φ76.2×152.4
198 (850)
275 (850)
362 (850)
396 (850)
543 (850)
45 (Pheeraphan et al.,
2002)
PC mortar
(0%, 10%, 20%, 30%
fly ash replacement)
40×40×160
90 (N/A)
on:20 + off:10 + on:20
on:20 + off:10 + on:15 + off:10 + on:10
on:20 + off:10 + on:20 + off:10 + on:20
(Topcu et al., 2008)
PC mortar
(ultra-high performance)
15×15×60
150 (800)
250 (800)
280 (800)
60 (150W) + 50 (250W) + 10 (280W) (Korpa and Trettin,
2008)

Chapter 2 Accelerated Curing for Portland Cement-based Materials
26
For example, Wu et al. (1987) could be considered to be the first research group to report
the use of a domestic microwave oven to cure PC mortars (40×40×160mm). Although
they claimed that their samples were cured at different power levels (note: the full power
output of this domestic microwave oven was 650W) with the durations of 0-120 minutes,
this was actually achieved by pulsing. Nonetheless, based on their study, no splashing of
fresh PC mortar was observed at the two low power levels of 150W and 210W when they
were exposed to microwave heating, which could be attributed to the different expansion
coefficients as discussed in Section 2.2.1.2. The mortars cured for 30 minutes at 150W
and 15 minutes at 210W respectively showed highest flexural strength and compressive
strength at 3 days, 7 days and 28 days (see Figure 2.10). In this study, they concluded
that higher power levels were not suitable for curing their samples due to the violent
evaporation of water in the sample.
Figure 2.10 Effect of microwave power level on compressive strength of Portland
cement mortars (Wu et al., 1987)
Instead of pulsing the magnetron, some researchers introduced a water load to absorb
part of the microwave energy. Table 2.5 summarises the details of the three microwave
curing regimes used by Hutchison and co-workers (1991), in which different water loads
were applied.
Table 2.5 Microwave curing control (R.G. Hutchison I et al., 1991)
Microwave power (W) Water load (ml) Microwave curing duration
(minute)
Control 0 0
50W 600 15
50W 800 22
50W 1000 40
a. Microwave power: 150W b. Microwave power: approx. 210W

Chapter 2 Accelerated Curing for Portland Cement-based Materials
27
Following microwave curing, these samples were further cured in saturated limewater until
test. In comparison with the control sample cured in saturated limewater, microwave
curing did not show any deleterious effect on the strength development of the sample
(Figure 2.11).
Figure 2.11 Compressive strength of Portland cement mortar (R.G. Hutchison I et al.,
1991)
Pera et al. (1997) investigated the effect of microwave power level on the microwave
curing of glass-fibre reinforced PC mortar (15×40×200mm). The full power level of the
microwave power output possible was 800W, but only 40W and 80W were finally applied
to cure the sample for 90 minutes as they found that higher power levels were not suitable
for the curing purpose.
In Pheeraphan et al. (2002)’s work, a combination of two power levels, 396W and 275W,
was used to cure the concrete samples (Φ76.2×152.4mm). They found that the best
curing regime was 30 minutes curing at 396W followed by 15 minutes curing at 275W.
Based on their results, they concluded that a high power input might be needed in the
early stage of microwave curing, whilst a lower power could be more suitable at a later
stage. However, the rationale for this was not given by the authors. One possible
explanation could be that, during the early stage of the microwave curing, a higher power
is needed to increase the temperature of the specimen from the ambient temperature to
the target temperature. Once the target temperature is reached, less energy is needed to
sustain reaction due to the extra heat released from cement hydration.
However, in Korpa and Trettin (2008)’s study, they attempted various curing programmes
at different power levels for different curing durations to cure ultra-high performance
concrete (UHPC) (15×15×60mm). The best curing regime from their results was the
combination of ‘60 minutes at 150W + 50 minutes at 250W + 10 minutes at 280W’, which
is just the opposite to the conclusion drawn by Pheeranphan and co-workers.

Chapter 2 Accelerated Curing for Portland Cement-based Materials
28
The review of the previous research indicates that all the samples were cured under
arbitrary curing regimes, which, to a certain extent, is contrary to the theory established
under conventional thermal curing (as reviewed in Section 2.3). Although it has been
noticed that ‘low power level’ actually referred to the low average power over a given
duration of time using a domestic microwave oven in pulsed mode. To avoid damaging
the by the full power output of the domestic oven, microwave systems with sophisticated
control should be developed.
2.4.2.4 Pilot industrial microwave systems for curing concrete products
Due to the limitations of domestic microwave ovens, efforts have been made by
researchers to develop customised microwave systems for curing concrete (Leung and
Pheeraphan, 1995, Sohn and Johnson, 1999, Mak et al., 2001, Rattanadecho et al., 2008),
which is summarised in Table 2.6. Some typical systems are reviewed below.

Chapter 2 Accelerated Curing for Portland Cement-based Materials
29
Table 2.6 Microwave curing with pilot industrial microwave systems
Material Specimen size
(mm)
Microwave power
(W)
Microwave curing duration
(minute) Literature
Type III
Mortar/concrete Φ76.2×152.4 0-1200 (continuous)
45 (optimum regime)
Curing power: 400W
(Leung and Pheeraphan,
1995)
Type III
Mortar/concrete Φ76.2×152.4 0-1200 (continuous) Optimum curing Tmax: 70oC
(Leung and Pheeraphan,
1997)
Concrete N/A N/A Temp gradient ≤ 20oC/hour (Bella et al., 1997)
PC and blended
cement mortar
Φ50×100 0-6k
120 (maintained at Tmax)
Curing Tmax: 40/60/80oC
Rate of temperature rise: 7oC/min
(Sohn and Johnson, 1999)
Concrete 800×800×100 10k
20-60
Curing Tmax ≤ 70oC
Rate of temperature rise: 20/35/40oC/hour
(Mak et al., 2001)
PC paste 50×50×50 11.2k (14 magnetrons) 15 or 30
No. of magnetron: 1-3 (Rattanadecho et al., 2008)
PC paste Φ69.0×40.0 6k
Highest strength obtained from:
15 (390W) + 15 (811W) + 15 (390W)
8 combinations of microwave power and
curing duration
(Makul et al., 2010b)

Chapter 2 Accelerated Curing for Portland Cement-based Materials
30
To overcome the issues associated with the pulsed microwave power, Leung and
Pheeraphan (1995b, 1997) developed a microwave oven with continuous adjustable
power in the range of 1-1200W to cure concrete cylinders (Φ76.2×152.4mm). A
thermocouple was also incorporated into the microwave curing system and the
temperature feedback was used to control the microwave curing process. Four curing
regimes were investigated in their study as follows:
C1) No feedback control: P=412W;
C2) Feedback control: Pmax=750W, Tmax=70oC;
C3) Feedback control: Pmax=1200W, Tmax=85oC;
C4) Feedback control: a reversed power history from C2 was applied, Tmax=70oC.
Figure 2.12 presents the power and temperature profiles obtained from these four curing
regimes. In C1, with a constant power output, the temperature inside the concrete
increased linearly as the energy was absorbed and built up inside the sample. C2 and C4
had reversed power profiles, resulting in different temperature profiles in the samples. A
faster rate of temperature rise was found in C2. In C3, with the maximum power output of
1200W, the temperature rose above 80oC in 16 minutes, leading to the highest rate of
temperature rise of 3.5oC/min.
a. Power profile of microwave curing
b. Temperature profile of concrete
Figure 2.12 Microwave curing Type III ordinary Portland cement concrete (Leung and
Pheeraphan, 1997)

Chapter 2 Accelerated Curing for Portland Cement-based Materials
31
In the above investigation, the concretes were first mixed followed by microwave oven
curing for 45 minutes. The concretes were demoulded at 3.5 hours and their compressive
strength was measured at 4.5 hours. Those concretes which demoulded after one day
were cured in 22.8oC saturated lime water and their compressive strength was measured
at 7 days. The results showed that, at 4.5 hours, the concretes cured with regimes C1 and
C2 developed equivalent strengths of 29.5 MPa and 28.2 MPa respectively, which were
higher than the strengths of concretes cured using regimes C3 and C4. At 7 days, the
concrete cured with C2 showed the highest strength. However, all the microwave cured
samples gained less strength than those cured at 22.8oC in saturated lime water. The
sample cured under regime C3 gained the lowest strength at 4.5 hours and 7 days,
indicating that the rapid rate of temperature rise was not beneficial to the strength gain.
Figure 2.13 Compressive strength of concrete specimens (Adapted from Leung and
Pheeraphan, 1997)
Bella et al. (1997) reported the development of a static microwave oven and a wheel-
mounted mobile oven for curing pre-stressed concrete. Although the details of the
microwave ovens were not given, the authors recommended a microwave curing regime
consisting of a 1-hour delay period, a rate of temperature rise less than 20oC/hour and
the maximum curing temperature of 65oC. The microwave energy was cut off once the
maximum curing temperature was reached and the concretes were left to cool naturally.
Sohn and Johnson (1999) employed a cylindrical microwave oven with a power output in
the range of 0-6kW to cure PC mortar and blended cement mortars (Φ50×100mm) with
replacement of PC by 50% GGBS, 10% silica fume or 20% fly ash. The total curing
duration was 120 minutes with a rate of temperature rise of 7oC/hour and three maximum
temperatures of 40oC, 60oC and 80oC. Thermocouples were inserted in the samples to
monitor the temperature changes and all the curing processes were regulated by a
temperature feedback control. After the microwave curing, the samples were cured in
saturated lime water until test. The results showed that, with microwave curing, the 28-
day compressive strength of the pure PC mortar was lower than that cured at 20oC in

Chapter 2 Accelerated Curing for Portland Cement-based Materials
32
saturated lime water. The opposite result was observed for all the blended cement mortars,
which attained a greater strength at 28 days after microwave treatment. In addition, the
best curing temperature for achieving the highest strength was found to be 40oC.
Mak et al. (2001) reported the application of a bench-top microwave unit with a power
output of 1kW and a large pilot microwave facility with a power output of 10kW on curing
concrete products (shown in Figure 2.14). Silicon temperature sensors and a process
controller were incorporated in the microwave curing system. The results showed that,
with a rate of temperature rise of 35oC/hour under microwave heating, the concrete
products gained equivalent 1-day and 28-day strengths to those with steam curing, and
the curing time was more than halved. However, there was no comparison between the
strengths of those concretes after microwave curing and those cured at standard
temperature conditions (details not given, assumed at 20oC and RH>90%) at later age.
Figure 2.14 Cross-sectional view of the 10kW microwave facility with 800x800x100mm
concrete panel element (Mak et al., 2001) (Note: Ports: emitting microwave, Mode stirrer:
making microwave uniformly distributed in the cavity )
Rattanadecho et al. (2008) applied a conveyor belt microwave system equipped with 14
magnetrons to cure PC paste (50×50×50mm) (see Figure 2.15). The power output of each
magnetron was 800W. The samples were cured for 30 minutes in the microwave oven 24
hours after mixing and subsequently cured in water at 25 ± 2oC. Microwave curing resulted
in a higher strength at the age of one day than that cured in water, but the strength
development slowed down from 14 days. The reason may be the lack of water for further
hydration as no moisture was supplied during the microwave treatment.

Chapter 2 Accelerated Curing for Portland Cement-based Materials
33
Figure 2.15 Microwave conveyor belt (Rattanadecho et al., 2008)
Makul and Agrawal (2011) studied the effect of different combinations of microwave power
and curing durations on the strength development of PC paste (Φ69.0×40.0mm).
Arbitrary microwave curing programmes were implemented, and the temperatures of the
samples at the top surface, middle cross section and bottom surface were measured at
the start and end of the curing process. The highest strength at different ages up to 28
days was obtained from the following combination of microwave power and curing
duration: 15 minutes at 390W + 15 minutes at 811W + 15 minutes at 390W (as shown in
Figure 2.16). In this curing regime, the rate of temperature rise was set at a low rate and
the maximum curing temperature was kept at approximately 70oC. It was also concluded
that there was a relationship between the absorbed energy and the strength gain.
Figure 2.16 Power profile and temperature profile (Adapted from Makul and Agrawal,
2011)
2.4.3 Microwave curing process control
2.4.3.1 Introduction
Based on the previous review of conventional thermal curing and some pilot studies on
microwave curing, it can be concluded that both the temperature and rate of temperature
rise need to be controlled carefully to develop optimum strength and long-term durability.
Although continuous monitoring of the temperature in conventional curing is now
commonly accepted in practice, this could be rather complex in a microwave curing

Chapter 2 Accelerated Curing for Portland Cement-based Materials
34
process due to the interference of the electromagnetic signal of microwaves with most
monitoring systems. To identify the most suitable monitoring system to be used for
industrial microwave systems, the relevant information is reviewed below.
2.4.3.2 Temperature monitoring during microwave curing
As highlighted before, conventional thermocouples have been used for temperature
monitoring in some microwave systems. They were embedded in the concrete samples
to obtain the temperature profile (Sohn and Johnson, 1999, Leung and Pheeraphan,
1997). However, the metallic thermocouple can interfere with the electromagnetic field of
microwave, which would have adverse impacts on the strength gain of the PC mortar.
Under the same curing regime, a strength decrease of 10%-12.6% was found in a sample
with an embedded thermocouple in comparison with a sample without a thermocouple
(Leung and Pheeraphan, 1997). In addition, a thermocouple with a large diameter is not
suitable for multi-point placements in small size samples. Therefore, the thermocouple is
not an ideal technique for monitoring the temperature changes inside the samples during
microwave curing.
Unlike conventional metallic thermocouples, optical fibre sensors are immune to
electromagnetic fields as they do not contain electrically conductive material (Sun and Wu,
2012, Akbarnezhad et al., 2011, O'Farrell et al., 2007). The diameter of a typical optical
fibre including its core and cladding is merely 125 µm which is much smaller than that of
a thermocouple and is therefore ideal to be embedded in concrete samples for
temperature sensing under microwave environment. Fibre Bragg grating (FBG) sensors
are photosensitive optical fibre sensors with Bragg gratings inscribed. A schematic of a
FBG sensor is illustrated in Figure 2.17.
Figure 2.17 Schematic of FBG (Chen and Dong, 2012)

Chapter 2 Accelerated Curing for Portland Cement-based Materials
35
The uniform gratings allow a periodic change in the effective refractive index of the fibre
core, enabling light to be reflected at a particular wavelength, λB, which can be interpreted
by the Bragg’s relationship (Akbarnezhad et al., 2011):
λB=2neΛ (2.11)
where ne is the effective refractive index of the grating in the fibre core and Λ is the grating
period. Temperature increase and decrease cause expansion and compression of the
grating structure, respectively. These changes in the physical size of the grating directly
modify the grating period which are manifested in the change in the peak reflection
wavelength of the optical signal. As the shift of the reflection peak wavelength, to a first
order approximation, is proportional to the temperature change, real-time temperature
monitoring can therefore be achieved by measuring the wavelength at which maximum
reflection of the optical signal occurs (Akbarnezhad et al., 2011, Sun and Wu, 2012, Liu
2016).
Moreover, multiple gratings sections each with a different grating period can be inscribed
along the same fibre at different positions. This allows temperature measurements in
different parts of the concrete samples by monitoring the shifts in the reflection peaks
around different wavelength ranges. The configuration will be illustrated in Chapter 4 and
the application will be introduced in Chapter 7.
2.4.3.3 Effect of moisture
There has not been any report on the moisture supply control during microwave curing
process. In previous research, the general approach adopted by different researchers was
to cure PC-based products in their microwave ovens without moisture monitoring or
supply during the curing process. However, it can be anticipated that, with rapid
microwave heating, the evaporation of water is unavoidable if the temperature is not
controlled.
As discussed in Section 2.3.3, the accelerated curing should take place in a certain
temperature range (i.e. 60-70oC) and a specific RH level (≥80%), which ensures the
quality and performance of the concrete products. Water loss from the product will hinder
further hydration of the cement and result in a porous microstructure, which can potentially
impair the quality of the product. In addition, it has been identified that if the temperature
is too high, the splash of fresh concrete, possibly due to the quick expansion of air bubbles,
cause damage to concrete products even at the very early stage of curing (Wu et al., 1987,
Hutchison et al., 1991).

Chapter 2 Accelerated Curing for Portland Cement-based Materials
36
2.4.3.4 Issues arising from microwave curing and proposed solutions
Based on the previous literature review, three main issues arising from the previous
research can be identified for microwave curing of PC-based products, including:
1) Inadequate control of temperature and humidity during microwave curing process
Most of the previous studies were carried out with domestic microwave ovens,
while the output power ranged from 650W to 850W. Such a range is too high for
curing purposes as the rate of temperature rise inside the products is rapid, such
overheating leads to the splashing of the fresh product or cracking of hardened
products (Wu et al., 1987). Also while maintaining a minimum level of RH is
deemed essential for the hydration of PC, the RH was not regulated or even
considered in all previous research.
2) Curing regimes arbitrarily chosen rather than established by careful investigation
It is not clear how experimental factors such as the microwave power, the
maximum curing temperature, the curing duration, etc. affect the microwave
curing process, even though it is clear that these factors are important for
microwave curing. It is evident that to ensure the quality of concrete products
cured in a microwave, all these factors need to be optimised.
3) Unreliable temperature monitoring systems
The conventional temperature monitoring systems, such as thermocouple, is not
reliable under microwave environment as the electrically conductive material
therein interferes with the microwave propagation, even though they are widely
adopted in conventional thermal curing process.
Therefore, before microwave curing can be accepted by industry as an alternative low
energy and low carbon curing technique for manufacturing precast concrete products, the
following issues must be addressed:
(1) Development of smart microwave curing systems, including:
Continuous adjustment of the power output of the microwave oven in response
to the temperature of the concrete element being processed;

Chapter 2 Accelerated Curing for Portland Cement-based Materials
37
Real-time monitoring of the temperature inside the concrete element and the
RH level in the curing environment, without interference from the
electromagnetic field;
(2) Optimisation of the microwave curing regimes
Effect of the power level, maximum curing temperature and curing duration on
the properties of the concrete products should be systematically studied, from
which a suitable microwave curing regime is proposed.
2.4.4 Modelling of microwave heating
2.4.4.1 Introduction
During conventional thermal curing of concrete products, the thermal gradient can cause
non-uniform hydration of the cement and affect the strength development of the concrete
products. Additionally, concrete products are much larger in industrial applications than in
laboratory studies; this and the shape could also have significant effects on the
temperature distribution and, consequently, the strength development of the concrete
products. Unfortunately, the effects of the samples size of the concrete products in the
microwave environment have never been investigated in the literature. Therefore, without
much empirical data, numerical simulation has been employed instead to model the
thermal behaviour of concrete products with different sizes under microwave curing in
industrial applications.
In this section, the modelling techniques for microwave heating are reviewed. As only
limited modelling has been conducted for concrete, the modelling techniques widely
applied in the food industry are reviewed first and this is then followed by a detailed review
of the modelling of microwave heating for concrete products.
2.4.4.2 Modelling of microwave heating of food
As microwave heating has been widely applied in the food industry, the experience and
knowledge from the food industry can be adapted and applied to the modelling of
microwave curing of concrete.
Campanone and Zatritzky (2005) simulated microwave heating of a beef cylinder
(Φ80×60mm) for 48 seconds using the finite element method (FEM) which was later
experimentally validated (Figure 2.18). It can be seen that the temperature distribution

Chapter 2 Accelerated Curing for Portland Cement-based Materials
38
over the central cross-section is not uniform. The outer layer was heated up more rapidly
than the inner layer due to the attenuation of microwave from the lateral surface to the
central axis of the cylinder, resulting in a temperature difference of 15oC (experimental
results) and 20oC (simulation results), respectively.
a. Schematic of beef cylinder under
microwave radiation (vertical cross-
section)
b. Temperature profile predicted by
numerical model (solid line) and
experimental results (dots)
Figure 2.18 Simulation of minced beef cylinder (central cross-section) heated by
microwave at 2.45GHz (Adapted from Campanone and Zaritzky, 2005)
Hossan et al. (2010) further simulated the temperature distribution in a beef cylinder with
different dimensions exposed to microwave heating by using FEM (Figure 2.19). It can be
clearly observed that the pattern of temperature distribution and the temperature range of
the lateral section changed with increasing the height of the cylinder.
Based on the dielectric properties (ε’=30.5 and ε’’=9.6) given in this study, the Dp (0.53
cm) of the beef cylinder can be calculated according to Eq. 2.7. Figure 2.19b shows that
the increase in the sample size leads to a higher attenuation of the microwave and hence
a lower temperature zone in the centre of the cylinder. However, as these results were
not validated by experiments, it is not clear how reliable they are. Nonetheless, it still can
be concluded that the temperature gradient depends on the dielectric properties, thermal
properties and the geometry of the sample.

Chapter 2 Accelerated Curing for Portland Cement-based Materials
39
a. Schematic of beef
cylinder under microwave
radiation (vertical cross-
section)
b. 2D temperature contour of microwave heating of a 2 cm
diameter beef cylinder (a) h=1.25cm, (b) h=2.50cm, (c)
h=3.75cm and (d) h=5.0cm.
Figure 2.19 Simulation of heating a beef cylinder (lateral section) in microwave for 120s
at 2.45 GHz (Adpated from Hossan et al., 2010)
Santos et al. (2010) applied COMSOL software to simulate a cylindrical sample heated in
a microwave oven at 2.45 GHz. The microwave output was set at 1000W and the dielectric
properties were given as ε’=3.5 and ε’’=0.001. The electric field distribution is shown in
Figure 2.20. Because the metallic cavity of the oven acts as a microwave reflector, the
incident microwave is therefore reflected by the metallic surface forming a standing wave.
The standing wave has maxima and minima at different positions which lead to uneven
distribution of the electric field or energy and is therefore another reason for uneven
heating of the sample. However, there is no validation of the simulation results, so the
reliability of the model is not clear.
a. Configuration of the microwave oven b. Electric field distribution (top view)
Figure 2.20 Simulation of cylindrical sample heated by microwave at 2.45 GHz (Santos
et al., 2010)

Chapter 2 Accelerated Curing for Portland Cement-based Materials
40
Raj et al. (2011) also modelled microwave heating of a cylindrical food sample
(Φ80×50mm) using COMSOL. The simulated and measured temperature distributions in
three planes (top, middle and bottom) are given in Figure 2.21.
a. Configuration of the microwave oven b. Simulation and experimental temperature
profiles at three planes
Figure 2.21 Simulation of 1% gellen gel (analogy to food) heated by microwave at 2.45
GHz (Raj et al., 2011)
It is evident that, in general, the simulation results overestimated the temperature profile
compared to the experimental data. There were three reasons to explain this
disagreement: 1) the power output applied to the sample was not accurate, because the
power of the magnetron is identified based on a water load of 1000g (BSI, 2012), which
involved a larger volume and different dielectric properties than the object simulated; 2) a
moving mesh module was applied to simulate the rotation of the sample on a turntable,
but the changes of the electric field could not be simulated when the sample was rotated
to different locations; 3) thermal effects (e.g. thermal conduction and heat loss) were
neglected in the simulation. Thus, in order to accurately model the heating behaviour in
microwave oven, coupling of the electromagnetism and the heat transfer is required.
2.4.4.3 Modelling of Portland cement paste cured by microwave
Only very limited work has been reported on the modelling of PC paste in microwave
(Rattanadecho et al., 2009, Makul et al., 2010b). As discussed in Section 2.2.2.3, the
dielectric material is heated up by the absorption of the propagated microwave and, thus,
electromagnetic energy is converted into thermal energy, which accelerates the hydration
of cement. As the water is consumed due to the hydration, the ε’ and ε’’ of the cement
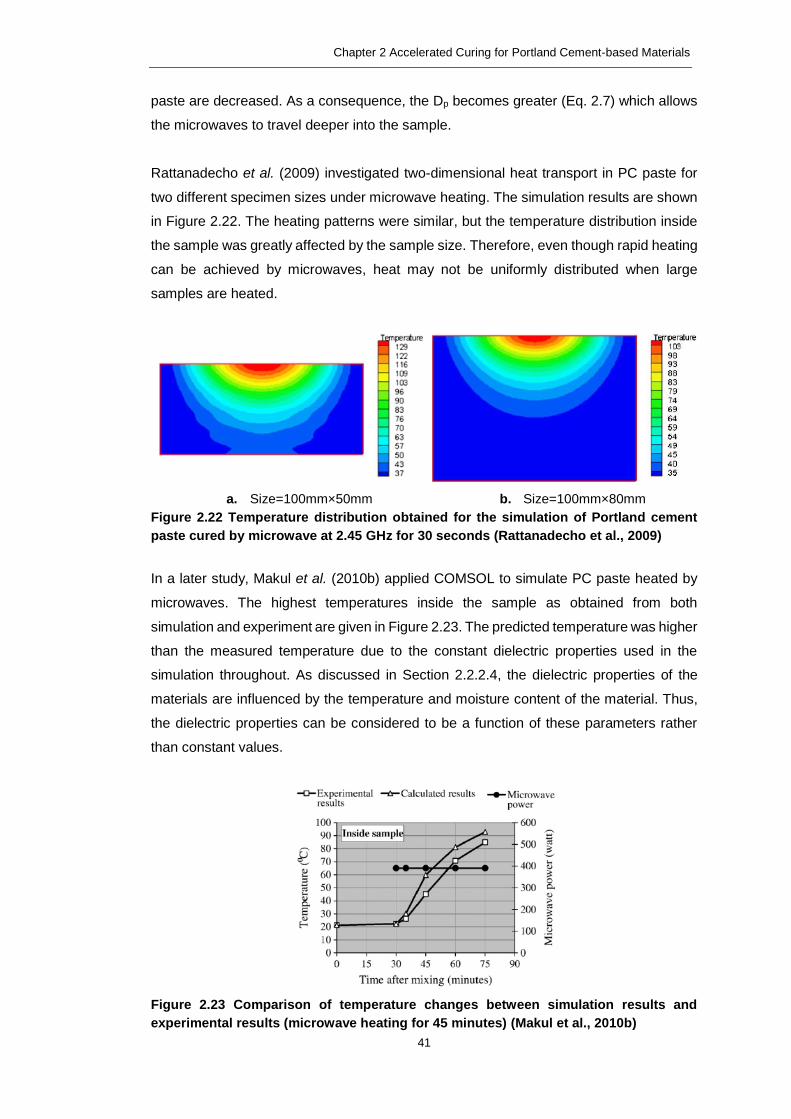
Chapter 2 Accelerated Curing for Portland Cement-based Materials
41
paste are decreased. As a consequence, the Dp becomes greater (Eq. 2.7) which allows
the microwaves to travel deeper into the sample.
Rattanadecho et al. (2009) investigated two-dimensional heat transport in PC paste for
two different specimen sizes under microwave heating. The simulation results are shown
in Figure 2.22. The heating patterns were similar, but the temperature distribution inside
the sample was greatly affected by the sample size. Therefore, even though rapid heating
can be achieved by microwaves, heat may not be uniformly distributed when large
samples are heated.
a. Size=100mm×50mm b. Size=100mm×80mm
Figure 2.22 Temperature distribution obtained for the simulation of Portland cement
paste cured by microwave at 2.45 GHz for 30 seconds (Rattanadecho et al., 2009)
In a later study, Makul et al. (2010b) applied COMSOL to simulate PC paste heated by
microwaves. The highest temperatures inside the sample as obtained from both
simulation and experiment are given in Figure 2.23. The predicted temperature was higher
than the measured temperature due to the constant dielectric properties used in the
simulation throughout. As discussed in Section 2.2.2.4, the dielectric properties of the
materials are influenced by the temperature and moisture content of the material. Thus,
the dielectric properties can be considered to be a function of these parameters rather
than constant values.
Figure 2.23 Comparison of temperature changes between simulation results and
experimental results (microwave heating for 45 minutes) (Makul et al., 2010b)

Chapter 2 Accelerated Curing for Portland Cement-based Materials
42
Changes in the dielectric properties as a material is heated will affect the conversion of
the energy and the thermal conduction (Metaxas and Meredith, 1983). There have been
investigations showing that the changes of water content, degree of hydration,
temperature and mixture proportions can affect the dielectric properties of PC-based
materials (Makul et al., 2010b, Jumrat et al., 2011). Therefore, information about the
dielectric properties as a function of temperature is required, so that temperature feedback
can be used in the simulation. However, in practice it is difficult to obtain the dielectric
properties of the material to be cured as a function of temperature.
Summary
In this chapter, the heating mechanisms of conventional thermal curing and microwave
curing were compared. The effects of the two curing methods on the PC-based materials
were discussed in detail. The key points are summarised as follows:
Conventional thermal curing is primarily dependent on thermal conduction. The delay
period, temperature rise period, curing period at maximum temperature and the
cooling period are the significant stages affecting the quality of the concrete products.
During the conventional thermal curing process, the RH level is kept above 80% to
facilitate cement hydration and microstructural development of hardened cement
paste. The drawback of the conventional thermal curing is its high energy
consumption.
Microwave curing is a promising alternative low-carbon curing technique for
manufacturing concrete products. Some attempts have been made to cure PC-based
products with microwave systems. Three main issues have been identified from the
previous research: 1) there was no accurate temperature and humidity control during
microwave curing; 2) the microwave curing regimes applied were arbitrary; 3) the
widely adopted thermocouple for monitoring temperature changes during the
microwave curing process was not reliable because of its conductive material
interfering with the microwave signal.
To overcome the barriers hindering the industrial application of microwave curing in
the concrete industry, smart microwave curing systems with accurate control of the
temperature and humidity should be developed. Moreover, a suitable microwave
curing regime must be established through systematic scientific research.

Chapter 2 Accelerated Curing for Portland Cement-based Materials
43
In industrial applications, the strength development of the concrete products is
expected to be affected by their size and shape. There is a necessity to study the
effect of the sample size of concrete products on the heating during microwave curing
so that the findings established in laboratory studies can be scaled up for future
industrial applications. It is anticipated that suitable modelling work may help
understand the effect of the sample size under microwave curing.
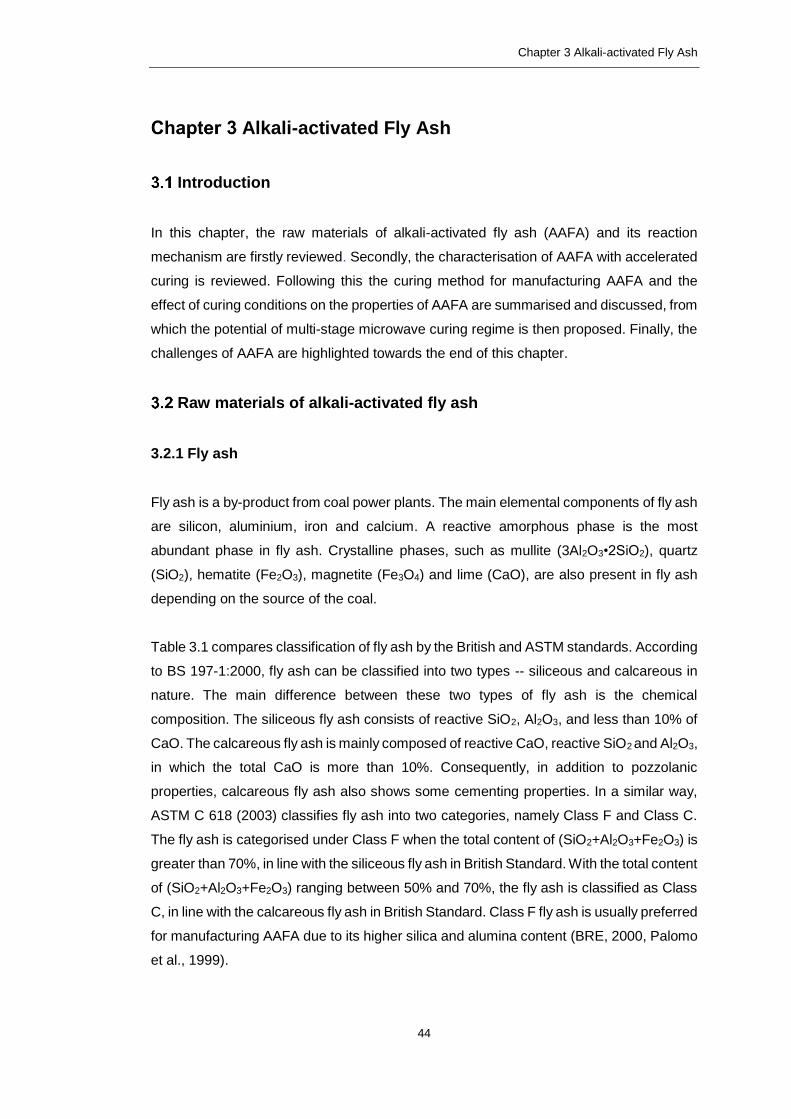
Chapter 3 Alkali-activated Fly Ash
44
Alkali-activated Fly Ash
Introduction
In this chapter, the raw materials of alkali-activated fly ash (AAFA) and its reaction
mechanism are firstly reviewed. Secondly, the characterisation of AAFA with accelerated
curing is reviewed. Following this the curing method for manufacturing AAFA and the
effect of curing conditions on the properties of AAFA are summarised and discussed, from
which the potential of multi-stage microwave curing regime is then proposed. Finally, the
challenges of AAFA are highlighted towards the end of this chapter.
Raw materials of alkali-activated fly ash
3.2.1 Fly ash
Fly ash is a by-product from coal power plants. The main elemental components of fly ash
are silicon, aluminium, iron and calcium. A reactive amorphous phase is the most
abundant phase in fly ash. Crystalline phases, such as mullite (3Al2O3•2SiO2), quartz
(SiO2), hematite (Fe2O3), magnetite (Fe3O4) and lime (CaO), are also present in fly ash
depending on the source of the coal.
Table 3.1 compares classification of fly ash by the British and ASTM standards. According
to BS 197-1:2000, fly ash can be classified into two types -- siliceous and calcareous in
nature. The main difference between these two types of fly ash is the chemical
composition. The siliceous fly ash consists of reactive SiO2, Al2O3, and less than 10% of
CaO. The calcareous fly ash is mainly composed of reactive CaO, reactive SiO2 and Al2O3,
in which the total CaO is more than 10%. Consequently, in addition to pozzolanic
properties, calcareous fly ash also shows some cementing properties. In a similar way,
ASTM C 618 (2003) classifies fly ash into two categories, namely Class F and Class C.
The fly ash is categorised under Class F when the total content of (SiO2+Al2O3+Fe2O3) is
greater than 70%, in line with the siliceous fly ash in British Standard. With the total content
of (SiO2+Al2O3+Fe2O3) ranging between 50% and 70%, the fly ash is classified as Class
C, in line with the calcareous fly ash in British Standard. Class F fly ash is usually preferred
for manufacturing AAFA due to its higher silica and alumina content (BRE, 2000, Palomo
et al., 1999).

Chapter 3 Alkali-activated Fly Ash
45
Table 3.1 Comparison of the classification of fly ash between BS and ASTM Standards
BS 197-1:2000 ASTM C 618
Siliceous
fly ash
SiO2, Al2O3
CaO<10%
Class F
fly ash (SiO2+Al2O3+Fe2O3)>70%
Calcareous
fly ash
CaO, SiO2, Al2O3
CaO>10%
Class C
fly ash 50%< (SiO2+Al2O3+Fe2O3)<70%
The density of fly ash usually ranges from 2.0 to 2.4 g/cm3 (Sear, 2001). Loss on ignition
(LOI) is used to quantify the unburnt carbon remaining in the fly ash and it varies
depending on the facility and the production process in the coal-fired power station. ASTM
C 618 (2003) specifies a LOI limit of 6%, because a high level of LOI may cause air-
entrainment problems in concretes. The particles of fly ash are mainly solid spheres,
hollow spheres or compound spheres (Sear, 2001). An SEM image of fly ash is shown in
Figure 3.1.
Figure 3.1 SEM image of Class F fly ash (Katz, 1998)
3.2.2 Alkaline activator
3.2.2.1 Sodium hydroxide
Sodium hydroxide (NaOH) is the most popular alkaline activator used for AAFA. The
dissolution of NaOH in water releases a large amount of heat which could cause some
potential health and safety issues in the laboratorial and practical applications. The
concentration of NaOH solution is usually given in mol/L (M). In the literature, 8M NaOH
solution (pH value≥14) is widely used to manufacture AAFA (Fernandez-Jimenez and
Palomo, 2003, Fernandez-Jimenez et al., 2005), although this could be too caustic for
practical applications.

Chapter 3 Alkali-activated Fly Ash
46
3.2.2.2 Sodium silicate
The second alkaline activator for AAFA is sodium silicate with a formula of Na2O•nSi2O.
The ‘n’ represents the silica modulus of sodium silicate (n=SiO2/Na2O), which ranges from
1.6 to 3.3 in commercial liquid sodium silicate (Shi et al., 2006), and can be modulated by
adding additional NaOH in the application of alkaline activation. As sodium silicate can
provide soluble silicate in the process of alkaline activation, it benefits the manufacture of
AAFA (Provis and Deventer, 2009).
In the past few years, there has been increasing interest in NaOH activated fly ash
systems because the manufacture of sodium silicate is associated with a high carbon
footprint of 1.64 kgCO2/kg compared with 0.46 kgCO2/kg for NaOH (Winnipeg, 2012)
Reaction mechanism of alkali-activated fly ash
3.3.1 Introduction
It is known that in a pozzolanic reaction, the amorphous phase in fly ash reacts with
Ca(OH)2 from the hydration of PC to form amorphous C-S-H gel (Hewlett, 1998, Neville,
2011). This reaction can be seen as a model of alkaline activation, in which Ca(OH)2 plays
the role of a relatively mild alkaline activator (pH value=12.4) (Hewlett, 1998).
Different from this model, AAFA often involves NaOH as an activator. The amorphous
phase in fly ash can react with NaOH to form N-A-S-H gel (Palomo et al., 1999). Although
the research on AAFA dates back to the 1980s with many investigations being carried out,
the reaction mechanism is still not fully understood. In this section, the reaction
mechanism, reaction products and microstructure development of AAFA products from
previous research are reviewed.
3.3.2 Reaction model of alkaline activation
3.3.2.1 Proposed reaction models
Mixing of aluminosilicate material and alkali solution leads to a series of chemical
reactions, resulting in hardening and strength gain. This process is similar to PC reacting
with water to set and harden.

Chapter 3 Alkali-activated Fly Ash
47
Glukhovsky (1959) firstly proposed a reaction mechanism for alkaline activation of
aluminosilicate materials in 1950s. In this theory, the reaction mechanism is divided into
three stages: destruction-coagulation, coagulation-condensation and condensation-
crystallisation. In an environment of high alkalinity, the Si-O-Si, Si-O-Al and Al-O-Al bonds
in the initial aluminosilicate material are destroyed, resulting in the liberation of alumina
and silica species in the alkaline media. As the concentration of these species builds up
in the solution, polycondensation between the species occurs. The reaction product, an
amorphous gel, is gradually formed.
Davidovits (2011) coined the term ‘geopolymer’ to describe the alkali-activated
aluminosilicate binder in 1970s. He proposed three types of poly(sialate), as shown in
Figure 3.2. All the SiO4 and AlO4 units are connected by oxygen atoms.
Figure 3.2 Three dimensional structure of poly(sialate) (sialate: silico-aluminate)
(Davidovits, 2011)
Duxson et al. (2007a) later further interpreted the model proposed by Glukhovsky. The
reactions are seen as a process of geopolymerisation. Figure 3.1 shows the three main
stages involved in the process, including dissolution, gelation, and polymerisation. It
should be highlighted that, in this model, the gel formed is classified into two types. The
initial gel formed is an Al-rich phase (Gel 1), and it is converted to a Si-rich phase (Gel 2)
as the polymerisation proceeds, which will be further elaborated later in this section. Water,
which plays the role of the reaction medium, is consumed in the dissolution stage and is
also a reaction product from the gelation and polymerisation process.

Chapter 3 Alkali-activated Fly Ash
48
Figure 3.3 Conceptual model for geopolymerisation (Duxson et al., 2007a)
Fernandez-Jimenez et al. (2005) proposed a model for the alkaline activation of fly ash
(shown in Figure 3.4), in which the fly ash is initially attacked by the alkaline solution,
resulting in corrosion of the crust of fly ash particles and penetration of alkaline solution
into the fly ash particles. As the chemical attack advances, the crust of the fly ash is broken
and smaller beads inside the fly ash particle are corroded in the high alkaline environment.
The silica and alumina species dissolved from the raw fly ash then react with each other.
The gaps between fly ash particles are filled in by the reaction products, resulting in the
formation of the dense structure of AAFA.
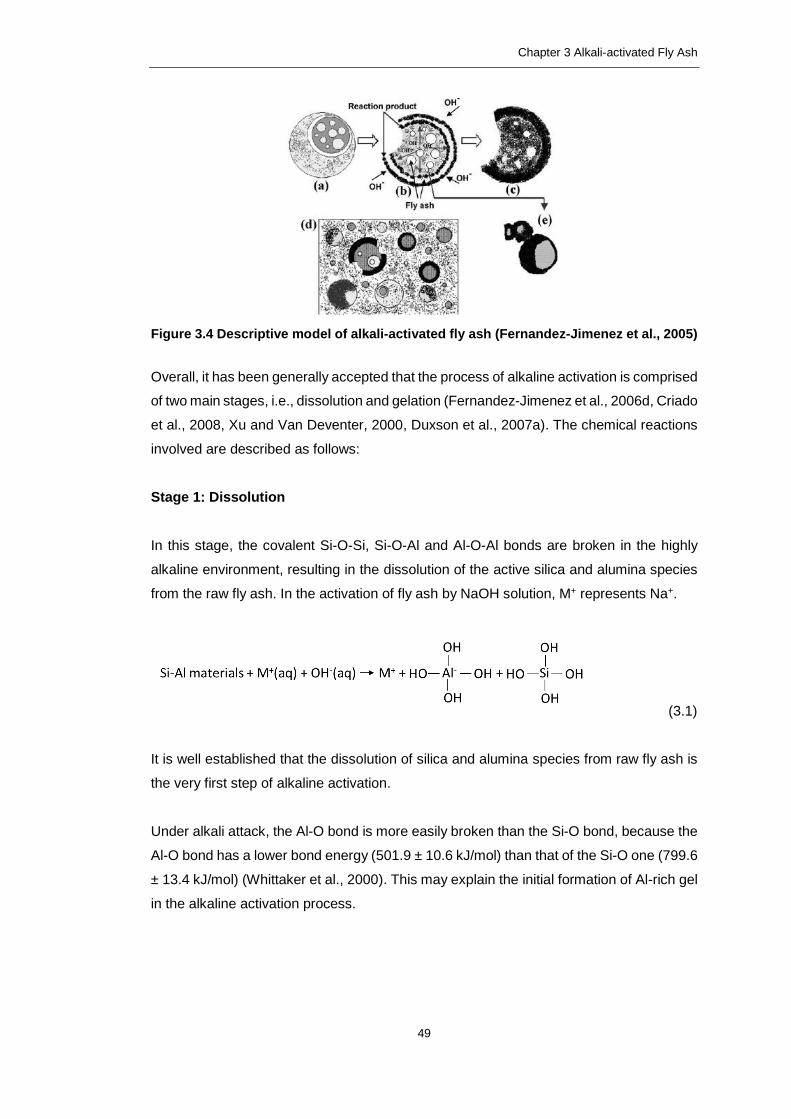
Chapter 3 Alkali-activated Fly Ash
49
Figure 3.4 Descriptive model of alkali-activated fly ash (Fernandez-Jimenez et al., 2005)
Overall, it has been generally accepted that the process of alkaline activation is comprised
of two main stages, i.e., dissolution and gelation (Fernandez-Jimenez et al., 2006d, Criado
et al., 2008, Xu and Van Deventer, 2000, Duxson et al., 2007a). The chemical reactions
involved are described as follows:
Stage 1: Dissolution
In this stage, the covalent Si-O-Si, Si-O-Al and Al-O-Al bonds are broken in the highly
alkaline environment, resulting in the dissolution of the active silica and alumina species
from the raw fly ash. In the activation of fly ash by NaOH solution, M+ represents Na+.
(3.1)
It is well established that the dissolution of silica and alumina species from raw fly ash is
the very first step of alkaline activation.
Under alkali attack, the Al-O bond is more easily broken than the Si-O bond, because the
Al-O bond has a lower bond energy (501.9 ± 10.6 kJ/mol) than that of the Si-O one (799.6
± 13.4 kJ/mol) (Whittaker et al., 2000). This may explain the initial formation of Al-rich gel
in the alkaline activation process.

Chapter 3 Alkali-activated Fly Ash
50
Stage 2: Gelation
This stage involves the reorganisation of the silica and alumina tetrahedras to form the
final reaction products, N-A-S-H gel and minor zeolitic phases as follows:
(3.2)
Si and Al occupy the tetrahedral sites in aluminosilicates, which can be classified
according to the degree of polymerisation. The notation Qn(mAl) is used to describe the
degree of polymerisation of the structure comprising SiO4 and AlO4 tetrahedras, which
are connected by bridging oxygen atoms. The ‘n’ represents the number of bridging
oxygen atoms and the ‘m’ represents the number of AlO4 units surrounding each SiO4 unit
(Davidovits, 2011, Duxson et al., 2005a).
In this stage, the silica tetrahedra and alumina tetrahedra are reorganised to form N-A-S-
H gel with three dimensional cross-link structures, in which the sodium ion (Na+) balances
the charge. Over time, the precipitation of N-A-S-H gel results in the hardening of AAFA
products and contributes to the strength development of the AAFA products (Fernandez-
Jimenez et al., 2005, Fernandez-Jimenez et al., 2006d).
During the process of gel formation, there is a transition of N-A-S-H gel from Al-rich phase
(Gel 1) to Si-rich phase (Gel 2). As aluminate species dissolve faster than silicate species,
the initial N-A-S-H gel formed is Gel 1 with an atomic Si/Al ratio of approximately one. As
the reaction proceeds, more silicate and aluminate species are dissolved, favouring the
conversion from Gel 1 to Gel 2, a more stable phase with a higher atomic Si/Al ratio of
approximately 1.8 (Fernandez-Jimenez et al., 2006d).
Figure 3.5 illustrates the relationship between the mechanical strength and the amount of
gel formed over the curing time, which clearly shows that the mechanical strength rises
with the increase of Gel 2. During Gel 1 formation, the reaction kinetics are dominated by
the dissolution of Al species, while during the gel conversion process, the supply of soluble
Si species favours the reaction moving forward and benefits the strength gain (Fernandez-
Jimenez et al., 2006d).

Chapter 3 Alkali-activated Fly Ash
51
Figure 3.5 Schematic description of mechanical properties evolution over the reaction
time. The increment of mechanical performances (P) is related to the Si/Al ratio in the
gel (Fernandez-Jimenez et al., 2006d).
3.3.2.2 Reaction products
The N-A-S-H gel, the primary reaction product, contributes to the strength development
of AAFA (Criado et al., 2007b). N-A-S-H is a short-range ordered amorphous phase with
a three-dimensional framework of Si and Al tetrahedras bridged by oxygen atoms, in
which the Si atom has a variety of Q4(mAl) (m=0, 1, 2, 3, and 4) units (Criado et al., 2007a,
Fernandez-Jimenez et al., 2006d). Figure 3.6 illustrates the schematic structure of Q4(mAl)
in the N-A-S-H gel.
Figure 3.6 Schematic structure of Q4(mAl) units (Davidovits, 2011)
Apart from the N-A-S-H gel, small amounts of zeolitic phases have also been observed in
this system, including hydroxysodalite, chabazite-Na, etc. (Criado et al., 2007a).

Chapter 3 Alkali-activated Fly Ash
52
3.3.3 Activation barrier and reaction kinetics
3.3.3.1 Activation barrier
Previous research has shown that external heat is important for the activation of fly ash,
particularly with NaOH as the activator (Bakharev, 2005b, Kovalchuk et al., 2007). The
AAFA exhibits desirable compressive strength after being exposed to accelerated curing
for a period of time. For example, a compressive strength of 22 MPa was achieved after
curing for 5 hours at 85oC (Palomo et al., 1999).
It has been generally accepted that a minimum energy is required to initiate a chemical
reaction, which is known as the activation energy (Ea). The Arrhenius equation shows the
relationship between Ea, T and the rate k at which a reaction proceeds (Whittaker et al.,
2000):
ln k = ln A – Ea/RT (3.3)
where A is the frequency factor for the reaction, R is the universal gas constant, T is the
absolute temperature in Kelvin, and k is the reaction rate constant, which is temperature
dependent.
It can be clearly seen that for a given Ea, which is dependent on the nature of the reaction,
with the increase of temperature, the reaction rate rises exponentially. In the alkaline
activation of fly ash, the overall reaction is controlled by the dissolution rates of the active
silica and alumina species from the amorphous phase of raw fly ash and the reaction rate
of polymerisation (Rees et al., 2007, Rattanasak and Chindaprasirt, 2009). The Ea of
polymerisation has been reported with the value 31.5 ± 6 kJ·mol-1 (Provis and van
Deventer, 2007), which compares with less than 50 kJ·mol-1 for PC hydration (Schindler
and Folliard, 2005).
From Eq. 3.3, it can be concluded that the rise of temperature accelerates the chemical
reactions. Therefore, the effect of the curing temperature on the mechanical properties of
AAFA products will be discussed in detail in Section 3.5.1.3.
3.3.3.2 Effect of concentration of NaOH solution on the reaction rate
In both dissolution and gelation stages, NaOH has a significant influence on the reaction
rate of alkaline activation. Rees et al. (2007) investigated the effect of the concentration

Chapter 3 Alkali-activated Fly Ash
53
of NaOH solution on the formation kinetics of N-A-S-H gel in AAFA with an in situ ATR-
FTIR. Four concentrations were adopted in their research: 3M, 6M, 9M and 12M. Figure
3.7 shows the changes in the peak intensity of the N-A-S-H gel formed over the reaction
duration. It can be seen that as the concentration of NaOH solution was increased from
3M to 9M, the peak intensity of the N-A-S-H gel initially increased but subsequently started
to decrease when the concentration further increased to 12M. For the 9M NaOH solution,
the Na/Al molar ratio reached 0.75, which was the most suitable ratio for the gelation in
this study. This observation suggests that there is an optimum concentration of NaOH
solution for the manufacture AAFA.
Figure 3.7 Effect of the concentration of NaOH solution on the N-A-S-H gel formation
(Note: peak intensity indicates the amount of N-A-S-H gel formed in the alkali-activated
fly ash) (Rees et al., 2007)
Rattanasak and Chindaprasirt (2009) studied the effect of concentration of NaOH solution
on the dissolution of silica and alumina from raw fly ash (see Figure 3.8). The results
showed that NaOH solution with a concentration of 10M gave rise to higher concentrations
of Si4+ and Al3+ than 5M and 15M NaOH solutions. This indicates that, whilst a minimum
NaOH concentration is essential for the dissolution of silica and alumina species, a higher
NaOH concentration, such as 15M NaOH, could cause the coagulation of the silica
dissolved from the raw fly ash, leading to a reduction in the subsequent gelation reaction.
These results also suggest that, for a given fly ash, there is always an optimum
concentration for the NaOH solution to be used in an AAFA system.
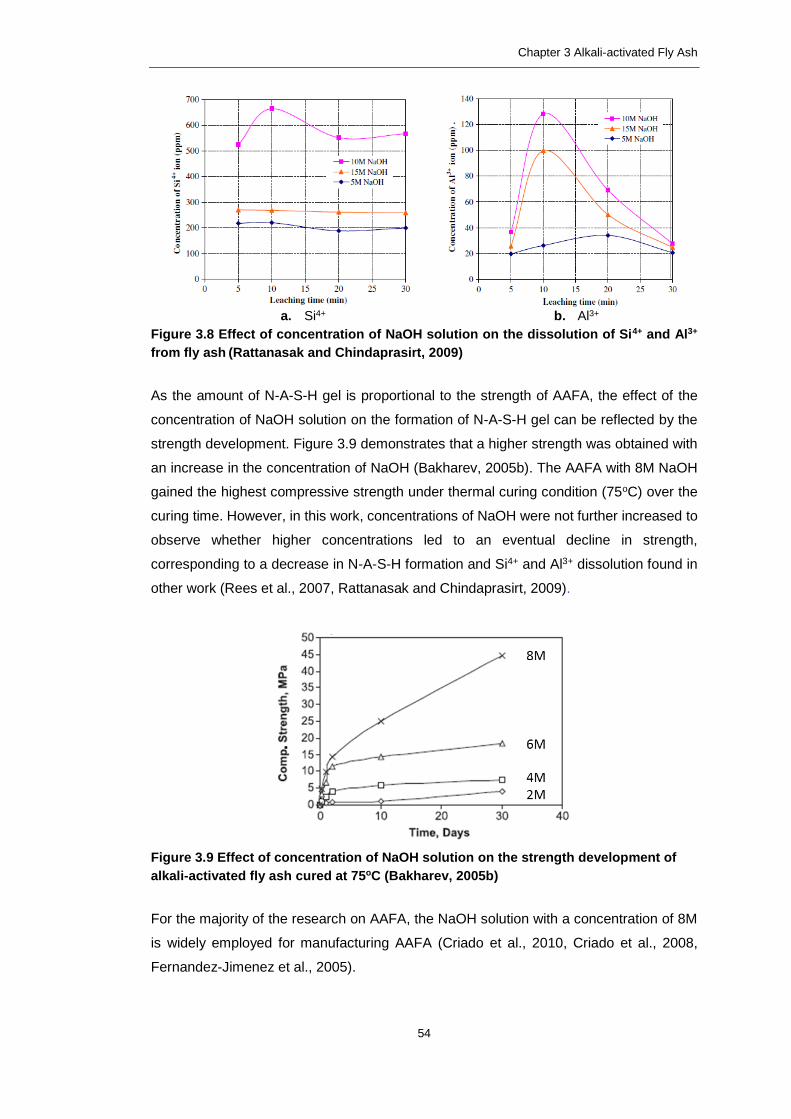
Chapter 3 Alkali-activated Fly Ash
54
a. Si4+ b. Al3+
Figure 3.8 Effect of concentration of NaOH solution on the dissolution of Si4+ and Al3+
from fly ash (Rattanasak and Chindaprasirt, 2009)
As the amount of N-A-S-H gel is proportional to the strength of AAFA, the effect of the
concentration of NaOH solution on the formation of N-A-S-H gel can be reflected by the
strength development. Figure 3.9 demonstrates that a higher strength was obtained with
an increase in the concentration of NaOH (Bakharev, 2005b). The AAFA with 8M NaOH
gained the highest compressive strength under thermal curing condition (75oC) over the
curing time. However, in this work, concentrations of NaOH were not further increased to
observe whether higher concentrations led to an eventual decline in strength,
corresponding to a decrease in N-A-S-H formation and Si4+ and Al3+ dissolution found in
other work (Rees et al., 2007, Rattanasak and Chindaprasirt, 2009).
Figure 3.9 Effect of concentration of NaOH solution on the strength development of
alkali-activated fly ash cured at 75oC (Bakharev, 2005b)
For the majority of the research on AAFA, the NaOH solution with a concentration of 8M
is widely employed for manufacturing AAFA (Criado et al., 2010, Criado et al., 2008,
Fernandez-Jimenez et al., 2005).

Chapter 3 Alkali-activated Fly Ash
55
Reaction products and microstructure of alkali-activated fly ash
3.4.1 Introduction
The alkaline activation of fly ash involves a different reaction mechanism from that of PC
hydration (Provis and Deventer, 2009, Hewlett, 1998). Since fly ash is a by-product from
thermal power plant which varies depending on the type of coal and burning conditions
(Sear, 2001), the nature of the reaction products formed is complex and has not been
well-understood. Attempts have been made by researchers to use various advanced
techniques to characterise the reaction products and the microstructure formed, to be able
to predict its performance and design this products to satisfy different applications. This
section, therefore, reviews the state-of-the-art of our knowledge on both the reaction
products and the microstructure of AAFA as obtained from different characteristic
techniques.
3.4.2 Reaction products
The main reaction product of AAFA is N-A-S-H gel, the primary contributor to the strength
development. Several zeolitic phases are also formed. In the literature, different analytical
techniques, including X-ray diffraction (XRD), thermogravimetry (TG), Fourier transform
infrared spectroscopy (FTIR) and nuclear magnetic resonance spectroscopy (NMR) have
been applied to analyse these products. The principles of these techniques are introduced,
and the knowledge of the reaction products of AAFA obtained from each individual
technique is reviewed below.
1) X-ray diffraction
XRD is an analytical technique for the identification of crystalline phases in solid materials
(Waseda et al., 2011). Atoms in a crystal are arranged in a periodic array, and a diffraction
pattern is produced by scattering of X-rays by the crystal lattice. The angle (2θ) where a
diffraction peak produced is determined by the distance between lattice planes (d)
according to the Bragg’s Law (Figure 3.10). Different crystals can be identified by the 2θ
value in XRD.

Chapter 3 Alkali-activated Fly Ash
56
Figure 3.10 Schematic representation of the Bragg’s Law (Waseda et al., 2011)
Figure 3.11 shows typical XRD patterns of raw fly ash and AAFA samples (Criado et al.,
2007a). In this case, Class F fly ash was activated by 8M NaOH solution and cured at
85oC for different durations. In the raw fly ash, quartz, mullite and magnetite are the three
main crystalline phases identified by XRD. The halo (2θ: approx. 20-35o) represents the
amorphous phase in the raw fly ash.
Figure 3.11 X-ray powder diffraction spectra of raw fly ash and alkali-activated fly ash
with different reaction durations (Criado et al., 2007a)
It can be seen from Figure 3.11, after alkaline activation, the peaks of the inert crystalline
phases in the raw fly ash, i.e. quartz, mullite, magnetite, did not change, whilst the area
of the halo decreased indicating that the amorphous phase was consumed in the alkaline
activation (Criado et al., 2007a). In addition, there were two new crystalline phases formed,
namely, hydroxysodalite and chabazite-Na. The details of these two zeolite species can
be found in Table 3.2. Similar findings were also reported by other researchers
(Fernandez-Jimenez and Palomo, 2005a, Ruiz-Santaquiteria et al., 2012, Kovalchuk et
al., 2007).

Chapter 3 Alkali-activated Fly Ash
57
Table 3.2 Two new zeolites species formed in alkali-activated fly ash (Criado et al., 2007a,
Fernandez-Jimenez et al., 2008)
Zeolite species Other name Chemical formulation Si/Al ratio
hydroxysodalite hydrated sodalite
or sodalite Na4Al3Si3O12OH 1
chabazite-Na herschelite NaAlSi2O6∙6H2O 2
2) Thermogravimetry
TG records the mass change of a material subjected to a controlled atmosphere as a
function of increasing temperature, while differential thermogravimetric (DTG) records the
first derivative of the TG curve. They are very useful for quantifying the amount of reaction
products, such as amorphous N-A-S-H gel, formed in AAFA (Menczel and Prime, 2009)
Figure 3.12 shows typical TG and DTG curves of AAFA samples. The curing condition
was 50oC for 4 hours followed by 85oC for 16 hours (RH>90%). The NaOH activated
AAFA sample had one wide peak at ~100oC in the DTG curve, which is associated with
the loss of water physically absorbed or chemically combined in the N-A-S-H gel
(Winnefeld et al., 2010, Fernandez-Jimenez et al., 2008).
Figure 3.12 Thermogravimetric analysis of 8M NaOH activated alkali-activated fly ash
(Adapted from Fernandez-Jimenez et al., 2008)
The limitation of TGA is that it cannot provide any further detailed information about the
structure of the N-A-S-H gel. FTIR and NMR are proved to be more useful in this respect.
3) Fourier transform infrared spectroscopy
FTIR is a useful technique for identifying different functional groups at a molecular level
from the absorption of infrared radiation at various wavelengths, resulting in peaks in an
FTIR spectrum. Thus, the spectrum obtained creates a molecular fingerprint of the sample.
Typical unit used in FTIR spectra is wavenumber (see Eq. 3.4).

Chapter 3 Alkali-activated Fly Ash
58
𝑊𝑎𝑣𝑒𝑛𝑢𝑚𝑏𝑒𝑟 (𝑐𝑚−1) = 1
𝑊𝑎𝑣𝑒𝑙𝑒𝑛𝑔𝑡ℎ =
𝐹𝑟𝑒𝑞𝑢𝑒𝑛𝑐𝑦
𝑆𝑝𝑒𝑒𝑑 𝑜𝑓 𝑙𝑖𝑔ℎ𝑡 (3.4)
In the study of AAFA products, FTIR spectroscopy is often used to understand the
structure and the nature of the reaction products formed through the fundamental
vibrations of the bonds formed (Smith, 2011, Provis and Deventer, 2009).
Figure 3.13 shows representative FTIR spectra of raw fly ash and AAFA samples. The
primary peak identified in the range of 1250 cm-1 to 850 cm-1 is attributed to the vibrations
of TO4 tetrahedra (T: Si or Al) in the raw fly ash and N-A-S-H gel formed after activation.
The band at 1078 cm-1 representing the asymmetric stretching vibration of T-O bond shifts
to lower frequency after alkaline activation, which is associated with the formation of N-A-
S-H gel (Criado et al., 2007b).
In addition, the width and the intensity of the band can be related to the degree of
crystallisation of the gel (Andini et al., 2008). When the band becomes sharper and more
intense, a more orderly structure is formed (Criado et al., 2007b). Moreover, the location
of the band is dependent on the Al/Si ratio in the product. With the increase of Al
tetrahedrally positioned in the gel, the band shifts to a lower frequency (Fernandez-
Jimenez and Palomo, 2005b).
Figure 3.13 FTIR spectra for the raw fly ash and alkali-activated fly ash at 85oC for
different reaction durations (Criado et al., 2007b)

Chapter 3 Alkali-activated Fly Ash
59
Table 3.3 further summarises the bands identified in the raw fly ash and the AAFA from
the literature. The bands representing the mullite and quartz from the raw fly ash and the
bands attributed to the new zeolitic phases formed in AAFA are also compared in this
table.
Table 3.3 Bands of FTIR spectra (Criado et al., 2010, Criado et al., 2007b, Fernandez-
Jimenez and Palomo, 2005b)
Raw fly ash AAFA
Band
(cm-1) Attribution
Band
(cm-1) Attribution
1078 T-O bond (T=Si or Al)
stretching band
1008 or 998 T-O bond in N-A-S-H gel
band (T=Si/Al)
796-778 Quartz double band 796-778 Quartz double band
730 O-Si-O (zeolite species)
bond band
697 Quartz band 697 Quartz band
668 O-Si-O bond band 668 O-Si-O bond band
620 O-Si-O (zeolite species)
bond band
560 Mullite band 560 Mullite band
512 O-Si-O (zeolite species)
bond band
460 SiO4 tetrahedra ν4
(O-Si-O) deformation band
460 SiO4 tetrahedra ν4
(O-Si-O) deformation band
In zeolites, the primary building unit is tetrahedral SiO4 unit or tetrahedral AlO4 unit (Dyer,
1988). It should be highlighted that a feature of hydroxysodalite is its secondary building
unit, single six ring (S6R), which can be identified at a band range of 730-720 cm-1, while
double six ring (D6R) for chabazite-Na, which can be distinguished from two bands at
516-512 cm-1 and 635-610 cm-1 respectively (Fernandez-Jimenez and Palomo, 2005b).
The structures of S6R and D6R are shown in Figure 3.14 below.
Figure 3.14 Structure of zeolite (Dyer, 1988)
Although FTIR spectra can demonstrate the transformation of the amorphous phase in
the raw fly ash to the amorphous phase of N-A-S-H gel in the AAFA product, it is unable

Chapter 3 Alkali-activated Fly Ash
60
to provide further information on the environment of the silica and alumina tetrahedras in
the gel framework, which are closely related to the evolution of the N-A-S-H gel and the
strength development of the AAFA (Fernandez-Jimenez et al., 2006d). This limitation of
FTIR can be supplemented by NMR as discussed below.
4) Nuclear magnetic resonance spectroscopy
Electrically charged nuclei (i.e. 29Si and 27Al) have spin. When an external magnetic field
is applied, a spinning nucleus is possible to have a transition from a lower energy state
(more stable) to a higher energy state by absorbing electromagnetic radiation in
radiofrequency region, resulting in a ‘flip’ of the spinning nucleus (Figure 3.15). The signal
matching this transition is measured and processed, yielding an NMR spectrum for the
nucleus concerned.
Figure 3.15 Energy transition of a spinning nucleus in a magnetic field (Adapted from
Abraham et al., 1994)
As the NMR signal obtained is directly proportional to the number of nuclei producing it,
the intensity of the signal can be used for quantitative analysis (Abraham et al., 1994).
The resonant frequency of a nucleus relative to the magnetic field is termed as chemical
shift (δ), which is usually expressed in parts per million (ppm) by frequency. Different
chemical shifts correspond to different Qn(mAl) units, reflecting the ways that SiO4 and
AlO4 tetrahedra are structured.
Among all the analytical techniques, NMR has made the most substantial contribution to
the exploration of the structure of the N-A-S-H gel at atomic level (Ruiz-Santaquiteria et
al., 2012). NMR can provide structural information of SiO4 and AlO4 tetrahedras bridged
by oxygen atoms in the short-range ordered amorphous N-A-S-H gel (Duxson et al.).
29Si NMR and 27Al NMR spectra are the two main spectra for examining reaction products
of AAFA. Figure 3.16 shows representative 29Si and 27Al NMR spectra of a Class F fly ash

Chapter 3 Alkali-activated Fly Ash
61
and NaOH activated AAFA samples at different curing ages (Fernandez-Jimenez et al.,
2006d).
i) 29Si NMR
Si has various environments in the N-A-S-H gel, consisting of Q4(mAl) (m=0, 1, 2, 3, 4).
The most dominant structures are Q4(3Al) and Q4(2Al) (Fernandez-Jimenez et al., 2006a,
Fernandez-Jimenez et al., 2005, Criado et al., 2007a). With each AlO4 unit connected to
a SiO4 unit, there is approx. 5 ppm increase of δ(29Si) in the 29Si NMR spectrum
(Davidovits, 2011).
In Figure 3.16a, the peaks detected at -84 ppm, -94 ppm, -98 ppm, and -103 ppm in the
29Si spectrum of raw fly ash can be assigned to amorphous phases in the ash. The peak
at -87 ppm is identified as the crystalline phase of mullite and the peaks beyond -108 ppm
are attributed to different crystalline silica phases in the raw ash, such as quartz(-108/-
109ppm) (Criado et al., 2008, Fernandez-Jimenez and Palomo, 2003).
It is evident that the most intense signal shifted to higher frequency in the early stages
alkaline activation, from 2 hours to 8 hours. The signal around -86/-88 ppm was
associated with the formation of Al-rich gel, in which the predominant silicon unit was
Q4(4Al). The spectra representing the AAFA with thermal curing at 20 hours and 7 days
showed signals at -88 ppm, -93 ppm, -98 ppm, -104 ppm, and -108 ppm, which were
associated with the silicon units of Q4(4Al), Q4(3Al), Q4(2Al), Q4(1Al) and Q4(0Al)
respectively, indicating the formation of Si-rich gel (Ruiz-Santaquiteria et al., 2012, Shi et
al., 2011, Criado et al., 2008).
ii) 27Al NMR
27Al NMR can provide information on the structural environments of Al in the N-A-S-H gel.
Figure 3.16b shows typical 27Al spectra. There are two signals observed in the raw fly ash.
The intense band at +54 ppm is assigned to tetrahedral aluminium (4-coordinate) and the
small band at +2.5 ppm is mainly associated with octahedral aluminium (6-coordinate) in
mullite (Fernandez-Jimenez et al., 2006a, Fernandez-Jimenez et al., 2006b). It can be
seen that the wide signal of the 4-coordinate Al in the raw fly ash becomes sharper after
alkaline activation, indicating the formation of N-A-S-H gel (Duxson et al., 2007a). The
band of 4-coordinate Al with a chemical shift range of 58.4-60 ppm in the AAFA samples
suggests that the AlO4 tetrahedras are present as Al(4Si) sites during the alkaline
activation process (Ruiz-Santaquiteria et al., 2012).

Chapter 3 Alkali-activated Fly Ash
62
a. 29Si NMR spectra b. 27Al NMR spectra
Figure 3.16 29Si and 27Al NMR spectra of raw fly ash and 8M NaOH activated alkali-
activated fly ash cured at 85oC for different durations (Fernandez-Jimenez et al., 2006d)
As highlighted before (Section 3.3.2.1), the amount of reactive aluminium plays a key role
in gel formation kinetics. In the initial reaction stage, a large amount of active alumina
released from the fly ash enhances the formation of Gel 1, which is then converted into a
more stable Gel 2 when more silica is available (Fernandez-Jimenez et al., 2006b). Figure
3.16a shows that the centre of gravity of the 29Si NMR spectrum moves to a less negative
chemical shift from 2 hours to 5 hours, and then moves to a more negative chemical shift
from 8 hours onwards, indicating the conversion of Gel 1 into Gel 2. The main signals
from Figure 3.16a are summarised in Table 3.4.
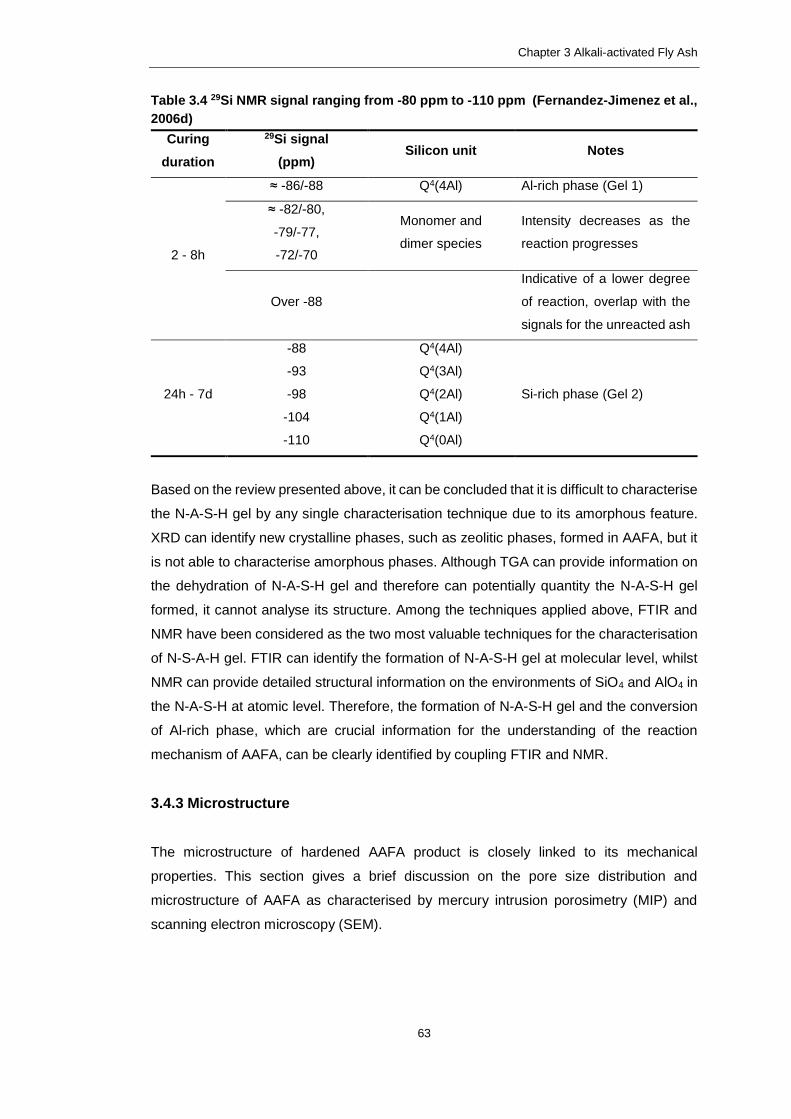
Chapter 3 Alkali-activated Fly Ash
63
Table 3.4 29Si NMR signal ranging from -80 ppm to -110 ppm (Fernandez-Jimenez et al.,
2006d)
Curing
duration
29Si signal
(ppm) Silicon unit Notes
2 - 8h
≈ -86/-88 Q4(4Al) Al-rich phase (Gel 1)
≈ -82/-80,
-79/-77,
-72/-70
Monomer and
dimer species
Intensity decreases as the
reaction progresses
Over -88
Indicative of a lower degree
of reaction, overlap with the
signals for the unreacted ash
24h - 7d
-88 Q4(4Al)
Si-rich phase (Gel 2)
-93 Q4(3Al)
-98 Q4(2Al)
-104 Q4(1Al)
-110 Q4(0Al)
Based on the review presented above, it can be concluded that it is difficult to characterise
the N-A-S-H gel by any single characterisation technique due to its amorphous feature.
XRD can identify new crystalline phases, such as zeolitic phases, formed in AAFA, but it
is not able to characterise amorphous phases. Although TGA can provide information on
the dehydration of N-A-S-H gel and therefore can potentially quantity the N-A-S-H gel
formed, it cannot analyse its structure. Among the techniques applied above, FTIR and
NMR have been considered as the two most valuable techniques for the characterisation
of N-S-A-H gel. FTIR can identify the formation of N-A-S-H gel at molecular level, whilst
NMR can provide detailed structural information on the environments of SiO4 and AlO4 in
the N-A-S-H at atomic level. Therefore, the formation of N-A-S-H gel and the conversion
of Al-rich phase, which are crucial information for the understanding of the reaction
mechanism of AAFA, can be clearly identified by coupling FTIR and NMR.
3.4.3 Microstructure
The microstructure of hardened AAFA product is closely linked to its mechanical
properties. This section gives a brief discussion on the pore size distribution and
microstructure of AAFA as characterised by mercury intrusion porosimetry (MIP) and
scanning electron microscopy (SEM).

Chapter 3 Alkali-activated Fly Ash
64
1) Mercury intrusion porosimetry
MIP is a technique widely used to determine the nature of the pores inside a material,
such as pore size, pore distribution and total pore volume (Abell et al., 1999). The volume
of mercury intruded into a porous sample is recorded as a function of the applied pressure.
The total pore porosity is calculated from the total volume of the mercury intruded. The
pore size is related to the pressure as follows (Eq. 3.5):
𝑃 =−2𝛾 cos𝜃
𝑟 (3.5)
where P represents applied pressure; γ represents surface tension of mercury; r
represents pore radius at which mercury intrudes at pressure P; θ represents the contact
angle between solid material and mercury.
Although MIP has been widely used to characterise the pore structure of PC system, up-
to-date, there has not been any work reported in the literature on the pore size distribution
of hardened NaOH activated AAFA paste samples. Only some MIP data have been
reported on the sodium silicate activated AAFA (Chi, 2015, Ma et al., 2013).
To have a better understanding of the pore structure of AAFA, it is helpful to compare its
pore structure with that of the PC system first. There are two pore systems in hardened
PC paste, namely gel pores and capillary pores. The median size of capillary pores is
estimated to be about 1.3 µm, and the pore size will become smaller in mature cement
pastes as the hydration processes (Neville, 2011). The size of gel pores in C-S-H is much
smaller than that of capillary pores, normally at the magnitude of nanometre (Mindess et
al., 2002).
Figure 3.17 shows a pore size distribution of PC paste (w/c ratio: 0.4) at different ages.
The cumulative mercury intrusion corresponds to the total porosity and the two peaks in
the differential curves are attributed to the gel pores and capillary pores. As hydration
proceeds, the gel pores move to a finer pore size range and the total porosity is reduced.

Chapter 3 Alkali-activated Fly Ash
65
Figure 3.17 Pore size distribution of cement paste at different ages (Adapted from Ye,
2003)
Substantial work on the pore structure of sodium silicate activated AAFA has been carried
out by Ma et al. (2012, 2013). Figure 3.18 shows the pore size distribution of AAFA
products activated by sodium silicate (the silica modulus was modified by adding NaOH)
at an age of 7 days. Similar to hardened cement paste, there were two peaks detected
from the differential curves, representing the gel pores and capillary pores respectively
(Ma et al., 2013). It can be seen that a higher content of silica is beneficial to the formation
of a dense structure with respect to a specific content of alkali (Ma et al., 2012, Ma, 2013)
Figure 3.18 Pore size distribution of alkali-activated fly ash paste at 7 days (Ma, 2013)
2) Scanning electron microscopy
A SEM is a type of electron microscope which produces images by scanning the sample
with a focused beam of electrons. With the interaction between the electrons and atoms
in the sample, various signals can be produced, which contain information of surface
topography and composition of the sample. SEM images are mainly based on the signals
of secondary electrons emitted from atoms in the sample excited by the electron beam,
providing the information about a sample’s morphology (Goldstein, 2003).

Chapter 3 Alkali-activated Fly Ash
66
Figure 3.19 presents some typical SEM images of AAFA after different curing durations.
In Figure 3.19a, the fly ash was attacked by alkaline solution, breaking the crust of the fly
ash particle at a relatively early stage. As the curing duration prolonged (see Figure 3.19b),
N-A-S-H precipitated on the surfaces of fly ash particles (arrows) and the gaps between
the particles were filled with the reaction products (Fernandez-Jimenez and Palomo,
2005a, Duxson et al., 2007a).
Figure 3.19 SEM images of alkali-activated fly ash: activated by 8M NaOH and cured at
85oC (a) for 5h; (b) for 20h (Fernandez-Jimenez et al., 2005)
Figure 3.20 shows the microstructure of an AAFA matrix after microwave curing. Reaction
products were difficult to be observed in the AAFA activated with low concentration of
NaOH solution (4M) due to the low dissolution rate of silica and alumina species
(Rattanasak and Chindaprasirt, 2009, Rees et al., 2007). As the concentration of alkaline
activator increased, a large amount of N-A-S-H gel formed and resulted in a denser
structure.
Figure 3.20 SEM images of alkali-activated fly ash activated by (a) 4M NaOH; (b) 10M
NaOH and cured by microwave for 120 min (Somaratna et al., 2010)

Chapter 3 Alkali-activated Fly Ash
67
Accelerated curing in the manufacture of alkali-activated fly ash
3.5.1 Conventional thermal curing for manufacturing alkali-activated fly ash
3.5.1.1 Introduction
Similar to the effects of conventional thermal curing on the strength development of PC
system (as reviewed in Chapter 2), strength development of AAFA under conventional
thermal curing is also highly dependent on the curing conditions, including delay period,
curing temperature, curing duration and curing moisture. Table 3.5 summarises the curing
regimes of AAFA manufactured with conventional thermal curing, found in the literature.
All these influencing factors are further reviewed in detail below.
3.5.1.2 Effect of delay period
As highlighted in Chapter 2, in the precast concrete industry, a delay period is usually
employed before the concrete is exposed to high temperature to allow the concrete to
gain initial strength, so that it can resist the thermal stress generated during the curing
process, which could lead to strength loss at a later age (Neville and Brooks, 2010).
In a similar way, a delay period has also been adopted in the manufacture of AAFA by a
few researchers. For example, Bakharev (2005b) explored the effect of a delay period on
the properties of AAFA with thermal oven curing. For the same thermal curing duration,
AAFA gained a strength of 45 MPa with a delay period of 24 hours, which was higher than
the 15 MPa gained by the AAFA with a delay period of 2 hours. It should be noticed that,
in a PC system, the delay period can allow the concretes to gain some initial strength
through PC hydration to resist thermal stress, whilst in case of AAFA, even with prolonged
delay period, the AAFA can hardly generate any strength. The possible contribution from
the delay period to the strength development could be mainly due to the increased
dissolution of active silica and alumina. However, the exact mechanism was not reported
by the author.

Chapter 3 Alkali-activated Fly Ash
68
Table 3.5 Summary of curing regimes used for conventional thermal curing of alkali-activated fly ash in the literature
Activator
Liquid/solid ratio Curing temperature
(oC)
Curing duration
(hour) Literature
8M NaOH 0.25/0.3 65/85 2/5/24 (Palomo et al., 1999)
8M NaOH 0.35 85 5/24, 60 days (Fernandez-Jimenez et al.,
2005)
8M NaOH 0.3 45/65/85 5, ~1 week (Palomo et al., 2004)
8M NaOH 0.33/0.4/0.56 85 2/5/8/20, 7 days (Fernandez-Jimenez and
Palomo, 2005b)
8M NaOH
(equivalent) 0.4 85 5/12/20, 7 days (Criado et al., 2005a)
8/10% Na
in mixture
0.3 (w/c)
75/95 Curing for 6/24, 1 month
(Delay period: 24) (Bakharev, 2005b)
5/6/8/10/15/20/25% Na
(by weight of fly ash) 0.5 60
24
(Delay period: 24) (Kumar et al., 2007)
NaOH+Na2SiO3
25,
40,
60,
85
16/96/168/456/672
72120/168/336
16/50/72/120
1/2/3/4/5/6
(Andini et al., 2008)
NaOH+Na2SiO3
20/40/60/80/95 24
(Delay period: 24) (Winnefeld et al., 2010)

Chapter 3 Alkali-activated Fly Ash
69
3.5.1.3 Effect of curing temperature
Palomo et al. (2004) investigated the effect of curing temperature on the strength
development of AAFA (mortar) with 8M NaOH solution as the activator (Figure 3.21). The
samples were cured at 45oC, 65oC or 85oC for 20 hours, which was then followed by room
temperature curing (23±1oC, RH >95%) until each testing age. The results showed that
the compressive strength increased with curing temperature. In particular, after 20 hours
curing, the AAFA cured at 85oC developed 300% compressive strength of that cured at
65oC.
Figure 3.21 Evolution of the compressive strength of alkali-activated fly ash at 45oC,
65oC and 85oC (Palomo et al., 2004)
Bakharev (2005b) cured the AAFA (paste) activated by 8M NaOH solution at 75oC or 95oC
for 24 hours. A similar trend was observed, i.e., the higher curing temperature resulted in
the increase of compressive strength (Figure 3.22). It should be highlighted that, although
the upper limit of curing temperature was raised to 95oC rather than the commonly
adopted 85oC in this research, there was no deleterious effect observed on the strength
gain.
Figure 3.22 Compressive strength development of alkali-activated fly ash cured at 75oC
and 95oC (Adapted from Bakharev, 2005b)
Atis et al. (2015) further increased the curing temperature up to 105oC for curing AAFA
(mortar) and investigated the effect of curing temperature and concentration of NaOH

Chapter 3 Alkali-activated Fly Ash
70
solution on the strength gain after 24 hours thermal curing. As shown in Figure 3.23, the
general trend was that the strength gain was proportional to the concentration of alkali
activator and the curing temperature.
In their research, neither 45oC nor 55oC was high enough to initiate alkaline activation.
The lowest effective thermal curing temperature was 65oC, which was also adopted by
several other researchers to activate AAFA (Palomo et al., 1999, Palomo et al., 2004).
Their data also suggest that there may exist an interaction effect between the
concentration of alkaline solution and curing temperature. Over the temperature range
from 65oC to 105oC, the compressive strength increased with the concentration of NaOH
solution to a certain level and then decreased with further increase of the concentration.
There was a sharp increase of the compressive strength of AAFA when the dosage of
NaOH increased from 12% to 14% (equivalent to ~12M NaOH solution), for samples
cured at 95oC, 105oC or 115oC. It is of interest that the highest curing temperature of
115oC did not contribute to the strength gain of AAFA at a relatively low concentration of
NaOH. There was little adverse effect of the concentration of NaOH solution on the
strength gain of AAFA cured at 85oC. This finding is consistent with common adoption of
a temperature of 85oC for curing AAFA products.
Figure 3.23 Effect of concentration of NaOH solution and curing temperature on
compressive strength of alkali-activated fly ash (Adapted from Atis et al., 2015)
3.5.1.4 Effect of curing duration
Cridao et al. (2007a) cured an 8M NaOH activated AAFA paste at 85oC from 8 hours to
180 days. Figure 3.24 shows the strength development of their AAFA over the curing time.
After 8 hours thermal curing, the strength of AAFA activated with NaOH increased to
around 20 MPa. In general, a substantial increase was observed by applying a longer
curing duration up to 180 days. However, a very long curing duration at 85oC is not
economically and environmentally desirable.

Chapter 3 Alkali-activated Fly Ash
71
Figure 3.24 Compressive strength vs curing duration (Adapted from Criado et al., 2007a)
In another study, Fernandez-Jimenez et al. (2006b) investigated the effect of curing
duration on the strength development of AAFA produced with three types of fly ash. All
the fly ash was activated by 8M NaOH and cured at 85oC from 2 hours up to 7 days. In
general, the strength of all AAFA samples increased with curing duration 2 hours up to 7
days (Figure 3.25). In particular, a quick increase in compressive strength was noticed
between 2 and 20 hours.
Figure 3.25 Compressive strength vs curing duration (Note: P, L, M indicate different fly
ashes activated by 8M NaOH) (Fernandez-Jimenez et al., 2006d)
As can be seen, AAFA can gain substantial strength with 8 hours curing. In general, it is
not economic to cure AAFA for more than 24 hours, even though some additional strength
development can be obtained.
3.5.1.5 Effect of moisture
As discussed in Section 2.3.3, the control of temperature and moisture during curing is
crucial to the quality and durability of PC-based concrete. Similarly, moisture control also
plays a key role in the strength development of AAFA.
Criado et al. (2010, 2012) investigated the effect of RH on the strength development of
8M NaOH (Figure 3.26a) and sodium silicate (Figure 3.26b) activated AAFA under

Chapter 3 Alkali-activated Fly Ash
72
accelerated curing at 85oC. They adopted two methods to control the RH. In Method 1,
AAFA samples were sealed in air-tight containers with RH maintained at 90%. In Method
2, AAFA samples were exposed to the air in the cavity of a thermal oven with a RH of 40-
50%.
As shown in Figure 3.26a, the compressive strength of AAFA activated with NaOH and
cured with Method 1 increased remarkably with the curing duration, while the compressive
strength of AAFA cured with Method 2 hardly changed from 8 hours to 60 days. Figure
3.26b shows that there was slight difference between the strength of AAFA activated with
sodium silicate and cured by these two methods at 12 hours. However, the AAFA cured
with Method 1 gained higher strength at 7 days and 30 days than that with Method 2.
They concluded that Method 1 with high RH (90%) benefited the strength development.
At low RH level (40-50%; Method 2), the hardened matrix was found to have a porous
structure due to the evaporation of water. In addition, the presence of alkaline bicarbonate
resulted in the decrease of pH value in the material, which consequently retarded the
activation reaction.
a. Alkali-activated fly ash activated with
8M NaOH (Criado et al., 2010)
b. Alkali-activated fly ash activated with
sodium silicate (Criado et al., 2012)
Figure 3.26 Effect of RH on compressive strength over curing time (Note: Method 1:
alkali-activated fly ash sealed in air-tight containers, RH: ~90%; Method 2: alkali-
activated fly ash exposed to the air in the cavity of thermal oven: RH: 40-50%)
Kovalchuk et al. (2007) studied the effect of curing method on the mechanical and
microstructural development of AAFA using sodium silicate as the activator. Figure 3.27
illustrates the relationship between the compressive strength and total porosity in the
hardened AAFA sample with three curing methods: 1) Drying Curing: 2 hours at 95oC + 6
hours at 150oC (without RH control); 2) Steam Curing: 8 hours at 95oC (RH: 100%); 3)
Curing in covered moulds: 8 hours at 95oC (RH>90%).

Chapter 3 Alkali-activated Fly Ash
73
It shows that the dry-cured AAFA gained the lowest compressive strength (30 MPa) due
to the evaporation of the water, while the AAFA cured in covered moulds gained the
highest strength of 105 MPa with the lowest porosity of 16%. Moreover, the Si/Al ratio of
AAFA cured in covered moulds was higher than that of AAFA by steam curing, which
could explain the higher strength of AAFA cured in covered moulds was contributed from
the Si-rich gel formed.
Figure 3.27 Effect of curing condition on the compressive strength and total porosity
[Note: Dry Curing (DC): 2h at 95oC + 6h at 150oC; Steam Curing (SC): 8h at 95oC; Curing
in covered moulds (CCM): 8h at 95oC] (Kovalchuk et al., 2007)
The above review suggests that, even though the reaction of AAFA is dominated by a
different reaction mechanism (i.e. polymerisation vs. hydration) (Provis and Deventer,
2009, Hewlett, 1998), similar to the accelerated curing in PC system, the control of
moisture during the accelerated curing process is still essential for strength and
microstructure development.
3.5.2 Microwave curing for manufacturing alkali-activated fly ash
3.5.2.1 Dielectric properties of alkali-activated fly ash
Microwave has also been attempted as an alternative to conventional thermal curing of
AAFA, due to its advantage of rapid volumetric heating. As discussed in Section 2.1.2.2,
the ability of a material to absorb microwaves and convert them to heat is dependent on
the dielectric properties of the raw material.
Jumrat et al. (2011) measured the dielectric constant of AAFA (mortar) activated by
sodium silicate over 24 hours after mixing (Figure 3.28). All AAFA mortars with various fly
ash to alkaline solution ratios (2.0/2.5) and sodium silicate to NaOH ratios (0.5/1.0/2.0)
showed high dielectric constants and loss factors, which indicates that there is potential
for microwave curing of AAFA products.

Chapter 3 Alkali-activated Fly Ash
74
Both dielectric constant and loss factor decreased over the time after mixing, which can
be explained by the reduced free water which was consumed in the geopolymerisation
process. Moreover, with lower fly ash to alkaline solution ratio, the water content in AAFA
mortar was higher, resulting in greater dielectric properties.
a. Dielectric constant
b. Loss factor
Figure 3.28 Variation of dielectric properties of alkali-activated fly ash mortar over time
after mixing (Note: measured at 28-29oC and 2.45 GHz) (Jumrat et al., 2011)
3.5.2.2 Microwave curing for manufacture of alkali-activated fly ash
The application of microwave curing on AAFA is rare. Somaratna et al. (2010) carried out
a pilot study to cure AAFA mortars (50×50×50mm) with a domestic microwave oven. With
a delay time of 12 hours, the mortars were cured with different curing durations at varying
percentages of full power level of 1200W (i.e. a pulsing regime was employed). The
compressive strength of the AAFA samples with microwave curing for 2 hours at
equivalent 240W was higher than that with thermal oven curing at 75oC for 48 hours,
indicating a good potential for use of microwave curing in manufacture of AAFA products.
However, it was noticed that high percentages of full microwave power (30%, 60% and
100%) caused severe cracks inside the sample, possibly due to the evaporation of water
and some local overheating caused by uneven temperature distribution inside the sample.
After microwave heating, the temperature difference between the core and the surface of

Chapter 3 Alkali-activated Fly Ash
75
the sample was found to be up to 35oC. Moreover, the temperature of the sample reached
140oC or even above 210oC during the microwave curing process, which would be
detrimental to the strength development and durability of AAFA (shown in Figure 3.29).
Another limitation in this study was that there was no humidity control throughout the
microwave curing process, which could also have affected the strength development.
Figure 3.29 Temperature distribution along the depth of the alkali-activated fly ash cube
(Somaratna et al., 2010)
Some preliminary work was carried out by Shi et al. (2012, 2014), who also applied a
domestic microwave oven with full power output of 850W to cure AAFA pastes
(25×25×25mm). Their results showed that AAFA samples cured in a microwave oven for
1 hour attained a higher early strength of 48.3 MPa than samples cured in a thermal oven
for 8 hours which only gained 41.8 MPa. The cross-sectional temperature of AAFA
samples after microwave curing was captured by infrared camera. The temperature at the
hottest spot was found to be over 120oC (Figure 3.30).
Figure 3.30 Thermal image of cross-section of alkali-activated fly ash samples after
microwave curing (Shi et al., 2014b)

Chapter 3 Alkali-activated Fly Ash
76
3.5.3 Discussion
As discussed in Section 2.3.3, the main problem associated with conventional thermal
curing is high energy consumption. The manufacture of AAFA faces the same issue. To
address this, alternative curing methods with lower energy consumption have to be
developed. In Chapter 2 (Section 2.4), some pilot research on using microwave as an
alternative low-energy curing technique for manufacturing PC products indicated that
compared to conventional thermal heating, microwave is an efficient and low-energy
heating source suitable for curing concrete products. However, the research and industrial
applications of microwave curing are still in their infancy. On the other hand, from the
above review on AAFA, it has become evident that, without thermal curing, the activation
of AAFA cannot be initiated, which makes the requirement for an alternative heating
source even more urgent for AAFA. Therefore, microwave curing seems to be a more
attractive solution for AAFA.
However, the review in Chapter 2 on some pilot studies using microwaves as an
alternative curing technique in manufacturing PC products clearly showed that without
accurate control of temperature and humidity, the strength and long-term performance of
concrete products can be adversely affected. Although the reaction mechanism of AAFA
is different from PC, the requirement for temperature and humidity control remains the
same. It also needs to be pointed out that the thermal curing of PC systems involves multi-
stage curing regimes, to accommodate the reactions of PC at different stages and enable
development of both the chemical and mechanical properties of concrete can be
developed without causing internal damages. This evidence supports formulation of the
research question articulated in Section 1.1. Unfortunately, as indicated in the previous
review, only very limited attempts have been made to explore the potential of using
microwaves to cure AAFA in the literature.
To address the research questions, some advanced and innovative approaches have
been taken in this research (Chapter 4) to develop a multi-stage microwave curing regime
for AAFA by taking advantage of the availability of a smart microwave system in the
Advanced and Innovative Materials (AIM) Group at University College London. The
properties and reaction products of AAFAs manufactured with this smart microwave
system were then characterised and compared with those achieved by the conventional
thermal curing method to examine the feasibility of this multi-stage microwave curing
technique for manufacturing AAFA products. Details of these are reported in Chapter 5-7
in this thesis.
Chapter 3 Alkali-activated Fly Ash
77
Challenges facing alkali-activated fly ash
The CO2 emission and energy consumption involved in the production of alkaline activator
and accelerated curing are important aspects of the sustainability of AAFA products.
The embodied carbon footprint (ECO2) of fly ash is 4kg CO2/kg and the ECO2 of NaOH is
0.629kg CO2/kg (Winnipeg, 2012). Compared to the amount of fly ash used in AAFA, the
amount of NaOH required is relatively small. Therefore, from the view of raw materials
used for producing NaOH activated AAFA, the CO2 saving is prominent. In addition,
according to the research of life-cycle studies, the estimation of CO2 savings by AAM
compared to PC ranges from 80% to 30% (Provis and Deventer, 2009). However, despite
energy savings compared to conventional thermal curing, microwave curing may also be
associated with significant energy consumption, which needs to be investigated.
Although there has been a lot of research on the AAFA in the past few decades, its
industrial application is rare. There are a few other issues that hinder the wide spread of
AAFA technology (Duxson et al., 2007b, van Deventer et al., 2012).
Safety issues related to the alkaline activator used
Heat released from the dissolution procedure and high corrosivity of the alkaline
NaOH solution are a potential source of harm to workers during mixing and handling
of the material (Provis and Deventer, 2009).
High curing temperature required
It is well known that NaOH activated AAFA normally requires thermal curing to obtain
desirable strength in a short period of time. Although this process can be seen as
similar to the accelerated curing process for manufacturing precast concrete products,
the curing temperature of 85oC is higher than that of PC-based products, normally
~65oC (ACI, 1980, Turkel and Alabas, 2005, Yazici et al., 2005).
Shortage of standard and guidance for the industry
To persuade the conservative industry to accept a new product, there are two main
issues to address. One is the establishment of standards specific to AAFA for
production and testing of the material. The other is a track record of the durability

Chapter 3 Alkali-activated Fly Ash
78
properties of this material in industrial application. Unfortunately, neither of these is
currently available.
Summary
Class F fly ash rich in aluminate and silicate components is usually selected as the
raw material for producing AAFA products.
The reaction mechanism of alkaline activation consists of two mains stages, namely,
dissolution of active aluminate and silicate components from raw fly ash under high
alkalinity, and gelation to form the reaction products, which are amorphous N-A-S-H
gel along with some minor zeolitic phases. Amorphous N-A-S-H gel exhibits a three-
dimensional framework of Si and Al tetrahedra bridged by oxygen atoms, in which Si
atom has a variety of Q4(mAl) environments. Al-rich gel (Gel 1) is first formed and is
then converted to Si-rich gel (Gel 2) as the reaction proceeds. The N-A-S-H gel is
primarily responsible for the mechanical strength of the AAFA.
It is difficult to characterise the N-A-S-H gel by a single characterisation technique
due to its amorphous nature. XRD can identify the new zeolitic phases formed in
AAFA, but is not able to characterise the amorphous phase. Although TGA can
provide useful information on the dehydration of N-A-S-H gel, it cannot analyse the
structure of the N-A-S-H gel formed. Among the techniques available, FTIR and NMR
are two valuable techniques for the characterisation of the N-S-A-H gel. FTIR can
identify the formation of N-A-S-H gel at molecular level, whilst NMR can provide
detailed structural information on the environments of SiO4 and AlO4 in N-A-S-H at
atomic level. The formation of N-A-S-H gel and the conversion of the Al-rich phase
to a Si-rich phase can be clearly identified by coupling these two techniques to obtain
a better understanding of the reaction mechanism of AAFA.
Due to the low reactivity of AAFA at ambient temperature, thermal curing is normally
employed to overcome the activation barrier of the polymerisation reaction and then
to further accelerate the activation reaction. The prevailing alkaline activator is 8M
NaOH solution and the commonly adopted curing regime is conventional thermal
oven curing at 85oC.
The main issue facing the conventional thermal curing of AAFA is its high energy
consumption which offsets other sustainable advantages that can be achieved by
using AAFA. To address this, alternative curing methods with lower energy

Chapter 3 Alkali-activated Fly Ash
79
consumption have to be developed. Microwave curing was identified as a promising
alternative to cure AAFA, but only very limited work has been carried out with
domestic ovens without an accurate control of temperature and humidity. To promote
the application of microwave curing in the manufacturing of AAFA, intelligent
microwave systems and curing regimes with accurate temperature and humidity
control, which are adapted to the unique chemical reaction mechanisms of AAFA,
still need to be developed.

Chapter 4 Experimental and Research Methods
80
Experimental and Research Methods
Introduction
A detailed experimental programme was designed and carried out in the following stages:
Stage 1 (Chapter 5): Development of an optimised multi-stage microwave curing regime
for manufacturing AAFA. At this stage, the factors contributing to the development of multi-
stage microwave curing regime identified in the literature review were explored in initial
trials. The effect of each factor on the multi-stage microwave curing was then
systematically studied through a central composite design. Finally the best multi-stage
microwave curing regime was identified by statistical modelling and related analysis.
Stage 2 (Chapter 6): Characterisation of AAFA manufactured with the newly developed
multi-stage microwave curing regime. The main focus of this stage was to characterise
the reaction products and microstructure of AAFA manufactured with the newly developed
multi-stage microwave curing regime. To explore the advantages and disadvantages of
the multi-stage microwave curing regime, the compressive strength, reaction products
and microstructure of microwave cured AAFA were also compared with those of AAFA
from conventional thermal curing.
Stage 3 (Chapter 7): Investigation of the effect of AAFA element size on the properties
of AAFA manufactured by multi-stage microwave curing regime, in relation to prospective
scale-up of the technology for commercial application. To address the possible concerns
from the industry on the penetration issues of microwave, the AAFA samples with different
sizes, namely, 25mm, 50mm and 100mm were cured with the multi-stage microwave
curing regime developed in Chapter 5 and compared with those cured in a thermal oven.
Raw materials and preparation of alkali-activated fly ash
4.2.1 Raw materials
In Section 3.2.1, it was confirmed that Class F fly ash is ideal for alkaline activation due
to it high content of silica and alumina. Fly ash supplied by Weihe coal power station
(Shaanxi, China) was used in this research. The chemical composition of the fly ash is
given in Table 4.1. It can be seen that the surface of fly ash particles are very smooth (as
shown in Figure 4.1).

Chapter 4 Experimental and Research Methods
81
Table 4.1 Major oxide composition of fly ash (wt/%)
Figure 4.1 SEM image of Class F fly ash from Weihe Power Plant, China
The particle size distribution of the fly ash is shown in Figure 4.2. The mean particle size
of the fly ash is 17.93 µm. The percentage of fly ash particle size less than 45 µm is
88.55%.
Figure 4.2 Particle size distribution of fly ash
Industrial grade NaOH with a purity of 95% was supplied by ReAgent, UK. As discussed
in Section 3.2.2, due to the high carbon footprint of sodium silicate, only NaOH solution
was used to manufacture AAFA. The concentration of NaOH solution used in this work
was 8M. Table 4.2 gives the proportion of NaOH and water for preparing 8M NaOH
solution.
SiO2 Al2O3 Fe2O3 CaO Na2O MgO K2O SO3 P2O5 TiO2 Other LOI
49.29 30.55 5.55 5.96 0.74 0.81 1.38 0.63 0.21 1.08 0.49 1.87

Chapter 4 Experimental and Research Methods
82
Table 4.2 NaOH solution
Concentration NaOH (g/L) H2O (g/L) Density (g/cm3)
8M 320* 940 1.26
* Molar mass of NaOH is 40g/mol.
The NaOH in solid was weighed and dissolved in water within a plastic beaker. A plastic
rod was used to stir the mixture until all the NaOH beads were dissolved thoroughly. The
NaOH solution was sealed to avoid CO2 absorption and left to cool to room temperature
and then transferred into a volumetric flask (1 Litre). The flask was topped up to the
calibration line, capped and inverted to ensure the solution uniformly mixed. Then the
solution was stored in a plastic container and placed in a dry and cool place. With the total
weight of NaOH solution, the water used for making one litre NaOH solution could be
calculated.
4.2.2 Preparation of alkali-activated fly ash samples
4.2.2.1 Mould
For microwave curing, the traditional three-gang steel mould is not suitable as steel under
microwave radiation will cause an electric arc. Microwave transparent material needed to
be investigated to meet the requirements for microwave curing. Polyether ether ketone
(PEEK) is an ideal material for making plastic moulds to be used in the microwave radiant
environment due to its high melting point at ~343oC. Custom-made PEEK moulds for this
research work are shown in Figure 4.3. There are three types of mould, i.e., one three-
gang mould (25mm), two individual moulds (50mm and 100mm), to investigate the effect
of size on accelerated curing.
a. 25mm b. 50mm c. 100mm
Figure 4.3 Plastic moulds fabricated for the microwave curing

Chapter 4 Experimental and Research Methods
83
4.2.2.2 Mixing and casting of alkali-activated fly ash paste
Mixing followed BS EN 196-3:2005+A1:2008 (BRE, 1983). The mix design for the AAFA
paste is given in Table 4.3. Based on the NaOH solution to fly ash (l/s) ratio, the dosage
of Na2O in mass was calculated, because the dosage of chemicals is always given in
mass rather than concentration in industrial application. The NaOH solution and the fly
ash were successively added into the mixing bowl. The Hobart mixer was turned on at
Speed 1 (low speed) for 90 seconds, then stopped for 30 seconds and switched on for
another 90 seconds. During the 30 seconds’ stop, the paste from the blade and the wall
of the bowl were scraped and added back to the paste in the bowl, ensuring that all the
materials were well distributed throughout the mixing process.
Table 4.3 Mix design of alkali-activated paste
* Liquid/solid ratio represents NaOH solution to fly ash ratio in weight.
After the mixing was completed, the moulds were filled with AAFA paste (steel for thermal
oven curing and PEEK for microwave curing), and vibrated on the vibrating table until all
the bubbles came out (approx. 5 minutes). Finally, the top of the paste in the mould was
smoothed by a palette knife.
Accelerated curing
4.3.1 Introduction
After mixing and casting, the fresh AAFA paste was subjected to accelerated curing,
namely, conventional thermal curing and microwave curing.
4.3.2 Temperature monitoring
4.3.2.1 Introduction
A microwave-compatible monitoring system is essential for the AAFA under microwave
curing. Optical fibre Bragg grating (FBG) temperature sensors were used as they are
immune to microwave radiation. A thermal camera was also used to capture the thermal
image of the cross section of the hardened AAFA samples immediately after the
Fly ash (g) 8M NaOH solution (g) Liquid/solid (l/s) ratio Na2O% of fly ash
100 33.00 0.33 6.47

Chapter 4 Experimental and Research Methods
84
microwave curing. Both these two techniques were also applied to the AAFA samples
cured in the thermal oven in order to compare these two curing techniques.
4.3.2.2 Optical fibre sensor
The principle of the FBG sensor was introduced in Section 2.4.3.2. Figure 4.4 illustrates
the configuration of the FBG sensor used in this project, which consisted of an optical fibre
(Figure 4.4a) with a custom-made housing manufactured of PEEK (Figure 4.4b). To
enable the transfer of temperature, a perforation was incorporated at the grating position
at the bottom of the PEEK housing.
a. Optic FBG sensor b. FBG sensor encased in PEEK housing
Figure 4.4 Configuration of FBG sensor
To monitor the temperature changes in the AAFA samples with three different sizes, the
sensors were custom-made according to a design developed by the Research Centre of
Photonics and Instrumentation at City University of London (Mokhtar et al., 2012), and
embedded at different positions of the sample as illustrated in Figure 4.5. In the 25mm
AAFA sample, an FBG sensor with one grating was applied to monitor the temperature
changes at the core of the sample. In the 50mm AAFA sample, an FBG sensor with three
gratings was used to measure the temperatures at the top, core and bottom (i.e., T1, T2
and T3). In the 100mm AAFA sample, an FBG sensor with five gratings was adopted to
measure the temperatures at five positions along the central axis of the sample (i.e., T1,
T2, T3, T4 and T5). This arrangement was made to measure the temperature difference
inside the sample with different sizes in Chapter 7.

Chapter 4 Experimental and Research Methods
85
Figure 4.5 Schematic diagram of three alkali-activated fly ash samples of different sizes with embedded FBG sensor
a. 25×25×25mm b. 50×50×50mm c. 100×100×100mm

Chapter 4 Experimental and Research Methods
86
To avoid the intrusion of AAFA paste, which may block the perforation, a
polytetrafluoroethylene (PTFE) sleeve (white part shown in Figure 4.6) was designed to
protect the sensor holder and the optic fibre. A simple test was carried out to see if the
PTFE sleeve would affect the sensitivity of the FBG sensor. Two FBG sensors were kept
in the water and heated in the microwave oven. One of the sensors was exposed to the
water directly, while the other one was protected with PTFE sleeve to avoid direct contact
from water.
a. Sensors with(out) PTFE sleeve b. Sensors in the water
Figure 4.6 Test of the effect of PTFE sleeve on the sensitivity of FBG sensor
The results of the test are shown in Figure 4.7. It can be seen that the temperature
difference between the two sensors is within 1.7oC, which is acceptable within the range
of experiment error.
Figure 4.7 Effect of PTFE sleeve on the temperature reading of the FBG sensor
4.3.2.3 Infrared camera
An infrared camera, FLIR E60bx (shown in Figure 4.8), was used to capture the thermal
image of the AAFA sample after accelerated curing. Immediately upon completion of the
microwave curing, the sample was split into two halves from the middle of the height and

Chapter 4 Experimental and Research Methods
87
the cross-sectional temperature distribution was obtained. The temperature range of the
thermal camera is from -20 to 140oC. The resolution of the thermal images is 320×240
pixels.
Figure 4.8 FLIR E60bx infrared camera
4.3.3 Conventional thermal curing
4.3.3.1 Electric oven
A conventional electric thermal oven was used to accelerate the strength development of
AAFA. The maximum power level of the thermal oven was 1000W (see Figure 4.9).
Figure 4.9 Conventional electric thermal oven

Chapter 4 Experimental and Research Methods
88
Figure 4.10 shows the power meter used for the conventional thermal oven with single
phase power supply to record the energy consumption for thermal oven curing. It was a
product by ENERGEiE with model number ENER007.
Figure 4.10 Power meter for electric thermal oven
4.3.3.2 Thermal curing control
Two curing regimes were employed for the AAFA samples under conventional thermal
oven curing.
24 hours at 85oC: this is the most popular curing regime reported in the literature.
In the current study, this regime was used as a control;
Duplication of the optimal multi-stage microwave curing regime established in
Chapter 5. The main purpose here was to identify the advantages and
disadvantages of microwave curing by comparing the properties of AAFA cured
in both curing systems under the same temperature history. The curing regime
used (as established in Chapter 5 from microwave curing) was: 35 minutes at
65oC + 35 minutes at 85oC + 35 minutes at 105oC + 85 minutes at 125oC.
To avoid moisture loss and provide a moist environment during thermal oven curing, the
fresh AAFA paste within the mould was wrapped with three layers of cling film and three
layers of saturated wet hessian, which were then sealed in plastic bags (Figure 4.11).
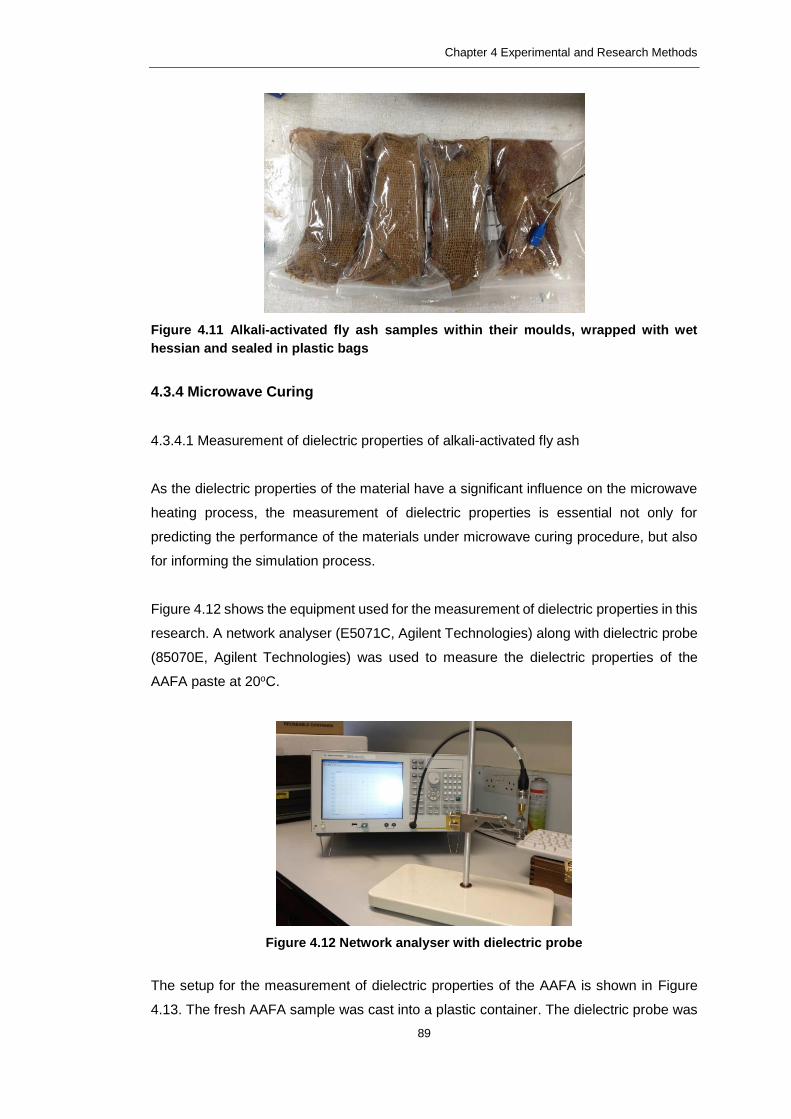
Chapter 4 Experimental and Research Methods
89
Figure 4.11 Alkali-activated fly ash samples within their moulds, wrapped with wet
hessian and sealed in plastic bags
4.3.4 Microwave Curing
4.3.4.1 Measurement of dielectric properties of alkali-activated fly ash
As the dielectric properties of the material have a significant influence on the microwave
heating process, the measurement of dielectric properties is essential not only for
predicting the performance of the materials under microwave curing procedure, but also
for informing the simulation process.
Figure 4.12 shows the equipment used for the measurement of dielectric properties in this
research. A network analyser (E5071C, Agilent Technologies) along with dielectric probe
(85070E, Agilent Technologies) was used to measure the dielectric properties of the
AAFA paste at 20oC.
Figure 4.12 Network analyser with dielectric probe
The setup for the measurement of dielectric properties of the AAFA is shown in Figure
4.13. The fresh AAFA sample was cast into a plastic container. The dielectric probe was

Chapter 4 Experimental and Research Methods
90
lowered to touch the sample. The support under the sample with a spring ensured that
the probe was in physical contact with the sample surface. The AAFA paste was tested
at 2.45 GHz to obtain values of dielectric constant (ε’) and loss factor (ε’’).
Figure 4.13 Setup for the measurement of dielectric properties of alkali-activated fly ash
4.3.4.2 Custom-made microwave oven
By contrast with previous research using uncontrolled domestic microwave ovens to cure
cement and concrete products, a custom-made microwave oven developed at UCL under
a TSB project (Project No: 20217-138255) was available for this research to implement
the microwave curing.
Figure 4.14 displays the setup of the custom-made microwave oven, including the four
main parts – a microwave oven, a temperature and a humidity FBG sensors, a humidifier
and a control system: the sensing interrogator provides the light source for the FBG
sensor and the control unit (interface box) allows communication between the computer
software and the microwave oven to achieve automatic control.
Figure 4.14 Custom-made microwave oven with variable power output and fully
controlled temperature profile

Chapter 4 Experimental and Research Methods
91
Figure 4.15 shows the custom-made MHTO350 microwave oven manufactured by
Industrial Microwave System Ltd, UK. The microwave power can be varied continuously
from 0 to 1000 W. The dimension of the microwave oven cavity is 350×350×215mm. In
the cavity of the microwave oven, there is a polypropylene (PP) turntable covered with a
mica sheet to reflect the microwaves. The turntable rotates clockwise and anticlockwise
to prevent the optic fibre from being twisted during the microwave curing process. A
humidifier (mist generator) next to the microwave oven was used to provide the moist
environment during microwave curing process. The mist was fed into the microwave cavity
via a choke on the side of the microwave oven, maintaining the humidity above 90%. It
has low power consumption with a maximum wattage of 25W.
Figure 4.15 Custom-made microwave oven with integrated sensor system and
humidifier
An OWL intuition power meter was used to record the electricity consumption of the
microwave oven with a three-phase power supply. The device is shown in Figure 4.16a,
in which part A is a network gateway connected to the Internet and part B is a transmitter
connected to the power supply of the microwave oven. The electricity consumption can
be read from the home page of OWL intuition (Figure 4.16b).

Chapter 4 Experimental and Research Methods
92
a. Power meter for microwave oven
(A: network gateway, B:transmitter)
b. Home dashboard of OWL intuition
Figure 4.16 Power meter for microwave oven
4.3.4.3 Placement of samples in the microwave oven
The fresh AAFA paste was cast into the PEEK moulds at ambient temperature before
curing in the MHTO350 microwave oven as shown in Figure 4.17. For the 25mm samples,
four three-gang moulds were cured in each batch. For the 50mm samples, four individual
moulds were cured in each batch. For the 100mm sample, one individual mould was cured.
It should be noted that the loading of the samples can affect the heat generated under
microwave curing. Therefore, when samples with different size were cured in microwave
oven, the sample loading has been kept consistent.
a. 25mm samples
(4 three-gang moulds)
b. 50mm samples
(4 individual moulds)
c. 100mm sample
(1 individual mould)
Figure 4.17 Alkali-activated fly ash cured in the custom-made microwave oven
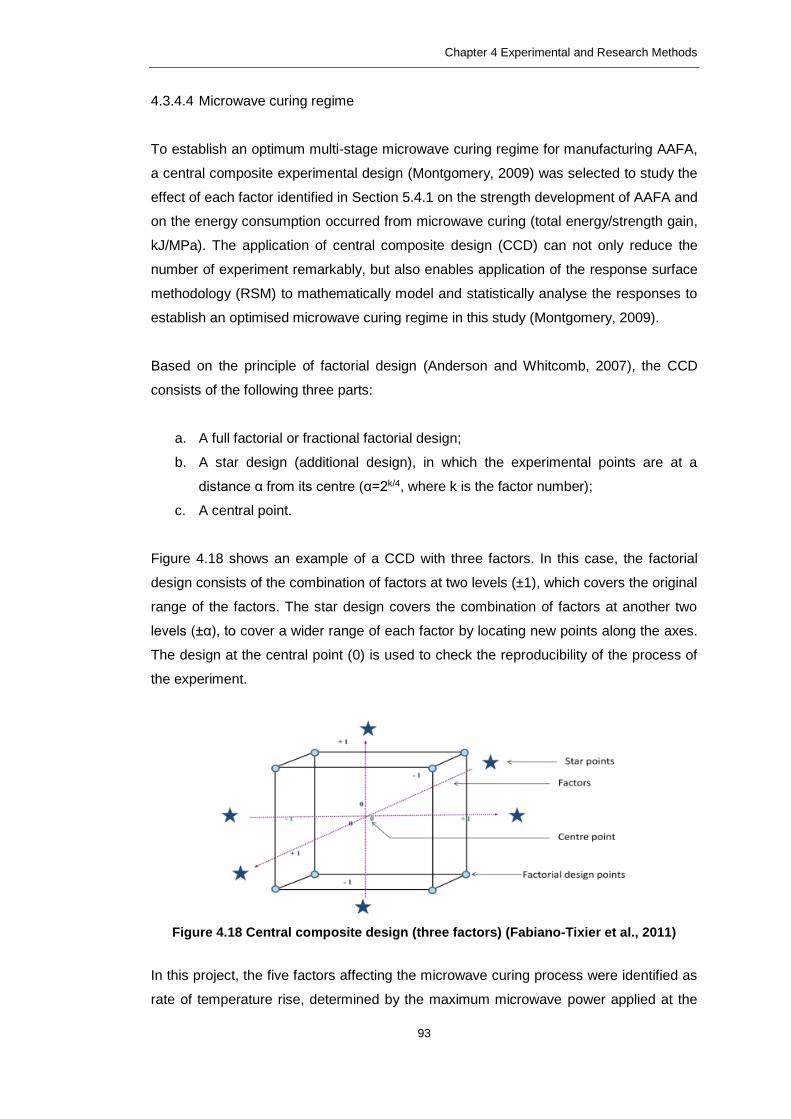
Chapter 4 Experimental and Research Methods
93
4.3.4.4 Microwave curing regime
To establish an optimum multi-stage microwave curing regime for manufacturing AAFA,
a central composite experimental design (Montgomery, 2009) was selected to study the
effect of each factor identified in Section 5.4.1 on the strength development of AAFA and
on the energy consumption occurred from microwave curing (total energy/strength gain,
kJ/MPa). The application of central composite design (CCD) can not only reduce the
number of experiment remarkably, but also enables application of the response surface
methodology (RSM) to mathematically model and statistically analyse the responses to
establish an optimised microwave curing regime in this study (Montgomery, 2009).
Based on the principle of factorial design (Anderson and Whitcomb, 2007), the CCD
consists of the following three parts:
a. A full factorial or fractional factorial design;
b. A star design (additional design), in which the experimental points are at a
distance α from its centre (α=2k/4, where k is the factor number);
c. A central point.
Figure 4.18 shows an example of a CCD with three factors. In this case, the factorial
design consists of the combination of factors at two levels (±1), which covers the original
range of the factors. The star design covers the combination of factors at another two
levels (±α), to cover a wider range of each factor by locating new points along the axes.
The design at the central point (0) is used to check the reproducibility of the process of
the experiment.
Figure 4.18 Central composite design (three factors) (Fabiano-Tixier et al., 2011)
In this project, the five factors affecting the microwave curing process were identified as
rate of temperature rise, determined by the maximum microwave power applied at the

Chapter 4 Experimental and Research Methods
94
temperature rising stage, Pmax, and curing durations at each temperature stage, t1, t2, t3
and t4. Based in this, a CCD experimental design of these five factors with five levels (0,
±1, ± α) was, thus, used to systematically study the effects of these parameters on the
multi-stage microwave curing regime (see Table 4.4).
Table 4.4 Summary of central composite design (5 factors and 5 levels)
Factors Unit
Levels
-α
(-2.378) -1 0 +1
+α
(+2.378)
Pmax W 150 400 575 750 1000
t1 min 0 35 60 85 120
t2 min 0 35 60 85 120
t3 min 0 35 60 85 120
t4 min 0 35 60 85 120
Pmax was tested at five levels with values ranging from 150W to 1000W. Table 4.5 shows
the rate of temperature rise achieved at different Pmax levels. The rate of temperature rise
at Pmax of 1000W was two-fold, three-fold, four-fold and five-fold as fast as that at Pmax of
750W, 575W, 400W and 150W respectively (as indicated in Table 4.5). The power output
can be controlled by presetting the upper limit of the power in LabVIEW to control the rate
of temperature rise, which will be further introduced in Section 4.3.4.5.
Table 4.5 Rate of temperature rise under different Pmaxs
Pmax (W) Rate of temperature rise (oC/min) Reciprocal
rate ratio 25-65oC 65-85oC 85-105oC 105-125oC
1000 10 6.7 10 2 1
750 5 3.3 5 1 2
575 3.3 2.2 3.3 0.7 3
400 2.5 1.7 2.5 0.5 4
150 2 1.3 2 0.4 5
The curing duration at each temperature step studied are: 0, 35, 60, 85 and 120 minutes
which has been determined by considering the logistical uses in the lab (i.e., maximum 8
hours available each day due to safety concerns) as well as the requirements of the CCD
design. In particularly, by using 0 minutes as a level, the effect of each temperature in the
overall multi-stage curing can be identified either through the experimental results or the
subsequent statistical analysis.

Chapter 4 Experimental and Research Methods
95
Based on Table 4.4, the statistical software Expert-Design 8 was employed to establish
the design matrix. The number of experiments is calculated as:
N=2k+2k+Cp (5.1)
where, k is the factor number (k=5 in the the current design), Cp is the replicate number
at the central point (8 times). The total number of experiments in this design matrix was
50.
Table 4.6 gives the coded design matrix consisting of 50 runs, which were carried out to
produce AAFA samples with various microwave curing regimes. In this matrix, the central
point was replicated eight times (in bold) to examine the experimental error and the
reproducibility of the data. The response variables for the 50 runs were the compressive
strength and the energy consumptions of AAFA samples.

Chapter 4 Experimental and Research Methods
96
Table 4.6 Design matrix (coded factor)
Run Pmax (W)
[Rate of temperature rise (oC/min)]
t1 (min) (65oC)
t2 (min) (85oC)
t3 (min) (105oC)
t4 (min) (125oC)
1 -1 -1 1 -1 -1 2 -1 1 1 -1 1 3 0 0 0 -2.378 0 4 0 0 0 0 0 5 0 0 2.378 0 0 6 1 1 -1 1 1 7 1 -1 -1 1 -1 8 0 0 0 0 2.378 9 1 -1 1 1 1
10 -1 -1 -1 1 -1 11 -1 1 1 1 1 12 1 -1 -1 1 1 13 1 1 -1 -1 -1 14 -1 -1 1 1 1 15 1.0 -1 1 -1 1 16 -2.378 0 0 0 0 17 0 0 0 0 -2.378 18 0 0 0 0 0 19 -1 1 -1 -1 -1
20 0 0 0 2.378 0 21 -1 1 -1 1 1 22 0 0 0 0 0 23 -1 -1 -1 -1 1 24 -1 -1 -1 1 1 25 0 0 -2.378 0 0 26 0 -2.378 0 0 0 27 -1 1 1 -1 -1 28 1 -1 -1 -1 1 29 1 1 1 -1 1 30 1 -1 1 1 -1 31 1 1 1 -1 -1 32 0 0 0 0 0 33 1 1 1 1 -1 34 -1 -1 1 1 -1 35 0 0 0 0 0 36 1 1 1 1 1 37 2.378 0 0 0 0 38 0 0 0 0 0 39 -1 1 -1 1 -1 40 -1 1 -1 -1 1 41 0 2.378 0 0 0 42 1 1 -1 1 -1 43 1 -1 -1 -1 -1 44 0 0 0 0 0 45 1 -1 1 -1 -1 46 0 0 0 0 0 47 1 1 -1 -1 1 48 -1 1 1 1 -1 49 -1 -1 -1 -1 -1 50 -1 -1 1 -1 1

Chapter 4 Experimental and Research Methods
97
4.3.4.5 Microwave curing control
Automatic control of the custom-made microwave oven was achieved by applying
Proportional-Integral-Derivative (PID) algorithm via LabVIEW software, Version 5.5
(NATIONAL INSTRUMENTS, 2013). Figure 4.19 shows the interface of PID Control loop
developed for controlling microwave curing process. Under this operating mode, the
power output can be controlled by presetting the upper limit of the power (Pmax), so
different rates of temperature rise can be achieved. Furthermore, within the set range, the
microwave power can be regulated to maintain the curing temperature (Tmax) based on
feedback from the FBG temperature sensor embedded in the sample. Accordingly, P and
I values were precautious selected to minimise the difference between a desired
temperature and a measured temperature.
Figure 4.19 The front panel for automatic control of microwave oven (LabVIEW)
4.3.5 Subsequent curing
Following the conventional thermal curing at 85oC and the multi-stage microwave curing,
samples were cooled down to room temperature naturally and then demoulded. Wrapped
with clean moist hessian and sealed in plastic bags (RH%>90%), the AAFA samples were
stored in a constant temperature room (20±1oC) until testing.

Chapter 4 Experimental and Research Methods
98
Analysis methods
4.4.1 Measurement of unconfined compressive strength
A compression test is used to determine the behaviour of materials under crushing loads
(Torrenti et al., 2010). In this research, the compressive strength of AAFA was tested two
hours after the conventional thermal and the microwave curing and at the 7 days and 28
days according to BS EN 12390 – 3: 2002.
The debris from the compression test was stored in acetone for three days to arrest further
reaction, and subsequently dried in a vacuum desiccator for another three days. For the
tests of XRD, TGA, FTIR and NMR, samples were ground into fine powder passing 63µm
sieve. For the analysis of MIP and SEM, the samples were dried in the thermal oven at
40oC for 24 hours without any further crushing to avoid damage to the microstructures.
4.4.2 Characterisation of reaction products
4.4.2.1 X-ray diffraction
Figure 4.20 shows a photo of the RICOH D-MAX/2200 used in this investigation. The XRD
patterns were obtained with CuKα radiation and running with 2θ in the range of 5o-70o at
a speed of 2o/min.
Figure 4.20 X-ray diffractometer

Chapter 4 Experimental and Research Methods
99
4.4.2.2 Thermogravimetry
The TG analysis was carried out using a NETZSCH TG 209 F1 Libra (Figure 4.21) TG
analyser. The samples were heated from 50 to 1000oC at a heating rate of 10oC/min,
during which the oven was purged with N2 at 20ml/min.
Figure 4.21 NETZSCH TG 209 F1 Libra
4.4.2.3 Fourier transform infrared spectroscopy
Figure 4.22 shows a photo of the Bruker ALPHA FTIR Spectrometer used in this research.
It works over the range of 4000cm-1 to 400cm-1 with a resolution of 4 cm-1.
Figure 4.22 Bruker ALPHA FTIR
4.4.2.4 Nuclear magnetic resonance spectroscopy
The 29Si NMR spectra of the powder samples were taken with an AscendTM-400 Bruker
spectrometer (Figure 4.23). The resonance frequency used in this study was 79.5 MHz,

Chapter 4 Experimental and Research Methods
100
with a spinning rate of 10 kHz. Spectra were obtained after irradiation of the sample with
a π/2 pulse (5 µs). All measurements were taken at room temperature with TMS
(tetramethylsilicane) as the external standard. Prior to the test, a magnet was used to
remove iron from the powdered sample because the iron limits the quality of the data
collected.
Figure 4.23 Bruker AscendTM-400 nuclear magnetic resonance spectrometer
4.4.3 Microstructure analysis
4.4.3.1 Mercury intrusion porosimetry
The pores distribution of the hardened AAFA samples was investigated by an AUTOPore
IV 9500 Micromeritics Instrument (Figure 4.24). The pressure running was from 0 to 413.7
MPa. The surface tension of mercury was 485 N/m and the contact angle was 130o.
Figure 4.24 AUTOPore IV 9500 Micromeritics Instrument

Chapter 4 Experimental and Research Methods
101
4.4.3.2 Scanning electron microscopy
In this thesis, a FEI Quanta200 SEM (Figure 4.25) was used to examine the morphology
of the hydration products. The specimens were coated with gold to improve the secondary
electron signal.
Figure 4.25 FEI Quanta200 scanning electron microscope

Chapter 5 Development of Multi-stage Microwave Curing Regime for Manufacturing AAFA
102
Development of Multi-stage Microwave Curing
Regime for Manufacturing Alkali-activated Fly Ash
Introduction
To facilitate the establishment of an optimum multi-stage microwave curing regime for
manufacturing alkali-activated fly ash (AAFA), an experimental design was applied in this
chapter to investigate the influence of rate of temperature rise, curing temperature and
curing duration on strength and energy consumption of the microwave cured AAFA. The
optimum microwave curing regime was then identified using a response surface
methodology (RSM). The effect of microwave curing on the long-term strength
development of the AAFA was also examined. In addition, AAFA was manufactured by
conventional thermal curing method to compare with that cured by microwave.
Aims and objectives
The aim of the research described in this chapter was to establish an optimised multi-
stage microwave curing regime for manufacturing AAFA. This was achieved through the
following objectives:
1) To identify the experimental factors to be considered in the development of a
multi-stage microwave curing regime, and to study the effect of the factors
identified in the literature review on multi-stage microwave curing through a central
composite design (CCD) experiment;
2) To optimise the multi-stage microwave curing regime using a response surface
methodology (RSM).
Temperature profile in alkali-activated fly ash cured by conventional
thermal oven
Before the proposed multi-stage microwave curing regime could be developed, it is
essential to identify the most suitable temperature to be used in control of the microwave
curing. Although different temperatures have been used in the literature to cure AAFA as
presented in the review in Chapter 3, it could be argued that curing AAFA at 85oC in
thermal oven is by far the most dominant regime reported in the literature (Palomo et al.,
1999, Fernandez-Jimenez and Palomo, 2005b). Therefore, it was decided to first
establish the temperature profile within AAFA sample cured at 85oC in a conventional

Chapter 5 Development of Multi-stage Microwave Curing Regime for Manufacturing AAFA
103
thermal oven (electric oven). In addition, the AAFA samples cured under this typical
thermal curing regime could be used for comparison with the samples cured under the
newly developed microwave curing regime.
To obtain the temperature profile inside the AAFA samples during the curing process and
also to ensure the monitoring technique used in the thermal oven curing could also be
applied in the microwave curing system, a FBG sensor was embedded in the AAFA
sample (25×25×25mm) (see Figure 4.5a). Another FBG sensor was directly exposed in
the cavity of the thermal oven in order to monitor the temperature change of the thermal
oven.
Figure 5.1 shows the temperature evolution within the AAFA sample under curing in the
thermal oven at 85oC for 24 hours, together with the temperature change in the cavity of
the thermal oven over the same period. The sample obtained from this curing regime was
named as O-85oC-24h (Note: the first letter ‘O’ stands for oven curing, 85oC the
temperature used and 24h the duration of the curing), and used to compare with samples
produced by microwave curing later in this chapter.
Figure 5.1 Temperature profile of O-85oC-24h under conventional thermal curing
Following the practice reported in the literature, the thermal oven was pre-heated to 85oC
before loading the samples. In Figure 5.1, a slight drop of the oven cavity temperature
from 85oC to 60oC can be noticed at time ‘0’ due to the heat loss from opening the oven
door. Within 2 hours, the temperature inside the AAFA sample was increased from the
ambient temperature of 22oC to the target curing temperature of 85oC, resulting in an
average rate of temperature rise of 31.5oC/hour (0.53oC/min). Curing in the thermal oven
was continued for 22 hours after the target curing temperature of 85oC was reached inside
the sample.

Chapter 5 Development of Multi-stage Microwave Curing Regime for Manufacturing AAFA
104
In Figure 5.1, the gradient of the temperature increase drops slightly after 65oC, which
was observed in three replicated samples. As discussed in Section 3.5.1.3, 65oC was
found to be the lower limit for initiating the alkaline activation (Palomo et al., 2004, Atis et
al., 2015). The current data supports that the previous finding may be valid.
Central composite experimental design for developing multi-stage
microwave curing regime
5.4.1 Preliminary study
Based on the review in Chapter 3, it has been identified that multi-stage curing regime is
widely employed for curing concrete products. To verify whether multi-stage curing
concept is also suitable for curing AAFA samples with microwave, three curing regimes
were initially proposed and attempted to cure the AAFA samples with microwave, which
are described as follows:
A. Four-stage curing regime combining the curing temperatures of 65oC, 85oC, 105oC
and 125oC with a total curing duration of 5 hours.
B. Three-stage curing regime combining the curing temperatures of 65oC, 85oC and
105oC with a total curing duration of 5 hours;
C. One-stage curing at 85oC for 8 hours;
There were four curing temperatures applied in the curing regimes given above, namely
65oC, 85oC, 105oC and 125oC. As discussed in Section 3.5.1.3, the lower limit for the
conventional thermal curing of AAFA is 65oC and the widely used curing temperature is
85oC. Moreover, it has been confirmed that increasing the curing temperature up to 105oC
is able to further increase the strength of AAFA cured by thermal oven (Atis et al., 2015).
In a previous study, the temperature of the AAFA samples cured in microwave reached
125oC, resulting in an increase of compressive strength (Shi et al., 2014b). Therefore,
Regime A and Regime B were established with multi-stage microwave curing, while
Regime C was cured at 85oC for 8 hours as a reference. After the three curing regimes
applied on the AAFA, temperature profiles of the samples obtained from experiments are
presented in Figure 5.2.

Chapter 5 Development of Multi-stage Microwave Curing Regime for Manufacturing AAFA
105
Figure 5.2 Initial multi-stage microwave curing regimes on alkali-activated fly ash
samples (data from experiments)
The three curing regimes and the corresponding compressive strengths of the AAFA after
microwave curing are summarised in Table 5.1. It can be clearly seen that the microwave
curing at 125oC enhanced the strength development of AAFA products. Although the
boiling point of 8M NaOH solution is 116oC (Vinnolit, 2011), the concerns about the boiling
of NaOH solution during microwave curing process could be neglected. This could be due
to the fact that before the temperature reached 125oC, most of the NaOH solution should
have reacted with fly ash and a hardened structure with sufficient strength has already
formed, while little amount of NaOH solution may stay in different pore structures. As a
consequence, the increase of curing temperature to 125oC should have little effect on the
structure of hardened AAFA.
Table 5.1 Initial multi-stage microwave curing regime vs strength gain of alkali-activated
fly ash
Curing
regime
Curing stage Total curing
duration (h)
Strength
(MPa) 65oC 85oC 105oC 125oC
A 5.0 41.13
B 5.0 24.20
C 8.0 26.62
5.4.2 Factors contributing to the multi-stage microwave curing regime
Similar to the multi-stage curing regime established in conventional curing, the factors
contributing to the establishment of the proposed multi-stage microwave curing regime
need to be identified first so that the experimental design can be carried out. Before these
factors were determined, the following issues were carefully considered:

Chapter 5 Development of Multi-stage Microwave Curing Regime for Manufacturing AAFA
106
1) Temperature: The literature review in Chapter 3 has indicated that 65oC is the
minimum temperature needed for the initiation of the activation reaction of AAFA and
this has also been verified by the temperature profile reported in Figure 5.1. On the
other hand, 85oC has been widely used for the activation of AAFA by thermal oven
curing. Other researchers also found that increasing the curing temperature up to
105oC and 125oC can further increase the strength of AAFA (Atis et al., 2015, Shi et
al., 2014a). Although, in the literature, only one of the above four temperatures was
used to cure AAFA samples, the preliminary trials carried out in this research (as
shown in Table 5.1) clearly indicated the combination of different temperatures in a
given curing regime can lead to higher strength gain and considerably shorter curing
duration, offering a good potential to develop a low-energy curing regime for curing
AAFA products. More importantly, by incorporating 125oC in the curing regime
showed significant increase of compressive strength. Therefore, these four
temperatures, namely, 65oC, 85oC, 105oC and 125oC, were selected initially as the
four temperature steps in the development of a multi-stage curing regime.
Coincidently, this also makes a uniformly distributed step with a fixed gap of 20oC.
2) Duration at each temperature step: Even though the strength of AAFA was
observed to be higher after a longer duration of thermal curing (as discussed in
Section 3.5.1.4), in practice, some logistical issues need to be considered. In an
industrial application, a short duration is always preferred because this can speed up
the turnover of the formwork and, hence, reduce the overall cost. On the other hand,
due to health and safety concerns, the custom-made microwave system in the
Advanced Materials Laboratory at UCL can only be switched on for a maximum of 8
consecutive hours. Therefore, the total duration of the microwave curing regime is
limited to 8 hours, including the duration at each temperature steps, and the time
needed to reach each temperature step. Further details about this have been given
in the central composite design in Section 4.3.4.4.
3) Rate of temperature rise: As discussed in Section 2.3.3.2, the rate of temperature
rise also plays an important role in the strength development of concrete products
under accelerated curing. In the current study, the rate of temperature rise was
controlled by adjusting the maximum output power (Pmax) of the microwave oven
based on the measured temperature of the sample. Further details about this have
been given in Section 4.3.4.4 and Section 4.3.4.5.
Based on the above considerations, a preliminary multi-stage microwave curing regime
was proposed (Figure 5.3). In this proposed regime, the AAFA sample is heated from
ambient temperature to 125oC at four temperature stages, each of which consists of a

Chapter 5 Development of Multi-stage Microwave Curing Regime for Manufacturing AAFA
107
temperature rise period and a curing period at any given temperature level. And t1, t2, t3
and t4 represent the curing durations at 65oC, 85oC, 105oC and 125oC respectively. After
microwave curing, the samples are cooled in the cavity of the microwave oven naturally.
However, the optimum curing duration was established through a systematic, statically
based experimental design as reported in the following sections.
Figure 5.3 Multi-stage microwave curing regime for manufacturing alkali-activated fly
ash
5.4.3 Central composite design and results
Table 5.2 shows the matrix of 50 runs with the levels of the five factors, and the responses.
The response variables for the 50 runs were the compressive strength in MPa and the
energy consumptions of AAFA samples (total energy consumed / strength gain) in kJ/MPa.

Chapter 5 Development of Multi-stage Microwave Curing Regime for Manufacturing AAFA
108
Table 5.2 Results of the actual design matrix
Run
Pmax (W)
Rate of temperature rise
[25-65oC/65-85 oC/85-105 oC /105-125 oC)
(oC/min)]
t1 (min)
(65oC)
t2 (min)
(85oC)
t3 (min)
(105oC)
t4 (min)
(125oC)
Total
heating
time
(minute)
Total
curing
duration
(hour)
Compressive
strength
(MPa)
Energy
consumption
(kJ/MPa)
1 400
[2.5 / 1.7 / 2.5 / 0.5] 35 85 35 35 76 4.4 33.3 41.5
2 400
[2.5 / 1.7 / 2.5 / 0.5] 85 85 35 85 76 6.1 36.1 47.7
3 575
[3.3 / 2.2 / 3.3 / 0.7] 60 60 0 60 57 4.0 31.9 38.7
4 575
[3.3 / 2.2 / 3.3 / 0.7] 60 60 60 60 57 5.0 29.4 54.1
5 575
[3.3 / 2.2 / 3.3 / 0.7] 60 120 60 60 57 6.0 33.1 57.8
6 750
[5 / 3.3 / 5 / 1] 85 35 85 85 38 5.5 33.7 46.0
7 750
[5 / 3.3 / 5 / 1] 35 35 85 35 38 3.8 29.7 50.5
8 575
[3.3 / 2.2 / 3.3 / 0.7] 60 60 60 120 57 6.0 41.8 40.6
9 750
[5 / 3.3 / 5 / 1] 35 85 85 85 38 5.5 34.3 51.2
10 400
[2.5 / 1.7 / 2.5 / 0.5] 35 35 85 35 76 4.4 31.1 47.1
11 400
[2.5 / 1.7 / 2.5 / 0.5] 85 85 85 85 76 6.9 40.9 44.8
12 750
[5 / 3.3 / 5 / 1] 35 35 85 85 38 4.6 32.5 44.2

Chapter 5 Development of Multi-stage Microwave Curing Regime for Manufacturing AAFA
109
Run
Pmax (W)
Rate of temperature rise
[25-65oC/65-85 oC/85-105 oC /105-125 oC)
(oC/min)]
t1 (min)
(65oC)
t2 (min)
(85oC)
t3 (min)
(105oC)
t4 (min)
(125oC)
Total
heating
time
(minute)
Total
curing
duration
(hour)
Compressive
strength
(MPa)
Energy
consumption
(kJ/MPa)
13 750
[5 / 3.3 / 5 / 1] 85 35 35 35 38 3.8 31.6 42.3
14 400
[2.5 / 1.7 / 2.5 / 0.5] 35 85 85 85 76 6.1 37.0 52.6
15 750
[5 / 3.3 / 5 / 1] 35 85 35 85 38 4.6 30.2 52.1
16 150
[2 / 1.3 / 2 / 0.4] 60 60 60 60 95 5.6 36.7 47.1
17 575
[3.3 / 2.2 / 3.3 / 0.7] 60 60 60 0 57 4.0 25.3 45.4
18 575
[3.3 / 2.2 / 3.3 / 0.7] 60 60 60 60 57 5.0 27.1 62.4
19 400
[2.5 / 1.7 / 2.5 / 0.5] 85 35 35 35 76 4.4 30.7 50.1
20 575
[3.3 / 2.2 / 3.3 / 0.7] 60 60 120 60 57 6.0 34.0 56.9
21 400
[2.5 / 1.7 / 2.5 / 0.5] 85 35 85 85 76 6.1 34.9 50.0
22 575
[3.3 / 2.2 / 3.3 / 0.7] 60 60 60 60 57 5.0 27.0 59.0
23 400
[2.5 / 1.7 / 2.5 / 0.5] 35 35 35 85 76 4.4 35.7 37.3
24 400
[2.5 / 1.7 / 2.5 / 0.5] 35 35 85 85 76 5.3 37.6 43.8
25 575
[3.3 / 2.2 / 3.3 / 0.7] 60 0 60 60 57 4.0 26.8 47.7

Chapter 5 Development of Multi-stage Microwave Curing Regime for Manufacturing AAFA
110
Run
Pmax (W)
Rate of temperature rise
[25-65oC/65-85 oC/85-105 oC /105-125 oC)
(oC/min)]
t1 (min)
(65oC)
t2 (min)
(85oC)
t3 (min)
(105oC)
t4 (min)
(125oC)
Total
heating
time
(minute)
Total
curing
duration
(hour)
Compressive
strength
(MPa)
Energy
consumption
(kJ/MPa)
26 575
[3.3 / 2.2 / 3.3 / 0.7] 0 60 60 60 57 4.0 33.2 42.8
27 400
[2.5 / 1.7 / 2.5 / 0.5] 85 85 35 35 76 5.3 27.7 55.0
28 750
[5 / 3.3 / 5 / 1] 35 35 35 85 38 3.8 32.2 41.9
29 750
[5 / 3.3 / 5 / 1] 85 85 35 85 38 5.5 31.6 58.4
30 750
[5 / 3.3 / 5 / 1] 35 85 85 35 38 4.6 31.0 49.6
31 750
[5 / 3.3 / 5 / 1] 85 85 35 35 38 4.6 25.8 52.0
32 575
[3.3 / 2.2 / 3.3 / 0.7] 60 60 60 60 57 5.0 36.1 47.1
33 750
[5 / 3.3 / 5 / 1] 85 85 85 35 38 5.5 29.3 57.8
34 400
[2.5 / 1.7 / 2.5 / 0.5] 35 85 85 35 76 5.3 28.9 61.4
35 575
[3.3 / 2.2 / 3.3 / 0.7] 60 60 60 60 57 5.0 29.0 56.8
36 750
[5 / 3.3 / 5 / 1] 85 85 85 85 38 6.3 36.0 52.5
37 1000
[10 / 6.7 / 10 / 2] 60 60 60 60 19 4.3 25.4 58.4
38 575
[3.3 / 2.2 / 3.3 / 0.7] 60 60 60 60 57 5.0 29.9 50.9

Chapter 5 Development of Multi-stage Microwave Curing Regime for Manufacturing AAFA
111
Run
Pmax (W)
Rate of temperature rise
[25-65oC/65-85 oC/85-105 oC /105-125 oC)
(oC/min)]
t1 (min)
(65oC)
t2 (min)
(85oC)
t3 (min)
(105oC)
t4 (min)
(125oC)
Total
heating
time
(minute)
Total
curing
duration
(hour)
Compressive
strength
(MPa)
Energy
consumption
(kJ/MPa)
39 400
[2.5 / 1.7 / 2.5 / 0.5] 85 35 85 35 76 5.3 33.2 51.0
40 400
[2.5 / 1.7 / 2.5 / 0.5] 85 35 35 85 76 5.3 37.1 44.8
41 575
[3.3 / 2.2 / 3.3 / 0.7] 120 60 60 60 57 6.0 36.2 52.3
42 750
[5 / 3.3 / 5 / 1] 85 35 85 35 38 4.6 31.7 48.1
43 750
[5 / 3.3 / 5 / 1] 35 35 35 35 38 3.0 31.8 31.7
44 575
[3.3 / 2.2 / 3.3 / 0.7] 60 60 60 60 57 5.0 26.3 63.9
45 750
[5 / 3.3 / 5 / 1] 35 85 35 35 38 3.8 29.8 39.4
46 575
[3.3 / 2.2 / 3.3 / 0.7] 60 60 60 60 57 5.0 36.4 42.9
47 750
[5 / 3.3 / 5 / 1] 85 35 35 85 38 4.6 28.8 54.0
48 400
[2.5 / 1.7 / 2.5 / 0.5] 85 85 85 35 76 6.1 33.1 55.1
49 400
[2.5 / 1.7 / 2.5 / 0.5] 35 35 35 35 76 3.6 27.9 40.8
50 400
[2.5 / 1.7 / 2.5 / 0.5] 35 85 35 85 76 5.3 34.5 49.9

Chapter 5 Development of Multi-stage Microwave Curing Regime for Manufacturing AAFA
112
Table 5.3 shows the mean value (σm), standard deviation (s) and coefficient of variation
(c) of the compressive strength obtained from the eight measurements at the central point
of the CCD (shown in italic in Table 5.2). The standard deviation was 3.8 MPa, which gave
a characteristic strength (calculated by: mean strength-1.64*standard deviation) of 24
MPa, indicating a 5% failure rate which is considered acceptable for most of the
construction materials. Regarding the coefficient of variation, the value was 12%, lower
than the typical value for concrete of 15% (BRE, 2011). Therefore, it can be concluded
that the process of the experiment is very precise.
Table 5.3 Analysis of the eight replicates of the compressive strength at the central
point
Item Sign Value
Mean value σm 30.2 MPa
Standard deviation S 3.8 MPa
Coefficient of variation c 12% (<15%)
Optimisation of the multi-stage microwave curing
5.5.1 Introduction
In the experimental design, 50 different microwave curing regimes were applied to cure
AAFA. Each microwave curing process along with the response variables of compressive
strength and energy consumption was called a run. To compare these runs, a technique
of statistical interference called hypothesis testing (significance testing) is used. The
results of a hypothesis test can be stated that the null hypothesis was or was not rejected
at a specified level of significance (Montgomery, 2009).
Based on the experimental data in Section 5.4.3, analysis of variance (ANOVA) and
response surface methodology (RSM) were applied to statistically analyse and
mathematically model the data. The significance of each factor was analysed, and the
relationship between the five factors (Pmax, t1, t2, t3 and t4) and the two responses
(compressive strength and energy consumption) was interpreted. Finally, the optimisation
of the microwave curing regime was achieved.
ANOVA uses F-tests to statistically test the equality of means. The F-statistic is simply a
ratio (F-value) of two variances. Variances are a measure of how far the data are scattered
from the mean. Under null hypothesis, F-value is approximate 1, so to reject the null
hypothesis, a high F-value is needed. F-value follows an F-distribution when the null
hypothesis is true. Under the assumption that the null hypothesis is true, the probability of

Chapter 5 Development of Multi-stage Microwave Curing Regime for Manufacturing AAFA
113
F-value is known as p-value, which is the smallest level of significance that would lead to
rejection of the null hypothesis. Therefore, a high F-value and a low p-value are favoured
to reject the null hypothesis. Adequate precision represents the signal to noise ratio (S/N)
which compares the range of predicted values at the design point to the average
prediction error. Ratio greater than 4.0 indicates that the model is adequate. R-squared
(R2) is used to measure how well the regression line approximates the real data. When
R2 is 1, it indicates the regression line fits the data perfectly (Montgomery, 2009, Anderson
and Whitcomb, 2007).
RSM uses mathematical models to investigate the influence of factors on responses,
which is usually presented graphically. The functional relationship found can resolve the
problem of optimisation (Bezerra et al., 2008).
5.5.2 Effects on the compressive strength after microwave curing
5.5.2.1 Analysis of variance for the response of compressive strength
ANOVA was performed on the compressive strength model (see Table 5.4), which turned
out to be a linear model. The model F-value of 9.73 and p-value of less than 0.0001
implied more than 99.99% confidence that the compressive strength was significantly
affected by one or more of the factors chosen from the model. The adequate precision of
11.724 was greater than 4.0, indicating the model was adequate (Montgomery, 2009).
With R2 of 0.5251, the factors explained 52.51% of the variability. The analysis of the
model showed that Pmax and t4 were significant model terms (p-value<0.005), which
means the rate of temperature rise and curing duration at 125oC are the two most
significant factors affecting the compressive strength of AAFA after microwave curing.
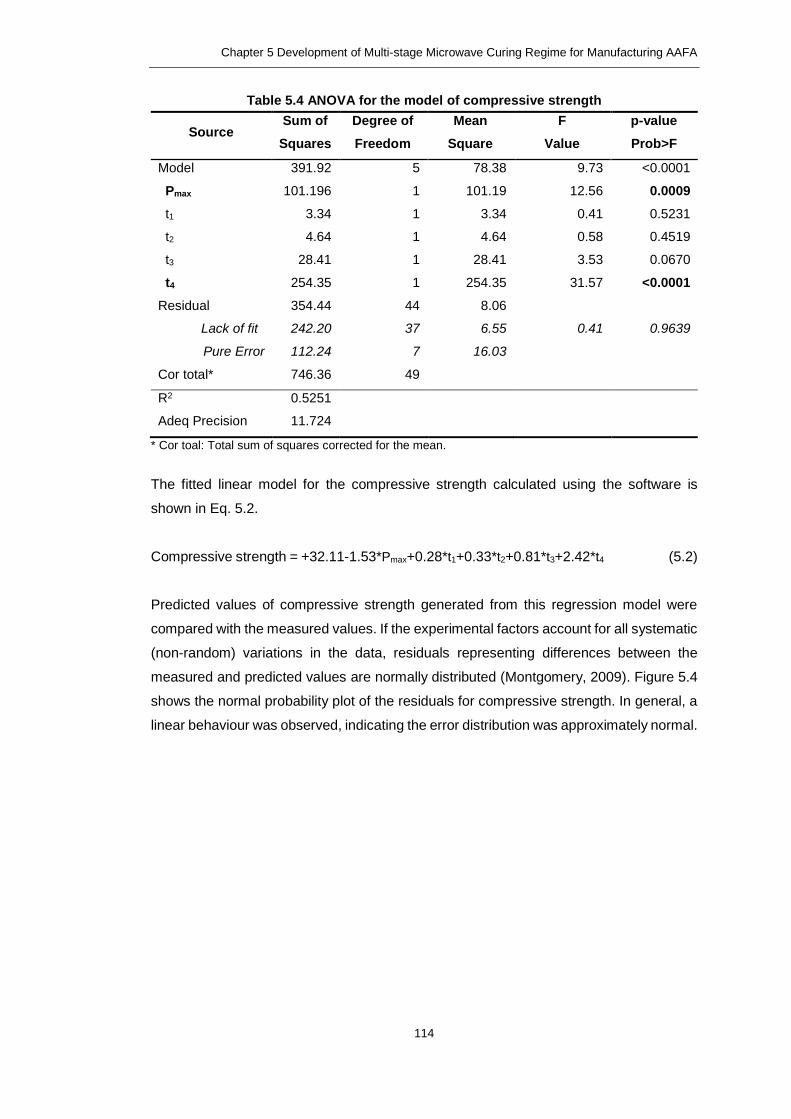
Chapter 5 Development of Multi-stage Microwave Curing Regime for Manufacturing AAFA
114
Table 5.4 ANOVA for the model of compressive strength
Source Sum of
Squares
Degree of
Freedom
Mean
Square
F
Value
p-value
Prob>F
Model 391.92 5 78.38 9.73 <0.0001
Pmax 101.196 1 101.19 12.56 0.0009
t1 3.34 1 3.34 0.41 0.5231
t2 4.64 1 4.64 0.58 0.4519
t3 28.41 1 28.41 3.53 0.0670
t4 254.35 1 254.35 31.57 <0.0001
Residual 354.44 44 8.06
Lack of fit 242.20 37 6.55 0.41 0.9639
Pure Error 112.24 7 16.03
Cor total* 746.36 49
R2 0.5251
Adeq Precision 11.724
* Cor toal: Total sum of squares corrected for the mean.
The fitted linear model for the compressive strength calculated using the software is
shown in Eq. 5.2.
Compressive strength = +32.11-1.53*Pmax+0.28*t1+0.33*t2+0.81*t3+2.42*t4 (5.2)
Predicted values of compressive strength generated from this regression model were
compared with the measured values. If the experimental factors account for all systematic
(non-random) variations in the data, residuals representing differences between the
measured and predicted values are normally distributed (Montgomery, 2009). Figure 5.4
shows the normal probability plot of the residuals for compressive strength. In general, a
linear behaviour was observed, indicating the error distribution was approximately normal.

Chapter 5 Development of Multi-stage Microwave Curing Regime for Manufacturing AAFA
115
Figure 5.4 Normal probability plot of residuals for compressive strength (MPa)
5.5.2.2 Effect of factors on the compressive strength
Figure 5.5 illustrates the effect of all the factors on the compressive strength of the AAFA
with microwave curing. Pmax and t4 are the two factors exerting the most significant
influence on the compressive strength. Higher Pmax increased the rate of temperature rise,
which hindered the strength development. Increasing the curing duration at 125oC (t4)
favoured the strength development.
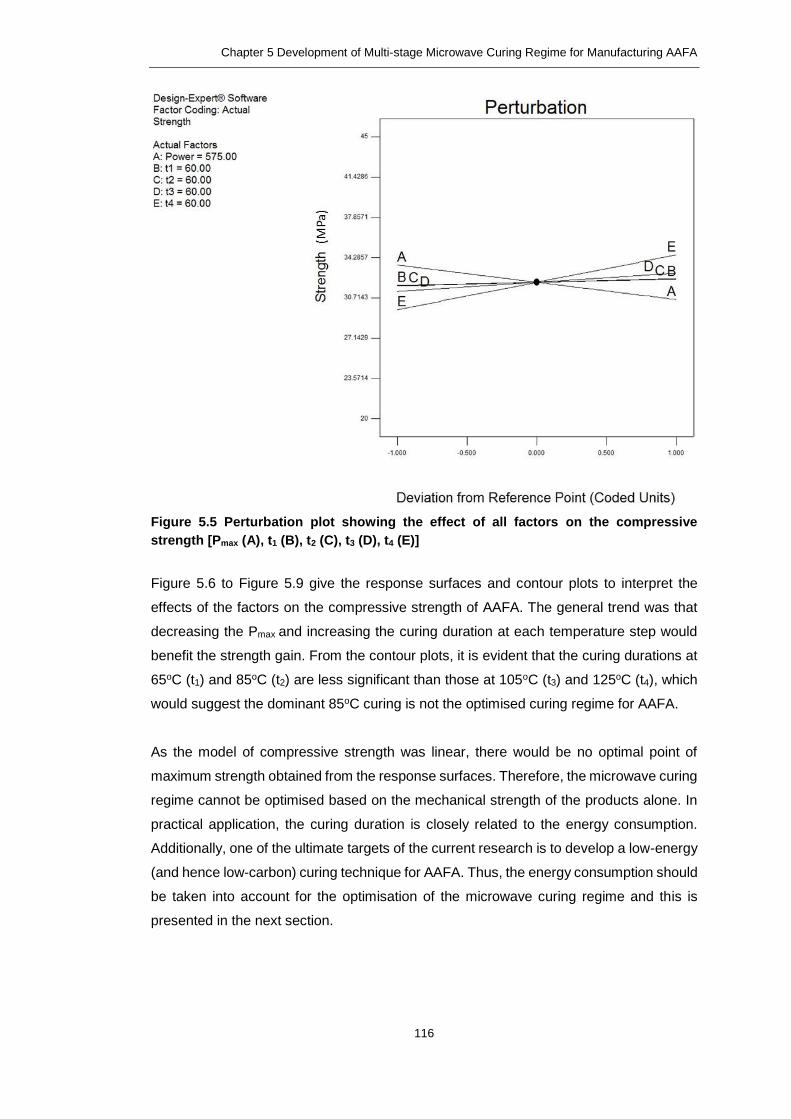
Chapter 5 Development of Multi-stage Microwave Curing Regime for Manufacturing AAFA
116
Figure 5.5 Perturbation plot showing the effect of all factors on the compressive
strength [Pmax (A), t1 (B), t2 (C), t3 (D), t4 (E)]
Figure 5.6 to Figure 5.9 give the response surfaces and contour plots to interpret the
effects of the factors on the compressive strength of AAFA. The general trend was that
decreasing the Pmax and increasing the curing duration at each temperature step would
benefit the strength gain. From the contour plots, it is evident that the curing durations at
65oC (t1) and 85oC (t2) are less significant than those at 105oC (t3) and 125oC (t4), which
would suggest the dominant 85oC curing is not the optimised curing regime for AAFA.
As the model of compressive strength was linear, there would be no optimal point of
maximum strength obtained from the response surfaces. Therefore, the microwave curing
regime cannot be optimised based on the mechanical strength of the products alone. In
practical application, the curing duration is closely related to the energy consumption.
Additionally, one of the ultimate targets of the current research is to develop a low-energy
(and hence low-carbon) curing technique for AAFA. Thus, the energy consumption should
be taken into account for the optimisation of the microwave curing regime and this is
presented in the next section.
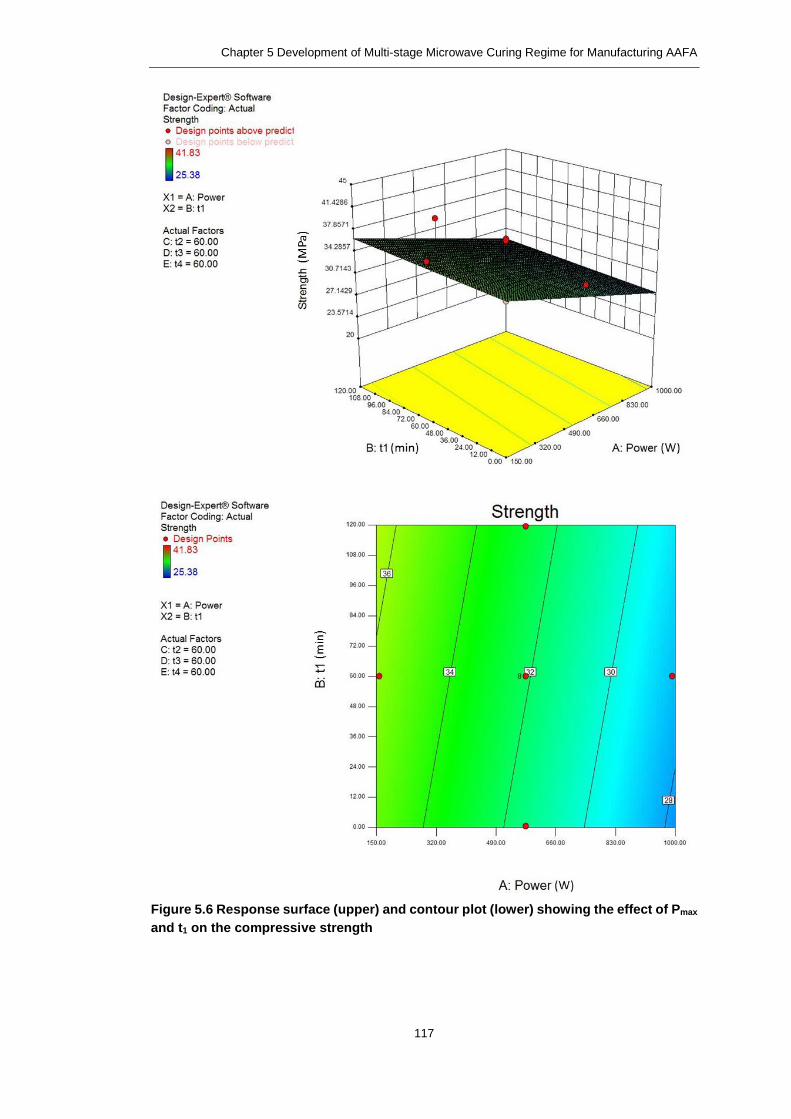
Chapter 5 Development of Multi-stage Microwave Curing Regime for Manufacturing AAFA
117
Figure 5.6 Response surface (upper) and contour plot (lower) showing the effect of Pmax
and t1 on the compressive strength

Chapter 5 Development of Multi-stage Microwave Curing Regime for Manufacturing AAFA
118
Figure 5.7 Response surface (upper) and contour plot (lower) showing the effect of Pmax
and t2 on the compressive strength (t1: 60min, t3: 60min, t4: 60min)

Chapter 5 Development of Multi-stage Microwave Curing Regime for Manufacturing AAFA
119
Figure 5.8 Response surface (upper) and contour plot (lower) showing the effect of Pmax
and t3 on the compressive strength (t1: 60min, t2: 60min, t4: 60min)

Chapter 5 Development of Multi-stage Microwave Curing Regime for Manufacturing AAFA
120
Figure 5.9 Response surface (upper) and contour plot (lower) showing the effect of Pmax
and t4 on the compressive strength (t1: 60min, t2: 60min, t3: 60min)
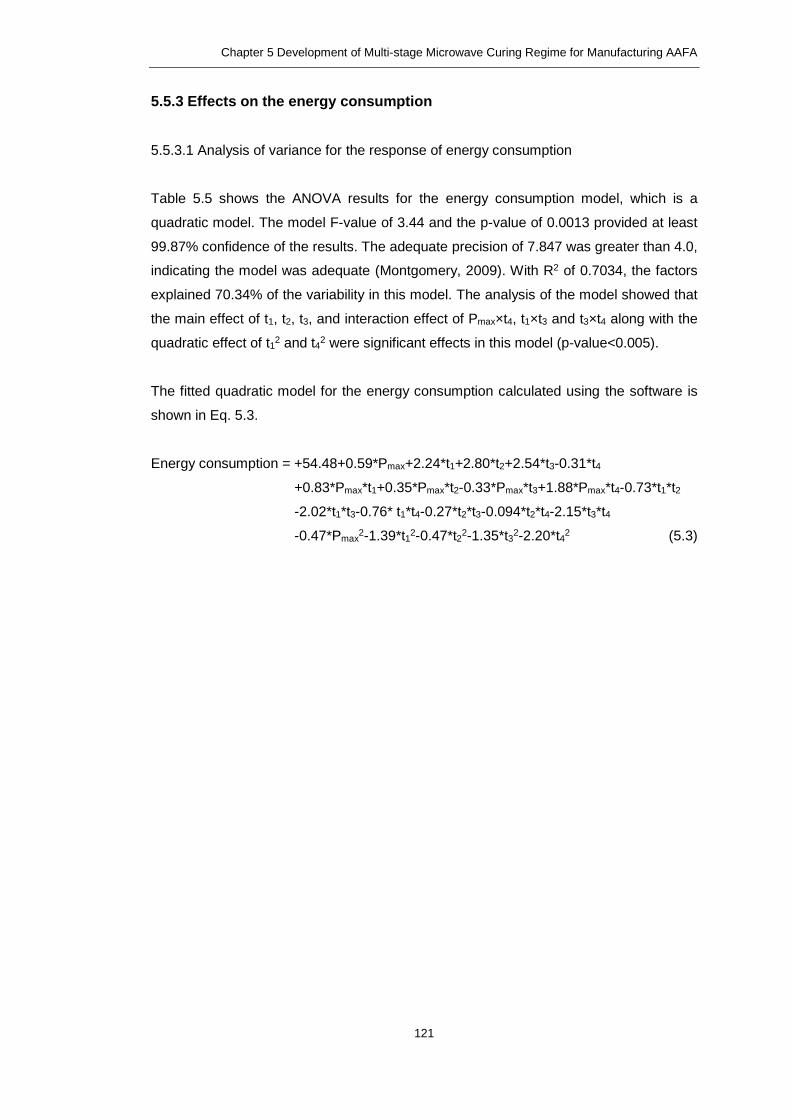
Chapter 5 Development of Multi-stage Microwave Curing Regime for Manufacturing AAFA
121
5.5.3 Effects on the energy consumption
5.5.3.1 Analysis of variance for the response of energy consumption
Table 5.5 shows the ANOVA results for the energy consumption model, which is a
quadratic model. The model F-value of 3.44 and the p-value of 0.0013 provided at least
99.87% confidence of the results. The adequate precision of 7.847 was greater than 4.0,
indicating the model was adequate (Montgomery, 2009). With R2 of 0.7034, the factors
explained 70.34% of the variability in this model. The analysis of the model showed that
the main effect of t1, t2, t3, and interaction effect of Pmax×t4, t1×t3 and t3×t4 along with the
quadratic effect of t12 and t42 were significant effects in this model (p-value<0.005).
The fitted quadratic model for the energy consumption calculated using the software is
shown in Eq. 5.3.
Energy consumption = +54.48+0.59*Pmax+2.24*t1+2.80*t2+2.54*t3-0.31*t4
+0.83*Pmax*t1+0.35*Pmax*t2-0.33*Pmax*t3+1.88*Pmax*t4-0.73*t1*t2
-2.02*t1*t3-0.76* t1*t4-0.27*t2*t3-0.094*t2*t4-2.15*t3*t4
-0.47*Pmax2-1.39*t12-0.47*t22-1.35*t32-2.20*t42 (5.3)
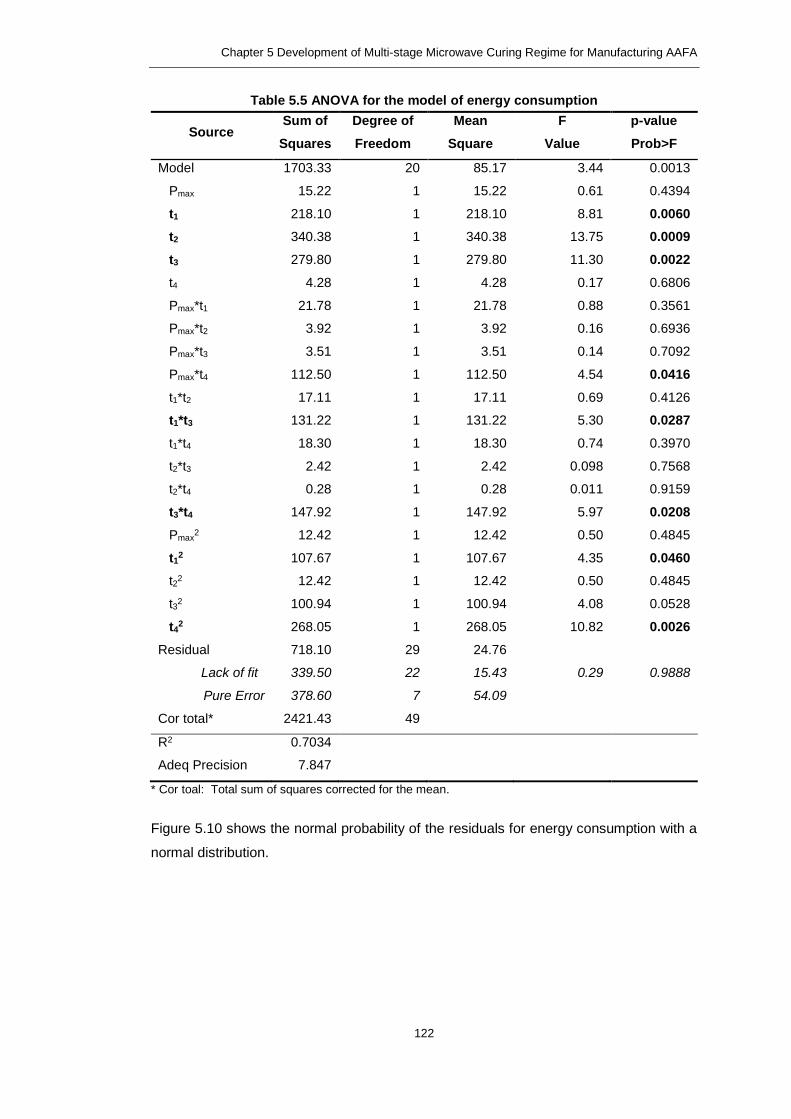
Chapter 5 Development of Multi-stage Microwave Curing Regime for Manufacturing AAFA
122
Table 5.5 ANOVA for the model of energy consumption
Source Sum of
Squares
Degree of
Freedom
Mean
Square
F
Value
p-value
Prob>F
Model 1703.33 20 85.17 3.44 0.0013
Pmax 15.22 1 15.22 0.61 0.4394
t1 218.10 1 218.10 8.81 0.0060
t2 340.38 1 340.38 13.75 0.0009
t3 279.80 1 279.80 11.30 0.0022
t4 4.28 1 4.28 0.17 0.6806
Pmax*t1 21.78 1 21.78 0.88 0.3561
Pmax*t2 3.92 1 3.92 0.16 0.6936
Pmax*t3 3.51 1 3.51 0.14 0.7092
Pmax*t4 112.50 1 112.50 4.54 0.0416
t1*t2 17.11 1 17.11 0.69 0.4126
t1*t3 131.22 1 131.22 5.30 0.0287
t1*t4 18.30 1 18.30 0.74 0.3970
t2*t3 2.42 1 2.42 0.098 0.7568
t2*t4 0.28 1 0.28 0.011 0.9159
t3*t4 147.92 1 147.92 5.97 0.0208
Pmax2 12.42 1 12.42 0.50 0.4845
t12 107.67 1 107.67 4.35 0.0460
t22 12.42 1 12.42 0.50 0.4845
t32 100.94 1 100.94 4.08 0.0528
t42 268.05 1 268.05 10.82 0.0026
Residual 718.10 29 24.76
Lack of fit 339.50 22 15.43 0.29 0.9888
Pure Error 378.60 7 54.09
Cor total* 2421.43 49
R2 0.7034
Adeq Precision 7.847
* Cor toal: Total sum of squares corrected for the mean.
Figure 5.10 shows the normal probability of the residuals for energy consumption with a
normal distribution.
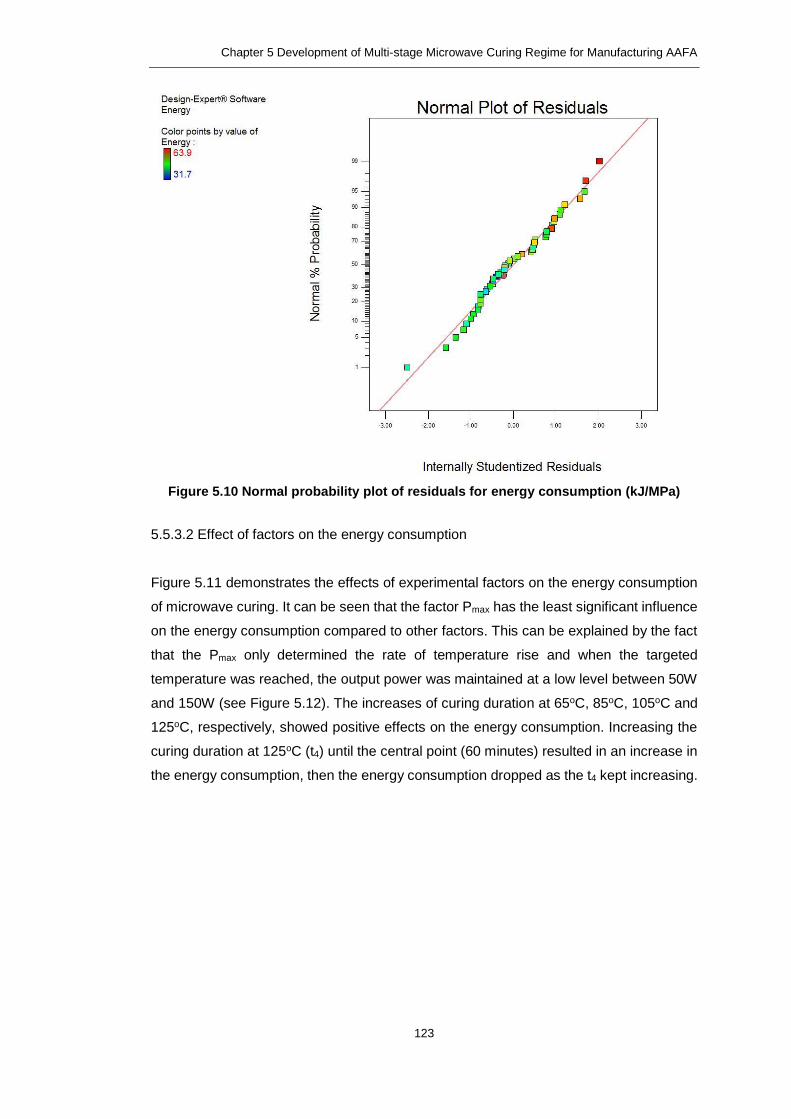
Chapter 5 Development of Multi-stage Microwave Curing Regime for Manufacturing AAFA
123
Figure 5.10 Normal probability plot of residuals for energy consumption (kJ/MPa)
5.5.3.2 Effect of factors on the energy consumption
Figure 5.11 demonstrates the effects of experimental factors on the energy consumption
of microwave curing. It can be seen that the factor Pmax has the least significant influence
on the energy consumption compared to other factors. This can be explained by the fact
that the Pmax only determined the rate of temperature rise and when the targeted
temperature was reached, the output power was maintained at a low level between 50W
and 150W (see Figure 5.12). The increases of curing duration at 65oC, 85oC, 105oC and
125oC, respectively, showed positive effects on the energy consumption. Increasing the
curing duration at 125oC (t4) until the central point (60 minutes) resulted in an increase in
the energy consumption, then the energy consumption dropped as the t4 kept increasing.

Chapter 5 Development of Multi-stage Microwave Curing Regime for Manufacturing AAFA
124
Figure 5.11 Perturbation plot showing the effects of all factors on the energy
consumption [Pmax (A), t1 (B), t2 (C), t3 (D), t4 (E)]

Chapter 5 Development of Multi-stage Microwave Curing Regime for Manufacturing AAFA
125
a. Run No.16 (Pmax: 150W, t1: 60min, t2: 60min, t3: 60min, t4:60min)
b. Run No.46 (Pmax: 575W, t1: 60min, t2: 60min, t3: 60min, t4: 60min)
c. Run No.37 (Pmax: 1000W, t1: 60min, t2: 60min, t3: 60min, t4: 60min)
Figure 5.12 Power and temperature profiles of three runs from the design matrix

Chapter 5 Development of Multi-stage Microwave Curing Regime for Manufacturing AAFA
126
Figure 5.13 to Figure 5.15 give the response surfaces and contour plots to interpret the
effects of factors on the energy consumption of microwave curing.
In terms of the interaction effect of Pmax×t4, it is evident that the energy consumption can
be reduced by two paths (see Figure 5.13): (1) low Pmax and long t4; (2) high Pmax and short
t4. Regarding the first path, the experimental results show a lower limit of 150W for the
Pmax required to raise the temperature from 105oC to 125oC. However, as discussed in
5.3.1.2, high Pmax is unfavourable to the strength development and thus the first path is
preferred.
With regard to the interaction effect of t1×t3, Figure 5.14 shows that simultaneous
reduction of the curing durations at 65oC (t1) and 105oC (t3) to the minimum level would
lead to the lowest energy consumption. However, as discussed in Section 5.2.1.1, 65oC
is the lowest limit of curing temperature for the initiation of the alkaline activation, which
should be taken into consideration in real practice. Regarding the interaction effect of t3×t4,
a similar trend is found in Figure 5.15; a decrease in the energy consumption could also
result from shortening the curing durations at 105oC (t3) and 125oC (t4).

Chapter 5 Development of Multi-stage Microwave Curing Regime for Manufacturing AAFA
127
Figure 5.13 Response surface (upper) and contour plot (lower) showing the effect of
Pmax and t4 on the energy consumption (t1: 60min, t2: 60min, t3: 60min)

Chapter 5 Development of Multi-stage Microwave Curing Regime for Manufacturing AAFA
128
Figure 5.14 Response surface (upper) and contour plot (lower) showing the effect of t1
and t3 on the energy consumption (Pmax: 575W, t2: 60min, t4: 60min)

Chapter 5 Development of Multi-stage Microwave Curing Regime for Manufacturing AAFA
129
Figure 5.15 Response surface (upper) and contour plot (lower) showing the effect of t3
and t4 on the energy consumption (Pmax: 575W, t1: 60min, t2: 60min)

Chapter 5 Development of Multi-stage Microwave Curing Regime for Manufacturing AAFA
130
5.5.4 Optimisation of the multi-stage microwave curing regime
5.5.4.1 Desirability method
Multi-response optimisation was conducted for high strength gain and low energy
consumption using the desirability method (Montgomery, 2009). The desirability functions
are shown in Eq. 5.4 to Eq. 5.6. The approach allows the conversion of each estimated
response, y, into a unitless utility bounded by 0<d<1, where a higher d value indicates
that response value y is more desirable. If d=0 this means a completely undesired
response (Benyounis et al., 2008, Bezerra et al., 2008, Montgomery, 2009).
If the goal is the maximum value, the desirability is defined as follow;
𝑑 = {
0 𝑦 < 𝐿
(𝑦−𝐿
𝑇−𝐿)𝑟 𝐿 ≤ 𝑦 ≤ 𝑇
1 𝑦 > 𝑇
(5.4)
If the goal is the minimum value, the desirability is defined as follow;
𝑑 = {
1 𝑦 < 𝑇
(𝑈−𝑦
𝑈−𝑇)𝑟 𝑇 ≤ 𝑦 ≤ 𝑈
0 𝑦 > 𝑈
(5.5)
If the goal is in range, the desirability is defined as follow;
𝑑 =
{
0 𝑦 < 𝐿
(𝑦−𝐿
𝑇−𝐿)𝑟1 𝐿 ≤ 𝑦 ≤ 𝑇
(𝑈−𝑦
𝑈−𝑇)𝑟2 𝑇 ≤ 𝑦 ≤ 𝑈
0 𝑦 > 𝑈
(5.6)
where, T is the target, L is the lower limit, U is the upper limit, r is the weight.
5.5.4.2 Optimisation of microwave curing regime
In this case, the goal was to obtain maximum compressive strength and lowest energy
consumption with a relatively short curing duration at an appropriate maximum power level.
The weight (r) value was set as one, which means the desirability function was linear.
Table 5.6 shows the parameter constraints and the responses corresponding to the
optimised microwave curing regime given by the software. The desirability was 0.66 and
the optimum values of the five parameters were Pmax of 400W, t1 of 35 minutes, t2 of 35
minutes, t3 of 35 minutes and t4 of 85 minutes.
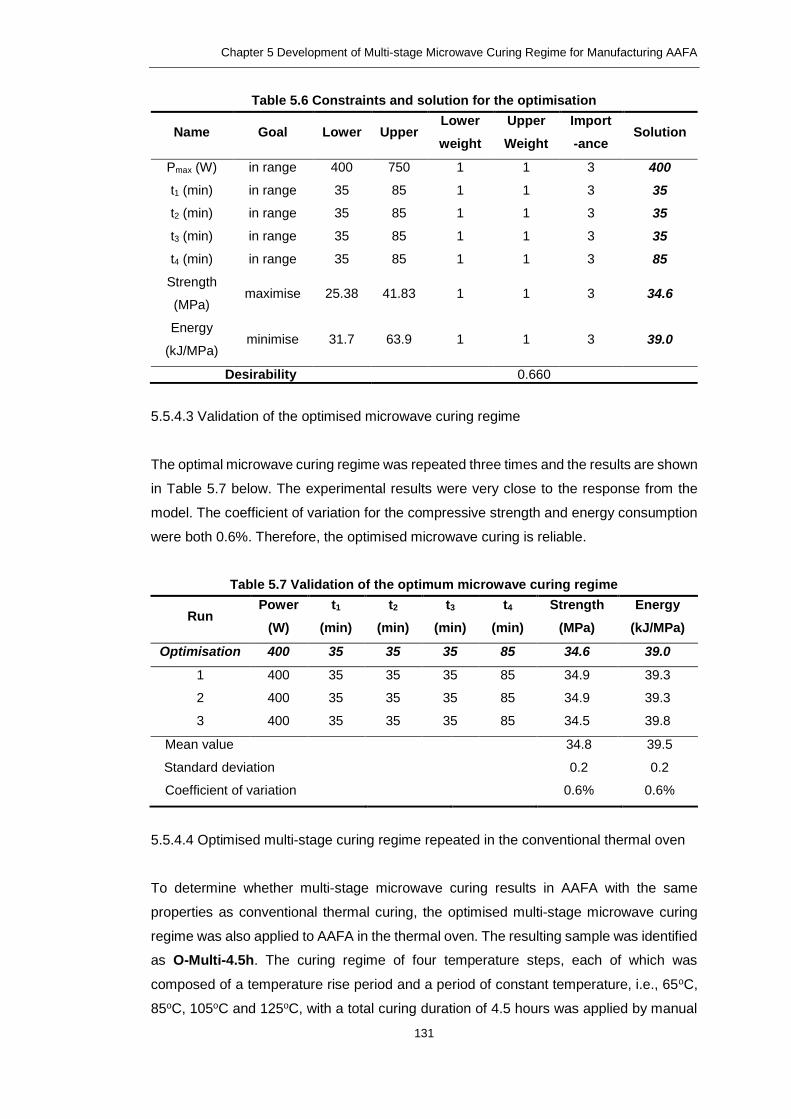
Chapter 5 Development of Multi-stage Microwave Curing Regime for Manufacturing AAFA
131
Table 5.6 Constraints and solution for the optimisation
Name Goal Lower Upper Lower
weight
Upper
Weight
Import
-ance Solution
Pmax (W) in range 400 750 1 1 3 400
t1 (min) in range 35 85 1 1 3 35
t2 (min) in range 35 85 1 1 3 35
t3 (min) in range 35 85 1 1 3 35
t4 (min) in range 35 85 1 1 3 85
Strength
(MPa) maximise 25.38 41.83 1 1 3 34.6
Energy
(kJ/MPa) minimise 31.7 63.9 1 1 3 39.0
Desirability 0.660
5.5.4.3 Validation of the optimised microwave curing regime
The optimal microwave curing regime was repeated three times and the results are shown
in Table 5.7 below. The experimental results were very close to the response from the
model. The coefficient of variation for the compressive strength and energy consumption
were both 0.6%. Therefore, the optimised microwave curing is reliable.
Table 5.7 Validation of the optimum microwave curing regime
Run Power
(W)
t1
(min)
t2
(min)
t3
(min)
t4
(min)
Strength
(MPa)
Energy
(kJ/MPa)
Optimisation 400 35 35 35 85 34.6 39.0
1 400 35 35 35 85 34.9 39.3
2 400 35 35 35 85 34.9 39.3
3 400 35 35 35 85 34.5 39.8
Mean value 34.8 39.5
Standard deviation
0.2 0.2
Coefficient of variation
0.6% 0.6%
5.5.4.4 Optimised multi-stage curing regime repeated in the conventional thermal oven
To determine whether multi-stage microwave curing results in AAFA with the same
properties as conventional thermal curing, the optimised multi-stage microwave curing
regime was also applied to AAFA in the thermal oven. The resulting sample was identified
as O-Multi-4.5h. The curing regime of four temperature steps, each of which was
composed of a temperature rise period and a period of constant temperature, i.e., 65oC,
85oC, 105oC and 125oC, with a total curing duration of 4.5 hours was applied by manual

Chapter 5 Development of Multi-stage Microwave Curing Regime for Manufacturing AAFA
132
control of the temperature of thermal oven based on the temperature in the oven chamber.
Figure 5.16 shows the temperature profile of “O-Multi-4.5h” with the temperature inside
the thermal oven chamber. It can be seen that the regime was not as accurate as that in
microwave oven. This also caused the difference in the temperature actually achieved
inside the samples (as indicated in Figure 5.16)
Figure 5.16 Temperature profile of O-Multi-4.5h under conventional thermal curing
(Duplication of the optimum microwave curing regime)
Comparison of strength development and energy consumption of
two curing methods
5.6.1 Selection of alkali-activated fly ash samples
Strength development and energy consumption of AAFA with conventional thermal curing
and multi-stage microwave curing were compared using four samples from the CCD
experiment:
The sample gained the highest compressive strength from Run No.8 in the design matrix
is now renamed as M-Multi-6h, and the sample cured by the optimised microwave curing
regime is renamed as M-Multi-4.5h, the curing regime of which is identical to that of Run
No.23 in the design matrix. They were compared with sample “O-85oC-24h” from Section
5.3.1 and sample “O-Multi-4.5h” from Section 5.3.4.4 with conventional thermal curing.
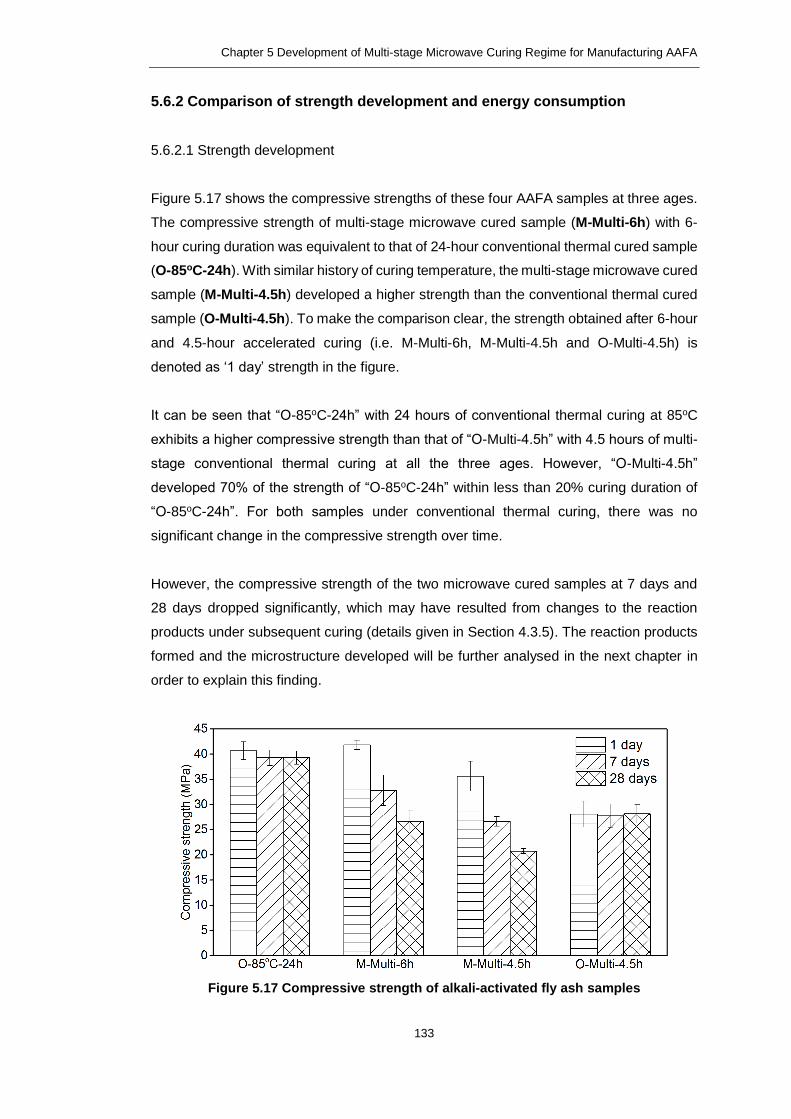
Chapter 5 Development of Multi-stage Microwave Curing Regime for Manufacturing AAFA
133
5.6.2 Comparison of strength development and energy consumption
5.6.2.1 Strength development
Figure 5.17 shows the compressive strengths of these four AAFA samples at three ages.
The compressive strength of multi-stage microwave cured sample (M-Multi-6h) with 6-
hour curing duration was equivalent to that of 24-hour conventional thermal cured sample
(O-85oC-24h). With similar history of curing temperature, the multi-stage microwave cured
sample (M-Multi-4.5h) developed a higher strength than the conventional thermal cured
sample (O-Multi-4.5h). To make the comparison clear, the strength obtained after 6-hour
and 4.5-hour accelerated curing (i.e. M-Multi-6h, M-Multi-4.5h and O-Multi-4.5h) is
denoted as ‘1 day’ strength in the figure.
It can be seen that “O-85oC-24h” with 24 hours of conventional thermal curing at 85oC
exhibits a higher compressive strength than that of “O-Multi-4.5h” with 4.5 hours of multi-
stage conventional thermal curing at all the three ages. However, “O-Multi-4.5h”
developed 70% of the strength of “O-85oC-24h” within less than 20% curing duration of
“O-85oC-24h”. For both samples under conventional thermal curing, there was no
significant change in the compressive strength over time.
However, the compressive strength of the two microwave cured samples at 7 days and
28 days dropped significantly, which may have resulted from changes to the reaction
products under subsequent curing (details given in Section 4.3.5). The reaction products
formed and the microstructure developed will be further analysed in the next chapter in
order to explain this finding.
Figure 5.17 Compressive strength of alkali-activated fly ash samples

Chapter 5 Development of Multi-stage Microwave Curing Regime for Manufacturing AAFA
134
5.6.2.2 Energy consumption
Table 5.8 shows the energy consumption of the AAFA samples cured by the conventional
thermal and microwave methods. It is evident that microwave curing consumed much less
energy than the conventional thermal oven curing. In particular, under same curing
duration, “M-Multi-4.5h” resulted in a 42% lower energy consumption per strength gained
(kJ/MPa) compared to “O-Multi-4.5h”.
Table 5.8 Energy consumption of alkali-activated fly ash with two curing methods
(calculation based on the data from power meter)
Sample Curing method
Curing
duration
(hour)
Total
EC [kJ]
Strength after
accelerated
curing (MPa)
EC
[kJ/MPa]
O-85oC-24h Electric oven 24 30769 40.7 756
M-Multi-6h Microwave oven 6 8640 41.8 206
M-Multi-4.5h Microwave oven 4.5 6840 35.7 192
O-Multi-4.5h Electric oven 4.5 9299 28.1 331
* EC: energy consumption
Conclusions
A multi-stage microwave curing regime for AAFA sample was proposed and examined
experimentally using a CCD experimental design. The main conclusions are as follows:
1. Five factors that were expected to influence the multi-stage microwave curing regime
were identified: rate of temperature rise (as determined by maximum microwave
power output, Pmax), and four curing durations at 65oC (t1), 85oC (t2), 105oC (t3) and
125oC (t4) respectively.
2. The rate of temperature rise and curing durations at the four different temperature
levels were found to have significant effects on the strength gain of AAFA and energy
consumption of microwave curing process.
Compressive strength
Rate of temperature rise (maximum microwave power output, Pmax) and curing
duration at 125oC (t4) were the two main factors that influenced the compressive
strength. Higher Pmax hindered the strength development, while increasing t4
favoured the strength development.

Chapter 5 Development of Multi-stage Microwave Curing Regime for Manufacturing AAFA
135
Energy consumption
Although in general, energy consumption was correlated with the curing
temperature, increasing the curing duration at 125oC (t4) beyond 60 minutes was
found to decrease the energy consumption.
3. The microwave curing regime was optimised by taking both the strength gain and the
energy consumption into account. The optimised regime under the testing conditions
investigated in this study was obtained to be Pmax at 400W, t1 at 35 minutes, t2 at
35 minutes, t3 at 35 minutes and t4 at 85 minutes, which was validated by repetition
of the experiment results.
4. The strength achieved by microwave curing was found to decrease at 7 days and 28
days, which may have resulted from the conversion of the reaction products during
the continued curing at room temperature.
5. Microwave curing provides a more energy-efficient way to manufacture AAFA in a
reduced curing time compare with the conventional thermal curing. The multi-stage
microwave curing resulted in lower energy consumption per strength gained (kJ/MPa).

Chapter 6 Characterisation of AAFA Manufactured by Multi-stage Microwave Curing Regime
136
Characterisation of Alkali-activated Fly Ash
Manufactured by Multi-stage Microwave Curing Regime
Introduction
In this chapter, the alkali-activated fly ash (AAFA) cured by the multi-stage microwave
curing technique were characterised by investigating the reaction products and the
microstructure developed. Additionally, to identify the advantages and disadvantages of
the newly developed microwave curing regime as compared with the conventional thermal
curing, the properties of the AAFA cured with microwave regime were also compared with
those of AAFA cured by thermal oven on the basis of equivalent strength and similar
history of curing temperature, respectively.
Moreover, it was reported in Chapter 5 that the long-term strength of the microwave cured
AAFA was reduced after being subsequently cured at room temperature until 7 days and
28 days. Therefore, to understand the cause of the strength loss, the evolution of the
reaction products and microstructure of the AAFA samples cured by the optimised multi-
stage microwave curing regime was further characterised and compared with those of the
AAFA cured by a typical conventional thermal oven over time (first at 85oC for 24 hours
and then room temperature up to 28 days).
Aims and objectives
The aim of this chapter was to study the reaction products and microstructure of the AAFA
cured by the newly developed multi-stage microwave curing regime as well as to compare
these with the reaction products and microstructure of AAFAs cured in the thermal oven
on the basis of equivalent strength and equivalent thermal history, respectively. In
particular, examination of the samples aimed to understand the reduction of strength
observed in Chapter 5 for microwave cured AAFA samples subjected to additional
ambient temperature curing for 7 days and 28 days. This was achieved through the
following two objectives:
1) To investigate and compare the reaction products and microstructure of the
AAFAs immediately after the conventional thermal curing and multi-stage
microwave curing;
2) To investigate and compare the evolution of the reaction products and
microstructure of the AAFAs manufactured with the optimised multi-stage

Chapter 6 Characterisation of AAFA Manufactured by Multi-stage Microwave Curing Regime
137
microwave curing regime and 85oC thermal oven curing at 7 days and 28 days
with an attempt to reveal the reason of the strength loss caused by microwave
curing.
Reaction products and microstructure of alkali-activated fly ash
immediately after accelerated curing
6.3.1 Introduction
It should be noted that the AAFA samples were cooled to room temperature immediately
after microwave curing before carrying out the compressive strength test. However, to
differentiate from the investigations carried out on the samples subsequently cured at
room temperature for longer duration, it was decided to use the term ‘immediately after
accelerated curing’. The same also applies to the AAFA manufactured with the thermal
oven curing.
Four samples from Chapter 5 were selected to compare the reaction products and
microstructure (see Section 5.6.1 for more detail). They are “O-85oC-24h” and “M-Multi-
6h (Run No.8)” with equivalent strength immediately after accelerated curing (Table 6.1),
and “M-Multi-4.5h (Run No.23)” and “O-Multi-4.5h” with similar history of curing
temperature (Table 6.2). The former two samples are compared in Section 6.3.2 below
and the latter two samples in Section 6.3.3.
Table 6.1 Details of the alkali-activated fly ash samples with equivalent compressive
strength after immediately after accelerated curing
Sample Curing method Duration of
accelerated curing
Strength after
accelerated curing
O-85oC-24h Conventional
thermal curing 24 hours 40.7 MPa
M-Multi-6h
(Run No.8)
Multi-stage
microwave curing 6 hours 41.8 MPa
Curing regime: Pmax: 575W;
25-65oC: 3.3oC/min, 65oC: 60min;
65-85oC: 2.2oC/min, 85oC: 60min;
85-105oC: 3.3oC/min, 105oC: 60min;
105-125oC: 0.7oC/min, 125oC: 120min.
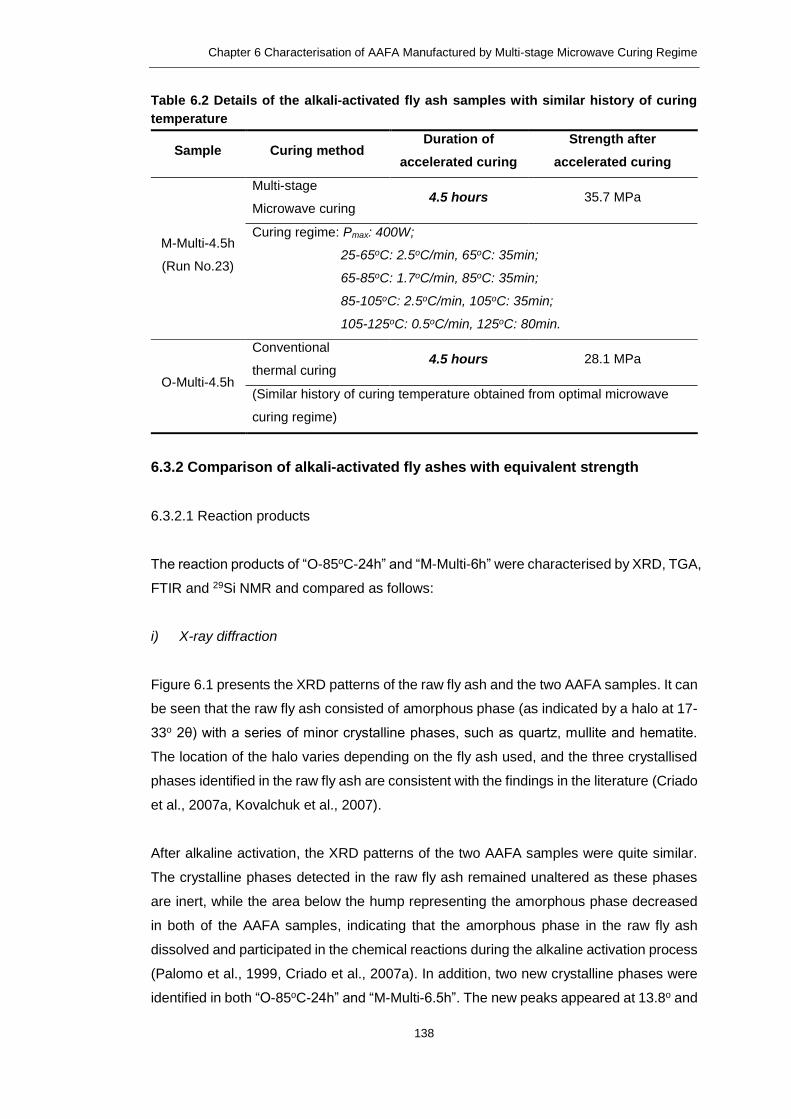
Chapter 6 Characterisation of AAFA Manufactured by Multi-stage Microwave Curing Regime
138
Table 6.2 Details of the alkali-activated fly ash samples with similar history of curing
temperature
Sample Curing method Duration of
accelerated curing
Strength after
accelerated curing
M-Multi-4.5h
(Run No.23)
Multi-stage
Microwave curing 4.5 hours 35.7 MPa
Curing regime: Pmax: 400W;
25-65oC: 2.5oC/min, 65oC: 35min;
65-85oC: 1.7oC/min, 85oC: 35min;
85-105oC: 2.5oC/min, 105oC: 35min;
105-125oC: 0.5oC/min, 125oC: 80min.
O-Multi-4.5h
Conventional
thermal curing 4.5 hours 28.1 MPa
(Similar history of curing temperature obtained from optimal microwave
curing regime)
6.3.2 Comparison of alkali-activated fly ashes with equivalent strength
6.3.2.1 Reaction products
The reaction products of “O-85oC-24h” and “M-Multi-6h” were characterised by XRD, TGA,
FTIR and 29Si NMR and compared as follows:
i) X-ray diffraction
Figure 6.1 presents the XRD patterns of the raw fly ash and the two AAFA samples. It can
be seen that the raw fly ash consisted of amorphous phase (as indicated by a halo at 17-
33o 2θ) with a series of minor crystalline phases, such as quartz, mullite and hematite.
The location of the halo varies depending on the fly ash used, and the three crystallised
phases identified in the raw fly ash are consistent with the findings in the literature (Criado
et al., 2007a, Kovalchuk et al., 2007).
After alkaline activation, the XRD patterns of the two AAFA samples were quite similar.
The crystalline phases detected in the raw fly ash remained unaltered as these phases
are inert, while the area below the hump representing the amorphous phase decreased
in both of the AAFA samples, indicating that the amorphous phase in the raw fly ash
dissolved and participated in the chemical reactions during the alkaline activation process
(Palomo et al., 1999, Criado et al., 2007a). In addition, two new crystalline phases were
identified in both “O-85oC-24h” and “M-Multi-6.5h”. The new peaks appeared at 13.8o and

Chapter 6 Characterisation of AAFA Manufactured by Multi-stage Microwave Curing Regime
139
24o 2θ were attributed to hydroxysodalite (atomic Si/Al ratio = 1). Another zeolitic phase
identified at 34.2o 2θ was assigned to chabazite-Na (atomic Si/Al ratio = 2). These results
are in agreement with reported findings (Criado et al., 2007a, Bakharev, 2005b).
Figure 6.1 XRD patterns of raw fly ash, O-85oC-24h and M-Multi-6h (Q-quartz, M-mullite,
F-hematite, H-hydroxysodalite, N-chabazite-Na)
ii) Thermogravimetric analysis
Figure 6.2 gives the TGA results of the two AAFA samples. In Figure 6.2a, the TG curves
show that the weight loss of “O-85oC-24h” is higher than that of “M-Multi-6h” in a certain
temperature range (i.e. 50-200oC), indicating that the amount of N-A-S-H gel formed in
the AAFA with conventional thermal curing was greater than that formed in the AAFA with
microwave curing. In Figure 6.2b, the two main peaks in the DTG curves were attributed
to the dehydration of N-A-S-H gel in both AAFA samples. The peak was centred at around
75oC in the “O-85oC-24h”, while the peak was centred at 105oC in “M-Multi-6h”, implying
that the N-A-S-H gels formed in conventional thermal cured AAFA was less thermally
stable than that formed in microwave cured AAFA.

Chapter 6 Characterisation of AAFA Manufactured by Multi-stage Microwave Curing Regime
140
a. TG
b. DTG
Figure 6.2 TG/DTG analysis of raw fly ash, O-85oC-24h and M-Multi-6h
iii) Fourier transform infrared spectroscopy
Figure 6.3 depicts the FTIR spectra of the raw fly ash and two AAFA samples. The
presence of quartz and mullite in the raw fly ash was responsible for the bands appearing
at 791 cm-1 and 548 cm-1, respectively. In addition, a wide band associated with T-O (T=Al,
Si) asymmetric stretching vibrations from the amorphous phase can be observed at 1037
cm-1 in the raw fly ash.
After alkaline activation, the T-O band became sharper and shifted towards lower
frequencies at 980 cm-1 in “O-85oC-24h” and 974 cm-1 in “M-Multi-6h”, respectively, which
is seen as the fingerprint of the formation of N-A-S-H gel in AAFA (Fernandez-Jimenez
and Palomo, 2005b, Criado et al., 2007b). It is interesting to find that the T-O band shifted
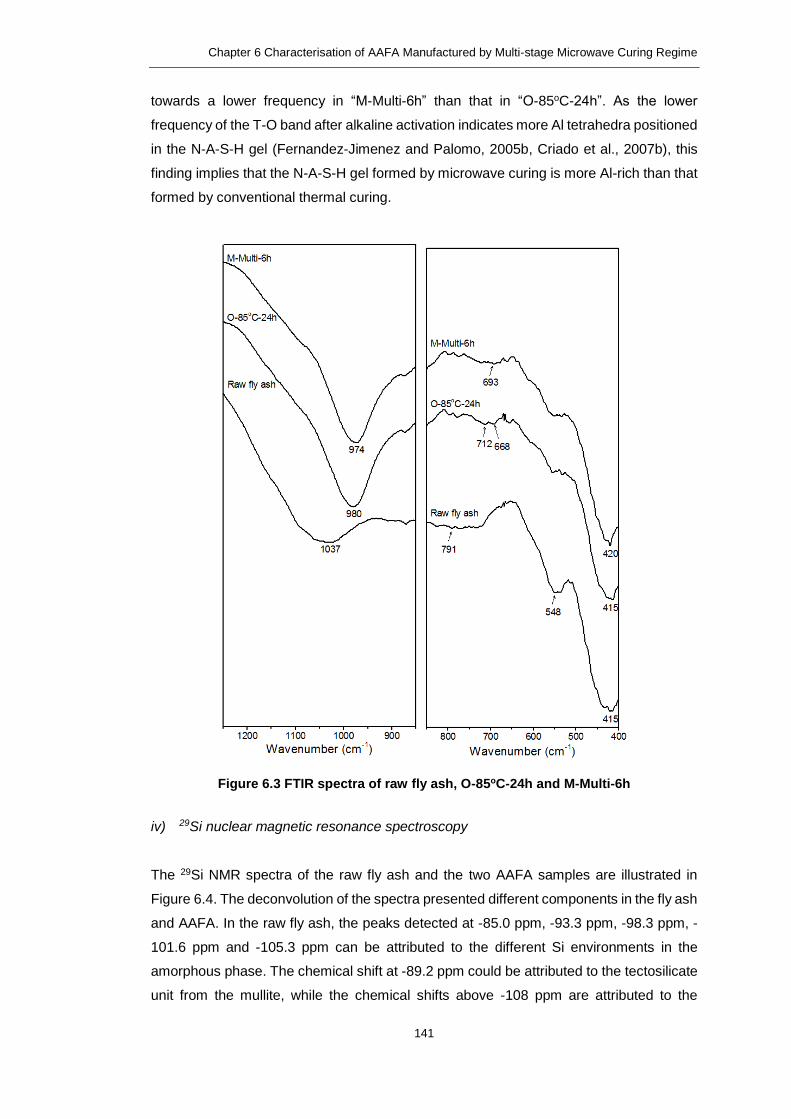
Chapter 6 Characterisation of AAFA Manufactured by Multi-stage Microwave Curing Regime
141
towards a lower frequency in “M-Multi-6h” than that in “O-85oC-24h”. As the lower
frequency of the T-O band after alkaline activation indicates more Al tetrahedra positioned
in the N-A-S-H gel (Fernandez-Jimenez and Palomo, 2005b, Criado et al., 2007b), this
finding implies that the N-A-S-H gel formed by microwave curing is more Al-rich than that
formed by conventional thermal curing.
Figure 6.3 FTIR spectra of raw fly ash, O-85oC-24h and M-Multi-6h
iv) 29Si nuclear magnetic resonance spectroscopy
The 29Si NMR spectra of the raw fly ash and the two AAFA samples are illustrated in
Figure 6.4. The deconvolution of the spectra presented different components in the fly ash
and AAFA. In the raw fly ash, the peaks detected at -85.0 ppm, -93.3 ppm, -98.3 ppm, -
101.6 ppm and -105.3 ppm can be attributed to the different Si environments in the
amorphous phase. The chemical shift at -89.2 ppm could be attributed to the tectosilicate
unit from the mullite, while the chemical shifts above -108 ppm are attributed to the
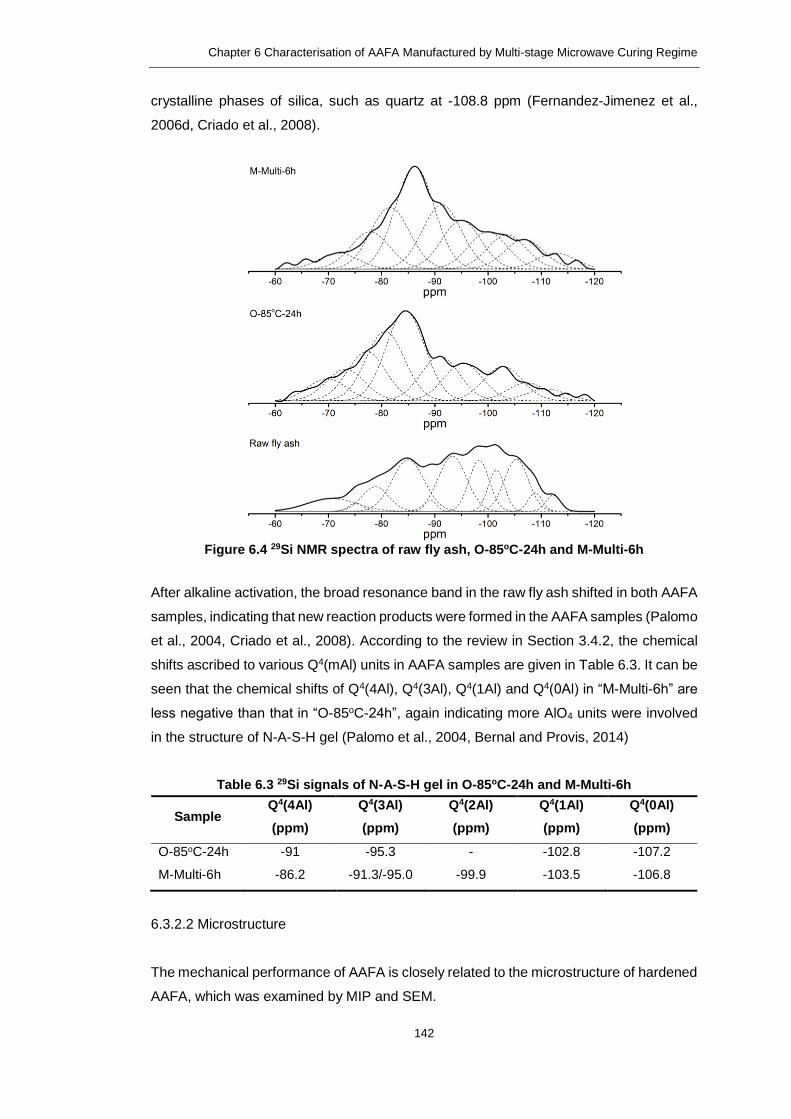
Chapter 6 Characterisation of AAFA Manufactured by Multi-stage Microwave Curing Regime
142
crystalline phases of silica, such as quartz at -108.8 ppm (Fernandez-Jimenez et al.,
2006d, Criado et al., 2008).
Figure 6.4 29Si NMR spectra of raw fly ash, O-85oC-24h and M-Multi-6h
After alkaline activation, the broad resonance band in the raw fly ash shifted in both AAFA
samples, indicating that new reaction products were formed in the AAFA samples (Palomo
et al., 2004, Criado et al., 2008). According to the review in Section 3.4.2, the chemical
shifts ascribed to various Q4(mAl) units in AAFA samples are given in Table 6.3. It can be
seen that the chemical shifts of Q4(4Al), Q4(3Al), Q4(1Al) and Q4(0Al) in “M-Multi-6h” are
less negative than that in “O-85oC-24h”, again indicating more AlO4 units were involved
in the structure of N-A-S-H gel (Palomo et al., 2004, Bernal and Provis, 2014)
Table 6.3 29Si signals of N-A-S-H gel in O-85oC-24h and M-Multi-6h
Sample Q4(4Al)
(ppm)
Q4(3Al)
(ppm)
Q4(2Al)
(ppm)
Q4(1Al)
(ppm)
Q4(0Al)
(ppm)
O-85oC-24h -91 -95.3 - -102.8 -107.2
M-Multi-6h -86.2 -91.3/-95.0 -99.9 -103.5 -106.8
6.3.2.2 Microstructure
The mechanical performance of AAFA is closely related to the microstructure of hardened
AAFA, which was examined by MIP and SEM.

Chapter 6 Characterisation of AAFA Manufactured by Multi-stage Microwave Curing Regime
143
i) Pore structure
The pore structure of hardened AAFA samples was obtained by MIP. Figure 6.5a
illustrates the curves of cumulative volume of mercury intruded into the AAFA. It can be
seen that the curve of “O-85oC-24h” is below that of “M-Multi-6h” over the whole range of
the pore sizes, which is consistent with total porosities of 20.39% and 31.91% for “O-
85oC-24h” and “M-Multi-6h” respectively. Figure 6.5b shows the pore size distributions in
the two AAFA samples, from which “O-85oC-24h” demonstrated a finer pore size
distribution than “M-Multi-6h".
a. Cumulative pore volume versus pore diameter
b. Differential pore volume versus pore diameter
Figure 6.5 Pore size distributions of O-85oC-24h and M-Multi-6h
Table 6.4 further compares the pores at different size ranges between these two samples.
In “M-Multi-6h”, the dominant pore ranges were 100-500 nm and >500 nm, which are in

Chapter 6 Characterisation of AAFA Manufactured by Multi-stage Microwave Curing Regime
144
the range of capillary pores, accounting for more than 97% of the pores in the hardened
AAFA sample. In comparison, 29% of total pores ranging <50 nm and 50-100 nm in “O-
85oC-24h” can be assigned to gel pores (Ma et al., 2013). These results indicate that more
polymerisation reaction took place in “O-85oC-24h” samples (as can be inferred from the
amount of gel pores formed), presumably due to the slow reaction and the longer duration
under conventional thermal curing. In contrast, in the case of microwave curing, due to
the volumetric heating effect, less polymerisation incurred, resulting in a more porous
structure primarily dominated by capillary pores.
Table 6.4 Comparison of pore size distribution of O-85oC-24h and M-Multi-6h
In addition, there is significant difference in the amount of pores larger than 50 nm
between the two samples. The amount of pores larger than 50 nm in “M-Multi-6h” was
more than double that in the “O-85oC-24h”. The established understanding is that the
amount of the pores larger than 50 nm dominates the strength and permeability properties
of cementitious materials (Mehta and Monteiro, 2005). However, the almost same
compressive strength obtained from both the thermal oven cured and microwave cured
samples would suggest that the nature of the gel formed under two curing methods are
different. The gel formed under microwave curing might be able to contribute to a stronger
bound. Further studies are still needed in the future to understand the nature of the gel
formed under different curing methods before the above observation can be fully
understood.
ii) Morphology of fractured sample
Figure 6.6 presents the SEM photographs of the fractured surfaces of the two AAFA
samples with different curing methods. Both of them featured a heterogeneous
microstructure and compacted texture. Compared to “O-85oC-24h”, “M-Multi-6h” showed
a more porous microstructure, which is in agreement with the MIP results.
Figure 6.6 also shows that the surfaces of fly ash particles in both samples were severely
corroded due to the alkaline activation. The reaction products formed on the surface of fly
ash particles and filled in the regions between the fly ash particles were observed in both
samples.
Sample Total pore
volume (mL/g)
Pore size distribution (mL/g) >50 nm
mL/g) <50 nm 50~100 nm 100~500 nm >500 nm
O-85oC-24h 0.1318 0.0118 0.0262 0.0666 0.0273 0.1200
M-Multi-6h 0.2904 0 0.0079 0.1470 0.1355 0.2904
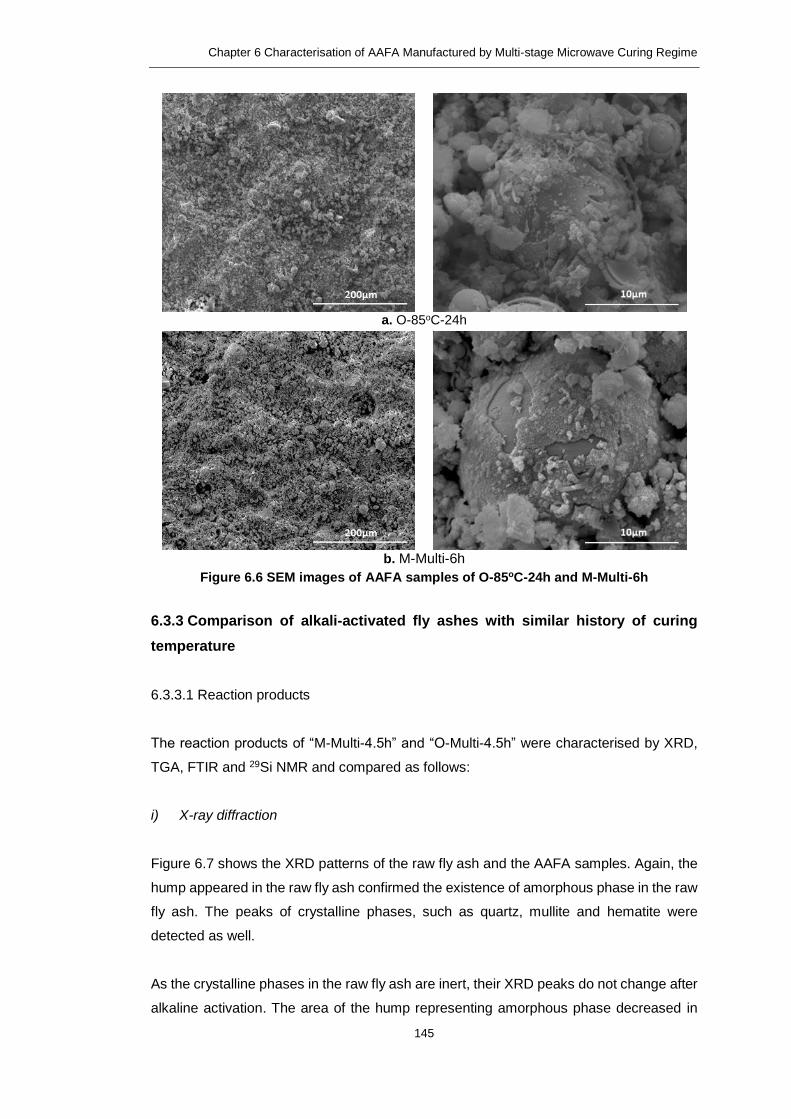
Chapter 6 Characterisation of AAFA Manufactured by Multi-stage Microwave Curing Regime
145
a. O-85oC-24h
b. M-Multi-6h
Figure 6.6 SEM images of AAFA samples of O-85oC-24h and M-Multi-6h
6.3.3 Comparison of alkali-activated fly ashes with similar history of curing
temperature
6.3.3.1 Reaction products
The reaction products of “M-Multi-4.5h” and “O-Multi-4.5h” were characterised by XRD,
TGA, FTIR and 29Si NMR and compared as follows:
i) X-ray diffraction
Figure 6.7 shows the XRD patterns of the raw fly ash and the AAFA samples. Again, the
hump appeared in the raw fly ash confirmed the existence of amorphous phase in the raw
fly ash. The peaks of crystalline phases, such as quartz, mullite and hematite were
detected as well.
As the crystalline phases in the raw fly ash are inert, their XRD peaks do not change after
alkaline activation. The area of the hump representing amorphous phase decreased in
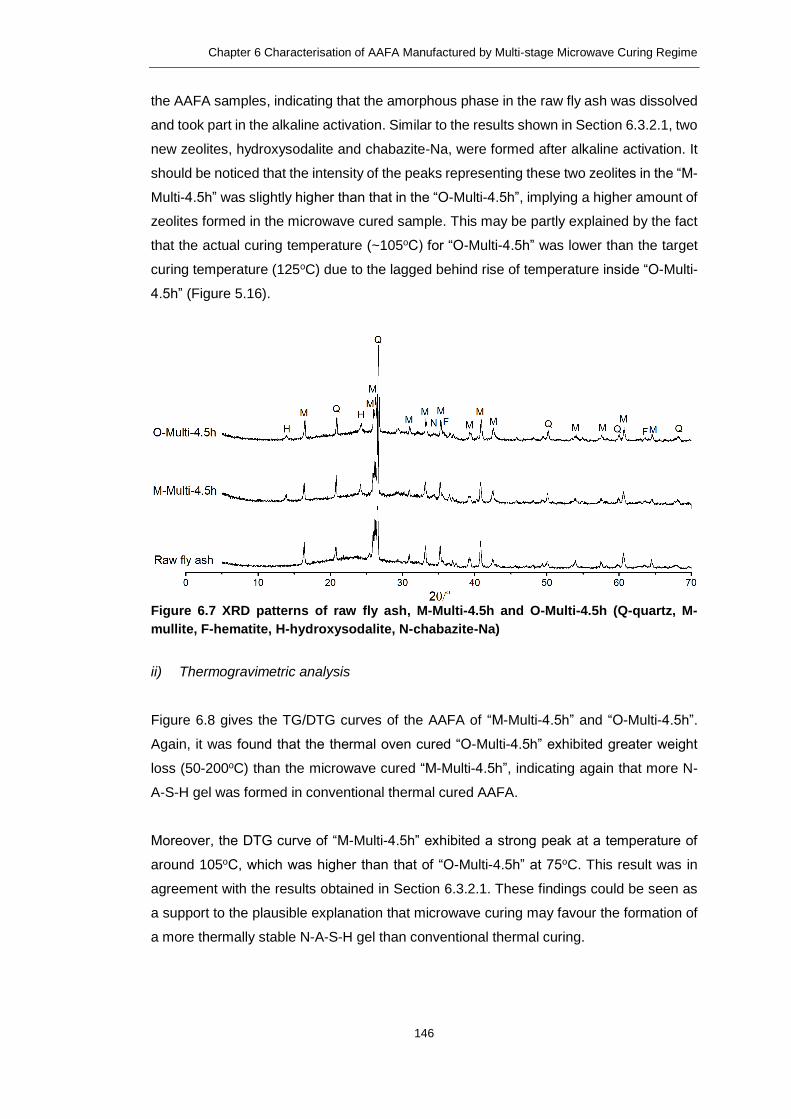
Chapter 6 Characterisation of AAFA Manufactured by Multi-stage Microwave Curing Regime
146
the AAFA samples, indicating that the amorphous phase in the raw fly ash was dissolved
and took part in the alkaline activation. Similar to the results shown in Section 6.3.2.1, two
new zeolites, hydroxysodalite and chabazite-Na, were formed after alkaline activation. It
should be noticed that the intensity of the peaks representing these two zeolites in the “M-
Multi-4.5h” was slightly higher than that in the “O-Multi-4.5h”, implying a higher amount of
zeolites formed in the microwave cured sample. This may be partly explained by the fact
that the actual curing temperature (~105oC) for “O-Multi-4.5h” was lower than the target
curing temperature (125oC) due to the lagged behind rise of temperature inside “O-Multi-
4.5h” (Figure 5.16).
Figure 6.7 XRD patterns of raw fly ash, M-Multi-4.5h and O-Multi-4.5h (Q-quartz, M-
mullite, F-hematite, H-hydroxysodalite, N-chabazite-Na)
ii) Thermogravimetric analysis
Figure 6.8 gives the TG/DTG curves of the AAFA of “M-Multi-4.5h” and “O-Multi-4.5h”.
Again, it was found that the thermal oven cured “O-Multi-4.5h” exhibited greater weight
loss (50-200oC) than the microwave cured “M-Multi-4.5h”, indicating again that more N-
A-S-H gel was formed in conventional thermal cured AAFA.
Moreover, the DTG curve of “M-Multi-4.5h” exhibited a strong peak at a temperature of
around 105oC, which was higher than that of “O-Multi-4.5h” at 75oC. This result was in
agreement with the results obtained in Section 6.3.2.1. These findings could be seen as
a support to the plausible explanation that microwave curing may favour the formation of
a more thermally stable N-A-S-H gel than conventional thermal curing.
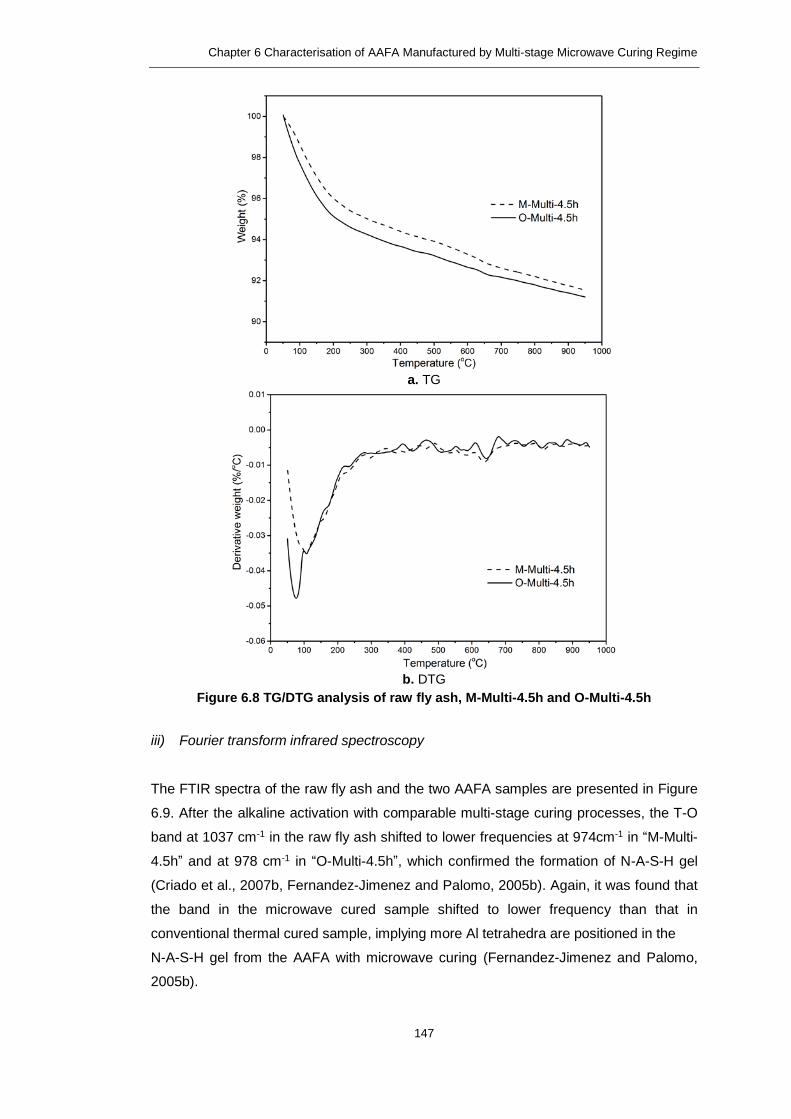
Chapter 6 Characterisation of AAFA Manufactured by Multi-stage Microwave Curing Regime
147
a. TG
b. DTG
Figure 6.8 TG/DTG analysis of raw fly ash, M-Multi-4.5h and O-Multi-4.5h
iii) Fourier transform infrared spectroscopy
The FTIR spectra of the raw fly ash and the two AAFA samples are presented in Figure
6.9. After the alkaline activation with comparable multi-stage curing processes, the T-O
band at 1037 cm-1 in the raw fly ash shifted to lower frequencies at 974cm-1 in “M-Multi-
4.5h” and at 978 cm-1 in “O-Multi-4.5h”, which confirmed the formation of N-A-S-H gel
(Criado et al., 2007b, Fernandez-Jimenez and Palomo, 2005b). Again, it was found that
the band in the microwave cured sample shifted to lower frequency than that in
conventional thermal cured sample, implying more Al tetrahedra are positioned in the
N-A-S-H gel from the AAFA with microwave curing (Fernandez-Jimenez and Palomo,
2005b).

Chapter 6 Characterisation of AAFA Manufactured by Multi-stage Microwave Curing Regime
148
Figure 6.9 FTIR spectra of raw fly ash, M-Multi-4.5h and O-Multi-4.5h
iv) 29Si nuclear magnetic resonance spectroscopy
Figure 6.10 shows the 29Si NMR spectra of the raw fly ash and two AAFA samples. The
deconvolution of the spectra showed the different components in the raw fly ash and
AAFA samples. Significant changes can be observed in the spectra of AAFA samples
after alkaline activation, indicating the chemical transformation that has taken place. As
the peaks in the raw fly ash have been interpreted in Section 6.3.2.1, only the changes of
the peaks in AAFA samples were discussed here.

Chapter 6 Characterisation of AAFA Manufactured by Multi-stage Microwave Curing Regime
149
Figure 6.10 29Si NMR spectra of raw fly ash, M-Multi-4.5h and O-Multi-4.5h
Error! Reference source not found. gives the chemical shifts corresponding to different
Q4(mAl) units in the N-A-S-H gel formed. It is found that the intensity of the main signal
representing Q4(4Al) in “M-Multi-4.5h” was higher than that in “O-Multi-4.5h”, again
indicating the Al-rich structural units in the reaction products were formed in the
microwave cured AAFA. The results corroborate with the hypothesis that microwave
curing may result in the formation of Al-rich N-A-S-H gel.
Table 6.5 29Si signals of N-A-S-H gel in M-Multi-4.5h and O-Multi-4.5h
Sample Q4(4Al)
(ppm)
Q4(3Al)
(ppm)
Q4(2Al)
(ppm)
Q4(1Al)
(ppm)
Q4(0Al)
(ppm)
M-Multi-4.5h -85.6 -92/-94.9 -98.1 -101.5/-105.7 -
O-Multi-4.5h -88.3 -93.2 -97.6 -101.6 -107.3
6.3.3.2 Microstructure
The microstructures of hardened “M-Multi-4.5h” and “O-Multi-4.5h” obtained by similar
multi-stage curing regimes were also examined by MIP and SEM.
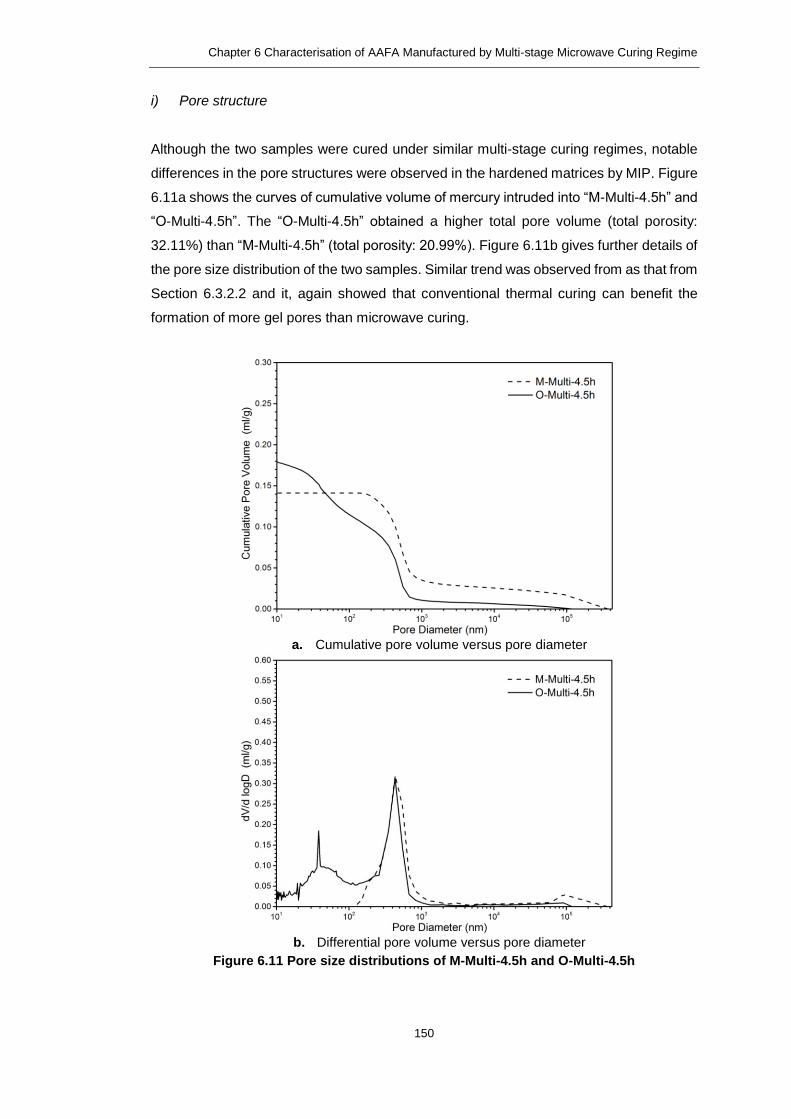
Chapter 6 Characterisation of AAFA Manufactured by Multi-stage Microwave Curing Regime
150
i) Pore structure
Although the two samples were cured under similar multi-stage curing regimes, notable
differences in the pore structures were observed in the hardened matrices by MIP. Figure
6.11a shows the curves of cumulative volume of mercury intruded into “M-Multi-4.5h” and
“O-Multi-4.5h”. The “O-Multi-4.5h” obtained a higher total pore volume (total porosity:
32.11%) than “M-Multi-4.5h” (total porosity: 20.99%). Figure 6.11b gives further details of
the pore size distribution of the two samples. Similar trend was observed from as that from
Section 6.3.2.2 and it, again showed that conventional thermal curing can benefit the
formation of more gel pores than microwave curing.
a. Cumulative pore volume versus pore diameter
b. Differential pore volume versus pore diameter
Figure 6.11 Pore size distributions of M-Multi-4.5h and O-Multi-4.5h

Chapter 6 Characterisation of AAFA Manufactured by Multi-stage Microwave Curing Regime
151
Table 6.6 gives the fraction of pore volume at different pore size ranges in two AAFA
samples. In “M-Multi-4.5h”, there was only two ranges of pores at 100-500 nm and >500
nm, while there were four pore ranges in the “O-Multi-4.5h”, associated with gel pores
(<50 nm, 50-100 nm) and capillary pores (100-500 nm and >500 nm). When the amount
of the pores large than 50 nm is compared between the two samples, it also showed that
whilst more pores larger than 50 nm was formed in microwave cured sample, the strength
of microwave cured AAFA was higher than that cured in thermal oven. This again,
indicates that the higher compressive strength achieved from microwave cured sample
could be due to a better gel initially formed during accelerated curing process. However,
it seems that the long-term stability of the gel formed under microwave curing is a concern
which could lead to a reduction of strength over time (to be discussed in Section 6.4.4
below).
Table 6.6 Comparison of pore size distribution of M-Multi-4.5h and O-Multi-4.5h
ii) Morphology of fractured sample
Figure 6.12 presents the SEM images of fractured surface of the two hardened AAFA
samples. Both of “M-Multi-4.5h” and “O-Multi-4.5h” featured heterogeneous textures. “O-
Multi-4.5h” showed a much more porous structure in comparison with “M-Multi-4.5h”. The
reaction products formed on the surface of fly ash particles and in the region between the
fly ash particles were also observed in both samples.
From the SEM images showed below, one of the reasons that “O-Multi-4.5h” gained a
lower strength could be due to the fact that the actual temperature inside the sample
throughout the whole curing duration was lower than that inside “M-Multi-4.5h” (Figure
5.16) and, hence, a more porous structure has been formed. However, other factors could
have also contributed to this difference which will be further discussed below.
Sample Total pore
volume (mL/g)
Pore size distribution (mL/g) >50 nm
mL/g) <50 nm 50~100 nm 100~500 nm >500 nm
M-Multi-4.5h 0.1412 0 0 0.0742 0.0670 0.1412
O-Multi-4.5h 0.1942 0.0574 0.0235 0.0865 0.0268 0.1368

Chapter 6 Characterisation of AAFA Manufactured by Multi-stage Microwave Curing Regime
152
a. M-Multi-4.5h
b. O-Multi-4.5h
Figure 6.12 SEM images of M-Multi-4.5h and O-Multi-4.5h
6.3.4 Discussion
Table 6.7 summarises the main findings from the results presented above. Reaction
products and microstructures of four AAFA samples under different curing regimes were
compared.
Alkaline activation of fly ash consists of two stages, dissolution and gelation (Fernandez-
Jimenez et al., 2005). As the dissolution of Al and Si species from raw fly ash is highly
temperature dependent (Whittaker et al., 2000), the dissolution process can thus be
accelerated by a higher curing temperature of 125oC applied in the multi-stage microwave
curing than that of 85oC in the typical conventional thermal curing. The dissolution of Al
species is faster than that of Si species due to a lower bond energy of Al-O bond than that
of Si-O bond (as discussed in Section 3.3.2.1). While the Si(OH)4 and Al(OH)4- released
from the raw fly ash take further reaction to form N-A-S-H gel, the reaction rate could be
increased by microwave curing due to its volumetric heating as reported in the synthesis
of ceramic by microwave (Binner et al., 1995). The fast temperature rise by microwave
heating is also dominated by energy conversion, rather than thermal conduction (Metaxas

Chapter 6 Characterisation of AAFA Manufactured by Multi-stage Microwave Curing Regime
153
and Meredith, 1983, Ong and Akbarnezhad, 2015). This explains why, with a much shorter
curing duration, “M-Multi-6h” cured by microwave curing gained equivalent strength to “O-
85oC-24h” cured by conventional thermal curing.
It has been discussed in Chapter 3 that an Al-rich N-A-S-H gel (Gel 1) is formed in the
early stage of alkaline activation (Fernandez-Jimenez et al., 2006d), more silica groups
take part in the gelation process to form a more stable Si-rich N-A-S-H gel (Gel 2) as the
activation reaction proceeds. The strength gain is proportional to the amount of N-A-S-H
gel and the Si-rich N-A-S-H gel primarily contributes to the strength development of AAFA
(Fernandez-Jimenez et al., 2006d). It has been seen that the amount of N-A-S-H gel
formed in “O-85oC-24h” was higher than that in “M-Multi-6h”, which could be due to the
longer reaction duration in “O-85oC-24h” than that in “M-Multi-6h” and hence more Si(OH)4
could be released to participate the conversion from Al-rich gel to Si-rich gel. Furthermore,
both FTIR and NMR results have shown that microwave curing favoured the formation of
relatively Al-rich N-A-S-H gel compared with that by conventional thermal curing. However,
the gel formed in “M-Multi-6h” showed higher thermal stability than that in “O-85oC-24h”
according to the DTG results, indicating that this Al-rich gel formed under microwave
curing could be different from that formed under conventional thermal curing. This could
somehow be related to the equivalent/higher strength obtained from microwave cured
AAFA and compared to that from conventional thermal cured AAFA, while the former
usually demonstrated more pores larger than 50 nm. However, the exact nature of this Al-
rich gel formed in the current microwave curing system is still unclear, which may need
further study in the future in order to have a better understanding of the observations from
the current study.
However, similar to the adverse effect incurred to the concrete during steam curing (Ba et
al., 2011), the fast and volumetric heating by microwave could lead to very quick formation
of reaction products on the surface of fly ash particles which can prevent the further
release of dissolved silica and alumina from fly ash and, hence, porous structure could
have been formed and the long-term strength could suffer, in a way similar to what has
been observed in steam cured concrete (Turkel and Alabas, 2005). The effect of
microwave curing on the long-term strength is, thus, further studied and discussed in
Section 6.4 below.

Chapter 6 Characterisation of AAFA Manufactured by Multi-stage Microwave Curing Regime
154
Table 6.7 Summary of characterisation of four alkali-activated fly ash samples after accelerated curing
O-85oC-24h Conventional thermal curing
85oC for 24 hours
M-Multi-6h Multi-stage
microwave curing 65-125oC for 6 hours
M-Multi-4.5h Multi-stage
microwave curing 65-125oC for 4.5 hours
O-Multi-4.5h Multi-stage
thermal oven curing 65-125oC for 4.5 hours
Main findings
Strength 40.7 MPa 41.8 MPa 35.7 MPa 28.1 MPa
XRD
Hydroxysodalite
Hydroxysodalite
Hydroxysodalite
Hydroxysodalite
Same new zeolites formed in the AAFA with two curing methods
Chabazite-Na Chabazite-Na Chabazite-Na Chabazite-Na (lower intensity)
TG/DTG
DTG peak: 75oC
DTG peak: 105oC
DTG peak: 105oC
DTG peak: 75oC
N-A-S-H gel is more thermally stable in the microwave cured AAFA
Weight loss (N-A-S-H gel): conventional thermal curing > microwave curing
Temperature (DTG peak): conventional thermal curing < microwave curing
FTIR
T-O band: 980cm-1
T-O band: 974cm-1
T-O band: 974cm-1
T-O band: 978cm-1
More AlO4 units formed in the microwave cured AAFA Frequency of T-O band: conventional thermal curing > microwave curing
29Si NMR
Q4(4Al): -91.0 ppm Q4(4Al): -86.2 ppm Q4(4Al): -85.6 ppm Q4(4Al): -88.3 ppm
Al-rich phase formed in the microwave cured AAFA Chemical shift of Q4(4Al): conventional thermal curing < microwave curing
MIP
Total porosity: 20.39%
Total porosity: 30.19%
Total porosity: 20.99%
Total porosity: 32.11%
Finer pore size distribution formed in conventional thermal cured AAFA
SEM porous porous Homogeneous
structure

Chapter 6 Characterisation of AAFA Manufactured by Multi-stage Microwave Curing Regime
155
Evolution of reaction products and microstructure of alkali-activated
fly ash over time
6.4.1 Introduction
To understand the cause of the strength loss over time of AAFA samples after the multi-
stage microwave curing, the evolution of the reaction products and microstructure of the
AAFA samples cured by both methods, i.e., “O-85oC-24h” and “M-Multi-4.5h”, were further
characterised over time.
Table 6.8 presents the compressive strengths of “O-85oC-24h” and “M-Multi-4.5h” at three
ages. After the initial accelerated curing (i.e. thermal oven curing or microwave curing),
all the samples were further cured at ambient temperature (RH>90%) until 7 days and 28
days for compression test and further analyses. The reaction products and microstructure
development of both samples were characterised at the each age and reported below.
Table 6.8 Strength development of O-85oC-24h and M-Multi-4.5h
Sample Curing regime Strength after
accelerated curing
7-day
strength
28-day
strength
O-85oC-24h Conventional thermal curing
at 85oC for 24 hours 40.7 MPa 39.3 MPa 39.3 MPa
M-Multi-4.5h Multi-stage microwave curing
for 4.5 hours 35.7 MPa 26.6 MPa 20.7 MPa
6.4.2 Reaction products and microstructure development of O-85oC-24h over
time
6.4.2.1 Reaction products
i) X-ray diffraction
Figure 6.13 presents the XRD patterns of the raw fly ash and “O-85oC-24h” at three ages
after conventional thermal curing at 85oC for 24 hours. It can be seen that after the alkaline
activation, the crystalline phases of mullite and quartz in the raw fly ash remained
unchanged. New zeolitic phases, hydroxysodalite and chabazite-Na were detected in all
AAFA samples. However, there was no observation of changes of crystalline phases in
AAFA over the time. The area of the hump decreased gradually over time, indicating that

Chapter 6 Characterisation of AAFA Manufactured by Multi-stage Microwave Curing Regime
156
the amorphous material in raw fly ash was consumed during the alkaline activation
process.
Figure 6.13 XRD patterns of raw fly ash and O-85oC-24h at different ages (Q-quartz, M-
mullite, F-hematite, H-hydroxysodalite, N-chabazite-Na)
ii) Thermogravimetric analysis
The TG/DTG curves of “O-85oC-24h” at 1 day, 7 days and 28 days are shown in Figure
6.14. The main weight loss occurred between 50oC and 200oC corresponding to the
dehydration of N-A-S-H gel in AAFA samples (Fernandez-Jimenez et al., 2008). The
weight loss (50-200oC) at three ages were in the order of 1d > 7d ≈ 28d. The trend of the
weight loss is consistent with the strength results shown in Table 6.8. This weight loss
could be due to the conversion from Al-rich gel to Si-rich gel over time as identified by
FTIR and NMR studies below.

Chapter 6 Characterisation of AAFA Manufactured by Multi-stage Microwave Curing Regime
157
a. TG
b. DTG
Figure 6.14 TG/DTG analysis of raw fly ash and O-85oC-24h at different ages
iii) Fourier transform infrared spectroscopy
The FTIR spectra of the raw fly ash and “O-85oC-24h” at 1 day, 7 days and 28 days are
given in Figure 6.15. The band corresponding to T-O (T=Al, Si) stretching vibrations
observed at 1087 cm-1 in the raw fly ash shifted perceptibly in the AAFA samples. The
band initially appeared at a frequency of 980 cm-1 at 1 day moved to a lower frequency of
978 cm-1 at 7 days, and then shifted backwards to a higher frequency of 982 cm-1 at 28
days. The shift of the frequencies in the AAFA samples at different ages indicated the
conversion of the N-A-S-H gel, namely Al-rich gel formed from 1 day to 7 days and Si-rich
gel formed from 7 days to 28 days. At 28 days, the N-A-S-H gel became Si-rich. This
finding was in consistent with previous research (Fernandez-Jimenez and Palomo,
2005b).

Chapter 6 Characterisation of AAFA Manufactured by Multi-stage Microwave Curing Regime
158
In addition, it can be noted that the T-O band was slightly sharper in the 1-day AAFA
sample than that in the 7-day and 28-day AAFA samples, implying that the N-A-S-H gel
underwent polymerisation to a greater extent and its molecular arrangement became
more orderly (Criado et al., 2007b).
Figure 6.15 FTIR spectra for raw fly ash and O-85oC-24h at different ages
iv) 29Si nuclear magnetic resonance spectroscopy
Figure 6.16 gives the 29Si spectra of raw fly ash and “O-85oC-24h” at different ages. After
alkaline activation, the broad resonance band in the raw fly ash shifted in all the AAFA
samples, and the intensity of the resonance band increased as the curing ages was
prolonged, indicating that reaction products were formed in the AAFA.

Chapter 6 Characterisation of AAFA Manufactured by Multi-stage Microwave Curing Regime
159
Figure 6.16 29Si NMR spectra of raw fly ash and O-85oC-24h at different ages
The deconvolution of the spectra showed the main signal at -84.5 ppm at 1 day shifted to
more negative at 7 days, -87.3 ppm and at 28 days, -88.3 ppm (Table 6.9). Furthermore,
the intensity of all Q4(mAl) units were increased from 1 day to 28 days, implying the N-A-
S-H gel was a more Si-rich phase at 28 days than that at 1 day (Criado et al., 2008).
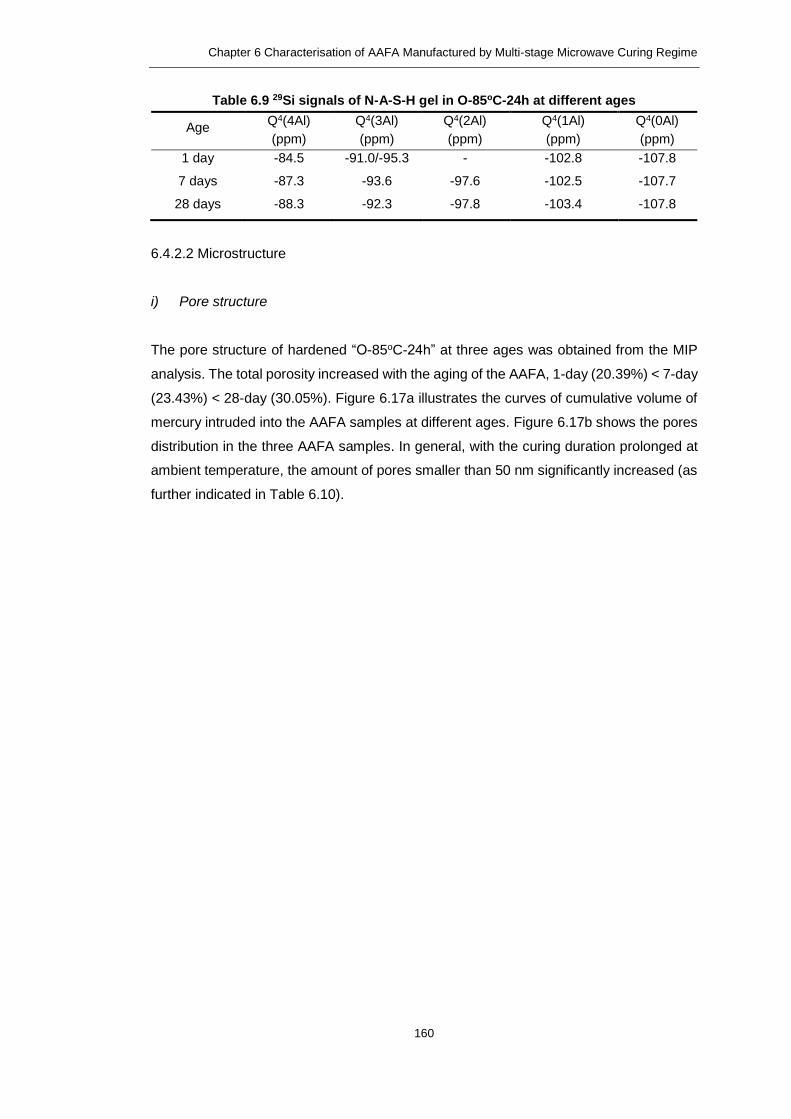
Chapter 6 Characterisation of AAFA Manufactured by Multi-stage Microwave Curing Regime
160
Table 6.9 29Si signals of N-A-S-H gel in O-85oC-24h at different ages
Age Q4(4Al)
(ppm)
Q4(3Al)
(ppm)
Q4(2Al)
(ppm)
Q4(1Al)
(ppm)
Q4(0Al)
(ppm)
1 day -84.5 -91.0/-95.3 - -102.8 -107.8
7 days -87.3 -93.6 -97.6 -102.5 -107.7
28 days -88.3 -92.3 -97.8 -103.4 -107.8
6.4.2.2 Microstructure
i) Pore structure
The pore structure of hardened “O-85oC-24h” at three ages was obtained from the MIP
analysis. The total porosity increased with the aging of the AAFA, 1-day (20.39%) < 7-day
(23.43%) < 28-day (30.05%). Figure 6.17a illustrates the curves of cumulative volume of
mercury intruded into the AAFA samples at different ages. Figure 6.17b shows the pores
distribution in the three AAFA samples. In general, with the curing duration prolonged at
ambient temperature, the amount of pores smaller than 50 nm significantly increased (as
further indicated in Table 6.10).

Chapter 6 Characterisation of AAFA Manufactured by Multi-stage Microwave Curing Regime
161
a. Cumulative pore volume versus pore diameter
b. Differential pore volume versus pore diameter
Figure 6.17 Pore size distributions of O-85oC-24h at different ages
Table 6.10 gives the pore size classification of “O-85oC-24h” at three curing ages. Both
gel pores (<50 nm and 50-100 nm) and capillary pores (100-500 nm and >500 nm) can
be clearly differentiated in the AAFA samples at three different ages.
Table 6.10 Comparison of pore size distribution of O-85oC-24h at different ages
Age Total pore volume
(mL/g)
Pore size distribution (mL/g) >50 nm
mL/g) <50 nm 50~100 nm 100~500 nm >500 nm
1 day 0.1318 0.0118 0.0262 0.0666 0.0273 0.1200
7 days 0.1486 0.0327 0.0236 0.0777 0.0146 0.1159
28 days 0.1885 0.0681 0.0251 0.0785 0.0168 0.1204

Chapter 6 Characterisation of AAFA Manufactured by Multi-stage Microwave Curing Regime
162
It has been generally agreed that the pores larger than 50 nm are more influential in
determining strength and permeability properties of hydrated PC paste (Mehta and
Monteiro, 2005). From Table 6.10, it can be seen that whilst the total pore volume of the
pores larger than 50 nm remained reasonably stable, the pores smaller than 50 nm
increased significantly over time. On one hand, this confirmed that the reaction of AAFA
is a polymerisation process. As a result, with further polymerisation and the formation of
more N-A-S-H gels, the gel pores increased. On the other hand, different from the
hydration reaction, the continued polymerisation has not contributed to the reduction of
the pores larger than 50 nm. This is because the polymerisation cannot chemically bound
water and, hence, reduce the porosity. Instead, further water is released through the
polymerisation reaction (Eq. 3.2) (Provis and van Deventer, 2014). This explained the
increased total porosity over time. Moreover, as the pores larger than 50 nm remained
constant over time, this could explain why the strength was similar at different ages.
ii) Morphology of fractured sample
Figure 6.18 presents the fractured surface of the AAFA at different ages after being cured
at 85oC for 24 hours in a thermal oven. All the three samples featured a dense
microstructure and heterogeneous texture. It is clearly observed that the fly ash shells
were corroded and the reaction products were formed on the surface of fly ash particles
in the three samples.
Overall, the SEM images of AAFA sample at 7 days and 28 days showed slightly less
dense structures compared to the AAFA sample at 1 day, which was in consistence with
the increase of the pores less than 50nm from MIP results. However, there was no
significant difference among the compressive strength of the three samples (Table 6.8).

Chapter 6 Characterisation of AAFA Manufactured by Multi-stage Microwave Curing Regime
163
a. 1 day
b. 7 days
c. 28 days
Figure 6.18 SEM images of O-85oC-24h at different ages
6.4.3 Reaction products and microstructure development of M-Multi-4.5h
6.4.3.1 Reaction products
To make the comparison clear in the subsequent sections, the sample tested immediately
after microwave curing (in this case, after 4.5 hours) is denoted as ‘1 day’.

Chapter 6 Characterisation of AAFA Manufactured by Multi-stage Microwave Curing Regime
164
i) X-ray Diffraction
Figure 6.19 presents the XRD patterns of the raw fly ash and “M-Multi-4.5h” at 1 day, 7
days and 28 days. Again, after the alkaline activation, the inert phases of mullite and
quartz in the fly ash did not alter, while the hump representing amorphous material
decreased over the time. Both two new zeolitic phases, hydroxysodalite and chabazite-
Na were again detected in the spectra of all AAFA samples at three ages. Similar to
conventional thermal curing, AAFA after microwave curing did not show significant
difference in crystalline phases over the time.
Figure 6.19 XRD patterns of raw fly ash and M-Multi-4.5h at different ages (Q-quartz, M-
mullite, F-hematite, H-hydroxysodalite, N-chabazite-Na)
ii) Thermogravimetric Analysis
The TG/DTG curves of the three AAFA samples are shown in Figure 6.20. The weight
loss (50-200oC) at three ages was in the order of 7d > 28d > 1d. The peak in the DTG
curve of 1-day AAFA sample was centred at 105oC, while the strongest peak was centred
at 75oC in the DTG curves of 7-day and 28-day AAFA samples, which is opposite to the
trend of the results obtained from “O-85oC-24h” with conventional thermal curing,
indicating that with the ongoing reaction at room temperature, the N-A-S-H gel became
less thermally stable. The exact reason for this is still unclear at this stage, further research
is still needed in the future.

Chapter 6 Characterisation of AAFA Manufactured by Multi-stage Microwave Curing Regime
165
a. TG
b. DTG
Figure 6.20 TG/DTG analysis of raw fly ash and M-Multi-4.5h at different ages
iii) Fourier Transform Infrared spectroscopy
The FTIR spectra of the raw fly ash and AAFA samples at difference ages are presented
in Figure 6.21. The T-O (T=Al, Si) band at 1087 cm-1 in the raw fly ash shifted after alkaline
activation. The band initially appeared at a frequency of 975 cm-1 in the 1-day AAFA
sample. It moved to a slightly lower frequency of 974 cm-1 in the 7-day AAFA sample, and
then shifted backwards to a higher frequency of 977 cm-1 in the 28-day AAFA sample.
This trend was observed in the “O-85oC-24h” as well. The band shift can be assigned to
the formation of N-A-S-H gel and the shift of the frequencies at different ages is likely to
be related to the conversion of the N-A-S-H gel from Al-rich phase to Si-phase
(Fernandez-Jimenez and Palomo, 2005b, Criado et al., 2007b). It should be noticed that

Chapter 6 Characterisation of AAFA Manufactured by Multi-stage Microwave Curing Regime
166
the N-A-S-H gel in “M-Multi-4.5h” were more Al-rich than that in “O-85oC-24h” at all three
ages.
Figure 6.21 FTIR spectra for raw fly ash and M-Multi-4.5h at different ages
iv) Si29 Nuclear Magnetic Resonance spectroscopy
Figure 6.22 shows the Si29 spectra of raw fly ash and the AAFA samples at different ages.
After alkaline activation, the broad resonance band in raw fly ash shifted in all the AAFA
samples. The AAFA at 28 days demonstrated the greatest intensity of all Q4(mAl) units,
indicating the reaction products formed in the AAFA samples became more Si-rich than
that at 1 day and 7 days (Criado et al., 2008).

Chapter 6 Characterisation of AAFA Manufactured by Multi-stage Microwave Curing Regime
167
Figure 6.22 29Si NMR spectra of raw fly ash and M-Multi-4.5h at different ages
The shift of the main signal was detected from the deconvolution of the spectra, showing
that the shift of the main signal of Q4(4Al) from -85.6 ppm at 1 day to -87.0 ppm at both 7
days and 28 days (Table 6.11), implying the conversion of Al-rich phase into Si-rich phase.

Chapter 6 Characterisation of AAFA Manufactured by Multi-stage Microwave Curing Regime
168
Table 6.11 29Si signals of N-A-S-H gel in M-Multi-4.5h at different ages
Age Q4(4Al)
(ppm)
Q4(3Al)
(ppm)
Q4(2Al)
(ppm)
Q4(1Al)
(ppm)
Q4(0Al)
(ppm)
1 day -85.6 -92.0/-94.9 -98.1 -101.5 -105.7
7 days -87.0 -91.2/-94.8 -99.8 -103.6 -107.2
28 days -87.0 -95.0 -98.1 -101.8 -107.8
6.4.3.2 Microstructure
i) Pore structure
Figure 6.23 provides the information on the pore structure of hardened “M-Multi-4.5h” at
different ages. Figure 6.23a illustrates the curves of cumulative volume of mercury
intruded into the AAFA samples at 1 day, 7 days and 28 days. The total porosity of the
three AAFA samples was in the order of 1 day (20.99%) < 7 days (26.96%) < 28 days
(35.29%). Figure 6.23b shows the pores distribution in the three AAFA samples. With the
prolonged curing duration at ambient temperature, the pore size distribution curve of
AAFA samples shifted to finer pore ranges at 7 days and 28 days.

Chapter 6 Characterisation of AAFA Manufactured by Multi-stage Microwave Curing Regime
169
a. Cumulative pore volume versus pore diameter
b. Differential pore volume versus pore diameter
Figure 6.23 Pore size distributions of M-Multi-4.5h at different ages
Table 6.12 compares the pore size classification of “M-Multi-4.5h” at different curing ages.
With the aging of the AAFA, the total porosity and the total volume of the pores larger than
50 nm increased, which was in agreement with the strength reduction at 7 days and 28
days. Regarding the AAFA sample at 1 day, there was only capillary pores (100-500 nm
and >500 nm) observed. From 1 day to 7 days, the gel pores with size ranging at 50-100
nm were developed, accounting for ~16% of the total pore volume, and from 7 days to 28
days, the total volume of the gel pores less than 50 nm was dramatically increased (from
<2% to ~26%), which can be explained by the further polymerisation in AAFA and more
gel pores were formed.

Chapter 6 Characterisation of AAFA Manufactured by Multi-stage Microwave Curing Regime
170
Table 6.12 Comparison of pore size distribution of M-Multi-4.5h at different ages
ii) Morphology of fractured sample
Figure 6.24 presents the fractured surface of the AAFA at different ages after microwave
curing with the optimised curing regime. The reaction products formed on the surface of
fly ash particles and in the region between the fly ash particles can also be observed in
both samples.
All the three AAFA samples featured heterogeneous microstructure. Overall, the SEM
image of AAFA sample at 7 days and 28 days showed a slightly less dense structure
compared to the AAFA sample at 1 day, which is in agreement with the results obtained
for compressive strength (Table 6.8). MIP results also proved the increase of <100 nm
pores in the AAFA over the time.
Age Total pore volume
(mL/g)
Pore size distribution (mL/g) >50 nm
(mL/g) <50 nm 50~100 nm 100~500 nm >500 nm
1 day 0.1412 0 0 0.0742 0.0670 0.1412
7 days 0.1778 0.0033 0.0293 0.0746 0.0706 0.1745
28 days 0.2165 0.0573 0.0253 0.0811 0.0528 0.1592

Chapter 6 Characterisation of AAFA Manufactured by Multi-stage Microwave Curing Regime
171
a. 1 day
b. 7 days
c. 28 days
Figure 6.24 SEM images of M-Multi-4.5h at different ages
6.4.4 Discussion
In Chapter 2, it has been discussed that the steam curing can accelerate the strength gain
of PC-based concrete compared to normal curing at ambient temperature, but would
affect the long-term strength. The reason has been explained by the fact that, with the
rapid initial hydration, the hydration product, C-S-H gel, is formed with a poorer structure
and distributed less uniformly in the hardened cement paste, which results in a more

Chapter 6 Characterisation of AAFA Manufactured by Multi-stage Microwave Curing Regime
172
porous structure than that cured at ambient temperature. Furthermore, there is insufficient
time for the C-S-H gel to diffuse away from cement particles and precipitate uniformly in
the interstitial space at high curing temperature. The build-up of the hydration products
locally around the cement particles retards the further hydration, which hinders the further
strength gain in a long-term run (Neville, 2011).
For AAFA system, after conventional thermal curing, the strength of AAFA barely changed.
However, a great strength reduction was observed in 7-day strength (25%) and 28-day
strength (42%) of AAFA by microwave curing with a more violent heating process. The
comparison of the reaction products and microstructure developed under two different
curing methods is shown in Table 6.13 and Table 6.14.
From XRD results, there was no significant difference observed in crystalline phases over
curing duration under two different curing methods. However, changes of the structure of
N-A-S-H gel were observed in AAFAs with different curing regime over the time. First,
both FTIR and NMR results showed the transformation of Al-rich phase into Si-rich phase
with the aging of AAFA, but the content of AlO4 incorporated in the N-A-S-H from
microwave cured AAFA was higher than that from conventional thermal cured AAFA at all
ages. This could be explained that microwave curing accelerated the alkali activation and
resulted in the formation of Al-rich gel in a much shorter curing duration than conventional
thermal curing, which may hinder the further conversion of N-A-S-H gel from Al-rich phase
into Si-rich phase due to limited time for the diffusion of N-A-S-H gel. Second, it is
interesting to find that the DTG peak centred at 75oC in the conventional thermal cured
AAFA at 1 day increased to 105oC in the 7-day and 28-day AAFA samples, whilst the
DTG peak centred at 105oC in the microwave cured AAFA sample at 1 day decreased to
75oC in the 7-day and 28-day AAFA samples. One plausible explanation for strength loss
could be the N-A-S-H gel became less thermally stable in AAFA under microwave curing
over the time.
Furthermore, the development of microstructure of AAFA under conventional thermal
curing and microwave curing over the time showed remarkably difference. First, it was
found that there was no pores ranging <100 nm in AAFA immediately after microwave
curing, while that of 29% of total pore volume in AAFA under conventional thermal curing.
Second, the pores ranging > 50 nm in AAFA under microwave curing only decreased 2%
of total pore volume at 7 days, while 13% decrease in AAFA under conventional thermal
curing at the same age. In general, conventional thermal curing was beneficial for the
formation of a finer pore size distribution than microwave curing for AAFA samples. As
discussed in Section 3.3.2, water can be released from polymerisation process, which
may result in the formation of pores inside hardened AAFA product. Meantime, capillary

Chapter 6 Characterisation of AAFA Manufactured by Multi-stage Microwave Curing Regime
173
pores can be gradually filled by gel pores with further polymerisation over the time, which
has been proved by the observation that the pore size distribution curve shifted to finer
pore ranges over the time. The increase of total porosity over the time can be attributed
to the gel pores formed increasingly with the aging of AAFA regardless of the curing
method used.

Chapter 6 Characterisation of AAFA Manufactured by Multi-stage Microwave Curing Regime
174
Table 6.13 Summary of characterisation of O-85oC-24h at three ages
O-85oC-24h (conventional thermal curing)
Main findings 1 day 7 days 28 days
Strength 40.7 MPa 39.3 MPa 39.3 MPa
XRD Hydroxysodalite Hydroxysodalite Hydroxysodalite New zeolites formed remained
unchanged with the aging of AAFA Chabazite-Na Chabazite-Na Chabazite-Na
TG/DTG
DTG peak: 75oC DTG peak: 105oC DTG peak: 105oC N-A-S-H gel became more thermally
stable with the aging of AAFA Weight loss (N-A-S-H gel): 1d > 7d ≈ 28d
Temperature (DTG peak): 1d < 7d = 28d
FTIR T-O band: 980cm-1 T-O band: 978cm-1 T-O band: 982cm-1
Conversion of Al-rich gel into Si-rich
gel with the aging of AAFA
Move towards lower frequency and shift back towards higher frequency
29Si NMR Q4(4Al): -84.5 ppm Q4(4Al): -87.3 ppm Q4(4Al): -88.3 ppm
Intensity of the signal: 1d < 7d < 28d
MIP Total porosity: 20.39% Total porosity: 23.43% Total porosity: 30.05% More gel pores formed with the aging
of AAFA
SEM Homogeneous structure

Chapter 6 Characterisation of AAFA Manufactured by Multi-stage Microwave Curing Regime
175
Table 6.14 Summary of characterisaiton of M-Multi-4.5h at three ages
M-Multi-4.5h (multi-stage microwave curing)
Main findings 1 day 7 days 28 days
Strength 35.7 MPa 26.6 MPa 20.7 MPa Strength loss
XRD Hydroxysodalite Hydroxysodalite Hydroxysodalite New zeolites formed remained
unchanged with the aging of AAFA Chabazite-Na Chabazite-Na Chabazite-Na
TG/DTG
DTG peak centred at 105oC DTG peak centred at 75oC DTG peak centred at 75oC N-A-S-H gel became less thermally
stable with the aging of AAFA Weight loss (N-A-S-H gel): 7d > 28d > 1d
Temperature (DTG peak): 1d > 7d = 28d
FTIR T-O band: 975cm-1 T-O band: 974cm-1 T-O band: 977cm-1
Conversion of Al-rich gel into Si-rich
gel with the aging of AAFA
Move towards lower frequency and shift back towards higher frequency
NMR Q4(4Al): -85.6 ppm Q4(4Al): -87.0 ppm Q4(4Al): -87.0 ppm
Intensity of the signal: 1d ≈ 7d < 28d
MIP Total porosity: 20.99% Total porosity: 26.96% Total porosity: 35.29%
Finer pore size distribution
developed and more porous with the
aging of AAFA
SEM Homogeneous structure

Chapter 6 Characterisation of AAFA Manufactured by Multi-stage Microwave Curing Regime
176
Conclusions
The reaction products and microstructure of AAFA under difference curing regimes with
two heating resources were compared. The main conclusions are as follows:
1. Properties of AAFA samples immediately after conventional thermal curing and
microwave curing
Two new zeolitic phases of hydroxysodalite and chabazite-Na were formed in all
AAFA samples.
Conventional thermal cured AAFA (“O-85oC-24h” and “O-Multi-4.5h”) had lower
temperature of 75oC in DTG curves in comparison with 105oC in those samples
under microwave cured (“M-Multi-6h” and “M-Multi-4.5h”), implying the N-A-S-H
gel formed under microwave curing is more thermally stable.
N-A-S-H gel formed under microwave curing had a higher amount of AlO4 than
that formed under conventional thermal curing.
Conventional thermal curing resulted in a finer pore size distribution compared
to microwave curing.
2. Properties of AAFA samples at 7 days and 28 days after conventional thermal curing
and multi-stage microwave curing
The DTG peak centred at 75oC in the 1-day conventional thermal cured AAFA
sample increased to 105oC in the 7-day and 28-days AAFA samples, whilst the
DTG peak centred at 105oC in the 1-day microwave cured AAFA sample
decreased to 75oC in the 7-day and 28-day AAFA samples. The strength loss of
microwave cured AAFA samples could be explained by the less thermally stable
N-A-S-H gel formed over the time.
The T-O (T=Al, Si) band shifted to a lower frequency in the 1-day AAFA samples
and moved backwards to a higher frequency in the 28-day AAFA samples
regardless of the curing method used, implying the transformation of Al-rich gel
into Si-rich gel with the aging of AAFA samples. The transformation of the gel
was further verified by the 29Si NMR spectra of AAFA samples over curing
durations.

Chapter 6 Characterisation of AAFA Manufactured by Multi-stage Microwave Curing Regime
177
With the additional curing duration at ambient temperature, the pore size
distribution curves of AAFA samples shifted to finer pore ranges, which can be
explained that the further gelation of N-A-S-H in the AAFA samples and the
reaction products filled the pores inside the sample. All three AAFA samples
featured a heterogeneous microstructure in SEM image.

Chapter 7 Effect of Sample Size on Properties of AAFA Manufactured by Multi-stage Microwave Curing
178
Effect of Sample Size on Properties of Alkali-
activated Fly Ash Manufactured by Multi-stage Microwave
Curing
Introduction
In Chapter 2, it was discussed that steam curing may result in a thermal gradient in the
large Portland cement (PC)-based concrete elements, which affects the hydration of
cement and the strength development of concretes. As accelerated curing is essential for
the initiation of alkaline activation and the strength gain of alkali-activated fly ash (AAFA)
samples, the effect of sample size on the properties of AAFA under microwave curing
should be considered for future industrial applications.
In this chapter, AAFA with three different sizes, namely, 25×25×25mm, 50×50×50mm and
100×100×100mm were cured by the optimised microwave curing regime established in
Chapter 5 (Section 5.5.4) in comparison with those cured by thermal oven with similar
history of curing temperature. The compressive strengths of AAFA samples with three
sizes were compared after accelerated curing. The temperature changes inside the
samples were recorded by FBG sensors in real-time, and the temperature distribution on
the cross section of AAFA samples was also captured by infrared camera. The reaction
products and microstructure from different temperature regions were then characterised
to understand the effects of thermal gradient on the reaction mechanism of AAFA under
different accelerated curing methods.
Aims and objectives
The aim of this chapter was to investigate and compare the effect of sample size on the
properties of AAFA under multi-stage microwave curing and conventional thermal curing.
This was achieved through the following objectives:
1) To compare the temperature distribution within the AAFA samples with different
sizes under multi-stage microwave curing and conventional thermal curing;
2) To study the reaction products and the microstructure of AAFA samples with
different sizes under multi-stage microwave curing and conventional thermal
curing.
Chapter 7 Effect of Sample Size on Properties of AAFA Manufactured by Multi-stage Microwave Curing
179
Temperature history of alkali-activated fly ash with three different
sizes
7.3.1 Alkali-activated fly ash under multi-stage microwave curing
7.3.1.1 Real-time temperature monitoring by FBG sensor during microwave curing
process
The optimum multi-stage microwave curing regime obtained from Section 5.5.4 was
applied to AAFA samples with three sizes. During the curing process, the real-time
temperature changes were monitored by FBG sensors, and the thermal images on the
cross sections of the AAFA samples was captured by thermal camera. Figure 7.1
illustrates the temperature evolution inside three AAFA samples along with the
temperature changes inside the cavity of the microwave oven. The configuration of FBG
sensors embedded in three AAFA samples with different sizes has been given in Section
4.3.2.2.
The temperature history inside 25mm and 50mm samples followed the history of curing
temperature from the optimised multi-stage microwave curing regime. However, with the
size sample increased, the AAFA samples would not be evenly heated. When the sample
size was increased to 100mm, the top and the bottom positions showed the highest
temperature in the initial heating stage due to the exposure to the microwave radiation.
As the microwave curing processed, the temperature at the other three positions inside
the 100mm sample increased and even was higher than that at the top and bottom
positions, showing the thermal ingredient existed inside the large sample due to the
penetration of microwave and the thermal conduction. The temperature inside the 100mm
sample can be more accurately regulated by adjusting P and I values to avoid the
overshoot of the temperature within the sample (see Section 4.3.4.5).

Chapter 7 Effect of Sample Size on Properties of AAFA Manufactured by Multi-stage Microwave Curing
180
a. 25mm AAFA
b. 50mm AAFA
c. 100mm AAFA
Figure 7.1 Temperature evolution at central axis of alkali-activated fly ash samples
under multi-stage microwave curing

Chapter 7 Effect of Sample Size on Properties of AAFA Manufactured by Multi-stage Microwave Curing
181
7.3.1.2 Thermal image of temperature distribution obtained by infrared camera after multi-
stage microwave curing
Once the microwave curing was finished, the AAFA samples was horizontally split at half
height and the thermal image on the cross section was captured by thermal camera.
Figure 7.2 demonstrates the temperature distribution of the cross section in three AAFA
samples. All samples showed radiant temperature distribution on their cross sections
regardless of sample size, in which the position with highest temperature appeared at the
core and there was a thermal gradient from the core to the edge on the cross section.
Compared to conventional thermal curing (see Section 7.3.2), the three AAFA samples
with different sizes gained higher temperature by rapid microwave curing.
To compare the results of temperature distributions obtained by infrared camera, a
commercial simulation, COMSOL Multiphysics 4.3b (COMSOL, 2013) based on finite
element analysis, was employed to simulate the microwave curing process. The results
of dielectric properties obtained in Appendix A can be used as input for the simulation in
COMSOL. The simulated temperature distributions were shown in Appendix B, which can
be compared with the results obtained by infrared camera. Due to the limitations
discussed in Section 2.4.4, simulations results would not be able to give accurate
estimation of the temperature changes inside the samples cured in the microwave oven.

Chapter 7 Effect of Sample Size on Properties of AAFA Manufactured by Multi-stage Microwave Curing
182
a. 25mm AAFA
b. 50mm AAFA
c. 100mm AAFA
Figure 7.2 Temperature distribution on the cross section of alkali-activated fly ash
samples immediately after multi-stage microwave curing
7.3.2 Alkali-activated fly ash under conventional thermal curing
7.3.2.1 Real-time temperature monitoring by FBG sensor during the conventional curing
process
In comparison, the AAFA samples with three sizes under conventional thermal curing
were studied. Again, the real-time temperature changes inside the AAFA samples and in
the cavity of thermal oven were monitored by FBG sensor during the curing process. As
soon as the conventional thermal curing was completed, the samples were horizontally
split into two halves and the thermal images were captured at the cross sections by
infrared camera, which was completed within two minutes.

Chapter 7 Effect of Sample Size on Properties of AAFA Manufactured by Multi-stage Microwave Curing
183
Figure 7.3 illustrates the temperature evolution inside the AAFA samples and the
temperature change in the cavity of thermal oven. Dependent on thermal conduction, heat
transfer from the cavity of thermal oven to the AAFA samples was very slow. It can be
seen that there was a delay of temperature rising inside the AAFA samples under
conventional thermal curing.
For the 25mm AAFA sample, it was heated up steadily to 102oC, which was lower than
the target curing temperature of 125oC. For the 50mm AAFA sample, the temperature
difference at three measuring positions was within 5oC in the first hour, and the
temperature gradient inside the sample was eliminated gradually due to thermal
conduction. The maximum temperature inside the 50mm sample was 105oC. With the
size of the AAFA sample increased to 100mm, the temperature at the core of AAFA (T3)
was lower than that close to the top position (T1) in the first three hours due to the slow
thermal conduction. A maximum temperature difference of 8oC was found between the
core and the region close to the top position. The maximum temperature inside the
100mm sample was 118oC.

Chapter 7 Effect of Sample Size on the Properties of AAFA Manufactured by Multi-stage Microwave Curing
184
a. 25mm AAFA
b. 50mm AAFA
c. 100mm AAFA
Figure 7.3 Temperature evolution at central axis of alkali-activated fly ash samples
under conventional thermal curing

Chapter 7 Effect of Sample Size on the Properties of AAFA Manufactured by Multi-stage Microwave Curing
185
7.3.2.2 Thermal image of temperature distribution obtained by infrared camera after
conventional thermal curing
Figure 7.4 gives the thermal images of the cross sections of three AAFA samples
immediately after conventional thermal curing. It can be seen that the temperature
distributions was similar that the temperature decreased from the core to the edge. The
highest temperature was observed at the core of the cross section and the thermal
gradient was detected from core to edge. As all the temperature images were captured
after conventional thermal curing, the highest temperature in these three samples were
less than 100oC due to the heat loss.

Chapter 7 Effect of Sample Size on the Properties of AAFA Manufactured by Multi-stage Microwave Curing
186
a. 25mm AAFA
b. 50mm AAFA
c. 100mm AAFA
Figure 7.4 Temperature distribution on the cross section of alkali-activated fly ash
samples immediately after conventional thermal curing
Compressive strength and energy consumption of alkali-activated fly
ash with three sizes
7.4.1 Alkali-activated fly ash manufactured by multi-stage microwave curing
Figure 7.5 compares the compressive strength of AAFA with three different sizes after
multi-stage microwave curing. With the increase of the size, the strength of AAFA
decreased slightly.

Chapter 7 Effect of Sample Size on the Properties of AAFA Manufactured by Multi-stage Microwave Curing
187
Figure 7.5 Compressive strength of alkali-activated fly ash samples under multi-stage
microwave curing
Figure 7.6 gives the temperature profile of each AAFA sample at the core and the
microwave power profile from each microwave curing process. The total energy
consumption can be calculated by integrating the power history. Table 7.1 compares the
strength and energy consumption of the AAFA samples with three sizes. It can be seen
that compared to the 25mm AAFA sample, 50mm AAFA sample and 100mm AAFA
sample gained equivalent strength with higher energy consumption.

Chapter 7 Effect of Sample Size on the Properties of AAFA Manufactured by Multi-stage Microwave Curing
188
a. 25mm AAFA
b. 50mm AAFA
c. 100mm AAFA
Figure 7.6 Power profile and temperature profile (core) of alkali-activated fly ash
samples under multi-stage microwave curing

Chapter 7 Effect of Sample Size on the Properties of AAFA Manufactured by Multi-stage Microwave Curing
189
Table 7.1 Strength and energy consumption of alkali-activated fly ash samples with
multi-stage microwave curing
Sample size t1 (min) t2 (min) t3 (min) t4 (min) Strength
(MPa)
Energy
(kJ/MPa)
25mm 35 35 35 85 34.90 39.32
50mm 35 35 35 85 28.90 52.97
100mm 35 35 35 85 29.92 103.66
7.4.2 Alkali-activated fly ash manufactured by conventional thermal curing
Figure 7.7 shows the compressive strength of AAFA samples with different sizes after
conventional thermal curing. The three AAFA samples gained equivalent compressive
strength after 4.5 hours conventional thermal curing.
Figure 7.7 Compressive strength of alkali-activated fly ash samples under conventional
thermal curing
Table 7.2 compares the strength and energy consumption of the three AAFA samples
cured by similar curing regimes. As the samples were cured in one batch within the
conventional thermal oven, the electricity consumption was the same. In this calculation,
the sample load was not taken into account, which can be improved to make the energy
consumption more accurately.

Chapter 7 Effect of Sample Size on the Properties of AAFA Manufactured by Multi-stage Microwave Curing
190
Table 7.2 Strength and energy consumption of alkali-activated fly ash samples with
conventional thermal curing
Sample size t1
(min)
t2
(min)
t3
(min)
t4
(min)
Strength
(MPa)
Energy
(kJ/MPa)
25mm 35 35 35 85 31.67 409.39
50mm 35 35 35 85 32.52 409.39
100mm 35 35 35 85 30.25 409.39
Characterisation of 100mm alkali-activated fly ash in three
temperature regions
7.5.1 Alkali-activated fly ash cured by multi-stage microwave curing
7.5.1.1 Classification of temperature regions
As show in Figure 7.2c, it can be seen that the cross section of the 100mm AAFA sample
after microwave curing has an uneven temperature distribution. In order to study the
influence of the sample size on the temperature distribution and reaction products, the
cross section with the actual size of 100×100mm (shown in Figure 7.8) was divided into
three regions according to the temperature range difference, namely Region A, Region B
and Region C. The dashed line represents the Dp calculated from Appendix A. The details
of temperatures in these three regions are given in Table 7.3.

Chapter 7 Effect of Sample Size on the Properties of AAFA Manufactured by Multi-stage Microwave Curing
191
Figure 7.8 Temperature distribution on the cross section of 100mm alkali-activated fly
ash sample with multi-stage microwave curing
Table 7.3 Temperature distribution of 100mm alkali-activated fly ash sample with multi-
stage microwave curing
Region A
(Core)
Max. temperature: 113.9oC
Min. temperature: 109.2 oC
Average temperature: 112.2 oC
Region B
Max. temperature: 101.2 oC
Min. temperature: 96.7 oC
Average temperature: 99.1oC
Region C
(Edge)
Max. temperature: 89.3 oC
Min. temperature: 79.3 oC
Average temperature: 84.5 oC
7.5.1.2 Reaction products
i) X-ray diffraction
Figure 7.9 presents the XRD patterns of the raw fly ash and the AAFA from three
temperature regions. After the alkaline activation, the two new zeolitic phases of
hydroxysodalite and chabazite-Na was clearly identified in the Region C. The intensity of
the peaks representing these two zeolites was very weak in the Region B and Region A.

Chapter 7 Effect of Sample Size on the Properties of AAFA Manufactured by Multi-stage Microwave Curing
192
Figure 7.9 XRD patterns of raw fly ash and 100mm alkali-activated fly ash sample under
multi-stage microwave curing (Q-quartz, M-mullite, F-hematite, H-hydroxysodalite, N-
chabazite-Na)
ii) Thermogravimetric analysis
The TG/DTG curves of the AAFA from three temperature regions are shown in Figure
7.10. As shown in Figure 7.10a, the weight loss (50-200oC) of three AAFA samples is in
the order of Region A < Region B < Region C. In Figure 7.10b, the DTG curve exhibited
a broad peak between 50oC and 200oC in the AAFA from three regions.

Chapter 7 Effect of Sample Size on the Properties of AAFA Manufactured by Multi-stage Microwave Curing
193
a. TG
b. DTG
Figure 7.10 TG/DTG analysis of raw fly ash and 100mm alkali-activated fly ash sample
under multi-stage microwave curing
iii) Fourier transform infrared spectroscopy
Figure 7.11 presents the FTIR spectra of raw fly ash and the AAFA from different
temperature regions. After alkaline activation, the T-O band became sharper and shifted
towards a lower frequency of 984 cm-1 in the Region A, 983 cm-1 in the Region B and 980
cm-1 in the Region C, which is seen as the fingerprint of the formation of N-A-S-H gel in
the AAFA (Criado et al., 2007b). The observation of the T-O band shifted towards lower
frequency implies more Al tetrahedra are positioned in the N-A-S-H gel from the Region
B and the Region C than that from the Region A.

Chapter 7 Effect of Sample Size on the Properties of AAFA Manufactured by Multi-stage Microwave Curing
194
Figure 7.11 FTIR spectra of raw fly ash and 100mm alkali-activated fly ash sample under
microwave curing
iv) 29Si nuclear magnetic resonance spectroscopy
The 29Si NMR spectra of the raw fly ash and the AAFA from three different temperature
regions are illustrated in Figure 7.12. After alkaline activation, the broad resonance band
in the raw fly ash shifted in the three temperature regions of the AAFA. The deconvolution
of the spectra showed the shift of the main signal to -87.4 ppm in the Region C, -87.2 ppm
in the Region B and -87.4 ppm in the Region A (Table 7.4), implying the Si-rich phase
formed in these three regions. The intensity of the signal representing Q4(mAl) in the
Region A was higher than that in the Region B and Region C, implying that the Si-rich
phase was formed in the Region A.

Chapter 7 Effect of Sample Size on the Properties of AAFA Manufactured by Multi-stage Microwave Curing
195
Figure 7.12 29Si NMR spectra of raw fly ash and 100mm alkali-activated fly ash sample
under microwave curing
Table 7.4 29Si signals of N-A-S-H gel in 100mm alkali-activated fly ash under multi-stage
microwave curing
Sample Q4(4Al)
(ppm)
Q4(3Al)
(ppm)
Q4(2Al)
(ppm)
Q4(1Al)
(ppm)
Q4(0Al)
(ppm)
Region A -87.4 -93.9 -99.4 -102.5 -107.8
Region B -87.2 - -97.4 -104.8 -108.6
Region C -87.4 -95.9 -100.6 -104.9 -107.3
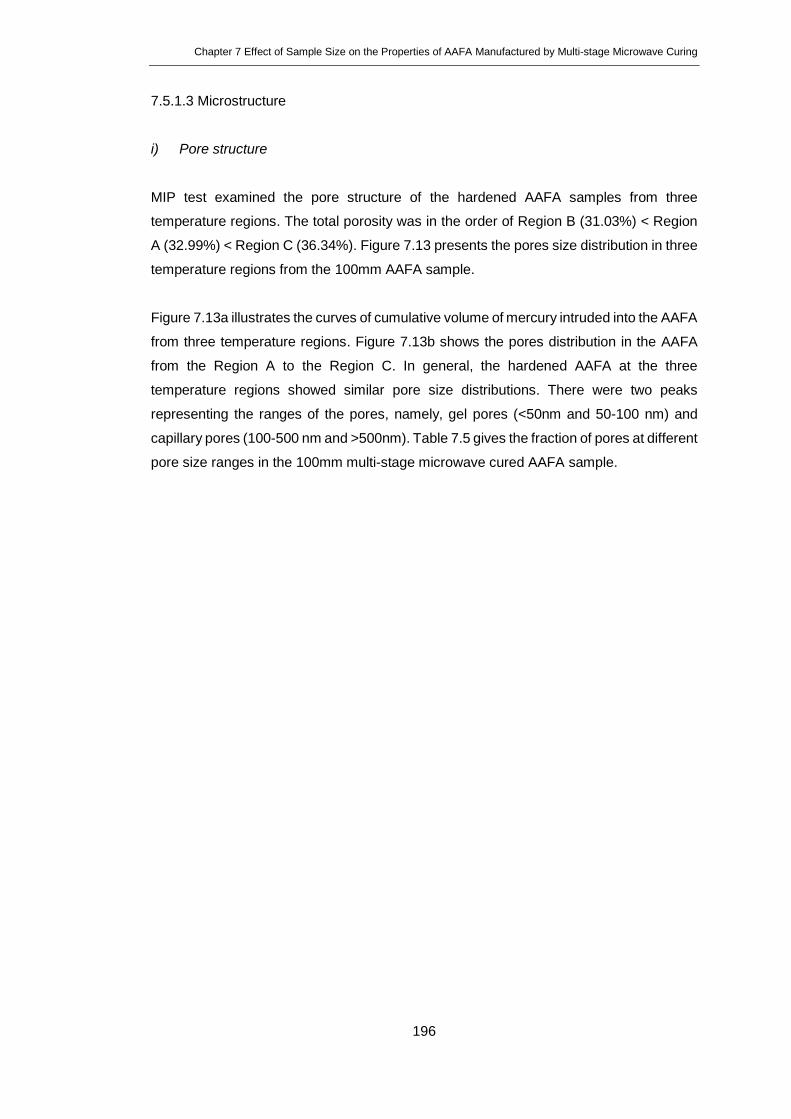
Chapter 7 Effect of Sample Size on the Properties of AAFA Manufactured by Multi-stage Microwave Curing
196
7.5.1.3 Microstructure
i) Pore structure
MIP test examined the pore structure of the hardened AAFA samples from three
temperature regions. The total porosity was in the order of Region B (31.03%) < Region
A (32.99%) < Region C (36.34%). Figure 7.13 presents the pores size distribution in three
temperature regions from the 100mm AAFA sample.
Figure 7.13a illustrates the curves of cumulative volume of mercury intruded into the AAFA
from three temperature regions. Figure 7.13b shows the pores distribution in the AAFA
from the Region A to the Region C. In general, the hardened AAFA at the three
temperature regions showed similar pore size distributions. There were two peaks
representing the ranges of the pores, namely, gel pores (<50nm and 50-100 nm) and
capillary pores (100-500 nm and >500nm). Table 7.5 gives the fraction of pores at different
pore size ranges in the 100mm multi-stage microwave cured AAFA sample.

Chapter 7 Effect of Sample Size on the Properties of AAFA Manufactured by Multi-stage Microwave Curing
197
a. Cumulative pore volume versus pore diameter
b. Differential pore volume versus pore diameter
Figure 7.13 Pore size distributions of 100mm alkali-activated fly ash sample under multi-
stage microwave curing
Table 7.5 Comparison of pore size distribution of multi-stage microwave cured AAFA at
different temperature regions
ii) Morphology of fractured sample
Figure 7.14 gives the SEM images of hardened AAFA from three temperature regions.
The two samples from the Region A and Region B featured heterogeneous microstructure
Sample Total pore volume
(mL/g)
Pore size distribution (mL/g)
<50 nm 50~100 nm 100~500 nm >500 nm
Region A 0.2140 0.0671 0.0208 0.0806 0.0455
Region B 0.2026 0.0522 0.0203 0.0739 0.0562
Region C 0.2130 0.0677 0.0185 0.0759 0.0509

Chapter 7 Effect of Sample Size on the Properties of AAFA Manufactured by Multi-stage Microwave Curing
198
and more compacted structure than the Region C. The reaction products formed on the
surface of fly ash particles and in the gap between the fly ash particles were also observed
in three temperature regions from the 100mm AAFA sample.
a. Region A
b. Region B
c. Region C
Figure 7.14 SEM images of 100mm alkali-activated fly ash sample under multi-stage
microwave curing

Chapter 7 Effect of Sample Size on the Properties of AAFA Manufactured by Multi-stage Microwave Curing
199
7.5.2 Alkali-activated fly ash cured by conventional thermal curing
7.5.2.1 Classification of temperature regions
As it can be seen from Figure 7.4c, the temperature distribution on the cross section of
100mm AAFA sample after conventional thermal curing is not uniform. To investigate the
influence of the sample size on the temperature distribution which, in turn, could affect the
reaction products and microstructure development, this thermal image of cross section in
actual size (100×100mm) is reproduced in Figure 7.15. There were three representative
regions identified according to temperature range difference, i.e. Region A, Region B and
Region C. The details of temperatures in these three regions are given in Table 7.6.
Figure 7.15 Temperature distribution on the cross section of 100mm alkali-activated fly
ash sample under conventional thermal curing

Chapter 7 Effect of Sample Size on the Properties of AAFA Manufactured by Multi-stage Microwave Curing
200
Table 7.6 Temperature regions of 100mm alkali-activated fly ash sample under
conventional thermal curing
Region A
(Core)
Max. temperaure: 89.4oC
Min. temperature: 86.5 oC
Average temperature: 88.1 oC
Region B
Max. temperaure: 83.5 oC
Min. temperature: 78.4 oC
Average temperature: 81.0 oC
Region C
(Edge)
Max. temperaure: 78.2 oC
Min. temperature: 70.5 oC
Average temperature: 74.8 oC
7.5.2.2 Reaction products
i) X-ray diffraction
Figure 7.16 presents the XRD patterns of the raw fly ash and the AAFA from the Region
A to the Region C. After the alkaline activation, two new crystalline phases representing
hydroxysodalite and chabazite-Na were clearly identified in these three temperature
regions from the AAFA sample (Criado et al., 2007a).
Figure 7.16 XRD patterns of raw fly ash and 100mm alkali-activated fly ash sample under
conventional thermal curing (Q-quartz, M-mullite, F-hematite, H-hydroxysodalite, N-
chabazite-Na)
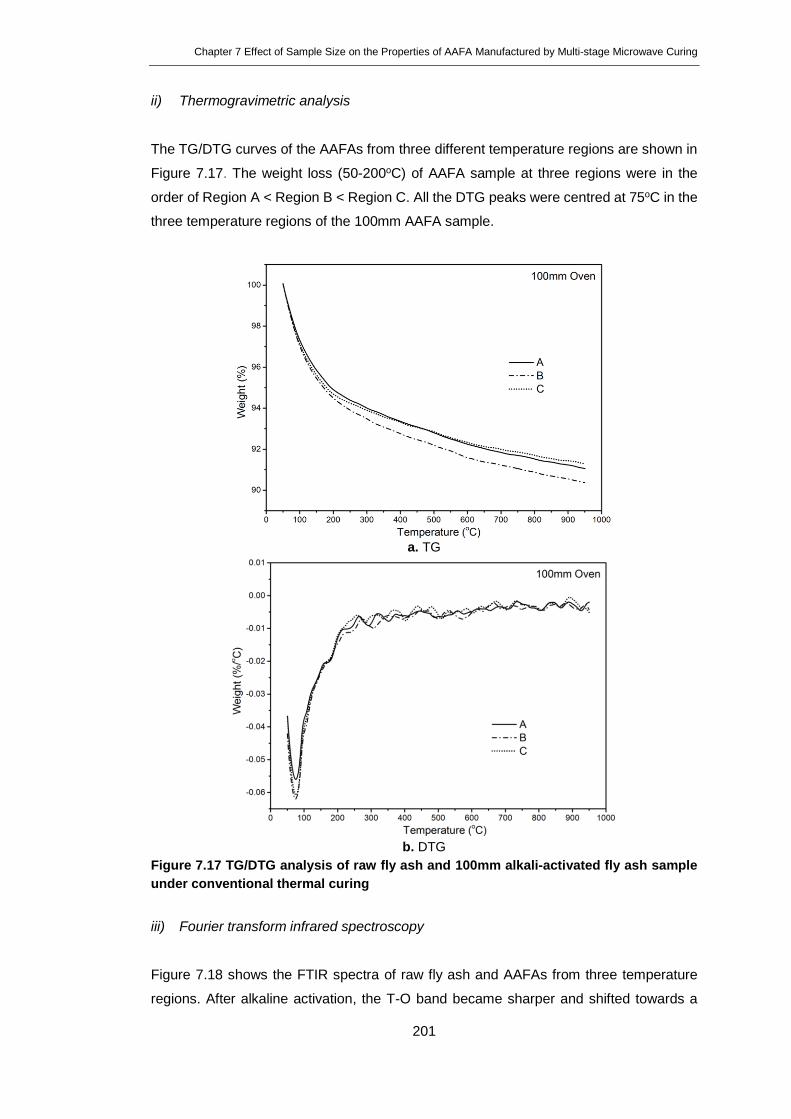
Chapter 7 Effect of Sample Size on the Properties of AAFA Manufactured by Multi-stage Microwave Curing
201
ii) Thermogravimetric analysis
The TG/DTG curves of the AAFAs from three different temperature regions are shown in
Figure 7.17. The weight loss (50-200oC) of AAFA sample at three regions were in the
order of Region A < Region B < Region C. All the DTG peaks were centred at 75oC in the
three temperature regions of the 100mm AAFA sample.
a. TG
b. DTG
Figure 7.17 TG/DTG analysis of raw fly ash and 100mm alkali-activated fly ash sample
under conventional thermal curing
iii) Fourier transform infrared spectroscopy
Figure 7.18 shows the FTIR spectra of raw fly ash and AAFAs from three temperature
regions. After alkaline activation, the T-O band became sharper and shifted towards a

Chapter 7 Effect of Sample Size on the Properties of AAFA Manufactured by Multi-stage Microwave Curing
202
lower frequency of 980 cm-1 in the Region A, which is seen as the fingerprint of the
formation of N-A-S-H gel in the AAFA sample (Fernandez-Jimenez and Palomo, 2005b).
The observation of the T-O band shifted towards lower frequency in the Region B and
Region C implied more Al tetrahedra were positioned in the N-A-S-H gel in these two
regions than in the Region A.
Figure 7.18 FTIR spectra of raw fly ash and 100mm alkali-activated fly ash sample under
conventional thermal curing
iv) 29Si nuclear magnetic resonance spectroscopy
The 29Si NMR spectra of the raw fly ash and AAFAs from three temperature regions are
illustrated in Figure 7.19. After alkaline activation, the broad resonance band in the raw
fly ash shifted in all three temperature regions. The deconvolution of the spectra showed
the shift of the main signal to -88.0 ppm in the Region C, and to -87.6 ppm in the Region
B and Region A (Table 7.7). The intensity of the signal representing Q4(mAl) in the Region

Chapter 7 Effect of Sample Size on the Properties of AAFA Manufactured by Multi-stage Microwave Curing
203
A was higher than that in the Region B and Region C, implying that the Si-rich phase was
formed in Region A (Fernandez-Jimenez et al., 2006d, Criado et al., 2008).
Figure 7.19 29Si NMR spectra of raw fly ash and 100mm alkali-activated fly ash sample
under conventional thermal curing
Table 7.7 29Si signals of N-A-S-H gel in 100mm alkali-activated fly ash under
conventional thermal curing
Sample Q4(4Al)
(ppm)
Q4(3Al)
(ppm)
Q4(2Al)
(ppm)
Q4(1Al)
(ppm)
Q4(0Al)
(ppm)
Region A -87.6 -91.2 -96.5 -101.6 -106.9
Region B -87.6 -91.2 -96.5 - -120.0
Region C -88.0 -92.0/-94.8 -98.8 -102.9 -106.9

Chapter 7 Effect of Sample Size on the Properties of AAFA Manufactured by Multi-stage Microwave Curing
204
7.5.2.3 Microstructure
i) Pore structure
The total porosity of the hardened AAFA samples from three temperature regions was in
the order of Region C (31.95%) < Region A (33.98%) < Region B (34.82%). Figure 7.20
presents the pores size distributions.
Figure 7.20a illustrates the curves of cumulative volume of mercury intruded into the AAFA
samples at different temperature regions. Figure 7.20b shows the pores distributions in
the three AAFA samples. In general, they all exhibited two ranges of the pores, namely,
gel pores (<50 nm and 50-100 nm) and capillary pores (100-500 nm and >500 nm). Table
7.8 compares the pore volume fractions in three temperature regions from conventional
thermal cured AAFA sample.

Chapter 7 Effect of Sample Size on the Properties of AAFA Manufactured by Multi-stage Microwave Curing
205
a. Cumulative pore volume versus pore diameter
b. Differential pore volume versus pore diameter
Figure 7.20 Pore size distributions of 100mm alkali-activated fly ash sample under
conventional thermal curing
Table 7.8 Comparison of pore size distribution of conventional thermal cured AAFA at
different temperature regions
ii) Morphology of fractured sample
Figure 7.21 presents the fractured surface of the AAFA sample from three different
regions. All the samples featured heterogeneous microstructure and compacted texture.
Sample Total pore volume
(mL/g)
Pore size distribution (mL/g)
<50 nm 50~100 nm 100~500 nm >500 nm
Region A 0.2209 0.0855 0.0213 0.0837 0.0304
Region B 0.2329 0.0867 0.0221 0.0910 0.0331
Region C 0.1909 0.0733 0.0166 0.0699 0.0311

Chapter 7 Effect of Sample Size on the Properties of AAFA Manufactured by Multi-stage Microwave Curing
206
The reaction products formed on the surface of fly ash particles and in the gap between
the fly ash particles were observed in the AAFA sample.
a. Region A
b. Region B
c. Region C
Figure 7.21 SEM images of 100mm alkali-activated fly ash sample under conventional
thermal curing

Chapter 7 Effect of Sample Size on the Properties of AAFA Manufactured by Multi-stage Microwave Curing
207
Discussion
Although microwave can lead to the rapid heating in the AAFA sample, the temperature
gradient was inevitably observed in the sample with large size, e.g. 100mm AAFA sample.
The highest temperature was found at the core and the temperature difference within the
AAFA sample was 27.7oC. A temperature difference (<80oC) was observed between
microwave oven cavity and the sample during microwave curing process, which may
result in thermal shock and affect the strength development adversely. This could be
another reason for strength loss at 7 days and 28 days of AAFA samples discussed in
Chapter 6. In the conventional thermal cured AAFA sample, the highest temperature was
found at the core and the temperature difference within the AAFA sample was 13.3oC.
There was a temperature difference (<40oC) between the oven cavity and the sample.
Automatic control of a thermal oven with temperature feedback could be achieved to
provide a more accurate curing environment. However, due to different heating
mechanisms, the temperature regulation in the thermal oven cannot be as accurate as
that in the microwave oven.
After accelerated curing, there was no significant difference on strength gain of AAFA
samples with two curing methods. However, microwave curing showed an advantage on
energy consumption over conventional thermal curing. To cure 100mm AAFA with
equivalent strength gain, microwave curing saved 75% energy compared to conventional
thermal curing,
Table 7.9 compares the reaction products and microstructure in three temperature regions
of the AAFA samples under multi-stage microwave curing and conventional thermal
curing. The effect of curing methods and curing temperature on the reaction products and
microwave structure of AAFA was discussed.
After alkaline activation, the zeolitic phases of hydroxysodalite and chabazite-Na were
formed in AAFA under both curing methods. Within the temperature range of 80-85oC
under multi-stage microwave curing and conventional thermal curing, both two zeolitic
phases were clearly identified in the 100mm AAFA samples. The DTG curves of AAFA
under microwave curing exhibited a broad peak between 50oC and 200oC in all
temperature regions, which was different from the sharp peak centred at 75oC observed
in the conventional thermal cured AAFA sample, indicating the thermal stability of N-A-S-
H gel formed under two curing methods were different.

Chapter 7 Effect of Sample Size on the Properties of AAFA Manufactured by Multi-stage Microwave Curing
208
After the alkaline activation, the observation of the T-O band in FTIR spectra shifted
towards lower frequency in both AAFA samples implies more Al tetrahedra are positioned
in the N-A-S-H gel from regions with lower temperature regardless of curing methods used,
which could be explained that higher temperature may benefit the further polymerisation.
The 29Si NMR spectra demonstrated similar trend that N-A-S-H gel formed in the Region
C with lower temperature was more Al-rich compared to that formed in the Region A with
higher temperature regardless of curing methods used.
The hardened AAFA at the three temperature regions showed similar microstructures.
There were two peaks representing the ranges of the pores, gel pores (<50 nm and 50-
100 nm) and capillary pores (100-500 nm and > 500 nm). Microwave cured AAFA had
more pores less than 50 nm and conventional thermal cured AAFA had less pores larger
than 500 nm. All the samples featured heterogeneous microstructure and compacted
texture. The gaps between the fly ash particles were filled with reaction products formed
on the crust of fly ash particles.
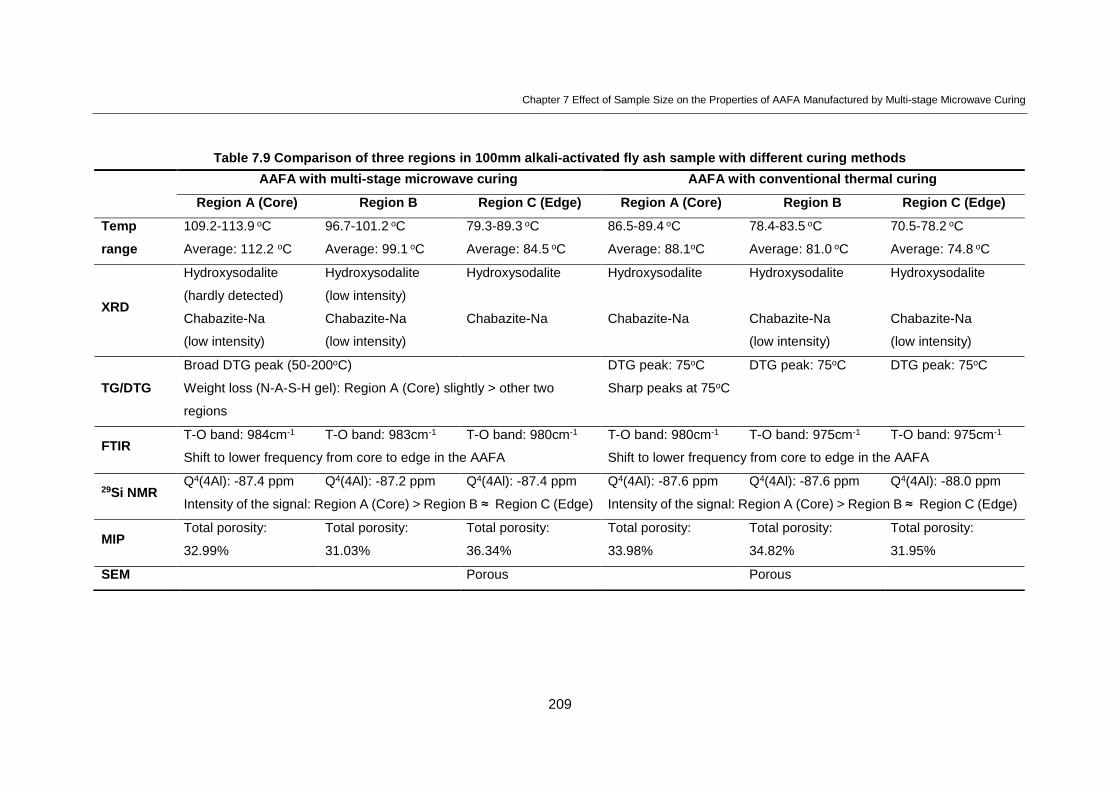
Chapter 7 Effect of Sample Size on the Properties of AAFA Manufactured by Multi-stage Microwave Curing
209
Table 7.9 Comparison of three regions in 100mm alkali-activated fly ash sample with different curing methods
AAFA with multi-stage microwave curing AAFA with conventional thermal curing
Region A (Core) Region B Region C (Edge) Region A (Core) Region B Region C (Edge)
Temp
range
109.2-113.9 oC
Average: 112.2 oC
96.7-101.2 oC
Average: 99.1 oC
79.3-89.3 oC
Average: 84.5 oC
86.5-89.4 oC
Average: 88.1oC
78.4-83.5 oC
Average: 81.0 oC
70.5-78.2 oC
Average: 74.8 oC
XRD
Hydroxysodalite
(hardly detected)
Chabazite-Na
(low intensity)
Hydroxysodalite
(low intensity)
Hydroxysodalite Hydroxysodalite Hydroxysodalite Hydroxysodalite
Chabazite-Na
(low intensity)
Chabazite-Na Chabazite-Na Chabazite-Na
(low intensity)
Chabazite-Na
(low intensity)
TG/DTG
Broad DTG peak (50-200oC) DTG peak: 75oC DTG peak: 75oC DTG peak: 75oC
Weight loss (N-A-S-H gel): Region A (Core) slightly > other two
regions
Sharp peaks at 75oC
FTIR T-O band: 984cm-1 T-O band: 983cm-1 T-O band: 980cm-1 T-O band: 980cm-1 T-O band: 975cm-1 T-O band: 975cm-1
Shift to lower frequency from core to edge in the AAFA Shift to lower frequency from core to edge in the AAFA
29Si NMR Q4(4Al): -87.4 ppm Q4(4Al): -87.2 ppm Q4(4Al): -87.4 ppm Q4(4Al): -87.6 ppm Q4(4Al): -87.6 ppm Q4(4Al): -88.0 ppm
Intensity of the signal: Region A (Core) > Region B ≈ Region C (Edge) Intensity of the signal: Region A (Core) > Region B ≈ Region C (Edge)
MIP Total porosity:
32.99%
Total porosity:
31.03%
Total porosity:
36.34%
Total porosity:
33.98%
Total porosity:
34.82%
Total porosity:
31.95%
SEM Porous Porous

Chapter 7 Effect of Sample Size on the Properties of AAFA Manufactured by Multi-stage Microwave Curing
210
Conclusions
The effect of sample size on the properties of AAFA under multi-stage microwave curing
and conventional thermal curing was investigated. The main conclusions are as follows:
1. Temperature distribution within the AAFA samples
Thermal gradients existed in 100mm AAFA samples regardless of the curing methods.
Although microwave can lead to the rapid heating in the AAFA sample, the temperature
gradient was inevitably observed in the sample with large size, e.g. 100mm AAFA sample.
The highest temperature was found at the core and the temperature difference within the
AAFA sample was 27.7oC. In the conventional thermal cured AAFA sample, the highest
temperature was found at the core and the temperature difference within the AAFA
sample was 13.3oC.
2. Strength gain and energy consumption
After accelerated curing, there was no significant difference on strength gain of AAFA
samples with two curing methods. To cure 100mm AAFA with equivalent strength gain,
microwave curing saved 75% energy compared to conventional thermal curing.
3. Reaction products
After alkaline activation, the zeolitic phases of hydroxysodalite and chabazite-Na were
formed in the AAFA samples under both curing methods. The thermal stability of the N-
A-S-H gel formed under two curing methods were different. The N-A-S-H formed in the
region with lower temperature was more Al-rich compared to that formed in the region
with higher temperature regardless of curing methods used.
4. Microstructure
The hardened AAFA samples at three temperature regions showed similar
microstructures. There were two peaks representing the ranges of the pores, gel pores
(<50 nm and 50-100 nm) and capillary pores (100-500 nm and > 500 nm). Microwave
cured AAFA had more pores less than 50 nm and conventional thermal curing AAFA had
less pores larger than 500 nm.

Chapter 8 Conclusions and Future Work
211
Conclusions and Future Work
Conclusions
8.1.1 Development of multi-stage microwave curing regime for manufacturing
alkali-activated fly ash
A multi-stage curing regime was developed and the microwave curing parameters were
systematically studied through experimental design to optimise microwave curing process
for manufacturing AAFA for the first time.
The curing process consisted of four stages, at which the curing temperatures were
set at 65oC, 85oC, 105oC and 125oC respectively. Rate of temperature rise
(dependent on Pmax) and the temperature step at 125oC were significant for the
strength development of the AAFA under microwave curing process.
The optimal multi-stage microwave curing regime obtained was: Pmax at 400W, at
65oC for 35 minutes, at 85oC for 35 minutes, at 105oC for 35 minutes and at 125oC
for 85 minutes.
Microwave curing provides a more energy-efficient way to manufacture AAFA in a
reduced curing time compare with conventional thermal curing.
8.1.2 Characterisation of alkali-activated fly ash manufactured with multi-stage
microwave curing regime
The compressive strength, the reaction product and the microstructure of the AAFA
sample under multi-stage microwave curing was investigated for the first time.
The microwave curing favoured the formation of Al-rich N-A-S-H gel in AAFA,
while conventional thermal curing gave rise to a Si-rich N-A-S-H gel.
Conventional thermal curing resulted in a finer pore size distribution compared
to microwave curing.

Chapter 8 Conclusions and Future Work
212
8.1.3 Effect of sample size on properties of alkali-activated fly ash
manufactured by multi-stage microwave curing
The effect of sample size on the properties of the AAFA manufactured by multi-stage
microwave curing regime was investigated for the first time.
Microwave can lead to the rapid heating in the AAFA sample, the temperature
gradient was inevitably observed in the sample with large size. To cure 100mm AAFA
with equivalent strength gain, microwave curing saved 75% energy compared to
conventional thermal curing.
After alkaline activation, the zeolitic phases of hydroxysodalite and chabazite-Na
were formed in AAFA under both curing methods. The N-A-S-H formed in the region
with lower temperature was more Al-rich compared to that formed in the region with
higher temperature regardless of curing methods used.
Microwave curing AAFA had more pores less than 50 nm and conventional thermal
curing AAFA had less pores larger than 500 nm.
Future work
8.2.1 Modification of design of microwave oven and further optimisation of
microwave curing regime
1) Modification of design of microwave oven
In the current microwave oven, the temperature in the cavity is lower than that inside
the AAFA sample, which may cause thermal shock to the sample. The microwave
oven should be further improved with the supply of heated air to reduce the
temperature difference between the microwave oven cavity and the AAFA sample.
The FBG sensor used for monitoring the temperature change is not robust enough.
The fibre of a FBG sensor embedded in the sample, which was placed on a turntable,
is vulnerable to be twisted. The fabrication of FBG sensor should be improved.

Chapter 8 Conclusions and Future Work
213
2) Further optimisation of microwave curing regime
In the current research, the curing duration at each temperature stage is curing
temperature dependent. The effect of curing duration and curing temperature on the
strength gain of AAFA samples and the properties of AAFA samples are not investigated
respectively. Two individual experimental matrices could be designed to study the single
effect.
8.2.2 Further study of mechanism of alkaline activation under microwave curing
1) Mechanism of alkaline activation under microwave curing
The N-A-S-H gel formed under multi-stage microwave curing was Al-rich, while the
gel formed under conventional thermal curing was Si-rich. It is worthwhile
investigating how the microwave curing affects the dissolution of silica and alumina
from fly ash and how the gelation is accelerated by microwave curing.
2) The evolution of reaction products of AAFA during microwave curing process and
after microwave curing process
It was observed that the strength of AAFA manufactured by multi-stage microwave
curing decreased at 7 days and 28 days, which could be explained by the conversion
of the reaction products during the continued curing at room temperature.
Quantitative analysis is necessary for monitoring the evolution of reaction products,
for example, the change of Si/Al ratio in the N-A-S-H gel (by EDS analysis).
8.2.3 Investigation of alkali-activated fly ash manufactured with various raw
materials and potential industrial application
1) In this research, only one type of fly ash activated with 8M NaOH solution was studied
under microwave curing condition. The methodology established could be applied to
various fly ashes activated by different activators with other dosages.
2) As this work only focuses at AAFA pastes, the microwave curing regime could be
applied to cure AAFA mortars and concretes, which could provide technical guidance
for industrial applications in the future.

214
Reference
ABELL, A. B., WILLIS, K. L. & LANGE, D. A., 1999. Mercury intrusion porosimetry and
image analysis of cement-based materials. Journal of Colloid and Interface
Science, 211, 39-44.
ABRAHAM, R. J., FISHER, J. & LOFTUS, P., 1994. Introduction to NMR Spectroscopy.
UK, John Wiley & Sons Ltd.
ACAA, 2014. 2013 Coal combustion product (CCP) production & use survey report. USA:
American Coal Ash Association.
ACI, 1980. ACI 517.2R-80. Accelerated curing of cocnrete at atmospheric pressure - State
of the art. American Concrete Institute.
AGGARWAL, V., GUPTA, S. M. & SACHDEVA, S. N., 2010. Concrete durability through
high volume fly ash concrete (HVFA) A literature review. International Journal of
Engineering Science and Technology, 2, 4473-4477.
AGILENT, 2006. Application Note. Basics of measuring the dielectric propertis of
materials.
AHMAD, M. A., SHAHNAWAZ, M., SIDDIQUI, M. F. & KHAN, Z. H., 2014. A statistical
review on the current scenario of generation and utilizaton of fly-ash in India.
International Journal of Current Engineering and Technology, 4, 2434-2438.
AKBARNEZHAD, A., KUANG, K. S. C. & ONG, K. C. G., 2011. Temperature sensing in
microwave heating of concrete using fibre Bragg grating sensors. Magazine of
Concrete Research, 63, 275-285.
ANDERSON, M. J. & WHITCOMB, P. J., 2007. DOE Simplified Practical Tools for
Effective Experimentation. New York, Productivity Press.
ANDINI, S., CIOFFI, R., COLANGELO, F., GRIECO, T., MONTAGNARO, F. & SANTORO,
L., 2008. Coal fly ash as raw material for the manufacture of geopolymer-based
products. Waste Management, 28, 416-423.
ATIS, C. D., GORUR, E. B., KARAHAN, O., BILIM, C., ILKENTAPAR, S. & LUGA, E.,
2015. Very high strength (120 MPa) Class F fly ash geopolymer mortar activated
at different NaOH amount, heat curing temperature and heat curing duration.
Construction and Building Materials, 96, 673-678.
BA, M. F., QIAN, C. X., GUO, X. J. & HAN, X. Y., 2011. Effects of steam curing on strength
and porous structure of concrete with low water/binder ratio. Construction and
Building Materials, 25, 123-128.

215
BAKHAREV, T., 2005a. Durability of geopolymer materials in sodium and magnesium
sulfate solutions. Cement and Concrete Research, 35, 1233-1246.
BAKHAREV, T., 2005b. Geopolymeric materials prepared using Class F fly ash and
elevated temperature curing. Cement and Concrete Research, 35, 1224-1232.
BELLA, B. D., BELLA, G. D., LAI, S. & PINNA, M., 1997. Application of microwaves for
the hyperaccelerated curing of precast concrete. 4th International Symposium on
Noteworthy Developments in Prestressing & Precasting, Singapore.
BENYOUNIS, K. Y., OLABI, A. G. & HASHMI, M. S. J., 2008. Multi-response optimization
of CO2 laser-welding process of austenitic stainless steel. Optics and Laser
Technology, 40, 76-87.
BERNAL, S. A. & PROVIS, J. L., 2014. Durability of alkali-activated materials: Progress
and perspectives. Journal of the American Ceramic Society, 97, 997-1008.
BEZERRA, M. A., SANTELLI, R. E., OLIVEIRA, E. P., VILLAR, L. S. & ESCALEIRA, L.
A., 2008. Response surface methodology (RSM) as a tool for optimization in
analytical chemistry. Talanta, 76, 965-977.
BINNER, J. G. P., HASSINE, N. A. & CROSS, T. E., 1995. The possible role of the pre-
exponential factor in explaining the increased reaction rates observed during the
microwave synthesis of titanium carbide. Journal of Materials Science, 30, 5389-
5393.
BRE, 1983. BS 1881-112:1983 Testing concrete - Part 112: Methods of accelerated
curing of test cubes.
BRE, 2000. BS EN 197-1:2000 Composition, specifications and conformity criteria for
common cements.
BRE, 2009. BS EN 12390-2:2009 Testing hardened concrete. Making and curing
specimens for strength tests.
BRE, 2011. BS EN 12390-3:2009 Testing hardened concrete Part 3: Compressive
strength of test specimens.
BSI, 2012. BS EN 60705:2012 Household microwave ovens - Methods for measuring
performance.
CAMPANONE, L. A. & ZARITZKY, N. E., 2005. Mathematical analysis of microwave
heating process. Journal of Food Engineering, 69, 359-368.
CARROLL, R. A., 2015. Coal combustion products in the United Kingdom and the
potential of stockpile ash. 2015 World of Coal Ash Nashville, Tennessee, USA.

216
CHATTERJEE, A. K., 2011. Indian fly Ashes: Their characteristics and potential for
mechanochemical activation for enhanced usability. Journal of Materials in Civil
Engineering, 23, 783-788.
CHEN, W. & DONG, X. P., 2012. Modification of the wavelength-strain coefficient of FBG
for the prediction of steel bar corrosion embedded in concrete. Optical Fiber
Technology, 18, 47-50.
CHI, M., 2015. Effects of modulus ratio and dosage of alkali-activated solution on the
properties and micro-structural characteristics of alkali-activated fly ash mortars.
Construction and Building Materials, 99, 128-136.
CHINA, 2014. Comprehensive utilization of resources in China (2014 Annual report).
National Development and Reform Commission of the People's Republic of China.
COMSOL, 2013. COMSOL Multiphysics 4.3b. USA.
CRIADO, A., PALOMO, A. & FERNANDEZ-JIMENEZ, A., 2005a. Alkali activation of fly
ashes. Part 1: Effect of curing conditions on the carbonation of the reaction
products. Fuel, 84, 2048-2054.
CRIADO, M., FERNANDEZ-JIMENEZ, A., DE LA TORRE, A. G., ARANDA, M. A. G. &
PALOMO, A., 2007a. An XRD study of the effect of the SiO2/Na2O ratio on the
alkali activation of fly ash. Cement and Concrete Research, 37, 671-679.
CRIADO, M., FERNANDEZ-JIMENEZ, A. & PALOMO, A., 2007b. Alkali activation of fly
ash: Effect of the SiO2/Na2O ratio Part I: FTIR study. Microporous and
Mesoporous Materials, 106, 180-191.
CRIADO, M., FERNANDEZ-JIMENEZ, A. & PALOMO, A., 2010. Alkali activation of fly
ash. Part III: Effect of curing conditions on reaction and its graphical description.
Fuel, 89, 3185-3192.
CRIADO, M., FERNANDEZ-JIMENEZ, A., PALOMO, A., SOBRADOS, I. & SANZ, J.,
2008. Effect of the SiO2/Na2O ratio on the alkali activation of fly ash. Part II: 29Si
MAS-NMR Survey. Microporous and Mesoporous Materials, 109, 525-534.
CRIADO, M., JIMENEZ, A. F., SOBRADOS, I., PALOMO, A. & SANZ, J., 2012. Effect of
relative humidity on the reaction products of alkali activated fly ash. Journal of the
European Ceramic Society, 32, 2799-2807.
CRIADO, M., PALOMO, A. & FERNANDEZJIMENEZ, A., 2005b. Alkali activation of fly
ashes. Part 1: Effect of curing conditions on the carbonation of the reaction
products. Fuel, 84, 2048-2054.

217
DAVIDOVITS, J., 2011. Geopolymer Chemistry and Applications. France, Institut
Geopolymere.
DEMIRSKYI, D., AGRAWAL, D. & RAGULYA, A., 2013. Comparisons of grain size-
density trajectory during microwave and conventional sintering of titanium nitride.
Journal of Alloys and Compounds, 581, 498-501.
DUXSON, P., FERNANDEZ-JIMENEZ, A., PROVIS, J. L., LUKEY, G. C., PALOMO, A. &
VAN DEVENTER, J. S. J., 2007a. Geopolymer technology: the current state of
the art. Journal of Materials Science, 42, 2917-2933.
DUXSON, P., PROVIS, J. L., LUKEY, G. C., MALLICOAT, S. W., KRIVEN, W. M. & VAN
DEVENTER, J. S. J., 2005a. Understanding the relationship between geopolymer
composition, microstructure and mechanical properties. Colloids and Surfaces A:
Physicochemical and Engineering Aspects, 269, 47-58.
DUXSON, P., PROVIS, J. L., LUKEY, G. C., SEPAROVIC, F. & VAN DEVENTER, J. S.
J., 2005b. 29Si NMR study of structural ordering in aluminosilicate geopolymer
gels. Langmuir, 21, 3028-3036.
DUXSON, P., PROVIS, J. L., LUKEY, G. C. & VAN DEVENTER, J. S. J., 2007b. The role
of inorganic polymer technology in the development of 'green concrete'. Cement
and Concrete Research, 37, 1590-1597.
DYER, A., 1988. An Introduction to Zeolite Molecular Sieves. UK, John Wiley & Sons Ltd.
ERDEM, T. K., TURANLI, L. & ERDOGAN, T. Y., 2003. Setting time: An important
criterion to determine the length of the delay period before steam curing of
concrete. Cement and Concrete Research, 33, 741-745.
FABIANO-TIXIER, A., ELOMRI A., BLANCKAERT A., SEGUIN E., PETITCOLAS, E. &
CHEMAT, F., 2011. Rapid and green analytical method for the determination of
quinoline alkaloids from cinchona succirubra based on microwave-integrated
extraction and leaching (MIEL) prior to high performance liquid chromatography.
International Journal of Molecular Sciences, 12, 7846-7860.
FERNANDEZ-JIMENEZ, A., DE LA TORRE, A. G., PALOMO, A., LOPEZ-OLMO, G.,
ALONSO, M. M. & ARANDA, M. A. G., 2006a. Quantitative determination of
phases in the alkali activation of fly ash. Part I. Potential ash reactivity. Fuel, 85,
625-634.
FERNANDEZ-JIMENEZ, A., DE LA TORRE, A. G., PALOMO, A., LOPEZ-OLMO, G.,
ALONSO, M. M. & ARANDA, M. A. G., 2006b. Quantitative determination of
phases in the alkaline activation of fly ash. Part II: Degree of reaction. Fuel, 85,
1960-1969.

218
FERNANDEZ-JIMENEZ, A., GARCÍA-LODEIRO, I. & PALOMO, A., 2006c. Durability of
alkali-activated fly ash cementitious materials. Journal of Materials Science, 42,
3055-3065.
FERNANDEZ-JIMENEZ, A. & PALOMO, A., 2003. Characterisation of fly ashes. Potential
reactivity as alkaline cements. Fuel, 82, 2259-2265.
FERNANDEZ-JIMENEZ, A. & PALOMO, A., 2005a. Composition and microstructure of
alkali activated fly ash binder: Effect of the activator. Cement and Concrete
Research, 35, 1984-1992.
FERNANDEZ-JIMENEZ, A. & PALOMO, A., 2005b. Mid-infrared spectroscopic studies of
alkali-activated fly ash structure. Microporous and Mesoporous Materials, 86, 207-
214.
FERNANDEZ-JIMENEZ, A., PALOMO, A. & CRIADO, M., 2005. Microstructure
development of alkali-activated fly ash cement: a descriptive model. Cement and
Concrete Research, 35, 1204-1209.
FERNANDEZ-JIMENEZ, A., PALOMO, A., PASTOR, J. Y. & MARTIN, A., 2008. New
cementitious materials based on alkali-activated fly ash: performance at high
temperatures. Journal of the American Ceramic Society, 91, 3308-3314.
FERNANDEZ-JIMENEZ, A., PALOMO, A., SOBRADOS, I. & SANZ, J., 2006d. The role
played by the reactive alumina content in the alkaline activation of fly ashes.
Microporous and Mesoporous Materials, 91, 111-119.
FONTA, P., 2013. New data for cement industry shows reductions in CO2 emission. World
Cement.
GOLDSTEIN, J., 2003. Scanning Electron Microscopy and X-Ray Microanalysis. London,
Kluwer Academic/Plenum Publishers.
GUNASEKARAN, S. & YANG, H. W., 2007. Optimization of pulsed microwave heating.
Journal of Food Engineering, 78, 1457-1462.
HANSON, J. A., 1963. Optimum steam curing procedure in precasting plants. ACI Journal
60, 75-99.
HEWLETT, P. C., 1998. Lea's Chemistry of Cement and Concrete. London, Arnold.
HOLMAN, J. P., 2002. Heat Transfer. London, McGraw-Hill.
HOSSAN, M. R., BYUN, D. & DUTTA, P., 2010. Analysis of microwave heating for
cylindrical shaped objects. International Journal of Heat and Mass Transfer, 53,
5129-5138.

219
HUTCHISON, R. G., CHANG, J. T., JENNINGS, H. M. & BRODWIN, M. E., 1991. Thermal
acceleration of Portland cement mortars with microwave energy. Cement and
Concrete Research, 21, 795-799.
HWANG, S. D., KHATIB, R., LEE, H. K., LEE, S. H. & KHAYAT, K. H., 2012. Optimization
of steam-curing regime for high-strength, self-consolidating concrete for precast,
prestressed concrete applications. PCI Journal, 48-62.
JUMRAT, S., CHATVEERA, B. & RATTANADECHO, P., 2011. Dielectric properties and
temperature profile of fly ash-based geopolymer mortar. International
Communications in Heat and Mass Transfer, 38, 242-248.
KATZ, A., 1998. Microscopic study of alkali-activated fly ash. Cement and Concrete
Research, 28, 197-208.
KHOYLOU, A., DEBS, M., SHI, S., BAI, Y., FABIAN, M., SUN, T., GRATTAN, K. T. V. &
MCKINNON, B., 2014. Dielectric properties and numerical modelling of
microwave heating of Portland cement fly ash blends. 34th Cement and Concrete
Science Conference, 14-16 September, Sheffield, England, UK.
KORPA, A. & TRETTIN, R., 2008. Very high early strength of ultra-high performance
concrete containing nanoscale pozzolans using the microwave heat curing
method. Advances in Cement Research, 20, 175-184.
KOVALCHUK, G., FERNANDEZ-JIMENEZ, A. & PALOMO, A., 2007. Alkali-activated fly
ash: Effect of thermal curing conditions on mechanical and microstructural
development - Part II. Fuel, 86, 315-322.
KUMAR, S., KUMAR, R., ALEX, T. C., BANDOPADHYAY, A. & MEHROTRA, S. P., 2007.
Influence of reactivity of fly ash on geopolymerisation. Advances in Applied
Ceramics, 106, 120-127.
LEUNG, C. K. Y. & PHEERAPHAN, T., 1995. Very high early strength of microwave cured
concrete. Cement and Concrete Research, 25, 136-146.
LEUNG, C. K. Y. & PHEERAPHAN, T., 1997. Determination of optimal process for
microwave curing of concrete. Cement and Concrete Research, 27, 463-472.
LEVITT, M., 2008. Precast Concrete: Materials, Manufacture, Properties and Usage.
London, Taylor & Francis.
LIU, B. J., XIE, Y. J. & LI, H., 2005. Influence of steam curing on the compressive strength
of concrete containing supplementary cementing materials. Cement and Concrete
Research, 35, 994-998.
LIU, C.P., 2016. Unpublished and private communication.

220
LONG, G. C., OMRAN, A. & HE, Z. M., 2012. Heat damage of steam curing on the surface
layer of concrete. Magazine of Concrete Research, 64, 995-1004.
MA, Y., HU, J. & YE, G., 2012. The effect of activating solution on the mechanical strength,
reaction rate, mineralogy, and microstructure of alkali-activated fly ash. Journal of
Materials Science, 47, 4568-4578.
MA, Y., HU, J. & YE, G., 2013. The pore structure and permeability of alkali activated fly
ash. Fuel, 104, 771-780.
MA, Y. W., 2013. Microstructure and engineering properties of alkali activated fly ash.
Doctor of Philosophy, Delft University of Technology.
MAK, S. L., RITCHIE, D., SHAPIRO, G. & BANKS, R., 2001. Rapid microwave curing of
precast concrete slab elements. Recent Advances in Concrete Technology, 537-
552.
MAKUL, N. & AGRAWAL, D. K., 2011. Influence of microwave-accelerated curing
procedures on the microstructure and strength characteristics of Type I-Portland
cement pastes. Journal of Ceramic Processing Research, 12, 376-381.
MAKUL, N., CHATVEERA, B. & RATANADECHO, P., 2009. Use of microwave energy for
accelerated curing of concrete: a review. Songklankarin Journal of Science and
Technology, 31, 1-13.
MAKUL, N., KEANGIN, P., RATTANADECHO, P., CHATVEERA, B. & AGRAWAL, D. K.,
2010a. Microwave-assisted heating of cementitious materials: Relative dielectric
properties, mechanical property, and experimental and numerical heat transfer
characteristics. International Communications in Heat and Mass Transfer, 37,
1096-1105.
MAKUL, N., RATTANADECHO, P. & AGRAWAL, D. K., 2010b. Microwave curing at an
operating frequency of 2.45 GHz of Portland cement paste at early-stage using a
multi-mode cavity: Experimental and numerical analysis on heat transfer
characteristics. International Communications in Heat and Mass Transfer, 37,
1487-1495.
MAKUL, N., RATTANADECHO, P. & AGRAWAL, D. K., 2014. Applications of microwave
energy in cement and concrete - A review. Renewable & Sustainable Energy
Reviews, 37, 715-733.
MCCALL, W. C., 1996. Accelerated concrete curing: The basics.
MCHW, 2005. Manual of contract documents for highway works. Volume 1: Specification
for highway works.

221
MEHTA, P. K., 2004. High-performance, high-volume fly ash concrete for sustainable
development. Proceedings of the International Workshop on Sustainable
Development and Concrete Technology, 3-14.
MEHTA, P. K. & MONTEIRO, P. J. M., 2005. Concrete: Microstructure, Properties, and
Materials. London, McGraw-Hill.
MENCZEL, J. D. & PRIME, R. B., 2009. Thermal Analysis of Polymers Fundamentals and
Applications, NJ, John Wiley & Sons, Inc.
METAXAS, A. C. & MEREDITH, R. J., 1983. Industrial Microwave Heating. London,
Peregrinus on behalf of the Institution of Electrical Engineers.
MINDESS, S., YOUNG, J. F. & DARWIN, D., 2002. Concrete. Upper Saddle River, NJ,
Prentice Hall.
MIRANDA, J. M., FERNÁNDEZ-JIMÉNEZ, A., GONZÁLEZ, J. A. & PALOMO, A., 2005.
Corrosion resistance in activated fly ash mortars. Cement and Concrete Research,
35, 1210-1217.
MOKHTAR, M. R., SUN, T. & GRATTAN, K. T. V., 2012. Bragg grating packages with
nonuniform dimensions for strain and temperature sensing. IEEE Sensors Journal,
12, 139-144.
MONTGOMERY, D. C., 2009. Design and Analysis of Experiments. Asia, John Wiley &
Sons, Inc.
NATIONAL INSTRUMENTS, 2013. LabVIEW 5.5. USA.
NEVILLE, A. M. 2011. Properties of Concrete. Harlow, London, Prentice Hall.
NEVILLE, A. M. & BROOKS, J. J., 2010. Concrete Technology. England, Pearson
Education Limited.
O'FARRELL, M., SHERIDAN, C., LEWIS, E., ZHAO, W. Z., SUN, T., GRATTAN, K. T. V.,
KERRY, J. & JACKMAN, N., 2007. Design of a slim-line integrated probe using
optical fibre technology that is suitable for microwave environments and measures
reflection spectroscopy and temperature. IEEE Sensors Journal, 1-3, 652-655.
ONG, K. C. G. & AKBARNEZHAD, A., 2015. Microwave-Assisted Concrete Technology:
Microwave-Assisted Concrete Technology. Boca Raton, CRC Press.
PALOMO, A., ALONSO, S. & FEMANDEZ-JIMENEZ, A., 2004. Alkaline activation of fly
ashes: NMR study of the reaction products. Journal of the American Ceramic
Society, 87, 1141-1145.
PALOMO, A., GRUTZECK, M. W. & BLANCO, M. T., 1999. Alkali-activated fly ashes - A
cement for the future. Cement and Concrete Research, 29, 1323-1329.

222
PERA, J., AMBROISE, J. & ORIOL, M., 1997. Microwave processing of glass-fiber
reinforced composites - Modification of the microstructure. Advanced Cement
Based Materials, 6, 116-122.
PHEERAPHAN, T., CAYLIANI, L., DUMANGAS, M. I. & NIMITYONGSKUL, P., 2002.
Prediction of later-age compressive strength of normal concrete based on the
accelerated strength of concrete cured with microwave energy. Cement and
Concrete Research, 32, 521-527.
PROVIS, J. L. & DEVENTER, J. S. J., 2009. Geopolymers: Structure, Processing,
Properties and Industrial Applications. Cambridge, UK, Woodhead Publishing
Limited.
PROVIS, J. L. & VAN DEVENTER, J. S. J., 2007. Geopolymerisation kinetics. 1. In situ
energy-dispersive X-ray diffractometry. Chemical Engineering Science, 62, 2309-
2317.
PROVIS, J. L. & VAN DEVENTER, J. S. J., 2014. Alkali-activated materials: state-of-the-
art report. RILEM TC 224-AAM. Dordrecht, Netherlands: RILEM.
PUERTAS, F., AMAT, T., FERNANDEZ-JIMENEZ, A. & VAZQUEZ, T., 2003. Mechanical
and durable behaviour of alkaline cement mortars reinforced with polypropylene
fibres. Cement and Concrete Research, 33, 2031-2036.
R.G. HUTCHISON I, J.T. CHANG, H.M. JENNINGS & BRODWIN, M. E., 1991. Thermal
acceleration of Portland cement mortars with microwave energy. Cement and
Concrete Research, 21, 795-799.
RAJ, J. D., BIRLA, S., PITCHAI, K., SUBBIAH, J. & JONES, D., 2011. Modeling of
microwave heating of a rotation object in domestic oven. Proceedings of the 2011
COMSOL Conference, Boston.
RATTANADECHO, P., SUWANNAPUM, N. & CHA-UM, W., 2009. Interactions between
electromagnetic and thermal fields in microwave heating of hardened Type I-
cement paste using a rectangular waveguide (influence of frequency and sample
size). Journal of Heat Transfer-Transactions of the Asme, 131.
RATTANADECHO, P., SUWANNAPUM, N., CHATVEERA, B., ATONG, D. & MAKUL, N.,
2008. Development of compressive strength of cement paste under accelerated
curing by using a continuous microwave thermal processor. Materials Science and
Engineering A: Structural Materials Properties Microstructure and Processing,
472, 299-307.
RATTANASAK, U. & CHINDAPRASIRT, P., 2009. Influence of NaOH solution on the
synthesis of fly ash geopolymer. Minerals Engineering, 22, 1073-1078.

223
REES, C. A., PROVIS, J. L., LUKEY, G. C. & VAN DEVENTER, J. S. J., 2007. In situ
ATR-FTIR study of the early stages of fly ash geopolymer gel formation. Langmuir,
23, 9076-9082.
RUIZ-SANTAQUITERIA, C., SKIBSTED, J., FERNANDEZ-JIMENEZ, A. & PALOMO, A.,
2012. Alkaline solution/binder ratio as a determining factor in the alkaline
activation of aluminosilicates. Cement and Concrete Research, 42, 1242-1251.
SANTOS, T., COSTA, L. C., VALENTE, M., MONTERIO, J. & SOUSA, J., 2010. 3D
electromagnetic field simulation in microwave ovens: a tool to control therml
runaway. Proceedings of the 2010 COMSOL Conference, Paris.
SAUL, A. G. A., 1951. Principles underlying the steam curing of concrete at atmospheric
pressure. Magzine of Concrete Research. London.
SCHINDLER, A. K. & FOLLIARD, K. J., 2005. Heat of hydration models for cementitious
materials. ACI Materials Journal, 102, 24-33.
SEAR, L. K. A., 2001. Properties and Use of Coal Fly Ash: A Valuable Industrial By-
product. London, Thomas Telford Publishing.
SHI, C. J., JIMENEZ, A. F. & PALOMO, A., 2011. New cements for the 21st century: The
pursuit of an alternative to Portland cement. Cement and Concrete Research, 41,
750-763.
SHI, C. J., KRIVENKO, P. V. & ROY, D. G., 2006. Alkali-Activated Cements and
Concretes. London, Taylor & Francis.
SHI, S., BAI, Y., FABIAN, M., AMS, M., SUN, T., GRATTAN, K. T. V., LI, H., XU, D. L. &
BASHEER, P. A. M., 2014a. Microwave curing techniques for manufacturing
alkali-activated fly ash. 34th Cement and Concrete Science Conference, 14-16
September, Sheffield, England, UK.
SHI, S., BAI, Y., LI, H., XU, D. L. & BASHEER, P. A. M., 2014b. Comparative study of
alkali-activated fly ash manufactured under pulsed microwave curing and thermal
oven curing. 4th International Conference on the Durability of Concrete Structures,
24-26 July, Purdue University, West lafayette, Indiana, USA.
SHIDELER, J. J., 1963. Low pressure steam curing. ACI Journal 60, 953-985.
SMITH, B. C., 2011. Fundamentals of Fourier Transform Infrared Spectroscopy. London,
CRC Press.
SOHN, D. G. & JOHNSON, D. L., 1999. Microwave curing effects on the 28-day strength
of cementitious materials. Cement and Concrete Research, 29, 241-247.

224
SOMARATNA, J., RAVIKUMAR, D. & NEITHALATH, N., 2010. Response of alkali
activated fly ash mortars to microwave curing. Cement and Concrete Research,
40, 1688-1696.
SOROKA, I., JAEGERMANN, C. H. & BENTUR, A., 1978. Short-term steam-curing and
concrete later-age strength. Materials and Structures, 11, 93-96.
SOSA-MORALES, M. E., VALERIO-JUNCO, L., LOPEZ-MALO, A. & GARCIA, H. S.,
2010. Dielectric properties of foods: Reported data in the 21st century and their
potential applications. Lwt-Food Science and Technology, 43, 1169-1179.
SUN, A. & WU, Z. S., 2012. Temperature insensitive bending sensor based on
microbending FBG cladding mode recoupling. Microwave and Optical Technology
Letters, 54, 1674-1676.
TAYLOR, H. F. W., 1996. Special issue - Delayed ettringite formation. Cement & Concrete
Composites, 18, 157-159.
TAYLOR, H. F. W., FAMY, C. & SCRIVENER, K. L., 2001. Delayed ettringite formation.
Cement and Concrete Research, 31, 683-693.
THOMPSON, M. S. & LAING, J., 1969. The selection of optimum steam-curing regimes
for large concrete components. Concrete.
TOPCU, I. B., TOPRAK, M. U. & AKDAG, D., 2008. Determination of optimal microwave
curing cycle for fly ash mortars. Canadian Journal of Civil Engineering, 35, 349-
357.
TORRENTI, J., REYNOUARD, J. & PIJAUDIER-CABOT, G., 2010. Mechanical Behaviour
of Concrete. London, ISTE.
TURKEL, S. & ALABAS, V., 2005. The effect of excessive steam curing on Portland
composite cement concrete. Cement and Concrete Research, 35, 405-411.
VADIVAMBAL, R. & JAYAS, D. S., 2010. Non-uniform temperaturedistribution during
microwave heating of food materials-A review. Food and Bioprocess Technology,
3, 161-171.
VAN DEVENTER, J. S. J., PROVIS, J. L. & DUXSON, P., 2012. Technical and
commercial progress in the adoption of geopolymer cement. Minerals Engineering,
29, 89-104.
VINNOLIT, 2011. Caustic Soda Solution (NaOH 50%).
WASEDA, Y., MATSUBARA, E. & SHINODA, K., 2011. X-Ray Diffraction Crystallography:
Introduction, Examples and Solved Problems. Berlin, Springer.

225
WHITTAKER, A. G., MOUNT, A. R. & HEAL, M. R., 2000. Physical Chemistry. USA, BIOS
Scentific Publisher Limited.
WINNEFELD, F., LEEMANN, A., LUCUK, M., SVOBODA, P. & NEUROTH, M., 2010.
Assessment of phase formation in alkali activated low and high calcium fly ashes
in building materials. Construction and Building Materials, 24, 1086-1093.
WINNIPEG, T. C. O., 2012. WSTP South End Plant Process Selection Report (Appendix
H Emission factors in kg CO2-equivalent per unit).
WON, I., NA, Y., KIM, J. T. & KIM, S., 2013. Energy-efficient algorithms of the steam
curing for the in situ production of precast concrete members. Energy and
Buildings, 64, 275-284.
WORRELL, E., PRICE, L., MARTIN, N., HENDRIKS, C. & MEIDA, L. O., 2001. Carbon
dioxide emission from the global cement industry. Annual Review of Energy and
the Environment.
WU, X. Q., DONG, J. G. & TANG, M. S., 1987. Microwave Curing Technique in Concrete
Manufacture. Cement and Concrete Research, 17, 205-210.
XU, H. & VAN DEVENTER, J. S. J., 2000. The geopolymerisation of alumino-silicate
minerals. International Journal of Mineral Processing, 59, 247-266.
YANG, H. W. & GUNASEKARAN, S., 2004. Comparison of temperature distribution in
model food cylinders based on Maxwell's equations and Lambert's law during
pulsed microwave heating. Journal of Food Engineering, 64, 445-453.
YAZICI, H., AYDIN, S., YIGITER, H. & BARADAN, B., 2005. Effect of steam curing on
Class C high-volume fly ash concrete mixtures. Cement and Concrete Research,
35, 1122-1127.
YE, G., 2003. Experimental Study and Numerical Simulation of the Development of the
Microstructure and Permeability of Cementitious Materials. Doctor of Philosophy,
Delft University of Technology.

226
Appendix A: Measurement of Dielectric Properties
As discussed in Section 2.2.2, the heating effect of microwave is highly determined by the
dielectric properties of the material. There is a need to measure the dielectric properties,
which can be used to calculate the penetration depth (Dp) and be used as an input for the
simulation of microwave curing in Appendix B.
The evolution of dielectric properties of AAFA from mixing to 24 hours at 20oC is shown
in Figure A1. Both the dielectric constant and loss factor decreased over time due to the
loss of free water in the AAFA.
Figure A1 Dielectric properties of alkali-activated fly ash paste at 20oC
According to Eq. 2.8, the Dp is dependent on the microwave frequency and dielectric
properties of materials. In this thesis, the microwave frequency used was 2.45 GHz. Thus,
the Dp calculated at different times after mixing was shown in Table A1.
Table A1 Dielectric properties of alkali-activated fly ash at the frequency of 2.45 GHz
Time (hour) ε’ ε’’ Dp (cm)
0 28.95 22.05 0.51
10 18.17 15.52 0.58
24 13.99 11.08 0.70

227
Appendix B: Simulation of Microwave Curing with COMSOL
The microwave heating module in the COMSOL was used for simulating the microwave
curing process. The geometry of the microwave oven cavity and the input of parameters
were given below.
The geometry of the microwave oven, including the cavity and the waveguide, are
identical to that of the custom-made microwave oven described in Section 4.3.4.2. Figure
B1 shows the configuration of the microwave oven with three samples (i.e., 25mm sample,
50mm sample and 100mm sample) placed in the microwave oven. Due to the limitation
of the modelling work, there was only one sample placed at the centre of the plate in the
microwave oven, which was different from the experiment (see Section 4.3.4.3).

228
a. 25mm AAFA b. 50mm AAFA c. 100mm AAFA
Figure B1 Configuration of alkali-activated fly ash samples cured in the microwave oven

229
The input of parameters mainly consisted of the properties of the AAFA and the frequency
of the microwave used for this simulation. The initial dielectric properties obtained from
Appendix A was imported to the model for the simulation. The frequency of the microwave
was set at 2.45 GHz. Table B1 shows the equivalent microwave curing power output
calculated according to the power profiles obtained from Appendix A.
Table B1 Power input of microwave curing for alkali-activated fly ash samples with
difference sizes
Sample
size
Integration of
power profile
(W·h)
Microwave curing
duration (h)
Calculated power
level (W)
Equivalent
power level (W)
25mm 381.20 4.43 86 10W
50mm 530.92 4.43 120 30W
100mm 700.30 4.43 158 158W
The simulation was run for 10 minutes on microwave curing AAFA samples. The results
are shown in Figure B2. Figure B2a demonstrates the temperature distribution of the bulk
and the cross section of the 25mm sample with an equivalent power output of 30W for 10
minutes. Uneven temperature distribution was observed in the small size sample (25mm).
Figure B2b shows the temperature distribution of the bulk and the cross section of the
50mm sample with an equivalent power output of 30W for 10 minutes. Non-uniform
temperature distribution was observed in the 50mm sample. The lower part of the sample,
particular the bottom corners, gained higher temperatures than other parts of the sample.
Figure B2c shows the temperature distribution of the bulk and the cross section of the
100mm sample with an equivalent power output of 158W for 2 minutes. Although the
whole bulk was found at a low temperature, the hot spots over 100oC were observed at
the corners.

230
Temperature
distribution of the
bulk
Temperature
distribution of the
cross section
a. 25mm AAFA b. 50mm AAFA c. 100mm AAFA
Figure B2 Simulation results of microwave curing alkali-activated fly ash samples with different sizes