Intumescent Silicate Coatings with the Addition of Alkali ...
Multi-parameter crack tip stress state description for evaluation ofnonlinear zone width in silicate composite specimens in componentsplitting/bending test geometry
V. VESELÝ1, P. FRANTÍK1, J. SOBEK1, L. MALÍKOVÁ1 and S. SEITL2
1Brno University of Technology, Faculty of Civil Engineering, Institute of Structural Mechanics, Brno, Czech Republic, 2Academy of Sciences of the Czech
Republic, v.v.i., Institute of Physics of Materials, Brno, Czech Republic
Received Date: 6 October 2013; Accepted Date: 24 January 2014; Published Online: 2014
ABSTRACT This paper is aimed at the approximation of the stress and displacement fields both in thevicinity and also at a larger distance from the crack tip in test specimens utilised for thedetermination of the fracture characteristics of quasi-brittle materials. A novel geometryis considered, which, with changes in the specimen’s shape proportions, offers a widevariety of crack tip constraint levels and consequently also a broad range of extents/shapesof the nonlinear zone evolving around the crack tip. The combination of (four-point) bend-ing and wedge splitting tests of notched prismatic specimens is proposed and numericallyinvestigated. Several variants of boundary conditions are modelled. The stress intensityfactor K, the T-stress and the coefficients of even higher-order terms of theWilliams seriesare determined and subsequently utilised for analytical approximations of the stress field.The agreement between the analytical and numerical solution depending on the distancefrom the crack tip and the number of terms of the series, and taking into account theanalytical expression, is discussed. The presented approach is expected to be a suitabletechnique employed as part of a procedure being developed for the estimation of thefracture process zone extent in silicate composite materials. Suchmaterials are characterisedby their quasi-brittle fracture response, which is caused by the softening of the material inthe nonlinear zone. It is shown that changes in specimen proportions and/or the positionsof supports slightly influence the crack tip constraint level resulting in possible differencesin the width of the nonlinear zone.
Keywords near-crack tip fields; Williams series; higher-order terms; stress fieldapproximation; failure criterion; nonlinear zone; quasi-brittle fracture; splitting-bendinggeometry.
NOMENCLATURE a = crack lengthAn = coefficients of the terms of the Williams series, constants for a particular value
of the crack lengthB = breadth of the specimenC = compliance
dax,hor = horizontal displacement of bearing axledax,vert = vertical displacement of bearing axleddb,vert = vertical displacement at the bottom surface at the axis symmetry
E = Young’s modulusft = strengthF = compliance functionsgn = dimensionless functions of coefficients of the Williams series termsGc = toughnessGf = fracture energyJ2 = second invariant of the deviatoric part of the Cauchy stress
Correspondence: Stanislav Seitl. E-mail: [email protected]
© 2014 Wiley Publishing Ltd. Fatigue Fract Engng Mater Struct 00, 1–15 1
doi: 10.1111/ffe.12170
k = number of selected nodes around the crack tipK = stress intensity factorL = specimen lengthM = order of the polynomial approximation of the compliance functionn = index of term of the power expansionN = number of terms in the selected series
Psp, Pv = horizontal, vertical component of the loading forcer, θ = polar coordinatesR = fracture resistanceS = support lengthT = T-stress
u, v = components of the displacement vector{u} = displacement vectorW = width of the specimen
Wef = effective width of the test specimenWf = work of fracture
Wf,s = energy dissipated for unit increase of crack surfaceWf,z = energy dissipated in the volume of the process zone
α = relative crack length α¼ a=W ef Þð
κ = Kolosov’s constant κ ¼ 3 " vð Þ= 1 þ vð Þð Þ for plane stress and κ ¼ 3"; 4vð Þ forplain strain
μ = shear modulus m¼ E= 2 1 þ vð Þð ÞÞð
υ = Poisson’s ratioσappl = applied nominal (gross) stress in the central plane of the specimen caused by
the applied load σ ¼ Psp= B;Wð Þ !
σeq = equivalent stress valueσyy = normal stress in the direction of y axisσ1 = maximum principal stress{σ} = stress tensor
I NTRODUCT ION
The main focus of the author’s collective is the estimationof the size, shape and other relevant properties of the zonewith nonlinear material behaviour evolving at the tip of apropagating crack in composite materials with disorderedinternal structure, that is, those with a quasi-brittle natureexhibiting strain softening, in particular cementitious com-posites. The characteristics of the zone, which in the caseof the materials in question is referred to as the fractureprocess zone (FPZ), are intended to be utilised withinmethods for the evaluation of fracture mechanical parame-ters in order to diminish the effects of the test specimen’ssize, geometry and free boundaries on the values gainedfor such parameters. Particularly, the work-of-fracturemethod for evaluation of fracture energy,1 which is deter-mined from records of tests on laboratory-sized specimens,is meant here. The aforementioned effects have beenamong rather intensively researched topics in the field ofquasi-brittle fracture in the last decades.2–8
With regard to this problem, a hypothesis has beenintroduced by the authors of this paper9,10 stating that theremedy for the size/shape/boundary effect on the fracture
mechanical parameters of the aforementioned materialscan be obtained by relating the energy dissipated for thefracture process (the work-of-fracture) not only to the (pro-jection of the) created fracture surface (as it is treated withinthe work-of-fracture method1) but also to the volume of theFPZ. Thus, an increment of the energy dissipated at onetime step of a quasi-brittle fracture process, dWf, can bedivided into a part released for the creation of new fracturesurfaces (like the Griffith crack), dWf,s (subscript ‘s’ denotes‘surface’), and a part dissipated in the volume of the currentFPZ, dWf,z (with the subscript ‘z’ denoting ‘zone’):
dW f ¼ dW f ;s þ dW f ;z: (1)
The part released for the creation of the new fracturesurface, dWf,s, can be specified by its area, da ·B, where ais the crack length and B the specimen breadth. This leadsto the well-known definition of the fracture resistance R(toughness Gc) in the case of ideally brittle materials. Re-garding the other part, dWf,z, a situation with the followingtwo extreme cases occurs: if dWf,z tends to zero, the classi-cal fracture mechanics functions normally, as dWf,s→ dWf,and the work-of-fracture method is accurate. On the other
2 V. VESELÝ et al.
© 2014 Wiley Publishing Ltd. Fatigue Fract Engng Mater Struct 00, 1–15

hand, if the value of the part, dWf,z, is not negligible, thesize/shape/boundary effect appears to be present to someextent (depending on the proportion of dWf,z to dWf). Inthis latter case, dWf,z should not be ignored in such anevaluation, that is, the whole dissipated energy, dWf, shouldnot be assigned exclusively to the energy release correspond-ing to the enlargement of the crack surface, as the work-of-fracture method assumes.
The part of the energy dissipated in the volume of theFPZ, dWf,z, shall also be specified in some manner by thecharacteristics of the region where the process takesplace. The most straightforward method of doing thiswould be to relate the energy directly to the FPZ volume,as was carried out in previous studies.9,11 However, thisassumption appears to be too strong, as the substantialnon-uniformity of the energy dissipation distributionhas become obvious. So, the parameter(s) describing thevolumic dissipation of energy is (are) being sought inconnection with a suitable distribution function, whichis one of the topics in current research of the authorsconnected with aspects of published works related toeither mezzo-scale numerical simulations12,13 or (mainlyacoustic emission scanning) experiments.14,15
A procedure for the determination of the true valuesof fracture parameters of structural materials taking intoaccount the aforementioned effects is currently underdevelopment by the authors. The outputs of individualparts of the procedure are being tested, verified andvalidated at present, both from the perspective of FPZextent estimation (analytically and using simulations,16,17
and experimentally18–20) and also of crack tip stress statedescription.21–27 This paper is particularly focused onthe analytical/numerical investigation of differencesbetween crack tip stress states caused by changes in testgeometry (the specimen’s shape and boundary condi-tions) resulting in differences in the extent (particularlywidth) of the FPZ. Another novelty of this paper is theproposal of a test geometry derived from a combinationof what is referred to as wedge splitting test (WST)geometry and the typical four-point bending test carriedout on notched beams. Variants of this test configurationare utilised for the present analytical/numerical study.
A precise description of the stress state in the crackedbody is necessary for the FPZ extent estimation procedure.For that purpose, multi-parameter fracture mechanics isemployed as the size of the FPZ in relation to the wholespecimen is much larger in the case of the studied quasi-brittle composites than that of, for example, the plastic zonein metals. Therefore, the FPZ extent analysis is preceded bya detailed finite element (FE) method (FEM) analysis of thestress and displacement fields in the test specimens.The dataserves as an input to the over-deterministic method for theevaluation of higher-order terms of the Williams powerseries via which the fields are approximated. Significant
attention is given to this issue in this paper; the accuracy ofthe approximation is investigated.
Finally, virtual experiments are conducted on the inves-tigated geometry; concrete specimens are considered. Thetests are simulated using FEM software with cohesive crackmodel implementation and the obtained results are takenas inputs for crack tip stress state reconstruction.
CONCEPTUAL APPROACH
Multi-parameter fracture mechanics – description of
stress and displacement fields in a cracked body
Multi-parameter fracture mechanics is based on theanalytical description of the stress and deformation fieldsin a cracked body by means of Williams expansion.28
This infinite power series for a homogeneous elastic iso-tropic cracked body can be expressed for the stress tensor{σ} and deformation vector {u} as
σ x
σ y
τxy
8
>
<
>
:
9
>
=
>
;
¼ ∑∞
n¼1
n
2rn2 1 !
! An"
2þ 1ð Þn þn
2
h i
cosn
2 1
) *
θ n
2 1
) *
cosn
2 3
) *
θ
2 1ð Þn n
2
h i
cosn
2 1
) *
θ þn
2 1
) *
cosn
2 3
) *
θ
1ð Þn þn
2
h i
sinn
2 1
) *
θ þn
2 1
) *
sinn
2 3
) *
θ
8
>
>
>
>
>
<
>
>
>
>
>
:
9
>
>
>
>
>
=
>
>
>
>
>
;
;
(2)
u
v
+ ,
¼ ∑∞
n¼1
rn=2
2μ!
! An"κ þ
n
2þ 1ð Þn
) *
cosn
2θ
n
2cos
n
2 2
) *
θ
κ n
2 1ð Þn
) *
sinn
2θ þ
n
2sin
n
2 2
) *
θ
8
>
<
>
:
9
>
=
>
;
;
(3)
respectively, where r and θ are polar coordinates centred atthe crack tip (considering the direction of the crack propaga-tion in the positive x-axis), n represents the index of the termof the power expansion, μ is the shear modulus (μ =E/(2(1 + ν))), κ is the Kolosov’s constant (κ = (3 ν)/(1 + ν) forplane stress or κ =3 4ν for plane strain state), E and ν areYoung’s modulus and Poisson’s ratio, respectively. Coeffi-cients An are functions of relative crack length α.
Note that the concept of multi-parameter fracturemechanics has recently been successfully utilised in manyfracture problems recently.23,29–34
Functions of the power series coefficients An(α) can beconveniently expressed as dimensionless functions (withregard to the loading) in various ways. In accordance withKarihaloo et al.35,36, they can be written as
MULT I - PARAMETER CRACK T I P STRESS S TATE DESCR I PT ION 3
© 2014 Wiley Publishing Ltd. Fatigue Fract Engng Mater Struct 00, 1–15
gn αð Þ ¼An αð Þ
σ applW
n 22 for n ¼ 1; 3; 4…;N
and g2 ¼4A2 αð Þ
σ appl;
(4)
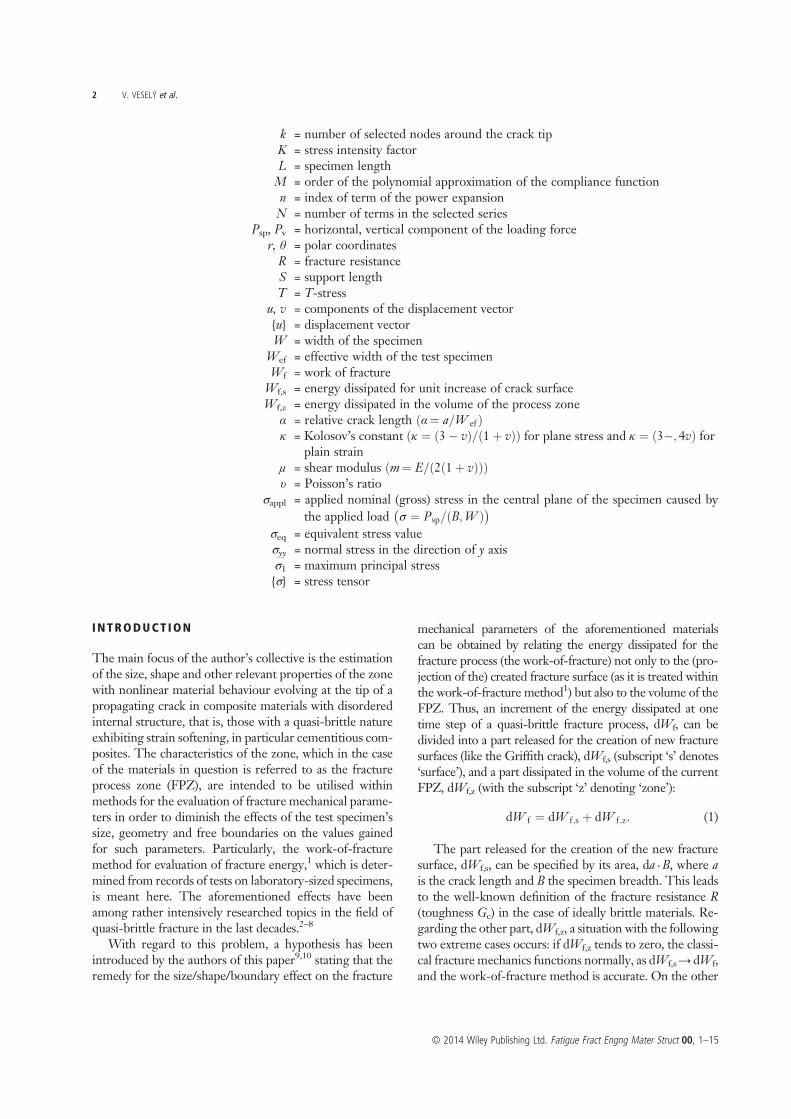
respectively. In these formulas, σappl is the applied nominal(gross) stress in the central plane of the specimen caused by(usually only the splitting component Psp, see Fig. 2, of ) theapplied load (i.e. σappl=Psp/BW), a is the crack length, andW and B are the specimen’s width and breadth, respectively.
For simplicity, the typical formula for σappl for thewedge splitting geometry (in accordance with Karihaloo’sworks), that is, the one neglecting the vertical componentof the loading force, is retained here. However, it has beenshown37 that the vertical component, Pv, is of significantrelevance in fracture analyses. This is true for the classicalWST geometry (both with a single central support andtwo supports); it is expected, that in the case of theproposed component splitting/bending, the effect of thevertical component might be even more pronounced.Nevertheless, it is omitted in the present analysis.
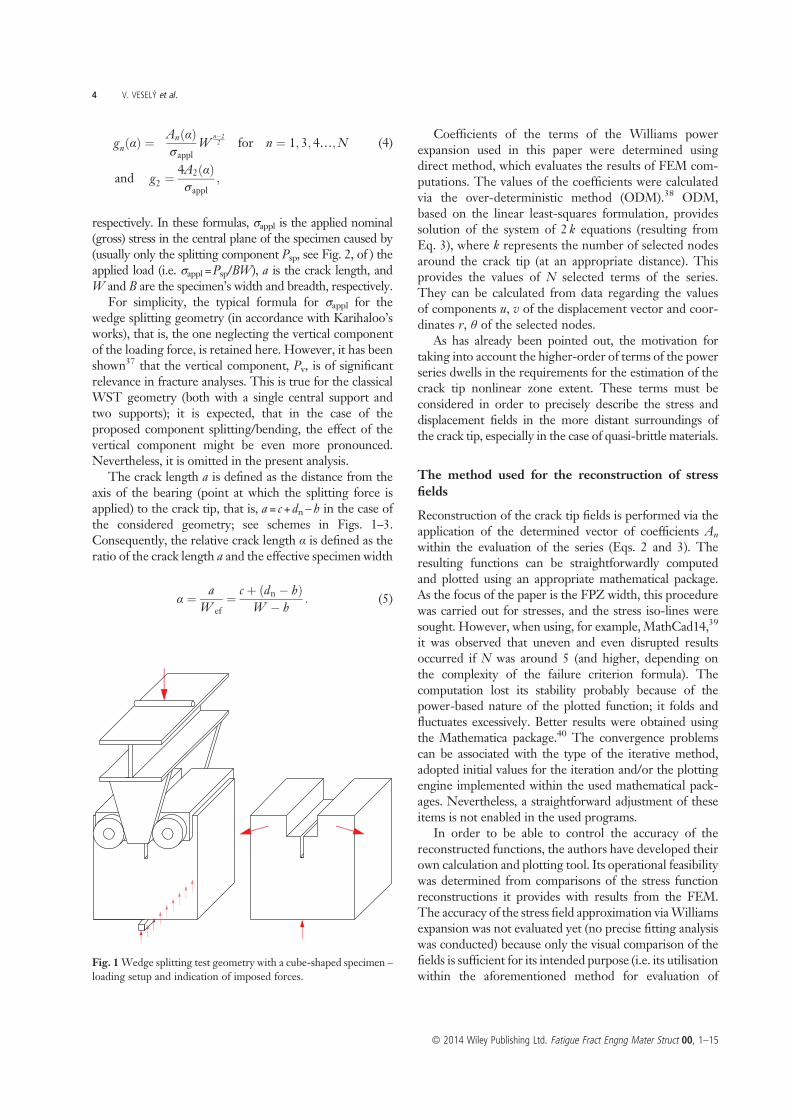
The crack length a is defined as the distance from theaxis of the bearing (point at which the splitting force isapplied) to the crack tip, that is, a = c + dn – h in the case ofthe considered geometry; see schemes in Figs. 1–3.Consequently, the relative crack length α is defined as theratio of the crack length a and the effective specimen width
α ¼a
W ef¼
c þ dn hð Þ
W h: (5)
Coefficients of the terms of the Williams powerexpansion used in this paper were determined usingdirect method, which evaluates the results of FEM com-putations. The values of the coefficients were calculatedvia the over-deterministic method (ODM).38 ODM,based on the linear least-squares formulation, providessolution of the system of 2 k equations (resulting fromEq. 3), where k represents the number of selected nodesaround the crack tip (at an appropriate distance). Thisprovides the values of N selected terms of the series.They can be calculated from data regarding the valuesof components u, v of the displacement vector and coor-dinates r, θ of the selected nodes.
As has already been pointed out, the motivation fortaking into account the higher-order of terms of the powerseries dwells in the requirements for the estimation of thecrack tip nonlinear zone extent. These terms must beconsidered in order to precisely describe the stress anddisplacement fields in the more distant surroundings ofthe crack tip, especially in the case of quasi-brittle materials.
The method used for the reconstruction of stress
fields
Reconstruction of the crack tip fields is performed via theapplication of the determined vector of coefficients An
within the evaluation of the series (Eqs. 2 and 3). Theresulting functions can be straightforwardly computedand plotted using an appropriate mathematical package.As the focus of the paper is the FPZ width, this procedurewas carried out for stresses, and the stress iso-lines weresought. However, when using, for example, MathCad14,39
it was observed that uneven and even disrupted resultsoccurred if N was around 5 (and higher, depending onthe complexity of the failure criterion formula). Thecomputation lost its stability probably because of thepower-based nature of the plotted function; it folds andfluctuates excessively. Better results were obtained usingthe Mathematica package.40 The convergence problemscan be associated with the type of the iterative method,adopted initial values for the iteration and/or the plottingengine implemented within the used mathematical pack-ages. Nevertheless, a straightforward adjustment of theseitems is not enabled in the used programs.
In order to be able to control the accuracy of thereconstructed functions, the authors have developed theirown calculation and plotting tool. Its operational feasibilitywas determined from comparisons of the stress functionreconstructions it provides with results from the FEM.The accuracy of the stress field approximation viaWilliamsexpansion was not evaluated yet (no precise fitting analysiswas conducted) because only the visual comparison of thefields is sufficient for its intended purpose (i.e. its utilisationwithin the aforementioned method for evaluation of
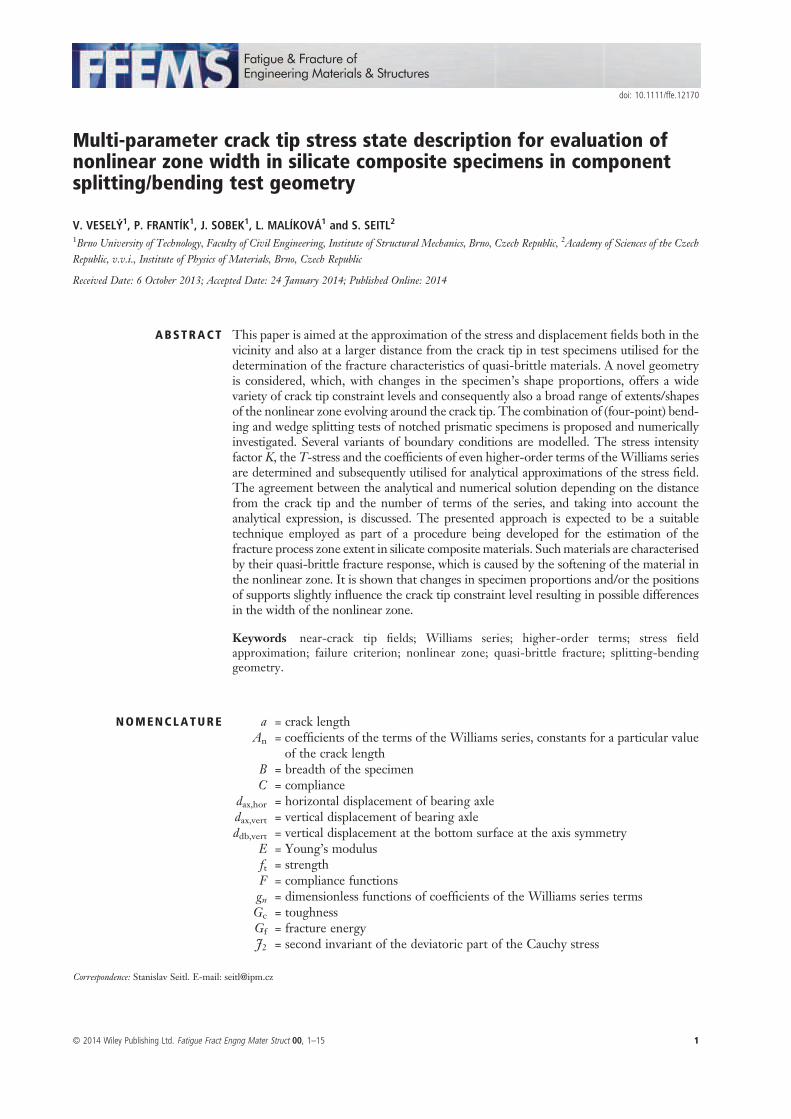
Fig. 1Wedge splitting test geometry with a cube-shaped specimen –
loading setup and indication of imposed forces.
4 V. VESELÝ et al.
© 2014 Wiley Publishing Ltd. Fatigue Fract Engng Mater Struct 00, 1–15
fracture parameters10). Examples of such a comparison areshown in the section on the Application ofmulti-parameterfracture mechanics.
The core of the algorithmic reconstruction of the stressfields is based on relationships in Eq. 2. The stress tensor{σ} and then an appropriate equivalent stress value σeq
(coming from a suitable failure criterion) is directly calcu-lated for the known vector of coefficients An (n ∈ ⟨1,N⟩)(calculated form Eq. 4) and given polar coordinates r, θ.The points of the particular stress iso-line are sought viaNewton’s iterative method, which is repeatedly applied tothe chosen equivalent stress field function σeq(r, θ). The
value of radius r is sought for the selected subset of θj ∈⟨0,π⟩ (a symmetrical half of the specimen is consideredbecause of the loading in fracture mode I only, whereas jis typically set to 180). A starting radius value is chosen,which is very close to zero (the crack tip). Examples ofthe results of the procedure are presented in Figs. 7–9.
The used failure criterion generally depends on theinvestigated material. For quasi-brittle cementitiousmaterials, for example, the Rankine criterion is appropri-ate (σeq = σ1, where σ1 is the maximum principal stress).For elasto-plastic materials, for example, the von Misescriterion (σeq =√3 J2, where J2 is the second invariant
(a) (b) (c)
(d)
Fig. 2 Considered test configuration variants – set of specimen shapes (I, II and III) and supports (0, a) – I-0 (a), I-a (b), II-a (c) and III-a (d).
Fig. 3 Sketch of the modelled specimens (I left and II to IV right, support variants 0 and a) with individual dimensions indicated.
MULT I - PARAMETER CRACK T I P STRESS S TATE DESCR I PT ION 5
© 2014 Wiley Publishing Ltd. Fatigue Fract Engng Mater Struct 00, 1–15
of the deviatoric part of the Cauchy stress) can be used.Summary of failure criteria for structural materials(Willam-Warnke, Mohr-Coulomb, Drucker-Prager andothers) can be found in Wikipedia for example.41
The filled plane contour plot is calculated more directly,using the same formulas (Eqs. 4 and 2). The polar coordi-nates r, θ and then the equivalent stress value σeq are calcu-lated for chosen Cartesian raster. In the case of the lattervalue, a colour from a discrete colour scale is assigned.The result is arranged in a pixmap (see examples in Fig. 10).
Both of the mentioned procedures are implemented inJAVA language and form, together with several otherparts, an application referred to as ReFraPro (Recon-struction of Fracture Process).10 This application isintended to have rather complex and wide purpose; inthis paper, only the parts enabling the (multi-parameterway of the) stress state reconstruction and the followingstress contour determination are utilised.
NUMER ICAL STUDY
Definition of numerical study – wedge splitting to
bending of notched prisms
The present study introduces a hybrid test configurationderived from two basic and most frequently used testconfigurations used for the determination of fracture prop-erties of quasi-brittle materials; in the civil engineeringfield, these are mainly cement based composites. Thesetwo tests are the bending of notched beams and the wedgesplitting of (usually) compact specimens (Fig. 1). A diagramof the proposed configuration is depicted in Fig. 2. The re-sults of a pilot numerical study concerning two-parameterfracture mechanics are detailed in Seitl et al.42.
The WST is a convenient and popular configurationfor the estimation of fracture parameters of silicate-basedcomposites, mainly building materials. It was introducedin the 1980s.43 Due to its advantages (mainly because ofconsiderable decrease of the specimen’s volume, negligi-ble effect of the specimen’s self-weight, variability in thespecimen shape and also the test stability), it is often usedas an alternative to the standard three-point or four-pointbending test of notched beams and especially to tensilegeometries. The splitting force driving the crack propaga-tion is imposed on the specimen via a wedge, which opensaxles with bearings mounted on platens placed into agroove in the test specimen (Figs. 1–3). The test can beperformed on specimens of various shapes; however, alsothe test setup, that is, the boundary conditions, can also sig-nificantly differ. In typical fracture analyses, details ofboundary conditions related to both the load applicationand the specimen supports are usually neglected, whichcan lead to substantial errors.27,37 In particular, the
compressive component of the loading force (Pv in Figs. 2and 3) tends to be ignored. Karihaloo and co-workerspublished a stress and displacement field description forthe WST using as many as five terms of the Williamsseries.35,36 Two support variants were modelled, but thecompressive component of the applied loading was stillnot considered.
The WST geometry forms one boundary of the con-sidered study. The other asymptote is the three-pointbending (when the specimen size becomes large enoughto neglect the width of the WST fittings and the groovefor it). For relevant laboratory specimen sizes it is neces-sary to deal with a combination of the wedge splitting(tension in the upper parts of the specimen ligamentand compression in the lower ones) and four-pointbending (vice-versa) tests. As such, the stress state in thespecimen ligament can be controlled by adjusting the testconfiguration parameters (e.g. loading span S, specimenwidth W and the wedge angle αw). A large range of cracktip constraint level can be obtained. No K-calibration curvesor T-stress values have been published for the geometry inquestion, so the authors had to conduct their own analyses.
In this paper, two support variants were considered:the first features one central support (marked as 0),whereas the other has two supports positioned 1/4Wfrom the central plane, that is, with a span to length ratioof 1/2 (marked as a). A variant with two supports withS/L = 3/4 (marked as b) was also studied to better utilisethe test specimen volume (shorter overhangs of thespecimen over supports). Four specimen shapes wereinvestigated: a cube (I), and prisms with W/L = 1/2 (II),W/L = 1/4 (III) and W/L = 1/8 (IV). Loading schemes anda detailed description of the specimens can be found inFigs. 2 and 3 and Table 1. This paper presents onlyselected results from the whole study; specimen shapes I,II and III, support variants 0 and a. Results obtained onthe other geometry variants (whose dimension parametersare given in brackets in Table 1) are qualitatively of thesame nature.
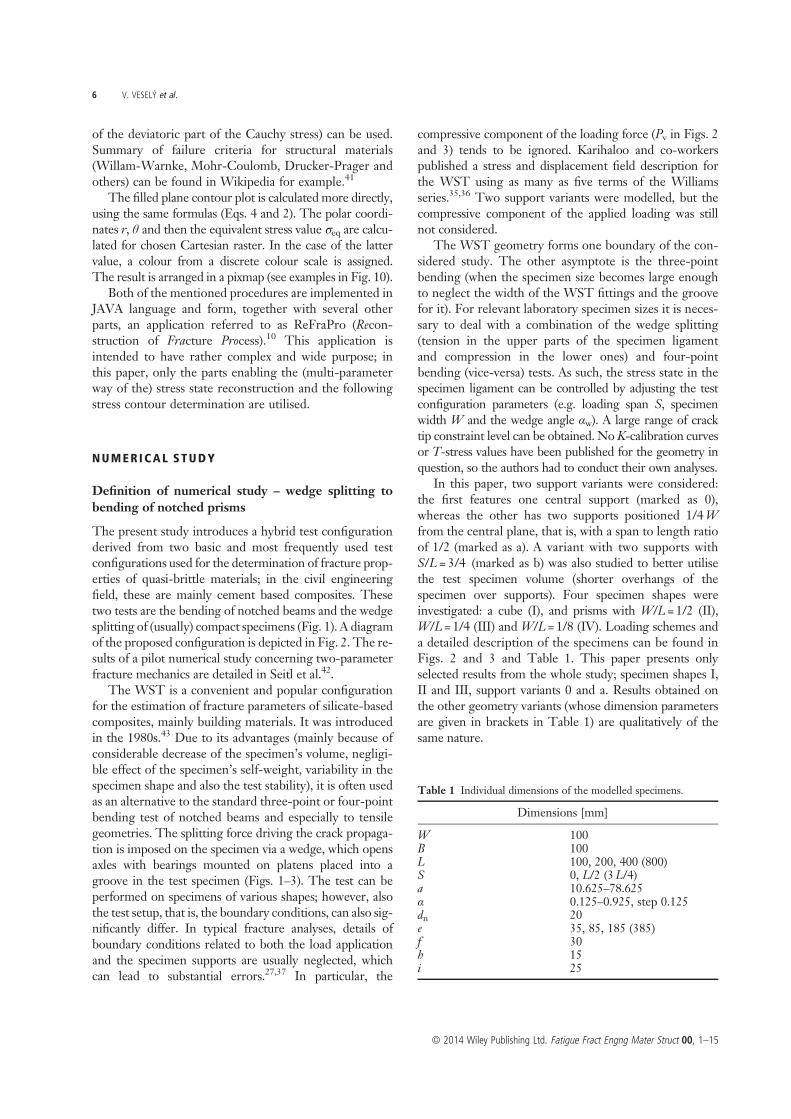
Table 1 Individual dimensions of the modelled specimens.
Dimensions [mm]
W 100B 100L 100, 200, 400 (800)S 0, L/2 (3L/4)a 10.625–78.625α 0.125–0.925, step 0.125dn 20e 35, 85, 185 (385)f 30h 15i 25
6 V. VESELÝ et al.
© 2014 Wiley Publishing Ltd. Fatigue Fract Engng Mater Struct 00, 1–15
Numerical modellingLinear elastic fracture mechanics modelling (ANSYS)
Detailed analysis of the stress and displacement fields in thespecimens of mentioned dimensions subjected to theearlier described test configuration in considered variantsof boundary conditions had to be performed. The numeri-cal study was conducted using ANSYS FEM software.44 Allsimulations were modelled as 2D problems under planestrain conditions. The FE mesh was generated from8-nodes iso-parametric elements (PLANE82), withthe crack tip singularity taken into account throughtriangular crack elements with the mid-side node movedto 1/4 of the length of a triangle’s side. The linear elasticisotropic material of the cementitious composite specimenand the steel loading platens was defined by Young’smoduli E of 35 and 210GPa and Poisson’s ratios ν of 0.2and 0.3, respectively.
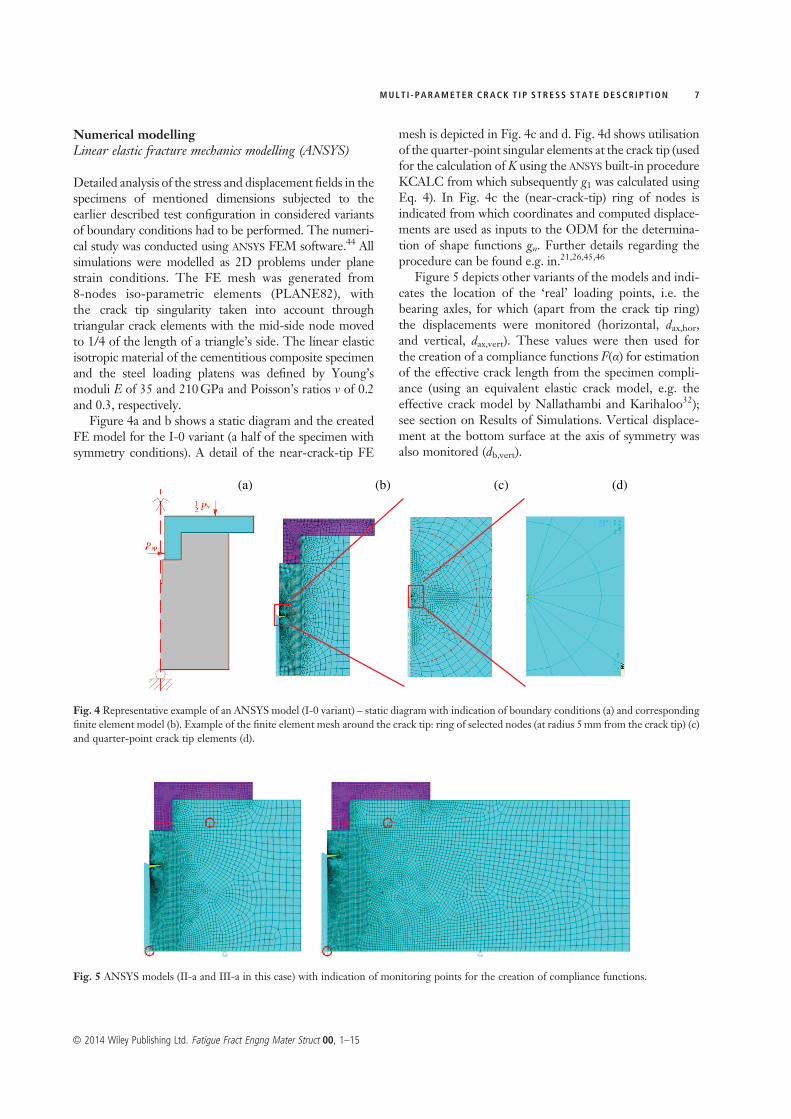
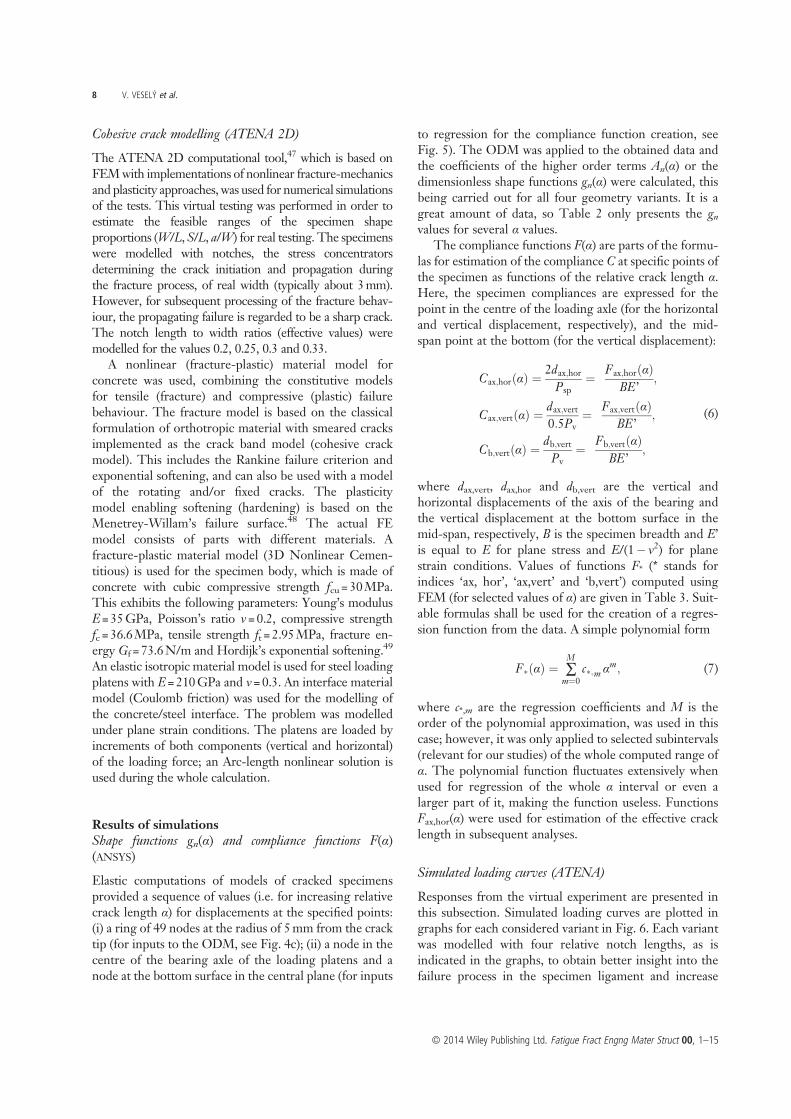
Figure 4a and b shows a static diagram and the createdFE model for the I-0 variant (a half of the specimen withsymmetry conditions). A detail of the near-crack-tip FE
mesh is depicted in Fig. 4c and d. Fig. 4d shows utilisationof the quarter-point singular elements at the crack tip (usedfor the calculation of K using the ANSYS built-in procedureKCALC from which subsequently g1 was calculated usingEq. 4). In Fig. 4c the (near-crack-tip) ring of nodes isindicated from which coordinates and computed displace-ments are used as inputs to the ODM for the determina-tion of shape functions gn. Further details regarding theprocedure can be found e.g. in.21,26,45,46
Figure 5 depicts other variants of the models and indi-cates the location of the ‘real’ loading points, i.e. thebearing axles, for which (apart from the crack tip ring)the displacements were monitored (horizontal, dax,hor,and vertical, dax,vert). These values were then used forthe creation of a compliance functions F(α) for estimationof the effective crack length from the specimen compli-ance (using an equivalent elastic crack model, e.g. theeffective crack model by Nallathambi and Karihaloo32);see section on Results of Simulations. Vertical displace-ment at the bottom surface at the axis of symmetry wasalso monitored (db,vert).
(a) (b) (c) (d)
Fig. 4 Representative example of an ANSYS model (I-0 variant) – static diagram with indication of boundary conditions (a) and corresponding
finite element model (b). Example of the finite element mesh around the crack tip: ring of selected nodes (at radius 5mm from the crack tip) (c)
and quarter-point crack tip elements (d).
Fig. 5 ANSYS models (II-a and III-a in this case) with indication of monitoring points for the creation of compliance functions.
MULT I - PARAMETER CRACK T I P STRESS S TATE DESCR I PT ION 7
© 2014 Wiley Publishing Ltd. Fatigue Fract Engng Mater Struct 00, 1–15
Cohesive crack modelling (ATENA 2D)
The ATENA 2D computational tool,47 which is based onFEMwith implementations of nonlinear fracture-mechanicsand plasticity approaches, was used for numerical simulationsof the tests. This virtual testing was performed in order toestimate the feasible ranges of the specimen shapeproportions (W/L, S/L, a/W) for real testing. The specimenswere modelled with notches, the stress concentratorsdetermining the crack initiation and propagation duringthe fracture process, of real width (typically about 3mm).However, for subsequent processing of the fracture behav-iour, the propagating failure is regarded to be a sharp crack.The notch length to width ratios (effective values) weremodelled for the values 0.2, 0.25, 0.3 and 0.33.
A nonlinear (fracture-plastic) material model forconcrete was used, combining the constitutive modelsfor tensile (fracture) and compressive (plastic) failurebehaviour. The fracture model is based on the classicalformulation of orthotropic material with smeared cracksimplemented as the crack band model (cohesive crackmodel). This includes the Rankine failure criterion andexponential softening, and can also be used with a modelof the rotating and/or fixed cracks. The plasticitymodel enabling softening (hardening) is based on theMenetrey-Willam’s failure surface.48 The actual FEmodel consists of parts with different materials. Afracture-plastic material model (3D Nonlinear Cemen-titious) is used for the specimen body, which is made ofconcrete with cubic compressive strength fcu= 30MPa.This exhibits the following parameters: Young’s modulusE = 35GPa, Poisson’s ratio ν = 0.2, compressive strengthfc = 36.6MPa, tensile strength ft = 2.95MPa, fracture en-ergy Gf = 73.6N/m and Hordijk’s exponential softening.49
An elastic isotropic material model is used for steel loadingplatens with E = 210GPa and ν = 0.3. An interface materialmodel (Coulomb friction) was used for the modelling ofthe concrete/steel interface. The problem was modelledunder plane strain conditions. The platens are loaded byincrements of both components (vertical and horizontal)of the loading force; an Arc-length nonlinear solution isused during the whole calculation.
Results of simulationsShape functions gn(α) and compliance functions F(α)(ANSYS)
Elastic computations of models of cracked specimensprovided a sequence of values (i.e. for increasing relativecrack length α) for displacements at the specified points:(i) a ring of 49 nodes at the radius of 5mm from the cracktip (for inputs to the ODM, see Fig. 4c); (ii) a node in thecentre of the bearing axle of the loading platens and anode at the bottom surface in the central plane (for inputs
to regression for the compliance function creation, seeFig. 5). The ODM was applied to the obtained data andthe coefficients of the higher order terms An(α) or thedimensionless shape functions gn(α) were calculated, thisbeing carried out for all four geometry variants. It is agreat amount of data, so Table 2 only presents the gnvalues for several α values.
The compliance functions F(α) are parts of the formu-las for estimation of the compliance C at specific points ofthe specimen as functions of the relative crack length α.Here, the specimen compliances are expressed for thepoint in the centre of the loading axle (for the horizontaland vertical displacement, respectively), and the mid-span point at the bottom (for the vertical displacement):
Cax;hor αð Þ ¼2dax;horPsp
¼Fax;hor αð Þ
BE’;
Cax;vert αð Þ ¼dax;vert0:5Pv
¼Fax;vert αð Þ
BE’;
Cb;vert αð Þ ¼db;vertPv
¼Fb;vert αð Þ
BE ’;
(6)
where dax,vert, dax,hor and db,vert are the vertical andhorizontal displacements of the axis of the bearing andthe vertical displacement at the bottom surface in themid-span, respectively, B is the specimen breadth and E’is equal to E for plane stress and E/(1 ν
2) for planestrain conditions. Values of functions F* (* stands forindices ‘ax, hor’, ‘ax,vert’ and ‘b,vert’) computed usingFEM (for selected values of α) are given in Table 3. Suit-able formulas shall be used for the creation of a regres-sion function from the data. A simple polynomial form
F! αð Þ ¼ ∑M
m¼0
c!;m αm; (7)
where c*,m are the regression coefficients and M is theorder of the polynomial approximation, was used in thiscase; however, it was only applied to selected subintervals(relevant for our studies) of the whole computed range ofα. The polynomial function fluctuates extensively whenused for regression of the whole α interval or even alarger part of it, making the function useless. FunctionsFax,hor(α) were used for estimation of the effective cracklength in subsequent analyses.
Simulated loading curves (ATENA)
Responses from the virtual experiment are presented inthis subsection. Simulated loading curves are plotted ingraphs for each considered variant in Fig. 6. Each variantwas modelled with four relative notch lengths, as isindicated in the graphs, to obtain better insight into thefailure process in the specimen ligament and increase
8 V. VESELÝ et al.
© 2014 Wiley Publishing Ltd. Fatigue Fract Engng Mater Struct 00, 1–15
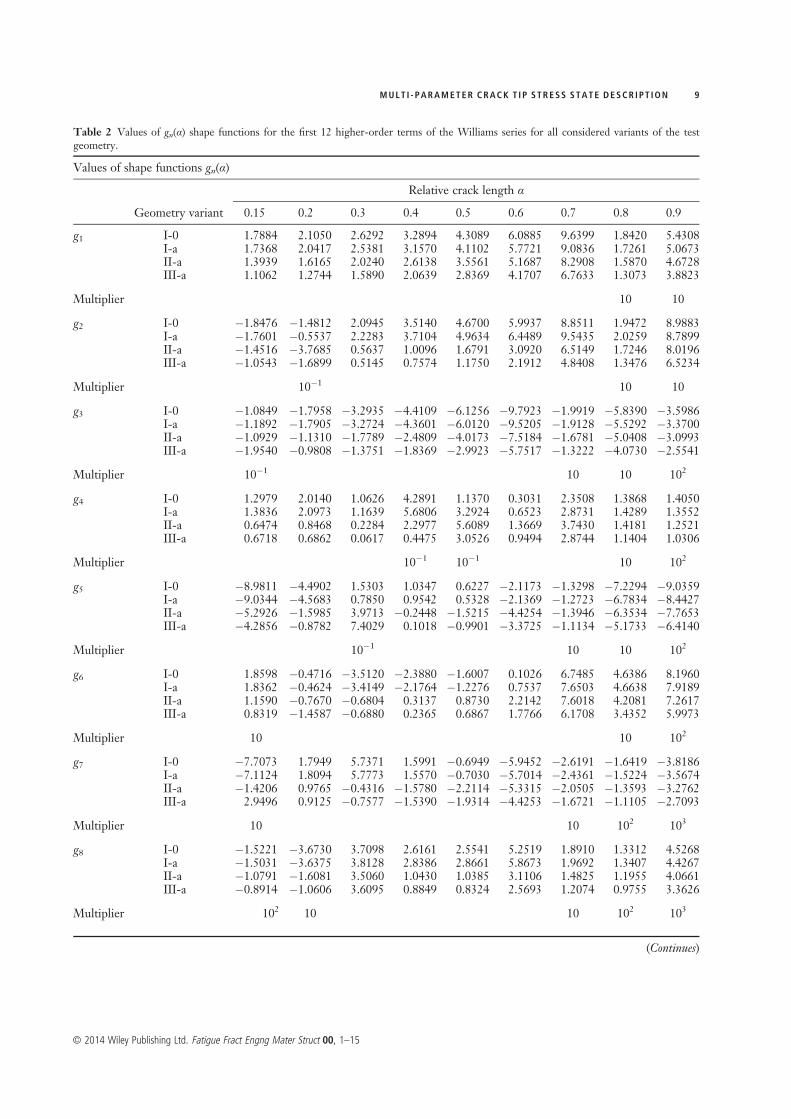
Table 2 Values of gn(α) shape functions for the first 12 higher-order terms of the Williams series for all considered variants of the testgeometry.
Values of shape functions gn(α)
Relative crack length α
Geometry variant 0.15 0.2 0.3 0.4 0.5 0.6 0.7 0.8 0.9
g1 I-0 1.7884 2.1050 2.6292 3.2894 4.3089 6.0885 9.6399 1.8420 5.4308I-a 1.7368 2.0417 2.5381 3.1570 4.1102 5.7721 9.0836 1.7261 5.0673II-a 1.3939 1.6165 2.0240 2.6138 3.5561 5.1687 8.2908 1.5870 4.6728III-a 1.1062 1.2744 1.5890 2.0639 2.8369 4.1707 6.7633 1.3073 3.8823
Multiplier 10 10
g2 I-0 �1.8476 �1.4812 2.0945 3.5140 4.6700 5.9937 8.8511 1.9472 8.9883I-a �1.7601 �0.5537 2.2283 3.7104 4.9634 6.4489 9.5435 2.0259 8.7899II-a �1.4516 �3.7685 0.5637 1.0096 1.6791 3.0920 6.5149 1.7246 8.0196III-a �1.0543 �1.6899 0.5145 0.7574 1.1750 2.1912 4.8408 1.3476 6.5234
Multiplier 10�1 10 10
g3 I-0 �1.0849 �1.7958 �3.2935 �4.4109 �6.1256 �9.7923 �1.9919 �5.8390 �3.5986I-a �1.1892 �1.7905 �3.2724 �4.3601 �6.0120 �9.5205 �1.9128 �5.5292 �3.3700II-a �1.0929 �1.1310 �1.7789 �2.4809 �4.0173 �7.5184 �1.6781 �5.0408 �3.0993III-a �1.9540 �0.9808 �1.3751 �1.8369 �2.9923 �5.7517 �1.3222 �4.0730 �2.5541
Multiplier 10�1 10 10 102
g4 I-0 1.2979 2.0140 1.0626 4.2891 1.1370 0.3031 2.3508 1.3868 1.4050I-a 1.3836 2.0973 1.1639 5.6806 3.2924 0.6523 2.8731 1.4289 1.3552II-a 0.6474 0.8468 0.2284 2.2977 5.6089 1.3669 3.7430 1.4181 1.2521III-a 0.6718 0.6862 0.0617 0.4475 3.0526 0.9494 2.8744 1.1404 1.0306
Multiplier 10�1 10�1 10 102
g5 I-0 �8.9811 �4.4902 1.5303 1.0347 0.6227 �2.1173 �1.3298 �7.2294 �9.0359I-a �9.0344 �4.5683 0.7850 0.9542 0.5328 �2.1369 �1.2723 �6.7834 �8.4427II-a �5.2926 �1.5985 3.9713 �0.2448 �1.5215 �4.4254 �1.3946 �6.3534 �7.7653III-a �4.2856 �0.8782 7.4029 0.1018 �0.9901 �3.3725 �1.1134 �5.1733 �6.4140
Multiplier 10�1 10 10 102
g6 I-0 1.8598 �0.4716 �3.5120 �2.3880 �1.6007 0.1026 6.7485 4.6386 8.1960I-a 1.8362 �0.4624 �3.4149 �2.1764 �1.2276 0.7537 7.6503 4.6638 7.9189II-a 1.1590 �0.7670 �0.6804 0.3137 0.8730 2.2142 7.6018 4.2081 7.2617III-a 0.8319 �1.4587 �0.6880 0.2365 0.6867 1.7766 6.1708 3.4352 5.9973
Multiplier 10 10 102
g7 I-0 �7.7073 1.7949 5.7371 1.5991 �0.6949 �5.9452 �2.6191 �1.6419 �3.8186I-a �7.1124 1.8094 5.7773 1.5570 �0.7030 �5.7014 �2.4361 �1.5224 �3.5674II-a �1.4206 0.9765 �0.4316 �1.5780 �2.2114 �5.3315 �2.0505 �1.3593 �3.2762III-a 2.9496 0.9125 �0.7577 �1.5390 �1.9314 �4.4253 �1.6721 �1.1105 �2.7093
Multiplier 10 10 102 103
g8 I-0 �1.5221 �3.6730 3.7098 2.6161 2.5541 5.2519 1.8910 1.3312 4.5268I-a �1.5031 �3.6375 3.8128 2.8386 2.8661 5.8673 1.9692 1.3407 4.4267II-a �1.0791 �1.6081 3.5060 1.0430 1.0385 3.1106 1.4825 1.1955 4.0661III-a �0.8914 �1.0606 3.6095 0.8849 0.8324 2.5693 1.2074 0.9755 3.3626
Multiplier 102 10 10 102 103
(Continues)
MULT I - PARAMETER CRACK T I P STRESS S TATE DESCR I PT ION 9
© 2014 Wiley Publishing Ltd. Fatigue Fract Engng Mater Struct 00, 1–15
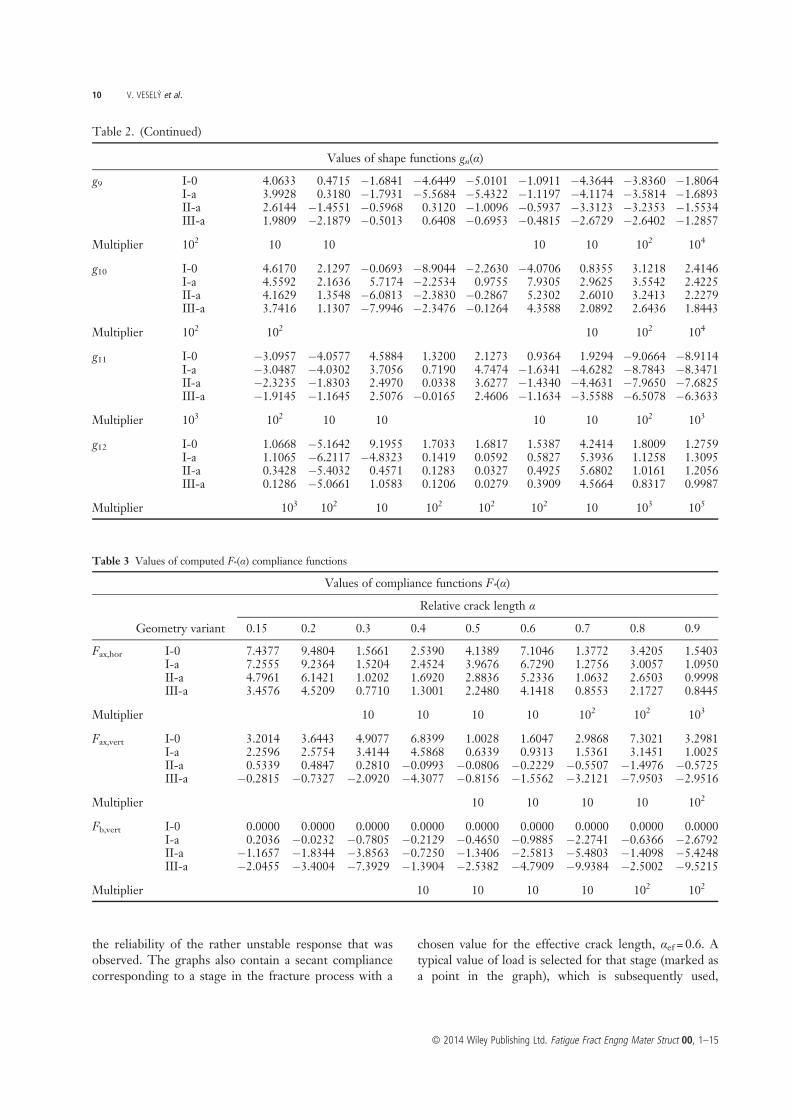
the reliability of the rather unstable response that wasobserved. The graphs also contain a secant compliancecorresponding to a stage in the fracture process with a
chosen value for the effective crack length, αef = 0.6. Atypical value of load is selected for that stage (marked asa point in the graph), which is subsequently used,
Table 2. (Continued)
Values of shape functions gn(α)
g9 I-0 4.0633 0.4715 �1.6841 �4.6449 �5.0101 �1.0911 �4.3644 �3.8360 �1.8064I-a 3.9928 0.3180 �1.7931 �5.5684 �5.4322 �1.1197 �4.1174 �3.5814 �1.6893II-a 2.6144 �1.4551 �0.5968 0.3120 �1.0096 �0.5937 �3.3123 �3.2353 �1.5534III-a 1.9809 �2.1879 �0.5013 0.6408 �0.6953 �0.4815 �2.6729 �2.6402 �1.2857
Multiplier 102 10 10 10 10 102 104
g10 I-0 4.6170 2.1297 �0.0693 �8.9044 �2.2630 �4.0706 0.8355 3.1218 2.4146I-a 4.5592 2.1636 5.7174 �2.2534 0.9755 7.9305 2.9625 3.5542 2.4225II-a 4.1629 1.3548 �6.0813 �2.3830 �0.2867 5.2302 2.6010 3.2413 2.2279III-a 3.7416 1.1307 �7.9946 �2.3476 �0.1264 4.3588 2.0892 2.6436 1.8443
Multiplier 102 102 10 102 104
g11 I-0 �3.0957 �4.0577 4.5884 1.3200 2.1273 0.9364 1.9294 �9.0664 �8.9114I-a �3.0487 �4.0302 3.7056 0.7190 4.7474 �1.6341 �4.6282 �8.7843 �8.3471II-a �2.3235 �1.8303 2.4970 0.0338 3.6277 �1.4340 �4.4631 �7.9650 �7.6825III-a �1.9145 �1.1645 2.5076 �0.0165 2.4606 �1.1634 �3.5588 �6.5078 �6.3633
Multiplier 103 102 10 10 10 10 102 103
g12 I-0 1.0668 �5.1642 9.1955 1.7033 1.6817 1.5387 4.2414 1.8009 1.2759I-a 1.1065 �6.2117 �4.8323 0.1419 0.0592 0.5827 5.3936 1.1258 1.3095II-a 0.3428 �5.4032 0.4571 0.1283 0.0327 0.4925 5.6802 1.0161 1.2056III-a 0.1286 �5.0661 1.0583 0.1206 0.0279 0.3909 4.5664 0.8317 0.9987
Multiplier 103 102 10 102 102 102 10 103 105
Table 3 Values of computed F*(α) compliance functions
Values of compliance functions F*(α)
Relative crack length α
Geometry variant 0.15 0.2 0.3 0.4 0.5 0.6 0.7 0.8 0.9
Fax,hor I-0 7.4377 9.4804 1.5661 2.5390 4.1389 7.1046 1.3772 3.4205 1.5403I-a 7.2555 9.2364 1.5204 2.4524 3.9676 6.7290 1.2756 3.0057 1.0950II-a 4.7961 6.1421 1.0202 1.6920 2.8836 5.2336 1.0632 2.6503 0.9998III-a 3.4576 4.5209 0.7710 1.3001 2.2480 4.1418 0.8553 2.1727 0.8445
Multiplier 10 10 10 10 102 102 103
Fax,vert I-0 3.2014 3.6443 4.9077 6.8399 1.0028 1.6047 2.9868 7.3021 3.2981I-a 2.2596 2.5754 3.4144 4.5868 0.6339 0.9313 1.5361 3.1451 1.0025II-a 0.5339 0.4847 0.2810 �0.0993 �0.0806 �0.2229 �0.5507 �1.4976 �0.5725III-a �0.2815 �0.7327 �2.0920 �4.3077 �0.8156 �1.5562 �3.2121 �7.9503 �2.9516
Multiplier 10 10 10 10 102
Fb,vert I-0 0.0000 0.0000 0.0000 0.0000 0.0000 0.0000 0.0000 0.0000 0.0000I-a 0.2036 �0.0232 �0.7805 �0.2129 �0.4650 �0.9885 �2.2741 �0.6366 �2.6792II-a �1.1657 �1.8344 �3.8563 �0.7250 �1.3406 �2.5813 �5.4803 �1.4098 �5.4248III-a �2.0455 �3.4004 �7.3929 �1.3904 �2.5382 �4.7909 �9.9384 �2.5002 �9.5215
Multiplier 10 10 10 10 102 102
10 V. VESELÝ et al.
© 2014 Wiley Publishing Ltd. Fatigue Fract Engng Mater Struct 00, 1–15
together with the chosen value of αef, in the analysis ofthe nonlinear zone width. The graphs are accompaniedby a figure depicting the simulated crack pattern for thecase of relative notch length 0.25.
APPL ICAT ION OF MULT I - PARAMETER FRAC -
TURE MECHAN ICS
Stress field reconstruction
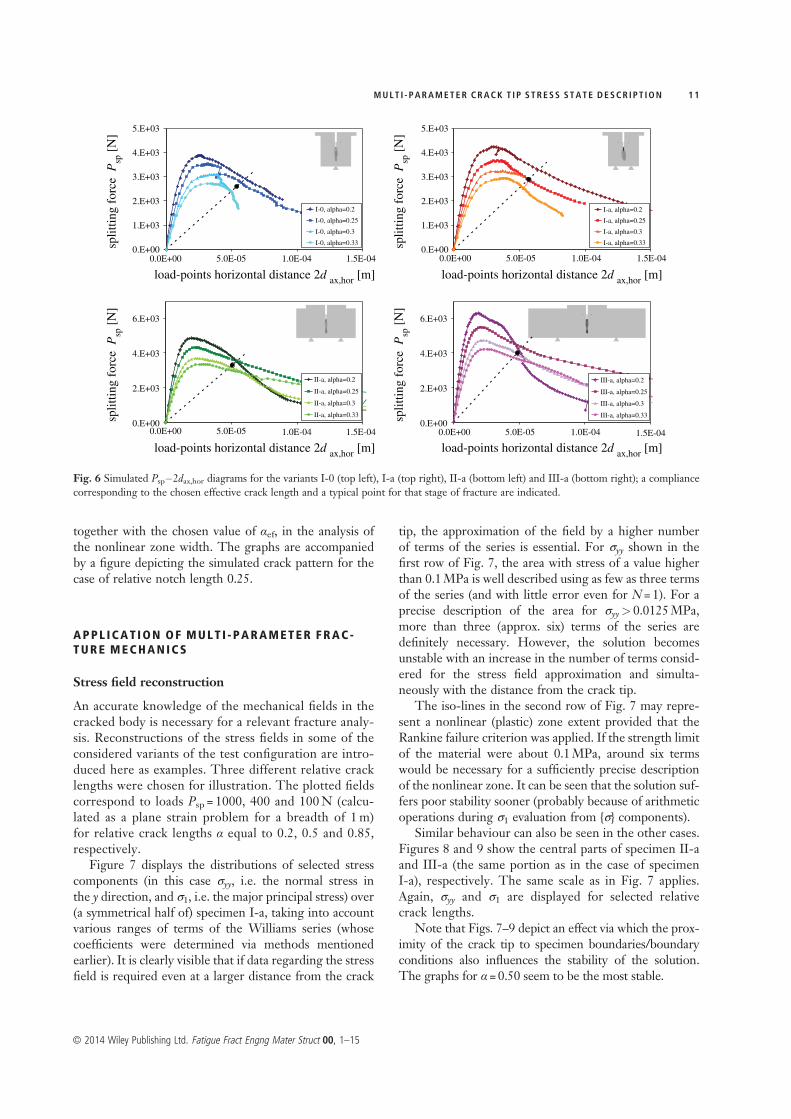
An accurate knowledge of the mechanical fields in thecracked body is necessary for a relevant fracture analy-sis. Reconstructions of the stress fields in some of theconsidered variants of the test configuration are intro-duced here as examples. Three different relative cracklengths were chosen for illustration. The plotted fieldscorrespond to loads Psp = 1000, 400 and 100N (calcu-lated as a plane strain problem for a breadth of 1m)for relative crack lengths α equal to 0.2, 0.5 and 0.85,respectively.
Figure 7 displays the distributions of selected stresscomponents (in this case σyy, i.e. the normal stress inthe y direction, and σ1, i.e. the major principal stress) over(a symmetrical half of) specimen I-a, taking into accountvarious ranges of terms of the Williams series (whosecoefficients were determined via methods mentionedearlier). It is clearly visible that if data regarding the stressfield is required even at a larger distance from the crack
tip, the approximation of the field by a higher numberof terms of the series is essential. For σyy shown in thefirst row of Fig. 7, the area with stress of a value higherthan 0.1MPa is well described using as few as three termsof the series (and with little error even for N = 1). For aprecise description of the area for σyy> 0.0125MPa,more than three (approx. six) terms of the series aredefinitely necessary. However, the solution becomesunstable with an increase in the number of terms consid-ered for the stress field approximation and simulta-neously with the distance from the crack tip.
The iso-lines in the second row of Fig. 7 may repre-sent a nonlinear (plastic) zone extent provided that theRankine failure criterion was applied. If the strength limitof the material were about 0.1MPa, around six termswould be necessary for a sufficiently precise descriptionof the nonlinear zone. It can be seen that the solution suf-fers poor stability sooner (probably because of arithmeticoperations during σ1 evaluation from {σ} components).
Similar behaviour can also be seen in the other cases.Figures 8 and 9 show the central parts of specimen II-aand III-a (the same portion as in the case of specimenI-a), respectively. The same scale as in Fig. 7 applies.Again, σyy and σ1 are displayed for selected relativecrack lengths.
Note that Figs. 7–9 depict an effect via which the prox-imity of the crack tip to specimen boundaries/boundaryconditions also influences the stability of the solution.The graphs for α = 0.50 seem to be the most stable.
0.E+00
1.E+03
2.E+03
3.E+03
4.E+03
5.E+03
0.0E+00 5.0E-05 1.0E-04 1.5E-04 1.5E-04
1.5E-04 1.5E-04
0.E+00
1.E+03
2.E+03
3.E+03
4.E+03
5.E+03
0.0E+00 5.0E-05 1.0E-04
0.E+00
2.E+03
4.E+03
6.E+03
0.E+00
2.E+03
4.E+03
6.E+03
0.0E+00 5.0E-05 1.0E-04 0.0E+00 5.0E-05 1.0E-04
load-points horizontal distance 2d ax,hor
[m]
spli
ttin
g f
orc
e P
sp [
N]
load-points horizontal distance 2d ax,hor
[m]
spli
ttin
g f
orc
e P
sp [
N]
load-points horizontal distance 2d ax,hor
[m]
spli
ttin
g f
orc
e P
sp [
N]
load-points horizontal distance 2d ax,hor
[m]
spli
ttin
g f
orc
e P
sp [
N]
I-0, alpha=0.2
I-0, alpha=0.25
I-0, alpha=0.3
I-0, alpha=0.33
I-a, alpha=0.2
I-a, alpha=0.25
I-a, alpha=0.3
I-a, alpha=0.33
II-a, alpha=0.2
II-a, alpha=0.25
II-a, alpha=0.3
II-a, alpha=0.33
III-a, alpha=0.2
III-a, alpha=0.25
III-a, alpha=0.3
III-a, alpha=0.33
Fig. 6 Simulated Psp�2dax,hor diagrams for the variants I-0 (top left), I-a (top right), II-a (bottom left) and III-a (bottom right); a compliance
corresponding to the chosen effective crack length and a typical point for that stage of fracture are indicated.
MULT I - PARAMETER CRACK T I P STRESS STATE DESCR I P T ION 11
© 2014 Wiley Publishing Ltd. Fatigue Fract Engng Mater Struct 00, 1–15
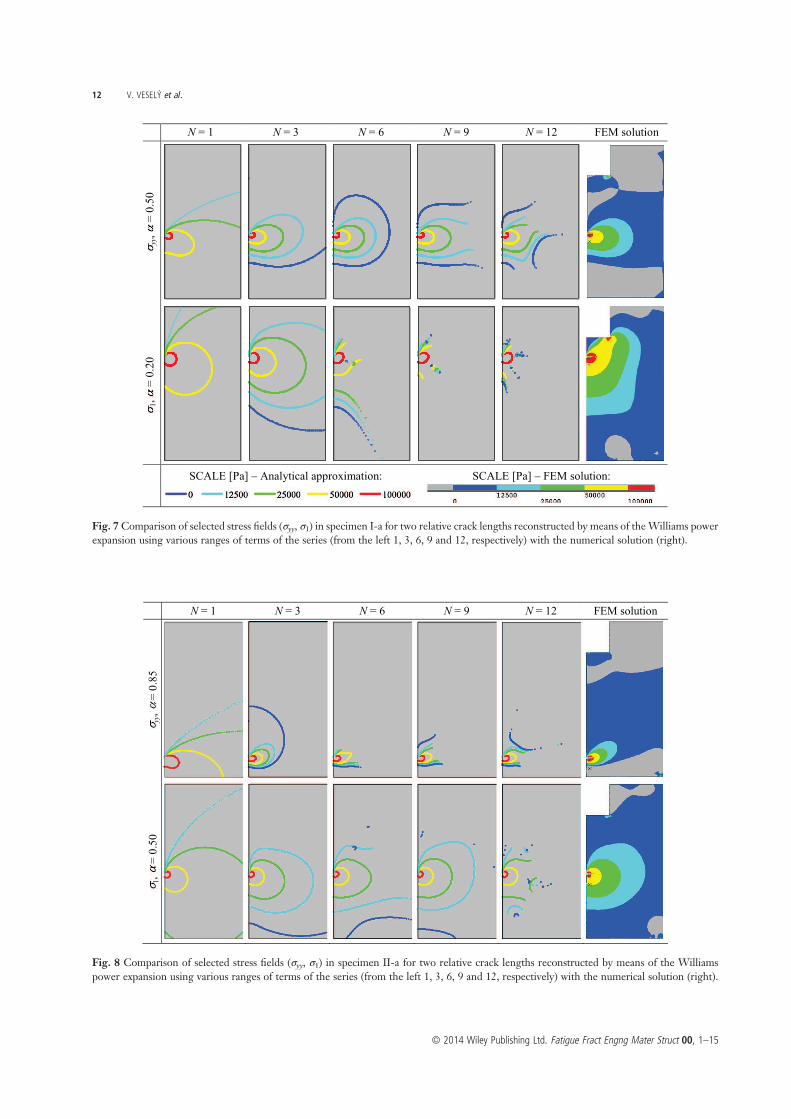
Fig. 7Comparison of selected stress fields (σyy, σ1) in specimen I-a for two relative crack lengths reconstructed by means of theWilliams power
expansion using various ranges of terms of the series (from the left 1, 3, 6, 9 and 12, respectively) with the numerical solution (right).
Fig. 8 Comparison of selected stress fields (σyy, σ1) in specimen II-a for two relative crack lengths reconstructed by means of the Williams
power expansion using various ranges of terms of the series (from the left 1, 3, 6, 9 and 12, respectively) with the numerical solution (right).
12 V. VESELÝ et al.
© 2014 Wiley Publishing Ltd. Fatigue Fract Engng Mater Struct 00, 1–15
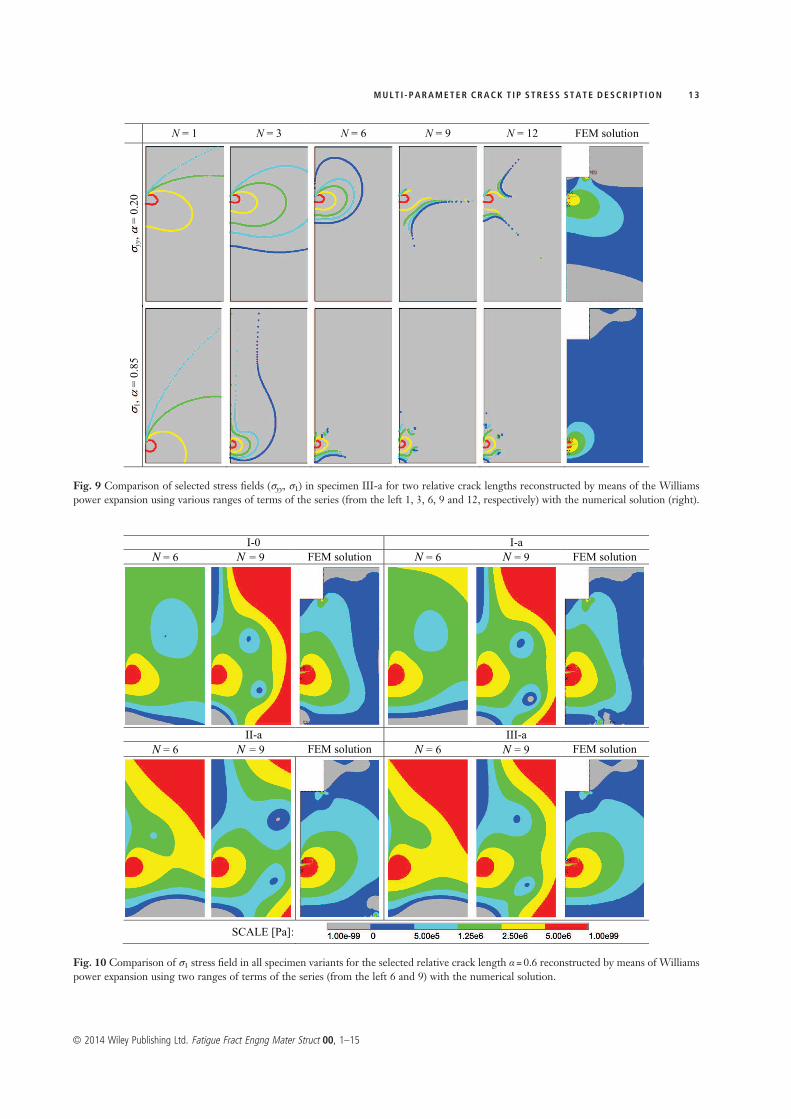
Fig. 9 Comparison of selected stress fields (σyy, σ1) in specimen III-a for two relative crack lengths reconstructed by means of the Williams
power expansion using various ranges of terms of the series (from the left 1, 3, 6, 9 and 12, respectively) with the numerical solution (right).
Fig. 10 Comparison of σ1 stress field in all specimen variants for the selected relative crack length α = 0.6 reconstructed by means of Williams
power expansion using two ranges of terms of the series (from the left 6 and 9) with the numerical solution.
MULT I - PARAMETER CRACK T I P STRESS STATE DESCR I P T ION 13
© 2014 Wiley Publishing Ltd. Fatigue Fract Engng Mater Struct 00, 1–15
Nonlinear zone extent estimation
As with the graphs with σ1 iso-lines in Figs. 7–9, a repre-sentation of the nonlinear zone width is studied in thissection. Comparison of the analytical reconstruction andthe FEM solution for the four investigated geometries isperformed. In these cases, filled plane contour plots arecreated. The stage of the fracture process in which thiscomparison is made is indicated in loading curve plots inFig. 6. It corresponds to current relative (effective) cracklength values of 0.6. Load Psp at that stage was estimated(using the aforementioned cohesive crack simulations) atvalues of 2.6, 2.9, 3.3 and 4.0 kN for the geometry variantsI-0, I-a, II-a and III-a, respectively. Again, several ranges ofinitial terms of theWilliams series were taken into account;Fig. 10 shows results for 6 and 9 terms.
As before, it is observed the same that with increasingN, the results of the analytical reconstruction of the stressfields are refined close to the crack tip and becomedisrupted farther away from it. The width of the corre-sponding stress contours increases somewhat with increas-ing specimen length (span); the widest contours are thosefor variant III-a.When this fact is considered in connectionwith typical methods of failure zone width estimation, thewidest nonlinear zone can be expected in this variant.
CONCLUS IONS
Analysis of the stress and displacement fields near a cracktip in a WST specimen is presented. For this purpose,multi-parameter fracture mechanics was applied. Theinfluence of the specimen shape and boundary conditionson the coefficients of higher-order terms of the Williamsseries (up to the order of 12) was investigated.
Subsequently, various ranges of the terms were used forthe reconstruction of the stress field around the crack tipand were compared with stress distribution obtained bymeans of the FEM. The results clearly show that especiallyfor short and long cracks and/or at larger distances fromthe crack tip, the accurate approximation of the stress fieldrequires the use of more terms of the Williams expansionthan is usual within classical fracturemechanical approaches.
Data obtained show that the studied specimen shapesand the location of supports at their bottom surface affectthe values of the shape functions gn(α) to a rathersignificant extent, at least for some relative crack lengthintervals. However, it does not result in the stress state inthe specimen ligament exerting a too noticeable influence.
Based on the visual comparison of the extent (width) ofthe iso-stress areas from the stress field reconstructionsusing Williams series (as well as the FEM simulations),the stress field becomes somewhat less constrained withincrease in the length of the specimen and the span
between supports (the larger/wider region of the same stressvaluemeans the smaller constraint and vice-versa). However,in such cases, the nonlinear zone width seems to increasesonly slightly, if at all. The conducted cohesive crack simula-tions predict no systematic increase in the nonlinear zonewidth with decrease in constraint; the widest nonlinear zonewas observed in the case of I-a geometry. Further valida-tion of the issue is planned using a spring network modelor other appropriate advanced numerical technique.
Acknowlegdements
The work has been supported by the Czech Science Foun-dation, under projects No. P104/11/0833 and 13-09518S.
REFERENCES
1 RILEM Committee FMT 50. (1985) Determination of thefracture energy of mortar and concrete by means of three-pointbend test on notched beams. Mater. Struct., 18, 285–290.
2 Bažant, Z. P. (1996) Analysis of work-of-fracture method formeasuring fracture energy of concrete. J. Engng. Mech. (ASCE),122(2), 138–144.
3 Duan, K., Hu, X.-Z.,Wittmann, F. H. (2003) Boundary effect onconcrete fracture and non-constant fracture energy distribution.Engng. Fract. Mech., 70, 2257–2268.
4 Duan, K., Hu, X.-Z.,Wittmann, F. H. (2007) Size effect on specificfracture energy of concrete. Engng. Fract. Mech., 74, 87–96.
5 Hu, X.-Z., Duan, K. (2007) Size effect: influence of proximity offracture process zone to specimen boundary. Engng. Fract.Mech., 74, 1093–1100.
6 Hu, X.-Z.,Wittmann, F.H. (2000) Size effect on toughness inducedby crack close to free surface. Engng. Fract. Mech., 65, 209–221.
7 Karihaloo, B. L., Abdalla, H. M., Imjai, T. (2003) A simplemethod for determining the true specific fracture energy ofconcrete. Mag. Concr. Res., 55, 471–481.
8 Trunk, B., Wittmann, F. H. (2001) Influence of size on fractureenergy of concrete. Mater. Struct., 34, 260–265.
9 Veselý, V., Frantík, P., Keršner, Z. (2009) Cracked volumespecified work of fracture. In: (Edited by B.H.V. Topping,L.F. Costa Neves, R.C. Barros), Proc. of 12th Int. Conf. onCivil, Structural and Environmental Engineering Computing,Funchal, Portugal, Civil-Comp Press, Stirlingshire, UK, pap.194 (16 p.). DOI: 10.4203/ccp.91.194.
10 Veselý, V., Frantík, P. (2013) An application for the fracturecharacterization of quasi-brittle materials taking into accountfracture process zone influence. Adv. Eng. Softw. http://dx.doi.org/10.1016/j.advengsoft.2013.06.004 (in press).
11 Veselý, V., Frantík, P., Vidya Sagar, R., Štafa, M., Pail, T. (2014)Balanced energy dissipation at propagating crack tip in quasi-brittle materials? – analysis via soft-computing methods. KeyEng. Mat., 577-578, 269–272. DOI: 10.4028/www.scientific.net/KEM.577-578.269.
12 Eliáš, J., Vořechovský, M., Bažant, Z. P. (2013) Stochastic latticesimulations of flexural failure in concrete beams. Proceedings of8th International Conference on Fracture Mechanics ofConcrete and Concrete Structures FraMCoS-8, Toledo, Spain,March 10–14. (Edited by J.G.M. Van Mier, G. Ruiz, C.
14 V. VESELÝ et al.
© 2014 Wiley Publishing Ltd. Fatigue Fract Engng Mater Struct 00, 1–15
Andrade, R.C. Yu and X.X. Zhang). CIMNE, 12 p. ISBN 978-84-941004-1-3.
13 Grassl, P., Grégoire, D., Rojas Solano, L., Pijaudier-Cabot, G.(2011) Meso-scale modelling of the size effect on the fracture pro-cess zone of concrete. arXiv:1107.2311v1 [cond-mat.mtrl-sci], 26. p.
14 Hadjab, H. S., Thimus, J.-F., Chabaat, M. (2007) The use ofacoustic emission to investigate fracture process zone in notchedconcrete beams. Curr. Sci., 93(5), 648–653.
15 Haidar, K., Pijaudier-Cabot, G., Dubé, J. F., Loukili, A. (2005)Correlation between the internal length, the fracture process zoneand size effect in model materials. Mater. Struct., 38, 201–210.
16 Frantík, P., Veselý, V., Keršner, Z. (2013) Parallelization oflattice modelling for estimation of fracture process zone extentin cementitious composites. Adv. Eng. Softw., 60-61, 48–57,http://dx.doi.org/10.1016/j.advengsoft.2012.11.020.
17 Veselý, V., Frantík, P. (2010) Reconstruction of a fractureprocess zone during tensile failure of quasi-brittle materials.Appl. Comp. Mech., 4, 237–250.
18 Vavřík, D., Fíla, T., Jandejsek, I., Veselý, V., Frantík, P., Keršner,Z. (2012) Fracture process in silicate composite specimens – X-raydynamic observation and numerical modelling. In: Proceedings ofthe 19th ECF, Kazan, Rusia, Kazan Scientific Centre of theRussian Academy of Science, Kazan, 9 p. ISBN 978-5-905576-18-8.
19 Vavřík, D., Jandejsek, I., Fíla, T., Veselý, V. (2013) Radio-graphic observation and semi-analytical reconstruction of frac-ture process zone in silicate composite specimen. Acta Technica,58, 315–326.
20 Veselý, V., Keršner, Z., Němeček, J., Frantík, P., Řoutil, L.,Kucharczyková, B. (2010) Estimation of fracture process zoneextent in cementitious composites. Chem. listy, 104, s382–s385.
21 Šestáková (Malíková), L. (2013) How to enhance efficiency andaccuracy of the over-deterministic method used for determina-tion of the coefficients of the higher-order terms in Williamsexpansion. Appl. Mech. Mat., 245, 120–125.
22 Šestáková (Malíková), L. (2014) Detailed crack-tip stress fielddescription in a specimen subjected to mixed-mode loading.Key Eng. Mat. 577-578, 317–320. DOI: 10.4028/www.scien-tific.net/KEM.577-578.317.
23 Šestáková (Malíková), L. (2014) Using the multi-parameterfracture mechanics for more accurate description of stress/dis-placement crack tip fields. Key Eng. Mat. 586, 237–240. DOI:10.4028/www.scientific.net/KEM.586.237.
24 Šestáková (Malíková), L., Veselý, V., Sobek, J., Frantík, P.(2013) Accuracy of approximation of stress field in crackedbodies for failure zone extent estimation. In: Proceedings of8
thInternational Conference on Fracture Mechanics of
Concrete and Concrete Structures FraMCoS-8, Toledo, Spain,March 10–14. (Edited by J.G.M. Van Mier, G. Ruiz, C.Andrade, R.C. Yu and X.X. Zhang). CIMNE, pp. 1615–1624.ISBN 978-84-941004-1-3.
25 Veselý, V., Šestáková (Malíková), L., Seitl, S. (2012) Influence ofboundary conditions on higher order terms of near-crack-tip stressfield in a WST specimen. Key Eng. Mat., 488-489, 399–402.
26 Veselý, V., Sobek, J., Šestáková (Malíková), L., Seitl, S. (2013)Accurate description of near-crack-tip fields for the estimationof inelastic zone extent in quasi-brittle materials. Key Eng.Mat., 525-526, 529–532.
27 Veselý, V., Sobek, J., Šestáková (Malíková), L., Frantík, P., Seitl,S. (2013) Multi-parameter crack tip stress state description forestimation of fracture process zone extent in silicate compositeWST specimens. Frattura ed Integrità Strutturale, Special Issue:Characterization of Crack Tip Stress Field, 25, pp. 69–78.Gruppo Italiano Frattura, Italia. ISSN 1971-8993. DOI:10.3221/IGF-ESIS.25.11.
28 Williams, M. L. (1957) On the stress distribution at the base of astationary crack. J. Appl. Mech. (ASME), 24, 109–114.
29 Berto, F., Lazzarin, P. (2013) Multiparametric full-field repre-sentations of the in-plane stress fields ahead of cracked compo-nents under mixed mode loading. Int. J. Fatigue, 46, 16–26.
30 Berto, F., Lazzarin, P., Christopher, C. J., James, M. N. (2011)Characterization of crack tip stress fields, Forni di Sopra (UD),Italy, March 7–9, 88–95.
31 Guagliano, M., Sangirardi, M., Sciuccati, A., Zakeri, M. (2011)Multiparameter analysis of the stress field around a crack tip.Procedia Engineering, 10, 2931–2936.
32 Karihaloo, B. L. (1995) Fracture mechanics and structuralconcrete. Longman Scientific & Technical, New York.
33 Karihaloo, B. L. (1999) Size effect in shallow and deep notchedquasi-brittle structures. Int. J. Fract., 95, 379–390.
34 Sousa, R. A., Castro, J. T. P., Lopes, A. A. O., Martha, L. F. (2012) Onimproved crack tip plastic zone estimates based on T-stress and oncomplete stress fields. Fatigue Fract. Engng. Mater. Struct. 36, 25–38.
35 Karihaloo, B. L., Abdalla, H., Xiao, Q. Z. (2003) Coefficients ofthe crack tip asymptotic field for wedge splitting specimen.Engng. Fract. Mech., 70, 2407–2420.
36 Karihaloo, B. L., Xiao, Q. Z. (2001) Higher order terms of thecrack tip asymptotic field for a wedge-splitting specimen. Int.J. Fract., 112, 129–137.
37 Seitl, S., Veselý, V., Řoutil, L. (2011) Two-parameter fracturemechanical analysis of a near-crack-tip stress field in wedgesplitting test specimens. Comp. Struct., 89, 1852–1858.
38 Ayatollahi, M. R., Nejati, M. (2011) An over-deterministicmethod for calculation of coefficients of crack tip asymptoticfield from finite element analysis. Fatigue Fract. Engng. Mater.Struct., 34, 159–176.
39 Mathcad user’s guide, (2007). Mathcad 14.0, ParametricTechnology Corp.
40 Wolfram Mathematica Documentation Center, (2007) WolframResearch, Inc., champaign.
41 Wikipedia – yield surface. http://en.wikipedia.org/wiki/Yield_surface.
42 Seitl, S., Korte, S., De Corte, W., Boel, V., Sobek, J., Veselý, V.(2014) Selecting a suitable specimen shape with low constraintvalue for determination of fracture parameters of cementitiouscomposites. Key Eng. Mat., 577-578, 481–484. DOI:10.4028/www.scientific.net/KEM.577-578.481.
43 Linsbauer, H. N., Tschegg, E. K. (1986) Fracture energydetermination of concrete with cube-shaped specimens. Zementund Beton, 31, 38–40.
44 ANSYS Users manual version 10.0, Swanson Analysis System,Inc., Houston, 2005.
45 Sobek, J., Veselý, V., Šestáková, L. (2012) Accuracy ofapproximation of stress and displacement fields in cracked bodyfor estimation of failure zone extent. Transactions of the VŠB–Technical University of Ostrava, Civil Engineering Series, Vol.XII, Issue 2. Versita Varsaw, 2012, pp. 1-10. ISSN 1804-4824(Online). DOI: 10.2478/v10160-012-0031-5.
46 Šestáková (Malíková), L., Veselý, V. (2013) Convergence studyon application of the over-deterministic method for determina-tion of near-tip fields in a cracked plate loaded in mixed-mode.Appl. Mech. Mat. 249-250, 76–81.
47 Červenka V., Jendele, L., Červenka, J. (2010) ATENA programdocumentation, theory. Prague: Cervenka Consulting.
48 Menétrey, P., Willam, K. J. (1995) Triaxial failure criterion for con-crete and its generalization. ACI Structural Journal, 92(3), 311–318.
49 Hordijk, D. A. (1991) Local approach to fatigue of concrete.Doctor dissertation, Delft University of Technology, TheNetherlands, ISBN 90/9004519-8.
MULT I - PARAMETER CRACK T I P STRESS STATE DESCR I P T ION 15
© 2014 Wiley Publishing Ltd. Fatigue Fract Engng Mater Struct 00, 1–15
Copyright © 2022 FDOKUMEN