Multi-hazard and multi-risk decision-support tools as a part of participatory risk governance:...
18
Multi-hazard and multi-risk decision-support tools as a part of participatory risk governance: Feedback from civil protection stakeholders Nadejda Komendantova a,e,n , Roger Mrzyglocki b , Arnaud Mignan c , Bijan Khazai d , Friedemann Wenzel d , Anthony Patt a,e , Kevin Fleming f a International Institute for Applied Systems Analysis, Risk, Policy and Vulnerability Program (IIASA), Austria b German Committee for Disaster Reduction (DKKV), Germany c ETH Zurich, Swiss Seismological Service, Switzerland d Karlsruhe Institute of Technology, Center for Disaster Management and Risk Reduction (CEDIM), Germany e ETH Zürich, Department of Environmental Systems Science, Switzerland f Helmholtz Centre Potsdam, GFZ German Research Centre for Geosciences, Section 2.1 Physics of Earthquakes and Volcanoes (GFZ), Germany article info Article history: Received 9 July 2013 Received in revised form 5 December 2013 Accepted 9 December 2013 Available online 16 January 2014 Keywords: Multi-hazard Multi-risk Risk governance abstract The number of people affected by natural hazards is growing, as many regions of the world become subject to multiple hazards. Although volume of geophysical, sociological and economic knowledge is increasing, so are the losses from natural catastrophes. The slow transfer from theory to practice might lay in the difficulties of the communication process from science to policy-making, including perceptions by stakeholders from disaster mitigation practice regarding the usability of developed tools. As scientific evidence shows, decision-makers are faced with the challenge of not only mitigating against single hazards and risks, but also multiple risks, which must include the consideration of their interrelations. As the multi-hazard and risk concept is a relatively young area of natural risk governance, there are only a few multi-risk models and the experience of practitioners as to how to use these models is limited. To our knowledge, scientific literature on stakeholders 0 perceptions of multi-risk models is lacking. In this article we identify perceptions of two decision-making tools, which involve multi-hazard and multi-risk. The first one is a generic, multi-risk framework based on the sequential Monte Carlo method to allow for a straightforward and flexible implementation of hazard interactions, which may occur in a complex system. The second is a decision-making tool that integrates direct input from stakeholders by attributing weights to different components and constructing risks ratings. Based on the feedback from stakeholders, we found that interest in multi-risk assessment is high but that its application remains hampered by the complexity of processes involved. & 2014 Elsevier Ltd. All rights reserved. 1. Introduction Historical records show that economic losses from disasters have increased steadily from €150 billion (value inflation adjusted for the year 1999) for the period 1950– 1959 to about €375 billion in the decade 1990–1999 [34]. Unfortunately, non-economic losses, such as human lives, are much more difficult to assess and they are not included in the majority of databases. Nonetheless, there is ample evidence in the literature that the number of people who are directly or indirectly affected by disasters will continue to increase [2,5,13,18,50]. Furthermore, many regions of Contents lists available at ScienceDirect journal homepage: www.elsevier.com/locate/ijdrr International Journal of Disaster Risk Reduction 2212-4209/$ - see front matter & 2014 Elsevier Ltd. All rights reserved. http://dx.doi.org/10.1016/j.ijdrr.2013.12.006 n Corresponding author. E-mail address: [email protected] (N. Komendantova). International Journal of Disaster Risk Reduction 8 (2014) 50–67
Transcript of Multi-hazard and multi-risk decision-support tools as a part of participatory risk governance:...
Contents lists available at ScienceDirect
International Journal of Disaster Risk Reduction
International Journal of Disaster Risk Reduction 8 (2014) 50–67
2212-42http://d
n CorrE-m
journal homepage: www.elsevier.com/locate/ijdrr
Multi-hazard and multi-risk decision-support tools as a partof participatory risk governance: Feedback from civilprotection stakeholders
Nadejda Komendantova a,e,n, Roger Mrzyglocki b, Arnaud Mignan c,Bijan Khazai d, Friedemann Wenzel d, Anthony Patt a,e, Kevin Fleming f
a International Institute for Applied Systems Analysis, Risk, Policy and Vulnerability Program (IIASA), Austriab German Committee for Disaster Reduction (DKKV), Germanyc ETH Zurich, Swiss Seismological Service, Switzerlandd Karlsruhe Institute of Technology, Center for Disaster Management and Risk Reduction (CEDIM), Germanye ETH Zürich, Department of Environmental Systems Science, Switzerlandf Helmholtz Centre Potsdam, GFZ German Research Centre for Geosciences, Section 2.1 Physics of Earthquakes and Volcanoes (GFZ), Germany
a r t i c l e i n f o
Article history:Received 9 July 2013Received in revised form5 December 2013Accepted 9 December 2013Available online 16 January 2014
Keywords:Multi-hazardMulti-riskRisk governance
09/$ - see front matter & 2014 Elsevier Ltd.x.doi.org/10.1016/j.ijdrr.2013.12.006
esponding author.ail address: [email protected] (N. Komen
a b s t r a c t
The number of people affected by natural hazards is growing, as many regions of theworld become subject to multiple hazards. Although volume of geophysical, sociologicaland economic knowledge is increasing, so are the losses from natural catastrophes. Theslow transfer from theory to practice might lay in the difficulties of the communicationprocess from science to policy-making, including perceptions by stakeholders fromdisaster mitigation practice regarding the usability of developed tools. As scientificevidence shows, decision-makers are faced with the challenge of not only mitigatingagainst single hazards and risks, but also multiple risks, which must include theconsideration of their interrelations. As the multi-hazard and risk concept is a relativelyyoung area of natural risk governance, there are only a few multi-risk models and theexperience of practitioners as to how to use these models is limited. To our knowledge,scientific literature on stakeholders0 perceptions of multi-risk models is lacking. In thisarticle we identify perceptions of two decision-making tools, which involve multi-hazardand multi-risk. The first one is a generic, multi-risk framework based on the sequentialMonte Carlo method to allow for a straightforward and flexible implementation of hazardinteractions, which may occur in a complex system. The second is a decision-making toolthat integrates direct input from stakeholders by attributing weights to differentcomponents and constructing risks ratings. Based on the feedback from stakeholders,we found that interest in multi-risk assessment is high but that its application remainshampered by the complexity of processes involved.
& 2014 Elsevier Ltd. All rights reserved.
1. Introduction
Historical records show that economic losses fromdisasters have increased steadily from €150 billion (value
All rights reserved.
dantova).
inflation adjusted for the year 1999) for the period 1950–1959 to about €375 billion in the decade 1990–1999 [34].Unfortunately, non-economic losses, such as human lives,are much more difficult to assess and they are not includedin the majority of databases. Nonetheless, there is ampleevidence in the literature that the number of people whoare directly or indirectly affected by disasters will continueto increase [2,5,13,18,50]. Furthermore, many regions of
N. Komendantova et al. / International Journal of Disaster Risk Reduction 8 (2014) 50–67 51
the world are not subject to only single hazards, but maybe impacted upon by multiple hazards, which may also becorrelated. Conjoint disasters and cascading effects poten-tially yield higher direct losses, such as damage to infra-structure, as well as higher indirect losses, such asbusiness interruption.
Existing risk assessment methods integrate large volumesof data and sophisticated analyses, as well as differentapproaches to risk quantification. However, the key questionis why do losses from natural disasters continue to grow if ourscientific knowledge on multi-risk increases? [48]. One reasonis the increasing value of assets exposed to hazards. However,there may be other reasons, and an understanding of thesewill play a key role in the reduction of losses in the future. AsKappes et al. [26] stated in their review on multi-hazard risk,to be able to understand this question, we also need to exa-mine the frameworks employed in the field of risk manage-ment, as well as the interactions between science andpractice in terms of knowledge transfer and the applicabilityof results. The successful implementation of disaster riskreduction options and strategies demand not only compre-hensive risk assessment schemes, but also an appropriatemechanism to communicate and transfer knowledge on riskand its underlying drivers to the various stakeholdersinvolved in the decision-making process.
Multi-risk assessment tools have the potential to sup-port decision-makers and to provide themwith informationon mitigation measures. These tools can influence theperceptions of stakeholders in terms of the probabilities ofhazards and their impacts. But this is a double-sidedcommunication process, as the feedback from stakeholders0
influences the usability of the tools and the implementationof recommendations provided by the geosciences, sociologyand economics. That is why feedback and perceptions of theusability of these models from the side of stakeholders areextremely important to the process of communication fromscience to policy and vice versa. So far, however, theliterature on the topic of how stakeholders perceive theusability of multi-risk models is very limited.
The aim of this paper is to identify the feedback of civilprotection stakeholders to the value of two complemen-tary decision-making tools developed within the contextof the EU FP7 project New Multi-Hazard and Multi-RiskAssessment Methods for Europe (MATRIX1)1. MATRIX issetting out to methods and tools to tackle multi-typenatural hazards within a common framework, focusingon the European context, which includes the followingdecision-making tools:
(1)
1
A generic probabilistic framework that implementshazard correlations in a comprehensive manner[31], and
(2)
An evaluation methodology based on the concept ofthe risk matrix to incorporate expert knowledgethrough stakeholder interactions into multi-hazardscenario development, developed by B. Khazai of theKarlsruhe Institute of Technology and described inthis paper.http://matrix.gpi.kit.edu/index.php
This work is a first attempt to collect and to integratethe feedback of stakeholders from civil protection autho-
rities into decision-making tools, which include aspects ofmulti-hazard and multi-risk. The feedback was gainedduring two workshops, in Bonn (July 2012) and in Lisbon(October 2012), and from questionnaires distributed onsite at the first workshop. The research within this workencompasses three overarching questions:a.
How do stakeholders perceive multi-hazard and multi-risk situations and what are their requirements formulti-risk assessment tools?b.
How do stakeholders perceive the decision-makingprocess for the mitigation of multi-risk and their feed-back on the usability of decision-making tools?c.
Is there a difference in the resulting feedback fromstakeholders (based on practice) and academia (basedon more theoretical considerations)?2. Background
This section aims at elaborating upon the basic termsin multi-risk assessment and examples of past experi-ences in multi-risk. This short review especially highlightsthe fact that decision-making under multi-risk is a nas-cent field. Feedback from stakeholders on newly devel-oped multi-risk tools is a participatory process that isgreatly needed to avoid a dichotomy arising betweenscience and practice.
2.1. Definitions of multi-risk assessment
Risk assessment includes hazard assessment, followedby estimations of the vulnerability and values of theelements at risk (or exposure), all leading to the computa-tion of risk as a function of hazard, vulnerability andexposure [45]. The term “natural hazard” refers to the“natural process or phenomenon that may cause loss oflife, injury or other health impacts, property damage, lossof livelihoods and services, social and economic disrup-tion, or environmental damage” [43,46]. Risk is defined asthe “expected losses of lives, persons injured, propertydamages and economic activities disrupted due to aparticular hazard for a given area and reference period”[49]. Another definition of risk is “the combination of theprobability of an event and its negative consequences”[43]. In any case, a definition of risk must also include theinteraction of hazards and the vulnerability of the affectedarea, especially the built environment. Definitions devel-oped by the European Commission extend the previousdefinitions by incorporating the terms “exposure” and“vulnerability” [9]. This foresees that an event of the samemagnitude can have a different impact, depending uponthe vulnerability and exposure of a given population andthe associated elements, thus also involving the need totake into consideration preparedness and preventive mea-sures. The definition of risk is also closely connected withthe definition of uncertainty, as the term “probability”already itself implies aleatory uncertainties. Risk can alsobe understood as “the effects of uncertainty on objectives”
N. Komendantova et al. / International Journal of Disaster Risk Reduction 8 (2014) 50–6752
which appear as a “combination of the consequences of anevent and the associated likelihood of occurrence” [24].It is therefore important to understand such uncertaintieswhen it comes to the development of decision-makingmodels and tools for the purposes of civil protection.
The purpose of multi-risk assessment is therefore toestablish a ranking of different types of risk, taking intoaccount possible conjoint and cascade effects. Multi-riskassessment is a relatively new field, until now developedonly partially by experts with different backgrounds suchas engineering, statistics or various fields of geosciences.Currently, there is no clear definition of “multi-risk”,neither in science, nor in practice ([9,26]). The onlydefinition that exists concerns the requirements formulti-risk, which needs to consider multiple hazards andmultiple vulnerabilities ([6,14,30,39]). There are essentiallytwo ways to approach multi-risk. The first considers thedifferent types of hazards and vulnerabilities of a regionand combines the results of various single risk layers into amulti-risk concept (e.g., [21]). This approach provides anoverview of multiple risks, but neglects the interactionsbetween the hazards and vulnerability. The second oneconsiders the risk arising from multiple hazardous sourcesand multiple vulnerable elements coinciding in time andspace [14]. However, a distinction between conjoint andcascading events must be made here. Conjoint events arewhen a series of parallel adverse events are generated bydifferent sources, for example a windstorm occurring at thesame time as an earthquake [14]. Cascading events on theother hand are when an initial event triggers a subsequentevent or series of events, for example an earthquake thattriggers a landslide or a tsunami (e.g., [30]).
The first approach considers more than one type ofhazards, but it ignores the spatial and temporal relation-ships between the hazards and other elements of the riskchain. For example, in the Cities Project in Australia [19], anumber of urban and regional areas were assessed for awide range of geo-hazards, however, the various interac-tions that may arise between hazards played no part inthis program. Similarly, in the German Research NetworkNatural Disasters Project, the city of Cologne was assessedfor earthquakes, windstorms and river floods separately,and while losses in terms of monetary values arising fromeach hazard were plotted together against the probabilityof occurrence to allow a comparison, the possible interac-tions between them and the effect this has on the final riskwere not considered, nor were the associated uncertainties[21]. Again, neither of these studies considered the possi-bility of one hazard type triggering another, nor theconsequences of events occurring simultaneously, ornearly-simultaneously, and how this affects an area0svulnerability. Hence, by not considering such interactions,which may lead to increased losses, such frameworkspotentially grossly underestimate the final risk. Moreover,most of these studies employ the term “multi-risk” todescribe what should really be referred to as “multiplesingle risk”, which adds to the confusion.
By contrast, the second approach explicitly considersspatial and temporal interactions between differenthazards and their subsequent risk. An example is theNaRaS EU project for the Casalnuovo municipality in the
province of Naples in Italy. This municipality is located just13 km away from the crater of the mount Vesuvius volcanoand is exposed to several kinds of hazards, such as theVesuvius volcano, active faults in the Apennine chain(tectonic source area of the damaging 1930 and 1980Irpinia earthquakes), as well as the presence of industriallandfills. A study supported by the local government, whowas interested in identifying the most dangerous hazardsand the most effective way of financing risk mitigationmeasures, found that volcanic risks significantly over-whelm all others, but also that the risks associated withvolcanic processes and the effects these have on industrymay be underestimated if the interactions between themis not considered [30].
2.2. Experience of civil protection authorities with multi-riskassessment
The reduction of risks cannot be only based on scien-tific knowledge about natural hazards, since risks also havesocial and psychological dimensions which are in turnshaped by political and cultural values [3]. Therefore, forthe successful implementation of risk mitigation mea-sures, it is necessary to identify these cultural and politicalfactors. The newly appearing concept of risk governancetakes into account these ingredients and emphasizes therole of participation and communication. It is also crucialto incorporate the experience of stakeholders into multi-risk assessment models. Risk governance is concernedwith how information is collected, perceived and commu-nicated and follows how management decisions are taken[23]. In the context of risk governance, risk communicationnot only transfers information on risk or risk managementdecisions, but it also includes a two-way process forcommunicating stakeholder perceptions in shaping theoutcomes of risk assessments.
Civil protection authorities have started only recentlyto apply multi-risk assessments for natural and technolo-gical disasters. In 2009, the European Commission issueda communication document with a set of measures tobe included in the European Community0s strategy forthe mitigation of natural and man-made disasters [7].Amongst other elements, the communication documentoutlines the need for multi-risk assessment and the needfor common guidelines, which will enhance the compar-ability of risks across Member States and will lead to acommon European picture of multi-risk.
The European Union Internal Security Strategy isanother milestone towards the development of multi-riskassessment. This strategy foresees the establishment of acoherent risk management policy, which will link threatsand risk assessments with decision-making [8]. The majoraim is to increase the resilience of EU member countries tocrises and disasters. Among other risk mitigation mea-sures, the strategy foresees an “all hazards approach tothreat and risk assessment”.
The Risk Assessment and Mapping Guidelines for Dis-aster Management focuses on the processes and methodsof national risk assessments, as well as on the mapping ofrisk assessment into the prevention, preparedness andplanning stages [9]. Even though it provides guidance for
2 http://www.fema.gov/hazus3 http://www.ecapra.org
N. Komendantova et al. / International Journal of Disaster Risk Reduction 8 (2014) 50–67 53
such steps as risk identification, risk analysis and riskevaluation, it does not deal with capacity analyses, cap-ability planning, monitoring and review, nor with theconsultation and communication of findings and resultsof risks assessments with stakeholders.
2.3. Participatory modeling and presentation of informationunder uncertainty
Participatory modeling is an important part of the riskgovernance and is the process which allows one to takeinto consideration not only the facts, but also values byasking questions and collecting feedback from stake-holders [15]. Therefore, it requires the active participationof stakeholders and two-way communication, where thefeedback is collected, analysed and implemented into riskassessment and decision-support tools. This process isespecially useful when the actual facts are uncertain,values are in dispute, the stakes are high and decisionsare urgent [16]. The process of interacting with stake-holders leads to an enhanced understanding of the differ-ent points of view, criteria, preferences and trade-offsinvolved in decision-making [1].
Participatory modeling is also used to build consensusamong groups of stakeholders on controversial issues,such as, for example, the attribution of weights to differentloss parameters under multi-risk scenarios. Such models,which integrate stakeholders0 feedback, were firstdeveloped for business management applications [38].Recent trends have also seen the application of decision-support models as a problem structuring method and forthe facilitation of group decision-support [36]. Thus,decision-support models become a part of executivedebate and dialogue to help avoid judgment biases andsystematic errors in decision-making [33] and to help incomplex decision-making process grounded on humanrationality, which can create persistent judgment biasesand errors [25]. The issue of what input science shouldprovide to policy-making through developed models hasalready been discussed widely in the literature [22].However, it is also known that the process of the devel-opment of models involves many assumptions and judg-ments [27,29].
Model such as STELLA or the Coastal Ecological Land-scape Spatial Simulation (CELSS), which integrate theknowledge of stakeholders via consultation processes suchas interviews, workshops and focus groups, were devel-oped to support decisions on environmental investmentsand problems [10]. The decision-makers had the chance toapply these models in practice and to choose differentparameters according to their understanding of the pro-blem [47]. As the participants were providing feedbackduring all stages of the model0s development, the models0
results were much easier to communicate and implement.Also, participants had a much more sophisticated under-standing of the underlying assumptions, uncertainties andstrengths of the models and could use them effectively as amanagement tool [11].
Currently, some decision models for multi-hazard andmulti-risk assessment are being developed with the aim ofproviding stakeholders with a set of scenarios or alternatives.
These models display different risks with respect to theirprobability and frequency, as well as to their possible out-comes. The decision-making models, such as a Multi-RiskLand Use Management Support System, developed withinframework of the ARMONIA project [41] and the scenario-based approach for risk assessment used by the GermanFederal Office of Civil Protection and Disaster Assistance [4]integrate multi-risk concept by visualizing risks and usingthe risk matrix, which combines likelihood and impact. Thedevelopment of such risk matrices was proposed by the riskassessment and mapping guidelines for disaster manage-ment developed by the European Commission in 2010 and iscurrent practice in several European countries. Within therisk matrix, multi-risk events could be represented as addi-tional scenarios (Fig. 1) and thus be integrated into theknowledge base for decision-making processes. The objec-tives of these tools are to provide assessments of exposureand vulnerability, to support discussions dealing with land-use issues and location of strategic facilities, and to provideoptions for mitigating risks through a system of MultipleCriteria Evaluations.
In addition, three principal software tools have beendeveloped to date to provide multiple single risk assess-ments of a given territory. These are HAZUS2 for the USA(hurricanes, earthquakes and floods), RiskScape for NewZealand (volcanic ash falls, floods, tsunamis, landslides,storms and earthquakes; [40]) and CAPRA3 in CentralAmerica (hurricanes, heavy rainfall, landslides, floods,earthquakes, tsunamis and volcanic hazards; CAPRA Prob-abilistic Risk Assessment Initiative, 2011). Variants of thesesoftware tools have been used in other parts of the world(e.g., HAZTURK and HAZTAIWAN, CAPRA in Asia, RiskScapein South East Asia). Even though the developers of thesetools propose an interactive process with stakeholders,currently a scientific review or evaluation of the resultsfrom the use of these tools and feedback from stakeholdersis not available. More importantly, these tools do notconsider conjoint or cascading disasters, which wouldstrictly be required for multi-risk tools.
To our knowledge, even though some of these modelshave been tested by operational and practicing stake-holders, there is limited evidence of stakeholder feedback.HAZUS is largely used by stakeholders, mainly govern-ment planners and emergency managers, to determinelosses and the most beneficial approaches for their miti-gation. It is also used by communities for the evaluation ofeconomic loss scenarios with respect to certain hazardsand to increase public awareness [17]. The aim ofRiskScape is to be an “easy to use multi-hazard impactand risk assessment tool” and to inform decision-making,including land-use planning, emergency management,assets management and insurance. This tool foreseesinteractive cooperation with users, and has put in placea development blog on-line where users can exchangetheir experience with the software and suggest improve-ments [37].
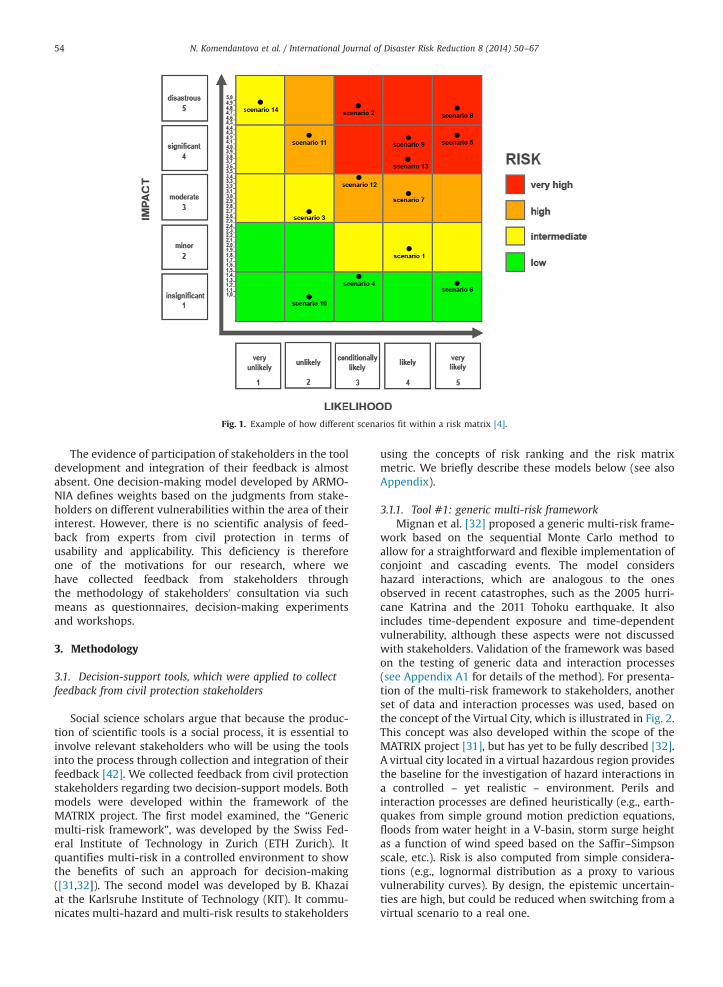
Fig. 1. Example of how different scenarios fit within a risk matrix [4].
N. Komendantova et al. / International Journal of Disaster Risk Reduction 8 (2014) 50–6754
The evidence of participation of stakeholders in the tooldevelopment and integration of their feedback is almostabsent. One decision-making model developed by ARMO-NIA defines weights based on the judgments from stake-holders on different vulnerabilities within the area of theirinterest. However, there is no scientific analysis of feed-back from experts from civil protection in terms ofusability and applicability. This deficiency is thereforeone of the motivations for our research, where wehave collected feedback from stakeholders throughthe methodology of stakeholders0 consultation via suchmeans as questionnaires, decision-making experimentsand workshops.
3. Methodology
3.1. Decision-support tools, which were applied to collectfeedback from civil protection stakeholders
Social science scholars argue that because the produc-tion of scientific tools is a social process, it is essential toinvolve relevant stakeholders who will be using the toolsinto the process through collection and integration of theirfeedback [42]. We collected feedback from civil protectionstakeholders regarding two decision-support models. Bothmodels were developed within the framework of theMATRIX project. The first model examined, the “Genericmulti-risk framework”, was developed by the Swiss Fed-eral Institute of Technology in Zurich (ETH Zurich). Itquantifies multi-risk in a controlled environment to showthe benefits of such an approach for decision-making([31,32]). The second model was developed by B. Khazaiat the Karlsruhe Institute of Technology (KIT). It commu-nicates multi-hazard and multi-risk results to stakeholders
using the concepts of risk ranking and the risk matrixmetric. We briefly describe these models below (see alsoAppendix).
3.1.1. Tool #1: generic multi-risk frameworkMignan et al. [32] proposed a generic multi-risk frame-
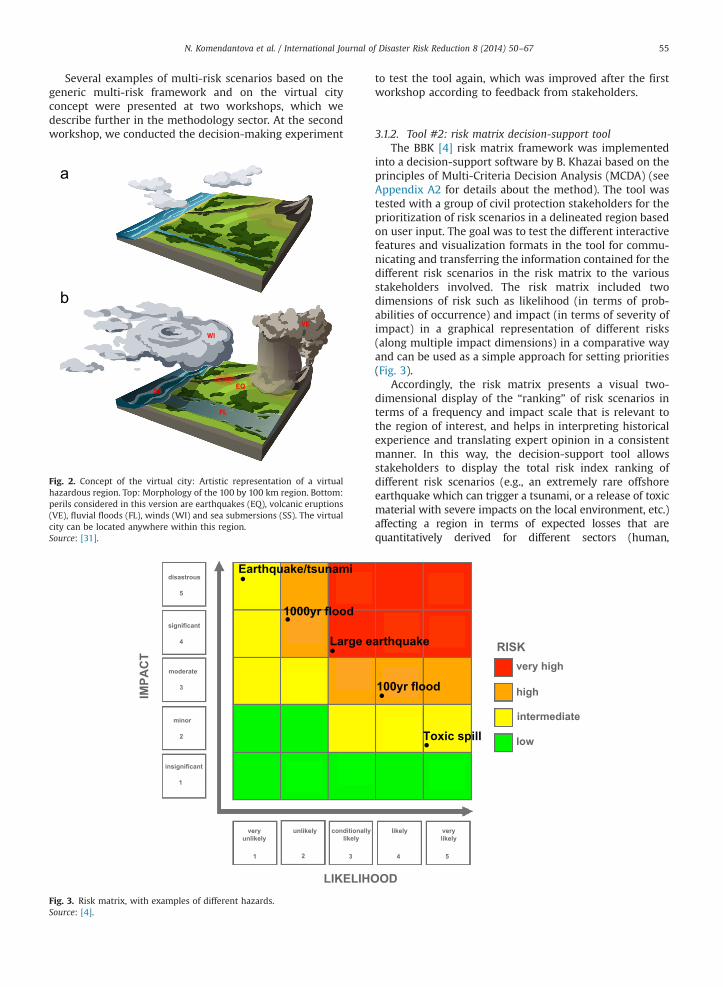
work based on the sequential Monte Carlo method toallow for a straightforward and flexible implementation ofconjoint and cascading events. The model considershazard interactions, which are analogous to the onesobserved in recent catastrophes, such as the 2005 hurri-cane Katrina and the 2011 Tohoku earthquake. It alsoincludes time-dependent exposure and time-dependentvulnerability, although these aspects were not discussedwith stakeholders. Validation of the framework was basedon the testing of generic data and interaction processes(see Appendix A1 for details of the method). For presenta-tion of the multi-risk framework to stakeholders, anotherset of data and interaction processes was used, based onthe concept of the Virtual City, which is illustrated in Fig. 2.This concept was also developed within the scope of theMATRIX project [31], but has yet to be fully described [32].A virtual city located in a virtual hazardous region providesthe baseline for the investigation of hazard interactions ina controlled – yet realistic – environment. Perils andinteraction processes are defined heuristically (e.g., earth-quakes from simple ground motion prediction equations,floods from water height in a V-basin, storm surge heightas a function of wind speed based on the Saffir–Simpsonscale, etc.). Risk is also computed from simple considera-tions (e.g., lognormal distribution as a proxy to variousvulnerability curves). By design, the epistemic uncertain-ties are high, but could be reduced when switching from avirtual scenario to a real one.
N. Komendantova et al. / International Journal of Disaster Risk Reduction 8 (2014) 50–67 55
Several examples of multi-risk scenarios based on thegeneric multi-risk framework and on the virtual cityconcept were presented at two workshops, which wedescribe further in the methodology sector. At the secondworkshop, we conducted the decision-making experiment
Fig. 2. Concept of the virtual city: Artistic representation of a virtualhazardous region. Top: Morphology of the 100 by 100 km region. Bottom:perils considered in this version are earthquakes (EQ), volcanic eruptions(VE), fluvial floods (FL), winds (WI) and sea submersions (SS). The virtualcity can be located anywhere within this region.Source: [31].
Earthquake/tsunami
Large e
1000yr flood
IMPA
CT
LIKELIHO
Fig. 3. Risk matrix, with examples of different hazards.Source: [4].
to test the tool again, which was improved after the firstworkshop according to feedback from stakeholders.
3.1.2. Tool #2: risk matrix decision-support toolThe BBK [4] risk matrix framework was implemented
into a decision-support software by B. Khazai based on theprinciples of Multi-Criteria Decision Analysis (MCDA) (seeAppendix A2 for details about the method). The tool wastested with a group of civil protection stakeholders for theprioritization of risk scenarios in a delineated region basedon user input. The goal was to test the different interactivefeatures and visualization formats in the tool for commu-nicating and transferring the information contained for thedifferent risk scenarios in the risk matrix to the variousstakeholders involved. The risk matrix included twodimensions of risk such as likelihood (in terms of prob-abilities of occurrence) and impact (in terms of severity ofimpact) in a graphical representation of different risks(along multiple impact dimensions) in a comparative wayand can be used as a simple approach for setting priorities(Fig. 3).
Accordingly, the risk matrix presents a visual two-dimensional display of the “ranking” of risk scenarios interms of a frequency and impact scale that is relevant tothe region of interest, and helps in interpreting historicalexperience and translating expert opinion in a consistentmanner. In this way, the decision-support tool allowsstakeholders to display the total risk index ranking ofdifferent risk scenarios (e.g., an extremely rare offshoreearthquake which can trigger a tsunami, or a release of toxicmaterial with severe impacts on the local environment, etc.)affecting a region in terms of expected losses that arequantitatively derived for different sectors (human,
arthquake
Toxic spill
100yr flood
OD
RISKvery high
high
intermediate
low
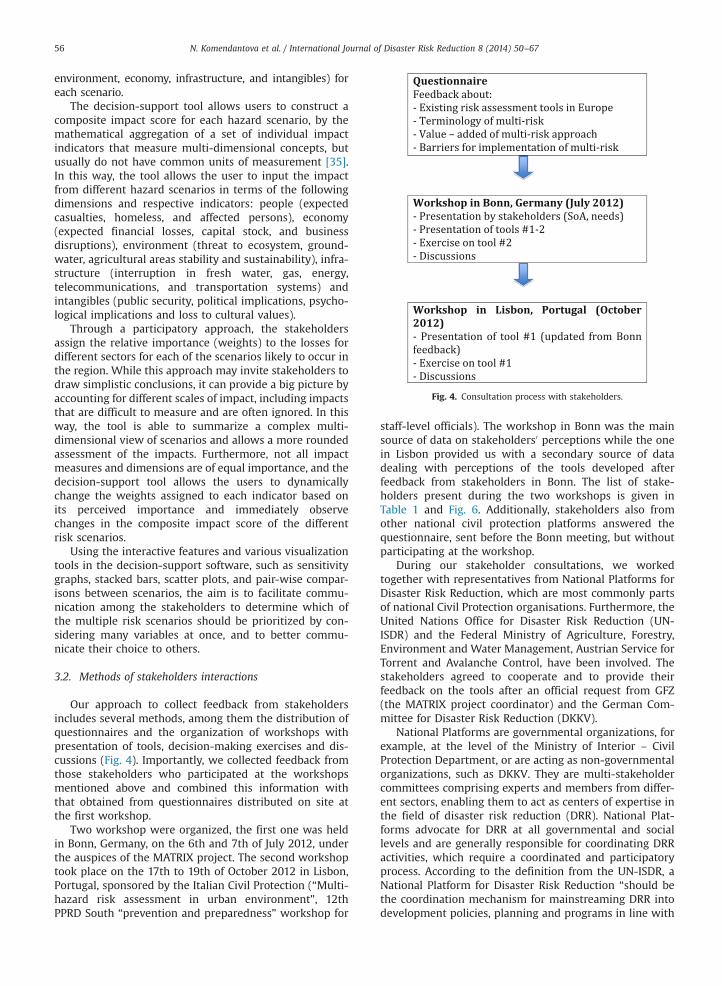
Fig. 4. Consultation process with stakeholders.
N. Komendantova et al. / International Journal of Disaster Risk Reduction 8 (2014) 50–6756
environment, economy, infrastructure, and intangibles) foreach scenario.
The decision-support tool allows users to construct acomposite impact score for each hazard scenario, by themathematical aggregation of a set of individual impactindicators that measure multi-dimensional concepts, butusually do not have common units of measurement [35].In this way, the tool allows the user to input the impactfrom different hazard scenarios in terms of the followingdimensions and respective indicators: people (expectedcasualties, homeless, and affected persons), economy(expected financial losses, capital stock, and businessdisruptions), environment (threat to ecosystem, ground-water, agricultural areas stability and sustainability), infra-structure (interruption in fresh water, gas, energy,telecommunications, and transportation systems) andintangibles (public security, political implications, psycho-logical implications and loss to cultural values).
Through a participatory approach, the stakeholdersassign the relative importance (weights) to the losses fordifferent sectors for each of the scenarios likely to occur inthe region. While this approach may invite stakeholders todraw simplistic conclusions, it can provide a big picture byaccounting for different scales of impact, including impactsthat are difficult to measure and are often ignored. In thisway, the tool is able to summarize a complex multi-dimensional view of scenarios and allows a more roundedassessment of the impacts. Furthermore, not all impactmeasures and dimensions are of equal importance, and thedecision-support tool allows the users to dynamicallychange the weights assigned to each indicator based onits perceived importance and immediately observechanges in the composite impact score of the differentrisk scenarios.
Using the interactive features and various visualizationtools in the decision-support software, such as sensitivitygraphs, stacked bars, scatter plots, and pair-wise compar-isons between scenarios, the aim is to facilitate commu-nication among the stakeholders to determine which ofthe multiple risk scenarios should be prioritized by con-sidering many variables at once, and to better commu-nicate their choice to others.
3.2. Methods of stakeholders interactions
Our approach to collect feedback from stakeholdersincludes several methods, among them the distribution ofquestionnaires and the organization of workshops withpresentation of tools, decision-making exercises and dis-cussions (Fig. 4). Importantly, we collected feedback fromthose stakeholders who participated at the workshopsmentioned above and combined this information withthat obtained from questionnaires distributed on site atthe first workshop.
Two workshop were organized, the first one was heldin Bonn, Germany, on the 6th and 7th of July 2012, underthe auspices of the MATRIX project. The second workshoptook place on the 17th to 19th of October 2012 in Lisbon,Portugal, sponsored by the Italian Civil Protection (“Multi-hazard risk assessment in urban environment”, 12thPPRD South “prevention and preparedness” workshop for
staff-level officials). The workshop in Bonn was the mainsource of data on stakeholders0 perceptions while the onein Lisbon provided us with a secondary source of datadealing with perceptions of the tools developed afterfeedback from stakeholders in Bonn. The list of stake-holders present during the two workshops is given inTable 1 and Fig. 6. Additionally, stakeholders also fromother national civil protection platforms answered thequestionnaire, sent before the Bonn meeting, but withoutparticipating at the workshop.
During our stakeholder consultations, we workedtogether with representatives from National Platforms forDisaster Risk Reduction, which are most commonly partsof national Civil Protection organisations. Furthermore, theUnited Nations Office for Disaster Risk Reduction (UN-ISDR) and the Federal Ministry of Agriculture, Forestry,Environment and Water Management, Austrian Service forTorrent and Avalanche Control, have been involved. Thestakeholders agreed to cooperate and to provide theirfeedback on the tools after an official request from GFZ(the MATRIX project coordinator) and the German Com-mittee for Disaster Risk Reduction (DKKV).
National Platforms are governmental organizations, forexample, at the level of the Ministry of Interior – CivilProtection Department, or are acting as non-governmentalorganizations, such as DKKV. They are multi-stakeholdercommittees comprising experts and members from differ-ent sectors, enabling them to act as centers of expertise inthe field of disaster risk reduction (DRR). National Plat-forms advocate for DRR at all governmental and sociallevels and are generally responsible for coordinating DRRactivities, which require a coordinated and participatoryprocess. According to the definition from the UN-ISDR, aNational Platform for Disaster Risk Reduction “should bethe coordination mechanism for mainstreaming DRR intodevelopment policies, planning and programs in line with
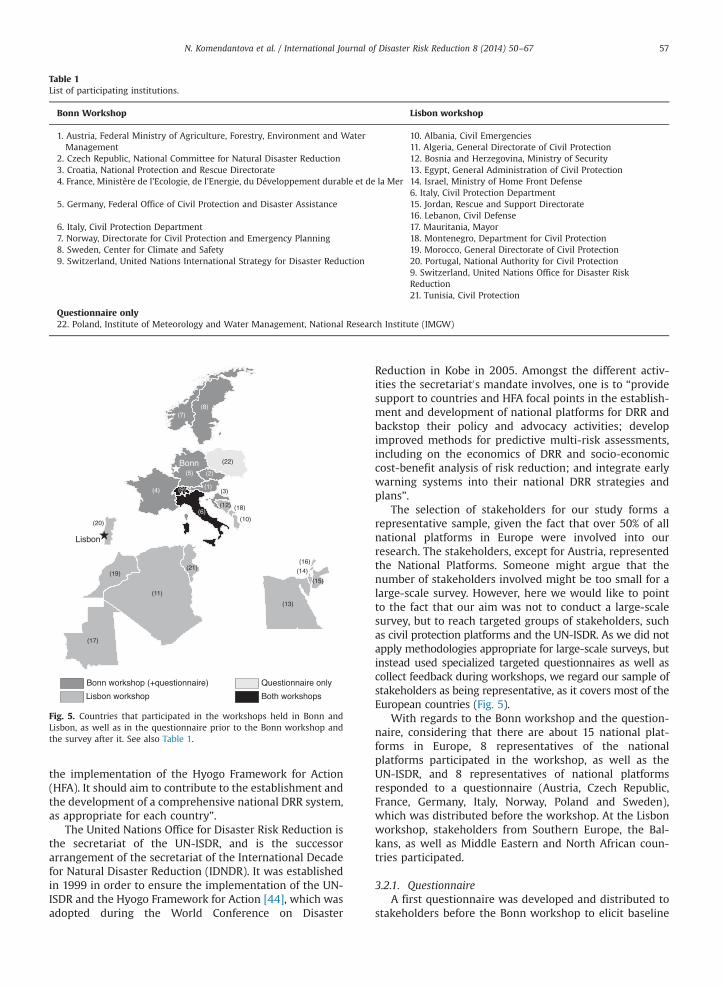
Fig. 5. Countries that participated in the workshops held in Bonn andLisbon, as well as in the questionnaire prior to the Bonn workshop andthe survey after it. See also Table 1.
Table 1List of participating institutions.
Bonn Workshop Lisbon workshop
1. Austria, Federal Ministry of Agriculture, Forestry, Environment and WaterManagement
10. Albania, Civil Emergencies11. Algeria, General Directorate of Civil Protection
2. Czech Republic, National Committee for Natural Disaster Reduction 12. Bosnia and Herzegovina, Ministry of Security3. Croatia, National Protection and Rescue Directorate 13. Egypt, General Administration of Civil Protection4. France, Ministère de l’Ecologie, de l’Energie, du Développement durable et de la Mer 14. Israel, Ministry of Home Front Defense
6. Italy, Civil Protection Department5. Germany, Federal Office of Civil Protection and Disaster Assistance 15. Jordan, Rescue and Support Directorate
16. Lebanon, Civil Defense6. Italy, Civil Protection Department 17. Mauritania, Mayor7. Norway, Directorate for Civil Protection and Emergency Planning 18. Montenegro, Department for Civil Protection
19. Morocco, General Directorate of Civil Protection8. Sweden, Center for Climate and Safety9. Switzerland, United Nations International Strategy for Disaster Reduction 20. Portugal, National Authority for Civil Protection
9. Switzerland, United Nations Office for Disaster RiskReduction21. Tunisia, Civil Protection
Questionnaire only22. Poland, Institute of Meteorology and Water Management, National Research Institute (IMGW)
N. Komendantova et al. / International Journal of Disaster Risk Reduction 8 (2014) 50–67 57
the implementation of the Hyogo Framework for Action(HFA). It should aim to contribute to the establishment andthe development of a comprehensive national DRR system,as appropriate for each country”.
The United Nations Office for Disaster Risk Reduction isthe secretariat of the UN-ISDR, and is the successorarrangement of the secretariat of the International Decadefor Natural Disaster Reduction (IDNDR). It was establishedin 1999 in order to ensure the implementation of the UN-ISDR and the Hyogo Framework for Action [44], which wasadopted during the World Conference on Disaster
Reduction in Kobe in 2005. Amongst the different activ-ities the secretariat0s mandate involves, one is to “providesupport to countries and HFA focal points in the establish-ment and development of national platforms for DRR andbackstop their policy and advocacy activities; developimproved methods for predictive multi‐risk assessments,including on the economics of DRR and socio‐economiccost‐benefit analysis of risk reduction; and integrate earlywarning systems into their national DRR strategies andplans”.
The selection of stakeholders for our study forms arepresentative sample, given the fact that over 50% of allnational platforms in Europe were involved into ourresearch. The stakeholders, except for Austria, representedthe National Platforms. Someone might argue that thenumber of stakeholders involved might be too small for alarge-scale survey. However, here we would like to pointto the fact that our aim was not to conduct a large-scalesurvey, but to reach targeted groups of stakeholders, suchas civil protection platforms and the UN-ISDR. As we did notapply methodologies appropriate for large-scale surveys, butinstead used specialized targeted questionnaires as well ascollect feedback during workshops, we regard our sample ofstakeholders as being representative, as it covers most of theEuropean countries (Fig. 5).
With regards to the Bonn workshop and the question-naire, considering that there are about 15 national plat-forms in Europe, 8 representatives of the nationalplatforms participated in the workshop, as well as theUN-ISDR, and 8 representatives of national platformsresponded to a questionnaire (Austria, Czech Republic,France, Germany, Italy, Norway, Poland and Sweden),which was distributed before the workshop. At the Lisbonworkshop, stakeholders from Southern Europe, the Bal-kans, as well as Middle Eastern and North African coun-tries participated.
3.2.1. QuestionnaireA first questionnaire was developed and distributed to
stakeholders before the Bonn workshop to elicit baseline
N. Komendantova et al. / International Journal of Disaster Risk Reduction 8 (2014) 50–6758
perceptions of the group of civil protection officers inorder to compare them with the perceptions afterwards. Italso served as a way to elicit problems perceived bystakeholders in order to discuss them during the firstworkshop. The general aim of the questionnaire was tocollect feedback from the civil protection communityabout the current status of multi-risk approaches, suchas availability, methods, and barriers, of hazard, risk andmulti-risk assessments among the involved Europeancountries. The focus was to understand the value ofmulti-hazard and multi-risk approaches and tools in realworld conditions. The questions were therefore related tothe availability of comprehensive hazard, risk and multi-risk assessments, descriptions of the applied hazard andrisk assessment methodologies, the use and usefulness ofhazard, risk and multi-risk assessments in decision makingprocesses, including probabilistic and scenario analysis,estimations of uncertainties and socio-economic and engi-neering models in hazard and risk assessment, require-ments for multi-hazard and multi-risk assessmentmethods and tools, parameters required to be considered,communication of multi-risk within decision-making pro-cesses, and the advantages of multi-risk in comparison tosingle-risk assessments.
The surveys allowed us not only to gain answers to thequestions set above, but to also capture the stakeholders0
perceptions of the term multi-risk, to gain an overview ofthe state-of the art of hazard, risk and multi-risk assess-ment, to receive feedback on the level of the integration ofhazard and risk assessments into decision making pro-cesses, to assess the usefulness of multi-risk scenarios fordisaster management strategies, to receive feedback onrequirements for multi-risk methods and tools, and on thepotential of integrating the multi-risk methodology devel-oped by MATRIX within the domain of the National Plat-form. We summarized the results of the questionnaire,presented and discussed them with the stakeholdersduring the workshop in Bonn.
3.2.2. Bonn workshopThe following activities were performed during the
Bonn workshop: presentation and discussion of the resultsof the submitted questionnaire, presentations from stake-holders and discussions about hazard and risk assessmentapproaches in Europe, presentation and discussion of thegeneric multi-risk framework and the decision-supporttool. These activities contributed to a better understandingof the current approaches and to the further developmentof the tools.
The Bonn workshop provided the opportunity to pre-sent and discuss current hazard and risk mapping con-cepts and highlight the importance of data andinformation for multi-hazard and multi-risk assessments,as well as the added value of the multi-risk approach. Italso provided an opportunity to discuss multi-risk decisionsupport tools in three aspects; first, to capture the status ofdifferent approaches and open problems with regards tomulti-risk assessment in Europe, second, to understandthe users0 requirements with regards to information tech-nology for the generation of scenarios, third, to understandthe range of risk components addressed in the current
practice, such as impacts on people0s health and lives,economic and ecological damage, impacts upon infrastruc-ture (especially critical infrastructure), and intangiblelosses.
The generic multi-risk framework (tool #1) and itsapplication in a virtual city were presented by A. Mignan,and the risk matrix decision-support tool (tool #2) waspresented by B. Khazai. No exercise involving tool #1 wasproposed in the Bonnworkshop. An exercise involving tool#2 was undertaken, in which stakeholder input wasneeded to identify the weights with which the contribu-tion of particular components on the overall picture ofimpact are specified in a participatory fashion (i.e., what isthe relative importance of the different loss parameters inthe risk ranking?). Thus, the primary difficulty in gatheringstakeholder input involved creating a “value model” thatwould support stakeholders in assessing problems andexpressing their views more explicitly. Using the decision-support tool in the workshop, the stakeholders ranked andcompared risk scenarios to each other relative to one (orseveral) loss criteria by following the five steps below:
1.
Identify all the risk scenarios to be ranked. 2. Identify loss parameters to quantify the risk score ofeach scenario.
3. Quantify the loss score (5 categories, from irrelevant tocatastrophic) for each of the loss parameters for eachscenario.
4.
Quantify preferences (weights) for different loss cate-gories and loss parameters.5.
Rank the scenarios by combining information fromsteps (4) and (5).Following the ranking of the scenarios, the stake-holders used the visualization tools of the decision-support software tool to conduct interactive sensitivityanalyses to detect the most significant factors in theranking of scenarios, and to identify whether or not theimportance of criteria differentiates between two scenar-ios. Furthermore, stakeholders discussed ways to charac-terize uncertainties in the loss parameters and to setpriorities by determining how much greater risk onescenario poses over another. Noteworthy, to save on time,only B. Khazai was directly interfacing with the tool, takinginto account recommendations from the stakeholders andshowing the outcomes on a large screen (i.e., interactivetutorial). Additional interactions with respect to tool #2allowed us to identify differences feedback between sta-keholders from science and practitioners.
3.2.3. Lisbon workshopA presentation of the generic multi-risk framework
(tool #1) in Lisbon was followed by a half-day exerciseco-organized with the PPRD South team and other speak-ers. The exercise0s aim was to provide a better under-standing of the role of multi-hazard in overall riskassessment by considering two sites: Lisbon, Portugaland Istanbul, Turkey. The participants were divided intoseveral groups of about 5 persons with discussions pro-moted within and between groups. The first part of the
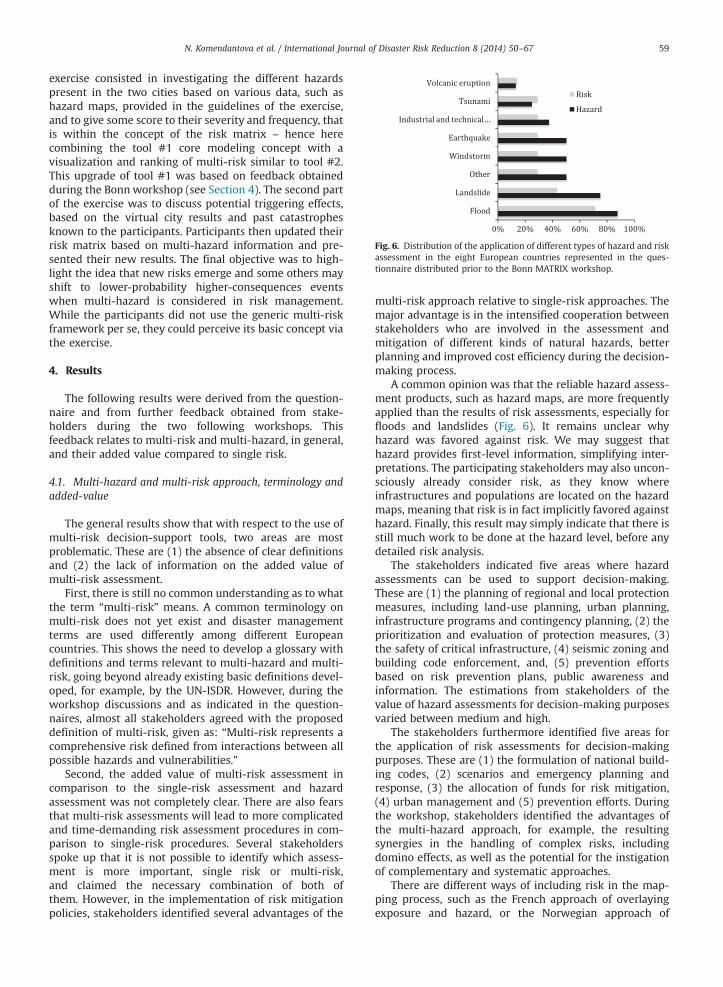
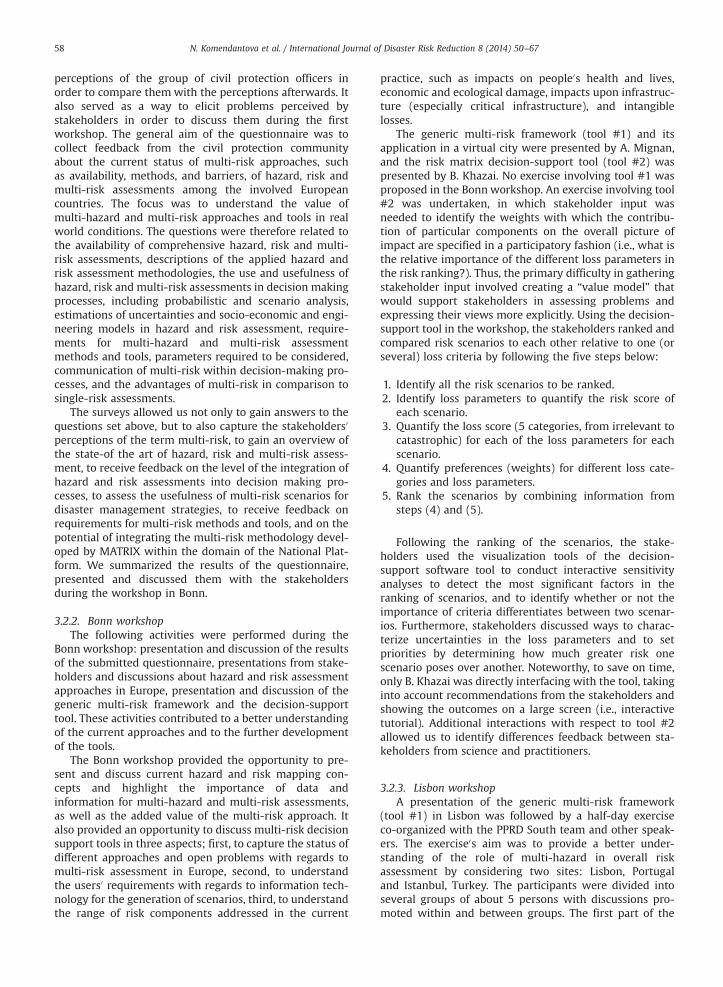
Fig. 6. Distribution of the application of different types of hazard and riskassessment in the eight European countries represented in the ques-tionnaire distributed prior to the Bonn MATRIX workshop.
N. Komendantova et al. / International Journal of Disaster Risk Reduction 8 (2014) 50–67 59
exercise consisted in investigating the different hazardspresent in the two cities based on various data, such ashazard maps, provided in the guidelines of the exercise,and to give some score to their severity and frequency, thatis within the concept of the risk matrix – hence herecombining the tool #1 core modeling concept with avisualization and ranking of multi-risk similar to tool #2.This upgrade of tool #1 was based on feedback obtainedduring the Bonnworkshop (see Section 4). The second partof the exercise was to discuss potential triggering effects,based on the virtual city results and past catastrophesknown to the participants. Participants then updated theirrisk matrix based on multi-hazard information and pre-sented their new results. The final objective was to high-light the idea that new risks emerge and some others mayshift to lower-probability higher-consequences eventswhen multi-hazard is considered in risk management.While the participants did not use the generic multi-riskframework per se, they could perceive its basic concept viathe exercise.
4. Results
The following results were derived from the question-naire and from further feedback obtained from stake-holders during the two following workshops. Thisfeedback relates to multi-risk and multi-hazard, in general,and their added value compared to single risk.
4.1. Multi-hazard and multi-risk approach, terminology andadded-value
The general results show that with respect to the use ofmulti-risk decision-support tools, two areas are mostproblematic. These are (1) the absence of clear definitionsand (2) the lack of information on the added value ofmulti-risk assessment.
First, there is still no common understanding as to whatthe term “multi-risk” means. A common terminology onmulti-risk does not yet exist and disaster managementterms are used differently among different Europeancountries. This shows the need to develop a glossary withdefinitions and terms relevant to multi-hazard and multi-risk, going beyond already existing basic definitions devel-oped, for example, by the UN-ISDR. However, during theworkshop discussions and as indicated in the question-naires, almost all stakeholders agreed with the proposeddefinition of multi-risk, given as: “Multi-risk represents acomprehensive risk defined from interactions between allpossible hazards and vulnerabilities.”
Second, the added value of multi-risk assessment incomparison to the single-risk assessment and hazardassessment was not completely clear. There are also fearsthat multi-risk assessments will lead to more complicatedand time-demanding risk assessment procedures in com-parison to single-risk procedures. Several stakeholdersspoke up that it is not possible to identify which assess-ment is more important, single risk or multi-risk,and claimed the necessary combination of both ofthem. However, in the implementation of risk mitigationpolicies, stakeholders identified several advantages of the
multi-risk approach relative to single-risk approaches. Themajor advantage is in the intensified cooperation betweenstakeholders who are involved in the assessment andmitigation of different kinds of natural hazards, betterplanning and improved cost efficiency during the decision-making process.
A common opinion was that the reliable hazard assess-ment products, such as hazard maps, are more frequentlyapplied than the results of risk assessments, especially forfloods and landslides (Fig. 6). It remains unclear whyhazard was favored against risk. We may suggest thathazard provides first-level information, simplifying inter-pretations. The participating stakeholders may also uncon-sciously already consider risk, as they know whereinfrastructures and populations are located on the hazardmaps, meaning that risk is in fact implicitly favored againsthazard. Finally, this result may simply indicate that there isstill much work to be done at the hazard level, before anydetailed risk analysis.
The stakeholders indicated five areas where hazardassessments can be used to support decision-making.These are (1) the planning of regional and local protectionmeasures, including land-use planning, urban planning,infrastructure programs and contingency planning, (2) theprioritization and evaluation of protection measures, (3)the safety of critical infrastructure, (4) seismic zoning andbuilding code enforcement, and, (5) prevention effortsbased on risk prevention plans, public awareness andinformation. The estimations from stakeholders of thevalue of hazard assessments for decision-making purposesvaried between medium and high.
The stakeholders furthermore identified five areas forthe application of risk assessments for decision-makingpurposes. These are (1) the formulation of national build-ing codes, (2) scenarios and emergency planning andresponse, (3) the allocation of funds for risk mitigation,(4) urban management and (5) prevention efforts. Duringthe workshop, stakeholders identified the advantages ofthe multi-hazard approach, for example, the resultingsynergies in the handling of complex risks, includingdomino effects, as well as the potential for the instigationof complementary and systematic approaches.
There are different ways of including risk in the map-ping process, such as the French approach of overlayingexposure and hazard, or the Norwegian approach of
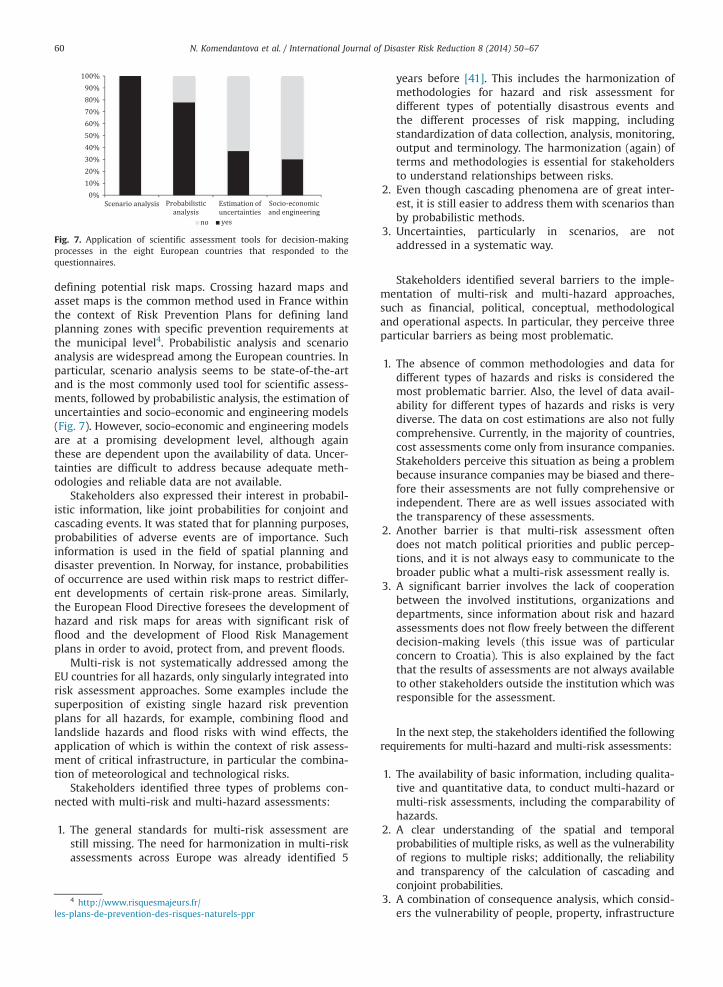
Fig. 7. Application of scientific assessment tools for decision-makingprocesses in the eight European countries that responded to thequestionnaires.
N. Komendantova et al. / International Journal of Disaster Risk Reduction 8 (2014) 50–6760
defining potential risk maps. Crossing hazard maps andasset maps is the common method used in France withinthe context of Risk Prevention Plans for defining landplanning zones with specific prevention requirements atthe municipal level4. Probabilistic analysis and scenarioanalysis are widespread among the European countries. Inparticular, scenario analysis seems to be state-of-the-artand is the most commonly used tool for scientific assess-ments, followed by probabilistic analysis, the estimation ofuncertainties and socio-economic and engineering models(Fig. 7). However, socio-economic and engineering modelsare at a promising development level, although againthese are dependent upon the availability of data. Uncer-tainties are difficult to address because adequate meth-odologies and reliable data are not available.
Stakeholders also expressed their interest in probabil-istic information, like joint probabilities for conjoint andcascading events. It was stated that for planning purposes,probabilities of adverse events are of importance. Suchinformation is used in the field of spatial planning anddisaster prevention. In Norway, for instance, probabilitiesof occurrence are used within risk maps to restrict differ-ent developments of certain risk-prone areas. Similarly,the European Flood Directive foresees the development ofhazard and risk maps for areas with significant risk offlood and the development of Flood Risk Managementplans in order to avoid, protect from, and prevent floods.
Multi-risk is not systematically addressed among theEU countries for all hazards, only singularly integrated intorisk assessment approaches. Some examples include thesuperposition of existing single hazard risk preventionplans for all hazards, for example, combining flood andlandslide hazards and flood risks with wind effects, theapplication of which is within the context of risk assess-ment of critical infrastructure, in particular the combina-tion of meteorological and technological risks.
Stakeholders identified three types of problems con-nected with multi-risk and multi-hazard assessments:
1.
les-
The general standards for multi-risk assessment arestill missing. The need for harmonization in multi-riskassessments across Europe was already identified 5
4 http://www.risquesmajeurs.fr/plans-de-prevention-des-risques-naturels-ppr
years before [41]. This includes the harmonization ofmethodologies for hazard and risk assessment fordifferent types of potentially disastrous events andthe different processes of risk mapping, includingstandardization of data collection, analysis, monitoring,output and terminology. The harmonization (again) ofterms and methodologies is essential for stakeholdersto understand relationships between risks.
2.
Even though cascading phenomena are of great inter-est, it is still easier to address them with scenarios thanby probabilistic methods.3.
Uncertainties, particularly in scenarios, are notaddressed in a systematic way.Stakeholders identified several barriers to the imple-mentation of multi-risk and multi-hazard approaches,such as financial, political, conceptual, methodologicaland operational aspects. In particular, they perceive threeparticular barriers as being most problematic.
1.
The absence of common methodologies and data fordifferent types of hazards and risks is considered themost problematic barrier. Also, the level of data avail-ability for different types of hazards and risks is verydiverse. The data on cost estimations are also not fullycomprehensive. Currently, in the majority of countries,cost assessments come only from insurance companies.Stakeholders perceive this situation as being a problembecause insurance companies may be biased and there-fore their assessments are not fully comprehensive orindependent. There are as well issues associated withthe transparency of these assessments.2.
Another barrier is that multi-risk assessment oftendoes not match political priorities and public percep-tions, and it is not always easy to communicate to thebroader public what a multi-risk assessment really is.3.
A significant barrier involves the lack of cooperationbetween the involved institutions, organizations anddepartments, since information about risk and hazardassessments does not flow freely between the differentdecision-making levels (this issue was of particularconcern to Croatia). This is also explained by the factthat the results of assessments are not always availableto other stakeholders outside the institution which wasresponsible for the assessment.In the next step, the stakeholders identified the followingrequirements for multi-hazard and multi-risk assessments:
1.
The availability of basic information, including qualita-tive and quantitative data, to conduct multi-hazard ormulti-risk assessments, including the comparability ofhazards.2.
A clear understanding of the spatial and temporalprobabilities of multiple risks, as well as the vulnerabilityof regions to multiple risks; additionally, the reliabilityand transparency of the calculation of cascading andconjoint probabilities.3.
A combination of consequence analysis, which consid-ers the vulnerability of people, property, infrastructure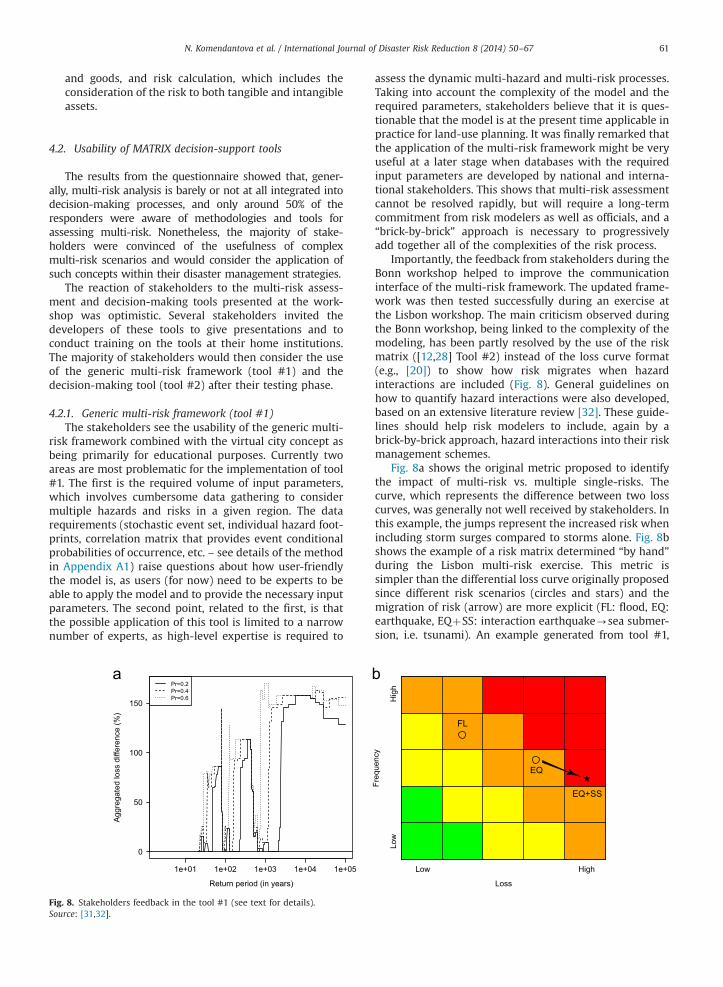
N. Komendantova et al. / International Journal of Disaster Risk Reduction 8 (2014) 50–67 61
and goods, and risk calculation, which includes theconsideration of the risk to both tangible and intangibleassets.
4.2. Usability of MATRIX decision-support tools
The results from the questionnaire showed that, gener-ally, multi-risk analysis is barely or not at all integrated intodecision-making processes, and only around 50% of theresponders were aware of methodologies and tools forassessing multi-risk. Nonetheless, the majority of stake-holders were convinced of the usefulness of complexmulti-risk scenarios and would consider the application ofsuch concepts within their disaster management strategies.
The reaction of stakeholders to the multi-risk assess-ment and decision-making tools presented at the work-shop was optimistic. Several stakeholders invited thedevelopers of these tools to give presentations and toconduct training on the tools at their home institutions.The majority of stakeholders would then consider the useof the generic multi-risk framework (tool #1) and thedecision-making tool (tool #2) after their testing phase.
4.2.1. Generic multi-risk framework (tool #1)The stakeholders see the usability of the generic multi-
risk framework combined with the virtual city concept asbeing primarily for educational purposes. Currently twoareas are most problematic for the implementation of tool#1. The first is the required volume of input parameters,which involves cumbersome data gathering to considermultiple hazards and risks in a given region. The datarequirements (stochastic event set, individual hazard foot-prints, correlation matrix that provides event conditionalprobabilities of occurrence, etc. – see details of the methodin Appendix A1) raise questions about how user-friendlythe model is, as users (for now) need to be experts to beable to apply the model and to provide the necessary inputparameters. The second point, related to the first, is thatthe possible application of this tool is limited to a narrownumber of experts, as high-level expertise is required to
1e+01 1e+02 1e+03 1e+04 1e+05
0
50
100
150
Return period (in years)
Agg
rega
ted
loss
diff
eren
ce (%
)
Pr=0.2Pr=0.4Pr=0.6
Fig. 8. Stakeholders feedback in the tool #1 (see text for details).Source: [31,32].
assess the dynamic multi-hazard and multi-risk processes.Taking into account the complexity of the model and therequired parameters, stakeholders believe that it is ques-tionable that the model is at the present time applicable inpractice for land-use planning. It was finally remarked thatthe application of the multi-risk framework might be veryuseful at a later stage when databases with the requiredinput parameters are developed by national and interna-tional stakeholders. This shows that multi-risk assessmentcannot be resolved rapidly, but will require a long-termcommitment from risk modelers as well as officials, and a“brick-by-brick” approach is necessary to progressivelyadd together all of the complexities of the risk process.
Importantly, the feedback from stakeholders during theBonn workshop helped to improve the communicationinterface of the multi-risk framework. The updated frame-work was then tested successfully during an exercise atthe Lisbon workshop. The main criticism observed duringthe Bonn workshop, being linked to the complexity of themodeling, has been partly resolved by the use of the riskmatrix ([12,28] Tool #2) instead of the loss curve format(e.g., [20]) to show how risk migrates when hazardinteractions are included (Fig. 8). General guidelines onhow to quantify hazard interactions were also developed,based on an extensive literature review [32]. These guide-lines should help risk modelers to include, again by abrick-by-brick approach, hazard interactions into their riskmanagement schemes.
Fig. 8a shows the original metric proposed to identifythe impact of multi-risk vs. multiple single-risks. Thecurve, which represents the difference between two losscurves, was generally not well received by stakeholders. Inthis example, the jumps represent the increased risk whenincluding storm surges compared to storms alone. Fig. 8bshows the example of a risk matrix determined “by hand”during the Lisbon multi-risk exercise. This metric issimpler than the differential loss curve originally proposedsince different risk scenarios (circles and stars) and themigration of risk (arrow) are more explicit (FL: flood, EQ:earthquake, EQþSS: interaction earthquake-sea submer-sion, i.e. tsunami). An example generated from tool #1,
Loss
Freq
uenc
y
Low High
Low
Hig
h
EQ
EQ+SS
FL
N. Komendantova et al. / International Journal of Disaster Risk Reduction 8 (2014) 50–6762
including numerous multi-risk scenarios from [32], isgiven in Appendix A1.
Fig. 8 highlights the idea that new risks emerge and someothers shift to lower-probability high-consequences eventswhen multi-hazard is considered in risk management. Thishad not been fully understood during both Bonn and Lisbonworkshops when using differential loss curves (Fig. 8a). Usingthe concept of the risk matrix helped to improve thecomprehension of the results obtained by the genericmulti-risk framework (Fig. 8b). The circles represent inde-pendent events, while the star represents an event emergingfrom interaction processes. In this case, floods (FL) remainindependent. While not all earthquakes (EQ) will trigger a seasubmersion (SS, here a tsunami), the combination of bothwould yield higher losses. The arrow represents the migra-tion of the risk arising from an earthquake alone to an eventwith lower-probability, but higher-consequences, when inter-actions are considered (which is similar to the jumpsobserved for longer return periods in Fig. 8a). While thisresult may appear obvious when considering this simpleexample, “surprise” chains of events may emerge whennumerous events and interactions are included in the system(see Appendix A1). This idea was well grasped during theexercise organized during the Lisbon workshop.
4.2.2. Decision-support model (tool #2)During the Bonn workshop, the stakeholders (both
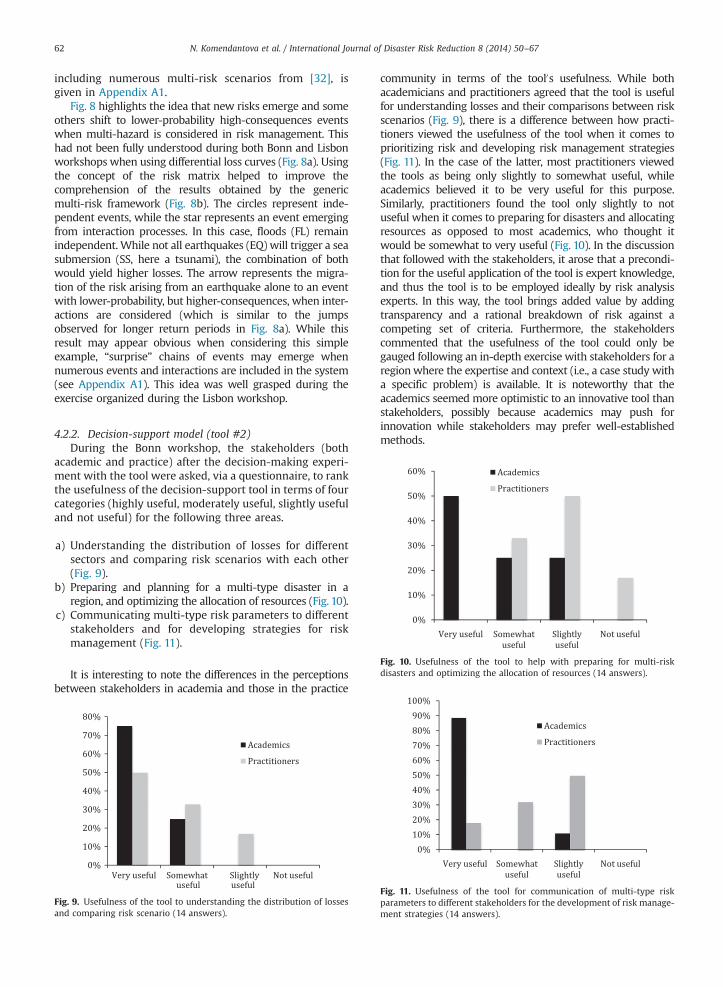
academic and practice) after the decision-making experi-ment with the tool were asked, via a questionnaire, to rankthe usefulness of the decision-support tool in terms of fourcategories (highly useful, moderately useful, slightly usefuland not useful) for the following three areas.
a)
Figand
Understanding the distribution of losses for differentsectors and comparing risk scenarios with each other(Fig. 9).
b)
Preparing and planning for a multi-type disaster in aregion, and optimizing the allocation of resources (Fig. 10).c)
Fig. 10. Usefulness of the tool to help with preparing for multi-riskdisasters and optimizing the allocation of resources (14 answers).
Communicating multi-type risk parameters to differentstakeholders and for developing strategies for riskmanagement (Fig. 11).
It is interesting to note the differences in the perceptionsbetween stakeholders in academia and those in the practice
. 9. Usefulness of the tool to understanding the distribution of lossescomparing risk scenario (14 answers).
community in terms of the tool0s usefulness. While bothacademicians and practitioners agreed that the tool is usefulfor understanding losses and their comparisons between riskscenarios (Fig. 9), there is a difference between how practi-tioners viewed the usefulness of the tool when it comes toprioritizing risk and developing risk management strategies(Fig. 11). In the case of the latter, most practitioners viewedthe tools as being only slightly to somewhat useful, whileacademics believed it to be very useful for this purpose.Similarly, practitioners found the tool only slightly to notuseful when it comes to preparing for disasters and allocatingresources as opposed to most academics, who thought itwould be somewhat to very useful (Fig. 10). In the discussionthat followed with the stakeholders, it arose that a precondi-tion for the useful application of the tool is expert knowledge,and thus the tool is to be employed ideally by risk analysisexperts. In this way, the tool brings added value by addingtransparency and a rational breakdown of risk against acompeting set of criteria. Furthermore, the stakeholderscommented that the usefulness of the tool could only begauged following an in-depth exercise with stakeholders for aregionwhere the expertise and context (i.e., a case study witha specific problem) is available. It is noteworthy that theacademics seemed more optimistic to an innovative tool thanstakeholders, possibly because academics may push forinnovation while stakeholders may prefer well-establishedmethods.
Fig. 11. Usefulness of the tool for communication of multi-type riskparameters to different stakeholders for the development of risk manage-ment strategies (14 answers).
N. Komendantova et al. / International Journal of Disaster Risk Reduction 8 (2014) 50–67 63
5. Discussion
The results from the workshops and questionnaireswith stakeholders on the usability and user-friendlinessof the presented multi-risk decision-support modelsshowed that stakeholders still have questions about theavailability of data for input parameters, but that they didnot question the general usefulness of the results.
For example, the decision-support model developed bythe ARMONIA project was tested in only two case studies andnot by a number of stakeholders from different countries. Itshowed, firstly, that doubts in the methodology arose, as therewas the tendency to exaggerate one hazard over others.Second, there were concerns about methodology0s output,such as the risk factor, which could be used only by decision-makers who are familiar with this method. The recommenda-tions were to develop alternative multiple-risk mappingmethods, which were not as data specific as the methodsdeveloped by the ARMONIA project. The recommendationsalso highlight strongly the need to appreciate participativegovernance and the need to conduct further research intowhat the end users of such risk maps actually require.
With the recently proposed MATRIX decision-supportmodel and generic multi-risk tool, we still could not addressthe first recommendation. The feedback from stakeholdersshowed us that there is a need for significant simplificationin terms of the required input data. However, we addressedthe second recommendation by collecting and addressingfeedback of civil protection stakeholders from several Eur-opean countries in terms of the usability and the areas ofapplication of the multi-risk assessment tools.
During several rounds of stakeholders0 interactions, wereceived the following recommendations. First, as alreadymentioned, there is an urgent need for more clarity withregards to the terms and definitions connected with multi-risk and multi-hazard. This will require the terminologycurrently being employed, for example within the MATRIXproject, to be disseminated and agreed upon with all relevantstakeholders (note, one of the MATRIX deliverables, D3.2“Dictionary of terminology”, is publically available via theMATRIX website5). Second, for input parameters, there is aneed to harmonize existing methodologies on data collectionand databases across the European countries. In this case,there are already on-going programs dealing with this, suchas the INSPIRE6 initiative of the European Union. Third, wereceived several recommendations regarding the area ofapplication for multi-risk assessment tools such as thedecision-making model and the generic multi-risk frame-work. This includes the application of the multi-risk approachto enable the comparability of risks. This recommendationwas included in the ongoing development of the genericmulti-risk framework by comparing various risks with the useof risk as a common metric. This could be a complementaryapproach to single-risk assessments, where the single andmulti-risk approaches relate to two different risk systems.
The feedback from stakeholders showed that, first, the risksystems need to be defined, and only afterwards could the risk
5 http://matrix.gpi.kit.edu/index.php6 http://inspire.jrc.ec.europa.eu/
analysis and assessment be used. There are expectations forthe multi-risk systems to be able to address dependenciesbetween hazards. For politicians and decision-makers, itwould be interesting to compare two sets of scenarios, onewith the interdependencies between different kinds ofhazards included, and the other without considering suchinterdependencies. This is an advantage of the generic multi-risk framework as it is able to provide such comparisons byincluding or excluding interdependencies between differentrisks (e.g., Fig. 2). The developed models could also be used asa test to compare these results with previous results and datadeveloped by insurance companies. Although insurance com-panies might be interested in such applications, their resultswould probably remain confidential. Also, the developedmodels could be used in training purposes in two possibleways. The first could be in a more narrow sense to convincestakeholders involved in the decision-making process of theusefulness of the multi-risk approach. The second could dealwith the broader view of disseminating these results to thegeneral public, hence dealing with public acceptance issues.Stakeholders also recommended to use the tools duringspecial training workshops organized for decision-makers onmulti-risk mitigation to see possible consequences of a multi-hazard situation for their region. The general recommendationwas that the tools (including the concept of virtual city) couldbe used for educational purposes.
In conclusion, while the stakeholders involved in thisstudy saw the value of the multi-risk approach, a greatdeal of work is still required by researchers in terms of themethodological development, and in shaping these meth-ods to meet the needs of end-users. From the other side,further efforts are required to actually understand what isrequired by end-users, while continuing to further dis-seminate the message of the value of multi-hazard andrisk approaches.
Acknowledgments
The work described in this paper was supported by theEuropean Community0s Seventh Framework Programme(FP7/2007–2013) through the grant agreement no. 265138of the project MATRIX “New Multi-Hazard and MulTi-RIsKAssessment MethodS for Europe”. The paper reflects theauthors0 views and not those of the European Community.Neither the European Community nor any member of theMATRIX Consortium is liable for any use of the informationin this paper. We are grateful to Andreas Pichler, KaticaBiljakovic, François Gérard, Susanne Lenz, Fabio Sabetta,Nils Ivar Larsen, Lars Nyber, Stefanie Dannenmann- DiPalma, Karl – Otto Zentel, Farrokh Nadim and Hans –
Liudger Dienel for participating in the Bonn MATRIXstakeholder0s workshop and for providing their knowledgeand expertise to the discussions and questionnaires
Appendix
A.1. Generic multi-hazard and multi-risk framework
The multi-risk framework proposed by [44] consists ofa core simulation algorithm based on the Monte Carlo
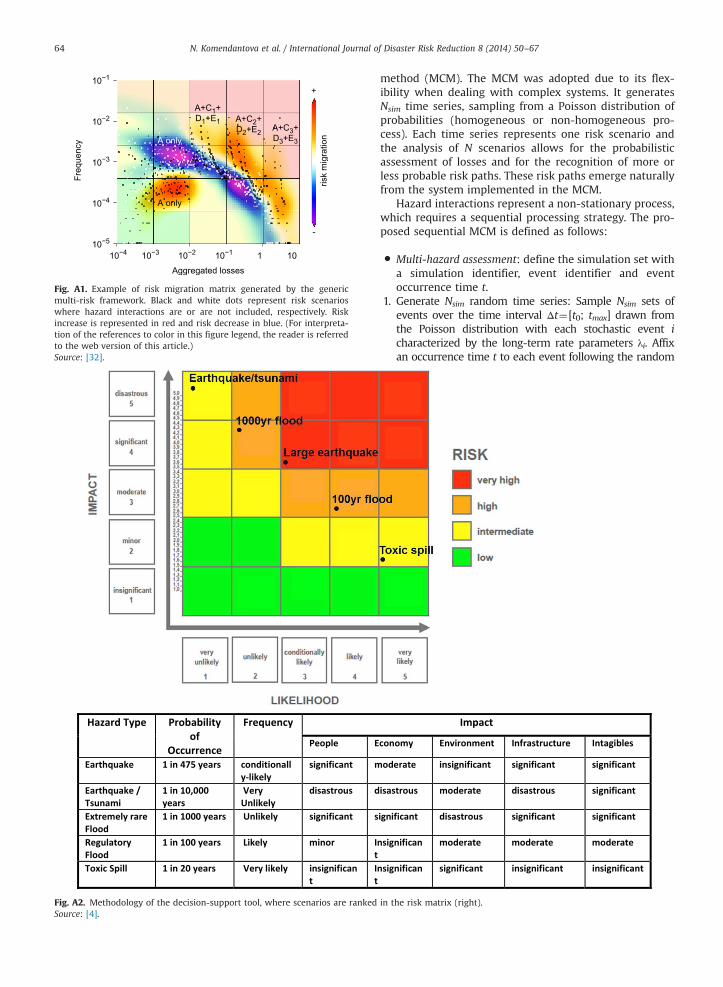
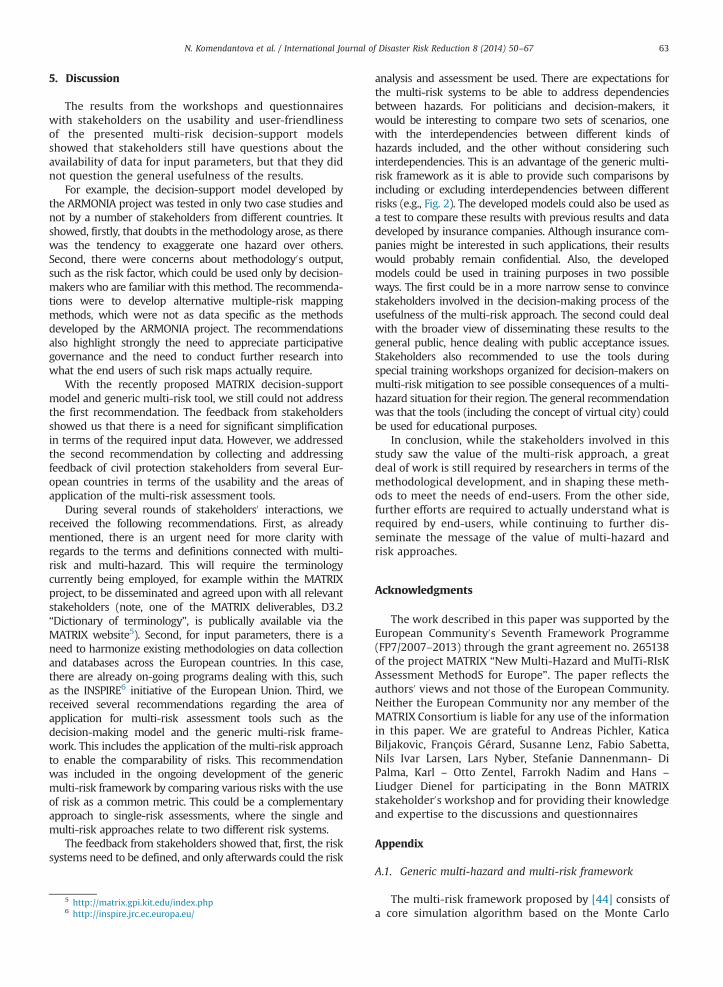
Fig. A2. Methodology of the decision-support tool, where scenarios are rankedSource: [4].
Fig. A1. Example of risk migration matrix generated by the genericmulti-risk framework. Black and white dots represent risk scenarioswhere hazard interactions are or are not included, respectively. Riskincrease is represented in red and risk decrease in blue. (For interpreta-tion of the references to color in this figure legend, the reader is referredto the web version of this article.)Source: [32].
N. Komendantova et al. / International Journal of Disaster Risk Reduction 8 (2014) 50–6764
method (MCM). The MCM was adopted due to its flex-ibility when dealing with complex systems. It generatesNsim time series, sampling from a Poisson distribution ofprobabilities (homogeneous or non-homogeneous pro-cess). Each time series represents one risk scenario andthe analysis of N scenarios allows for the probabilisticassessment of losses and for the recognition of more orless probable risk paths. These risk paths emerge naturallyfrom the system implemented in the MCM.
Hazard interactions represent a non-stationary process,which requires a sequential processing strategy. The pro-posed sequential MCM is defined as follows:
�
in t
Multi-hazard assessment: define the simulation set witha simulation identifier, event identifier and eventoccurrence time t.
1.
Generate Nsim random time series: Sample Nsim sets ofevents over the time interval Δt¼[t0; tmax] drawn fromthe Poisson distribution with each stochastic event icharacterized by the long-term rate parameters λi. Affixan occurrence time t to each event following the randomhe risk matrix (right).
Fig. A3. (a) Total risk/impact score and ranking shown for each of the scenarios. (b) Graph showing the sensitivity of the total risk score to changes in theweights of the “People” losses criteria.
N. Komendantova et al. / International Journal of Disaster Risk Reduction 8 (2014) 50–67 65
uniform distribution. Record the time series in the simula-tion set S0, which represents the null hypothesis H0 ofhaving no interactions in the system. Fix j¼1.
2.
For each of the Nsim simulations, record the character-istics of the jth event, which occurs at tj, in simulationset S1. Resample events k occurring in the interval (tj;tmax] if the conditional probability Pr(k|j) exists (conceptof hazard correlation matrix). Affix tk¼tjþε with ε⪡Δt.Fix j¼ jþ1.3.
Repeat step 2 while tjrtmax. 4. Fix j¼1. � Multi-risk assessment: update the simulation sets S0and S1 with event loss Λ.
5. For each of the Nsim simulations, calculate the meandamage ratio δj due to the jth event, which is condi-tional on the occurrence of previous events.
6.
For each of the Nsim simulations, calculate the loss Λjdue to the jth event, which is conditional on theoccurrence of previous events. Record Λj.
7.
Repeat steps 5 and 6 while tjrtmax.Mignan et al. [44] used Nsim¼105, Δt¼[t0¼0; tmax¼1]and ε¼0.01. They defined a hazard correlation matrix,considering possible interactions between ad-hoc perils A,B, C, D and E. Noteworthy, these ad-hoc perils andassociated interactions are more abstract than the conceptof the virtual city. They are also more difficult to compre-hend, but provide an elegant mathematical framework.Fig. A1 shows an example of a risk migration matrixgenerated by the MCM. In the presented case, the
occurrence of peril A leads to the occurrence of peril Cwith a probability Pr(C|A). C can then trigger D and D canthen trigger E. A and C may represent earthquake/tsunamiinteractions, for instance, while D and E may representdomino effects in critical infrastructures (i.e., NaTechevents). Fig. A1 shows that the risk migrates to lowerprobability-higher consequences events when interactionsare considered (i.e., moving from yellow to orange/red).More details can be found in [44].
A.2. Decision-support tool
Impact values for each hazard scenario can be inputtedinto the decision-support tool as both numerical values(either single value or probabilistic distributions) or nom-inal categories where the numbers are simply labels thatcan be expressed in categories such as: “catastrophic”,“large”, “moderate”, “small” and “irrelevant”. For impactssuch as casualties and capital stock losses, where therequired vulnerability functions are typically available,impacts are computed using loss estimation models (e.g.,CAPRA, HAZUS, etc.).
In other cases, for example intangible impacts such aspolitical implications, where impacts cannot be computedin a numerical form, an expert-driven participatory mod-eling approach is used to assign nominal rankings forthese types of impacts along each of the considered hazardscenarios. The spatial extent and temporal dimensions (i.e.,immediate vs. short, mid- and long-term) of impact haveto be clearly defined during the expert solicitation process.
N. Komendantova et al. / International Journal of Disaster Risk Reduction 8 (2014) 50–6766
As the participatory modeling process is likely to producea spread in the results, the decision-support tool providesthe ability to assign a probability distribution around theimpact classification (for example, loss in an intangiblecategory such as “political implications” may be judged byexperts to be 0.25 catastrophic, 0.50 large, 0.20 moderate,0.05 small and 0 irrelevant) (Fig. A2).
According to this approach, the sectorial losses arecombined as a weighted sum into one single aggregatedloss score for each scenario (Fig. A3). Together, these twosteps (i.e., severity and loss scores) produce a compositeimpact score or each scenario.
For example, in Fig. A3a, it can be seen that an offshoreearthquake triggering a tsunami is deemed to have a muchgreater risk score than a toxic spill. As the total risk indexfor each scenario is determined as the aggregate weightedsum of each of the loss measures in each of the differentsectors, the risk index ranking will also depend, of course,on the weights given to each sector.
Next, the decision-support software is used in a groupsetting to discuss the weighting outcomes and interactivelyexamine the variability of the ranking results. For example, asensitivity graph can be used to see the effect on the rankingsas the weights are changed. In Fig. 4b it can be seen that asmore weight is given to the casualties, short- and long-termmass care represented by the “People” criteria, the risk scorefor the toxic spill decreases considerably. This is due to thefact that the toxic spill scenario produces none to very fewfatalities and has an insignificant impact on mass care. As aresult, when all the weight is given to only one measure, inthis case human losses, the risk score for this scenario isminimal. On the other hand, the risk score of all otherscenarios goes up, but importantly the relative rankingsbetween them stays the same.
References
[1] Antunes P, Santos R, Videira N. Participatory decision-making forsustainable development – the use of mediated modeling techni-ques. Land Use Policy 2006;23(2006):44–52.
[2] Arnold M, Chen U, Deichmann RS, Dilley M, Lerner-Lam A, Pullen R,et al. Natural disaster hotspots: case studies. The World Bank; 2006.
[3] Assmuth T, Hild_en M, Benighaus C. Integrated risk assessment andrisk governance as socio-political phenomena: a synthetic view ofthe challenges. Sci Total Environ 2010;408:3943–53.
[4] BBK. Methode für die Risikoanalyse im Bevölkerungsschutz. Tech.1024 rep. Bundesamt fur Bevölkerungsschutz und Katastrophen-hilfe. URL ⟨http://www.bbk.bund.de/cln_027/nn_402322/SharedDocs/Publikationen/Broschueren__Flyer/Methode__Risikoanalyse-BS,templateId=raw,property=publicationFile.pdf/Methode_Risikoanalyse-BS.pdf⟩.
[5] Bilham R. The seismic future of cities. Bull Earthquake Eng 2009;7:839–87, http://dx.doi.org/10.1007/s10518-009-9147-0.
[6] Carpignano A, Golia E, Di Mauro C, Bouchon S, Nordvik J-P. Amethodological approach for the definition of multi-risk maps atregional level: first application. J Risk Res 2009;12:513–34.
[7] COM, (2009) 82 final. Communication from the Commission to theEuropean Parliament, the Council, the European Economic andSocial Committee and the Committee of the regions, Brussels.
[8] COM(2010b) 673 final. Communication from the Commission to theEuropean Parliament and the Council. The EU Internal SecurityStrategy in Action: five steps towards a more secure Europe,Brussels.
[9] COM (2010a) 1626 final. A Community approach on the preventionof natural and man-made disasters Commission Staff WorkingPaper. 2010. Risk Assessment and Mapping Guideline for DisasterManagement, Brussels.
[10] Costanza R, Ruth M. Using dynamic modeling to scope environmentproblems and build consensus. Environ. Manage. 1998;22(2):183–95.
[11] Costanza R, Greer J. The Chesapeake Bay and its watershed: A modelfor sustainable ecosystem management? In: Gunderson LH, HollingCS, Light S, editors. Barriers and bridges to the renewal of ecosys-tems and institutions. New York: Columbia University Press; 1995.p. 169–213 (593 p.).
[12] Cox T. Risk integration and decision-making, in: Risk assessmentand management in the context of the Seveso II Directive. In:Kirchsteiger C, Christou MD, Papadakis GA, editors. Industrial SafetySeries, vol. 6. Elsevier; 1998.
[13] Daniell JE, Khazai B, Wenzel F. The CATDAT DamagingEarthquakes Database. Nat Hazards Earth Syst Sci 2011;11:2235–51, http://dx.doi.org/10.5194/nhess-11-2235-2011.
[14] Di Mauro D, Lepidi S, Meloni A, Palangio P. Update on monitoring ofmagnetic and electromagnetic tectonic signals in Central Italy. AnnGeophys 2006;50(1) (in press).
[15] Forester J. The deliberative practitioner. Encouraging participatoryplanning process. Cambridge, MA.MIT Press; 1999.
[16] Funtowicz S, Ravetz J. The worth of a songbird: ecological econom-ics, as a post-normal science. Ecol Econ 1994;10:197–207.
[17] FEMA (2009) Hazus MH MR4 Technical manual. Federal EmergencyManagement Agency, Washington, DC. Available at online at: ⟨http://www.fema.gov/plan/prevent/hazus/hz_manuals.shtm⟩.
[18] Hoyois D, Guha-Sapir D. Three decades of floods in Europe: apreliminary analysis of EMDAT data. Working paper (draft). Brus-sels: CRED; 2003 Brussels: CRED; 2003.
[19] Granger K, Jones T, Laiba M, Scott G.. Community risk in Cairns: amulti-hazards risk assessment. Technical report, Australian Geolo-gical Survey Organisation (AGSO). URL ⟨http://www.ga.gov.au/hazards/reports/cairns⟩. Access; 1999.
[20] Grossi P, Kunreuther H, Windeler D. An introduction to catastrophemodels and insurance. In: Grossi P, Kunreuther H, editors. Cata-strophe modeling: a new approach to managing risk. Boston:Springer Science + Business Media, Inc; 2005. p. 23–42.
[21] Grünthal G, Thieken A, Schwarz J, Radtke K, Smolka A, Merz B.Comparative risk assessment for the city of Cologne – storms, foods,earthquakes. Nat Hazards 2006;38(1–2):22–44.
[22] Jasanoff S. The fifth branch: science advisers as policy makers.Cambridge, Massachusetts: Harvard University Press; 1990.
[23] IRGC. Risk governance deficits: analysis, illustration and recommen-dations. Policy brief. Geneva, Switzerland: International Risk Gov-ernance Council; 2010.
[24] ISO/IEC Guide 73:2009. Risk management – vocabulary. Interna-tional Organization for Standardization; 2009.
[25] Kahneman D, Tversky A. Prospect Theory: an analysis of decisionunder risk. Econometrica 1979;47(2):263–91.
[26] Kappes MS, Keiler M, von Elverfeldt K, Glade T. Challenges ofanalyzing multi-hazard risk: a review. Nat. Hazards 2012;64:1925–58, http://dx.doi.org/10.1007/s11069-012-0294-2.
[27] Korfmacher KS. Water quality modeling for environmentalmanagement: Lessons from the policy sciences. Policy Sci 1998;31:35–54.
[28] Krausmann E, et al. Industrial accidents triggered by earthquakes,floods and lightning: lessons learned from a database analysis. NatHazards 2011;59(1):285–300.
[29] Korfmacher K. Water quality modeling for environmental manage-ment: lessons from the policy sciences. Policy Sci 1998;31:35–54.
[30] Marzocchi W, Newhall Ch, Woo G. The scientific management ofvolcanic crises. J Volcanol Geotherm Res 2012;247–248(2012):181–9.
[31] Mignan A. D7.2 MATRIX-CITY User Manual, New methodologiesfor multi-hazard and multi-risk assessment methods for Europe.Deliverable 2013;7(2):78, http://matrix.gpi.kit.edu/downloads/MATRIX-D7.2.pdf.
[32] Mignan A, Wiemer S, Giardini D. The quantification of low prob-ability-high consequences events: Part I. A generic multi-riskapproach. Nat Hazards 2014.
[33] Morecroft JDW. Executive knowledge, models, and learning. In:Morecroft JDW, Sterman JD, editors. Modeling for learning organiza-tions. Portland, Oregon: Productivity Press; 1994. p. 3–28.
[34] Munich Re. Topics 2000: natural catastrophes – the current position.Technical report URL ⟨http://www.imia.com/downloads/external_papers/EP17_2003.pdf⟩; 2000.
[35] Nardo M, Saisana M, Saltelli A, Tarantola S, Hoffmann A, GiovanniniE. Handbook on constructing composite indicators: methodologyand user guide, OECD Statistics working paper series; 2005.
N. Komendantova et al. / International Journal of Disaster Risk Reduction 8 (2014) 50–67 67
[36] Phillips LD. Decision analysis for group discussion support. In: EdenC, Radford J, editors. Tackling strategic problems: The role of groupdiscussion support. London: Sage Publishers; 1990.
[37] Reese S, Bell R, King A. RiskScape: a new tool for comparing riskfrom natural hazards. Water Atmos 2007;15:24–5.
[38] Senge PM, Sterman JD. Systems thinking and organizational learn-ing: acting locally and thinking globally in the organization of thefuture. In: Morecroft JDW, Sterman JD, editors. Portland, OR:(Hrsg.): Modeling for Learning Organizations; 1994. p. 195–216.
[39] Selva J. Long-term multi-risk assessment: statistical treatment ofinteraction among risks. Nat Hazards 2013;67(2):701–22,http://dx.doi.org/10.1007/s11069-013-0599-9.
[40] Schmidt J, Matcham I, Reese S, King A, Bell R, Henderson R, et al.Quantitative multi-risk analysis for natural hazards: a framework formulti-risk modelling. Nat. Hazards 2011:58, http://dx.doi.org/10.1007/s11069-011-9721-z.
[41] T6. Assessing and mapping multiple risks for spatial planning.Rome: Armonia Project deliverable. EU FP6; 2007 (T6).
[42] Tesh S. Hidden arguments: political ideology and disease preventionpolicy. New Brunswick, NJ: Rutgers University Press; 1990.
[43] UN-ISDR. Global assessment report on disaster risk reduction.Technical report, United Nations - International Strategy for DisasterReduction. URL ⟨http://www.preventionweb.net/english/hyogo/gar/report/index.php?id=9413⟩; 2009a.
[44] UNISDR (United Nations International Strategy for Disaster Reduc-tion). Hyogo framework for action 2005–2015: building the resi-lience of nations and communities to disasters. ⟨www.unisdr.org/wcdr⟩; 2005.
[45] Varnes DJ. Landslide hazard zonation: a review of principles andpractice. Paris, France: United Nations Educational, Scientific andCultural Organisation; 1984.
[46] UN-ISDR. UNISDR terminology on disaster risk reduction. Technicalreport, United Nations - International Strategy for Disaster Reduc-tion. URL ⟨http://www.undp.org.ge/new/files/24_619_762164_UNISDR-terminology-2009-eng.pdf⟩; 2009b.
[47] Weston RF, Ruth M. A dynamic, hierarchical approach to under-standing and managing natural economic systems. Ecol. Econ.1997;21:1–17.
[48] White G, Kates R, Burton I. Knowing better and losing even more:the use of knowledge in hazards management. Environ Hazards2001;3:81–92.
[49] WMO. Comprehensive risk assessment for natural hazards. Techni-cal document 955, World Meteorological Organisation 1999 (URL)⟨http://www.planat.ch/ressources/planat_product_en_198.pdf⟩.
[50] The World Bank, 2010, World development report 2010: develop-ment and climate change. Washington, DC, USA; 2010.