Raising Awareness of Anaerobic Digestion in the UK- Views of Key Stakeholders
Upload
khangminh22Category
view
1download
0
SELECTED STAKEHOLDERS’ VIEWS ON THE USE OF TABLET COMPUTERS IN LEARNING AND TEACHING–A
SOUTH AFRICAN CASE STUDY AT A UNIVERSITY
SIMON CHRISTOPHER FERNANDEZ
A THESIS SUBMITTED IN FULFILMENT OF THE REQUIREMENTS
for
THE DEGREE
of
DOCTOR OF PHILOSOPHY (EDUCATION)
in the
FACULTY OF EDUCATION
at the
UNIVERSITY OF FORT HARE
SUPERVISOR: PROFESSOR K. J. MAMMEN
2019

i
PLAGIARISM DECLARATION
I, Simon Christopher Fernandez, student number 201716824, hereby declare that I
am fully aware of the University of Fort Hare’s policy on plagiarism and I have taken
every measure to comply with the policy.
Signature Date: 04-01-2019

ii
ETHICAL CLEARANCE CERTIFICATE
I, Simon Christopher Fernandez, student number 201716824, hereby declare that I
am fully aware of the University of Fort Hare’s policy on research ethics and I have
taken every precaution to comply with the regulations. I have obtained an ethical
clearance certificate from the University of Fort Hare’s Research Ethics Committee
and my reference number is MAM111SFER01
Signature Date: 04-01-2019

iii
ABSTRACT
The popularity of mobile technologies has greatly influenced the people of all ages,
especially adolescents. Tablet computers as part of mobile technologies, were
launched in colleges and universities in many countries to supplement and
complement learning and teaching. However, research reports based on the
effectiveness of the use of tablet computers in higher education institutions in South
Africa’s Eastern Cape Province are scarce. In order to address the deficiency, this
study examined the views of stakeholders such as students, lecturers and managers
on the use of tablet computers for learning and teaching in one of the Eastern Cape
universities. The research adopted the Post-Positivist paradigm and mixed method
approach. The theoretical frameworks were Constructivism and Technological
Pedagogical Content Knowledge. The sample consisted of (a) 155 students from a
population of 254 extended-stream National Diploma students in Information and
Communication Technology and National Diploma Electrical Engineering cohorts; (b)
14 lecturers from a relevant population of 25; and, (c) 16 managers from a
population of 20. Three separate questionnaires as well as interview protocols for
each of the stakeholder cohorts provided the core data. All members in the sample
were surveyed. The researcher opted to be an outsider and received assistance
from a few qualified trained academics to administer the questionnaire to students in
different cohorts in order to minimise data bias. Only 18 students, five lecturers and
nine managers were interviewed. Quantitative data were captured manually into
Statistical Package for Social Sciences (version 24) and they were analysed using
descriptive and inferential analysis: Analysis of Variance and Independent Samples
t-test. Qualitative data were transcribed and analysed using thematic analysis to
generate major themes and sub themes for the sub-research questions. Main
strengths of using tablets from the findings of the study were (a) tablets motivated
students in learning and lecturers in teaching (b) students understood the different
styles of learning (c) enhanced students’ engagement and collaboration in learning.
Main weakness of using tablets were students’ use of tablets for personal work and
social networking during class hours was causing distractions to lecturers and other
students. Generally, the evidence shows that strengths were greater than the
weaknesses. It should also be noted that all stakeholders were positive and not
statistically significantly different from each other in their views towards the use of

iv
tablets for learning and teaching in university classroom. However, students had
views different from lecturers on the advantages and disadvantages of using tablets.
The variance could be due to new students or new lecturers’ ignorance in the
effective use of tablets and this might change as their familiarity in the use of the
device improves. The research report makes a few recommendations which include
training to all students and lecturers on the effective use of tablet computers for
learning and teaching and installation of relevant applications before the
commencement of each academic year. Moreover, the Information and
communication technology technical staff must prevent students from visiting
unwanted and restricted sites by keeping a network based tracker and blocker
software application.
Keywords: use of tablet computers, mobile technology, stakeholders’ views, teaching
and learning

v
ACKNOWLEDGEMENTS
First of all, I would like to thank the almighty God immensely for all the favour,
grace and blessings showered upon me to complete the PhD degree successfully.
My deep gratitude goes to my supervisor Prof. K. J. Mammen, who
scrupulously went through my research and offered valuable and constructive
criticisms at various stages of my study. His valuable advices, suggestions and
encouragements contributed incalculably to the success of this project.
A great appreciation and thanks goes to all students, lecturers and managers
who have participated in my research. I am indebted to Ms. Nombasa Madlingozi,
the library staff of University of Fort Hare for her selfless service in assisting me to
retrieve numerous research articles from the internet. I also thank Dr. John
Sungwacha Nasile who assisted me with the statistical analyses, Dr. Syden Mishi
who helped me patiently in clarifying my statistical doubts and Mrs. Roshni Thomas
for the language editing.
I am grateful to the Dean and Head of the department where the study was
conducted who gave me all the assistance and support. Many thanks to all my
friends and colleagues for their encouragement. Special mention goes to my
colleague, friend, well-wisher and the altruistic cool man Mr. Vinod Kumar who have
shown me the “gateway” of research and introduced me to my supervisor. I thank
him for giving me all the advices whenever I was in need. I am also grateful to my
unseen friend Ms. Malu Shaika for her inspiration.
Last but not least, I am humbled to express my gratitude for the support that I
have received from my dad Mr. John Christopher Fernandez and my mom Mrs. Raji
C. Fernandez during my toughest times. My brother Mr. John Percival Fernandez
and his wife Mrs. Sanith John and their cute little baby Sandra John Fernandez were
always on my side as cheerleaders throughout this endeavour. Their prayers and
support was immeasurable all through my way for the successful completion of this
research. May god bless you all.

vi
LIST OF FIGURES
Fig 2.1: TPACK FRAMEWORK ................................................................................ 54
Fig 3.1: Flow diagram of ES and MS ........................................................................ 77
Fig 3.2: Flow diagram of ICT Branches .................................................................. 104
Fig 5.1: A Proposed Framework to enhance the use of tablets for learning and
teaching .................................................................................................................. 180

vii
LIST OF TABLES
TABLE 2.1: Comparison of Traditional teaching methods and moderately evolved
teaching methods ..................................................................................................... 20
TABLE 2.2: Criteria for Selecting Appropriate Educational apps .............................. 34
TABLE 2.3: Comparison of learning through a lecturer and learning through a
facilitator ................................................................................................................... 51
TABLE 2.4: Some of the studies done since 2013 using TPACK as framework
focussing on pre-service teachers in subject specific studies .................................. 59
TABLE 2.5: Some of the studies done since 2015 using TPACK as framework
regarding the use of technology by the lecturers around the world .......................... 62
TABLE 3.1: Advantages and disadvantages of case studies ................................... 75
TABLE 3.2: Cronbach Alpha value for each questionnaire ...................................... 93
TABLE 4.1: Students’ gender ................................................................................. 112
TABLE 4.2: Students’ age group ............................................................................ 113
TABLE 4.3: Students’ national diploma .................................................................. 113
TABLE 4.4: Students’ level of study ....................................................................... 113
TABLE 4.5: Demographic characteristics of each student participated in the interview
............................................................................................................................... 114
TABLE 4.6: Lecturers’ gender ................................................................................ 115
TABLE 4.7: Lecturers’ age group ........................................................................... 115
TABLE 4.8: Lecturers’ highest qualification ............................................................ 116
TABLE 4.9: Lecturers’ department ......................................................................... 116
TABLE 4.10: Lecturers’ lecturing experience ......................................................... 116
TABLE 4.11: Lecturers’ lecturing experience using tablet ...................................... 117
TABLE 4.12: Demographic characteristics of each lecturer participated in the
interview ................................................................................................................. 117
TABLE 4.13: Managers’ gender ............................................................................. 118
TABLE 4.14: Managers’ age group ........................................................................ 118
TABLE 4.15: Managers’ highest qualification ......................................................... 119
TABLE 4.16: Managers’ designation ...................................................................... 119
TABLE 4.17: Managers’ managing experience ...................................................... 120
TABLE 4.18: Demographic characteristics of each manager participated in the
interview ................................................................................................................. 120

viii
TABLE 4.19: Likert Responses of Students for Sub-Research Question 1.3.2.1 ... 123
TABLE 4.20: Likert Responses of Managers on students’ tablet use for Sub-
Research Question 1.3.2.1 ..................................................................................... 124
TABLE 4.21: Likert Responses of Students and Lecturers for Sub-Research
Question 1.3.2.1 ..................................................................................................... 125
TABLE 4.22: Group Statistics of Learning score .................................................... 127
TABLE 4.23: Independent Samples t-test for Learning .......................................... 128
TABLE 4.24: Themes and sub-themes regarding the students’ responses of tablet
use for learning ...................................................................................................... 129
TABLE 4.25: Themes and sub-themes regarding the lecturers’ responses of the use
of tablets for learning .............................................................................................. 131
TABLE 4.26: Themes and sub-themes regarding the managers’ responses of the
use of tablets for learning ....................................................................................... 133
TABLE 4.27: Triangulation: Engagement and Collaboration .................................. 136
TABLE 4.28: Triangulation: Curriculum change for tablets..................................... 136
TABLE 4.29: Triangulation: Enhancement of skills ................................................ 137
TABLE 4.30: Likert Responses of Lecturers for Sub-Research Question 1.3.2.2 .. 137
TABLE 4.31: Likert Responses of Lecturers and Managers for Sub-Research
Question 1.3.2.2 ..................................................................................................... 139
TABLE 4.32: Group Statistics of Teaching score ................................................... 140
TABLE 4.33: Independent Samples Test for Teaching .......................................... 141
TABLE 4.34: Themes and sub-themes regarding the lecturers’ responses to the use
of tablets for teaching ............................................................................................. 142
TABLE 4.35: Themes and sub-themes regarding the managers’ responses to the
use of tablets for teaching ...................................................................................... 144
TABLE 4.36: Triangulation: Tablet Training ........................................................... 146
TABLE 4.37: Likert Responses of Students and Lecturers for Sub-Research
Question 1.3.2.3 ..................................................................................................... 147
TABLE 4.38: Likert Responses of Students for Sub-Research Question 1.3.2.3 ... 149
TABLE 4.39: Likert Responses of Students, Lecturers and Managers for Sub-
Research Question 1.3.2.3 ..................................................................................... 150
TABLE 4.40: Group Statistics of advantages and disadvantages score (Students and
Lecturers) ............................................................................................................... 152

ix
TABLE 4.41: Independent Samples Test of tablet's advantages and disadvantages
for learning and teaching (Students and Lecturers) ............................................... 152
TABLE 4.42: Group Statistics of advantages and disadvantages score (Students and
Managers) .............................................................................................................. 153
TABLE 4.43: Independent Samples Test of tablet's advantages and disadvantages
for learning and teaching (Students and Managers) .............................................. 154
TABLE 4.44: Descriptive statistics: Comparison of tablet and PC score ................ 155
TABLE 4.45: Test of Homogeneity of Variances .................................................... 156
TABLE 4.46: ANOVA ............................................................................................. 156
TABLE 4.47: Welch test ......................................................................................... 156
TABLE 4.48: Post-Hoc test .................................................................................... 157
TABLE 4.50: Theme and sub-themes concerning the lecturers’ responses on the
advantages and disadvantages of using tablets in classroom ................................ 160
TABLE 4.51: Theme and sub-themes concerning the managers’ responses on the
advantages and disadvantages of using tablets in classroom ................................ 162
TABLE 4.52: Triangulation: Students’ non learning activities in class .................... 164
TABLE 4.53: Triangulation: Benefits as a learning tool .......................................... 165
TABLE 4.54: Triangulation: Drawbacks as a learning tool ..................................... 165
TABLE 4.55: Triangulation: Benefits as a teaching tool ......................................... 166
TABLE 4.56: Triangulation: Drawbacks as a teaching tool ..................................... 166

x
LIST OF ACRONYMS
PC: Personal Computer
ES: Extended Stream
MS: Main Stream
ICT: Information and Communication Technology
EE: Electrical Engineering
HOD: Head of the Department
Ex PCO: Extended Programme Coordinator
BA: Business Application
CN: Communication Networks
SD: Software Development
HC: Heavy Current
CLTD: Centre for Learning and Teaching Department
TPACK: Technological pedagogical content knowledge
TK: Technological knowledge
PK: Pedagogical knowledge
CK: Content knowledge
TCK: Technology Content knowledge
PCK: Pedagogical content knowledge
TPK: Technological Pedagogical Knowledge

xi
TABLE OF CONTENTS
PLAGIARISM DECLARATION ................................................................................... i
ETHICAL CLEARANCE CERTIFICATE .................................................................... ii
ABSTRACT .............................................................................................................. iii
ACKNOWLEDGEMENTS .......................................................................................... v
LIST OF FIGURES.................................................................................................... vi
LIST OF TABLES .................................................................................................... vii
LIST OF ACRONYMS ................................................................................................ x
CHAPTER ONE: INTRODUCTION AND BACKGROUND TO THE STUDY ............ 1
Description Pages
1.1 Introduction and background to the study ........................................................ 1
1.2 Statement of the problem ................................................................................. 7
1.3 Research questions ......................................................................................... 8
1.3.1 Main research question ........................................................................... 8
1.3.2 Sub-research questions .......................................................................... 9
1.4 Purpose of the study ........................................................................................ 9
1.5 Objectives of the study ..................................................................................... 9
1.6 Theoretical Framework .................................................................................... 9
1.7 Significance of the study ................................................................................ 10
1.8 Research Methodology .................................................................................. 11
1.8.1 Research Paradigm .............................................................................. 11
1.8.2 Research Approach .............................................................................. 11
1.8.3 Research Design ................................................................................... 11
1.8.4 Study site .............................................................................................. 11
1.8.5 Population, Sample selection and Sample size ..................................... 11
1.8.6 Instruments ........................................................................................... 12
1.8.7 Data analyses ....................................................................................... 12
1.9 Definitions of operational terms ...................................................................... 12
1.10 Chapter Demarcation ................................................................................... 16
1.11 Summary ...................................................................................................... 17
CHAPTER TWO: LITERATURE REVIEW AND THEORITICAL FRAMEWORK .... 18

xii
Description Pages
2.1 Education system ........................................................................................... 18
2.2 Traditional methods of learning and teaching ................................................ 18
2.3 Evolution of technologies ............................................................................... 20
2.4 Modern methods of learning and teaching ..................................................... 21
2.5 Mobile technologies ....................................................................................... 23
2.6 Mobile learning ............................................................................................... 24
2.7 Technology Integration ................................................................................... 25
2.8 Information and Communication Technology (ICT) in education ................... 27
2.9 Introduction of iPad tablet technology ............................................................ 28
2.10 Introducing tablets into Higher education ..................................................... 29
2.11 Theories of Professional Development ........................................................ 31
2.12 Professional training for Lecturers ................................................................ 32
2.13 Mobile Application apps used in tablets for learning and teaching ............... 33
2.14 Benefits of tablets and other mobile technologies ........................................ 36
2.15 Drawbacks of using tablets in learning and teaching environment ............... 38
2.15.1 Off-task use of technology in classrooms ............................................ 38
2.15.2 Challenges of adopting technology for technology’s sake ................... 39
2.15.3 Upgrade of internet infrastructure ........................................................ 39
2.15.4 Drawbacks of using tablets when compared with PC and Laptops ..... 40
2.16 Views of students, lecturers and managers on the effectiveness of tablet use
for learning in university classrooms .................................................................... 40
2.17 Views of lecturers and managers on the effectiveness of tablet use for
teaching in university classrooms ........................................................................ 44
2.18 Views of students, lecturers and managers on the advantages and
disadvantages of using tablets for learning and teaching .................................... 46
2.19 Theoretical Framework ................................................................................ 48
2.19.1 Constructivism ..................................................................................... 49
2.19.1.1 History of Constructivism ....................................................... 49
2.19.1.2 Significance of Constructivism ............................................... 50
2.19.1.3 Constructivism in IT courses .................................................. 50

xiii
2.19.1.4 Implications of Constructivism to education ........................... 50
2.19.1.5 ICT Utilization in a Constructivist Learning Approach ............ 51
2.19.2 Technological Pedagogical Content Knowledge (TPACK) framework 52
2.19.2.1 Technological knowledge (TK) ............................................... 55
2.19.2.2 Pedagogical knowledge (PK) ................................................. 56
2.19.2.3 Content knowledge (CK) ........................................................ 56
2.19.2.4 Technology Content knowledge (TCK) .................................. 57
2.19.2.5 Pedagogical content knowledge (PCK) .................................. 57
2.19.2.6 Technological Pedagogical Knowledge (TPK) ....................... 57
2.19.2.7 Significance of TPACK study ................................................. 58
2.19.2.8 TPACK studies in terms of respondents and subject specific
studies ...................................................................................... 58
2.19.2.9 TPACK in Universities ............................................................ 62
2.19.2.10 TPACK in ICT....................................................................... 64
2.19.2.11 TPACK in South Africa ......................................................... 65
2.20 Summary ...................................................................................................... 65
CHAPTER THREE: RESEARCH METHODOLOGY ............................................... 68
Description Pages
3.1 Introduction .................................................................................................... 68
3.2 Research Paradigm ....................................................................................... 68
3.3 Research Approach ....................................................................................... 69
3.3.1 Quantitative Research ......................................................................... 70
3.3.2 Qualitative Research ........................................................................... 71
3.3.3 Mixed Method Research ..................................................................... 72
3.4 Research Design............................................................................................ 74
3.5 Study site ....................................................................................................... 76
3.6 Description of the Population and Sample ..................................................... 78
3.6.1 The Population ...................................................................................... 78
3.6.1.1 Students’ population ................................................................. 79

xiv
3.6.1.2 Lecturers’ population ................................................................ 80
3.6.1.3 Managers’ population ............................................................... 80
3.6.2 Sample .................................................................................................. 80
3.6.2.1 Students’ sample...................................................................... 80
3.6.2.2 Lecturers’ sample ..................................................................... 81
3.6.2.3 Managers’ sample .................................................................... 81
3.7 Data Collection Instruments ........................................................................... 81
3.7.1 Questionnaire ........................................................................................ 81
3.7.1.1 Advantages of using questionnaire in this study ...................... 82
3.7.1.2 Disadvantages of using questionnaire in this study.................. 83
3.7.1.3 Students’ questionnaire ............................................................ 84
3.7.1.4 Lecturers’ questionnaire ........................................................... 84
3.7.1.5 Managers’ questionnaire .......................................................... 84
3.7.2 Interview ................................................................................................ 85
3.7.2.1 Advantages of an Interview ...................................................... 86
3.7.2.2 Disadvantages of an Interview ................................................. 86
3.7.2.3 Advantages of the Face-to-face interview ................................ 87
3.7.2.4 Disadvantages of the Face-to-face interview ........................... 87
3.7.2.5 Advantages of Semi-structured interview ................................. 88
3.7.2.6 Disadvantages of Semi-structured interview ............................ 88
3.7.2.7 Students’ semi-structured interview ......................................... 89
3.7.2.8 Lecturers’ semi-structured interview ......................................... 89
3.7.2.9 Managers’ semi-structured interview ........................................ 90
3.8 Quality assurance of instruments ................................................................... 90
3.8.1 Validity................................................................................................... 90
3.8.1.1 Content Validity ........................................................................ 91
3.8.1.2 Face Validity ............................................................................ 91

xv
3.8.2 Reliability ............................................................................................... 91
3.8.3 Data Trustworthiness ............................................................................ 94
3.8.3.1 Credibility ................................................................................. 95
3.8.3.2 Dependability ........................................................................... 95
3.8.3.3 Transferability .......................................................................... 95
3.8.3.4 Confirmability ........................................................................... 95
3.9 Data Collection Procedures ........................................................................... 96
3.9.1 Initial Process ........................................................................................ 96
3.9.2 Pilot study .............................................................................................. 97
3.9.2.1 Students ................................................................................... 98
3.9.2.2 Lecturers .................................................................................. 98
3.9.2.3 Managers ................................................................................. 99
3.10 Ethical Compliance .................................................................................... 100
3.10.1 Ethical clearance from institutions ..................................................... 100
3.10.2 Voluntary participation ....................................................................... 101
3.10.3 Informed consent .............................................................................. 101
3.10.4 Prevention of physical or psychological harm ................................... 102
3.10.5 Anonymity and Confidentiality ........................................................... 102
3.11 Negotiation of access ................................................................................. 102
3.11.1 Managers .......................................................................................... 103
3.11.2 Lecturers ........................................................................................... 103
3.11.3 Students ............................................................................................ 103
3.11.4 Position of the researcher ................................................................. 105
3.12 Data Collection: Main study ....................................................................... 106
3.12.1 Managers .......................................................................................... 106
3.12.2 Lecturers ........................................................................................... 107
3.12.3 Students ............................................................................................ 108

xvi
3.13 Summary .................................................................................................... 109
CHAPTER FOUR: DATA ANALYSIS, INTERPRETATION AND DISCUSSION .. 111
Description Pages
4.1 Introduction .................................................................................................. 111
4.2 Demographic data ........................................................................................ 112
4.2.1 Students’ Demographic data ............................................................... 112
4.2.1.1 Survey .................................................................................... 112
4.2.1.2 Demographic characteristics of each student participated in the
interview ................................................................................. 114
4.2.2 Lecturers’ demographic data ............................................................... 115
4.2.2.1 Survey .................................................................................... 115
4.2.2.2 Demographic characteristics of each lecturer participated in the
interview ................................................................................. 117
4.2.3 Managers’ demographic data .............................................................. 118
4.2.3.1 Survey .................................................................................... 118
4.2.3.2 Demographic characteristics of each manager participated in the
interview ................................................................................. 120
4.3 Data Presentation and Analysis ................................................................... 121
4.3.1 Sample responses on the effectiveness of tablet use for learning in
university classrooms ........................................................................ 123
4.3.1.1 Descriptive analysis of students’ survey responses for learning123
4.3.1.2 Descriptive analysis of managers’ survey responses for learning124
4.3.1.3 Triangulation of descriptive analysis of students and lecturers
survey responses for learning through engagement and
collaboration ........................................................................... 125
4.3.1.4 Triangulation of inferential analysis of students’ and lecturers’
survey responses for learning ................................................ 127
4.3.1.5 Students’ interview responses: Enhancement of skills ........... 129

xvii
4.3.1.6 Students’ interview responses: Engagement and collaboration
with lecturer ............................................................................ 130
4.3.1.7 Students’ interview responses: Engagement and Collaboration
with classmates ...................................................................... 130
4.3.1.8 Lecturers’ interview responses: Curriculum change for tablets131
4.3.1.9 Lecturers’ interview responses: Students’ tablet activities ..... 132
4.3.1.10 Lecturers’ interview responses: Enhancement of skills ........ 132
4.3.1.11 Lecturers’ interview responses: Engagement and Collaboration
between students ................................................................... 133
4.3.1.12 Managers’ interview responses: Pass rate ........................... 134
4.3.1.13 Managers’ interview responses: Tablet Training .................. 134
4.3.1.14 Managers’ interview responses: Enhancement of skills ....... 134
4.3.1.15 Managers’ interview responses: Curriculum change for tablets135
4.3.1.16 Triangulation of interview responses of stakeholders for
learning .................................................................................. 135
4.3.2 Sample responses on the effectiveness of tablet use for teaching in
university classrooms ........................................................................ 137
4.3.2.1 Descriptive analysis of lecturers’ survey responses for teaching137
4.3.2.2 Triangulation of descriptive analysis of lecturers and managers’
survey responses for teaching ............................................... 139
4.3.2.3 Triangulation of inferential analysis of lecturers and managers
survey responses for teaching ............................................... 140
4.3.2.4 Lecturers’ interview responses: Tablet Training ..................... 142
4.3.2.5 Lecturers’ interview responses: Teaching apps ..................... 143
4.3.2.6 Lecturers’ interview responses: Before integrating tablets ..... 143
4.3.2.7 Managers’ interview responses: After integrating tablets ....... 144
4.3.2.8 Managers’ interview responses: Tablet Training .................... 145
4.3.2.9 Managers’ interview responses: Enhancement of skills ......... 145

xviii
4.3.2.10 Managers’ interview responses: Curriculum change for tablets145
4.3.2.11 Triangulation of interview responses of lecturers and managers
on teaching ............................................................................. 146
4.3.3 Sample responses on the advantages and disadvantages of using
tablets for learning and teaching ....................................................... 146
4.3.3.1 Triangulation of descriptive analysis of students and lecturers
survey responses on students’ activities using tablet ............. 147
4.3.3.2 Descriptive analysis of students’ survey responses on tablet use
when compared with personal computer (PC) ....................... 149
4.3.3.3 Triangulation of descriptive analysis of students, lecturers and
managers’ survey responses on tablet use when compared with
personal computer (PC) ......................................................... 150
4.3.3.4 Triangulation of inferential analysis of students and lecturers
survey responses on tablet's advantages and disadvantages for
learning and teaching ............................................................. 151
4.3.3.5 Triangulation of inferential analysis of students and managers
survey responses on tablet's advantages and disadvantages for
learning and teaching ............................................................. 153
4.3.3.6 Triangulation of inferential analysis of students, lecturers and
managers survey responses on the convenience of using tablets
when compared with personal computer (PC) ....................... 155
4.3.3.7 Students’ interview responses: Non learning activities in class158
4.3.3.8 Students’ interview responses: Non learning activities outside
class ....................................................................................... 158
4.3.3.9 Students’ interview responses: Benefits as a learning tool .... 159
4.3.3.10 Students’ interview responses: Drawbacks as a learning tool159
4.3.3.11 Lecturers’ interview responses: Benefits as a teaching tool . 160
4.3.3.12 Lecturers’ interview responses: Drawbacks as a teaching tool160

xix
4.3.3.13 Lecturers’ interview responses: Students’ non learning
activities in class .................................................................... 161
4.3.3.14 Lecturers’ interview responses: Benefits as a learning tool .. 161
4.3.3.15 Lecturers’ interview responses: Drawbacks as a learning tool162
4.3.3.16 Managers’ interview responses: Benefits as a learning tool . 162
4.3.3.17 Managers’ interview responses: Benefits as a teaching tool 163
4.3.3.18 Managers’ interview responses: Drawbacks as a learning tool163
4.3.3.19 Managers’ interview responses: Drawbacks as a teaching tool164
4.3.3.20 Triangulation of interview responses of stakeholders on the
advantages and disadvantages of tablet use ......................... 164
4.4 Discussion of findings .................................................................................. 166
4.4.1 Effectiveness of tablet use for learning in university classrooms ......... 166
4.4.1.1 Survey responses .................................................................. 166
4.4.1.2 Interview responses ............................................................... 169
4.4.2 Effectiveness of tablet use for teaching in university classrooms ........ 169
4.4.2.1 Survey responses .................................................................. 169
4.4.2.2 Interview responses ............................................................... 171
4.4.3 Advantages and disadvantages of using tablets for learning and teaching172
4.4.3.1 Survey responses .................................................................. 172
4.4.3.2 Interview responses ............................................................... 174
4.5 Summary ...................................................................................................... 175
CHAPTER FIVE: SUMMARY OF THE MAJOR FINDINGS, RECOMMENDATIONS
AND CONCLUSIONS ............................................................................................ 176
Description Pages
5.1 Introduction .................................................................................................. 176
5.2 Reaffirming the research questions.............................................................. 176
5.3 Summary of Major Findings ......................................................................... 176
5.3.1 Views of students, lecturers and managers on the effectiveness of tablet
use for learning in university classrooms........................................... 177

xx
5.3.2 Views of lecturers and managers on the effectiveness of tablet use for
teaching in university classrooms ...................................................... 178
5.3.3 Views of students, lecturers and managers on the advantages and
disadvantages of using tablets for learning and teaching .................. 178
5.3.4 Proposed Framework to enhance the use of tablets for learning and
teaching............................................................................................. 179
5.4 Conclusion ................................................................................................... 180
5.4.1 Effectiveness of tablet use for learning in university classrooms ......... 180
5.4.2 Effectiveness of tablet use for teaching in university classrooms ........ 181
5.4.3 Advantages and disadvantages of using tablets for learning and teaching181
5.4.4 Conclusion of overall study ................................................................. 182
5.5 Limitations of the study ................................................................................ 183
5.6 Recommendations from the study................................................................ 183
5.7 Suggestions for future research ................................................................... 184
5.8 Summary ...................................................................................................... 185
LIST OF REFERENCES ........................................................................................ 186
LIST OF APPENDICES ......................................................................................... 225
APPENDIX A1: Student questionnaire SECTION A .......................................... 225
APPENDIX A2: Student questionnaire SECTION B .......................................... 226
APPENDIX A3: Student questionnaire SECTION C .......................................... 227
APPENDIX A4: Student questionnaire SECTION D .......................................... 228
APPENDIX A5: Student questionnaire SECTION E .......................................... 229
APPENDIX B1: Lecturer questionnaire SECTION A .......................................... 230
APPENDIX B2: Lecturer questionnaire SECTION B .......................................... 231
APPENDIX B3: Lecturer questionnaire SECTION C ......................................... 232
APPENDIX B4: Lecturer questionnaire SECTION D ......................................... 233
APPENDIX B5: Lecturer questionnaire SECTION E .......................................... 234
APPENDIX C1: Manager Questionnaire SECTION A ........................................ 235
APPENDIX C2: Manager Questionnaire SECTION B ........................................ 236
APPENDIX D1: Interview protocols for Students ............................................... 237
APPENDIX D2: Interview protocols for Lecturers .............................................. 238

xxi
APPENDIX D3: Interview protocols for Managers ............................................. 239
APPENDIX E1: Application letter requesting for Ethical clearance certificate .... 240
APPENDIX E2: Ethical clearance certificate from University of Fort Hare ......... 241
APPENDIX E3: Application letter requesting for permission to conduct the study in
research site ...................................................................................................... 243
APPENDIX E4: Consent from University where study was executed ................ 244
APPENDIX E5: Invitation letter to Managers to participate in pilot study ........... 245
APPENDIX E6: Invitation letter to lecturers to participate in pilot study ............. 246
APPENDIX F1: Survey Consent form - Managers ............................................. 247
APPENDIX F2: Survey Consent form - Lecturers .............................................. 249
APPENDIX F3: Survey Consent form - Students ............................................... 251
APPENDIX F4: Interview Consent form - Students ............................................ 253
APPENDIX F5: Interview Consent form - Lecturers and Managers ................... 255
APPENDIX G1: Certificate of Language Editing ................................................ 257

1
CHAPTER ONE
INTRODUCTION AND BACKGROUND TO THE STUDY
1.1 Introduction and background to the study
This chapter gives an introduction to the study and provides a background.
An overview of the education system, mobile technologies, mobile learning devices,
tablet computers and their history are demarcated. Tablet technologies are used in
institutions to change the old method of chalk and talk approach and implement a
new way of blended learning. Technology integration, ICT in education, tablet
computer in higher education institutions, professional development, mobile
applications, university students’, lecturers’ and managers’ views on the tablet use in
classrooms, its benefits and drawbacks are all summarised. The statement of the
problem, research questions, purpose of the study, its objectives and the
significance of the study are all elucidated. A brief summary of the methodology and
an overview of the theoretical frameworks used in the research are illuminated.
Definitions of operational terms used in this study are also provided thereafter.
Tablet computers and mobile applications are commonly known as tablets and apps
respectively and only these are used in this report from now.
Education has a very important role in the development of our society from a
very early stage. The method of learning and teaching that was followed in the olden
days was passive as it was a teacher centred approach (Zohrabi, Torabi &
Baybourdiani, 2012). Nasseh (2009) remarks that traditional way of learning and
teaching is vanishing nowadays and student centred approach which is the new way
of learning and teaching is implemented using various digital technologies. Value
based education should be integrated into the learning programme to make every
person a good citizen (Bhardwaj, 2016). A year later, Blazar and Kraft (2017) state
that the influence of teachers have shaped the education policy over the past years.
Students in the 21st century have transformed drastically in terms of finding
new learning methods and exploring technologies (Prensky, 2001b, 2006). In order
to maximise and utilize the potential of students and modern educators in learning

2
and teaching, an effective way of integrating the latest technology in the classroom is
highly obligatory (Rajasingham, 2011; Geist, 2011). The methodology of teaching
using technologies has revolutionised education all over the globe, especially in
higher education sectors (Castillo-Manzano, et al., 2017).
Institutions in this era are improving radically by incorporating the newly
advanced technologies in the classrooms (Keating, 2013; Kyzym & Petukhova,
2017). According to the findings of National Center for Educational Statistics (2010),
almost all computers in the classrooms of Unites states have internet access.
Technologies are rapidly growing up daily and it reflects in all areas of works,
so in education as well (Alhassan, 2016; Zidney & Warner, 2016; Huda, et al., 2018).
Brown (2002) states that students are utilizing the technologies such as internet and
World Wide Web in a successful manner, thereby discovering a new method of
learning and obtaining knowledge. Higher education institutions provide internet
access to lecturers and students with an intention to make use of all kinds of learning
and teaching using different tools such as desktop computers, laptops, tablets,
projectors etc (Stahl, Koschmann & Suthers, 2006). These technologies are playing
a huge role in bringing education to an upper level (Rossing, et al., 2012).
Mobile technologies such as smart phones and tablets have begun to
revolutionize the way people make purchases, make decisions and design
curriculum. Such devices also impact the way people think and learn. More
importantly, people continue to rely on their mobile devices for most daily tasks and
as a main method of communication (Geist, 2011; Geer, 2012; Alexander, 2014; Ally
& Blazquez-Prieto, 2014; Brown, 2015). People in this era of technology have
advanced tremendously in the way they think, make decisions and communicate
with each other. They also plan curriculum and learn courses using mobile learning
devices such as tablet computer or iPad. They use these mobile devices for their
daily activities and to interconnect with one another (Geist, 2011; Geer, 2012; Ally &
Blazquez-Prieto, 2014; Alexander, 2014; Brown, 2015). Alexander (2014) has
predicted that instructional practices and obtaining degrees will all be done using
new educational apps installed in mobile learning devices by the year 2024.

3
Furthermore, Geer (2012) and Gentile (2012) assert that a full transformation will
only happen if students actively utilize mobile learning device in a positive way.
Mobile learning devices such as smart phones and tablets can highly enhance
students’ interest in their studies at both pre university (Cobcroft, Towers, Smith &
Bruns, 2006; Kim, et al., 2015; Popović, Markovic, & Popović, 2016) and university
level (Henríquez-Ritchie & Organista-Sandoval, 2012; Lin & Lin, 2016). These
devices also help them to perform mobile learning using internet by being in their
own convenient place and time (Menkhoff & Bengtsson, 2012). This enables the
students to develop a collaboration with their classmates and educators and make a
better learning atmosphere (Motiwalla, 2007). The students in this generation are
very familiar with digital technologies when compared with educators (Rideout,
2011). Richards (2014, p. 2) remarks that “the use of technology in teaching
becomes more important in present times, because teachers also have to be able to
keep up with the technological knowledge of their students” in order to be competent
with the knowledge of current day students.
In order to effectively function the objective of mobile learning, curriculum
must be integrated along with the use of mobile learning devices (Labbo & Place,
2010). It is very important for lecturers to have the knowledge on how to use and get
acquainted with these devices to enhance the level of learning, motivation and
knowledge of students (Duhaney & Zemel, 2000).
The evolution of ICT has helped the institutions to offer a better education to
students (Husseini & Safa, 2009). Although it was a serious challenge for the
institutions to link lecturers and students with computers (Donovan, Green & Hartley,
2010), institutions managed to encourage students by integrating computers in
classrooms (Conn, 2012). Smart phone is one of the technologies that enabled
students to explore the learning concepts and communicate with lecturers (Ooms,
Linsey, Webb & Panayiotidis, 2008).
The emergence of tablet computers such as Galaxy (developed by Samsung
Inc.) and iPad (developed by Apple Inc.) into the electronic market have made a

4
greater impact everywhere. These tablets are introduced in order to overcome the
challenges experienced with the previous mobile devices such as smartphones and
laptops (John, et al., 2012).
Although tablets are fascinating devices, it is absolutely necessary to integrate
tablets into learning and teaching for the purpose of switching from chalk and talk
approach to blended learning approach (Figueiredo & Afonso, 2005). Meurant (2010)
postulates that tablet is a game changing device that is probably going to modernise
the current trend of education.
Many institutions all over the globe have already spent a large amounts of
money for purchasing bulk quantities of tablet computers for the benefit of their
students (Hu, 2011; Tomassini, 2012; Vu, McIntyre & Cepero, 2014). Foresman
(2010) and Miller (2012) emphasise that many universities around the world are
integrating this gadget into the curriculum as a cost saving, interactive and
collaborative tool.
The effectiveness of technology in institutions can be seen only if it
incorporates with the standard of curriculum (Debele & Plevyak, 2012). A research
was conducted by Sugar (2005) to assess the need for technology in classroom.
Findings of his study showed that there is a positive impact on teachers. Another
study conducted by Roschelle, et al. (2010a) revealed that technology enhanced
students’ learning capability. However, Roschelle, et al. (2010a) claim that training
and professional development offered for the educators is equally responsible for the
positive results along with technology innovation. Debele and Plevyak (2012) concur
that educators have a huge role in the success of the technology integration in
classrooms.
According to Ganser’s (2000) point of view, professional development can be
defined as the development of an individual by attending workshops, reading
articles, newspapers, publications and watching documentaries that relate to
academics. Moon (2002) reports that there are many universities in the east and
central part of the African continent that provides workshops for the lecturers to

5
develop their professional career. Generally, educators have a negative perception
towards using the new technology in the classroom. However, it is very vital for the
educators to attend workshops to gain more knowledge on the latest technologies
and apps that are installed in these gadgets for the betterment of themselves as well
as for the students (Mosenson & Johnson, 2010).
Cohen (2012) claims that there are plenty of educational apps available in the
tablets for effective learning and teaching. Preloaded apps that are installed in
tablets are the main factors for mobile learning (Cochrane, 2012). Many students
concur that selecting apps by themselves in tablets have boosted their engagement
and collaboration between each other (Gordon, Jackson & Usher, 2014).
A study conducted by Percival and Claydon (2015) in a Canadian university to
determine the views and attitudes of tablet users for learning revealed that students
had mixed opinions. Although in general students are admiring the portability and
easy access feature, some of them were concerned with the distractions caused by
those who use tablets for non-learning purposes. Mango (2015) claims that students
consider it as a learning tool. Using tablets in classrooms not only boosts students’
interest in attending lectures (Rossing, et al., 2012) but also improves their
confidence (Shen, 2016).
Past researches about the students’ views and attitudes on the tablet use
have also been discussed regarding collaboration and engagement in the classroom.
Tablets helped students to develop a collaborative atmosphere where they could
share, discuss and engage with one another (Weider, 2011; Rossing, et al., 2012;
Mang & Wardley, 2012; Diemer, Fernandez & Streepey, 2012). Nguyen, Barton and
Nguyen (2015) take a different view that there is a lack of pedagogical approach on
how efficiently tablets can be used to improve learning particularly in the field of
engagement and collaboration between students. Despite students holding positive
views about engagement in the classroom, Percival and Claydon (2015) suggest that
students need more workshops on tablet use to reach a higher level.

6
While many studies have addressed the views and attitudes of students on
tablet use in the classroom, some studies have documented the views and attitudes
of lecturers on its use for learning and teaching. A study conducted by Yeung and
Chung (2011) showed that lecturers were impressed with the accessing facility of
library resources. On the other hand, the apps that were preferred were either not
available or too costly to purchase. Vu, McIntyre and Cepero (2014) reveal that the
use of tablets for instructional practice has drawn positive responses from the
lecturers to a certain extent. On the other side, some other studies showed that
lecturers had a negative perspective towards the use of tablet technology (Beckerle,
2013) due to the lack of proper training and professional development (Percival and
Claydon, 2015). Moreover, Flanagan’s (2016) research shows that lecturers were
not impressed with students’ use of tablet in classroom.
.
More studies have been conducted to evaluate the views and attitudes of
managers on students’ and lecturers’ use of tablets. A study conducted in
Midwestern town by Bennett (2014) postulates that proper guidance must be given
to both students and academics to utilize tablets properly for effective learning and
teaching. Similarly, in Long, Liang and Yu’s (2013) study, managers revealed that
students and lecturers need more knowledge in understanding the use of tablet.
However, findings of the research conducted by Flanagan (2016) and Dogan and
Almus (2014) show that managers have positive attitudes towards students’ and
educators’ use of tablet in the classroom.
Many authors have concurred about the wide range of benefits on using
tablets in the classroom such as reading articles, searching information during
discussion and saving lecture notes (Mang & Wardley, 2012). Alsufi (2014) and
Sheppard (2011) aver that students will benefit as they do not need to buy costly text
books which can be downloaded from the internet. Ludwig and Mayrberger (2012)
suggest that students who regularly use tablets are extremely interested in
collaborating with their classmates. It also helps the educators to prepare the
teaching and learning materials for students and to follow the curriculum.

7
Despite the potential benefits of tablets, many researchers have pointed out
various drawbacks. Kinash, Brand and Mathew (2012) emphasise the off-task
attitudes of students such as visiting social networking sites, chatting with friends
and taking pictures. This makes students to deviate their concentration from the
lecture contents. Garrett (2012) stressed about the possibility of tablets getting
damaged as students take them home. Niemeijer, Donnellan and Robledo (2012)
posit that many institutions often purchase tablets in large numbers without a proper
plan. This may lead to a situation where students and lecturers do not realize their
value for money and education. Fischman and Keller (2011) argue that tablets are
not as user-friendly as laptops. This might be a challenge to students to perform their
tasks.
1.2 Statement of the problem
In the light of the literature shown in the background, it is evident that many
educational institutions around the globe have already started using tablets in
classroom. There is also a dearth of empirical research on how to implement tablets
in the classroom (Pegrum, Howitt & Striepe, 2013) and how tablet use affects
students’ learning (Wakefield, Frawley, Tyler & Dyson, 2018). Academics are in the
dark as they attempt to integrate these devices in effective ways (Rafiki, 2015). This
clearly shows that even though tablets are considered as the latest tool for learning
and teaching, there are some serious gaps still pending that need to be addressed in
this research such as how well lecturers are using tablets, how well students are
using tablets in university, the views of managers about the use of tablets by the
lecturers and students for learning and teaching. The strengths and weaknesses of
using tablets in a classroom and whether tablets can increase motivation and
engagement in class participation among students may also be discussed. Many
South African institutions are either integrating or planning to integrate tablets, yet
none seems certain of the outcomes or the process to undertake to ensure that the
devices serve their intended purposes. To date there is little published research to
confirm that tablets are valuable to classroom instruction, especially in the South
African context (Shuler, 2012; Rafiki, 2015). Similar pieces of research have been
done in developed countries such as Canada (Karsenti & Fievez, 2013), Georgia
(Hill, et al., 2012), Australia (Clarkson, 2018) and the Unites States of America

8
(Chou, Block & Jesness, 2014; Mango, 2015; Shen, 2016). However, similar
research, unlike in developed countries, is not popular in a developing country like
South Africa and little research has so far been done in the Eastern Cape Province
of South Africa. Moreover, frameworks that are used for this study are
Constructivism and Technological pedagogical content knowledge (TPACK). Ben-Ari
(1998) asserts that even though constructivism studies in the area of Mathematics
and Science are common, study in the area of Information technology are still in its
infancy. Only 8% of the TPACK studies have been conducted on the use of ICT in
higher education (Wu, 2013). This makes the current study more distinctive as the
current research is conducted in a university particularly only on the use of tablet but
not on a broader terminology such as ICT. Leendertz, et al. (2013) stress that the
TPACK that was used in South Africa was only to examine TPACK level of
mathematics among in-service teachers in grade 8 and studies based on TPACK in
South Africa are still inadequate. Poore (2015) concurs with Leendertz, et al. (2013)
and state that empirical studies on the tablet teaching practice are highly limited.
Since 2016, merely a few researches using TPACK framework have been conducted
in South Africa. The observations made by Ben-Ari, (1998), Leendertz, et al. (2013)
and Poore (2015) further makes the current study an inevitable research. Therefore,
gathering and analysing the views of relevant stakeholders on the strengths and
weaknesses of the use of tablets in learning and teaching is a worthy problem for
investigation. Furthermore, the factors affecting the impacts need to be identified in
order to address and implement changes for the benefit of students and lecturers.
1.3 Research questions
This study was guided by one main and four sub-research questions which
are as follows:
1.3.1 Main research question
Based on stakeholders’ views, what are the strengths and weaknesses of
using tablets for learning and teaching?

9
1.3.2 Sub-research questions
1.3.2.1 How do students, lecturers and managers differ in their views on the
effectiveness of tablet use for learning in university classrooms?
1.3.2.2 How do lecturers and managers differ in their views on the effectiveness of
tablet use for teaching in university classrooms?
1.3.2.3 How do students, lecturers and managers differ in their views on the
advantages and disadvantages of using tablets for learning and teaching?
1.3.2.4 What feasible framework can be developed to enhance the use of tablets for
learning and teaching?
1.4 Purpose of the study
The purpose of the study was to gather stakeholders’ views to assess the
strengths and weaknesses of using tablets in learning and teaching at a university in
Eastern Cape Province of South Africa.
1.5 Objectives of the study
1.5.1 To gather data on university students’, lecturers’ and managers’ views on the
effectiveness of tablet use for learning in university classrooms.
1.5.2 To collect data on lecturers’ and managers’ views on the effectiveness of tablet
use for teaching in university classrooms.
1.5.3 To obtain data on university students’, lecturers’ and managers’ views on the
advantages and disadvantages of using tablets for learning and teaching.
1.5.4 To develop a feasible framework to enhance the use of tablets for learning and
teaching.
1.6 Theoretical Framework
For the theoretical grounding of the present study, the researcher drew on
Constructivism framework and TPACK framework to explore the strengths and
weaknesses of the use of tablet technology in learning and teaching.
Constructivism framework was developed by Dewey (1933), Vygotsky (1978),
Bruner (1963) and Piaget (1963). Constructivism is based on theory of constructivist

10
learning which means learning happens only when the learners understand the
meaning and develop knowledge. Both Dewey (1933) and Piaget (1963) were
prominent in constructing an education that is informal. According to Dewey (1933),
knowledge must be constructed by expanding the experience, thinking and reflection
associated with the educators. However, Piaget (1963) suggests that knowledge
must be constructed by expanding all experiences that are related to learning from
the early stage to adulthood. Both ideas are incorporated in the extensive
programme of progressive education.
The past decade has seen voluminous number of studies on the integration
and use of ICTs in general that have used TPACK as their theoretical framework.
This framework was used to understand a new knowledge that helps the educators
to deliver the presentation using technology. TPACK was first defined by Shulman in
1986, focussing only on teachers’ knowledge for teaching. Later, Shulman’s idea
was expanded by Mishra and Koehler in 2006 by focussing also on ICT along with
teaching knowledge. It was articulated more by many researchers (Koehler & Mishra
2009; Harris, Mishra & Koehler, 2009; Schmidt, Cogan & Houang, 2011; Chai, Koh &
Tsai, 2011). TPACK recognizes a different kind of knowledge that educators need for
the purpose of teaching effectively using technology. Constructivism and TPACK
frameworks are described vastly in Chapter Two along with their importance in the
current study.
1.7 Significance of the study
It is envisaged that the empirical results of this study will provide valuable
knowledge to the management and procurement people of universities, Technical
and Vocational Education and Training (TVET) colleges, Department of Education
(DOE), Department of Higher Education and Training (DHET), school governing
boards (SGB’s) and private colleges considering the adoption of tablet technology for
learning and teaching. As Mobile learning devices such as tablets or iPads keep
updating their features, many more institutions may plan to integrate tablet into the
classrooms due to their benefits or trend or marketing strategy to register more
students (Brown, 2015). Findings from this study will show that students and
lecturers can fully utilize this tool only if there are necessary apps installed and

11
proper training given to all kinds of users including digital immigrants and not just
digital natives. Otherwise, more pressure will be put on digital immigrants by the
digital natives to change their lecturing approach in the classroom (Prensky, 2001a;
2010; Werth & Werth, 2011). It also plays a crucial role in shaping the academic
future of the students. Furthermore, researchers, learners, teachers, curriculum
developers and lecturers in universities will benefit from the findings of this research
work. It is expected that the findings of this research will stimulate further research
on other areas of tablet use by students and lecturers in universities as well as
learners and teachers in the schools of Eastern Cape Province.
1.8 Research Methodology
1.8.1 Research Paradigm
The researcher adopted a Post Positivist paradigm for this study.
1.8.2 Research Approach
A mixed method research approach was followed to conduct this study.
1.8.3 Research Design
The researcher had opted to use a case study research design with elements
of descriptive survey research and interview. Structured survey questionnaires were
given to university students, lecturers and managers.
1.8.4 Study site
The university where the study was carried out has four campuses. The
research was conducted at one of the campuses where the National Diplomas in ICT
and EE were offered.
1.8.5 Population, Sample selection and Sample size
Details of sample and sample selection are given in Chapter three. In
summary, a total sample of 155 students that comprised of ICT and EE students
from a population of 254 and another sample of 14 lecturers that comprised of ICT
and EE from a population of 25 participated in the survey. Furthermore, a total of 16
managers from a population of 20 also took part in the survey.

12
An overall sample of 18 students were interviewed from the ICT and EE
cohorts. A total of five lecturers were interviewed from both ICT and EE departments.
In addition to that a total of nine managers were also interviewed.
1.8.6 Instruments
The instruments used in the mixed method research consisted of closed-
ended questionnaires and interviews.
1.8.7 Data analyses
The data were statistically analysed. Quantitative data was analysed
statistically by the use of descriptive statistics and inferential statistics. Moreover,
thematic analysis was used to analyse the qualitative data.
1.9 Definitions of operational terms
Tablet
A small portable computer device that is used to be online but not to make
any calls or receive calls (Parajuli, 2016). In this study, tablet is a tool that is used by
university students and lecturers for learning and teaching in the classroom.
iPad
iPad is a device that is introduced by Apple Inc. iPad is used to take photos,
shoot video, play games, play music and do web browsing and e-mailing. An iPad is
also called a slate and is an example of a tablet computer (Buchanan, 2010). iPad is
a flat-screened tablet computer that has touch screen keyboard developed by Apple
(De Clercq & Celine, 2015). In this study, iPad is used in multiple literature to explain
the tablet technology.
Laptop
A small, portable computer that can be kept on an individual’s lap (Beal,
2015). In this study, laptop is a tool that is used to differentiate between tablets in the
way it is used in universities to determine the level of substitutability.

13
Student
“Student” refers to learners at the Bachelor’s and Master’s levels at the
Department of Computer and Systems Sciences at Stockholm University (Aghaee,
2015). In this study, a student is someone who is doing his/her studies at University
level by using tablet.
Lecturer
A lecturer is someone who fills knowledge in students’ minds and gives more
and more information to withstand in the outer world. Lecturer shapes them for
preparation of actual building (Naveen, 2015). Lecturer is someone who is
professionally qualified for educating others in a particular discipline (Aklilu, 2016).
In this study a lecturer is regarded as someone who uses tablet to lecture his/her
students at university level.
Manager
Manager is a person in a formal position or role having certain powers that are
received as a result of workers seeing the manager as a role model (Mele, 2012).
For the purpose of this study, Manager is referred to as Dean, Head of the
department (HOD), e-learning administrator, e-learning specialist, Extended
Programme coordinators (Ex PCO) of the department and Extended Programme
coordinator (Ex PCO) of the whole university.
University
A "university" is a group of schools for studies after secondary school. At least
one of these schools is a college where students receive a bachelor's degree. The
other schools in a university are "graduate" (also known as "postgraduate") schools
where students receive advanced degrees. Therefore, a university offers both the
bachelor's degree and graduate degrees such as the master's (M.A.) and doctorate
(Ph.D.) (Sharon, 2016). In this study, university is a place where the lecturer delivers
the lecturing presentation to the university level students.

14
Learning
Learning is a process of obtaining latest knowledge, behaviours, skills, values
or preferences (Gross, 2012). For the purpose of this study, learning is a process
done by the university students using the latest technology called tablet.
Teaching
According to Gage (1964), "Teaching is a form of interpersonal influence
aimed at changing the behaviour potential of another person". In this study, teaching
was a process done by lecturers using the latest technology called tablet.
Lecturing
Lecturing is a process by which the lecturer gives oral presentations to
students who are obliged to listen and take notes (Good & Merkel, 1959). In this
study, lecturing is a process done by lecturers using the latest technology called
tablet.
Information and Communications Technology (ICT)
ICT consists of the hardware, software, networks and media for the collection,
storage, processing, transmission and presentation of information (voice, data, text,
images), as well as related services (Evoh, 2007). ICT is a broad area that includes
many computer related aspects. In this study, ICT included all kinds of computer
technologies such as desktop computer, laptop, iPad, iPod, mobile phones, smart
phones and Tablet.
apps apps are the abbreviation for applications. It is a software program that can
run on computer and electronic devices such as phone, tablet, computer etc. There
are apps that may work even without internet connection (Karch, 2018). For the
purpose of this study, apps are applications that are downloaded and installed in
tablets for educational purposes.
Technology
Technology is a substance for a community, financial and radical change at
the different stages of an individual, group, company and institution (Fountain, 2002).

15
In this study, technologies are devices such as tablets, iPad, iPod, laptop,
smartphones and mobile phones that are developed from scientific knowledge.
Professional development
Professional development “refers to the attaining or developing new skills
and knowledge required for upholding a particular career path and growing as a
proficient in a specific field” (Education Commission of the States, 2015, para 1).
Providing training or workshops to lecturers and students and staff development in
various ways are termed as Technology training/Professional development in this
thesis.
TPACK
TPACK is the abbreviation for Technological Pedagogical Content
Knowledge. It is a theoretical framework “demonstrating how teachers’
understandings of technology, pedagogy, and content can interact with one another
to produce effective discipline-based teaching with educational technologies” (Harris,
Mishra & Koehler, 2009, p. 396). TPACK is one of the frameworks used in this study
for the purpose of understanding the views of lecturers.
Constructivism
Constructivism is a theoretical framework that is used for constructing,
producing and developing an individual’s own knowledge and skills (Liu & Chen,
2010). It is a framework that is used in this study for the purpose of understanding
the views of students.
Main stream
Main stream refers to streams designed for degree and diploma programmes
which are offered to the students based on their entrance requirements (UNISA,
2018). In this study, students who qualify academically for the entrance
requirements of their chosen programme are placed in the mainstream.

16
Extended Stream
Extended programmes are “streams within regular diploma or bachelor
degree qualifications which are offered over a longer period than the formal time for
regular programmes” (UNISA, 2018). In this study, students who do not qualify
academically for the entrance requirements of their selected programme were
supposed to study an extra year in order to reach up to the level of main stream.
Digital immigrants
Digital immigrants are those who were not born into the digital world (Prensky,
2007). Digital immigrants have adapted and are learning the language of technology.
In this study, the researcher determined the age of digital immigrants to be anyone
born before 1990.
Digital natives
Digital natives are students of the 21st century who are native speakers of
technology and are fluent in the digital language of computers, video games and the
internet (Prensky, 2007). In this study, the researcher determined the age of digital
natives to be anyone born in or after 1990.
1.10 Chapter Demarcation
This thesis contains five chapters and are organised as follows:
Chapter One presented an introduction and background of the study, emphasised
some of the elements that motivated the researcher in commencing the study, such
as the need for an education using tablet computer. The different mobile learning
devices and the importance of professional development were also described. An
outline of the benefits and drawbacks of the tablet use in a university classroom was
presented. The objectives of the study, the research questions, the scope, a brief
overview on population and sample, instrument, data analyses and the significance
of the study were summarised.
Chapter Two provides a critical review of the theoretical frameworks and relevant
literature applicable to this study.

17
Chapter Three describes the research paradigm, approach and design. The
population, sample, data collection instruments are discussed. Issues such as
validity and reliability, data collection procedures, analysis and ethics are also
addressed.
Chapter Four provides a detailed report of the results obtained during the collection
of the data. Data are presented, interpreted and analysed.
Chapter Five presents a summary of the thesis and concludes with limitations of the
study and recommendations related from the findings of the research.
1.11 Summary
In this chapter, the study was introduced and the background to the study was
sketched. An overview of the use of tablet computers in university classrooms was
demarcated. Tablet technologies are used in institutions to change the old method of
chalk and talk approach and implement a new way of blended learning. Technology
integration, ICT in education, tablet computer in higher education institutions,
professional development, mobile apps, university students’, lecturers’ and
managers’ views on tablet use in classrooms, its benefits and drawbacks were all
summarised. A concise summary of the significance of the study was followed. A
brief summary of the methodology used in the research was shadowed. Definitions
of operational terms used in this study were also provided thereafter in this study. In
the next chapter, two theoretical frameworks for the current study would be
presented, followed by a review of the pertinent literature.

18
CHAPTER TWO
LITERATURE REVIEW AND THEORITICAL FRAMEWORK
2.1 Education system
Education has a crucial role in the everyday life of an individual which makes
a holistic development not only to an individual but also to the public and the country.
Blazar and Kraft (2017) posit that education policy has been shaped due to the
effectiveness of teacher over the past decade. Value based education should be
incorporated into the curriculum to make every individual a good citizen (Bhardwaj,
2016). Institutions play a significant role in building good citizens by providing
excellent education to the students through new ICTs (Keating, 2013). Many of the
students nowadays are using modern technologies (Greenhow & Robelia, 2009;
Kyzym & Petukhova, 2017) from an early stage itself (Gutnik, et al., 2011; Rideout
2011) which will make them easier to use these tools later in an institution. However,
educational technologies are not yet implemented effectively due to unqualified
teachers and shortage of academic resources (Stošić, 2015). However, the
incredible expansion in the area of ICT is changing the style of higher education.
Educators are engaged in additional responsibilities to update themselves with the
current progress in the scientific and technical field. Technologies must be
implemented in higher education institutions that include both on campus and distant
education to enhance the skill of students and academics from the traditional
methods of learning and teaching (Lambert, et al., 2014).
2.2 Traditional methods of learning and teaching
A glimpse at the former way of learning and teaching reveals that the learning
style was passive as the teaching style was based on teacher centred approach
where the teacher plays the main role which is commonly known as traditional
teaching methods (Zohrabi, Torabi & Baybourdiani, 2012). In earlier days, teaching
entailed both teachers and students to be at one place at the same time to deliver
knowledge (Nasseh, 2009). Information from the prescribed curriculum and
resources are organised and presented structurally by the teacher which can be
considered as the traditional technique of school based learning (Kim, Tan &

19
Bielaczyc, 2015). According to Bowers and Flinders (1990), teacher-centred
approach is similar to an industrial production in which student is a product of “exit
skills” or “outcomes”. The role of a teacher was to provide information to students
who passively receive information and this traditional method of teacher centred
learning was used more commonly than student centred learning (Lynch, 2010;
Ahmada, Bakarb & Ahmadc, 2018). The main drawback is that the students are
limited to a certain extent and the assessment of their knowledge is based on their
performance in tests or exams that cannot bring out their full potential. Donnelly
(2014) pointed out that “chalk and talk” approach is favoured in China. However,
countries such as the US (Rossing, et al., 2012; Diemer, Fernandez & Streepey,
2012; Shen, 2016), UAE (Hargis, Cavanaugh, Kamali & Soto, 2014), Australia
(Pegrum, Howitt & Striepe, 2013; Clarkson, 2018), Georgia (Hill, et al., 2012) and
Canada (Karsenti & Fievez, 2013) have upgraded from this mode of teaching to a
collaborative mode of learning where students take greater control. Students need to
be prepared in such a way to be a part of the information society where knowledge is
the most significant factor in the social and economic development of a country. It is
also considered as a crucial necessity for upcoming growth in the education sector
(Spathis, 2004). Print media and tools used for writing are the modernised ways to
spread ideas and knowledge (Nasseh, 2009).
The structure and functionality of education has been changed by the
implementation of ICT in the field of education particularly in universities and open
universities resulting in the wide spread and growth of distance learning and
electronic learning (e-learning). These new technologies convert and support the
adaptation of new syllabus and developments in the existing applications (Petridou &
Spathis, 2001; Mohamed & Lashire, 2003). Moreover, the approaches of teaching
may change based on the influence of active learning (Cottel & Millis, 1994; Bonner,
1999) as given below.
The following table shows the comparison of traditional teaching methods and
moderately evolved teaching methods.

20
TABLE 2.1: Comparison of Traditional teaching methods and moderately
evolved teaching methods
Traditional teaching methods Moderately evolved teaching methods
• Reading texts and problems
• Formulating questions
• Attending lectures
• Monitor discussions
• Writing and reply brief or extensive
questions and objective type
questions
• Solving short or lengthy
unstructured problems and cases
• Oral presentation of topic and
reply to short questions from the
audience
• Video Watching
• Attendance and participation in lectures
using interactive whiteboards
• Accounting applications using simple
systems
• Role Playing
• Simple modelling
Source: Cottel & Millis, 1994; Bonner, 1999
The old style of classroom based teaching is undergoing a change due to the
emergence of various digital technologies (Nasseh, 2009).
2.3 Evolution of technologies
Education sectors in the 21st century have been revolutionized by the rapid
growth of ICT (Siu & García, 2017). Recent research on communications technology
(Pew Research Center Global attitudes and trends, 2015) has shown that common
people are using smart phones to access the internet rather than using the old
broadband land phone connection. Pownell and Bailey (2001) identified some trends
in the link with education and ICT. Internet, World Wide Web are those trends of ICT
which has made a tremendous change in the communication among people. Internet
plays a vital role in the day-today activities of general users, especially students due
to the assistance they are obtaining to complete assignments and related works.
This also helps students to acquire knowledge and upgrade themselves by moving
to the next level of studying which makes them confident in their studies (Brown,
2002; Turkle & Papert, 1991). Internet access is offered for lecturers and students in

21
higher education to provide different methods of learning and teaching using tools
such as desktop, laptop, tablet, Personnel Digital Assistant (PDA). The opaque
projector that was used in the olden days is no longer used and it is replaced by the
new advanced fast response time digital projectors which are used by lecturers to
deliver the presentation to students in university classrooms (Grudin, 1994; Stahl,
Koschmann & Suthers, 2006). Different mobile technologies such as laptops, tablets
and mobile phones are revolutionising the range of learning and teaching to a higher
level (Rossing, et al., 2012).
2.4 Modern methods of learning and teaching
Kyzym and Petukhova (2017) aver that modern methods are launched in
education by improving the curriculum and introducing new learning technologies. It
is very important to integrate technology into education by updating the curriculum so
as to prepare the next level of students with essential skills for their forthcoming
(Green, 2005; Motteram, 2011; Saine, 2012; McClanahan, Williams, Kennedy &
Tate, 2012). Gawelek, Spataro and Komarny (2011, p. 28) argue that “no matter
their economic status, they know the world wide web, social media, and
entertainment technologies such as film, music, and games as consistent and
constant components of everyday experience”. Students of the present generation
have high hopes and anticipations which are unlike in the days of chalk and talk
approach in higher education (Siemens, 2005; Castle & McGuire, 2010; Jean-Louis,
2011).
Daniels and Pethel (2005, p. 47) compare students in the current classrooms
with those in the classrooms of olden days and find that they “report higher
subjective satisfaction on a number of dimensions, including overall quality of
educational experience” and “the more they judge the experience to be collaborative,
the more likely they are to judge the outcomes as superior to the traditional
classroom”. Teachers who support the modern method of learning and teaching
claim that “when students are engaged in digital literacy activities,” they “become
more creative in their thinking” (Saine, 2012, p. 38). Kim, Tan and Bielaczyc (2015)
define modern learning as student centred education that lays the responsibility on
students for the learning path without any prescribed curriculum.

22
During the beginning of 21st century, Barrows (2000) and Salvatori (2000)
claimed that problem based learning (PBL) was first comprehended at a medical
school in Canada to train students for attaining the knowledge required, through
group studies to solve realistic problems. Furthermore, instructional approaches
such as inductive teaching and learning (Prince & Felder, 2006) and PBL (Klegeris &
Hurren, 2011; Jurewitsch, 2012) have taken over and followed by many universities
and colleges around the world (Klegeris & Hurren, 2011) to foster the inquiry based
learning in real world contexts which is gaining an acceptance across many
educational disciplines (Spronken-Smith & Walker, 2010). Field based learning plays
a significant role in the education system (Whitmeyer, et al., 2009) that aids the
conceptual development and understanding of student learning (Orion & Hofstein,
1994; Elkins & Elkins, 2007). Researches have proved that field courses are
assisting the students in enhancing their knowledge (Spencer, 1990). Nasseh (2009)
describes distance learning as a new method of education system where the study
materials and guidelines are given to learners by not being in a designated place
called classrooms but through the wide access of libraries. Jethro, Grace and
Thomas (2012) refer e-learning as the Internet technologies that deliver a wide range
of solutions to enrich knowledge and performance. Many of the e-learning
technologies (Garrison, 2011) assist the students to learn the topics from their
convenient place and time (Herrington, et al., 2012). There are several technologies
available to adopt a blended learning approach that can be used to enhance the
skills of learners and these include videos for demonstration, recording and reflective
analysis for simulation-based e-learning (SIMBEL) systems (El-Mowafy, Kuhn &
Snow, 2013). PowerPoint delivery of lecture is an effective way of lecturing when
compared with chalk and talk approach (Shah, Patel & Shah, 2017).
To mark the shift from chalk and talk approach where the students are
passive to a modern approach where the students are active, collaborate and
engage in classroom (Pelgrum, 2001; Figueiredo & Afonso, 2005), a magic device
called tablet computers came into market (Melhuish & Falloon, 2010; Falloon, 2013).
These tablets are more narrowly defined by the New Media Consortium in 2012 as a
wireless mobile PC device that has finger driven touch screens (Clark & Luckin,

23
2013). Meurant (2010, p.54) indicate that the tablet’s “operating system and
innovative apps are a potential game changer. An integrated ecosystem that is being
established will likely revolutionize education”. It is therefore necessary to observe
the different mobile technologies that are changing the world today.
2.5 Mobile technologies
The high popularity of the mobile technologies have greatly influenced people
all over the world especially the youth (Alhassan, 2016; Zidney & Warner, 2016;
Huda, et al., 2018). Mobile technology is increasingly being used to support blended
learning beyond computer centres (Mayisela, 2013). The adoption of these
technologies provide communication, knowledge and information from anyone
around the world at any time which removes the gap from old style of life and work to
modern (Sadler, Robertson, Kan & Hagen, 2006). Portable computers such as
laptops, wireless communication tools such as 3G/data card, data bundles,
Bluetooth, Wi-Fi, general packet radio service (GPRS) and mobile devices can all
be called mobile technologies. The most recent growth in the field of mobile
technologies are smartphones and tablets (Mayisela, 2013).
While over 75% of the world’s population uses mobile technology, more than
30 billion users have downloaded mobile apps in 2011 all over the world (World
Bank, 2012). There are mobile devices of various models easily available in the
arcade which are widely used by all kinds of people who range from university
students to senior citizens. Students get familiar with these devices fast but teachers
takes some time to get acquainted with them (Knezek, Christenson & Tyler-Wood,
2009) even though they have a high interest in the invention of mobile apps since it
assists learning and teaching (Johnson, Adams & Cummins, 2012).
Mobile phones have made an impact in almost all the developed countries
(BuddeComm, 2011), where it is common for people to own two devices. During
mid-2012, in Australia the use of mobile phones and smart phones came up to a
level of 130% (BuddeComm, 2012), and 52% (Google & Ipsos, 2012) respectively.
The report from International Telecommunication Union shows that more than 6
billion customers purchased mobile phones in 2012 (Liu & Wei, 2014). Another

24
report by Comscore (2014) indicates that 163.2 million people in the U.S. owned
smartphones during the beginning of 2014. Mobile phones have developed into a
multipurpose device that has various features such as audio recording, video
capturing, web browsing, playing games as well as sending and receiving emails
(Engel & Green, 2011).
Mobile health or mHealth is applied in the medical field where health
information networks are accessed with the help of mobile devices (mDevices). The
information is retrieved using radio waves either through the central access points or
satellites. Among all these mobile devices, mobile phones are most commonly used
in mHealth (Hart, 2000).
Recent developments in mobile technology including the introduction of
smartphone and tablet devices have provided essential new tools for communication
(MCNaughton & Light, 2013). In the beginning of 2012, tablet ownership of the
people in Australia was 18% and it was expected that by the end of the year, it would
reach to 39% (IAB Australia, 2012). The wide availability of these portable, powerful,
networked technologies have changed our ways in how we work, learn, spend our
leisure time and interact socially. The impact has been rapid and widely spread
(MCNaughton & Light, 2013). “Mobile technologies are able to support learners’
engagement in creative, collaborative, critical and communicative learning activities”
(Cobcroft, Towers, Smith & Bruns, 2006, p. 25). Mobile technologies such as mobile
phones and tablets can highly supplement students’ interest in studies and produce
effective academic results when blended with traditional strategy. These
technologies enable students to perform mobile learning by being online and work
more independently inside and outside of the classroom (Menkhoff & Bengtsson,
2012).
2.6 Mobile learning
Chen (2012) states that mobile learning is a type of learning by not being in a
specified time or at a particular place where the study material can be obtained from
various locations. Mobile learning or m-learning includes all kinds of learning using
any mobile device such as personal digital assistants (PDAs), digital media players

25
(iPods and iPod Touches), smartphones (iPhones, Android phones, BlackBerrys and
Windows phones) and tablet computers including tablets (Wood, 2003; McQuail,
2005; Wallace, 2008; Mark, Grace & Robert, 2012; Gong, 2012). These mobile
learning devices are weightless, portable, easier to handle and need less
requirements when it is compared with the older version of computers (Milks &
Bloxham, 2010). O’Malley, et al. (2005) indicate that mobile learning is a kind of
learning in specialized contexts that are entered in numerous ways such as learning
by not determining a particular location (Ally, 2009; Motiwalla, 2007), study materials
accessing from various sources and by taking advantage of learning prospects
offered by the mobile technologies. This process of mobile learning “plays an
essential role of online collaboration for educational purposes” (Liu, Tao & Nee,
2008, p. 127). As discussed by Motiwalla (2007), m-learning is possible as long as
one has a wireless connectivity to the internet. This assists students to enhance their
collaboration and interaction with the lecturers and classmates which are valuable for
enlightening the learning environment.
However, the mobile learning used in universities around the globe is still in its
infancy. The latest models, systems and applications need to be implemented in
higher education sectors for the successful integration of mobile learning. Educators
need to update themselves with the new technologies and update the learning styles
that are available in the current era to safeguard an efficient and effective mobile
learning environment (Khaddage, Lattemann & Bray, 2011). In the next section, the
discussion focuses on technology integration.
2.7 Technology Integration
While technology has become a greater force to improve the productivity in
the field of business, education did not have much change (Geringer, 2003). Only a
minority of the educators are using technology in classroom to enhance learning and
teaching even though much have been discussed to integrate technology into
classroom (Geringer, 2003). “The level of knowledge and familiarity with technology
can be a factor in the incorporation of technology into the daily lesson planning” (Al-
Bataineh, Anderson, Toledo & Wellinski, 2008, p. 381).

26
Labbo and Place (2010, p.9) define the technology integration as “curriculum
integration with the use of technology involves the infusion of technology as a tool to
enhance learning in a content area or a multidisciplinary setting”. Dockstader (1999,
p.2) states that “technology integration is using computers effectively and efficiently
in the general content areas to allow students to learn how to apply computer skills in
meaningful ways”.
Educators should have knowledge in the latest technologies and use it
regularly in classroom in order to fully utilize the integration of tools in learning and
teaching (Duhaney & Zemel, 2000). "The challenge for educators today is not about
chasing the latest technologies, but about utilizing the potential of technology to
enrich learning” (Khim, 2003, p. 2). Using technology in classroom is an essential
factor to make the students not only productive but also to motivate, develop the
knowledge and boost creativity in all their courses (Duhaney & Zemel, 2000).
“Integrating technology isn’t about using complex technology programs but rather
simplifying technology choices and focusing on how technology connects to learning”
(Antifaiff, 2000, p. 7).
The use of technology on a regular basis into the instruction has made the
educator a facilitator in a student centred approach from teacher centred approach.
This made a vital change in students to collaborate and engage more with their
classmates by being active participants in learning (Pisapia, 1994).
However, teachers should initiate the process of using technologies in the
classroom and it is very important for a teacher to have knowledge on how to
integrate technology into curriculum as well as to have the ability to use the
technology efficiently and effectively (Wang, Ertmer & Newby, 2004). Incorporating
technology into curriculum is to improve students’ learning by which curriculum
drives the use of technology, not technology driving curriculum (Dockstader, 1999).
A review of ICT in education explains this concept further.

27
2.8 Information and Communication Technology (ICT) in education
The rapid development of ICTs has provided the way for academic institutions
all over the globe to develop the learning and teaching process (Husseini & Safa,
2009). The use of ICTs in education have transformed the learning and teaching
approach (Talibian, Hamid & Ahmed, 2014). Means and Olson (1997, p.9) state that
technology “promotes student learning through collaborative involvement in
challenging, multidisciplinary tasks by providing realistic complex environments for
student inquiry, furnishing information and tools to support investigation, linking
classrooms for joint investigations”.
Technology has revolutionised the field of education during the beginning of
1980s with the emergence of computers. It was a challenging task for institutions to
connect computers with educators and students (Donovan, Green & Hartley, 2010).
When the impact of computers stood up, educators started to realize the benefits of
using computers in classrooms. For example, in 1995, 79% of the institutions in the
U. S. had computer labs (Lowther, Ross & Morrison, 2003). Taylor, Casto & Walls
(2007) declare that more computer facilities are available in institutions compared to
the previous years. Adopting computers and technologies in the classroom have
always encouraged students (Conn, 2012). Serin (2011) and Donovan, Green and
Hartley (2010) also hold the same view that integrating computers into learning has
made students to think independently and involve more using learner centred
approach. According to Li and Ma (2010), students were highly productive when
computers were integrated into mathematics education. “Technology-enriched
classrooms were prone to produce more student-centred and individualized
interactions, and non-technological classrooms consisted of the traditional model of
teacher centeredness” (Page, 2002, p. 403). Classrooms that have computer
facilities have made the environment learner centred rather than teacher centred
(Swan & Mitrani, 1993).
Mobile phone is an ICT tool which can be considered as a learning tool in
classroom as it can assist students in discovering new concepts and offer better
interaction between students and educators (Ooms, Linsey, Webb & Panayiotidis,
2008). Students in China, Japan, Philippines and Germany very often use mobile

28
phones in classroom to learn English spelling, mathematics and health related
matters (Roberson & Hagevik, 2008). Prensky (2005) notes that university students
use mobile phones to complete exams and record voice to check the test taker.
Many students benefit from using mobile phones in computer programming class
(Chen, Wang & Li, 2007).
Tablets in institutions encourage innovative teaching methods such as game-
based learning (Chen, 2012), exploratory learning outside the classroom (Liu, Lin,
Tsai, & Paas, 2012) and cooperative learning (Lan, Sung & Chang, 2007;
Roschelle, et al., 2010b) by gathering and sharing the information. Furthermore,
tablets can be used from any place at any time. Therefore, teachers can use this
device to foster student learning (Lemke, Coughlin & Reifsneider, 2009; Melhuish &
Falloon, 2010). Tablets are revolutionising the learning and teaching environment
from traditional method to blended method (Kiger, Herro & Prunty, 2012). Among all
the mobile devices, tablet is the latest technology that has created a boom in all
sectors especially in education (Cochrane, Narayan & OldField, 2013). The next
section will discuss more on tablet technology such as its evolution and impact
around the world.
2.9 Introduction of iPad tablet technology
Despite mobile devices such as laptops, smartphones and personal digital
assistants (PDA) gaining high popularity in recent years due to its establishment in
the electronics market, they all have defects in one way or the other (John, et al.,
2012). While laptops are heavier and have less battery life, some of the smartphones
and PDAs have small screen size. Tablet computers such as Galaxy (developed by
Samsung Inc.) and iPad (developed by Apple Inc.) have been introduced to enhance
features such as graphic display resolution and touch screen user interface when
compared with previous devices such as laptop and smartphones (John, et al.,
2012).
After the revolution of iPod touch and iPhone, Apple Inc. hurled a supernatural
and innovative device (Apple Inc., 2012) called iPad in January 2010. iPads connect
all ages of people ubiquity through emails, social networking portals, Skype or imo

29
applications. This device has created a platform that is familiar with multi-touch
support and finger gestures which makes it a mixture of laptop and smartphones
(Jane, 2011). Since then, Apple has declared iPad as “poised to change the learning
landscape” (Apple Inc, 2011). Mc Cracken (2010) report in Time Magazine that iPad
was declared as one of the fifty best inventions of the year 2010. Due to its large
capacity to store Apple iTunes with over 500,000 apps and 72% of educational apps,
iPads offer innumerable software choices for all types of users including students
(Shuler, 2012).
iPads are in much use as a tool for educational and academic purposes
(Manuguerra & Petocz, 2011; Keane, Lang & Pilgrim, 2012; NAEYC, 2012;
Cochrane, Narayan & OldField, 2013; Cavanaugh, Hargis, Kamali & Soto, 2013).
Apple claims iPad as an educational tool that has creativity and hands-on learning
where one cannot find similar features in any other tool (Apple Inc., 2013a). The
powerful apps that are installed in iPads allow students to access information quickly
from anywhere and engage in learning (Apple Inc., 2013b). iPad is widely used not
only for reading, filling, signing and managing the official documents(Warren, 2011)
but also to read e-books, communicate with one another and learn in the new style
that challenges the old style of learning (Henrik, 2011). It is therefore necessary to
observe the entry of tablet technology into higher education.
2.10 Introducing tablets into Higher education
Tablets have made a great impact in higher education. The method of
technology based teaching is spreading all over the world particularly in universities
(Castillo-Manzano, et al., 2017; Henderson, Selwyn & Aston, 2017). Integration of
tablet technology into classrooms has become ubiquitous and it enhances the skill to
read, motivates to learn and helps to collaborate and engage between each other
(Shuler, 2009). Research shows that emerging institutions are incorporating this
gadget into student learning while supplanting the previous computer devices such
as desktop and laptops (Hu, 2011). Another research conducted by Vu, McIntyre and
Cepero (2014) report that institutions in the New York City paid out more than $1.3
million to purchase more than 2000 tablets for the students. The department of
Education in Virginia spent $150,000 to procure tablets at 11 schools. More than 200

30
institutions in Canada applied for a fund grant of approximately $450,000 to
purchase tablets (Vu, McIntyre & Cepero, 2014). Within a period of two years after
the release of iPad tablet computers, 1.5 million iPads and 20,000 education apps
have been purchased for education as per the findings of Apple (Tomassini, 2012).
Nevertheless, the goal of potential technologies to interact with learning and
teaching is still not nearer than expected (Timmermann, 2010). It will not be a difficult
task for academics to integrate technologies such as tablet into classroom to
encourage creativity and collaboration among students as they are already familiar
with all these devices (Timmermann, 2010).
A report made by Foresman (2010) shows that Higher education institutions in
Oklahama are planning to implement this gadget into their curriculum as they
consider it as a cost saving device and a collaborative tool. Many colleges and
Universities such as Oklahoma State University, University of Maryland, Reed
College, North Carolina State University, Duke University, George Fox University,
Seton Hill University, Darden School of Business and Illinois Institute of Technology
plan to begin a pilot tablet program to expand the tactical abilities of students as they
enter the workforce.
The multipurpose features of tablet such as its flexibility and easiness in
reading e-books make it an apt learning tool in the higher education sector. Tablets
are helping hands for students as they are cheaper than their textbooks (Miller,
2012). Beyond reading, tablets have many other facets for academics and students
to use in colleges and universities. Walczak and Taylor (2018) and Minocha, Tudor
and Tilling (2017) posit that a combination of face to face and tablet based
instruction have made substantial developments in learning outcomes. Results from
the study conducted by Enriquez (2010), show a tremendous improvement in
students’ learning when compared with students who did not use tablets. This study
shows that students were more collaborative and their interaction with lecturer and
classmates were easier when tablets were used. Overall, tablets have revolutionised
education in colleges and universities and created more opening for student
improvement and professional development.

31
2.11 Theories of Professional Development
Professional development has been defined in multiple ways by each
researcher. “Professional development is defined as activities that develop an
individual’s skills, knowledge, expertise and other characteristics as a teacher”
(OECD, 2009, p 49). In Mokhele’s (2011, p. 35) view “Professional development is
defined as the development of a person in his or her professional role”. Galtthorn
(1995) defines professional development as a process of acquiring knowledge
through experience and methodical assessment of the educator’s teaching strategy.
However, Ganser (2000) states that professional development is a professional
growth that can be obtained through both formal and informal involvements such as
attending workshops, meetings, reading peer reviewed publications and watching
academic documentaries. Roters and Trautmann (2014) claim that professional
development will address the knowledge base, beliefs, practical skills or attitude of
teachers. Educational institutions offer a learning space with the necessary gadgets
that provides workshops for training (Avalos, 2011).
The common types of professional development that were offered for years
for educators were staff development workshops, inter training workshops and short
term courses that provided educators with innovative ideas to perform their work
(Villegas-Reimers, 2003). But many of these workshops and trainings were not
fruitful for the work to be done in classroom (Walling & Lewis, 2000; Cochran-Smith
& Lytle, 2001). Educators always have worries about the new tactics that need to be
implemented in learning and teaching once the workshop is done (Guskey, 1986).
Guskey’s (1986, 2002) point seems to be that educators are not ready to change
their mind set and style of teaching as they believe that it will affect negatively on the
performance of students for which they will be held accountable later.
Converse to Guskey’s (1986, 2002) claims, Hochberg and Desimone (2010)
argue that educators should develop their academic and subject knowledge in order
to meet students’ learning needs. Professional development helps the educators to
develop their skill and thereby students can improve their performance in
assessments which definitely stimulates the academics. Technology integration and

32
professional development must always be linked to each other as academics need to
develop their skill and knowledge whenever technologies are implemented
(Bouterse, Corn & Halstead, 2009; Spires, et al., 2012). Spires, et al. (2012, p.234)
state that “Given the effect computers have in the classroom, high quality and well-
designed teacher professional development initiatives become even more crucial for
1:1 learning environments”
Globally, many colleges are improving their quality in education by
augmenting the content and course knowledge of the lecturers and their pedagogical
strategies through various trainings (Darling-Hammond & BaratzSnowden, 2005).
2.12 Professional training for Lecturers
Since the beginning of the 20th century, higher education sectors promote
training for academics to enhance the quality of education. University of Sudan,
University of Tanzania, Makerere University and many more universities in east and
central African continent play a significant role in training and updating the
qualifications of many lecturers (Moon, 2002).
According to Smerdon, et al. (2000, p.9) “teachers' preparation and training to
use education technology is a key factor to consider when examining their use of
computers and the Internet for instructional purposes”. Educators should be updated
with the knowledge of latest technologies in the current market such as tablets,
smart phones for appraisal and professional development which also helps to
communicate between student-teacher-parent effectively and become familiar with
tablet technology (Agir, 2015). Agir (2015) argues that they should be pedagogically
trained on how to use tablets effectively in the learning and teaching environment
with the assistance of various new applications apps to improve the deliverance of
content to students in classroom. Training provided to the academics will certainly
help students to learn the topics more effectively (Caverly, Peterson & Mandeville,
1997).
Cennamo, Ross and Ertmer (2010) undermine the position that
educationalists need to have knowledge on the different stages of implementing

33
technology in the classroom even if they have a negative perception towards the use
of new technologies in learning and teaching.
As a matter of fact, Brooks-Young (2007) and Buabeng-Andoh (2012) indicate
that it is highly significant for an educator to undergo training to integrate new
technologies into the classroom to enhance the instructional strategies for the benefit
of students. However, some researches indicate that there are very little training
facilities available for educators and these are not successful in most cases (Finley &
Hartman, 2004; Brooks-Young, 2007; Buabeng-Andoh, 2012). Educators should be
aware and have knowledge on the current technologies including mobile applications
apps to be prepared for using with their students (Mosenson & Johnson, 2010).
To describe more on this topic, application apps used in tablets for learning
and teaching is explained in the next section.
2.13 Mobile Application apps used in tablets for learning and teaching
Norris and Soloway (2012) note that Apple’s iTunes store has more than
500,000 apps among which there are many apps that can be used for learning and
teaching. Apple provides numerous updating apps that are available to enhance skill
and cover all learning areas for academics and students of different ages
(Bonnstette & VanOverbeke, 2012). According to Carr and Prater (2013, p.3857)
“classrooms with the tablets involved students utilizing apps to reinforce skill
acquisition of letters/sounds, sight/spelling words”.
There are plenty of pedagogy apps available for quality learning and teaching.
Educators have their own way of incorporating technology seamlessly (Cohen,
2012). Some of the commonly used apps have been described in this literature.
iWrite words app is suitable for students who like to write numbers, letters,
words and sentences by using their fingers (Moffet & Amend, 2011). Diigo app is
appropriate for students who want to work collaboratively. It helps students to
highlight, save or comment in the textbooks and receive links to books or articles
(Cohen, 2012; Beach & O'Brien, 2013). Access My Library (AML) app is similar to

34
Diigo app where students can input the name of the database to search for a book or
topic (Cohen, 2012).
A very recent study lists the various functions of educational apps that need to
be installed in smart phones by academics and students while using tablets for
learning. The table shown below describes the criteria of students and educators for
choosing a specific educational app (Eppard, Nasser & Reddy, 2016).
TABLE 2.2: Criteria for Selecting Appropriate Educational apps
Source: Eppard, Nasser and Reddy (2016, pp. 23-25)
Many researches have taken place that provide freedom to students to select
the apps for their coursework (Backhouse, Wilson & Mackley, 2014; Brown, 2015;
Gordon, Jackson & Usher, 2014; Kerrigan, et al., 2014; Manakil & George, 2017).
Zou and Li (2015) conducted a study in Xi’an jiaotong-Liverpool University (XJTLU),
China to examine in what ways mobile apps can be incorporated into the learning
and teaching of English language and the students’ perception on different apps that
can be used to enhance their learning. Two phases were used to collect the data

35
from students. First phase included observation, 40 students completed the
questionnaire and 18 randomly selected students participated in interviews. Second
phase comprised of questionnaire and interviews. While 44 students completed the
questionnaire, 19 students were involved in interviews. Participants reported
positively on the use of tablets with apps for learning in English lessons and they
self-studied inside and outside of the classroom.
The findings of the study conducted by Kim (2013) to investigate the
substantial variances between two groups namely control group and experimental
group are as follows. Students in the control group had only class activity while those
in the experimental group used their smart phone apps. This research was done in a
women’s university in Korea where 24 and 20 students participated in control group
and experimental group respectively. The result discloses the benefits and
drawbacks of smart phone apps in a foreign language classroom.
A research was conducted at the University of New Haven with 20 General
Chemistry honours students who were using tablet3 both in the classroom and the
laboratory. In the beginning, both students and the academics struggled to use the
apps. However, at a later stage, they were satisfied with the efficiency of apps when
tablets had been preloaded with appropriate apps before the commencement of the
chemistry class (Hesser & Schwartz, 2013).
Tablets with preloaded apps for quality learning in classroom can be
considered as the main aspect of mobile learning (Cochrane, 2012) which is one of
the foretelling developments in higher education (Brown, 2015). Majority of the
students agreed that choosing their own apps and devices had enhanced their
learning, collaboration and engagement in a better way (Gordon, Jackson & Usher,
2014).
The literature that follows hereafter will discuss the benefits and drawbacks of
using tablets in a university classroom, views and attitudes of university students,
lecturers and managers regarding tablet use for learning, collaboration and
engagement in classroom. Lecturers and managers views and attitudes on the use

36
of tablets for teaching are also discussed. These are the key factors that drive this
research.
2.14 Benefits of tablets and other mobile technologies
The 21st century generation is very fast in adapting new technologies due to
the benefits these offer. According to Ludwig and Mayrberger (2012, p. 2158),
“mobile devices are easy and safe to handle and can be integrated in the class
without a big expenditure”. A study conducted in Midwestern state college reported
positively on the cognitive skill, organization and learning motivation of students
using tablets in classroom and at home (Dyer, 2013). In addition to that, students
understood that it was an easy tool to take lecture notes and easy to handle and use
when compared with previous mobile technology. As it is portable and can be used
anywhere and at any time, it has improved students’ processing and accessing skill
for information (Dyer, 2013; Hunter & Storksdieck, 2017).
In Barone’s and Wright’s (2009) view, the gadget has helped students to
interact and communicate with their classmates and educators very easily due to its
ability to share and pass information. Based on the findings of a study conducted by
Oblinger (2003) on the use of internet by adolescents, 41% of them used emails and
instant messages to communicate with their teachers for the purpose of learning.
Among all mobile technologies, tablet specifically has helped students to collaborate
with educators and engage more in the classroom (Dhir, Gahwaji & Nyman, 2013).
Berk (2010) argued that gadgets are not only helping students to communicate
between each other in the form of capturing pictures but also through sharing
knowledge in a structure of peer to peer.
Goral’s (2011) point seems to be that the key benefit for students using
tablets is the provision to download and read e-books thereby cutting the
expenditure on textbooks. It also boosts the critical thinking and creativity of the
learners through software included in the technology. Sheppard (2011) highlights
that tablet has the features of an eBook reader, it also allowed access to the myriad
resources of the internet; allowing users to seamlessly switch from one text to
another. Despite mobile technologies such as laptop and tablet being costly for low

37
income people, it will benefit students in terms of not purchasing textbooks but being
online and download e-books (Alsufi, 2014).
Alyahya and Gall (2012, p. 1269) found that “students felt confident carrying
their tablet with them because it organized everything: planner, articles, notes,
emails, appointments etc”. It helps students to be assertive and talented in
classroom. Incorporating tablets into the classroom has made learning enjoyable and
promoted student motivation and interest in learning (Norris & Soloway, 2012;
Ludwig & Mayrberger, 2012; Alsufi, 2014).
Mang and Wardley (2012) pointed out numerous benefits of incorporating
tablets into the classroom such as students reading articles, taking lecture notes,
sharing the work with each other and conducting research during debates. A student
who regularly uses tablet will be much interested to have group study as they share
information in classroom (Ludwig & Mayrberger, 2012).
The vast spread of mobile technologies offer much support for students to
learn inside and outside the classroom (Martin & Ertzberger, 2013). Students in
different age groups who use tablets in classroom are obtaining the benefit of
learning (Alsufi, 2014) that includes slow learners as well (Sheppard, 2011). Mobile
technologies provide multiple learning styles that can be used at any place at any
time (Martin & Ertzberger, 2013). Baya’a and Daher (2009) firmly believe that mobile
technologies are a learning tool that can be used by students to learn effortlessly and
proficiently. Incorporating tablets in classroom can make instructional strategy a
blended learning approach such as project based learning, independent inquiry,
problem based learning and cooperative learning (Lowther, Ross & Morrison, 2003).
Tablet apps provide significant benefits to the educators especially to design
and prepare study materials and curriculum which make it easier for them to devise
instructional strategies (Ludwig & Mayrberger, 2012). This also makes students to
have an interest in attending classes and engaging in learning and completing large
portions in less time (Schachter & D'Orio, 2011; Ludwig & Mayrberger, 2012).
Tanaka, Hawrylyshyn, and Macario (2012) also reveal the viability of using tablets to

38
teach anaesthesiology students. Apple provides many educational apps that can be
potentially used by educators for the purpose of teaching (Ludwig & Mayrberger,
2012).
It is essential to make use of the opportunity to incorporate mobile
technologies into the classroom as it is affordable for the institution (Cobcroft,
Towers, Smith & Bruns, 2006). Barone’s and Wright’s (2009) point seem to be that
institutions should come forward to mould students with new technologies such as
tablets to create a better tomorrow.
2.15 Drawbacks of using tablets in learning and teaching environment
2.15.1 Off-task use of technology in classrooms
Contrary to the earlier literature, mobile technologies that create benefits in
higher education can also create drawbacks (Kim, Mims, & Holmes, 2006). As
students are not familiar with tablets, its software and apps, it is not worth to
incorporate tablets into the classroom (Mang & Wardley, 2013). Kinash, Brand and
Mathew (2012) record the off-task behaviour of students using tablets during lecture
time which includes checking mail, web browsing and visiting social networking sites
such as Facebook and Twitter. Karsenti and Fievez (2013) argue that it is not the
mobile technology particularly tablet that matters but it is how teachers and students
use the tool that matters. None of these devices can create interest in students
unless they themselves use them in a productive manner.
A measurement tool to monitor each student should be implemented in the
classroom. Research conducted by Mifsud (2002) has shown that educators cannot
determine the students’ activities while they are using tablets in classroom. Students
are using the device for ineffective purposes such as playing games, chatting, instant
messaging and visiting websites. These purposes are not appropriate during class
hours and malpractices during tests and exams are supposed to be carefully
controlled. Mifsud (2002) stresses that educators require proper training on how to
use the device effectively before the technology is adopted in the classroom or else
technology will be considered as an intruder into the chalk and talk approach of the
educator.

39
2.15.2 Challenges of adopting technology for technology’s sake
McNaughton and Light (2013) emphasise that the supreme jeopardy in the
revolution of tablet technology is that overenthusiasm on these new technologies will
lead to people focussing on only on technology but not on studies. Due to common
people’s attention to technology, there is a high possibility that parents will purchase
tablets for their children without a clear sense of their purpose and requirement. This
eventually results in them not achieving the goal of purchasing the tablets which
frustrates the consumers and families. Even regular users claim that the tablet is
merely a piece of multi-component communication system (Hyatt, 2011; Rummel-
Hudson, 2011; Niemeijer, Donnellan & Robledo, 2012).
A study conducted by Murphy (2011) reveals that many institutions have
adopted tablets for each and every student registered for the various courses. It is
possible that more institutions may purchase tablets for students in the near future.
Nevertheless, purchasing tablets for the sake of technology will not bring the desired
outcomes.
Similarly, a study conducted in North America indicates that adopting tablets
in institutions have been unsuccessful. Consequently, institutions that have tablets
should be prepared for the successful implementation of tablets in classroom (Mang
& Wardley, 2012).
2.15.3 Upgrade of internet infrastructure
Institutions should come forward to filter and restrict the unnecessary and
irrelevant sites that are used by students during teaching time (Business Wire,
2011). The websites and portals that students visit during the absence of the
educator will deviate their minds from learning and seriously affect their academic
performance (Vuorikari, Garoia & Balanskat, 2011). Vuorikari, Garoia, and Balanskat
(2011) undermine the position that tablet computers make the work harder for an
educator as it is a convenient tool for students to access internet very easily during
any situation. Hence, managements are enforced to implement a technology to limit
the unwanted sites for a productive education. McGee and VanderNoor (2013)
40
expect institutions to do a tight monitoring on the access of content students use to
avoid issues in later stages.
2.15.4 Drawbacks of using tablets when compared with PC and Laptops
Despite the potential benefits offered by tablets, there still remain many
challenges that must be addressed if these benefits are to be fully realized. The main
drawback of tablets when it is compared with the previous technologies such as PC
and Laptops is that tablets lack the feature of inserting CDs or DVDs, thus creating a
serious problem of not being able to install software. A study conducted in Stanford
University and University of Notre Dame revealed that management and students
were unhappy with the use of tablets and discontinued it within a few weeks’ time.
Students were not friendly with the structure, interface and keyboard facility that it
offered and they preferred the earlier technology which was laptop for learning
(Fischman & Keller, 2011).
2.16 Views of students, lecturers and managers on the effectiveness of tablet
use for learning in university classrooms
A study conducted in an Australian university explored the views of 84
students from a population of 92 to assess the effect on learning through the use of
iPad tablets. Mixed method was used for this research. Findings of the study
indicated that iPad use enhanced engagement, realism, collaboration and critical
thinking (Clarkson, 2018).
An interdisciplinary team of faculty from Indiana University – Purdue
University Indianapolis (IUPUI) studied the use of Apple iPad tablet computers as a
supplemental tool for learning in classroom. A total of 209 students partook in the
study. A concurrent mixed method approach was used for the collection of both
qualitative and quantitative data. Findings revealed that some of the students felt the
tablet was a hindrance to their learning and they also had issues with the
touchscreen. However, majority of the students felt tablet as an entertainment tool
that motivated them to learn the topics. Additionally, it generated an interest in them
to attend classes actively. The researchers also recommended that in order to
maximize this potential, the curriculum must be prudently developed and applications

41
that assist various styles of learning and content delivery need to be installed. They
also did not fail to recall the drawback that tablets were a shared resource (Rossing,
et al., 2012).
Mango (2015) conducted a study to investigate the perception of college
students on the use of tablets in their learning. The participants in the study were 35
students from two college level classes of Arabic in a university in the southwest of
the US. A quantitative analysis was performed and a 5-point Likert-type
questionnaire was used in this study. The data analysis and results indicated that
students not only enjoyed using the tablets but also believed that the tablets could be
an effective tool in their learning.
Agir (2015) explored the experience of the first institution that had purchased
tablets in Turkey for classroom use. The aim of this study was to evaluate how well
tablet was used in a classroom and whether it increased the motivation among
students to learn. A total of 15 students participated in the survey. Data was
collected through qualitative analysis in which observations, focus group meetings
and interviews were conducted. From the findings, it was observed that students
used tablets neither to read e-books nor to make presentations. Many students have
used tablets to gather information to conduct online researches thereby getting an
exposure to different learning methods. Overall, students reported positively on
synchronizing smart boards and tablets in education. Nevertheless, classrooms,
management and facilitation must be conducive enough to realize the actual
potential of technology.
Conversely, in a study conducted in China to examine the application of tablet
computer and perception of students on the technology, Long, Liang and Yu (2013)
collected the data from 112 students who participated in an online anonymous
survey. Despite, students agreeing that tablets were used as a learning tool, they
used the device only for fun and entertainment activities.
Diemer, Fernandez and Streepey (2012) investigated the perception of 209
undergraduate students to understand the factors that may shape the attitudes of

42
students towards the use of tablet in the classroom. The authors also examined how
the gadgets had impacted student perceptions of learning and their engagement in
active and collaborative learning during tablet-centred activities. A quantitative
method was used and a 5-point Likert scale questionnaire was circulated for this
approach. Although, the authors reported that the adoption of tablets had enhanced
collaborative learning and engagement between the students, they did not measure
the learning styles of the students prior to the analysis.
A pilot study conducted in Midwest United States with a total of 237 students
in a qualitative research analysis showed that students had more openings to work
together in groups for the project and brainwave with their peers to be more creative.
The students were also interested in attending classes to perform tablet activities
which makes them productive (Chou, Block & Jesness 2014).
A research conducted in Turkey warns that students must pay attention to
their work instead of becoming distracted or dominating the gadget in a group (Agir,
2015). However, on an overall appraisal, the tablet facilitated their participation and
collaboration among groups when they worked on a project (Agir, 2015; Mango,
2015).
The views and attitudes of academics on the use of tablets in learning and
teaching environment are equally significant as those of students (Ogle, 2015). The
purpose of Rossing’s (2012) study was to determine the perceptions of university
lecturers on students tablets use when tablets were incorporated into communication
courses. Each faculty member received a tablet during the 2010-2011 academic
year and had access to a set of tablets for in-class use. Indiana University-Purdue
University-Indianapolis faculty attempted to determine how mobile technology might
promote the values and outcomes of liberal education. He used observations,
discussions and experiences to capture the perceptions of teachers on the use of
tablets. The findings indicated that the use of mobile devices invited collaboration
and cooperation, as well as changed the way students interacted with one another
and applied their knowledge. He suggested that students in higher education should
be provided with specific guidance as the new technology is introduced.

43
Research in Turkey from the perspective of academics indicate that majority
of the students use the tool for educational purposes such as to gather information,
prepare presentation and conduct research online. It helps to assert the notion that it
can be used for any lesson (Agir, 2015). Nevertheless, the author states that for the
higher pedagogic effectiveness of using tablets, the institution should take necessary
steps to set a barrier to social networking sites.
Research conducted by Long, Liang and Yu (2013) in China explored the
perspectives of 68 educational administrators who include principals and curriculum
supervisors of different institutions from Beijing and Shandong on the implications of
introducing tablets in developing countries. All the three parts of surveys included
close-ended questions in which the first part focussed on their knowledge of tablets
and their choice between tablets and other similar devices. The second part
concentrated on applications of tablets and the third part engaged on the
requirements of introducing tablets into their learning, teaching and work. The study
shows that students and lectures still need in depth knowledge of applications on
tablets.
Beckerle (2013) measured the perceptions of administrators, professional
support staff and district content facilitators to evaluate how worth and effective was
tablet in terms of learning and teaching tool in classroom. Despite the population of
administrators being 18, unfortunately only one person was ready to participate.
Therefore, statistical analysis was not performed for administrators. Sample for
professional support staff and district content facilitators were 13 and three
respectively. The professional support staff performed the role of counsellors,
psychologists and librarians. A mixed method study was used where the quantitative
data was collected through Likert- scale and qualitative data in the form of open
ended responses and interviews. Generally, all the participants responded positively
to use the gadget for pedagogical purposes in classroom.

44
2.17 Views of lecturers and managers on the effectiveness of tablet use for
teaching in university classrooms
Research conducted to examine the perspective of faculties on deploying
tablets at the Higher Colleges of Technology (HCT) and Abu Dhabi Women’s
College (ADWC) campus in Abu Dhabi shows that the device has highly influenced
the faculties in terms of professional development. Three kinds of methods such as
1) case study interviews, 2) a faculty dispositional survey and 3) tablet lead faculty
were used for the study. A sample of 4 instructors out of 30 participated in the case
study. While 224 out of 325 faculty members participated in the survey, 19 of the
initial 30 national iChampions were used for the tablet lead faculty. The case study
was analysed using the framework of SWOT (strengths, weaknesses, opportunities
and threats). The adoption of tablets also helped to create an active student- centred
education and encouraged other technical colleges to integrate the new digital
content (Hargis, Cavanaugh, Kamali & Soto, 2014).
Furthermore, Hill et.al (2012) conducted an exploratory study to seek how
tablet assists physicians in professional practice and clinical decision making. All the
nine faculty preceptors were from St Mary’s Health Care System in Athens, Georgia.
They had received the third generation tablet for the research that was preloaded
with apps to access the medical knowledge for clinic purposes. Classroom
observation and interview were used for the data collection. Findings show that
tablets are very useful for the faculty preceptors to access patients’ information while
doing rounds. Overall, they are motivated and benefiting from the use of tablets.
Contrary to the above studies, Percival and Claydon (2015) argue that even
though tablet is a weight less tool that is portable and easier to handle, faculty
members expressed strong concerns. In order to investigate the use of tablets in the
higher education sector, the authors interviewed lecturers who had used tablets in
classrooms. Majority of them struggled to type on the keyboard as it was tiny.
Tablets cannot be connected to the projector which is another reason for their
concern. Lack of proper training and professional development which made many
academics struggle to get familiar with the gadget and they prefer to stick on to the

45
traditional approach until it becomes user-friendly with the learning and teaching
environment.
Additionally, Nguyen, Barton and Nguyen (2015) revised 20 selected full text
papers from 2011 to 2013 to investigate how tablets had been implemented in the
tertiary institution. They examined and collected peer- reviewed published articles
and scholarly journal articles in ProQuest Academic Research Library, Scopus,
EBSCOhost, Informit A+ Education and Google Scholar and piloted a content
analysis. Notwithstanding some of the benefits such as tablet supports professional
development and administration, it was not clear how well the devices should be
incorporated into the curriculum and how wisely these technologies could be
implemented and handled in higher education.
Shen (2016) conducted a research to evaluate the experiences of teacher
educators regarding tablet use in teacher education from 2013-2015. The study took
place in the School of Education in a Midwestern private university in the United
States of America. Five, four and three faculties participated in the fall semesters of
2013, 2014 and 2015 respectively. However, three faculties in the fall semester of
2015 were the same faculties who had participated in the fall semesters of 2013 and
2014. Data was collected through semi structured interview. In 2013, the researcher
conducted face to face interview and the responses were recorded and transcribed.
On the other hand, responses in 2014 and 2015 were collected through mail. During
this three year cycle, faculties who used tablets on a regular basis in lecturing had
been incorporated into the curriculum. Majority of the faculties had not used the
digital technology very often and used maximum of twice in a semester.
A survey based on quantitative study was conducted to investigate the
attitudes of administrators and educators regarding the use of tablets in classroom in
a south western state. Administrators included the principal and vice principals of
various institutions. A total of 51 administrators participated in the study. The
researcher developed two survey instruments such as pre survey and post survey
and administered to collect the data. The result showed that administrators were
impressed with the training that the lecturers received to enhance their talents and

46
knowledge on tablet use for professional duties. Administrators were also glad with
the present and future use of tablets in the classroom by the teachers and students
(Dogan & Almus, 2014).
A case study conducted by Flanagan (2016) examined the use of tablets to
provide information in connection with the process of incorporating similar
technologies and thereby investigating the effects of student learning from the
perspective of administrators. Two administrators comprising of the principal and
vice principal participated in the interview process. Findings of this qualitative study
elicited a positive response regarding the implementation of tablets in instructional
strategies.
2.18 Views of students, lecturers and managers on the advantages and
disadvantages of using tablets for learning and teaching
A study in which the viability of introducing tablet into the English curriculum
was scrutinised and the researchers found that tablets were useful to students who
had expertise in the apps. This research highlights both benefits and drawbacks.
Even though, students reported about the slow speed in Wi-Fi connectivity, they
managed to collaborate and engage with their classmates to understand the
concepts and complete the tasks (Brown, Castellano, Hughes, & Worth, 2012).
A case study was conducted at Indiana University – Purdue University
Indianapolis (IUPUI) to examine students’ impressions of mobile technology,
particularly tablets in the classroom. The results showed that tablets provided a
collaborative learning environment that included debates, developing knowledge,
discussing ideas together, participating in classroom activities and thereby having a
greater interaction between each other (Rossing, et al., 2012). Likewise, findings of
the tablet study conducted at Pepperdine University by Weider (2011) revealed that
tablets enhanced the collaboration between student and lecturer in terms of sharing
tablet screen images while solving Calculus problems in Mathematics.
Additionally, research done by Pegrum, Howitt and Striepe (2013)
investigated the existing academic uses of handheld devices in tertiary institution

47
and the views of pre-service teachers in tablet use on their learning about teaching.
Semi structured interview, non-participant observation and focus group interview
were the three types of data collection methods used for the study. Eight pre-service
teachers in the faculty of education at the University of Western Australia were used
for the study. The findings reported that tablet use facilitated them to study a new
way of learning and enhanced their understanding of the pedagogy, content and
helped to stay connected and organized.
A pilot study was conducted at Loyola Marymount University, USA with 30
faculty participants to examine potential pedagogical uses of tablet. The researchers
Yeung and Chung (2011) discussed about the benefits and challenges of using
tablet as well. This study is one of the first tablet Exploration Projects (iPEP) that is
cross disciplined and collaborative enough to encourage the faculty to check the
effectiveness of using tablet in education sector. Qualitative analysis was performed
to code all the data in a software called Nvivo 9. The Faculty responded that tablet
was very useful in terms of accessing the library resources and course resources
very quickly. Tablet also helped the lecturers to communicate with students instantly.
Some of the challenges they have confronted were related to apps where either
preferred apps were not available or it was too expensive to purchase.
In recent times, a large study was conducted in seven vocational college
campuses to investigate the perception of both faculty and students on the
productivity of using tablet in classrooms. About 51 faculties from various programs
such as criminal justice, dental hygiene, medical billing and coding, medical
assisting, pharmacy technology and dental assisting participated in the survey. The
population of the faculties from all the campuses of the various programs were 130.
As the design was mixed-method, both quantitative and qualitative methods had
been used to collect the data. Findings of this study showed that the perception of
faculties and students were not identical. While faculties indicated that their
experience of using tablet in classroom was challenging, students believed that
tablets had helped them to have a high engagement in the classroom. However,
qualitative result showed that both faculties and students believed tablets caused
distraction in learning environment (Reed, 2017).

48
Bennett (2014) conducted a qualitative study in a small Midwestern town that
began a 1:1 tablet initiative. The purpose of the study was to determine the
perceptions of administrators and directors to evaluate the effectiveness of tablet
integration into curriculum and instruction. A focus group was used with three
administrators and two technology and curriculum directors were interviewed to
collect the data. Bennett (2014, p.8) states, “Whether or not technology should be
used in the classroom is no longer debated; instead, the emphasis is ensuring that
technology is integrated into instruction to promote student achievement and future
success”. She found that an institution considered as technologically-rich needed to
improve the integration of technology and instruction for all educators and students.
Furthermore, having technology is not enough, educators and students must be
properly trained with good technology practices for it to be optimized as an
educational tool.
A pilot study conducted in Massachusetts reported positively on the use of
tablets in classrooms. Neither the method nor the number of tablets provided to the
students was mentioned in the research. From the perception of the head of the
institution, the result showed that educators in the experimental study reported
extremely well regarding the implementation of touch gadget and this prompted the
higher officials to provide 1:1 tablets to students (Taborn, 2011).
2.19 Theoretical Framework
Many authors namely Tapscott (2008), Hammer, et al. (2010), Werth and
Werth (2011), Geist (2011), Franklin (2011), Menkhoff and Bengtsson (2012),
Alexander (2014), Ally and Blazquez-Prieto (2014) and Brown (2015) debated about
the young new students in the universities who liked to be entertained by the Wi-Fi
facility, video games and computer technology. These authors named these new
generation students as “Gen Y Learners” (Menkhoff & Bengtsson, 2012),
“Millennials” (Werth & Werth, 2011), “Net-Geners” (Tapscott, 2008) and “Digital
Natives” (Prensky, 2001a; 2001b; 2005; 2010). Constructivism and TPACK were the
two theoretical frameworks that guided this study. Both frameworks were suitable in
this literature to analyse the effects of integrating tablet technology into learning and

49
teaching. These theories together provided the theoretical underpinnings of the
literature related to this study’s sub-research questions. A deep look at each
theoretical framework provides better understanding of the following literature.
2.19.1 Constructivism
The constructivist form of approach converts the teaching from teacher-
centred approach to student-centred approach. The main belief of Constructivism
framework is that students develop their knowledge by themselves through different
ways. This theory advocates the concept that each student creates different sense
and skills as they learn. “Constructivism means that learning involves constructing,
creating, inventing and developing one’s own knowledge and meaning” (Liu & Chen,
2010, p.65). Liu and Chen (2010) state that the teacher will act as a facilitator to
pass the information and arrange the various activities for the students to learn
themselves.
2.19.1.1 History of Constructivism
The Constructivism framework was developed by Dewey (1933), Vygotsky
(1978), Bruner (1963) and Piaget (1963). Liu and Chen (2010) suggest that there
should be a relationship between students learning and their living environment.
In Constructivism framework, students’ learning includes communication,
teamwork and real world situations through which they develop new knowledge by
themselves. Piaget “thought that human’s cognitive structure should construct from
the interaction with the environment gradually and the human’s cognitive structure
develop by the internal and external cause” (Zhang & Kou, 2012, p. 2294).
Dewey (1897) suggests that the interest and experience of the students are
the most important events that will help them to learn in a better way. Lutz and Huitt
(2004) articulate that according to Dewey (1897), people should interact and
collaborate with real situations in order to construct the knowledge. Experience of
each individual offers “foundation for the development of the necessary attributes for
successful living” (Lutz & Huitt, 2004, p.2).

50
2.19.1.2 Significance of Constructivism
Kopelman and De Ville (2001) concur that Dewey’s philosophy has provided a
positive impact on education internationally such as obtaining skills to solve
problems, communicating with small groups, group discussions and acclimatising the
new data into the curriculum programme. Liu and Chen (2010) posit that many
institutions have incorporated the theory of constructivism into their education
programme as they observed that students develop their knowledge by themselves
and teachers being the facilitator.
2.19.1.3 Constructivism in IT courses
Constructivism has been widely explored in the field of education, in
mathematics (Davis, Maher & Noddings, 1990; Coetzee, 2017) and science (Glynn,
Yeany & Britton, 1991) where “radical constructivism represents the state of the art
in epistemological theories for mathematics and science education” (Ernest, 1995, p.
475). Conversely, studies related to Information Technology and Computer Science
education are still in its infancy (Ben-Ari, 1998).
2.19.1.4 Implications of Constructivism to education
Abdulwahed, Jaworski and Crawford (2012) aver that constructivism is a
theory of learning and it is not considered as a pedagogy. However, pedagogy is
highly influenced by constructivism and thus it has implications on teaching.
McCarthy (2016, p.13) concurs with the observation of Fosnot and Dolk (2005,
p.175) and Vygotsky (1978) that learning is closely associated with teaching and
thus it should be integrated into the frameworks of learning and teaching.
Furthermore, they state that teaching will not happen without learning. This clearly
shows that learning and teaching are directly proportional to each other. Hence, it
proves that students’ learning can be improved if the instructional practices are
enhanced (McCarthy, 2016). Cometto (2008) supports learning through facilitation
rather than learning through lecturing and the comparison between these two
approaches is shown below.
The following table shows the comparison between learning through a lecturer
and learning through a facilitator.
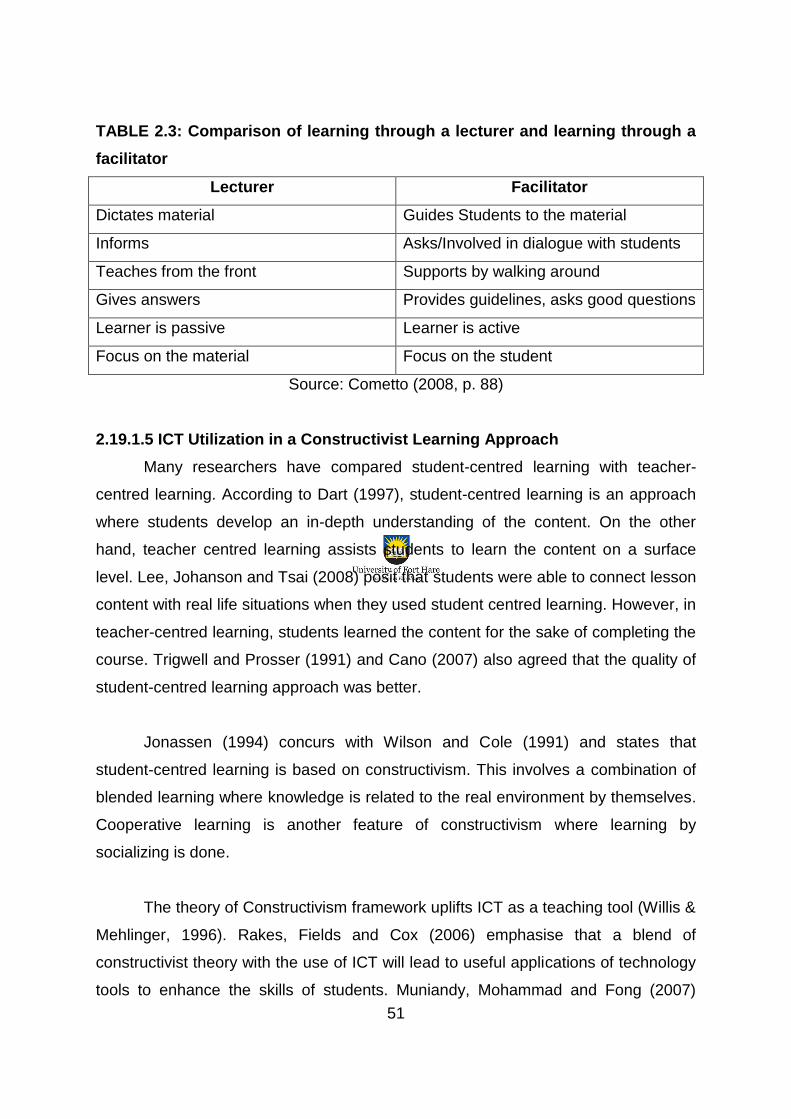
51
TABLE 2.3: Comparison of learning through a lecturer and learning through a
facilitator
Lecturer Facilitator
Dictates material Guides Students to the material
Informs Asks/Involved in dialogue with students
Teaches from the front Supports by walking around
Gives answers Provides guidelines, asks good questions
Learner is passive Learner is active
Focus on the material Focus on the student
Source: Cometto (2008, p. 88)
2.19.1.5 ICT Utilization in a Constructivist Learning Approach
Many researchers have compared student-centred learning with teacher-
centred learning. According to Dart (1997), student-centred learning is an approach
where students develop an in-depth understanding of the content. On the other
hand, teacher centred learning assists students to learn the content on a surface
level. Lee, Johanson and Tsai (2008) posit that students were able to connect lesson
content with real life situations when they used student centred learning. However, in
teacher-centred learning, students learned the content for the sake of completing the
course. Trigwell and Prosser (1991) and Cano (2007) also agreed that the quality of
student-centred learning approach was better.
Jonassen (1994) concurs with Wilson and Cole (1991) and states that
student-centred learning is based on constructivism. This involves a combination of
blended learning where knowledge is related to the real environment by themselves.
Cooperative learning is another feature of constructivism where learning by
socializing is done.
The theory of Constructivism framework uplifts ICT as a teaching tool (Willis &
Mehlinger, 1996). Rakes, Fields and Cox (2006) emphasise that a blend of
constructivist theory with the use of ICT will lead to useful applications of technology
tools to enhance the skills of students. Muniandy, Mohammad and Fong (2007)

52
argue that ICT and learning theory should not be separated as these two aspects
must be combined together always in order to produce an effective learning
atmosphere in classroom. Hence, it is significant for teachers to enhance their skills
of TPACK to understand how technology is associated with pedagogy and content
(Mishra & Koehler, 2006). TPACK emphasises that an academic must have the
knowledge to use ICT for teaching the subject content in a better pedagogical
approach for quality teaching. The following section provides a detailed elucidation
on TPACK which is the second framework used for this study.
2.19.2 Technological Pedagogical Content Knowledge (TPACK) framework
This study used a framework for the integration of technology into teacher
knowledge called Technological Pedagogical and Content Knowledge (TPACK).
TPACK was first proposed by Koehler and Mishra in 2006. They have derived
TPACK framework from Shulman’s (1986) work on the knowledge of teachers for
teaching using ICT. After the development of TPACK, many researchers such as
Koehler and Mishra (2009), Harris, Mishra and Koehler (2009), Schmidt, Cogan and
Houang (2011), Chai, Koh, Tsai and Tan (2011), Lin, Tsai, Chai and Lee (2013)
have used this framework to integrate ICT in schools. Shumlan’s (1986) work was
reformed by Koehler and Mishra (2009) to emphasise that TPACK centres around
technology, pedagogy and content and the association between them. Comparing
with Shulman’s framework, Koehler and Mishra (2009) posit that in TPACK, the
educators need an additional knowledge in order to teach courses well using
technology which can be considered as an extension from Shulman’s framework.
Koehler and Mishra (2009) concur that the use of Technology in education
stimulates the inferences concerning pedagogy and content. Jang (2010) argues that
teachers need to update themselves with cognizance of relation between the
knowledge of pedagogy and content along with technology in order to mould the
students of the 21st century. Although the mode of teaching with technology is
critical, it benefits in implementing the content and PK of the educator in classroom
using technology. Technology is a part of pedagogical and content knowledge
(Koehler & Mishra, 2009). TPACK model removes the complexity in each component
namely technology, content and pedagogy and the intersection of these three basic

53
components that enables each situation in a classroom to be a unique interaction
(Koehler & Mishra, 2009). They further added that it is very vital for an educator to
interrelate these components with contextual parameters along with the articulacy
and cognitive flexibility of each component to develop effective solutions.
The integration of a new technology such as tablet into education sectors
challenges the educators to assimilate all the basic components of knowledge.
Koehler and Mishra (2006) assert that educators must know how effectively and
efficiently technology can be incorporated into pedagogy and content. TPACK is a
framework which can be used by the educators to integrate technology to enhance
the level of learning and teaching. Jang and Tsai (2012) corroborate that
effectiveness and efficiency of teaching can be maximised by teachers using the
model called TPACK.
There are totally six types of knowledge components in TPACK to describe
knowledge. They are Technological knowledge (TK), Pedagogical knowledge (PK),
Content knowledge (CK), Technology Pedagogy knowledge (TPK), Technology
Content knowledge (TCK) and Pedagogy Content knowledge (PCK). These
knowledge components and their relationship between each components makes the
framework TPACK. The Venn diagram of TPACK is shown below.

54
Fig 2.1: TPACK FRAMEWORK
Source: http://tpack.org
The above diagram has three circles for TK, PK and CK. The intersecting
portion of all the circles represents TPACK which is in the middle signifying the
synthesis of all different knowledge components.
The researcher of this study used the framework of TPACK to measure the
tablet use of lecturers during teaching practice in university classrooms in terms of
the different knowledge components. This enables the researcher to make sense of
how they integrate these components during the stage of instruction. The TPACK
framework was an indispensable model in structuring the quantitative and qualitative
method of lecturers for this research study. TPACK was investigated through the
execution of closed-ended questionnaire and interview revolving around how the
tablet computers were beneficial and unfavourable for teaching in university
classrooms. Harris, Mishra and Koehler (2009) aver that TPACK is a holistic
framework that contains all parts of knowledge and these parts mixed up together
and developed one domain of knowledge.

55
2.19.2.1 Technological knowledge (TK)
TK is the main domain knowledge in TPACK framework. This knowledge
component was included to define TPACK from Shulman’s (1986) PCK model. Chai,
Koh and Tsai (2013, p.33) define TK as “Knowledge about how to use ICT hardware
and software and associated peripherals”. Harris, Mishra and Koehler (2009) and
Koehler, Mishra and Cain (2013) articulated that TK was hard to describe as there
were many possibilities to become outmoded. National Research Council (1999)
claimed that Fluency of Information Technology (FITness) required people to
understand Information Technology (IT) largely to implement it at work as IT could
assist in achieving the objective and updating themselves with the new knowledge.
Knowledge about “certain ways of thinking about and working with technology can
apply to all technology tools and resources” (Koehler, Mishra & Cain, 2013, p.15).
Hence, the above statement balances with the use of IT products such as tablet
computer for learning and teaching in a working environment. Mouza, et al. (2014)
postulate that it is necessary for a teacher to have basic skills for using technology
tools and practical application of technical skills in order to engage students with ICT
which is considered as TK.
TK discusses about the knowledge of different tools that ranges from pencil
and paper to digital technologies such as interactive whiteboards, digital video,
internet and software programs (Schmidt, et al., 2009). Delivering a lesson using IT
tools such as the use of Microsoft word, PowerPoint presentations and mailing
learning materials to the students and lecturers, presenting information in Excel
spreadsheet to a class are all considered as example of TK. The more chances
lecturers get to use IT tools such as tablet computers, the more they acquire TK. The
lecturers who have high level of TK will always update themselves with the latest
change in the ICT market. Each lecturer will decide which application and what
feature of tablet computer to use for each session. Lecturers can become more
competent, learn deeper and acquire more TK if they use tablet computers in
maximum number of classes for teaching. Hence, utilizing the opportunity of tablet
computer for instructional purpose will enhance the skills of TK and make them self-
reliant and competent lecturers.

56
2.19.2.2 Pedagogical knowledge (PK)
Koehler, Mishra and Cain (2013, pp. 397) viewed about PK as:
teachers’ deep knowledge about the processes and practices of teaching and learning, encompassing educational purposes, goals, values, strategies, and more. PK is a generic form of knowledge that applies to student learning, classroom management, instructional planning and implementation, and student assessment. It includes knowledge about techniques or methods used in the classroom, the nature of the learners' needs and preferences, and strategies for assessing student understanding.
In this study, lecturers should acquire various skills in teaching under different
circumstances such as project based learning in teaching, problem based learning in
teaching, micro teaching and experimental teaching.
2.19.2.3 Content knowledge (CK)
CK is one of the domain knowledges in TPACK framework. Koehler, Mishra
and Cain (2013) assert CK as a knowledge about the subject content that is to be
taught or learned. A concrete foundation of subject knowledge is an essential for a
teacher. Schmidt, et al. (2009) articulate that teachers are the people who must
know the contents in the course that they are going to teach and how the nature of
discipline distinguishes for each subject area. CK is significant as it determines the
particular modes of thinking unique to each field (Koehler, Mishra, Akcaoglu &
Rosenberg, 2013).
As far as this study is concerned, ICT and EE lecturers must be qualified and
must have deep knowledge on their subject matter and central theories. They must
also have a clear view on what they are going to lecture. In order to teach and
assess students’ learning effectively, academics should be experts in subject matter
(Department of Basic Education, 2011).
Shulman (1986) posits that future teachers need to understand and connect
CK with other domains in TPACK such as Technology Content Knowledge (TCK)
and Pedagogical Content Knowledge (PCK) in order to be competent in CK.

57
2.19.2.4 Technology Content knowledge (TCK)
According to Koehler, Mishra and Cain (2013) TCK is a knowledge of how
technology can influence the subject content by changing the way it is offered for the
purpose of teaching. It also helps teachers to change the way students learn and
understand each topic (Schmidt, et al., 2009; Koehler, Mishra & Cain, 2013).
In this study, TCK represents a relationship between tablet technology, ICT
and EE subjects’ areas. Lecturers must know how educational apps can enhance
the subject content to the best level and be capable of presenting the contents to
students in a highly effective manner. Lecturers can record a video of EE or ICT
practical and play it to students to help them to understand the content more
effectively.
2.19.2.5 Pedagogical content knowledge (PCK)
Friedrichsen, et al. (2009) advocate that learning opportunities for students
might be limited and this may also discourage students from productive learning
unless teachers merge CK with pedagogy. Shulman (1986) concurs in his
observation in addition to the general knowledge of pedagogies, a teacher should
also blend pedagogies with content for the purpose of teaching.
Tablets are one of the technologies in ICTs that the lecturers need to explore
in order to be competent in CK. A lecture video that is recorded by using tablet or a
soft copy handout can be re-enforced by students as many number of times as
possible by being in their own convenient place and time.
2.19.2.6 Technological Pedagogical Knowledge (TPK)
Schmidt, et al. (2009, p.125) enunciate that TPK refers to the “knowledge of
how various technologies can be used in teaching, and to understanding that using
technology may change the way teachers teach”.
Tablets offer individual learning and collaborative learning among students.
Lecturers can avoid face to face meetings and use Google Docs for collaborative
activities over the distance. The facility of online learning through tablets helps

58
lecturers to explore new pedagogical approaches in teaching. Tablets also have the
provision for simulated learning, automated assessment as well as synchronous and
asynchronous way of learning (Rafiki, 2015). As such, this makes a change in the
way the lecturer delivers the instruction in the classroom. Lecturers should have the
knowledge on the pedagogical shifts that will take place if these approaches are
used to teach EE and ICT subjects. TPK gives lecturers the potential to explore
when they have opportunities to practise teaching under various situations. Lecturers
must be able to understand the benefits and drawbacks of using tablets when
preparing and developing study materials for different students. A capable lecturer
would be able to use tablets effectively to teach a particular section of the content.
2.19.2.7 Significance of TPACK study
TPACK is a theoretical framework model which is used in this study to
investigate the different components of teaching in ICT and EE using tablets in
university. There are many researches that have been conducted in the previous
years on the integration and the use of ICT for learning and teaching by using
TPACK as the framework. Many researchers around the globe have used TPACK
survey instrument to examine the integration of technology.
2.19.2.8 TPACK studies in terms of respondents and subject specific studies
This study engages with the current discussions about the interpretation and
implementation of TPACK in higher education sectors. Wu (2013) avers that 54.2%
of the recent studies and publication based on TPACK from 2000 to 2011 is
focussed on pre-service teachers. For the purpose of narrowing down this research,
the researcher of this study focussed more on similar researches published since
2013 where TPACK was used to evaluate the elements of teaching. The following
table shows the framework of TPACK used by different researchers centring on pre-
service teachers in subject specific studies.

59
TABLE 2.4: Some of the studies done since 2013 using TPACK as framework
focussing on pre-service teachers in subject specific studies
AUTHOR/
DATE
PURPOSE RESPONDENTS COURSE RESULT
Haydn, T.,
2014
The study
examines the
different
approaches of
preservice
teachers used
in
development
programmes to
teach their
subject using
ICTs with the
help of
TPACK.
pre-service
teachers
Science and
English
The result shows
that there is a
need for subject
specificity in the
use of ICTs.
Zelkowski,
J.,
Gleason,
J., Cox,
D.C. &
Bismarck,
S., 2013
The aim of the
paper was to
investigate the
views of pre-
service
teachers in
teaching
mathematics
using ICTs
with the help of
TPACK.
pre-service
teachers
Mathematics
The study
concludes that
the knowledges
such as
technological,
pedagogical, and
content
knowledge;
technology
knowledge;
content
knowledge and
pedagogical
knowledge are

60
valid and
reliable, whereas
pedagogical
content
knowledge,
technological
content
knowledge and
technological
pedagogical
knowledge
remain hard for
preservice
teachers to
separate and
self-report.
Doyle, H. &
Reading,
C., 2013
This study was
aimed to
enhance pre-
service
teacher’s
ability to
incorporate the
effective use of
ICT into the
new Australian
Curriculum
using TPACK
framework.
Pre service
teachers
science Findings indicate
that the
transformation
play can enable
the objectives of
learning and
teaching
Lin, T.C,
Tsai, C.C,
Chai, C.S.
The aim of the
study was to
explore the
pre- and in-
service teachers
in Singapore
Science
The results
confirm that pre
and in service

61
& Lee, M.H.
2013
perceptions of
TPACK on the
use of
technology in
teaching
practice.
science teacher
consider
Technology
pedagogy and
content (TPC) as
a factor that can
be positively
linked with the
remaining
TPACK factors.
Öz, H.,
2015.
The purpose of
the study was
to examine pre
service English
teachers views
on the TPACK
development.
This study also
presents the
strengths and
weaknesses of
preparation
and practice of
pre service
English
teachers in
Turkey.
pre-service
teachers
English
The results
suggest
incorporation of
TPACK into the
current teacher
education
programme will
contribute to
quality learning
and teaching.
Öz (2015) concurs that much of the studies conducted in worldwide focus on
the level of TPACK on any particular course. Hechter and Vermette (2013), Doyle
and Reading (2013), Lin, Tsai, Chai and Lee (2013) examined in-service or pre-
service science teachers in the learning of theory (science) course during a teacher
education programme using TPACK instrument. The aforementioned studies also

62
focus on the pre-service teachers in subject specific studies. However, the current
study is not focusing on pre-service teachers but on university lecturers on the major
courses of ICT and EE. Therefore, the current study is different from all the previous
studies and also unique in terms of respondents and subject specific studies.
2.19.2.9 TPACK in Universities
Wu (2013) argues that hardly 8% of the TPACK studies have examined on
the integration and the use of ICT for the different ways of teaching practice in
universities. Rienties, Brouwer and Lygo-Baker (2013) articulate that researches on
the developmental programmes of teaching practice aiming on technology
implementation using TPACK instrument are inadequate. Following are a few
researches that have been done since 2015 regarding the lecturer’s use of
technology practice in different subject streams in universities around the world using
TPACK as a framework.
TABLE 2.5: Some of the studies done since 2015 using TPACK as framework
regarding the use of technology by the lecturers around the world
AUTHOR/
DATE
PURPOSE RESPONDEN
TS
INSTITUTION METHOD CONCLUSION
Reyes,
Reading,
Doyle &
Gregory,
2017
The
purpose of
the study
was to
explore the
perception
s of
university
lecturers
on the
pedagogic
al
practices
Education
Lecturers
Australian
Regional
University
Mixed
method
Approximately
66% of the
lecturers
indicate that
there is a
serious gap in
the pedagogy,
content and
technology in
connection
with the
integration of
ICT in

63
of teacher
education
using ICT
by
examining
TPACK.
university for
the teaching
purposes.
Wu, Hu,
Gu & Lim,
2015
The aim of
the paper
was to
examine
ICT
profession
al
developme
nt of
Higher
education
(HE)
lecturers.
Higher
education (HE)
Lecturers
Higher
education
institution in
China
Quantitati
ve using
online
surveys
The study
revealed a
positive impact
on the HE
lecturers, their
use of ICT and
level of
TPACK.
Chukwue
meka &
Iscioglu,
2016
The study
explores
the TPACK
perception
s of
lecturers
experience
at the
Faculty of
Education
towards
the use of
ICT.
Education
Lecturers
Eastern
Mediterranean
University
Quantitati
ve
The results of
this study
show that
lecturers have
a massive
knowledge on
all levels of
TPACK.

64
Pattinasar
any &
Juwono,
2016.
The aim of
the paper
was to
examine
and
analyse
the
lecturer’s
use of e-
Learning
using the
framework
TPACK
and how
they are
implement
ed to bring
about
active e-
learning.
Social
Sciences and
Humanities
Studies major
lecturer
Higher
education
institution in
Indonesia
Qualitativ
e
The study
concludes with
the result that
lecturers need
to have
knowledge in
technology,
pedagogy and
content to
model an
effective
blended
learning that
includes both
face to face
teaching and
e-learning.
2.19.2.10 TPACK in ICT
Zhang and Martinovic (2008) assert that there is no particular definition for
ICT as they develop every day. Khan, Hasan and Clement (2012) define ICT as a
broad range of computing devices that includes computer hardware, computer
software, super computers, calculators and telecommunication facilities. It also
comprises of all kinds of networks to connect between computer and people, all
varieties of projection and display devices, cameras, smart phones, tablets, iPads,
video games, CDs and DVDs. All of the aforementioned researches on TPACK use
ICT as a common factor for the technology in education. ICT is a broad area that
includes many computer related aspects. Shankar (2008, p. 50) states ICT as a
“broad terminology referring to multiple communication technologies which range
from simple and complex namely mobile phone applications (SMS), Digital Cameras,

65
Internet, Wireless (Wi-Fi and WiMAN), VOIP,GPS, GIS, Convergence, Digital radio”.
In this study, the researcher is not focussing on a broader technology such as ICT
but emphasising only tablet technology.
2.19.2.11 TPACK in South Africa
Leendertz, et al. (2013) assert that TPACK instrument has been used in
South Africa only for examining the TPACK level of mathematics in-service teachers
in grade 8. Leendertz, et al. (2013) argue that researches using TPACK are still
inadequate in a developing country like South Africa. Rafiki (2015) and Schuler
(2012) concur that researches and publications in the South African context on the
use of tablets in classroom are inadequate. Poore (2015) advocates that the
empirical studies on the tablet teaching practice is limited due to the latest
technology. Since 2016, merely a few researches using TPACK framework have
been conducted in South Africa. For example the study conducted by Thuthukile
(2016) aims to investigate the capability of pre-service teachers in teaching science
using ICTs with the help of TPACK framework. Another study conducted by Coetzee
(2017) explores the level of TPACK of mathematics teachers and how the elements
of TPACK improves the teaching of mathematics in grade 8. Consequently, the
current research is completely different from all these previous researches. The main
aspect of this research focuses on the use of tablets by the lecturers for the purpose
of teaching and students for learning in university classrooms. The present research
which is particularly based on the tablet use in a higher education institution using
TPACK framework is highly scarce in South Africa which makes the current study a
highly distinctive research. Furthermore, the mixed method used for this research
exploring the level of TPACK for IT and EE courses makes this study a unique
endeavour and differentiates much more with all previous researches.
2.20 Summary
Technology is not a solution for all the educational problems (Torkelson,
1972; Dede, 1989; LeFevre, 2004). “Computers alone don’t make the difference.
Computers have to be in the right hands and use in the right ways” (LeFevre, 2004,
p. 81). Fox (2009, p. 26) points out that the benefits of technology in learning is
“more than just the distribution of machines, but creates a technology-rich learning

66
environment that is supported by ongoing professional development, technology
coaches, high-quality curriculum, sufficient broadband access and administrative
leadership”. Richardson (2013, p. 12) argues that “it is not about tools. It is not about
layering expensive technology on top of the traditional curriculum. Instead, it is about
addressing the new needs of modern learners in entirely new ways”. Apple
Classrooms of Tomorrow-Today (Apple, 2008) highlights that students in this
generation are not like those in earlier days. “Not surprisingly, students today expect
to learn in an environment that mirrors their lives and their futures” (Apple, 2008, p.
19).
This chapter reviewed the literature related to the research questions. The
literature reviewed provided a summary on the use of tablets by the students and
academics in the classroom as the device can be used for learning, teaching,
engagement and collaboration between each other in the most modern way. It
reviewed the perception of managers on the use of tablets by the lecturers and
students. The literature also discussed the benefits of tablets and other mobile
technologies. The section of drawbacks focussed deeply on areas such as the off-
task use of technology in university classrooms, challenges in adopting technology
for technology’s sake, upgrade of internet infrastructure and drawbacks of using
tablets when compared with laptops. This chapter provided relevant information
about the use of mobile technologies particularly tablets in higher education. The
reviewed researches exposed the paradigm shift in the style of learning and teaching
and how often students use this technology. As technology is changing globally,
tertiary institutions need to use these tools to motivate and enhance the skills of
students to a level that is required in the current market.
Various methods were used to collect the data such as survey tools,
interviews and observations for much of the researches and the results showed that
technology had powerfully influenced the current higher education sector.
Nevertheless, academics are in a panic situation as the management are adopting a
bulk number of tablets for each individual without having a proper research and
training on how to use the device in classroom (Attard & Northcote, 2011).

67
The outcomes of the researches established that tablet computers had the
potential to revolutionize the higher education system. The significance of integrating
tablets into universities and its impact on students and educators had been highly
described in each study and the results of each research varied. There is a lack of
empirical research on the strengths and weaknesses of using tablets in South
African context. As such, the need for additional research demands. Hence this
study seeks to understand the aforementioned in learning and teaching in higher
education sector. This chapter also described the theoretical frameworks such as
Constructivism and TPACK that the study was based on.
In Chapter Three, a review of research methodology will be described along
with the information that includes research paradigm, approach, design, population
and sample, instruments, validity and reliability, data collection procedures for
quantitative and qualitative data.

68
CHAPTER THREE
RESEARCH METHODOLOGY
3.1 Introduction
The previous chapter reviewed the literature on the uses of tablets in colleges
and Universities. In this chapter, the researcher describes the research methodology
that was employed in this study and how the research process was elucidated. The
researcher defines and justifies the methods that were adopted to conduct a case
study that examined the views of students, lecturers and managers on using tablets
for learning and teaching in a university classroom. According to Merriam, a case
study involves “an examination of a specific phenomenon such as a program, a
process, an institution, or a social group” (Merriam, 1988, p.9). This research
methodology begins by describing the research paradigm, research approach,
research design, population, sample, data collection instruments, data collection
procedures, data trustworthiness and ethical compliance. The chapter ends with a
brief section to summarise the overall items in research methodology and a link to
the next chapter. In the next section, the chapter focuses on the paradigm which is
used for this study.
3.2 Research Paradigm
A research paradigm discusses about the ideologies behind the research
process and it should meet the purpose or knowledge on interest of the research (De
Vos, et al., 1998). Saunders, Thornhill and Lewis (2003) state that values and
assumptions are the main factors that a research paradigm is composed of and the
foundations for a research. These factors serve as a bench mark for the scholar to
interpret the data and reach the final goal.
Bearing the aforementioned outlook in mind, the researcher had found that
the most appropriate paradigm to plot the complex territory of this research is post-
positivist paradigm. The reason for choosing this paradigm emerged from the central
knowledge of the study that was to explore, determine and understand the strengths
and weaknesses of students’ and lecturers use of tablets in learning and teaching

69
respectively in a university. This research also sought to explore and understand the
perspectives of higher managers on the use of tablets by the lecturers and students
for the development of higher education. The three aspects of this study mentioned
above demanded a post-positivist paradigm.
Creswell (2003) defines post-positivist paradigm as thinking after positivism.
Post-positivist paradigm includes the features of both quantitative (positivist) and
qualitative (interpretivist) approaches (Saunders, Thornhill & Lewis, 2003; Glicken,
2003; Brown & Schulze, 2007; De Wet, 2007). This helps the researchers in this
paradigm to have numerous perspectives from participants instead of a single reality
(Creswell, 2007). This paradigm uses various methods, different views and multiple
procedures of data collection and analysis (Richie & Rigano, 2001; Ajibade, 2016).
The researcher employed different instruments such as closed ended questionnaire
and interview during the course of this study for a deep understanding of the
integration of tablets in university classrooms. This attitude was supported by
Trochim (2006) due to its significance of different observations to find multiple faults
which helps to achieve the best objectivity. Therefore, triangulation was adopted in
this study to find the concrete meaning of what was happening practically. The next
section explores the research approach that the study was adopted.
3.3 Research Approach
Research approach is an approach that is essential and it is based on the
purpose of the study (Jankowicz, 2000; Maylor & Blackmon, 2005). Creswell (2014,
p.3) defines research approach as “the plans and procedures that span the steps for
research from broad assumptions to detailed methods of data collection, analysis,
and interpretation”. The research approach and problem of the study are correlated
to each other. Therefore, the selection of research approach depends on the
respondents of the study, personal experience of researcher, nature of the issue that
is being addressed (Creswell, 2008a) and responses to the following three questions
that are sought by the researcher (Creswell, 2003, p.5).
a. “What knowledge claims are being made by the researcher (including
theoretical perspective)?”
b. “What strategies of inquiry will inform the procedures?”

70
c. “What methods of data collection and analysis will be used?”
There are different ways to approach a research. They are quantitative
approach, qualitative approach and mixed method approach (Creswell, 2009). A
mixed method approach was used for this study which included strategies from both
qualitative and quantitative approaches. The description of each of the approaches
have been shown below.
3.3.1 Quantitative Research
File, Mueller, Wesneski and Stremmel (2017, p. 13) define quantitative
research approach as "means for testing objective theories by examining the
relationship among variables. These variables, in turn, can be measured through
instruments so that numbered data can be analysed using statistical procedures". As
a result, the research will have a set of norms that includes introduction, review of
literature, research methodology, findings and discussion (Creswell, 2008b). In
quantitative approach, all parts of the research process such as expectations about
testing theories, protection against preferences, controlling for alternative
explanations, and being able to generalize and reproduce the outcomes will be fixed
by the researcher before the commencement of data collection (Kumar, 2005).
The advantage of using quantitative research approach is that statistical
analysis in this approach helps to arrange the data, define the association and detect
the differences and similarities between different groups of data (Hopkins, 2008;
McMillan & Schumacher, 2010). The sample of the participants were recorded to
have a clear picture of descriptive nature that was attained from the items of
quantitative questionnaire. Subsequently, a wide range of data collected through
various instruments should provide features of precise situations, individuals or
groups and conclude in a whole depiction of the variable studied groups (Hopkins,
2008; McMillan & Schumacher, 2010).
The disadvantage of using quantitative approach is that it is not good to view
individual cases in detail and its structure stops from unanticipated results. This

71
approach is also criticized for its inability to provide exact outcome, explanation or
examples (Ryan, 2006).
3.3.2 Qualitative Research
In Qualitative approach, researchers collect descriptive data deeply with an
aim of understanding and developing a particular phenomenon (Cooper & Schindler,
2006; Creswell, et al., 2010). Qualitative research is a type of research approach in
which people who have experience in a phenomenon of interest, develop several
realities. This is a relativist and constructivist ontology research approach that does
not have any objective reality (Krauss, 2005). Qualitative researchers concentrate on
the perceptions of respondents on how they observe the world and the environment
and how they interact with one another (Creswell, et al., 2010). Creswell (2007)
describes this approach as one to be used to explore the understanding of
individuals or a group of people to find a social problem. As this approach is
subjective in nature, the researchers are more interested in realising the behaviour of
people in deep and the cause of such behaviours (Sekaran & Bougie, 2010;
Creswell, et al., 2010).
Moreover, qualitative approach generally uses open ended data with the
major intention of creating themes from the data. Sample in qualitative approach is
small but focused compared to quantitative approach (Hossain, 2011) and results
obtained from this approach are not generalizable in most cases (Creswell, 2003;
Cooper & Schindler, 2006). In line with the above statement, Hossain (2011)
emphasises that qualitative researchers scrutinise not only “what‟, “where‟, and
“when‟ questions but also “why‟ and “how‟ questions to establish the meaning of the
phenomenon under study. Narratives, phenomenologies, ethnographies, grounded
theory studies or case studies are some of the strategies that are used by qualitative
approach (Creswell, 2003). In Kumar’s (2005) point of view, qualitative
methodological approach is likely a shapeless but changeable aspects in response
to the events it take place. This is a time consuming approach for the data collection
and analysis when it is compared with quantitative approach (Dahlberg & McCaig,
2010).

72
3.3.3 Mixed Method Research
Authors such as Ridenour and Newman (2008), Leech and Onwuegbuzie
(2009), Tashakkori and Teddlie, (2009) and Nastasi, Hitchcock and Brown (2010)
indicate that there are multiple reasons for combining qualitative and quantitative
research methods. Nastasi, Hitchcock and Brown (2010) define mixed method
approach as the mixture of qualitative and quantitative methodologies during the
collection of data and analysis. Creswell (2009, p. 4) defines mixed method as “an
approach to inquiry that combines or associates both qualitative and quantitative
forms". Research skills are necessary for a research to collect quantitative and
qualitative research data to integrate and link the data (Creswell, 2009). Polit (2010),
Creswell (2003), Wilkins and Woodgate (2008) describe mixed method approach as
the mixture of both quantitative and qualitative approach where quantitative methods
comprise of collection, analysis and interpretation of data numerically and qualitative
methods include the collection, analysis and interpretation of data narratively. A
researcher or a group of researchers use the features of both quantitative and
qualitative components to sight the collaboration and broad understanding of the
world (Johnson, Onwuegbuzie & Turner, 2007). Consequently, a mixed method
researcher need to be cautioned that the approach calls for extensive data collection
as it is time–intensive to analyse both numerical and textual data (Creswell, 2003).
In this study, this research was focused on acquiring information regarding the
implementation of tablet programmes for learning and teaching in university
classrooms. To best understand this phenomenon, the researcher sought
information from respondents, namely: students, lecturers and higher managers in a
selected university in the Eastern Cape Province of South Africa. Using only
quantitative method was inadequate to address all the sub-research questions in this
study. Consequently, qualitative method was used for validating quantitative analysis
to sight broadly the space of pragmatic functions of vague language. The researcher
used both quantitative and qualitative research approach to deliver a detailed idea
about the vague language of tablet use in university classroom. An approach to
understand the problem of research by collecting, analysing and combining both
quantitative and qualitative research and methods in a particular study is called
Mixed Method Research Approach (Johnson & Turner, 2003; Creswell, 2012).

73
In Maree’s (2007) view, mixed methods research models can be divided into
two namely: sequential model and concurrent model. In sequential model, the
investigator gathers the quantitative and qualitative data sequentially one after the
other in any order depending on the initial requirement of researcher. On the other
hand, time can be saved in concurrent model when it is compared with sequential
model, as the investigator collects both quantitative and qualitative data
simultaneously. This study was under the first category mentioned above as
interviews were done after conducting the survey.
To have an interactive and iterative system based approach to mixed method,
it is significant to have five interconnected elements when designing a mixed method
study (Maxwell & Loomis, 2003). They are purpose of the study, conceptual
framework, research question, methods and validity considerations.
According to Creswell (2009), there are three ways of mixing the methods.
They merge both quantitative and qualitative data by bringing them together, connect
both quantitative and qualitative data by having one build on other and embed one
data within the other ensuring one type of data provides a supportive role for the
other data. In this study, both quantitative and qualitative data are merged by
bringing them together which means this study falls under the first category.
Mixed method approach helps to enhance the understanding of human
behaviour deeply and their experiences particularly in a complex situation (Creswell,
et al., 2010). Therefore, the method chosen was appropriate as the key objective of
the study was to examine the strengths and weaknesses of using tablets in learning
and teaching at a university. The main justification of using mixed method approach
for this study was due to the fact that different instruments used to collect the data
aided to offer valuable and pertinent information to the phenomenon of this study.
The next section explores the research design of this study.

74
3.4 Research Design
De Vos, et al. (1998) and Denzin and Lincoln (2000) define research design
as a blueprint to conduct the study. Research design is a structure to clearly specify
the best way of determining the research objective (Coolican, 2004; Babbie &
Mouton, 2009). Trochim (2006) describes design as a glue that joins all the research
components together. Research design can be defined as a procedure on how to
conduct the study, when to conduct the study, from whom the data will be collected
and under what criteria the data will be collected, till what level the researcher can
interfere, time horizon and the unit of analysis (Macmillan & Schumacher, 2010;
Sekaran & Bougie, 2010). Creswell and Clark (2007) describe research design as a
structure in which the investigator uses to obtain, analyse, interpret and present the
data. Moreover, it is an action plan that the researcher must implement to lead the
methods and decisions to interpret the findings. To support this fact, many authors
such as Trochim (2006), Creswell and Clark (2007), Creswell (2009), Tashakkori and
Teddlie (2009) and Pierson and Thomas (2010) assert that research design is a
process of designing, organising and implementing the whole research to reach the
main purpose of the study in a systematic mode.
The reality viewed in quantitative and qualitative approaches are in different
ways. Williams (2007) indicates that while quantitative method delivers an objective
measure of reality, qualitative method assists the investigator to insight the
complexity of the problem. Therefore mixed method design fitted well with this study
as it included both quantitative and qualitative instruments to seek the views of
students, lecturers and managers about their views and attitudes of using tablets in
university classroom. Quantitative approach enabled the researcher of this study to
obtain huge amount of data in a short time and qualitative approach helped to
understand the data deeply for the phenomenon of interest. According to the
researcher’s point of view, an intense understanding of the result cannot be obtained
only through one method. Moreover, mixed method neutralizes the chances of bias
with one method (Creswell, 2003) and this increased the reliability and generality of
the results of this study. Another benefit of using mixed method is that the strengths
of one method will counterbalance the weaknesses of the other method (Tashakkori
& Teddlie, 2003).

75
In this study, the research design was a case study using survey and
interview. A case study is an in-depth investigation on a few cases, generally only
one (Gorman, Hammersley & Foster, 2000; Henning, Rensburg & Smit, 2004) of the
situations. A phenomenon such as an event, an activity, a person, group, institution
or community that has a description and analysis is called a case study (Merriam,
1988; Cohen, Manion & Morrison, 2000, 2007; Yin, 2009). The researcher opted a
case study to have a better insight on the use of tablets for learning and teaching
and understand the strengths and weaknesses of using it in university classrooms.
Table 3.1 shown below describes the advantages and disadvantages of a case
study.
TABLE 3.1: Advantages and disadvantages of case studies
Advantages Disadvantages
One issue can be studied in depth Huge volume of qualitative data
may be difficult to analyse
The interaction of factors and
events can be taken into account
Difficult or impossible, to cross-
check information
Breadth of methods of data
collection
Generalisation may not be
possible
Access to one organisation (or a
small number of cases)
Researcher may influence and be
influenced by the case.
Can focus in-depth in one
department or group
Lack of rigour within case study
research
Source: Anderson (2009, p.55).
A case study offers an irreplaceable situation of real people in real situations
which helps the reader to recognise how facts and principles can be adequate
together (Nisbert & Watt 1984, cited in Cohen, Manion & Morrison, 2000, 2007). In
this study, the case study enabled the researcher to understand the reactions of
students, lecturers and managers on the use of tablets for learning and teaching in
university classroom.

76
Case studies have three forms, namely: exploratory, explanatory and
descriptive (Yin, 2003). The description of each form is described below.
a. Exploratory case study: An explanatory case study explores an emerging
phenomenon which can be generated into new facts and single set of results
(Yin, 2003) that can be a basis for other researches.
b. Explanatory case study: An explanatory case study explains what has
happened in particular case and the justification of it (Rule & John, 2011).
c. Descriptive case study: “A descriptive case study presents a complete
description of a phenomenon within its context” (Yin, 2003, p.5).
Explanatory case study was adopted as this was the most appropriate case
study of all the three as it endeavoured to explore the current situation of learning
and teaching using tablets through obtaining the views of different stakeholders. The
next section discusses the study site.
3.5 Study site
The selected university is situated in the Eastern Cape province of South
Africa. The university has four campuses around the province. However, this study
focused only on one campus and two departments (ICT and EE) where the tablets
were supplied. Students from this province cannot afford to join tertiary institutions in
cities for their higher studies as they were from financial deprived backgrounds. This
university was established with an objective of providing excellent education to
students who were from the same region. To enhance the level of pedagogy, the
university had purchased a bulk quantity of tablets by the end of 2013 for the
students of Extended Stream (ES). The researcher opted this university for the study
as this was the only university from this region where students and lecturers used
tablets for learning and teaching.
ES was one of the divisions of diploma programmes in the University to assist
students with great potential but inadequate knowledge in understanding their
diploma programmes. Main Stream (MS) was another division of diploma
programme. Entrance into the diploma programme was based on the results of

77
matric and Standardised Assessment Test for Access and Placement (SATAP). The
score of each student in SATAP determined whether he/she could enter into ES or
MS. The year level of students in the diploma programmes was categorized into
seven. They were ES year 1, ES year 2, ES year 3, ES year 4, MS year 1, MS year
2 and MS year 3.
Fig 3.1: Flow diagram of ES and MS
Researcher-constructed flow diagram
Students who were registered in ES would have an extra year in the
beginning. While ES students complete the course in 4 years, MS students complete
it in 3 years. This additional year was utilised to prepare ES students by providing
additional academic support for particular MS courses, university studies in general
and to facilitate their transition from school to university. While MS students study the
modules in Year 1 courses in one year, ES students study the same courses in 2

78
years. In year 1, ES students will study the first half of the MS year 1 courses. In
year 2, ES students will study the second half of the MS year 1 courses. Students
must pass all the courses of ES year 2 to gain admission to the ES year 3. As the
courses in ES year 3 and MS year 2 are same, students are mixed together in one
classroom. Then those in the ES year 3 and those in the MS year 2 will proceed to
the final year of study. The diagrammatic representation of the flow of ES and MS is
shown in Fig 3.1. ES students’ progress to the subsequent years and continue to
have access to tablets. The tablets were delivered to the students on an agreement
that they are supposed to return it back to the department before they go for
university approved holidays. As the tablets are delivered only to ES students, this
study focussed exclusively on the ES student’s use of tablets in University
classroom.
The decision to purchase tablets was taken by the ES programme committee
in 2013. The committee had purchased bulk quantity of tablets from the fund that
was allocated for the betterment of ES education. At the beginning of 2014, tablets
were supplied to all ES students and lecturers in the department of ICT and EE to
use inside and outside the classroom. It had been four years now since the students
and lecturers had started using tablets. The university distributed the tablets with an
expectation that it would enhance students’ learning and knowledge and simplify
lecturers’ tasks and upgrade the instructional method. Next section will discuss more
on population and sample that are used in this study.
3.6 Description of the Population and Sample
3.6.1 The Population
Walliman (2006) defines population as a group of cases of a particular type of
the study. A set of people are those who have common characteristics from which
the data can be collected and analysed. A year later, Briggs and Coleman (2007)
argued that population was a targeted group in which the researcher was interested
and wished to obtain the data and find the conclusions. Certain common
characteristics of various cases that are of interest to the researcher for the purpose
of delivering a foundation to a scientific conclusion is referred to as population
(Tuckman, 1999; Best & Khan, 2003; Welman, Mitchel & Kruger, 2005). Moreover,

79
Macmillan and Schumacher (2010) describe the concept of population as the
quantity of items, individuals, events or components which follow a specific
benchmark to generalize the results of the study. Babbie and Mouton (2009)
hypothesise that population is a group of elements from which the sample is drawn.
The population in this study were ES students in ICT and EE cohorts,
lecturers who lectured to ES students in ICT and EE cohorts and managers of all the
departments in the selected campus of the university who were involved in the tablet
programme.
The criteria of the population were:
(a) Students from National Diploma: ICT and National Diploma: EE.
(b) Students from ES.
(c) Students who use tablets for learning in classroom.
(d) Lecturers from the department of ICT and EE.
(e) Lecturers of ES courses.
(f) Lecturers who use tablets for teaching.
(g) Lecturers of the students who were participating in this research.
(h) Managers who were in charge of implementing tablet use.
3.6.1.1 Students’ population
ICT cohort
A total of 186 students who registered in 2017 for year levels 2, 3 and 4 were
considered as the population for National Diploma: Information and Communication
Technology (ICT) ES. Due to some internal issues in the department, tablets were
not offered to year 1 ES. Therefore, year 1 students were excluded from the study.
A total number of 59, 90 and 37 ICT students were enrolled in year 2, year 3 and
year 4 respectively.
EE cohort
A total of 68 students who registered in 2017 for year levels 1, 2 and 3 were
considered as the population for National Diploma: Electrical Engineering (EE) ES.
As the year 4 ES students need to do project in industries or companies as a part of
80
their studies, they were unavailable in university classrooms. Therefore, year 4 EE
students were excluded from the study. A total number of 48, 12 and eight EE
students were enrolled in year 1, year 2 and year 3 respectively.
Consequently, an overall population of students from National Diploma: ICT
(186 students) and National Diploma: EE (68 students) were 254.
3.6.1.2 Lecturers’ population
These consisted of those who lectured the aforementioned cohorts and there
were 12 and 13 lecturers for ICT and EE respectively. Thus, the overall population of
lecturers from both departments was 25.
3.6.1.3 Managers’ population
These consisted of managers who were involved in the implementation of
tablet programme in the selected campus of the university: two deans, seven heads
of the departments (HoDs), two e-learning specialists, one e-learning administrator,
seven extended programme co-ordinators and one Institutional Head of Extended
programme co-ordinators. The Managers’ population was 20.
3.6.2 Sample
The sample size is always small when compared with the population. Sample
is a fraction of participants from the population which should always be an unbiased
one (Adam, 2010). Lind, Marchal and Wathen (2008) assert that researchers use
sample to collect data from a large population of interest and draw the inferences
since sample is a subset of population. According to Barker (2003), cited in Strydom
(2011), sample can be described as a small element in the population which is
assigned as the actual subject of the study. The sample for this study was derived
from the population which was mentioned earlier.
3.6.2.1 Students’ sample
From each year level, the names of those who volunteered to participate in
the study were documented with intention of choosing year-wise representation.
However, it was seen that those who volunteered were representing the different

81
year levels. Therefore, those from the population of ES students from the ICT and
EE cohorts who volunteered to participate in the study constituted the student
sample. It needs to be pointed out that the numbers decreased from years 1 to 4 in
line with lower enrolment as year levels progressed.
The details of the sample were as follows:
Total sample was 155 (N=155) consisting of 109 from ICT cohort (46, 42 and
21 from year levels 2, 3 and 4, respectively) and 46 from EE cohort (32, 8 and 6 from
year levels 1, 2 and 3, respectively).
3.6.2.2 Lecturers’ sample
Those from the population of ICT and EE lecturers who volunteered to
participate in the study constituted the lecturers sample and the sample size was 14
(N=14) consisting 10 from ICT cohort and four from EE cohort.
3.6.2.3 Managers’ sample
Those from the population of managers who volunteered to participate in the
study constituted the managers’ sample (2 Dean, 6 HoDs, 2 e-learning specialists, 1
e-learning administrator, 4 extended programme co-ordinators and 1 Institutional
Head of Extended programme co-ordinators) and the sample size was 16 (N=16).
3.7 Data Collection Instruments
A data collection instrument is a research tool that is used to collect, compute,
study and report data (Creswell, 2009). In mixed method approach, data are
collected in various ways. The researcher obtained data in this study by using
research instruments such as closed-ended questionnaire and interview. Below is
the description of both instruments.
3.7.1 Questionnaire
A questionnaire is one of the most widely used instruments to gather
quantitative data from a large population as it is easy to administer, collect and
analyse the data obtained. The respondents use a questionnaire to answer the
questions about demographics, views, attitudes, knowledge and other groups of data

82
(McNabb, 2004). A questionnaire is a list of structured questions that are carefully
developed to obtain reliable data from the sample (Hussey & Hussey, 1997). The
researcher draws these structured questions to collect the responses from the
respondents to achieve the objective (Saunders, Lewis & Thornhill, 1997). Direct
involvement is less in using questionnaire which makes the data unbiased and
reduces the influence of the researcher (Payne & Payne, 2004).
The researcher used a questionnaire as an instrument to collect the data from
students, lecturers and managers regarding their views on the use of tablet in
learning and teaching in university classrooms. This questionnaire was used to
gather the data necessary to answer the sub-research questions. The researcher
had made three questionnaires for each type of stakeholders: students, lecturers and
managers.
In order to draw up the questionnaire, the researcher used various sources.
As the discipline in school and university is common in terms of usage of tablets, the
researcher initially had an in depth study on the literature of both types of institution
which assisted in the development of the instrument. Some of the items in the
questionnaire that was used by the authors in their studies has been modified and
used in this research. For example, Agir (2015); McBeth et al. (2015); Rossing,
Miller, Cecil & Stamper, (2012); Diemer, Fernandez & Streepey, (2012); Shen,
(2016); Mango, (2015).
3.7.1.1 Advantages of using questionnaire in this study
The researcher had chosen a questionnaire for this study to collect the data
due to its following advantages:
(a) The questionnaire helped the researcher to gain a larger view of students,
lecturers and managers on the use of tablets for learning and teaching in University
classrooms in the Eastern Cape Province of South Africa.
(b) It enabled the researcher to gather the data on the demographical profile of
participants such as students, lecturers and managers, students’ tablet use for
engagement, collaboration in classroom and their current use of tablets compared
with earlier use of PCs. Collecting data using rating scale in questionnaire is useful

83
for understanding the attitudes, perceptions and opinions of a particular aspect
(Cohen, Manion & Morrison, 2007).
(c) It enabled the researcher to collect information about students’ use of tablets in
classroom from the point of view of lecturers which assisted the researcher to
triangulate the data and generate the inferences.
(d) It helped to collect the data about the lecturers’ use of tablet for teaching in
classroom.
(e) It assisted the researcher to understand the views of managers on the use of
tablets in learning and teaching in University classrooms in the Eastern Cape
Province of South Africa.
(f) Respondents were given an opportunity to answer the questions anonymously.
“The advantages of the questionnaire over interviews, for instance, are: it tends to be
more reliable; because it is anonymous, it encourages greater honesty” (Cohen,
Manion & Morrison, 2007, p.158).
(g) The data collection using questionnaires benefited this research in terms of time
saving. The researcher was able to collect a large number of data over a short
period of time from a large geographically dispersed population. Wilson and McLean
(1994) emphasise that a questionnaire that has closed ended questions can be
easily completed fast and forwarded straight to computer analysis.
(h) It was less expensive to collect the data using questionnaire. Cohen, Manion and
Morrison (2007, p.158) assert that “it is more economical than the interview in terms
of time and money”.
(i) The method of collecting the data using the instrument questionnaire was
relatively easy to conduct and carry out.
(j) The return rate of receiving the questionnaire back from participants was accurate
and optimal.
(k) Closed- ended responses were easy to analyse in this study. Punch (1998)
suggests that questionnaires are easy to analyse and the data will be unbiased as
there are no visual hints or vocal clues to influence the participants.
3.7.1.2 Disadvantages of using questionnaire in this study
The researcher acknowledged the disadvantages of the questionnaire in this
research. As the researcher’s role was outsider, participants were not able to ask

84
questions for clarity. Hence some participants refrained from completing the
questionnaire or avoiding a few questions.
3.7.1.3 Students’ questionnaire
Questionnaire that was developed for students consisted of five sections.
Section A (See Appendix A1) covered background details such gender, age group,
national diploma and level of study. A five point Likert scale format was the scale
used in Section B (See Appendix A2), Section C (See Appendix A3), Section D (See
Appendix A4) and Section E (See Appendix A5) of the questionnaire. The scale
ranged from level 1 to level 5 with level 1 being “STRONGLY DISAGREE” and level
5 being “STRONGLY AGREE”. Section B to Section E were used to find their views
on the use of tablets from different angles to answer the sub-research questions
1.3.2.1 and 1.3.2.3 (Refer 1.3.2 in Chapter One).
3.7.1.4 Lecturers’ questionnaire
Questionnaire that was developed for lecturers consisted of five sections.
Section A (See Appendix B1) covered background details such gender, age group,
lecturing department, highest qualification, lecturing experience and experience in
using tablet for teaching. Section B to Section E were used to find lecturers’ views on
the student’s tablet use in learning and their tablet use in teaching which responded
to all the sub-research questions (Refer 1.3.2 in Chapter One). A five point Likert
scale format was the scale used in Section B (See Appendix B2), Section C (See
Appendix B3), Section D (See Appendix B4) and Section E (See Appendix B5) of the
questionnaire. The scale ranged from level 1 to level 5 with level 1 being
“STRONGLY DISAGREE” and level 5 being “STRONGLY AGREE”.
3.7.1.5 Managers’ questionnaire
Questionnaire that was developed for managers consisted of two sections.
Section A (See Appendix C1) covered background details such as age group,
highest qualification, designation and Managing experience. Section B was used to
find their views on the tablet use of students and lecturers in learning and teaching
respectively which answered to all sub-research questions (Refer 1.3.2 in Chapter
One). A five point Likert scale format was the scale used in Section B (See Appendix

85
C2) of the questionnaire. The scale ranged from level 1 to level 5 with level 1 being
“STRONGLY DISAGREE” and level 5 being “STRONGLY AGREE”.
3.7.2 Interview
Creswell, et al. (2010) state that interview is a reciprocal chat where the
interviewer gathers the data and understand the ideas, views, attitudes and
behaviours of the interviewee by asking questions for witnessing the world from the
respondent’s perspective. Willis (2007) defines an interview as a conversation
between the person who conducts the interview and the person who appears in the
interview. An interaction between interviewer and interviewee for the purpose of
collecting information is called interview (Gray, 2004). According to Maree (2013)
interview is a shared talk between two parties. One person will act as interviewer and
other one takes the role of interviewee. In this process, interviewer inquires the
interviewee in order to gather data and to understand the perspectives, attitudes and
behaviours of the person. These data can be valuable if it can be used in the proper
way. The purpose of conducting interview in this study was to explore the views of
students, lecturers and managers on the use of tablet technology in higher
education. All the participants got the opportunity to voice their views during the
interview.
The researcher of this study decided to conduct interviews apart from
questionnaire survey because interview enabled the researcher to repeat the
question if the respondent was not clear with it. This prompted the researcher to
collect more precise answers. Maree (2013) claims that there are three different
probing approaches such as detailed-oriented probes, elaboration probes and
clarification probes that can be used to collect maximum amount of data and to
confirm whether what the interviewer collected is what the interviewee meant.
Detailed-oriented probes are used to check whether the researcher has understood
about the “what”, “where” and “who” answer by the interviewee. Elaboration probes
are probes that aim at obtaining the whole picture by asking the interviewee to
explain more about a particular response which is answered. Clarification probes are
designed to ensure whether the researcher has understood all the responses given
by the interviewee and ensuring the data are accurate. The researcher of this study

86
had opted clarification probes to ensure whether researcher had understood
accurately the interviewee’s response.
3.7.2.1 Advantages of an Interview
(a) It would not have been possible for the researcher to probe and access deeper
information about the views, attitudes and behaviours of the respondents if the
instrument chosen had not been an interview.
(b) Conducting an interview was very flexible. The researcher was able to adjust the
words in the questions slightly in order to collect accurate information. The
atmosphere of the place where the interview was conducted helped the respondents
to be honest and open to answer the questions.
(c) Instead of the traditional way of using microphone and tape recorder, the
researcher of this study used high quality smart phone to record the interviews.
Professional audio recording software installed in laptop was also used as a
secondary safety measure to record the interviews.
(d) In interviews, the probability of participants responding to all the questions was
high as the researcher can ensure it.
3.7.2.2 Disadvantages of an Interview
It was a time consuming process to transcribe the recorded interviews into
hand-written notes or narrative form. Bryman (2001) notes that one hour of recorded
video takes approximately five to six hours to transcribe.
According to Gray (2004), interviews are categorized into five types. They are
structured interviews, semi-structured interviews, informal conversational interviews,
non-directive interviews and focused interviews.
In this study, the researcher used semi structured interview to obtain
information from students, lecturers and managers. The aim of conducting the
interview was to obtain “one-on-one” information on the tablet use for learning and
teaching. The researcher opted face–to–face interviews where semi-structured
questions were set for collecting the data.

87
Face-to-face interview is also known as personal interview. Face-to-face
interview is a type of interview in which the researcher can probe the response of the
respondents and observe their behaviour either as a group or as an individual.
3.7.2.3 Advantages of the Face-to-face interview
Some of the advantages of face-to-face interview are:
(a) The researcher recorded all interviews and wrote down the conversation to
support the recordings for the purpose of analysis.
(b) The response rate received from the respondents was good as the researcher
conducted a face-to-face model of personal interview.
(c) Face-to-face interview helped the researcher to observe the attitudes and
behaviours of the participants.
3.7.2.4 Disadvantages of the Face-to-face interview
Some of the disadvantages of face-to-face interview are:
(a) The cost of Face to Face interviews was high as the researcher needed to travel
to the some of participants’ places to conduct the interview. There were even cases
where the respondents requested the researcher to postpone the scheduled
interview multiple times even after the appointment had been fixed.
(b) The researcher lost valuable time when the respondents were not punctual.
(c) Some of the student respondents panicked as it was a face to face interview.
Saunders, Lewis and Thornhill (2009) aver that semi-structured interview is a
hybrid interview which is in between structured interview and an in-depth interview.
Hence semi-structured interview is also called non-standardized interview. The semi-
structured interview was suitable for this study as it enabled the researcher to
provide in-depth data. The researcher conducted semi structured interviews to
collect data from all stakeholders such as students (See Appendix D1), lecturers
(See Appendix D2) and managers (See Appendix D3).
Gray (2004) remarks that despite the fact that the researcher has a set of
questions he wishes to ask, some of them may not be asked in each interview due to
the high chance of changing the order of interview questions. These pre-determined

88
questions are generally controlled by the flow of the interview. The interviewer may
ask some new questions which was not anticipated earlier.
The researcher did not choose structured interviews as there was a need to
probe for more information and it would not have been possible with the structured
interview. In some cases, the interviewees might not be able to answer certain
questions as they did not understand the question or lack insufficient information to
answer. Probing would then support the participants to deliver the information that
was desirable.
3.7.2.5 Advantages of Semi-structured interview
Some of the advantages of Semi-structured interview are:
(a) In semi structured interviews, the researcher had the benefit of rephrasing the
questions as and when the questions were not clear for the respondents. Morse and
Field (1995) suggest that the interviewer has full freedom in using different words to
express the question for the purpose of making the interviewee understand the
question to get in-depth data.
(b) The respondents gave honest answers in reply to the questions asked by the
researcher. Therefore, cheating was not done by receiving responses from others.
(c) The researcher was able to record the date, time and venue of the place where
the interview was conducted.
(d) The researcher was able to arrange a quiet and calm place in order to conduct
the interview so as to avoid noise during recording.
3.7.2.6 Disadvantages of Semi-structured interview
Some of the disadvantages of Semi-structured interview are:
(a) Semi structured interview was time consuming both in the case of data collection
and analysis.
(b) It was difficult for the researcher to directly compare the results of semi structured
interview as each interview was unique.
(c) As each interview consumed more time, the number of participants were less in
semi structured interviews.

89
The structure of semi-structured interview began with the researcher’s
welcoming introduction, brief summary of the study and the purpose of recording the
interview. The participants were also given informed consent form (See Appendix F4
for students, Appendix F5 for lecturers and managers) to sign. This consent form
included the description of the research, ethical compliances such as anonymity and
confidentiality.
3.7.2.7 Students’ semi-structured interview
Age group, level of study and branch of study were inquired by the researcher
to gather demographical information about the students and to maintain a positive
relations for the purpose of obtaining maximum data. Key questions (See Appendix
D1) that answered to the sub-research questions were asked by the researcher
along with some probing questions for the purpose of obtaining core data. Out of
eight key questions, the third, fourth and fifth questions answered to the first sub-
research question. All other key questions answered to the third sub-research
question. The interview ended with a closure question so as not to leave the
students with emotionally susceptible or with painful remembrances. Hennink, Hutter
and Bailey (2011) suggest that closing questions have a huge role in an interview in
not making the participant emotionally weak or leaving him or her with hurting
memories.
3.7.2.8 Lecturers’ semi-structured interview
The researcher asked a few background questions to the lecturers such as
age group, lecturing department, highest qualification, years of lecturing experience
and years of lecturing experience particularly using tablets. This enabled the
lecturers to freely respond to the questions of the researcher. Subsequently, the
researcher collected core data by asking the essential interview questions (See
Appendix D2) to answer to the sub-research questions. Out of fourteen essential
questions, the sixth, seventh, ninth, tenth and thirteenth question answered to the
first sub-research question. The first, fourth, fifth, fourteenth answered to the second
sub-research question. All other questions answered to the third sub-research
question. The first three questions were related to TK, fourth question was related to
PK and fifth question was related to CK. The remaining questions focussed on the

90
lecturer’s views on the students’ use of tablets. For the sake of acquiring penetrative
data, some probing questions were also asked by the researcher after the interview
questions. A closing question was also asked for the closure of the interview to be in
line with the suggestion of Hennink, Hutter and Bailey (2011).
3.7.2.9 Managers’ semi-structured interview
The interview recording started with the demographic questions such as their
age group, highest qualification, designation and years of managing experience.
These questions helped the researcher to understand the background of the
participants and to develop a relationship in the interview. By doing so, participants
were very comfortable and it helped them to narrate their responses in the most
effective way. This was followed by key questions (See Appendix D3) on the
research topic to gather core information that would answer to the sub-research
questions. Out of thirteen key questions, first, third, fifth, seventh questions
answered to the first sub-research question. Second, fourth, sixth and eighth
questions answered to second sub-research question. All other key questions
answered to the third sub-research question. In some cases, probing questions were
also followed after the key questions to obtain in depth information from the
managers. There was a closing question at the end to conclude the interview.
To describe the credibility of the instrument, the researcher has explained
Validity, Reliability and Data trustworthiness in the next section.
3.8 Quality assurance of instruments
3.8.1 Validity
Denscombe (2002) describes validity as the accuracy of the items in the
questionnaire, collected data and the explanation offered. He further continued that
“claims to validity involve some demonstration that the researcher’s data and his or
her analysis are firmly rooted in the realm of things that are relevant, genuine and
real: they act to reassure the reader that the research is not based on poor data and
erroneous interpretations” (Denscombe, 2002, p. 100). The quantitative research
and qualitative research of this study was backed up by closed-ended, interview
questions. The data that was collected through these methods enabled the

91
researcher to get the right information to analyse and interpret in order to reach the
right conclusion. The responses that were collected through these methods helped
the researcher to obtain accurate information to analyse and interpret to meet the
exact inference. Babbie (2010) defines validity as a technique to measure the
instrument that accurately reflects the concept it is intended to measure. It is very
significant to validate the research study because it tells people whether an item
describes what it should be (Maxwell, 1998; Kasenga, 2007). In Joppe’s (2000) point
of view, validity is defined as a technique to measure that which was intended to
measure or to assess how truthful the results of the research are.
The researcher of this study had given the instrument to his supervisor and
the post-doctoral fellow who were experts in this area to ensure its validity.
Moreover, a pilot study was conducted to measure its validity. The two types of
validity are content validity and face validity.
3.8.1.1 Content Validity
“To demonstrate this form of validity the instrument must show that it fairly
and comprehensively covers the domain or items that it purports to cover” (Cohen,
Manion & Morrison, 2007, p.137). The researcher had consulted with his supervisor
and the post-doctoral fellow to ensure the content validity.
3.8.1.2 Face Validity
Face validity discusses about the instrument’s superficial appearance or face
value of the variables it claims to measure (Deport & De Vos, 2005). The supervisor
of this study and the post-doctoral fellow were consulted in this regard to measure
the face validity of the instrument and it was confirmed.
3.8.2 Reliability
Reliability affects the credibility of the findings. Denscombe (2002, p. 100)
describes reliability as a process that “provides results that do not vary from
occasion to occasion and that do not vary according to particular persons
undertaking the research. Researchers need to feel confident that the results they
obtain are not being affected by a research instrument that throws up different

92
results each time it is used”. According to Miles and Huberman (1994), Cohen,
Manion and Morrison (2000), Kuze (2009) and Babbie (2010), reliability focuses on
accuracy and consistency of the results. Delport (2005) argues that the instrument
must produce similar results as long as the instrument is tested under the same
condition. Leedy and Ormrod (2009) concur in their observation that the result which
is generating from the instrument to measure should be constant when the entity
being measured has not changed. When this technique is repeated each time under
similar conditions using the same technique, it should output the same result
(Babbie, 2010).
The measuring instrument which was the questionnaire in this study was pilot-
tested on the respondents who were not part of the sample to ensure conclusions
drawn were warranted. The questionnaires were administered to evaluate the
efficiency of the research instruments. Hence, the actual research instruments were
adjusted and refined for the main study. The researcher ensured that the
administrators had administrated the questionnaires in a consistent manner. The
respondents were well sampled for the statistical processing of data. The validity and
reliability of the measuring instruments were developed during the course of the pilot
study. There were no ambiguities and difficulties for all participants to understand
any words or instructions. However, the researcher noticed during analysis that there
were two significant items which had been missed out. This was then added and
rectified.
Reliability depends upon the coefficient value it generates between the ranges
0 and 1. The greater the value the more reliable the instrument will be. A value of
0.70 or higher can be regarded as adequate value (Maizura, Masilamani & Aris,
2009). Cronbach Alpha value was used to determine the reliability of the
instruments. The following table shows the Cronbach Alpha value for the different
sections in each questionnaire and where the sections referred to appear in
Appendices.

93
TABLE 3.2: Cronbach Alpha value for each questionnaire
Questionnaire
for
SECTION Description No of
Items
Cronbach's
Alpha
value
Appendix
Students B Students’ activities
using tablet.
10 0.700 A2
C Students’ tablet use
in learning the
courses
7 0.748 A3
D Engagement and
collaboration in
classroom
8 0.807 A4
E Students’ use of
tablets when
compared with
personal computer
(PC)
5 0.758 A5
Lecturers B Students’ activities
using tablet.
10 0.700 B2
C Engagement and
collaboration in
classroom
8 0.733 B3
D Students’ use of
tablet when
compared with
personal computer
(PC)
3 0.960 B4
E Lecturer’s tablet use
while lecturing the
courses
10 0.754 B5
Managers B tablet use of
students and
8 0.788 C2

94
lecturers in learning
and teaching
respectively
3.8.3 Data Trustworthiness
The quality issues in qualitative research are not the same as in quantitative
research (Rolfe, 2006). The issues in qualitative research should be connected to
“trustworthiness” and not to “truth” or “value” as they are for quantitative
(Sandelowski, 1993, cited in Rolfe, 2006). Trustworthiness is a way in which the
audience are inspired by the results of the study obtained and it is worth spending
time as the research is of high quality (Maree, 2007). Bryman (2004) describes
trustworthiness as how the investigator defines the terms and approaches for
assessing the purity of the qualitative study.
According to Marshall and Roshman (2006), cited in De Vos (2007), the
research must answer to all the questions that are used as the criteria to evaluate
the trustworthiness of the project. The following are the list of questions the research
must respond to.
a. How credible are the particular results of the research?
b. What criteria can be used to measure the credibility of these results?
c. How are these results applicable and transferable to another research or group
of people?
d. How can we ensure that the results would be replicated if the study is conducted
with same respondents in the same background?
e. How can we ensure that the results are reflective of the subjects and inquiry
rather than researcher’s biases?
Trustworthiness is all about establishing the following four criteria, which are
described in more detail below (Rolfe, 2006; Guba & Lincoln 1985, cited in
Nieuwenhuis 2007).

95
3.8.3.1 Credibility
Credibility corresponds more to the internal validity in quantitative approach
(Rolfe, 2006). In this study, the researcher was strongly confident in the truth of the
findings obtained. With the assistance of triangulation done in this research, the
researcher could strongly comment that the data were true, accurate and genuine.
This showed that the findings of the study were credible.
3.8.3.2 Dependability
Dependability corresponds more to the reliability in quantitative approach
(Rolfe, 2006). It was the extended version of the study that could be repeated by
other researchers to produce their findings which would be similar to the current
study. If any other researcher wants to replicate the study, they should have
sufficient information from the existing study to obtain consistent findings. In this
study, the researcher had used inquiry audit in order to address the dependability
issues.
3.8.3.3 Transferability
Transferability corresponds more to the external validity (Rolfe, 2006). It
showed how the researcher demonstrated that the research findings were pertinent
to other contexts such as similar situations, similar population and similar
phenomena. In this study, the researcher used thick description of data to show that
the research study’s findings could be relevant to other similar conditions and
circumstances.
3.8.3.4 Confirmability
Confirmability is an issue of presentation (Rolfe, 2006). It is the degree of
neutrality in the findings. In confirmability, findings must not be based on any
potential bias or influence of the researcher but it must be based on the responses of
the participants. To address the confirmability issues, the researcher of this study
provided an audit trail which emphasized every stage of data analysis that was made
in order to provide rationale for the decisions made. This helped to establish that the
findings of this study were accurately portrayed responses of the participants.

96
It was very significant to know how data was collected from each participant.
Therefore it was necessary to observe what procedures the researcher used to
collect the data from participants.
3.9 Data Collection Procedures
This section aims at revealing how the researcher collected data for the study.
Mason (1996) and David and Sutton (2004) defined data collection as a process of
producing and recording the data which is not there in the data sources chosen by
the researcher. Mouton (1996, p.67) describes that in data collection it “involves
applying the measuring instrument to the sample or cases selected for the
investigation”. Data collection in this study was carried out in various stages. The
detailed description of these stages are shown below.
3.9.1 Initial Process
Before conducting a pilot study to test the feasibility of the main study, the
researcher first applied for ethical clearance certificate from the university where the
researcher registered for the study. An application letter (See Appendix E1)
requesting for the same was sent to the ethics committee of the university. After the
researcher had received the ethical clearance certificate (See Appendix E2), a
permission letter to conduct the study was requested by the researcher to the
university (See Appendix E3) where the research was going to be conducted. After
receiving the consent letter (See Appendix E4) to execute the research, an invitation
letter was sent to seven managers (See Appendix E5) to be a part of the pilot study
to test the questionnaire for managers. However, only five managers responded and
accepted the invitation. Another invitation letter was sent to six lecturers (See
Appendix E6) to be a part of the pilot study to test the questionnaire for lecturers.
Five lecturers responded and agreed to answer the questionnaire. There was no
invitation letter given to students but the researcher verbally communicated with
BTech students who graduated from the same university with National Diploma.
These students are still using tablets and chosen them to participate in the pilot
study. Five students came forward to be a part of the pilot study. All of those who
participated in the pilot studies to test the questionnaire for managers, lecturers and
students were not a part of the main study.

97
3.9.2 Pilot study
The process of testing the questionnaire that is designed by the researcher for
a forthcoming survey is called a pilot study (Strydom, 2007). According to Bless and
Higson-Smith (1987), cited in Strydom (2007), it is a small study conducted before
the start of the main study to determine whether the methodology, sampling,
instruments and analysis are adequate and appropriate. Briggs and Coleman (2002)
articulated that all instruments that are used to collect the data need to be piloted.
In this study, the researcher considered the following factors in pilot testing
the questionnaire. They were whether the items added in the questionnaire had been
answered to the sub-research questions, whether the responses from the
questionnaire met the objective of the research, whether the participants could
complete the questionnaire within the duration of time and whether resources were
available for the study design and procedures. Five students, five lecturers and five
managers who did not participate in the main study were utilised for the pilot study.
Moreover, the supervisor of this research and a post-doctoral fellow also had a
thorough look at all the items and overall structure of all the questionnaires. The
researcher’s main intentions were to get a feedback from the respondents on
whether they could understand all the questions and the overall time for all
respondents in completing the survey was adequate. A group similar to that of
population must pilot the questionnaire and provide feedback (Briggs & Coleman,
2002).
Drew, Hardman and Hosp (2008) argue that the quality of the data depends
on how the researcher records the interview which can be executed only by practice.
The researcher had done a rehearsal by questioning, listening and recording for the
smooth running of the interviews with all stakeholders such as students, lecturers
and managers. This practice session had been done before the commencement of
the actual interview which helped the researcher to be accurate and consistent when
the actual data was collected.

98
In short, the purpose of the pilot study was to determine the possible
weaknesses, uncertainties, inadequacies and any challenges in all stages of the
research and tackle those in advance before the main data collection was started.
3.9.2.1 Students
The questionnaire for students was piloted and administered by the
researcher himself to the students. All the five participants showed positive attitude
and willingness to participate in the study. The approach of self–administration made
it easier for the researcher to explain the contents of the questionnaire to the
participants. The researcher explained clearly to all participants about the aim of this
pilot study and what the research topic was all about. Although instructions were
clearly described in the first three pages and before the start of each section in the
questionnaire, the researcher still explained all the instructions and reminded them to
sign on the consent form. The researcher requested all students to check the time
before they started and ended. The researcher also reminded them to indicate the
time at the top of the page once they finished. He encouraged them to freely ask any
queries that they had. Almost all of them returned after completing within 20-25
minutes time duration. However, one student took 31 minutes to complete the survey
which could be considered as the maximum time. Therefore, the researcher edited
the approximate duration time in the questionnaire to 45 minutes in order not to have
any pressure for the students in the main study. The common feedback which came
from all the students was they agreed unanimously that all items were
straightforward and they had seen no hitches to understand neither in any words nor
in any of the sentences used in the whole questionnaire.
3.9.2.2 Lecturers
The researcher piloted the lecturers’ questionnaire to the lecturers who had
accepted the request from the researcher to participate in the pilot study. The
questionnaires were distributed to them by the researcher himself. The researcher
treated the pilot study as very formal and in an official manner by describing about
the research and the intention of doing the pilot study. The researcher also
requested all participants to read the instructions carefully, sign and enter the date
on the space provided in the consent form. The researcher reminded all of them to

99
write the duration of time at the top of the first page to determine how long it took for
them to complete the questionnaire. He also reminded them to ask him freely by
making a telephone call in case any clarity was needed in any particular place and
ensured that all participants had his mobile phone number. All the participants
managed to complete all the questions and returned the questionnaire within a
weeks’ time. The maximum time taken by all the lecturers was 17 minutes.
Responses from the respondents were positive. Two items were added to the
lecturers’ questionnaire for the main study as the researcher noticed that there was
something missing to triangulate the data received from students’ pilot study. Three
items from Section E was removed before the main study. Due to the
aforementioned situations, Babbie (2001) asserted that the pilot study would
discover any abnormal flaws in the questionnaire. Although the lecturers were able
to complete the pilot study in 17 minutes, the researcher still edited the approximate
duration time in the questionnaire to 30 minutes in order not to have any pressure for
them in the main study.
3.9.2.3 Managers
Similarly, the questionnaire for managers was delivered to three HODs and
two Ex PCOs who were from other campuses of the same university. The researcher
visited their departments by taking an appointment and hand delivered it to them. In
addition, he described about the research and requested them to sign the consent
form and write the time required to complete the task at the top of the page. As they
were busy, the researcher requested them to respond through mail. They managed
to read all the instructions and completed the questionnaire in four minutes’ time.
The fully completed questionnaire was returned to the researcher within a week time.
Thereafter, the researcher called each of them by phone to glean their comments
about the questionnaire. In their view, there was nothing that was hard to grasp. An
excellent design of the instrument is to be developed only when he does a detailed
pilot study (McBurney, 1990). Although the managers were able to complete the pilot
study in four minutes, the researcher still edited the approximate duration time in the
questionnaire to 10 minutes in order not to have any pressure for them in the main
study.

100
Obtaining ethical clearances from the concerned authorities was very
important while doing a research. It was therefore necessary to observe the ethical
compliances that surrounded this research.
3.10 Ethical Compliance
The word “Ethical” means following the standard of any profession or group
(Babbie, 2008). Research ethics is based on what is ethically right or wrong when
using the respondents for the study or retrieving archival data (McMillan &
Schumacher, 2010). Babbie (2001) posits that all the respondents in a research
must be aware of the general agreement on appropriate and inappropriate aspects in
a scientific research. Researchers must enable a high level of academic care and
behave with trustworthiness and self-respect (Kuze, 2009). Blanche and Durrheim
(1999) concur that the researcher must respect and protect the respondents in the
research. In the current study, the researcher had considered the dignity and
autonomy of all participants as very significant. He minimised all psychological and
social risks connected with research and maximised the benefit of gaining the
knowledge (Denzin & Lincoln, 2000). The researcher of this study had followed all
ethical compliances to corroborate the study but not compromising the faith the
participants had on him (Creswell, 2009; Silverman, 2011). Ethical compliance in
research included the need for ethical clearance certificate from institution, informed
consent as well as prevention of harm and confidentiality.
3.10.1 Ethical clearance from institutions
The researcher of this study had collected ethical clearance certificate from
the University of Fort Hare (See Appendix E2). Permission had been obtained from
the Ethics Committee of the university where the research was conducted (See
Appendix E4) which is the gate keeper in this study. In this regard, both universities
were informed in detail about the study that was performed and they agreed. The
researcher had followed all ethical requirements, guidelines and rules listed in the
ethics certificate of the relevant ethics committee.

101
3.10.2 Voluntary participation
The researcher clearly articulated to all participants that the participation was
entirely voluntary and they had all the right to withdraw at any time without providing
any reason and they were under no obligation to participate (Creswell, 2003). None
of the participants were forced to participate and only those who volunteered had
been in the study.
3.10.3 Informed consent
Informed consent is one of the most important tools to safe guard that
participants understand what it means to participate in a particular study in order to
decide whether to participate or not consciously (Denzin & Lincoln, 2000; Henning,
Rensburg & Smit, 2004). Babbie (2010) advocates that informed consent is a
procedure that the researcher follows to ensure that the participants understand the
threats of the investigation. In informed consent form, the researcher should provide
adequate and accessible information regarding the investigation for the participants
to take a decision whether to participate or not (Gray, 2009). Attaining informed
consent means all likely information on the objective of the research, the measures
that will be taken during investigation, the possible benefits and drawbacks, possible
risks that would occur if the participants are exposed and reliability of the researcher
be rendered to potential subjects or their legal representatives (Strydom, 2007). The
standard of informed consent ascends from the subject’s right to liberty and
autonomy (Cohen, Manion & Morrison, 2000).
In the context of this study, the researcher was frank and honest with the
participants. He explained the nature of the research, procedures involved in the
research, its risks and benefits and promised that there would not be any risks to the
participants. All the participants such as managers, lecturers and students in this
research were adults and they were all requested to sign a letter of consent if they
agreed to participate in the survey (See Appendix F1, Appendix F2 and Appendix
F3) and interview (See Appendix F4 and Appendix F5).

102
3.10.4 Prevention of physical or psychological harm
Welman, Mitchel and Kruger (2005) advocate that participants should not
have unnecessary stress, inconvenience or harm due to the participation in the study
and their honesty and personal safety must be assured. Researchers should not
lead the participants to an injury or danger. In this regard, the researcher guaranteed
that the involvement of participants in this research would never result in harm or
threat.
3.10.5 Anonymity and Confidentiality
Cohen, Manion and Morrison (2000) argue that anonymity should be assured
always for all participants who are being a part of study. Consequently, the
researcher guaranteed and informed them before the commencement of the
research that all the participants would be anonymous and confidentiality which was
explicitly stated in the consent form. Cohen, Manion and Morrison (2000) further
justified that nobody should identify the participants and they must be kept as
anonymous. They have answered the questionnaires anonymously in order to keep
their anonymity. The researcher assured that responses of all participants would be
treated with the strictest confidentiality and used only for academic purposes.
Strydom (2005) emphasised that no one including the researcher should be able to
identify the participants once the research had been conducted. The name of the
university where the study was conducted was also not mentioned anywhere in the
research to maintain a high level of anonymity and confidentiality.
3.11 Negotiation of access
Although the permission was received from the university (research site) to
collect data from respondents, the researcher still informed the HODs that the data
would be collected from managers, lecturers and students. HODs responded
positively to this. To start with the data collection, the researcher approached the
manager cohort and lecturer cohort simultaneously to save time needed for the
study.

103
3.11.1 Managers
The managers included the Deans, HODs, e-learning specialists, e-learning
administrators, extended programme co-ordinators and Institutional Head of
Extended programme co-ordinators where the study was conducted. The
researcher’s request for an appointment with each Dean was fortunately granted on
the same day itself. The researcher received permission from other managers to
hand deliver the questionnaire to them in their office. The researcher organised his
office itself as the venue to interview the Deans and HODs. However, other
managers preferred their own office.
3.11.2 Lecturers
The researcher had a friendly talk with all lecturers personally to determine
whether they were willing to participate or not and all of their responses were
positive. The researcher was much worried of the strike which was very common in
the university where the study was conducted. Generally, if once it is started, it would
certainly prolong and affect the study. This would make the researcher hard to get
the questionnaires back from respondents if it was hand delivered. Consequently, in
order to make the survey quick, easy and make them feel free while answering to the
questions that are asked in the questionnaire, the researcher decided to mail it to
respondents. As all the respondents are researcher’s colleagues, he had their
contact details. The researcher organised his office itself as the venue to interview
the lecturers.
3.11.3 Students
The lecturers accepted the request put forward by the researcher to assist
him by sparing their last period (45 minutes) for administering the questionnaire.
There was a delay in the data collection and it was due to poor students’ attendance
from first week after the holidays. Most of the students’ could not afford the travel
expenses until their parents received their monthly salaries. Accordingly, having
waited for more students until the third week, the researcher decided to go ahead
with the data collection. Eventually, data collection started only on the third week
after the semester holidays that was during the second week of August 2017 and it
went on for two weeks.

104
As described earlier in section 3.5, ES students were spread into four years.
After year 2 of their study, they had the option to choose their branch in ICT such as
Software Development (SD), Communication networks (CN) and Business
application (BA) for year 3 and year 4. The flow diagram of the branches is shown
below.
Fig 3.2: Flow diagram of ICT Branches
Researcher-constructed flow diagram
As mentioned earlier in section 3.6.1.1, the department did not provide tablets
to ES year 1. Hence, the data of ICT were drawn only from seven lecture classes
and the data of EE students were drawn from three lecture classes.
In order to obtain the data from students, it was very important to know their
availability and also lecturers of the research site as it was they who were
administering the questionnaire. Therefore, the researcher had a meeting with each
105
and every lecturer who were lecturing these streams to find the convenient time and
made a chart in order not to miss the time permitted to the researcher. It was the
same lecturer who administered ES year 2 and ES year 3 BA as she was the
responsible lecturer in charge of that class. She managed to administer the
questionnaire one period before the end of each class. The lecturer for ES year 4 BA
also distributed the questionnaire and collected data during the last period of her
class. However, the lecturer of ES year 2 CN was not ready to sacrifice his class
although he was ready to administer the questionnaire. Therefore, lecturer collected
the data from his students after the end of his class. Fortunately the academic venue
was available and students were also free at that time. In order to diminish the bias,
the researcher requested another lecturer to administer ES year 3 SD, ES year 4 SD
and ES year 4 CN as one of the lecturer of these classes was the researcher
himself. The researcher organised his office itself as the venue to interview the
students.
3.11.4 Position of the researcher
The current study originated from the researcher’s role as a lecturer who is
responsible for different courses such as Development Software II, Development
Software III and Technical Programming II in the national diploma programme of the
same university where the research had taken place. The aforementioned course
was under the branch of ES year 3 SD, ES year 4 SD and ES year 4 CN. The
researcher deliberately considered himself as an outsider as he did not want to
remain a member of staff while he was a researcher to avoid unwanted influence on
the participants.
A case study becomes good only when the investigator has the skill to
connect the purpose of the study with the data that are collected and to make a
meaningful analysis (Cohen, Manion & Morrison, 2011). Face to face data collection
through survey was conducted only with the students. Some students knew the
researcher was a lecturer and the researcher acknowledged it. However, he was
present in the place only to give a brief introduction and instructions and he strictly
did not want to be an administrator to administer the questionnaire.

106
The researcher requested a few qualified trained academics to assist him to
administer the questionnaire to gain the validity of the instrument and their
responses were positive. Kvale (1995) suggests that the idea of validity becomes
powerful when researchers choose outsider action. The validity of the insider
research becomes complex if the researcher administer the questionnaire.
Therefore, the researcher of this study opted to be an outsider in order to make the
data less biased. Hammersley (2000) postulated that to make complete objectivity in
a research is highly impossible and therefore the aim of the study should be to
reduce the impact of biases. The next section explains the data collection of the
main study.
3.12 Data Collection: Main study
3.12.1 Managers
The researcher hand delivered the questionnaire to HODs and other
managers and explained clearly about the project, the objective of the research and
what each section was about in the questionnaire. He emphasized that the data
collection was absolutely for study purposes and would not affect anybody in
anyway. The researcher also explained all the instructions even though it was
described in the consent form (See Appendix F1). He reminded them to sign at the
end of the consent form with date.
The researcher collected mobile numbers of all managers who participated in
this study in order to remind them through Whatsapp after a week. Both the deans
were so generous and very positive. Deans instructed that the researcher can come
and get it back on the same day afternoon from their secretaries. However, in the
case of other managers, researcher gave his email id and requested all of them to
respond back through mail as each one of them come to work at different times. One
manager replied to the researcher to come and get the responded questionnaire
from his office on the same day in the evening half an hour before he leaves. All
managers in the sample participated in the survey. Therefore the response rate was
100%.

107
The researcher himself was the interviewer and stressed that the interview
was totally for study purposes and it would not upset anybody in anyway. He also
explained all the instructions even though it was described in the consent form (See
Appendix F5). He prompted them to sign at the bottom of the consent form with date
where the space was provided. Data was collected through interview from nine
managers (1 Dean, 3 HoDs, 1 e-learning specialists, 1 e-learning administrator, 2
extended programme co-ordinators and 1 Institutional Head of Extended programme
co-ordinators).
3.12.2 Lecturers
Despite the instructions and guidelines clearly mentioned in the consent form
(See Appendix F2), the researcher met officially each and every lecturer on the
same day to explain more about the research, the purpose of the questionnaire and
the intention of doing this research. He indicated that there was no need of any
mental pressure to complete the questionnaire and no compensations would be
provided. He highlighted that at any point of time, if the respondent wished to quit or
skip any questions, they were free to do so and their anonymity would be protected
by all means. He exhorted the respondents to read the instructions given in the
consent form carefully before they signed and entered the date on the space
provided. He also indicated that there were totally five sections and explained the
purpose of each section. All respondents were requested to be as sincere as
possible in their responses. Finally, he requested them to respond within two weeks’
time.
The researcher politely reminded the respondents by Whatsapp on the
fifteenth day to complete the questionnaire. Seven of them responded within one
week after the friendly reminder. The remaining three respondents were busy
attending various workshops. The researcher sent a friendly reminder again to all of
them through Whatsapp as well as through personal message and waited for one
more week. Eventually, the remaining participants also responded. All lecturers from
ICT cohort in the sample participated in the survey.

108
The researcher gave the questionnaires simultaneously to lecturers in EE and
ICT. However, lecturers in EE took more time to respond. Finally, out of four
respondents in the sample, only two lecturers responded within two days. The
researcher waited for two weeks and made a friendly reminder through Whatsapp
and personal message to the remaining respondents who haven’t responded. He
made several voice calls to the lecturers to remind them again after a week’s time.
Eventually, the remaining participants also responded. All lecturers from EE cohort in
the sample participated in the survey. Therefore, the response rate from lecturers
(ICT cohort and EE cohort) was 100%.
The researcher himself was the interviewer and stressed that the interview
was totally for study purposes and it would not upset anybody in anyway. He also
explained all the instructions even though it was described in the consent form (See
Appendix F5). He prompted them to sign at the bottom of the consent form with date
where the space was provided. Data was collected through interviews from five
lecturers (3 ICT lecturers and 2 EE lecturers).
3.12.3 Students
Before all lecturers started administering the questionnaire, the researcher
visited the classroom and remained there for two minutes to explain slowly and
clearly about the consent form and research. The researcher introduced himself and
described about the purpose of the study, potential risks and benefits. He reminded
that they were free to withdraw at any time of the survey if they did not feel
comfortable with any words or sentences or for any other reasons and it would not
affect their test marks in anyway. He did not forget to mention that the participation
was completely voluntary and no incentives or compensation would be provided for
the participation. He also indicated that he would take all measures to protect the
participants’ anonymity. The students were informed not to write their names
anywhere in the questionnaire as it was essential that the questionnaires must be
anonymous for the purpose of confidentiality. The respondents were assured that the
research was purely for academic purposes. He exhorted all the students to read the
instructions on the consent form (See Appendix F3) very carefully, sign and enter the
date if they wished to participate. All respondents were requested to be as sincere in

109
their responses as possible. The respective lecturers who were in charge of
administering had taken over and the researcher left the classroom to make himself
an outsider. A researcher being an outsider might produce more benefits than being
an insider (Thapar-Bj¨orkert & Henry, 2004).
All the students (109 from ICT cohort and 46 from EE cohort) who participated
in this study returned the filled questionnaire to the lecturers who administrated the
questionnaire. All the respondents completed before the specified time indicated on
the questionnaire. All students in the sample participated in the survey. Therefore,
the response rate was 100%.
The researcher organised his office itself as the venue to conduct the
interview for the students. The researcher himself was the interviewer and stressed
that the interview was totally for study purposes and it would not trouble anybody in
anyways. He also explained all the instructions even though it was described in the
consent form (See Appendix F4). He prompted them to sign at the bottom of the
consent form with date where the space was provided. Data was collected through
interview from 14 ICT students (3, 4 and 7 from year levels 2, 3 and 4 respectively)
and four EE students (2, 2 from year levels 2 and 3 respectively). Therefore, totally
18 students were interviewed from ICT cohort and EE cohort. The next section
summarises this chapter.
3.13 Summary
The methodology adopted by the research was discussed in this chapter
under many sub-headings that started with the introduction. The research paradigm
followed was post-positivism that directed the focus of the study. The mixed method
approach that was adopted was discussed along with its features, advantages and
disadvantages. The research design that was used was described in detail. This
chapter also discussed about the population, sample selection and sample size by
clearly justifying the reasons for choosing them all in this study. The instruments
used for the data collection were expounded with the advantages and
disadvantages. This chapter also outlined negotiation of access to participants, pilot
study and how data was collected in pilot study. Validity, reliability and data

110
trustworthiness of the study were discussed. The ethical compliances were also
discussed in this chapter. This chapter also described how data was collected in the
main study. The chapter concluded with a brief summary of the chapter. The next
chapter presents the findings from the data collected and analysed.

111
CHAPTER FOUR
DATA ANALYSIS, INTERPRETATION AND DISCUSSION
4.1 Introduction
The research methodology which was used in this study was broadly
discussed and warranted in the previous chapter. The researcher described the
research paradigm, approach and design. The population and sample used in the
study were also discussed. The instruments that were used for the data collection
such as closed-ended questionnaire and interview were also explained. Data
collection procedures, analysis method, issues such as validity and reliability were
also highlighted. The researcher clearly described the different ethical measures that
were considered and used in this study. The aim of this chapter is to analyse and
present the data collected for the following sub-research questions:
(a) How do students, lecturers and managers differ in their views on the
effectiveness of tablet use for learning in university classrooms?
(b) How do lecturers and managers differ in their views on the effectiveness of tablet
use for teaching in university classrooms?
(c) How do students, lecturers and managers differ in their views on the advantages
and disadvantages of using tablets for learning and teaching?
(d) What feasible framework can be developed to enhance the use of tablets for
learning and teaching?
To address these questions, interviews were conducted and surveys were
distributed in the form of closed-ended questionnaire to the participants in a
university located in the Eastern Cape province of South Africa. The sample of this
study consisted of three types of participants such as students, lecturers and
managers. Furthermore, closed-ended questionnaires and interviews were also used
to collect the data from all types of participants.
The thematic approach was used with interview to analyse and triangulate to
confirm the findings. The data collected was analysed using some major themes and

112
sub-themes from the responses given by the participants to understand in depth
knowledge on the use of tablets for learning and teaching in classroom.
This chapter begins with the demographic information of the participants. This
information was used to assist the researcher in finding the elementary details of the
participants. All the participants gave comprehensive information to the best of their
knowledge with an awareness that the study was completely for the academic
purpose. Thereafter, this chapter discusses about the views of all stakeholders on
the effectiveness of tablet use for learning, views of lecturers and managers on the
effectiveness of tablet use for teaching, views of all stakeholders on the advantages
and disadvantages of using tablets for learning and teaching. While descriptive
analysis and inferential analysis were used to analyse the quantitative data, thematic
analysis was used to analyse the qualitative data.
The descriptive and demographic data were put into tables to compare
responses of students, lecturers and managers. Data collected from this study were
presented, analysed, triangulated and interpreted by assimilating both quantitative
and qualitative methods to corroborate the results (Marshall & Rossman, 2016).
4.2 Demographic data
The researcher collected personal information of the participants’ based on
the category of stakeholders. The stakeholders of this study included students,
lecturers and managers.
4.2.1 Students’ Demographic data
4.2.1.1 Survey
TABLE 4.1: Students’ gender
Gender Frequency Percent Valid Percent Cumulative Percent
Male 89 57.4 57.4 57.4
Female 66 42.6 42.6 100.0
Total 155 100.0 100.0

113
Table 4.1 indicates that there were about 57% male respondents and about
43% female respondents. Having more male respondents than females was not
intentional but indicated those who were willing to participate in this research.
TABLE 4.2: Students’ age group
Age Group Frequency Percent Valid Percent Cumulative Percent
17- 25 136 87.7 87.7 87.7
26 – 30 18 11.6 11.6 99.4
31 – 40 1 0.6 0.6 100.0
Total 155 100.0 100.0
From Table 4.2, it emerged that majority (88%) of the students were in the
age group of 17-25. A total of 12% of the students were in the age group of 26-30.
Only one student was in an age group of 31-40.
TABLE 4.3: Students’ national diploma
National Diploma Frequency Percent Valid Percent Cumulative Percent
ICT 109 70.3 70.3 70.3
EE 46 29.7 29.7 100.0
Total 155 100.0 100.0
Table 4.3 depicts that majority (70%) of the students who participated in the
study were registered for National Diploma: ICT and the remaining 30% of the
students in the study were registered for National Diploma: EE.
TABLE 4.4: Students’ level of study
Level of study Frequency Percent Valid Percent Cumulative Percent
Year 1 34 21.9 21.9 21.9
Year 2 65 41.9 41.9 63.9
Year 3 41 26.5 26.5 90.3
Year 4 and above 15 9.7 9.7 100.0
Total 155 100.0 100.0

114
A total of 22% of the students who responded in the survey were from year 1.
The majority (42%) of the students were from year 2 while about 27% of the students
were from year 3. Yet from year 4, only 10% responded.
4.2.1.2 Demographic characteristics of each student participated in the
interview
Table 4.5 displays the characteristics of each student who participated in the
interview according to their gender, age group, national diploma, branch and level of
study. Students were coded as StuInter 1 to StuInter 18.
TABLE 4.5: Demographic characteristics of each student participated in the
interview
Student Gender Age group National
diploma
Branch Level of
study
StuInter 1 Female 17-25 ICT BA Year 3
StuInter 2 Female 17-25 ICT BA Year 3
StuInter 3 Male 26-30 ICT BA Year 4
StuInter 4 Male 17-25 ICT CN Year 4
StuInter 5 Male 17-25 ICT CN Year 4
StuInter 6 Male 17-25 ICT CN Year 4
StuInter 7 Male 17-25 ICT CN Year 4
StuInter 8 Male 17-25 EE NA (Extended) Year 2
StuInter 9 Male 17-25 EE NA (Extended) Year 2
StuInter 10 Male 26-30 EE HC Year 3
StuInter 11 Male 17-25 EE HC Year 3
StuInter 12 Female 17-25 ICT NA (Extended) Year 2
StuInter 13 Female 17-25 ICT NA (Extended) Year 2
StuInter 14 Male 17-25 ICT NA (Extended) Year 2
StuInter 15 Female 17-25 ICT SD Year 3
StuInter 16 Female 17-25 ICT SD Year 3
StuInter 17 Female 17-25 ICT SD Year 4
StuInter 18 Male 17-25 ICT SD Year 4

115
Table 4.5 shows that except for two students of the age group of 26-30, all
students who participated in the interview were in the age group of 17-25. Moreover,
majority of the respondents were male. Similarly, the number of students from ICT
were more than the students from EE. Gathering data of students from various
branches of two departments enabled the researcher to understand deeply their
views of using tablets.
4.2.2 Lecturers’ demographic data
4.2.2.1 Survey
TABLE 4.6: Lecturers’ gender
Gender Frequency Percent Valid Percent Cumulative Percent
Male 9 64.3 64.3 64.3
Female 5 35.7 35.7 100
Total 14 100 100
Table 4.6 indicates that there were about 64% male respondents and about
36% female respondents. Having more male respondents than females was not
intentional but indicated those who were willing to participate in this research.
TABLE 4.7: Lecturers’ age group
Age group Frequency Percent Valid Percent Cumulative Percent
21- 30 1 7.1 7.1 7.1
31 – 40 10 71.4 71.4 78.6
41 – 50 3 21.4 21.4 100
Total 14 100 100
From Table 4.7, it emerged that majority (71.4%) of the lecturers were in the
age group of 31 - 40. About 21% of the lecturers were in the age group of 41 - 50. A
minor group of about 7.1% of the lecturers were in the age group of 21 – 30.

116
TABLE 4.8: Lecturers’ highest qualification
Highest
qualification Frequency Percent Valid Percent Cumulative Percent
B Tech 3 21.4 21.4 21.4
Honours 4 28.6 28.6 50
Masters 7 50 50 100
Total 14 100 100
Table 4.8 depicts that half (50%) of the total lecturers who participated in the
study were qualified with Masters. A total of 29% of the lecturers were Honours
holders and about 21% were B Tech holders.
TABLE 4.9: Lecturers’ department
Department Frequency Percent Valid Percent Cumulative Percent
ICT 10 71.4 71.4 71.4
EE 4 28.6 28.6 100
Total 14 100 100
Table 4.9 depicts that majority (71%) of the lecturers who participated in the
study were working in the department of ICT. Yet from the department of EE, only
29% responded.
TABLE 4.10: Lecturers’ lecturing experience
Lecturing
experience Frequency Percent Valid Percent Cumulative Percent
4<years>=2 2 14.3 14.3 14.3
6<years>=4 5 35.7 35.7 50
years>6 7 50 50 100
Total 14 100 100
Table 4.10 depicts that half (50%) of the total lecturers who participated in the
study had more than 6 years of experience in lecturing. A total of 36% of the
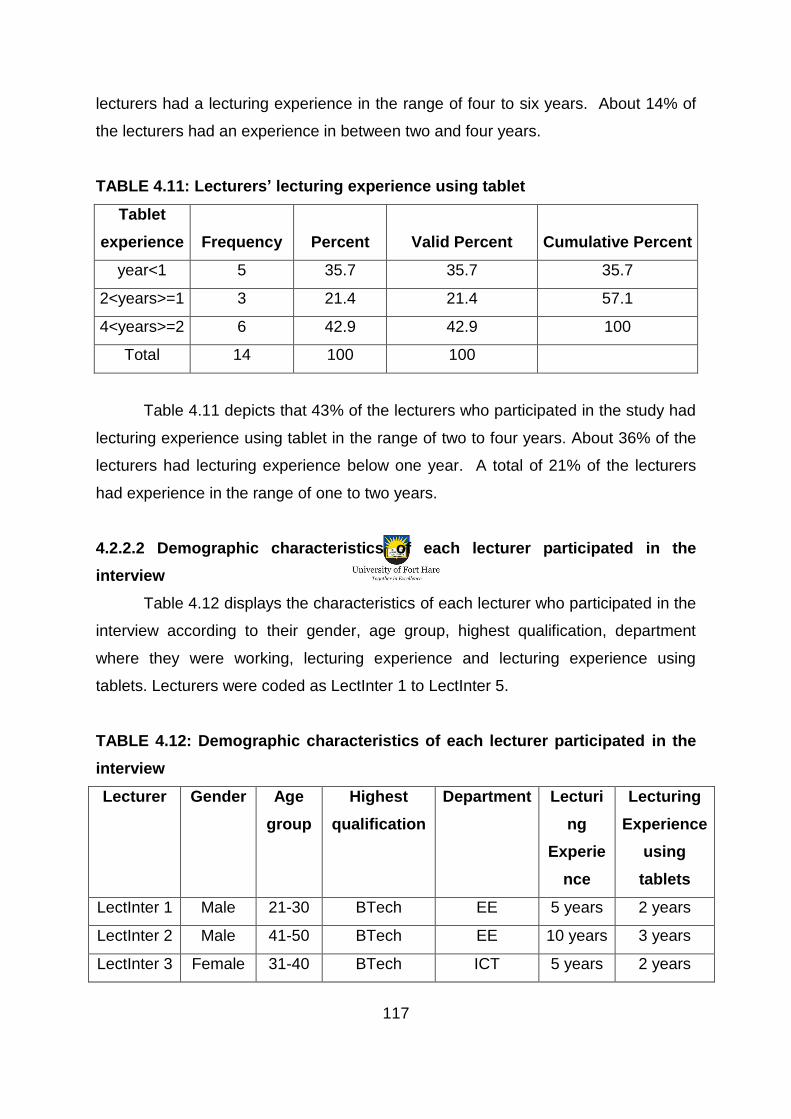
117
lecturers had a lecturing experience in the range of four to six years. About 14% of
the lecturers had an experience in between two and four years.
TABLE 4.11: Lecturers’ lecturing experience using tablet
Tablet
experience Frequency Percent Valid Percent Cumulative Percent
year<1 5 35.7 35.7 35.7
2<years>=1 3 21.4 21.4 57.1
4<years>=2 6 42.9 42.9 100
Total 14 100 100
Table 4.11 depicts that 43% of the lecturers who participated in the study had
lecturing experience using tablet in the range of two to four years. About 36% of the
lecturers had lecturing experience below one year. A total of 21% of the lecturers
had experience in the range of one to two years.
4.2.2.2 Demographic characteristics of each lecturer participated in the
interview
Table 4.12 displays the characteristics of each lecturer who participated in the
interview according to their gender, age group, highest qualification, department
where they were working, lecturing experience and lecturing experience using
tablets. Lecturers were coded as LectInter 1 to LectInter 5.
TABLE 4.12: Demographic characteristics of each lecturer participated in the
interview
Lecturer Gender Age
group
Highest
qualification
Department Lecturi
ng
Experie
nce
Lecturing
Experience
using
tablets
LectInter 1 Male 21-30 BTech EE 5 years 2 years
LectInter 2 Male 41-50 BTech EE 10 years 3 years
LectInter 3 Female 31-40 BTech ICT 5 years 2 years

118
LectInter 4 Male 31-40 Honours ICT 13 years Less than 1
year
LectInter 5 Male 31-40 Masters ICT 5 years 3 years
Table 4.12 shows that the age group of three lecturers were between 31 - 40.
The other two lecturers were in the age group of 21-30 and 41-50 respectively.
Moreover, except one lecturer, all other lecturers were male. Similarly, the highest
qualification of three lecturers was B Tech and the other two lecturers had Honours
and Masters respectively. Two lecturers from EE and three lecturers from ICT
department participated in the interview. Among all lecturers, three of them had a
lecturing experience of 5 years and the other two lecturers had it in the range of 10
to 13 years respectively. However, the tablet experience in classroom for two
lecturers were two years and other two lecturers had three years of experience. The
remaining lecturer had less than one year of experience in using tablets in
classroom.
4.2.3 Managers’ demographic data
4.2.3.1 Survey
TABLE 4.13: Managers’ gender
Gender Frequency Percent Valid Percent Cumulative Percent
Male 11 68.8 68.8 68.8
Female 5 31.3 31.3 100
Total 14 100 100
Table 4.13 indicates that there were about 69% male respondents and 31%
female respondents who participated in the interview. Having more male
respondents than females was not intentional but indicated those who were willing to
participate in this research.
TABLE 4.14: Managers’ age group
Age group Frequency Percent Valid Percent Cumulative Percent
21- 30 1 6.3 6.3 6.3

119
31 – 40 7 43.8 43.8 50.0
41 – 50 1 6.3 6.3 56.3
Above 50 7 43.8 43.8 100
Total 16 100 100
From Table 4.14, it emerged that the maximum number of managers who
participated in the survey were in the age groups of 31 – 40 and above 50. About
44% of the managers who participated were from each of the aforementioned age
group. Similarly, about 6% of the managers, each from the two age groups of 21 –
30 and 41 – 50, participated in the survey.
TABLE 4.15: Managers’ highest qualification
Highest
qualification Frequency Percent Valid Percent Cumulative Percent
B Tech 4 25.0 25.0 25.0
Honours 3 18.8 43.8 43.8
Masters 9 56.3 56.3 100
Total 16 100 100
Table 4.15 depicts that more than half (56%) of the total managers who
participated in the study were qualified with Masters. About 44% of the managers
were Honours holders and 25% were B Tech holders.
TABLE 4.16: Managers’ designation
Designation Frequency Percent Valid Percent Cumulative Percent
Dean 4 25.0 25.0 25.0
HOD 7 43.8 43.8 63.8
Ex PCO 4 25.0 25.0 93.8
e-learning
specialist 1 6.3 6.3 100
Total 16 100 100

120
Table 4.16 depicts that majority (44%) of the managers who participated in
the study were heads of the various departments. While 25% of managers were
deans another 25% were working as Ex PCOs. About 6% of the managers were
working as e-Learning specialists.
TABLE 4.17: Managers’ managing experience
Managing
experience Frequency Percent Valid Percent Cumulative Percent
year<1 2 12.5 12.5 12.5
4<years>=2 4 25.0 25.0 37.5
6<years>=4 4 25.0 25.0 62.5
years>6 6 37.5 37.5 100
Total 16 100 100
Table 4.17 depicts that majority (38%) of the managers who participated in
the study had more than 6 years of managing experience. A total of 25% of the
managers each from two to four years and four to six years of managing experience
participated in the survey. About 13% of the managers had managing experience of
below a year.
4.2.3.2 Demographic characteristics of each manager participated in the
interview
Table 4.18 displays the characteristics of each manager who participated in
the interview according to their gender, age group, highest qualification, designation
and managing experience. Managers were coded as ManInter 1 to ManInter 9.
TABLE 4.18: Demographic characteristics of each manager participated in the
interview
Managers Gender Age
group
Highest
qualification
Designation Managing
Experience
ManInter 1 Male 41-50 Masters Dean Exp>10 years
ManInter 2 Male 41-50 B Tech Ex PCO 4 years

121
ManInter 3 Male 41-50 Masters HOD 2 years
ManInter 4 Male 31-40 Honours HOD 2>=Exp<4
ManInter 5 Female Age>50 Masters HOD Exp>10
ManInter 6 Male Age>50 Masters HOD 10 years
ManInter 7 Female 31-40 B Tech e learning
administrator
2 years
ManInter 8 Male 31-40 Masters Ex PCO 1 year
ManInter 9 Female 31-40 Masters Institutional
Head of Ex
PCO
2 years
Table 4.18 shows that the age group of three managers were in between 41-
50 and four managers were in between 31-40. The other two managers were above
50 years of age. Moreover, except three managers, all other managers were male.
Similarly, the highest qualification of one of the managers was Honours and the
other two managers were holding B Tech. The highest qualification of all other
managers was Masters. Managers were the designated officials who were involved
in the implementation of tablet programme. These officials included one Dean, four
HODs, two Ex PCOs, an eLearning administrator and an Institutional Head of
Extended programme co-ordinator. Among all managers, three of them had a
managing experience of 10 plus years. Four managers had two and more than two
years of experience. The remaining two managers had one and four years of
experience respectively.
Descriptive analyses for demographic data for all stakeholders were carried
out only to give a broad profile of the sample, although there was no direct nexus
with the sub-research questions.
4.3 Data Presentation and Analysis
Data analysis can be defined as a process of bringing order, structure and
meaning of large thick description of collected data that consumes a high period of
time (De Vos, 2007). The quantitative data analysis involves a process of data
cleaning and data entry. The researcher of this study manually coded and entered

122
into Statistical Package for Social Sciences (SPSS version 24) programme.
Thematic analysis was used to analyse qualitative data. Responses from interviews
were sorted and grouped together based on similar themes. Themes are cyclical
patterns, views and concepts that might generate from the analysis of data (Bailey,
2007). This type of analysis is called thematic analysis where the researcher
searches for themes that address the sub-research questions and finds the
relationship among them. This enabled the researcher to understand the strengths
and weaknesses of using tablets in university classrooms from a holistic and
inclusive perspective of respondents. Data were merged by comparing thoroughly
the responses received through quantitative and qualitative. Quantitative results
were compared and discussed with qualitative results (Lincon & Guba, 1985;
Silverman, 2004). The data from both qualitative and quantitative methods were
interpreted to determine the meaning and overall findings of the study.
Surveys that were used for the main study included 30 (see Appendix A2 to
Appendix A5), 31 (see Appendix B2 to Appendix B5) and 8 (see Appendix C2) Likert
scale items in students’, lecturers’ and managers’ questionnaire respectively.
Furthermore, all items in the questionnaires were not answered by all stakeholders
of this study. However, almost all the items in the questionnaires were answered by
the stakeholders. The researcher had also collected eight responses from each
student (see Appendix D1), 14 responses from each lecturer (see Appendix D2) and
13 responses from each manager (see Appendix D3) in the form of interview.
Data were presented and analysed using tables that were structured on the
basis of each sub-research question of this study. Some of the items in each
questionnaire of the stakeholders were common for the purpose of triangulation. As
such, all the responses collected from the common items by all stakeholders for
each sub-research question were triangulated. Finally, the findings were briefly
discussed by comparing and reviewing with the previous literature.
Each sub-research question was answered on the basis of the mixture of
survey items from students, lecturers and managers. The first sub-research question
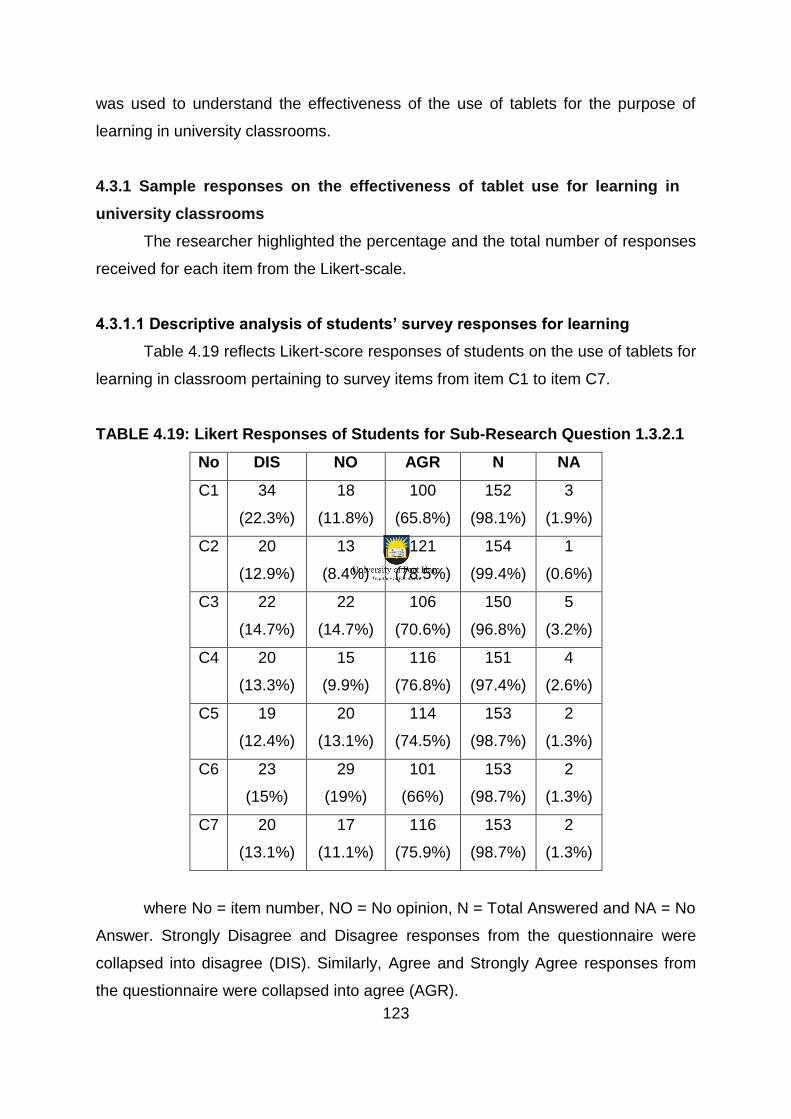
123
was used to understand the effectiveness of the use of tablets for the purpose of
learning in university classrooms.
4.3.1 Sample responses on the effectiveness of tablet use for learning in
university classrooms
The researcher highlighted the percentage and the total number of responses
received for each item from the Likert-scale.
4.3.1.1 Descriptive analysis of students’ survey responses for learning
Table 4.19 reflects Likert-score responses of students on the use of tablets for
learning in classroom pertaining to survey items from item C1 to item C7.
TABLE 4.19: Likert Responses of Students for Sub-Research Question 1.3.2.1
No DIS NO AGR N NA
C1 34
(22.3%)
18
(11.8%)
100
(65.8%)
152
(98.1%)
3
(1.9%)
C2 20
(12.9%)
13
(8.4%)
121
(78.5%)
154
(99.4%)
1
(0.6%)
C3 22
(14.7%)
22
(14.7%)
106
(70.6%)
150
(96.8%)
5
(3.2%)
C4 20
(13.3%)
15
(9.9%)
116
(76.8%)
151
(97.4%)
4
(2.6%)
C5 19
(12.4%)
20
(13.1%)
114
(74.5%)
153
(98.7%)
2
(1.3%)
C6 23
(15%)
29
(19%)
101
(66%)
153
(98.7%)
2
(1.3%)
C7 20
(13.1%)
17
(11.1%)
116
(75.9%)
153
(98.7%)
2
(1.3%)
where No = item number, NO = No opinion, N = Total Answered and NA = No
Answer. Strongly Disagree and Disagree responses from the questionnaire were
collapsed into disagree (DIS). Similarly, Agree and Strongly Agree responses from
the questionnaire were collapsed into agree (AGR).

124
When the SD and D columns were collapsed into disagree, the percentage of
student responses for the item C1 was 22.3%, item C2 was 12.9%, item C3 was
14.7%, item C4 was 13.3%, item C5 was 12.4%, item C6 was 15% and item C7 was
13.1%. It was observed that most of the students agreed on all seven items. The
percentage of students agreed for the item C1 was 65.8%, item C2 was 78.5%, item
C3 was 70.6%, item C4 was 76.8%, item C5 was 74.5%, item C6 was 66% and item
C7 was 75.9%. From table 4.19, it was clear that, above 70% of the students agreed
on the items from item C2 to item C5 and item C7. Moreover, above 65% of the
students agreed on item C1 and item C6. Five students did not attend item C3, four
students did not attend item C4 and three students did not attend item C1. Item C5,
item C6 and item C7 were not answered by two students and item C2 was not
answered by one student.
4.3.1.2 Descriptive analysis of managers’ survey responses for learning
Table 4.20 shown below describes the Likert-score response from managers
on their view on the students’ use of tablets for learning in classroom referring to
survey item B4.
TABLE 4.20: Likert Responses of Managers on students’ tablet use for Sub-
Research Question 1.3.2.1
No DIS NO AGR N NA
B2 0
(0%)
7
(43.75%)
9
(56.2%)
16
(100%)
0
(0%)
where No = item number, NO = No opinion, N = Total Answered and NA = No
Answer. From table 4.20, Strongly Disagree and Disagree responses from
questionnaire were condensed into disagree (DIS). Similarly Agree and Strongly
Agree responses from the questionnaire were condensed into agree (AGR).
More than 55% of the managers agreed that the academic results of students
had improved after incorporating tablets into education. This showed that tablet use

125
among students made a positive impact in their learning. Although all managers
answered and had no disagreements, 43.75% of the managers were uncertain.
4.3.1.3 Triangulation of descriptive analysis of students and lecturers survey
responses for learning through engagement and collaboration
Students’ responses pertained to survey items item D1, item D2, item D3,
item D5, item D6, item D7 and item D8 and Lecturers responses pertained to survey
items item C1, item C2, item C3, item C4, item C6, item C7 and item C8.
TABLE 4.21: Likert Responses of Students and Lecturers for Sub-Research
Question 1.3.2.1
P No DIS NO AGR N NA
S D1 41
(27%)
28
(18.4%)
83
(54.7%)
152
(98.1%)
3
(1.9%)
L C1
5
(35.7%)
3
(21.4%)
6
(42.8%)
14
(100%)
0
(0%)
S D2 53
(34.2%)
29
(18.7%)
73
(47.1%)
155
(100%)
0
(0%)
L C2 3
(21.4%)
1
(7.14%)
10
(71.4%)
14
(100%)
0
(0%)
S D3 41
(26.4%)
30
(19.4%)
84
(54.2%)
155
(100%)
0
(0%)
L C3 2
(14.2%)
4
(28.5%)
8
(57.1%)
14
(100%)
0
(0%)
S D5 21
(13.6%)
8
(5.2%)
125
(81.1%)
154
(99.4%)
1
(0.6%)
L C4 1
(7.6%)
4
(30.7%)
8
(61.4%)
13
(92.8%)
1
(7.2%)
S D6 39
(25.3%)
34
(22.1%)
81
(52.6%)
154
(99.4%)
1
(0.6%)
L C6 2
(14.2%)
5
(35.7%)
7
(50%)
14
(100%)
0
(0%)

126
S D7 11
(7.1%)
8
(5.2%)
136
(87.7%)
155
(100%)
0
(0%)
L C7 0
(0%)
4
(28.5%)
10
(71.3%)
14
(100%)
0
(0%)
S D8 13
(8.4%)
6
(3.9%)
136
(87.8%)
155
(100%)
0
(0%)
L C8 1
(7.1%)
4
(28.5%)
9
(64.2%)
14
(100%)
0
(0%)
where P = Participant (Possible values for “P” participant are S = Student and
L = Lecturer), No = item number, NO = No opinion, N = Total Answered and NA = No
Answer. Strongly Disagree and Disagree responses from the questionnaire were
collapsed into Disagree (DIS). Similarly, Agree and Strongly Agree responses from
the questionnaire were collapsed into Agree (AGR).
Item C2 of lecturer and item D2 of students pertained to the same statement
as to whether tablets helped students to participate more in class during the tablet
activities than during activities that did not use tablet. The percentage of lecturers
agreed for the item C2 was 71.4%. However, students who agreed for item D2 were
only 47.1%. It was observed that 54.7% of students and 42.8% of lecturers had
agreed to item D1 of students and item C1 of lecturers that the tablet activities
motivated students to learn the course material more than the class activities that did
not use tablet. The percentage of agreeing for the students’ item D3 and lecturers’
item C3 were almost in the same range which were 54.2% and 57.1% respectively.
Similarly, item D6 of students and item C6 of lecturers agreed (AGR) with the
percentage around 50% that the tablet activities helped students to participate in
quiz as a team. 81.1% of the students and 61.4% of the lecturers agreed that tablets
made it easier for students to understand the topics when they learned in a group
which came under item D5 of students and item C4 of lecturers. Additionally, item D7
of students and item C7 of lecturers revealed that 87.7% of students and 71.3% of
lecturers agreed that tablets helped students to gather information for the group
project work. Likewise, 87.8% (item D8) of the students and 64.2% (item C8) of the
lecturers supported to the fact that tablets helped students in group discussion.

127
4.3.1.4 Triangulation of inferential analysis of students’ and lecturers’ survey
responses for learning
An Independent Samples t-test was used by the researcher to compare the
scores of the mean on some continuous variables for two different groups of
participants. From the results, if the significance level of Levene’s test is larger than
0.05, then it indicates that the data support the assumption of equal variance. On
other hand, if the Sig. value is 0.05 or less, then it shows that variances of two
groups are not the same and hence data violate the assumption of equal variance.
The following tables explore the views of different stakeholders such as
students and lecturers in learning using tablet technology. The two variables used in
this test were stakeholders (categorical, independent variable) and the total score
that participants have recorded for items related to learning (continuous, dependent
variable). This test determines whether there is a statistically significant difference in
the mean scores of two categorical groups such as students and lecturers in terms of
their total scores.
TABLE 4.22: Group Statistics of Learning score
Group Statistics
STAKEHOLDERS N Mean Std. Deviation Std. Error Mean
Learning
Score
Student 155 25.12 4.926 .396
Lecturer 14 24.36 3.835 1.025

128
TABLE 4.23: Independent Samples t-test for Learning
Independent Samples Test
Levene's Test
for Equality of
Variances t-test for Equality of Means
F Sig. t Df
Sig.
(2-
tailed)
Mean
Differ
ence
Std.
Error
Differ
ence
95%
Confidence
Interval of the
Difference
Lower Upper
Learni
ng
Score
Equal
variances
assumed
.588 .444 .56
6
167 .572 .765 1.353 -1.907 3.437
Equal
variances
not
assumed
.69
7
17.
130
.495 .765 1.099 -1.551 3.082
An Independent Samples t-test was conducted to compare the views of
students and lecturers in learning at a 5% level of significance (ie. ά = 0.05). The
results showed that there was no significant difference (t (167) = 0.566; p (2-tailed)
=0.572) in the views of students (M=25.12; SD=4.926) and lecturers (M=24.36;
SD=3.835). The differences in the means was 0.765 with 95% CI: -1.907 to 3.437.
Therefore, the results showed that the views of students and lecturers were same on
the effectiveness of tablet use for learning in university classrooms and it had an
equal effect over all participants.
The analysis of interview is captured through categorising the factors that
emerged as themes during the process of coding and theme analysis.
Table 4.24 reflects the theme and sub themes that were extracted from the
responses of students for Sub-Research Question 1.3.2.1.

129
TABLE 4.24: Themes and sub-themes regarding the students’ responses of
tablet use for learning
THEME SUB THEME ISSUES RAISED
Effectiveness of tablet use
for learning
Enhancement of skills The respondents indicated
that tablet use had
enhanced their skills and
learning capabilities with
the help of WI-FI
connection.
Engagement and
Collaboration with lecturer
Majority of the
respondents have stated
that tablets were very
good tool to engage with
their lecturers.
Engagement and
Collaboration with
classmates
Students engaged and
collaborated with their
classmates by making use
of different social
networking application for
the learning purpose.
4.3.1.5 Students’ interview responses: Enhancement of skills
Majority of the respondents had a positive experience as it had enhanced
their skills and learning capabilities.
StuInter 4: “I start learning how to connect to Wi-Fis, I start learning to access
other applications through the internet. So I think I do learn something when you get
those tablets”.
Other students such as StuInter 2, StuInter 5, StuInter 6, StuInter 7, StuInter
10 and StuInter 16 were corroborating to the view of StuInter 4, as they were also
enhanced in learning using tablets with the help of internet getting through WI-FI.
StuInter 3 was fond of reading notes on tablets. However, StuInter 8 and StuInter 18

130
had a negative impression on tablets. StuInter 8 averred that as tablets did not have
sim card slots, it was difficult to access internet all the time. Moreover, StuInter 18
preferred to follow the old method of hard copies to read notes.
4.3.1.6 Students’ interview responses: Engagement and collaboration with
lecturer
Most of the respondents such as StuInter 4, StuInter 5, StuInter 6 and StuInter
17 alluded to the fact that they collaborated with the lecturers through emails and
Wiseup (An online learning and teaching application installed in university for the
need of students and lecturers).
StuInter 1: “Here at school there is an app called Wiseup. That’s.. That’s is
where we collaborate with our lecturer and taking notes.. and assignments and
putting our research or something”.
Conversely, StuInter 2, StuInter 11 and StuInter 14 contradicted the others’
responses as they had a negative impression on collaboration with the lecturers.
4.3.1.7 Students’ interview responses: Engagement and Collaboration with
classmates
StuInter 1, StuInter 3, StuInter 6 and StuInter 17 stated that they
communicated and collaborated with their classmates only when they could access
WI-FI or internet. Even though, they were in group discussions, most of them had
issues as they could not access internet due to the unavailability of the sim card
facility on their tablets. Internet or WI-FI was accessible to them only when they were
in the campus.
StuInter 11: “We are discussing some topics that we have been given by the
lecturer, so that we will be getting some new things from one another with the help of
tablets”.
StuInter 2, StuInter 5 and StuInter 18 contradicted with others responses as
they believed that collaboration was not active between classmates.

131
The following table shows the theme and sub themes that were extracted
from the responses of lecturers for Sub-Research Question 1.3.2.1.
TABLE 4.25: Themes and sub-themes regarding the lecturers’ responses of
the use of tablets for learning
THEME SUB THEME ISSUES RAISED
Effectiveness of tablet use
for learning
Curriculum change for
tablets
The contents in the
curriculum was not
needed to be changed for
tablets.
Students’ tablet activities Students used tablets for
various learning purposes
and the use depends on
the topic that they are
learning in class.
Enhancement of skills Students had enhanced
their skills in learning after
the adoption of tablets.
Engagement and
Collaboration between
students
All the respondents had
the same view that tablets
were making an
engagement and
collaboration among
students.
4.3.1.8 Lecturers’ interview responses: Curriculum change for tablets
On the aspect of curriculum, most of the respondents suggested that changes
must be made in the way topics were delivered using tablets in class but not in the
curriculum.
LectInter 3: “No. No need to make changes in the curriculum. Whatever we
are using that must be in line with the Technology”.

132
LectInter 1: “It is a tool that is not changing the content. So if needs for the
content to be changed, then it should be for the other reasons but not for tablets”.
On the other hand, LectInter 2 had a different view that the curriculum needed
to be changed for the tablets.
4.3.1.9 Lecturers’ interview responses: Students’ tablet activities
Students used tablets in classroom for different learning activities based on
the module they learn at that particular point of time. LectInter 3 and LectInter 4
noticed that their students were in the internet to do group discussion and share
information. LectInter 1 noticed that his students were using eBooks to read in class
using tablets.
LectInter 5: “I ask students to do presentations so it is nice to see them having
the tablet and they look smart”.
However, LectInter 2 preferred the old method of paper and pencil to draw
schematics and layouts than using tablets just to view it. “Tablet will only show you
the schematics whereas if you do it by hand it will go into your brains”.
4.3.1.10 Lecturers’ interview responses: Enhancement of skills
All the lecturers had the same opinion that tablets had enhanced their learning
capabilities and developed their skills.
LectInter 1: “they can do the assignments in their comfort zone”.
LectInter 3 corroborated with the view of LectInter 1 by mentioning that “since
they are having the black board or in other words Wiseup, so its easy for them to
access their assignment and they can respond”.

133
While LectInter 4 stated that students had started reading eBooks using
tablets, LectInter 2 emphasized that tablet was a tool that had not only advantages
but also disadvantages.
4.3.1.11 Lecturers’ interview responses: Engagement and Collaboration
between students
Tablets helped students to engage and collaborate with their classmates for
the purpose of learning. LectInter 1 indicated that students created a Whatsapp
group for their class and even if they were not in campus premises, students could
still communicate between each other and share the handouts in Whatsapp.
LectInter 2 substantiated that if the lecturer gave a task to one student to pass to
others, then they would share and discuss with others through Whatsapp using
tablets and later meet physically as a group.
The theme and sub themes that were obtained from the responses of
managers for Sub-Research Question 1.3.2.1 are shown below in Table 4.26.
TABLE 4.26: Themes and sub-themes regarding the managers’ responses of
the use of tablets for learning
THEME SUB THEME ISSUES RAISED
Effectiveness of tablet use
for learning
Pass rate Managers indicated that
the pass rate of the
students for the past three
years had improved after
the adoption of tablets.
Tablet Training Training was offered to the
students on how to use
the tablets and it was
effective.
Enhancement of skills Managers had a positive
response on the
enhancement of students’

134
skills.
Curriculum change for
tablets
Majority of the
respondents were of the
view that curriculum did
not need to be changed
but the change should be
in the way the curriculum
was delivered.
4.3.1.12 Managers’ interview responses: Pass rate
Since 2013, the pass rate of the students had been improving in many
departments after the implementation of tablets. The response of ManInter 9
coincided with the ManInter 1 and ManInter 7. ManInter 9 indicated that:
We are under the impression that it has improved in terms of data that we are getting from the Departments. It seems to have improved. When we look at the data, we have high pass rate in extended program as a whole and they have been increasing as well in the past 3 years because we have been implementing for 3 years since 2013.
ManInter 2 and ManInter 3 pointed out that pass rate had improved but they
did not completely believe that it was mainly due to the tablets. However, they
agreed that tablet also had a vital role in the improvement of pass rate of students.
4.3.1.13 Managers’ interview responses: Tablet Training
Students had received training from the CLTD and overall the training was
very effective.
ManInter 5: “Yeah they went for the training. I think it was effective. They
check wiseup using tablets. They check their marks and also use it for internet”.
ManInter 2 concurred with the ManInter 5 and indicated that “CLTD has given
the training to the students on the very same day that they have issued the tablet”.
4.3.1.14 Managers’ interview responses: Enhancement of skills
All the respondents had a positive response that the use of tablets had
improved the learning capabilities of students.

135
ManInter 3: “I would like to think that it has enhanced student’s skills. Because
it has also shown the throughput rate has improved. So it should have definitely
improved students skill”.
Consistent to the earlier response, ManInter 4 responded that:
I think it has given them another way in which they can improve their learning. For example, they have access not just the library at which is a traditional tool or a learning tool but they also have the access to the internet which has wealth of information. So they have increased their learning skills a lot.
ManInter 6 also supported to the view of ManInter 3 and ManInter 4.
4.3.1.15 Managers’ interview responses: Curriculum change for tablets
Curriculum is based on the outcome of any particular subject. Majority of the
respondents held the view that it was not necessary to change the curriculum for the
sake of tablets. ManInter 4 indicated that:
I don't think that curriculum needs to be changed. Because I think the curriculum has its own learning outcomes. I think what needs to change is the way that the curriculum is delivered and also the way it is accessed.
ManInter 3 also had a similar view “I don't think curriculum needs to be
changed but because tablet is just a tool to learn just like a book which you have lot
textbooks or a reading material”.
Conversely two respondents: ManInter 5 and ManInter 8 had a different view
that curriculum needed to be slightly modified.
4.3.1.16 Triangulation of interview responses of stakeholders for learning
Table 4.27 shows the comparison of interview responses collected from
students and lecturers on students’ engagement and collaboration in classroom.
Both the participants articulated to the fact that tablets made a positive impact
among students in developing the communication, engagement and collaboration.

136
TABLE 4.27: Triangulation: Engagement and Collaboration
SUB THEME STUDENTS LECTURERS
Engagement and
Collaboration
Students engaged and
collaborated with their
classmates by the use of
different social networking
applications for the learning
purpose.
All the respondents had the
same view that tablets made
an engagement and
collaboration among
students.
Table 4.28 shows the comparison of interview responses collected from
lecturers and managers on the curriculum for learning and teaching. Lecturers and
managers were of the same view that the tablet was a tool which was used to
enhance learning and teaching of the topics that were in the curriculum and it need
not be changed for the sake of tablets.
TABLE 4.28: Triangulation: Curriculum change for tablets
SUB THEME LECTURERS MANAGERS
Curriculum
change for
tablets
The contents in the
curriculum need not to be
changed for tablets.
Majority of the respondents
were of the view that
curriculum need not to be
changed but the change
should be in the way the
curriculum was delivered.
Table 4.29 shows the comparison of interview responses collected from
students, lecturers and managers on enhancing students’ skills. All the stakeholders
had a mutual response that tablets had enhanced the students learning skills and
capabilities. It has also helped students to learn the content in various styles.

137
TABLE 4.29: Triangulation: Enhancement of skills
SUB THEME STUDENTS LECTURERS MANAGERS
Enhancement of
skills
The respondents
indicated that
tablet use had
enhanced
student’s skills
and learning
capabilities with
the help of WI-FI
connection.
Students had
enhanced their
skills in learning
after the
adoption of
tablets.
Managers had a
positive response on
the enhancement of
students’ skills.
4.3.2 Sample responses on the effectiveness of tablet use for teaching in
university classrooms
Closed ended responses were collected from lecturers and managers to seek
the effectiveness of tablet use for teaching in university classrooms. As students did
not have any role in the area of teaching using tablet, they were excluded from the
survey for sub-research question 1.3.2.2. The researcher highlighted the percentage
and the total number of responses received for each item from the Likert-scale.
4.3.2.1 Descriptive analysis of lecturers’ survey responses for teaching
Tables 4.30 reflects Likert-score responses of lecturers on the use of tablets
for teaching in classroom that pertain to survey items from item E1 to item E10.
TABLE 4.30: Likert Responses of Lecturers for Sub-Research Question 1.3.2.2
No DIS NO AGR N NA
E1 9
(81.2%)
0
(0%)
2
(18.1%)
11
(78.5%)
3
(21.4%)
E2 1
(8.3%)
3
(25%)
8
(66.6%)
12
(85.7%)
2
(14.2%)
E3 3
(23%)
3
(23%)
7
(53.7%)
13
(92.8%)
1
(7.1%)

138
E4 1
(7.6%)
4
(30.7%)
8
(61.4%)
13
(92.8%)
1
(7.1%)
E5 1
(7%)
4
(28.5%)
9
(64.2%)
14
(100%)
0
(0%)
E6 4
(28.5%)
3
(21.4%)
7
(50%)
14
(100%)
0
(0%)
E7 3
(21.4%)
3
(21.4%)
8
(57.1%)
14
(100%)
0
(0%)
E8 2
(14.2%)
7
(50%)
5
(35.6%)
14
(100%)
0
(0%)
E9 1
(7.1%)
5
(35.7%)
8
(57.1%)
14
(100%)
0
(0%)
E10 3
(21.3%)
6
(42.8%)
5
(35.6%)
14
(100%)
0
(0%)
where No = item number, NO = No opinion, N = Total Answered, NA = No
Answer, Disagree (DIS) and Agree (AGR).
When Strongly Disagree and Disagree columns in the questionnaire were
collapsed into Disagree (DIS), the percentage of lecturers’ responses was 81.2%
(Item E1), 8.3% (Item E2), 23% (Item E3), 7.6% (Item E4), 7% (Item E5), 28.5%
(Item E6), 21.4% (Item E7), 14.2% (Item E8), 7.1% (Item E9) and 21.3% (Item E10).
It was observed that a majority agreed (AGR) on nine items and they were Item E2
(66.6%), Item E3 (53.7%), Item E4 (61.4%), Item E5 (64.2%), Item E6 (50%), Item
E7 (57.1%), Item E8 (35.6%), Item E9 (57.1%) and Item E10 (35.6%). As can be
seen from Table 4.30, above 61% of students agreed on item E2, item E4 and item
E5. About 57.1% of students agreed on item E7 and item E9. While 53.7% of
students agreed on item E3, only 50% agreed on item E6. Furthermore, 35.6% of the
students agreed on item E8 and item E10. However, 81.2% of the students
disagreed with item E1. While three students did not answer item E1 and two
students did not answer item E2, one student did not answer item E3 and item E4.

139
4.3.2.2 Triangulation of descriptive analysis of lecturers and managers’ survey
responses for teaching
Likert scale responses collected from lecturers and managers on lecturers’
use of tablets for teaching is as shown below in table 4.31. Lecturers’ responses
pertained to survey items item E4, item E5 and item E9 and manager’s responses
pertained to survey items item B3, item B4 and item B1.
TABLE 4.31: Likert Responses of Lecturers and Managers for Sub-Research
Question 1.3.2.2
P No DIS NO AGR N NA
L E4
1
(7.6%)
4
(30.7%)
8
(61.4%)
13
(92.8%)
1
(7.1%)
M B3 3
(18.7%)
9
(56.2%)
4
(25%)
16
(100%)
0
(0%)
L E5
1
(7%)
4
(28.5%)
9
(64.2)
14
(100%)
0
(0%)
M B4 1
(6.2%)
1
(6.2%)
14
(87.4%)
16
(100%)
0
(0%)
L E9
1
(7.1%)
5
(35.7%)
8
(57.1%)
14
(100%)
0
(0%)
M B1 2
(12.4%)
5
(31.2%)
9
(56.2%)
16
(100%)
0
(0%)
where P = Participant (Possible values for “P” participant are L = Lecturer and
M = Manager), No = item number, NO = No opinion, N = Total Answered and NA =
No Answer. Strongly Disagree and Disagree responses from the questionnaire were
collapsed into Disagree (DIS). Similarly, Agree and Strongly Agree responses from
the questionnaire were collapsed into agree (AGR).
It was observed that 61.4% of lecturers and a minor group of 25% of
managers had agreed to item E4 of lecturers and item B3 of managers that the use

140
of tablet helped the lecturers to complete the curriculum on time. Majority (56.2%) of
managers were in neutral for this statement as they did not want to state any
opinions. Item E5 of lecturer and item B4 of managers were about the same
statement as to whether there was any need for the current curriculum to be adapted
or not for effective use of tablet. The percentage of lecturers agreed for item E5 was
64.2%. However, managers agreed for the item B4 was only 87.4%. Furthermore,
the percentage of lecturers agreed for item E9 and managers agreed for item B1
were almost in the same range which were 57.1% and 56.2% respectively. Both
parties supported the statement that the tablet activities helped lecturers to develop
their skills that applied to their academic career. Overall, Table 4.31 indicates that
majority of both lecturers and managers agreed on the statements “Current
curriculum should be adapted for effective use of tablet” (Lecturer: item E5 and
Manager: item B4) and “Tablet helped the lecturers to develop skills that apply to
their academic career” (Lecturer: item E9 and Manager: item B1). Despite lecturers
(item E4) agreed that they were able to complete the curriculum on time or fast using
tablets, majority of the managers (item B3) indicated a neutral stance on the same.
4.3.2.3 Triangulation of inferential analysis of lecturers and managers survey
responses for teaching
The tables shown below explore the views of different stakeholders such as
lecturers and managers in teaching using tablet technology. The two variables used
in this test were stakeholders (categorical, independent variable) and the total score
that participants recorded for items related to teaching (continuous, dependent
variable). This tests whether the variation of the scores for the two groups (lecturers
and managers) in the categorical variable are same or not.
TABLE 4.32: Group Statistics of Teaching score
Group Statistics
STAKEHOLDERS N Mean
Std.
Deviation
Std. Error
Mean
TEACHING
SCORE
Lecturer 14 10.64 2.170 .580
Manager 16 10.75 2.113 .528

141
TABLE 4.33: Independent Samples Test for Teaching
Independent Samples Test
Levene's
Test for
Equality of
Variances t-test for Equality of Means
F Sig. t df
Sig.
(2-
tailed)
Mean
Differe
nce
Std.
Error
Differe
nce
95%
Confidence
Interval of the
Difference
Lower Upper
TEACH
ING
SCORE
Equal
variances
assumed
.069 .794 -.137 28 .892 -.107 .783 -1.711 1.497
Equal
variances
not
assumed
-.137 27.
260
.892 -.107 .785 -1.716 1.502
An independent-samples t-test was performed to compare the views of
stakeholders (lecturers and managers) with their scores on teaching. There was no
significant difference in the scores of students (M=10.64, SD=2.17) and lecturers
(M=10.75, SD=2.113); t (28) =-0.137, p (2-tailed) = 0.892 which was much greater
than 0.05. 95% confidence interval around difference between the group mean was -
1.711 and 1.497 and mean difference was -.107. Hence the results indicated that
there were no differences in the views of lecturers and managers on the
effectiveness of tablet use for teaching in university classrooms.
The researcher had collected interview responses from lecturers and
managers and major themes were developed based on sub-research question
1.3.2.2. Sub-themes were formulated from these major themes. Under each sub-
theme, interview responses were discussed and interpreted.

142
Table 4.34 reflects the theme and sub themes that are extracted from the
responses of lecturers for Sub-Research Question 1.3.2.2.
TABLE 4.34: Themes and sub-themes regarding the lecturers’ responses to
the use of tablets for teaching
THEME SUB THEME ISSUES RAISED
Effectiveness of tablet use
for teaching
Tablet Training Reponses received from
respondents were a
mixture of both sides such
as received training and
not received training.
Teaching apps Majority of the
respondents had stated
that they were not using
apps for the teaching
purposes.
Before integrating tablets All mentioned that it had
been challenging during
the earlier days and now it
was easy to teach in the
classroom.
4.3.2.4 Lecturers’ interview responses: Tablet Training
On the aspect of tablet training, the researcher received a mixture of
responses. Some respondents mentioned that they had received training. Other
respondents indicated that they had not received any training for tablet use. One
respondent mentioned that he received training. However, it was not the training that
CLTD were supposed to provide.
LectInter 2: “We did attend a short course. Information about how to operate
and integrate. They were explaining all useful applications that are useful for
teaching and it was effective for me”.

143
LectInter 3’s response was consistent with the response of LectInter 2.
LectInter 3 affirms that “It has helped us how to use the tablet for teaching purpose”.
On the other hand, LectInter 1 and LectInter 5 opined that they had never
received training on how to use the tablets effectively in classroom.
4.3.2.5 Lecturers’ interview responses: Teaching apps
Most of the respondents alluded to the fact that they were not using
pedagogical apps for lecturing. Only one respondent indicated that she used
different apps in the classroom.
LectInter 2: “The newly tablets are coming with the apps but I haven't explored
them yet but I think they're useful”.
LectInter 1 and LectInter 4 stressed that they did not use teaching apps which
were installed in tablets. While LectInter 3 used the pedagogical apps such as Excel,
Word, PowerPoint and Microsoft Publisher, LectInter 5 used tablets only for
Blackboard or Wiseup app for the purpose of effective teaching.
4.3.2.6 Lecturers’ interview responses: Before integrating tablets
Respondents indicated that it was challenging in the olden days and now it is
much easier to teach in classroom.
LectInter 4: “It was challenging in the olden days. We have to print the notes
for them so it was a challenging in the preparation of going to the class”.
LectInter 3: “It was difficult at that time because we need to draw the diagram
on the board”.
The following table shows the theme and sub themes that are extracted from
the responses of managers for Sub-Research Question 1.3.2.2.

144
TABLE 4.35: Themes and sub-themes regarding the managers’ responses to
the use of tablets for teaching
THEME SUB THEME ISSUES RAISED
Effectiveness of tablet use
for teaching
After integrating tablets The lecturers used the
tablets for various
teaching purposes and the
tablet use depends on the
topic that they are
teaching in class.
Tablet Training CLTD had offered an
intensive training to
lecturers and it was highly
effective.
Enhancement of skills All the respondents had
the same view that use of
tablets was improving the
skills of lecturers in
teaching.
Curriculum change for
tablets
Majority of the
respondents averred that
there was no need to
change the curriculum.
4.3.2.7 Managers’ interview responses: After integrating tablets
All the respondents responded positively due to the tremendous change that
they had witnessed in lecturers’ instructional methodology.
ManInter 1: “I would say that they are more enthusiastic now do use the
tablets for the teaching purpose”.
ManInter 3: “I think the lecturers and the students they all are excited in using
the technology and it is enhancing the teaching and learning and it is improving the
pass rate”.

145
One respondent asserted that it was the blended learning which was taking
place after the integration of tablets in learning and teaching,
4.3.2.8 Managers’ interview responses: Tablet Training
All the respondents had the same response that lecturers had received
training in order to use the tablet effectively in classroom for the purpose of teaching.
ManInter 9 added that from the following year onwards more intensive trainings were
going to be conducted for lecturers.
ManInter 4: “The department itself has not done any training but there was a
training that was offered by CLTD department in order to use the tablets effectively in
the classroom for teaching purpose”.
ManInter 5: “Yes the training itself was a success but I'm not sure about the
implementation”.
4.3.2.9 Managers’ interview responses: Enhancement of skills
Use of tablets in classroom made a positive impact on lecturer’s skill and
instructional methodology. ManInter 3 indicated that:
It has enhanced. It makes teaching and learning a lot easier than rely on just talking and all that. There is a quickly reference, you can quickly reference your talk in class and quickly connect to the Wi-Fi and also downloading books on the tablet and gives us quick reference.
In ManInter 6’s point of view, these tablets must be provided to the other
lecturers also who are lecturing the main stream courses in the university as it had
enhanced the teaching capability of extended stream lecturers.
ManInter 1: “You may not necessarily be in front of the students all the time.
You can give the work even if you are not there physically”.
4.3.2.10 Managers’ interview responses: Curriculum change for tablets
Most of the respondents stated that the way the curriculum was delivered or
the current curriculum plan must change and not changing the curriculum.

146
ManInter 2: “I think we can just integrate the tablet but otherwise changing the
curriculum I don't think so”.
ManInter 9 articulated that rather than changing the curriculum, curriculum
plan must be changed and it had to be done by lecturers in each department. This
would help the CLTD to understand what gadgets were required for each lecturer to
lecture each topic effectively in their curriculum. However, ManInter 6 had a different
view that:
It is really a matter of changing the curriculum. There may be some aspects that we need to be adapted to actually fit with the one that we are using with this electronic device. It is not a whole fail to the change of entire curriculum.
4.3.2.11 Triangulation of interview responses of lecturers and managers on
teaching
Table 4.36 shows the comparison of interview responses collected from
lecturers and managers on tablet training.
TABLE 4.36: Triangulation: Tablet Training
SUB THEME LECTURERS MANAGERS
Tablet Training Reponses received from
respondents were a mixture
of both sides such as
received training and not
received training.
CLTD had offered an
intensive training to
lecturers and it was highly
effective.
4.3.3 Sample responses on the advantages and disadvantages of using
tablets for learning and teaching
Closed ended responses were collected from students, lecturers and
managers to understand the advantages and disadvantages of using tablets for
learning and teaching.

147
4.3.3.1 Triangulation of descriptive analysis of students and lecturers survey
responses on students’ activities using tablet
Likert scale responses collected from students and lecturers on students’ use
of tablets in classroom is as shown below in table 4.37. Students’ responses
pertained to survey items from item B1 to item B10 and Lecturers’ responses
pertained to survey items from item B1 to item B10.
TABLE 4.37: Likert Responses of Students and Lecturers for Sub-Research
Question 1.3.2.3
P No DIS NO AGR N NA
S B1 60
(39.2%)
0
(0%)
93
(60.7%)
153
(98.7%)
2
(1.2%)
L B1 0
(0%)
2
(14.2%)
12
(85.6%)
14
(100%)
0
(0%)
S B2 88
(58.6%)
0
(0%)
62
(41.3%)
150
(96.7%)
5
(3.2%)
L B2 4
(28.5%)
1
(7.1%)
9
(64.2%)
14
(100%)
0
(0%)
S B3 16
(10.4%)
0
(0%)
136
(89.4%)
152
(98%)
3
(1.9%)
L B3 2
(14.2%)
2
(14.2%)
10
(71.3%)
14
(100%)
0
(0%)
S B4 7
(4.6%)
0
(0%)
143
(95.3%)
150
(96.7%)
5
(3.2%)
L B4 2
(14.2%)
3
(21.4%)
9
(64.2%)
14
(100%)
0
(0%)
S B5 40
(26.3%)
0
(0%)
112
(73.5%)
152
(98%)
3
(1.9%)
L B5 1
(7.1%)
5
(35.7%)
8
(57.1%)
14
(100%)
0
(0%)
S B6 11
(7%)
1
(0.6%)
143
(92.2%)
155
(100%)
0
(0%)

148
L B6 1
(7.1%)
8
(57.1%)
5
(35.6%)
14
(100%)
0
(0%)
S B7 9
(5.7%)
3
(1.9%)
143
(92.1%)
155
(100%)
0
(0%)
L B7 4
(28.5%)
5
(35.7%)
5
(35.6%)
14
(100%)
0
(0%)
S B8 10
(6.3%)
3
(1.9%)
142
(91.5%)
155
(100%)
0
(0%)
L B8 2
(14.2%)
2
(14.2%)
10
(71.3%)
14
(100%)
0
(0%)
S B9 10
(6.3%)
3
(1.9%)
142
(91.5%)
155
(100%)
0
(0%)
L B9 2
(15.3%)
5
(38.4%)
6
(46%)
13
(92.8%)
1
(7.1%)
S B10 11
(7%)
2
(1.2%)
142
(91.5%)
155
(100%)
0
(0%)
L B10 3
(23%)
1
(7.6%)
9
(69.1%)
13
(92.8%)
1
(7.1%)
where P = Participant (Possible values for “P” participant are S = Student and
L = Lecturer), No = item number, NO = No opinion, N = Total Answered and NA = No
Answer. While Strongly Disagree and Disagree responses from the questionnaire
were collapsed into disagree (DIS), Agree and Strongly Agree were collapsed into
agree (AGR).
It was observed that 89.4% and 71.3% of the students and lecturers
respectively had agreed to the statement (item B3) that they conducted research
after getting tablets. The table 4.37 shows that item B2 was a mixed set of
responses for students and lecturers. 58.6% of students disagreed to the statement
that they started to communicate with the lecturer. However, 64.2% of the lecturers
had a belief that students started to communicate with lecturers. 60.7% of the
students and 85.6% of the lecturers had agreed that students started to read eBooks
which is item B1. Additionally, item B4 revealed that 95.3% of students and 64.2% of

149
lecturers agreed that students used tablets to gather information. Students (73.5%)
agreed that they used tablets to e-learn through Blackboard or Wiseup (item B5)
compared to 72% of lecturers. Majority of the students agreed to the item B7.
However, lecturers indicated a neutral position for all the aforementioned items.
While more than 90% of the students agreed to the items such as item B9, around
40% of the lecturers preferred a neutral stance. Furthermore, 91.5% of the students
and around 70% of the lecturers agreed on item B8 and item B10 that students took
photos of the lecture highlights on white board and submitted their work to the
lecturer through email or file sharing apps.
4.3.3.2 Descriptive analysis of students’ survey responses on tablet use when
compared with personal computer (PC)
Table 4.38 reflects Likert-score responses of students on the use of tablets
when it is compared with the use of PCs that pertains to survey items item E1 and
item E3.
TABLE 4.38: Likert Responses of Students for Sub-Research Question 1.3.2.3
No DIS NO AGR N NA
E1 43
(28%)
15
(9.8%)
95
(62%)
153
(98.7%)
2
(1.2%)
E3 38
(24.7%)
19
(12.4%)
96
(62.7%)
153
(98.7%)
2
(1.2%)
where No = item number, NO = No opinion, N = Total Answered, NA = No
Answer, Disagree (DIS) and Agree (AGR).
When Strongly Disagree and Disagree columns from the questionnaire were
collapsed into disagree (DIS), the percentage of student responses for the item E1
was 62% and item E3 was 62.7%. It was observed that when Strongly Agree and
Agree columns from the questionnaire were collapsed into agree (AGR), the
percentage of student responses for item E1 was 28% and item E3 was 24.7%.
From table 4.38, it was clear that, 62% of the students agreed on item E1 and item
E3.

150
4.3.3.3 Triangulation of descriptive analysis of students, lecturers and
managers’ survey responses on tablet use when compared with personal
computer (PC)
Likert scale responses collected from students, lecturers and managers on
students’ use of tablets when compared with PC is as shown below in table 4.39.
Students’ responses pertained to survey items item E2, item E4 and item E5.
Lecturers’ responses pertained to survey items from item D1 to item D3 and
Managers’ responses pertained to survey items item B5 and item B6.
TABLE 4.39: Likert Responses of Students, Lecturers and Managers for Sub-
Research Question 1.3.2.3
P No DIS NO AGR N NA
L D1 1
(7.6%)
0
(0%)
12
(92.2%)
13
(92.8%)
1
(7.1%)
M B6 14
(87.4%)
1
(6.2%)
1
(6.2%)
16
(100%)
0
(0%)
S E2 39
(25.4%)
20
(13%)
94
(61.4%)
153
(98.7%)
2
(1.2%)
L D2 1
(8.3%)
4
(33.3%)
7
(58.3%)
12
(85.7%)
2
(14.2%)
S E4 47
(30.6%)
27
(17.6%)
79
(51.5%)
153
(98.7%)
2
(1.2%)
L D3 0
(0%)
5
(38.4%)
8
(61.4%)
13
(92.8%)
1
(7.1%)
S E5 98
(63.5%)
9
(5.8%)
47
(30.4%)
154
(99.3%)
1
(0.6%)
M B5 9
(56.2%)
2
(12.5%)
5
(31.2%)
16
(100%)
0
(0%)

151
where P = Participant (Possible values for “P” participant are S = Student, L =
Lecturer, M = Manager), No = item number, NO = No opinion, N = Total Answered
and NA = No Answer. Strongly Disagree and Disagree responses from the
questionnaire were collapsed into disagree (DIS). Similarly, Agree and Strongly
Agree responses from the questionnaire were collapsed into agree (AGR).
Item E2 of students and item D2 of lecturers pertained to the same statement
as to whether tablet assisted students to search for more information than through
PC. Percentage of students and lecturers agreeing for this statement were almost in
the same range of 61.4% and 58.3% respectively. Similarly, item E4 of students and
item D3 of lecturers agreed with the percentage of 51.5% and 61.4% respectively
that the tablets did not help them in developing programs but they managed to do so
using PC. Finally, 63.5% of the students on item E5 and 56.2% of the managers on
item B5 did not believe that tablet was a good learning tool when compared with PC.
4.3.3.4 Triangulation of inferential analysis of students and lecturers survey
responses on tablet's advantages and disadvantages for learning and teaching
An Independent Samples t-test was performed by the researcher to compare
the views of different stakeholders (categorical, independent variable) with their
scores on the advantages and disadvantages of using tablets for learning and
teaching. The different groups in the factor stakeholders were students and lecturers.
Continuous, dependent variable were the total score that participants who had
responded for items related to advantages and disadvantages. This test finds
whether there is a statistically significant difference in the mean scores of students
and lecturers in terms of their total scores.

152
TABLE 4.40: Group Statistics of advantages and disadvantages score
(Students and Lecturers)
Group Statistics
STAKEHOLDERS N Mean
Std.
Deviation
Std. Error
Mean
ADVANTAGES
DISADVANTAGES
SCORE
Students 155 46.88 6.916 .556
Lecturers 14 41.93 7.011 1.874
TABLE 4.41: Independent Samples Test of tablet's advantages and
disadvantages for learning and teaching (Students and Lecturers)
Independent Samples Test
Levene's
Test for
Equality of
Variances t-test for Equality of Means
F Sig. t df
Sig.
(2-
tailed)
Mean
Differ
ence
Std.
Error
Differ
ence
95%
Confidence
Interval of the
Difference
Lower Upper
ADVAN
TAGES
DISAD
VANTA
GES
SCOR
E
Equal
variances
assumed
.010 .922 2.565 167 .011 4.955 1.932 1.141 8.770
Equal
variances
not
assumed
2.536 15.
376
.023 4.955 1.954 .799 9.112
As predicted, results from an Independent Samples t-test indicated that
students (M = 46.88, SD = 6.916, N = 155) scored much higher (i.e., less logically

153
consistent) than lecturers (M = 41.93, SD = 7.011, N = 14), t (167) = 2.565, p < .05,
two-tailed. The differences in the means was 4.955 with 95% CI: 1.141 to 8.770. The
results showed that stakeholders such as students and lecturers had different views
on the advantages and disadvantages of using tablets for learning and teaching. The
researcher observed that this could be due to new students or new lecturers who
might not know to use the tablets or understand the advantages of using tablets.
This attitude would change as they start using tablets and advance in the
programme.
4.3.3.5 Triangulation of inferential analysis of students and managers survey
responses on tablet's advantages and disadvantages for learning and teaching
The following tables explore the views of different stakeholders such as
students and managers using Independent Samples Test to obtain tablet’s
advantages and disadvantages. The two variables used in this test were
stakeholders (categorical, independent variable) and the total score participants had
responded for items related to advantages and disadvantages (continuous,
dependent variable). This test enables whether there is a statistically significant
difference in the mean scores of two categorical groups such as students and
managers in terms of their total scores.
TABLE 4.42: Group Statistics of advantages and disadvantages score
(Students and Managers)
Group Statistics
STAKEHOLDERS N Mean
Std.
Deviation
Std. Error
Mean
ADVANTAGES
DISADVANTAGES
SCORE
STUDENTS 154 2.53 1.483 .119
MANAGERS 16 2.63 1.258 .315

154
TABLE 4.43: Independent Samples Test of tablet's advantages and
disadvantages for learning and teaching (Students and Managers)
Independent Samples Test
Levene's
Test for
Equality of
Variances t-test for Equality of Means
F Sig. t df
Sig.
(2-
tailed)
Mean
Differ
ence
Std.
Error
Differ
ence
95% Confidence
Interval of the
Difference
Lower Upper
ADVA
NTAG
ES
DISAD
VANTA
GES
SCOR
E
Equal
variances
assumed
1.498 .223 -.241 168 .810 -.093 .385 -.852 .667
Equal
variances
not
assumed
-.275 19.
600
.786 -.093 .337 -.795 .610
An Independent Sample t-test was conducted at a 5% level of significance (ie.
ά = 0.05) to compare the views of students and managers on the advantages and
disadvantages of using tablets in classroom. The results showed that there was no
significant difference (t (168) = -0.241; p (2-tailed) = 0.81) in the views of students
(M=2.53; SD=1.483) and managers (M=2.63; SD=1.258). The differences in the
means was -0.093 with 95% CI: -0.852 to 0.667. Consequently after comparison,
results showed that students and managers shared the same views on the
advantages and disadvantages of using tablets for learning and teaching.

155
4.3.3.6 Triangulation of inferential analysis of students, lecturers and
managers survey responses on the convenience of using tablets when
compared with personal computer (PC)
A one-way between groups analysis of variance (ANOVA) was conducted to
explore the views of all stakeholders such as students, lecturers and managers on
the convenience of using tablets in classroom when compared with PC. Participants
were divided into three groups: 1) students 2) lecturers 3) managers. The dependent
variable was the total score of different items that related to the comparison of using
tablet with PC in terms of its convenience. Since the Sig. value in Levene’s test is
less than 0.05, the assumption of homogeneity of variance was violated and would
consider Welch’s test F(2, 25.436) = 33.025, p < 0.001, indicating that not all
stakeholders had the same views on the convenience of using tablets for learning
and teaching. Post-hoc comparisons using the turkey HSD test indicated that the
mean score of managers (M=1.88, SD=0.806) was significantly different from
students (M=3.44, SD=1.347) and lecturers (M=4.23, SD=0.832). However, lecturers
were not significantly different from students.
TABLE 4.44: Descriptive statistics: Comparison of tablet and PC score
Descriptive
TABLET Vs PC SCORE
N Mean
Std.
Deviation
Std.
Error
95% Confidence
Interval for Mean
Minimu
m
Maxim
um
Lower
Bound
Upper
Bound
Students 153 3.44 1.347 .109 3.23 3.66 1 5
Lecturers 13 4.23 .832 .231 3.73 4.73 2 5
Managers 16 1.88 .806 .202 1.45 2.30 1 4
Total 182 3.36 1.371 .102 3.16 3.56 1 5
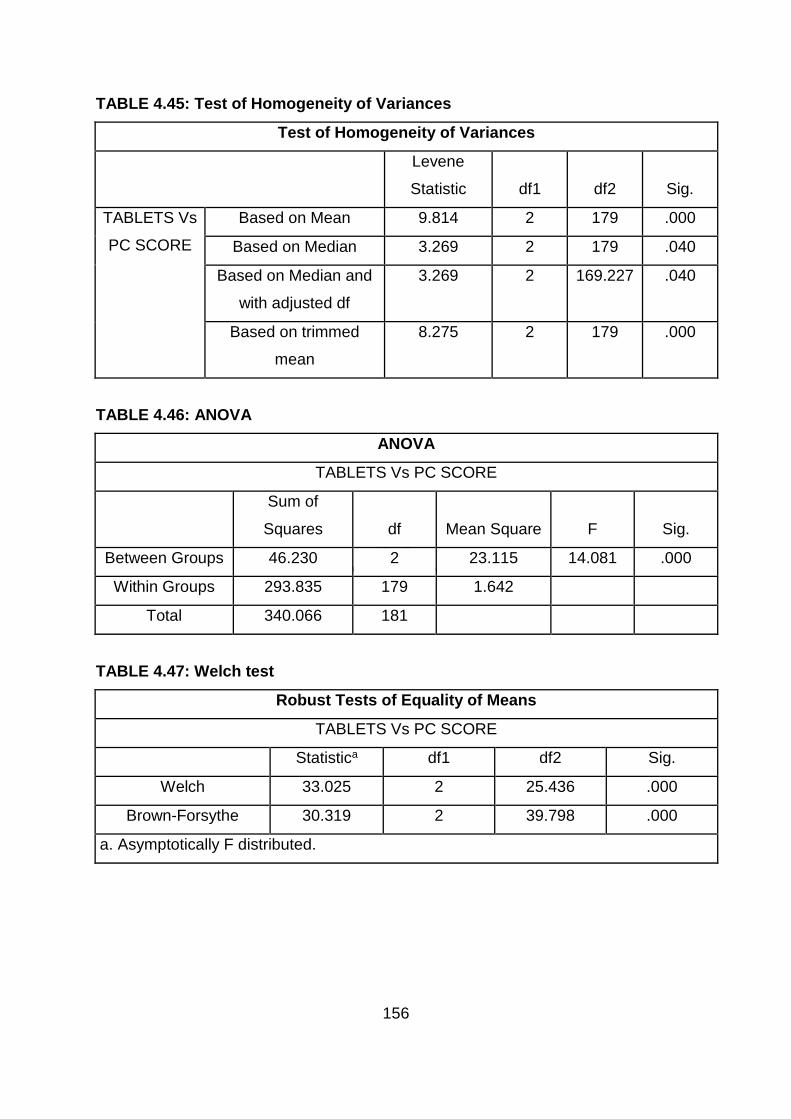
156
TABLE 4.45: Test of Homogeneity of Variances
Test of Homogeneity of Variances
Levene
Statistic df1 df2 Sig.
TABLETS Vs
PC SCORE
Based on Mean 9.814 2 179 .000
Based on Median 3.269 2 179 .040
Based on Median and
with adjusted df
3.269 2 169.227 .040
Based on trimmed
mean
8.275 2 179 .000
TABLE 4.46: ANOVA
ANOVA
TABLETS Vs PC SCORE
Sum of
Squares df Mean Square F Sig.
Between Groups 46.230 2 23.115 14.081 .000
Within Groups 293.835 179 1.642
Total 340.066 181
TABLE 4.47: Welch test
Robust Tests of Equality of Means
TABLETS Vs PC SCORE
Statistica df1 df2 Sig.
Welch 33.025 2 25.436 .000
Brown-Forsythe 30.319 2 39.798 .000
a. Asymptotically F distributed.

157
TABLE 4.48: Post-Hoc test
Multiple Comparisons
Dependent Variable: TABLETS Vs PC SCORE
Tukey HSD
(I)
STAKEHOLDERS
(J)
STAKEHOLDERS
Mean
Differenc
e (I-J)
Std.
Error Sig.
95% Confidence
Interval
Lower
Bound
Upper
Bound
Students Lecturers -.786 .370 .088 -1.66 .09
Managers 1.569* .337 .000 .77 2.37
Lecturers Students .786 .370 .088 -.09 1.66
Managers 2.356* .478 .000 1.23 3.49
Managers Students -1.569* .337 .000 -2.37 -.77
Lecturers -2.356* .478 .000 -3.49 -1.23
*. The mean difference is significant at the 0.05 level.
The interview responses that was collected from students, lecturers and
managers were analysed using themes by separating them into different categories.
The major themes were developed based on sub-research question 1.3.2.3. From
these major themes, sub-themes were formulated. Under each sub-theme, interview
responses collected from students, lecturers and managers were discussed and
interpreted to understand the advantages and disadvantages of tablet use in
classroom for learning and teaching in university classrooms.
Table 4.49 reflects the theme and sub themes that were extracted from the
responses of lecturers for Sub-Research Question 1.3.2.3.

158
TABLE 4.49: Theme and sub-themes concerning the students’ responses on
the advantages and disadvantages of using tablets in classroom
THEME SUB THEMES ISSUES RAISED
Advantages
and
disadvantages
Non learning
activities in
class
Reponses received from 80% of the respondents
were that they did not use it for activities that were
not part of learning during class hours.
Non learning
activities
outside class
Almost all of the respondents used tablets for
getting into social networking sites or apps for
time pass.
Benefits as a
learning tool
All respondents mentioned that it was highly
beneficial for them as a learning tool.
Drawbacks as
a learning tool
Majority of the respondents agreed that tablets
had some drawbacks.
4.3.3.7 Students’ interview responses: Non learning activities in class
Majority of the respondents expressed that they used tablet during the lecture
hours only for the purpose of learning.
StuInter 5: “I don’t use it for those kind of any activities”.
StuInter 6: “No. I do use the tablets only for leaning activities like searching
about the topics”.
On the other hand, three respondents have concurred that they used for non-
learning activities. StuInter 12, StuInter 16 and StuInter 17 used tablets to chat with
friends in social networking sites such as Facebook, Twitter and Whatsapp.
4.3.3.8 Students’ interview responses: Non learning activities outside class
StuInter 5 states that:
I usually use it for social networks when I am around the campus when I connected to the Wi-Fi and I sometimes play some games when I having spare time just to cool off my mind.
StuInter 2 and StuInter 3 used tablets not only to play games but also to
download eBooks and to work on assignments after class hours.

159
StuInter 15: “yes I use it for group chat”.
4.3.3.9 Students’ interview responses: Benefits as a learning tool
All the respondents equally agreed that tablet was a learning tool that had
high benefits and it had changed the way they learned.
StuInter 1: “It has enhanced my learning capability and I also got easy access
to my school work on wiseup, then I can browse in the internet to browse more
details”.
The response of StuInter 7 and StuInter 13 corroborated with the response of
StuInter 1. StuInter 18 argued that he benefited with the use of tablet only for once:
Once I have I lost all my notes and took pictures of somebody's notes and I tried to read that soft copies but it was very difficult and but I did make it because I passed it.
4.3.3.10 Students’ interview responses: Drawbacks as a learning tool
StuInter 1, StuInter 2 and StuInter 9 did not find any drawbacks except that
some applications were not compatible with the tablets. For example, some of the
programming courses such as C++ or code blocks failed to install in their tablets.
StuInter 5 raised the concern that WI-FI connections in the university premises were
very poor and speed was low which did not help to use tablets effectively as it had
only WI-FI facility and did not have sim card facility. The responses of StuInter7 and
StuInter10 were substantiated with the response of StuInter 5.
The following table shows the theme and sub themes that were extracted
from the responses of lecturers for Sub-Research Question 1.3.2.3.

160
TABLE 4.50: Theme and sub-themes concerning the lecturers’ responses on
the advantages and disadvantages of using tablets in classroom
THEME SUB THEMES ISSUES RAISED
Advantages and
disadvantages
Benefits as a
teaching tool
Most of the respondents obtained many
benefits from the use of tablet as a teaching
tool.
Drawbacks as
a teaching tool
Majority of the respondents have pointed out
some drawbacks that they had faced while
using tablet as a teaching tool.
Student’s non
learning
activities in
class
The issue of students accessing social media
during lecture time.
Benefits as a
learning tool
Students received different kinds of benefits in
using tablet as a learning tool.
Drawbacks as
a learning tool
Majority of the respondents agreed that tablets
had some drawbacks.
4.3.3.11 Lecturers’ interview responses: Benefits as a teaching tool
LectInter 2 states that:
Well on assignments yeah. It assist .because if you give them assignments. Instead of computers because we know we have problems with computer. Then they can be able to use the tablets to search for those assignments. Students are exploring by going to the internet by using the tablet.
LectInter 3 obtained benefit in the case of sending notes to students through
Wiseup.
LectInter 5: “The same thing whatever I am doing or whatever I am using in
laptops all those benefits I was getting even in the tablets”.
4.3.3.12 Lecturers’ interview responses: Drawbacks as a teaching tool
LectInter 2 highlighted the plagiarism issues that arose due to the use of
tablets in classroom. When LectInter 2 posted some assignment question in Wiseup

161
for students to do, they just copied and pasted the answer they found from the
internet without using their competitive skills.
LectInter 3: “Students cannot rely on Wi-Fi. They cannot access any email if
they're outside the campus. They don't have the SIM card provision there tablets
have only Wi-Fi facility”.
However, one respondent mentioned that he did not see any drawbacks.
4.3.3.13 Lecturers’ interview responses: Students’ non learning activities in
class
Social networking was done actively by students while the lecturer lectured in
the class. LectInter 1 stressed that students were very tricky as they could switch
very fast between Facebook and eBook in tablets during the class hours.
LectInter 2: “They are very Addicted in using the tablets to do something that
are not related to learning even when the lecture goes on”.
LectInter 3: “Each and every time they send WhatsApp they are laughing. We
don't know why they're laughing. Maybe because of Twitter they are using.
Somehow we need to draw a line”.
LectInter 5’s response was consistent with the response of LectInter 3
4.3.3.14 Lecturers’ interview responses: Benefits as a learning tool
LectInter 1: “Yes. In terms of accessing the information... in terms of
Engagement with the lecturer. Yes there is improvement”.
LectInter 2 remarked that tablets delivered to students was a great help and
benefit for them as each student had a tablet and they could be used just like they do
on their computer such as going to google and gather information.

162
LectInter 3: “There are benefits. They do online chats, they create
brainstorming sessions through the tablet”.
4.3.3.15 Lecturers’ interview responses: Drawbacks as a learning tool
LectInter 3: “If network is down they cannot download anything”.
LectInter 2 avers that:
The normal activity of the student has come down because most of the time they are looking at the tablets they're not working there most of the time they're sitting down they're not walking up and down for
healthy.
LectInter 4 states that:
Drawbacks for them I think are the disruption that the tablets have brought into their learning even though they are using it for the beneficial purposes of the activities for learning inside and outside the class.
The theme and sub themes that were obtained from the responses of
managers for Sub-Research Question 1.3.2.3 are shown below.
TABLE 4.51: Theme and sub-themes concerning the managers’ responses on
the advantages and disadvantages of using tablets in classroom
THEME SUB THEMES ISSUES RAISED
Advantages
and
disadvantages
Benefits as a
learning tool
All the respondents indicated that students had
different types of benefits in using tablets as a
learning tool.
Benefits as a
teaching tool
Lecturers had positive attitude in terms of using
tablets for teaching and they were benefitting from
the use of tablets.
Drawbacks as
a learning tool
Majority of the participants agreed that there were
some drawbacks.
Drawbacks as
a teaching tool
Most of the respondents did not see any
drawbacks in tablets as a teaching tool.
4.3.3.16 Managers’ interview responses: Benefits as a learning tool
Students changed the way they had been learning after the implementation of
tablets in classroom. ManInter 9 suggested that tablets motivated students to aim for

163
high marks, helped to communicate between each other in sharing notes and this
made them to read notes quickly. ManInter 1 stated that it was more convenient for
the students to learn their courses by being from anywhere. ManInter 3 indicated that
students:
can do quick reference and it is a tablet that can holder so many files instead of carrying bag of so many books. Tablets becomes handy for quick reference and they can download eBooks as well.
4.3.3.17 Managers’ interview responses: Benefits as a teaching tool
Respondents emphasized that lecturers were utilizing the benefits that they
obtained from the use of tablets.
ManInter 6: “it is easy to change the material as it is in the electronic format”.
ManInter 2 avers that “It makes environment the class environment conducive
to learning and teaching because the information is at their fingertip”.
ManInter 8 stressed that overall he could find only positive things about the
use of tablet and it was an effective tool for teaching.
4.3.3.18 Managers’ interview responses: Drawbacks as a learning tool
Even though tablets had a vast number of benefits, majority of the managers
agreed that there were a few drawbacks in tablets as well.
ManInter 3 affirms that:
The only drawback is that they tend to abuse the tablet they use it for other things other than for learning purposes and they are not doing it for the things that they are intended to use it for.
ManInter 9: “Its very easy for the students to use it for social networking such
as Whatsapp and Facebook it Twitter video downloading so I think that's an another
drawback”.
ManInter 4 corroborates with the views of ManInter 3 and ManInter 9.
However, ManInter 5 and ManInter 7 declare that they did not notice any drawbacks
in the tablet use of students.

164
4.3.3.19 Managers’ interview responses: Drawbacks as a teaching tool
Majority of the respondents responded that they did not see any drawbacks in
tablet as a teaching tool.
ManInter 6: “No I'm not aware of any that kind of thing”.
ManInter 3: “Not really significant other than the tablets are working very well
for the teaching and learning”.
ManInter 1, ManInter 5 and ManInter 7 also substantiated the views of earlier
respondents.
4.3.3.20 Triangulation of interview responses of stakeholders on the
advantages and disadvantages of tablet use
Table 4.52 shows the comparison of students’ and lecturers’ responses on the
learning activities of students in class. Both the participants had a similar response
that students were using tablets during the class hours not for the purpose of
learning but for the non-educational activities such as checking social networking
platforms namely Facebook, Twitter and Whatsapp.
TABLE 4.52: Triangulation: Students’ non learning activities in class
SUB THEME STUDENTS LECTURERS
Student’s
non learning
activities in
class
Reponses received from 80% of
the respondents were that they did
not use it for activities that were not
part of learning during class hours.
Students accessing social
media during lecture time
was a common issue that all
respondents highlighted.
Table 4.53 shows the comparison of students’, lecturers’ and managers’
responses on the benefits of using tablets in classroom. All the respondents equally
believed that students had acquired numerous benefits in using tablet as a learning
tool.

165
TABLE 4.53: Triangulation: Benefits as a learning tool
SUB
THEME
STUDENTS LECTURERS MANAGERS
Benefits
as a
learning
tool
All respondents
mentioned that it
was highly
beneficial for them
as a learning tool.
Students had
different kinds of
benefits in using
tablet as a learning
tool.
All the respondents
indicated that students
received different types of
benefits in using tablets
as a learning tool.
Table 4.54 shows the comparison of students’, lecturers’ and managers’
responses on the drawbacks of using tablets in classroom. Apart from the benefits
obtained, all types of participants equally believed that tablets had some drawbacks
as a learning tool.
TABLE 4.54: Triangulation: Drawbacks as a learning tool
SUB
THEME
STUDENTS LECTURERS MANAGERS
Drawback
s as a
learning
tool
Majority of the
respondents
agreed that
tablets had some
drawbacks.
Majority of the respondents
agreed that tablets had
caused many drawbacks
among students.
Majority of the
participants agreed
that there were some
drawbacks.
Table 4.55 shows the comparison of lecturers’ and managers’ responses on
the benefits of using tablets in classroom. The results showed that tablets provided
many benefits to the lecturers as a teaching tool.

166
TABLE 4.55: Triangulation: Benefits as a teaching tool
SUB THEME LECTURERS MANAGERS
Benefits as a
teaching tool
Most of the respondents
obtained several benefits
from the use of tablet as a
teaching tool.
Lecturers had a positive attitude in
terms of using tablets for teaching
and they benefitted from the use of
tablets.
Table 4.56 shows the comparison of lecturers’ and managers’ responses on
the drawbacks of using tablets in classroom. The results collected from both parties
were mixed responses. While lecturers admitted that they found a few drawbacks in
using tablets as a teaching device, managers aver that tablet was a teaching gadget
that had no drawbacks.
TABLE 4.56: Triangulation: Drawbacks as a teaching tool
SUB THEME LECTURERS MANAGERS
Drawbacks as a
teaching tool
Majority of the respondents had
pointed out some drawbacks
that they suffered while using
tablet as a teaching tool.
Most of the respondents
did not see any
drawbacks in tablets as
a teaching tool.
4.4 Discussion of findings
The findings for this research were based on two sources of data that were
comprised of Likert scale responses and interview responses. In this section of the
study, the findings were discussed in the light of the findings of similar studies,
theories and literature.
4.4.1 Effectiveness of tablet use for learning in university classrooms
4.4.1.1 Survey responses
The present study showed that majority of the students found the use of
tablets had helped them to learn the course content in the class (item C1). These
corroborate with the findings by Agir (2015), Mango (2015), Rossing, et al. (2012)
and Diemer, Fernandez and Streepey (2012). Agir (2015), Mango (2015), Rossing,
et al. (2012) concur that students in their study also perceived the tablets use to

167
enhance their learning by participating in course activities. Diemer, Fernandez and
Streepey (2012) had also observed that classroom use of iPad tablets have made a
positive effect on students learning. It emerged from the study that students started
to perform their homework more easily after they had received tablets (item C2).
These results were consistent with the findings by Agir (2015) that using the iPad
tablets on the course provided students to perform their homework with no trouble.
Majority of the students believed that they could perform their projects very easily
(item C3) after the adoption of tablets for learning. Mango (2015, p.56) had observed
that “students’ participation in class activities and their interaction with each other
were remarkably enhanced when using the iPads to work on common projects”. Agir
(2015) suggests that use of tablets enabled students to perform their projects easily.
Therefore, findings of the current study substantiate with the views of Mango (2015)
and Agir (2015). The study established that the students obtained multiple learning
styles (item C4) after they had received tablets. Findings of the present study were
consistent with results by Rossing, et al. (2012), McBeth, et al. (2015) and Shen
(2016) who state that tablets facilitated students to learn the contents in multiple
styles. Emphasising this, McBeth, et al. (2015, p.6) state that “the iPads served as
useful tool to engage students with multiple learning styles including text, visual, and
oral communication using a variety of app”. The present study further established
that after receiving tablets, students who participated in the course activity had
enhanced their learning (item C5) which is similar to the finding by Wakefield and
Smith (2012) as they state that learning could be enhanced by using a tool called
tablet. Staff Writers (2012) indicate that iPad tablets enhanced the learning skill of
students. Findings by Rossing, et al. (2012) also show that use of tablets enhanced
students’ learning skill. Therefore, item C5 corroborates with the findings by
Wakefield and Smith (2012), Staff Writers (2012) and Rossing, et al. (2012). Shen
(2016) specify that due to the various learning activities that was facilitated by
tablets, students became more confident in using these devices for the purpose of
learning. Findings by Wakefield and Smith (2012) also support the same. In the
present study, majority of the students indicated that they developed confidence in
the subject area (item C6) after the integration of tablets in classroom. Most of the
students indicated that they focused on the tasks after they had started using tablets
(item C7) which is consistent with the investigations by Rossing, et al. (2012) and

168
Diemer, Fernandez and Streepey (2012) that students’ attention was greater after
using tablets. In the present study, managers reported that academic results of
students had improved after incorporating tablets into education (item B2). This
finding is inconsistent with the finding by Perez, Gonzalez, Pitcher and Golding
(2011) who state that tablets made a negative impact in students’ academic results.
The study revealed that both students (item D1) and lecturers (item C1)
agreed that tablet activities motivated students to learn the course material more
than the class activities that did not use tablet. Diemer, Fernandez and Streepey
(2012), Rossing, et al. (2012) and Singer (2015) indicate that tablets activities
motivated students to learn the course material. Mango (2015) avers that the use of
iPad tablets motivated students to participate in class activities. Agir (2015) and
Chou, Block and Jesness (2014) state that use of tablets increased motivation to
learn. Therefore, findings of the current study were stable with the views of Diemer,
Fernandez and Streepey (2012), Mango (2015), Agir (2015), Chou, Block and
Jesness (2014), Rossing, et al. (2012) and Singer (2015). Most of the students in the
current study felt that tablets helped them to participate more in class during the
tablet activities than during activities that did not use tablet. This is similar to the
results found by Rossing, et al. (2012) and Diemer, Fernandez and Streepey (2012)
who state that tablets helped students to participate more than usual in classroom.
Both students (item D5) and lecturers (item C4) mutually agreed that students’ use of
tablets at home was not as useful as that in the classroom. However Agir’s (2015)
finding shows that iPad use of students had increased the learning time at home.
Therefore, findings of the present study were not parallel with the findings by Agir
(2015). The current research showed that tablets made it easier for students to
understand the topics when they learn in a group. This was agreed by both students
and lecturers unanimously. The findings of this study coincide with the findings by
Rossing, et al. (2012) and Diemer, Fernandez and Miller (2012) who state that
students found it easier to learn in group using tablets. The study found that tablet
activities helped students to participate in quiz as a team which is in line with
investigations by Hahn and Bussell (2012) who affirm that tablets allowed students
for taking online quizzes. Majority of the students (item D7) and lecturers (item C7)
agreed that tablets helped students to gather information for the group project work.

169
Although Agir’s (2015) investigation was similar to the findings of the present study,
Hahn and Bussell’s (2012) finding contradicts with this study. Furthermore, this study
showed that tablets helped students in Group discussion. Rossing, et al. (2012) also
indicate that students’ participation in class discussion and group discussion
increased after the adoption of iPad tablets. Agir (2015) asserts that tablets helped
students to join in discussion. Therefore, the results of current study is stable with
the investigations by Rossing, et al. (2012) and Agir (2015).
4.4.1.2 Interview responses
Students and lecturers reverberate in the same voice that students engaged
and collaborated with their classmates by making use of different social networking
application such as Facebook, Twitter, Whatsapp for the purpose of learning. Chou,
Block and Jesness (2014, p.21) concur that “Mobile devices such as iPads increase
student engagement; teachers have commented that the students were 100% on
tasks and engaging in classroom discussions”. McBeth, et al. (2015) indicate that
56% and 63% of the respondents’ concurred with the notion of engagement and
collaboration respectively. Findings of the present study were therefore consistent
with results by Chou, Block and Jesness (2014) and McBeth, et al. (2015). Lecturers
and managers disagreed with the idea of changing the curriculum for the use of
tablets. They stressed that change must be done in the delivery of lecture using
tablets but not in the curriculum and this does not substantiate with the findings by
Agir (2015) who states that current curriculum should be changed for the effective
iPad use. All the stakeholders of this study coincided with the statement that tablets
use had enhanced the skills of students. This finding is consistent with the views by
Rossing, et al. (2012) and Diemer, Fernandez and Streepey (2012) who indicate that
use of tablets enhanced the skills of students.
4.4.2 Effectiveness of tablet use for teaching in university classrooms
4.4.2.1 Survey responses
Most of the lecturers in the current study indicated that they did not use
tablets for most of their lecture classes (item E1) which is similar to the results found
by Yeung and Chung (2011) and Lindsey (2011). Findings by Yeung and Chung
(2011) show that out of 30 respondents 50% have never used tablets at all. Lindsey

170
(2011) advocates that only 37% of the academics used tablets for teaching. The
results obtained from the current survey showed that tablet assists lecturers’ tasks
during lectures (item E2) which is consistent with the finding of Agir (2015) who
states that the use of tablets support the task of academics. The current research
showed that lecturers could quickly complete their topics using tablets (item E3)
which is stable with the findings by Agir (2015) who concurs that topics can be easily
completed by using iPad tablets. Despite majority of lecturers agreed that they could
complete the curriculum on time (item E4), managers responded to this by opting a
neutral stand (item B3). Agir (2015, p. 187) states that “Most of the teachers (94%)
think that the teaching curriculum can be completed by using iPads”. Investigation of
the current study showed that the respondents could finish curriculum within the
specified period which concur with the findings by Agir (2015). In the present study,
lecturers (item E5) and managers (item B4) indicated that curriculum should be
adapted for the effective use of tablets. Brand, Kinash, Mathew and Kordyban’s
(2011) findings contradict with the results of the current study. Tablet use made
lecturers work easy while lecturing (item E6) which is similar to the findings by Agir
(2015) who states that “iPad usage facilitates the task of teachers”. Current study
showed that majority of the lecturers stressed that there was much distraction in
class during the lecture hours (item E7). Even though Geist (2011) and Staff Writers
(2012) also found the result similar to the findings of this study, many other
researches (Robinson, 2012; Kinash, Brand & Mathew, 2012; Gong & Wallace,
2012; Wakefield & Smith, 2012; Rossing, et al., 2012; Mango, 2015) highlight that
tablets could be a distraction due to its non-educative use. Gong and Wallace (2012)
advocate that more than 50% of the respondents’ in their study stated that tablets
were useful more for entertainments than learning. The current study found that
lecturers indicated a neutral stance for the statement “Using personal computers
(PC) makes better impact on students than using tablets“(item E8). However, Mang
and Wardley (2012) articulate that tablets should be considered as an extra tool
along with PC. Both lecturers and managers mutually agreed that tablets helped
lecturers to develop the skills that apply to their academic career (item E9) which
substantiates with the findings by Rossing, et al. (2012) and Diemer, Fernandez and
Streepey (2012) who indicate that tablet use has developed the skills that apply to
their professional life. It emerged from the study that a small group of lecturers

171
preferred PC than using tablets (item E10). Most of them opted for a neutral stand
which do not substantiate with the findings by Hill, et al. (2012) and Rossing, et al.
(2012) who state that iPad tablets were more useful compared to a desktop
computer.
4.4.2.2 Interview responses
The study found that the lecturers were not using apps for the purpose of
teaching. Chou, Block and Jesness (2014) argue that lack of teacher selected apps
was one of the challenges for teaching. Academics in a survey conducted by Yeung
and Chung (2011) stress that apps they wish to use were not available. The finding
of this study was therefore consistent with the views of Chou, Block and Jesness
(2014) and Yeung and Chung (2011). Most of the lecturers mentioned that it was
challenging during the earlier days and now it is easy to lecture after the adoption of
tablets in the classroom and this is in line with the investigations by Agir (2015) who
indicates that use of iPad tablets simplified the task of academics. Moreover,
quantitative data (item E1) corroborated this finding. From the managers’ point of
view, the lecturers were using tablets for various teaching purposes and their tablet
use depended on the topic that they were lecturing in class was comparable with the
findings by Diemer, Fernandez and Streepey (2012). Chou, Block and Jesness
(2014) indicate that academics use apps with updated information in Geography to
engage with students. The results obtained from managers were similar with the
findings by Diemer, Fernandez and Streepey (2012) and Chou, Block and Jesness
(2014). Majority of the managers averred that there was no need to change the
curriculum which is similar to the findings by Agir (2015, p.186) who states that
currently “the curriculum can be finished on time by using iPad”. “A training workshop
for faculty was conducted to kick start the iPad initiative” (Shen, 2016, p.18).
Managers of this study upheld with the findings of Shen (2016). However, it was
mixed responses that were received from lecturers.

172
4.4.3 Advantages and disadvantages of using tablets for learning and
teaching
4.4.3.1 Survey responses
Majority of the students and lecturers believed that students could read e-
Books (item B1). Agir (2015) declares that a few students read e-Books in his
findings. Therefore, finding of the current study is not consistent with the view of Agir
(2015). This study established that according to the views of students,
communication between students and lecturers using tablet was not that often (item
B2) which is similar to the views of Agir (2015) who specified that students in his
research did not communicate with the lecturer after using tablet. However, lecturers
were against to the views of students (item B2). This study also established that
students conducted research (item B3) after they had received tablets. Agir (2015)
avers that 54% of the students always use iPad tablets to conduct research.
Findings of the present study were therefore consistent with the findings by Agir
(2015). The current study revealed that both students (item B4) and lecturers (item
B4) agreed that tablet activities made students to gather more information. These
findings are stable with the views of McBeth, et al. (2015). The current research
shows that e-learning through Black Board using tablets was effective. This was
unanimously agreed both by students (item B5) and lecturers (item B5). Geist (2011,
p. 174) highlights that “More students used the Blackboard Mobile Learn app with
77% indicating they had used it”. Geist (2011, p. 764) states that “students were
enthusiastic about the use of Blackboard because of the ease of access to material”.
Kinash, Brand and Mathew (2012) indicate that students in their research positively
responded on Blackboard Mobile Learning. Therefore, findings of Brand, Kinash,
Mathew and Kordyban (2011), Geist (2011) and Kinash, Brand and Mathew (2012)
coincide with the investigations of the present study. Majority of the students (item
B6) agreed that they obtained multiple learning styles due to the use of tablets. Most
of the lecturers took a neutral stance. Many other researchers such as Rossing, et
al. (2012), McBeth, et al. (2015) and Shen (2016) also agree to the views of students
who stated that use of tablets engaged students to learn in different ways. It was
observed that mixed responses were received for the statement “After getting tablet,
I started to have a negative impact on students’ handwriting skills”. Students
indicated a negative impression that it had affected their handwriting. However,

173
lecturers took a neutral position. Findings by Agir (2015) indicates that 46% of the
respondents disagreed and 41% of them agreed to the statement. The results
obtained from the current study showed that above 90% of the students and 70% of
the lecturers’ agreed that students took photos of the lecture highlights on white
board to avoid copying by hand. This result is in line with many studies (Alyahya &
Gall, 2012; Hahn & Bussell, 2012; Mang & Wardley, 2012) as they indicate that
tablet was a useful device to take notes, highlight texts or take pictures. While
lecturers took a neutral position for the statement “used tablets during the lecture for
taking notes”, students agreed that they used tablets during the lecture for taking
notes. Kinash, Brand and Mathew (2012), Hahn and Bussell (2012), Mang and
Wardley (2012) and Alyahya and Gall (2012) concur that tablets enabled students to
take lecture notes in class. Consequently, the findings of present study corroborate
with the findings of many studies (Kinash, Brand & Mathew, 2012; Hahn & Bussell,
2012; Mang & Wardley, 2012; Alyahya & Gall, 2012). Furthermore, the present study
showed that, tablet activity helped students to submit their work to the lecturer
through email or file sharing apps (item B10). Rossing, et al. (2012, p. 5) concur that
“students submitted their work to the instructor through email or a file sharing
application such as Dropbox”. Geist (2011), Alyahya and Gall (2012), Mang and
Wardley (2012), Hahn and Bussell (2012) and Kinash, Brand and Mathew (2012)
agree that students submit assignments using apps in tablet. Shen (2016, p. 21)
indicates that “the use of iPad added convenience in completing course assignment”.
The findings of the current study is therefore similar to the findings of a number of
researches (Geist, 2011; Kinash, Brand & Mathew, 2012; Rossing, et al., 2012;
Alyahya & Gall, 2012; Mang & Wardley, 2012; Hahn & Bussell, 2012; Shen, 2016).
In the present study, it showed that majority of the students agreed that tablets were
more convenient to use when compared with personal computer (PC) (item E1)
which corroborated with the findings by Rossing, et al. (2012) who state that iPad
tablets were convenient than desktop computer and laptops. It emerged from the
study that tablets assisted students to participate more actively in discussions than
using PC (item E3). “I believe the iPad will assist (assisted) me to participate more
actively in discussions than traditional learning methods” (Mang & Wardley, 2013,
p.10). Agir (2015) indicate that majority of the students join in discussions after the
adoption of tablets. The results of the present study are similar to the finding by
174
Mang and Wardley (2013) and Agir (2015). A student response from the findings by
Rossing, et al. (2012, p. 11) aver that interaction and sharing of documents during
class discussion was high. Therefore, findings of the present study relate with the
findings by Rossing, et al. (2012). The study obtained a negative impression from
managers on the statement “tablets are better than personal computer (PC) for
lecturers” (item B6). Conversely, tablets were more convenient to use for lecturers
when compared with personal computer (PC). Moreover, Rossing, et al. (2012)
support to the view of lecturers that iPad tablets are more convenient than desktop
computers. Most of the students indicated that tablet assisted students to search for
more information than through PC (item E2) which is consistent with the
investigations by Mang and Wardley (2013). The study revealed that both students
and managers disagreed that tablet was a good tool to learn when compared with
PC. Findings by Mang and Wardley (2013) state that the respondents had a positive
attitude towards tablet as a learning tool.
4.4.3.2 Interview responses
Almost all the students used tablets for getting into social networking sites or
apps to pass time which is comparable with the results by Hahn and Bussell (2012,
p. 45) who state that “the most highly reported non-class use of the iPad was to
check e-mail and social networking”. The most common non learning activities
students generally did during lecture hours were to check emails and do social
networking. Listening to music, browsing internet and watching videos were some of
the other non-learning activities of students outside the classroom. Reponses
received from 80% of the students were that they did not use it for non-learning
activities during class hours. However, lecturers opined that students were involved
more with social media than on the lecture. Consequently, this concurs with the
findings by Mang and Wardley (2013) who indicate that checking personnel emails
and social networking in class declined students from focussing on the lecture. All
the stakeholders had a common opinion that tablet was a learning tool that offered
plenty of benefits. Mang and Wardley (2013) aver that majority of the students
believed that tablets is an innovative tool for learning. Finding of the current study is
therefore consistent with views of Mang and Wardley (2013). Despite the fact that
students found it useful to take notes using iPad 2, the gadget did not suit well for

175
extensive thorough research and typing (Hahn & Bussell, 2012). The responses
received from all the stakeholders were the same on this and corroborate with the
result of Hahn and Bussell (2012). The quantitative data (item B9) corroborated the
finding of taking notes. Both lecturers and managers observed that tablets offered
numerous benefits as a teaching tool. Chou, Block and Jesness (2012) found that
academics spent more time in assisting students in practical work and less time to
lecture. Consequently, the result of present study is consistent with the findings of
Chou, Block and Jesness (2012). As no device was perfect, so were tablets. Most of
the lecturers indicated the various drawbacks of tablets as a teaching tool from their
experiences in the classroom. Conversely, most of the managers did not see any
drawbacks in tablets as a teaching tool. However, Chou, Block and Jesness’s (2012)
results were similar to the responses of lecturers that there are a few drawbacks.
4.5 Summary
Chapter Four started with a summary of demographical data. Thereafter the
results obtained from the collection of data were presented for each sub-research
question. This chapter focussed mainly on the presentation and analysis of data to
seek the differences in the views of students, lecturers and managers on the use of
tablets for learning and teaching at a university in the Eastern Cape province of
South Africa. This chapter also strived to find out the benefits and drawbacks of
using tablets in classroom from the point of view of all the stakeholders. Responses
collected from the quantitative closed-ended questions were discussed. Major
themes and sub themes were developed from the responses obtained from
qualitative interviews. Both quantitative and qualitative responses were analysed,
interpreted and triangulated among all stakeholders. Ultimately, the responses from
this study were discussed along with similar studies and previous literature. In the
next chapter, summary of the findings, conclusions and limitations will be discussed.
Furthermore, recommendations to the management or institution that are planning to
implement tablets in their classrooms are also highlighted in Chapter Five.

176
CHAPTER FIVE
SUMMARY OF THE MAJOR FINDINGS, RECOMMENDATIONS AND
CONCLUSIONS
5.1 Introduction
The previous chapter presented the data, analysed, interpreted, triangulated
and discussed. In this chapter, summary of the findings and conclusions of the study
are discussed. This chapter concluded by explaining the limitations of the study and
proposing recommendations to the management or institution that are planning to
implement tablets in their classrooms. The chapter commenced by reaffirming the
sub-research questions.
5.2 Reaffirming the research questions
The main research question addressed in this study was:
Based on stakeholders’ views, what are the strengths and weaknesses of using
tablets for learning and teaching?
The study also addressed the following sub-research questions:
(a) How do students, lecturers and managers differ in their views on the
effectiveness of tablet use for learning in university classrooms?
(b) How do lecturers and managers differ in their views on the effectiveness of tablet
use for teaching in university classrooms?
(c) How do students, lecturers and managers differ in their views on the advantages
and disadvantages of using tablets for learning and teaching?
(d) What feasible framework can be developed to enhance the use of tablets for
learning and teaching?
5.3 Summary of Major Findings
This section of the chapter shaped the summary of the findings based on
each sub-research question.

177
5.3.1 Views of students, lecturers and managers on the effectiveness of
tablet use for learning in university classrooms
The views of students, lecturers and managers were identical on the use of
tablet technology for the purpose of learning in classroom. The use of tablets helped
students to learn the course content in multiple ways and perform homework and
projects easily. Tablets enabled students to focus on the tasks and boost their level
of confidence in the subject which led them to involve in different learning activities
that enhanced their learning. Managers compared and observed the improvements
in academic results after the integration of tablets into education. Both students and
lecturers unanimously agreed on students’ motivation level for learning the course
materials. Tablets not only assisted students to gather information for group work,
but also to participate in group discussion. This gadget boosted students’
participation in class during the tablets activities with and without their classmates
after the adoption of tablets. Both lecturers and students indicated that students’
tablet use in classroom was better than at home. Both parties agreed that tablets
contributed to students’ better understanding of the topics in group learning as well
as in quiz activities (See section 4.4.1.1).
Tablets enabled students to engage and collaborate with the lecturers as well
as to perform various educational and learning activities. The tablet training which
was offered to students by the CLTD department helped them to improve the pass
rate. Students used social networking sites such as Facebook not only for non-
learning activities but also for learning activities such as creating forums to discuss
and communicate between classmates to get clarity on the topics lectured in class.
Both lecturers and managers unanimously agreed that rather than changing the
curriculum for tablets, the change should be effected in the way lecturers deliver the
lecture using tablets. Tablets enhanced students’ skill and learning capabilities
tremendously. After scrutinising each source of data, the researcher of this study
concluded that all the stakeholders held positive views on the use of tablet computer
for learning (See section 4.4.1.2).

178
5.3.2 Views of lecturers and managers on the effectiveness of tablet use for
teaching in university classrooms
Lecturers and managers shared almost the same views on the use of tablets
for teaching purpose. Even though lecturers used tablets only for certain classes,
they believed that tablets can be used to complete the topics quickly, thereby
completing the curriculum on time. Lecturing using tablets made their work easy.
However, it should be noted that the use of tablets in class also led to various
distractions. Tablets helped lecturers to develop their skills in terms of their academic
career and enhance tasks during lectures. They believed that tablets were better
than PCs for students in terms of educational purposes. Therefore, in overall,
lecturers’ preferred tablets than PCs (See section 4.4.2.1).
Despite the lecturers stated that lecturing was easier compared to the earlier
days, they failed to use teaching apps for lecturing. Lecturers used tablets for
multiple purposes depending on the topic. Use of tablets enhanced lecturing skills.
Managers highlighted that there was no need to change the curriculum to
accommodate the use of tablets and pointed out that tablet training was offered to
lecturers who taught ES courses and that it was found to be effective. However, a
few lecturers claimed that they did not receive any training and they were exploring
tablets themselves (See section 4.4.2.2).
.
5.3.3 Views of students, lecturers and managers on the advantages and
disadvantages of using tablets for learning and teaching
The views of all students and lecturers on the advantages and disadvantages
of using tablets for learning and teaching were dissimilar. There was a tremendous
difference academically among students after they had started using tablets.
Students began to read eBooks, conduct research and gather information with the
integration of tablets. It is significant to indicate that their e-Learning through
Blackboard had improved greatly. Students took photos of the lecture that were
highlighted on the white board, they finished and submitted their works to the lecturer
through email or file sharing apps. Students started to join in discussions, brought
ideas from different fields during class discussions and developed projects.
However, the use of tablets had affected students’ handwriting negatively. Managers’

179
responses contradicted with the views of students and lecturers and they indicated
that tablets were more convenient for students to use when compared with PC.
Tablets assisted students more than PC to participate actively in discussions.
Students’ use of PC decreased after the introduction of tablets. Even though tablets
had enabled them to search for information better than PC, they could not develop
programs using tablets as they could with PC. Moreover, both students and
managers believed PC was a better learning tool than tablets (See section 4.4.3.1).
Although majority of the students’ concurred that they did not use tablets for
non-learning activities during lecture hours, lecturers contradicted with this
statement. All the stakeholders’ averred that there were many benefits of using tablet
as a learning tool in classroom. While lecturers agreed that there were a few
drawbacks in considering tablet as a teaching tool despite its numerous benefits,
most of the managers did not find any drawbacks at all. (See section 4.4.3.2).
5.3.4 Proposed Framework to enhance the use of tablets for learning and
teaching
Based on the conclusions from each data set and discussions that followed, it
was possible to respond to objective 1.5.4. The major elements in the framework in
order to enhance the use of tablets for learning and teaching include:
- Students using tablet computers;
- Tablet training and educational apps;
- Facilitator;
- Tablet computers;
- Constructivism;
- Interaction;
- Team work;
- Collaboration;
- TPACK;
- TCK;
- PCK; and,
- TPK.

180
These are incorporated in the framework below in Fig 5.1. The single
directional arrows show one way relationship and double directional arrows indicate
feedback and revision in a dynamic interaction.
Fig 5.1: A Proposed Framework to enhance the use of tablets for learning and
teaching
Researcher-constructed framework
5.4 Conclusion
5.4.1 Effectiveness of tablet use for learning in university classrooms
It could be concluded from the findings that all stakeholders in this study
(students, lecturers and managers) showed positive attitude about students’ use of
tablet for learning in classroom. Students’ confidence and motivation level of learning
boosted after the adoption of tablets. Currently, students could learn the contents in
different styles using tablet which made an improvement in academic results. This

181
gadget enabled students to be active in classroom. Students began to communicate
actively for learning with their peers and lecturers, both inside and outside the
classroom. Overall, the engagement and collaboration among the students and with
the lecturers enhanced significantly after the implementation of the tablet technology.
5.4.2 Effectiveness of tablet use for teaching in university classrooms
The evidence from this study underscored that both lecturers and managers
viewed that tablets were an effective teaching tool in the university classrooms.
However, in order to realize this, the necessary apps must be installed. Skills of the
lecturers were enhanced due to the use of tablets and it made completion of their
work faster than without tablets. Lecturers believed that tablets were more effective
than PC for students. They also believed that tablet was a tool for teaching the
existing curriculum which was not needed to be changed. It is important to provide
training or workshops to the lecturers for the effective use of tablets for teaching. Half
of the lecturers claimed that the training provided by CLTD, which they attended was
effective. However, the remaining lecturers indicated that they did not receive
training and they were exploring tablets by themselves.
Even though mobile devices such as e-reader and smart phones are used all
over the globe, an assumption cannot be made that all lecturers know how to use
tablets without proper guidance. In the researcher’s view, CLTD must track out the
lecturers who did not receive training and offer them training for the effective use of
tablets in teaching.
5.4.3 Advantages and disadvantages of using tablets for learning and
teaching
Like any other technology, tablet computers also have advantages as well as
disadvantages. In this study, the researcher found that tablets had more advantages
than disadvantages. After the adoption of tablets, students could engage in learning
activities with little dependence on lecturers. They understood the different styles of
learning and actively participated in group discussions. Gathering information,
downloading and reading eBooks, researching and its user-friendliness made the
device more attractive for students. Students used tablets by understanding the
182
benefits of the technology and not just for a trend to be with the booming technology
in the market.
It is significant to note that students had considered tablet as an effective
learning tool. However, when it was compared with PC, they preferred PC as a
better learning tool than tablets. As students could do most of their learning activities
on tablets, it had seriously affected their handwriting. As there was a lack of training
offered and apps installed to students and lecturers, they were not able to explore
and experience the full potential of that technology. Students checking social
networking sites during lecture hours was a common and serious issue for all
lecturers. Poor internet connection of Wi-Fi made users unable to use the device
when required as most tablets had only Wi-Fi facility and did not have sim card
facility.
5.4.4 Conclusion of overall study
All sub-research questions were answered and all objectives were achieved in
the foregoing section. The researcher described the experiences and views of
students, lecturers and managers regarding the integration of tablets in university
classrooms. Like any other product, tablet also had its strengths and weaknesses.
The views of all stakeholders such as students, lecturers and managers were almost
identical on the use of tablet technology for learning and teaching. The responses of
the stakeholders showed that tablets had more strengths than weaknesses.
Students’ engagement and collaboration for the purpose of learning had
developed tremendously. Students used tablets not only for a trend to be with the
latest technology in the market but also they found it useful. However, simply using
the tablet for personal work was highly distracting the students and causing
underutilization of the device for learning. Students’ use of social networking such as
Facebook and Whatsapp during class hours was causing distractions to the lecturers
and other students. It is important to note that social networking sites had a provision
of creating forums where the students discussed the educational matters with their
classmates which was alluded by one of the lecturers during the interview.
Therefore, being in the social networking sites did not always mean that students

183
were socializing. Students should avoid using social networking sites during the
class hours to avoid the distractions for themselves and others.
The researcher found that tablets were useful depending on the area of
course of study and that too only by implementing the items mentioned in the
recommendations. In addition, tablets were unsuitable for a course like programming
as ICT students gave focus more on developing the code. In such cases, laptops or
PCs were better choices to strengthen students’ learning and engagement with
classroom activities facilitating students’ collaboration between each other and their
participation in classroom activities.
Overall, this study indicated that all stakeholders who were cited in this
research showed positive attitude towards the tablets’ educational capabilities.
Tablets were a motivating tool for learning and teaching not only for students but
also for lecturers. Instead of a teacher-centred approach, blended learning was
followed in the classrooms. A key lesson from this study was that proper guidelines
regarding tablet use, both at university and residence, were necessary in order to
reduce distractions and to improve the effectiveness.
5.5 Limitations of the study
This study was not without its limitations. The students and lecturers in the
study were from the department of ICT and EE. Thus, it would be beneficial to
conduct a similar case study with groups of students from other departments in the
same university to evaluate the difference in the results. A comparative study
between the same departments in different campuses would also help to understand
the variance in the ways lecturers implement the use of computers in their respective
instructional methods. The next limitation was the sample size of the lecturers and
managers. The sample consisted of only 14 lecturers and 16 managers and this
could also be a limitation.
5.6 Recommendations from the study
The researcher made 10 recommendations to the management or institution
that are planning to implement tablets in their classrooms:

184
(a) Before making a bulk order to purchase, analyse thoroughly and find out what the
needs of students in each stream are and how you can address those needs with
and without technology.
(b) Purchase tablets ONLY if the student’s level or course really demands it.
(c) Purchase tablets that have both Wi-Fi facility and sim card facility in order for the
students and lecturers to use tablets even when the internet connection is poor.
(d) Wi-Fi routers should be fixed at all places in campus and campus residences in
order for the students to access internet any time.
(e) Increase the strength of Wi-Fi router at all points in campus premises.
(f) Proper training must be offered to all lecturers and students on how to use the
tablet for learning and teaching.
(g) Proper training must be offered to all lecturers and students on the necessary
apps and how to use it.
(h) All necessary apps must be installed prior to the commencement of class.
(i) Lecturer must explain the Do’s and Don’ts on the first day itself to all the students.
Lecturer must also have a clear understanding on how to use the tablets in
classroom.
(j) Prevent students from visiting unwanted and restricted sites by keeping a network
based tracker and blocker software application manged by ICT technical staff.
5.7 Suggestions for future research
The researcher made three suggestions to the people who are planning to
conduct a future research:
(a) Further study with students and lecturers as respondents from the departments
other than ICT and EE may yield interesting results.
(b) This study could also be carried out with learners, teachers and managers in
schools that uses tablets for learning and teaching to gather new views and observe
if different contexts would give different findings.
(c) A comparative study using triangulation between the school and university on
their use of tablets for learning and teaching.

185
5.8 Summary
Chapter Five started by reaffirming the main and sub-research questions.
Conclusion for each sub-research question was presented and explained. Each of
the pre-set objectives was achieved. A summary of the major findings was
discussed. The main research question was: ‘Based on stakeholders’ views, what
are the strengths and weaknesses of using tablets for learning and teaching?’
Through the answers to the sub-research question and achievement of objectives,
the study provided the strengths and weaknesses in the various use, attitudes and
operations involving tablet use. As such the main research question was answered.
A Proposed Framework to enhance the use of tablets for learning and teaching was
formulated and included in this chapter. Furthermore, the chapter provided perceived
limitations of the study and recommendations emanating from the study.

186
LIST OF REFERENCES
Abdulwahed, M., Jaworski, B. and Crawford, A. R., 2012. Innovative approaches to
teaching mathematics in higher education: a review and critique. Nordic
Studies in Mathematics Education, 17(2), pp. 49-68.
Adam, N. P., 2010. Investigation of factors that influence practices of parental
involvement in the development of children’s literacy at senior phase school
level. MEd. University of Fort Hare.
Aghaee, N., 2015. The Usefulness of ICT Support Systems for Thesis Courses
Learners’ Perspectives at Bachelor and Master Level. Ph.D. Stockholm
University.
Agir, A., 2015. iPad at School: A Holistic Evaluation of the Opinions of Students,
Teachers and Parents Concerning iPad Use. International Journal of
Education, 7(3), pp. 175-193.
Ahmada, S. Z., Bakarb, A. R. A., Ahmadc, N., 2018. An evaluation of teaching
methods of entrepreneurship in hospitality and tourism programs. The
international Journal of Management Education, 16, pp. 14-25.
Ajibade, B. A., 2016. Implementation of school- based continuing professional
teacher development programmes in high schools in the fort beaufort
education district, eastern cape province, south africa: towards a teacher
development model. Ph.D. University of Fort Hare.
Aklilu, 2016. Whats the difference between a teacher and a lecturer? Answers.
Yahoo blog, [blog], available at https://answers.yahoo.com/question/
index?qid=20070315155923AATlODI
Al-Bataineh, A., Anderson, S., Toledo, C. and Wellinski, S., 2008. A study of
technology integration in the classroom. International Journal of Instructional
Media, 35(4), pp.381-387.
Alexander, B., 2014. Higher Education in 2024: Glimpsing the Future. [online]
EDUCAUSE Review. Available at:<http://er.educause.edu/ articles/2014/9/
higher-education-in-2024-glimpsing-the-future> [Accessed 15 September
2014].
Alhassan, R., 2016. Mobile learning as a method of ubiquitous Learning: Students'
attitudes, readiness, and possible barriers to implementation in higher
education. Journal of Education and Learning, 5(1), pp.176-189.

187
Ally, M. and Blazquez-Prieto, J., 2014. What is the future of mobile learning in
education? Revista de Universidad y Sociedad del Conocimiento, 11(1),
pp.140-151.
Alsufi, D., 2014. Evolution of classroom technology, the new way of teaching, using
tablets in schools. Master of Education. Bowling Green State University.
Alyahya, S. and Gall, J. E., 2012. tablets in education: A qualitative study of
students’ attitudes and experiences. In: T. Amiel and B. Wilson, eds.
2012 Proceedings of World Conference on Educational Multimedia,
Hypermedia and Telecommunications. Chesapeake, VA: AACE, pp.1266-
1271.
Anderson, V., 2009. Research methods in human resource management. 2nd ed.
London: CIPD Publishers.
Antifaiff, G., 2000. Integration of technology into the curriculum. University of
Saskatchewan.
Apple Inc, 2008. Apple classrooms of tomorrow—today. Learning in the 21st century.
[online] Available at: <http://www/education.apple.com/acot2/global/files/
ACOT2_Background.pdf>
Apple Inc, 2011. Now. [online] Available at: <http://www.apple.com/ca/tablet/videos/#
play-guieded-tours-ads>
Apple Inc, 2012. The tablet. [online] Available at: <http://www.apple.com/tablet/
features/> [Accessed 15 June 2012]
Apple Inc, 2013a. tablet. [online] Available at: <http://www.apple.com/tablet/>
[Accessed 25 June 2013]
Apple Inc, 2013b. Apple in Education. [online] Available at: <http://www.apple.com/
education/tablet/#classroom> [Accessed 25 June 2013]
Attard, C. and Northcote, M., 2011. Teaching technology: Mathematics on the move:
Using mobile technologies to support student learning. Australian Primary
Mathematics Classroom, 16(4), pp.29-31.
Avalos, B., 2011. Teacher professional development in teaching and teacher
education over ten years. Teaching and Teacher Education, 27(1), pp.10-20.
Babbie, E., 1990. Survey Research Methods. 2nd ed. Belmont, CA: Wadsworth
publishing.
Babbie, E., 2001. The practice of social research. Belmont, CA: Wadsworth.

188
Babbie, E. and Mourton, J., 2005. The Practice of social Research. Cape Town:
Oxford University Press
Babbie, E., 2008. Introduction to Social Research, 5th ed. Belmont: Wadsworth.
Babbie, E. and Mouton, J., 2009. The Practice of Social Research. Cape Town:
Oxford University Press.
Babbie, E., 2010. The Practice of Social Research. 12th ed. Belmont: Wadsworth.
Backhouse, A., Wilson, I. and Mackley, D., 2014. Enhancing the formative
assessment environment through the use of mobile technologies. PRACTICE
G, 24.
Backhouse, A., Wilson, I. and Mackley, D., 2014. Enhancing the formative
assessment environment through the use of mobile technologies.
Bailey, K.D., 2007. Methods of social research. New York: The free press.
Banas, J. R., 2010. Teachers' attitudes toward technology: Considerations for
designing preservice and practicing teacher instruction. Community & Junior
College Libraries, 16(2), pp.114-127.
Barone, D. and Wright, T.E., 2009. Literacy instruction with digital and media
technologies. The Reading Teacher, 62(4), pp.292-302.
Barrows, H. S., 2000. Problem-Based Learning Applied to Medical Education.
Southern Illinois University School of Medicine.
Baya'a, N. and Daher, W., 2009. Learning mathematics in an authentic mobile
environment: the perceptions of students. International Journal of Interactive
Mobile Technologies, 3, 6-14.
Beal V., 2015. Laptop computer. webopedia [online]. Available at:
<http://www.webopedia.com/TERM/L/laptop_computer.html> [Accessed 23
April 2015].
Beach, R. and O’Brien, D., 2013. Fostering Student Writing-to-Learn through App
Affordances. In: K. E. Pytash, R. E. Ferdig and V. R. Timothy, eds. Exploring
technology for writing and writing instruction. Pittsburg, PA: ETC Press.
Beckerle, A.L., 2013. A Mixed Method Study Measuring the Perceptions of
Administrators, Classroom Teachers and Professional Staff on the Use of
tablets in a Midwest School District. Ph. D. Lindenwood University.
Ben-Ari, M., 1998. Constructivism in computer science education. ACM SIGCSE
Bulletin, 30(1), pp.257-261.

189
Bernard, H.R., Wutich, A. and Ryan, G.W., 2010. Analysing Qualitative data:
Systematic Approaches. 2nd ed. Thousand Oaks: Sage.
Berk, R. A., 2010. How do you leverage the latest technologies, including web 2.0
tools, in your classroom?. International Journal of Technology in Teaching and
Learning, 6(1), pp.1-13.
Best, W.J. and Khan, V.W., 2003. Research in education.7th ed. Allyn and Becon:
Boston.
Bennett, J. E., 2014. A case study of the integration of technology and instruction in
a rural midwestern school district. Ph.D. University of Missouri.
Bhardwaj, A., 2016. Importance of Education in Human Life: a Holistic Approach.
International Journal of Science and Consciousness, 2(2), pp.23-28.
Blanche, T. M. and Durrheim, K., 1999. Histories of the Present: Social Science
Research in Context. In M. Terre Blanche and K. Durrheim, (1993) eds.
Research in Practice: Applied Methods for the Social Sciences. Cape Town:
UCT Press, pp. 1-16.
Blazar, D. and Kraft, M. A., 2017. Teacher and teaching effects on students‟
attitudes and behaviors. Educational Evaluation and Policy Analysis, 39(1),
pp.146-170.
Bonner, S. E., 1999. Choosing Teaching Methods Based on Learning Objectives: An
Integrative Framework. Issues in Accounting Education, 14(1), pp. 11-39.
Bouterse, B., Corn, J.O. and Halstead, E.O., 2009. Choosing the perfect tools for
one-toone. Learning & Leading With Technology, 37(1), pp.14-17.
Bowers, C. A. and Flinders, D. J., 1990. Responsive teaching: an ecological
approach to classroom patterns of language, culture, and thought. New York,
Teachers College Press.
Brand, J., Kinash, S., Mathew, T. and Kordyban, R., 2011. iWant does not equal
iWill: correlates of mobile learning with iPads, e-textbooks, BlackBoard Mobile
Learn and a blended learning experience.
Briggs, A.R.J. and Coleman, M., 2002. Research methods in educational leadership
and Management. London: SAGE Publications LTD.
Brooks-Young, S., 2007. Digital-age literacy for teachers: applying technology
standards to everyday practice. [online] Available at:
<http://www.iste.org/docs/ excerpts/DALITT-excerpt.pdf>.

190
Brown, B., and Schulze, S., 2007. Teacher migration to Botswana: Causes and
implications for human resources management in education. African
Education Review, 4(2), pp. 1-25.
Brown, J. S., 2002. Growing up digital: How the Web changes work, education, and
the ways people learn. USDLA Journal, 16(2).
Brown, M., Castellano, J., Hughes, E. and Worth, A., 2012. Integration of tablets into
a Japanese university English language curriculum. The Jalt Call Journal,
8(3), pp.197-209.
Brown, M., 2015. Six Trajectories for digital technology in higher education. [online]
EDUCAUSE Review. Available at: < http://er.educause.edu/articles/2015/6/six
-trajectories-for-digital-technology-in-higher-education> [Accessed 22 June
2015].
Bruner, J., 1963. The process of education. Cambridge: Harvard University Press.
Bryman, A., 2001. Social research methods. Oxford: Oxford University Press.
Bryman, A. 2004. Social Research methods. 2nd ed. United States: Oxford University
Press.
Brzycki, D. and Dudt, K., 2005. Overcoming barriers to technology use in teacher
preparation programs. Journal of Technology and Teacher Education, 13(4),
pp.619-641.
Buabeng-Andoh, C., 2012. Factors influencing teachers’ adoption and integration of
information and communication technology into teaching: A review of the
literature. International Journal of Education and Development using ICT, 8(1),
pp.136-135.
Buchanan, M. 2010. Official: iPad launching here april 3, Pre-orders March 12.
[online]. Available at: < https://gizmodo.com/5486444/official-ipad-launching-
here-april-3-pre-orders-march-12> [Accessed 03 May 2010].
BuddeComm, 2011. Global mobile communications – Insights into worldwide
developments. [online] Available at: <http://www.budde.com.au/Research/
Global-Mobile-CommunicationsInsights-into-Worldwide-Developments.html>.
BuddeComm, 2012. Australia – Mobile communications – Subscriber statistics.
[online] Available at: <http://www.budde.com.au/Research/Australia-Mobile-
Communications-SubscriberStatistics.html>.

191
Business Wire, 2011. Xirrus and Logical Choice Technologies Partner to Improve
Application Performance for Tablets and Smartphones Across Schools,
Colleges, and Universities Business and Economics. [online] Available at:
<http://search.proquest.com/docview/893684848?accountid=45049>
[Accessed 31 May 2013].
Cano, F., 2007. Approaches to learning and study orchestrations in high school
students. European Journal of Psychology of Education, 22 (2), pp. 131-151.
Carlson, S., 2010. The missing link in educational technology: Trained teachers.
[online] Available at: <http://www.techknowlogia.com/TKL_Articles/PDF/435.
pdf>
Carr, T. and Prater, T., 2013. Transitioning to the common core: Incorporating tablets
into reading / English language arts. Proceedings of Society for Information
Technology & Teacher Education International Conference.
Castillo-Manzano, J. I., Castro-Nuño, M., López-Valpuesta, L., Sanz-Díaz, M. T. and
Yñiguez, R., 2017. To take or not to take the laptop or tablet to classes, that is
the question. Elsevier, 68, pp. 326-333.
Castle, S. and McGuire, C., 2010. An analysis of student self-assessment of online,
blended, and face to-face learning environments: Implications for sustainable
education delivery. International Education Studies, 3(3), pp.36-40.
Cavenaugh, C., Hargis, J., Kamali, T. and Soto, M., 2013. Substitution to
augmentation: Faculty adoption of iPad mobile learning in higher education.
Interactive Technology and Smart Education, 10(4), pp. 270-284.
Caverly, D., Peterson, C. and Mandeville, T., 1997. A generational model for
professional development. Educational Leadership, 55(3), pp.56-59.
Cennamo, K., Ross, J. and Ertmer, P., 2010. Technology integration for meaningful
classroom use: A standards-based approach. Belmont, CA: Cengage
Learning.
Chai, C.S., Koh, J.H.L., Tsai, C. and Tan, L.L.W., 2011. Modelling primary school
pre-service teachers’ technological pedagogical content knowledge (TPACK)
or meaningful learning with information and communication technology (ICT).
Computers & Education, 57(1), pp. 1184–1193.

192
Chen, G., Wei, F., Wang, C. and Li, L., 2007. Ubiquitous discussion forum:
Introducing mobile phones and voice discussion into web discussion forum.
Journal of Educational Multimedia and Hypermedia, 16(2), pp.125-140.
Chen, H.R., 2012. Design of Mobile Learning-Recommendation Services
Supporting Small-Screen Display Interfaces. In: A. Xie and X. Huang, eds.
Advances in Computer Science and Education. Advances in Intelligent and
Soft Computing. Springer, Berlin, Heidelberg.
Chou, C.C., Block, L. and Jesness, R., 2012. A case study of mobile learning pilot
project in K-12 schools. Journal of Educational Technology Development and
Exchange, 5(2), pp. 11-26.
Chou, C.C., Block, L. and Jesness, R., 2014. Strategies and challenges in iPad
initiative. IADIS International Journal, 12(2), pp. 85-101.
Chukwuemeka, E.J. and Iscioglu, E., 2016. An Examination of Lecturers’
Technological Pedagogical Content Knowledge Perceptions at the Faculty of
Education in EMU in Cyprus. Croatian Journal of Education, 18 (4), pp.999-
1034.
Clark, W. and Luckin, R., 2013. What the research says. Tablets in the classroom.
London Knowledge Lab, Institute of Education University of London.
Clarkson, G., 2018. Evaluating the potential of iPads to actively engage
paramedicine students in an authentic learning experience. Australasian
Journal of Paramedicine, 15(1), pp. 1-9.
Cobcroft, R. S., Towers, S.J., Smith, J.E. and Bruns, A., 2006. Mobile learning in
review: Opportunities and challenges for learners, teachers, and institution.
In: Online Learning and Teaching (OLT) Conference 2006. Queensland
University of Technology, Brisbane.
Cochran-Smith, M. and Lytle, S.L., 2001. Beyond certainty: taking an inquiry stance
on practice. In: A. Lieberman and L. Miller, eds. teachers caught in the action:
professional development that matters. New York: Teachers College Press,
pp.45–58.
Cochrane, T., 2012. Secrets of M-learning failures: Confronting reality. Research in
Learning Technology, 20.

193
Cochrane, T., Narayan, V. and OldField, J., 2013. tabletagogy: Appropriating the
tablet within pedagogical contexts. International Journal of Mobile
Learning and Organisation, 7(1), pp.48–65.
Coetzee, H., 2017. Reform-based approaches in the learning and teaching for
conceptual understanding of calculus for diploma studies at a South African
university. PhD. University of fort hare.
Cohen, L., Manion, L. and Morrison, K., 2000. Research Methods in Education.5th
ed. London: Routledge Falmer.
Cohen, C., Manion, L. and Morrison, K., 2007. Research Methods in Education. 6th
ed. London: Routledge.
Cohen, L., Manion, L. and Morrison, K. 2011. Research methods in education, 7th
ed. New York: Routledge.
Cohen, S., 2012. Apps meet the common core state standards in writing. Teacher
Librarian, 40(2), pp.32-39.
Cometto, T., 2008. Implementing Constructivism in Mathematics Classrooms.
Available at: <http://docslide.us/documents/implementing-constructivism-in-
mathematics-classrooms-tomas-cometto-20-march.html>
ComScore, 2014. U.S. smartphone subscriber market share. [online] Available at:
<https://www.comscore.com/Insights/PressReleases/2014/4/comScore-
Reports-February-2014-USSmartphone-Subscriber-Market-Share>
Conn, C., 2012. Managing and maximizing a class set of tablets. Learning and
Leading with Technology, 39(8), pp.32-33.
Coolican, H., 2004. Research methods and statistics in psychology. 5th ed. New
York: Routledge.
Cooper, D. R. and Schindler, P. S., 2006. Business Research Method. 11th ed.
Boston: McGraw-Hill International edition.
Cottel, P.G. and Millis, B.J., 1994. Complex Cooperative Learning Structures for
College and University Courses. To Improve the Academy. 8(1), pp. 40–60.
Creswell, J. W., 2003. Research Design: Qualitative, Quantitative, and Mixed
Methods Approaches. 2nd ed. Thousand Oaks: Sage.
Creswell, J., 2007. Research design: Qualitative, Quantitative and Mixed Methods
Approaches. 2nd ed. London: Sage Publications.

194
Creswell, J. W. and Clark, V. L., 2007. Designing and Conducting Mixed Methods
Research. Thousand Oaks, CA: Sage.
Creswell, J. W., 2008a. Educational research: Planning, conducting, and evaluating
quantitative and qualitative research. Upper Saddle River, NJ: Pearson/Merrill
Education.
Creswell, J. W., 2008b. Research Design: Qualitative, Quantitative, and Mixed
Methods Approaches. 3rd ed. Thousand Oaks, CA: Sage Publications, Inc.
Creswell, J. W., 2009. Research Design: Qualitative, Quantitative, and Mixed
Methods Approaches. 3rd ed. Thousand Oaks, CA: Sage.
Creswell, J. W. et al., 2010. First steps in Research. Pretoria: Van Schaik Publishers.
Creswell, J. W., 2012. Research Design: Qualitative, Quantitative, and Mixed
Methods Approaches. 4th ed. Thousand Oaks, CA: SAGE Publications.
Dahlberg, L. and McCaig, C., 2010. Practical Research and Evaluation. London:
SAGE Publishers.
Daniels, T. and Pethel, M., 2005. Computer mediated communications. In: M. Orey,
eds. Emerging perspectives on learning, teaching, and technology.
Darling-Hammond, L. and Baratz-Snowden, J., 2005. A good teacher in every
classroom: preparing the highly qualified teachers our children deserve. San
Francisco: Jossey Bass.
Dart, B. C., 1997. Adult learners’ metacognitive behaviour in higher education. In: P.
Sutherland, ed. Adult learning: A reader. London: Kogan Page.
David, M. and Sutton, C.D., 2004. Social research. London: SAGE Publications.
Davis, R., Maher, C., Noddings, N., 1990. Introduction: Constructivist views on the
teaching and learning of mathematics. In: R. Davis, C. Maher and N.
Noddings, eds. Constructivist views on the teaching and learning of
mathematics. Reston, Va: National Council of Teachers of Mathematics. pp.7-
18.
Debele, M. and Plevyak, L., 2012. Conditions for successful use of technology in
social studies classrooms. Computers in the Schools, 29(3), pp.285-299.
De Clercq and Celine, K., 2015. Digitally Enhanced Classrooms: Understanding the
Effect of Individualized Technology on Language Arts Instruction in
Elementary Schools. University Honors Theses. Portland State University.

195
Dede, C., 1989. The evolution of information technology: Implications for curriculum.
Educational Leadership, 47(1), pp.23-26.
Delport C.S.L. and De Vos A.S., 2005. Professional research and professional
practice. In: De Vos, A.S., Strydom, H., Fouché, C.B. & Delport, C.S.L., eds.
2005.Research at grassroots: For the social sciences and human service
professions. Pretoria: Van Schaik, pp 44‒55.
Denscombe, M., 2002. Ground Rules for Good Research: A 10 Point Guide for
Social Researchers. Buckingham: Open University Press.
Denzin, N.K. and Y. S. Lincoln. 2000. Handbook of Qualitative Research. 2nd ed.
Thousand Oakes: Sage Publications, Inc.
Department of Basic Education, 2011. Curriculum and Assessment Policy Statement
(CAPS). Pretoria: Government Printer.
De Vos, A.S. et al., 1998. Research at grass roots: A primer for the caring
professions. Pretoria: Van Schaik.
De Vos, A.S., 2007. Qualitative data analysis and interpretation. In: De Vos, A.S.,
Strydom, H., Fouché, C.B. & Delport, C.S.L., eds. Research at grassroots: For
the social sciences and human service professions.
De Wet, C., 2007. Educator’s perceptions and observations of learner-on-learner
Violence-related behaviour. African Education Review. 4(2), pp. 75-93.
Dewey, J., 1933. How we think: A restatement of the relation of reflective thinking to
the educative process. Boston, MA: D. C. Heath.
Dewey, J., 1897. My pedagogic creed. School. 54, pp.77-80.
Dhir, A., Gahwaji, N. M. and Nyman, G., 2013. The role of the tablet in the hands of
the learner. Journal of Universal Computer Science, 19(5), pp.706-727.
Diemer, T.T., Fernandez, E. and Streepey, J. W., 2012. Student perceptions of
classroom engagement and learning using iPads. Journal of Teaching and
Learning with Technology, 1 (2), pp. 13-25.
Dockstader, J., 1999. Teachers of the 21st century know the what, why, and how of
technology integration. T.H.E. Journal, 26(6), pp.73-74.
Dogan, B. and Almus, K., 2014. School Administrators’ Use of tablets: Impact of
Training and Attitudes toward School Use. Computers in the Schools, 31(3),
pp.233-250.

196
Donnelly, K., 2014. Chalk and talk teaching might be the best way after all. [online]
the conversation. Available at: <http://theconversation.com/chalk-and-talk-
teaching-might-be-the-best-way-after-all-34478> [Accessed 23 November
2014].
Donovan, L., Green, T. and Hartley, K., 2010. An examination of one-to-one
computing in the middle school: Does increased access bring about increased
student engagement?. Journal of Educational Computing Research, 42(4),
pp.423-441.
Doyle, H. and Reading, C., 2013. Resistance to advocacy: Pre-service teachers
recognising the potential of curriculum-based virtual worlds for TPACK-framed
science teaching. Australian Education Computing, 27(3), pp. 101-108.
Drew, C. J., Hardman, M. L. and Hosp, J. L., 2008. Designing and Conducting
Research in Education. Thousand Oaks: SAGE Publications.
Duhaney, D. and Zemel, P., 2000. Technology and the educational process:
Transforming classroom activities. International Journal of Instructional Media,
27(1), pp.67-72.
Dyer, C., 2013. Examining College Students' Perceptions of tablet Use on
Motivation, Organization, and Cognitive Skills. Master of Education (MEd).
Bowling Green State University.
Education Commission of the States, 2015. Professional development. Available
at:<http://www.ecs.org/html/issue.asp?issueid=129&subIssueID=64>
El-Mowafy, A., Kuhn, M. and Snow, T., 2013. Blended learning in higher education:
Current and future challenges in surveying education, Issues in Educational
Research, 23(2), pp.132-150.
Engel, G. and Green, T., 2011. Cell Phones in the Classroom: Are we Dialing up
Disaster?. TechTrends: Linking Research & Practice to Improve Learning,
55(2), pp.39–45.
Enriquez, A. 2010. Enhancing student performance using tablet computers. College
Teaching, 58(3), pp.77–84.
Eppard, J., Nasser, O. and Reddy, P., 2016. The Next Generation of Technology:
Mobile Apps in the English Language Classroom. International Journal of
Emerging Technologies in Learning, 11(4), pp. 21-27.

197
Ernest, P., 1995. The one and the many. In: L. P. Steffe & J. Gale, eds.
Constructivism in education. Hillsdale, NJ: Lawrence Erlbaum Associates, pp.
459-486.
Evoh, C.J. 2007. ICTs, Secondary Education, and the Knowledge Economy:
Exploring the Roles of the Private Sector in Post-Apartheid South Africa.
Journal of Education for International Development. 1(3).
Falloon, G., 2013. Young students using tablets: App design and content influences
on their learning pathways. Computers & Education.; 68, pp.505–521.
Figueiredo, A.D., Afonso, A.P., 2005. Context and learning: A philosophical
approach. In: A. D. Figueiredo and A. P. Afonso, eds. Managing learning in
virtual settings: The role of context. Hershey, PA: Idea Group, pp.1–22.
Finley, L. and Hartman, D., 2004. Institutional change and resistance: teacher
preparatory faculty and technology integration. Journal of Technology and
Teacher Education, 12(3), pp.319-337.
Fischman, J. and Keller, J., 2011. College Tech Goes Mobile. Chronicle of Higher
Education. [online]. Available at: <http://www.chronicle.com/article/College-
Tech-Goes-Mobile/128614/> [Accessed 21 August 2011].
Flanagan, 2016. The Effects of a One-to-One tablet Initiative: A Case Study.
Ph.D.University of Wisconsin-Milwaukee.
Foresman, C., 2010. The tablet goes to college this fall. cnn. [online] Available at:
<http://edition.cnn.com/2010/TECH/mobile/07/26/tablet.university.ars/index.ht
ml> [Accessed 27 July 2010].
Fosnot, C. T. and Dolk, M., 2005. Mathematics or Mathematizing in Constructivism:
Theory, Perspectives, and Practice (2nd ed.). New York: Teachers College
Press.
Fountain, J. E., 2002. Information, Institutions and Governance. Cambridge: Harvard
University.
Fox, C., 2009. More than machines. T.H.E. Journal, 36(6), pp.23-26.
Franklin, T., 2011. Mobile learning: At the tipping point. The Turkish Online Journal
of Educational Technology, 10(4), pp. 261-275.
Friedrichsen, P. J., Abell, S. K., Pareja, E. M., Brown, P. L., Lankford, D. M. and
Volkmann, M. J., 2009. Does teaching experience matter? Examining biology

198
teachers’ prior knowledge for teaching in an alternative certification program.
Journal of research in science teaching, 46(4), pp. 357-383.
Ganser, T., 2000. An ambitious vision of professional development for teachers.
National Association of Secondary school principals, 84(618), pp.6-12.
Garrett, B., 2012. Monadnock school district will try out electronic tablets in some
classes. [online] sentinelsource. Available at: <http://www.sentinelsource.
com/news/ local/monadnock-school-district-will-try-out-electronic-tablets-in-
some/ article_c50a9bf7-162e-57c6-af3d-8e5334d102ca.html> [Accessed 18
July 2012].
Gawelek, M., Spataro, M. and Komarny, P., 2011. Mobile Perspectives: On tablets--
Why Mobile? EDUCAUSE Review, 46(2), pp.28–32.
Geer, D., 2012. Computing trends, today and tomorrow. UniversityBuisness.com pp.
42-44.
Geist, E., 2011. The Game Changer: Using tablets in College Teacher Education
Classes. College student journal, 45(4), pp.758-768.
Gentile, M., 2012. The importance of managing iPads in the classroom. Education
Digest: Essential Readings Condensed for Quick Review, 78(3), pp. 11-13.
Geringer, J., 2003. Reflections of professional development: Toward high-quality
teaching and learning. Phi Delta Kappan, 84(5), pp.373-380.
Glicken, M. D., 2003. Social Research: A Simple Guide. Boston: Pearson Education
Glynn, S. M., Yeany, R. H. and Britton, B. K., 1991. A constructive view of learning
science. In: S. M. Glynn, R. H. Yeany and B. K. Britton, eds. The Psychology
of Learning Science. Hilldale, New Jersey: Lawrence Erlbaum Associates, pp.
3-19.
Good, C. V. and Merkel, W. R., 1959. Dictionary of Education, 3rd ed. New York: Mc
Graw-Hill.
Google and Ipsos, 2012. Our mobile planet: Australia. Understanding the mobile
consumer. [online] Available at: <http://services.google.com/fh/files/blogs/
our_mobile_planet_australia_en.pdf> [Accessed 01 May 2012].
Gong, Z., 2012. A Comparative Analysis of tablet and Other M-learning
Technologies: Exploring Students’ View of Adoption, Potentials, and
Challenges. Journal of Literacy and Technology. 13(1), pp. 46-49.

199
Gong, Z. and Wallace, J. D., 2012. A Comparative Analysis of iPad and Other M-
learning Technologies: Exploring Students’ View of Adoption, Potentials, and
Challenges. Journal of Literacy and Technology, 13(1).
Goral, T., 2011. Take II Tablets. [online] University Business. Available at:
<https://www.universitybusiness.com/article/take-ii-tablets > [Accessed 01
January 2011].
Gordon, A., Jackson, J. and Usher, J., 2014. Learning across contexts-mobile for
fieldwork in environmental sciences. Mobile learning: How mobile
technologies can enhance the learning experience.
Gorman, R., Hammersley, M. and Foster, P. 2000. Case Study Method. Sage
Publications: London.
Gray, J., 2004. An illusion with a future. Daedalus, 133(3), pp. 10-17.
Gray, D. E., 2009. Doing Research in the Real World. 2nd ed. London: Sage.
Green, T., 2005. Using technology to help English language students develop
language skills: A home and school connection. Multicultural Education,
13(2), pp.56–59.
Greenhow, C. and Robelia, B., 2009. Old communication, new literacies: Social
Network sites as Social Learning resources. Journal of computer-mediated
communication, 14(4), pp. 1130-1161.
Gross, R., 2012. The Science of Mind and Behaviour, 6th ed. Hachette: HODDER
EDUCATION
Grudin, J., 1994. Computer – supported cooperative work: history and focus.
Computer, 27(5), pp.19-26.
Guskey, T. R., 1986. Staff development and the process of teacher change.
Educational Researcher, 15(5), pp.5-12.
Guskey, T. R., 2002. Professional development and teacher change. Teachers and
Teaching: Theory and Practice, 8(3), pp.381-391.
Hahn, J. and Bussell, H., 2012. Curricular use of the tablet 2 by a first-year
undergraduate learning community. In: R. K. Miller, C. Meier and H.
Moorefield-Lang, eds. Library Technology Reports, pp.42-47.
Hammer, R., Ronen, M., Sharon, A., Lankry, T., Huberman, Y. and Zamtsov, V.,
2010. Mobile culture in college lectures: Instructors’ and students’

200
perspectives. Interdisciplinary Journal of E-Learning and Learning Objectives,
pp. 293-304.
Hammersley, M., 2000. Taking Sides in Social Research. Essays on Partisanship
and Bias. London: Routledge.
Hargis, J. H., Cavanaugh, C., Kamali, T. and Soto, M., 2014. A federal higher
education iPad mobile learning initiative: Triangulation of data to determine
early effectiveness. Innovative Higher Education, 39(2), pp. 45-57.
Harris, J., Mishra, P. and Koehler, M., 2009. Teachers’ technological pedagogical
content knowledge and learning activity types. Journal of Research on
Technology Education, 41(1), pp. 393-416.
Hart, D., 2000. Satellite Communication. [online] Available at: <http://www.cs.wustl.
edu/jain/cis788-97/ftp/satellitenets.pdf>.
Haydn, T. 2014. How do you get pre-service teachers to become ‘good at ICT’ in
their subject teaching? The views of expert practitioners. Technology,
Pedagogy and Education, 23(4), pp. 455-469.
Hechter, R.P. and Vermette, L.A., 2013. Technology integration in K-12 science
classrooms: An analysis of barriers and implications. Themes in Science and
Technology Education, 6(2), pp. 73-90.
Henderson, M., Selwyn, N. and Aston, R., 2017. What works and why? Student
perceptions of ‘useful’ digital technology in university teaching and learning.
Studies in Higher Education, 42(8), pp. 1567–1579.
Henning, E., Van Rensburg, W. V. and Smit, B. 2004. Finding your way in the
qualitative research. Pretoria: Van Schaik Publishers.
Henrik, V., 2011. Introducing the tablet in A Norwegian High School How do students
and teachers react to this technology?. Master of Science in Computer
Science. Norwegian University of Science and Technology.
Henríquez-Ritchie, P. and Organista-Sandoval, J., 2012. Propuesta metodol_ogica
para la caracterizaci_on de actividades de m-learning realizadas por
estudiantes de una universidad pública. Revista Iberoamericana para la
Investigaci_on y el Desarrollo Educativo. Available at:<http://www.ride.org.mx/
1-11/index.php/ RIDESECUNDARIO/article/download/39/39>.

201
Hesser, T. L. and Schwartz, P. M., 2013. Tablets in the science laboratory:
Experience in Designing and implementing a paperless chemistry laboratory
course. Journal of STEM Education, 14(2), pp.5-9.
Hochberg, E. D. and Desimone, L. M., 2010. Professional development in the
accountability context: Building capacity to achieve standards. Educational
Psychologist, 45(2), pp.89-106.
Hopkins, D., 2008. A teacher guide to classroom research. 4th ed. London: Open
University Press.
Hossain, D., M., 2011. Qualitative Research Process, in Postmodern Openings, 7(2),
pp. 143-156.
Hu, W., 2011. Math That Moves: Schools Embrace the tablet. The New York Times.
[online] Available at: <http://www.nytimes.com/2011/01/05/education
/05tablets.html? pagewanted=all> [Accessed 04 January 2011].
Huda, M., Maseleno, A., Atmotiyoso, P., Siregar, M., Ahmad, R., Jasmi, K. A. and
Muhamad, N. H. N, 2018. Big Data Emerging Technology: Insights into
Innovative environment for Online Learning Resources. International journal of
emerging technologies in learning, 13 (1), pp. 23-36.
Hunter, N. and Storksdieck, M., 2017. Understanding the Use of Tablet Technology
as a Mechanism for Improving Teaching and Learning in the Corvallis School
District. Technical Report. Corvallis, OR: Oregon State University.
Husseini, S. M. and Safa, L., 2009. Factors Affecting the Use of Information and
Communication Technologies (ICTs) by Iranian Agricultural Faculty Members.
World Applied Sciences Journal, 6(8), pp.1123-1127.
Hussey, J. and Hussey, R., 1997. Business research: A practical guide for under
graduate and postgraduate students. Palgrave. New York.
Hyatt, G. W., 2011. The tablet: A cool communicator on the go. Perspectives on
Augmentative and Alternative Communication, 20(1), pp.24 – 27.
IAB [Interactive Advertising Bureau] Australia, 2012. Nielsen Australian online
consumer report 2011-2012. [online] Available at: <http://www.iabaustralia.
com.au/ index.php?/news/story/nielsen_australian_online_consumer_report_2
011-201202> [Accessed 5 March 2012].
Ivankova, N., Creswell, J. and Clark, V. 2007. Foundations and approaches to mixed
methods research. Van Schaik Publishers: Pretoria, South Africa.

202
Jane, M., 2011. The advantages of tablets and tablets in a business. [online].
Available at: <http://smallbusiness.chron.com/advantages-tablets-tablets
business-22551.html> [Accessed 09 September 2011].
Jang, S. J., 2010. Integrating the IWB and peer coaching to develop the TPACK of
secondary science teachers. Computers & Education, 55(4), pp. 1744-1751.
Jang, S.J. and Tsai, M.F., 2012. Exploring the TPACK of Taiwa - nese Elementary
Mathematics and Science Teachers with Respect to Use of Interactive
Whiteboards. Computers & Education, 597, pp. 327-338.
Jankowicz, A., 2000. Business research projects. 3rd ed. Australia: Thomson
Publishers.
Jean-Louis, M., 2011. Final report: Engagement process for an Ontario Online
Institute.
Jethro, O. O., Grace, A., M. and Thomas, A.K., 2012. E-Learning and Its Effects on
Teaching and Learning in a Global Age. International Journal of Academic
Research in Business and Social Sciences, 2(1), pp.203-210.
John, S., Poh, A. C. C., Lim, T. C. C., Chan, E. H. Y. and Chong L. R., 2012. The
iPad tablet computer for mobile on-call radiology diagnosis? Auditing
discrepancy in CT and MRI reporting. Journal of digital imaging, 25, 628–634.
Johnson, B. and Turner, L.A., 2003. Data collection strategies in mixed methods
research. In: A. Tashakkori and C. Teddlie, eds. Handbook of mixed methods
in social and behavioural research.pp. 297-319.
Johnson, L., Adams, S. and Cummins, M., 2012. Mobile apps. The NMC horizon
report: 2012 higher education edition. Austin, Texas: The New Media
Consortium.
Jonassen, D. H., 1994. Thinking technology. Educational Technology, 34(4), pp. 34-
37.
Joppe, M. 2000. The research process. Available at: <http://www.ryerson.ca/
~mjoppe/rp.htm> [Accessed 13 May 2004].
Jurewitsch, B., 2012. A mixed-methods systematic review of online versus face-to-
face problem-based learning. The Journal of Distance Education, 26(2).
Karch, M., 2018. A Beginner's Guide to Apps. [online] Available at:
<https://www.lifewire.com/what-are-apps-1616114>

203
Karsenti, T. and Fievez, A., 2013. The tablet in education: uses, benefits, and
challenges – A survey of 6,057 students and 302 teachers in Quebec,
Canada. Montreal, QC: CRIFP.
Kasenga, A., 2007. An Investigation into the implementation of senior agriculture in
the Caprivi region of Namibia. An Unpublished Dissertation. Rhodes
University.
Keane, T., Lang, C. and Pilgrim, C., 2012. Pedagogy! tabletology! Netbookology!
Learning with mobile devices. Australian Educational Computing, 27(2),
pp.29–33.
Keating, A., 2013. Educating tomorrow’s citizens: what role can schools play?. In:
Keynote Lecture at the Annual School Leadership Conference for Head
teachers in Slovenia, Organised by the Ministry of Education and National
School for Leadership in Education. Slovenia.
Kent, R., 2007. Marketing research. London: Thomson Learning.
Kerrigan, M., Blackburn, R., Force, S., Amin, Z., James, K., Yorke, J., and Scott-
Jones, E., 2014. The student experience of using tablets to enhance
undergraduate laboratory teaching. UCISA (2014) Good Practice Guide.
Mobile Learning: How mobile technologies can enhance the learning
experience, 31-38.
Khaddage, F., Lattemann, C. and Bray, E., 2011. Mobile Apps Integration for
Teaching and Learning Are Teachers Ready to Re-blend?. In: SITE 2011:
Proceedings of the Society for Information Technology & Teacher Education
international conference. AACE, Chesapeake, Va., pp.2545-2552.
Khan, M. S. H., Hasan, M. and Clement, C. K., 2012. Barriers to the introduction of
ICT into education in developing countries: the example of Bangladesh.
International Journal of Instruction, 5(2), pp. 61-80.
Khim, M. C. B., 2003. Harnessing technology for cooperative learning. Educational
Technology Division Ministry of Education, pp.1-16.
Kiger, D., Herro, D. and Prunty, D., 2012. Examining the influence of a mobile
learning intervention on third grade math achievement. Journal of Research
on Technology in Education, 45(1), pp.61-82.

204
Kim, S. H., Mims, C. and Holmes, K. P., 2006. An introduction to current trends and
benefits of mobile wireless technology use in higher education. Association for
the Advancement of Computing in Education, 14(1), pp. 77-100.
Kim, Hea-Suk., 2013. Emerging mobile apps to improve English listening skills.
Multimedia-Assisted Language Learning, 16(2), pp.11-30.
Kim, D. K.., Jeong, D., Lu, L., Debnath, D. and Ming, H., 2015. Opinions on
computing education in Korean K-12 system: Higher education perspective.
Computer science education, 25(4), pp. 371-389.
Kim, B., Tan, L. and Bielaczyc, K., 2015. Learner-generated designs in participatory
culture: what they are and how they are shaping learning, Interactive Learning
Environments, 23(5), pp.545–555.
Kinash, S., Brand, J. and Mathew, T., 2012. Challenging mobile learning discourse
through research: Student perceptions of Blackboard Mobile Learn and
tablets. Australasian Journal of Educational Technology, 28(4), pp. 639-655.
Klegeris, A., and Hurren, H., 2011. Impact of problem-based learning in a large
classroom setting: Student perception and problem-solving skills. Advances in
Physiology Education, 35(4), pp.408-415.
Knezek, G., Christenson, R., Tyler-Wood, T., 2009. Addressing the Need of Digital
Age Learners. [Video online] Available at: <http://www.youtube.com/watch?
v=3pCUAh2uD7w> [Accessed 12 November 2010].
Koehler, M. and Mishra, P., 2009. What is technological pedagogical content
knowledge (TPACK)? Contemporary Issues in Technology and Teacher, 9(1),
pp. 13–20.
Koehler, M., Mishra, P. and Cain, W., 2013. What is technological pedagogical
content knowledge (TPACK)? Journal of Education, 193(3), pp. 14-19.
Koehler, M. J., Mishra, P., Akcaoglu, M. and Rosenberg, J. M., 2013. The
technological pedagogical content knowledge framework for teachers and
teacher educators.
Kopelman L.M. and De Ville K.A., 2001. The Contemporary Debate Over
Physician-Assisted Suicide. In: Kopelman L.M., De Ville K.A., eds.
Physician-Assisted Suicide: What are the Issues?. Philosophy and
Medicine. Dordrecht: Springer.

205
Krauss, S. E., 2005. Research Paradigms and Meaning Making: A Primer. The
Qualitative Report, 10(4), pp. 758-770.
Kumar, R., 2005. Research Methodology-A Step-by-Step Guide for Beginners. 2nd
ed., Australia: Pearson Education
Kuze. M., W., 2009. An investigation into the formative assessment practises of
teachers in selected Eastern Cape schools. Digital Dissertation. University of
Fort Hare.
Kvale, S., 1995. The social construction of validity' in Qualitative Inquiry. 1(1). pp. 19-
40.
Kyzym O. H., Petukhova I. I., 2017. Modern trends in teaching analytical chemistry.
In: international scientific and practical conference of young scientists and
student, 20 April 2017.
Labbo, L. D. and Place, K., 2010. Fresh perspectives on new literacies and
technology integration. Voices from the Middle, 17(3), pp.9-18.
Lambert, C., Erickson, L., Alhramelah, A., Rhoton, D., Lindbeck, R. and Sammons,
D., 2014. Technology and Adult Students In Higher Education: A Review of
the Literature. Issues and Trends in Educational Technology, 2(1), pp.1-19.
Lan, Y. J., Sung, Y. T., Chang, K. E., 2007. A mobile-device-supported peer-assisted
learning system for collaborative early EFL reading. Language Learning &
Technology, 11 (3), pp.130–151
Lee, M. S., Johanson, R. E. and Tsai, C. C., 2008. Exploring Taiwanese high school
students’ conceptions and approaches to learning science through a structural
equation modelling analysis. Science Education, 92(2), pp. 191-220.
Piaget, J., 1963. Origins of intelligence. New York: Norton.
Leech, N. L., and Onwuegbuzie, A. J., 2009. A typology of mixed methods research
designs. Quality and Quantity, 43, pp. 265-75.
Leendertz, V., Blignaut, A. S., Nieuwoudt, H. D., Els, C. J. and Ellis, S. M., 2013.
Technological pedagogical content knowledge in South African mathematics
classrooms: A secondary analysis of SITES 2006 data. Pythagoras, 34(2), pp.
232-240.
LeFevre, A.T., 2004. Technology alone has not improved education. In: L. Egendorf
ed., The information revolution: Opposing viewpoints. Farmington Hills, MI:
Greenhaven Press, pp.78-82.

206
Lemke, C., Coughlin, E. and Reifsneider, D., 2009. Technology in Schools: what the
research says: an update. Culver City, CA: commissioned by Cisco Systems.
Lin, T., Tsai, C., Chai, C. and Lee, M., 2013. Identifying science teachers'
perceptions of technological pedagogical and content knowledge (TPACK).
Journal of Science Education and Technology, 22(3), pp. 325-336.
Lin, Y. T. and Lin, Y. C., 2016. Effects of mental process integrated nursing training
using mobile device on students' cognitive load, learning attitudes,
acceptance, and achievements. Computers in Human Behaviour, 55,
pp.1213-1221.
Lincon, Y.S. and Guba, E.G., 1985. Naturalistic Enquiry. Beverly Hills, CA: Sage.
Lind, D. A., Marchal, W. G. and Wathen, S. A., 2008. Statistical Techniques in
Business & Economics. 13th ed. Boston: McGraw-Hill.
Lindsey, J. L., 2011. Leading change: “going green” with tablets. International
Journal of Business, Humanities & Technology, 1(2), pp.10–16.
Liu, C., Tao, S. and Nee, J., 2008. Bridging the gap between students and
computers: supporting activity awareness for network collaborative learning
with GSM network. Behaviour & Information Technology, 27(2), pp. 127-137.
Liu, C.C. and Chen, I.J., 2010. Evolution of constructivism. Contemporary Issues in
Education Research (CIER), 3(4), pp. 63-66.
Liu, T. C., Lin, Y. C., Tsai, M. J. and Paas, F, 2012. Split-attention and redundancy
effects in mobile learning in physical environments, Computers & Education,
56(2), pp.172–180.
Liu, X. and Wei, R., 2014. Maintaining social connectedness in a fast-changing
world: Examining the effects of mobile phone uses on loneliness among teens
in Tibet. Mobile Media & Communication, 2(3), pp.318-334.
Long, T., Liang, W. and Yu, S., 2013. A study of the tablet computer’s application in
K-12 schools in China. International Journal of Education and Development
using Information and Communication Technology, 9(3), pp.61-70.
Lowther, D. L., Ross, S. M. and Morrison, G. M., 2003. When each one has one: The
influences on teaching strategies and student achievement of using laptops in
the classroom. Educational Technology Research and Development, 51(3),
pp.23-44.

207
Ludwig, L., and Mayrberger, K., 2012. Next generation learning? Learning with
tablets as an example for the implementation digital media in schools. In: T.
Amiel and B. Wilson, eds.Proceedings of the World Conference on
Educational Multimedia, Hypermedia and Telecommunications. Denver, CO,
pp.2179-2187.
Lutz, S. and Huitt, W., 2004. Connecting cognitive development and constructivism:
Implications from theory for instruction and assessment. Constructivism in the
Human Sciences, 9(1), pp. 67-90.
Lynch, D. N., 2010. Student-Centered Learning: The Approach That Better Benefits
Students. Virginia Wesleyaan Collage.
Macmillan, J.H. and Schumacher, S. 2010. Research in education: evidence-based
inquiry. New Jersey: Pearson education Inc.
Maizura, H., Masilamani, R. and Aris, T., 2009. Reliability (Internal Consistency) of
the Job Content Questionnaire on Job Stress Among Office Workers of a
Mulitinatinal Company in Kuala Lampur. Public Journal of PublicHealth, 21,
p.219.
Malhotra, N. K. and Birks, D., 2007. Marketing research: an applied approach.
London: Pearson Publishers.
Manakil, J. and George, R., 2017. Mobile learning practices and preferences a way
forward in enhancing dental education learning experience. European Journal
of General Dentistry, 6(1), pp.22-28.
Mang C. F. and Wardley L. J., 2012. Effective Adoption of Tablets in Post-Secondary
Education: Recommendations Based on a Trial of tablets in University
Classes. Journal of Information Technology Education, 11, pp.301-317.
Mang, C. F. and Wardley, L. J., 2013. Student perceptions of using tablet technology
in post-secondary classes. Canadian Journal of Learning and Technology,
39(4), pp. 1-16.
Mango, O., 2015. iPad Use and Student Engagement in the Classroom. Turkish
Online Journal of Educational Technology, 14(1), pp. 53-57.
Manuguerra, M. and Petocz, P., 2011. Promoting student engagement by integrating
new technology into tertiary education: The role of the tablet. Asian Social
Science, 7(11), pp.61–65.
Maree, K., 2007. First Steps in Research. Pretoria: Van Schaik Publishers.

208
Maree, J. G., 2013. Latest developments in career counselling in South Africa:
Towards a positive approach. South African Journal of Psychology, 43(4). pp.
409-421.
Martin, F. and Ertzberger, J., 2013. Here and now mobile learning: An experimental
study on the use of mobile technology. Computers & Education, 68, pp.76–85.
Mason, J., 1996. Qualitative researching. London: SAGE Publications.
Maxwell, J. A., 1998. Designing a qualitative Study. In: L. Bickman and D. J. Roj,
eds. Handbook of Applied Social Science research methods. Thousand Oaks:
Sage, pp. 214-253.
Maxwell, J. A. and Loomis, D. M., 2003. Mixed methods design: an alternative
approach. In: A. Tashakkori and C. Teddlie, eds. Thousand Oaks, CA: Sage
Publishers.
Maykut, P. and Morehouse, R., 1994. Beginning qualitative research. Routledge
Falmer. London.
Mayisela, T., 2013. The potential use of mobile technology: enhancing accessibility
and communication in a blended learning course. South African Journal of
Education, 33(1), pp.1-18.
Maylor, H. and Blackmon, K., 2005. Researching Business and Management.
London: Palgrave Macmillan.
McBeth, M. K., Turley-Ames, K., Youngs, Y., Ahola-Young, L. and Brumfield, A.,
2015. The iPad Pilot Project: A Faculty Driven Effort to Use Mobile
Technology in the Reinvention of the Liberal Arts. Journal of Teaching and
Learning with Technology, 4(1), pp. 1-21.
McBurney, D.H., 1990. Research methods. California: Books / Coll Publishing
Company.
McCarthy, J., 2016. A Jaworskian analysis of four senior class primary teachers
endeavouring to teach mathematics from a constructivist compatible
perspective. PhD, University College Cork.
McClanahan, B., Williams, K., Kennedy, E. and Tate, S., 2012.
A breakthrough for Josh: How use of an tablet facilitated reading
improvement. Tech Trends, 56(3), pp.20–28.

209
McGee, D. and VanderNoor, J., 2013. Tablet Computer Adoption Programs in High
Schools. [PowerPoint presentation]. Available at: <http://slideplayer.com/slide/
9192610/> [Accessed 24 June 2013].
McMillan, J. H. and Schumacher, S., 2010. Research in education: Evidence-based
inquiry. 7th ed. Boston: Pearson.
McNabb, D., 2004. Research methods for political science: Quantitative and
qualitative methods. Armonk, New York: M.E. Sharpe.
McNaughton, D. and Light, J., 2013. The tablet and Mobile Technology Revolution:
Benefits and Challenges for Individuals who require Augmentative and
Alternative Communication. Augmentative and Alternative Communication,
29(2), pp.107–116.
McQuail, D., 2005. Media structures and institution, In: F. E. Dardis, F. R.
Baumgartner, A. E. Boydstun, S. De Boef and F. Shen, eds. Mass
communication and society. London: Routledge.
Means, B. and Olson, K., 1997. Technology and education reform: Studies of
education reform. Washington DC: U. S. Government Printing Office.
Mele, D., 2012. Management Ethics: Placing Ethics at the Core of Good
Management. Basingstoke: Palgrave Macmillan.
Melhuish, K. and Falloon, G., 2010. Looking to the future: M-learning with the
tablet. Computers in New Zealand Schools: Learning, Leading,
Technology. 22(3), pp.1–16.
Menkhoff, T. and Bengtsson, M., 2012. Engaging Students in Higher Education
Through Mobile Learning: Lessons Learnt in a Chinese Entrepreneurship
Course. Educational Research for Policy and Practice, 11, pp.225-242.
Merriam, S., 1988. Case study research in education: A qualitative research. San
Francisco, CA: Jossey – Bass.
Meurant, R. C., 2010. Tablet computing to foster Korean EFL digital literacy.
International Journal of u-and e- Service, Science, and Technology, 3(4),
pp.49-62.
Mifsud, L., 2002. Alternative Learning Arenas — Pedagogical Challenges to Mobile
Learning Technology in Education. IEEE International Workshop on Wireless
and Mobile Technologies in Education.
Miles, M.B. and Huberman, A.M., 1994. Qualitative data analysis. London: Sage
210
Miller, W., 2012, iTeaching and Learning Collegiate Instruction Incorporating Mobile
Tablets. In: R. K. Miller, C. Meier and H. Moorfield-Lang, eds. Rethinking
Reference and Instruction with Tablets, ALA TechSource, Library Technology
Reports.
Milks, J. and Bloxham, M., 2010. A play date with the tablet: Real people experience
the tablet. Muncie, IN: Ball State University.
Minocha, S. Tudor, A. D. and Tilling, S., 2017. Technological Affordances of Virtual
Reality and their role in Learning and Teaching. Telematics and
Informatics 34(8). pp.1-10.
Mishra, P. and Koehler, M. J., 2006. Technological Pedagogical Content Knowledge:
A framework for teacher knowledge. Teachers College Record, 108(6), pp.
1017-1054.
Mohamed, E. and Lashire, S., 2003. Accounting knowledge and skills and the
challenges of a global business environment. Managerial Finance, 29(7),
pp.3-16.
Mokhele, M.L., 2011. Teachers’ perspectives on continuing professional
development: a case study of the Mpumalanga secondary science initiative
(mssi) project. Ph.D. UNISA.
Moon, B., 2002. Globalization, digital societies and school reform: realising the
potential of new technologies to enhance the knowledge, understanding and
dignity of teachers. In: 2nd European conference on information technologies
in education and citizenship: a critical insight, Barcelona, Spain, 26 June
2002.
Morse, J. M. and Field, P. A., 1995. Qualitative research methods for health
professionals. 2nd ed. Thousand Oaks, CA: Sage.
Mosenson, A. B., and Johnson, J. M., 2010. Instructional strategies and resources:
Exploring the use of technology. In: P. M. Erickson, W. S Fox and D. Stewart,
eds.National standards for teachers of family and consumer sciences:
Research, implementation, and resources. National Association of Teacher
Educators for Family and Consumer Sciences. pp.176-194.
Motiwalla, L. F., 2007. Mobile learning: A framework and evaluation. Computers &
Education, 49(3), pp. 581-596.

211
Motteram, G., 2011.Developing language-learning materials with technology. In: B.
Tomlinson, ed. Materials development in language teaching. Cambridge,
England: Cambridge University Press, pp. 303-327.
Mouton, J., 1996. Understanding social research. Van Schaik. Pretoria.
Mouza, C., Karchmer-Klein, R., Nandakumar, R., Ozden, S.Y. and Hu, L., 2014.
Investigating the impact of an integrated approach to the development of pre-
service teachers' technological pedagogical content knowledge (TPACK).
Computers & Education, 71, pp.206-221.
Muniandy, B., Mohammad, R. and Fong, S. F., 2007. Synergizing pedagogy,
learning theory and technology in instruction: How can it be done? US-China
Education Review, 4(9), pp. 46-53.
Murphy, G. D., 2011. Post-PC devices: A summary of early tablet technology
adoption in tertiary environments. E-Journal of Business Education &
Scholarship of Teaching, 5(1), pp.18-32.
Nancarrow, C., Pallister, J. and Brace, I., 2001. A new research medium, new
research populations and seven deadly sins for internet researchers.
Qualitative Market Research, 4 (3), pp. 136-49.
Nastasi, B. K., Hitchcock, J. H. and Brown, L. M., 2010. An inclusive framework for
conceptualising mixed methods typologies. In: A. Tashakkori and C. Teddlie,
eds. The Sage handbook of mixed methods in social and behavioural
research. Thousand Oaks, CA: Sage Publishers.
National Center for Educational Statistics, 2010. Fast facts: educational technology.
[online]. Available at :< https://nces.ed.gov/fastfacts/display.asp?id=46>
National Research Council, 1999. Being fluent with information technology literacy.
Computer science and telecommunications board commission on physical
sciences, mathematics, and applications. Washington, DC: National Academy
Press.
Nasseh, B., 2009. A Brief History of Distance Education.
Naveen, 2015. Whats the difference between a teacher and a lecturer? Answers.
Yahoo blog, [blog], Available at: < https://answers.yahoo.com/question/index?
qid=20070315155923AATlODI>

212
Nguyen, L., Barton, S. M. and Nguyen, L. T., 2015. iPads in higher education—
Hype and hope. British Journal of Educational Technology, 46(1), pp.190–
203.
Niemeijer, D., Donnellan, A. and Robledo, J., 2012. Taking the pulse of
augmentative and alternative communication on iOS. [online] Assistiveware.
Available at: <http://www.assistiveware.com/taking-pulse-augmentative-and-
alternative-communication-ios > [Accessed 16 April 2012].
Nieuwenhuis, J., 2007. Qualitative research design and data gathering techniques.
In: Maree, K., ed. 2007. First steps in research. Pretoria: Van Schaik, pp 70–
92.
Norris, C. and Soloway, E., 2012. Want increased student achievement using
tablets? [online] District administration. Available at:
<https://www.districtadministration.com/article/want-increased-student-
achievement-using-tablets> [Accessed 24 July 2012].
Oblinger, D., 2003. Boomers & gen-xers millennials understanding the new students.
EDUCAUSE, 38(4), pp.36-47.
OECD (Organisation for Economic Co-operation and Development), 2009. Creating
effective teaching and learning environments. First results from TALIS.
O’Malley, C., Vavoula, G., Glew, J.P., Taylor, J., Sharples, M., Lefrere, P., Lonsdale,
P., Naismith, L. and Waycott, J., 2005. Guidelines for
learning/teaching/tutoring in a mobile environment.
Ooms A., Linsey, Webb and Panayiotidis, 2008. The in-classroom use of mobile
technologies to support diagnostic and formative assessment and feedback.
7th London International Scholarship of Teaching and Learning Conference.
Kingston University, London, U.K.
Öz, H. 2015. Assessing pre-service English as a foreign language teachers'
technological pedagogical content knowledge. International Education
Studies; 8(5), pp. 119-130.
Page, M. S., 2002. Technology-enriched classrooms: Effects on students of low
socioeconomic status. Journal of Research on Technology in Education,
34(4), pp.389-409.
Parafloo, K., 1994. Questionnaire, use, value and limitations. Market Research
Society, 35(1), pp. 79-89.

213
Parajuli, K. P., 2016. Mobile Learning Practice in Higher Education in Nepal. Open
Praxis, 8(1), pp. 41-54.
Pattinasarany, R. R. D. and Juwono, I. D., 2016. Analyzing the Use of E-Learning by
Indonesian Lecturers using TPACK Framework. Asian Education Technology
Conference, pp.93-107.
Patton, M. 2002. Qualitative research and evaluation methods. 3rd ed. Thousand
Oaks, CA: Sage.
Payne, G. and Payne, J., 2004. Distance Education for Teacher Training. London:
Routledge.
Pegrum, M., Howitt, C. and Striepe, M., 2013. Learning to take the tablet: How pre-
service teachers use tablets to facilitate their learning. Australasian Journal of
Educational Technology, 29(4), pp.464-479.
Pelgrum, W. J., 2001. Obstacles to the integration of ICT in education: results from a
worldwide educational assessment. Computers & Education. 37, pp.163–178.
Percival, J. and Claydon, T., 2015. A Study of Student and Instructor Perceptions of
Tablet PCs in Higher Education Contexts. In: Higher Education in
Transformation Conference, Dublin, Ireland, 31 May - 01 April 2015.
Perez, O. A., Gonzalez, V., Pitcher, M. T. and Golding, P., 2011. Work in progress:
analysis of mobile technology impact on STEM based courses; specifically
introduction to engineering in the era of the iPad. Paper presented at the
118th ASEE Annual Conference and Exposition, Vancouver, BC, Canada.
Petridou, E. and Spathis, C., 2001. Designing training interventions: human or
technical skills training?. International Journal of Training and Development,
5(3), pp.185-195.
Pew Research Center Global attitudes and trends, 2015. Internet Seen as Positive
Influence on Education but Negative on Morality in Emerging and Developing
Nations. Pewglobal. [online]. Available at: <http://www.pewglobal.org/2015/03/
19/internet-seen-as-positive-influence-on-education-but-negative-influence-
on-morality-in-emerging-and-developing-nations/> [Accessed 19 March
2015].
Pierson, J. and Thomas, M., 2010. Dictionary of social work: the definitive A to Z of
social work and social care. New York: McGraw Hill Open University Press.
Pisapia, J., 1994. Teaching with technology: Roles and styles. Richmond, VA.

214
Polit, D. F., 2010. Statistics and data analysis for nursing research. 2nd ed. Upper
Saddle River: Pearson.
Poore, D. M., 2015. Professional Development for the Use of iPads in Instruction,
Doctor of Education (Ed.D.), Walden University.
Popović, O., Marković, D. S. and Popović, R., 2016. mTester—Mobile learning
system. Computer Applications in Engineering Education, 24(3), pp. 412-420.
Pownell, D. and Bailey, G., 2001. Getting a Handle on Handhelds: What to Consider
before You Introduce Handheld Computers in Your Schools. American School
Board Journal, 188(6), pp.18-21.
Prensky, M., 2001a. Digital natives, digital immigrants. On the Horizon, 9(5), pp. 1-6.
Prensky, M., 2001b. Do they really think differently? On the Horizon, 9(6), pp.1-9.
Prensky, M., 2005. What can you learn from a cell phone? Almost anything!.
Innovate: Journal of Online Education, 1(5), pp.1-8.
Prensky, M., 2006. Listen to the Natives, Educational Leadership, 63(4), pp. 8-13.
Prensky, M., 2007. Changing paradigms. Educational Technology, 47(4), pp.1-3.
Prensky, M., 2010. Teaching digital natives: Partnering for real learning. Thousand
Oaks, CA: Sage Publications.
Prince, M. J. and Felder, R. M., 2006. Inductive teaching and learning methods:
Definitions, comparisons, and research bases. Journal of Engineering
Education, 95(2), pp.123-138.
Prinsloo, E., Vorster and Sibaya., 1996. Teaching with confidence. Kagiso. Pretoria.
Punch, K.F., 1998. Introduction to Social Research. Buckingham: Open University
Press.
Rafiki, M., 2015. Pedagogical integration of the ipad to enhance teaching and
learning of grade 10 life sciences. Masters of education. University of the
Witwatersrand.
Rakes, G. C., Fields, V. S. and Cox, K. E., 2006. The influence of teachers’
technology use on instructional practices. Journal of Research on Technology
in Education, (38)4, pp. 409-424.
Rajasingham, L., 2011. Will mobile learning bring a paradigm shift in higher
education? Educational Research International, pp. 1-10.

215
Rauscher, L. and Greenfield, B. H., 2009. Advancements in contemporary physical
therapy research: Use of mixed methods research. Physical Therapy, 89(1),
pp. 91–100.
Reed, A. R., 2017. Perceptions on the effectiveness of tablet integration in vocational
college classrooms: a mixed-methods study. Ph.D. Northwest Nazarene
University.
Reyes, V. C. J., Reading, C., Doyle, H. and Gregory, S., 2017. Integrating ICT into
teacher education programs from a TPACK perspective: Exploring
perceptions of university lecturers. Computers & Education, 115, pp.1–19.
Richards, J. C., 2014. Foreword. In: J. D. D. M. Agudo, ed. English as a foreign
language teacher education: Current perspectives and challenges.
Amsterdam: Rodopi, pp. 1-3.
Richardson, W., 2013. Students first, not stuff. Educational Leadership, 70(6), pp.10-
14.
Richie, S.M. and Rigano, D.C., 2001. Evaluation Positivism against Interpretivism:
Post Positivist Approaches to Research. Available at:
<http:www.ukessays.com> ukessays> essays> sociology. Qualitative Social
Research. www.qualitative-research.net/..414>
Rideout, V., 2011. Zero to eight: Children’s media use in America. San Francisco,
CA: Common Sense Media.
Ridenour, C. S. and Newman, I., 2008. Mixed methods research: exploring the
interactive continuum. Carbondale, IL: South Illinois University Press.
Rienties, B., Brouwer, N., & Lygo-Baker, S., 2013. The effects of online professional
development on teachers' beliefs and intentions towards learning facilitation
and technology. Teaching and Teacher Education, 29, pp.122-131.
Roberson, J. H. and Hagevik, R. A., 2008. Cell Phones for Education. Meridian
Middle School Computer Technologies Journal, 11(2). pp. 234-241.
Robson, C., 2005. Real world research: A resource for social-scientists and
practitioner- researchers. Oxford: Blackwell Publishing.
Robinson, R., 2012. Experiential Learning in a New Millennium: The Implications of
iPad Technology in Instructional Settings. In: P. Resta, ed. Proceedings of
SITE 2012--Society for Information Technology & Teacher Education

216
International Conference. Austin, Texas, USA: Association for the
Advancement of Computing in Education (AACE), pp. 1242-1248.
Rolfe, G., 2006. Validity, trustworthiness and rigor: Quality and the idea of qualitative
research. Methodological Issues in Nursing Research, 16. pp. 304–310.
Roschelle, J., Rafanan, K., Bhanot, R., Estrella, G.,Penuel, B., Nussbaum, M. and
Claro, S., 2010a. Scaffolding group explanation and feedback with handheld
technology: impact on students' mathematics learning. Educational
Technology Research and Development, 58(4), pp.399–419.
Roschelle, J., Shechtman, N., Tatar, D., Hegedus, S., Hopkins, B., Empson, S. and
Gallagher, L. P., 2010b. Integration of technology, curriculum, and
professional development for advancing middle school mathematics three
large-scale studies. American Educational Research Journal, 47(4), pp.833-
878.
Rossing, J. P., 2012. Mobile technology and liberal education. Liberal Education,
98(1), pp.68-71.
Rossing, P. J., Miller, W. M., Cecil, A. K. and Stamper, S. E., 2012. iLearning: The
future of higher education? Student perceptions on learning with mobile
tablets. Journal of the Scholarship of Teaching and Learning, 12(2), pp.1–26.
Roters, B. and Trautmann, M., 2014. Professionalitat von Fremdsprachenlehrenden:
Theoretiche Zugange und empirische Befunde. FLuL, 43(1), pp.51-65.
Rule, D. and John, V. 2011. Your Guide to Case Study Research. Pretoria: Van
Schaik Publishers.
Rummel-Hudson, R., 2011. A revolution at their fingertips. Perspectives on
Augmentative and Alternative Communication, 20(1), pp.19 – 23.
Ryan, A. B., 2006. Post-Positivist Approaches to Research. In: Researching and
Writing your thesis: A guide for postgraduate students. MACE: Maynooth
Adult and Community Education.
Sadler, K., Robertson, T., Kan, K. and Hagen, P., 2006. Balancing work, life and
other concerns: a study of mobile technology use by Australian
freelancers. In: Mørch, Anders and Morgan, Konrad and Bratteteig,
Tone and Ghosh, Gautam and Svanaes, Dag, eds. Proceedings of the 4th
Nordic conference on Human-computer interaction changing roles. ACM

217
International Conference Proceeding Series. Association for Computing
Machinery, New York, pp. 413-416.
Saine, P., 2012. iPods, tablets, and the SMARTBoard: Transformingliteracy
instruction and student learning. New England Reading Association Journal,
47(2), pp.4–81.
Salvatori, P., 2000. Implementing a problem-based learning curriculum in
occupational therapy: A conceptual model. Australian Occupational Therapy
Journal, 47(3), pp.119-133.
Saunders, M., Lewis, P., and Thornhill, A., 1997. Research methods for business
students. England: Prentice Hall.
Saunders, M., Thornhill, A. and Lewis, P., 2003. Research methods for business
students. England: Pearson Education.
Saunders, M., Lewis, P. and Thornhill, A., 2007. Research methods for business
students. 4th ed. England: Pearson.
Saunders, M., Lewis, P., and Thornhill, A., 2009. Research methods for business
students. 5th ed. England: Pearson.
Schachter, R. and D'Orio, W., 2011. Kid2kid Connections: How to Use Technology to
Connect Your Students to a Larger World. Instructor, 120(5), pp.46-52.
Schmidt, D.A., Baran, E., Thompson, A.D., Mishra, P., Koehler, M.J. and Shin, T.S.,
2009. Technological pedagogical content knowledge (TPACK): The
development and validation of an assessment instrument for pre-service
teachers. Journal of Research on Technology in Education, 42(2), pp. 123-
149.
Schmidt, W.H., Cogan, L. and Houang, R., 2011. The role of opportunity to learn in
teacher preparation: An international context. Journal of Teacher Education,
62, pp. 138–153.
Schuler, G., 2012. At your own risk: Narratives of Zimbabwean migrant sex workers
in hill brow and discourses of vulnerability, agency, and power. MA thesis.
University of Witwatersrand.
Sekaran, U. and Bougie, R., 2010. Research methods for business. 5th ed. London:
John Wiley and Sons Ltd.

218
Serin, O., 2011. The Effects of the Computer-Based Instruction on the Achievement
and Problem Solving Skills of the Science and Technology Students. The
Turkish Online Journal of Educational Technology, 10(1), pp.183-201.
Shah, T., Patel, M. A. and Shah, H., 2017. A Comparative Study on the Teaching
Effectiveness of Chalk & Talk Versus Microsoft Powerpoint PresentationAn
Institution Based Pilot Study of Physiotherapy Students. International Journal
of Current Research and Review, 9(11), pp. 40-43.
Shanker, D., 2008. ICT and Tourism: Challenges and Opportunities. In: Conference
on Tourism in India – Challenges Ahead. 15-17 May 2008.
Sharon, J., 2016. What is the difference between a school, college and university in
the USA? Studyusa [online]. Available at <https://www.studyusa.com/en/a/
107/what-is-the-difference-between-a-school-college-and-university-in-the-
usa>. [Accessed 07 September 2016].
Shen, Y. W., 2016. An evaluation of the impact of using tablets in teacher education.
The Online Journal of New Horizons in Education, 6(4), pp.18-25.
Sheppard, D., 2011. Reading with tablets – the difference makes a difference.
[online] Education Today. Available at: <http://www.educationtoday.com.au/
article/ Reading-with-tablets--344 > [Accessed 24 July 2012].
Shuler, C., 2009. Pockets of potential: using mobile technologies to promote
children’s learning. [online] New York: The Joan Ganz Cooney Center at
Sesame Workshop. Available at: < http://www.joanganzcooneycenter.org/wp-
content/uploads/2010/03/pockets_of_potential_1_.pdf>.
Shuler, C., 2012. iLearn II. An Analysis of the Education Category of the iTunes App
Store. [online] New York: The Joan Ganz Cooney Center at Sesame
Workshop. Available at: http://www.joanganzcooneycenter.org/wp-
content/uploads/2012/01/ ilearnii.pdf. [Accessed January 2012].
Shulman, L.S. 1986. Those who understand: Knowledge growth in teaching.
Educational Researcher, pp. 4-14.
Siemens, G., 2005. Connectivism: A learning theory for the digital age. International
Journal of Instructional Technology and Distance Learning, 2(1), pp. 3-10.
Singer, J., 2015. The effects of iPad devices on elementary school students’
mathematics achievement and attitudes. Ph.D., North-eastern University.
Silverman, D., 2004. Qualitative data: Theory, Methods and Practice. London: Sage.
219
Silverman, D., 2011. Interpreting Qualitative Data. 4th ed. London: Sage
Siu, K. W. M. and García, G. J. C., 2017. Disruptive technologies and education: Is
there any disruption after all? In Educational leadership and administration:
Concepts, methodologies, tools, and applications. Hershey, PA: IGI Global.
Staff Writers, 2012. 18 enlightening iPad experiments in education [online]. Available
at:<http://www.onlineuniversities.com/18-enlighteni-ipad-experiments-in
education> [Accessed 08 February 2012].
Spathis, C., 2004. Use of Information Technologies and Communication by Business
Studies Students. Proceedings of the 4th Conference in UTIC, Athens’
University. Athens. 29Sept-03Oct. Greece.
Spires, H.A., Wiebe, E., Young, C.A., Hollebrands, K. and Lee, J.K., 2012. Toward a
new learning ecology: Professional development for teachers in 1:1 learning
environments. Contemporary Issues in Technology and Teacher Education,
12(2).
Spronken-Smith, R. and Walker, R., 2010. Can inquiry-based learning strengthen the
links between teaching and disciplinary research? Studies in Higher
Education, 35(6), pp.723-740.
Stahl, G., Koschmann, T. and Suthers, D., 2006. Computer-supported collaborative
learning: an historical perspective, In: R.K. Sawyer, ed. Cambridge Handbook
of the Learning Sciences. Cambridge: Cambridge University Press, pp.409–
426.
Stošić, L., 2015. The importance of educational technology in teaching. International
Journal of Cognitive Research in Science, Engineering and Education, 3(1).
Strydom H., 2005. Ethical aspects of research in the social sciences and human
service professions. In: De Vos, A.S., Strydom, H., Fouché, C.B. and Delport,
C.S.L. eds. Research at grassroots: For the social sciences and human
service professions. Pretoria: Van Schaik, pp. 56‒70.
Strydom, H., 2007. Ethical aspects of research in the social sciences and human
service professions. In De Vos, A.S., Strydom, H., Fouché, C.B. and Delport,
C.S.L., eds. Research at grassroots: For the social sciences and human
service professions.
Strydom, H., 2011. Sampling in the quantitative paradigm. In: De Vos, A.S.,
Strydom, H., Fouché, C.B. and Delport, C.S.L., eds. Research at grass roots:

220
for the social sciences and human service professions. Pretoria: Van Schaik,
pp. 222-235.
Sugar, W., 2005. Instructional technologist as a coach: impact of a situated
professional development program on teachers' technology use. Journal of
Technology and Teacher Education, 13(4), pp.547-571.
Swan, K. and Mitrani, M., 1993. The changing nature of teaching and learning in
computer-based classrooms. Journal of Research on computing in Education,
26(1), pp.40-55.
Taborn, T. W., 2011. Tower School’s 1:1 program brings the tablet 2 to the
elementary classroom. THE Journal. [online] Available at: <https://thejournal.
com/articles/2011/08/03/tower-schools-11-program-brings-the-tablet2-to-the-
elementary-classroom.aspx > [Accessed 08 March 2011].
Talibian, S., Hamid, M. M. and Ahmed R., 2014. Information and Communication
Technologies (ICT) in Higher Education: Advantages, Disadvantages,
Conveniences and Limitations of Applying Elearning to Agricultural Students
in Iran. ProcediaSocial and Behavioral Sciences, 152, pp.300-305.
Tanaka, P. P., Hawrylyshyn, K. A. and Macario, A., 2012. Use of tablet (tablet®) as a
tool for teaching anesthesiology in an orthopedic rotation. Revista Brasileira
de Anestesiologia, 62(2), pp. 214-222.
Tapscott, D., 2008. Net Geners Come of Age.[online] Available at: <http://www.
bloomberg.com/bw/stories/2008-11-03/net-geners-come-ofagebusinessweek
business-news-stock-market-and-financial-advice> [Accessed 12 December
2015]
Tashakkori, A. and Teddlie, C., 2003. Handbook of Mixed Methods in Social and
Behavioural research. Thousand Oaks, CA: Sage.
Tashakkori, A. and Teddlie, C., 2009. Foundations of mixed methods research:
Integrating quantitative and qualitative approaches in the social and
behavioural sciences. Thousand Oaks, CA: Sage.
Taylor, L. M., Casto, D. J. and Walls, R. T., 2007. Learning with versus without
technology in elementary and secondary school. Computers in Human
Behaviour, 23(1), pp.798-811.

221
Thapar-Bj¨orkert, S. and Henry, M., 2004. Reassessing the research relationship:
location, position and power in fieldwork accounts. International Journal of
Social Research Methodology, 7 (5), pp. 363–81.
Thuthukile, J., 2016. Pre-service teachers’ competences for teaching science
through information and communication technologies during teaching practice.
PhD, University of the Free State.
Timmermann, P., 2010, Is my tablet in my backpack?. Journal of Digital Research &
Publishing.
Tomassini, J., 2012. Apple Unveils E-textbook Strategy for K-12. Education Week,
[online] Available at :< http://www.edweek.org/ew/articles/2012/01/20/18apple.
html> [Accessed 20 January 2012].
Torkelson, G.M., 1972. Technology: New goals for individualization. Educational
Leadership, 29(4), pp.315-318.
Trigwell, K. and Prosser, M., 1991. Relating approaches to study and quality of
learning outcomes at the course level. British Journal of Educational
Psychology, 61, pp. 265– 275.
Trochim, W. M. K., 2006. The qualitative debate. The research methods knowledge
base. [online]. Available at: < http://www.socialresearchmethods.net/kb/>
Tuckman, B. 1999. Conducting educational research. 5th ed. Harvest Brace:
Orlando FI.
Turkle, S. and Papert, S., 1991. Epistemological pluralism and the revaluation of the
concrete. In I. Harel and S. Papert, eds. Constructionism: Research reports
and essays. Norwood, NJ: Ablex, pp.161–191.
Unisa, 2018. Extended Science Pathway. [online] Available at: <http://www.unisa.
ac.za/static/corporate_web/Content/Register%20to%20study%20through%20
Unisa%20in%202016/UGH/Docs/Extended-Science-Pathway-Unisa.pdf>
Villegas-Reimers, E., 2003. Teacher professional development; an international
review of the literature. International institute for educational planning.
Vogt, P. W., 2007. Quantitative Research Methods for Professionals. Boston, MA:
Allyn and Bacon.
Vu, P., McIntyre, J. and Cepero, J., 2014. Teachers' Use of the tablet in Classrooms
and Their Attitudes toward Using It. Journal of Global Literacies,
Technologies, and Emerging Pedagogies, 2(2), pp. 58-76.

222
Vuorikari, R., V. Garoia and Balanskat, A., 2011. Introducing Netbook Pedagogies in
Schools. Acer European School net Educational Netbook Pilot. Brussels:
European Schoolnet.
Vygotsky, L. S., 1978. Mind in Society: The Development of Higher Psychological
Processes. MA: Harvard University Press.
Wallace, J. D., 2008. Computer-mediated communication research. In P. Zaphiris &
C. S. Ang (Eds.). Human Computer Interaction: Concepts, Methodologies,
Tools and Applications Hersey, PA: Information Science Reference, pp.299-
315.
Walliman, N. 2006. Social Research Methods. London: Sage publications.
Briggs, A. R.J. and Coleman M., 2007. Research Methods in Educational Leadership
and Management. 2nd ed. Sage Publications: London.
Walling, B. and Lewis, M., 2000. Development of professional identity among
professional development school pre-service teachers; longitudinal and
comparative analysis. Action in Teacher Education, 22(2), pp.63-72.
Wakefield, J. and Smith, D., 2012. From Socrates to Satellites: iPad Learning in an
Undergraduate Course. Creative Education, 3(5), pp.643-648.
Wakefield J., Frawley J.K., Tyler J. and Dyson L.E., 2018. The impact of an iPad
supported annotation and sharing technology on university students' learning.
Computers & Education, , 122, pp.243-259.
Walczak, S. and Taylor, N. G., 2018. Geography learning in primary school:
Comparing face-to-face versus tablet-based instruction methods. Computers
& Education.117, pp. 188-198.
Wang, L., Ertmer, P.A. and Newby, T.J., 2004. Increasing preservice teachers’ self-
efficacy beliefs for technology integration. Journal of Research on Technology
in Education, 36(3), pp.231–250.
Warren, C., 2011. 5 ways to take advantage of the tablet for business. [online].
Available at: < http://mashable.com/2011/07/20/tabletbusiness/#jp_OEKFS
NEqS> [Accessed 20 July 2011].
Weider, B., 2011. Tablets could hinder teaching, professors say. Chronicle of Higher
Education. [online]. Available at: <http://chronicle.com/article/tablets-for-
College-Classrooms-/126681/> [Accessed 13 March 2011].

223
Welman, C., Mitchel, B. and Kruger, F., 2005. Research methodology. 3rd ed. Cape
Town: Oxford University Press.
Werth, E. P. and Werth, L., 2011. Effective training for millennial students. Adult
Learning, 22(3), pp. 12-19.
Willis, J. W. and Mehlinger, H. D., 1996. Information technology and teacher
education. In: J. Sikula, T. Butterly, and E, Guyton, eds. Handbook of
research on teacher education. New York: Simon & Schuster, pp. 978-1029.
Williams, C., 2007. Research Methods. Journal of Business & Economic Research.
5, pp.65-72.
Willis, J. W., 2007. Foundations of qualitative research: Interpretive and critical
approaches. Thousand Oaks, CA: Sage Publications.
Wilkins, K. and Woodgate, R., 2008. Designing a Mixed Methods Study in Pediatric
Oncology Nursing Research. Journal of Pediatric Oncology Nursing, 25(1),
pp. 24–33.
Wilson, B. and Cole, P., 1991. A review of cognitive teaching models. Educational
Technology Research and Development, 39(4), pp. 47-64.
Wilson, N. and McLean, S., 1994. Questionnaire Design: A Practical Introduction.
Newtown Abbey, Co. Antrim: University of Ulster Press.
World bank, 2012. Mobile Phone Access Reaches Three Quarters of Planet's
Population. [online] Available at: <http://www.worldbank.org/en/news/press-
release/2012/07/17/mobile-phone-access-reaches-three-quarters-planets-
population> [Accessed 17 July 2012].
Wu, Y.T., 2013. Research Trends in technological pedagogical content knowledge
(TPACK) research: A review of empirical studies published in selected
journals from 2002 to 2011. British Journal of Educational Technology, 44(3),
pp. 73-76.
Wu, B., Hu, Y., Gu, X. and Lim, C.P., 2015. Professional Development of New
Higher Education Teachers with Information and Communication Technology
in Shanghai: A Kirkpatrick’s Evaluation Approach, Journal of computing
evaluation research, 54(4), pp.531-562.
Yeung, M. and Chung, H., 2011. iPEP talk: pedagogical conversations from The
iPad Exploration Project.

224
Yin, R. K. 2003. Case Study research, Design and methods. 3rd Edition. Sage
publications: London.
Yin, R. K., 2009. Case study research: Design and methods. 4th ed. Los Angeles:
Sage Publications.
Zelkowski, J., Gleason, J., Cox, D.C. and Bismarck, S., 2013. Developing and
validating a reliable TPACK instrument for secondary mathematics pre-service
teachers. Journal of Research on Technology in Education, 46(2), pp. 173-
206.
Zhang, Q. and Kou, Q., 2012. The Course Research for the Software Program
Based on the Constructivism Teaching Theories. Physics Procedia, 25(22),
pp. 2294-2297.
Zhang, Z. and Martinovic, D., 2008. ICT in teacher education: Examining needs,
expectations and attitudes. Canadian Journal of Learning and Technology,
34(2). pp. 149-166.
Zidney, J. and Warner, Z., 2016. Mobile apps for science learning: Review of
research. Computers and Education, 94, pp.1-17.
Zikmund, W., 2000. Business research methods. Orlando, USA: Harcourt Inc.
Zohrabi, M., Torabi, M. A. and Baybourdiani, P., 2012. Teacher-centred and/or
Student-centred learning: English Language in Iran. English Language and
Literature Studies, 2(3), pp.18-30.
Zou, B. and Li, J., 2015. Exploring mobile apps for English language teaching and
learning. In: F. Helm, L. Bradley, M. Guarda and S. Thouësny, eds. Critical
CALL – Proceedings of the 2015 EUROCALL Conference. Padova, Italy.

225
LIST OF APPENDICES
APPENDIX A1: Student questionnaire SECTION A
The questions in this section is to gather biographical data which will be used for
statistical purposes only. Please indicate your choice by placing a tick on the
space provided against to your choice.
A1. Please indicate your gender
MALE
FEMALE
A2. Please indicate your age group
17- 25
26 – 30
31 – 40
Above 40
A3. Please indicate the national diploma you have chosen
Information and Communication Technology
Electrical Engineering
A4. Please indicate your level of study
Year 1
Year 2
Year 3
Year 4 and above

226
APPENDIX A2: Student questionnaire SECTION B
The questions in this section are for you to indicate your agreement on the given
statements on a scale from Strongly Disagree to Strongly Agree. Please circle the
number shown below, that best represents your response on your activities using
tablet.
# STATEMENT
After getting tablet, I started to
STRON
GLY
DISAG
REE
DISAG
REE
NO
OPIN
ION
AGREE STRO
NGLY
AGRE
E
B1 read e-books. 1 2 3 4 5
B2 communicate with the lecturer. 1 2 3 4 5
B3 conduct research. 1 2 3 4 5
B4 gather information. 1 2 3 4 5
B5 e-learning through Black Board. 1 2 3 4 5
B6 learn multiple learning styles. 1 2 3 4 5
B7 have a negative impact on their
handwriting skills.
1 2 3 4 5
B8 take photos of the lecture
highlights on white board to avoid
copying by hand.
1 2 3 4 5
B9 use during the lecture for taking
notes.
1 2 3 4 5
B10 submit their work to the lecturer
through email or a file sharing
apps.
1 2 3 4 5

227
APPENDIX A3: Student questionnaire SECTION C
The questions in this section are for you to indicate your agreement on the given
statements on the scale from Strongly Disagree to Strongly Agree. Please circle the
number shown below, that best represents your response on tablet use in learning
the courses.
# STATEMENT
The use of tablets helped
me to
STRONGLY
DISAGREE
DISAG
REE
NO
OPIN
ION
AGRE
E
STRON
GLY
AGREE
C1 learn the course content in the
class.
1 2 3 4 5
C2 perform my homework more
easier.
1 2 3 4 5
C3 perform my project easier. 1 2 3 4 5
C4 learn multiple learning styles. 1 2 3 4 5
C5 participate in the course
activity that enhanced my
learning.
1 2 3 4 5
C6 develop confidence in the
subject area.
1 2 3 4 5
C7 focus on the tasks. 1 2 3 4 5

228
APPENDIX A4: Student questionnaire SECTION D
The questions in this section are for you to indicate your agreement on the given
statements on a scale from Strongly Disagree to Strongly Agree. Please circle the
number shown below, that best represents your response on the tablet use for
engagement and student collaboration in classroom.
# STATEMENT
Tablet
STR
ONG
LY
DISA
GRE
E
DISAG
REE
NO
OPIN
ION
AGRE
E
STRO
NGLY
AGRE
E
D1 activities motivated me to learn the course
material more than the class activities that did
not use tablet.
1 2 3 4 5
D2 helped me to participate more in class during
the tablet activities than during activities that
did not use tablet.
1 2 3 4 5
D3 assisted me to participate more in classroom
during the tablet activities with my classmates
than during activities that did not use tablet.
1 2 3 4 5
D4 use at home is not as useful as that in the
classroom.
1 2 3 4 5
D5 made it easier for me to understand the topics
using tablets when I learn in a group.
1 2 3 4 5
D6 activities helped me to participate in quiz as a
team.
1 2 3 4 5
D7 helped me to gather information for the group
project work.
1 2 3 4 5
D8 helped me in Group discussion. 1 2 3 4 5

229
APPENDIX A5: Student questionnaire SECTION E
The questions in this section are for you to indicate your agreement on the given
statements on a scale from Strongly Disagree to Strongly Agree. Please circle the
number shown below, that best represents your response on the use of tablet when
it is compared with personal computer (PC).
#
STATEMENT STR
ONG
LY
DISA
GRE
E
DISAG
REE
NO
OPIN
ION
AGRE
E
STRO
NGLY
AGRE
E
E1 tablets are more convenient to use when
compared with personal computer(PC).
1 2 3 4 5
E2 The tablet assists me to search for more
information than through PC.
1 2 3 4 5
E3 tablet assisted me to participate more actively
in discussions than using PC.
1 2 3 4 5
E4 I was not able to develop programs using
tablets but was able to develop them using PC.
1 2 3 4 5
E5 I see tablet as a good tool to learn when I
compare it with PC.
1 2 3 4 5

230
APPENDIX B1: Lecturer questionnaire SECTION A
The questions in this section is to gather biographical data which will be used for
statistical purposes only. Please indicate your choice by placing a tick on the
space provided against to your choice.
A1. Please indicate your gender
MALE
FEMALE
A2. Please indicate your age group
21- 30
31 – 40
41 – 50
Above 50
A3. Please indicate your highest qualification
B Tech
Honours
Masters
PhD
A4. Please indicate the department in which you are working on
Information and Communication Technology
Electrical Engineering
A5. Please indicate your lecturing experience
Below 1 year
1 year and above but less than 2 years
2 years and above but less than 4 years
4 years and above but less than 6 years
Above 6 years
A6. Please indicate your level of experience using the tablet in lecturing
Below 1 year
1 year and above but less than 2 years
2 years and above but less than 4 years
4 years and above but less than 6 years
Above 6 years

231
APPENDIX B2: Lecturer questionnaire SECTION B
The questions in this section are for you to indicate your agreement on the given
statements on a scale from Strongly Disagree to Strongly Agree. Please circle the
number shown below, that best represents your response on students’ activities
using tablet.
# STATEMENT
After getting tablet, students
started to
STRO
NGLY
DISAG
REE
DISAG
REE
NO
OPIN
ION
AGRE
E
STRO
NGLY
AGRE
E
B1 read e-books. 1 2 3 4 5
B2 communicate with the lecturer. 1 2 3 4 5
B3 conduct research. 1 2 3 4 5
B4 gather information. 1 2 3 4 5
B5 e-learning through Black Board. 1 2 3 4 5
B6 learn multiple learning styles. 1 2 3 4 5
B7 have a negative impact on their
handwriting skills.
1 2 3 4 5
B8 take photos of the lecture highlights
on white board to avoid copying by
hand.
1 2 3 4 5
B9 use during the lecture for taking
notes.
1 2 3 4 5
B10 submit their work to the lecturer
through email or a file sharing apps.
1 2 3 4 5

232
APPENDIX B3: Lecturer questionnaire SECTION C
The questions in this section are for you to indicate your agreement on the given
statements on a scale from Strongly Disagree to Strongly Agree. Please circle the
number shown below, that best represents your response on students’ activities for
engagement and collaboration in classroom using tablet.
# STATEMENT
Tablet
STRO
NGLY
DISAG
REE
DISA
GRE
E
NO
OPIN
ION
AGR
EE
STR
ONG
LY
AGR
EE
C1 activities motivated students to learn the
course material more than the class
activities that did not use tablet.
1 2 3 4 5
C2 helped students to participate more in
class during the tablet activities than
during activities that did not use tablet.
1 2 3 4 5
C3 assisted students to participate more in
classroom during the tablet activities with
their classmates than during activities
that did not use tablet.
1 2 3 4 5
C4 made it easier for students to understand
the topics using tablets when they learn
in a group.
1 2 3 4 5
C5 use in Peer Assisted Learning (PAL) tutor
class has helped them to learn the topics
better than without tablets.
1 2 3 4 5
C6 activities helped them to participate in
quiz as a team.
1 2 3 4 5
C7 helped them to gather information for the
group project work.
1 2 3 4 5
C8 helped them in Group discussion. 1 2 3 4 5

233
APPENDIX B4: Lecturer questionnaire SECTION D
The questions in this section are for you to indicate your agreement on the given
statements on a scale from Strongly Disagree to Strongly Agree. Please circle the
number shown below, that best represents your response on students’ use of tablet
when compared with personal computer (PC).
# STATEMENT STR
ONG
LY
DISA
GRE
E
DISAG
REE
NO
OPINI
ON
AGRE
E
STRO
NGLY
AGRE
E
D1 tablets are more convenient to use
when compared with personal
computer(PC).
1 2 3 4 5
D2 The tablet assists students to search
for more information than through PC.
1 2 3 4 5
D3 Students were not able to develop
programs using tablets but was able
to develop them using PC.
1 2 3 4 5

234
APPENDIX B5: Lecturer questionnaire SECTION E
The questions in this section are for you to indicate your agreement on the given
statements on a scale from Strongly Disagree to Strongly Agree. Please circle the
number shown below, that best represents your response on your tablet use in
lecturing the courses.
# STATEMENT
STRO
NGLY
DISAG
REE
DISA
GRE
E
NO
OPINIO
N
AGRE
E
STRO
NGLY
AGRE
E
E1 I use tablets for most of my lecture
classes.
1 2 3 4 5
E2 Tablet enhances the tasks during
lectures.
1 2 3 4 5
E3 By using the tablet, I am quickly able
to complete the topics.
1 2 3 4 5
E4 The use of tablet helps to complete
the curriculum on time.
1 2 3 4 5
E5 Current curriculum should be adapted
for effective use of tablet.
1 2 3 4 5
E6 tablet use has made my work more
easier in lecturing.
1 2 3 4 5
E7 With students’ use of tablets, I see
distraction in class while I am
lecturing.
1 2 3 4 5
E8 Using personal computers (PC)
makes better impact in students than
using tablets.
1 2 3 4 5
E9 tablet helped me to develop skills that
apply to my academic career.
1 2 3 4 5
E10 Overall, I prefer personal computers
than using tablets.
1 2 3 4 5

235
APPENDIX C1: Manager Questionnaire SECTION A
The questions in this section is to gather biographical data which will be used for
statistical purposes only. Please indicate your choice by placing a tick on the
space provided against to your choice.
A1. Please indicate your gender
MALE
FEMALE
A2. Please indicate your age group
21- 30
31 – 40
41 – 50
Above 50
A3. Please indicate your highest qualification
B Tech
Honours
Masters
PhD
A4. Please indicate your designation
Dean
Head of the Department
Extended Programme Coordinator
e-learning specialist
e-learning administrator
Institutional Head of Extended programme co-ordinator
A5. Please indicate your Managing experience
Below 1 year
1 year and above but less than 2 years
2 years and above but less than 4 years
4 years and above but less than 6 years
Above 6 years
236
APPENDIX C2: Manager Questionnaire SECTION B
The questions in this section are for you to indicate your agreement on the given
statements on a scale from Strongly Disagree to Strongly Agree.
Please circle the number shown below, that best represents your response on the
tablet use of students and lecturers in learning and teaching respectively.
#
STATEMENT
STRO
NGLY
DISAG
REE
DISAGR
EE
NO
OPIN
ION
AGRE
E
STRO
NGLY
AGRE
E
B1 Tablet helped the lecturers to develop
skills that apply to their academic career
1 2 3 4 5
B2 Academic results of students have
improved after incorporating tablets into
education
1 2 3 4 5
B3 After using tablet, lecturers are able to
complete the curriculum very fast
1 2 3 4 5
B4 Current curriculum should be adapted
for effective use of tablet
1 2 3 4 5
B5 tablets are better than personal
computer (PC) for students
1 2 3 4 5
B6 tablets are better than personal
computer (PC) for lecturers
1 2 3 4 5
B7 Wi-Fi internet speed in the campus and
class room is good
1 2 3 4 5
B8 Tablets are adopted just for a trend to
be with the latest technology in the
market.
1 2 3 4 5

237
APPENDIX D1: Interview protocols for Students
1. Do you use tablets for any activity other than learning during lecture hours? If yes,
what are they?
2. Do you use tablets for any activity other than learning after the class hours? If yes,
what are they?
3. Do you think tablets enhanced your learning capability? Why or why not?
4. Did tablets enable you to collaborate with your lecturer? If yes, how?
5. Did tablets enable you to collaborate with your classmates? If yes, how?
6. What benefits have you obtained in your use of tablet computers as a learning
tool?
7. What drawbacks have you noticed in your use of tablet computers as a learning
tool?
8. Would you like to share anything else with me about the use of tablets in
classroom?

238
APPENDIX D2: Interview protocols for Lecturers
1. Have you attended any training in order to use the tablets effectively for teaching
before it was integrated in classroom? If yes, how effective was it for you?
2. What benefits have you obtained in your use of tablet computers as a teaching
tool?
3. What drawbacks have you noticed in your use of tablet computers as a teaching
tool?
4. Please describe your teaching experience in using pedagogical apps that are
installed in tablets to teach IT/Electrical courses.
5. Was it easy or challenging to teach the courses before the integration of tablets?
Why?
6. In your view, do you think that the curriculum needs to be changed for the
effective use of tablets to make students more active in learning? Why or why not?
7. What are the different tablet activities that are related to learning which you have
noticed very often among students while you lecture in classroom?
8. What are the different tablet activities that are not related to learning which you
have noticed very often among students while you lecture in classroom?
9. Do you think that the method of learning by the students has changed after the
implementation of tablets? If yes, How?
10. How does the use of tablets support engagement and collaboration between
students?
11. What benefits for students have you noticed in their use of tablet computers as a
learning tool?
12. What drawbacks for students have you noticed in their use of tablet computers
as a learning tool?
13. Would you like to share anything else with me about students’ use of tablets in
learning?
14. Would you like to share anything else with me about your use of tablets in
teaching?

239
APPENDIX D3: Interview protocols for Managers
1. Do you think that the pass rate of students has improved after the implementation
of tablets? If yes, How?
2. What difference have you noticed in the teaching methodology of lecturers after
the implementation of tablets?
3. Have you offered any training to students in order to use the tablets effectively for
learning before it was integrated in classroom? If yes, how effective was it for them in
their learning?
4. Have you offered any training to lecturers in order to use the tablets effectively for
teaching before it was integrated in classroom? If yes, how effective was it for them
in their teaching?
5. Do you think that the integration of tablets in classroom has enhanced the skill of
students in learning? Why or why not?
6. Do you think that the integration of tablets in classroom has enhanced the skill of
lecturers in teaching? Why or why not?
7. In your view, do you think that the curriculum needs to be changed for the
effective use of tablets to make students more active in learning? Why or why not?
8. In your view, do you think that the curriculum needs to be changed for the
effective use of tablets to make lecturers more active in teaching? Why or why not?
9. What benefits for students have you noticed in their use of tablet computers as a
learning tool?
10. What benefits for lecturers have you noticed in their use of tablet computers as a
teaching tool?
11. What drawbacks for students have you noticed in their use of tablet computers
as a learning tool?
12. What drawbacks for lecturers have you noticed in their use of tablet computers
as a teaching tool?
13. Would you like to share anything else with me about your use of students and
lecturers use of tablets?

240
APPENDIX E1: Application letter requesting for Ethical clearance certificate

241
APPENDIX E2: Ethical clearance certificate from University of Fort Hare

242
243
APPENDIX E3: Application letter requesting for permission to conduct the
study in research site

244
APPENDIX E4: Consent from University where study was executed

245
APPENDIX E5: Invitation letter to Managers to participate in pilot study

246
APPENDIX E6: Invitation letter to lecturers to participate in pilot study

247
APPENDIX F1: Survey Consent form - Managers
INFORMED CONSENT FORM
RESEARCHER
Simon Christopher Fernandez, a PhD student in the department of Education
at University of Fort Hare.
INTRODUCTION
The purpose of this form is to provide you with information by which you can
decide whether to participate or not in this study. Any questions that you may have
will be answered by the researcher. Once you are familiar with the information on the
form and have asked any questions you may have, you can decide whether to
participate or not to participate. If you agree, please sign at the end of this form in the
given space.
PURPOSE
The purpose of this study is to gather the views of selected stakeholders to
assess the strengths and weaknesses of using tablets for learning and teaching in a
university.
POTENTIAL RISKS
This research is purely academic and any information provided here will not
be used against the respondents. There are no foreseeable risks to your involvement
in this study. Therefore, confidentiality of your responses is hereby pledged. If for
any reason participating in this study cause you to feel upset or anxious, you may
withdraw from participation at any time.
COMPENSATION
You will not receive any type of payment for participating in this study.
POTENTIAL BENEFITS
The possible benefits to you if you participate in this research is that you may
learn about what a survey is and how to do it by rating opinions. You may also think
more about the strengths and weaknesses of using the tablet in classrooms.

248
STATEMENT OF PRIVACY AND CONFIDENTIALITY
The researcher will make every effort to prevent anyone from knowing that
you have provided the information, or what that information was. To protect the
anonymity, your name or personal details will not be asked in this form.
VOLUNTARY PARTICIPATION
Your refusal to participate in this study will involve no penalty or loss of
benefits and will not affect you in any way.
DURATION
The completion of the survey will take approximately 10 minutes.
PLEASE NOTE
Before you sign this form, please ask any questions on any aspect of this
study that is unclear to you.
SIGNATURE SECTION – PLEASE READ CAREFULLY
By signing this consent form, you confirm that you are satisfied with the
ethical concerns and you have read and understood the information provided above
and give consent to take part in this research.
Participant Signature……………….………..………….…………………
Date……………………………

249
APPENDIX F2: Survey Consent form - Lecturers
INFORMED CONSENT FORM
RESEARCHER
Simon Christopher Fernandez, a PhD student in the department of Education
at University of Fort Hare.
INTRODUCTION
The purpose of this form is to provide you with information by which you can
decide whether to participate or not in this study. Any questions that you may have
will be answered by the researcher. Once you are familiar with the information on the
form and have asked any questions you may have, you can decide whether to
participate or not to participate. If you agree, please sign at the end of this form in the
given space.
PURPOSE
The purpose of this study is to gather the views of selected stakeholders to
assess the strengths and weaknesses of using tablets for learning and teaching in a
university.
POTENTIAL RISKS
This research is purely academic and any information provided here will not
be used against the respondents. There are no foreseeable risks to your involvement
in this study. Therefore, confidentiality of your responses is hereby pledged. If for
any reason participating in this study cause you to feel upset or anxious, you may
withdraw from participation at any time.
COMPENSATION
You will not receive any type of payment for participating in this study.
POTENTIAL BENEFITS
The possible benefits to you if you participate in this research is that you may
learn about what a survey is and how to do it by rating opinions. You may also think
more about the strengths and weaknesses of using the tablet in classrooms.
250
STATEMENT OF PRIVACY AND CONFIDENTIALITY
The researcher will make every effort to prevent anyone from knowing that
you have provided the information or what that information was. To protect the
anonymity, your name or any personal details will not be asked in this form.
VOLUNTARY PARTICIPATION
Your refusal to participate in this study will involve no penalty or loss of
benefits and will not affect you in any way.
DURATION
The completion of the survey will take approximately 30 minutes.
PLEASE NOTE
Before you sign this form, please ask any questions on any aspect of this
study that is unclear to you.
SIGNATURE SECTION – PLEASE READ CAREFULLY
By signing this consent form, you confirm that you are satisfied with the
ethical concerns and you have read and understood the information provided above
and give consent to take part in this research.
Participant Signature………………. ………..………….…………………
Date……………………………

251
APPENDIX F3: Survey Consent form - Students
INFORMED CONSENT FORM
RESEARCHER
Simon Christopher Fernandez, a PhD student in the department of Education
at University of Fort Hare.
INTRODUCTION
The purpose of this form is to provide you with information by which you can
decide whether to participate or not in this study. Any questions that you may have
will be answered by the researcher. Once you are familiar with the information on the
form and have asked any questions you may have, you can decide whether to
participate or not to participate. If you agree, please sign at the end of this form in the
given space.
PURPOSE
The purpose of this study is to gather the views of selected stakeholders to
assess the strengths and weaknesses of using tablets for learning and teaching in a
university.
POTENTIAL RISKS
This research is purely academic and any information provided here will not
be used against the respondents. There are no foreseeable risks to your involvement
in this study. Therefore, confidentiality of your responses is hereby pledged. If for
any reason participating in this study cause you to feel upset or anxious, you may
withdraw from participation at any time.
COMPENSATION
You will not receive any type of payment for participating in this study.
POTENTIAL BENEFITS
The possible benefits to you if you participate in this research is that you may
learn about what a survey is and how to do it by rating opinions. You may also think
more about the strengths and weaknesses of using the tablet in your courses.

252
STATEMENT OF PRIVACY AND CONFIDENTIALITY
The researcher will make every effort to prevent anyone from knowing that
you have provided the information, or what that information was. To protect the
anonymity, your name or personal details will not be asked in this form.
VOLUNTARY PARTICIPATION
Your refusal to participate in this study will involve no penalty or loss of
benefits and will not affect you in any way.
DURATION
The completion of the survey will take approximately 45 minutes.
PLEASE NOTE
Before you sign this form, please ask any questions on any aspect of this
study that is unclear to you.
SIGNATURE SECTION – PLEASE READ CAREFULLY
By signing this consent form, you confirm that you are satisfied with the
ethical concerns and you have read and understood the information provided above
and give consent to take part in this research.
Participant Signature………………. ………..………….…………………
Date……………………………

253
APPENDIX F4: Interview Consent form - Students
Ethics Research Confidentiality and Informed Consent Form
Please note: This form is to be completed by the researcher(s) as well as by the interviewee before the commencement of the research. Copies of the signed form must be filed and kept on record (To be adapted for individual circumstances/needs) Our University of Fort Hare / Department is asking people from your community / sample / group to answer some questions, which we hope will benefit your community and possibly other communities in the future. The University of Fort Hare / Department/ organization is conducting research regarding selected stakeholders’ views on the use of tablet computer in learning and teaching – a South African case study at a university. We are interested in finding out more about views of University students, Lecturers, and Managers to assess the strengths and weaknesses of using tablets for learning and teaching in a university. We are carrying out this research to help the lecturers who are using new technologies and also the institutions that are having a plan to adopt tablets for learning. Please understand that you are not being forced to take part in this study and the choice whether to participate or not is yours alone. However, we would really appreciate it if you do share your thoughts with us. If you choose not take part in answering these questions, you will not be affected in any way. If you agree to participate, you may stop me at any time and tell me that you don’t want to go on with the interview. If you do this there will also be no penalties and you will NOT be prejudiced in ANY way. Confidentiality will be observed professionally. I will not be recording your name anywhere on the questionnaire and no one will be able to link you to the answers you give. Only the researchers will have access to the unlinked information. The information will remain confidential and there will be no “come-backs” from the answers you give. The interview will last around (13) minutes. I will be asking you a questions and ask that you are as open and honest as possible in answering these questions. Some questions may be of a personal and/or sensitive nature. I will be asking some questions that you may not have thought about before, and which also involve

254
thinking about the past or the future. We know that you cannot be absolutely certain about the answers to these questions but we ask that you try to think about these questions. When it comes to answering questions there are no right and wrong answers. When we ask questions about the future we are not interested in what you think the best thing would be to do, but what you think would actually happen. If possible, our organisation would like to come back to this area once we have completed our study to inform you and your community of what the results are and discuss our findings and proposals around the research and what this means for people in this area.
INFORMED CONSENT I hereby agree to participate in research regarding selected stakeholders’ views on the use of tablet computers in learning and teaching – a South African case study at a university. I understand that I am participating freely and without being forced in any way to do so. I also understand that I can stop this interview at any point should I not want to continue and that this decision will not in any way affect me negatively. I understand that this is a research project whose purpose is not necessarily to benefit me personally. I have received the telephone number of a person to contact should I need to speak about any issues which may arise in this interview. I understand that this consent form will not be linked to the questionnaire, and that my answers will remain confidential. I understand that if at all possible, feedback will be given to my community on the results of the completed research. …………………………….. Signature of participant Date:………………….. I hereby agree to the tape recording of my participation in the study …………………………….. Signature of participant Date:…………………..

255
APPENDIX F5: Interview Consent form - Lecturers and Managers
Ethics Research Confidentiality and Informed Consent Form
Please note: This form is to be completed by the researcher(s) as well as by the interviewee before the commencement of the research. Copies of the signed form must be filed and kept on record (To be adapted for individual circumstances/needs) Our University of Fort Hare / Department is asking people from your community / sample / group to answer some questions, which we hope will benefit your community and possibly other communities in the future. The University of Fort Hare / Department/ organization is conducting research regarding selected stakeholders’ views on the use of tablet computer in learning and teaching – a South African case study at a university. We are interested in finding out more about views of University students, Lecturers, and Managers to assess the strengths and weaknesses of using tablets for learning and teaching in a university. We are carrying out this research to help the lecturers who are using new technologies and also the institutions that are having a plan to adopt tablets for learning. Please understand that you are not being forced to take part in this study and the choice whether to participate or not is yours alone. However, we would really appreciate it if you do share your thoughts with us. If you choose not take part in answering these questions, you will not be affected in any way. If you agree to participate, you may stop me at any time and tell me that you don’t want to go on with the interview. If you do this there will also be no penalties and you will NOT be prejudiced in ANY way. Confidentiality will be observed professionally. I will not be recording your name anywhere on the questionnaire and no one will be able to link you to the answers you give. Only the researchers will have access to the unlinked information. The information will remain confidential and there will be no “come-backs” from the answers you give. The interview will last around (30) minutes. I will be asking you a questions and ask that you are as open and honest as possible in answering these questions. Some questions may be of a personal and/or sensitive nature. I will be asking some questions that you may not have thought about before, and which also involve

256
thinking about the past or the future. We know that you cannot be absolutely certain about the answers to these questions but we ask that you try to think about these questions. When it comes to answering questions there are no right and wrong answers. When we ask questions about the future we are not interested in what you think the best thing would be to do, but what you think would actually happen. If possible, our organisation would like to come back to this area once we have completed our study to inform you and your community of what the results are and discuss our findings and proposals around the research and what this means for people in this area.
INFORMED CONSENT I hereby agree to participate in research regarding selected stakeholders’ views on the use of tablet computers in learning and teaching – a South African case study at a university. I understand that I am participating freely and without being forced in any way to do so. I also understand that I can stop this interview at any point should I not want to continue and that this decision will not in any way affect me negatively. I understand that this is a research project whose purpose is not necessarily to benefit me personally. I have received the telephone number of a person to contact should I need to speak about any issues which may arise in this interview. I understand that this consent form will not be linked to the questionnaire, and that my answers will remain confidential. I understand that if at all possible, feedback will be given to my community on the results of the completed research. …………………………….. Signature of participant Date:………………….. I hereby agree to the tape recording of my participation in the study …………………………….. Signature of participant Date:…………………..

257
APPENDIX G1: Certificate of Language Editing
Copyright © 2022 FDOKUMEN