A multiple stakeholders’ approach to strategic selection decisions
16
This article appeared in a journal published by Elsevier. The attached copy is furnished to the author for internal non-commercial research and education use, including for instruction at the authors institution and sharing with colleagues. Other uses, including reproduction and distribution, or selling or licensing copies, or posting to personal, institutional or third party websites are prohibited. In most cases authors are permitted to post their version of the article (e.g. in Word or Tex form) to their personal website or institutional repository. Authors requiring further information regarding Elsevier’s archiving and manuscript policies are encouraged to visit: http://www.elsevier.com/copyright
Transcript of A multiple stakeholders’ approach to strategic selection decisions

This article appeared in a journal published by Elsevier. The attachedcopy is furnished to the author for internal non-commercial researchand education use, including for instruction at the authors institution
and sharing with colleagues.
Other uses, including reproduction and distribution, or selling orlicensing copies, or posting to personal, institutional or third party
websites are prohibited.
In most cases authors are permitted to post their version of thearticle (e.g. in Word or Tex form) to their personal website orinstitutional repository. Authors requiring further information
regarding Elsevier’s archiving and manuscript policies areencouraged to visit:
http://www.elsevier.com/copyright
Author's personal copy
A multiple stakeholders’ approach to strategicselection decisions
S.M. Ali Khatami Firouzabadi *, Brian Henson 1, Cathy Barnes 2
Allameh Tabatabaie University Business School (ATUBS), Tehran, Iran
School of Mechanical Engineering, University of Leeds, Leeds LS2 9JT, United Kingdom
Received 30 June 2005; accepted 4 October 2007Available online 4 November 2007
Abstract
This paper presents a decision support methodology for strategic selection decisions, in which a single choice has to bemade between a number of alternatives in the presence of multiple stakeholders. The methodology uses a combination ofAnalytic Hierarchy Process (AHP) and Zero-One Goal Programming (ZOGP) to address not only the selection problemfrom the point of view of an individual stakeholder but also from that of multiple stakeholders, by aggregating differentoutcomes obtained by the stakeholders. The methodology then can simultaneously account for: minimisation of undesir-able intangible and tangible criteria; resource limitations and goal constraints; the view of more than one stakeholder; andit can suggest a single, aggregated, go or no-go decision.� 2007 Elsevier Ltd. All rights reserved.
Keywords: Multi-criteria decision making; Stakeholders; Aggregation; AHP; ZOGP
1. Introduction
This paper presents a decision support methodology for strategic selection decisions. In these decisions,companies have to choose a single outcome from a number of alternatives by aggregating outcomes of differ-ent stakeholders. Each stakeholder can be an individual person or an entity, such as a department or a groupof persons, whose views are important for making the decision. A decision making problem with more thanone stakeholder can be constructed as more than one hierarchy with different criteria (Saaty, 1980).
The difficulties associated with strategic selection decisions are:
• They are non-repetitive.• They have a long term effect on the success of the company.
0360-8352/$ - see front matter � 2007 Elsevier Ltd. All rights reserved.doi:10.1016/j.cie.2007.10.015
* Corresponding author. Address: Allameh Tabatabaie Business School, (ATUBS), Nezami Ganjavi Ave., Tavanir St., Vali Asr St.Tehran, Iran.
E-mail addresses: [email protected] (S.M. Ali Khatami Firouzabadi), [email protected] (B. Henson), [email protected](C. Barnes).
1 Tel.: +44 0 113 343 2755/2150; fax: +44 0 113 343 2150.2 Tel.: +44 0 113 343 2123.
Available online at www.sciencedirect.com
Computers & Industrial Engineering 54 (2008) 851–865
www.elsevier.com/locate/caie

Author's personal copy
• Conflicting views may exist between different stakeholders. For example, customers might like to purchasea particular product, but managers might find it difficult to manufacture.
• Even within an individual stakeholder or stakeholder group, criteria may conflict. For example, customerswant quality but also want something inexpensive.
• There are a large number of intangible and tangible criteria (Ordoobadi & Mulvaney, 2001). Tangible cri-teria are those that can be objectively measured (such as current cost) and intangible criteria are those thatcannot (such as efficiency or future income).
• Retaining the status quo cannot be considered as an alternative because in the increasingly competitiveworld, companies in international markets must continuously improve their products and productivityto survive. Choosing to do nothing causes market share to decrease (Noble, 1990).
The traditional way of justifying strategic selection decisions is financial assessment. In traditional methods,the future benefits of an investment are converted to monetary values, ignoring most of the qualitative benefitsbecause of inadequate means for quantifying them. Traditional methods usually justify decisions using low-level capital budgeting, which works well for investments with clearly defined benefits as monetary values,but does not work well for longer-term strategic investments (Parsaei & Wilhelm, 1989). This is because intan-gible criteria, such as flexibility and quality, cannot be converted into monetary values exactly (Yang & Chen,2006). Thus traditional methods ignore intangible benefits and long-term perspectives. Another way of justi-fying strategic selection decisions is to perform a strategic/economic analysis, making a list of all potential ben-efits, and performing a traditional economic analysis on the quantifiable benefits (Noble, 1990). Then, if theproject is not justified through these procedures, expected value analysis is used to estimate any remainingnon-quantifiable benefits. However, this method does not take into account the views of multiple stakeholdersand the assigning probabilities to calculate the expected value is subjective.
This paper proposes a methodology that uses a combination of Analytic Hierarchy Process (AHP) withZero-One Goal Programming (ZOGP), not only to form separate models to reach the most suitable outcomefrom the viewpoint of each individual stakeholder but also to aggregate the possibly different outcomesobtained from individual ZOGP models. AHP is used because of its ability to generate true or approximateweights. Furthermore, AHP has an advantage of being easy to use. ZOGP is used because of its ability toresolve conflicting, tangible criteria from different stakeholders into a go, no-go decision and to satisfy the cri-teria as much as possible.
In the combined AHP-ZOGP procedure, the criteria, such as price or quality of a product, and real con-straints, such as budget limitations, are sought as the goals which stakeholders intend to maximise with min-imum additional efforts. In this view, as well as the usual real constraints which form the constraints of ZOGPmodels, such as budget limitations, there are constraints which have a one-to-one relationship between crite-ria. For example, the quality criterion will have been considered as a constraint in the model. The aim of thesekinds of constraints, as will be described later, is not only to take into account the intangible criteria in themodel by their quantification using pairwise comparison of AHP, but also to provide a way to measurehow well an alternative is performed against a criterion. The consequences of considering these constraintscan be demonstrated by their entire or partial fulfilment depending upon what the target values of those cri-teria are, which in turn depends on the subjective judgement of stakeholders.
To construct a ZOGP model for each individual stakeholder, its objective function and its constraints needto be identified. For both purposes, AHP is a useful technique because it helps (1) to identify the contributionof each criterion to the overall goal from each individual viewpoint: selection of the most suitable alternative,and (2) to identify how well an alternative performs with regard to a criterion when all the alternatives arecompared with that criterion. The contribution of each criterion is, in fact, the importance of each criterionin comparison with other criteria. The AHP’s global weights of criteria which measure the relative importanceof the criteria by pairwise comparisons can be these contributions. The AHP can establish the global weightsof those criteria which have been placed in the penultimate level of the hierarchy. On the other hand, the par-tial weights are the weights of alternatives when they are compared to a criterion. The global weights becomethe coefficients of the objective function of the ZOGP model, while partial weights become the parameters ofintangible criteria constraints. Tangible criteria constraints are made by normalising the values of alternatives.Although the target of each intangible criterion constraint can be set to any normal value, depending entirely
852 S.M. Ali Khatami Firouzabadi et al. / Computers & Industrial Engineering 54 (2008) 851–865
Author's personal copy
on the attitude of the stakeholder, this value is set as the largest parameters of that criterion constraint (valuesof the left hand side of the constraint) because it is assumed that the stakeholder wants to be exactly satisfiedwith that criterion. The objective functions of individual ZOGP models are to minimise the linear sum of tan-gible and intangible criteria undesirable deviation variables. The weighting method is used to solve ZOGPmodels because, unlike the pre-emptive method, it can consider all goals, without neglecting the goals thatmay not be important or will be close to the upper level priority.
To aggregate possibly different outcomes obtained by individual models, the approach uses another ZOGPmodel. The objective function of this model is a linear sum of individual objective functions with an attachedweight, which can be varied in the subsequent stages to show the importance of each of the stakeholders in theprocess of making the decision. The attached weights for individual objective functions, at this stage, are set tobe equal but they can then take any other values. The constraints of individual models are set to the aggre-gated model. The aggregated model is, in fact, a device to tradeoff between not only the stakeholders but alsotheir criteria.
The novelty of the proposed approach is that it can simultaneously account for: minimisation of undesir-able tangible and intangible criteria; resource limitations and goal constraints; and it can suggest a single,aggregated, go or no-go decision, by aggregation of models, not outcomes of the models.
An application of a strategic selection decision, which is used in this paper, is when a company has to selectan Advanced Manufacturing Technology (AMT). An AMT is any type of technology that, when incorporatedinto a manufacturing operation, has a significant impact on the product, process, and informational view-points of the system (Ordoobadi & Mulvaney, 2001). Evaluating and justifying AMTs is a complex taskbecause they have a long life, and the investments and expected returns occur over several years. Large invest-ments are often associated with the selection of AMTs and companies make such decisions relatively infre-quently. Consequently, the nature of the problem is that of a binary decision; selection or non-selection.The selection of an AMT affects many stakeholders such as managers, customers and perhaps governments.The selection criteria often include both tangible and intangible social, economic and technological criteria.For a more detailed assessment of traditional methods for evaluating AMTs, the reader is referred Canadaand Sullivan (1990), and Ordoobadi and Mulvaney (2001). The assessment suggests that companies shouldnot rely on traditional economic methods alone for the selection of a technology.
The principal claim of this paper is that we demonstrate a decision support method for multiple criteria,multiple stakeholders that goes beyond previous methods. Whilst the approach appears to enhance the useof AHP and ZOGP, it remains for the methodology to be validated by testing it, not only against othermulti-criteria decision support techniques for making strategic selection decisions, but also to implementthe methodology for other case studies.
2. Literature review
The application of AHP to strategic evaluation was demonstrated by Partovi (1990). Similar models wereproposed by Albayrakoglu (1996), Datta, Sambasivarao, Kodali, and Deshmukh (1992), Bayazit, Karpak,and Yagci (2006), and Borenstein and Betencourt (2005). In these models, AHP was used to rank alternatives,neglecting the availability of scarce resources and different stakeholders’ viewpoints.
Tie and Lin (1991, 1992) formulated a linear programming model that included capital costs, direct andindirect costs and qualitative costs in AMT selection. Kuei, Lin, Aheto, and Madu (1994) used linear pro-gramming and AHP for the selection of AMT. However, they did not suggest method for converting the qual-itative benefits into numerical parameters, and the issue of viewpoints of different stakeholders is not fullyconsidered. Hugo and Pistikopoulos (2005) used the traditional economic criteria and mixed integer program-ming to address the strategic decisions involving the selection, allocation and capacity expansion of processingtechnologies. In addition, an approach was developed to consider buyer and seller interactions in supplierselection process (Chan, 2003).
Soni, Parsaei, and Liles (1990) suggested a linear weighted additive model which consists of two phases. Thefirst phase investigates the importance of strategic, long-term proposals, while the second phase analyses thetactical, short-term alternatives that could be used to carry out the strategic approach chosen in the first phase.Similar weighted models were used by Parsaei and Wilhelm (1989). Dhavale (1995) proposed a more sophis-
S.M. Ali Khatami Firouzabadi et al. / Computers & Industrial Engineering 54 (2008) 851–865 853

Author's personal copy
ticated weighted scoring model. These models do not consider the viewpoints of different stakeholders and donot include methods for the consideration of scarce resources. In addition, the methods suggest no approachfor considering multiple viewpoints.
Troxler and Blank (1989) developed a method for selection of AMT based on the value of the system. Theyconsidered strategic, tactical, and operational decision factors. The method included analysis of manufactur-ing systems from several vantage points which allowed comparisons to be made. The value of a system wasmeasured in terms of suitability (relative to corporate strategy), capability, performance and productivity.The system value was represented by an additive vector function that reflected the value of tangible and intan-gible attributes. Zavadskas and Antucheviciene (2007) used a multi-criteria approach to rank the availablebuilding’s regeneration alternatives by combining the economic benefits and social criteria. An approachwas developed for selection of chief executive officer by combination of strategic management and goal pro-gramming (Hoffman, Schniederjans, & Sebora, 2004).
Badri (2001), and Schniederjans and Garvin (1997) used a combination of AHP and ZOGP, but they did notuse the relative weights of last level pairwised comparisons with regard to alternatives to build intangible con-straints. Furthermore they did not apply the global weights of each criterion to form the objective function.
Ordoobadi and Mulvaney (2001) suggested firstly considering the tangible benefits when choosing an AMT.If these benefits can justify the proposal, there is no need for further action. If they cannot, then it is necessaryto establish whether intangible benefits can make up for the gap. Their methodology is based on utility theory.Ordoobadi and Mulvaney (2001) provide a review and classification of techniques used in AMT investmentdecisions.
Yang and Chen (2006) used AHP with GRA (Grey Relational Analysis) for strategic supplier selection in asingle stakeholder environment. Shyur and Shih (2006) used analytical network process and TOPSIS (Tech-nique for Order Performance by Similarity to Idea Solution) for strategic vendor selection, again in a singlestakeholder environment. Choudhury, Shankar, and Tiwari (2006) developed a multi-person, multi-criteriaand multi-preference method using the fuzzy preference relations for a technology selection problem. Theselection of the most suitable partner in strategic shipping alliances using the fuzzy set theory has been exam-ined by Ding and Liang (2005). Some studies have examined selection decisions under uncertainty such asthose by De kort and Booij (2007), Alonso-Ayuso, Escudero, Garin, Ortuno, and Perez (2005) and Dingand Benyoucef (2005).
To summarise, the literature describes many techniques for considering the various tangible and intangibleelements, such as AHP. However, there appears to be few methods that consider different stakeholders’ cri-teria, the availability of resources, the desirability of criteria; or minimum and maximum achievement thresh-olds for criteria. The methodology proposed here addresses these shortcomings.
3. Methodology
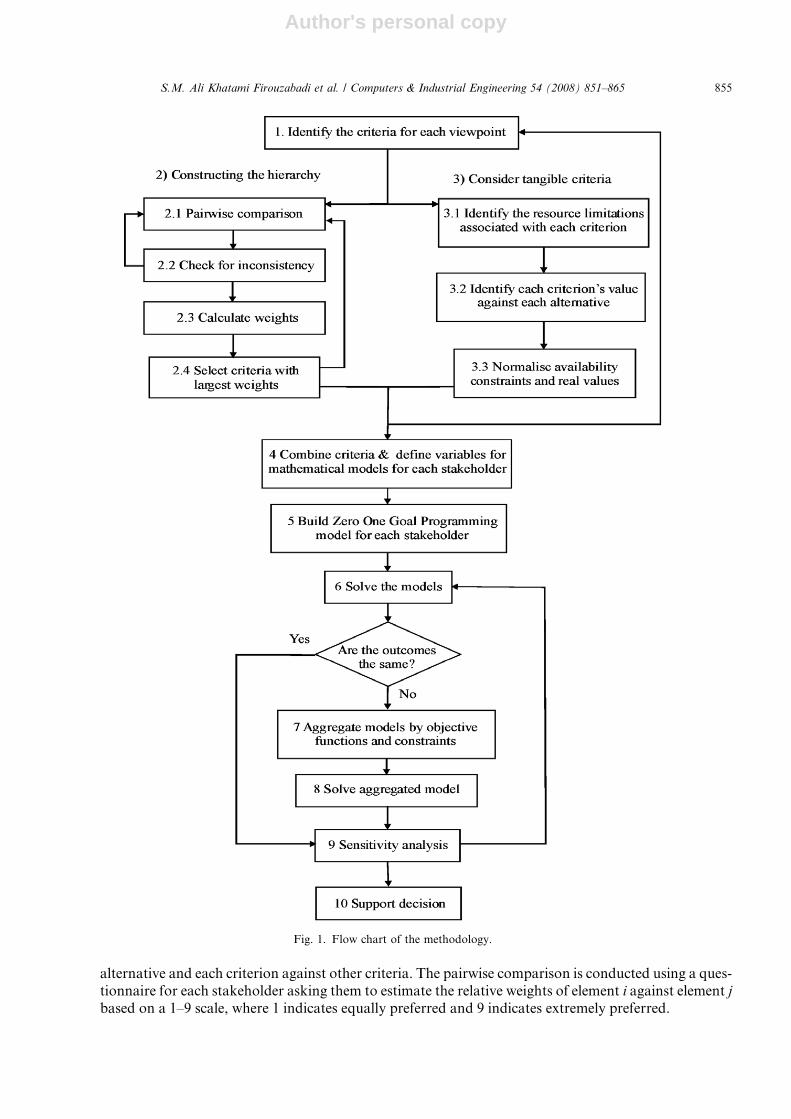
The stages of this methodology are shown in Fig. 1.
1. Selection criteria play an extremely important role in MCDM problems, so the first step is to identifythe selection criteria (Chan, 2003). The selection of criteria should first satisfy the roles of those ele-ments and then favour the collection of data so as to measure and compare the criteria objectively orsubjectively. To implement this stage, the Delphi method can be used. For example, to select a vehiclemanufacturing technology, the manufacturer’s criteria might include the cost of buying the technology,access to know-how, and the ability to sell the technology to a third party; whereas the criteria fromthe customers’ viewpoint might include the price of each product, horsepower, and durability. Thesecriteria are divided into tangible and intangible criteria. It should be noted that to use AHP, the cri-teria need to be independent. If some criteria are dependent, they can be aggregated in a node in theAHP process.
2. The next steps are to construct the AHP hierarchy in order to identify each stakeholders’ weights for theZOGP model. In this research, the software Expert Choice (Expert Choice, 2007) was used for steps 2.1–2.3.2.1 A pairwise comparison is performed to determine the weights of each criterion with regard to each
854 S.M. Ali Khatami Firouzabadi et al. / Computers & Industrial Engineering 54 (2008) 851–865
Author's personal copy
alternative and each criterion against other criteria. The pairwise comparison is conducted using a ques-tionnaire for each stakeholder asking them to estimate the relative weights of element i against element j
based on a 1–9 scale, where 1 indicates equally preferred and 9 indicates extremely preferred.
Fig. 1. Flow chart of the methodology.
S.M. Ali Khatami Firouzabadi et al. / Computers & Industrial Engineering 54 (2008) 851–865 855
Author's personal copy
2.2 The inconsistency ratios for the pairwise comparison are checked to ensure that they have beenprecisely judged by the stakeholders. If the inconsistency ratio reveals inconsistencies, theprevious step is repeated to get better judgements (Kuei et al., 1994). Hadamard matrices can alsobe used here to identify which judgement is the most incompatible between the individual and thegroup in order to inform that individual to modify his comparisons. (Srisoepardani, 1996).
2.3 The weights are calculated for each level of hierarchy and each alternative. Tangible criteria areincluded in the AHP but are not considered objectively. Instead, the criteria such as price, forexample, are compared subjectively. When the weights have been calculated, some of them maybe too small in comparison with other weights at the same parent node. If this occurs, those cri-teria are removed to decrease the chance of rank reversal because of existence of irrelevant criteria.This process is valuable when the problem has so many criteria that the most important ones areobscured. This step is repeated until there are no criteria with a significant difference in weight.
3. Consider tangible criteria:3.1 The resource limitations associated with each criterion are identified. For instance, the available bud-
get for buying a specific vehicle manufacturing technology might be a million units.3.2 Data is gathered about the values of tangible criteria. For example, the price of car A might be 12 cur-
rency units.3.3 To allow the use of the weighting method to solve the ZOGP model, the values are normalised and
units removed. For example, the unit price may be in dollars, while the fuel consumption is in kilome-tres per litre.
4. Each stakeholder’s weights for tangible and intangible criteria needed to construct the ZOGP models areconsidered. Variables are defined for each stakeholder.
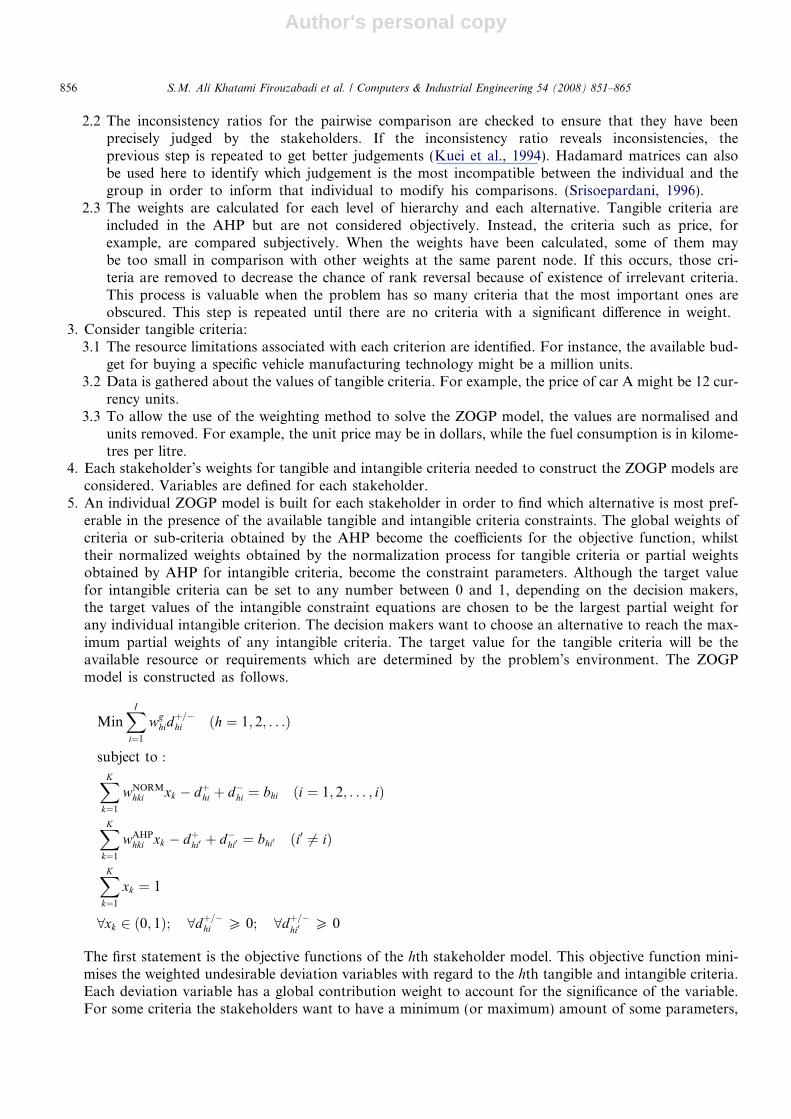
5. An individual ZOGP model is built for each stakeholder in order to find which alternative is most pref-erable in the presence of the available tangible and intangible criteria constraints. The global weights ofcriteria or sub-criteria obtained by the AHP become the coefficients for the objective function, whilsttheir normalized weights obtained by the normalization process for tangible criteria or partial weightsobtained by AHP for intangible criteria, become the constraint parameters. Although the target valuefor intangible criteria can be set to any number between 0 and 1, depending on the decision makers,the target values of the intangible constraint equations are chosen to be the largest partial weight forany individual intangible criterion. The decision makers want to choose an alternative to reach the max-imum partial weights of any intangible criteria. The target value for the tangible criteria will be theavailable resource or requirements which are determined by the problem’s environment. The ZOGPmodel is constructed as follows.
MinXI
i¼1
wghidþ=�hi ðh ¼ 1; 2; . . .Þ
subject to :
XK
k¼1
wNORMhki xk � dþhi þ d�hi ¼ bhi ði ¼ 1; 2; . . . ; iÞ
XK
k¼1
wAHPhki xk � dþhi0 þ d�hi0 ¼ bhi0 ði0 6¼ iÞ
XK
k¼1
xk ¼ 1
8xk 2 ð0; 1Þ; 8dþ=�hi P 0; 8dþ=�hi0 P 0
The first statement is the objective functions of the hth stakeholder model. This objective function mini-mises the weighted undesirable deviation variables with regard to the hth tangible and intangible criteria.Each deviation variable has a global contribution weight to account for the significance of the variable.For some criteria the stakeholders want to have a minimum (or maximum) amount of some parameters,
856 S.M. Ali Khatami Firouzabadi et al. / Computers & Industrial Engineering 54 (2008) 851–865

Author's personal copy
so in these circumstances, having less (more) than a predetermined level of the parameter is not desirable,so their negative (positive) relative deviation variables should be minimised (maximized) with regard totheir weights. The second equation represents the tangible criteria constraints once their coefficientsand target values are normalised. The third equation indicates the intangible criteria constraints. Theircoefficients are derived from AHP. Its target value is the greatest relative importance of alternatives whenthey are compared with a criterion. The selection of just one alternative is represented in the next equation.The selection variable is binary in nature and all of the deviation variables must be equal to or greater thanzero. Definition of the parameters and variables are given as follows:
K number of alternatives
xk binary selection variable of kth alternative (1 = selection, 0 = non-selection)
wghi global weight of ith sub-criterion in the penultimate level of hth hierarchy
dþ=�hi deviation variables for sub-criteria of the hth hierarchy that can be desirable or undesirable
wNORMhki ith AHP weight of tangible sub-criteria for the hth hierarchy with regard to the kth alternative
bhi target value of ith tangible sub-criterion of the hth hierarchy
bhi0 target value of i’th intangible sub-criterion of the hth hierarchy
wAHPhki ith weight of intangible sub-criteria for the hth hierarchy with regard to the kth alternative
Deviation variables (d) with a plus or minus index and a positive value show that the full attainment of agoal (right hand side of an equation) is not possible. For those constraints that the less (more) is better(such as cost for former and alignment for latter), the deviation variable with plus (minus) index accompa-nying its weights, is minimised. Each deviation variable is recognised by d and one index.
6. The models are solved using Lindo software (Lindo software, 2007). If the outcomes of each model are dif-ferent, then the models need to be aggregated. Otherwise go to step 9.
7. The models are aggregated in order to find a single outcome that can satisfy all stakeholders’ criteriaas much as possible. The objective function of the aggregated model is assumed to be a linear sum ofthe objective functions of the single models. All the coefficients in the objective function are un-scaledand therefore can be added. The aggregated objective function tries to minimise the sum of undesirabledeviation variables with their attached weights to each individual stakeholder. For some criteria thestakeholders want to have a minimum amount of some parameter. In these circumstances, having lessthan a predetermined level of the parameter is not desirable, so their relative deviation variable shouldbe minimised with regard to its weights. Different stakeholders’ variables can be connected by express-ing them as additional constraints in the aggregated model if necessary. Constraints that relate thevariables of technology selection and the products of those technologies are well defined (Hillier &Lieberman, 1995). A single outcome is yielded. If the alternatives for all stakeholders’ viewpointsare the same, then the aggregated model is as follows. The parameter and variable definitions arethe same as individual models. wm and wc indicate the attached weight of each stakeholder which mustsum to one. These weights are useful to obtain additional information when a sensitivity analysis iscarried out.
Min wmXJ
j¼1
wgmjd
þ=�mj þ wc
XI
i¼1
wgcidþ=�ci
subject to
XK
k¼1
wNORMmkj xk � dþmj þ d�mj ¼ bmj ðj ¼ 1; 2; . . . ; JÞ
XK
k¼1
wAHPmkj xk � dþmj0 þ d�mj0 ¼ bmj0 ðj0 6¼ jÞ
XK
k¼1
XL
l¼1
wNORMcki xk � dþci þ d�ci ¼ bci ði ¼ 1; 2; . . . ; IÞ
S.M. Ali Khatami Firouzabadi et al. / Computers & Industrial Engineering 54 (2008) 851–865 857

Author's personal copy
XK
k¼1
XL
l¼1
wAHPcki xk � dþci0 þ d�ci0 ¼ bci0 ði0 6¼ iÞ
XK
k¼1
xk ¼ 1
8xk 2 ð0; 1Þ; 8dþ=�mj P 0; 8dþ=�mj0 P 0; 8dþ=�ci P 0; 8dþ=�ci0 P 0
8. The aggregated model is solved. This outcome provides the most appropriate outcome for all stakeholders’selection criteria.
9. A sensitivity analysis is performed to determine how the outcome changes as important parameters are var-ied. Sensitivity analysis involves obtaining a sequence of solutions that comprises a series of improvingapproximations to the ideal course of action. Thus any apparent weakness in the initial outcome is usedto suggest improvements in the model, its input data, and perhaps the solution procedure. In addition, sen-sitivity analysis includes the investigation of some of the tradeoffs between parameters and decision vari-ables. To do this, we change the target values of the models to see what will happen and to identify thebounds of the target values for each constraint. A sensitivity analysis can be performed by:• Deleting each intangible criterion one by one and then calculating the AHP weightings to obtain new
coefficients for the objective function.• Changing the target values of the constraints to evaluate their effects in the outcome.• Developing alternative objective functions for the aggregated model.• Deleting the less important alternative with regard to the initial outcome and then calculating new
weights for the objective function and constraints.10. The outcomes of the process, and the results of the sensitivity analysis, are used by the decision maker(s)
who have sufficient power to implement a decision.
3.1. The case study
A case study is used based on the selection of a vehicle manufacturing technology to illustrate the method-ology. Selection of the most suitable vehicle manufacturing technology is characterised by the difficulties asso-ciated with other strategic selection decisions. It is a complex task because of its long-term benefits; the social,economical, and political criteria; the existence of intangible and tangible criteria; the existence of conflictingcriteria; and the existence of multiple stakeholders.
Growing competition, increasing demands from customers and scarce resources are forcing Iranian vehi-cle manufacturing companies to consider investment in new technologies, adopting manufacturing technol-ogy from a well-known international company. A new technology is any type of technology that, whenincorporated into a manufacturing operation, has a significant impact on the product, process, and infor-mational viewpoints of the system (Ordoobadi & Mulvaney, 2001). The case study envisages a situation inwhich a company purchases an entire vehicle manufacturing technology, perhaps when the technology hascome to the end of its market life in its country of origin, to manufacture the vehicle under license. Adop-tion of a technology implies transferring all of the hardware including machines, equipments, tools andproduction lines. It includes transferring all the accompanying softwares, documents, technical diagrams,standards, methods and systems including training from a country that has the technology to anothercountry under a contract.
Selection of a new technology such as a vehicle manufacturing system is not trivial, and the decision is onlyexplored at a general level. Nevertheless, the case study is offered for illustrative purposes. The stakeholdersfor the selection might include managers, customers, government and employees and the authors assert thatthe methodology is not restricted to the consideration of just two viewpoints. However, for the sake of clarityand conformity of reality in this case, only two stakeholders, managers and customers, are considered. Thecriteria for customers were obtained by interviewing experts in three large car agencies, five mechanics inthe garages and 20 persons who had a car for more than fifteen years. The criteria for managers were obtainedby interview of more than ten managers and experts who were working at three large vehicle manufacturing
858 S.M. Ali Khatami Firouzabadi et al. / Computers & Industrial Engineering 54 (2008) 851–865

Author's personal copy
companies in Iran. The process of interview for determining the criteria from the viewpoints of managers andcustomers were repeated three times using the Delphi method, in order to refine the criteria which were deter-mined previously. In this regard, less important sub-criteria were eliminated from further consideration andsome cognate and dependent criteria were considered together. In addition, only general criteria commonbetween the respondents were taken into account. In other words, special criteria or sub-criteria wereeliminated.
Also, it is necessary to determine the alternatives from which the stakeholders wish to choose. To do this,an initial list was considered including the vehicle companies’ name from around the world. The initial list ofalternatives was more than 30 famous companies. The list of possible alternatives was decreased to limit thechoice to a small number of alternatives that could be examined in detail based on some reasonable factors(Pomerol & Romero, 2000). That list of alternatives was then decreased based on the following factors: gov-ernment support, limitation of political issues, export possibility of products, availability of data, interests ofvehicle manufacturing managers, interests of customers, usability for middle class people, and reasonable sell-ing price of products.
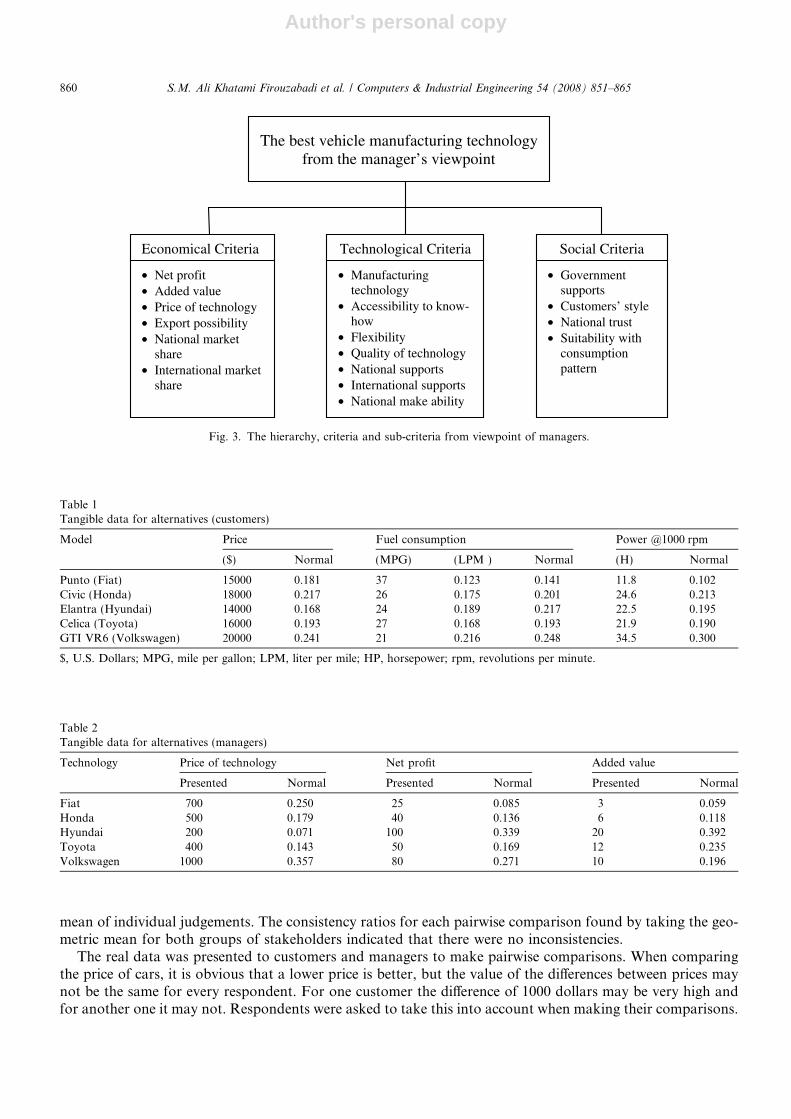
These factors reduced the number of alternatives sharply. For example, limitation of political issues pre-vented consideration of American companies, while usability for middle class people prevented considerationof companies such as B.M.W or Mercedes-Benz. After full consideration of alternatives from the viewpointsof the listed factors, Fiat, Honda, Hyundai, Toyota and Volkswagen were chosen for further consideration. Inaddition, in order to avoid rank reversal of alternatives when similar alternatives exists (Golden, Wasil, &Harker, 1989), a model was selected from each company which was compatible with interests of customers,was medium size and was suitable for a family of 4. They were: Punto (Fiat), Civic (Honda), Elantra (Hyun-dai), Celica (Toyota), and GTI VR6 (Volkswagen). Based on the above description of alternatives, criteria andsub-criteria, two hierarchies were built to express the stakeholders’ viewpoints. These hierarchies are shown inFigs. 2 and 3. Alternatives will be shown at the bottom of these hierarchies.
For the chosen alternatives, available data regarding customers’ criteria were elicited from www.kbb.comand data regarding managers’ criteria were obtained from related proposals which were available for vehiclemanufacturing companies in Iran. These data are depicted in Tables 1 and 2.
3.1.1. Obtaining the weights
To obtain the weights of criteria and sub-criteria, two questionnaires were designed. One questionnaire wasdistributed among 150 Iranian customers. 31 questionnaires were returned. The second questionnaire was dis-tributed among 15 members of the boards of three large vehicle manufacturing companies in Iran. Amongthem 12 members responded. Final results of pairwise comparisons were obtained by taking the geometric
The best vehicle manufacturing technology from the customer’s viewpoint
Economical Criteria Technical CriteriaStyle Criteria
• Comfort• Elegance • Type• Dimension and
shape• Modern equipments
• Price• Fuel consumption • Repairing costs • Easy to sell second
hand
• Safety• Durability• Horsepower• Easy to repair
Fig. 2. The hierarchy, criteria and sub-criteria from viewpoint of customers.
S.M. Ali Khatami Firouzabadi et al. / Computers & Industrial Engineering 54 (2008) 851–865 859
Author's personal copy
mean of individual judgements. The consistency ratios for each pairwise comparison found by taking the geo-metric mean for both groups of stakeholders indicated that there were no inconsistencies.
The real data was presented to customers and managers to make pairwise comparisons. When comparingthe price of cars, it is obvious that a lower price is better, but the value of the differences between prices maynot be the same for every respondent. For one customer the difference of 1000 dollars may be very high andfor another one it may not. Respondents were asked to take this into account when making their comparisons.
The best vehicle manufacturing technology from the manager’s viewpoint
Technological Criteria Social CriteriaEconomical Criteria
• Net profit • Added value • Price of technology • Export possibility • National market
share• International market
share
• Manufacturingtechnology
• Accessibility to know-how
• Flexibility• Quality of technology • National supports • International supports • National make ability
• Governmentsupports
• Customers’ style • National trust • Suitability with
consumptionpattern
Fig. 3. The hierarchy, criteria and sub-criteria from viewpoint of managers.
Table 1Tangible data for alternatives (customers)
Model Price Fuel consumption Power @1000 rpm
($) Normal (MPG) (LPM ) Normal (H) Normal
Punto (Fiat) 15000 0.181 37 0.123 0.141 11.8 0.102Civic (Honda) 18000 0.217 26 0.175 0.201 24.6 0.213Elantra (Hyundai) 14000 0.168 24 0.189 0.217 22.5 0.195Celica (Toyota) 16000 0.193 27 0.168 0.193 21.9 0.190GTI VR6 (Volkswagen) 20000 0.241 21 0.216 0.248 34.5 0.300
$, U.S. Dollars; MPG, mile per gallon; LPM, liter per mile; HP, horsepower; rpm, revolutions per minute.
Table 2Tangible data for alternatives (managers)
Technology Price of technology Net profit Added value
Presented Normal Presented Normal Presented Normal
Fiat 700 0.250 25 0.085 3 0.059Honda 500 0.179 40 0.136 6 0.118Hyundai 200 0.071 100 0.339 20 0.392Toyota 400 0.143 50 0.169 12 0.235Volkswagen 1000 0.357 80 0.271 10 0.196
860 S.M. Ali Khatami Firouzabadi et al. / Computers & Industrial Engineering 54 (2008) 851–865

Author's personal copy
Tables 3 and 4 show the output of Expert Choice for the customers’ and managers’ viewpoints respectively.In these tables the weights for tangible criteria are replaced with normalised real data but other outputs, suchas the final weights for alternatives, were not changed. No criteria were removed based on insignificantweights.
As can be seen, different stakeholders chose different alternatives when AHP was used individually. Theapproach uses the partial and global weights to construct the ZOGP models for each individualstakeholder.
Table 3Output of Expert Choice software for customers’ viewpoint
Criteria Alternatives
Partial weights Global weights
Fiat Honda Hyundai Toyota Volkswagen Relative importance
Comfort (C1) 0.066 0.274 0.085 0.369 0.207 0.054Elegance (C2) 0.081 0.276 0.099 0.375 0.168 0.035Type (C3) 0.073 0.255 0.089 0.382 0.201 0.038Dimension and shape (C4) 0.078 0.241 0.103 0.346 0.232 0.031Modern equipment (C5) 0.080 0.269 0.118 0.349 0.183 0.033Price (C6) 0.181 0.217 0.168 0.193 0.241 0.143Fuel consumption (C7) 0.141 0.201 0.217 0.193 0.248 0.073Repairing costs (C8) 0.129 0.262 0.189 0.187 0.233 0.129Easy to sell second hand (C9) 0.092 0.235 0.114 0.360 0.199 0.128Safety (C10) 0.081 0.254 0.084 0.328 0.253 0.128Durability (C11) 0.087 0.217 0.074 0.303 0.319 0.099Horsepower (C12) 0.102 0.213 0.195 0.190 0.300 0.044Easy to repair (C13) 0.127 0.201 0.177 0.327 0.168 0.063
Final weight 0.150 0.216 0.147 0.285 0.202Rank 4 2 5 1 3
Table 4Output of Expert Choice software for managers’ viewpoint
Criteria Alternatives
Partial weights Global weights
Fiat Honda Hyundai Toyota Volkswagen Relative importance
Net profit (M1) 0.085 0.136 0.339 0.169 0.271 0.149Added-value (M2) 0.059 0.118 0.392 0.235 0.196 0.123Price of technology (M3) 0.250 0.179 0.071 0.143 0.357 0.061Export possibility (M4) 0.150 0.281 0.078 0.200 0.291 0.112National market share (M5) 0.091 0.258 0.074 0.349 0.299 0.046International market share (M6) 0.178 0.230 0.127 0.205 0.260 0.108Manufacturing technology (M7) 0.127 0.197 0.067 0.323 0.286 0.037Accessible to know-how (M8) 0.100 0.113 0.471 0.170 0.146 0.051Flexibility (M9) 0.138 0.223 0.105 0.279 0.254 0.032Quality of technology (M10) 0.092 0.157 0.148 0.285 0.317 0.041National supports (M11) 0.111 0.170 0.281 0.239 0.198 0.025International supports (M12) 0.139 0.155 0.322 0.188 0.196 0.040National make ability (M13) 0.115 0.249 0.162 0.309 0.165 0.027Governments supports (M14) 0.098 0.135 0.463 0.159 0.145 0.042Customer’s style (M15) 0.180 0.228 0.131 0.265 0.197 0.026National trust (M16) 0.134 0.247 0.087 0.270 0.262 0.050Suitability with consumption pattern (M17) 0.159 0.190 0.213 0.229 0.209 0.030
Final Weight 0.131 0.194 0.236 0.220 0.219Rank 5 4 1 2 3
S.M. Ali Khatami Firouzabadi et al. / Computers & Industrial Engineering 54 (2008) 851–865 861
Author's personal copy
4. The ZOGP models
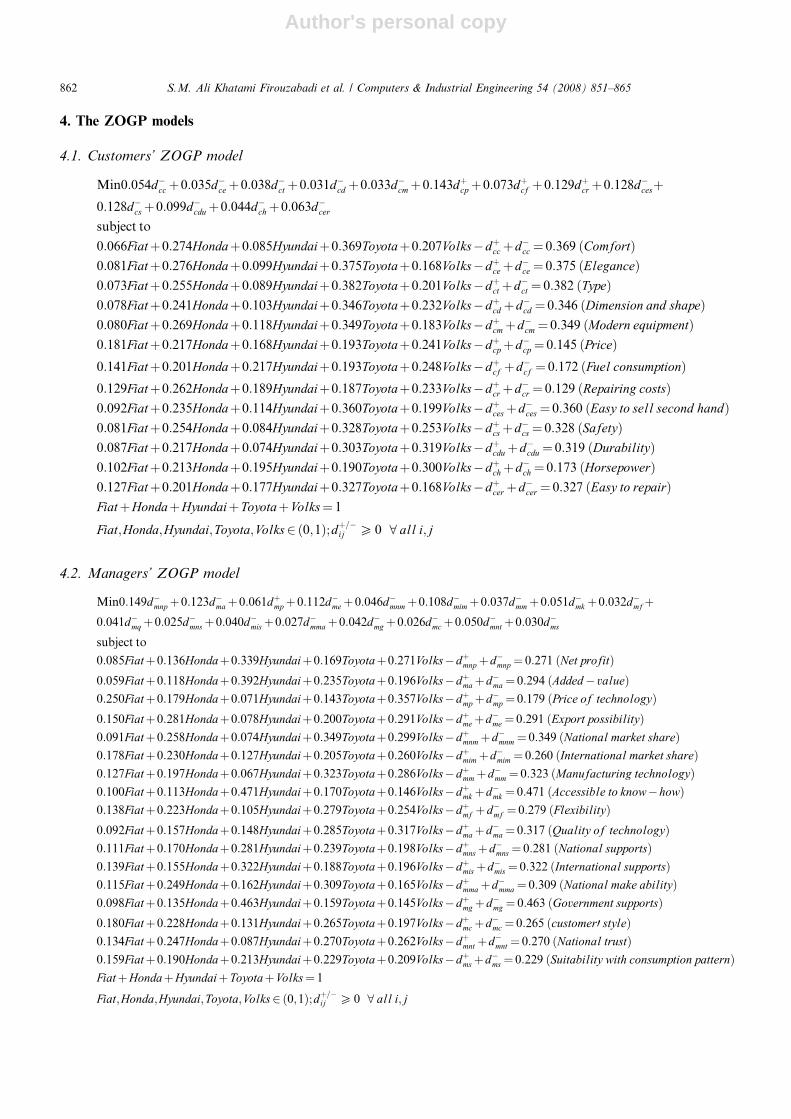
4.1. Customers’ ZOGP model
Min0:054d�ccþ0:035d�ceþ0:038d�ctþ0:031d�cd þ0:033d�cmþ0:143dþcpþ0:073dþcf þ0:129dþcrþ0:128d�cesþ0:128d�csþ0:099d�cduþ0:044d�chþ0:063d�cer
subject to
0:066Fiatþ0:274Hondaþ0:085Hyundaiþ0:369Toyotaþ0:207Volks�dþccþd�cc¼ 0:369 ðComfortÞ0:081Fiatþ0:276Hondaþ0:099Hyundaiþ0:375Toyotaþ0:168Volks�dþceþd�ce¼ 0:375 ðEleganceÞ0:073Fiatþ0:255Hondaþ0:089Hyundaiþ0:382Toyotaþ0:201Volks�dþctþd�ct ¼ 0:382 ðTypeÞ0:078Fiatþ0:241Hondaþ0:103Hyundaiþ0:346Toyotaþ0:232Volks�dþcd þd�cd ¼ 0:346 ðDimension and shapeÞ0:080Fiatþ0:269Hondaþ0:118Hyundaiþ0:349Toyotaþ0:183Volks�dþcmþd�cm¼ 0:349 ðModern equipmentÞ0:181Fiatþ0:217Hondaþ0:168Hyundaiþ0:193Toyotaþ0:241Volks�dþcpþd�cp ¼ 0:145 ðPriceÞ0:141Fiatþ0:201Hondaþ0:217Hyundaiþ0:193Toyotaþ0:248Volks�dþcf þd�cf ¼ 0:172 ðFuel consumptionÞ0:129Fiatþ0:262Hondaþ0:189Hyundaiþ0:187Toyotaþ0:233Volks�dþcrþd�cr ¼ 0:129 ðRepairing costsÞ0:092Fiatþ0:235Hondaþ0:114Hyundaiþ0:360Toyotaþ0:199Volks�dþcesþd�ces¼ 0:360 ðEasy to sell second handÞ0:081Fiatþ0:254Hondaþ0:084Hyundaiþ0:328Toyotaþ0:253Volks�dþcsþd�cs¼ 0:328 ðSafetyÞ0:087Fiatþ0:217Hondaþ0:074Hyundaiþ0:303Toyotaþ0:319Volks�dþcduþd�cdu¼ 0:319 ðDurabilityÞ0:102Fiatþ0:213Hondaþ0:195Hyundaiþ0:190Toyotaþ0:300Volks�dþchþd�ch¼ 0:173 ðHorsepowerÞ0:127Fiatþ0:201Hondaþ0:177Hyundaiþ0:327Toyotaþ0:168Volks�dþcerþd�cer ¼ 0:327 ðEasy to repairÞFiatþHondaþHyundaiþToyotaþVolks¼ 1
Fiat;Honda;Hyundai;Toyota;Volks2 ð0;1Þ;dþ=�ij P 0 8 all i;j
4.2. Managers’ ZOGP model
Min0:149d�mnpþ0:123d�maþ0:061dþmpþ0:112d�meþ0:046d�mnmþ0:108d�mimþ0:037d�mmþ0:051d�mkþ0:032d�mfþ0:041d�mqþ0:025d�mnsþ0:040d�misþ0:027d�mmaþ0:042d�mgþ0:026d�mcþ0:050d�mntþ0:030d�ms
subject to
0:085Fiatþ0:136Hondaþ0:339Hyundaiþ0:169Toyotaþ0:271Volks�dþmnpþd�mnp ¼ 0:271 ðNet profitÞ0:059Fiatþ0:118Hondaþ0:392Hyundaiþ0:235Toyotaþ0:196Volks�dþmaþd�ma¼ 0:294 ðAdded� valueÞ0:250Fiatþ0:179Hondaþ0:071Hyundaiþ0:143Toyotaþ0:357Volks�dþmpþd�mp ¼ 0:179 ðPrice of technologyÞ0:150Fiatþ0:281Hondaþ0:078Hyundaiþ0:200Toyotaþ0:291Volks�dþmeþd�me¼ 0:291 ðExport possibilityÞ0:091Fiatþ0:258Hondaþ0:074Hyundaiþ0:349Toyotaþ0:299Volks�dþmnmþd�mnm¼ 0:349 ðNational market shareÞ0:178Fiatþ0:230Hondaþ0:127Hyundaiþ0:205Toyotaþ0:260Volks�dþmimþd�mim¼ 0:260 ðInternational market shareÞ0:127Fiatþ0:197Hondaþ0:067Hyundaiþ0:323Toyotaþ0:286Volks�dþmmþd�mm¼ 0:323 ðManufacturing technologyÞ0:100Fiatþ0:113Hondaþ0:471Hyundaiþ0:170Toyotaþ0:146Volks�dþmkþd�mk ¼ 0:471 ðAccessible to know�howÞ0:138Fiatþ0:223Hondaþ0:105Hyundaiþ0:279Toyotaþ0:254Volks�dþmf þd�mf ¼ 0:279 ðFlexibilityÞ0:092Fiatþ0:157Hondaþ0:148Hyundaiþ0:285Toyotaþ0:317Volks�dþmaþd�ma¼ 0:317 ðQuality of technologyÞ0:111Fiatþ0:170Hondaþ0:281Hyundaiþ0:239Toyotaþ0:198Volks�dþmnsþd�mns¼ 0:281 ðNational supportsÞ0:139Fiatþ0:155Hondaþ0:322Hyundaiþ0:188Toyotaþ0:196Volks�dþmisþd�mis¼ 0:322 ðInternational supportsÞ0:115Fiatþ0:249Hondaþ0:162Hyundaiþ0:309Toyotaþ0:165Volks�dþmmaþd�mma¼ 0:309 ðNational make abilityÞ0:098Fiatþ0:135Hondaþ0:463Hyundaiþ0:159Toyotaþ0:145Volks�dþmgþd�mg ¼ 0:463 ðGovernment supportsÞ0:180Fiatþ0:228Hondaþ0:131Hyundaiþ0:265Toyotaþ0:197Volks�dþmcþd�mc¼ 0:265 ðcustomer0 styleÞ0:134Fiatþ0:247Hondaþ0:087Hyundaiþ0:270Toyotaþ0:262Volks�dþmntþd�mnt ¼ 0:270 ðNational trustÞ0:159Fiatþ0:190Hondaþ0:213Hyundaiþ0:229Toyotaþ0:209Volks�dþmsþd�ms¼ 0:229 ðSuitability with consumption patternÞFiatþHondaþHyundaiþToyotaþVolks¼ 1
Fiat;Honda;Hyundai;Toyota;Volks2 ð0;1Þ;dþ=�ij P 0 8 all i;j
862 S.M. Ali Khatami Firouzabadi et al. / Computers & Industrial Engineering 54 (2008) 851–865
Author's personal copy
4.3. Outcomes of the ZOGP models
The customers’ ranked preferences using the model are Toyota, Honda, Volkswagen, Hyundai, and Fiat,while managers’ ranked preferences are Volkswagen, Toyota, Hyundai, Honda, and Fiat. Different stakehold-ers selected different alternatives. To reach a single outcome, the individual ZOGP models are aggregated byanother ZOGP model.
4.3.1. The aggregated ZOGP model
In this model, the individual objective functions of ZOGP models are added to each other with the attachedweights which are equal at first. However, these weights can be changed for sensitivity analysis. The con-straints of the aggregated ZOGP model are those from the individual models.
4.4. Outcomes of the ZOGP models and its sensitivity analysis
The weighted aggregate model outcomes rank Toyota, Volkswagen, Honda, Hyundai, and Fiat, when theattached weights for each part of the objective function are equal. The outcome will change if the attachedweights of the managers’ and customers’ objective functions change to 0.97 and 0.03 respectively. That meansthat if the managers’ viewpoints are more than 30 times more important than the customers’ viewpoint, thenthe outcome will change. Further analyses can be made to indicate which of criteria or sub-criteria are sensi-tive enough to change the outcome.
4.4.1. Submission of all outcomes to decision maker
In this step, the outcomes including outcomes of using AHP alone, and outcomes of individual and aggre-gated models are submitted to the decision maker for the final decision.
5. Discussion and conclusions
This paper proposes a methodology that, when making a strategic selection decision involving differentstakeholders with a diverse range of conflicting assessment criteria, could be a useful decision support tool.The case study, which involved the selection of a single vehicle manufacturing system to make vehicles underlicense, possessed the characteristics of the type of problems this methodology is intended to support. Thesecharacteristics include the long-term nature of the effects of the decision, the number of stakeholders involvedwith possibly conflicting criteria, and the presence of both tangible and intangible assessment criteria. The casestudy showed how it is possible to consider many criteria from different stakeholders to yield a single outcomethat covers the requirements of the stakeholders. The proposed methodology is based on the minimisation ofundesirable intangible and tangible criteria, whereas previous work has only considered the minimisation ofundesirable tangible criteria. The case study demonstrated that the use of AHP alone for a strategic selectionproblem is not sufficient, because AHP is not able to consider the availability of resources explicitly, or con-sider multiple stakeholders when stakeholders have different criteria and sub-criteria. This method introducedresource limitations and goal constraints. In this method, the weights yielded by AHP become the coefficientsfor the objective function and constraints equations of the ZOGP model. In this way, resource limitations andgoal constraints are considered. To take into account the criteria of multiple stakeholders, ZOGP was used toresolve the conflicting criteria from different stakeholders. The success of implementing the proposed method-ology in this paper may appear limited by the usual modelling disadvantages such as data collection and mod-elling effort, but the nature of the strategic selection problem minimises these limitations. For example, thenumber of alternatives must not exceed of 20 for weighting (Saaty, 1980). In addition, AHP is easy to useand the fairly small size of the ZOGP models should pose no formulation problem. It remains for the meth-odology to be tested by real decision makers.
The use of ZOGP in this work differs from that in previous literature. These are:
1. Previous work considers the minimisation of tangible undesirable variables, whereas here, both tangibleand intangible variables are considered in the objective function.
S.M. Ali Khatami Firouzabadi et al. / Computers & Industrial Engineering 54 (2008) 851–865 863
Author's personal copy
2. Real data is normalised for the weights of the objective function. The target value for the tangible data isalso normalised.
3. The target value of the intangible constraints is the maximum value of the intangible parameter in the lefthand side of the equation.
4. Global weights determined using AHP are represented in the models to show the contribution of each sub-criteria for the highest level in the hierarchy.
It is also worth noting Arrow’s Impossibility Theorem because of its implications for methods of aggrega-tion. The main tenet of the theorem, that there can be no equitable method for social choice, does not apply inthis context because of the use of weighted preferences. However, the theorem implies that decision methodsmust have an explicit procedure for assigning values to alternatives. This methodology satisfies this require-ment by aggregating models rather than criteria. Nevertheless, it remains to be determined under which cir-cumstances the methodology suggests sensible conclusions. The methodology needs to be tested by comparingits use and its outcomes to other multi-criteria selection methods. In addition, a simple additive linear modelwas used for aggregating models of several viewpoints. The methodology can be developed by consideringother aggregation methods.
References
Albayrakoglu, M. (1996). Justification of new manufacturing technology: a strategic approach using the analytic hierarchy process.Journal of Production and Inventory Management, 37(3), 71–76.
Alonso-Ayuso, A., Escudero, L. F., Garin, A., Ortuno, M. T., & Perez, G. (2005). On the product selection and plant dimensioningproblem under uncertainty. OMEGA – International Journal of Management Science, 33(4), 307–318.
Badri, M. A. (2001). A combined AHP-GP model for quality control systems. International Journal of Production Economics, 72, 27–40.Bayazit, O., Karpak, B., & Yagci, A. (2006). A purchasing decision: selecting a supplier for a construction company. Journal of Systems
Science and Systems Engineering, 15(2), 217–231.Borenstein, D., & Betencourt, P. R. B. (2005). A multi-criteria model for the justification of IT investments. INFOR, 43(1), 1–21.Canada, J. R., & Sullivan, W. G. (1990). Persistent pitfalls and applicable approaches for justification of advanced manufacturing
technologies. Engineering Costs and Production Economics, 18, 247–253.Chan, F. T. S. (2003). Interactive selection model for supplier selection process: an analytical hierarchy process approach. International
Journal of Production Research, 41(15), 3549–3579.Choudhury, A. K., Shankar, R., & Tiwari, M. k. (2006). Consensus-based intelligent group decision-making model for the selection of
advanced technology. Decision Support System, 42(3), 1776–1799.Datta, V., Sambasivarao, K. V., Kodali, R., & Deshmukh, S. G. (1992). Multi-attribute decision model using the analytic hierarchy
process for justification of manufacturing systems. International Journal of Production Economics, 28(2), 227–234.Dhavale, D. (1995). Justifying manufacturing cells. Journal of Manufacturing Engineering, 115(6), 31–34.De kort, A. D., & Booij, M. J. (2007). Decision making under uncertainty in a decision support system for the Red River. Environmental
Modelling & Software, 22(2), 128–136.Ding, J. F., & Liang, G. S. (2005). Using fuzzy MCDM to select partners of strategic alliances for liner shipping. Information Science,
173(1–3), 197–225.Ding, H. W., & Benyoucef, L. (2005). A simulation optimisation methodology for supplier selection problem. International Journal of
Computer Integrated Manufacturing, 18(2–3), 210–224.Expert Choice, www.expertchoice.com. Accessed 8th February 2007.Golden, B. L., Wasil, E. A., & Harker, P. T. (1989). The analytic hierarchy process: applications and studies. Berlin: Springer-Verlag.Hillier, F. S., & Lieberman, G. J. (1995). Introduction to operations research. New York: McGraw-Hill.Hoffman, J. J., Schniederjans, M. J., & Sebora, T. C. (2004). A multi-objective approach to CEO selection. INFOR, 42(4), 237–255.Hugo, A., & Pistikopoulos, E. N. (2005). Environmentally conscious long-range and design of supply chain networks. Journal of Cleaner
Production, 13(15), 1471–1491.Kuei, C. H., Lin, C., Aheto, J., & Madu, C. N. (1994). A strategic selection decision model for the selection of advanced technology.
International Journal of Production Research, 32(9), 2117–2130.Lindo. Lindo Systems Inc., www.lindo.com. Accessed 8th February 2007.Noble, J. L. (1990). A new approach for justifying computer-integrated manufacturing. Cost Management, 3(4), 14–19.Ordoobadi, S. M., & Mulvaney, N. J. (2001). Development of a justification tool for advanced manufacturing technologies: system-wide
benefits value analysis. Journal of Engineering and Technology Management, 18, 157–184.Parsaei, H. R., & Wilhelm, M. R. (1989). A justification methodology for automated manufacturing technologies. Computers & Industrial
Engineering, 16(3), 363–373.Partovi, F. Y. (1990). A strategic evaluation methodology for manufacturing technologies. In J. M. Liberatore (Ed.), Selection and
Evaluation of Advanced Manufacturing Technologies. Berlin: Springer-Verlag.
864 S.M. Ali Khatami Firouzabadi et al. / Computers & Industrial Engineering 54 (2008) 851–865
Author's personal copy
Pomerol, J. C., & Romero, S. B. (2000). Multicriterion Decision in Management: Principles and Practice. Massachusetts: Kluwer AcademicPublishers.
Saaty, T. L. (1980). The analytic hierarchy process. New York: McGraw-Hill.Schniederjans, M. J., & Garvin, T. (1997). Using the analytic hierarchy process and multi-objective programming for the selection of cost
drivers in activity-based costing. European Journal of Operation Research, 100, 72–80.Shyur, H. J., & Shih, H. S. (2006). A hybrid MCDM model for strategic vendor selection. Journal of Mathematical and Computer
Modelling, 44(7–8), 749–761.Soni, R. G., Parsaei, H. R., & Liles, D. H. (1990). A methodology for evaluating computer integrated manufacturing technologies.
Computers & Industrial Engineering, 19(1–4), 210–214.Srisoepardani, K.P., (1996). The Possibility Theorem for Group Decision Making: the Analytic Hierarchy Process. Ph.D. Dissertation,
University of Pittsburgh.Tie, H. Y., & Lin, G. C. I. (1991). Towards CIM optimisation. International Journal of Computer Integrated Manufacturing Systems, 4(1),
184–197.Tie, H. Y., & Lin, G. C. I. (1992). Incorporating CIM optimisation in manufacturing strategy. International Journal of Computer
Integrated Manufacturing Systems, 5(4), 311–325.Troxler, J. W., & Blank, L. (1989). A comprehensive methodology for manufacturing system evaluation and comparisons. Journal of
Manufacturing Systems, 8(3), 175–183.Yang, C. C., & Chen, B. S. (2006). Supplier selection using combined analytical hierarchy process and grey relational analysis. Journal of
Manufacturing Technology Management, 17(7), 926–941.Zavadskas, E. K., & Antucheviciene, J. (2007). Multiple criteria evaluation of rural building’s regeneration alternatives. Building and
Environment, 42(1), 436–451.
S.M. Ali Khatami Firouzabadi et al. / Computers & Industrial Engineering 54 (2008) 851–865 865