Role of Gag and lipids during HIV-1 assembly in CD4(+) T cells and macrophages

Vaccine 26 (2008) 4494–4505
Contents lists available at ScienceDirect
Vaccine
journa l homepage: www.e lsev ier .com/ locate /vacc ine
Mucosal immunization against ovine lentivirus using PEI–DNA complexesand modified vaccinia Ankara encoding the gag and/or env genes
R. Reinaa,1, C. Barbezangeb,1, H. Niesallac,1, X. de Andrésa, H. Arnarsond, E. Biescase,M. Mazzei f, C. Fraisierg, T.N. McNeillyc, C. Liuc, M. Pereze, M.L. Carrozza f, P. Bandecchih,C. Solanoa, H. Crespoa, I. Glariaa, C. Huard i, D.J. Shawc, I. de Blase, D. de Andrésa, F. Tolari f,S. Rosatih, M. Suzan-Montig, V. Andrésdottird, S. Torsteinsdottird, G. Peturssond, L. Lujane,M. Pepin i, B. Amorenaa, B. Blacklawsb, G.D. Harkissc,∗
a CSIC-Public University of Navarra, Pamplona, Spainb University of Cambridge, Cambridge, UKc University of Edinburgh, Edinburgh, UKd University of Iceland, Reykjavik, Iceland
e University of Zaragoza, Zaragoza, Spainf University of Pisa, Pisa, Italyg Faculté de Médecine, Marseille, Francegainse (NAlleng
h University of Turin, Italyi AFSSA, Sophia Antipolis, France
a r t i c l e i n f o
Article history:Received 14 June 2007Received in revised form 4 June 2008
a b s t r a c t
Sheep were immunized aassociated lymphoid tissuvaccinia Ankara, and cha
Accepted 13 June 2008Available online 9 July 2008
Keywords:SheepLentivirusDNA vaccinationMucosal
responses prior to but not aftergenerally low, with the responsafter challenge. A transient redfollowing env immunization, wnificantly elevated provirus loawas observed in animals immuimmunization mixture in generagainst VMV-induced lesions cathough this was accompanied b
1. Introduction
Visna/Maedi virus (VMV) and caprine arthritis encephalitisvirus (CAEV), also known as small ruminant lentiviruses (SRLV),are monocyte/macrophage tropic lentiviruses that infect sheep andgoats, causing a lifelong infection despite the immune responsegenerated against them. SRLV are endemic in sheep and goat indus-tries in European countries and cause significant economic losses
∗ Corresponding author at: Division of Veterinary Biomedical Sciences, Royal DickSchool of Veterinary Studies, University of Edinburgh, Summerhall, Edinburgh EH91QH, UK. Tel.: +44 131 650 6177; fax: +44 131 650 6511.
E-mail address: [email protected] (G.D. Harkiss).1 These authors made an equal contribution to this work.
0264-410X/$ – see front matter © 2008 Elsevier Ltd. All rights reserved.doi:10.1016/j.vaccine.2008.06.065
t Visna/Maedi virus (VMV) gag and/or env genes via the nasopharynx-LT) and lung using polyethylenimine (PEI)–DNA complexes and modifieded with live virus via the lung. env immunization enhanced humoralVMV challenge. Systemic T cell proliferative and cytotoxic responses werees following single gag gene immunization being significantly depresseduction in provirus load in the blood early after challenge was observedhilst the gag gene either alone or in combination with env resulted in sig-ds in lung. However, despite this, a significant reduction in lesion scorenized with the single gag gene at post-mortem. Inclusion of IFN-� in the
al had no significant effects. The results thus showed that protective effectsn be induced following respiratory immunization with the single gag gene,y an increased pulmonary provirus load.© 2008 Elsevier Ltd. All rights reserved.
due to premature culling, reduced milk yields, reduced numbers ofoffspring, reduced lamb/kid weights, and poor quality of meat [1].The economic impact of SRLV infections tends to be hidden due tothe slow insidious nature of the disease, and the true cost is usuallyonly appreciated when a careful analysis of flock performance overa period of years is undertaken.
Approaches based on diagnosis and culling strategies are cur-rently being applied to control SRLV infection, but prophylacticmethods such as immunization are still being developed. Theimmune response in VMV infections involves T cell responsesand antibody production, including that of neutralising antibod-ies [2–4]. Cellular responses might help in controlling viremiaand disease development, whilst humoral responses might pre-vent viral entry into permissive cells and control early viralburden. However, it is still not clear what arm of the immune

ine 26
R. Reina et al. / Vaccresponse might associate with protection from SRLV infection ordisease.
Immunization against lentiviruses has been used to preventinfection or disease and to study the immune response to otherlentiviruses such as the immune deficiency viruses; FIV in cats, SIVin simians and HIV in humans [5–7]. Immunizations against CAEVreveal that the use of recombinant env plasmids for immunizationleads to lower viral replication and load and diminished disease[8], whilst using gag gene, peptide or inactivated virus enhance-ment of disease or proviral load were observed [9–11]. Genes usedin sheep for VMV immunization have involved those of a completeviral clone [12] and the env gene, the latter administered mucosally[13]. In both cases a significant protective effect (diminished viralload in blood) has been found in immunized animals after chal-lenge. The cellular (proliferative and cytotoxic) responses were notinvestigated in the VMV immunization studies and the associationbetween the immune response and protection against infectionneeds to be further assessed.
DNA vaccination is one of the immunization strategies thatcould be applied against SRLV, with potential ability to induceboth humoral and cell-mediated immune response [14]. Enhance-ment of immune responses by DNA vaccination relies on theplasmid itself, genes that encode specific viral proteins, deliv-ery systems that may attract professional antigen presenting cells(APCs), and genes that encode cytokines, chemokines or T cell co-stimulatory molecules. For example, IFN-� has been shown to beeffective in modulating the immune response towards a Th1 pro-file against lentiviruses such as HIV-1, enhancing the production ofspecific antibody (IgG2a), cytotoxic activity and T helper prolifer-ation [15,16]. Some of the DNA vaccination strategies, such as theinclusion of IFN-� [17,13] or IL-12 [18] have been explored againstSRLV. However, in goats, experiments based on env-immunizationagainst CAEV have shown that IFN-� does not enhance Th1 cytokineresponses and appears to inhibit antibody production against theencoded antigen [17].
Vehicles may also play an important role in DNA vacci-nation, since they can promote increased plasmid transfectionefficiency and protect DNA from degradation. Particularly, the use ofDNA–polycation complexes to improve DNA immunization appearsto be of potential use. The cationic polymer, polyethylenimine (PEI25 kDa) is an efficient vehicle of plasmid DNA that enhances trans-fection of cells in vitro and in vivo [19,20]. It provides a globalpositive charge that allows DNA cellular uptake, protects DNAfrom enzymatic degradation, and allows DNA to traverse the endo-
somal membrane, reaching the cytoplasm and the nucleus [21].Organs such as lungs can be transfected efficiently and safely[22].In this study, we aimed to investigate whether new approachesto vaccination may provide another avenue of immune modula-tion and control of SRLV infections. This study involved the use ofplasmid PEI–DNA complexes, containing gag and/or env genes inthe presence or absence of the gene encoding ovine IFN-�. Thisapproach allowed us to determine primarily whether the core orenvelope genes provided the better targets for vaccination. Immu-nization was performed via the respiratory tract with recombinantplasmids for priming and first boosting, and a live attenuated viralvector for second boosting. The animals were then challenged withlive VMV via the lung, a major target site for natural transmission.Cellular and humoral responses in blood were assessed and thedegree of protection conferred by immunization was investigated.The results showed that env mucosal immunization responsesdecreased the viral load in blood transiently, whilst gag immu-nization protected against lesion development measured 12 weekspost-challenge despite being associated with elevated lung proviralloads.
(2008) 4494–4505 4495
2. Materials and methods
2.1. Sheep for vaccination experiments
One to 2-year-old Lleyn sheep (females and castrated males)were obtained from a VMV-free accredited flock. Prior to immu-nization, absence of VMV was confirmed by ELISA using acommercially available diagnostic kit (Elitest MVV/CAEV, HyphenBiomed) following the manufacturer’s instructions and by real-time PCR as described below. The animal experiments wereperformed at three European centres according to national regu-lations and institutional guidelines.
2.2. Viruses and plasmids
VMV strain EV1 [23] was grown and titred as described previ-ously [24]. The same stock of virus was used to challenge sheepin all three centres. The same strain of VMV (kept at low passage,<10), was concentrated (culture medium containing the virus wasclarified by centrifugation at 10,000 × g for 30 min at 4 ◦C then thesupernatant was centrifuged for 8 h at 4 ◦C, 10,000 × g and the pelletresuspended in phosphate-buffered saline (PBS)) and used as anti-gen in T cell proliferation assays [2]. The same viral stock was usedto develop a quantitative real-time PCR assay to detect provirusDNA.
Recombinant modified vaccinia virus Ankara (MVA) (kind giftfrom Prof. G. Smith, Imperial College, London, UK) expressing eitherthe gag p55 or the env gp150 genes of VMV EV1 were made usingthe pSC11 transfer plasmid [25]. pSC11env was kindly supplied byDr. D Rodriguez, Centro Nacional de Biotecnologia-CSIC, Madrid,Spain [26]. Recombinant MVAs were named MVAgag and MVAenv,respectively. As a control for immunizations, a recombinant MVAexpressing beta-galactosidase from empty pSC11 was also made(named MVApSC11). MVA and its derivatives were routinely prop-agated in QT35 cells (fibrosarcoma cells from Japanese quail, ECACCRef No. 93120832) and the titre determined by plaque forming assay(pfu) using either methylene blue staining of cells and scoring forcytopathic effects or beta-galactosidase staining for recombinantvirus plaques. MVAgag and MVAenv were shown to express GAGand ENV, respectively, by Western blot using anti-GAG and anti-SU ENV specific rabbit sera. Virus for injection was purified overa sucrose cushion and then a sucrose gradient before it was pel-leted and resuspended in 1 mM Tris–Cl, pH 9.0. Virus was storedin aliquots at −80 ◦C and an aliquot used for titration as described
above. Virus was diluted in PBS for administration to animals, and108 pfu was given per animal intra-tracheally.Plasmids used for immunizations in this study were derivatesof pN3-EGFP (Clontech Laboratories, Inc.) from which the EGFPgene was removed to generate plasmid pN3. This was used asthe control empty plasmid with no expressed gene in immuniza-tions as well as the parental plasmid to make pN3-gag, pN3-envand pN3-IFN encoding the VMV gag p55 and env gp150 genesand the ovine IFN-� gene, respectively. A constitutive transportelement (CTE) sequence from the Mason-Pfizer Monkey Virus (M-PMV) was cloned into the gag construct to produce pN3-gag-CTEto enhance nucleocytoplasmic export of gag mRNAs. Large-scalepreparations of endotoxin-free DNA were made using a commer-cial maxi-prep kit (Qiagen Ltd., Crawley, UK) according to themanufacturer’s instructions. Expression of p55 GAG and gp150ENV was determined by RT-PCR and Western blotting. Expres-sion of IFN-� in vitro was determined by RT-PCR and ELISA usingtransfected HEK 293 cells and by RT-PCR in transfected ovine fibrob-lasts (not shown). The ELISA was kindly performed by Dr. GaryEntrican, Moredun Research Institute, Roslin, Midlothian EH260PZ.

ine 26
4496 R. Reina et al. / Vacc2.3. Preparation of DNA–PEI complexes
DNA–polyethylenimine (PEI, 25 kDa branched, Sigma–AldrichCompany Ltd., Cat. No. 40 872-7) complexes were prepared at ratiosof 1:10 DNA phosphate to PEI nitrogen (i.e. 1 �g DNA:1.29 �g PEI)in water for injection. The complexes were allowed to stand for atleast 20 min before use.
2.4. Expression and purification of recombinant GAG proteins
Plasmid clones of VMV strain EV1 gag p14, p17 and p25 (in pRSETplasmids) have been described previously [3]. Plasmids used forproduction of protein were confirmed to be correct by sequencing.
2.4.1. Production of recombinant p14Gag p14 was amplified by PCR with high fidelity thermophilic
DNA polymerase to allow cloning into pGEX-5X-2 vector (GEHealthcare). For protein production, plasmid pGEX-5X-2 p14 waselectroporated into E. coli BL21 C41 (DE3), a mutant strain of E.coli BL21(DE3). Cultures were grown at 37 ◦C, with shaking, to anOD600 of 0.5. IPTG was added to a final concentration of 0.1 mMand cells were grown at 23 ◦C overnight. GST fusion protein waspurified from clarified lysates using a GSTrapTM FF 5 ml columnand an AKTAprime chromatography system (GE Healthcare). ForFactor Xa on-column cleavage, 10 U of Prescission protease/mg ofbound GST-fusion protein was used. A post-cleavage removal ofFactor Xa using a GSTrap FF and HiTrap Benzamidine FF columns(GE Healthcare) was performed. Eluted protein fractions containingp14 were pooled and dialyzed against PBS. The dialyzed sample wasfiltered through a 0.22 �m filter, vortexed and dispensed into 50 �laliquots. The yield of p14 obtained was 4 mg per litre of bacterialculture.
2.4.2. Production of recombinant p17Gag p17 was amplified by PCR with high fidelity thermophilic
DNA polymerase to allow cloning into pGEX-6H. The pGEX-6Hplasmid is derived from pGEX-6P1 (GE Healthcare) that has beenmodified by adding, in-frame, a six histidine coding region betweenthe EcoR1 and SalI restriction sites. Recombinant protein expressedin pGEX-6H contains a carboxy-terminal 6xHis tag which allowsa further affinity purification step by immobilized metal chelateaffinity chromatography (IMAC). For protein production, E. coli BL21
cultures, carrying the pGEX6H-p17 plasmid, were grown at 37 ◦Cwith shaking and protein expression induced at 0.6 OD600 with1 mM IPTG for 2 h. GST-p17 fusion protein was purified from the sol-uble fraction using glutathione sepharose 4B affinity matrix packedinto a XK16 column (GE Healthcare). Eluted fractions were pooledand digested in solution with Prescission Protease (GE Healthcare)at a concentration of 1 U/mg of fusion protein. After complete diges-tion, as detected by SDS-PAGE, p17 was dialysed overnight against50 mM phosphate buffer, 10 mM imidazole, 1 M urea and furtherpurified by IMAC. Eluted fractions containing p17 were pooled andpurified protein was diluted to 0.17 mg/ml to avoid precipitation. Afinal dialysis was performed against three changes of PBS for 48 hat 4 ◦C. Gag p17 was filter sterilized, aliquoted and stored at −80 ◦Cuntil used. The yield of p17 was about 15 mg per litre of bacterialculture.2.4.3. Production of recombinant p25Gag p25 was amplified by PCR with high fidelity thermophilic
DNA polymerase to allow cloning into pGEX-6P-2 vector (GEHealthcare). For protein production, E. coli BL21 containing the plas-mid were induced and the protein purified as for p14 above. Theyield of p25 obtained was 42 mg per litre of bacterial culture.
(2008) 4494–4505
Fig. 1. Experimental design. The times of mucosal immunization with plasmid DNA(pDNA) and recombinant MVA (rMVA), and challenge with VMV are shown. Animalswere bled before immunization (week 0); after plasmid DNA immunization (week7); after recombinant MVA boost and before challenge (week 12); after challenge(weeks 16, 20 and 24); then animals were post-mortemed at week 24–25 and tissuesamples taken.
2.4.4. Mock antigen preparationsTo make mock antigen preparations, bacteria with empty
expression plasmids were put through the same expression andpurification processes as above and the equivalent purified frac-tions used in proliferation assays.
2.5. Experimental design
2.5.1. ImmunizationThe experimental design time points are given in Fig. 1. Groups
and the plasmids that were administered were as follows: gag(n = 8), pN3-gag and pN3; gag-ifn (n = 8), pN3-gag and pN3-IFN;env (n = 8), pN3-env and pN3; env-ifn (n = 8), pN3-env and pN3-IFN;gag-env (n = 7), pN3-gag, pN3-env and pN3; gag-env-ifn (n = 8), pN3-gag, pN3-env and pN3-IFN; control (n = 15), pN3. Gag, gag-ifn, env,env-ifn groups and 8 control sheep received 800 �g plasmid/animalwith 200 �g given intra-nasally via a cannula spray [27] and 600 �ggiven intra-tracheally, at week 0 and week 4. Gag-env, gag-env-ifngroups and 7 control sheep received 1200 �g plasmid/animal with300 �g given intra-nasally via a cannula spray [27] and 900 �g givenintra-tracheally at week 0 and week 4. Four hundred �g of eachplasmid was given at each time point. Sheep were boosted with108 pfu recombinant MVA intra-tracheally at week 10. Groups gagand gag-ifn were given MVAgag and MVApSC11; env and env-ifnwere given MVAenv and MVApSC11; gag-env and gag-env-ifn weregiven MVAgag and MVAenv (108 pfu each virus). The control groupreceived MVApSC11.
The immunizations were performed at three different laborato-ries as follows: Laboratory 1: control, gag and gag-ifn; Laboratory2: control, env and env-ifn; and Laboratory 3: control, gag-env and
gag-env-ifn.2.5.2. VMV challengeChallenge was performed 12 weeks post-priming by injection
of 1 × 10³ TCID50 VMV EV1 in 1 ml of 1× PBS via the intra-trachealroute as described previously [28].
2.5.3. SamplingBlood samples were taken before the start of immunization (up
to 2 weeks before the start of the experiment, hereafter calledweek 0), after DNA priming and boosting (week 7), after recom-binant MVA boosting but before challenge (week 12), then afterVMV challenge (weeks 16, 20 and 24, i.e. weeks 4, 8 and 12 post-challenge). Sheep were euthanised and necropsied 24–25 weeksafter the start of the experiment (12–13 weeks post-challenge) andlung and mediastinal lymph node samples taken.
2.6. Measurement of anti-VMV antibodies in serum
Serum was taken from clotted blood, stored at −20 ◦C andused to measure anti-VMV antibodies in an indirect ELISA using

ine 26
R. Reina et al. / Vaccwhole VMV antigen. VMV antigen for ELISA was prepared as abovefrom infected sheep choroid plexus cell supernatants with thevirus pellet resuspended in 1 ml TNE buffer (100 mM NaCl, 10 mMTris–HCl, pH 7.4, 1 mM EDTA), mixed with 1 ml high salt buffer (TNEbuffer with 5.3 M NaCl), and the mixture kept at room temper-ature for 30 min, diluted 1:1 with Tris–HCl–EDTA buffer (20 mMTris–HCl, pH 7.4, 1 mM EDTA), and pelleted at 100,000 × g for 2 h.The pellet was resuspended in 1 ml TNE buffer (approximatelya 1:1000 concentration), aliquoted, and frozen at −80 ◦C untiluse.
A slightly modified ELISA method from Houwers et al. [29]was used to measure serum anti-VMV antibody levels. Microtiterplates were coated with 100 �l of 1:400 dilution of VMV antigenin 0.05 M carbonate/bicarbonate buffer, pH 9.6, incubated 1 h at37 ◦C and then overnight at 4 ◦C. Two-fold dilutions of serum weremade starting with a dilution of 1:100 and unbound material wasremoved by washing with PBS containing 0.05% Tween 20. Rab-bit anti-goat IgG conjugated to horseradish peroxidase was usedat a dilution of 1:4000 and bound antibody detected with H2O2/o-phenylenediamine dihydrochloride (OPD) (Dako). The reaction wasstopped after 10 min with 75 �l per well of 0.04% H2SO4 and theoptical density read at 492 nm in a HTS 7000 Plus Bio Assay Reader(PerkinElmer). The reciprocal of the last positive serum dilutionwas taken as the titre of the antibody and the titre was expressedas log2(titre/50), i.e. negative sera were given a value of 0 and titresof 100, 200, etc., were assigned values of 1, 2 and so on in the figures.Untransformed titres were analysed statistically.
Neutralization tests were performed by taking one hundredTCID50 of the virus in 0.1 ml and mixing with 0.1 ml of two-folddilutions of serum. The mixtures were held at 4 ◦C for 48 h and theninoculated onto four SCP cultures, which were observed for 2–3weeks. Neutralization titres of the sera were calculated as the recip-rocal of the serum dilution that caused complete neutralization in50% of inoculated cultures.
2.7. Measurement of anti-VMV T cell reactivity
Blood was collected into heparin (10 U/ml final) and periph-eral blood mononuclear cells prepared by buffy coat andFicoll–Metrizoate gradients, then suspended in RPMI-1640medium with 25 mM HEPES (Sigma–Aldrich Company Ltd.), sup-plemented with 2 mM l-glutamine, 50 �M beta-mercaptoethanol,100 U penicillin and 100 �g streptomycin/ml, 2.5 �g amphotericinB/ml and 10% foetal calf serum (FCS) (10% RPMI) [30].
2.7.1. T cell proliferation assay105 PBMC in 10% RPMI were mixed with recombinant GAG pro-
teins (p17, p25 or p14). The p25 and p14 proteins were used ata final concentration of 50, 25 and 12.5 �g/ml. The p17 proteinwas used at a final concentration of 25 and 12.5 �g/ml. Concen-trated VMV EV1 (see above) was used at a final dilution of 1:200,1:400 and 1:800 (200 �l final volume). As a positive control Con-canavalin A (Sigma–Aldrich Company Ltd.) was used at 5 �g/mland negative controls included cells with medium alone and mockpeptide preparations without GAG antigen or mock infected cellconcentrated supernatant [2]. Each antigen or control was testedin quadruplicate. Plates were incubated for 5 days at 37 ◦C and5% CO2 and cellular proliferation measured by labelling cells with[3H]thymidine (0.037 MBq/well, GE Healthcare) for 5 h. Follow-ing automated harvesting, the incorporation of [3H]thymidine wasmeasured by liquid scintillation counting using a 1450 Micro-beta counter (Wallac, PerkinElmer). The stimulation index (SI)for each antigen was calculated using the formula SI = cpm withantigen/cpm with mock antigen. Results were analysed using themedian stimulation index of the antigen dilutions.
(2008) 4494–4505 4497
2.7.2. Cytotoxic T cell assayPrecursor cytotoxic T lymphocytes (CTL) were stimulated for 14
days using autologous skin fibroblasts infected with VMV EV1 inthe presence of human recombinant IL-2 as previously described[30]. The CTL activity in these effector cells was then tested onautologous or heterologous, mock or VMV infected skin fibroblastsusing a 51chromium release assay at two effector:target ratios, eachtested in triplicate. Chromium release into the supernatant wasmeasured using scintillation counting in a 1450 Microbeta counter(Wallac, PerkinElmer). The percentage specific 51Cr release fromtargets was calculated using the formula [cpm with effectors − cpmwith medium]/[cpm with Triton-X 100 − cpm with medium] × 100.Animals were deemed to show the presence of precursor CTL ifthe percentage specific 51Cr release from VMV infected minusmock infected autologous cells was >10% above that from het-erologous infected minus mock infected cells [30], in which thekilling of mock infected and heterologous cells was less than10%.
2.7.3. IFN-gamma expression measured by quantitative real-timeRT-PCR
Sheep PBMC’s in 10% RPMI were stimulated for 4 h at 37 ◦C in 5%CO2 with 5 �g/ml Concanavalin A, with whole virus at a concentra-tion of 1:400, or with recombinant GAG antigens at a concentrationof 25 �g/ml. Unstimulated (medium), and mock EV1 stimulatedcells were used as controls. Stimulated PBMCs were resuspendedin RNAlater (ABgene) and stored at −80 ◦C.
RNA was isolated using a commercial kit (RNeasy Mini kit,Qiagen Ltd.) following the manufacturer’s instructions, treatedwith RNase-free DNase under the on-column conditions (RNase-free DNase set, Qiagen Ltd.), and eluted in 50 �l RNase-free H2O.Single-strand cDNA was synthesized as follows: briefly, 9 �l ofDNase-treated RNA was mixed with 1 �l oligo(dT) (500 �g/ml),incubated at 90–100 ◦C for 2 min, transferred on ice and subjectedto the reverse transcription reaction using 100 U of M-MLV reversetranscriptase (Invitrogen) and 20 U RNase OUT as RNase inhibitor(Invitrogen) in a 20 �l final volume, for 20 min at 50 ◦C. Real-timePCR experiments were performed using the Light Cycler Fast StartDNA Master SYBR Green I (Roche). Two microliters of cDNA wasamplified by real-time PCR using primers specific to ovine IFN-�,and ovine GAPDH as the “housekeeping” gene. Primer sequenceswere the following: IFN-� forward 5′-TACACAAGCTCCTTCTTAGC-3′; reverse 5′-AGAAGGAGACAATTTGGTC-3′ (Accession number:X52640); GAPDH forward 5′-GTTTGTGATGGGCGTGAAC-3′; reverse
5′-GTCTTCTGGGTGGCAGTGAT-3′. The PCR cycles were as follows:denaturation 95 ◦C 10 min; amplification 95 ◦C 8 s, 60 ◦C 7 s, 72 ◦C20 s for 40 cycles. Melting curves were performed by cooling to62 ◦C 15 s, then heating to 95 ◦C by 0.1 ◦C/s continuously and finallycooling 40 ◦C 20 s.Results of the real-time PCR data were taken as Ct values wherethe Ct is defined as the threshold cycle of the PCR at which amplifiedproduct was first detected. Analysis was performed using the math-ematical model described by Pfaffl [31]. Relative quantification ofIFN-� target gene transcript was made in comparison to GAPDHreference gene transcript using the equation:
ratio = (Etarget)�Ct target(control−sample)
(Eref)�Ct ref(control−sample)
where Etarget and Eref are the real-time PCR efficiencies ofIFN-� and GAPDH gene transcripts, respectively, calculated asE = 10[−1/slope]; the slopes for IFN-� and GAPDH assays were cal-culated from standard curves where Ct values were plotted againstserial dilutions of RNA from ConA stimulated lymphocytes. Mean Evalues from three different sheep lymphocytes were Etarget = 1.924

ine 26
T
4498 R. Reina et al. / Vacc
and Eref = 2.628. �Ct is the difference in Ct between unstimulated(mock antigen) − stimulated (antigen) samples of the IFN-� andGAPDH gene transcripts. Due to technical difficulties samples fromsheep immunized with gag-env or gag-env-ifn that were stimulatedwith whole virus were not analyzed.
2.8. Measurement of proviral load
2.8.1. Real-time PCR assaysProvirus load was measured using real-time PCR. Assays were
developed to detect, respectively, gag and pN3-gag sequences.Primers and probes were selected using Beacon Designer (PremierBiosoft International).
2.8.1.1. Gag assay. Amplicon length was 106 bp. Primers and probesequences were as follows: sense primer: 5′-TCAACAGGCATCA-CAGGCTAATA-3′ (nt. 1249–1271); antisense primer: 5′-GTTACCTGGCCTATGCGACAT-3′ (nt. 1334–1353); dual-labelledantisense probe (Operon): 5′-(6-FAM) ACCGCTCTCAAGGCTGTT-ATGACCCA(BHQ-6-FAM)-3′ (nt. 1301–1325). Nucleotide positionsrefer to the published EV1 strain sequence (S51392) [22]. Choiceof amplicon and set-up of the procedure will be described else-where. Serial dilutions of plasmid (pDRIVE, Qiagen Ltd.) carryinga 567 bp EV1 gag fragment (nt. 963–1529) [22] spanning thereal-time amplicon, were used in each assay to generate thestandard curve. Plasmid copy numbers ranged from 1 × 10⁶ to 3per reaction. Reaction volume was 25 �l (Quantitect Probe PCRkit, Qiagen Ltd.), programme was: 15 min at 95 ◦C to allow for Taqpolymerase activation, then 15 s at 94 ◦C and 1 min at 58 ◦C for 50cycles.
2.8.1.2. pN3-gag assay. pN3-gag amplicon length was 130 bp.Primers and probe sequences were as follows: sense primer: 5′-GAACCGTCAGATCCGCTAG-3′ (nt. 576–595 in U57609), located
within the CMV promoter/MCS of pN3 plasmid sequence; antisenseprimer: 5′-AGCTCGGGGTATCCCTTTT-3′ (nt. 531–549 of S51392)located within gag; dual-labelled antisense probe (Operon): 5′-(6-FAM) CCTTGAGCCTTGCTTCGCCATACGAC (BHQ-6-FAM)-3′ (nt.506–526 of S51392) spanning the ATG of p17 gag with 5 basesderived from cloning the gag fragment at the 3′ end. Assays wereperformed as in Section 2.8.1.1.
2.8.2. Proviral load in blood
Eight milliliter EDTA blood were collected at each time point.Following erythrocyte lysis with ammonium chloride, the leuko-cytes were washed 2 times in cold PBS and genomic DNA extractedwith DNeasy tissue kit (Qiagen Ltd.) according to the manu-facturer’s instructions. DNA was quantified by fluorimetry withPicoGreen dsDNA Quantitation Kit (Invitrogen). DNA concentra-tions varied between 40 and 500 ng/�l. Five microliters of freshlyprepared DNA were analyzed with real-time PCR assays specificfor EV1 gag p25 coding sequences and for pol sequences. DNAsamples were tested in triplicate; two assays were performed foreach DNA. Negative and positive controls were included in eachassay. Reactions were carried out in an I Cycler (Bio-Rad) thermalcycler with the programmes described above. The coefficient ofvariation (COV) of the proviral copy number per reaction of thesix replicates for each DNA was calculated. A threshold value of0.26 was established for DNAs having more than 10 copies perreaction and outliers were excluded from further analysis. No COVanalysis was applied to DNA samples carrying less than 10 copiesper reaction. Mean copy number per reaction was converted tomean copy number per microgram of template DNA for each ani-mal.
(2008) 4494–4505
2.8.3. Proviral load in tissuesAt autopsy 100 mg pieces of tissue from the same mediastinal
lymph node and lung samples as for the pathological evalua-tion (see below) were taken and stored at −80 ◦C until they wereprocessed. Tissue samples were minced with a scalpel and homog-enized with a pestle in ATL buffer (DNeasy tissue kit, Qiagen Ltd.).Following overnight incubation with proteinase K at 56 ◦C, DNA wasextracted according to the manufacturer’s instructions. DNA wasquantified as above and the gag copy number measured for eachlung piece and lymph node with the gag and the pN3-gag assays,as described above. The lung tissue sample with the maximumproviral load for each animal was used for statistical analysis.
Representative lung samples from the gag, gag-ifn, gag-env, andgag-env-ifn groups were assayed simultaneously using the pN3GAGassay to detect input gag plasmid. The number of samples assayedfor each gag immunized group was as follows: gag, n = 9; gag-ifn, n = 10; gagenv, n = 7; gagenvifn, n = 9. The number of copies/�gobtained from each animal using the pN3gag assay was expressedas a percentage of the number of copies/�g obtained using the GAGassay. Also, the copies/�g obtained in the gag assay was comparedstatistically with those obtained in the pN3–gag assay for each gagvaccinated group.
2.9. Determination of pathological changes
The lungs were removed aseptically and samples taken from 4different lung lobes (the right accessory (cranial) lobe, the rightapical (medial) lobe, the right caudal lobe and the left cardiac(cranial) lung lobe). In addition, a sample from the mediastinallymph node was also taken. Tissues were fixed in 10% phosphate-buffered formalin (Sigma), embedded in paraffin and sectionedaccording to standard procedures. Sections were stained withHematoxylin–Eosin and scored blind for pathology by two inde-pendent pathologists.
Histological sections from one lung lobe were stained for VMVp25 antigen using immunocytochemistry. The sections were fixedin Bouin solution and paraffin embedded. Following dewaxingand rehydration, sections were unmasked by immersing in cit-rate buffer, pH 6 (DAKO) and autoclaved for 3 min (∼100 ◦C at1 bar) in a (20/10) pressure cooker. Sections were cooled in dis-tilled water at room temperature for 5 min and after they weretreated with 3% hydrogen peroxide (DAKO®) for 5 min at room tem-perature followed by several washes in Tris-buffered saline (TBS)(DAKO®). Sections were then incubated with the VPM70 mon-
oclonal antibody (anti-GAG p25) as supernatant [32] for 1 h at37 ◦C.After incubation the sections were washed with TBS and incu-bated with EnvisionTM peroxidase mouse (DAKO®) for 30 min atroom temperature. After incubation, sections were washed withTBS and incubated with 3-3-diaminobenzidine (DAB) (DAKO®) for10 min at room temperature. The sections were then washed withdistilled water and the slides rinsed and counterstained with DAKOHematoxylin and mounted under DPX for microscopy. Sections inwhich the specific primary antibodies were replaced by TBS wereused as negative controls. Sections from a known positive animalwere used as positive controls.
2.10. Statistical analysis
Data were analysed using non-parametric Mann–Whitney tests.Data were considered significantly different if p ≤ 0.05. The exper-iment was performed in 3 centres and the statistical analysis firstdetermined if the control groups in each centre were different.When the control groups were shown not to be different, they werepooled and compared to the relevant immunized groups.

R. Reina et al. / Vaccine 26
in these groups above background (week 12 post-immunization).After challenge the antibody response in these animals was similarto controls (Fig. 3B). In all cases, the antibodies were of the IgG1subclass, with no IgG2 antibody responses being observed (datanot shown).
3.3. Induction of T cell immunity
3.3.1. Cytotoxic T cell responsesVery few animals in any group (usually less than 1–2 per group)
induced detectable CTL responses systemically after the primeboost vaccination and challenge (data not shown). Therefore sta-tistical analysis was not performed.
3.3.2. T cell proliferative responsesT cell proliferation assays on PBMC were performed using whole
virus as a source of ENV and GAG and with recombinant GAG pro-teins. The median stimulation indices obtained from using two orthree antigen concentrations were used for the analyses. The resultsare shown in Fig. 4. Proliferative responses were not elevated in any
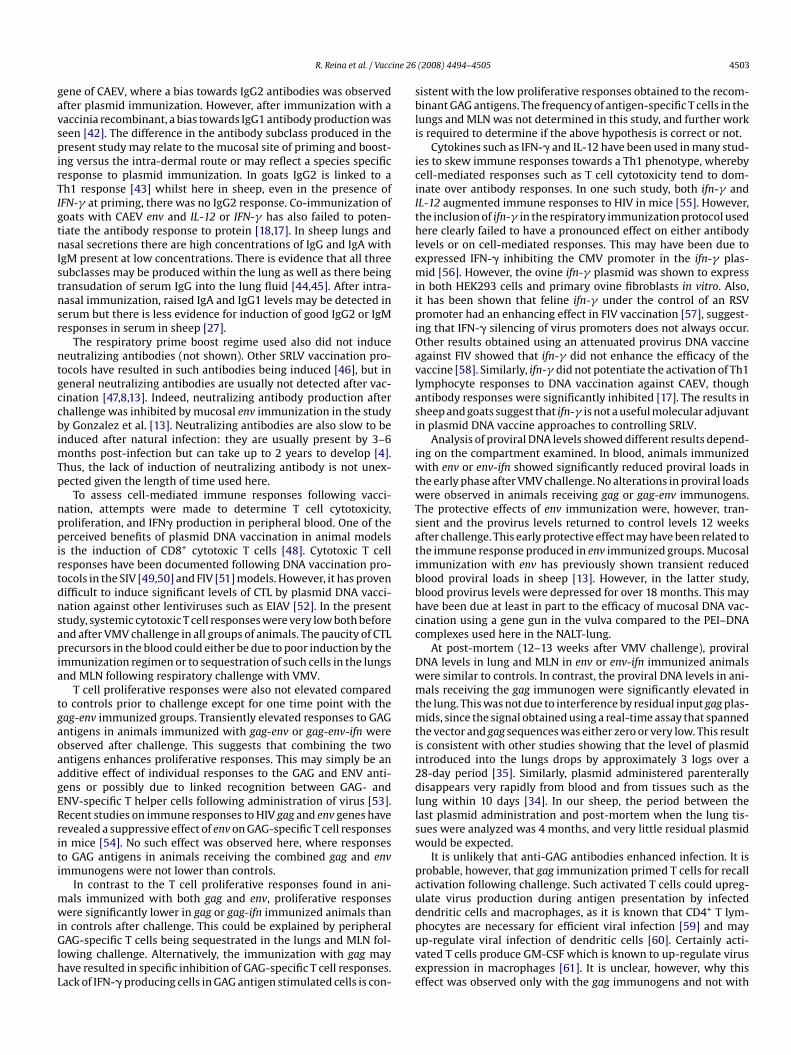
Fig. 2. Expression of recombinant p55 GAG protein. Expression of p55 GAG precursorfrom plasmid (A) and rMVA (B) was detected by anti-p25 Western blotting. HEK293 cells were transfected with plasmid. (A) Track 1, pN3-gag; 2, pN3-gag.inv (gaggene in the inverse orientation to promoter); 3, pN3-gag + CTE (gag gene with theconstitutive transport element of Mason-Pfizer Monkey virus); 4 and 5, lysates fromtwo separate transfections with pN3-p25 (pN3 with the p25 gag region only); and 6,pN3 alone as control. Recombinant MVA infected cell lysates (B) track 1, MVApSC11;2, MVAp25 (recombinant MVA expressing p25 gag region only); 3, MVAgag. Celllysates were analysed by Western blotting and proteins were probed with a rabbitanti-p25 serum diluted 1:5000. The expression of p55 GAG is indicated from thegag and gag + CTE constructs and MVAgag, whilst p25 is expressed from the p25constructs.
3. Results
3.1. Expression of IFN-� and p55 GAG and gp150 ENV precursorproteins
The expression of the gag-CTE, env, and ovine IFN-� genes wasdriven from the eukaryotic immediate early CMV promoter. Theproduction of GAG and ENV proteins was confirmed prior to useby transfection of human embryonic kidney 293 cells and Westernblotting. Fig. 2A shows expression of p55 GAG precursor from therecombinant plasmid using the MPMV CTE-fragment in HEK293cells 48 h after transfection in vitro. The recombinant GAG pro-tein was detected using anti-p25 (Fig. 2A) and anti-p17 (data notshown) specific antibodies. Expression of gp150 ENV precursorprotein either from plasmid or from MVAenv was reported else-where [33]. The equivalent p55 GAG protein in MVA was shown tobe expressed in vitro using anti-p25 antiserum (Fig. 2B) and anti-p14 antiserum (data not shown). Expression of ovine IFN-� wasdemonstrated using RT-PCR and ELISA in supernatants of trans-fected HEK293 cells and by RT-PCR in ovine fibroblasts (data notshown).
3.2. Induction of antibody
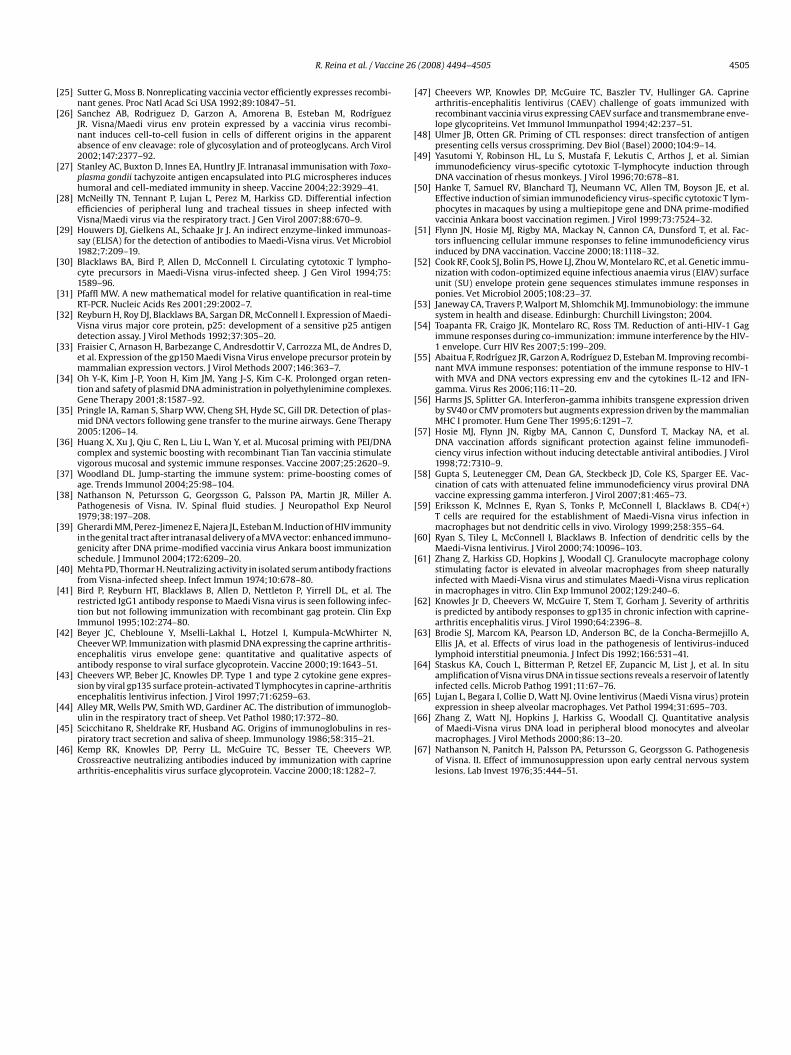
Sheep were immunized using a prime boost vaccination methodwith plasmid and recombinant MVA before challenge with VMV(Fig. 1) and anti-virus antibody measured by ELISA. After twoimmunizations with plasmid (week 7 post-immunization), onlythe env and env-ifn immunized groups induced a significant anti-body IgG response systemically (measured by a whole virus ELISA)with titres greater than those of the control group (p = 0.047 and0.003, respectively) (Fig. 3A). These two groups were not differentto each other and when pooled because there was no overall effectof IFN-� immunization at any time point, the difference from con-trols was significant at p = 0.009. The antibody responses seen in theenv and env-ifn immunized groups were transient and not boostedsystemically by recombinant MVA administration intra-tracheally.Indeed at week 12 post-immunization, the antibody response wasnot different to controls (Fig. 3A). However, there was an increasedresponse early after challenge (week 16 post-immunization, i.e.week 4 post-challenge) with both groups showing increased anti-body titres compared to controls (p = 0.036 and 0.046, respectively,and p = 0.012 when the groups were pooled) (Fig. 3B). Again this was
(2008) 4494–4505 4499
transient with the env and env-ifn groups not varying from the con-trols at week 20. However at week 24 there was a reduced antibodyresponse in these animals compared to controls (p = 0.023 for bothindividual groups and p = 0.003 for the pooled groups) (Fig. 3B).Plasmid immunization with gag or gag and env together withor without IFN-� did not induce an increased antibody responsecompared to controls using the whole virus ELISA. Similarly, recom-binant MVA administration did not boost the antibody response
Fig. 3. Antibody titre determined using whole virus ELISA. Serial two-fold dilutionsof sera from sheep were tested on a whole VMV ELISA before and after challengewith VMV. The results are given as the mean titre (log2[titre/50]) ± standard error ofthe group. Time post-immunization: (�) week 0; (�) week 7; (©) week 12; (�) week16; (�) week 20; (�) week 24. Panel (A) shows week 0–12, pre-challenge results onan expanded scale, panel (B) shows week 16–24 results after challenge. Asterisk (*)indicates titre greater than the control group (p < 0.05, groups env and env-ifn week7 and week 16) and symbol (§) indicates less than the control group (p < 0.05, envand env-ifn week 24) using Mann–Whitney tests.

4500 R. Reina et al. / Vaccine 26 (2008) 4494–4505
d as tag-ifnhan c17 we
Fig. 4. T cell proliferation responses. T cell proliferative results have been expresseAntigen used: (A) EV1; (B) p25; (C) p17; (D) p14. Groups: (�) control; (�) gag; (©) ghave only been indicated after challenge: asterisk (*) indicates significantly greater tsymbol (§) indicates significantly less than controls (§ gag: EV1 week 24; p25 and pand p14 week 16; § env: p25 week 20). Analysis by Mann–Whitney test.
of the immunized groups compared to controls prior to challengeexcept in the gag-env immunized group at week 7 which showeda weak proliferative response with p25 (p = 0.044). Following chal-lenge, the gag-env and gag-env-ifn groups tended to show higherproliferative responses to p25, p17 and p14 compared to the con-trols, with significant elevations being observed at week 20 in p17(p = 0.04) and p14 (p = 0.034) responses, respectively (Fig. 4C andD). The T cell proliferative responses to EV1 antigen in the gag-envand gag-env-ifn groups were not available for technical reasons.In animals immunized with env or env-ifn-, T cell proliferationto EV1 antigen was observed at week 24, though the levels werenot different to controls. In contrast, the gag and gag-ifn groupstended to show depressed responses at one or more time points
after challenge compared to controls. This was evident with all fourantigens (Fig. 4A–D). Combining the gag and gag-ifn groups gavesignificantly reduced responses compared to controls using EV1 atweek 24 (p = 0.006), p25 at week 20 (p = 0.003) and 24 (p = 0.026),p17 at week 16 (p = 0.003), and p14 at week 16 (p = 0.001) and 24(p = 0.023).The combined gag and gag-ifn groups were significantly lowerthan the combined gag-env and gag-env-ifn groups at week 16in response to p17 (p < 0.001) and p14 (p = 0.001), at week 20 inresponse to p25 (p = 0.001), p17 (p = 0.002), and p14 (p = 0.019), andat week 24 in response to p25 (p = 0.002), p17 (p = 0.003), and p14(p = 0.002). The responses in the combined gag and gag-ifn groupswere also significantly lower than the combined env and env-ifngroups at one or more time points when p17, p14 or EV1 was usedas antigen in the assays (data not shown).
3.3.3. IFN-� expression by PBMCExpression of IFN-� mRNA was measured by real-time PCR using
cultures of PBMC stimulated with whole virus or GAG recombi-nant proteins. By Mann–Whitney test, IFN-� mRNA expression inresponse to EV1 antigen was elevated at week 7 for gag immunized
he median of the group’s median stimulation index for each antigen against time.; (�) env; (�) env-ifn; (�) gag-env; (♦) gag-env-ifn. For clarity, significant differencesontrols (env-ifn: EV1 week 16; gag-env-ifn: p17 week 20; gag-env: p14 week 16) andeks 16, 20 and 24; p14 weeks 16 and 24; § gag-ifn: EV1 week 24; p25 week 20; p17
animals compared to controls (p = 0.032). The combined gag andgag-ifn groups showed elevated IFN� expression levels at week 16in response to p17 antigen (p = 0.047). For env immunized animalsIFN-� expression induced by EV1 stimulation at week 16 was higherthan in control animals (p = 0.049). However, these responses weretransient as there was no difference to controls at week 20. Apartfrom the above no significant differences in IFN� responses werenoted when recombinant p14, p17, or p25 were used as stimulatingantigens (data not shown).
3.4. Blood proviral load
To determine the level of systemic infection, the proviral load in
blood was measured using quantitative real time PCR. Two assayswere developed, based, respectively, on EV1 pol and gag sequences.Preliminary control experiments performed on plasmids diluted ingenomic ovine DNA showed that the gag assay was more sensitivethan pol, and therefore the gag assay was chosen for subsequentroutine analysis of blood. All samples before challenge were neg-ative (week 0, 7 and 12, data not shown). Proviral load was notaffected by having ifn-� present in the plasmid immunization atany time point. Results are shown in Fig. 5. When the env andenv-ifn groups were analysed together they were found to havea lower virus load than control animals 4 weeks after challenge(p = 0.002) and the individual groups were also significantly dif-ferent to controls (p = 0.004 and p = 0.024, respectively). By 8–12weeks after challenge, there was still a trend for the pooled envand env-ifn immunized groups to show a reduced blood proviralload (8 weeks p.i., p = 0.075; individually env, p = 0.053 and env-ifn,p = 0.333 compared to controls) with decreasing significance withtime (12 weeks p.i., p = 0.206 for the pooled groups compared tocontrols). The gag-env and gag-env-ifn groups were not significantlydifferent to one another and, although individually they were notdifferent to controls, when pooled they showed an increased provi-
R. Reina et al. / Vaccine 26
env was not protective by this measure and did not result in anincreased proviral load.
3.5.2. Mediastinal lymph node proviral loadThe major draining lymph node for the lung is the mediastinal
lymph node. Samples were taken from each animal at week 12–13post-challenge and the proviral load was determined. The provi-ral load was not significantly different between any group and thecontrols whether groups were analysed individually or grouped:immunogen and immunogen + ifn-�; as all animals with either gagor env in the immunogen; or as all animals with ifn-� in the plasmidimmunization (Fig. 6B). Thus, the significant increases in virus loadseen in the lung in gag and gag-env immunized animals were notseen in the draining lymph node at week 12–13 post-challenge.
3.6. Pathology
Sections from 4 different lung lobes and the mediastinal lymphnode of each animal were taken at week 12–13 post-challenge.Pathological changes typical of VMV infection (Fig. 7A and B) were
Fig. 5. Blood proviral load after challenge. The proviral load in white blood cells wasmeasured using a VMV p25 specific real-time PCR assay. Results have been expressedas mean copy number per �g extracted DNA ± standard error of the group. Timepost-immunization: (A) week 16; (B) week 20; (C) week 24. Asterisk (*) indicatesproviral load greater than the control group (p < 0.05, pooled gag-env and gag-env-ifngroup week 16) and symbol (§) indicates proviral load less than the control group(p < 0.05, env week 16 and 20; env-ifn week 16). Analysis by Mann–Whitney test.
ral load compared to controls 4 weeks after challenge (p = 0.049).Indeed, when groups immunized with gag in the immunogen werecompared to those without gag, there was a significant increase inproviral load at weeks 4 and 8 post-challenge (weeks 16 and 20;Fig. 5, p = 0.001 and p = 0.005, respectively) in the gag immunizedanimals. Thus, early after infection, immunization with env causeda reduction whilst the presence of both gag and env in the immu-nization mixture resulted in an increase in systemic proviral load.These effects were short lived as there was no significant differencebetween groups by week 12 post-challenge.
3.5. Tissue proviral load
3.5.1. Lung proviral loadEach animal was challenged intra-tracheally with 103 TCID50
EV1 VMV. At week 12–13 post-challenge the number of copies ofproviral DNA per �g DNA extracted from tissue was measured in4 different lung lobes for each animal with the gag assay, althoughthe gag gene was present in the plasmids used for immunization, onthe grounds that input plasmid disappears rapidly from blood andlung tissues [34,35]. To control for the possible presence of resid-ual input gag plasmid, representative lung samples from the gag,gag-ifn, gag-env, and gag-env-ifn groups were assayed simultane-ously using the pN3-gag assay. In general, the input gag plasmidcopy numbers (data not shown) were very low. The copies/�gobtained in the pN3-gag assay were expressed as a percentage ofthose obtained in gag assay. The mean% ± S.E. of pN3-gag/gag forthe gag, gag-ifn, gag-env, and gag-env-ifn groups was 0.06 ± 0.06,3.03 ± 1.35, 2.73 ± 1.49, 3.06 ± 1.47, respectively, i.e. ranging from0 to 3%. Therefore, plasmid levels remaining were approximately100-fold less than the gag levels and were on the limits of detec-
(2008) 4494–4505 4501
tion of the assay. As such they did not affect the results shown inFig. 6.
The lung lobe with the maximum value for each animal wastaken for analysis of the immunized groups (Fig. 6A). Again therewas no effect on proviral copy number if ifn-� was present in theplasmid immunization. Animals immunized with gag, i.e. gag, gag-ifn, gag-env and gag-env-ifn showed increased levels of proviral DNAin the lung (Fig. 6A, p ≤ 0.024). Immunization with env or env-ifneither individually or pooled did not affect lung proviral load com-pared to controls (Fig. 6A). Thus, immunization with gag mucosallycaused increased proviral load in the lung after challenge, whilst
Fig. 6. Tissue proviral load. The proviral load in lung and mediastinal lymph nodewas measured using a VMV p17 specific real-time PCR assay at week 12–13 post-challenge (week 24–25 post-immunization). Results have been expressed as meancopy number per �g extracted DNA ± standard error of the group. (A) Mean of themaximum lung section. (B) Mean of the mediastinal lymph node proviral load. Aster-isk (*) indicates proviral load greater than the control group (p < 0.05, in lung allgroups immunized with gag). Analysis by Mann–Whitney test.

4502 R. Reina et al. / Vaccine 26 (2008) 4494–4505
nodelogicascore ±est.
Fig. 7. Tissue pathology. Characteristic pathological changes in the lung and lymphassociated lymphoid tissue hyperplasia and (B) interstitial pneumonitis. (C) Pathoeach animal calculated. Results have been expressed as the mean of the pathologycontrol group (p < 0.05, pooled gag and gag-ifn group). Analysis by Mann–Whitney t
screened and scored: in the lung, lymphoid follicle hyperplasiaand interstitial pneumonia as well as BALT hyperplasia, perivas-cular infiltrates, congestion and oedema were scored on a scale of0–4; and in the mediastinal lymph node, lymphoid follicle reac-tivity and cortical hyperplasia were scored on a scale of 0–2. Themean of all scores was used for each animal. There was no effectof the presence of ifn-� in the plasmid immunogen. Individuallygroups were not different to controls but when single immunogengroups were pooled (once they had been shown not to be different)the gag with gag-ifn group showed decreased pathological changes(Fig. 7C, p = 0.047). The env with env-ifn group and gag-env with
gag-env-ifn group were not different to controls. So immunizationwith gag alone reduced the levels of pathology induced by infectionwith VMV.Staining for viral p25 GAG showed only a few positive cellspresent in sections. When sections were scored as either virus anti-gen positive or negative there was no correlation with lesion score(data not shown).
4. Discussion
In this study, we investigated whether a prime boost regimenof immunization against VMV given via the respiratory mucosawould induce immune responses, and modulate virus loads orlesion formation in a challenge model of ovine lentivirus infec-tion. We utilized the ability of PEI–DNA complexes to transfectcells in vivo and induce immune responses in rodents [19,36], andcoupled this with administration of a live virus vector, MVA, todeliver a “protein” boost [37]. The genes encoding the GAG andENV precursor proteins of VMV were used individually or together,with and without the gene encoding ovine IFN-� with a view todetermining whether the gag or env genes provided the best immu-
are shown. Haematoxilin and Eosin stained lung sections showing (A) bronchiolel changes in the lung and mediastinal lymph node were scored and the values for
standard error of the group. Symbol (§) indicates pathological score less than the
nization targets or whether both structural genes were required forprotection.
Humoral responses were found to be elevated in sheep immu-nized with env or env-ifn plasmids prior to challenge, but lowin all other immunized groups. The elevated anti-ENV antibodyresponses were transient but seen again early after challenge (week16). The antibody responses in these animals were reduced at week24 following challenge with VMV compared to controls. This reduc-tion may have been due to sequestration of anti-ENV producingplasma cells to sites of virus production such as the lung and drain-ing MLN. It is well established that virus levels increase transiently
following experimental infection then decrease to low or unde-tectable levels for prolonged periods thereafter [38,24]. It is notknown whether this reduction is due to humoral or cell-mediatedresponses or to a combination of both. Anti-ENV antibodies couldconceivably be involved in the reduction of virus leading to therestricted replication phase, and might be expected to return tocontrol levels once virus levels have dropped.No antibody response was seen in blood to the gag or gag-envimmunizations. This may reflect local antibody production at themucosal surface after immunization or skewing of the responseto IgM or IgA but this was not tested. There was no systemicanamnestic antibody response in the immunized groups after chal-lenge; these animals showed similar antibody responses to controlinfected animals in blood. We did not test for locally produced anti-body but intra-nasal immunization in a variety of systems is knownto induce mucosal antibody [39].
It is of interest to note that the antibodies generated by thisimmunization method were all of the IgG1 subclass (data notshown), as has been found in naturally infected animals [40,41].IgG2 antibody responses were not induced. This is in contrast toresults obtained in goats immunized intra-dermally with the env
ine 26
R. Reina et al. / Vaccgene of CAEV, where a bias towards IgG2 antibodies was observedafter plasmid immunization. However, after immunization with avaccinia recombinant, a bias towards IgG1 antibody production wasseen [42]. The difference in the antibody subclass produced in thepresent study may relate to the mucosal site of priming and boost-ing versus the intra-dermal route or may reflect a species specificresponse to plasmid immunization. In goats IgG2 is linked to aTh1 response [43] whilst here in sheep, even in the presence ofIFN-� at priming, there was no IgG2 response. Co-immunization ofgoats with CAEV env and IL-12 or IFN-� has also failed to poten-tiate the antibody response to protein [18,17]. In sheep lungs andnasal secretions there are high concentrations of IgG and IgA withIgM present at low concentrations. There is evidence that all threesubclasses may be produced within the lung as well as there beingtransudation of serum IgG into the lung fluid [44,45]. After intra-nasal immunization, raised IgA and IgG1 levels may be detected inserum but there is less evidence for induction of good IgG2 or IgMresponses in serum in sheep [27].
The respiratory prime boost regime used also did not induceneutralizing antibodies (not shown). Other SRLV vaccination pro-tocols have resulted in such antibodies being induced [46], but ingeneral neutralizing antibodies are usually not detected after vac-cination [47,8,13]. Indeed, neutralizing antibody production afterchallenge was inhibited by mucosal env immunization in the studyby Gonzalez et al. [13]. Neutralizing antibodies are also slow to beinduced after natural infection: they are usually present by 3–6months post-infection but can take up to 2 years to develop [4].Thus, the lack of induction of neutralizing antibody is not unex-pected given the length of time used here.
To assess cell-mediated immune responses following vacci-nation, attempts were made to determine T cell cytotoxicity,proliferation, and IFN� production in peripheral blood. One of theperceived benefits of plasmid DNA vaccination in animal modelsis the induction of CD8+ cytotoxic T cells [48]. Cytotoxic T cellresponses have been documented following DNA vaccination pro-tocols in the SIV [49,50] and FIV [51] models. However, it has provendifficult to induce significant levels of CTL by plasmid DNA vacci-nation against other lentiviruses such as EIAV [52]. In the presentstudy, systemic cytotoxic T cell responses were very low both beforeand after VMV challenge in all groups of animals. The paucity of CTLprecursors in the blood could either be due to poor induction by theimmunization regimen or to sequestration of such cells in the lungsand MLN following respiratory challenge with VMV.
T cell proliferative responses were also not elevated compared
to controls prior to challenge except for one time point with thegag-env immunized groups. Transiently elevated responses to GAGantigens in animals immunized with gag-env or gag-env-ifn wereobserved after challenge. This suggests that combining the twoantigens enhances proliferative responses. This may simply be anadditive effect of individual responses to the GAG and ENV anti-gens or possibly due to linked recognition between GAG- andENV-specific T helper cells following administration of virus [53].Recent studies on immune responses to HIV gag and env genes haverevealed a suppressive effect of env on GAG-specific T cell responsesin mice [54]. No such effect was observed here, where responsesto GAG antigens in animals receiving the combined gag and envimmunogens were not lower than controls.In contrast to the T cell proliferative responses found in ani-mals immunized with both gag and env, proliferative responseswere significantly lower in gag or gag-ifn immunized animals thanin controls after challenge. This could be explained by peripheralGAG-specific T cells being sequestrated in the lungs and MLN fol-lowing challenge. Alternatively, the immunization with gag mayhave resulted in specific inhibition of GAG-specific T cell responses.Lack of IFN-� producing cells in GAG antigen stimulated cells is con-
(2008) 4494–4505 4503
sistent with the low proliferative responses obtained to the recom-binant GAG antigens. The frequency of antigen-specific T cells in thelungs and MLN was not determined in this study, and further workis required to determine if the above hypothesis is correct or not.
Cytokines such as IFN-� and IL-12 have been used in many stud-ies to skew immune responses towards a Th1 phenotype, wherebycell-mediated responses such as T cell cytotoxicity tend to dom-inate over antibody responses. In one such study, both ifn-� andIL-12 augmented immune responses to HIV in mice [55]. However,the inclusion of ifn-� in the respiratory immunization protocol usedhere clearly failed to have a pronounced effect on either antibodylevels or on cell-mediated responses. This may have been due toexpressed IFN-� inhibiting the CMV promoter in the ifn-� plas-mid [56]. However, the ovine ifn-� plasmid was shown to expressin both HEK293 cells and primary ovine fibroblasts in vitro. Also,it has been shown that feline ifn-� under the control of an RSVpromoter had an enhancing effect in FIV vaccination [57], suggest-ing that IFN-� silencing of virus promoters does not always occur.Other results obtained using an attenuated provirus DNA vaccineagainst FIV showed that ifn-� did not enhance the efficacy of thevaccine [58]. Similarly, ifn-� did not potentiate the activation of Th1lymphocyte responses to DNA vaccination against CAEV, thoughantibody responses were significantly inhibited [17]. The results insheep and goats suggest that ifn-� is not a useful molecular adjuvantin plasmid DNA vaccine approaches to controlling SRLV.
Analysis of proviral DNA levels showed different results depend-ing on the compartment examined. In blood, animals immunizedwith env or env-ifn showed significantly reduced proviral loads inthe early phase after VMV challenge. No alterations in proviral loadswere observed in animals receiving gag or gag-env immunogens.The protective effects of env immunization were, however, tran-sient and the provirus levels returned to control levels 12 weeksafter challenge. This early protective effect may have been related tothe immune response produced in env immunized groups. Mucosalimmunization with env has previously shown transient reducedblood proviral loads in sheep [13]. However, in the latter study,blood provirus levels were depressed for over 18 months. This mayhave been due at least in part to the efficacy of mucosal DNA vac-cination using a gene gun in the vulva compared to the PEI–DNAcomplexes used here in the NALT-lung.
At post-mortem (12–13 weeks after VMV challenge), proviralDNA levels in lung and MLN in env or env-ifn immunized animalswere similar to controls. In contrast, the proviral DNA levels in ani-mals receiving the gag immunogen were significantly elevated in
the lung. This was not due to interference by residual input gag plas-mids, since the signal obtained using a real-time assay that spannedthe vector and gag sequences was either zero or very low. This resultis consistent with other studies showing that the level of plasmidintroduced into the lungs drops by approximately 3 logs over a28-day period [35]. Similarly, plasmid administered parenterallydisappears very rapidly from blood and from tissues such as thelung within 10 days [34]. In our sheep, the period between thelast plasmid administration and post-mortem when the lung tis-sues were analyzed was 4 months, and very little residual plasmidwould be expected.It is unlikely that anti-GAG antibodies enhanced infection. It isprobable, however, that gag immunization primed T cells for recallactivation following challenge. Such activated T cells could upreg-ulate virus production during antigen presentation by infecteddendritic cells and macrophages, as it is known that CD4+ T lym-phocytes are necessary for efficient viral infection [59] and mayup-regulate viral infection of dendritic cells [60]. Certainly acti-vated T cells produce GM-CSF which is known to up-regulate virusexpression in macrophages [61]. It is unclear, however, why thiseffect was observed only with the gag immunogens and not with

ine 26
[
[
[
[
[
[
4504 R. Reina et al. / Vacc
the individual env gene. It is possible that ENV-specific cytotoxicresponses counteracted the virus enhancing effects of the gag genesin the lung ablating the increase. Again, there was no consistenteffect on provirus loads of including the ifn-� gene in the immu-nizing mixture.
The SRLV cause chronic inflammatory lesions in target organssuch as the lungs and lymphoid tissue. Here, we scored the pres-ence and degree of severity of lesions in four lung lobes and in theMLN 12–13 weeks after respiratory challenge with VMV in con-trol and immunized animals. Lesions were found in most animalsafter challenge. However, the mean lesion scores were reduced inanimals receiving the single gag immunogen, with the combinedgag and gag-ifn groups showing a significant reduction at post-mortem. No reduction in lesion frequency or severity was observedwith the env or gag-env immunized groups. In goats, by contrast,priming with plasmid DNA encoding CAEV env and boosting withthe ENV surface protein in Freund’s incomplete adjuvant via theintradermal route suppresses the development of arthritis follow-ing intravenous challenge [8]. Longer term studies are required todetermine if the reduced lesions observed here persist.
The immunizations in the present study thus had differingeffects on virus levels and pathology scores, with env immunizationreducing blood virus levels but not lesions, and gag increasing tis-sue virus levels but reducing lesion formation. A strong correlationbetween virus levels and lesion formation in sheep and goats hasbeen established in several studies. In goats infected with CAEV, thefrequency of virus isolation was shown to be associated with lesiondevelopment in joints [62]. Similarly, in sheep infected with VMV,a correlation has been found between the degree of lung inflamma-tion and levels of proviral DNA and virus RNA, the frequency of virusisolation and antigen expression, and the number of cells express-ing the gag p25 core protein [63–66]. However, it is thought thatlesions are immune mediated [67]. One possible explanation for theresults could, therefore, be that gag immunization in the absenceof env inhibits T cell responses to VMV antigens, leading to a reduc-tion in T cell-mediated tissue damage. In contrast, the presence ofenv in the immunization leads to functional T cell responses andexpected levels of lesion formation. The observation that proviruslevels are higher in tissues following gag immunization is, how-ever, more consistent with viral replication being driven by activeT cell activation. The latter would require virus protein expres-sion. In fact, p25 protein expression levels in lung tissue of gagor env immunized animals were similar to controls. Further workis required to unravel the immunological and virological mecha-
nisms operating in the target tissues following mucosal gag DNAimmunization.In conclusion, mucosal immunization via the respiratory tractagainst VMV env results in transiently reduced levels of proviralDNA in the blood, whilst immunization with the single gag geneinduces a degree of protection against lesion development despiteincreasing proviral load in the lung. Having identified the gag geneas a potentially useful immunogen for respiratory tract immuniza-tion, future work will focus on determining local immune responsesto gag in the lung, and the long-term effects of vaccination on lesionformation and virus replication.
Acknowledgements
This study was supported by grants from European Union(QLK2-CT-2002-00617) and Spanish CICYT (AGL2003-08977-C03-01 and AGL2006-13410C-06/01/GAN). Ramsés Reina and Ximenade Andrés were supported by a fellowship FPI from the SpanishMinistry of Science and Education. Tom McNeilly was supportedby a Ph.D. studentship from the Royal (Dick) College of VeterinaryStudies, University of Edinburgh. We thank Margaret Ross, Pauline
[
[
[
[
[
[
(2008) 4494–4505
Love, Paolo Caldato, Paul Tonks, Santiago Becerra, Rosario Puyó,Margherita Profiti, Katia Ricci, Giorgia Tozzini, Angela Wheatley,Sigridur Matthiasdottir, and Paul Wright for technical help.
References
[1] Peterhans E, Geenland T, Badiola J, Harkiss G, Bertoni G, Amorena B, et al. Routesof transmission and consequences of small ruminant lentiviruses (SRLVs) infec-tion and eradication schemes. Vet Res 2004;35:257–74.
[2] Reyburn HT, Roy DJ, Blacklaws BA, Sargan DR, Watt NJ, McConnell I. Character-istics of the T cell-mediated immune response to Maedi-Visna virus. Virology1992;191:1009–12.
[3] Singh I, McConnell I, Blacklaws B. Immune response to individual Maedi-Visnavirus gag antigens. J Virol 2006;80:912–9.
[4] Petursson G, Nathansson N, Georgsson G, Panitch H, Palsson PA. Pathogenesisof Visna. I. Sequential virologic, serologic, and pathologic studies. Lab Invest1976;35:402–12.
[5] Yamamoto JK, Pu R. Feline immunodeficiency virus pathogenesis and devel-opment of a dual-subtype feline-immunodeficiency-virus vaccine. AIDS2007;21:547–63.
[6] Amara RR, Patel K, Niedziela G, Nigam P, Sharma S, Staprans SI, et al. A com-bination DNA and attenuated simian immunodeficiency virus vaccine strategyprovides enhanced protection from simian/human immunodeficiency virus-induced disease. J Virol 2005;79:15356–67.
[7] Goonetilleke N, Moore S, Dally L, Winstone N, Cebere I, Mahmoud A, et al.Induction of multifunctional human immunodeficiency virus type 1 (HIV-1)-specific T cells capable of proliferation in healthy subjects by using a prime-boost regimen of DNA- and modified vaccinia virus Ankara-vectored vaccinesexpressing HIV-1 gag coupled to CD8+ T-cell epitopes. J Virol 2006;80:4717–28.
[8] Cheevers WP, Snekvik KR, Trujillo JD, Kumpula-McWhirter NM, Pretty On TopKJ, Knowles DP. Prime-boost vaccination with plasmid DNA encoding caprine-arthritis encephalitis lentivirus env and viral SU suppresses challenge virus anddevelopment of arthritis. Virology 2003;306:116–25.
[9] Nenci C, Zahno M-L, Vogt H-R, Obexer-Ruff G, Doherr MG, Zanoni R, et al. Vacci-nation with a T-cell-priming Gag peptide of caprine arthritis encephalitis virusenhances virus replication transiently in vivo. J Gen Virol 2007;88:1589–93.
10] McGuire TC, Adams DS, Johnson GC, Klevjer-Anderson P, Barbee DD, GorhamJR. Acute arthritis in caprine arthritis-encephalitis virus challenge exposure ofvaccinated or persistently infected goats. Am J Vet Res 1986;47:537–40.
[11] Torsteinsdottir S, Carlsdottir HM, Svansson V, Matthiasdottir S, Martin AH,Petursson G. Vaccination of sheep with Maedi-Visna virus gag gene and protein,beneficial or harmful? Vaccine 2007;25:6713–20.
12] Petursson G, Matthiasdottir S, Svansson V, Andresdottir V, Georgsson G, MartinAH, et al. Mucosal vaccination with an attenuated Maedi-Visna virus clone.Vaccine 2005;23:3223–8.
13] Gonzalez B, Reina R, Garcia I, Andres S, Glaria I, Alzueta M, et al. Mucosal immu-nisation of sheep with a Maedi-Visna virus (MVV) env DNA vaccine protectsagainst early MVV productive infection. Vaccine 2005;23:4342–52.
14] Donnelly JJ, Wahren B, Liu MA. DNA vaccines: progress and challenges. JImmunol 2005;175:633–9.
15] Kim JJ, Yang JS, vanCott TC, Lee DJ, Manson KH, Wyand MS, et al. Modulationof antigen-specific humoral responses in rhesus macaques by using cytokinecDNAs as DNA vaccine adjuvants. J Virol 2000;74:3427–9.
16] Kim JJ, Yang JS, Manson KH, Weiner DB. Modulation of antigen-specific cellularimmune responses to DNA vaccination in rhesus macaques through the use of
IL-2, IFN-gamma, or IL-4 gene adjuvants. Vaccine 2001;19:2496–505.[17] Cheevers WP, Beyer JC, Hotzel I. Plasmid DNA encoding caprine interferongamma inhibits antibody response to caprine arthritis-encephalitis virus(CAEV) surface protein encoded by a co-administered plasmid expressing CAEVenv and tat genes. Vaccine 2001;19:3209–15.
[18] Cheevers WP, Hotzel I, Beyer JC, Kumpula-McWhirter N. Immune responseto caprine arthritis-encephalitis virus surface protein induced by coim-munization with recombinant vaccinia viruses expressing the caprinearthritis-encephalitis virus envelope gene and caprine interleukin-12. Vaccine2000;18:2494–503.
19] Boussif O, Lezoualc’h F, Zanta MA, Mergny MD, Scherman D, Demeneix B, et al.A versatile vector for gene and oligonucleotide transfer into cells in culture andin vivo: polyethylenimine. Proc Natl Acad Sci USA 1995;92:7297–301.
20] Kasturi SP, Sashaphibulkij K, Roy K. Covalent conjugation of polyethyleneimineon biodegradable microparticles for delivery of plasmid DNA vaccines. Bioma-terials 2005;26:6375–85.
21] Bieber T, Meissner W, Kostin S, Niemann A, Elsasser HP. Intracellular routeand trasncriptional competence of polyethylenimine–DNA complexes. J ControlRelease 2002;82:441–54.
22] Goula D, Becker N, Lemkine GF, Normandie P, Rodriguez J, Mantero S, et al.Rapid crossing of the pulmonary endothelial barrier by polyethylenimine/DNAcomplexes. Gene Ther 2000;7:499–504.
23] Sargan DR, Bennet ID, Cousens C, Roy DJ, Blacklaws BA, Dalziel RG, et al.Nucleotide sequence of EV1, a British isolate of Maedi Visna virus. J Gen Virol1991;72:1893–903.
24] Bird P, Blacklaws B, Reyburn HT, Allen D, Hopkins J, Sargan D, et al. Early eventsin immune evasion by the lentivirus Maedi-Visna occurring within infectedlymphoid tissue. J Virol 1993;67:5187–97.
ine 26
[
[
[
[
[
[
[
[
[
[
[
[
[
[
[
[
[
[
[
[
[
[
[
[
[
[
[
[
[
[
[
[
[
[cination of cats with attenuated feline immunodeficiency virus proviral DNA
R. Reina et al. / Vacc
25] Sutter G, Moss B. Nonreplicating vaccinia vector efficiently expresses recombi-nant genes. Proc Natl Acad Sci USA 1992;89:10847–51.
26] Sanchez AB, Rodriguez D, Garzon A, Amorena B, Esteban M, RodríguezJR. Visna/Maedi virus env protein expressed by a vaccinia virus recombi-nant induces cell-to-cell fusion in cells of different origins in the apparentabsence of env cleavage: role of glycosylation and of proteoglycans. Arch Virol2002;147:2377–92.
27] Stanley AC, Buxton D, Innes EA, Huntlry JF. Intranasal immunisation with Toxo-plasma gondii tachyzoite antigen encapsulated into PLG microspheres induceshumoral and cell-mediated immunity in sheep. Vaccine 2004;22:3929–41.
28] McNeilly TN, Tennant P, Lujan L, Perez M, Harkiss GD. Differential infectionefficiencies of peripheral lung and tracheal tissues in sheep infected withVisna/Maedi virus via the respiratory tract. J Gen Virol 2007;88:670–9.
29] Houwers DJ, Gielkens AL, Schaake Jr J. An indirect enzyme-linked immunoas-say (ELISA) for the detection of antibodies to Maedi-Visna virus. Vet Microbiol1982;7:209–19.
30] Blacklaws BA, Bird P, Allen D, McConnell I. Circulating cytotoxic T lympho-cyte precursors in Maedi-Visna virus-infected sheep. J Gen Virol 1994;75:1589–96.
31] Pfaffl MW. A new mathematical model for relative quantification in real-timeRT-PCR. Nucleic Acids Res 2001;29:2002–7.
32] Reyburn H, Roy DJ, Blacklaws BA, Sargan DR, McConnell I. Expression of Maedi-Visna virus major core protein, p25: development of a sensitive p25 antigendetection assay. J Virol Methods 1992;37:305–20.
33] Fraisier C, Arnason H, Barbezange C, Andresdottir V, Carrozza ML, de Andres D,et al. Expression of the gp150 Maedi Visna Virus envelope precursor protein bymammalian expression vectors. J Virol Methods 2007;146:363–7.
34] Oh Y-K, Kim J-P, Yoon H, Kim JM, Yang J-S, Kim C-K. Prolonged organ reten-tion and safety of plasmid DNA administration in polyethylenimine complexes.Gene Therapy 2001;8:1587–92.
35] Pringle IA, Raman S, Sharp WW, Cheng SH, Hyde SC, Gill DR. Detection of plas-mid DNA vectors following gene transfer to the murine airways. Gene Therapy2005:1206–14.
36] Huang X, Xu J, Qiu C, Ren L, Liu L, Wan Y, et al. Mucosal priming with PEI/DNAcomplex and systemic boosting with recombinant Tian Tan vaccinia stimulatevigorous mucosal and systemic immune responses. Vaccine 2007;25:2620–9.
37] Woodland DL. Jump-starting the immune system: prime-boosting comes ofage. Trends Immunol 2004;25:98–104.
38] Nathanson N, Petursson G, Georgsson G, Palsson PA, Martin JR, Miller A.Pathogenesis of Visna. IV. Spinal fluid studies. J Neuropathol Exp Neurol1979;38:197–208.
39] Gherardi MM, Perez-Jimenez E, Najera JL, Esteban M. Induction of HIV immunityin the genital tract after intranasal delivery of a MVA vector: enhanced immuno-genicity after DNA prime-modified vaccinia virus Ankara boost immunizationschedule. J Immunol 2004;172:6209–20.
40] Mehta PD, Thormar H. Neutralizing activity in isolated serum antibody fractionsfrom Visna-infected sheep. Infect Immun 1974;10:678–80.
41] Bird P, Reyburn HT, Blacklaws B, Allen D, Nettleton P, Yirrell DL, et al. Therestricted IgG1 antibody response to Maedi Visna virus is seen following infec-tion but not following immunization with recombinant gag protein. Clin ExpImmunol 1995;102:274–80.
42] Beyer JC, Chebloune Y, Mselli-Lakhal L, Hotzel I, Kumpula-McWhirter N,Cheever WP. Immunization with plasmid DNA expressing the caprine arthritis-encephalitis virus envelope gene: quantitative and qualitative aspects ofantibody response to viral surface glycoprotein. Vaccine 2000;19:1643–51.
43] Cheevers WP, Beber JC, Knowles DP. Type 1 and type 2 cytokine gene expres-sion by viral gp135 surface protein-activated T lymphocytes in caprine-arthritisencephalitis lentivirus infection. J Virol 1997;71:6259–63.
44] Alley MR, Wells PW, Smith WD, Gardiner AC. The distribution of immunoglob-ulin in the respiratory tract of sheep. Vet Pathol 1980;17:372–80.
45] Scicchitano R, Sheldrake RF, Husband AG. Origins of immunoglobulins in res-piratory tract secretion and saliva of sheep. Immunology 1986;58:315–21.
46] Kemp RK, Knowles DP, Perry LL, McGuire TC, Besser TE, Cheevers WP.Crossreactive neutralizing antibodies induced by immunization with caprinearthritis-encephalitis virus surface glycoprotein. Vaccine 2000;18:1282–7.
[
[
[
[
[
[
[
[
[
(2008) 4494–4505 4505
47] Cheevers WP, Knowles DP, McGuire TC, Baszler TV, Hullinger GA. Caprinearthritis-encephalitis lentivirus (CAEV) challenge of goats immunized withrecombinant vaccinia virus expressing CAEV surface and transmembrane enve-lope glycopriteins. Vet Immunol Immunpathol 1994;42:237–51.
48] Ulmer JB, Otten GR. Priming of CTL responses: direct transfection of antigenpresenting cells versus crosspriming. Dev Biol (Basel) 2000;104:9–14.
49] Yasutomi Y, Robinson HL, Lu S, Mustafa F, Lekutis C, Arthos J, et al. Simianimmunodeficiency virus-specific cytotoxic T-lymphocyte induction throughDNA vaccination of rhesus monkeys. J Virol 1996;70:678–81.
50] Hanke T, Samuel RV, Blanchard TJ, Neumann VC, Allen TM, Boyson JE, et al.Effective induction of simian immunodeficiency virus-specific cytotoxic T lym-phocytes in macaques by using a multiepitope gene and DNA prime-modifiedvaccinia Ankara boost vaccination regimen. J Virol 1999;73:7524–32.
51] Flynn JN, Hosie MJ, Rigby MA, Mackay N, Cannon CA, Dunsford T, et al. Fac-tors influencing cellular immune responses to feline immunodeficiency virusinduced by DNA vaccination. Vaccine 2000;18:1118–32.
52] Cook RF, Cook SJ, Bolin PS, Howe LJ, Zhou W, Montelaro RC, et al. Genetic immu-nization with codon-optimized equine infectious anaemia virus (EIAV) surfaceunit (SU) envelope protein gene sequences stimulates immune responses inponies. Vet Microbiol 2005;108:23–37.
53] Janeway CA, Travers P, Walport M, Shlomchik MJ. Immunobiology: the immunesystem in health and disease. Edinburgh: Churchill Livingston; 2004.
54] Toapanta FR, Craigo JK, Montelaro RC, Ross TM. Reduction of anti-HIV-1 Gagimmune responses during co-immunization: immune interference by the HIV-1 envelope. Curr HIV Res 2007;5:199–209.
55] Abaitua F, Rodríguez JR, Garzon A, Rodríguez D, Esteban M. Improving recombi-nant MVA immune responses: potentiation of the immune response to HIV-1with MVA and DNA vectors expressing env and the cytokines IL-12 and IFN-gamma. Virus Res 2006;116:11–20.
56] Harms JS, Splitter GA. Interferon-gamma inhibits transgene expression drivenby SV40 or CMV promoters but augments expression driven by the mammalianMHC I promoter. Hum Gene Ther 1995;6:1291–7.
57] Hosie MJ, Flynn JN, Rigby MA, Cannon C, Dunsford T, Mackay NA, et al.DNA vaccination affords significant protection against feline immunodefi-ciency virus infection without inducing detectable antiviral antibodies. J Virol1998;72:7310–9.
58] Gupta S, Leutenegger CM, Dean GA, Steckbeck JD, Cole KS, Sparger EE. Vac-
vaccine expressing gamma interferon. J Virol 2007;81:465–73.59] Eriksson K, McInnes E, Ryan S, Tonks P, McConnell I, Blacklaws B. CD4(+)
T cells are required for the establishment of Maedi-Visna virus infection inmacrophages but not dendritic cells in vivo. Virology 1999;258:355–64.
60] Ryan S, Tiley L, McConnell I, Blacklaws B. Infection of dendritic cells by theMaedi-Visna lentivirus. J Virol 2000;74:10096–103.
61] Zhang Z, Harkiss GD, Hopkins J, Woodall CJ. Granulocyte macrophage colonystimulating factor is elevated in alveolar macrophages from sheep naturallyinfected with Maedi-Visna virus and stimulates Maedi-Visna virus replicationin macrophages in vitro. Clin Exp Immunol 2002;129:240–6.
62] Knowles Jr D, Cheevers W, McGuire T, Stem T, Gorham J. Severity of arthritisis predicted by antibody responses to gp135 in chronic infection with caprine-arthritis encephalitis virus. J Virol 1990;64:2396–8.
63] Brodie SJ, Marcom KA, Pearson LD, Anderson BC, de la Concha-Bermejillo A,Ellis JA, et al. Effects of virus load in the pathogenesis of lentivirus-inducedlymphoid interstitial pneumonia. J Infect Dis 1992;166:531–41.
64] Staskus KA, Couch L, Bitterman P, Retzel EF, Zupancic M, List J, et al. In situamplification of Visna virus DNA in tissue sections reveals a reservoir of latentlyinfected cells. Microb Pathog 1991;11:67–76.
65] Lujan L, Begara I, Collie D, Watt NJ. Ovine lentivirus (Maedi Visna virus) proteinexpression in sheep alveolar macrophages. Vet Pathol 1994;31:695–703.
66] Zhang Z, Watt NJ, Hopkins J, Harkiss G, Woodall CJ. Quantitative analysisof Maedi-Visna virus DNA load in peripheral blood monocytes and alveolarmacrophages. J Virol Methods 2000;86:13–20.
67] Nathanson N, Panitch H, Palsson PA, Petursson G, Georgsson G. Pathogenesisof Visna. II. Effect of immunosuppression upon early central nervous systemlesions. Lab Invest 1976;35:444–51.
Copyright © 2022 FDOKUMEN