mTOR/p70S6k signalling alteration by Abeta exposure as well as in APP-PS1 transgenic models and in...
11
mTOR/p70S6k signalling alteration by Ab exposure as well as in APP-PS1 transgenic models and in patients with Alzheimer’s disease Claire Lafay-Chebassier,* , ,1 Marc Paccalin, , à ,1 Guyle `ne Page, Ste ´phanie Barc-Pain, Marie Christine Perault-Pochat,* , Roger Gil,§ , Laurent Pradier¶ and Jacques Hugon§ , Departments of *Pharmacology, àGeriatrics and §Neurology, Poitiers University Hospital, Poitiers, France Research Group on Brain Aging (Equipe associe ´e 3808), University of Poitiers, Poitiers, France ¶Sanofi-Aventis, CRVA Vitry-sur-Seine, France Abstract In Alzheimer’s disease, neuropathological hallmarks include the accumulation of b-amyloid peptides (Ab) in senile plaques, phosphorylated tau in neurofibrillary tangles and neuronal death. Ab is the major aetiological agent according to the amyloid cascade hypothesis. Translational control includes phosphorylation of the kinases mammalian target of rapa- mycin (mTOR) and p70S6k which modulate cell growth, pro- liferation and autophagy. It is mainly part of an anti-apoptotic cellular signalling. In this study, we analysed modifications of mTOR/p70S6k signalling in cellular and transgenic models of Alzheimer’s disease, as well as in lymphocytes of patients and control individuals. Ab 1–42 produced a rapid and persistent down-regulation of mTOR/p70S6k phosphorylation in murine neuroblastoma cells associated with caspase 3 activation. Using western blottings, we found that phosphorylated forms of mTOR and p70S6k are decreased in the cortex but not in the cerebellum (devoid of plaques) of double APP/PS1 transgenic mice compared with control mice. These results were confirmed by immunohistochemical methods. Finally, the expression of phosphorylated p70S6k was significantly reduced in lymphocytes of Alzheimer’s patients, and levels of phosphorylated p70S6k were statistically correlated with Mini Mental Status Examination (MMSE) scores. Taken together, these findings demonstrate that the mainly anti-apoptotic mTOR/p70S6k signalling is altered in cellular and transgenic models of Alzheimer’s disease and in peripheral cells of patients, and could contribute to the pathogenesis of the disease. Keywords: Alzheimer, Ab, human lymphocytes, mTOR signalling, transgenic models, translation. J. Neurochem. (2005) 94, 215–225. In eukaryotes, protein translation includes three consecutive phases: initiation, elongation and termination. The initiation phase corresponds to processes associated with the connection between mRNA and ribosomes. The elongation phase includes the links between amino acids at the ribosomal level, and is followed by the termination phase. These three phases are highly regulated by proteins, called translation factors, that can interact directly with mRNAs. In the initiation phase, two major factors are involved: eukaryotic initiation factor 2 (eIF2) and eukaryotic initiation factor 4E (eIF4E). The availability of eIF4E is linked to the binding of specific proteins called 4E-BPs. When these proteins are not phos- phorylated, they have a great affinity for eIF4E, which is unable to bind to mRNAs, leading to a reduction of translation. These proteins are mainly phosphorylated by a kinase called mTOR (mammalian target of rapamycin) or FKBP12- Received January 12, 2005; revised manuscript received February 7, 2005; accepted February 23, 2005. Address correspondence and reprint requests to Jacques Hugon, Department of Neurology, CHU Poitiers, rue de la Miletrie, 86000 Poitiers, France. E-mail: [email protected] 1 Claire Lafay-Chebassier and Marc Paccalin contributed equally to this work. Abbreviations used:Ab, b-amyloid peptides; AD, Alzheimer’s dis- ease; BDNF, Brain derived neurotrophic factor; eIF2, eukaryotic initi- ation factor 2; eIF4E, eukaryotic initiation factor 4E; ER, endoplasmic reticulum; FRAP, FKBP12-Rapamicyn associated protein; GTP, Gua- nosine triphosphate; LTP, Long Term potentiation; MMSE, mini mental state examination; mTOR, mammalian target of rapamycin; PI3K, phosphatidyl Inositol 3 Kinase; PERK, PKR-like endoplasmic reticulum kinase; PKR, double-stranded RNA-dependent protein kinase; RA, all-trans retinoic acid. Journal of Neurochemistry , 2005, 94, 215–225 doi:10.1111/j.1471-4159.2005.03187.x ȑ 2005 International Society for Neurochemistry, J. Neurochem. (2005) 94, 215–225 215
-
Upload
independent -
Category
Documents
-
view
3 -
download
0
Transcript of mTOR/p70S6k signalling alteration by Abeta exposure as well as in APP-PS1 transgenic models and in...

mTOR/p70S6k signalling alteration by Ab exposure as well asin APP-PS1 transgenic models and in patients with Alzheimer’sdisease
Claire Lafay-Chebassier,*,�,1 Marc Paccalin,�,�,1 Guylene Page,� Stephanie Barc-Pain,� MarieChristine Perault-Pochat,*,� Roger Gil,§,� Laurent Pradier¶ and Jacques Hugon§,�
Departments of *Pharmacology, �Geriatrics and §Neurology, Poitiers University Hospital, Poitiers, France
�Research Group on Brain Aging (Equipe associee 3808), University of Poitiers, Poitiers, France
¶Sanofi-Aventis, CRVA Vitry-sur-Seine, France
Abstract
In Alzheimer’s disease, neuropathological hallmarks include
the accumulation of b-amyloid peptides (Ab) in senile plaques,
phosphorylated tau in neurofibrillary tangles and neuronal
death. Ab is the major aetiological agent according to the
amyloid cascade hypothesis. Translational control includes
phosphorylation of the kinases mammalian target of rapa-
mycin (mTOR) and p70S6k which modulate cell growth, pro-
liferation and autophagy. It is mainly part of an anti-apoptotic
cellular signalling. In this study, we analysed modifications of
mTOR/p70S6k signalling in cellular and transgenic models of
Alzheimer’s disease, as well as in lymphocytes of patients and
control individuals. Ab 1–42 produced a rapid and persistent
down-regulation of mTOR/p70S6k phosphorylation in murine
neuroblastoma cells associated with caspase 3 activation.
Using western blottings, we found that phosphorylated forms
of mTOR and p70S6k are decreased in the cortex but not in
the cerebellum (devoid of plaques) of double APP/PS1
transgenic mice compared with control mice. These results
were confirmed by immunohistochemical methods. Finally,
the expression of phosphorylated p70S6k was significantly
reduced in lymphocytes of Alzheimer’s patients, and levels of
phosphorylated p70S6k were statistically correlated with Mini
Mental Status Examination (MMSE) scores. Taken together,
these findings demonstrate that the mainly anti-apoptotic
mTOR/p70S6k signalling is altered in cellular and transgenic
models of Alzheimer’s disease and in peripheral cells of
patients, and could contribute to the pathogenesis of the
disease.
Keywords: Alzheimer, Ab, human lymphocytes, mTOR
signalling, transgenic models, translation.
J. Neurochem. (2005) 94, 215–225.
In eukaryotes, protein translation includes three consecutivephases: initiation, elongation and termination. The initiationphase corresponds to processes associated with the connectionbetweenmRNAand ribosomes. The elongation phase includesthe links between amino acids at the ribosomal level, and isfollowed by the termination phase. These three phases arehighly regulated by proteins, called translation factors, that caninteract directly with mRNAs. In the initiation phase, twomajor factors are involved: eukaryotic initiation factor 2 (eIF2)and eukaryotic initiation factor 4E (eIF4E).
The availability of eIF4E is linked to the binding of specificproteins called 4E-BPs. When these proteins are not phos-phorylated, they have a great affinity for eIF4E, which isunable to bind tomRNAs, leading to a reduction of translation.These proteins are mainly phosphorylated by a kinase calledmTOR (mammalian target of rapamycin) or FKBP12-
Received January 12, 2005; revised manuscript received February 7,2005; accepted February 23, 2005.Address correspondence and reprint requests to Jacques Hugon,
Department of Neurology, CHU Poitiers, rue de la Miletrie, 86000Poitiers, France. E-mail: [email protected] Lafay-Chebassier and Marc Paccalin contributed equally to thiswork.Abbreviations used: Ab, b-amyloid peptides; AD, Alzheimer’s dis-
ease; BDNF, Brain derived neurotrophic factor; eIF2, eukaryotic initi-ation factor 2; eIF4E, eukaryotic initiation factor 4E; ER, endoplasmicreticulum; FRAP, FKBP12-Rapamicyn associated protein; GTP, Gua-nosine triphosphate; LTP, Long Term potentiation; MMSE, mini mentalstate examination; mTOR, mammalian target of rapamycin; PI3K,phosphatidyl Inositol 3 Kinase; PERK, PKR-like endoplasmic reticulumkinase; PKR, double-stranded RNA-dependent protein kinase; RA,all-trans retinoic acid.
Journal of Neurochemistry, 2005, 94, 215–225 doi:10.1111/j.1471-4159.2005.03187.x
� 2005 International Society for Neurochemistry, J. Neurochem. (2005) 94, 215–225 215

rapamicyn associated protein (FRAP) (Schmelzle and Hall2000; Raught et al. 2001). mTOR can also phosphorylatekinase p70S6k that stimulates protein synthesis (Dufner andThomas 1999). The regulation of mTOR activity is importantfor the availability of eIF4E. mTOR is activated by thephosphatidyl Inositol 3 Kinase (PI3K) and Akt pathways. ThemTOR pathway is also activated by IGF1 (Clemens 2001).mTOR signalling is physiologically active and allows proteinand ribosome synthesis.Many studies have shown that cellularstresses can increase the binding of 4E-BPs to the eIF4E factorand can reduce protein translation (Clemens 2001). Recentstudies have shown that two tumour suppressor genes, TSC1andTSC2, and their corresponding proteins are able to regulatemTOR phosphorylation and binding to protein 14-3-3 (Gaoet al. 2002). In addition, reduction of the eIF4E level is notenough to induce cellular apoptosis (Luo et al. 1994) anddouble-stranded RNA dependent protein kinase (PKR) candephosphorylate the protein’s 4EBPs through the activation ofphosphatase 2A, leading to cell apoptosis (Xu and Williams2000; Jeffrey et al. 2002). Recent electrophysiological resultshave also demonstrated that mTOR could play a role inneuronal plasticity and in the process of learning and memory.In brain slices treated with the mTOR inhibitor rapamycin, theauthors observed a decrease in the late phase of long termpotentiation (LTP) induced by synaptic stimulation or brainderived neurotrophic factor (BDNF) exposure (Nguyen 2002;Tang et al. 2002).
EIF2 can fix guanosine triphosphate (GTP) and interactwith tRNA carrying methionin. The complex formed canbind to the small 40S subunit of the ribosome, a phase inwhich eIF4E plays also a major role. The availability of thesetwo initiation factors is indispensable for the onset of proteinsynthesis. The control of eIF2 is linked to the state ofphosphorylation on the a subunit on serine 51. Uponphosphorylation, eIF2a is unable to bind to tRNA andtranslation is stopped. Four protein kinases are able tophosphorylate eIF2a: PKR, PERK (PKR-like endoplasmicreticulum kinase), HRI (Heme-regulated kinase) and GCN2(amino acid-regulated kinase). PKR is a ubiquitous proteininvolved in viral infections, but it is also activated duringdifferent cellular stresses such as toxic stress, endoplasmicreticulum (ER) stress, intracellular calcium stress and lack oftrophic factors (Williams 1999). ER stress also leads to theactivation of PERK and the unfolded protein response(Harding et al. 1999). Several studies have revealedincreased PKR expression with ageing (Ladiges et al.2000), in neurodegenerative diseases (Peel et al. 2001;Chang et al. 2002b), or in the activation of eIF2a in cerebralischaemia-reperfusion, hypoxia or zinc toxicity (Frerichset al. 1998; Alirezaei et al. 1999; DeGracia et al. 1999). Ithas been demonstrated that these kinases play an importantrole in the process of cellular apoptosis by interacting withprotein translation and apoptotic factors.
An early study revealed that mRNA translation wasdisturbed in the brain of Alzheimer’s disease (AD) patients(Langstrom et al. 1989). Inhibition of ribosomal translationcould be responsible for modifications of gene expressiondetected in affected brain regions. An increased level ofelongation factor 2was also noted in ADbrains (Johnson et al.1992). We have recently demonstrated an accumulation ofphosphorylated eIF2a in degenerating neurones in AD brainsassociated with increased staining of activated PKR (Changet al. 2002a). This finding was confirmed by another group(Ferrer 2002). In addition, we have shown in vitro that Abcould induce activation of PKR and the phosphorylation ofeIF2a (Chang et al. 2002b). PKR activation was dependentupon caspase 3 and caspase 8 triggering. A reduction in proteinsynthesis has been described during ageing (Rattan 1996), aswell as a decrease in eIF2a and eIF2B and an increase in PKRexpression (Kimball et al. 1992; Ladiges et al. 2000). Veryfew studies have been carried out so far on the involvement ofthemTOR/p70S6k signalling pathway following Ab exposurein cell cultures and in AD models. The results of the presentstudy show that there is a decrease inmTOR/p70S6k signallingin neural cells treated in vitro with Ab, in the cortex oftransgenic mice overexpressing APP and Presenilin 1 muta-tions, and in lymphocytes of patients suffering fromAD.Thesefindings demonstrate that translational control could representa new molecular target for future therapeutic interventionsconcerning Alzheimer’s disease.
Materials and methods
Chemicals
All-trans retinoic acid (RA), peptides Ab 1–42 and Ab 40–1,
paraformaldehyde (PFA), Histopaque 1077, Triton X-100, sodium
fluoride, phenylmethylsulfonyl fluoride, protease and phosphatase
inhibitors, dithiothreitol (DTT) and Caspase 3 substrate Ac-DEVD-
pNA were obtained from Sigma (Saint Quentin Fallavier, France).
Pentobarbital was obtained from Ceva Sante Animale (Libourne
France). Primary antibodies and secondary anti-rabbit IgG antibody
conjugated with horseradish peroxidase were purchased from Cell
Signalling Ozyme (Saint Quentin Yvelines, France) except for anti-
b-tubulin antibody and anti-b-actin antibody which were from
Sigma. The phospho-mTOR antibody was recently used as a marker
for mTOR activation (Bolster et al. 2002). Secondary anti-mouse
IgG antibody conjugated with horseradish peroxidase was obtained
from Amersham (Orsay, France). All reagent-grade chemicals for
buffers were obtained from VWR International (Strasbourg, France).
Cell cultures and Ab treatment
Neuro-2a murine neuroblastoma cell lines were obtained from the
American Type Culture Collection (ATCC). Neuro-2a cells were
cultured with Minimal Essential Medium (MEM) (Gibco-BRL,
Cergy Pontoise, France), supplemented with 10% fetal bovine serum
(FBS) and 1% antibiotics [50 U/mL penicillin + 50 lg/mL
streptomycin (Gibco-BRL)]. The cells were differentiated into
216 C. Lafay-Chebassier et al.
� 2005 International Society for Neurochemistry, J. Neurochem. (2005) 94, 215–225

mature neurones by incubating with 20 lM RA for 2 days. Cells
were maintained in a humidified 5% CO2 atmosphere at 37�C.Cells were treated with 20 lM Ab (1–42) or (40–1) from 30 min
to 24 h in serum-free medium. The peptides were incubated at 37�Cfrom 24 to 48 h to form aggregates prior to use. After treatment,
neural cells were lysed in ice-cold lysis buffer containing protease
and phosphatase inhibitor cocktail. The lysate was sonicated and
then centrifuged at 15 000 g for 15 min at 4�C. The protein content
of the supernatant fluid was measured using a protein assay kit
(BioRad, Marnes la Coquette, France); 20 lg protein (from the
supernatant fluid) per lane were used for mTOR analysis, 10 lg for
all other proteins and 60 lg for the caspase activity assay.
Caspase 3 assay
In a reaction volume of 100 lL, lysate buffer supernatant fluid was
added to assay buffer [312.5 mM HEPES (pH 7.5), 31.25% w/v
sucrose, 0.3125% w/v CHAPS] with 100 mM DTT and the caspase-
3 substrate Ac-DEVD-pNA (200 lM), and incubated at 37�C.Release of p-nitroaniline was monitored by recording the OD405nm
at 15 min intervals.
Western blot analysis
Protein (20 lg per sample) was separated on 6% or 10% Tris-
glycine polyacrylamide gels and transferred to polyvinylidene
difluoride (PVDF) membranes (Immobilon-P, Millipore, Bedford,
MA, USA). Immunoblots were blocked for 2 h in Tris-buffered
saline Tween-20 (TBST, 20 mM Tris-HCl, 150 mM NaCl, pH 7.5,
0.05% Tween 20) containing 5% non-fat milk and 0.21% sodium
fluoride. The blots were incubated with primary antibody in
blocking buffer at 4�C overnight. Membranes were washed twice
with TBST and then incubated with the secondary antibody : per-
oxidase-conjugated anti-rabbit IgG (1 : 1000 dilution) for 1 h at
25�C. Membranes were washed again and then developed with
Enhanced Chemiluminescence (ECL) plus western blotting (Amer-
sham Biosciences), followed by apposition of the membrane to
autoradiographic films (Hyperfilm ECL, Amersham Biosciences).
After two washes with TBST, membranes were probed with a
monoclonal antibody against tubulin (1 : 1000, Sigma) or b-actin(1 : 1000, Sigma) for 2 h at 25�C. They were then washed with
TBST, incubated with anti-mouse peroxidase-conjugated secondary
antibody for 1 h and developed. Band intensities were analysed with
a gel documentation system (BioRad). mTor and p70S6k expres-
sions were adjusted to tubulin expression. The protein levels were
expressed as densitometry and percentage of controls.
Transgenic mice
The different transgenic mouse lines were generated at the Research
Centre of Paris, Sanofi Aventis, in Neurodegenerative Disease Group
(Vitry sur Seine, France). All themicewere female and all experiments
were performed in compliance with, and following approval of the
Aventis Animal Care and Use Committee, in accordance with the
standards of the Guide for the Care and Use of Laboratory Animals
(CNRS ILAR), and with respect to French and European Community
rules. The genetic background of the mice was mixed CBA/C57BL/6.
The following groups of mice were examined: 24-month-old
control mice [n ¼ 5, body weight (BW) ¼ 36.14 ± 4.49 g];
24-month-old transgenic mice (n ¼ 5, BW ¼ 28.78 ± 1.84 g)
expressing human mutant APP751 (APP HE) (carrying the
Swedish and London mutations KM670/671NL and V717l, Thy1
promoter); 12-month-old control mice (C57BL/6, n ¼ 8, BW ¼34.58 ± 2.22 g); 12-month-old transgenic mice expressing single
human mutant presenilin-1 (APP/PS1 WT/HE) (PS-1 M146L,
HMG promoter, n ¼ 6, BW ¼ 34.06 ± 3.05 g), 12-month-old
transgenic mice expressing human mutant APP751 SL and human
mutant presenilin-1 M146L (APP/PS1 HE/HE, n ¼ 4, BW ¼28.85 ± 0.48 g). APP/PS-1 double-transgenic mice were generated
by crossing PS-1 (HMG PS-1 M146L) homozygous mice with
hemizygous APP (Thy1 APP751 SL) transgenic mice. A detailed
description of these transgenic mice has been given previously
(Wirths et al. 2001; Blanchard et al. 2003). APP mice were
analysed at 24 months of age and APP-PS1 mice were assessed at
12 months of age because they revealed comparable levels of
amyloid plaques in the brain at these respective ages.
Brain tissue preparation
For western blot analysis, mice were anaesthetized with pentobarbital
(40 mg/kg, i.p.) and killed. Brains were removed and cortex and
cerebellum dissected. These cerebral regions were homogenized by
10 up-and-down strokes of a pre-chilled Teflon-glass homogenizer in
20 volumes of lysis buffer (25 mM Tris-HCl, 150 mM NaCl, 1 mM
EDTA, pH 7.4) and supplementedwith 50 mMsodiumfluoride, 1 mM
phenylmethylsulfonyl fluoride, protease and phosphatase inhibitor
cocktails (50 lL/g tissue and 10 lL/mL lysis buffer, respectively).
Lysates were sonicated and centrifuged at 15 000 g for 15 min at 4�C.The resulting supernatant fluids were collected for BioRad protein
assay and western blot analysis as described above.
The brain tissue preparation for immunohistochemistry required
an intracardial perfusion with Phosphate-Buffered Saline (PBS)
(154 mM NaCl, 1.54 mM KH2PO4, 2.7 mM Na2HPO4.7H2O,
pH 7.2) followed by 4% (v/v) paraformaldehyde (PFA) in PBS.
Brains were removed and post-fixed for 24 h in 4% PFA at 4�C.They were then rinsed in PBS, dehydrated, and embedded in
paraffin for sectioning (4 lm in thickness).
Immunohistochemistry
Sections were de-waxed for 2 · 10 min with Histosol (Shandon,
Cergy Pontoise, France) and rehydrated by 5 min incubations in each
of 100, 95 and 75% ethanol. Sections were rinsed twice for 5 min in
ultra-high quality water (H2OUHQ) and washed twice in PBS
(2 · 5 min). To unmask antigens, the slides were immersed in citrate
buffer (10 mM sodium citrate, pH 6) and microwaved for 2 · 10 min
(with 650 W). For amyloid peptide (Ab) immunostaining, sections
were incubated in 10 mM sodium citrate buffer, pH 9, for 40 min in a
98�C water bath. Slides were allowed to reach room temperature
before two 5 min incubations in H2OUHQ. For rabbit polyclonal
primary antibody anti-phospho-mTOR (Ser2448), dilution 1/20, the
EnVision System (DakoCytomation, Trappes, France) was used. This
protocol includes four steps: (i) a 5 min peroxidase block to quench
endogenous peroxidase activity; (ii) an incubation for 30 min at room
temperaturewith diluted primary antibody in TBST (50 mMTris-HCl,
150 mM NaCl pH 7,6 with 0.1% Tween) containing 1% of bovine
serum albumin; (iii) an incubation for 30 min at room temperature
with the peroxidase-labelled polymer; (iv) staining (8 min incubation)
with 3,3¢-diaminobenzidine (DAB) substrate-chromogen which
results in a brown-coloured precipitate at the antigen site. The
monoclonal mouse primary antibody anti-human b-amyloid
mTOR/p70S6k signalling alteration by Ab 217
� 2005 International Society for Neurochemistry, J. Neurochem. (2005) 94, 215–225

(1–40/42) C-terminal, dilution 1/25 (Calbiochem, Strasbourg,
France), was immunostained with the DakoCytomation DAKO
ARK system. The diluted primary antibody was labelled using
the biotinylation reagent, a monovalent biotinylated anti-mouse
immunoglobulin. Tissue sections were incubated for 15 min at room
temperature (RT) with the biotin-labelled primary antibody and then
incubated, also for 15 min at RT, with a streptavidin-alcaline
phosphatase conjugate. Staining was completed with fast red
substrate-chromogen, resulting in a red end product at the site of the
target antigen. Mayer’s haematoxylin or methyl green was eventually
used as counterstain.
Selection of patients and cognitive tests
Twenty-six patients (18 female, 8 male) (mean age: 76.3 ± 6.5 years,
range: 60–89 years) suffering from AD were selected from the
department of Neurology (Poitiers University Hospital), according to
the NINCDS-ADRDA clinical criteria, and included in the study
along with 28 control subjects (21 female, 7 male) (mean age:
77.4 ± 7.2 years, range: 64–94 years) without neurological disor-
ders. All patients and controls gave their written informed consent for
the study. All control individuals had a Mini Mental Status
Examination (MMSE) above 25. AD patients had a MMSE below
26. Blood samples (20 mL) were drawn at the same time as MMSE
was performed. This study was approved by the regional ethics
committee of the Region Poitou-Charentes (France) (CCPPRB).
Preparation of lymphocyte cells
Peripheral venous blood was obtained from healthy volunteer donors
andAlzheimer patients.Mononuclear cells were isolated using Ficoll-
Histopaque 1077 (Sigma, Saint Quentin Fallavier, France) density
gradient centrifugation at 700 g for 20 min. The lymphocyte cells
obtained were then washed in RPMI 1640 (Gibco-BRL) and
re-suspended in 200 lL lysis buffer [50 mM Tris-HCl, 50 mM NaCl,
pH 6.8, 1% Triton X-100, 1% (v/v) protease inhibitor cocktail, 1%
(v/v) phosphatase inhibitor cocktail]. After homogenization, lysates
were sonicated for 2 min and centrifuged at 15 000 g for 15 min at
4�C. The supernatant fluid was analysed for protein content using a
protein assay kit (BioRad). Aliquots of 2 lg protein/lLwere frozen at
) 80�C until further analysis. As internal control, we used the same
protein sample obtained frommurine neuroblastoma cells (Neuro-2a).
Statistical analysis
Results are expressed as means with SEM. Data for multiple
variable comparisons were analysed by one-way analysis of
variance (ANOVA) or the non-parametric Kruskal–Wallis test. For
comparison of significance, Bonferroni’s test or Dunns’s test was
used as a post hoc test according to the statistical program GraphPad
Instat. For comparison of significance between two groups,
Student’s t-test was conducted. The level of significance was
p < 0.05. The Pearson correlation and linear regression between
p70S6k levels and MMSE scores was also analysed.
Results
Caspase 3 activation induced by 1–42 AbFigure 1a shows the results of caspase 3 activation inNeuro-2acells after exposure to Ab. After 8 h, there is a significant
Control
30m
in 2h 4h 8h 16h
24h 8h
0
50
100
150
***
1-42 40-1
Ph
osp
ho
-mT
OR
/mTO
R(%
ofc
on
tro
l)Neuro-2a
Neuro-2(a)
(b)
(c)
a
Neuro-2a
289 kDa
55 kDa
289 kDa
55 kDa
Phospho-mTOR
Tubulin
Tubulin
Total mTOR
289 kDa
55 kDa
289 kDa
55 kDa
30min 2h 4h 8h 16h 24h 8hContro
l
4h 8h0
100
200
300
400
1-42
*
Cas
pas
e-3
acti
vity
(% o
f co
ntr
ol)
Fig.1 (a) Neuro-2a cells were treated with Ab (20 lM) for 4 and 8 h
and caspase 3 activity analysed. The results are expressed as a
percentage of their corresponding control at each time (treated cells
and corresponding time controls). Results were obtained from three
independent experiments; *p < 0.05. (b) Detection of total and phos-
phorylated mTOR in differentiated murine Neuro-2a cells exposed to
Ab 1–42 peptide. After differentiation by 20 lM all-trans retinoic acid
for 2 days and treatment by 20 lM Ab 1–42 from 30 min to 24 h, cells
were lysed and subjected to western blotting. Untreated cells served
as controls. The first lane shown in the western blots corresponds to a
control culture at time 0. (c) Histograms represent the ratio between
the phosphorylated and the total forms of mTOR in Neuro-2a taken
from three independent experiments. Data are shown as fold of the
corresponding time control. The results in all treated cell cultures were
compared with the results in control cell cultures at the same time
(30 min and 2, 4, 8, 16 and 24 h); *p < 0.05 compared with the
respective control by one-way ANOVA followed by a Bonferroni’s test for
multiple comparisons. There is a clear decrease in phosphorylated
mTOR expression induced by Ab.
218 C. Lafay-Chebassier et al.
� 2005 International Society for Neurochemistry, J. Neurochem. (2005) 94, 215–225

increase in active caspase 3 in treated cells compared withcontrol cells, indicating that apoptosis pathways are triggeredby Ab in Neuro-2a cells. The activity of caspase 3 is aug-mented (174% of control) 4 h after Ab exposure. After 8 h, theactivity is 267% of controls and at the same time, inactivationof mTOR is around 70% of controls in Neuro-2a cells.
Inactivation of mTOR in neural cells induced by Abpeptide 1–42
Expression of mTOR was examined using polyclonalantibodies against its total and phosphorylated forms.Figure 1b shows a marked decrease in mTOR phosphoryla-tion when the differentiated murine neuroblastoma cells weretreated with 20 lM aggregated Ab 1–42 for various times.The ratio between the phosphorylated and the total forms isalready reduced (Fig. 1c) 30 min after the beginning ofexposure. This inactivation augments with time and is around75% in Neuro-2a cells after 24 h (*p < 0.05 compared withthe respective control). As a control, the non-toxic homo-logue Ab 40–1 did not enhance mTOR inactivation in cells.
Western blots also depicted the effects of Ab 1–42exposure on phosphorylated (Thr389 controlled by mTORsignalling) p70S6k expression in neural cells (Figs 2a and b).Analysis revealed that Ab 1–42 induced a progressivereduction of the ratio between the phosphorylated and thetotal forms of p70S6k. This inactivation is significant after24 h (*p < 0.05 compared with the respective control). As acontrol, the reverse peptide Ab 40–1 did not induce p70S6kinactivation in neural cells.
mTOR and p70S6k expression in transgenic mice
Antibody against p70S6k phosphorylated at Thr389 showedtwo positive bands corresponding to phosphorylated p70/p85 S6 kinases that are the cytosolic and nuclear isoforms,respectively. In mouse homogenates, we analysed only thesignal band at 70 kDa (Fig. 4). There was no difference inthe activation of mTOR and p70S6k (corresponding to theratio between phosphorylated and total forms of the kinases)between transgenic mice expressing human mutant APP751and control mice in cortex homogenates (Figs 3a and 4a). Incerebellum homogenates, an increased level of phosphoryl-ated mTOR and p70S6k was observed but was onlysignificant for p70S6k (increase: 34%, p < 0.01) (Figs 4band d). A significant decrease in mTOR activation wasobserved in the cortex (decrease: 34%) of APP/PS-1 double-transgenic mice expressing human mutant APP751 SL andhuman mutant presenilin-1 M146L compared with12-month-old control mice (Figs 3a and c). As shown inFig. 5, APP/PS-1 double-transgenic mice developed in thecortical regions extracellular Ab deposits (Fig. 5a) with veryintensively Ab-immunostained neurones (Fig. 5b). A reduc-tion in phosphorylated mTOR immunostaining was observedin cortical neurones of APP/PS-1 double-transgenic mice(Fig. 5d) compared with cortical neurones of control mice
showing mainly cytoplasmic localizations (Fig. 5c). In thecortex of APP/PS-1 double-transgenic mice, the inactivationof mTOR detected by western blots was associated with asignificant inactivation of p70S6k (decrease: 31%, Figs 4aand c). On the other hand, a large increase in mTORactivation was observed in cerebellum homogenates of APP/PS-1 double-transgenic mice (increase: 250% of the ratiophospho-mTOR/mTOR, p < 0.01) (Figs 3b and d) with anon-significant increase in the ratio phospho-p70S6k/p70S6k(Figs 4b and d). Morphological results confirmed thatphospho-mTOR immunostaining was clearly marked in thecerebellum of APP/PS1 transgenic mice (Fig. 5f).
Expression and phosphorylation of p70S6 kinase in
lymphocytes of Alzheimer patients
The expression and phosphorylation of p70S6 kinase(Thr389) was analysed by western blotting in lymphocytesof 28 control individuals and 26 Alzheimer patients (Figs 6a,
Contro
l
Phospho-p70S6K(T389)
Tubulin
Tubulin
30min 2h 4h 8h 16h 24h 8h
(a)
(b)
70 kDa
55 kDa
70 kDa
55 kDa
Total p70S6K
Contro
l
Neuro-2a
Neuro-2a
Control
30m
in 2h 4h 8h 16h
24h 8h
0
50
100
150
200
1-42 40-1
*
Ph
osp
ho
-p70
S6K
/p70
S6K
(% o
f co
ntr
ol)
Fig.2 (a) Detection of total and phosphorylated (Thr389 controlled by
mTOR signalling) p70S6k in differentiated murine Neuro-2a cells
exposed to Ab 1–42 peptide. After differentiation by 20 lM all-trans
retinoic acid for 2 days and treatment with 20 lM Ab 1–42 for various
times, cells were lysed and subjected to western blotting. Untreated
cells served as controls. The first lane shown in the western blots
corresponds to a control culture at time 0. (b) Histograms represent
the ratio between phosphorylated and total forms of p70S6k in Neuro-
2a and result from three independent experiments. Data are shown as
fold of the corresponding time control. The results in all treated cell
cultures were compared with the results in control cell cultures at the
same time (30 min, 2, 4, 8, 16 and 24 h). There is a clear decrease in
phosphorylated p70S6k expression induced by Ab.
mTOR/p70S6k signalling alteration by Ab 219
� 2005 International Society for Neurochemistry, J. Neurochem. (2005) 94, 215–225
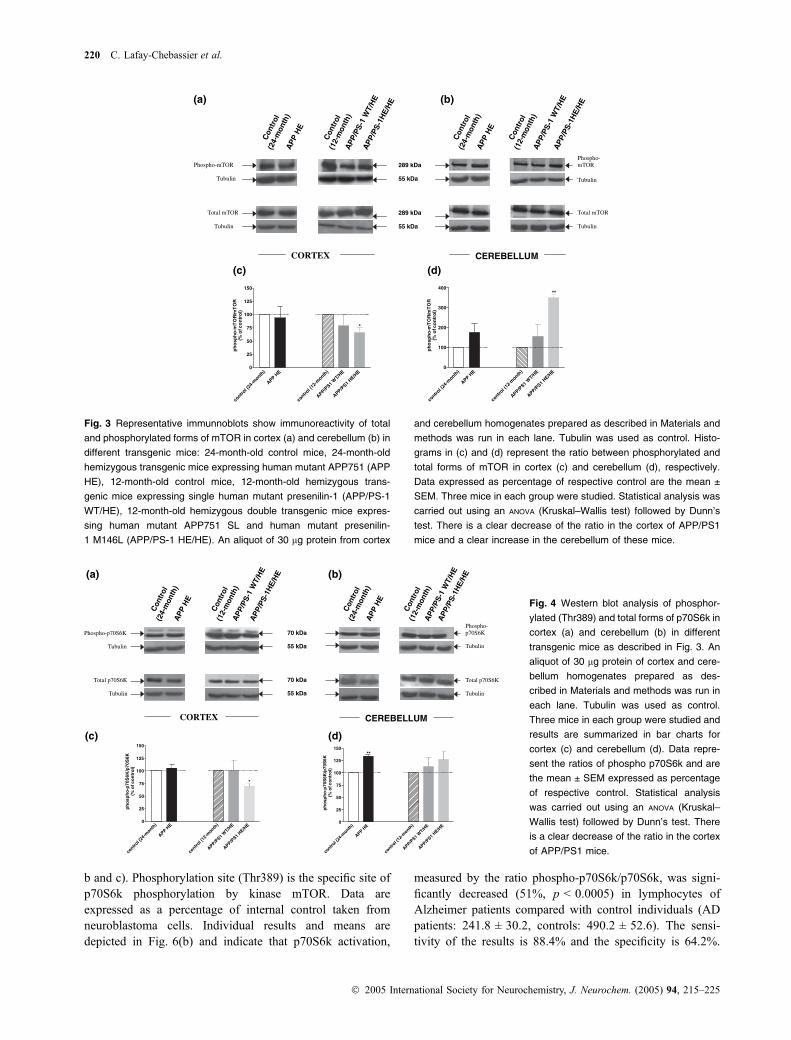
b and c). Phosphorylation site (Thr389) is the specific site ofp70S6k phosphorylation by kinase mTOR. Data areexpressed as a percentage of internal control taken fromneuroblastoma cells. Individual results and means aredepicted in Fig. 6(b) and indicate that p70S6k activation,
measured by the ratio phospho-p70S6k/p70S6k, was signi-ficantly decreased (51%, p < 0.0005) in lymphocytes ofAlzheimer patients compared with control individuals (ADpatients: 241.8 ± 30.2, controls: 490.2 ± 52.6). The sensi-tivity of the results is 88.4% and the specificity is 64.2%.
CORTEX
Phospho-p70S6K
Total p70S6K
Tubulin
Tubulin
70 kDa
70 kDa
55 kDa
55 kDa
(a) (b)
(d)(c)
Total p70S6K
Phospho-p70S6K
Tubulin
Tubulin
APP
HE
APP
HE
APP
/PS-
1W
T/H
EA
PP/P
S-1H
E/H
E
APP
/PS-
1W
T/H
E
APP
/PS-
1HE/
HE
Con
trol
(24-
mon
th)
Con
trol
(24-
mon
th)
Con
trol
(12-
mon
th)
Con
trol
(12-
mon
th)
CEREBELLUM
contro
l (24
-month
)
APPHE
contro
l (12
-month
)
APP/PS1 W
T/HE
APP/PS1 HE/H
E0
25
50
75
100
125
150
*
ph
osp
ho
-p70
S6K
/p70
S6K
(%o
fco
ntr
ol)
contro
l (24
-month
)
APPHE
contro
l (12
-month
)
APP/PS1 W
T/HE
APP/PS1 HE/H
E0
25
50
75
100
125
150**
ph
osp
ho
-p70
S6K
/p70
S6K
(%o
fco
ntr
ol)
Fig. 4 Western blot analysis of phosphor-
ylated (Thr389) and total forms of p70S6k in
cortex (a) and cerebellum (b) in different
transgenic mice as described in Fig. 3. An
aliquot of 30 lg protein of cortex and cere-
bellum homogenates prepared as des-
cribed in Materials and methods was run in
each lane. Tubulin was used as control.
Three mice in each group were studied and
results are summarized in bar charts for
cortex (c) and cerebellum (d). Data repre-
sent the ratios of phospho p70S6k and are
the mean ± SEM expressed as percentage
of respective control. Statistical analysis
was carried out using an ANOVA (Kruskal–
Wallis test) followed by Dunn’s test. There
is a clear decrease of the ratio in the cortex
of APP/PS1 mice.
CORT
(a) (b)
(d)(c)EX CEREBELLUM
Phospho-mTOR
Total mTOR
Tubulin
Tubulin
289 kDa
289 kDa
55 kDa
55 kDa
Phospho-mTOR
Total mTOR
Tubulin
Tubulin
APP
HE
APP
HE
APP
/PS-
1W
T/H
EA
PP/P
S-1H
E/H
E
APP
/PS-
1W
T/H
EA
PP/P
S-1H
E/H
E
Con
trol
(24-
mon
th)
Con
trol
(24-
mon
th)
Con
trol
(12-
mon
th)
Con
trol
(12-
mon
th)
contro
l (24
-mon
th)
APPHE
contro
l (12
-month
)
APP/PS1 W
T/HE
APP/PS1 HE/H
E0
25
50
75
100
125
150
*
ph
osp
ho
-mT
OR
/mT
OR
(%o
fco
ntr
ol)
contro
l (24
-month
)
APPHE
contro
l (12
-month
)
APP/PS1
WT/H
E
APP/PS1 HE/H
E0
100
200
300
400**
ph
osp
ho
-mT
OR
/mT
OR
(%o
fco
ntr
ol)
Fig. 3 Representative immunnoblots show immunoreactivity of total
and phosphorylated forms of mTOR in cortex (a) and cerebellum (b) in
different transgenic mice: 24-month-old control mice, 24-month-old
hemizygous transgenic mice expressing human mutant APP751 (APP
HE), 12-month-old control mice, 12-month-old hemizygous trans-
genic mice expressing single human mutant presenilin-1 (APP/PS-1
WT/HE), 12-month-old hemizygous double transgenic mice expres-
sing human mutant APP751 SL and human mutant presenilin-
1 M146L (APP/PS-1 HE/HE). An aliquot of 30 lg protein from cortex
and cerebellum homogenates prepared as described in Materials and
methods was run in each lane. Tubulin was used as control. Histo-
grams in (c) and (d) represent the ratio between phosphorylated and
total forms of mTOR in cortex (c) and cerebellum (d), respectively.
Data expressed as percentage of respective control are the mean ±
SEM. Three mice in each group were studied. Statistical analysis was
carried out using an ANOVA (Kruskal–Wallis test) followed by Dunn’s
test. There is a clear decrease of the ratio in the cortex of APP/PS1
mice and a clear increase in the cerebellum of these mice.
220 C. Lafay-Chebassier et al.
� 2005 International Society for Neurochemistry, J. Neurochem. (2005) 94, 215–225

This clear-cut decrease was due to a significant reduction inthe phosphorylated form of p70S6k. The scattergram(Fig. 6c) shows that the mean value of phospho-p70S6k(Thr389) expression alone was significantly decreased by74% in lymphocytes of Alzheimer patients compared withcontrol lymphocytes (AD patients: 49.2 ± 10.4; controls:188.0 ± 17.2; p < 0.0005).
Correlation between p70S6 kinase activation
in lymphocytes of Alzheimer patients and MMSE scores
Correlation and regression analyses were carried out toinvestigate the relations between p70S6k activation inlymphocytes of Alzheimer patients and MMSE scores. Thephospho-p70S6k/p70S6k ratio measured in Alzheimer
patients lymphocytes showed a significant correlation withMMSE scores (r ¼ 0.726; p < 0.0001; Fig. 7).
Discussion
Our results demonstrate that Ab exposure induces a sustainedreduction in mTOR/p70S6k signalling in neuroblastoma cell
d
(d)
(b)(a)
c
(f)(e)
(c)
Fig. 5 Immunohistochemical staining of paraffin-embedded mouse
brains showing expression of Ab (cortex: 5a and 5b) and phosphor-
ylated mTOR (cortex: 5c and 5d, cerebellum: 5e and 5f) using DAKO
ARK and EnVision systems, respectively, as described in Materials
and methods. (a) The extracellular accumulation of Ab deposits in
the brain of Thy-APP751 SL X PS-1M146L transgenic line (APP/PS-1
HE/HE). (b) Intense Ab staining in a cortical neurone of these double
transgenic mice. In (c) and (d), respectively, the expression of phos-
phorylated mTOR in the cortex of control mice (12 m) and an APP/PS-
1 HE/HE mouse is illustrated. A reduction of phosphorylated mTOR
staining was observed in double transgenic mice (d) compared with
control mice (c) where the expression of active mTOR is localized near
the nuclear membrane and in the plasma membrane of cortical neu-
rones indicated by arrowheads. In (e) and (f), respectively, immuno-
staining of phosphorylated mTOR in the cerebellum of a control mouse
and of an APP/PS-1 HE/HE mouse is shown. Horizontal bar in (a) ¼40 lm; (b), (c) and (d) ¼ 10 lm; (e) and (f) ¼ 20 lm.
controls alzheimer0
250
500
750
1000
1250
(a)
(b)
(c)
ph
osp
ho
-p70
S6K
/ p
70S
6K(%
of
inte
rnal
co
ntr
ol)
controls alzheimer0
100
200
300
400
ph
osp
ho
-p70
S6K
(T
389)
(% o
f in
tern
al c
on
tro
l)
phospho-p70S6K
actin
70 kDa
Alzheimer Controls
Alzheimer Controls
actin
total p70S6K
42 kDa
70 kDa
42 kDa
Internalcontrol
Internalcontrol
Fig. 6 Western blot analysis of p70S6k activation in lymphocytes of
control individuals and Alzheimer patients. The internal control cor-
responds to the result obtained in neuroblastoma cell cultures. Rep-
resentative immunnoblots of phospho-p70S6k (Thr389) and total
p70S6k expression is shown in lymphocytes of three control individ-
uals and three Alzheimer patients (a). The antibodies recognize spe-
cific bands of 70 kDa and 42 kDa for phospho-p70S6k (Thr389), total
p70S6k and actin, respectively. The bands were quantified by densi-
tometry and the results were expressed as percentage of internal
control (Neuro-2a cells). p70S6k activation, measured by the ratio
phospho-p70S6k/total p70S6k, is summarized as a scattergram (b).
Results of phospho-p70S6k (Thr 89) expression alone are shown in
(c). In (b) and (c), data are means ± SEM of 28 control individuals and
26 Alzheimer patients. The symbols represent the means of the group.
***p < 0.0005 statistical difference from control individuals (Student’s
t-test). (j) Control individuals; (m) Alzheimer patients.
mTOR/p70S6k signalling alteration by Ab 221
� 2005 International Society for Neurochemistry, J. Neurochem. (2005) 94, 215–225

cultures, marked by a progressive decrease in phosphorylatedmTOR and phosphorylated p70S6k. In addition, mTORsignalling is reduced in the cortex but not in the cerebellumof APP/PS-1 mutant transgenic mice and in lymphocytes ofAD patients compared with control individuals. Takentogether, these findings suggest that the inactivation ofmTOR/p70S6k pathway, which regulates cell growth andproliferation, protein translation and autophagy and isthought to transfer anti-apoptotic properties, could be afactor contributing to the degenerative process detected in thebrains of AD patients.
mTOR is known to phosphorylate p70S6k at Thr389, butother kinases such as ERK1/2 are able to phosphorylatep70S6k at Thr421/Ser424 (Dennis et al. 1998). In addition, arecent report showed that p70S6k could be activated not by alinear pathway from mTOR but by two separate pathwaystriggered by mTOR and PI3 kinase (Raught et al. 2001).This could explain the different activation profile observedfor mTOR and p70S6k dephosphorylation. This dephospho-rylation is not very rapid and complete as it was observedafter energy depletion in another cell culture system (Inokiet al. 2003). This difference is possibly linked to the slowtoxicity induced by Ab. We have previously demonstratedthat Ab 1–42 activates PKR, a kinase known to down-regulate protein translation, acting prior to mTOR intranslational control and leading to phosphorylation of theeukaryotic initiation factor 2a (eIF2a) and cellular apoptosis(Suen et al. 2003). Increased PKR signalling and reducedmTOR/p70S6k signalling are the combined consequences ofAb 1–42 exposure in neural cells. Previous reports haverevealed an increase in intracellular calcium following Abexposure (Mattson and Chan 2003). The role of calcium inPKR activation was also demonstrated in our previous study(Suen et al. 2003) and could be involved in the transient riseof p70S6k phosphorylation observed at 2 h because this
enzyme is known to be sensitive to variations in intracellularcalcium (Hannan et al. 2003). It is now known that mTOR isan oncogenic protein participating in cell growth andproliferation but with probable anti- and pro-apoptoticproperties that have been recently reviewed (Castedo et al.2002). In our neural cell system, the reduction in mTORphosphorylation occurred as early as 30 min to 2 h after Abexposure and was amplified over the following 24 h. Thisfinding could contribute to the neurotoxic and apoptoticproperties of Ab previously described in neural cells (Changet al. 2002b).
The immunohistochemical results showed a large numberof Ab)positive plaques in different regions of the centralnervous system including the cortex, as well as an increase inexpression of Ab inside neurones. As previously described,almost no neuronal degeneration was detected in the brainsof the transgenic mice at the opposite of what was in thebrain of AD patients. The changes in mTOR/p70S6ksignalling were only detected in APP/PS1 transgenic miceand not in transgenic mice expressing only human mutantAPP. Since both types of transgenic mice expressed Abplaques, it is possible to postulate that the augmentedexpression of Ab can only be partly responsible for thereduced mTOR/p70S6k signalling in the same regions.Presenilin (Culvenor et al. 1997) and mTOR (Drenan et al.2004) have been localized in the ER–Golgi network andmutated PS1 could contribute, together with Ab accumula-tion, to the reduced activity of mTOR/p70S6k in the brains ofthese APP/PS1 mice. A recent report has also noted thatmutated human PS1 down-regulates the PI3K/Akt pathwaywhich controls mTOR activity (Baki et al. 2004). We haveobserved a significant modification of mTOR phosphoryla-tion in the cerebellum of transgenic mice overexpressing thedouble APP/PS1 human mutations. In addition, usinghistological methods, we did not observe plaques or overtpositive Ab immunostaining in the cerebellum of theseanimals; this observation concurs with previously publisheddata assessing the same mice (Blanchard et al. 2003). Theincreased levels of phosphorylated mTOR observed in thecerebellum with western blots in APP-PS1 mice is associatedwith a lack of Ab accumulation. The reasons for thesebiochemical and histological findings are not known but itcan be assumed that specific molecular pathways in thecerebellum might prevent major extracellular and intracellu-lar Ab accumulations. Further studies will be necessary todetermine whether these two observations are linked and areimplicated in specific neuronal susceptibility of the corticalversus the cerebellar areas. In AD brains, only diffuseplaques and very few senile plaques have been described inthe cerebellum of patients with a faint morphological reactionin their microenvironment (Joachim et al. 1989). A recentreport has revealed that positive staining for phosphorylatedp70S6k on two sites (Thr389, Thr421/Ser424) was detectedin neurones of AD patients with increased brain levels. Only
0 5 10 15 20 25 300
250
500
750
1000
MMSE score
ph
osp
ho
-p70
S6K
/ p
70S
6K(%
of
inte
rnal
co
ntr
ol) r = .726
p< .0001
Fig. 7 p70S6 kinase activation in lymphocytes of Alzheimer patients
and correlation with Mini Mental Status Examination (MMSE) scores.
Expression of phospho-p70S6 kinase (Thr389) and total p70S6 kinase
was analysed by western blot in lymphocytes of 26 Alzheimer patients.
p70S6k activation measured by the ratio phospho-p70S6k/total
p70S6k was expressed as percentage of internal control and was
correlated with MMSE score of Alzheimer patients. p < 0.0001
(Pearson correlation). (m) Alzheimer patients.
222 C. Lafay-Chebassier et al.
� 2005 International Society for Neurochemistry, J. Neurochem. (2005) 94, 215–225

activated p70S6k expression at the Thr421/Ser424 site wascorrelated with levels of total tau and phosphorylated tau (Anet al. 2003). The phosphorylation of p70S6k on Thr421/Ser424 is linked to ERK1/ERK2 triggering and not to mTORactivation (Dufner and Thomas 1999). The molecularmechanisms leading to increased expression of phosphoryl-ated p70S6k on Thr389 in specific AD neurones could becomparable with those leading to the transient increasedactivity induced in vitro by Ab exposure in our cell culturesystem. Whether or not the staining of activated p70S6k(Thr389) in AD brains corresponds to specific modulation ofmTOR signalling activity or to another contributory factor inthese neurones remains to be determined.
We analysed the expression of phosphorylated p70S6k(Thr389) and total p70S6k in lymphocytes of patients andcontrol individuals. There was a clear reduction in the meanlevel of the ratio between phosphorylated p70S6k versustotal p70S6k. This difference was also detected for phos-phorylated p70S6k alone in AD patients as compared withcontrol subjects. This finding demonstrates that peripheralcells are marked by a decrease in the initiation phase ofprotein translation in patients suffering from AD. Manyprevious studies have demonstrated various biological dis-turbances in lymphocytes and other peripheral cells in ADpatients, including increased cytosolic free calcium levels(Gibson et al. 1987; Adunsky et al. 1991; Eckert et al. 1997;Palotas et al. 2002), an impairment of mitogenic proliferation(Stieler et al. 2001), an enhanced sensitivity to apoptosis(Eckert et al. 2001) and the presence of increased reactiveoxygen species (Mecocci et al. 2002). In line with the resultsof the present study, several of these observations could beeither the cause or the consequence of reduced translationalcontrol. Recent data have revealed that lymphocytes of ADpatients are less sensitive to the action of rapamycin, a potentantagonist of mTOR signalling, on cell cycle kinesis andproliferation (Nagy et al. 2002). We suggest that if themTOR/p70S6k signalling is already down-regulated in ADlymphocytes, the availability of the remaining activatedmTOR/p70S6k proteins is insufficient for proper rapamycinaction. The other interesting finding is that the reduction oftranslational control assessed by the ratio between activatedp70S6k versus total p70S6k is correlated with the cognitivedecline of patients evaluated by MMSE scores. In this study,we have only included AD patients with a MMSE scoreranging from 25 to 10; in these patients, memory anomaliesin the first phase of the disease are very often at the forefrontof clinical signs. mTOR has been experimentally associatedwith molecular mechanisms of long-term potentiation (LTP),and learning and memory (Cammalleri et al. 2003). In fact,rapamycin can experimentally modify these cognitive pro-cesses. If the translational control is altered in AD brains, thismodification could contribute to the onset of memoryimpairment observed in AD. As mentioned previously,protein synthesis appears to be reduced in AD brains. This
finding was also observed in experimental transient cerebralischaemia associated with a decrease in mTOR/p70S6ksignalling marked by reduced activated p70S6k expression(Mengesdorf et al. 2002).
We have previously shown that PKR levels are altered inhippocampal neurones of AD patients and are marked byincreased expression of phosphorylated PKR, suggestingthat protein translation is reduced in these neurones (Changet al. 2002a). It would be interesting to find out whether ornot the modifications of mTOR/p70S6k signalling inperipheral lymphocytes can reflect biological neuronaldisturbances associated with memory decline in ADpatients, and it can be assumed that a general alterationof translational control implicates various cell types in ADmodels and in the cells of AD patients, including neuronesand peripheral lymphocytes.
In summary, it is not yet known whether the down-regulation of mTOR/p70S6k signalling observed in lympho-cytes is also present in the brains and neurones of ADpatients. Cellular and transgenic AD models have revealeddown-regulated mTOR/p70S6k signalling, and further stud-ies will have to determine the contribution of this disturbedsignalling to neuronal degeneration. The mTOR/p70S6kpathway, which is already at the centre of active anti-cancerresearch (Bjornsti and Houghton 2004), could also representa new target for future therapeutic approaches and neuro-protection in AD, as well as in other neurodegenerativedisorders.
Acknowledgements
The authors would like to thank Raymond Poncharaud and Brigitte
Vidal for technical help, Claudette Pluchon, Bernard Fauconneau
and Alain Piriou for useful advice, and Andre Brizard for scientific
support. This study was supported by the CHU de Poitiers with a
grant from the French Ministry of Health (PHRC) and by the
University of Poitiers and the French Ministry of Education and
Research, with a grant to the Research Unit EA 3808.
References
Adunsky A., Baram D., Hershkowitz M. and Mekori Y. A. (1991)Increased cytosolic free calcium in lymphocytes of Alzheimerpatients. J. Neuroimmunol. 33, 167–172.
Alirezaei M., Nairn A. C., Glowinski J., Premont J. and Marin P. (1999)Zinc inhibits protein synthesis in neurons. Potential role of phos-phorylation of translation initiation factor-2alpha. J. Biol. Chem.274, 32433–32438.
An W. L., Cowburn R. F., Li L., Braak H., Alafuzoff I., Iqbal K., Iqbal I.G., Winblad B. and Pei J. J. (2003) Up-regulation of phosphor-ylated/activated p70, S6 kinase and its relationship to neurofibril-lary pathology in Alzheimer’s disease. Am. J. Pathol. 163,591–607.
Baki L., Shioi J., Wen P., Shao Z., Schwarzman A., Gama-Sosa M.,Neve R. and Robakis N. K. (2004) PS1 activates PI3K thusinhibiting GSK-3 activity and tau overphosphorylation: effects ofFAD mutations. EMBO J. 23, 2586–2596.
mTOR/p70S6k signalling alteration by Ab 223
� 2005 International Society for Neurochemistry, J. Neurochem. (2005) 94, 215–225

Bjornsti M. A. and Houghton P. J. (2004) The TOR pathway: a target forcancer therapy. Nat. Rev. Cancer 4, 335–348.
Blanchard V., Moussaoui S., Czech C. et al. (2003) Time sequence ofmaturation of dystrophic neurites associated with Abeta deposits inAPP/PS1 transgenic mice. Exp. Neurol. 184, 247–263.
Bolster D. R., Crozier S. J. and Jefferson L. S. (2002) AMP-activatedprotein kinase suppresses protein synthesis in rat skeletal musclethrough down-regulated mammalian target of rapamycin (mTOR)signaling. J. Biol. Chem. 277, 23977–23980.
Cammalleri M., Lutjens R., Berton F., King A. R., Simpson C.,Francesconi W. and Sanna P. P. (2003) Time-restricted role fordendritic activation of the mTOR-p70S6k pathway in the inductionof late-phase long-term potentiation in the CA1. Proc. Natl Acad.Sci. USA 100, 14 368–14 373.
Castedo M., Ferri K. F. and Kroemer G. (2002) Mammalian target ofrapamycin (mTOR): pro- and anti-apoptotic. Cell Death Differ. 2,99–100.
Chang R. C., Wong A. K., Ng H. K. and Hugon J. (2002a) Phos-phorylation of eukaryotic initiation factor-2alpha (eIF2alpha) isassociated with neuronal degeneration in Alzheimer’s disease.Neuroreport 13, 2429–2432.
Chang R. C. C., Suen K. C., Ma C. H., Elyaman W., Ng H. K. andHugon J. (2002b) Involvement of double-stranded RNA-depend-ent protein kinase and phosphorylation of eukaryotic initiationfactor-2alpha in neuronal degeneration. J. Neurochem. 83,1215–1225.
Clemens M. J. (2001) Translation regulation in cell stress and apoptosis.Roles of the eIF4E binding proteins. J. Cell. Mol. Med. 5, 221–239.
Culvenor J. G., Maher F., Evin G. et al. (1997) Alzheimer’s disease-associated presenilin 1 in neuronal cells: evidence for localizationto the endoplasmic reticulum-Golgi intermediate compartment.J. Neurosci. Res. 49, 719–731.
DeGracia D. J., Adamczyk S., Folbe A. J. et al. (1999) Eukaryotic ini-tiation factor 2alpha kinase and phosphatase activity during pos-tischemic brain reperfusion. Exp. Neurol. 155, 221–227.
Dennis P. B., Pullen N., Pearson R. B., Kozma S. C. and Thomas G.(1998) Phosphorylation sites in the auto-inhibitory domain parti-cipate in p70 (s6k) activation loop phosphorylation. J. Biol. Chem.273, 14 845–14 852.
Drenan R. M., Liu X., Bertram P. G. and Zheng X. F. (2004) FKBP12-rapamycin-associated protein or mammalian target of rapamycin(FRAP/mTOR) localization in the endoplasmic reticulum and theGolgi apparatus. J. Biol. Chem. 279, 772–778.
Dufner A. and Thomas G. (1999) Ribosomal S6 kinase signaling and thecontrol of translation. Exp. Cell Res. 253, 100–109.
Eckert A., Forstl H., Zerfass R., Hennerici M. and Muller W. E. (1997)Free intracellular calcium in peripheral cells in Alzheimer’s dis-ease. Neurobiol. Aging 18, 281–284.
Eckert A., Oster M., Zerfass R., Hennerici M. and Muller W. E. (2001)Elevated levels of fragmented DNA nucleosomes in native andactivated lymphocytes indicate an enhanced sensitivity to apoptosisin sporadic Alzheimer’s disease. Specific differences to vasculardementia. Dement. Geriatr. Cogn. Disord. 12, 98–105.
Ferrer I. (2002) Differential expression of phosphorylated translationinitiation factor 2 alpha in Alzheimer’s disease and Creutzfeldt-Jakob’s disease. Neuropathol. Appl. Neurobiol. 28, 441–451.
Frerichs K. U., Smith C. B., Brenner M., DeGracia D. J., Krause G. S.,Marrone L., Dever T. E. and Hallenbeck J. M. (1998) Suppressionof protein synthesis in brain during hibernation involves inhibitionof protein initiation and elongation. Proc. Natl Acad. Sci. USA 95,14511–14516.
Gao X., Zhang Y., Arrazola P., Hino O., Kobayashi T., Yeung R. S., RuB. and Pan D. (2002) Tsc tumour suppressor proteins antagonizeamino-acid-TOR signaling. Nat. Cell Biol. 4, 699–704.
Gibson G. E., Nielsen P., Sherman K. A. and Blass J. P. (1987)Diminished mitogen-induced calcium uptake by lymphocytes fromAlzheimer patients. Biol. Psychiatr. 22, 1079–1086.
Hannan K. M., Thomas G. and Pearson R. B. (2003) Activation of S6K1(p70 ribosomal protein S6 kinase 1) requires an initial calcium-dependent priming event involving formation of a high-molecular-mass signalling complex. Biochem. J. 370, 469–477.
Harding H. P., Zhang Y. and Ron D. (1999) Protein translation andfolding are coupled by an endoplasmic-reticulum-resident kinase.Nature 397, 271–274.
Inoki K., Zhu T. and Guan K. L. (2003) TSC2 mediates cellular energyresponse to control cell growth and survival. Cell 115, 577–590.
Jeffrey I. W., Bushell M., Tilleray V. J., Morley S. and Clemens M. J.(2002) Inhibition of protein synthesis in apoptosis: differentialrequirements by the tumor necrosis factor alpha family and a DNA-damaging agent for caspases and the double-stranded RNA-dependent protein kinase. Cancer Res. 62, 2272–2280.
Joachim C. L., Morris J. H. and Selkoe D. J. (1989) Diffuse senileplaques occur commonly in the cerebellum in Alzheimer’s disease.Am. J. Pathol. 135, 309–319.
Johnson G., Gotlib J., Haroutunian V., Bierer L., Nairn A. C., Merril C.and Wallace W. (1992) Increased phosphorylation of elongationfactor 2 in Alzheimer’s disease. Brain Res. Mol. Brain Res. 15,319–326.
Kimball S. R., Vary T. C. and Jefferson L. S. (1992) Age-dependentdecrease in the amount of eukaryotic initiation factor 2 in variousrat tissues. Biochem. J. 286, 263–268.
Ladiges W., Morton J., Blakely C. and Gale M. (2000) Tissue specificexpression of PKR protein kinase in aging B6D2F1 mice. Mech.Ageing Dev. 114, 123–132.
Langstrom N. S., Anderson J. P., Lindroos H. G., Winblad B. and WallaceW. C. (1989) Alzheimer’s disease-associated reduction of polysomalmRNA translation. Brain Res. Mol. Brain Res. 5, 259–269.
Luo H., Duguid W., Chen H., Maheu M. and Wu J. (1994) The effect ofrapamycin on T cell development in mice. Eur. J. Immunol. 24,692–701.
Mattson M. P. and Chan S. L. (2003) Neuronal and glial calcium sign-aling in Alzheimer’s disease. Cell. Calcium 34, 385–397.
Mecocci P., Polidori M. C., Cherubini A. et al. (2002) Lymphocyteoxidative DNA damage and plasma antioxidants in Alzheimer’sdisease. Arch. Neurol. 59, 794–798.
Mengesdorf T., Proud C. G., Mies G. and Paschen W. (2002) Mecha-nisms underlying suppression of protein synthesis induced bytransient focal cerebral ischemia in mouse brain. Exp. Neurol. 177,538–546.
Nagy Z., Combrinck M., Budge M. and McShane R. (2002) Cell cyclekinesis in lymphocytes in the diagnosis of Alzheimer’s disease.Neurosci. Lett. 317, 81–84.
Nguyen P. V. (2002) Protein synthesis during LTP: linking synapticactivity to translation. Trends Neurosci. 25, 4.
Palotas A., Kalman J., Palotas M., Juhasz A., Janka Z. and Penke B.(2002) Beta-amyloid-induced increase in the resting intracellularcalcium concentration gives support to tell Alzheimer lymphocytesfrom control ones. Brain Res. Bull. 58, 203–205.
Peel A. L., Rao R. V., Cottrell B. A., Hayden M. R., Ellerby L. M. andBredesen D. E. (2001) Double-stranded RNA-dependent proteinkinase, PKR, binds preferentially to Huntington’s disease (HD)transcripts and is activated in HD tissue. Hum. Mol. Genet. 10,1531–1538.
Rattan S. I. (1996) Synthesis, modifications, and turnover of proteinsduring aging. Exp. Gerontol. 31, 33–47.
Raught B., Gingras A. C. and Sonenberg N. (2001) The target ofrapamycin (TOR) proteins. Proc. Natl Acad. Sci. USA 98, 7037–7044.
224 C. Lafay-Chebassier et al.
� 2005 International Society for Neurochemistry, J. Neurochem. (2005) 94, 215–225

Schmelzle T. and Hall M. N. (2000) mTOR, a central controller of cellgrowth. Cell 103, 253–262.
Stieler J. T., Lederer C., Bruckner M. K., Wolf H., Holzer M., Gertz H. J.and Arendt T. (2001) Impairment of mitogenic activation of per-ipheral blood lymphocytes in Alzheimer’s disease. Neuroreport 12,3969–3972.
Suen K. C., Yu M. S., So K. F., Chang R. C. and Hugon J. (2003)Upstream signaling pathways leading to the activation of double-stranded RNA-dependent serine/threonine protein kinase in beta-amyloid peptide neurotoxicity. J. Biol. Chem. 278, 49819–49827.
Tang S. J., Reis G., Kang H., Gingras A. C., Sonenberg N. and SchumanE. M. (2002) A rapamycin-sensitive pathway contributes to long-
term synaptic plasticity in the hippocampus. Proc. Natl Acad. Sci.USA 99, 467–472.
Williams B. R. (1999) PKR; a sentinel kinase for cellular stress.Oncogene 18, 6112–6120.
Wirths O., Multhaup G., Czech C., Blanchard V., Tremp G., Pradier L.,Beyreuther K. and Bayer T. A. (2001) Reelin in plaques of beta-amyloid precursor protein and presenilin-1 double-transgenic mice.Neurosci. Lett. 316, 145–148.
Xu Z. and Williams B. R. (2000) The B56alpha regulatory subunit ofprotein phosphatase 2A is a target for regulation by double-stran-ded RNA-dependent protein kinase PKR. Mol. Cell Biol. 20,5285–5299.
mTOR/p70S6k signalling alteration by Ab 225
� 2005 International Society for Neurochemistry, J. Neurochem. (2005) 94, 215–225