M/s NTPC Ltd. - Environmental Clearance
83
TRAFFIC STUDY INCLUDING ASSESSMENT OF ITS IMPACTS DUE TO TRANSPORTATION OF COAL BY ROAD FROM 1. MINES OF MCL (KULDA, BASUNDHRA, SAMLESHWARI, LAJKURA, LAKHANPUR, LILARI AND BELPAHAR MINE) 2. MINES OF SECL (BAROUD AND JAMPALI MINE) 3. DULANGA COAL MINING PROJECT OF NTPC LTD. 4. MINES OF MCL (SAMLESHWARI, LAJKURA, BASUNDHARA, KULDA, BELPAHAR, LAKHANPUR, LILARI) & SECL MINES (CHHAL, GARE PALMA, BISRAMPUR, BHATGAON, BAIKUNTHPUR, CHIRMIRI, HASDEO, JAMUNA KOTMA, SOHAGOUR, JOHILLA AREAS) TO KOTARLIYA RAILWAY SIDING AND BHUPDEOPUR RAILWAY SIDING BY RAIL AND FROM THE SIDING TO LARA STPP BY ROAD TO LARA STPP (2 X 800 MW) AT TEHSIL PUSSORE, DISTRICT RAIGARH, CHHATTISGARH OF M/s NTPC Ltd. JULY, 2018 (Issue 01, Rev. 0) Prepared by: MIN MEC CONSULTANCY PVT. LTD. A-121, Paryavaran Complex, IGNOU Road, New Delhi – 110 030 Ph : 29534777, 29532236, 29535891 ; Fax: +91-11-29532568 Email :[email protected]; Web site : http://www.minmec.co.in Estb. 1983 An ISO 9001:2008 approved company
-
Upload
khangminh22 -
Category
Documents
-
view
1 -
download
0
Transcript of M/s NTPC Ltd. - Environmental Clearance
TRAFFIC STUDY INCLUDING ASSESSMENT OF ITS IMPACTS DUE TO TRANSPORTATION OF COAL BY ROAD
FROM
1. MINES OF MCL (KULDA, BASUNDHRA, SAMLESHWARI, LAJKURA, LAKHANPUR, LILARI AND BELPAHAR MINE)
2. MINES OF SECL (BAROUD AND JAMPALI MINE)
3. DULANGA COAL MINING PROJECT OF NTPC LTD.
4. MINES OF MCL (SAMLESHWARI, LAJKURA, BASUNDHARA, KULDA, BELPAHAR, LAKHANPUR, LILARI) & SECL MINES (CHHAL, GARE PALMA, BISRAMPUR, BHATGAON, BAIKUNTHPUR, CHIRMIRI, HASDEO, JAMUNA KOTMA, SOHAGOUR, JOHILLA AREAS) TO KOTARLIYA RAILWAY SIDING AND BHUPDEOPUR RAILWAY SIDING BY RAIL AND FROM THE SIDING TO LARA STPP BY ROAD
TO
LARA STPP (2 X 800 MW)
AT TEHSIL PUSSORE, DISTRICT RAIGARH,
CHHATTISGARH
OF
M/s NTPC Ltd.
JULY, 2018 (Issue 01, Rev. 0)
Prepared by:
M I N M E C C O N S U L T AN C Y P V T . L T D . A - 1 2 1 , P a r y a v a r a n C o m p l e x , I G N O U R o a d , N e w D e l h i – 1 1 0 0 3 0 Ph : 29534777, 29532236, 29535891 ; Fax : +91-11-29532568 E m a i l : m i n _ m e c @ v s n l . c o m ; W e b s i t e : http:/ /www.minmec.co. in
EEssttbb.. 11998833
An ISO 9001:2008
approved company
Min Mec Consultancy Pvt. Ltd.
Assessment of Impacts Due to Transportation of Coal for Lara STPP of NTPC Ltd. i
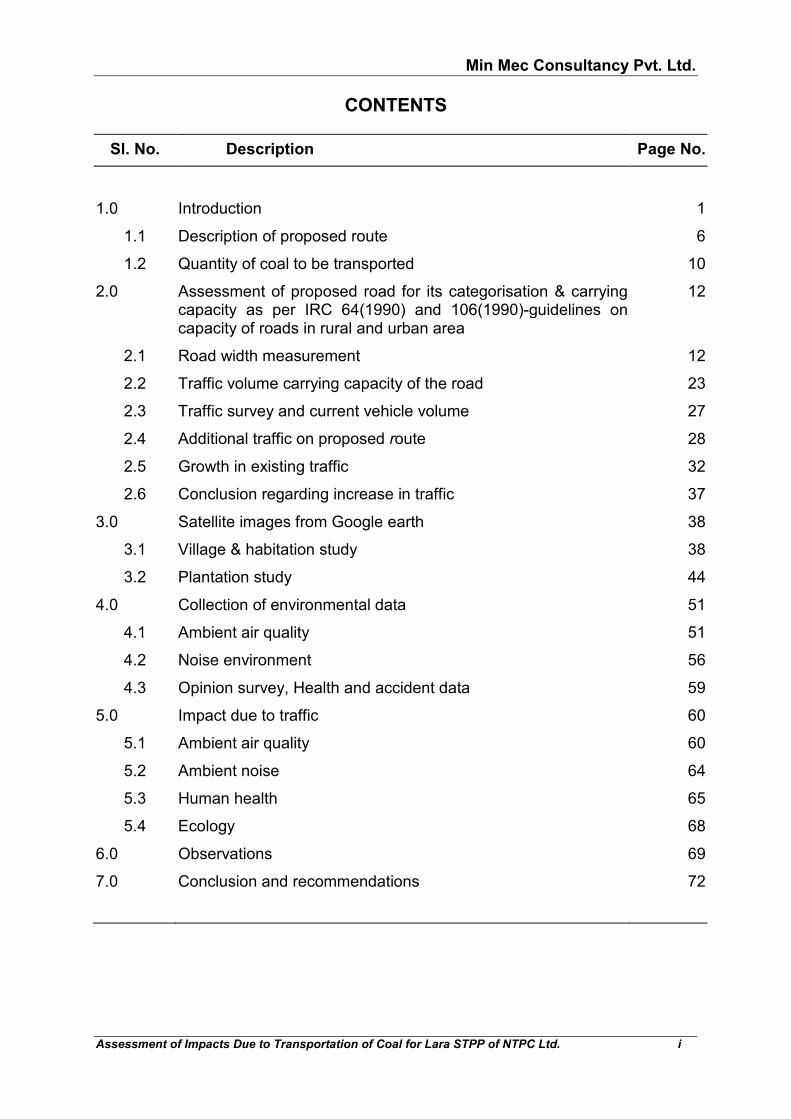
CONTENTS
Sl. No. Description Page No.
1.0 Introduction 1
1.1 Description of proposed route 6
1.2 Quantity of coal to be transported 10
2.0 Assessment of proposed road for its categorisation & carrying capacity as per IRC 64(1990) and 106(1990)-guidelines on capacity of roads in rural and urban area
12
2.1 Road width measurement 12
2.2 Traffic volume carrying capacity of the road 23
2.3 Traffic survey and current vehicle volume 27
2.4 Additional traffic on proposed route 28
2.5 Growth in existing traffic 32
2.6 Conclusion regarding increase in traffic 37
3.0 Satellite images from Google earth 38
3.1 Village & habitation study 38
3.2 Plantation study 44
4.0 Collection of environmental data 51
4.1 Ambient air quality 51
4.2 Noise environment 56
4.3 Opinion survey, Health and accident data 59
5.0 Impact due to traffic 60
5.1 Ambient air quality 60
5.2 Ambient noise 64
5.3 Human health 65
5.4 Ecology 68
6.0 Observations 69
7.0 Conclusion and recommendations 72
Min Mec Consultancy Pvt. Ltd.
Assessment of Impacts Due to Transportation of Coal for Lara STPP of NTPC Ltd. ii
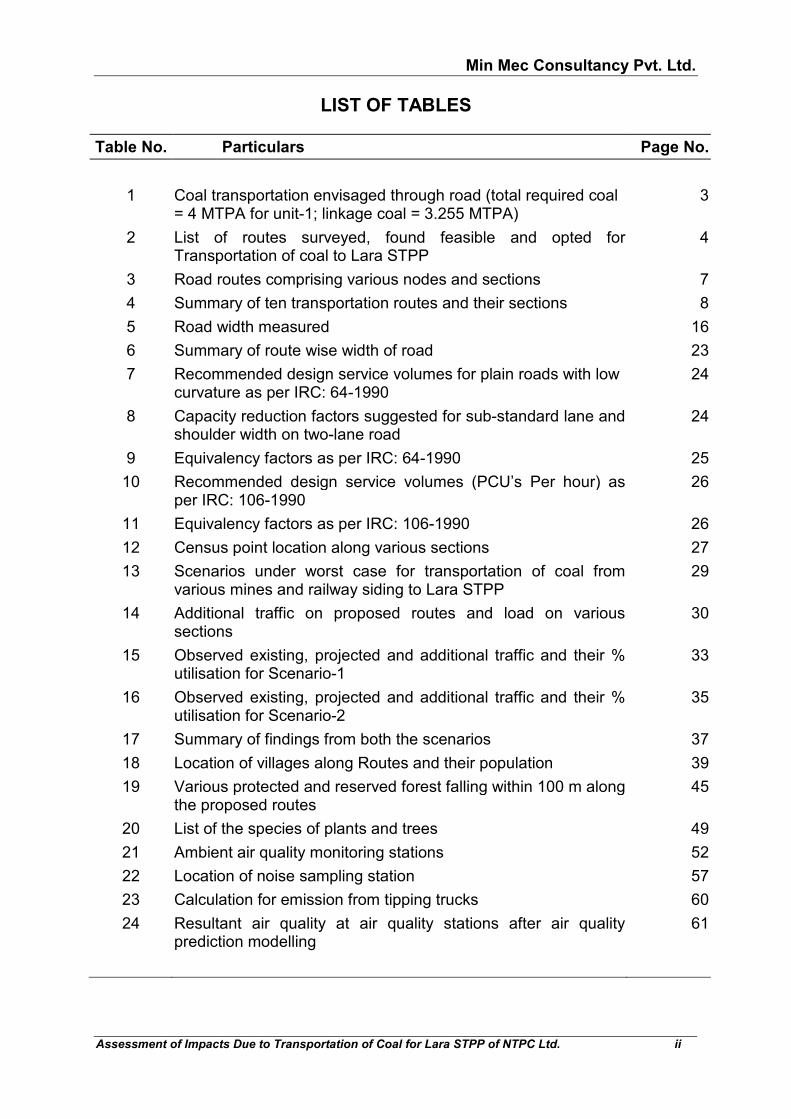
LIST OF TABLES
Table No. Particulars Page No.
1 Coal transportation envisaged through road (total required coal = 4 MTPA for unit-1; linkage coal = 3.255 MTPA)
3
2 List of routes surveyed, found feasible and opted for Transportation of coal to Lara STPP
4
3 Road routes comprising various nodes and sections 7
4 Summary of ten transportation routes and their sections 8
5 Road width measured 16
6 Summary of route wise width of road 23
7 Recommended design service volumes for plain roads with low curvature as per IRC: 64-1990
24
8 Capacity reduction factors suggested for sub-standard lane and shoulder width on two-lane road
24
9 Equivalency factors as per IRC: 64-1990 25
10 Recommended design service volumes (PCU’s Per hour) as per IRC: 106-1990
26
11 Equivalency factors as per IRC: 106-1990 26
12 Census point location along various sections 27
13 Scenarios under worst case for transportation of coal from various mines and railway siding to Lara STPP
29
14 Additional traffic on proposed routes and load on various sections
30
15 Observed existing, projected and additional traffic and their % utilisation for Scenario-1
33
16 Observed existing, projected and additional traffic and their % utilisation for Scenario-2
35
17 Summary of findings from both the scenarios 37
18 Location of villages along Routes and their population 39
19 Various protected and reserved forest falling within 100 m along the proposed routes
45
20 List of the species of plants and trees 49
21 Ambient air quality monitoring stations 52
22 Location of noise sampling station 57
23 Calculation for emission from tipping trucks 60
24 Resultant air quality at air quality stations after air quality prediction modelling
61

Min Mec Consultancy Pvt. Ltd.
Assessment of Impacts Due to Transportation of Coal for Lara STPP of NTPC Ltd. iii
LIST OF FIGURES
Fig. No. Particulars Page No.
1 Proposed route opted for transportation of coal from MCL & SECL mines, railway sidings and Dulanga CMP to Lara STPP
5
2 Proposed route alignment from MCL & SECL mines, railway sidings and Dulanga CMP to Lara STPP with location codes of road measurement & traffic census points
11
3 Part I - Line diagram of road width 14
Part II Line diagram of road width 15
4 Villages along transportation route 43
5 Part I - forests along transportation route 47
Part II - forests along transportation route 48
6 Part I - Location of air and noise sampling stations 54
Part II - Location of air and noise sampling stations 55
7 Under construction road by PWD 71
8 Different vehicles on the road 71
9 Green belt along route 72
LIST OF ANNEXURES
Annexure No. Particulars
1 Environmental Clearance was granted to Lara STPP vide letter no. J 13012/79/2007-IA.II (T) dated December 13, 2012
1A Amendment in Environment clearance (EC) for Lara STPP, Stage-I
2 Photographs of road width measurement locations
3 Photographs of census point locations
4 Traffic census data
5 Satellite images extracted from Google Earth
6 Air quality dispersion modelling
7 Bridge linkage letters
8 Extract of MOM of Expert Appraisal Committee (Thermal), MOEF&CC, New Delhi on 30.08.2017

Min Mec Consultancy Pvt. Ltd.
Assessment of Impacts Due to Transportation of Coal for Lara STPP of NTPC Ltd. iv
ABBREVIATIONS
DSV - Design Service Volume
MC - Maximum Capacity
HMV - Heavy Motor Vehicles
LMV - Light Motor Vehicles
PWD - Public Works Department
IRC - Indian Road Congress
STPP - Super Thermal Power Project
TPD - Tonnes per Day
MW - Mega Watt
PCU - Passenger Car Units
MoEF&CC - Ministry of Environment, Forest and Climate Change
US EPA - United States Environment Protection Agency
MMRDL - Min Mec R&D Laboratory
CMP - Coal Mining Project
EC - Environmental Clearance
FC - Forest Clearance
TLCMP - Talaipali Coal Mining Project
NTPC - National Thermal Power Corporation
MoC - Ministry of Coal
MCL - Mahanadi Coalfields Ltd.
SECL - South Eastern Coalfields Ltd.
MTPA - Million Tonnes Per Annum
CMP - Coal Mine Project

Min Mec Consultancy Pvt. Ltd.
Assessment of Impacts Due to Transportation of Coal for Lara STPP of NTPC Ltd. 1
1.0 INTRODUCTION NTPC Limited is installing Lara Super Thermal Power Project (STPP) of
1600 MW (2x800 MW) capacity at village Chhapora, Tehsil Pussore, District Raigarh in Chhattisgarh.
The coal linkage for the project is established from Talaipalli Coal Mining Project (TLCMP) of NTPC. Environmental Clearance (EC) and Forest Clearance (FC) for TLCMP have already been accorded by MoEF&CC. However, as per the Hon’ble Supreme Court’s order, the coal block was de-allocated on 24.09.2014 and later on re-allocated on 08.09.2015. This has delayed the production plan from TLCMP. As per the Commencement Plan submitted to Ministry of Coal (MoC), coal production from this block shall commence by November, 2019. In order to cater to the coal requirement of Lara STPP, Ministry of Coal vide letter dated 02.06.2016 has granted a “Bridge Linkage” for both the Units of Stage-1 (2X800 MW) of Lara STPP, from MCL (5.67 MTPA) & SECL Mines (0.832 MTPA) without specifying the mines. For Unit-1 (800 MW), maximum 3.255 MTPA shall be linked. The related extract of bridge linkage letter is given in Annexure 7. Bridge linkage will expire on 07.09.2018. However, Ministry of Coal (MoC), Government of India vide letter dated 15.05.2018 has recommended that the bridge linkage may be extended upto 2022 and shall be on tapering basis from 2019 to 2022 as per the approved Mine Plan of TLCMP. Related extract of the recommendation is attached as Annexure 7A.
Environmental Clearance was accorded to Lara STPP vide letter no. J-
13012/79/ 2007-IA.II (T) dated December 13, 2012. A copy of EC letter has been attached as Annexure 1. Point no. 4 of specific condition of EC letter, states that coal transportation shall be only by rail and transportation shall not be permitted by road.
Accordingly, amendment in EC for Lara STPP, Stage-I was obtained vide
MoEF&CC’s letter no. J-13012/79/2007-IA.II(T) dated 26.04.2017 (hereafter referred as “Amendment proposal -1” and copy given in Annexure 1A) for operation of one unit only for change in source of coal and its temporary transportation through road for 6913 Tonnes/Day from MCL’s Lakhanpur Coal Block. The permission received through the amendment letter was valid till 25.04.2018.
Subsequently, NTPC proposed to transport the coal from (i) Baroud and
Jampali Mines of SECL to Lara STPP by road and (ii) mines of MCL (Samleshwari, Lajkura, Basundhara, Kulda, Belpahar, Lakhanpur, Lilari) & SECL Mines (Chhal, Gare Palma, Bisrampur, Bhatgaon, Baikunthpur, Chirmiri, Hasdeo, Jamuna Kotma, Sohagour, Johilla Areas) to Kotarliya railway siding by rail and from Kotarliya railway siding to Lara STPP by road. Hereafter, this proposal may be referred as “Amendment proposal-2”.
Min Mec Consultancy Pvt. Ltd.
Assessment of Impacts Due to Transportation of Coal for Lara STPP of NTPC Ltd. 2
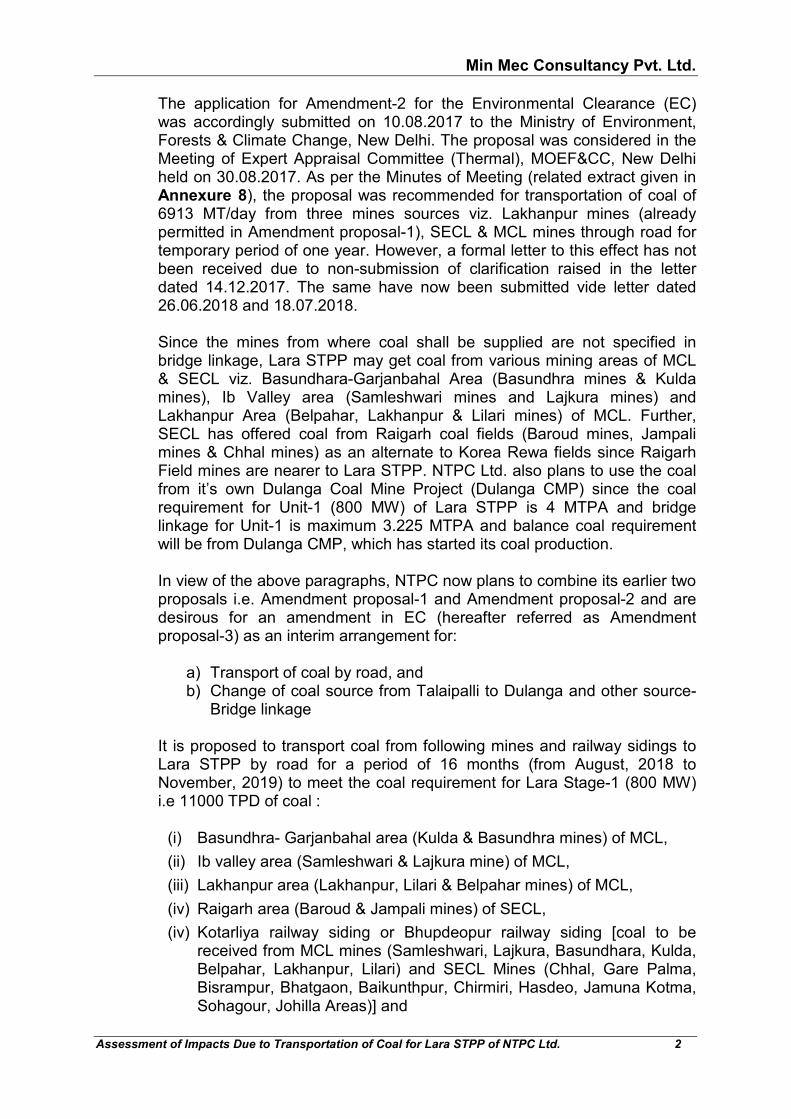
The application for Amendment-2 for the Environmental Clearance (EC) was accordingly submitted on 10.08.2017 to the Ministry of Environment, Forests & Climate Change, New Delhi. The proposal was considered in the Meeting of Expert Appraisal Committee (Thermal), MOEF&CC, New Delhi held on 30.08.2017. As per the Minutes of Meeting (related extract given in Annexure 8), the proposal was recommended for transportation of coal of 6913 MT/day from three mines sources viz. Lakhanpur mines (already permitted in Amendment proposal-1), SECL & MCL mines through road for temporary period of one year. However, a formal letter to this effect has not been received due to non-submission of clarification raised in the letter dated 14.12.2017. The same have now been submitted vide letter dated 26.06.2018 and 18.07.2018.
Since the mines from where coal shall be supplied are not specified in
bridge linkage, Lara STPP may get coal from various mining areas of MCL & SECL viz. Basundhara-Garjanbahal Area (Basundhra mines & Kulda mines), Ib Valley area (Samleshwari mines and Lajkura mines) and Lakhanpur Area (Belpahar, Lakhanpur & Lilari mines) of MCL. Further, SECL has offered coal from Raigarh coal fields (Baroud mines, Jampali mines & Chhal mines) as an alternate to Korea Rewa fields since Raigarh Field mines are nearer to Lara STPP. NTPC Ltd. also plans to use the coal from it’s own Dulanga Coal Mine Project (Dulanga CMP) since the coal requirement for Unit-1 (800 MW) of Lara STPP is 4 MTPA and bridge linkage for Unit-1 is maximum 3.225 MTPA and balance coal requirement will be from Dulanga CMP, which has started its coal production.
In view of the above paragraphs, NTPC now plans to combine its earlier two
proposals i.e. Amendment proposal-1 and Amendment proposal-2 and are desirous for an amendment in EC (hereafter referred as Amendment proposal-3) as an interim arrangement for:
a) Transport of coal by road, and b) Change of coal source from Talaipalli to Dulanga and other source-
Bridge linkage It is proposed to transport coal from following mines and railway sidings to Lara STPP by road for a period of 16 months (from August, 2018 to November, 2019) to meet the coal requirement for Lara Stage-1 (800 MW) i.e 11000 TPD of coal :
(i) Basundhra- Garjanbahal area (Kulda & Basundhra mines) of MCL,
(ii) Ib valley area (Samleshwari & Lajkura mine) of MCL,
(iii) Lakhanpur area (Lakhanpur, Lilari & Belpahar mines) of MCL,
(iv) Raigarh area (Baroud & Jampali mines) of SECL,
(iv) Kotarliya railway siding or Bhupdeopur railway siding [coal to be received from MCL mines (Samleshwari, Lajkura, Basundhara, Kulda, Belpahar, Lakhanpur, Lilari) and SECL Mines (Chhal, Gare Palma, Bisrampur, Bhatgaon, Baikunthpur, Chirmiri, Hasdeo, Jamuna Kotma, Sohagour, Johilla Areas)] and

Min Mec Consultancy Pvt. Ltd.
Assessment of Impacts Due to Transportation of Coal for Lara STPP of NTPC Ltd. 3
(v) Dulanga CMP of NTPC Ltd. The earlier two amendment proposals and the third amendment proposal
for coal transportation envisaged through road to meet the demand of the 800 MW Unit-1 of NTPC Lara STPP till its captive Talaipali Coal Mine becomes operational has been summarised in Table 1.
TABLE 1
COAL TRANSPORTATION ENVISAGED THROUGH ROAD (TOTAL REQUIRED COAL = 4 MTPA FOR UNIT-1 (11000 TPD);
LINKAGE COAL = 3.255 MTPA) Amendment proposal No.
Source of coal Daily Road transportatio
n, TPD
Total (TPD)
Status of amendment proposal
1 Lakhanpur Coal Block 6913 6913 Permitted for 1 yr vide EC amendment dt. 26.04.2017, lapsed on 25.04.2018.
2 (a) Baroud and Jampali Mines of SECL
1780
4794
EC amendment application on 10.08.2017, considered and recommended during EAC (Thermal) meeting dated 30.08.2017 for a total of 6913 TPD from Lakhanpur, Baroud, Jampali & Kotarliya RS.
(b) Kotarliya Railway Siding 3014
3 (a) Basundhra- Garjanbahal area (Kulda & Basundhra mines) of MCL
2500
11000
Current Proposal: Amalgamated proposal combining & revising Amendment 1 & 2 (given above) along with addition of further likely sources of coal.
(b) Ib valley area (Samleshwari & Lajkura mine) of MCL
500
(c) Lakhanpur area (Lakhanpur, Lilari & Belpahar mines) of MCL
700
(d) Raigarh area (Baroud & Jampali mines) of SECL
1800
(e) Kotarliya or Bhupdeopur railway siding
3500
(f) Dulanga CMP of NTPC Ltd. 2000* * Even though production from Dulanga CMP will be higher, only 2000 TPD coal transportation
from Dulanga CMP to Lara STPP has been permitted as per the Minutes of Meeting of Expert Appraisal Committee (Coal), MOEF&CC, New Delhi dated 17-18 May 2018, during which amendment in EC of Dulanga CMP was considered.
This report pertains to the study of the alternate road routes from Basundhra- Garjanbahal area, Ib valley area, Lakhanpur area, Raigarh area, Kotarliya railway siding, Bhupdeopur railway siding and Dulanga CMP to Lara STPP.
A total of ten routes were surveyed and studied in detail with respect to road width, road condition, traffic volumes and other parameters. Based on the survey assessment, nine routes were found feasible and only seven (refer Fig. 1) will be opted for transportation as follows:
Min Mec Consultancy Pvt. Ltd.
Assessment of Impacts Due to Transportation of Coal for Lara STPP of NTPC Ltd. 4
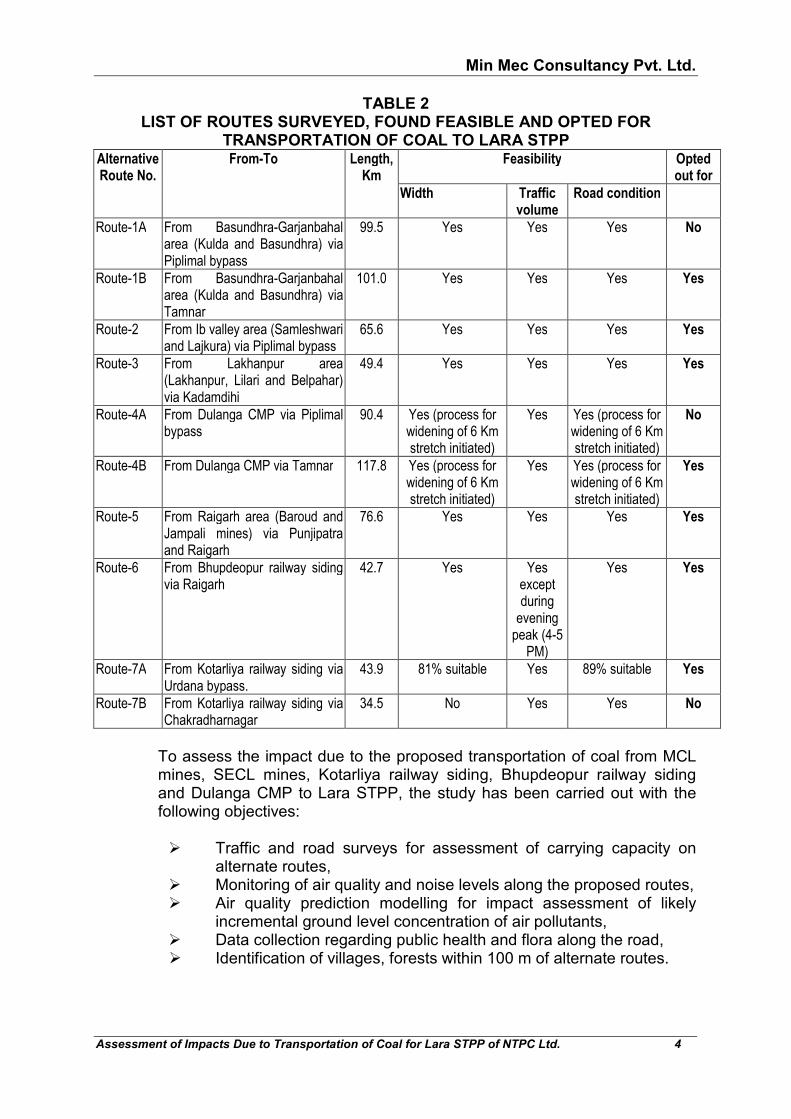
TABLE 2 LIST OF ROUTES SURVEYED, FOUND FEASIBLE AND OPTED FOR
TRANSPORTATION OF COAL TO LARA STPP Alternative Route No.
From-To Length, Km
Feasibility Opted out for
Width Traffic volume
Road condition
Route-1A From Basundhra-Garjanbahal area (Kulda and Basundhra) via Piplimal bypass
99.5 Yes Yes Yes No
Route-1B
From Basundhra-Garjanbahal area (Kulda and Basundhra) via Tamnar
101.0 Yes Yes Yes Yes
Route-2 From Ib valley area (Samleshwari and Lajkura) via Piplimal bypass
65.6 Yes Yes Yes Yes
Route-3 From Lakhanpur area (Lakhanpur, Lilari and Belpahar) via Kadamdihi
49.4 Yes Yes Yes Yes
Route-4A From Dulanga CMP via Piplimal bypass
90.4 Yes (process for widening of 6 Km stretch initiated)
Yes Yes (process for widening of 6 Km stretch initiated)
No
Route-4B From Dulanga CMP via Tamnar 117.8 Yes (process for widening of 6 Km stretch initiated)
Yes Yes (process for widening of 6 Km stretch initiated)
Yes
Route-5 From Raigarh area (Baroud and Jampali mines) via Punjipatra and Raigarh
76.6 Yes Yes Yes Yes
Route-6 From Bhupdeopur railway siding via Raigarh
42.7 Yes Yes except during
evening peak (4-5
PM)
Yes Yes
Route-7A From Kotarliya railway siding via Urdana bypass.
43.9 81% suitable Yes 89% suitable Yes
Route-7B From Kotarliya railway siding via Chakradharnagar
34.5 No Yes Yes No
To assess the impact due to the proposed transportation of coal from MCL
mines, SECL mines, Kotarliya railway siding, Bhupdeopur railway siding and Dulanga CMP to Lara STPP, the study has been carried out with the following objectives:
� Traffic and road surveys for assessment of carrying capacity on
alternate routes, � Monitoring of air quality and noise levels along the proposed routes, � Air quality prediction modelling for impact assessment of likely
incremental ground level concentration of air pollutants, � Data collection regarding public health and flora along the road, � Identification of villages, forests within 100 m of alternate routes.

Min Mec Consultancy Pvt. Ltd.
Assessment of Impacts Due to Transportation of Coal for Lara STPP of NTPC Ltd. 5
FIG. 1: PROPOSED ROUTE OPTED FOR TRANSPORTATION OF COAL FROM MCL & SECL MINES, RAILWAY SIDINGS AND DULANGA CMP TO LARA STPP
Min Mec Consultancy Pvt. Ltd.
Assessment of Impacts Due to Transportation of Coal for Lara STPP of NTPC Ltd. 6
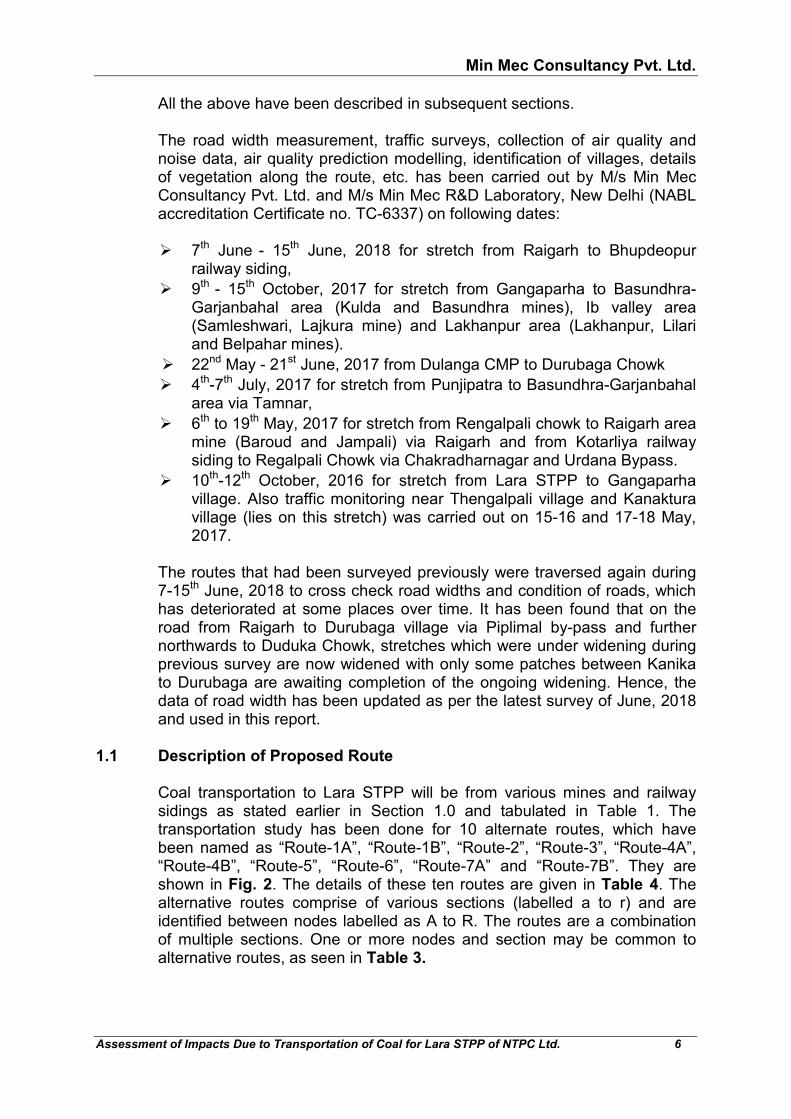
All the above have been described in subsequent sections. The road width measurement, traffic surveys, collection of air quality and
noise data, air quality prediction modelling, identification of villages, details of vegetation along the route, etc. has been carried out by M/s Min Mec Consultancy Pvt. Ltd. and M/s Min Mec R&D Laboratory, New Delhi (NABL accreditation Certificate no. TC-6337) on following dates:
� 7th June - 15th June, 2018 for stretch from Raigarh to Bhupdeopur
railway siding, � 9th - 15th October, 2017 for stretch from Gangaparha to Basundhra-
Garjanbahal area (Kulda and Basundhra mines), Ib valley area (Samleshwari, Lajkura mine) and Lakhanpur area (Lakhanpur, Lilari and Belpahar mines).
� 22nd May - 21st June, 2017 from Dulanga CMP to Durubaga Chowk � 4th-7th July, 2017 for stretch from Punjipatra to Basundhra-Garjanbahal
area via Tamnar, � 6th to 19th May, 2017 for stretch from Rengalpali chowk to Raigarh area
mine (Baroud and Jampali) via Raigarh and from Kotarliya railway siding to Regalpali Chowk via Chakradharnagar and Urdana Bypass.
� 10th-12th October, 2016 for stretch from Lara STPP to Gangaparha village. Also traffic monitoring near Thengalpali village and Kanaktura village (lies on this stretch) was carried out on 15-16 and 17-18 May, 2017.
The routes that had been surveyed previously were traversed again during 7-15th June, 2018 to cross check road widths and condition of roads, which has deteriorated at some places over time. It has been found that on the road from Raigarh to Durubaga village via Piplimal by-pass and further northwards to Duduka Chowk, stretches which were under widening during previous survey are now widened with only some patches between Kanika to Durubaga are awaiting completion of the ongoing widening. Hence, the data of road width has been updated as per the latest survey of June, 2018 and used in this report.
1.1 Description of Proposed Route Coal transportation to Lara STPP will be from various mines and railway
sidings as stated earlier in Section 1.0 and tabulated in Table 1. The transportation study has been done for 10 alternate routes, which have been named as “Route-1A”, “Route-1B”, “Route-2”, “Route-3”, “Route-4A”, “Route-4B”, “Route-5”, “Route-6”, “Route-7A” and “Route-7B”. They are shown in Fig. 2. The details of these ten routes are given in Table 4. The alternative routes comprise of various sections (labelled a to r) and are identified between nodes labelled as A to R. The routes are a combination of multiple sections. One or more nodes and section may be common to alternative routes, as seen in Table 3.

Min Mec Consultancy Pvt. Ltd.
Assessment of Impacts Due to Transportation of Coal for Lara STPP of NTPC Ltd. 7
TABLE 3 ROAD ROUTES COMPRISING VARIOUS NODES AND SECTIONS
Nodes Sections Length
(km)
From-To
Ro
ute
-1A
Ro
ute
-1B
Ro
ute
-2
Ro
ute
-3
Ro
ute
-4A
Ro
ute
-4B
Ro
ute
-5
Ro
ute
-6
Ro
ute
-7A
Ro
ute
-7B
A to B a 1.89 Lara STPP to Rengalpali chowk a a a a a a a a a a
B to Q b 2.11 Regalpali chowk to Kali mandir at Kanaktura village b - b b b - - - - b
Q to C c 40.34 Kali mandir at Kanaktura village to Bandahal T-Point
c - c c c - - - - -
C to D d 4.18 Bandahal T-Point to Lakhanpur area mines - - - d - - - - - -
C to E e 5.45 Bandahal T-Point to Piplymal bypass e - e - e - - - - -
E to F f 14.91 Piplimal Bypass to Ib valley area mines - - f - - - - - - -
E to G g 33.85 Piplymal bypass to Durubaga chowk g - - - g - - - - -
G to H h 5.90 Durubaga chowk to Dulanga mine site - - - - h h - - - -
G to I i 12.97 Durubaga chowk to Bankibahal Chowk i - - - - i - - - -
I to J j 2.07 Bankibahal chowk to Basundhra mine j j - - - - - - - -
I to K k 55.10 Bankibahal Chowk to Punjipatra - k - - - k - - - -
K to L m 32.80 Punjipatra to jampali mine - - - - - - m - - -
K to M l 19.14 Punjipatra to Dhimrapur chowk - l - - - l l - - -
M to N o 0.29 Stretch having 300 m length at Dhimrapur chowk - o - - - o o o - -
N to O n 19.45 Dhimrapur chowk to Kotarliya siding - - - - - - - - n -
N to B p 21.66 Dhimrapur chowk to Regalpali chowk - p - - - p p p p -
P to Q q 29.63 Kotarliya siding to Kalimandir at Kanaktura village - - - - - - - - - q
N to R r 17.98 Dhimrapur chowk to Bhupdeopur siding - - - - - - - r - -
Total length (km) 99.5 101.0 65.6 49.4 90.4 117.8 76.6 42.7 43.9 34.5

Min Mec Consultancy Pvt. Ltd.
Assessment of Impacts Due to Transportation of Coal for Lara STPP of NTPC Ltd. 8
TABLE 4 SUMMARY OF TEN TRANSPORTATION ROUTES AND THEIR SECTIONS
Alternative Route No.
From-To Length, km
Remarks
Route-1A (Section-j+i+g+e+c+b+a)
From Basundhra-Garjanbahal area (Kulda and Basundhra) to Lara STPP via Duduka Chowk, Garjanbahal, Kanika, Piplimal bypass, Kadamdihi and Rengalpali chowk.
99.5 � About 23 km length of the road from Barpali Chowk to Brahmani village was under widening to 20 m by PWD through its contractor Balaji Construction Company during initial survey in Oct 2017. In June 2018, during the re-survey of the route it was observed that road widening has been completed except 1.5 km of road and at near culverts, which are underway. Hence, for the purpose of this study, the entire stretch has been considered as 20 m as the under construction patches are also likely to be completed soon.
� No-Entry timings from 9.30-10.30 AM and 3.30-4.30 PM apply
in villages Barpali, Durubaga, Garjanbahal and Kanika Villages � A bypass was under construction in Garjanbahal Village
whereafter the above no-entry timings may be waived off as per interaction with villagers.
� Road from Piplimal bypass to Rengalpali chowk is NH200/49.
While the road from Piplimal Bypass to Kulda mine is a PWD road.
Route-1B (Section-j+k+l+o+p+a)
From Basundhra-Garjanbahal area (Kulda and Basundhra) to Lara STPP via Gopalpur, Bileimunda, Tamnar, Punjipatra and Raigarh
101.0 � About 55 km of road from MCL mines upto Punjipatra via Tamnar is a PWD road and from there to near Dhimrapur Chowk is Ambikapur State highway (SH-1).
� No entry timings is applicable for trucks from 9:00-10:00 AM in morning, 1:00-2:00 PM in afternoon and from 5:00-6:00 PM in evening in Gopalpur, Ratanpur, Bileimunda, Taparia, Khuruslenga and Dhaurabhanta villages
Route-2 From Ib valley area (Samleshwari 65.6 � Fly over in Junadihi Village was completed and part of the

Min Mec Consultancy Pvt. Ltd.
Assessment of Impacts Due to Transportation of Coal for Lara STPP of NTPC Ltd. 9
Alternative Route No.
From-To Length, km
Remarks
(Section-f+e+c+b+a)
and Lajkura) to Lara STPP via Mandalia, Belpahar, Piplimal bypass, Kuraloi, Kadamdihi and Rengalpali chowk.
carriageway has been opened to traffic. � About 5 km length of road from mines to Mandlia Village, where
it meets NH 200/49, is a village road.
Route-3 (Section-d+c+b+a)
From Lakhanpur area (Lakhanpur, Lilari and Belpahar) to Lara STPP via Sahajbahal, Bandahal T-Point, Kadamdihi, and Rengalpali chowk
49.4 � About 4 km length of road from mines to Bandahal T-Point, where it meets NH 200/49, is a village road.
Route-4A (Section-h+g+e+c+b+a)
From Dulanga CMP to Lara STPP via Durubaga, Kanika, Piplimal bypass, Kadamdihi, and Rengalpali chowk.
90.4 � The road from Dulanga mines to Durubaga village is a village road, approximately 6 km long.
� NTPC have already deposited Rs. 400 Lakhs with RWD, Sundergarh for strengthening and widening of this stretch. The process has already been initiated by RWD, Sundergarh. Route-4B
(Section-h+i+k+l+o+p+a)
From Dulanga CMP to Lara STPP via Durubaga, Duduka, Bileimunda, Tamnar and Raigarh.
117.8
Route-5 (Section-m+l+o+p+a)
From Raigarh area (Baroud and Jampali mines) to Lara STPP via Punjipatra, Taraimal and Raigarh
76.6 � About 14 km road from Regalpali chowk to Bypass chowk near Sangitarai is NH 49/200. While about 51 km of road from Dhimrapur chowk to Baihamura and Kasaia village to Baruod and Jampali Mine area is Ambikapur State highway (SH-1).
Route-6 (Section-r+p+a)
From Bhupdeopur railway siding to Lara STPP via Raigarh
42.7 � The road from Dhimrapur chowk to Bhupdeopur railway siding is NH-49/200 and is in good condition.
Route-7A (Section-n+o+p+a)
From Kotarliya railway siding to Lara STPP via Urdana bypass.
43.9 � The road from Kotarliya railway siding upto Urdana bypass is rural PWD Road having length approx. 20 KM. This route contains BT, 10m wide Cement concrete road also. Some patches are damaged. For damaged Patches road widening and strengthening by PWD, Raigarh is under process through various Funds.
Route-7B (Section-q+b+a)
From Kotarliya railway siding to Lara STPP via Chakradharnagar
34.5 � Entire road length is an existing PWD road. No widening or strengthening of the roads was observed during site visit.

Min Mec Consultancy Pvt. Ltd.
Assessment of Impacts Due to Transportation of Coal for Lara STPP of NTPC Ltd. 10
1.2 Quantity of coal to be transported The amount of coal to be transported from MCL mines, SECL mines,
Kotarliya siding, Bhupdeopur siding and Dulanga CMP to Lara STPP for a period of 16 months (August, 2018 to November, 2019) via different alternates road routes and corresponding to and fro coal carrying tippers movement (both loaded and unloaded) is as follows:
� Route-1A or 1B- 2500 T/ Day of coal from Basundhra-Garjanbahal
area (Kulda and Basundhra mines) of MCL Mines through tippers/ trucks having carrying capacity 25 T. In this case, there will be to and fro movement of 200 coal carrying tippers.
� Route-2- 500 T/ Day of coal from Ib valley area (Samleshwari and Lajkura mines) of MCL through tippers/ trucks having carrying capacity 15 T. In this case, there will be to and fro movement of 68 coal carrying tippers.
� Route-3- 700 T/ Day of coal from Lakhanpur area (Lakhanpur, Lilari and Belpahar mines) of MCL through tippers/ trucks having carrying capacity 15 T. In this case, there will be to and fro movement of 94 coal carrying tippers.
� Route-4A or 4B- 2000 T/ Day of coal from Dulanga CMP of NTPC Ltd. through tippers/trucks having carrying capacity 20 T. In this case, there will be to and fro movement of 200 coal carrying tippers.
� Route-5- 1800 T/ Day of coal from Raigarh area (Baroud and Jampali
mine) of SECL through tippers/trucks having carrying capacity 25 T. In this case, there will be to and fro movement of 144 coal carrying tippers.
Route-6- 3500 T/ Day of coal from Bhupdeopur railway siding through tippers/trucks having carrying capacity 25 T.
Or
� Route-7A or 7B- 3500 T/ Day of coal from Kotarliya railway siding through tippers/trucks having carrying capacity 25 T.
In both the cases, there will be to and fro movement of 280 coal carrying tippers.
Min Mec Consultancy Pvt. Ltd.
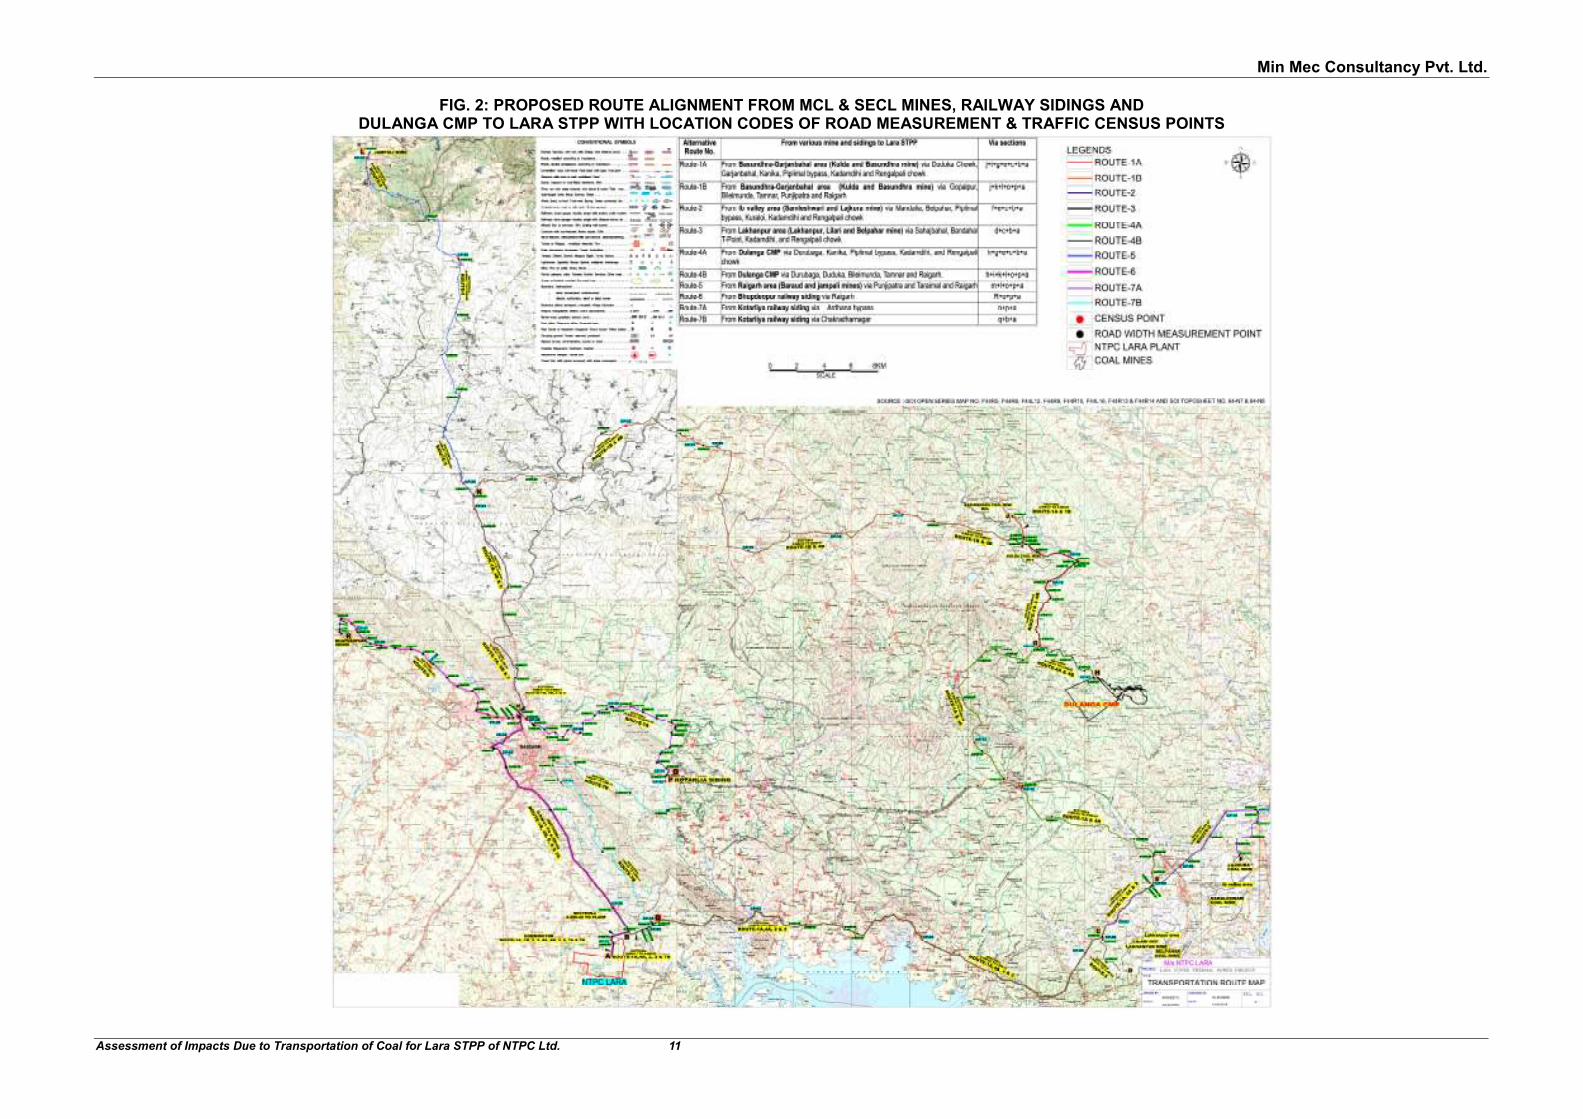
Assessment of Impacts Due to Transportation of Coal for Lara STPP of NTPC Ltd. 11
FIG. 2: PROPOSED ROUTE ALIGNMENT FROM MCL & SECL MINES, RAILWAY SIDINGS AND DULANGA CMP TO LARA STPP WITH LOCATION CODES OF ROAD MEASUREMENT & TRAFFIC CENSUS POINTS
Min Mec Consultancy Pvt. Ltd.
Assessment of Impacts Due to Transportation of Coal for Lara STPP of NTPC Ltd. 12
2.0 ASSESSMENT OF PROPOSED ROAD FOR ITS CATEGORISATION & CARRYING CAPACITY AS PER IRC 64(1990) AND 106(1990)-GUIDELINES ON CAPACITY OF ROADS IN RURAL AND URBAN AREA
2.1 Road width measurement The length of the ten alternate routes i.e “Route-1A”, “Route-1B”, “Route-2”,
“Route-3”, “Route-4A”, “Route-4B”, “Route-5”, “Route-6”, “Route-7A” and “Route-7B” had been given in Table 3 earlier. The above routes can be seen in Fig. 2.
The width of the road was measured. Since the road width was not uniform,
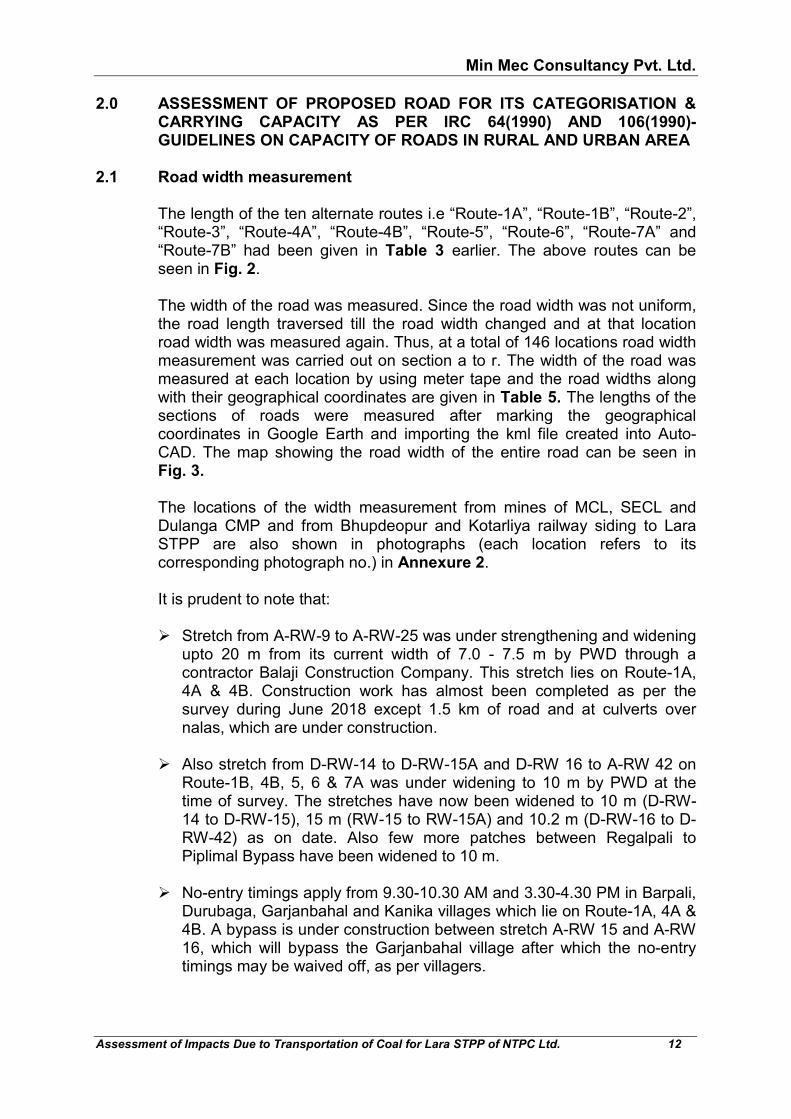
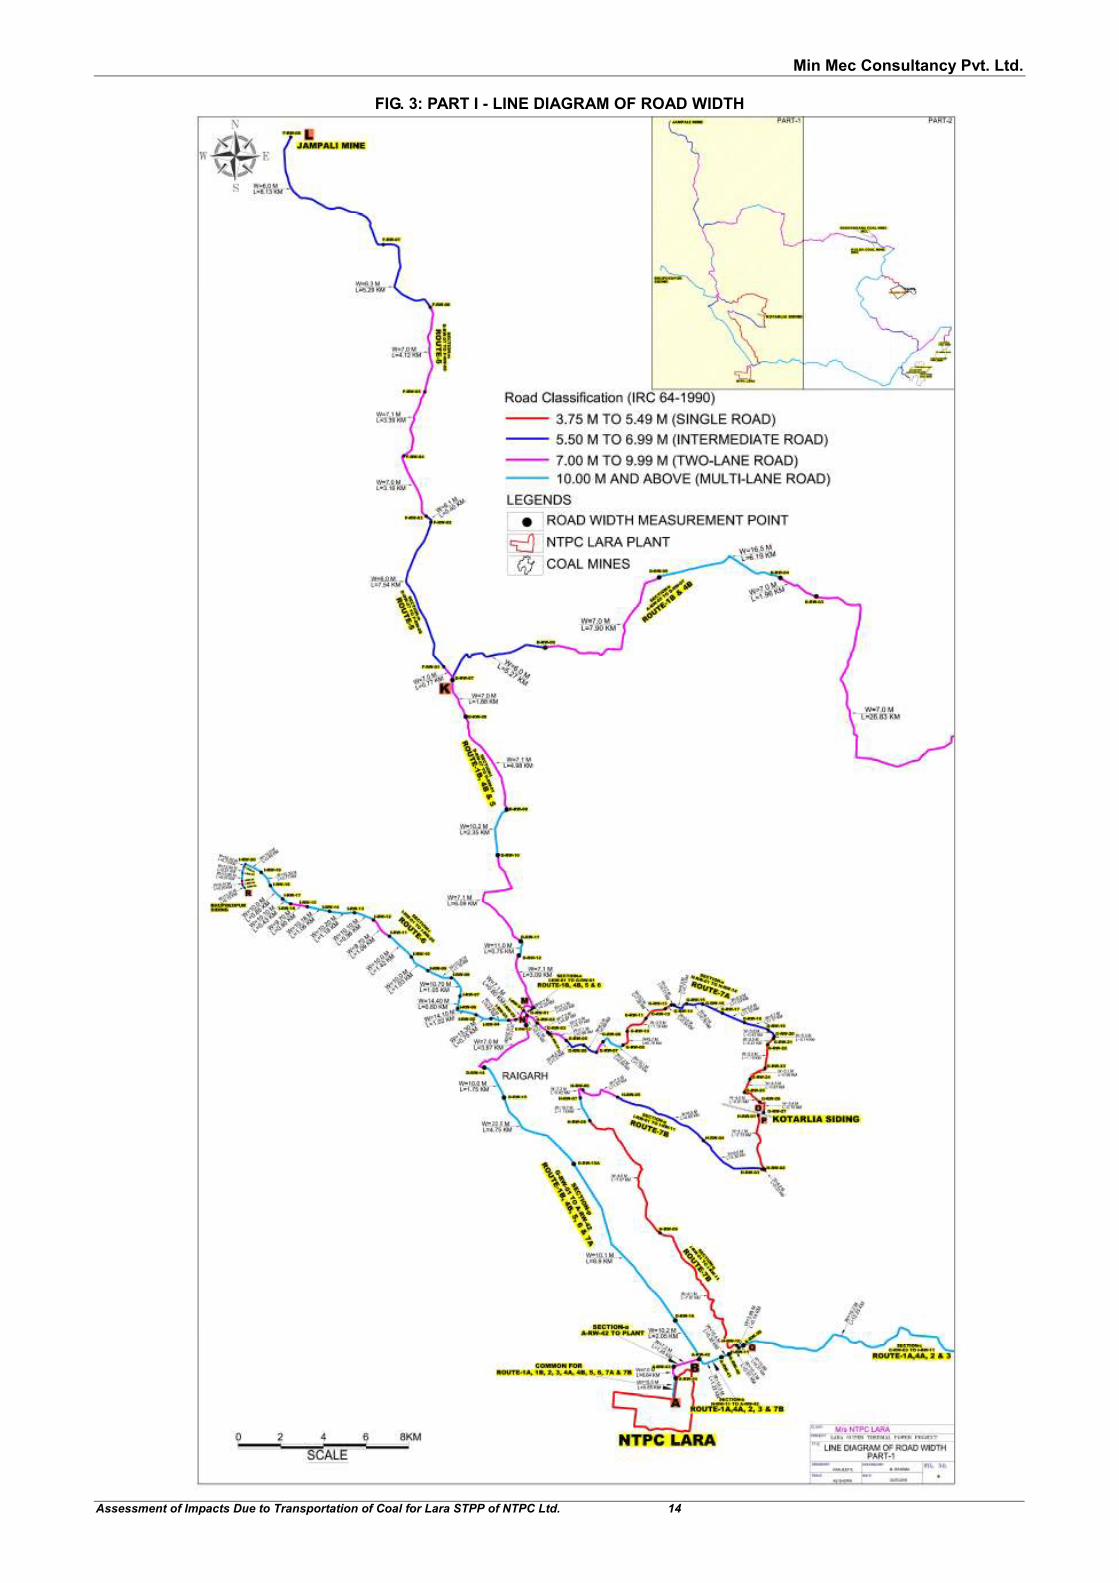
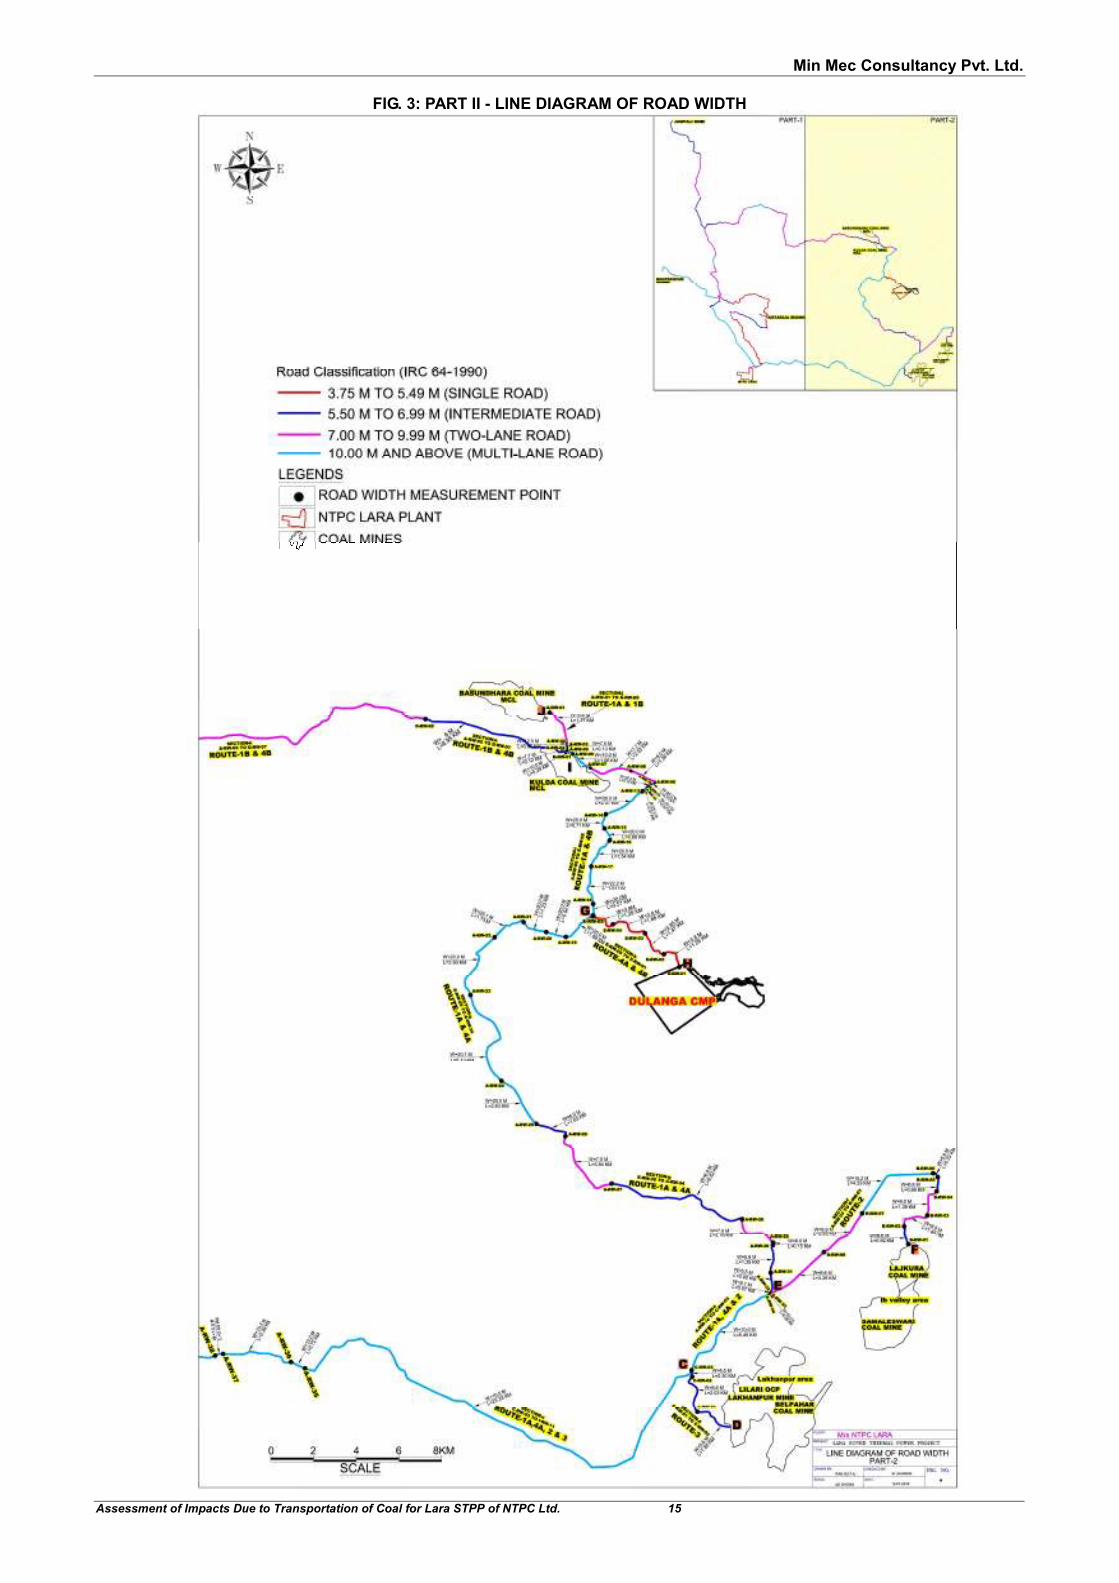
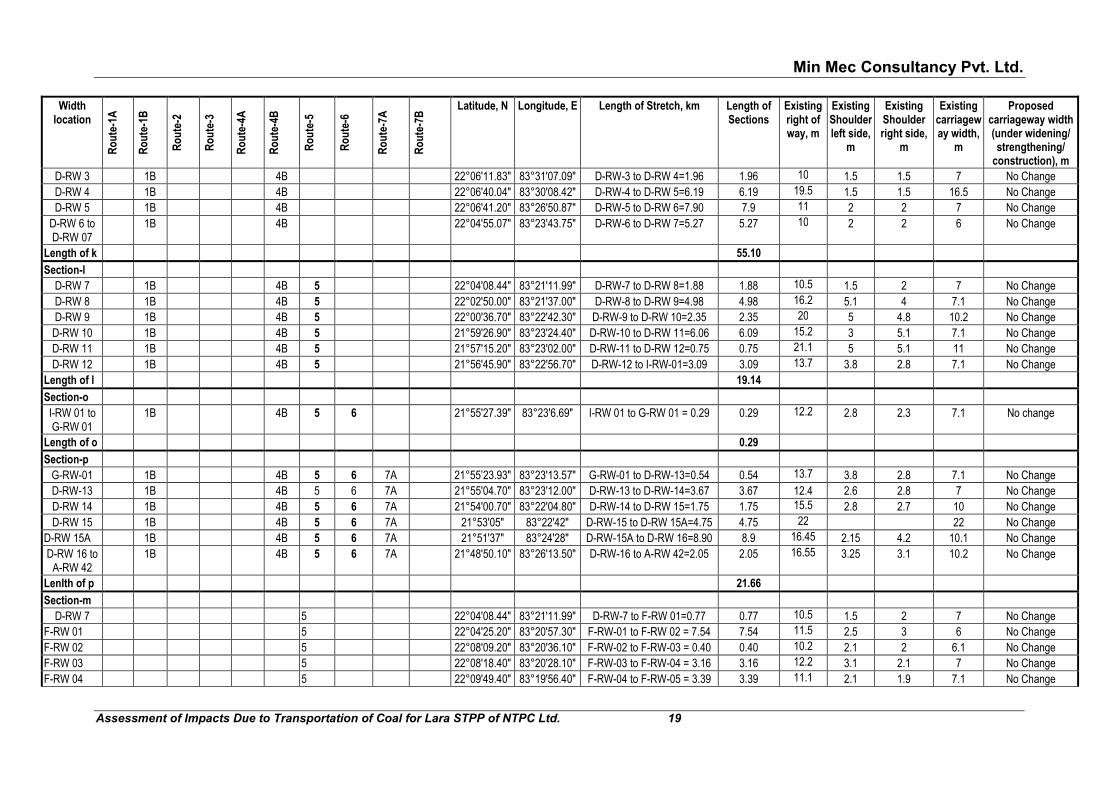
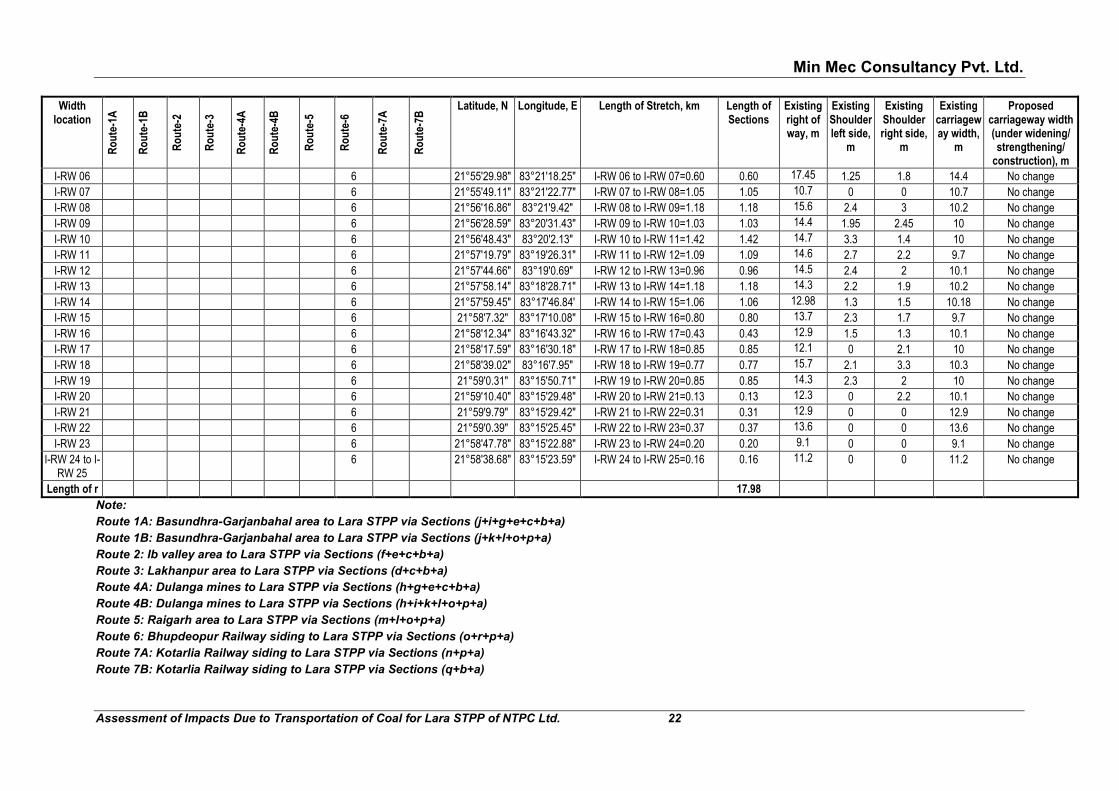
the road length traversed till the road width changed and at that location road width was measured again. Thus, at a total of 146 locations road width measurement was carried out on section a to r. The width of the road was measured at each location by using meter tape and the road widths along with their geographical coordinates are given in Table 5. The lengths of the sections of roads were measured after marking the geographical coordinates in Google Earth and importing the kml file created into Auto-CAD. The map showing the road width of the entire road can be seen in Fig. 3.
The locations of the width measurement from mines of MCL, SECL and
Dulanga CMP and from Bhupdeopur and Kotarliya railway siding to Lara STPP are also shown in photographs (each location refers to its corresponding photograph no.) in Annexure 2.
It is prudent to note that:
� Stretch from A-RW-9 to A-RW-25 was under strengthening and widening upto 20 m from its current width of 7.0 - 7.5 m by PWD through a contractor Balaji Construction Company. This stretch lies on Route-1A, 4A & 4B. Construction work has almost been completed as per the survey during June 2018 except 1.5 km of road and at culverts over nalas, which are under construction.
� Also stretch from D-RW-14 to D-RW-15A and D-RW 16 to A-RW 42 on Route-1B, 4B, 5, 6 & 7A was under widening to 10 m by PWD at the time of survey. The stretches have now been widened to 10 m (D-RW-14 to D-RW-15), 15 m (RW-15 to RW-15A) and 10.2 m (D-RW-16 to D-RW-42) as on date. Also few more patches between Regalpali to Piplimal Bypass have been widened to 10 m.
� No-entry timings apply from 9.30-10.30 AM and 3.30-4.30 PM in Barpali, Durubaga, Garjanbahal and Kanika villages which lie on Route-1A, 4A & 4B. A bypass is under construction between stretch A-RW 15 and A-RW 16, which will bypass the Garjanbahal village after which the no-entry timings may be waived off, as per villagers.

Min Mec Consultancy Pvt. Ltd.
Assessment of Impacts Due to Transportation of Coal for Lara STPP of NTPC Ltd. 13
� Also no entry timings are applicable for trucks from 9:00-10:00 AM in morning, 1:00-2:00 PM in afternoon and from 5:00-6:00 PM in evening in Gopalpur, Ratanpur, Bileimunda, Taparia, Khuruslenga and Dhaurabhanta village. These villages are lying on Route-1B and 4B.
� Stretch from Dulanga project site to Durubaga chowk (E-RW 1 to E-RW 5) has width of about 3.8-4 m. The strengthening/ widening of this stretch has been taken up by RWD with the funds provided by NTPC.
� The road from Kotarliya railway siding upto Urdana bypass is rural PWD
Road having length approx. 20 KM. This route contains BT, 10m wide Cement concrete road also. Some patches are damaged. For damaged Patches road widening and strengthening by PWD, Raigarh is under process through various Funds.
Min Mec Consultancy Pvt. Ltd.
Assessment of Impacts Due to Transportation of Coal for Lara STPP of NTPC Ltd. 14
FIG. 3: PART I - LINE DIAGRAM OF ROAD WIDTH
Min Mec Consultancy Pvt. Ltd.
Assessment of Impacts Due to Transportation of Coal for Lara STPP of NTPC Ltd. 15
FIG. 3: PART II - LINE DIAGRAM OF ROAD WIDTH

Min Mec Consultancy Pvt. Ltd.
Assessment of Impacts Due to Transportation of Coal for Lara STPP of NTPC Ltd. 16
TABLE 5 ROAD WIDTH MEASURED
Width
location
Ro
ute
-1A
Ro
ute
-1B
Ro
ute
-2
Ro
ute
-3
Ro
ute
-4A
Ro
ute
-4B
Ro
ute
-5
Ro
ute
-6
Ro
ute
-7A
Ro
ute
-7B
Latitude, N Longitude, E Length of Stretch, km Length of
Sections
Existing
right of way, m
Existing
Shoulder left side,
m
Existing
Shoulder right side,
m
Existing
carriageway width,
m
Proposed
carriageway width (under widening/ strengthening/
construction), m
Section-j
A-RW 1 1A 1B 22°03’18.3” 83°44’25.8” A-RW 1 to A-RW 2 = 1.77 1.77 14 5 0 9 No Change A-RW 2 1A 1B 22°02’28.7” 83°44’53.3” A-RW 2 to A-RW 3 =0.05 0.05 16.8 3.8 1 12 No Change A-RW 3 1A 1B 22°02’27.6” 83°44’53.3” A-RW 3 to A-RW 4 =0.13 0.13 7 0 0 7 No Change
A-RW 4 to A-RW 5
1A 1B 22°02’23.3” 83°44’53.2” A-RW 4 to A-RW 5 =0.12 0.12 11.7 2 2 7.7 No Change
Length of j 2.07
Section-i
A-RW 5 1A 4B 22°02’19.6” 83°44’53.6” A-RW 5 to A-RW 6 =0.29 0.29 13 1.5 1.5 10 No Change A-RW 6 1A 4B 22°02’14.4” 83°45’02.1” A-RW 6 to A-RW 7 =1.06 1.06 14 2 2 10 No Change A-RW 7 1A 4B 22°01’54.0” 83°45’30.8” A-RW 7 to A-RW 8 =2.03 2.03 11.7 2 2 7.7 No Change A-RW 8 1A 4B 22°01’50.0” 83°46’36.5” A-RW 8 to A-RW 9 =1.36 1.36 11 1.5 1.5 8 No Change A-RW 9 1A 4B 22°01’30.5” 83°47’14.2” A-RW 9 to A-RW 10 =0.20 0.20 23.7 2 1.7 20 No Change A-RW 10 1A 4B 22°01’28.4” 83°47’08.3” A-RW 10 to A-RW 11 =0.14 0.14 25 2 3 20 No Change A-RW 11 1A 4B 22°01’26.6” 83°47’03.8” A-RW 11 to A-RW 12 =0.07 0.07 20 0 0 20 No Change A-RW 12 1A 4B 22°01’25.6” 83°47’01.8” A-RW 12 to A-RW 13 =0.31 0.31 26 2 4 20 No Change A-RW 13 1A 4B 22°01’18.4” 83°46’54.1” A-RW 13 to A-RW 14 =2.07 2.07 22.6 1.3 1.3 20 No Change A-RW 14 1A 4B 22°00’42.2” 83°45’54.7” A-RW 14 to A-RW 15 =0.71 0.71 22 1 1 20 No Change A-RW 15 1A 4B 22°00’20.2” 83°45’55.0” A-RW 15 to A-RW 16 =0.68 0.68 25.4 1.3 4.1 20 No Change A-RW 16 1A 4B 22°00’04.6” 83°46’03.1” A-RW 16 to A-RW 17 =1.54 1.54 24.4 1.4 3 20 No Change A-RW 17 1A 4B 22°59’25.5” 83°45’30.0” A-RW 17 to A-RW 18 =1.94 1.94 28.1 2.5 3.4 22.2 No Change
A-RW 18 to E-RW 5
1A 4B 21°58’23.2” 83°45’36.0” A-RW 18 to E-RW 5 = 0.57 0.57 21.3 1.3 0 20 No Change
Length of i 12.97
Section-g
E-RW-5 1A 4A 21°58’06.8” 83°45’32.9” E-RW-5 to A-RW 19 =1.69 1.69 21.3 1.3 0 20 No Change A-RW 19 1A 4A 21°57’36.2” 83°44’50.8” A-RW 19 to A-RW 20 =0.94 0.94 23.65 2.15 1.5 20 No Change A-RW 20 1A 4A 21°57’42.7” 83°44’20.7” A-RW 20 to A-RW 21 =1.23 1.23 22 1 1 20 No Change A-RW 21 1A 4A 21°57’58.1” 83°43’42.4” A-RW 21 to A-RW 22 =1.73 1.73 25.5 2 3.4 20.1 No Change A-RW 22 1A 4A 21°57’34.15” 83°42’54.83” A-RW 22 to A-RW 23 =3.50 3.5 23.5 1.5 2 20 No Change A-RW 23 1A 4A 21°56’8.41” 83°42’15.10” A-RW 23 to A-RW 24 =5.13 5.13 26.1 3 3 20.1 No Change

Min Mec Consultancy Pvt. Ltd.
Assessment of Impacts Due to Transportation of Coal for Lara STPP of NTPC Ltd. 17
Width location
Ro
ute
-1A
Ro
ute
-1B
Ro
ute
-2
Ro
ute
-3
Ro
ute
-4A
Ro
ute
-4B
Ro
ute
-5
Ro
ute
-6
Ro
ute
-7A
Ro
ute
-7B
Latitude, N Longitude, E Length of Stretch, km Length of Sections
Existing right of way, m
Existing Shoulder left side,
m
Existing Shoulder right side,
m
Existing carriageway width,
m
Proposed carriageway width (under widening/ strengthening/
construction), m
A-RW 24 1A 4A 21°53’54.3” 83°43’08.0” A-RW 24 to A-RW 25 =2.63 2.63 26.5 2 4.5 20 No Change A-RW 25 1A 4A 21°52’49.9” 83°44’03.1” A-RW 25 to A-RW 26 =1.63 1.63 11.9 3 2 6.9 No Change A-RW 26 1A 4A 21°52’31.5” 83°44’50.3” A-RW 26 to A-RW 27 =3.84 3.84 11.2 2 2.2 7 No Change A-RW 27 1A 4A 21°51’19.8” 83°46’05.0” A-RW 27 to A-RW 28 =6.82 6.82 8.4 0.5 1 6.9 No Change A-RW 28 1A 4A 21°50’23.3” 83°49’35.8” A-RW 28 to A-RW 29 =2.16 2.16 9 1 1 7 No Change A-RW 29 1A 4A 21°49’46.7” 83°50’29.4” A-RW 29 to A-RW 30 =0.15 0.15 9.5 2 1.5 6 No Change A-RW 30 1A 4A 21°49’45.5” 83°50’29.0” A-RW 30 to A-RW 31 =1.35 1.35 9.9 2.1 2 5.8 No Change A-RW 31 1A 4A 21°49’02.3” 83°50’24.4” A-RW 31 to A-RW 32 =0.92 0.92 8.5 1.5 1.5 5.5 No Change A-RW 32 1A 4A 21°48’31.5” 83°50’22.9” A-RW 32 to A-RW 33 =0.07 0.07 8.1 1.7 0.7 5.7 No Change
A-RW 33 to A-RW 34
1A 4A 21°48’30.2” 83°50’21.3” A-RW 33 to A-RW 34 =0.06 0.06 14.4 1.7 2.4 10.3 No Change
Length of g 33.85
Section-e
A-RW 34 to C-RW 3
1A 2 4A 21°48’28.7” 83°50’19.4” A-RW 34 to C-RW 03 = 5.45 5.45 13 1.5 1.5 10 No Change
Length of e 5.45
Section-c
C-RW 3 1A 2 3 4A 21°46’30.4” 83°48’14.0” C-RW 3 to A-RW 35 = 23.33 23.33 13.2 1.2 2 10 No Change A-RW 35 1A 2 3 4A 21°46’34.9” 83°37’48.1” A-RW 35 to A-RW 36 =0.72 0.72 14.6 2 2.6 10 No Change A-RW 36 1A 2 3 4A 21°46'45.1" 83°37'23.0" A-RW 36 to A-RW 37 =3.39 3.39 14.6 2.1 2.3 10.2 No Change A-RW 37 1A 2 3 4A 21°46'57.4" 83°35'31.9" A-RW 37 to A-RW 38 =0.40 0.4 14.4 2.2 2.2 10 No Change A-RW 38 1A 2 3 4A 21°46'55.3" 83°35'19.6" A-RW 38 to A-RW 39 =12.23 12.23 14.1 2 1.9 10.2 No Change A-RW 39 1A 2 3 4A 21°47'0.5" 83°29'04.6" A-RW 39 to H-RW 11 =0.27 0.27 13.7 1.7 2 10 No Change
Length of c 40.34
Section b H-RW 11 1A 2 3 4A 7B 21°46'56.50" 83°28'59.70" H-RW-11 to A-RW 40 = 0.51 0.51 14.2 1.7 2.2 10.3 No Change A-RW 40 1A 2 3 4A 7B 21°46'47.4" 83°28'45.4" A-RW 40 to A-RW 41 =0.38 0.38 15.5 2 3 10.5 No Change
A-RW 41 to A-RW 42
1A 2 3 4A 7B 21°46'42.9” 83°28'31.9" A-RW 41 to A-RW 42 =1.22 1.22 14.4 2.1 2 10.3 No Change
Length of b 2.11
Section-a
A-RW 42 1A 1B 2 3 4A 4B 5 6 7A 7B 21°46'39.3" 83°27'54.4" A-RW 42 to A-RW 43 =1.25 1.25 11.1 1.6 2.3 7.2 No Change A-RW 43 1A 1B 2 3 4A 4B 5 6 7A 7B 21°46’28.45” 83°27’13.18” A-RW 43 to A-RW-44 =0.64 0.64 9.5 1 1.5 7 No Change
Min Mec Consultancy Pvt. Ltd.
Assessment of Impacts Due to Transportation of Coal for Lara STPP of NTPC Ltd. 18
Width location
Ro
ute
-1A
Ro
ute
-1B
Ro
ute
-2
Ro
ute
-3
Ro
ute
-4A
Ro
ute
-4B
Ro
ute
-5
Ro
ute
-6
Ro
ute
-7A
Ro
ute
-7B
Latitude, N Longitude, E Length of Stretch, km Length of Sections
Existing right of way, m
Existing Shoulder left side,
m
Existing Shoulder right side,
m
Existing carriageway width,
m
Proposed carriageway width (under widening/ strengthening/
construction), m
A-RW-44 to Lara Plant
1A 1B 2 3 4A 4B 5 6 7A 7B 21°46'13" 83°27''18" A-RW-44 to Plant=0.85 0.85 15.5 No Change
LenIth of a 1.89
Section-f
B-RW 1 2 21°49’43.99” 83°54’12.29” B-RW 1 to B-RW 2 = 0.92 0.92 8.1 0.5 1 6.6 No Change B-RW 2 2 21°50’13” 83°54’02.2” B-RW 2 to B-RW 3 = 1.45 1.45 11 1 1 9 No Change B-RW 3 2 21°50’29.6” 83°54’37.6” B-RW 3 to B-RW 4 = 1.38 1.38 11.8 1.5 1.3 9 No Change B-RW 4 2 21°51’09.3” 83°54’56.6” B-RW 4 to B-RW 5 = 0.69 0.69 10 2 1.2 6.8 No Change B-RW 5 2 21°51’31.6” 83°54’54” B-RW 5 to B-RW 6 = 0.33 0.33 10.6 2 3 5.6 No Change B-RW 6 2 21°51’34.8” 83°54’49.4” B-RW 6 to B-RW 7 = 4.23 4.23 13 1.8 1 10.2 No Change B-RW 7 2 21°50’34” 83°52’54.3” B-RW 7 to B-RW 8 = 2.63 2.63 14.6 2.3 2.4 9.9 No Change
B-RW 8 to A-RW34
2 21°49’35.4” 83°51’54.1” B-RW 8 to A-RW 34 = 3.28 3.28 11.6 1 1 9.6 No Change
LenIth of f 14.91
Section-d No change
Lilari mine site
3 Mine site-C-RW 1=1.85 1.85 9.7 2 2.1 5.6 No change
C-RW 1 3 21°45’31.0” 83°48’22.6" C-RW 1 to C-RW 2 =2.03 2.03 9.7 2 2.1 5.6 No change C-RW 2 to C-RW 3
3 21°46’28.2” 83°48’14.9” C-RW 2 to C-RW 3 = 0.30 0.30 9.5 1.8 2.2 5.5 No change
Length of d 4.18
Section-h
E-RW-1 4A 4B 21°56'50.0" 83°47'53.8" E-RW 1 to E-RW 2= 1.26 1.26 10.1 3.16 3.14 3.8 Widening of carriageway from 3.75 to 5.5 m and formation of width
from 7.5 to 8.5 m by RWD Sundergarh through deposit
work basis.
E-RW-2 4A 4B 21°57'09.9" 83°47'28.4" E-RW 2 to E-RW 3= 1.47 1.47 8.57 1.62 3.1 3.85 E-RW-3 4A 4B 21°57'41.0" 83°46'58.2" E-RW 3 to E-RW 4= 1.88 1.88 8 2 2.2 3.8
E-RW-4 to E-RW 5
4A 4B 21°57'54.3" 83°46'05.6" E-RW-4 to E-RW-5 = 1.29 1.29 8.47 2.25 2.42 3.8
Length of h 5.90
Section-k
D-RW 1 1B 4B 22°02'18.21" 83°44'51.19" D-RW-1 to D-RW 2=6.95 6.95 9 1.5 1.5 6 No Change D-RW 2 1B 4B 22°03'07.69" 83°41'02.77" D-RW-2 to D-RW-3 = 26.83 26.83 10 1.5 1.5 7 No Change
Min Mec Consultancy Pvt. Ltd.
Assessment of Impacts Due to Transportation of Coal for Lara STPP of NTPC Ltd. 19
Width location
Ro
ute
-1A
Ro
ute
-1B
Ro
ute
-2
Ro
ute
-3
Ro
ute
-4A
Ro
ute
-4B
Ro
ute
-5
Ro
ute
-6
Ro
ute
-7A
Ro
ute
-7B
Latitude, N Longitude, E Length of Stretch, km Length of Sections
Existing right of way, m
Existing Shoulder left side,
m
Existing Shoulder right side,
m
Existing carriageway width,
m
Proposed carriageway width (under widening/ strengthening/
construction), m
D-RW 3 1B 4B 22°06'11.83" 83°31'07.09" D-RW-3 to D-RW 4=1.96 1.96 10 1.5 1.5 7 No Change D-RW 4 1B 4B 22°06'40.04" 83°30'08.42" D-RW-4 to D-RW 5=6.19 6.19 19.5 1.5 1.5 16.5 No Change D-RW 5 1B 4B 22°06'41.20" 83°26'50.87" D-RW-5 to D-RW 6=7.90 7.9 11 2 2 7 No Change
D-RW 6 to D-RW 07
1B 4B 22°04'55.07" 83°23'43.75" D-RW-6 to D-RW 7=5.27 5.27 10 2 2 6 No Change
Length of k 55.10
Section-l D-RW 7 1B 4B 5 22°04'08.44" 83°21'11.99" D-RW-7 to D-RW 8=1.88 1.88 10.5 1.5 2 7 No Change D-RW 8 1B 4B 5 22°02'50.00" 83°21'37.00" D-RW-8 to D-RW 9=4.98 4.98 16.2 5.1 4 7.1 No Change D-RW 9 1B 4B 5 22°00'36.70" 83°22'42.30" D-RW-9 to D-RW 10=2.35 2.35 20 5 4.8 10.2 No Change D-RW 10 1B 4B 5 21°59'26.90" 83°23'24.40" D-RW-10 to D-RW 11=6.06 6.09 15.2 3 5.1 7.1 No Change D-RW 11 1B 4B 5 21°57'15.20" 83°23'02.00" D-RW-11 to D-RW 12=0.75 0.75 21.1 5 5.1 11 No Change D-RW 12 1B 4B 5 21°56'45.90" 83°22'56.70" D-RW-12 to I-RW-01=3.09 3.09 13.7 3.8 2.8 7.1 No Change
Length of l 19.14
Section-o I-RW 01 to G-RW 01
1B 4B 5 6 21°55'27.39" 83°23'6.69" I-RW 01 to G-RW 01 = 0.29 0.29 12.2 2.8 2.3 7.1 No change
Length of o 0.29
Section-p G-RW-01 1B 4B 5 6 7A 21°55’23.93" 83°23'13.57" G-RW-01 to D-RW-13=0.54 0.54 13.7 3.8 2.8 7.1 No Change D-RW-13 1B 4B 5 6 7A 21°55'04.70" 83°23'12.00" D-RW-13 to D-RW-14=3.67 3.67 12.4 2.6 2.8 7 No Change D-RW 14 1B 4B 5 6 7A 21°54'00.70" 83°22'04.80" D-RW-14 to D-RW 15=1.75 1.75 15.5 2.8 2.7 10 No Change D-RW 15 1B 4B 5 6 7A 21°53'05" 83°22'42" D-RW-15 to D-RW 15A=4.75 4.75 22 22 No Change
D-RW 15A 1B 4B 5 6 7A 21°51'37" 83°24'28" D-RW-15A to D-RW 16=8.90 8.9 16.45 2.15 4.2 10.1 No Change D-RW 16 to
A-RW 42 1B 4B 5 6 7A 21°48'50.10" 83°26'13.50" D-RW-16 to A-RW 42=2.05 2.05 16.55 3.25 3.1 10.2 No Change
LenIth of p 21.66
Section-m D-RW 7 5 22°04'08.44" 83°21'11.99" D-RW-7 to F-RW 01=0.77 0.77 10.5 1.5 2 7 No Change
F-RW 01 5 22°04'25.20" 83°20'57.30" F-RW-01 to F-RW 02 = 7.54 7.54 11.5 2.5 3 6 No Change F-RW 02 5 22°08'09.20" 83°20'36.10" F-RW-02 to F-RW-03 = 0.40 0.40 10.2 2.1 2 6.1 No Change F-RW 03 5 22°08'18.40" 83°20'28.10" F-RW-03 to F-RW-04 = 3.16 3.16 12.2 3.1 2.1 7 No Change F-RW 04 5 22°09'49.40" 83°19'56.40" F-RW-04 to F-RW-05 = 3.39 3.39 11.1 2.1 1.9 7.1 No Change

Min Mec Consultancy Pvt. Ltd.
Assessment of Impacts Due to Transportation of Coal for Lara STPP of NTPC Ltd. 20
Width location
Ro
ute
-1A
Ro
ute
-1B
Ro
ute
-2
Ro
ute
-3
Ro
ute
-4A
Ro
ute
-4B
Ro
ute
-5
Ro
ute
-6
Ro
ute
-7A
Ro
ute
-7B
Latitude, N Longitude, E Length of Stretch, km Length of Sections
Existing right of way, m
Existing Shoulder left side,
m
Existing Shoulder right side,
m
Existing carriageway width,
m
Proposed carriageway width (under widening/ strengthening/
construction), m
F-RW 05 5 22°11'24.80" 83°20'26.70" F-RW-05 to F-RW-06 = 4.12 4.12 11 2 2 7 No Change F-RW 06 5 22°13'31.20" 83°20'35.30" F-RW-06 to F-RW-07 = 5.29 5.29 10.1 1.9 1.9 6.3 No Change F-RW 07 5 22°15'06.00" 83°19'15.50" F-RW-07 to F-RW-08 = 8.133 8.13 10.5 2.6 1.9 6 No Change F-RW 08 5 22°17'46.50" 83°16'46.60" SECL Mines No Change Length of m 32.80
Section-n G-RW-01 7A 21°55’23.93" 83°23'13.57" G-RW-01 to G-RW-02 = 0.62 0.62 12.1 2 3 7.1 Strengthening
Proposed G-RW-02 7A 21°55’11.07" 83°23'27.82" G-RW-02 to G-RW-03 = 0.67 0.67 10.55 1.55 2 7 Strengthening
Proposed G-RW-03 7A 21°54’57.77" 83°23'44.65" G-RW-03 to G-RW-04 = 0.17 0.17 12.4 2.5 2.9 7 Strengthening
Proposed G-RW-04 7A 21°54’56.29" 83°23'47.36" G-RW-04 to G-RW-05 = 0.86 0.86 12.8 3 2.7 7.1 Strengthening
Proposed G-RW-05 7A 21°54’46.34" 83°24'17.10" G-RW-05 to G-RW-06 = 1.00 1.00 10.5 2.8 1.5 6.2 Strengthening
Proposed G-RW-06 7A 21°54’38.83" 83°24'40.82'" G-RW-06 to G-RW-07 = 0.69 0.69 9.7 2 1.4 6.3 Strengthening
Proposed G-RW-07 7A 21°54’27.81" 83°25'3.55" G-RW-07 to G-RW-08 = 0.59 0.59 10.5 2 1.3 7.2 Strengthening
Proposed G-RW-08 7A 21°54’43.67" 83°25'3.80" G-RW-08 to G-RW-09 = 1.18 1.18 13.9 2.4 1.4 10.1 No Change G-RW-09 7A 21°54’40.63" 83°25'47.83" G-RW-09 to G-RW-10 = 0.78 0.78 7.6 2.4 1.5 3.7 Widening proposed G-RW-10 7A 21°55’1.13" 83°25'55.16" G-RW-10 to G-RW-11 = 1.19 1.19 7.8 2 2.3 3.5 G-RW-11 7A 21°55’20.03" 83°26'26.66" G-RW-11 to G-RW-12 = 1.08 1.08 7.2 2.1 2.1 3 G-RW-12 7A 21°55’36.20" 83°26'59.71" G-RW-12 to G-RW-13 = 0.34 0.34 9.35 3.25 3.1 3 G-RW-13 7A 21°55’40.77" 83°27'9.92" G-RW-13 to G-RW-14 = 0.17 0.17 8.6 2.4 2.5 3.7 G-RW-14 7A 21°55’40.95" 83°27'11.35" G-RW-14 to G-RW-15 = 0.71 0.71 8.9 1.2 1.7 6 Strengthening
Proposed G-RW-15 7A 21°55’42.60" 83°27'31.70" G-RW-15 to G-RW-16 = 0.76 0.76 9.3 1.6 1.5 6.2 Strengthening
Proposed G-RW-16 7A 21°55’42.85" 83°27'55.87" G-RW-16 to G-RW-17 = 1.03 1.03 9 1.3 1.8 5.9 Strengthening
Proposed G-RW-17 7A 21°55’27.37" 83°28'34.65" G-RW-17 to G-RW-18 = 1.12 1.12 8 1.2 1 5.8 Strengthening
Proposed

Min Mec Consultancy Pvt. Ltd.
Assessment of Impacts Due to Transportation of Coal for Lara STPP of NTPC Ltd. 21
Width location
Ro
ute
-1A
Ro
ute
-1B
Ro
ute
-2
Ro
ute
-3
Ro
ute
-4A
Ro
ute
-4B
Ro
ute
-5
Ro
ute
-6
Ro
ute
-7A
Ro
ute
-7B
Latitude, N Longitude, E Length of Stretch, km Length of Sections
Existing right of way, m
Existing Shoulder left side,
m
Existing Shoulder right side,
m
Existing carriageway width,
m
Proposed carriageway width (under widening/ strengthening/
construction), m
G-RW-18 7A 21°55’14.02" 83°29'5.91" G-RW-18 to G-RW-19 = 1.17 1.17 8.25 1.25 1.3 5.7 Strengthening Proposed
G-RW-19 7A 21°55’3.98" 83°29'47.13" G-RW-19 to G-RW-20 = 0.43 0.43 9.15 2 1.35 5.8 Strengthening Proposed
G-RW-20 7A 21°54’52.43" 83°29'56.71' G-RW-20 to G-RW-21 = 0.14 0.14 8.5 1.5 1.7 5.3 Widening Proposed G-RW-21 7A 21°54’51.52" 83°29'56.57" G-RW-21 to G-RW-22 = 0.41 0.41 5.85 1.2 1.15 3.5 Widening Proposed G-RW-22 7A 21°54’38.89" 83°29'45.66" G-RW-22 to G-RW-23 = 1.10 1.10 7 2.1 1.6 3.3 Widening Proposed G-RW-23 7A 21°54’4.88" 83°29'41.56" G-RW-23 to G-RW-24 = 0.96 0.96 5.2 1.2 0.9 3.1 Widening Proposed G-RW-24 7A 21°53’50.32" 83°29'19.12" G-RW-24 to G-RW-25 = 0.67 0.67 7.1 1.3 1.5 4.3 Widening Proposed G-RW-25 7A 21°53’27.84" 83°29'8.99" G-RW-25 to G-RW-26 = 0.91 0.91 7 1.4 1.6 4 No Change G-RW-26 7A 21°53’12.58" 83°29'32.58" G-RW-26 to G-RW-27 = 0.70 0.70 6.15 1.25 1.5 3.4 No Change G-RW-27 7A 21°52’58.01" 83°29'37.26" G-RW-27 to siding 5.75 1.15 1.1 3.5 No Change Widening and strengthening of road (G-RW-01 to G-RW-24) is being taken up by PWD, Raigarh through various Funds. NTPC shall fund for widening and strengthening of 6.275 Km on deposit work basis. Length of n 19.45 Section-q H-RW 01 7B 21°52'53.40" 83°29'27.90" H-RW-01 to H-RW-02 = 2.73 2.73 7.7 2.1 1.5 4.1 No Change H-RW 02 7B 21°51'28.80" 83°29'40.00" H-RW-02 to H-RW-03 = 0.22 0.22 5.3 0.8 0.5 4 No Change H-RW 03 7B 21°51'28.60" 83°29'38.00" H-RW-03 to H-RW-04 = 3.30 3.30 12.4 3.4 3 6 No Change H-RW 04 7B 21°52'14.80" 83°27'58.20" H-RW-04 to H-RW-05 = 4.60 4.60 10.1 1.9 1.7 6.5 No Change H-RW 05 7B 21°53'20.10" 83°25'37.80" H-RW-05 to H-RW-06 = 1.97 1.97 9.6 1.6 1 7 No Change H-RW 06 7B 21°53'30.90" 83°24'42.10" H-RW-06 to H-RW-07 = 0.61 0.61 10.8 2.1 1.5 7.2 No Change H-RW 07 7B 21°53'18.90" 83°24'37.40" H-RW-07 to H-RW-08 = 1.18 1.18 23.2 1.8 1.7 19.7 No Change H-RW 08 7B 21°52'43.50" 83°24'54.30" H-RW-08 to H-RW-09 = 7.07 7.07 8 2.1 1.9 4 No Change H-RW 09 7B 21°49'51.80" 83°26'49.00" H-RW-09 to H-RW-10 = 7.81 7.81 6.1 1.1 0.9 4.1 No Change H-RW 10 to H-RW 11
7B 21°46'58.50" 83°28'59.70'' H-RW-10 to H-RW-11 = 0.14 0.14 8.4 1.9 2.5 3.95 No Change
Length of q 29.63
Section-r I-RW 01 6 21°55'27.39" 83°22'6.69" I-RW 01 to I-RW 02=0.60 0.60 12.2 2.8 2.3 7.1 No change I-RW 02 6 21°55'15.85" 83°22'49.57" I-RW 02 to I-RW 03=0.33 0.33 14.8 4 3.8 7 No change I-RW 03 6 21°55'13.34" 83°22'38.47" I-RW 03 to I-RW 04=0.84 0.84 19.15 2.05 2.7 14.4 No change I-RW 04 6 21°55'13.99" 83°22'10.74" I-RW 04 to I-RW 05=0.75 0.75 17.9 2.3 2.3 13.3 No change I-RW 05 6 21°55'21.79" 83°21'49.34' I-RW 05 to I-RW 06=1.02 1.02 17.6 0.7 2.8 14.1 No change
Min Mec Consultancy Pvt. Ltd.
Assessment of Impacts Due to Transportation of Coal for Lara STPP of NTPC Ltd. 22
Width location
Ro
ute
-1A
Ro
ute
-1B
Ro
ute
-2
Ro
ute
-3
Ro
ute
-4A
Ro
ute
-4B
Ro
ute
-5
Ro
ute
-6
Ro
ute
-7A
Ro
ute
-7B
Latitude, N Longitude, E Length of Stretch, km Length of Sections
Existing right of way, m
Existing Shoulder left side,
m
Existing Shoulder right side,
m
Existing carriageway width,
m
Proposed carriageway width (under widening/ strengthening/
construction), m
I-RW 06 6 21°55'29.98" 83°21'18.25" I-RW 06 to I-RW 07=0.60 0.60 17.45 1.25 1.8 14.4 No change I-RW 07 6 21°55'49.11" 83°21'22.77" I-RW 07 to I-RW 08=1.05 1.05 10.7 0 0 10.7 No change I-RW 08 6 21°56'16.86" 83°21'9.42" I-RW 08 to I-RW 09=1.18 1.18 15.6 2.4 3 10.2 No change I-RW 09 6 21°56'28.59" 83°20'31.43" I-RW 09 to I-RW 10=1.03 1.03 14.4 1.95 2.45 10 No change I-RW 10 6 21°56'48.43" 83°20'2.13" I-RW 10 to I-RW 11=1.42 1.42 14.7 3.3 1.4 10 No change I-RW 11 6 21°57'19.79" 83°19'26.31" I-RW 11 to I-RW 12=1.09 1.09 14.6 2.7 2.2 9.7 No change I-RW 12 6 21°57'44.66" 83°19'0.69" I-RW 12 to I-RW 13=0.96 0.96 14.5 2.4 2 10.1 No change I-RW 13 6 21°57'58.14" 83°18'28.71" I-RW 13 to I-RW 14=1.18 1.18 14.3 2.2 1.9 10.2 No change I-RW 14 6 21°57'59.45" 83°17'46.84' I-RW 14 to I-RW 15=1.06 1.06 12.98 1.3 1.5 10.18 No change I-RW 15 6 21°58'7.32" 83°17'10.08" I-RW 15 to I-RW 16=0.80 0.80 13.7 2.3 1.7 9.7 No change I-RW 16 6 21°58'12.34" 83°16'43.32" I-RW 16 to I-RW 17=0.43 0.43 12.9 1.5 1.3 10.1 No change I-RW 17 6 21°58'17.59" 83°16'30.18" I-RW 17 to I-RW 18=0.85 0.85 12.1 0 2.1 10 No change I-RW 18 6 21°58'39.02" 83°16'7.95" I-RW 18 to I-RW 19=0.77 0.77 15.7 2.1 3.3 10.3 No change I-RW 19 6 21°59'0.31" 83°15'50.71" I-RW 19 to I-RW 20=0.85 0.85 14.3 2.3 2 10 No change I-RW 20 6 21°59'10.40" 83°15'29.48" I-RW 20 to I-RW 21=0.13 0.13 12.3 0 2.2 10.1 No change I-RW 21 6 21°59'9.79" 83°15'29.42" I-RW 21 to I-RW 22=0.31 0.31 12.9 0 0 12.9 No change I-RW 22 6 21°59'0.39" 83°15'25.45" I-RW 22 to I-RW 23=0.37 0.37 13.6 0 0 13.6 No change I-RW 23 6 21°58'47.78" 83°15'22.88" I-RW 23 to I-RW 24=0.20 0.20 9.1 0 0 9.1 No change
I-RW 24 to I-RW 25
6 21°58'38.68" 83°15'23.59" I-RW 24 to I-RW 25=0.16 0.16 11.2 0 0 11.2 No change
Length of r 17.98 Note:
Route 1A: Basundhra-Garjanbahal area to Lara STPP via Sections (j+i+g+e+c+b+a)
Route 1B: Basundhra-Garjanbahal area to Lara STPP via Sections (j+k+l+o+p+a)
Route 2: Ib valley area to Lara STPP via Sections (f+e+c+b+a)
Route 3: Lakhanpur area to Lara STPP via Sections (d+c+b+a)
Route 4A: Dulanga mines to Lara STPP via Sections (h+g+e+c+b+a)
Route 4B: Dulanga mines to Lara STPP via Sections (h+i+k+l+o+p+a)
Route 5: Raigarh area to Lara STPP via Sections (m+l+o+p+a)
Route 6: Bhupdeopur Railway siding to Lara STPP via Sections (o+r+p+a)
Route 7A: Kotarlia Railway siding to Lara STPP via Sections (n+p+a)
Route 7B: Kotarlia Railway siding to Lara STPP via Sections (q+b+a)

Min Mec Consultancy Pvt. Ltd.
Assessment of Impacts Due to Transportation of Coal for Lara STPP of NTPC Ltd. 23
Roads are provided with good shoulders on either sides, thus, can be expected to support 15% additional volume than the designed service volume as per IRC 64:1990.
The width of single lane road is <5.5 m, intermediate roads have width of
5.5 to <7 m, two lane road is 7.0 to <10 m and multi lane road has width >=10 m. Route wise width of the road is summarized in Table 6 from the above Table 5 and Fig. 3.
TABLE 6
SUMMARY OF ROUTE WISE WIDTH OF ROAD
Length of Stretch (in %) w.r.t. Type
Alternative Route No. Length, km
Single Lane
(<5.5 m)
Inter-mediate
(>=5.5 m)
Two Lane (>
7 m)
Multi-lane (>=10 m)
Route-1A (Section-j+i+g+e+c+b+a) 99.5 0.0 11.0 13.4 75.6
Route-1B (Section-j+k+l+o+p+a) 101.0 0.0 12.1 60.5 27.4
Route-2 (Section-f+e+c+b+a) 65.6 0.0 3.0 16.2 80.8
Route-3 (Section-d+c+b+a) 49.4 0.0 8.5 3.8 87.7
Route-4A (Section-h+g+e+c+b+a)
(i) existing width 90.4 6.5* 12.1 8.7 72.6
(ii)after widening, by August, 2018 90.4 0.0 18.6 8.7 72.6
Route-4B (Section-h+i+k+l+o+p+a)
(i) existing width 117.8 5.0* 10.4 53.1 31.6
(ii)after widening, by August, 2018 117.8 0.0 15.4 53.1 31.6
Route-5 (Section-m+l+o+p+a) 76.6 0.0 27.9 44.2 27.9
Route-6 (Section-r+o+p+a) 42.7 0.0 0.0 22.1 77.9
Route-7A (Section-n+p+a) 43.9 19.0 16.1 20.5 44.4
Route-7B (Section-q+b+a) 34.5 52.1 22.9 13.0 12.0 2.2 Traffic Volume Carrying Capacity of the Road In the study, the route considered is a rural highway, which is considered as
an all-purpose road, with no control of access and with heterogeneous mix of fast and slow-moving vehicles.
There are two terms which are to be considered - (a) Capacity and (b)
Design Service Volume
(i) Capacity is defined as the maximum hourly volume (Vehicles per hour) at which vehicles can reasonably be expected to traverse a point or uniform section of a lane or roadway during a given time period under the prevailing roadway, traffic and control conditions.

Min Mec Consultancy Pvt. Ltd.
Assessment of Impacts Due to Transportation of Coal for Lara STPP of NTPC Ltd. 24
(ii) Design Service Volume is defined as the maximum hourly volume (Vehicles per hour) at which vehicles can reasonably be expected to traverse a point or uniform section of a lane or roadway during a given time period under the prevailing roadway, traffic and control conditions while maintaining a designated level of service.
Under normal circumstance, use of Level of Service “B” (available from A to
F) is considered adequate for the design of rural highways. At this level, volume of traffic will be around 0.5 times the maximum capacity and this is taken as the “design service volume” for the purpose of adopting design values.
The recommended design service volume for plain roads with low curvature
(0-50 degrees/km), which is applicable to the study area, is given in Table 7.
TABLE 7
RECOMMENDED DESIGN SERVICE VOLUMES FOR PLAIN ROADS WITH LOW CURVATURE AS PER IRC: 64-1990
Type of Road
Description Recommended Design Service
Volume in PCU/day
Single Lane Roads
A single lane bi-directional road should have at least 3.75 metre wide paved carriageway with good quality shoulders such as moorum shoulders of minimum 1.0 metre width on either side.
2000
Intermediate Lane Roads
Intermediate lane roads should have a pavement width of around 5.5 metre with good usable shoulders on either side.
6000
Two Lane Roads
Two lane roads shall have a 7 metre wide carriageway and good earthen shoulders.
15000
Two Lane Roads +
Two lane roads + paved & surface shoulders of at-least 1.5 m width on either side.
17250
Source: Table 3, 4, 5 and section 10.3 of guidelines for capacity of roads in rural area (IRC: 64-1990)
In case of two lane roads, where the shoulder width or carriageway width on
a two lane road are restricted, there will be a certain reduction in capacity. Table 8 gives the recommended reduction factors in this account over the capacity values given in Table 7.
TABLE 8
CAPACITY REDUCTION FACTORS SUGGESTED FOR SUB-STANDARD LANE AND SHOULDER WIDTH ON TWO-LANE ROAD
Usable shoulder width, m 3.50 m lane 3.25 m lane 3.00 m lane
>/= 1.8 1.0 0.92 0.84 1.2 0.92 0.85 0.77

Min Mec Consultancy Pvt. Ltd.
Assessment of Impacts Due to Transportation of Coal for Lara STPP of NTPC Ltd. 25
Usable shoulder width, m 3.50 m lane 3.25 m lane 3.00 m lane
0.6 0.81 0.75 0.68 0 0.70 0.64 0.58
Source : Table 5 of guidelines for capacity of roads in rural area (IRC: 64-1990)
Similarly, the capacity of two lane roads can be increased by providing
paved and surface shoulders of at least 1.5 m width on either side. Provision of hard shoulders results in slow moving traffic, being able to travel on shoulders, which reduces the interference to fast traffic on the main carriageway. Under these circumstances, 15% increase in capacity can be expected vis-a-vis the values given in Table 7 earlier.
The result of presence of slow moving vehicles in traffic stream is that it
affects the free flow of traffic. A way of accounting for the interaction of various kind of vehicles is to express the capacity of roads in terms of common unit. Therefore, the number of vehicles have been converted into “passenger car units” (PCUs) using the equivalency factor as per Table 1 of IRC: 64-1990. The equivalency factors used have been given in Table 9 below.
TABLE 9
EQUIVALENCY FACTORS AS PER IRC: 64-1990
Sl. No.
Vehicle type Equivalency factor
Fast vehicles
1 Motor cycle or scooter 0.50 2 Passenger car, pickup van or auto-rickshaw 1.00 3 Agricultural tractor, light commercial vehicle 1.50 4 Truck and Bus 3.00 5 Truck-trailer, Agricultural Tractor-trailer 4.50 Slow vehicles
6 Cycle 0.50 7 Cycle rickshaw 2.00 8 Hand cart 3.00 9 Horse drawn vehicle 4.00
10 Bullock cart 8.00 Source: Table 1 of guidelines for capacity of roads in rural area (IRC: 64-1990)
(iii) Capacity of urban roads is also a function of the roadside fringe
conditions, e.g. parking, extent of commercial activities, frontage access etc. For purpose of recommendations given further on, the following fringe conditions are assumed:
Arterials : No frontage access, no standing vehicles, very
little cross traffic Sub-arterials : Frontage development, side roads, bus stops,
no standing vehicles, waiting restrictions Collectors : Free frontage access, parked vehicles, bus
stops, no waiting restrictions

Min Mec Consultancy Pvt. Ltd.
Assessment of Impacts Due to Transportation of Coal for Lara STPP of NTPC Ltd. 26
Design service volumes for different categories of urban roads corresponding to above referred conditions are given in Table 10.
TABLE 10
RECOMMENDED DESIGN SERVICE VOLUMES (PCU’S PER HOUR) AS PER IRC: 106-1990
Sl. No.
Type of carriageway Total Design Service Volumes for Different Categories of Urban Roads
Arterial* Sub-arterial** Collector***
1. 2-Lane (One-Way) 2400 1900 1400 2. 2-Lane (Two-Way) 1500 1200 900 3. 3-Lane (One-Way) 3600 2900 2200 4. 4-Lane Undivided (Two-Way) 3000 2400 1800 5. 4-Lane Divided (Two-Way) 3600 2900 - 6. 6-Lane Undivided (Two-Way) 4800 3800 - 7. 6-Lane Divided (Two-Way) 5400 4300 - 8. 8-Lane Divided (Two-Way) 7200 - -
* : Roads with no frontage access, no standing vehicles, very little cross traffic. **: Roads with frontage access but no standing vehicles and high capacity
intersections. *** : Roads with free frontage access, no standing vehicles, very little cross traffic.
Under normal circumstances, it is recommended that normally Level of
Service C be adopted for design of urban roads. At this level, volume of traffic will be around 0.70 times the maximum capacity and this is taken as the “design service volume” for the purpose of adopting design values.
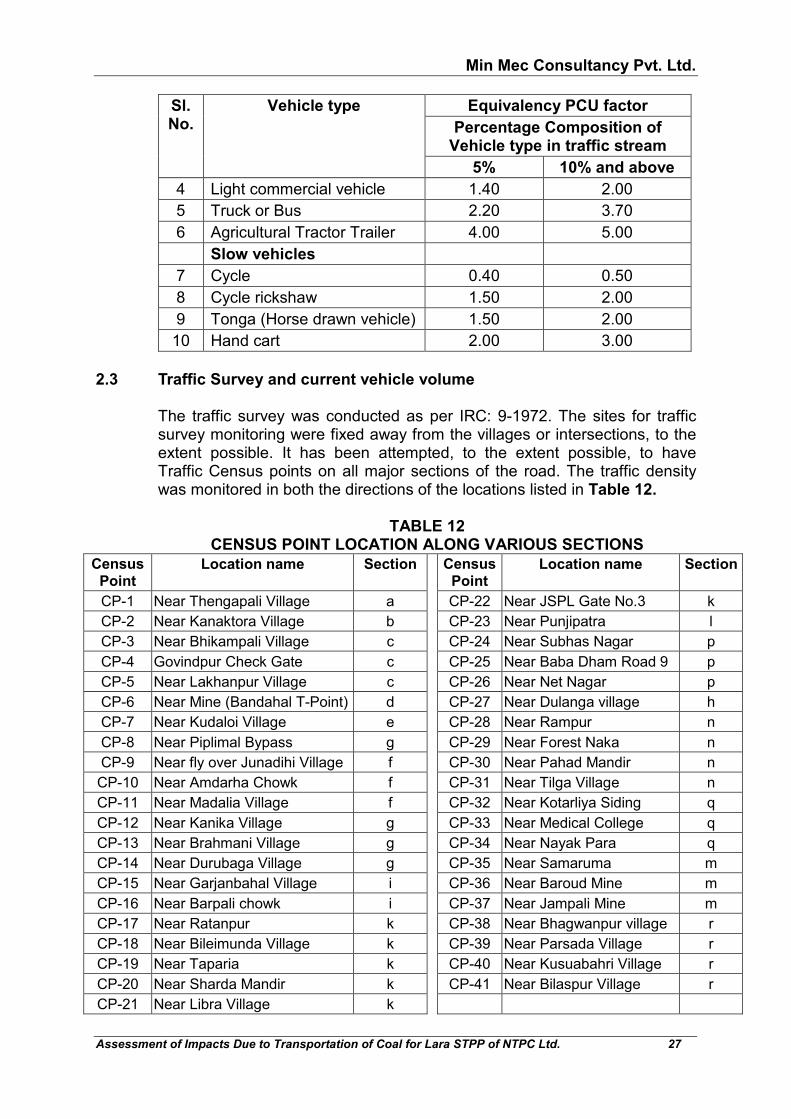
The equivalent PCU of different vehicle categories do not remain constant
under all circumstances. Rather, these are a function of the physical dimensions and operational speeds of respective vehicle classes. In urban situations, the speed differential amongst different vehicle classes is generally low, and as such the PCU factors are predominantly a function of the physical dimensions of the various vehicles. Nonetheless, the relative PCU of a particular vehicle type will be affected to a certain extent by increase in its proportion in the total traffic. Considering all these factors, the conversion factors as shown in Table 11 are recommended for adoption.
TABLE 11
EQUIVALENCY FACTORS AS PER IRC: 106-1990
Sl. No.
Vehicle type Equivalency PCU factor
Percentage Composition of Vehicle type in traffic stream
5% 10% and above
Fast vehicles
1 Two wheelers, Motor cycle or scooter
0.50 0.75
2 Passenger car, pickup van 1.00 1.00 3 Auto-Rickshaw 1.20 2.00
Min Mec Consultancy Pvt. Ltd.
Assessment of Impacts Due to Transportation of Coal for Lara STPP of NTPC Ltd. 27
Sl. No.
Vehicle type Equivalency PCU factor
Percentage Composition of Vehicle type in traffic stream
5% 10% and above
4 Light commercial vehicle 1.40 2.00 5 Truck or Bus 2.20 3.70 6 Agricultural Tractor Trailer 4.00 5.00 Slow vehicles
7 Cycle 0.40 0.50 8 Cycle rickshaw 1.50 2.00 9 Tonga (Horse drawn vehicle) 1.50 2.00 10 Hand cart 2.00 3.00
2.3 Traffic Survey and current vehicle volume The traffic survey was conducted as per IRC: 9-1972. The sites for traffic
survey monitoring were fixed away from the villages or intersections, to the extent possible. It has been attempted, to the extent possible, to have Traffic Census points on all major sections of the road. The traffic density was monitored in both the directions of the locations listed in Table 12.
TABLE 12
CENSUS POINT LOCATION ALONG VARIOUS SECTIONS
Census Point
Location name Section Census Point
Location name Section
CP-1 Near Thengapali Village a CP-22 Near JSPL Gate No.3 k CP-2 Near Kanaktora Village b CP-23 Near Punjipatra l CP-3 Near Bhikampali Village c CP-24 Near Subhas Nagar p CP-4 Govindpur Check Gate c CP-25 Near Baba Dham Road 9 p CP-5 Near Lakhanpur Village c CP-26 Near Net Nagar p CP-6 Near Mine (Bandahal T-Point) d CP-27 Near Dulanga village h CP-7 Near Kudaloi Village e CP-28 Near Rampur n CP-8 Near Piplimal Bypass g CP-29 Near Forest Naka n CP-9 Near fly over Junadihi Village f CP-30 Near Pahad Mandir n CP-10 Near Amdarha Chowk f CP-31 Near Tilga Village n CP-11 Near Madalia Village f CP-32 Near Kotarliya Siding q CP-12 Near Kanika Village g CP-33 Near Medical College q CP-13 Near Brahmani Village g CP-34 Near Nayak Para q CP-14 Near Durubaga Village g CP-35 Near Samaruma m CP-15 Near Garjanbahal Village i CP-36 Near Baroud Mine m CP-16 Near Barpali chowk i CP-37 Near Jampali Mine m CP-17 Near Ratanpur k CP-38 Near Bhagwanpur village r CP-18 Near Bileimunda Village k CP-39 Near Parsada Village r CP-19 Near Taparia k CP-40 Near Kusuabahri Village r CP-20 Near Sharda Mandir k CP-41 Near Bilaspur Village r CP-21 Near Libra Village k

Min Mec Consultancy Pvt. Ltd.
Assessment of Impacts Due to Transportation of Coal for Lara STPP of NTPC Ltd. 28
The locations can be seen in Fig. 2 and their photographs in Annexure 3. The monitoring was done at each location for a period of 24 hours continuously. The observed traffic density has been processed for an interval of 1 hour. The total no. of vehicles were calculated on hourly basis as well as for 24 hours. The monitoring plan included the following vehicles, namely, LMV, buses, trucks, motor cycles and scooters, cycles and others.
The outcome of the monitoring after processing the raw data has been
recorded in Annexure 4 in terms of vehicle count to arrive at the current vehicle volume. Since the traffic census points were surveyed in October 2016 and May, June, July and October 2017 the projection of the observed traffic count has been done to June, 2018 based on the procedure described in Section 2.5 later. Therefore the traffic projection has been done for a period of 20 months, 13 months, 12 months, 11 months and 8 months respectively. The initial and projected values are given in Annexure 4.
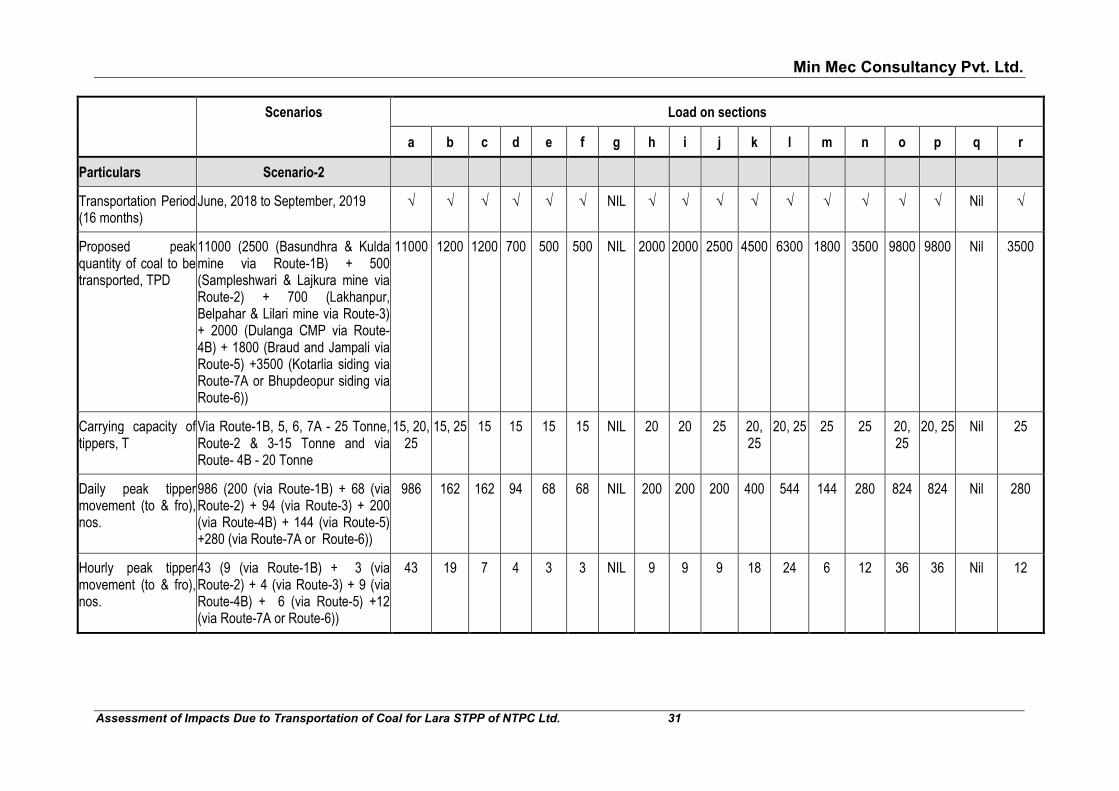
2.4 Additional Traffic on proposed route The traffic volume i.e. number of tippers to be moved from various mines
and sidings on corresponding routes has been discussed in section 1.1 earlier. For additional traffic due to plying of coal carrying tippers on proposed routes, two worst case scenarios i.e. Scenario-1&2 have been considered, which have been described in Table 13 and additional traffic on proposed routes are detailed in Table 14.
Apart from the Scenario 1&2, two more scenarios can be there in case of
change in coal transportation routes from Basundhra-Garjanbahal area and Dulanga CMP. i.e.
Scenario-3: transportation of coal to Lara STPP from Basundhra-
Garjanbahal area via route-1B, while from Dulanga CMP via route-4A. Scenario-4: transportation of coal to Lara STPP from Basundhra-
Garjanbahal area via route-1A, while from Dulanga CMP via route-4B. Peak truck movement will be there on the routes in only two scenarios i.e
scenario-1&2, as mentioned in Table 13. These two scenarios have been called as worst case scenarios for the purpose of this report. These two worst case scenario has been considered to assess the impact due to traffic movement including carrying capacity of the roads and air quality prediction modeling for pollutants, arising due to emissions from movement of tippers. As the impact due to transportation of coal in other two scenario i.e Scenario-3&4 (as explained above) will always be lower than that of scenario-1&2.
The calculations for the existing and proposed carrying capacity of the road
for Scenario-1 & 2 have been done in Table 15 and 16, respectively.

Min Mec Consultancy Pvt. Ltd.
Assessment of Impacts Due to Transportation of Coal for Lara STPP of NTPC Ltd. 29
TABLE 13 SCENARIOS UNDER WORST CASE FOR TRANSPORTATION OF COAL FROM VARIOUS MINES AND RAILWAY
SIDING TO LARA STPP
Sl. No.
From mine/railway sidings to Lara STPP via Route
Via Section
a b c d e f g h i j k l m n o p q r
Scenario-1
1 Basundhra-Garjanbahal area (Basundhra & Kulda mine) 1A √ √ √ - √ - √ - √ √ - - - - - - - -
2 Ib valley area (Samleshwari and lajkura Mine) 2 √ √ √ - √ √ - - - - - - - - - - - -
3 Lakhanpur area (Lakhanpur, Belpahar and Lilari Mine) 3 √ √ √ √ - - - - - - - - - - - - - -
4 Dulanga CMP 4A √ √ √ - √ - √ √ - - - - - - - - - -
5 Raigarh area (Baroud and Jampali mine) 5 √ - - - - - - - - - - √ √ - √ √ - -
6 Bhupdeopur railway siding, or 6 √ - - - - - - - - - - - - - √ √ - √
Kotarliya railway siding 7B √ √ - - - - - - - - - - - - - - √ -
Scenario-2
1 Basundhra-Garjanbahal area (Basundhra & Kulda mine) 1B √ - - - - - - - - √ √ √ - - √ √ - -
2 Ib valley area (Samleshwari and lajkura Mine) 2 √ √ √ - √ √ - - - - - - - - - - - -
3 Lakhanpur area (Lakhanpur, Belpahar and Lilari Mine) 3 √ √ √ √ - - - - - - - - - - - - - -
4 Dulanga CMP 4B √ - - - - - - √ √ - √ √ - - √ √ - -
5 Raigarh area (Baroud and Jampali mine) 5 √ - - - - - - - - - - √ √ - √ √ - -
6 Bhupdeopur railway siding, or 6 √ - - - - - - - - - - - - - √ √ - √
Kotarliya railway siding 7A √ - - - - - - - - - - - - √ - √ - - Note: (i) in case of railway siding, either Bhupdeopur railway siding or Kotarliya railway siding will be used for transportation of 3500 TPD of coal.

Min Mec Consultancy Pvt. Ltd.
Assessment of Impacts Due to Transportation of Coal for Lara STPP of NTPC Ltd. 30
TABLE 14 ADDITIONAL TRAFFIC ON PROPOSED ROUTES AND LOAD ON VARIOUS SECTIONS
Scenarios Load on sections
a b c d e f g h i j k l m n o p q r
Particulars Scenario-1
Transportation Period (16 months)
June, 2018 to September, 2019 √ √ √ √ √ √ √ √ √ √ Nil √ √ Nil √ √ √ √
Proposed peak quantity of coal to be transported, TPD
11000 (2500 (Basundhra & Kulda mine via Route-1A) + 500 (Sampleshwari & Lajkura mine via Route-2) + 700 (Lakhanpur, Belpahar & Lilari mine via Route-3) + 2000 (Dulanga CMP via Route-4A) + 1800 (Braud and Jampali via Route-5) +3500 (Kotarlia siding via Route-7B or Bhupdeopur siding via Route-6))
11000 9200 9200 700 5000 500 4500 2000 2500 2500 Nil 1800 1800 Nil 5300 5300 3500 3500
Carrying capacity of tippers, T
Via Route-1A, 5, 6, 7B - 25 Tonne, Route-2 & 3-15 Tonne and via Route- 4A - 20 Tonne
15, 20, 25
15, 20, 25
15, 20, 25
15 15, 20, 25
15 20, 25 20 25 25 Nil 25 25 Nil 25 25 25 25
Daily peak tipper movement (to & fro), nos.
986 (200 (via Route-1A) + 68 (via Route-2) + 94 (via Route-3) + 200 (via Route-4A) + 144 (via Route-5) +280 (via Route-7B or Route-6))
986 842 562 94 468 68 400 200 200 200 Nil 144 144 Nil 424 424 280 280
Hourly peak tipper movement (to & fro), nos.
43 (9 (via Route-1A) + 3 (via Route-2) + 4 (via Route-3) + 9 (via Route-4A) + 6 (via Route-5) +12 (via Route-7B or Route-6))
43 37 25 4 21 3 18 9 9 9 Nil 6 6 Nil 18 18 12 12
Min Mec Consultancy Pvt. Ltd.
Assessment of Impacts Due to Transportation of Coal for Lara STPP of NTPC Ltd. 31
Scenarios Load on sections
a b c d e f g h i j k l m n o p q r
Particulars Scenario-2
Transportation Period (16 months)
June, 2018 to September, 2019 √ √ √ √ √ √ NIL √ √ √ √ √ √ √ √ √ Nil √
Proposed peak quantity of coal to be transported, TPD
11000 (2500 (Basundhra & Kulda mine via Route-1B) + 500 (Sampleshwari & Lajkura mine via Route-2) + 700 (Lakhanpur, Belpahar & Lilari mine via Route-3) + 2000 (Dulanga CMP via Route-4B) + 1800 (Braud and Jampali via Route-5) +3500 (Kotarlia siding via Route-7A or Bhupdeopur siding via Route-6))
11000 1200 1200 700 500 500 NIL 2000 2000 2500 4500 6300 1800 3500 9800 9800 Nil 3500
Carrying capacity of tippers, T
Via Route-1B, 5, 6, 7A - 25 Tonne, Route-2 & 3-15 Tonne and via Route- 4B - 20 Tonne
15, 20, 25
15, 25 15 15 15 15 NIL 20 20 25 20, 25
20, 25 25 25 20, 25
20, 25 Nil 25
Daily peak tipper movement (to & fro), nos.
986 (200 (via Route-1B) + 68 (via Route-2) + 94 (via Route-3) + 200 (via Route-4B) + 144 (via Route-5) +280 (via Route-7A or Route-6))
986 162 162 94 68 68 NIL 200 200 200 400 544 144 280 824 824 Nil 280
Hourly peak tipper movement (to & fro), nos.
43 (9 (via Route-1B) + 3 (via Route-2) + 4 (via Route-3) + 9 (via Route-4B) + 6 (via Route-5) +12 (via Route-7A or Route-6))
43 19 7 4 3 3 NIL 9 9 9 18 24 6 12 36 36 Nil 12

Min Mec Consultancy Pvt. Ltd.
Assessment of Impacts Due to Transportation of Coal for Lara STPP of NTPC Ltd. 32
2.5 Growth in existing traffic It is proposed to use the road for coal transportation for a maximum of 16
months from August, 2018 to November, 2019. During this 16 months, the existing road traffic is likely to experience a natural growth also, which is affected by the following factors:
Economic 1. Gross National Product (GNP) or Gross Domestic Product (GDP)
2. Agricultural Output 3. Industrial Output
Demographic 4. Population 5. Rural/ Urban mix of population
The natural growth can be assessed through various ways which is related
to either one or more of the above parameters. Past trends of data related to traffic flow from census, vehicle registration or fuel sales can also be used, if available. In this case, being a rural road, past trend data was not available for sufficient number of years from authentic sources for extrapolations. Hence, an average growth rate of 1.40% has been assumed on the basis of 14.05% population growth rate in Odisha for the sections of routes which comes under Odisha State and 2.26% has been assumed on the basis of 22.6% population growth in Chhattisgarh for the sections of routes which comes under Chhattisgarh state in the previous decade, as per Census 2001 & 2011.
As traffic study data that was done in October 2016 and May, June, July
and October 2017 have been projected to June, 2018 based on the procedure described above (refer Annexure 4) and additional traffic on proposed route will be for 16 months. Therefore, the growth in traffic has been projected for next 16 months till November, 2019 on all the ten routes i.e. Route-1A, 1B, 2, 3, 4A, 4B, 5, 6, 7A and 7B, based on the formula prescribed by IRC:108-1996 (Guidelines for Traffic Prediction on Rural Highways) and same has been used in subsequent Tables 15 to 16 for the Scenario 1 to 2.
The formula used for projection is Pn = Po(1+r)n Where Pn = Traffic in the nth year Po = Traffic flow in the base year n = number of years (16 months)
r = annual rate of growth of traffic, expressed in decimals. (0.014 for Odisha and 0.0226 for Chhattisgarh)
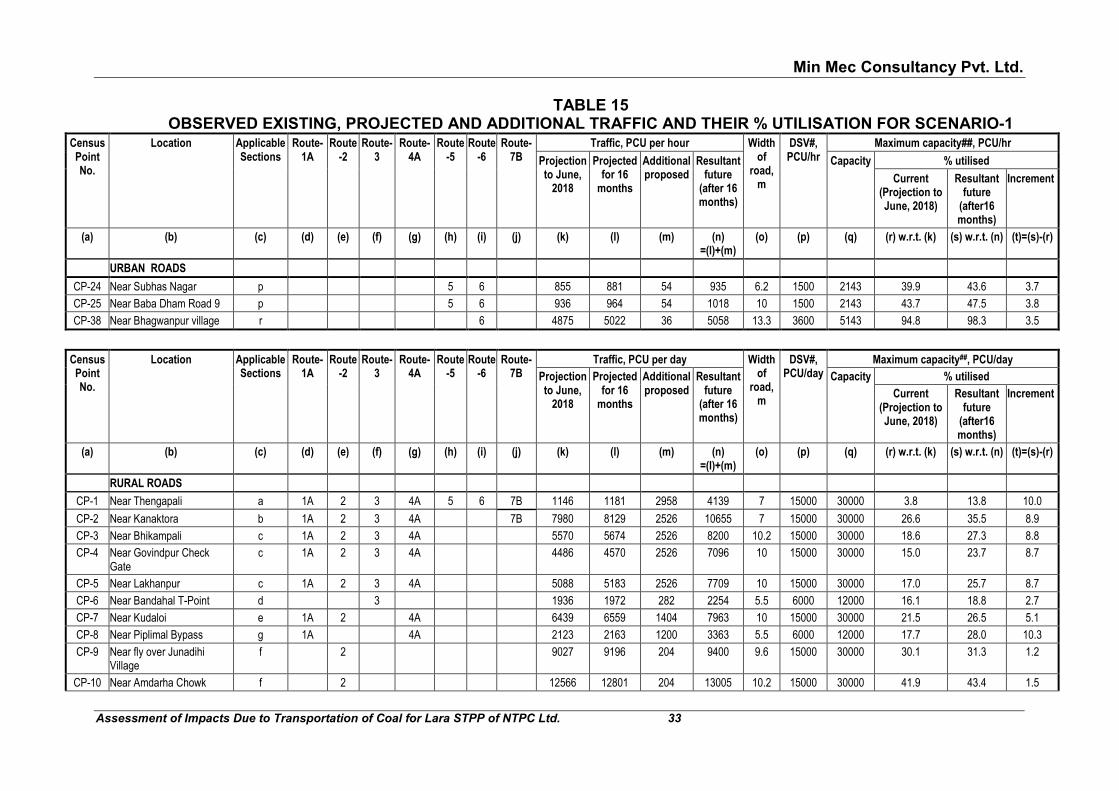
Both the Scenario-1 and 2 are given in the respective Table 15 and 16 showing the existing, projected (after 16 months), additional and total future traffic, road width, the design service volume according to road width, the maximum capacity and the percentage utilization of the maximum capacity with respect to existing and future traffic and the increment utilization expected.
Min Mec Consultancy Pvt. Ltd.
Assessment of Impacts Due to Transportation of Coal for Lara STPP of NTPC Ltd. 33
TABLE 15 OBSERVED EXISTING, PROJECTED AND ADDITIONAL TRAFFIC AND THEIR % UTILISATION FOR SCENARIO-1
Census Point No.
Location Applicable Sections
Route-1A
Route-2
Route-3
Route-4A
Route-5
Route-6
Route-7B
Traffic, PCU per hour Width of
road, m
DSV#, PCU/hr
Maximum capacity##, PCU/hr
Projection to June,
2018
Projected for 16
months
Additional proposed
Resultant future
(after 16 months)
Capacity % utilised
Current (Projection to June, 2018)
Resultant future
(after16 months)
Increment
(a) (b) (c) (d) (e) (f) (g) (h) (i) (j) (k) (l) (m) (n) =(l)+(m)
(o) (p) (q) (r) w.r.t. (k) (s) w.r.t. (n) (t)=(s)-(r)
URBAN ROADS
CP-24 Near Subhas Nagar p 5 6 855 881 54 935 6.2 1500 2143 39.9 43.6 3.7
CP-25 Near Baba Dham Road 9 p 5 6 936 964 54 1018 10 1500 2143 43.7 47.5 3.8
CP-38 Near Bhagwanpur village r 6 4875 5022 36 5058 13.3 3600 5143 94.8 98.3 3.5
Census Point No.
Location Applicable Sections
Route-1A
Route-2
Route-3
Route-4A
Route-5
Route-6
Route-7B
Traffic, PCU per day Width of
road, m
DSV#, PCU/day
Maximum capacity##, PCU/day
Projection to June,
2018
Projected for 16
months
Additional proposed
Resultant future
(after 16 months)
Capacity % utilised
Current (Projection to June, 2018)
Resultant future
(after16 months)
Increment
(a) (b) (c) (d) (e) (f) (g) (h) (i) (j) (k) (l) (m) (n) =(l)+(m)
(o) (p) (q) (r) w.r.t. (k) (s) w.r.t. (n) (t)=(s)-(r)
RURAL ROADS
CP-1 Near Thengapali a 1A 2 3 4A 5 6 7B 1146 1181 2958 4139 7 15000 30000 3.8 13.8 10.0
CP-2 Near Kanaktora b 1A 2 3 4A 7B 7980 8129 2526 10655 7 15000 30000 26.6 35.5 8.9
CP-3 Near Bhikampali c 1A 2 3 4A 5570 5674 2526 8200 10.2 15000 30000 18.6 27.3 8.8
CP-4 Near Govindpur Check Gate
c 1A 2 3 4A 4486 4570 2526 7096 10 15000 30000 15.0 23.7 8.7
CP-5 Near Lakhanpur c 1A 2 3 4A 5088 5183 2526 7709 10 15000 30000 17.0 25.7 8.7
CP-6 Near Bandahal T-Point d 3 1936 1972 282 2254 5.5 6000 12000 16.1 18.8 2.7
CP-7 Near Kudaloi e 1A 2 4A 6439 6559 1404 7963 10 15000 30000 21.5 26.5 5.1
CP-8 Near Piplimal Bypass g 1A 4A 2123 2163 1200 3363 5.5 6000 12000 17.7 28.0 10.3
CP-9 Near fly over Junadihi Village
f 2 9027 9196 204 9400 9.6 15000 30000 30.1 31.3 1.2
CP-10 Near Amdarha Chowk f 2 12566 12801 204 13005 10.2 15000 30000 41.9 43.4 1.5

Min Mec Consultancy Pvt. Ltd.
Assessment of Impacts Due to Transportation of Coal for Lara STPP of NTPC Ltd. 34
Census Point No.
Location Applicable Sections
Route-1A
Route-2
Route-3
Route-4A
Route-5
Route-6
Route-7B
Traffic, PCU per day Width of
road, m
DSV#, PCU/day
Maximum capacity##, PCU/day
Projection to June,
2018
Projected for 16
months
Additional proposed
Resultant future
(after 16 months)
Capacity % utilised
Current (Projection to June, 2018)
Resultant future
(after16 months)
Increment
(a) (b) (c) (d) (e) (f) (g) (h) (i) (j) (k) (l) (m) (n) =(l)+(m)
(o) (p) (q) (r) w.r.t. (k) (s) w.r.t. (n) (t)=(s)-(r)
CP-11 Near Madalia Village f 2 4047 4123 204 4327 5.8 6000 12000 33.7 36.1 2.3
CP-12 Near Kanika Village g 1A 4A 3177 3236 1200 4436 7 15000 30000 10.6 14.8 4.2
CP-13 Near Brahmani Village g 1A 4A 8261 8416 1200 9616 20.1 17250 34500 23.9 27.9 3.9
CP-14 Near Durubaga Village g 1A 4A 9860 10044 1200 11244 20 17250 34500 28.6 32.6 4.0
CP-15 Near Garjanbahal Village i 1A 10118 10307 600 10907 20 17250 34500 29.3 31.6 2.3
CP-16 Near Barpali chowk i 1A 13062 13306 600 13906 8 15000 30000 43.5 46.4 2.8
CP-23 Near Punjipatra l 5 6097 6281 432 6713 7 15000 30000 20.3 22.4 2.1
CP-26 Near Net Nagar p 5 6 6900 7109 1272 8381 10.1 15000 30000 23.0 27.9 4.9
CP-27 Near Dulanga Village h 4A 781 796 600 1396 3.8 2000 4000 19.5 34.9 15.4
CP-32 Near Kotarliya Siding q 7B 158 163 840 1003 3.4 2000 4000 4.0 25.1 21.1
CP-33 Near Medical College q 7B 251 259 840 1099 4 2000 4000 6.3 27.5 21.2
CP-34 Near Nayak Para q 7B 257 265 840 1105 4.1 2000 4000 6.4 27.6 21.2
CP-35 Near Samaruma m 5 3172 3268 432 3700 6 6000 12000 26.4 30.8 4.4
CP-36 Near Baraud Mine m 5 2774 2858 432 3290 6.3 6000 12000 23.1 27.4 4.3
CP-37 Near Jampali Mine m 5 2082 2145 432 2577 5.7 6000 12000 17.4 21.5 4.1
CP-39 Near Parsada Village r 6 7523 7751 840 8591 9.7 17250 34500 21.8 24.9 3.1
CP-40 Near Kusuabahri Village r 6 14978 15431 840 16271 9.7 17250 34500 43.4 47.2 3.8
CP-41 Near Bilaspur Village r 6 7749 7983 840 8823 10.3 17250 34500 22.5 25.6 3.1 Note- # Design Service Volume (DSV) in PCU/day as per Table 3&4 of IRC:64-1990 ## Maximum capacity as per IRC 64-1990, section 6.1 = DSV/0.7, in PCU/Hour for Urban area ## MAXIMUM CAPACITY AS PER IRC 64-1990, SECTION 6.1 = DSV/0.5, IN PCU/DAY
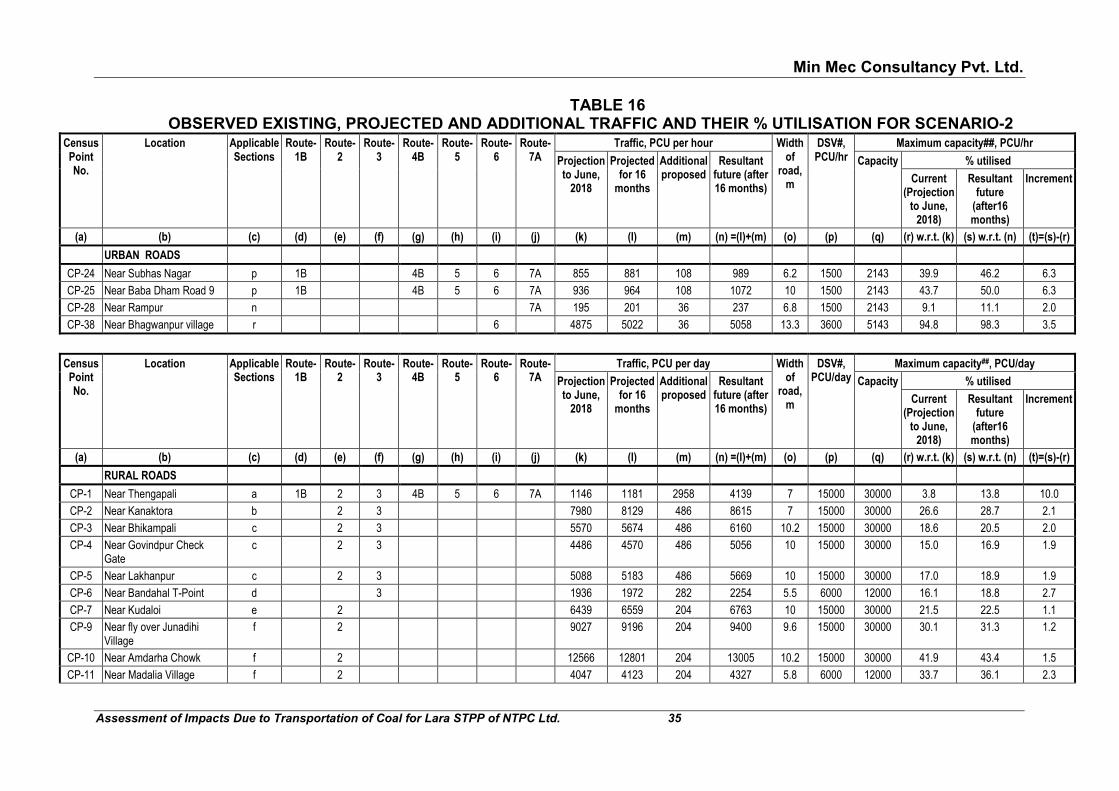
Min Mec Consultancy Pvt. Ltd.
Assessment of Impacts Due to Transportation of Coal for Lara STPP of NTPC Ltd. 35
TABLE 16 OBSERVED EXISTING, PROJECTED AND ADDITIONAL TRAFFIC AND THEIR % UTILISATION FOR SCENARIO-2
Census Point No.
Location Applicable Sections
Route-1B
Route-2
Route-3
Route-4B
Route-5
Route-6
Route-7A
Traffic, PCU per hour Width of
road, m
DSV#, PCU/hr
Maximum capacity##, PCU/hr
Projection to June,
2018
Projected for 16
months
Additional proposed
Resultant future (after 16 months)
Capacity % utilised
Current (Projection
to June, 2018)
Resultant future
(after16 months)
Increment
(a) (b) (c) (d) (e) (f) (g) (h) (i) (j) (k) (l) (m) (n) =(l)+(m) (o) (p) (q) (r) w.r.t. (k) (s) w.r.t. (n) (t)=(s)-(r)
URBAN ROADS
CP-24 Near Subhas Nagar p 1B 4B 5 6 7A 855 881 108 989 6.2 1500 2143 39.9 46.2 6.3
CP-25 Near Baba Dham Road 9 p 1B 4B 5 6 7A 936 964 108 1072 10 1500 2143 43.7 50.0 6.3
CP-28 Near Rampur n 7A 195 201 36 237 6.8 1500 2143 9.1 11.1 2.0
CP-38 Near Bhagwanpur village r 6 4875 5022 36 5058 13.3 3600 5143 94.8 98.3 3.5
Census Point No.
Location Applicable Sections
Route-1B
Route-2
Route-3
Route-4B
Route-5
Route-6
Route-7A
Traffic, PCU per day Width of
road, m
DSV#, PCU/day
Maximum capacity##, PCU/day
Projection to June,
2018
Projected for 16
months
Additional proposed
Resultant future (after 16 months)
Capacity % utilised
Current (Projection
to June, 2018)
Resultant future
(after16 months)
Increment
(a) (b) (c) (d) (e) (f) (g) (h) (i) (j) (k) (l) (m) (n) =(l)+(m) (o) (p) (q) (r) w.r.t. (k) (s) w.r.t. (n) (t)=(s)-(r)
RURAL ROADS
CP-1 Near Thengapali a 1B 2 3 4B 5 6 7A 1146 1181 2958 4139 7 15000 30000 3.8 13.8 10.0
CP-2 Near Kanaktora b 2 3 7980 8129 486 8615 7 15000 30000 26.6 28.7 2.1
CP-3 Near Bhikampali c 2 3 5570 5674 486 6160 10.2 15000 30000 18.6 20.5 2.0
CP-4 Near Govindpur Check Gate
c 2 3 4486 4570 486 5056 10 15000 30000 15.0 16.9 1.9
CP-5 Near Lakhanpur c 2 3 5088 5183 486 5669 10 15000 30000 17.0 18.9 1.9
CP-6 Near Bandahal T-Point d 3 1936 1972 282 2254 5.5 6000 12000 16.1 18.8 2.7
CP-7 Near Kudaloi e 2 6439 6559 204 6763 10 15000 30000 21.5 22.5 1.1
CP-9 Near fly over Junadihi Village
f 2 9027 9196 204 9400 9.6 15000 30000 30.1 31.3 1.2
CP-10 Near Amdarha Chowk f 2 12566 12801 204 13005 10.2 15000 30000 41.9 43.4 1.5
CP-11 Near Madalia Village f 2 4047 4123 204 4327 5.8 6000 12000 33.7 36.1 2.3

Min Mec Consultancy Pvt. Ltd.
Assessment of Impacts Due to Transportation of Coal for Lara STPP of NTPC Ltd. 36
Census Point No.
Location Applicable Sections
Route-1B
Route-2
Route-3
Route-4B
Route-5
Route-6
Route-7A
Traffic, PCU per day Width of
road, m
DSV#, PCU/day
Maximum capacity##, PCU/day
Projection to June,
2018
Projected for 16
months
Additional proposed
Resultant future (after 16 months)
Capacity % utilised
Current (Projection
to June, 2018)
Resultant future
(after16 months)
Increment
(a) (b) (c) (d) (e) (f) (g) (h) (i) (j) (k) (l) (m) (n) =(l)+(m) (o) (p) (q) (r) w.r.t. (k) (s) w.r.t. (n) (t)=(s)-(r)
CP-15 Near Garjanbahal Village i 4B 10118 10307 600 10907 20 17250 34500 29.3 31.6 2.3
CP-16 Near Barpali chowk i 4B 13062 13306 600 13906 8 15000 30000 43.5 46.4 2.8
CP-17 Near Ratanpur k 1B 4B 7370 7508 1200 8708 7 15000 30000 24.6 29.0 4.5
CP-18 Near Bileimunda Village k 1B 4B 6901 7030 1200 8230 7 15000 30000 23.0 27.4 4.4
CP-19 Near Taparia k 1B 4B 6656 6857 1200 8057 7 15000 30000 22.2 26.9 4.7
CP-20 Near Sharda Mandir k 1B 4B 8404 8658 1200 9858 7 15000 30000 28.0 32.9 4.9
CP-21 Near Libra Village k 1B 4B 6430 6624 1200 7824 7 15000 30000 21.4 26.1 4.7
CP-22 Near JSPL Gate No.3 k 1B 4B 9243 9523 1200 10723 16.5 15000 30000 30.8 35.7 4.9
CP-23 Near Punjipatra l 1B 4B 5 6097 6281 1632 7913 7 15000 30000 20.3 26.4 6.1
CP-26 Near Net Nagar p 1B 4B 5 6 7A 6900 7109 2472 9581 10.1 15000 30000 23.0 31.9 8.9
CP-27 Near Dulanga Village h 4B 781 796 600 1396 3.8 2000 4000 19.5 34.9 15.4
CP-29 Near Forest Naka n 7A 3166 3262 840 4102 10 15000 30000 10.6 13.7 3.1
CP-30 Near Pahad Mandir n 7A 1346 1387 840 2227 3.7 2000 4000 33.7 55.7 22.0
CP-31 Near Tilga Village n 7A 363 374 840 1214 3.4 2000 4000 9.1 30.4 21.3
CP-35 Near Samaruma m 5 3172 3268 432 3700 6 6000 12000 26.4 30.8 4.4
CP-36 Near Baraud Mine m 5 2774 2858 432 3290 6.3 6000 12000 23.1 27.4 4.3
CP-37 Near Jampali Mine m 5 2082 2145 432 2577 5.7 6000 12000 17.4 21.5 4.1
CP-39 Near Parsada Village r 6 7523 7751 840 8591 9.7 17250 34500 21.8 24.9 3.1
CP-40 Near Kusuabahri Village r 6 14978 15431 840 16271 9.7 17250 34500 43.4 47.2 3.8
CP-41 Near Bilaspur Village r 6 7749 7983 840 8823 10.3 17250 34500 22.5 25.6 3.1 Note- # Design Service Volume (DSV) in PCU/day as per Table 3&4 of IRC:64-1990 ## Maximum capacity as per IRC 64-1990, section 6.1 = DSV/0.7, in PCU/Hour for Urban area ## Maximum capacity as per IRC 64-1990, section 6.1 = DSV/0.5, in PCU/day
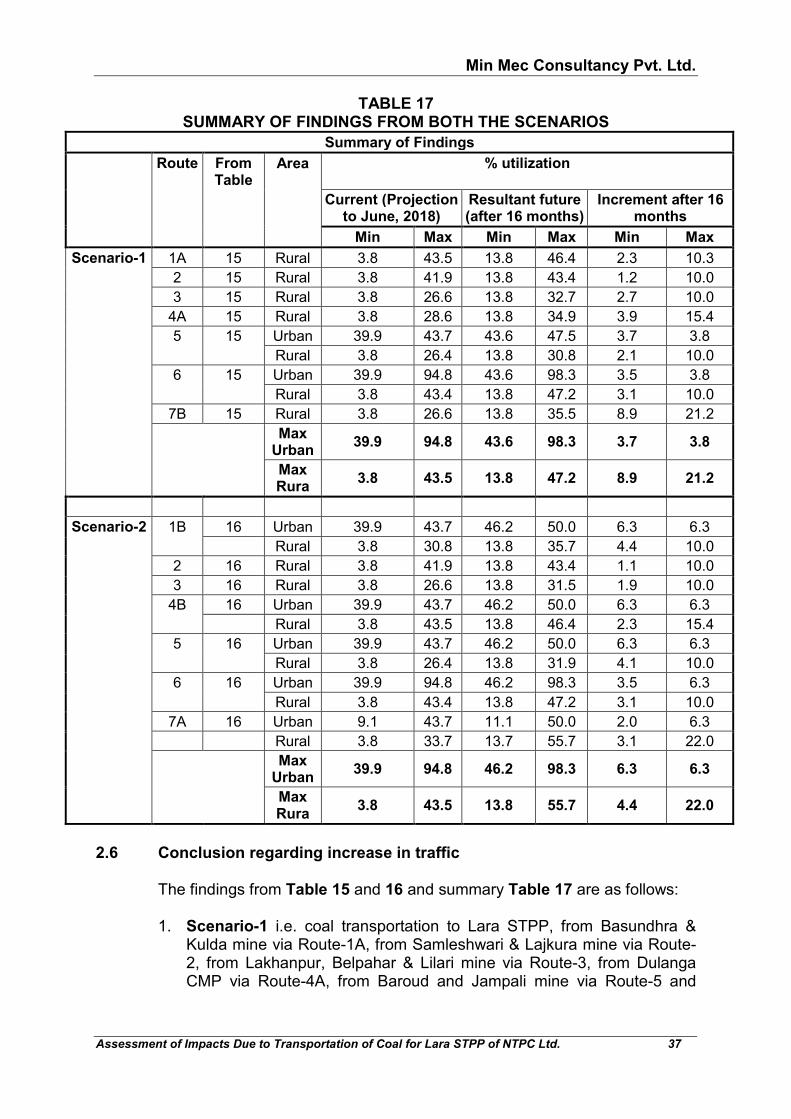
Min Mec Consultancy Pvt. Ltd.
Assessment of Impacts Due to Transportation of Coal for Lara STPP of NTPC Ltd. 37
TABLE 17 SUMMARY OF FINDINGS FROM BOTH THE SCENARIOS
Summary of Findings
Route From Table
Area % utilization
Current (Projection to June, 2018)
Resultant future (after 16 months)
Increment after 16 months
Min Max Min Max Min Max
Scenario-1 1A 15 Rural 3.8 43.5 13.8 46.4 2.3 10.3 2 15 Rural 3.8 41.9 13.8 43.4 1.2 10.0 3 15 Rural 3.8 26.6 13.8 32.7 2.7 10.0 4A 15 Rural 3.8 28.6 13.8 34.9 3.9 15.4 5 15 Urban 39.9 43.7 43.6 47.5 3.7 3.8 Rural 3.8 26.4 13.8 30.8 2.1 10.0 6 15 Urban 39.9 94.8 43.6 98.3 3.5 3.8 Rural 3.8 43.4 13.8 47.2 3.1 10.0 7B 15 Rural 3.8 26.6 13.8 35.5 8.9 21.2 Max
Urban 39.9 94.8 43.6 98.3 3.7 3.8
Max Rura
3.8 43.5 13.8 47.2 8.9 21.2
Scenario-2 1B 16 Urban 39.9 43.7 46.2 50.0 6.3 6.3
Rural 3.8 30.8 13.8 35.7 4.4 10.0 2 16 Rural 3.8 41.9 13.8 43.4 1.1 10.0 3 16 Rural 3.8 26.6 13.8 31.5 1.9 10.0 4B 16 Urban 39.9 43.7 46.2 50.0 6.3 6.3 Rural 3.8 43.5 13.8 46.4 2.3 15.4 5 16 Urban 39.9 43.7 46.2 50.0 6.3 6.3 Rural 3.8 26.4 13.8 31.9 4.1 10.0 6 16 Urban 39.9 94.8 46.2 98.3 3.5 6.3 Rural 3.8 43.4 13.8 47.2 3.1 10.0 7A 16 Urban 9.1 43.7 11.1 50.0 2.0 6.3 Rural 3.8 33.7 13.7 55.7 3.1 22.0 Max
Urban 39.9 94.8 46.2 98.3 6.3 6.3
Max Rura
3.8 43.5 13.8 55.7 4.4 22.0
2.6 Conclusion regarding increase in traffic
The findings from Table 15 and 16 and summary Table 17 are as follows:
1. Scenario-1 i.e. coal transportation to Lara STPP, from Basundhra & Kulda mine via Route-1A, from Samleshwari & Lajkura mine via Route-2, from Lakhanpur, Belpahar & Lilari mine via Route-3, from Dulanga CMP via Route-4A, from Baroud and Jampali mine via Route-5 and

Min Mec Consultancy Pvt. Ltd.
Assessment of Impacts Due to Transportation of Coal for Lara STPP of NTPC Ltd. 38
from Bhupdeopur siding via Route-6 or from Kotarlia Railway siding via Route-7B.
From the Table 15 and 17 above, it is clear that the present road width of all
the seven proposed routes i.e. Route-1A, 2, 3, 4A, 5, 6 & 7B is sufficient to carry existing traffic load, later after 16 months (August, 2018 to November, 2019) as well as additional proposed traffic load. In this case of scenario-1, the resultant future load (on November, 2019) will vary between 43.6% to 98.3% of the maximum capacity of Urban road and between 13.8% to 47.2% of the maximum capacity of Rural road.
2. Similarly in case of Scenario-2 i.e. coal transportation to Lara STPP,
from Basundhra & Kulda mine via Route-1B, from Samleshwari & Lajkura mine via Route-2, from Lakhanpur, Belpahar & Lilari mine via Route-3, from Dulanga CMP via Route-4B, from Baroud and Jampali mine via Route-5 and from Bhupdeopur siding via Route-6 or from Kotarlia Railway siding via Route-7A.
It is clear from the Table 16 and 17 that the present road width of all the
seven proposed routes i.e. Route-1B, 2, 3, 4B, 5, 6 & 7A is sufficient to carry existing traffic load, later after 16 months (August, 2018 to November, 2019) as well as additional proposed traffic load. in case of scenario-2, the resultant future load (on November, 2019) will vary on urban area road between 46.2% to 98.3% and on rural area road between 13.8% to 55.7% of the maximum capacity of road.
However, It may be noted that there are no-entry timings for trucks in Gopalpur, Ratanpur, Bileimunda, Taparia, Khuruslenga and Dhaurabhanta village on Route-1A & 4B from 9:00-10:00 AM in morning, 1:00-2:00 PM in afternoon and from 5:00-6:00 PM in evening and in Barpali, Durubaga, Garjanbahal and Kanika villages which lies on Route-1A, 4A & 4B from 9.30-10.30 AM and 3.30-4.30 PM. Due to this there will be backlog of trucks needing to pass through this stretch of route. Usually, in such scenario, the trucks will park on roadsides, empty plots, food shacks (dhaba), petrol pumps etc. and slow down the general traffic.
3.0 SATELLITE IMAGES FROM GOOGLE EARTH Satellite images of the entire route for coal transportation from various
mines and sidings to Lara STPP have been prepared, using Google Earth. The maps were prepared to give a birds eye view of the area around roads and the land uses along it. The satellite images are given in Annexure 5.
3.1 Village & Habitation Study The villages lying within 100 m on both sides of the road, along its entire
length (Route-1A, 1B, 2, 3, 4A, 4B, 5, 6, 7A and 7B) were identified during field visit. The district, tehsil, route along which they are falling and population of the villages is given in Table 18 and also shown in Fig. 4.

Min Mec Consultancy Pvt. Ltd.
Assessment of Impacts Due to Transportation of Coal for Lara STPP of NTPC Ltd. 39
TABLE 18 LOCATION OF VILLAGES ALONG ROUTES AND THEIR POPULATION
Sl. No. Name of Village Tehsil District Population as per Census 2011 (except */#)
Distance from road
(m) Ro
ute
-
1A
Ro
ute
-
1B
Ro
ute
-
2
Ro
ute
-3
Ro
ute
-
4A
Ro
ute
-
4B
Ro
ute
-5
Ro
ute
-
6
Ro
ute
-
7A
Ro
ute
-
7B
1. Thengapali Pusour Raigarh 410 40 √ √ √ √ √ √ √ √ √ √
2. Dipapara Rengali Jharsuguda 150* 60 √ - √ √ √ - - - - √
3. Karlabahal Rengali Jharsuguda 144* 12 √ - √ √ √ - - - - -
4. Kanjijharan Rengali Jharsuguda 219 10 √ - √ √ √ - - - - -
5. Baigadera Rengali Jharsuguda 65* 30 √ - √ √ √ - - - - -
6. Bhikampali Rengali Jharsuguda 920 0 √ - √ √ √ - - - - -
7. Panchgaon Rengali Jharsuguda 666 0 √ - √ √ √ - - - - -
8. Mahasingh Rengali Jharsuguda 529 0 √ - √ √ √ - - - - -
9. Katarbaga Rengali Jharsuguda 1134 50 √ - √ √ √ - - - - -
10. Jamgaon Rengali Jharsuguda 1713 12 √ - √ √ √ - - - - -
11. Telen Rengali Jharsuguda 278 40 √ - √ √ √ - - - - -
12. Kuremal Rengali Jharsuguda 687 8 √ - √ √ √ - - - - -
13. Samarbaga Rengali Jharsuguda 784 8 √ - √ √ √ - - - - -
14. Gobindpur Rengali Jharsuguda 555 0 √ - √ √ √ - - - - -
15. Kadamdihi Rengali Jharsuguda 690 0 √ - √ √ √ - - - - -
16. Patrapali Lakhanpur Jharsuguda 328 30 √ - √ √ √ - - - - -
17. Singharpur Lakhanpur Jharsuguda 964 50 √ - √ √ √ - - - - -
18. Gaurparha Lakhanpur Jharsuguda 250* 38 √ - √ √ √ - - - - -
19. Gangaparha Lakhanpur Jharsuguda 354* 50 √ - √ √ √ - - - - -
20. Kusraloi Lakhanpur Jharsuguda 1848 8 √ - √ - √ - - - - -
21. Piplimal Belpahar Jharsuguda 2275 30 √ - - - √ - - - - -
22. Chaurimol Hemgir Sundargarh 2000* 0 √ - - - √ - - - - -
23. Grindola Hemgir Sundargarh 8000* 0 √ - - - √ - - - - -
24. Kaudarha Hemgir Sundargarh 1044 0 √ - - - √ - - - - -
25. Kanika Hemgir Sundargarh 3587 0 √ - - - √ - - - - -

Min Mec Consultancy Pvt. Ltd.
Assessment of Impacts Due to Transportation of Coal for Lara STPP of NTPC Ltd. 40
Sl. No. Name of Village Tehsil District Population as per Census 2011 (except */#)
Distance from road
(m) Ro
ute
-
1A
Ro
ute
-
1B
Ro
ute
-
2
Ro
ute
-3
Ro
ute
-
4A
Ro
ute
-
4B
Ro
ute
-5
Ro
ute
-
6
Ro
ute
-
7A
Ro
ute
-
7B
26. Kanika Sundargarh Sundargarh 399 55 √ - - - √ - - - - -
27. Kamalga Hemgir Sundargarh 115 25 √ - - - √ - - - - -
28. Budhajharia Hemgir Sundargarh 218 60 √ - - - √ - - - - -
29. Durubaga Hemgir Sundargarh 972 0 √ - - √ √ - - - -
30. Garjanbahal Hemgir Sundargarh 1288 0 √ - - √ - - - -
31. Brahmani Hemgir Sundargarh 58 65 √ - - - √ - - - - -
32. Majhaparha Dharuadihi Sundargarh 2262 85 √ - - - - - - - - -
33. Balinga (Bailanga) Hemgir Sundargarh 1028 90 √ - - - - - - - - -
34. Belpahar + out growth Belpahar Jharsuguda 38993 0 - - √ - - - - - - -
35. Madalia & Burhijam merged in Brajraj nagar municipality
Orient Jharsuguda 80403 (municipality population)
0 - - √ - - - - - - -
36. Netnagar Pussore Raigarh 1450 15 - √ - - - √ √ √ √ -
37. Jhalmala Pussore Raigarh 1018 45 - √ - - - √ √ √ √ -
38. Dumarpali Pussore Raigarh 917 8 - √ - - - √ √ √ √ -
39. Garh Umaria Raigarh 4206 12 - √ - - - √ √ √ √ -
40. Raigarh (city+Out growth)
Raigarh 150019 0 - √ - - - √ √ √ √ -
41. Gerwani Raigarh Raigarh 2219 0 - √ - - - √ √ - - -
42. Taraimal Tamnar Raigarh 3951 5 - √ - - - √ √ - - -
43. Jhingolpara Tamnar Raigarh 330# 0 - √ - - - √ - - - -
44. Amaghat Tamnar Raigarh 1116 90 - √ - - - √ - - - -
45. Godhi Tamnar Raigarh 2251 0 - √ - - - √ - - - -
46. Tamnar Tamnar Raigarh 5465 0 - √ - - - √ - - - -
47. Salihabhanttha Tamnar Raigarh 1041 0 - √ - - - √ - - - -
48. Jhinku bahal Tamnar Raigarh 905 0 - √ - - - √ - - - -
49. Libara Tamnar Raigarh 1418 10 - √ - - - √ - - - -
50. Pathandhipa Tamnar Raigarh 350# 40 - √ - - - √ - - - -
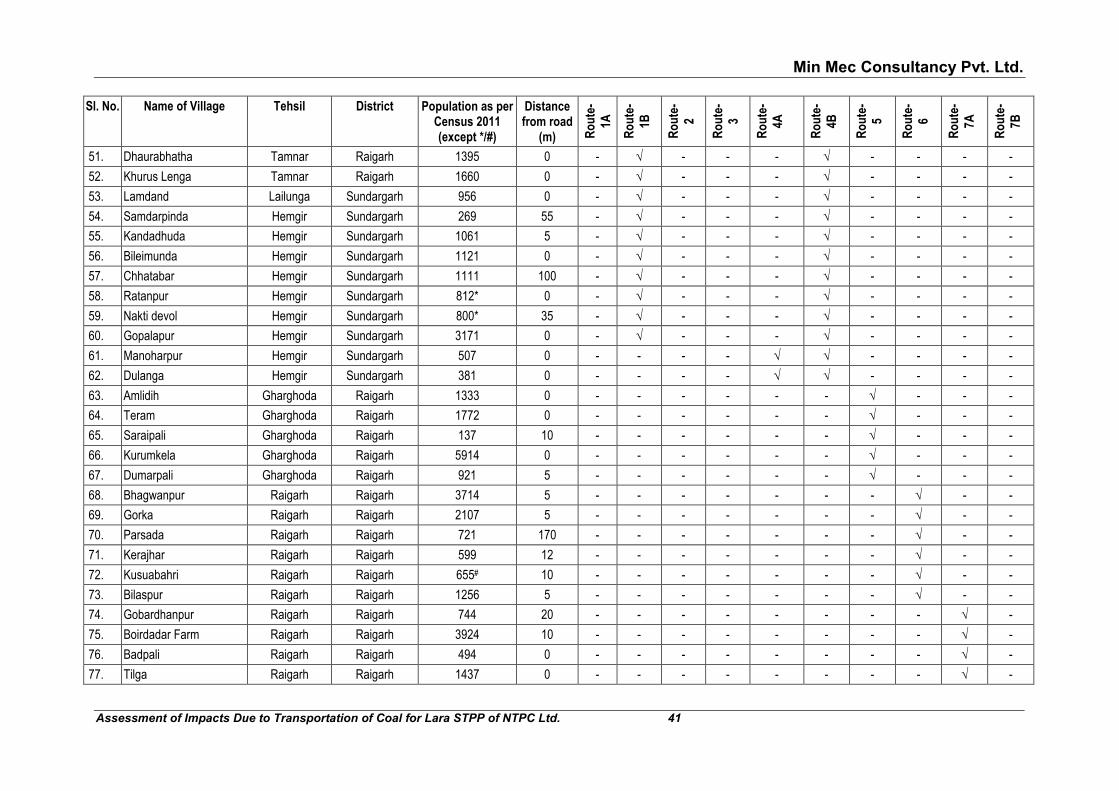
Min Mec Consultancy Pvt. Ltd.
Assessment of Impacts Due to Transportation of Coal for Lara STPP of NTPC Ltd. 41
Sl. No. Name of Village Tehsil District Population as per Census 2011 (except */#)
Distance from road
(m) Ro
ute
-
1A
Ro
ute
-
1B
Ro
ute
-
2
Ro
ute
-3
Ro
ute
-
4A
Ro
ute
-
4B
Ro
ute
-5
Ro
ute
-
6
Ro
ute
-
7A
Ro
ute
-
7B
51. Dhaurabhatha Tamnar Raigarh 1395 0 - √ - - - √ - - - -
52. Khurus Lenga Tamnar Raigarh 1660 0 - √ - - - √ - - - -
53. Lamdand Lailunga Sundargarh 956 0 - √ - - - √ - - - -
54. Samdarpinda Hemgir Sundargarh 269 55 - √ - - - √ - - - -
55. Kandadhuda Hemgir Sundargarh 1061 5 - √ - - - √ - - - -
56. Bileimunda Hemgir Sundargarh 1121 0 - √ - - - √ - - - -
57. Chhatabar Hemgir Sundargarh 1111 100 - √ - - - √ - - - -
58. Ratanpur Hemgir Sundargarh 812* 0 - √ - - - √ - - - -
59. Nakti devol Hemgir Sundargarh 800* 35 - √ - - - √ - - - -
60. Gopalapur Hemgir Sundargarh 3171 0 - √ - - - √ - - - -
61. Manoharpur Hemgir Sundargarh 507 0 - - - - √ √ - - - -
62. Dulanga Hemgir Sundargarh 381 0 - - - - √ √ - - - -
63. Amlidih Gharghoda Raigarh 1333 0 - - - - - - √ - - -
64. Teram Gharghoda Raigarh 1772 0 - - - - - - √ - - -
65. Saraipali Gharghoda Raigarh 137 10 - - - - - - √ - - -
66. Kurumkela Gharghoda Raigarh 5914 0 - - - - - - √ - - -
67. Dumarpali Gharghoda Raigarh 921 5 - - - - - - √ - - -
68. Bhagwanpur Raigarh Raigarh 3714 5 - - - - - - - √ - -
69. Gorka Raigarh Raigarh 2107 5 - - - - - - - √ - -
70. Parsada Raigarh Raigarh 721 170 - - - - - - - √ - -
71. Kerajhar Raigarh Raigarh 599 12 - - - - - - - √ - -
72. Kusuabahri Raigarh Raigarh 655# 10 - - - - - - - √ - -
73. Bilaspur Raigarh Raigarh 1256 5 - - - - - - - √ - -
74. Gobardhanpur Raigarh Raigarh 744 20 - - - - - - - - √ -
75. Boirdadar Farm Raigarh Raigarh 3924 10 - - - - - - - - √ -
76. Badpali Raigarh Raigarh 494 0 - - - - - - - - √ -
77. Tilga Raigarh Raigarh 1437 0 - - - - - - - - √ -
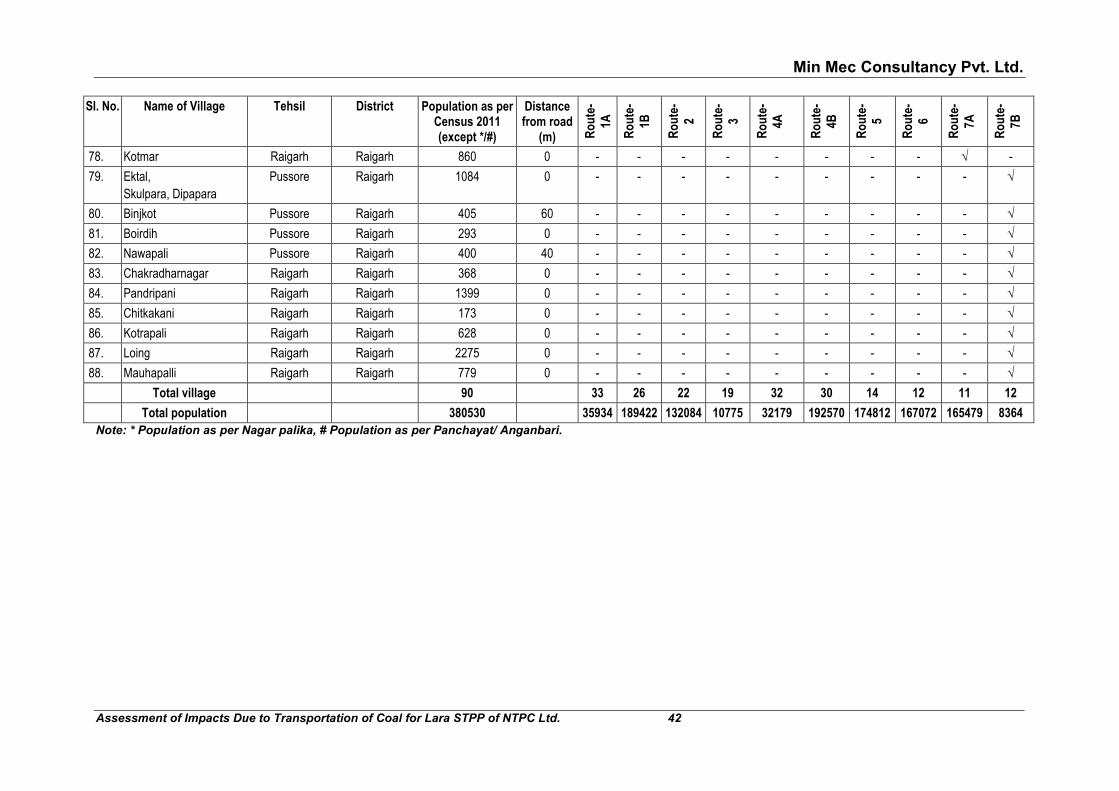
Min Mec Consultancy Pvt. Ltd.
Assessment of Impacts Due to Transportation of Coal for Lara STPP of NTPC Ltd. 42
Sl. No. Name of Village Tehsil District Population as per Census 2011 (except */#)
Distance from road
(m) Ro
ute
-
1A
Ro
ute
-
1B
Ro
ute
-
2
Ro
ute
-3
Ro
ute
-
4A
Ro
ute
-
4B
Ro
ute
-5
Ro
ute
-
6
Ro
ute
-
7A
Ro
ute
-
7B
78. Kotmar Raigarh Raigarh 860 0 - - - - - - - - √ -
79. Ektal, Skulpara, Dipapara
Pussore Raigarh 1084 0 - - - - - - - - - √
80. Binjkot Pussore Raigarh 405 60 - - - - - - - - - √
81. Boirdih Pussore Raigarh 293 0 - - - - - - - - - √
82. Nawapali Pussore Raigarh 400 40 - - - - - - - - - √
83. Chakradharnagar Raigarh Raigarh 368 0 - - - - - - - - - √
84. Pandripani Raigarh Raigarh 1399 0 - - - - - - - - - √
85. Chitkakani Raigarh Raigarh 173 0 - - - - - - - - - √
86. Kotrapali Raigarh Raigarh 628 0 - - - - - - - - - √
87. Loing Raigarh Raigarh 2275 0 - - - - - - - - - √
88. Mauhapalli Raigarh Raigarh 779 0 - - - - - - - - - √
Total village 90 33 26 22 19 32 30 14 12 11 12
Total population 380530 35934 189422 132084 10775 32179 192570 174812 167072 165479 8364
Note: * Population as per Nagar palika, # Population as per Panchayat/ Anganbari.

Min Mec Consultancy Pvt. Ltd.
Assessment of Impacts Due to Transportation of Coal for Lara STPP of NTPC Ltd. 43
FIG. 4: VILLAGES ALONG TRANSPORTATION ROUTE
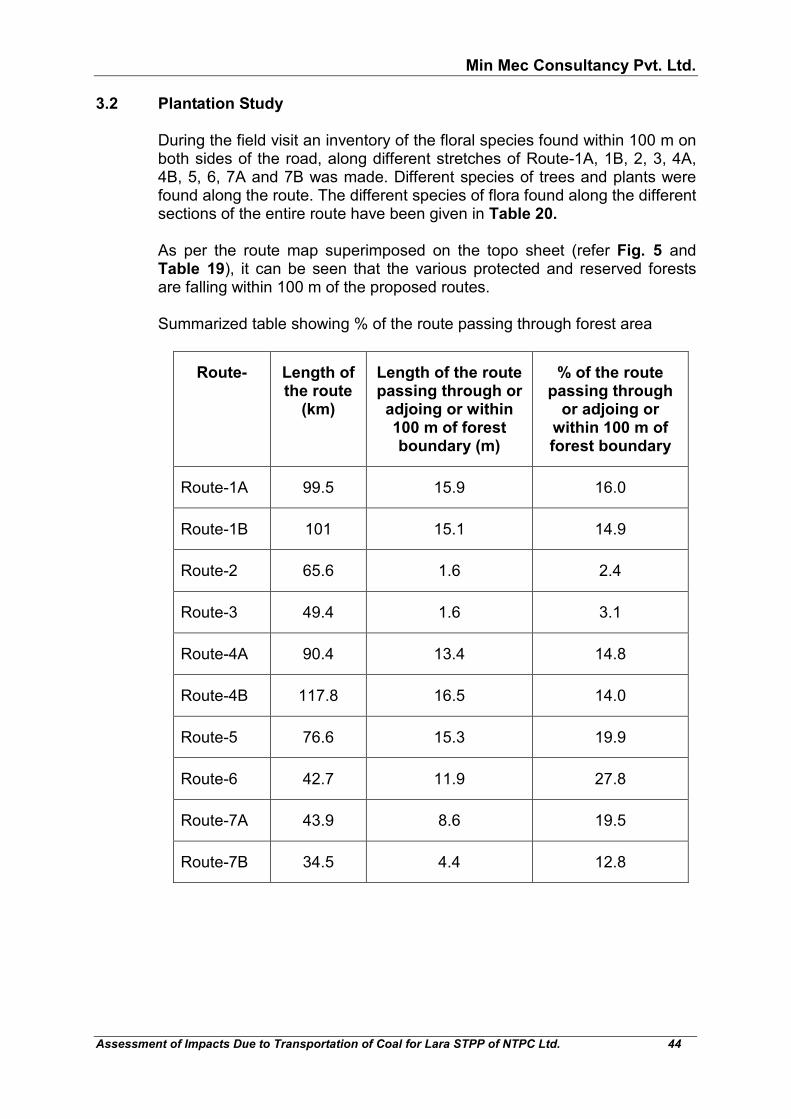
Min Mec Consultancy Pvt. Ltd.
Assessment of Impacts Due to Transportation of Coal for Lara STPP of NTPC Ltd. 44
3.2 Plantation Study During the field visit an inventory of the floral species found within 100 m on
both sides of the road, along different stretches of Route-1A, 1B, 2, 3, 4A, 4B, 5, 6, 7A and 7B was made. Different species of trees and plants were found along the route. The different species of flora found along the different sections of the entire route have been given in Table 20.
As per the route map superimposed on the topo sheet (refer Fig. 5 and Table 19), it can be seen that the various protected and reserved forests are falling within 100 m of the proposed routes.
Summarized table showing % of the route passing through forest area
Route- Length of the route
(km)
Length of the route passing through or adjoing or within 100 m of forest boundary (m)
% of the route passing through
or adjoing or within 100 m of forest boundary
Route-1A 99.5 15.9 16.0
Route-1B 101 15.1 14.9
Route-2 65.6 1.6 2.4
Route-3 49.4 1.6 3.1
Route-4A 90.4 13.4 14.8
Route-4B 117.8 16.5 14.0
Route-5 76.6 15.3 19.9
Route-6 42.7 11.9 27.8
Route-7A 43.9 8.6 19.5
Route-7B 34.5 4.4 12.8
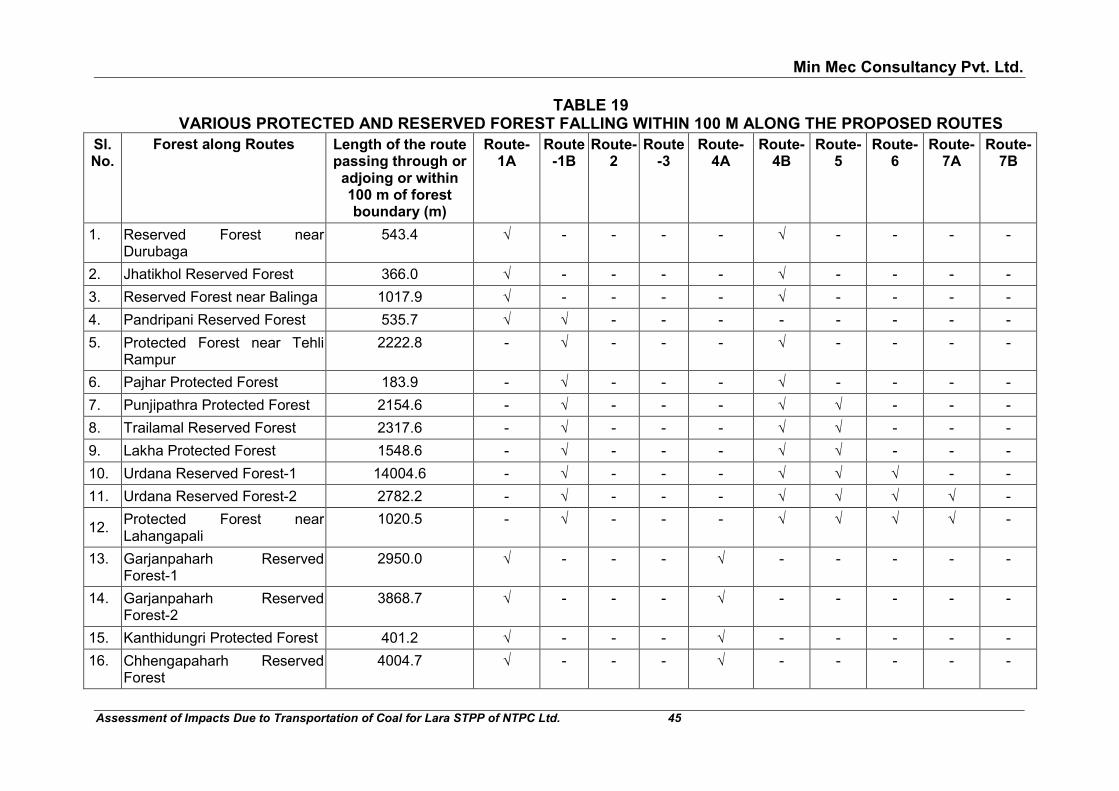
Min Mec Consultancy Pvt. Ltd.
Assessment of Impacts Due to Transportation of Coal for Lara STPP of NTPC Ltd. 45
TABLE 19 VARIOUS PROTECTED AND RESERVED FOREST FALLING WITHIN 100 M ALONG THE PROPOSED ROUTES
Sl. No.
Forest along Routes Length of the route passing through or adjoing or within 100 m of forest boundary (m)
Route-1A
Route-1B
Route-2
Route-3
Route-4A
Route-4B
Route-5
Route-6
Route-7A
Route-7B
1. Reserved Forest near Durubaga
543.4 √ - - - - √ - - - -
2. Jhatikhol Reserved Forest 366.0 √ - - - - √ - - - -
3. Reserved Forest near Balinga 1017.9 √ - - - - √ - - - -
4. Pandripani Reserved Forest 535.7 √ √ - - - - - - - -
5. Protected Forest near Tehli Rampur
2222.8 - √ - - - √ - - - -
6. Pajhar Protected Forest 183.9 - √ - - - √ - - - -
7. Punjipathra Protected Forest 2154.6 - √ - - - √ √ - - -
8. Trailamal Reserved Forest 2317.6 - √ - - - √ √ - - -
9. Lakha Protected Forest 1548.6 - √ - - - √ √ - - -
10. Urdana Reserved Forest-1 14004.6 - √ - - - √ √ √ - -
11. Urdana Reserved Forest-2 2782.2 - √ - - - √ √ √ √ -
12. Protected Forest near Lahangapali
1020.5 - √ - - - √ √ √ √ -
13. Garjanpaharh Reserved Forest-1
2950.0 √ - - - √ - - - - -
14. Garjanpaharh Reserved Forest-2
3868.7 √ - - - √ - - - - -
15. Kanthidungri Protected Forest 401.2 √ - - - √ - - - - -
16. Chhengapaharh Reserved Forest
4004.7 √ - - - √ - - - - -
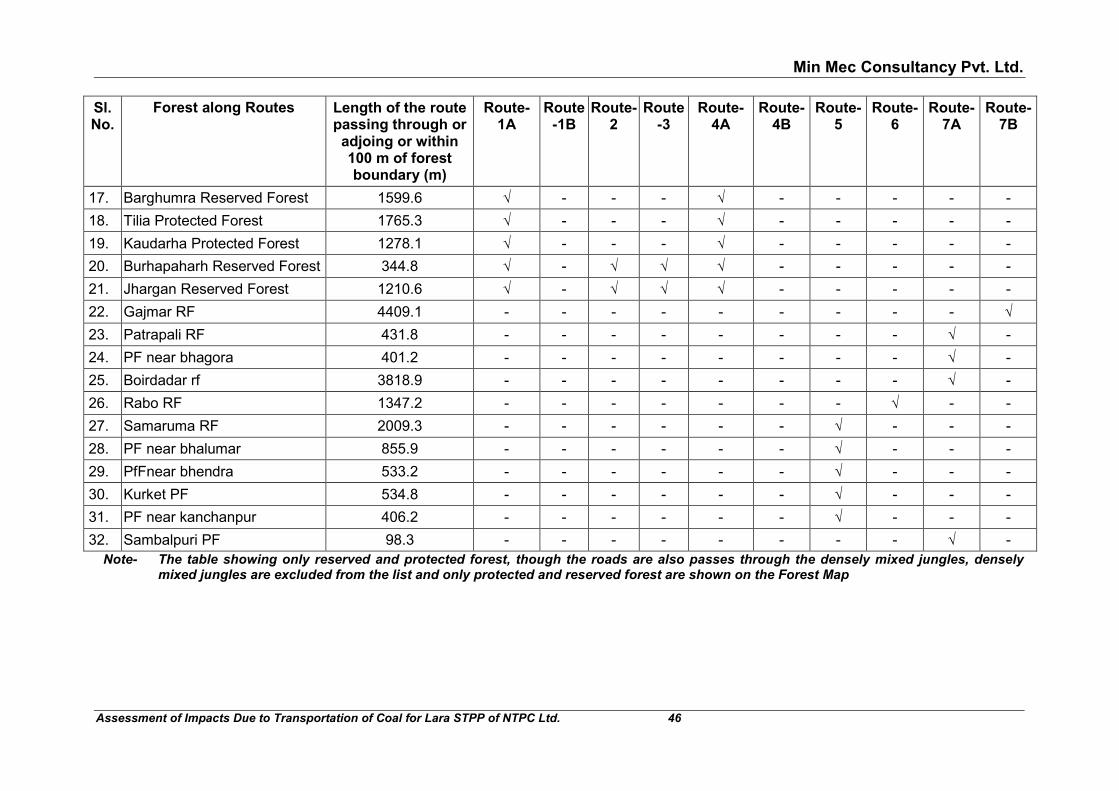
Min Mec Consultancy Pvt. Ltd.
Assessment of Impacts Due to Transportation of Coal for Lara STPP of NTPC Ltd. 46
Sl. No.
Forest along Routes Length of the route passing through or adjoing or within 100 m of forest boundary (m)
Route-1A
Route-1B
Route-2
Route-3
Route-4A
Route-4B
Route-5
Route-6
Route-7A
Route-7B
17. Barghumra Reserved Forest 1599.6 √ - - - √ - - - - -
18. Tilia Protected Forest 1765.3 √ - - - √ - - - - -
19. Kaudarha Protected Forest 1278.1 √ - - - √ - - - - -
20. Burhapaharh Reserved Forest 344.8 √ - √ √ √ - - - - -
21. Jhargan Reserved Forest 1210.6 √ - √ √ √ - - - - -
22. Gajmar RF 4409.1 - - - - - - - - - √
23. Patrapali RF 431.8 - - - - - - - - √ -
24. PF near bhagora 401.2 - - - - - - - - √ -
25. Boirdadar rf 3818.9 - - - - - - - - √ -
26. Rabo RF 1347.2 - - - - - - - √ - -
27. Samaruma RF 2009.3 - - - - - - √ - - -
28. PF near bhalumar 855.9 - - - - - - √ - - -
29. PfFnear bhendra 533.2 - - - - - - √ - - -
30. Kurket PF 534.8 - - - - - - √ - - -
31. PF near kanchanpur 406.2 - - - - - - √ - - -
32. Sambalpuri PF 98.3 - - - - - - - - √ - Note- The table showing only reserved and protected forest, though the roads are also passes through the densely mixed jungles, densely
mixed jungles are excluded from the list and only protected and reserved forest are shown on the Forest Map

Min Mec Consultancy Pvt. Ltd.
Assessment of Impacts Due to Transportation of Coal for Lara STPP of NTPC Ltd. 47
FIG. 5: PART I - FORESTS ALONG TRANSPORTATION ROUTE

Min Mec Consultancy Pvt. Ltd.
Assessment of Impacts Due to Transportation of Coal for Lara STPP of NTPC Ltd. 48
FIG. 5: PART II - FORESTS ALONG TRANSPORTATION ROUTE

Min Mec Consultancy Pvt. Ltd.
Assessment of Impacts Due to Transportation of Coal for Lara STPP of NTPC Ltd. 49
TABLE 20 LIST OF THE SPECIES OF PLANTS AND TREES
Sl. No.
Local Name of Species
Botanical Name Family Chhapora to
Piplimal bypass
Piplimal bypass to Baundhra and Kulda
mines
Piplimal bypass to Samleshw
ari and Lajkura mines
Bandahal T-Point to
Lakhanpur, Lilari and Belpahar
mines
Lara STPP to
Punjipatra village
Punjipatra village to Baundhra and Kulda
mines
Durubaga to dulanga
mines
Punjipatra to Jampali
mine
Raigarh to Bhupdeopur
siding
Raigarh to Kotarlia
Siding via Urdana bypass
Kotarlia siding to
Kanaktura via
Chakradharnagar
Tree
1. Siris Albizia lebbeck Fabaceae √ √ √ √ √ √ - √ - -
2. Shisham Delbergia latifolia Legumenoceae √ √ √ √ √ √ √ √ - -
3. Aam Mangifera indica Anacardiaceae √ √ - - √ √ √ √ √ - √
4. Ashok Saraca asoca Fabaceae √ √ √ √ √ - - - - √
5. Bel Aegle marmelos Rutaceae √ √ √ √ √ √ - - - √ √
6. Cotton tree Bombax ceiba Malvaceae √ √ √ - - - √ √
7. Char Buchanania cochinchinensis
Anancardiaceae - - - - √ √ √ - - - -
8. Jamun Syzygium cumini Myrtaceae - - - - √ √ - √ √ - √
9. Kadam Neolamarckia cadamba Rubiaceae √ √ √ - √ √ - - - √
10. Bargad Ficus benghalensis Moraceae √ √ √ √ √ √ - √ - - √
11. Karanj Pongamia pinnata Leguminiosae √ √ √ √ √ √ - √ - - √
12. Kathal Artocarpus heterophyllus Moraceae √ √ √ √ √ √ - - - - √
13. Khajoor Phoenix dactylifera Arecaceae √ √ √ √ - √ - - - - √
14. Kaju Anacardium occidentale Anacardiaceae √ √ √ √ - √ - -
15. Mahaneem Melia azedarach Meliaceae √ √ √ √ - - - √ - - √
16. Mahua Madhuca longifolia Sapotaceae √ √ √ √ √ √ √ √ √ - √
17. Neem Azadirachta indica Meliaceae √ √ √ √ √ √ √ √ √ - √
18. Palas Butea monosperma Fabaceae √ √ √ √ - - - - - - √
19. Peepal Ficus religiosa Moraceae √ √ √ √ √ √ √ √

Min Mec Consultancy Pvt. Ltd.
Assessment of Impacts Due to Transportation of Coal for Lara STPP of NTPC Ltd. 50
Sl. No.
Local Name of Species
Botanical Name Family Chhapora to
Piplimal bypass
Piplimal bypass to Baundhra and Kulda
mines
Piplimal bypass to Samleshw
ari and Lajkura mines
Bandahal T-Point to
Lakhanpur, Lilari and Belpahar
mines
Lara STPP to
Punjipatra village
Punjipatra village to Baundhra and Kulda
mines
Durubaga to dulanga
mines
Punjipatra to Jampali
mine
Raigarh to Bhupdeopur
siding
Raigarh to Kotarlia
Siding via Urdana bypass
Kotarlia siding to
Kanaktura via
Chakradharnagar
20. Safeda Eucalyptus camaldulensis Myrtaceae - √ √ - √ √ - - - - √
21. Sahjan Moringa oleifera Moringaceae √ √ - - √ √ - - - - -
22. Sarai Shorea robusta Dipterocarpaceae - - - - √ √ - √ - - -
23. Sagwan Tectona grandis Lamiaceae √ √ √ √ √ √ √ √ - - √
24. Tar Borassus flabellifer Arecaceae √ - - - √ √ - √ - - -
25. Tendu Diospyros melanoxylon Ebenaceae - - √ - √ √ √ √ - - -
26. Gulmohor Delonix regia Caesalpiniaceae - - - - - - - - √ - -
27. Rewa Knightia excelsa Proteaceae - - - - - - - - √ - -
28. Babool Acacia arabica Leguminioceae √ √ √ √ √ √ - √ - √ √
29. Aloe vera Aloe barbadensis Asphodelaceae - - - - - √ - - - - -
30. Ber Ziziphus jujuba Rhamnaceae √ √ √ √ √ √ - - - √ √
Shrubs
1. Aak Calotropis gigantea Apocynaceae √ √ √ √ √ √ - - - √ √
Grasses
1. Bamboo Dendrocalamus strictus Gramineace √ √ √ √ √ √ - - - - √
Min Mec Consultancy Pvt. Ltd.
Assessment of Impacts Due to Transportation of Coal for Lara STPP of NTPC Ltd. 51
4.0 COLLECTION OF ENVIRONMENTAL DATA 4.1 Ambient Air Quality The ambient air quality monitoring along different road stretch, once at each
location was carried out on following dates
� 8th May - 15th June, 2018 for stretch from Bhupdeopur railway siding to Dhimrapur chowk.
� 9th to 15th October, 2017 for Stretch from Bandahal T-Point to the three
mines area of MCL i.e Basundhra-Garjanbahal area, Ib valley area and Lakhanpur area.
� 22nd May - 21st June, 2017 for stretch from Dulanga mines to Durubaga
chowk, � 4th-7th July, 2017 for stretch from Punjipatra to Basundhra-Garjanbahal
area via Tamnar � 6th to 19th May, 2017 for stretch from Rengalpali chowk to Raigarh area
mine (Baroad and Jampali) via Raigarh and from Kotarliya railway siding to Regalpali chowk via Urdana bypass and also via Chakradharnagar.
� 10th -12th October, 2016 for stretch from plant to Gangaparha village
(Bandahal T-Point). 24-hour average samples were collected from each station. These samples
were analysed in laboratory by adopting the methods specified in National Ambient Air Quality Standards. The following parameters were determined for each sample:
- Respirable Particulate Matter (RPM or PM10)
- Fine particulate (PM2.5)
- Sulphur dioxide (SO2)
- Nitrogen dioxide (NO2) The air sampling stations were established at 31 locations along the
different routes (Route-1A, 1B, 2, 3, 4A, 4B, 5, 6, 7A and 7B) to study the baseline ambient air quality. The locations and baseline ambient air quality of these sampling stations, is given in Table 21 and shown in Fig. 6.

Min Mec Consultancy Pvt. Ltd.
Assessment of Impacts Due to Transportation of Coal for Lara STPP of NTPC Ltd. 52
TABLE 21 AMBIENT AIR QUALITY MONITORING STATIONS
Station No.
Location Distance (m) from
road, aerial
Air Quality Parameters, µg/m3 Located on Routes
PM10 PM2.5 SO2 NO2 1A 2 3 1B 4B 4A 5 6 7A 7B
AQ1 Barpali Chowk 50 83.9 50.2 14.2 22.1 1A 4B
AQ2 Garjan Bahal Village 150 68.0 41.2 15.6 24.1 1A 4B
AQ3 Durubaga Village 190 69.5 41.6 11.6 17.0 1A 4A 4B
AQ4 Brahmni Village near bus stand
200 71.2 42.8 12.0 16.2 1A 4A
AQ5 Kanika Village near railway crossing
260 56.9 33.7 8.5 14.2 1A 4A
AQ6 Piplimal Village bypass near Petrol pump
270 63.6 37.4 9.4 13.0 1A 4A
AQ7 Madalia Village near NH49
230 78.8 47.0 10.2 18.2 2
AQ8 Amdarha Chowk, NH49 200 58.1 35.3 7.1 12.2 2
AQ9 Junadihi village near fly over
220 65.5 38.7 11.1 16.6 2
AQ10 Kadamdihi Village 260 70.4 37.1 12.5 15.8 1A 2 3 4A
AQ11 Chhapora Village 270 79.6 39.8 10.8 16.6 1A 1B 2 3 4A 4B 5 6 7A 7B
AQ12 Near Babadham Road 220 82.4 42.8 27.2 32.1 1B 4B 5 6 7A
AQ13 Near Mandir 240 68.2 35.5 14.3 17.6 1B 4B 5
AQ14 Taraimal Village 220 90.6 47.1 20.6 26.3 1B 4B 5
AQ15 Punjipatra 230 79.3 41.2 18.9 21.3 1B 4B 5
AQ16 JPL Tamnar 190 68.5 41.2 15.6 22.7 1B 4B
AQ17 Libra Village 180 67.9 42.1 13.6 19.4 1B 4B

Min Mec Consultancy Pvt. Ltd.
Assessment of Impacts Due to Transportation of Coal for Lara STPP of NTPC Ltd. 53
Station No.
Location Distance (m) from
road, aerial
Air Quality Parameters, µg/m3 Located on Routes
PM10 PM2.5 SO2 NO2 1A 2 3 1B 4B 4A 5 6 7A 7B
AQ18 Sharda Mandir 180 71.3 42.9 15.1 20.2 1B 4B
AQ19 Taparia Village 130 63.5 38.7 13.6 16.9 1B 4B
AQ20 Bileimunda Village 180 72.4 43.7 16.2 18 1B 4B
AQ21 Ratanpur village 190 64.9 38.7 12.6 18.7 1B 4B
AQ22 Manoharpur 170 60.5 35.6 5.9 7.5 4A 4B
AQ23 Karichapar Village 270 69.4 36.1 19.7 21.6 5
AQ24 Kudumkela Village 230 72.3 37.6 18.9 22.3 5
AQ25 Kotarliya Railway Siding 320 118.0 61.4 16.3 18.2 7A
AQ26 Tilga Village 160 64.3 33.4 11.6 14.1 7A
AQ27 Loing Village 270 86.1 44.8 12.3 14.7 7B
AQ28 Medical College 160 62.6 32.6 10.9 14.3 7B
AQ29 Thengapali village 200 79.1 41.1 12.6 14.8 1A 1B 2 3 4A 4B 5 6 7A 7B
AQ30 Near Bhagwanpur Village 130 65.4 36.4 7.3 15.4 6
AQ31 Near Bimla siding 200 90.6 51.2 7.2 15.1 6
Permissible Limit as per NAAQS 2009
100 60 80 80

Min Mec Consultancy Pvt. Ltd.
Assessment of Impacts Due to Transportation of Coal for Lara STPP of NTPC Ltd. 54
FIG. 6: PART I - LOCATION OF AIR AND NOISE SAMPLING STATIONS

Min Mec Consultancy Pvt. Ltd.
Assessment of Impacts Due to Transportation of Coal for Lara STPP of NTPC Ltd. 55
FIG. 6: PART II - LOCATION OF AIR AND NOISE SAMPLING STATIONS

Min Mec Consultancy Pvt. Ltd.
Assessment of Impacts Due to Transportation of Coal for Lara STPP of NTPC Ltd. 56
The concentration of various air quality parameters along the routes summarized from above Table 21 are as given under:
Route Air Quality Parameters, µg/m3
PM10 PM2.5 SO2 NOx
Min Max Min Max Min Max Min Max
1A 56.9 83.9 33.7 50.2 8.5 15.6 13.0 24.1 1B 63.5 90.6 35.5 47.1 10.8 27.2 14.8 32.1 2 58.1 79.6 35.3 47.0 7.1 12.6 12.2 18.2 3 70.4 79.6 37.1 41.1 10.8 12.6 14.8 16.6
4A 56.9 79.6 33.7 42.8 5.9 12.6 7.5 17.0 4B 60.5 90.6 35.5 50.2 5.9 27.2 7.5 32.1 5 68.2 90.6 35.5 47.1 10.8 27.2 14.8 32.1 6 65.4 90.6 36.4 51.2 7.2 27.2 14.8 32.1
7A 64.3 118.0 33.4 61.4 10.8 27.2 14.1 32.1 7B 62.6 86.1 32.6 44.8 10.8 12.6 14.3 16.6
Permissible Limit as per NAAQS 2009
100 60 80 80
It can be seen that all the concentrations of SO2 and NO2 are considerably
low compared to the 80 µg/m3 NAAQS permissible limit for residential, rural and other areas. The concentrations of PM10 and PM2.5 are within limits of 100 µg/m3 and 60 µg/m3, respectively, as per the National Ambient Air Quality Standard except PM10 and PM2.5 near Kotarliya Railway Siding. The higher values of PM10 and PM2.5 was observed, which may be attributed due to material handling and on-going construction activities at Kotarliya railway siding.
4.2 Noise environment Ambient noise monitoring was also carried out along with monitoring of the
ambient air quality along all the proposed routes to ascertain the present noise level. The noise level monitored at 30 locations along the different routes (Route-1A, 1B, 2, 3, 4A, 4B, 5, 6, 7A and 7B). The location of monitoring station and respective noise level observed, is given in Table 22 and shown in Fig. 6.
It can be seen from Table 22 that the baseline noise levels both during day
time and night time, were within the permissible limit of the National Ambient Air Quality Standards with respect to ambient noise, both during day time and night time at all the locations except near Bhagwanpur and Kusuabahri village, which may be because of high traffic volume on the road and movement of trains at nearby railway line.

Min Mec Consultancy Pvt. Ltd.
Assessment of Impacts Due to Transportation of Coal for Lara STPP of NTPC Ltd. 57
TABLE 22 LOCATION OF NOISE SAMPLING STATION
Station No.
Location Area Distance (m) from
road, aerial
Observed noise levels,
dBA
Permissible levels, dBA
On Routes
Day Night Day Night 1A 2 3 1B 4B 4A 5 6 7A 7B
N1 Barpali Chowk Residential 50 52.69 42.21 55.00 45.00 1A 4B
N2 Garjan Bahal Village Residential 150 51.81 41.93 55.00 45.00 1A 4B
N3 Durubaga Village Residential 190 52.12 42.23 55.00 45.00 1A 4A 4B
N4 Brahmni Village near bus stand
Residential 200 51.22 41.86 55.00 45.00 1A 4A
N5 Kanika Village near railway crossing
Residential 260 49.38 41.07 55.00 45.00 1A 4A
N6 Piplimal Village bypass near Petrol pump
Residential 270 51.13 40.77 55.00 45.00 1A 4A
N7 Madalia Village near NH49 Residential 230 52.10 41.02 55.00 45.00 2
N8 Amdarha Chowk, NH49 Residential 200 50.53 40.62 55.00 45.00 2
N9 Junadihi village near fly over Residential 220 50.65 41.26 55.00 45.00 2
N10 Thengalpali Village Residential 260 52.99 43.97 55.00 45.00 1A 1B 2 3 4A 4B 5 6 7A 7B
N11 Chhapora Village Residential 270 51.45 42.44 55.00 45.00 1A 1B 2 3 4A 4B 5 6 7A 7B
N12 Near Babadham Road Commercial 220 60.73 54.60 65.00 55.00 1B 4B 5 6 7A
N13 Near Maya Mandir Residential 240 53.06 44.35 55.00 45.00 1B 4B 5
N14 Taraimal Village Residential 220 53.87 42.61 55.00 45.00 1B 4B 5
N15 Punjipatra Residential 230 54.44 43.99 55.00 45.00 1B 4B 5
N16 JPL Tamnar Industrial 190 59.36 56.17 75.00 70.00 1B 4B
N17 Libra Village Residential 180 53.01 44.34 55.00 45.00 1B 4B
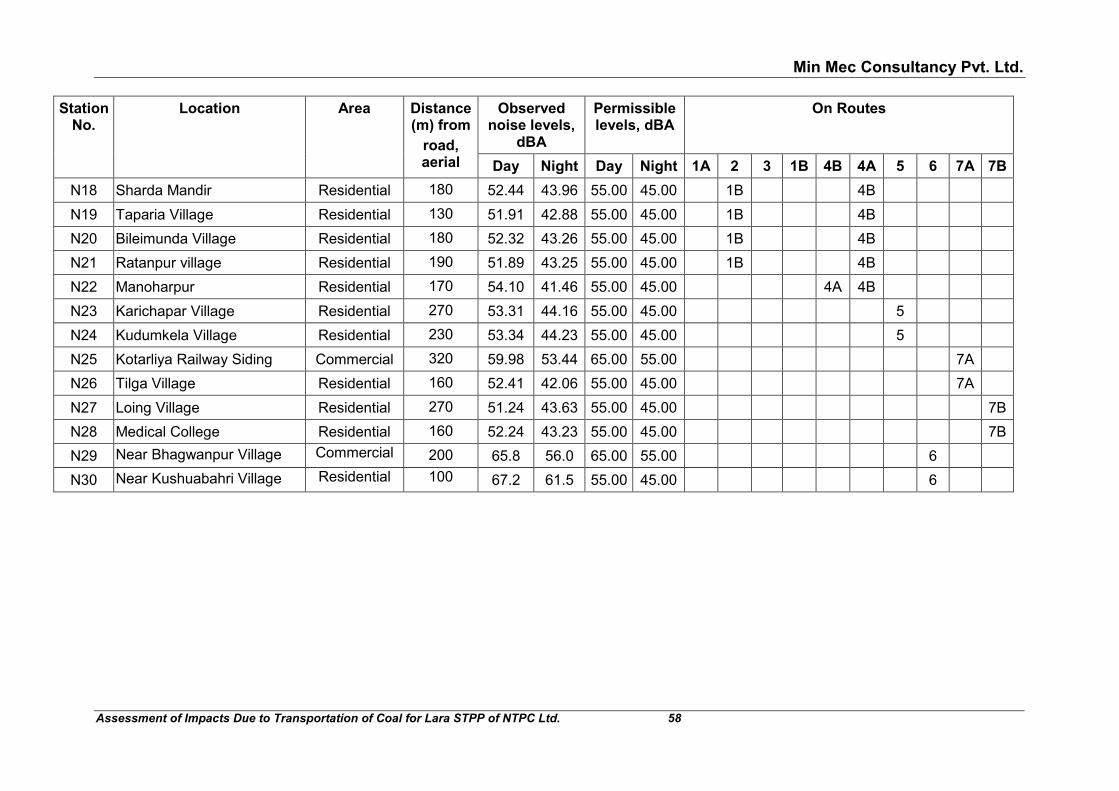
Min Mec Consultancy Pvt. Ltd.
Assessment of Impacts Due to Transportation of Coal for Lara STPP of NTPC Ltd. 58
Station No.
Location Area Distance (m) from
road, aerial
Observed noise levels,
dBA
Permissible levels, dBA
On Routes
Day Night Day Night 1A 2 3 1B 4B 4A 5 6 7A 7B
N18 Sharda Mandir Residential 180 52.44 43.96 55.00 45.00 1B 4B
N19 Taparia Village Residential 130 51.91 42.88 55.00 45.00 1B 4B
N20 Bileimunda Village Residential 180 52.32 43.26 55.00 45.00 1B 4B
N21 Ratanpur village Residential 190 51.89 43.25 55.00 45.00 1B 4B
N22 Manoharpur Residential 170 54.10 41.46 55.00 45.00 4A 4B
N23 Karichapar Village Residential 270 53.31 44.16 55.00 45.00 5
N24 Kudumkela Village Residential 230 53.34 44.23 55.00 45.00 5
N25 Kotarliya Railway Siding Commercial 320 59.98 53.44 65.00 55.00 7A
N26 Tilga Village Residential 160 52.41 42.06 55.00 45.00 7A
N27 Loing Village Residential 270 51.24 43.63 55.00 45.00 7B
N28 Medical College Residential 160 52.24 43.23 55.00 45.00 7B
N29 Near Bhagwanpur Village Commercial 200 65.8 56.0 65.00 55.00 6
N30 Near Kushuabahri Village Residential 100 67.2 61.5 55.00 45.00 6

Min Mec Consultancy Pvt. Ltd.
Assessment of Impacts Due to Transportation of Coal for Lara STPP of NTPC Ltd. 59
4.3 Opinion survey, Health and accident data An opinion survey has been conducted in the villages located within a
distance of 100 m on both sides of the route from various mines to Lara STPP. The survey has been conducted to understand the peoples perception about their current comfort levels in their residences, with respect to disturbances due to traffic.
A questionnaire was filled by the 70 people living in the villages along the different routes, mentioning the problems they faced and may face due to transportation along the road. Out of the total people involved in the survey 75% are satisfied with their present location, while 2% (only one person from Panwaria village) of them are not happy with their location due to noise, dust and vibration of the vehicles, while remaining 13.7% did not comment on this. It has been observed that the people of the area are well aware of the current scenario with respect to traffic and its impacts. They also have clear views on what are the likely impacts of increase in traffic and how to resolve them.
In addition to the opinion survey, data regarding health and accidents was collected by interaction with hospitals and police stations. The salient points of the data are as follows
� From hospital in Brijraj Nagar: major proportion of the patients suffer
from Cough & Cold, Vomitting, Viral Fever, Itching, Tuberculosis, Asthma, Leprosy And Skin diseases. In case of major issues related to health patient are refered to Belpahar or Jharsuguda Hopital for treatment.
� From Belpahar Hospital: people were mainly affected by Viral Fever,
Itching, Asthma, Tuberculosis, Cancer, Loose Motion and Leprosy. It was also noted that victims of road accident and patients bitten by snake came to the hospital for treatment.
� From district Hospital Raigarh: majority of the patients suffered
from Viral Fever, Cough & Cold, Typhoid, Malaria, Tuberculosis, Asthma and Hernia. Many advanced facilities like treatment of kidney and gall stones, orthopaedic problems, plastic surgery, skin related problems, ophthalmic problems, etc. are available.
� From Basundhra mine Police Station, Sundargarh: During
discussion with staff, it was noted that narrow width of road is the main cause of accident. Both, the heavy and lower motor vehicle are plying on the same road. However, 8-10 accidents cases were reported during the year 2016. It may be because of restriction on the speed of vehicles. There is no-entry in morning 9.30-10.30 Am and in evening 3.30-4.30 PM. Approximately 2-3 death have been reported due to road accident during 2016.

Min Mec Consultancy Pvt. Ltd.
Assessment of Impacts Due to Transportation of Coal for Lara STPP of NTPC Ltd. 60
� From Punjipatra Police Station: During discussion with staff, it was noted that 18 cases of accident were reported in the year 2016. Out of the 18 accidents, 4 of them involved two wheelers and pedestrians, of which in one of the cases the victim died. Four accidents involved four wheelers, while 8 accidents were due to trailers. Out of the 8 by trailers, in 3 cases the victim died. Majority of the accidents are due to over-speeding, overtaking and careless driving.
5.0 IMPACT DUE TO TRAFFIC The impact of increase in traffic on various parameters of the environment is
discussed in subsequent paragraphs. 5.1 Ambient Air Quality
The plying of trucks from MCL mines and Dulanga mines of NTPC to Lara STPP will emit particulates, HCs, SO2, NOx and CO. In order to access the impact on existing air quality in the area due to plying of additional tippers, monitoring of existing air quality was carried out at 31 locations along the routes during different time intervals as given in Table 21 above.
Dispersion modelling has been done (for both existing and proposed route)
to determine the incremental values due to plying of additional tippers. The details of modelling for the 15T, 20T & 25T of BS-IV coal carrying tippers is given in Table 23 below:
TABLE 23
CALCULATION FOR EMISSION FROM TIPPING TRUCKS 15 T CAPACITY 20 T CAPACITY 25T CAPACITY Units NO2 PM SO2 NO2 PM SO2 NO2 PM SO2
Emission permitted* g/KWH 3.5 0.02 3.5 0.02 3.5 0.02 Resultant horsepower HP 136 136 136 178 178 178 180 180 180 Resultant KWH KWH 103.36 103.36 103.36 135.28 135.25 135.28 136.8 136.8 136.8 Average speed of Vehicle Kmph 40 40 40 40 40 40 40 40 40 Emission from one truck g/truck
per hr 361.76 2.0672 68.04 473.48 2.7056 67.284 478.8 2.736 68.04
Emission from 1 truck/ km g/km 9.044 0.05168 1.2852 11.837 0.06764 1.6821 11.97 .0684 1.701 Emission from 1 truck/mile g/mile 14.4704 0.082688 2.05632 18.9392 0.10822 2.6914 19.152 0.1094 2.7216
Note: Actual emissions will be much less since above calculation are for maximum permitted value
*Source: Indian Emission Regulation for Bharat Stage-IV (BS-IV) w.e.f. 01.04.2010.
(* Emission standards for new heavy-duty engines—applicable as per Bharat Stage IV (applicable nationwide since April 2017)
The detailed report of Dispersion modelling, on each section along different
routes, considering worst case as per Scenario 1 to 2 are given in Annexure 6. The resultant values obtained after air quality prediction modeling for pollutants, arising due to emissions from tippers, at all the air quality locations is given in Table 24. The fugitive dust airborne due to movement of wheels on the road is not included but described below in this para itself.
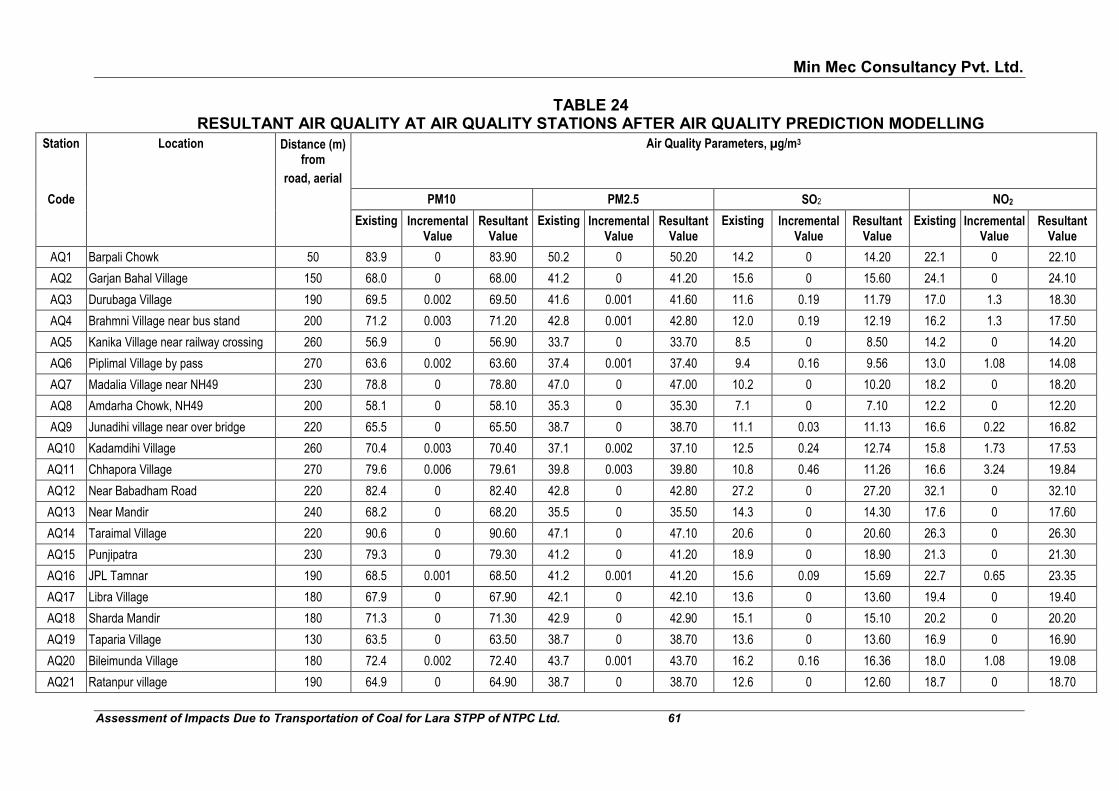
Min Mec Consultancy Pvt. Ltd.
Assessment of Impacts Due to Transportation of Coal for Lara STPP of NTPC Ltd. 61
TABLE 24 RESULTANT AIR QUALITY AT AIR QUALITY STATIONS AFTER AIR QUALITY PREDICTION MODELLING
Station Location Distance (m) from
road, aerial
Air Quality Parameters, µg/m3
Code PM10 PM2.5 SO2 NO2
Existing Incremental Value
Resultant Value
Existing Incremental Value
Resultant Value
Existing Incremental Value
Resultant Value
Existing Incremental Value
Resultant Value
AQ1 Barpali Chowk 50 83.9 0 83.90 50.2 0 50.20 14.2 0 14.20 22.1 0 22.10
AQ2 Garjan Bahal Village 150 68.0 0 68.00 41.2 0 41.20 15.6 0 15.60 24.1 0 24.10
AQ3 Durubaga Village 190 69.5 0.002 69.50 41.6 0.001 41.60 11.6 0.19 11.79 17.0 1.3 18.30
AQ4 Brahmni Village near bus stand 200 71.2 0.003 71.20 42.8 0.001 42.80 12.0 0.19 12.19 16.2 1.3 17.50
AQ5 Kanika Village near railway crossing 260 56.9 0 56.90 33.7 0 33.70 8.5 0 8.50 14.2 0 14.20
AQ6 Piplimal Village by pass 270 63.6 0.002 63.60 37.4 0.001 37.40 9.4 0.16 9.56 13.0 1.08 14.08
AQ7 Madalia Village near NH49 230 78.8 0 78.80 47.0 0 47.00 10.2 0 10.20 18.2 0 18.20
AQ8 Amdarha Chowk, NH49 200 58.1 0 58.10 35.3 0 35.30 7.1 0 7.10 12.2 0 12.20
AQ9 Junadihi village near over bridge 220 65.5 0 65.50 38.7 0 38.70 11.1 0.03 11.13 16.6 0.22 16.82
AQ10 Kadamdihi Village 260 70.4 0.003 70.40 37.1 0.002 37.10 12.5 0.24 12.74 15.8 1.73 17.53
AQ11 Chhapora Village 270 79.6 0.006 79.61 39.8 0.003 39.80 10.8 0.46 11.26 16.6 3.24 19.84
AQ12 Near Babadham Road 220 82.4 0 82.40 42.8 0 42.80 27.2 0 27.20 32.1 0 32.10
AQ13 Near Mandir 240 68.2 0 68.20 35.5 0 35.50 14.3 0 14.30 17.6 0 17.60
AQ14 Taraimal Village 220 90.6 0 90.60 47.1 0 47.10 20.6 0 20.60 26.3 0 26.30
AQ15 Punjipatra 230 79.3 0 79.30 41.2 0 41.20 18.9 0 18.90 21.3 0 21.30
AQ16 JPL Tamnar 190 68.5 0.001 68.50 41.2 0.001 41.20 15.6 0.09 15.69 22.7 0.65 23.35
AQ17 Libra Village 180 67.9 0 67.90 42.1 0 42.10 13.6 0 13.60 19.4 0 19.40
AQ18 Sharda Mandir 180 71.3 0 71.30 42.9 0 42.90 15.1 0 15.10 20.2 0 20.20
AQ19 Taparia Village 130 63.5 0 63.50 38.7 0 38.70 13.6 0 13.60 16.9 0 16.90
AQ20 Bileimunda Village 180 72.4 0.002 72.40 43.7 0.001 43.70 16.2 0.16 16.36 18.0 1.08 19.08
AQ21 Ratanpur village 190 64.9 0 64.90 38.7 0 38.70 12.6 0 12.60 18.7 0 18.70

Min Mec Consultancy Pvt. Ltd.
Assessment of Impacts Due to Transportation of Coal for Lara STPP of NTPC Ltd. 62
Station Location Distance (m) from
road, aerial
Air Quality Parameters, µg/m3
Code PM10 PM2.5 SO2 NO2
Existing Incremental Value
Resultant Value
Existing Incremental Value
Resultant Value
Existing Incremental Value
Resultant Value
Existing Incremental Value
Resultant Value
AQ22 Manoharpur 170 60.5 0.002 60.50 35.6 0.001 35.60 5.9 0.12 6.02 7.5 0.86 8.36
AQ23 Karichapar Village 270 69.4 0.001 69.40 36.1 0 36.10 19.7 0.05 19.75 21.6 0.43 22.03
AQ24 Kudumkela Village 230 72.3 0.001 72.30 37.6 0 37.60 18.9 0.05 18.95 22.3 0.43 22.73
AQ25 Kotarliya Railway Siding 320 118.0 0.001 118.00 61.4 0.001 61.40 16.3 0.07 16.37 18.2 0.43 18.63
AQ26 Tilga Village 160 64.3 0.002 64.30 33.4 0.001 33.40 11.6 0.13 11.73 14.1 0.86 14.96
AQ27 Loing Village 270 86.1 0 86.10 44.8 0 44.80 12.3 0 12.30 14.7 0 14.70
AQ28 Medical College 160 62.6 0 62.60 32.6 0 32.60 10.9 0 10.90 14.3 0 14.30
AQ29 Thengapali village 200 79.1 0 79.10 41.1 0 41.10 12.6 0 12.60 14.8 0 14.80
AQ30 Near Bhagwanpur Village 130 65.4 0 65.40 36.4 0 36.40 7.3 0 7.30 15.4 0 15.40
AQ31 Near Bimla siding 200 90.6 0.002 90.60 51.2 0.001 51.20 7.2 0.15 7.35 15.1 1.08 16.18
Minimum value 56.90 0.00 56.90 32.60 0.00 32.60 5.90 0.00 6.02 7.50 0.00 8.36
Maximum value 118.00 0.01 118.00 61.40 0.00 61.40 27.20 0.46 27.20 32.10 3.24 32.10
Permissible Limit as per NAAQS 2009
100 60 80 80
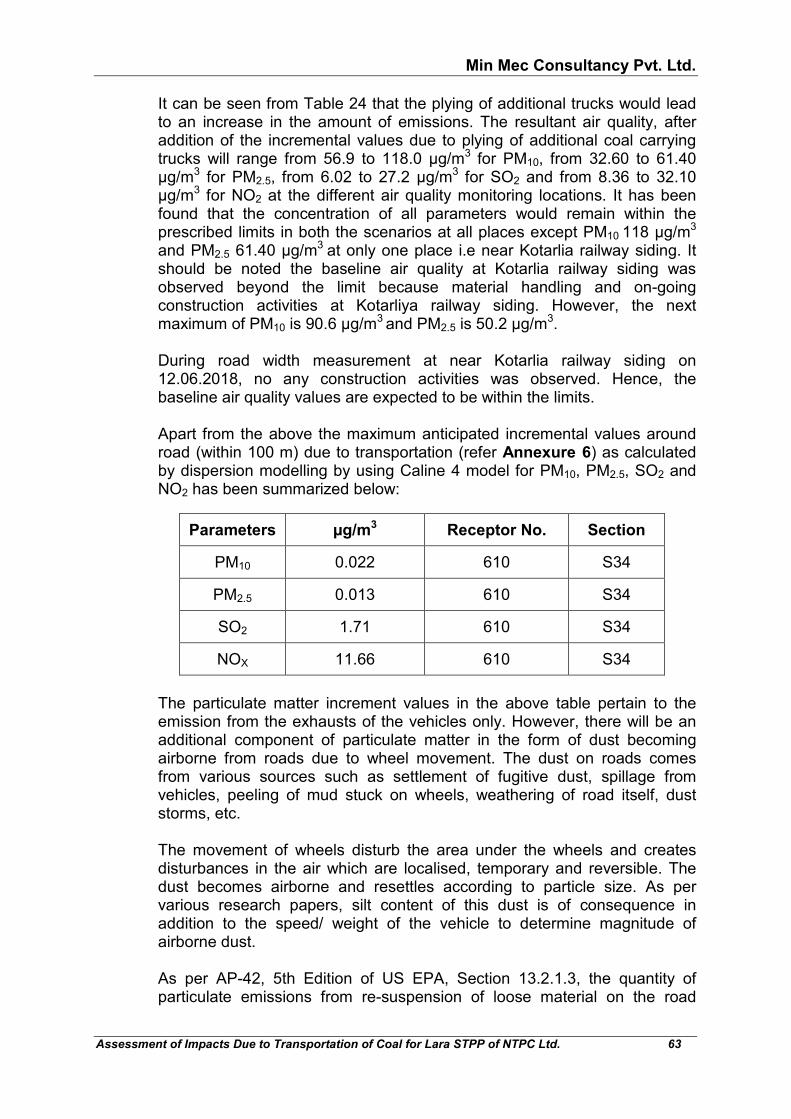
Min Mec Consultancy Pvt. Ltd.
Assessment of Impacts Due to Transportation of Coal for Lara STPP of NTPC Ltd. 63
It can be seen from Table 24 that the plying of additional trucks would lead to an increase in the amount of emissions. The resultant air quality, after addition of the incremental values due to plying of additional coal carrying trucks will range from 56.9 to 118.0 µg/m3 for PM10, from 32.60 to 61.40 µg/m3 for PM2.5, from 6.02 to 27.2 µg/m3 for SO2 and from 8.36 to 32.10 µg/m3 for NO2 at the different air quality monitoring locations. It has been found that the concentration of all parameters would remain within the prescribed limits in both the scenarios at all places except PM10 118 µg/m3
and PM2.5 61.40 µg/m3 at only one place i.e near Kotarlia railway siding. It should be noted the baseline air quality at Kotarlia railway siding was observed beyond the limit because material handling and on-going construction activities at Kotarliya railway siding. However, the next maximum of PM10 is 90.6 µg/m3 and PM2.5 is 50.2 µg/m3.
During road width measurement at near Kotarlia railway siding on 12.06.2018, no any construction activities was observed. Hence, the baseline air quality values are expected to be within the limits.
Apart from the above the maximum anticipated incremental values around road (within 100 m) due to transportation (refer Annexure 6) as calculated by dispersion modelling by using Caline 4 model for PM10, PM2.5, SO2 and NO2 has been summarized below:
Parameters µg/m3 Receptor No. Section
PM10 0.022 610 S34
PM2.5 0.013 610 S34
SO2 1.71 610 S34
NOX 11.66 610 S34
The particulate matter increment values in the above table pertain to the
emission from the exhausts of the vehicles only. However, there will be an additional component of particulate matter in the form of dust becoming airborne from roads due to wheel movement. The dust on roads comes from various sources such as settlement of fugitive dust, spillage from vehicles, peeling of mud stuck on wheels, weathering of road itself, dust storms, etc.
The movement of wheels disturb the area under the wheels and creates
disturbances in the air which are localised, temporary and reversible. The dust becomes airborne and resettles according to particle size. As per various research papers, silt content of this dust is of consequence in addition to the speed/ weight of the vehicle to determine magnitude of airborne dust.
As per AP-42, 5th Edition of US EPA, Section 13.2.1.3, the quantity of
particulate emissions from re-suspension of loose material on the road
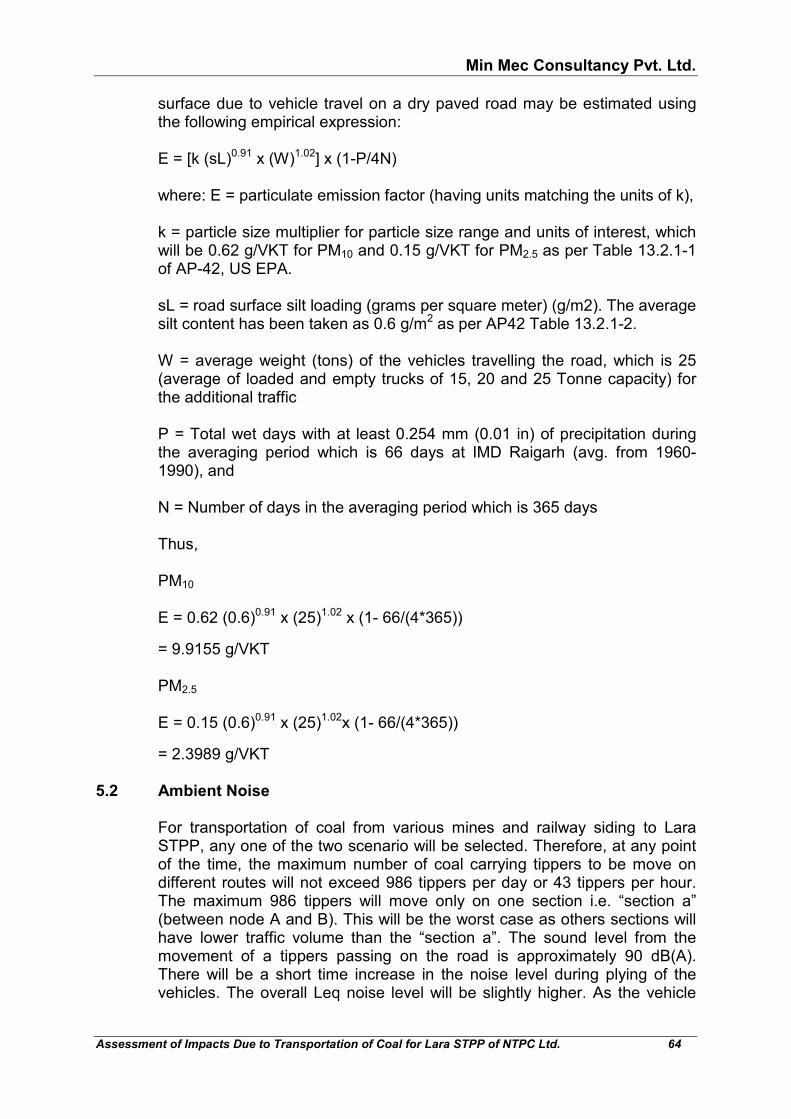
Min Mec Consultancy Pvt. Ltd.
Assessment of Impacts Due to Transportation of Coal for Lara STPP of NTPC Ltd. 64
surface due to vehicle travel on a dry paved road may be estimated using the following empirical expression:
E = [k (sL)0.91 x (W)1.02] x (1-P/4N)
where: E = particulate emission factor (having units matching the units of k), k = particle size multiplier for particle size range and units of interest, which
will be 0.62 g/VKT for PM10 and 0.15 g/VKT for PM2.5 as per Table 13.2.1-1 of AP-42, US EPA.
sL = road surface silt loading (grams per square meter) (g/m2). The average
silt content has been taken as 0.6 g/m2 as per AP42 Table 13.2.1-2. W = average weight (tons) of the vehicles travelling the road, which is 25
(average of loaded and empty trucks of 15, 20 and 25 Tonne capacity) for the additional traffic
P = Total wet days with at least 0.254 mm (0.01 in) of precipitation during the averaging period which is 66 days at IMD Raigarh (avg. from 1960-1990), and N = Number of days in the averaging period which is 365 days Thus, PM10 E = 0.62 (0.6)0.91 x (25)1.02 x (1- 66/(4*365))
= 9.9155 g/VKT
PM2.5 E = 0.15 (0.6)0.91 x (25)1.02x (1- 66/(4*365))
= 2.3989 g/VKT 5.2 Ambient Noise For transportation of coal from various mines and railway siding to Lara
STPP, any one of the two scenario will be selected. Therefore, at any point of the time, the maximum number of coal carrying tippers to be move on different routes will not exceed 986 tippers per day or 43 tippers per hour. The maximum 986 tippers will move only on one section i.e. “section a” (between node A and B). This will be the worst case as others sections will have lower traffic volume than the “section a”. The sound level from the movement of a tippers passing on the road is approximately 90 dB(A). There will be a short time increase in the noise level during plying of the vehicles. The overall Leq noise level will be slightly higher. As the vehicle
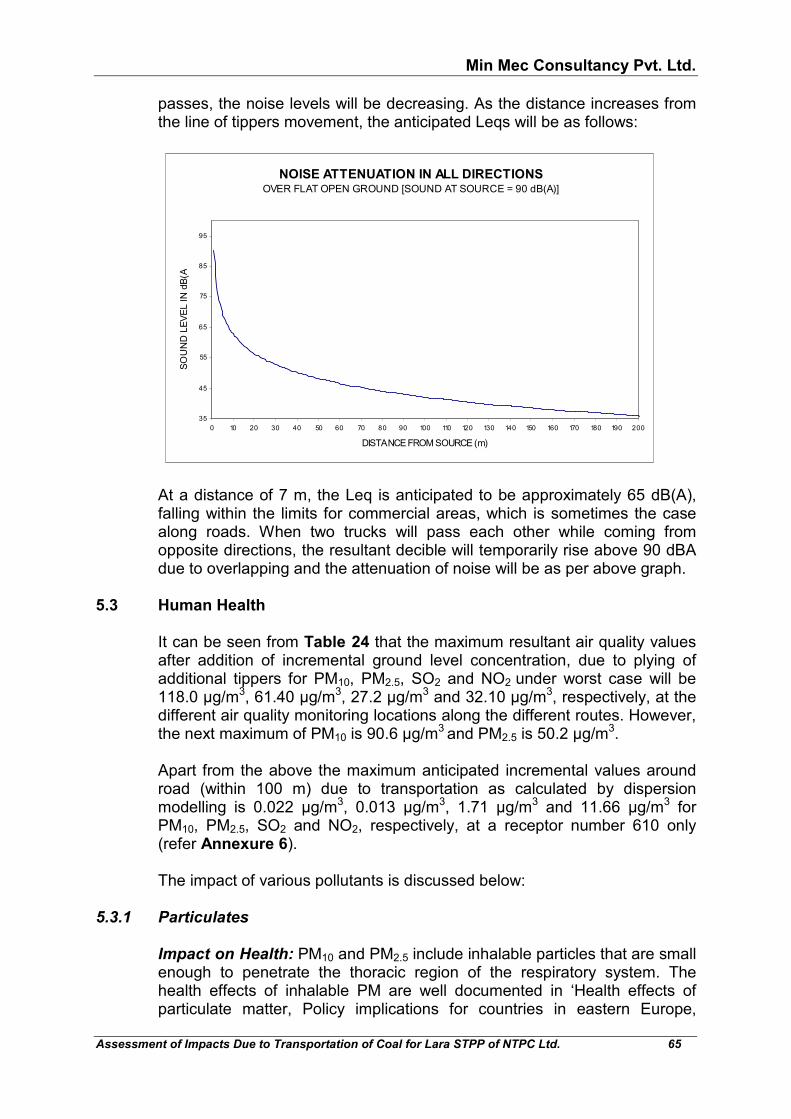
Min Mec Consultancy Pvt. Ltd.
Assessment of Impacts Due to Transportation of Coal for Lara STPP of NTPC Ltd. 65
passes, the noise levels will be decreasing. As the distance increases from the line of tippers movement, the anticipated Leqs will be as follows:
NOISE ATTENUATION IN ALL DIRECTIONSOVER FLAT OPEN GROUND [SOUND AT SOURCE = 90 dB(A)]
35
45
55
65
75
85
95
0 10 20 30 40 50 60 70 80 90 100 110 120 130 140 150 160 170 180 190 200
DISTANCE FROM SOURCE (m)
SO
UN
D L
EV
EL
IN d
B(A
)
At a distance of 7 m, the Leq is anticipated to be approximately 65 dB(A),
falling within the limits for commercial areas, which is sometimes the case along roads. When two trucks will pass each other while coming from opposite directions, the resultant decible will temporarily rise above 90 dBA due to overlapping and the attenuation of noise will be as per above graph.
5.3 Human Health It can be seen from Table 24 that the maximum resultant air quality values
after addition of incremental ground level concentration, due to plying of additional tippers for PM10, PM2.5, SO2 and NO2 under worst case will be 118.0 µg/m3, 61.40 µg/m3, 27.2 µg/m3 and 32.10 µg/m3, respectively, at the different air quality monitoring locations along the different routes. However, the next maximum of PM10 is 90.6 µg/m3 and PM2.5 is 50.2 µg/m3.
Apart from the above the maximum anticipated incremental values around road (within 100 m) due to transportation as calculated by dispersion modelling is 0.022 µg/m3, 0.013 µg/m3, 1.71 µg/m3 and 11.66 µg/m3 for PM10, PM2.5, SO2 and NO2, respectively, at a receptor number 610 only (refer Annexure 6).
The impact of various pollutants is discussed below: 5.3.1 Particulates Impact on Health: PM10 and PM2.5 include inhalable particles that are small
enough to penetrate the thoracic region of the respiratory system. The health effects of inhalable PM are well documented in ‘Health effects of particulate matter, Policy implications for countries in eastern Europe,

Min Mec Consultancy Pvt. Ltd.
Assessment of Impacts Due to Transportation of Coal for Lara STPP of NTPC Ltd. 66
Caucasus and Central Asia by World Health Organisation, Regional Office for Europe, 2013’. They are due to exposure over both the short term (hours, days) and long term (months, years) and include:
• respiratory and cardiovascular morbidity, such as aggravation of asthma,
respiratory symptoms and an increase in hospital admissions; • mortality from cardiovascular and respiratory diseases and from lung
cancer. Threshold concentrations for humans : As described in detail in Chapter
7.3, Particulate Matter, Air Quality Guidelines, Second Edition, World Health Organisation Regional Office for Europe, Copenhagen, Denmark, 2000, at low levels of (short-term) exposure (defined as 0–100 μg/m3 for PM10), the exposure response curve fits a straight line reasonably well, there are indications from studies conducted in the former German Democratic Republic and in China that at higher levels of exposure (several hundreds of μg/m3 PM10), the curve is shallower for at least effects on mortality than at low levels of exposure.
The relative risk increase between 1.0074-1.0356 for daily mortality,
respiratory hospital admissions, reporting of broncho-dilator use, cough and lower respiratory symptoms, and changes in peak expiratory flow has been associated with a 10 μg/m3 increase in PM10 or PM2.5 with respect to the concentrations actually measured.
In this case, the incremental particulate emissions under worst case
scenario will be 0.022 μg/m3 for PM10 and 0.013 μg/m3 for PM2.5. The incremental values are within the significant figures of 10 μg/m3.
5.3.2 Sulphur dioxides Impact on Health: Sulphur dioxide irritates the skin and mucous
membranes of the eyes, nose, throat, and lungs. High concentrations of SO2 can cause inflammation and irritation of the respiratory system, particularly during heavy physical activity.
The resulting symptoms may include pain when taking a deep breath,
coughing, throat irritation, and breathing difficulties. High concentrations of SO2 can affect lung function, worsen asthma attacks, and aggravate existing heart disease in sensitive groups. This gas can also react with other chemicals in the air and convert to a small particle that can lodge in the lungs and cause similar health effects.
Threshold concentrations for humans: As described in detail in Chapter
7.4, Sulphur dioxide, Air Quality Guidelines, Second Edition, World Health Organisation Regional Office for Europe, Copenhagen, Denmark, 2000, the health risk evaluation for short term exposures (less than 24 hours) has been done. Only small changes, not regarded as of clinical significance, were seen at 572 μg/m3 (0.2 ppm); reductions representing about 10% of baseline, Forced Expiratory Volume (FEV1) occurred at about 1144 μg/m3
Min Mec Consultancy Pvt. Ltd.
Assessment of Impacts Due to Transportation of Coal for Lara STPP of NTPC Ltd. 67
(0.4 ppm); and reductions of about 15% occurred at about 1716 μg/m3 (0.6 ppm).
The response was not greatly influenced by the severity of asthma. These
findings are consistent with those reported from other exposure studies. In one early series, however, a small change in airway resistance was reported in two of the asthmatic patients at 286 μg/m3 (0.1 ppm). For long term exposure, the lowest-observed-adverse-effect level of sulfur dioxide was judged to be 100 μg/m3 (0.035 ppm) annual average, together with particulate matter.
In this case, the maximum resultant ambient air quality after addition of incremental emissions under worst case will be 27.20 μg/m3. which is much lower than the thresholds which impact human health.
5.3.3 Nitrogen oxides Impact on Health: Human health concerns include effects on breathing and
the respiratory system, damage to lung tissue, and premature death. Small particles penetrate deeply into sensitive parts of the lungs and can cause or worsen respiratory disease, such as emphysema and bronchitis, and aggravate existing heart disease.
Threshold concentrations for humans : As described in detail in Chapter
7.1, Nitrogen dioxide, Air Quality Guidelines, Second Edition, World Health Organisation Regional Office for Europe, Copenhagen, Denmark, 2000, a significant amount of research has been directed at evaluating the effect of nitrogen dioxide on pulmonary function and airway responsiveness to pharmacological, physical (e.g. cold air) or natural (i.e. allergens) broncho-constrictors. Generally, concentrations higher than 1880 μg/m3 (1.0 ppm) are required to increase responsiveness to broncho-constrictors and to induce changes in pulmonary function in healthy adults.
Analysis of lung lavage from healthy humans indicated that high levels
(5640-7520 μg/m3; 3–4 ppm) reduce the activity of alpha-1-protease inhibitor, a protein that acts to protect the lung from the proteolytic enzyme elastase by inhibiting connective tissue damage. However, 2820 μg/m3 (1.5 ppm) had no such effect.
Such concentrations as mentioned above, almost never occur in ambient air, thus, the resultant ambient air quality values of nitrogen oxide (under worst case situation resultant air quality with respect to NO2 will be 32.10 μg/m3) is not expected to have any impact on the healthy human beings. On the basis of these human clinical data, WHO has given a 1-hour guideline of 200 μg/m3. At double this recommended guideline (400 μg/m3), there is evidence to suggest possible small effects in the pulmonary function of asthmatics. Should the asthmatic be exposed either simultaneously or sequentially to nitrogen dioxide and an aeroallergen, the risk of an exaggerated response to the allergen is increased.
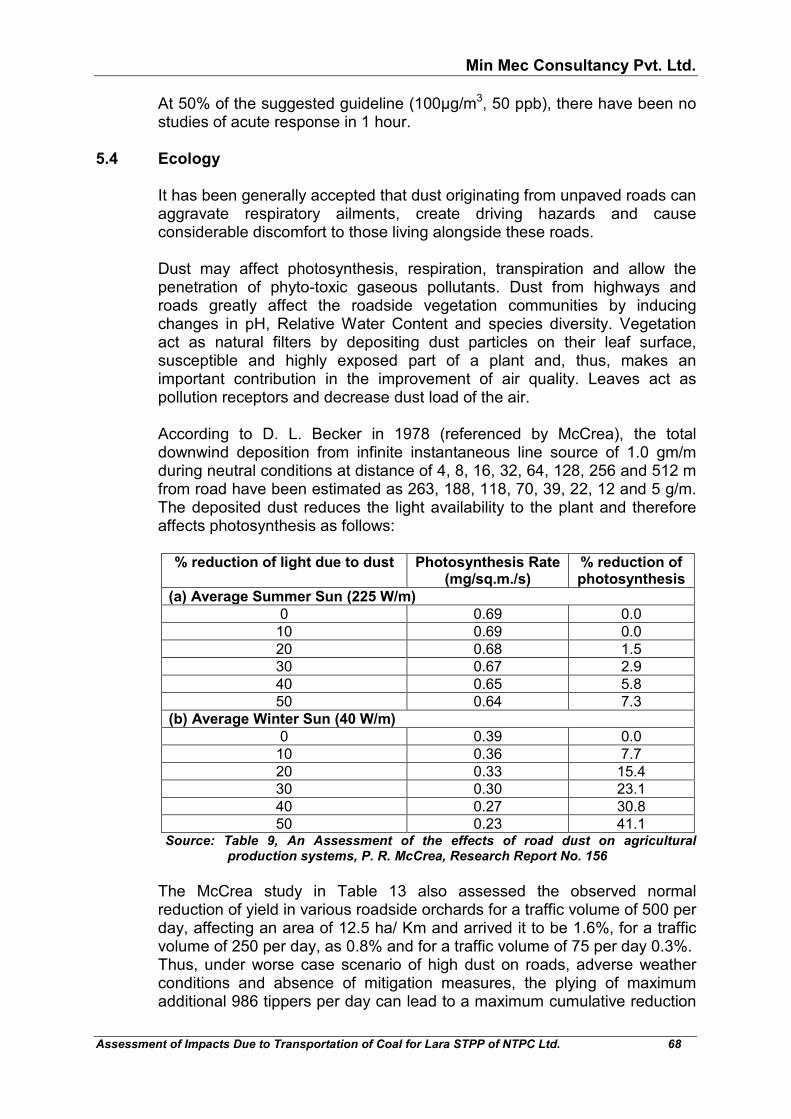
Min Mec Consultancy Pvt. Ltd.
Assessment of Impacts Due to Transportation of Coal for Lara STPP of NTPC Ltd. 68
At 50% of the suggested guideline (100μg/m3, 50 ppb), there have been no studies of acute response in 1 hour.
5.4 Ecology It has been generally accepted that dust originating from unpaved roads can
aggravate respiratory ailments, create driving hazards and cause considerable discomfort to those living alongside these roads.
Dust may affect photosynthesis, respiration, transpiration and allow the
penetration of phyto-toxic gaseous pollutants. Dust from highways and roads greatly affect the roadside vegetation communities by inducing changes in pH, Relative Water Content and species diversity. Vegetation act as natural filters by depositing dust particles on their leaf surface, susceptible and highly exposed part of a plant and, thus, makes an important contribution in the improvement of air quality. Leaves act as pollution receptors and decrease dust load of the air.
According to D. L. Becker in 1978 (referenced by McCrea), the total
downwind deposition from infinite instantaneous line source of 1.0 gm/m during neutral conditions at distance of 4, 8, 16, 32, 64, 128, 256 and 512 m from road have been estimated as 263, 188, 118, 70, 39, 22, 12 and 5 g/m. The deposited dust reduces the light availability to the plant and therefore affects photosynthesis as follows:
% reduction of light due to dust Photosynthesis Rate
(mg/sq.m./s) % reduction of photosynthesis
(a) Average Summer Sun (225 W/m)
0 0.69 0.0 10 0.69 0.0 20 0.68 1.5 30 0.67 2.9 40 0.65 5.8 50 0.64 7.3
(b) Average Winter Sun (40 W/m)
0 0.39 0.0 10 0.36 7.7 20 0.33 15.4 30 0.30 23.1 40 0.27 30.8 50 0.23 41.1
Source: Table 9, An Assessment of the effects of road dust on agricultural production systems, P. R. McCrea, Research Report No. 156
The McCrea study in Table 13 also assessed the observed normal
reduction of yield in various roadside orchards for a traffic volume of 500 per day, affecting an area of 12.5 ha/ Km and arrived it to be 1.6%, for a traffic volume of 250 per day, as 0.8% and for a traffic volume of 75 per day 0.3%. Thus, under worse case scenario of high dust on roads, adverse weather conditions and absence of mitigation measures, the plying of maximum additional 986 tippers per day can lead to a maximum cumulative reduction

Min Mec Consultancy Pvt. Ltd.
Assessment of Impacts Due to Transportation of Coal for Lara STPP of NTPC Ltd. 69
of yield in roadside plantation will be 3.15%, if control measures like water sprinkling, road maintenance, cleaning and road side plantations are not carried out.
According to the proposal, there will be maximum additional movement of
986 tippers to and fro per day on dedicated transportation route in worst case. The distance between two consecutive truck will be 934 m (assuming speed of tippers 40 km/hr , 667 m covered in a minute and 1.4 minutes for a tipper to cross a particular point on road). Hence, at any point of time, only 4 tippers will move within 1 Km length of the road. Two in up and two in down direction. The quantity of particulate emissions from re-suspension of loose material on the road surface due to one vehicle movement has been estimated as 9.9155 g/VKT (see para 5.1). Hence, quantity of particulate emission from line source of 1 Km i.e from 4 tippers will be 4 X 9.9155 = 39.66 gm/kilometer, which is 0.039 gm/m.
The quantity 0.039 gm/m is only 3.9% of 1 gm/m (as studied by D. L.
Becker in 1978 (referenced by McCrea) and described above). Hence actual reduction in yield will be only 3.9% of 3.15% (as calculated above on the basis of 1 gm/m dust deposition and maximum additional traffic movement of 986 tippers per day) i.e only 0.122% only.
The range of reduction of yield in various roadside orchards as calculated above are in worst cases i.e if mitigation measures like water sprinkling, road maintenance, cleaning and road side plantations are not carried out. However, there is plantation of mature trees at various places along all the routes as evidenced in the photographs, which will mitigate the impact of dust substantially.
6.0 OBSERVATIONS From the site visit and through various data interpretation, following
observations have been made regarding various transportation routes:
� The transportation route from Basundhra-Garjanbahal area (Kulda and Basundhra mines) to Lara STPP is about 100 km long via Route-1A and about 101 km via Route-1B.
� While the length of route from Ib valley area (Samleshwari and Lajkura mines) to Lara STPP via Route-2 is about 66 km and from Lakhanpur area (Lakhanpur, Lilari and Belpahar mines) via Route-3 is about 50 km.
� The transportation route from Dulanga mines of NTPC to Lara STPP is about 91 km long via Route-4A and about 118 km via route-4B.
� The transportation route from Raigarh area (Baroud and Jampali mine) to Lara STPP is about 77 km long via Route-5. While the length of transportation route from Bhupdeopur railway siding to Lara STPP via Route-6 is about 43 km long.

Min Mec Consultancy Pvt. Ltd.
Assessment of Impacts Due to Transportation of Coal for Lara STPP of NTPC Ltd. 70
� The length of route from Kotarlia railway siding to Lara STPP via Route-7A is about 44 km and via Route 7B is about 35 km.
� Stretch from A-RW 9 to A-RW 25 was under strengthening and widening to 20 m by PWD through its contractor Balaji Construction Company during intial survey in Oct 2017. In June 2018, during the re-survey of the route it was observed that road widening has been completed except 1.5 km of road and at near the culverts, which are underway. Hence, for the purpose of this study, the entire stretch has been considered as 20 m since the under construction patches are also likely to be completed soon. The widening works and completion of road can be seen in Fig. 7.
� Also stretch from D-RW-14 to D-RW-15A and D-RW 16 to A-RW 42 on Route-1B, 4B, 5, 6 & 7A was under widening to 10 m by PWD at the time of survey. The stretches have now been widened to 10 m (D-RW-14 to D-RW-15), 15 m (RW-15 to RW-15A) and 10.2 m (D-RW-16 to D-RW-42) as on date. Also few more patches between Regalpali to Piplimal Bypass have been widened to 10 m.
� No-entry timing from 9.30-10.30 AM and 3.30-4.30 PM in Barpali, Durubaga, Garjanbahal and Kanika villages which lies on Route-1A, 4A & 4B. A bypass is under construction between stretch A-RW 15 and A-RW 16, which will bypass the Garjanbahal village, after completion of which the no entry timing can be waived off as per interaction with villagers.
� Also no entry timings is applied for trucks from 9:00-10:00 AM in morning, 1:00-2:00 PM in afternoon and from 5:00-6:00 PM in evening in Gopalpur, Ratanpur, Bileimunda, Taparia, Khuruslenga and Dhaurabhanta village. The villages are lying on Route-1B and 4B.
� Stretch from Dulanga project site to Durubaga chowk (E-RW 1 to E-RW 5) has width of about 3.8 - 4 m. The strengthening/ widening of this stretch has been taken up by PWD.
� The road from Kotarliya railway siding upto Urdana bypass is rural PWD Road having length approx.20 KM. This route contains 10m wide concrete road also. For damaged Patches road widening and strengthening by PWD, Raigarh is under process. NTPC is constantly in touch with PWD for widening and strengthening of the Road. PWD Raigarh has provided budgetary offer for construction and widening (at least 7 m)/strengthening of the road, NTPC shall provide necessary assistance for widening and strengthening/construction of the Road and shall bear the cost for the same..
� The road from Dhimrapur chowk to Bhupdeopur railway siding is a NH-49/200 and is in good condition.
� Various kinds of vehicles are using the roads such as cars, jeeps, motorcycles, scooters, buses, trucks, etc. Which can be seen in Fig. 8.
� Almost entire route from the Lara STPP to mines of MCL and NTPC Dulanga mines has a good green plantation cover on both sides of the road as can be seen in Fig. 9.

Min Mec Consultancy Pvt. Ltd.
Assessment of Impacts Due to Transportation of Coal for Lara STPP of NTPC Ltd. 71
FIG. 7: UNDER CONSTRUCTION ROAD BY PWD
FIG. 8: DIFFERENT VEHICLES ON THE ROAD

Min Mec Consultancy Pvt. Ltd.
Assessment of Impacts Due to Transportation of Coal for Lara STPP of NTPC Ltd. 72
FIG. 9: GREEN BELT ALONG ROUTE
7.0 CONCLUSION AND RECOMMENDATIONS This study has been conducted to assess the impact of coal transportation
from various mines of MCL (Kulda, Basundhra, Samleshwari, Lajkura, Lilari, Lakhanpur and Belpahar mines), SECL (Baroud and Jampali mines), Dulanga mines of NTPC Ltd, Bhupdeopur railway siding and Kotarlia railway siding. to Lara STPP, Tehsil Pussore, District Raigarh, Chhattisgarh of M/s NTPC Ltd.
NTPC proposes to transport coal for Lara STPP for 16 months (August,
2018 to November, 2019) from various mines and railway sidings as follows, which are all a part of routes of Scenario-2:
1. 2500 T/ Day of coal from Basundhra-Garjanbahal area (Kulda and
Basundhra mines) of MCL Mines via Route-1B. 2. 500 T/ Day of coal from IB valley area (Samleshari and Lajkura mines)
of MCL Mines via Route-2. 3. 700 T/ Day of coal from Lakhanpur area (Lakhanpur, Lilari and
Belpahar mines) of MCL Mines via Route-3. 4. 2000 T/ Day of coal from Dulanga CMP of NTPC Ltd. via Route- 4B. 5. 1800 T/ Day of coal from Raigarh area (Baroud and Jampali mine) of
SECL via Route-5. 6. 3500 T/ Day of coal from Bhupdeopur railway siding via Route-6.

Min Mec Consultancy Pvt. Ltd.
Assessment of Impacts Due to Transportation of Coal for Lara STPP of NTPC Ltd. 73
Or 3500 T/ Day of coal from Kotarliya railway siding via Route-7A.
Hence, the coal from mines and railway sidings would be brought through
trucks/ tippers of 25 tonnes (Route- 1A or 1B, 5 and 6; 7A; 7B), 20 tonnes (Route-4A or 4B) and 15 tonne (Route-2 and 3) capacity. There would be additional movement of maximum 986 coal carrying tippers (to & fro) in any of the Scenario 1 to 2. Traffic load on various sections of the routes under different scenarios has been given in Table 14 above.
All surveys, calculations and assessments have been carried out in line with
Standards available from Indian Road Congress (IRC), Ministry of Environment, Forest and Climate Change (MoEF&CC) and United States Environment Protection Agency (US EPA). Road width along entire length has been measured besides observation of traffic volumes at 41 “Census Point” locations.
Based on the various aspects studied, the following conclusions are arrived
at:
� From the aspect of Traffic Volume and capacity of the road As the routes are to be used for a period of 16 months i.e. from August,
2018 to November, 2019, there will be additional traffic due to coal transportation as well as natural growth of the existing traffic.
The findings from Table 15 and 16 and summary Table 17 are as follows:
Scenario-1 i.e. coal transportation to Lara STPP, from Basundhra & Kulda mine via Route-1A, from Samleshwari & Lajkura mine via Route-2, from Lakhanpur, Belpahar & Lilari mine via Route-3, from Dulanga CMP via Route-4A, from Baroud and Jampali mine via Route-5 and from Bhupdeopur siding via Route-6 or from Kotarlia Railway siding via Route-7B.
From the Table 15 and 17 above, it is clear that the present road width of all
the seven proposed routes i.e. Route-1A, 2, 3, 4A, 5, 6 & 7B is sufficient to carry existing traffic load, later after 16 months (August, 2018 to November, 2019) as well as additional proposed traffic load. In this case of scenario-1, the resultant future load (on November, 2019) will vary between 43.6% to 98.3% of the maximum capacity of Urban road and between 13.8% to 47.2% of the maximum capacity of Rural road.
Similarly in case of Scenario-2 i.e. coal transportation to Lara STPP, from Basundhra & Kulda mine via Route-1B, from Samleshwari & Lajkura mine via Route-2, from Lakhanpur, Belpahar & Lilari mine via Route-3, from Dulanga CMP via Route-4B, from Baroud and Jampali mine via Route-5 and from Bhupdeopur siding via Route-6 or from Kotarlia Railway siding via Route-7A.
Min Mec Consultancy Pvt. Ltd.
Assessment of Impacts Due to Transportation of Coal for Lara STPP of NTPC Ltd. 74
It is clear from the Table 16 and 17 that the present road width of all the seven proposed routes i.e. Route-1B, 2, 3, 4B, 5, 6 & 7A is sufficient to carry existing traffic load, later after 16 months (August, 2018 to November, 2019) as well as additional proposed traffic load. in case of scenario-2, the resultant future load (on November, 2019) will vary on urban area road between 46.2% to 98.3% and on rural area road between 13.8% to 55.7% of the maximum capacity of road. However, it may be noted that there are no-entry timings for trucks in Gopalpur, Ratanpur, Bileimunda, Taparia, Khuruslenga and Dhaurabhanta village on Route-1A & 4B from 9:00 to 10:00 am in morning, 1:00 to 2:00 pm in afternoon and from 5:00 to 6:00 pm in evening and in Barpali, Durubaga, Garjanbahal and Kanika villages which lies on Route-1A, 4A & 4B from 9.30-10.30 am and 3.30-4.30 pm. Due to this there will be backlog of trucks needing to pass through this stretch of route. Usually, in such scenario, the trucks will park on roadsides, empty plots, food shacks (dhaba), petrol pumps etc. and slow down the general traffic.
All the Census Points of rural and urban areas in both the Scenarios will have sufficient carrying capacity.
From study of the report, following conclusions can be drawn regarding the different routes to be used for transportation:
� In case of transportation of coal from Basundhra Garjanbahal area and
Dulanga CMP to Lara STPP, both the alternate routes i.e Route-1A & 1B and 4A & 4B, respectively, are feasible because, More than 80% length of all the 4 alternate routes have road width more than 7 m.
� While, for transportation of coal from Ib valley and Lakhanpur area to Lara STPP, the Route-2 and 3 via Piplimal Bypass, Gourparha and Patrapali villages has been considered feasible because of maximum part of the route has good road width (more than 90% of length of the route has >7m wide road), shorter distance and will be sufficient to accommodate the present and the additional traffic due to movement of coal carrying tippers.
� In case of transportation of coal from Baroud & Jampali mine and
Bhupdeopur railway siding, Route 5 (72.1% route length has road width >7 m) and Route-6 (100% route length has road width >7 m), respectively, are feasible because of good quality of road and present road width is sufficient to carry additional traffic load.
� While, for transportation of coal from Kotarlia railway siding to Lara
STPP, the Route-7A will be feasible via Urdana bypass but needs widening/ strengthening. As already said in section 6.0 that for damaged Patches road widening and strengthening by PWD, Raigarh is under process. NTPC is constantly in touch with PWD for widening and strengthening of the Road. PWD, Raigarh has provided budgetary offer for construction and widening (at least 7 m)/ strengthening of the road,
Min Mec Consultancy Pvt. Ltd.
Assessment of Impacts Due to Transportation of Coal for Lara STPP of NTPC Ltd. 75
NTPC shall provide necessary financial assistance for widening and strengthening/ construction of the 6.275 Km length at two stretches.
From the aspect of Impact on Ambient Air quality - A perusal of Table 24 shows that the plying of additional trucks would lead to an increase in the amount of emissions. The resultant air quality, after addition of the incremental values due to plying of additional coal carrying trucks will range from 56.9 to 118.0 µg/m3 for PM10, from 32.60 to 61.40 µg/m3 for PM2.5, from 6.02 to 27.2 µg/m3 for SO2 and from 8.36 to 32.10 µg/m3 for NO2 at the different air quality monitoring locations. It has been found that the concentration of all parameters would remain within the prescribed limits in both the scenarios at all places except PM10 118 µg/m3 and PM2.5 61.40 µg/m3 at only one place i.e near Kotarlia railway siding. It should be noted the baseline air quality at Kotarlia railway siding was observed beyond the limit because of material handling and on-going construction activities at Kotarliya railway siding. However, the next maximum of PM10 is 90.6 µg/m3
and PM2.5 is 50.2 µg/m3.
� From the aspect of Impact on Ambient Noise - The sound level from the movement of a truck passing on the road is approximately 90 dBA. This will be a short term increase, prevailing only at the time of passage of truck. There will be a short time increase in the noise level during plying of the vehicles. The overall Leq noise level will be slightly higher. As the vehicle passes, the noise levels will be deceasing.
As per the noise monitored in the area during the study period it is found that the existing noise level in the area is within the prescribed limits.
� From the aspect of Impact on Human Health- The incremental values
have been compared against the Air Quality Guidelines, Second Edition, World Health Organisation Regional Office for Europe, Copenhagen, Denmark, 2000 and found to be lower than the significant figures of 10 μg/m3.
From the aspect of Impact on Ecology- The actual range of reduction in
yield when 986 tippers (to & fro) per day will ply in worst case, it will be 0.122% only. The range of reduction of yield as calculated are in worst cases i.e. if mitigation measures like water sprinkling, road maintenance, cleaning and road side plantations are not carried out. However, there is plantation of mature trees at various places along all the routes as evidenced in the photographs, which will mitigate the impact of dust substantially.
Hence, a total of ten routes were surveyed and studied in detail with respect to road width, road condition, traffic volumes and other parameters. Based on the survey assessment, nine routes were found feasible for coal transportation, but with varying degree of, road widths and Maximum carrying Capacity. Out of nine feasible route only seven i.e Route-1B, 2, 3, 4B, 5, 6 and 7 will be opted for transportation of coal from various mines and sidings, refer Fig. 1.
Min Mec Consultancy Pvt. Ltd.
Assessment of Impacts Due to Transportation of Coal for Lara STPP of NTPC Ltd. 76
Based on the study and observations, the following are recommended: A. Plantation
� Continue to maintain plantation already done and replace
damaged saplings.
� Carry out additional plantation along the traffic route for dust and noise control on either side of road, in consultation with villagers, where ever possible.
B. Air pollution mitigation for protection of ecology & human health
� The tippers used for transportation of coal should be covered
with tarpaulin and properly stamped to ensure that tarpaulin is properly tied with the help of rope and tipper shall be fully covered so that there is no spillage of coal and/ or emission of dust during transportation
� The tippers will have PUC certification as per manufacturers norms and it shall be ensured that unadulterated diesel is used and procured from authorised dealers only.
� Only those vehicles having fitness certificate shall be allowed to ply
� Make provision for tyre washing at unloading point within the power plant.
C. Noise mitigation
� No honking along the settlements stretch, which would be silent zones.
� All trucks will undergo preventive maintenance as per manufacturers schedule and their silencers shall be maintained and operational at all times.
� Plantation along roadside as suggested for air pollution mitigation will also act as buffer against noise propagation
D. Safety
� Installation of speed bumps near settlements to ensure slow
driving
� Awareness to Truck drivers & villagers through hoardings on roads regarding road safety
� Contact number of crane operators along the routes shall be made available to all vehicle drivers
� All trucks will carry first aid kits and drivers will be trained in provision of first aid in case of emergency

Min Mec Consultancy Pvt. Ltd.
Assessment of Impacts Due to Transportation of Coal for Lara STPP of NTPC Ltd. 77
� Creating awareness for road safety to villagers and drivers and ensuring availability of ambulance facility for the accident victims, if any.
E. Road status
� Inform the PWD immediately in case of observation of any
damage to the road so that repairs can be requested and carried out at the earliest.
F. Facilities for Drivers Facilities for rest/ stay/ hygiene/ sanitation/ HIV Control for drivers shall
be provided at the plant as follows:
� Parking facilities for truck within the power plant
� Rest room for drivers
� Attached bath and toilets
� Drinking water with cooler
� Posters spreading awareness about safety, driving rules and HIV awareness

Annexures have been deleted due to the Size Constraint . Complete Report shall be submitted in Hard and Soft Copy separately.


![RRB NTPC Paper [2nd April 2016, Shift 2] - SSCAdda](https://static.fdokumen.com/doc/165x107/633ea1309014276f4601845b/rrb-ntpc-paper-2nd-april-2016-shift-2-sscadda.jpg)