Mr. Mayer AP Macroeconomics - Denton ISD
62
AP Macroeconomics Unit III Fall 2011 Inflation, Unemployment, Business Cycle and CPI, Phillips Curve, Circular Flow Model But maybe not in that order
-
Upload
khangminh22 -
Category
Documents
-
view
0 -
download
0
Transcript of Mr. Mayer AP Macroeconomics - Denton ISD

AP Macroeconomics
Unit III Fall 2011
Inflation, Unemployment,
Business Cycle and CPI, Phillips
Curve, Circular Flow Model
But maybe not in that order

Measuring the Cost of Living
• Inflation (tt)– occurs when the economy’s overall
price level is rising.
• Inflation Rate (tt%)
– the percentage change in the price
level from one time period to another.

THE CONSUMER PRICE
INDEX• The consumer price index (CPI) is a
measure of the overall cost of the goods and services bought by a typical consumer.
• The Bureau of Labor Statistics reports the CPI each month.
• It is used to monitor changes in the cost of living over time.

THE CONSUMER PRICE
INDEX
• When the CPI rises, the typical family
has to spend more dollars to
maintain the same standard of
living.

How the Consumer Price Index Is
Calculated
• Fix the Basket: Determine what prices are most important to the typical consumer.– The Bureau of Labor Statistics (BLS)
identifies a market basket of goods and services the typical consumer buys.
– The BLS conducts monthly consumer surveys to set the weights for the prices of those goods and services.

• Find the Prices: Find the prices of
each of the goods and services in
the basket for each point in time.
How the Consumer Price Index Is
Calculated

• Compute the Basket’s Cost: Use the
data on prices to calculate the cost
of the basket of goods and services
at different times.
How the Consumer Price Index Is
Calculated

• Choose a Base Year and Compute the Index:– Designate one year as the base year,
making it the benchmark against which other years are compared.
– Compute the index by dividing the price of the basket in one year by the price in the base year and multiplying by 100.
How the Consumer Price Index Is
Calculated

• Compute the inflation rate: (tt%)
The inflation rate is the percentage
change in the price index from the
preceding period.
How the Consumer Price Index Is
Calculated

• The Inflation Rate (tt%)
– The inflation rate is calculated as
follows:
Inflation Rate in Year 2 =CPI in Year 2 -CPI in Year 1
CPI in Year 1100
How the Consumer Price Index Is
Calculated

Calculating the Consumer Price Index and the Inflation Rate: An Example
Copyright©2004 South-Western

Copyright©2004 South-Western
Calculating the Consumer Price Index and
the Inflation Rate: An Example

Copyright©2004 South-Western
Calculating the Consumer Price Index and
the Inflation Rate: An Example

Copyright©2004 South-Western
Calculating the Consumer Price Index and
the Inflation Rate: An Example

Copyright©2004 South-Western
Calculating the Consumer Price Index and
the Inflation Rate: An Example

How the Consumer Price Index Is
Calculated
• Calculating the Consumer Price Index
and the Inflation Rate: Another Example
– Base Year is 2002.
– Basket of goods in 2002 costs $1,200.
– The same basket in 2004 costs $1,236.
– CPI = ($1,236/$1,200) 100 = 103.
– Prices increased 3 percent between 2002 and
2004.

FYI: What’s in the CPI’s Basket?
16%
Food and
beverages
17%
Transportation
Medical care
6%
Recreation
6%
Apparel
4%
Other goods
and services
4%
41%
Housing
6%Education and
communication
Copyright©2004 South-Western

Problems in Measuring the Cost of
Living
• The CPI is an accurate measure of
the selected goods that make up
the typical bundle, but it is not a
perfect measure of the cost of living.

Problems in Measuring the Cost of
Living
• Substitution bias
• Introduction of new goods
• Unmeasured quality changes

• Substitution Bias
– The basket does not change to reflect
consumer reaction to changes in
relative prices.
• Consumers substitute toward goods that
have become relatively less expensive.
• The index overstates the increase in cost of
living by not considering consumer
substitution.
Problems in Measuring the Cost of
Living

• Introduction of New Goods
– The basket does not reflect the change
in purchasing power brought on by the
introduction of new products.
• New products result in greater variety,
which in turn makes each dollar more
valuable.
• Consumers need fewer dollars to maintain
any given standard of living.
Problems in Measuring the Cost of
Living

• Unmeasured Quality Changes
– If the quality of a good rises from one year to
the next, the value of a dollar rises, even if the
price of the good stays the same.
– If the quality of a good falls from one year to
the next, the value of a dollar falls, even if the
price of the good stays the same.
– The BLS tries to adjust the price for constant
quality, but such differences are hard to
measure.
Problems in Measuring the Cost of
Living

• The substitution bias, introduction of new
goods, and unmeasured quality changes
cause the CPI to overstate the true cost
of living.
– The issue is important because many
government programs use the CPI to adjust
for changes in the overall level of prices.
– The CPI overstates inflation by about 1
percentage point per year.
Problems in Measuring the Cost of
Living

The GDP Deflator versus the
Consumer Price Index
• The GDP deflator is calculated as
follows:
GDP deflator =Nominal GDP
Real GDP100

The GDP Deflator versus the
Consumer Price Index
• The BLS calculates other prices
indexes:
– The index for different regions within the
country.
– The producer price index, which
measures the cost of a basket of goods
and services bought by firms rather
than consumers.

The GDP Deflator versus the Consumer Price Index
• Economists and policymakers
monitor both the GDP deflator and
the consumer price index to gauge
how quickly prices are rising.
• There are two important differences
between the indexes that can
cause them to diverge.

• The GDP deflator reflects the prices
of all goods and services produced
domestically, whereas...
• …the consumer price index reflects
the prices of all goods and services
bought by consumers.
The GDP Deflator versus the
Consumer Price Index

• The consumer price index compares the
price of a fixed basket of goods and
services to the price of the basket in the
base year (only occasionally does the BLS
change the basket)...
• …whereas the GDP deflator compares
the price of currently produced goods
and services to the price of the same
goods and services in the base year.
The GDP Deflator versus the
Consumer Price Index

Inflation
• Inflation – a rise in the level of prices
• Measured by CPI comparisons (year
to year; month to month)
• Normal economic growth = 2-3%
change
• Inflation is above 6% – “double digit”
is very serious for U.S.
• Hyperinflation can be devastating
to output and employment

Inflation’s Positive Effects
• Flexible-Income receivers are
unaffected (COLA like SS, businesses
with prices rising faster than costs,
commission sales positions, any business
that anticipates inflation, etc.)
• Debtors (borrowers pay back loans with
“cheap” dollars – lower interest than
inflation %)

Inflation’s Negative Effects
• Fixed income receivers (elderly
retirees, government workers, minimum
wage earners, landlords, etc.)
• Savers (paper assets lose value over
time when interest rate is lower than
inflation rate)
• Creditors (lenders are paid back in
“cheaper” dollars & have a loss of “real”
income)

Happy or Sad Face?
Banks lend out billions of dollars in fixed-
rate home mortgages to consumers.
Unexpected inflation will cause?
Bank
Borrower

Happy or Sad Face?
You borrow $15,000 for a new car and
agree to a variable interest rate loan.
Unexpected inflation will cause?
Bank
Borrower

Types of Inflation
• Demand – Pull Inflation
– Caused by changes in spending
beyond the production capacity
– i.e. failure to produce more drives up
price
– “too much money chasing too few
goods”
– In long run, wages will go up as workers
are in demand & cost of living
increases

Types of Inflation
• Cost – Push Inflation
– Caused by increase in factors of
production costs
– Per unit production costs rise
– Business must raise prices to make
profits
– “wage price spirals” as wages are the
largest single production cost
– Also caused by “supply shocks” (raw
materials or energy costs rise abruptly)

Two Measures of Inflation
1965
Percent
per Year
15
CPI
GDP deflator
10
5
01970 1975 1980 1985 1990 20001995
Copyright©2004 South-Western

Dollar Figures from Different Times
• Do the following to convert (inflate)
Babe Ruth’s wages in 1931 to dollars
in 2001:
Salary SalaryPrice level in 2001
Price level in 19312001 1931
$80,.
$931,
000177
152
579

The Most Popular Movies of All Times, Inflation Adjusted
Copyright©2004 South-Western

Real (r%) and Nominal Interest
(i%) Rates
• Interest represents a payment in the
future for a transfer of money in the
past.

• The nominal interest (i%) rate is the interest rate usually reported and
not corrected for inflation (tt%).
– It is the interest rate that a bank pays.
• The real interest rate (r%) is the nominal interest rate that is corrected for the effects of inflation
(tt%).
Real (r%) and Nominal Interest
(i%) Rates

• You borrowed $1,000 for one year.
• Nominal interest rate was 15%.
• During the year inflation was 10%.
Real interest rate = Nominal interest rate –Inflation
r% = i% - tt%r% = 15% - 10%
r% = 5%
Real (r%) and Nominal Interest
(i%) Rates

Real and Nominal Interest Rates
1965
Interest Rates
(percent
per year)
15
Real interest rate
10
5
0
–51970 1975 1980 1985 1990 1995 2000
Nominal interest rate
Copyright©2004 South-Western

Summary
• The consumer price index shows the cost
of a basket of goods and services relative
to the cost of the same basket in the
base year.
• The index is used to measure the overall
level of prices in the economy.
• The percentage change in the CPI
measures the inflation rate.

Summary
• The consumer price index is an imperfect
measure of the cost of living for the
following three reasons: substitution bias,
the introduction of new goods, and
unmeasured changes in quality.
• Because of measurement problems, the
CPI overstates annual inflation by about 1
percentage point.

Summary
• The GDP deflator differs from the CPI
because it includes goods and services
produced rather than goods and services
consumed.
• In addition, the CPI uses a fixed basket of
goods, while the GDP deflator
automatically changes the group of
goods and services over time as the
composition of GDP changes.

Summary
• Dollar figures from different points in time do not represent a valid comparison of purchasing power.
• Various laws and private contracts use price indexes to correct for the effects of inflation.
• The real interest rate equals the nominal interest rate minus the rate of inflation
r% = i% - tt%

The Business Cycle• The United States’ GDP is not constant
from year to year.
• Instead, the GDP grows most years
and then shrinks in some years.
• The ups and downs in GDP over time is
referred to as the business cycle.

The Business Cycle
Illustrated:

Business Cycles
• Economic Growth is a major goal
• Measured by – increase in real GDP or
increase in real GDP per capita
• Sources of growth: 1) increase resources
and 2 ) increase the productivity of the
resource inputs
• Productivity = real output per unit of
input
• Results from Health, training, education &
motivation of workers

The Business Cycle
Illustrated:• Peak
– temporary maximum in Real GDP. At this point the unemployment rate (u%) is probably below the natural rate of unemployment, and the inflation rate (π%) is probably increasing.
• Recession– The contractionary phase of the business cycle. A period of
decline in Real GDP accompanied by an increase in u%. To be classified as a recession, the economic decline must be at least 6 months long.
• Trough– The bottom of the business cycle. The u% is probably high and π%
is probably low.
• Recovery– The phase of the business cycle where the economy is returning to
full employment.

The Business Cycle Illustrated:
• Causes
– Irregularity of Investment
– Changes in productivity
– Changes in total spending (aggregate demand)
• Durable goods manufacturing is most susceptible
to the effects of the business cycle
• Business cycle has become less severe because
of technological advancements in supply-chain
management and structural changes in U.S.
economy.
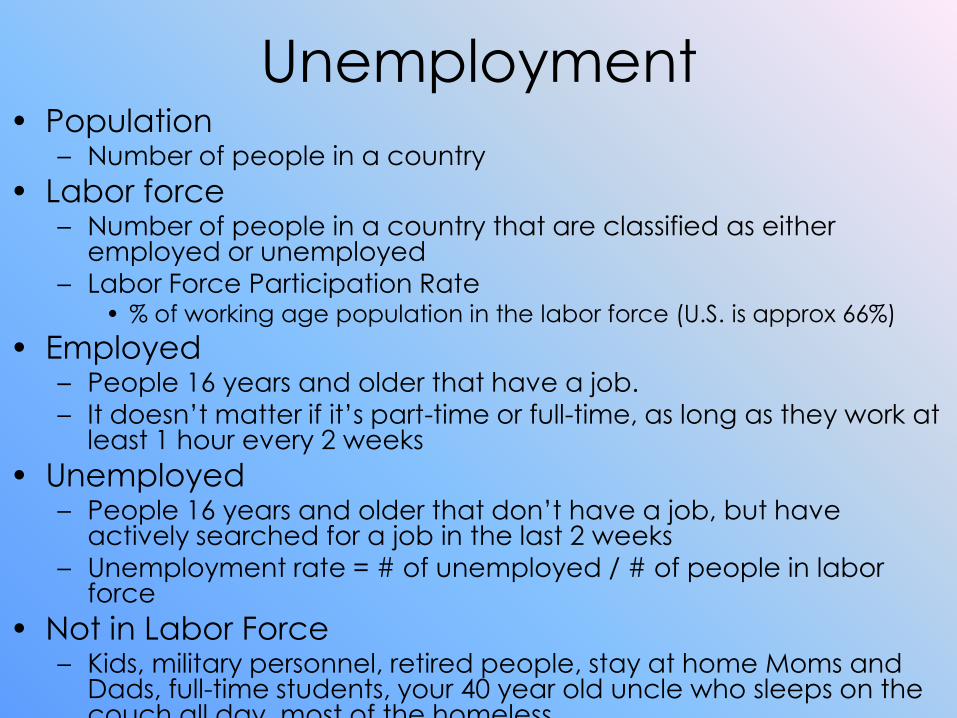
Unemployment• Population
– Number of people in a country
• Labor force– Number of people in a country that are classified as either
employed or unemployed
– Labor Force Participation Rate• % of working age population in the labor force (U.S. is approx 66%)
• Employed – People 16 years and older that have a job.
– It doesn’t matter if it’s part-time or full-time, as long as they work at least 1 hour every 2 weeks
• Unemployed– People 16 years and older that don’t have a job, but have
actively searched for a job in the last 2 weeks
– Unemployment rate = # of unemployed / # of people in labor force
• Not in Labor Force– Kids, military personnel, retired people, stay at home Moms and
Dads, full-time students, your 40 year old uncle who sleeps on the couch all day, most of the homeless.

Types of Unemployment• Frictional
– “between jobs”, voluntary, good for individuals and society
• Structural– Associated with lack of skills or declining industry (ex.
High school dropouts, type-writer repairmen). Think “Creative Destruction”
• Cyclical– Associated with downturns in business cycle. Bad for
society and individuals.
• Seasonal– Mall Santas, Schlitterbahn Life-guards, Ride operators at
Fiesta Texas, Golf-pros in Alaska during January.

Full Employment• Occurs when there is no cyclical
unemployment present in the economy
• Associate with the Natural Rate of
Unemployment (NRU).
– The level of unemployment experienced when
the economy is producing at its full potential.
– The United States’ NRU is approx. 4%-5%
• Associate Full Employment (FE) with the
PPC, the long-run aggregate supply (LRAS)
and the long-run Phillips curve (LRPC)

Why Unemployment is bad• Okun’s Law- Every 1% increase in the u%
causes a 2% decline in Real GDP.
• The burden of unemployment is not equally
shared in society.
• It causes social unrest and is hard on
individuals and families.

Phillips Curve
In the short run, inflation &
unemployment are inversely related
In the long run, unemployment is
unaffected by inflation
Inflation %
Unemployment
SRPC
LRPC – at
natural rate of
unemployment

An
nu
al
rate
of
infl
ati
on
(per
cen
t)
Unemployment rate (percent)
7
6
5
4
3
2
1
0
1 2 3 4 5 6 7
As inflation declines...
THE PHILLIPS CURVE CONCEPT
unemployment
increases
And vice versa!
SRPC

An
nu
al
rate
of
infl
ati
on
(per
cen
t)
Unemployment rate (percent)
7
6
5
4
3
2
1
0
1 2 3 4 5 6 7
THE PHILLIPS CURVE CONCEPT
SRPC 1
LRPC = Is the natural
Rate of Unemployment
SRPC 2
With Stagflation,
Shift SRPC to the
right With AD
shift, move
along
existing
SRPC

Phillips Curve• Short run trade-off between inflation and
unemployment.
• In the Long Run there is no trade off. The
long run Phillips curve is Vertical!
• Stagflation (an increase in Unemployment
and inflation) or an Aggregate Supply Shock
will shift the SRPC to the right.
• Decreases in Inflation and Unemployment will
shift the SRPC to the left. (and increase in AS
would cause this)

“Redelsheimer’sGraphs to Know”
TWO WAYS TO SHOW ECONOMIC GROWTH
A
B
C
D
Cap
ital
Good
s
Consumer Goods
Pric
e L
evel
Real GDP
ASLR1 ASLR2
Q1 Q2

“
Causes of Economic Growth
1. Increased investments in Capital Stock.
2. Increased investments in Human
Capital (education, training) and
increases in quantity of human
resources
3. New Technology leading to increased
productivity
4. Increase in quantity and quality of
natural resources

BUSINESSES HOUSEHOLDS
RESOURCES INPUTS
$ COSTS $ INCOMES
PRODUCT
MARKET
GOODS &
SERVICES
GOODS &
SERVICES
$ CONSUMPTION$ REVENUE
GOVERNMENT
RESOURCE
MARKET
Circular Flow Model