Australian Macroeconomics Workshop 2012
26
On the Environment, Income and Inequality: A Politico-economic Theory Timothy Kam and Yingying Lu Research School of Economics Australian National University Australasian Macro Workshop, Monash University, April 12-13, 2012
Transcript of Australian Macroeconomics Workshop 2012

On the Environment, Income andInequality: A Politico-economic Theory
Timothy Kam and Yingying Lu
Research School of EconomicsAustralian National University
Australasian Macro Workshop, Monash University, April 12-13, 2012

How Environment, Income and Inequality are linked with eachother?
Empirical studies (e.g. Torras and Boyce, 1998; Maganani,2000; Kinda, 2010)
Theoretical models (e.g. Marsiliani and Renstrom, 2000;Eriksson and Persson, 2003)

What we do with the model...
Question: How would politico-economic conflicts of interest distortthe allocations of income, inequality and environment relative tothe benchmark (Ramsey) allocation?
Environmental state positively depends on public expenditureand externality effect from agents use of “clean technology”.
Construct a benchmark model with Ramsey planner that isconsistent with the stylized facts observed from data.
Table: Correlation
Introduce political voting into the benchmark model.
Compare the politico-economic outcomes with the benchmarkmodel, especially the environmental outcome.

What we get from the model...
Compared to the benchmark (Ramsey) model...
Voters’ desire to manipulate politico-economic outcomes candistort private investment and therefore the composition ofenvironmental good from public expenditure and privateinvestment externality.
Political equilibria can generate either higher or lowerenvironmental quality, income and inequality.
In terms of welfare, politico-economic equilibria are all(weakly) Pareto dominated by the benchmark allocation.
Some empirical implications!

Model
OLG model with political voting
Similar framework to Hassler, Stroesletten and Zilibotti (HSZ,JET ’07)
Private agents
Agents have identical ex ante preference over privateconsumption and environmental good, which is perfectlysubstitutable at rate λ > 0.
High-income agents adopt a “clean technology” whichhas positive externality on the environment (measured byε > 0) through investment.

Model: Timing and Decisions
Figure: Event tree: time-t Y oung individual
BornNature
(Y, L) 7→ V Y,Lt
(O,L) 7→ V O,Lt+1
(Y,H) 7→ V Y,Ht
Invest at cost i2t
(O,U) 7→ V O,Ut+1
(O,S) 7→ V O,St+1
1− µ
µ1− it
it

Model
Government
Tax the high-income agents by age: τOt , τYt .
Reward successful agents for their “clean” investmentwith once-off subsidy bt.
Therefore, τYt = τYt − bt is the net tax rate on the young.
Tax revenue is spent on general transfer (st) and publicenvironmental good (At).
Environmental good (Et) = public expenditure +positive externality from use of “clean technology”through private investment

Model
The expected lifetime payoffs of each type of agent at time t aregiven respectively by:
V O,St = (1− τOt ) + st + λEt; (1)
V O,Ut = st + λEt; (2)
V O,Lt = V O,U
t ; (3)
V Y,Ht = −(it)
2 + it[(1− τYt + bt) + β(1− τOt+1)
]+(st + λEt) + β (st+1 + λEt+1) ;
(4)
V Y,Lt = (st + λEt) + β (st+1 + λEt+1) . (5)

Political Voting
Figure: Timing of repeated voting game.
t t+ 1
πt realized
Expectations:(τOt+1)
e
Old vote: (τYt , τOt )
zY realized
(Y,H) choose i∗[τYt , (τOt+1)
e]
(At, Et)
πt+1 realized
zY : Idiosyncratic productivity type of young agent, i.e. H or L.At: Public expenditure on environmental good.Et: Composite environmental good.
πt: Proportion of (O,S)-agents in the old (voter) population, πt+1 = i∗t .

Who is the decisive voter?
Definition (Current median voter)
A current median voter is one whose indirect utility at state πt is
wm(πt) = maxτOt ,τ
Yt
{(1− τOt )1I{πt≥ 1
2µ}
+ λ[W (πt, τ
Ot ) + Z(τYt , (τ
Ot+1)
e)]}
.
Assume: the subsidy (bt) cannot exceed the tax rate (τYt ), suchthat the net tax rate on the young τYt ∈ [0, 1].
W (�): tax revenue extracted from the old.Z(�): net tax revenue extracted from the young, including theinvestment externality.
Definition of Politico-economic Equilibria
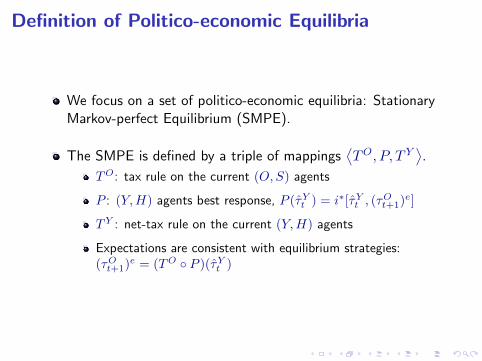
We focus on a set of politico-economic equilibria: StationaryMarkov-perfect Equilibrium (SMPE).
The SMPE is defined by a triple of mappings⟨TO, P, T Y
⟩.
TO: tax rule on the current (O,S) agents
P : (Y,H) agents best response, P (τYt ) = i∗[τYt , (τOt+1)e]
TY : net-tax rule on the current (Y,H) agents
Expectations are consistent with equilibrium strategies:(τOt+1)e = (TO ◦ P )(τYt )

Politico-economic Equilibria
Given the conflicts of interest exist (λ ≤ 1/µ), we show existenceof two classes of SMPE depending on (β, ε, µ):
Non-Machiavellian (NM) – unique
Machiavellian (M)
1 (M1) – continuum of equilibria
2 (M2) – unique (NEW!)

Politico-economic Outcomes
Equilibrium strategy and outcomes are time-invariant.
Environmental spillover of investment (ε) shows up in all theSMPE equilibrium outcomes.
Environmental outcome:
E = µ(τO + τY )i∗(τY , τO) + µεi∗(τY , τO)
When τY and τO increase, i∗ decreases.
Public provision: raise tax rates will decrease tax base.
Environmental spillover from private investment: raise tax rateswill reduce environmental externality from private investment.

Comparison with benchmark model...
Welfare: all SMPE outcomes are (weakly) Pareto-dominatedby Ramsey outcomes.
Income and inequality: Ramsey equilibrium can generatehigher average income and more equality than SMPE, exceptfor equilibria M1 that can go either way.
Environmental outcome: all classes of the politico-economicequilibria can generate more (or less) E.
Intuition: e.g. political manipulation may force too muchinefficient private externality on environmental good, whichhurts social welfare.
Numerical examples in next slide...

Numerical Examples
Table: Examples for comparative equilibria of E
Ex.1 Ex.2 Ex.3 Ex.4 Ex.5 Ex.6
β 3/4 3/4 1/3 1/3 3/4 3/4µ 3/4 3/4 3/4 3/4 9/10 9/10λ 3/4 1 3/4 2/3 3/4 1ε 1/4 1/4 1/9 1/9 1/2 1/2
E M1 > R M1 < R NM < R NM > R M2 > R M2 < R

Conclusion
This paper studies how politico-economic conflicts of interestdistort the allocations of income, inequality and environmentrelative to the benchmark (Ramsey) model.
Voters’ desire to manipulate politico-economic outcomes candistort private investment and therefore the composition ofenvironmental good from public expenditure and privateinvestment externality.
Political equilibria can generate either higher or lowerenvironmental quality, income and inequality. And marginalexternality effect ε plays a key role.
In terms of welfare, politico-economic equilibria are all(weakly) Pareto dominated by the benchmark allocation.

Empirical Implications
The empirical relationship between income and theenvironment estimated from data is sensitive to smallvariations in the data and econometric specifications.[Harbaugh et al. (RES,2002)]
So why are these results useful?
Data is the output of a black box.
Our theory implies that there ought to be endogeneity inthese relationships in the data.
Problem: Complexity of interaction between politics andeconomic outcomes may make inference on empiricallyestimated relations difficult.
Challenge: How to empirically identify and test which regimeof politico-economic equilibria underlies the observed data?

What we see in the data...
Table: OECD correlations between per-capita GDP (y), incomeinequality (Gini) and environmental quality index (SOx per capita).
y Gini SOx per capita
y 1Gini -0.25 1SOx per capita -0.51 0.50 1
*Note: Averaged data for 17 OECD member countries for the periods1991-1995, 1996-2000, 2001-2005.
Back

0
10
20
30
40
50
60
70
80
90
0 10,000 20,000 30,000 40,000 50,000
INCM
SOX
.20
.24
.28
.32
.36
.40
0 10,000 20,000 30,000 40,000 50,000
INCM
GINI
0
10
20
30
40
50
60
70
80
90
.20 .24 .28 .32 .36 .40
GINI
SOX
*Covered 17 OECD countries,
from 1990-2005, 5-year average.
INCM: GDP per capita (2000
constant US$)
GINI: Gini coefficient
SOX: SOx emissions (Kg per capita)
Table: Correlation