20 MACROECONOMICS – FISCAL, MONETARY AND SUPPLY ...
27
1 Business Economics, 1 st edition Mankiw, Taylor and Ashwin ISBN 9781408069813 © 2013 Cengage Learning EMEA LEARNING OBJECTIVES: By the end of this chapter, students should understand: Learn the difference between monetary, fiscal and supply-side policies Learn the difference between planned and actual spending, saving and investment Consider why deflationary and inflationary gaps occur Examine the concept of the marginal propensity to withdraw Learn how governments can influence aggregate demand to bring about desired macroeconomics outcomes in the short run Learn the theory of liquidity preference as a short-run theory of the interest rate Analyze how monetary policy affects interest rates and aggregate demand Analyze how fiscal policy affects interest rates and aggregate demand Discuss the debate over whether policy makers should try to stabilize the economy After reading this chapter students should be able to: Give a clear definition to outline the differences between monetary, fiscal and supply-side policies Explain the difference between planned and actual spending, saving and investment Draw a diagram of the Keynesian cross and use it to show both an inflationary and deflationary gap Be able to calculate the value of the multiplier given data on the marginal propensities to withdraw Use a diagram to explain the relevance of the slope of the expenditure line in relation to changes in autonomous expenditure Show what an increase in the money supply does to the interest rate in the short run Illustrate what an increase in the money supply does to aggregate demand Explain crowding out Describe the lags in fiscal and monetary policy 20 MACROECONOMICS – FISCAL, MONETARY AND SUPPLY-SIDE POLICY
-
Upload
khangminh22 -
Category
Documents
-
view
3 -
download
0
Transcript of 20 MACROECONOMICS – FISCAL, MONETARY AND SUPPLY ...
1
Business Economics, 1st edition Mankiw, Taylor and Ashwin
ISBN 9781408069813 © 2013 Cengage Learning EMEA
LEARNING OBJECTIVES: By the end of this chapter, students should understand:
Learn the difference between monetary, fiscal and supply-side policies
Learn the difference between planned and actual spending, saving and investment
Consider why deflationary and inflationary gaps occur
Examine the concept of the marginal propensity to withdraw
Learn how governments can influence aggregate demand to bring about desired macroeconomics outcomes in the short run
Learn the theory of liquidity preference as a short-run theory of the interest rate
Analyze how monetary policy affects interest rates and aggregate demand
Analyze how fiscal policy affects interest rates and aggregate demand
Discuss the debate over whether policy makers should try to stabilize the economy
After reading this chapter students should be able to: Give a clear definition to outline the differences between monetary, fiscal and supply-side policies
Explain the difference between planned and actual spending, saving and investment
Draw a diagram of the Keynesian cross and use it to show both an inflationary and deflationary gap
Be able to calculate the value of the multiplier given data on the marginal propensities to withdraw
Use a diagram to explain the relevance of the slope of the expenditure line in relation to changes in autonomous expenditure Show what an increase in the money supply does to the interest rate in the short run
Illustrate what an increase in the money supply does to aggregate demand
Explain crowding out
Describe the lags in fiscal and monetary policy
20 MACROECONOMICS –
FISCAL, MONETARY AND SUPPLY-SIDE POLICY
2
Business Economics, 1st edition Mankiw, Taylor and Ashwin
ISBN 9781408069813 © 2013 Cengage Learning EMEA
CONTEXT AND PURPOSE: Chapter 20 is the last of a five-chapter sequence making up part six of the book. Chapter 20 establishes the relationship between the rate of growth of money and the inflation rate. It also concentrates on short-run fluctuations in the economy around its long-term trend. We see how the government’s monetary, fiscal and supply-side policies affect aggregate demand and supply and in turn can influence economic growth and the rate of price changes. The purpose of Chapter 20 is to understand how monetary, fiscal and supply-side policies affect the aggregate demand and aggregate supply in an economy.
KEY POINTS: 1. The three main policies used to affect economic activity are monetary policy, fiscal policy and supply-
side policy.
2. Keynes developed The General Theory as a response to the mass unemployment which existed in the 1930s.
3. He advocated governments intervene to boost demand through influencing aggregate demand.
4. The Keynesian cross diagram shows how the economy can be in equilibrium when E = Y.
5. This equilibrium may not be sufficient to deliver full employment output and so the government can attempt to boost demand to help achieve full employment.
6. Supply-side policies aim to improve the efficiency of the economy and increase the capacity of the economy by shifting the aggregate supply curve to the right.
7. Key elements of a supply-side policy include tax and welfare reforms, improving the flexibility of labour markets including trade union reform, education and training and investing in improved infrastructure.
8. In developing a theory of short-run economic fluctuations, Keynes proposed the theory of liquidity preference to explain the determinants of the interest rate. According to this theory, the interest rate adjusts to balance the supply and demand for money.
9. An increase in the price level raises money demand and increases the interest rate that brings the money market into equilibrium. Because the interest rate represents the cost of borrowing, a higher interest rate reduces investment and, thereby, the quantity of goods and services demanded. The downward-sloping aggregate demand curve expresses this negative relationship between the price level and the quantity demanded.
10. Policy makers can influence aggregate demand with monetary policy. An increase in the money supply reduces the equilibrium interest rate for any given price level. Because a lower interest rate stimulates investment spending, the aggregate demand curve shifts to the right. Conversely, a decrease in the money supply raises the equilibrium interest rate for any given price level and shifts the aggregate demand curve to the left.

3
Business Economics, 1st edition Mankiw, Taylor and Ashwin
ISBN 9781408069813 © 2013 Cengage Learning EMEA
11. Policy makers can also influence aggregate demand with fiscal policy. An increase in government purchases or a cut in taxes shifts the aggregate demand curve to the right. A decrease in government purchases or an increase in taxes shifts the aggregate demand curve to the left.
12. When the government alters spending or taxes, the resulting shift in aggregate demand can be larger or smaller than the fiscal change. The multiplier effect tends to amplify the effects of fiscal policy on aggregate demand. The crowding-out effect tends to dampen the effects of fiscal policy on aggregate demand.
CHAPTER OUTLINE: A. Monetary Policy, Fiscal Policy and Supply-Side Policy
2. These are the three main policies used to control the economy. They affect businesses and consumers in different ways.
3. Fiscal and monetary policy tends to have an impact on aggregate demand whereas supply-
side policies are focused on the aggregate supply curve.
4. Monetary and fiscal policies can be used to help stabilize the economy from shifts in aggregate demand that cause short-run fluctuations in output and employment.
B. Monetary Policy
2. Definition of monetary policy: The set of actions taken by the central bank in order to affect the money supply.
3. MV = PY where M = the money stock, V = velocity of circulation, P = price level and Y =
level of national income. This can be stated more formally as Md = kPY where P is the price level, Y is the level of real national income, Md is demand for money for transactions purposes, k = proportion of national income held as transactions balances.
In equilibrium Md = Ms , so: P = (1/kY) x Ms . It follows that a rise in Ms will lead to a proportional rise in P.
C. The main weapon used to control the money supply is interest rates set by the central bank.
D. The interest rate transmission mechanism shows the effects of changes in the interest rates
on different parts of the economy.
1. Panel a) shows the effect of changes in interest rates on the amount of borrowing by businesses and individuals which in turn affect levels of consumption and investment.
2. Panel b) looks at how changes to interest rates affect those with mortgages and can
impact on disposable income thus affecting consumption.
Refer to Figure 20.1

4
Business Economics, 1st edition Mankiw, Taylor and Ashwin
ISBN 9781408069813 © 2013 Cengage Learning EMEA
3. Panel c) shows how changes in interest rates feed through to exchange rates.
E. The Central Bank’s Tools of Monetary Control
1. Open Market.
a. If the central bank wants to increase the supply of money, it creates currency and uses it to purchase government bonds from the public in the nation's bond markets.
b. If the central bank wants to lower the supply of money, it sells
government bonds from its portfolio to the public in the nation's bond markets. Money is then taken out of the hands of the public and the supply of money falls.
c. The open market operations described in these simple examples are
outright open market operations because they involve an outright sale or purchase of non-monetary assets to or from the banking sector by the central bank without a corresponding agreement to reverse the transaction at a later date.
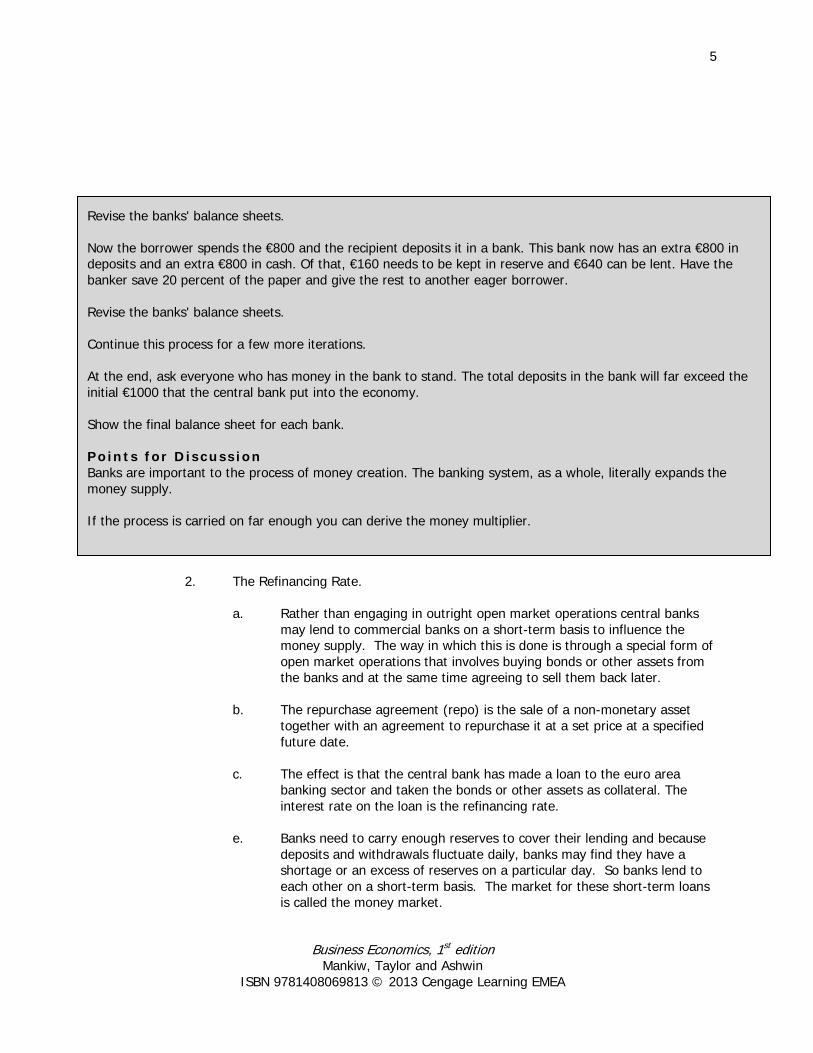
Activity 1 - Money Creation Type: In-class demonstration Topics: The banking system and deposit expansion Materials needed: 2 volunteers, a paper with “€1000” written on it Time: 25 minutes Class limitations: Works in any size class Purpose This activity demonstrates the role of the banking system in expanding the money supply. Instructions The two volunteers are bankers. Have each of them draw a balance sheet on the board. BankTwo FirstBankCorp Assets Liabilities Assets Liabilities 0 0 0 0 The rest of the class is the public. They are all eager borrowers and depositors. The instructor is the central bank. The central bank sets the reserve requirement at 20 per cent of deposits. The central bank also conducts open market operations. Use the €1000 paper to buy a baseball cap (or other item) from a student. (Explain that the central bank actually buys government bonds from the public since the market for used baseball caps is small.) The capless student now has €1000 to spend with any other member of the class. This student receives €1000 and puts it in the bank of his or her choice. The bank now has €1000 in deposits (a liability) and €1000 in cash (an asset). The bank needs to keep €200 in reserve (20 percent) but can loan the other €800. Have the banker tear off 20 percent of the bill and give the rest to another student. Continued.
5
Business Economics, 1st edition Mankiw, Taylor and Ashwin
ISBN 9781408069813 © 2013 Cengage Learning EMEA
2. The Refinancing Rate. a. Rather than engaging in outright open market operations central banks
may lend to commercial banks on a short-term basis to influence the money supply. The way in which this is done is through a special form of open market operations that involves buying bonds or other assets from the banks and at the same time agreeing to sell them back later.
b. The repurchase agreement (repo) is the sale of a non-monetary asset
together with an agreement to repurchase it at a set price at a specified future date.
c. The effect is that the central bank has made a loan to the euro area
banking sector and taken the bonds or other assets as collateral. The interest rate on the loan is the refinancing rate.
e. Banks need to carry enough reserves to cover their lending and because
deposits and withdrawals fluctuate daily, banks may find they have a shortage or an excess of reserves on a particular day. So banks lend to each other on a short-term basis. The market for these short-term loans is called the money market.
Revise the banks' balance sheets. Now the borrower spends the €800 and the recipient deposits it in a bank. This bank now has an extra €800 in deposits and an extra €800 in cash. Of that, €160 needs to be kept in reserve and €640 can be lent. Have the banker save 20 percent of the paper and give the rest to another eager borrower. Revise the banks' balance sheets. Continue this process for a few more iterations. At the end, ask everyone who has money in the bank to stand. The total deposits in the bank will far exceed the initial €1000 that the central bank put into the economy. Show the final balance sheet for each bank. Points for Discuss ion Banks are important to the process of money creation. The banking system, as a whole, literally expands the money supply. If the process is carried on far enough you can derive the money multiplier.
6
Business Economics, 1st edition Mankiw, Taylor and Ashwin
ISBN 9781408069813 © 2013 Cengage Learning EMEA
g. When the commercial banks are generally short of reserves, the money market interest rate will tend to rise, and when there is a surplus of liquidity in the money market the interest rate will tend to fall. The central bank monitors the money market and may intervene in it in order to affect the supply of liquidity to banks. By doing so it can influence the banks’ lending and hence the money supply.
h. The central bank intervention takes the form of repurchase agreements,
as discussed above, so the refinancing rate is crucial. In the UK the refinancing rate is referred to as the repo rate. In the USA, the corresponding rate is called the discount rate.
i. The repo rate is the interest rate at which the Bank of England lends on a
short-term basis to the UK banking sector. Whilst the discount rate is the interest rate at which the Federal Reserve lends on a short-term basis to the US banking sector.
3. Reserve Requirements.
a. The central bank can influence the money supply with reserve requirements. The reserve requirements are regulations on the minimum amount of reserves that banks must hold against deposits.
b. Definition of money multiplier: The amount of money the banking
system generates with each unit of reserves.
c. If the banks were required to hold 5% in reserves then the banking system would have 20 times as much in deposits as in reserves so the money multiplier would be 20. If banks had to hold 10% in reserve, the money multiplier would fall to 10.
d. New regulations following on from the current financial crises will require
banks to hold greater reserves. When the regulations are fully functioning banks will be required to hold 7% in reserve compared with just 25 prior to the crises.
E. Problems in Controlling the Money Supply
1. The central bank does not control the amount of money that consumers choose
to deposit in banks.
a. The more money that households deposit, the more reserves the banks have, and the more money the banking system can create.
b. The less money that households deposit, the smaller the amount of
reserves banks have, and the less money the banking system can create.
2. The central bank does not control the amount that bankers choose to lend.
a. The amount of money created by the banking system depends on loans being made.

7
Business Economics, 1st edition Mankiw, Taylor and Ashwin
ISBN 9781408069813 © 2013 Cengage Learning EMEA
b. If banks choose to hold onto a greater level of reserves than required by the Fed (called excess reserves), the money supply will fall.
3. Therefore, in a system of fractional-reserve banking, the amount of money in the
economy depends in part on the behaviour of depositors and bankers. 4. Because the Fed cannot control or perfectly predict this behaviour, it cannot
perfectly control the money supply.
III. Fiscal Policy
A. Fiscal Policy
1. Definition of fiscal policy: Influencing the level of economic activity though
manipulation of government income and expenditure.
2. The General Theory of Employment, Interest and Money was published in 1936. In it Keynes attempted to explain short-run economic fluctuations in general and the Great Depression in particular. Keynes’ primary message was that recessions and depressions could occur because of inadequate aggregate demand for goods and services. Keynes had long been a critic of classical economic theory because it could explain only the long-run effects of policies.
3. Keynes argued that short-run interventions in the economy could lead to improvements
in the economy that would be beneficial rather than waiting for the long run equilibrium to establish itself.
B. The Keynesian Cross
1. Definition of full employment: A point where those people who want to work at the going market wage level are able to find a job.
2. Definition of planned spending, saving or investment: the desired or
intended actions of households and firms.
3. Definition of actual spending, saving or investment: the realized or ex post outcome resulting from actions of households and firms.
4. Fundamental to Keynesian analysis is the distinction between planned and actual
decisions by households and firms. Planned and actual outcomes might be very different. As a result Keynes argued that there was no reason why equilibrium national income would coincide with full employment output.
5. Wages and prices might not adjust in the short run (so called sticky wages and
prices, which we looked at in Chapter 17) and so the economy could be at a position
Pitfall…. You will need to be able to be very clear about the role of planned and actual spending in this analysis.
Refer to Figure 20.2

8
Business Economics, 1st edition Mankiw, Taylor and Ashwin
ISBN 9781408069813 © 2013 Cengage Learning EMEA
where the level of demand in the economy was insufficient to bring about full employment. The mass unemployment of the 1930s could be alleviated, he argued, by governments intervening in the economy to manage demand to achieve the desired level of employment.
6. In the 45 degree line diagram, the 45 degree line can be thought of as the capacity of the economy. The economy is in equilibrium where the C + I + G + (X – M) line cuts the 45 degree line.
7. Definition of deflationary gap: The difference between full employment
output and the expenditure required to meet it.
C. The Multiplier Effect
1. Definition of multiplier effect: The additional shifts in aggregate demand that result when expansionary fiscal policy increases income and thereby increases consumer spending.
2. The accelerator principle relates the rate of change of aggregate demand to the rate of
change in investment. Since investment is a component of aggregate demand, economists are very interested in the way investment adjusts to changes in demand in the economy.
D. A formula for the spending multiplier
1. The marginal propensity to consume (MPC) is the fraction of extra income that a household consumes rather than saves.
2. Example: The government spends €10 billion on new power stations.
Assume that MPC = ¾.
3. Incomes will increase by €20 billion, so consumption will rise by MPC × €10 billion. The second increase in consumption will be equal to MPC × (MPC × €10 billion) or MPC2 × €10 billion.
4. To find the total impact on the demand for goods and services, we add up all of these
effects:
Change in government purchases = €10 billion First change in consumption = MPC × €10 billion Second change in consumption = MPC2 × €10 billion
Tip… The multiplier effect can be explained quite intuitively by, for example, asking students what they would do if they were given a small grant on account of their status as students. The chances are that some of the things they report they would spend some of this additional money on will generate income that might benefit another student or a family member or friend of a student; e.g. someone in the room might work in a restaurant in which a student says they would spend some of their grant. In this way we can begin to see how the multiplier effect works. If students say they would repay debt with the money received or save it you can refer them to the In the News feature in this chapter.
9
Business Economics, 1st edition Mankiw, Taylor and Ashwin
ISBN 9781408069813 © 2013 Cengage Learning EMEA
Third change in consumption = MPC3 × €10 billion Total Change = (1 + MPC + MPC2 + MPC3 + . . .) × €10 billion
ALTERNATIVE CLASSROOM EXAMPLE: The multiplier effect is also triggered by tax cuts. Suppose that government cuts taxes by €15 billion in order to boost the economy. Suppose also that the MPC is 0.8. The tax cut will give rise to an initial increase in consumption spending of €15 billion x 0.8 = €12 billion. To find the total impact on the demand for goods and services we add up all these effects:
Initial change in spending due to tax cut = €12 billion First induced change in consumption = MPC × €12 billion Second induced change in consumption = MPC2 × €12 billion Third induced change in consumption = MPC3 × €12 billion
Total change = (1 + MPC + MPC2 + MPC3 + . . .) × €12 billion This means that the multiplier can be written as: Multiplier = (1 + MPC + MPC2 + MPC3 + . . .) or 1/(1-MPC) In this case, MPC is 0.8 so the multiplier is 1/(1-0.8) = 5. The €15 billion of tax cuts will give rise to a €60 billion total increase in demand for goods and services.
10
Business Economics, 1st edition Mankiw, Taylor and Ashwin
ISBN 9781408069813 © 2012 Cengage Learning EMEA
5. This means that the multiplier can be written as:
Multiplier = (1 + MPC + MPC2 + MPC3 + . . .)
6. Because this expression is an infinite geometric series, it also can be written as: Multiplier = 1/(1-MPC)
7. Note that the size of the multiplier depends on the size of the marginal propensity to
consume.
E. Other applications of the multiplier effect
1. The multiplier effect applies to any event that alters spending on any component
of GDP (consumption, investment, government purchases, or net exports).
2. Examples include a reduction in net exports due to a recession in another
country or a stock market boom that raises consumption.
3. Definition of autonomous expenditure: spending which is not dependent on income.
4. An increase in autonomous expenditure, also termed an increase in injections,
induces a further increase in expenditure – this is the multiplier effect. The amount of this induced expenditure depends on how much of each extra euro of expenditure of is withdrawn from the circular flow.
Multiplier = 1 / MPW
Tip… It may help students to show them that MPC2 x €10 billion is the same as MPC x (MPC x €10 billion). That is, the second induced change in spending is given by multiplying the first induced change by the MPC.
Do the numbers: if the MPC is ¾ then the first induced change in spending is €7.5 billion; the second is ¾ x €7.5 billion, which is €5.625; and so on…
? What if… the government did some research and found that the MPC for the wealthiest 20 per cent of the population was 0.3 but that the MPC for the poorest 20 per cent was 0.95. What might the explanation for this difference be and how might this affect policy decisions on tax changes to boost the economy?
11
Business Economics, 1st edition Mankiw, Taylor and Ashwin
ISBN 9781408069813 © 2012 Cengage Learning EMEA
5. The marginal propensity to withdraw (MPW) will reduce the value of the multiplier.
6. In equilibrium, planned injections equal planned withdrawals. However, if actual
withdrawals are greater than planned injections then the economy would be experiencing a deficiency in demand. For example, assume that equilibrium output is €100 billion. Planned withdrawals amount to €60 billion. If this planned withdrawal level is not ‘bought’ by governments, firms and foreigners (i.e. planned injections) then firms will build up stocks and plan to cut back on output in the next period. This leads to a fall in income and as withdrawals are endogenous, planned withdrawals for the next period will fall. The process will continue until planned withdrawals equal planned injections once again and the economy is in equilibrium.
7. When the economy is experiencing such demand deficiency, the government can budget for a deficit to boost spending in the economy. It could also influence monetary policy to cut the cost of borrowing and so boost investment. The multiplier process meant that the increase in government spending did not need to be as high as the size of the inflationary or deflationary gap. 8. Definition of real money balances: What money can actually buy given the ratio of the money supply to the price level M/P.
Refer to Figure 20.3
12
Business Economics, 1st edition Mankiw, Taylor and Ashwin
ISBN 9781408069813 © 2012 Cengage Learning EMEA
IV. Supply-Side Policies
A. Definition of supply-side policy:
B. Supply-side policy aims to increase the efficiency of the markets in an economy and by doing so to increase its capacity causing an outward shift in the aggregate supply curve.
C. There are a number of ways the markets can be made more efficient.
1. Definition of deregulation: The removal of controls, laws or rules governing a particular market aimed at improving the economic efficiency of that market and therefore the performance of the economy at the microeconomic level.
2. Changing tax laws.
a. The argue goes that reducing taxes in incomes will provide a greater incentive to work.
b. Laffer argued that if taxes were too high, reducing them would actually raise tax revenue.
3. Welfare reform. Some welfare benefits act as a disincentive to work leading to long-
term unemployment.
4. Flexible labour markets
a. Flexible labour markets focus on the ease with which the demand and supply of labour responds to changing wage conditions.
b. Definition of underemployment: A situation where a worker has a job
but may not be working to full capacity or does not have all their skills utilized or is working for a lower income than their qualifications, training or experience might suggest.
c. Labour market can become more flexible by making it easier to hire and fire
and change to nature of the job when required.
d. Definition of geographical mobility: The ease with which people can move to different parts of the country where jobs may be available.
e. Definition of occupational mobility: The ease with which people are
able to move from occupation to occupation including the degree to which skills and qualifications are transferable between occupations.
Refer to Figure 20.4
Refer to Figure 20.5

13
Business Economics, 1st edition Mankiw, Taylor and Ashwin
ISBN 9781408069813 © 2013 Cengage Learning EMEA
5. Education and training. a. Investment in human capital to help improve productivity, innovation and
creativity.
b. Can be paid for by the state and or by firms.
6. Infrastructure includes transport, information exchange and the provision of utilities like power and water supply. Increased congestion and inadequate broadband access are examples of how a poor infrastructure can hold back growth.
7. Trade unions can distort the market if too powerful.
D. Summary
1. Some countries have surrendered the control of monetary policy to an independent
Central Bank.
2. Fiscal policies have both macro and microeconomic objectives.
V. How Monetary Policies Influences Aggregate Demand
A. The Theory of Liquidity Preference
1. Definition of theory of liquidity preference: Keynes’s theory that the interest rate adjusts to bring money supply and money demand into balance.
B. This theory is an explanation of the supply and demand for money and how they relate to the interest rate.
1. Money Supply
Tip… The effects of monetary policy are easy to show graphically. Begin with money supply, money demand, and an equilibrium interest rate. Show how both an increase and a decrease in the money supply affect interest rates.
Tip… Point out that when we discuss the "interest rate" we are discussing both the nominal interest rate and the real interest rate because we are assuming that they will move together.
Pitfall Prevention… Remember that monetary, fiscal and supply-side policies tend to be used together in order to target not only macroeconomic objectives but also microeconomic objectives which may help boost the overall efficiency of the economy. Given the prevailing economic orthodoxy of the day, one policy might take more prominence than another but the reality is that the three have to work in harmony.
14
Business Economics, 1st edition Mankiw, Taylor and Ashwin
ISBN 9781408069813 © 2013 Cengage Learning EMEA
a. The money supply in the economy is controlled by the central bank.
b. The central bank can alter the supply of money using open market operations, changes in the refinancing rate, and changes in reserve requirements.
c. Because the central bank can control the size of the money supply
directly, the quantity of money supplied does not depend on any other variables, including the interest rate. Thus, the supply of money is represented by a vertical supply curve.
2. Money Demand
a. Any asset’s liquidity refers to the ease with which that asset can be
converted into a medium of exchange. Thus, money is the most liquid asset in the economy.
b. The liquidity of money explains why people choose to hold it instead of
other assets that could earn them a higher return.
c. However, the return on other assets (the interest rate) is the opportunity cost of holding money. All else equal, as the interest rate rises, the quantity of money demanded will fall. Therefore, the demand for money will be downward sloping.
3. Equilibrium in the Money Market
a. The interest rate adjusts to bring money demand and money supply into
balance.
b. If the interest rate is higher than the equilibrium interest rate, the quantity of money that people want to hold is less than the quantity that the central bank has supplied. Thus, people will try to buy bonds or deposit funds in an interest bearing account. This increases the funds available for lending, pushing interest rates down.
c. If the interest rate is lower than the equilibrium interest rate, the
quantity of money that people want to hold is greater than the quantity that the central bank has supplied. Thus, people will try to sell bonds or withdraw funds from an interest bearing account. This decreases the funds available for lending, pulling interest rates up.
4. The Downward Slope of the Aggregate Demand Curve
Refer to Figure 20.6
Refer to Figure 20.7

15
Business Economics, 1st edition Mankiw, Taylor and Ashwin
ISBN 9781408069813 © 2013 Cengage Learning EMEA
a. When the price level increases, the quantity of money that people need to hold becomes larger. Thus, an increase in the price level leads to an increase in the demand for money, shifting the money demand curve to the right.
b. For a fixed money supply, the interest rate must rise to balance the
supply and demand for money. c. At a higher interest rate, the cost of borrowing increases and the return
on saving increases. Thus, consumers will choose to spend less and will be less likely to invest in new housing. Firms will be less likely to borrow funds for new equipment or structures. In short, the quantity of goods and services purchased in the economy will fall.
d. This implies that as the price level increases, the quantity of goods and
services demanded falls. This is Keynes’s interest rate effect.
C. Changes in the Money Supply
1. Example: The central bank buys government bonds in open-market operations.
2. This will increase the supply of money, shifting the money supply curve to the
right. The equilibrium interest rate will fall.
3. The lower interest rate reduces the cost of borrowing and the return to saving. This encourages households to increase their consumption and desire to invest in new housing. Firms will also increase investment, building new factories and purchasing new equipment.
4. The quantity of goods and services demanded will rise at every price level,
shifting the aggregate demand curve to the right.
5. Thus, a monetary injection by the central bank increases the money supply, leading to a lower interest rate, and a larger quantity of goods and services demanded.
Refer to Figure 20.8
ALTERNATIVE CLASSROOM EXAMPLE: Suppose the Fed sells government bonds in the open market. The following would occur: 1. The supply of money will decrease, shifting the money supply curve to the left. 2. The equilibrium interest rate will rise, raising the cost of borrowing and the return on saving. 3. Households will lower consumption and firms will lower investment. 4. The quantity of goods and services demanded will fall at every price level, shifting the aggregate
demand curve to the left.
16
Business Economics, 1st edition Mankiw, Taylor and Ashwin
ISBN 9781408069813 © 2013 Cengage Learning EMEA
D. The Role of Interest Rates
1. In recent years, many of the major central banks have conducted policy by
setting the interest rate at which they will lend to the banking sector (the refinancing rate for the ECB, the repo rate for the Bank of England, and the discount rate in the terms of the US Federal Reserve).
2. Because changes in the money supply lead to changes in interest rates,
monetary policy can be described either in terms of the money supply or in terms of the interest rate.
VI. How Fiscal Policy Influences Aggregate Demand
A. In the short run, the primary effect of fiscal policy is on the aggregate demand for goods
and services.
B. Changes in Government Purchases
1. When the government changes the level of its purchases, it influences aggregate demand directly. An increase in government purchases shifts the aggregate demand curve to the right, while a decrease in government purchases shifts the aggregate demand curve to the left.
2. The multiplier effect means that aggregate demand will shift by a larger amount
than the increase in government spending. However, there is also a crowding-out effect that works in the opposite direction, suggesting that the shift in aggregate demand could be smaller than the initial injection.
C. The Crowding-Out Effect
1. The crowding-out effect works in the opposite direction.
2. Definition of crowding-out effect: the offset in aggregate demand that
results when expansionary fiscal policy raises the interest rate and thereby reduces investment spending.
Refer to Figure 20.9
Tip… Make sure that you point out to students that, while the media describes the actions of the central bank as “changing interest rates,” they could instead be described as “changing the money supply.”
Tip… Point out the circumstances under which the central bank is likely to increase the money supply. Then, discuss the circumstances under which it is likely to decrease the money supply. Discuss the short- and long-run effects of each.
Tip… Show students that the central bank can target either the money supply or the interest rate, but not both.
17
Business Economics, 1st edition Mankiw, Taylor and Ashwin
ISBN 9781408069813 © 2013 Cengage Learning EMEA
3. When the government buys a product from a company, the immediate impact of
the purchase is to raise profits and employment at that firm. As a result, owners and workers at this firm will see an increase in income, and will therefore probably increase their own consumption.
4. If consumers want to purchase more goods and services, they will need to
increase their holdings of money. This shifts the demand for money to the right, pushing up the interest rate.
5. The higher interest rate raises the cost of borrowing and the return to saving.
This discourages households from spending their incomes for new consumption or investing in new housing. Firms will also decrease investment, choosing not to build new factories or purchase new equipment.
6. Thus, even though the increase in government purchases shifts the aggregate
demand curve to the right, this fall in consumption and investment will pull aggregate demand back toward the left. Thus, aggregate demand increases by less than the increase in government purchases.
7. Therefore, when the government increases its purchases by €X, the aggregate
demand for goods and services could rise by more or less than €X, depending on whether the multiplier effect or the crowding-out effect is larger.
a. If the multiplier effect is greater than the crowding-out effect, aggregate
demand will rise by more than €X.
b. If the multiplier effect is less than the crowding-out effect, aggregate demand will rise by less than €X.
D. Changes in Taxes
1. Changes in taxes affect a household’s take-home pay. If the government
reduces taxes, households will probably spend some of this extra income, shifting the aggregate demand curve to the right. If the government raises taxes, household spending falls, shifting the aggregate demand curve to the left.
2. The size of the shift in the aggregate demand curve will also depend on the sizes
of the multiplier and crowding-out effects.
a. When the government lowers taxes and consumption increases, earnings and profits rise, which further stimulate consumer spending. This is the multiplier effect.
b. Higher incomes lead to greater spending, which means a higher demand
for money. Interest rates rise and investment spending falls. This is the crowding-out effect.
3. Another important determinant of the size of the shift in aggregate demand due
to a change in taxes is whether people believe that the tax change is permanent or temporary. A permanent tax change will have a larger effect on aggregate demand than a temporary one.

18
Business Economics, 1st edition Mankiw, Taylor and Ashwin
ISBN 9781408069813 © 2013 Cengage Learning EMEA
VI. Conclusion
A. Before policy makers make any change in policy, they need to consider all the effects of their decisions.
B. Policy instruments can change the aggregate demand for goods and services and, thereby,
alter the economy’ s production and employment in the short run.
C. When the government reduces spending in order to balance the budget it needs to consider both the long-run effects on saving and growth and the short-run effects on aggregate demand and employment.
D. When the central bank reduces the growth rate of the money supply, it must take into
account the long-run effect on inflation as well as the short-run effect on production.
VII. In the News: Supply-Side Policies
A. This article looks at a perspective on adopting supply-side policies in India.
Activity 2 — Politics and Policy Type: Take-home assignment Topics: Aggregate Demand, Aggregate Supply Class limitations: Works in any class; works particularly well during major campaigns Purpose This assignment asks students to analyze a policy proposal or campaign promise from an economic perspective. Aggregate Demand-Aggregate Supply analysis lets students consider the macroeconomic implications of political promises. Assignment 1. Find a current political proposal that would have economic implications. This could be a campaign promise by a
candidate, or a policy proposal by a member of the government, or a policy proposal by a member of an opposition party.
2. Name the politician and briefly describe the proposal. 3. Consider the economic implications of this proposal. Is it more likely to affect Aggregate Demand or Aggregate
Supply? Explain how this proposal would change the AD curve—through consumption, investment, government spending, or net exports—or the AS curve—through labor, capital, natural resources, or technology.
4. Graph the impact of this proposal using aggregate demand and aggregate supply. Explain what happens to the price level and the level of output.
5. Does this policy seem to be appropriate given the current economic conditions? Explain. Points for Discuss ion Many political proposals will affect one, or more, components of aggregate demand—consumption, investment, government spending, or net exports. Some proposals may also have an impact on aggregate supply—enhancing a nation’s productive resources. These policies can have an impact on a country’s long-run prospects.

19
Business Economics, 1st edition Mankiw, Taylor and Ashwin
ISBN 9781408069813 © 2013 Cengage Learning EMEA
SOLUTIONS TO TEXT PROBLEMS: Quick Quizzes 1. Banks create money when they make loans and hold a fraction of the amount of the loans in
reserves, resulting in an expansion of both money and credit in the economy. If the ECB wanted to use all three of its tools to decrease the money supply, it would: (1) sell government bonds from its portfolio in the open market to reduce the number of euros in circulation; (2) increase reserve requirements to reduce the money created by banks; and (3) increase the refinancing rate to discourage banks from borrowing reserves from the ECB.
2. A decrease in the money supply increases the equilibrium interest rate. The decrease in the
money supply reduces aggregate demand because the higher interest rate causes households to buy fewer houses, reducing the demand for residential investment, and causes firms to spend less on new factories and new equipment, reducing business investment.
3. If the government reduces spending on motorway construction by €1 billion, the aggregate
demand curve shifts to the left because government purchases are lower. The shift to the left of the aggregate demand curve could be more than €1 billion because of the multiplier effect or it could be less than €1 billion because of the crowding-out effect.
In the News 1. Structural change results from changes in technology or from changes in the types of products and services people demand. Cyclical change refers to fluctuations in the economy through booms and recessions over time. The lower rate of economic growth indicates a slowdown. The road bump analogy refers to a cyclical slowdown, but the engine trouble analogy refers to a structural slowdown. The latter is likely to be the main cause as there have been too few economic reforms over the last few years. 2. Fiscal profligacy refers to the government building up a growing fiscal deficit meaning it is spending far more than it is getting in tax revenue. Too much of government spending has been on promoting current consumption especially in helping the poor rather than using it to invest in the infrastructure and in deal with supply side constraints. These constraints in meeting the demand providing energy for instance, has lead to price rises at a time when growth is being stunted. 3. The slowing economy means that economic growth is less than forecast so the government is getting in fewer taxes than it planned, so increasing the government deficit. Raising taxes when growth is lower than expected might just lower the growth rate. 4. Supply-side policies would help India improve the efficiency of businesses. This would require spending changes towards improving infrastructure and energy supplies. Other supply –side policies might include developing people skills. These policies are needed would to produce an outward shift of the aggregate supply curve allowing for economic growth without the inflationary pressures. 5. China has recognised it cannot sustain previous growth rates and that it must add more value to its products and service. This leaves a potential gap to be filled in the low added value market using cheap labour. The author believes India would benefit from filling that gap, but weaknesses in energy and infrastructure may stifle that opportunity which is why supply-side reforms are necessary.
20
Business Economics, 1st edition Mankiw, Taylor and Ashwin
ISBN 9781408069813 © 2013 Cengage Learning EMEA
Questions for Review 1. Monetary policy attempts to influence the level of economic activity through changes to the
amount of money in circulation and the price of money – short-term interest rates. Fiscal policy attempts it influence the level of economic activity through changes in government income and spending. Supply-side policy is aimed at influencing the aggregate supply in the economy, such as increasing the range and quality of the factors of production.
2. Changes in the interest rates feed through to different parts of the economy. The interest rate
transmission mechanism can work to bring about changes in the various components of aggregate demand. For example high interest rates increase the cost of mortgages and will therefore reduce the demand of housing. Low interest rates might lead to a depreciation of the value of the currency, providing a boost for firms selling abroad as their products become cheaper. Low interest rates also encourage higher spending and provide a boost to the economy.
3. Planned expenditure is the desired or intended expenditure of households and firms. Actual
expenditure is the expenditure that actually occurs – it is the outcome of households’ and firms’ actions.
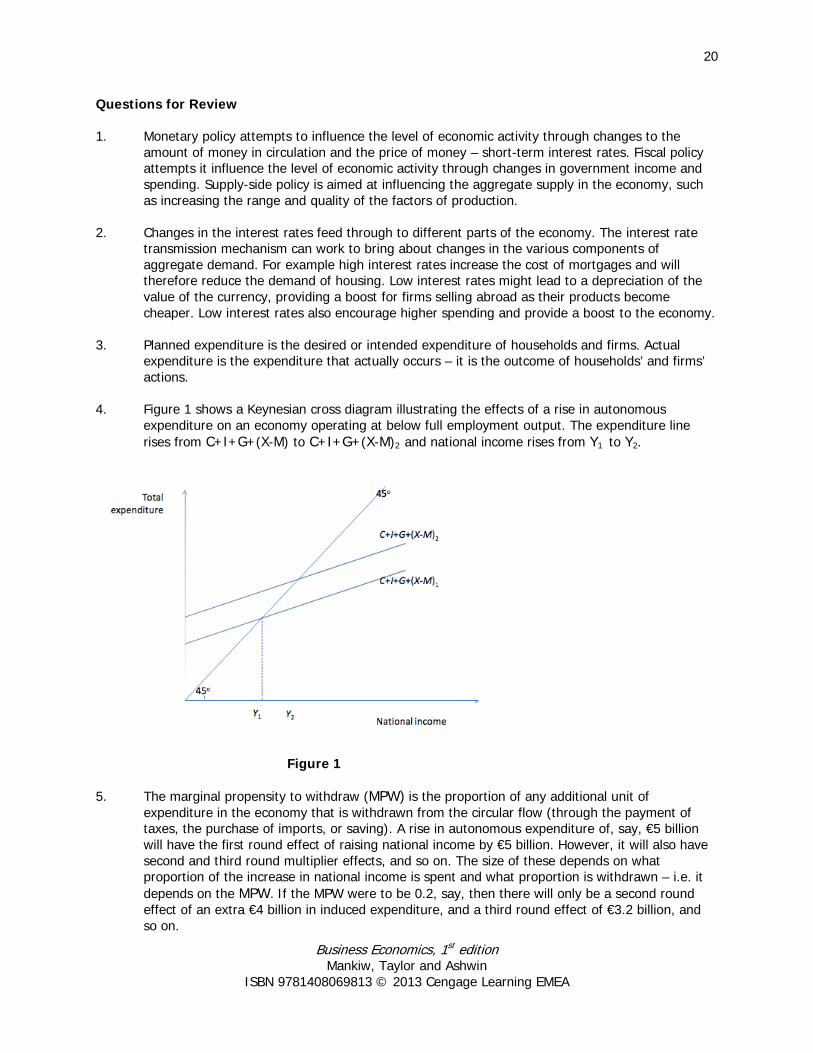
4. Figure 1 shows a Keynesian cross diagram illustrating the effects of a rise in autonomous
expenditure on an economy operating at below full employment output. The expenditure line rises from C+I+G+(X-M) to C+I+G+(X-M)2 and national income rises from Y1 to Y2.
Figure 1 5. The marginal propensity to withdraw (MPW) is the proportion of any additional unit of
expenditure in the economy that is withdrawn from the circular flow (through the payment of taxes, the purchase of imports, or saving). A rise in autonomous expenditure of, say, €5 billion will have the first round effect of raising national income by €5 billion. However, it will also have second and third round multiplier effects, and so on. The size of these depends on what proportion of the increase in national income is spent and what proportion is withdrawn – i.e. it depends on the MPW. If the MPW were to be 0.2, say, then there will only be a second round effect of an extra €4 billion in induced expenditure, and a third round effect of €3.2 billion, and so on.

21
Business Economics, 1st edition Mankiw, Taylor and Ashwin
ISBN 9781408069813 © 2013 Cengage Learning EMEA
6. Supply-side policies are designed to make markets and firms operate more efficiently. Supply-
side policies aim to shift the aggregate supply curve outwards and therefore have the effect of reducing the price level as there is a new market equilibrium. The policies help reduce the unemployment of the factors of production, so that for example more land is used and more people are employed. The increased supply means overall output must rise. 7.
8. The theory of liquidity preference is Keynes's theory of how the interest rate is determined.
According to the theory, the aggregate demand curve slopes downward because: (1) a higher price level raises money demand; (2) higher money demand leads to a higher interest rate; and (3) a higher interest rate reduces the quantity of goods and services demanded. Thus the price level has a negative relationship with the quantity of goods and services demanded.
9. A decrease in the money supply shifts the money-supply curve to the left. The money-supply
curve now intersects the money-demand curve at a higher interest rate. The higher interest rate reduces consumption and investment, so aggregate demand falls. Thus, the aggregate demand curve shifts to the left.
10. If the government spends €500 million to buy police cars, aggregate demand might increase by
more than €500 million because of the multiplier effect on aggregate demand. Aggregate demand might increase by less than €500 million because of the crowding-out effect on aggregate demand.
Problems and Applications 1. a. A reduction in child poverty in the short-run requires the government to make transfer
payments which is a fiscal policy. b. Improvements in productivity could be achieved by having a more flexible labour market
and a better trained one. This would have the effect of shifting the aggregate supply curve outwards. It is a supply-side policy. Legislation may be enough to increase the flexibility of the labour market, but better training and education will require government spending.
c. Investment by businesses would increase if the government managed to reduce interest
rates making the cost of borrowing cheaper. This is a monetary policy. d. The interest rate will help the government control inflation. It can increase interest rates
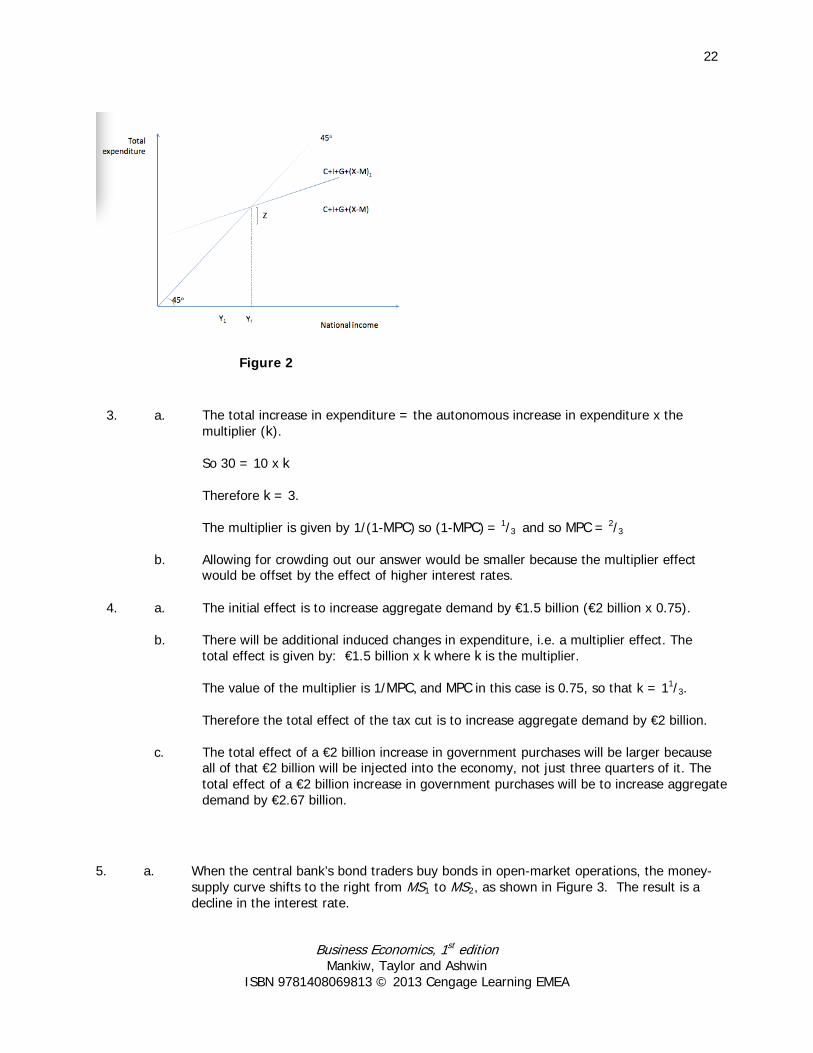
by restricting the money supply. This is a monetary policy. 2. Figure 2 illustrates a deflationary gap. The economy is in equilibrium where the expenditure
line intersects the 45 degree line. In figure 8 this is at Y1, below full employment output. There is insufficient demand to maintain full employment. The expenditure line would need to be at C + I + G + (X - M)1 in order to eliminate the deflationary gap labelled Z.
22
Business Economics, 1st edition Mankiw, Taylor and Ashwin
ISBN 9781408069813 © 2013 Cengage Learning EMEA
Figure 2
3. a. The total increase in expenditure = the autonomous increase in expenditure x the multiplier (k).
So 30 = 10 x k
Therefore k = 3.
The multiplier is given by 1/(1-MPC) so (1-MPC) = 1/3 and so MPC = 2/3
b. Allowing for crowding out our answer would be smaller because the multiplier effect would be offset by the effect of higher interest rates.
4.
a.
The initial effect is to increase aggregate demand by €1.5 billion (€2 billion x 0.75).
b.
There will be additional induced changes in expenditure, i.e. a multiplier effect. The total effect is given by: €1.5 billion x k where k is the multiplier.
The value of the multiplier is 1/MPC, and MPC in this case is 0.75, so that k = 11/3.
Therefore the total effect of the tax cut is to increase aggregate demand by €2 billion.
c.
The total effect of a €2 billion increase in government purchases will be larger because all of that €2 billion will be injected into the economy, not just three quarters of it. The total effect of a €2 billion increase in government purchases will be to increase aggregate demand by €2.67 billion.
5. a. When the central bank’s bond traders buy bonds in open-market operations, the money-
supply curve shifts to the right from MS1 to MS2, as shown in Figure 3. The result is a decline in the interest rate.

23
Business Economics, 1st edition Mankiw, Taylor and Ashwin
ISBN 9781408069813 © 2013 Cengage Learning EMEA
Figure 3
b. When an increase in credit card availability reduces the cash people hold, the money-demand curve shifts to the left from MD1 to MD2, as shown in Figure 4. The result is a decline in the interest rate.
Figure 4 c. When the central bank reduces reserve requirements, the money supply increases, so
the money-supply curve shifts to the right from MS1 to MS2, as shown in Figure 1. The result is a decline in the interest rate.
d. When households decide to hold more money to use for holiday shopping, the money-
demand curve shifts to the right from MD1 to MD2, as shown in Figure 5. The result is a rise in the interest rate.

24
Business Economics, 1st edition Mankiw, Taylor and Ashwin
ISBN 9781408069813 © 2013 Cengage Learning EMEA
Figure 5 e. When a wave of optimism boosts business investment and expands aggregate demand,
money demand increases from MD1 to MD2 in Figure 5. The increase in money demand increases the interest rate.
f. When an increase in oil prices shifts the short-run aggregate supply curve to the left, the
increased price level increases money demand. The money-demand curve shifts to the right from MD1 to MD2, as shown in Figure 5. The result is a rise in the interest rate.
Figure 6 6. a. When more ATMs are available, money demand is reduced and the money-demand curve shifts to the left from MD1 to MD2, as shown in Figure 6. If the central bank does not change the money supply, which is at MS1, the interest rate will decline from r1 to r2. The decline in the interest rate shifts the aggregate demand curve to the right, as consumption and investment increase.
25
Business Economics, 1st edition Mankiw, Taylor and Ashwin
ISBN 9781408069813 © 2013 Cengage Learning EMEA
b. If the central bank wants to stabilize aggregate demand, it should reduce the money
supply to MS2, so the interest rate will remain at r1 and aggregate demand will not change.
7. A tax cut that is permanent will have a bigger impact on consumer spending and aggregate
demand. If the tax cut is permanent, consumers will view it as adding substantially to their financial resources, and they will increase their spending substantially. If the tax cut is temporary, consumers will view it as adding just a little to their financial resources, so they will not increase spending as much.
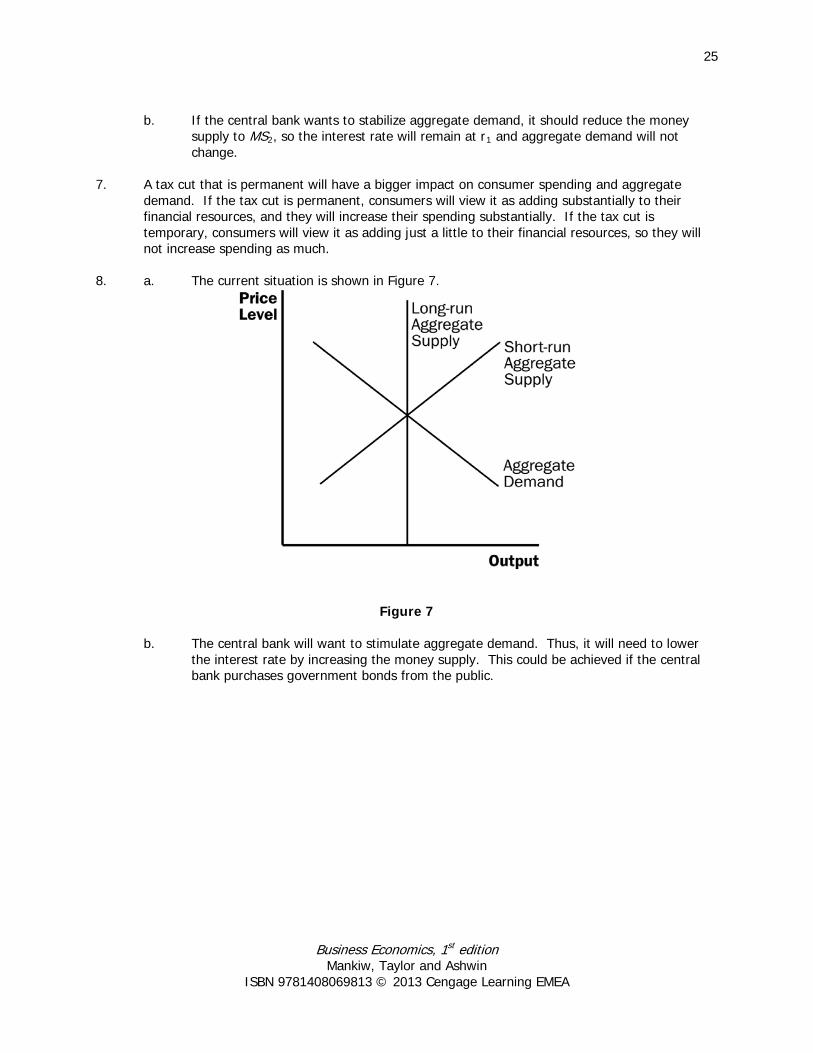
8. a. The current situation is shown in Figure 7.
Figure 7
b. The central bank will want to stimulate aggregate demand. Thus, it will need to lower the interest rate by increasing the money supply. This could be achieved if the central bank purchases government bonds from the public.
26
Business Economics, 1st edition Mankiw, Taylor and Ashwin
ISBN 9781408069813 © 2013 Cengage Learning EMEA
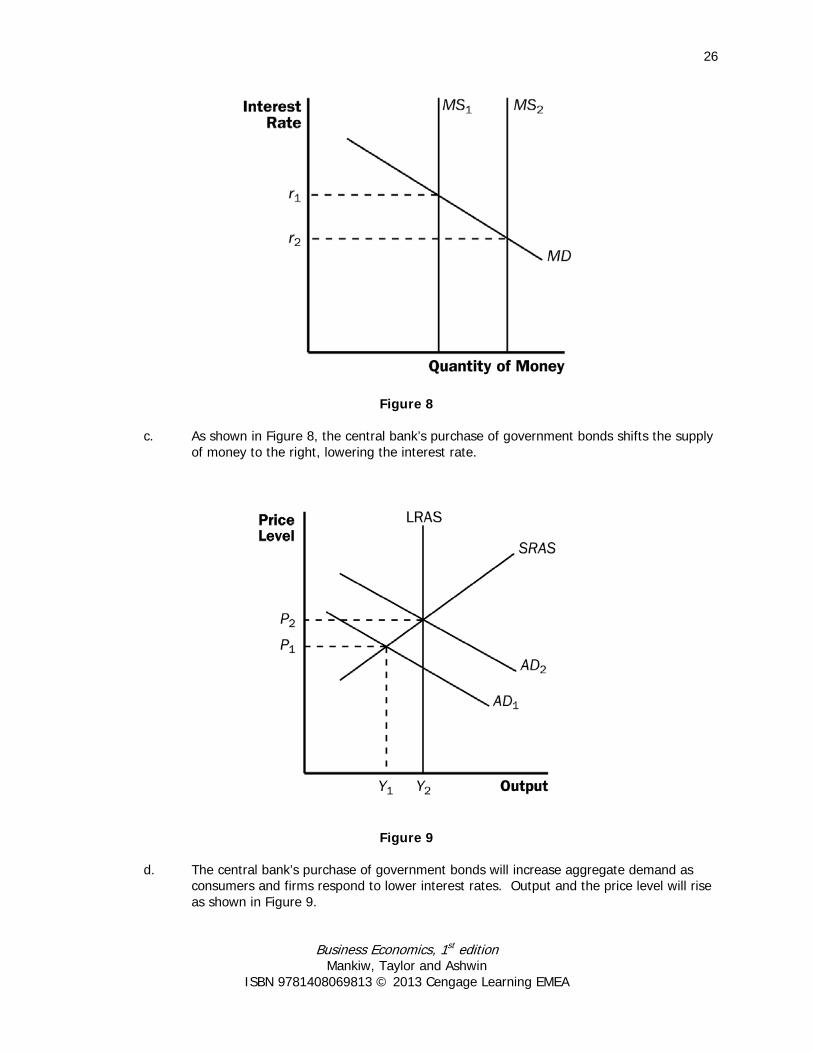
Figure 8
c. As shown in Figure 8, the central bank’s purchase of government bonds shifts the supply of money to the right, lowering the interest rate.
Figure 9 d. The central bank’s purchase of government bonds will increase aggregate demand as
consumers and firms respond to lower interest rates. Output and the price level will rise as shown in Figure 9.

27
Business Economics, 1st edition Mankiw, Taylor and Ashwin
ISBN 9781408069813 © 2013 Cengage Learning EMEA
9. a. Expansionary fiscal policy is more likely to lead to a short-run increase in investment if
the investment accelerator is large. A large investment accelerator means that the increase in output caused by expansionary fiscal policy will induce a large increase in investment. Without a large accelerator, investment might decline because the increase in aggregate demand will raise the interest rate.
b. Expansionary fiscal policy is more likely to lead to a short-run increase in investment if
the interest sensitivity of investment is small. Since fiscal policy increases aggregate demand, thus increasing money demand and the interest rate, the greater the sensitivity of investment to the interest rate the greater the decline in investment will be, which will offset the positive accelerator effect.
10. a. An increase in government spending would shift the aggregate demand curve to the
right, increasing output. The rise in output would raise consumption spending, since people would have higher incomes, and raise investment spending through the accelerator. But money demand would also increase, raising the interest rate. This would tend to reduce consumption, as people would save more, and reduce investment, since the cost of investing would be higher. Overall, the changes in both consumption and investment are ambiguous.
b. A reduction in taxes would directly increase consumption spending, since people would
have higher after-tax incomes. Also, since the reduction in taxes increases consumption spending, aggregate demand increases, so total output increases. The rise in output would raise consumption spending further, since people would have higher incomes, and raise investment spending through the accelerator. But money demand would also increase, raising the interest rate. This would tend to reduce consumption, as people would save more, and reduce investment, since the cost of investing would be higher. Overall, consumption must increase (otherwise aggregate demand would not have increased at all) while the change in investment is ambiguous.
c. An expansion in the money supply reduces the interest rate, thus increasing aggregate
demand and output. The rise in output would raise consumption spending, since people would have higher incomes, and raise investment spending through the accelerator. The lower interest rate would increase consumption, as people would save less, and increase investment, since the cost of investing would be lower. Overall, both consumption and investment would increase.