GFATM tracking study Macroeconomics and sector ...
57
FINAL DRAFT GFATM tracking study Macroeconomics and sector background paper TANZANIA Prepared for LSHTM by Sally Lake January 2004
-
Upload
khangminh22 -
Category
Documents
-
view
0 -
download
0
Transcript of GFATM tracking study Macroeconomics and sector ...

FINAL DRAFT
GFATM tracking study
Macroeconomics and sector background paper
TANZANIA
Prepared for LSHTM by Sally Lake January 2004

GFATM Tracking Study: Macroeconomics and sectoral background Tanzania
Final draft i
CONTENTS
Acknowledgements and caveats…………………………………………………………….…….iv Acronyms………………………………………………………………………………………...….. v Summary of key issues and areas for Phase 2 tracking…………………………. …...……… vii
1 INTRODUCTION ................................................................................................................1
1.1 BACKGROUND TO THE STUDY ............................................................................................1 1.2 THE COUNTRY MACROECONOMIC AND SECTORAL FINANCING DESK STUDY ..........................1 1.3 STRUCTURE OF THE DOCUMENT .........................................................................................3
2 THE MACROECONOMIC CONTEXT................................................................................3
2.1 OVERVIEW AND PAST PERFORMANCE.................................................................................3 2.1.1 STRUCTURE OF THE ECONOMY ........................................................................................3 2.1.2 RECENT ECONOMIC PERFORMANCE .................................................................................4 2.2 THE CURRENT ECONOMIC PROGRAMME..............................................................................6 2.3 POVERTY, AND THE PRSP.................................................................................................6 2.3.1 POVERTY IN TANZANIA: AN OVERVIEW..............................................................................6 2.3.2 POVERTY REDUCTION POLICIES AND STRATEGIES.............................................................8 2.3.3 THE PRSP, HEALTH AND HIV/AIDS ..............................................................................10 2.4 EXTERNAL FINANCING .....................................................................................................14 2.4.1 TANZANIA ASSISTANCE STRATEGY ................................................................................14 2.4.2 BUDGET SUPPORT FOR POVERTY REDUCTION ................................................................15 2.5 ADMINISTRATIVE SETUP...................................................................................................16 2.5.1 ADMINISTRATIVE DECENTRALISATION AND LOCAL GOVERNMENT REFORM ......................16 2.5.2 FISCAL DECENTRALISATION ...........................................................................................17
3 THE GOVERNMENT BUDGET FRAMEWORK ..............................................................18
3.1 THE FINANCIAL YEAR AND THE PLANNING CYCLE ..............................................................18 3.1.1 PUBLIC EXPENDITURE REVIEW ......................................................................................18 3.2 THE MEDIUM TERM EXPENDITURE FRAMEWORK...............................................................19 3.3 FINANCIAL MANAGEMENT................................................................................................20
4 HEALTH SECTOR CONTEXT.........................................................................................21
4.1 ADMINISTRATIVE SETUP...................................................................................................21 4.1.1 CENTRAL MOH.............................................................................................................21 4.1.2 REGIONS ......................................................................................................................21 4.1.3 LOCAL GOVERNMENT AUTHORITIES...............................................................................22 4.2 CURRENT HEALTH POLICIES AND STRATEGIES ..................................................................22 4.2.1 HEALTH PLANNING, BUDGETING, FINANCING AND FINANCIAL MANAGEMENT......................25 4.2.2 MONITORING, REPORTING AND EVALUATION...................................................................26 4.3 SECTORAL EXPENDITURE OVERVIEW................................................................................26 4.3.1 OVERALL SPENDING ......................................................................................................26 4.3.2 EXTERNAL FUNDING IN THE HEALTH SECTOR ..................................................................27 4.3.3 PROJECT VERSUS PROGRAMME SUPPORT......................................................................29 4.3.4 EXTERNAL FINANCING FOR HIV/AIDS, MALARIA AND TUBERCULOSIS..............................30

GFATM Tracking Study: Macroeconomics and sectoral background Tanzania
Final draft ii
4.3.5 HEALTH SECTOR SPENDING ON HIV/AIDS ACTIVITIES.....................................................32
5 GFATM AND SPECIFIC ISSUES FOR THE TRACKING STUDY ..................................33
5.1 BROAD MACROECONOMIC ISSUES ARISING.......................................................................34 5.2 SECTORAL ISSUES ARISING..............................................................................................35 5.2.1 GENERAL......................................................................................................................35 5.2.2 HIV/AIDS.....................................................................................................................36 5.2.3 MALARIA.......................................................................................................................37
6 ANNEXES ........................................................................................................................40
Annex A Terms of Reference for Macro-economic Desk Study.............................................40 Annex B Local Government Authorities by phase of reform ..................................................42 Annex C Tanzania MTEF and budget calendar .....................................................................43 Annex D Details of GFATM priority disease projects in MOF database.................................45

GFATM Tracking Study: Macroeconomics and sectoral background Tanzania
Final draft iii
List of tables Table 1 GDP by sector, 1998 – 2002 (TSh m and %)..............................................................4 Table 2 Trends in selected macroeconomic indicators ............................................................5 Table 3 Poverty headcount ratios, 1992/92 and 2000/01.........................................................7 Table 4 Progress in areas of non-income poverty....................................................................7 Table 5 PRSP priority sectors and items (2000 original)..........................................................9 Table 6 Rough per capita estimates of requirements for priority disease areas, FY03..........11 Table 7 GFS classifications....................................................................................................20 Table 8 MOH departmental budget classification...................................................................21 Table 9 Total public health expenditure, FY99 – FY03 (TSh bn) ..........................................27 Table 10 Public health spending, by funding type (Billion shillings) .......................................28 Table 11 HIV/AIDS, TB and Malaria in the MOF health sector database, FY03....................30 Table 12 Projected external spending from MOF database for HIV/AIDS “sector” ................31 Table 13 HIV/AIDS spending, Central MOH (TSh) ................................................................33 Table 14 HIV/AIDS spending, Local Government Authorities (TSh) ......................................33 Table 15 Tanzania mainland GFATM proposals....................................................................34 Table 16 Possible disbursement of GFATM monies (US$)....................................................34
List of figures
Figure 1 PRSP projections of health spending as % of DRE, FY00 – FY03..........................12 Figure 2 Budgeted and actual recurrent health spending as % of adjusted DRE, FY99 –
FY03................................................................................................................................13 Figure 3 On-budget health spending as a proportion of the total GOT budget, FY99 – FY03
........................................................................................................................................27 Figure 4 On-budget share of domestic and foreign financing, FY99 – FY03 .........................28 Figure 5 Health sector external financing, by budget status, FY03........................................29 Figure 6 Basket funding as a share of recurrent health spending, FY00 – FY03...................29
List of boxes Box 1 PRS Targets in relation to income poverty.....................................................................9 Box 2 PRS survival targets related to health..........................................................................10 Box 3 PRSP survival targets related to HIV/AIDS..................................................................13 Box 4 Key areas in strengthening development cooperation .................................................15 Box 5 Key findings of the HIV/AIDS PER for FY03 ................................................................32

GFATM Tracking Study: Macroeconomics and sectoral background Tanzania
Final draft iv
Acknowledgements
This draft paper was commissioned by a team from the Department of Public Health and Policy at the London School of Hygiene and Tropical Medicine as background to an 18-month tracking study of the Global Fund for AIDS, Tuberculosis and Malaria. The study is jointly funded by the Danish Agency for Development Assistance (DANIDA), the UK Department for International Development (DFID), Development Cooperation Ireland (DCI), and the Netherlands Directorate-General for International Cooperation (DGIS). Assistance in sourcing documents from Tanzania was gratefully received from Jacqueline Mahon (Swiss Agency for Development and Cooperation (SDC) – Tanzania), Paul Smithson (DFID Tanzania), Anita Alban, and through the consultant’s participation in the FY03 Public Expenditure Review process with the Ministry of Health, funded by SDC.
Caveats
This document is the draft output of a desk-based study, and as such has been limited by the number and type of documents available to the consultant. Key documents which it has not yet been possible to obtain include the draft National Health Policy and the detailed 2002/03 Medium Term Expenditure Framework documents which identify earlier activities and budgets related to HIV/AIDS, malaria and tuberculosis. The Health Sector HIV/AIDS Strategy and the medium term plan of the National Tuberculosis Programme were also not available. Some data are drawn from draft documents, and may be subject to change, eg the general Budget Guidelines circulated in December 2002 (which had limited circulation and should probably not be cited), and the FY03 health sector Public Expenditure Review update. In addition, general documentation circulated in advance of the May 2003 Public Expenditure Review consultative meeting refers to an assessment of the macroeconomic impact of external aid in the Tanzania context, but to date it has been possible only to source summary documents. This draft was essentially finalised in October 2003, since when a number of developments have occurred which it has not been possible to incorporate. The most important of these are noted in the summary, ie the approval of the substantial Care and Treatment Plan (prepared with support from the “Clinton Foundation”) the approval of Tanzania’s third round GFATM proposal, and launching of WHO’s 3 x 5 initiative, some details of which are given in Sections 4 and 5. In addition, various key documents have been or are in the process of being updated as part of the FY04 Public Expenditure Review process, notably the HIV/AIDS cross-sectoral PER, the health sector PER, and the joint annual review of the multi-donor Poverty Reduction Budget Support and World Bank Poverty Reduction Support Credit. Findings of these will be included in any update of this document, but in the interim should be taken into account by the Study Team.
GFATM Tracking Study: Macroeconomics and sectoral background Tanzania
Final draft v
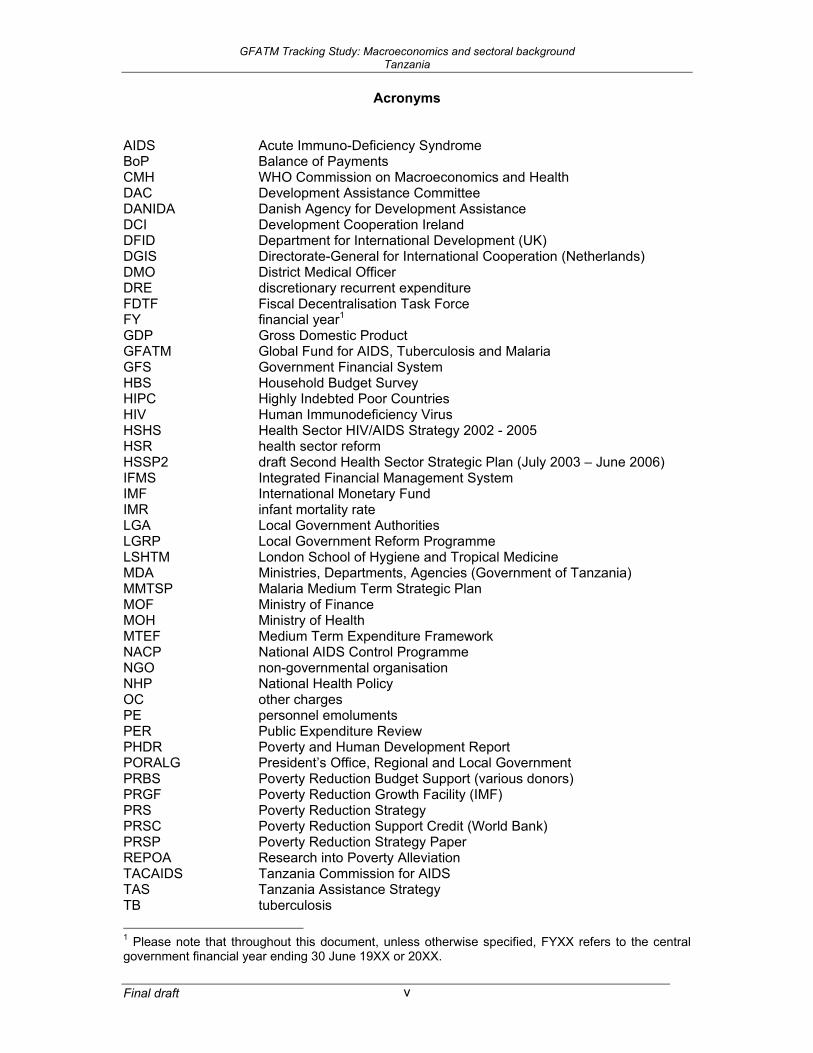
Acronyms AIDS Acute Immuno-Deficiency Syndrome BoP Balance of Payments CMH WHO Commission on Macroeconomics and Health DAC Development Assistance Committee DANIDA Danish Agency for Development Assistance DCI Development Cooperation Ireland DFID Department for International Development (UK) DGIS Directorate-General for International Cooperation (Netherlands) DMO District Medical Officer DRE discretionary recurrent expenditure FDTF Fiscal Decentralisation Task Force FY financial year1 GDP Gross Domestic Product GFATM Global Fund for AIDS, Tuberculosis and Malaria GFS Government Financial System HBS Household Budget Survey HIPC Highly Indebted Poor Countries HIV Human Immunodeficiency Virus HSHS Health Sector HIV/AIDS Strategy 2002 - 2005 HSR health sector reform HSSP2 draft Second Health Sector Strategic Plan (July 2003 – June 2006) IFMS Integrated Financial Management System IMF International Monetary Fund IMR infant mortality rate LGA Local Government Authorities LGRP Local Government Reform Programme LSHTM London School of Hygiene and Tropical Medicine MDA Ministries, Departments, Agencies (Government of Tanzania) MMTSP Malaria Medium Term Strategic Plan MOF Ministry of Finance MOH Ministry of Health MTEF Medium Term Expenditure Framework NACP National AIDS Control Programme NGO non-governmental organisation NHP National Health Policy OC other charges PE personnel emoluments PER Public Expenditure Review PHDR Poverty and Human Development Report PORALG President’s Office, Regional and Local Government PRBS Poverty Reduction Budget Support (various donors) PRGF Poverty Reduction Growth Facility (IMF) PRS Poverty Reduction Strategy PRSC Poverty Reduction Support Credit (World Bank) PRSP Poverty Reduction Strategy Paper REPOA Research into Poverty Alleviation TACAIDS Tanzania Commission for AIDS TAS Tanzania Assistance Strategy TB tuberculosis 1 Please note that throughout this document, unless otherwise specified, FYXX refers to the central government financial year ending 30 June 19XX or 20XX.

GFATM Tracking Study: Macroeconomics and sectoral background Tanzania
Final draft vi
TMAP Tanzania Multi-sector HIV/AIDS Project TSh Tanzanian shillings U5MR under-five mortality rate URT United Republic of Tanzania VCT voluntary counselling and testing WB World Bank WHO World Health Organisation

GFATM Tracking Study: Macroeconomics and sectoral background Tanzania
Final draft vii
Summary of key issues and areas for Phase 2 tracking Tanzania is currently benefiting from relatively strong economic performance, with consistently high growth rates in recent years, with real GDP growth reaching 6.2% in 2002 and positive per capita GDP growth over the last five years. The country has also successfully contained inflation which fell below 5% in 2002, reaching 4.2% in March 2003. Foreign reserves have grown substantially in recent years, reaching the equivalent of almost nine months of imports in 2002. Fiscal policy is considered broadly sound, with the government meeting its recent targets in terms of domestic revenue performance, reduction in the fiscal deficit, and zero domestic borrowing. With no major turbulence to throw the planned expenditure programme under the PRSP off-course, expenditure levels have been maintained even in the face of shortfalls in project funding. One outstanding problem is the poor quality and consistency of data recording budgets and expenditures which has made trend analysis of allocations to priority sectors and priority areas difficult, but these are recognised and are being given attention. Government policy towards external finance is clearly stated in the Tanzanian Assistance Strategy, and the move towards general budget support by a number of key partners is continuing, with harmonisation of World Bank and bilateral support structures and processes. The annual budget support review process appears to be functioning well. In regard to GFATM target diseases, roles and strategies are being clarified, with the establishment and continued strengthening of TACAIDS as the body responsible for coordinating the multisectoral response to HIV/AIDS, and planned restructuring within MOH to better manage the health sector response under the recently approved Health Sector HIV/AIDS Strategy. The malaria proposal clearly fits within the existing strategy, facilitated by a well-supported technical programme at national level. Macroeconomic issues for follow-up • GDP performance Continued positive real GDP growth will be required to help balance additional planned inflows to the health and HIV/AIDS sectors if the latter are not to distort inter-sectoral allocations, particularly in terms of PRS priorities2. Despite positive achievements in terms of increasing public expenditure, the health sector remains under-funded in terms of achieving national coverage with priority interventions3, and a constant or increasing share of overall public expenditure in a climate of positive economic growth is one way in which the gap can be closed. • Domestic revenue performance as % GDP The Tanzanian government has indicated that improved domestic revenue performance is the chosen strategy for eventually reducing the share of the budget and the PRSP which are currently externally funded. The extent to which targets in this area are being met should be monitored. 2 although it should be borne in mind that there is little international evidence on what constitutes an “appropriate” inter-sectoral allocation at the national budget level. 3 It is not possible to state whether HIV/AIDS interventions are under-funded to the same extent as more analysis of the multitude of funding sources and their expected use is required.

GFATM Tracking Study: Macroeconomics and sectoral background Tanzania
Final draft viii
• Sectoral allocations as % of total government budget GFATM funding is intended to be additional to other sour ces of funding, and as such should alter the inter-sectoral allocation of budgetary resources. The total volume of resources available to government, together with its allocation between sectors should therefore be tracked. Monitoring this remains problematic in the Tanzanian context, not least as HIV/AIDS is defined as a priority sector in its own right, but with substantial overlap with the health sector, in terms of reporting on PRSP-related expenditure. The ongoing improvements in financial reporting in this area, and a planned analysis of flow of funds to HIV/AIDS should facilitate this task4. • General budget support as % of total revenues
o Loans versus grants o Budgeted versus actually disbursed
The proportion of government revenues coming from budget support is important in terms of enabling flexibility and sovereignty with respect to inter-sectoral allocations. The loan/grant breakdown affects future interest payments which can reduce discretionary expenditure, and the extent to which budgetary commitments are met will determine whether there is need to either alter actual expenditure from planned levels or to reduce foreign reserves to smooth flows. Sector issues for follow-up • Timing and level of GFATM inflows The disbursement of external funding through any source has been an issue in the past for Tanzania, whether due to problems on the part of the funder or the recipient. To the extent that GFATM funding has been programmed into the MTEF, release of such funding according to schedule and subsequent spending thereof, will impact upon stated programme objectives and sectoral targets. Where this is due to delays on the part of the Principal Recipient, it may reflect absorption constraints. • Reporting of GFATM budgets and expenditures included in MTEF In Tanzania GFATM funding is currently programmed for channelling through three separate MDAs, MOH for malaria, and TACAIDS and PORALG for HIV/AIDS. A detailed MTEF is available for the central level MOH only at this point. The contribution of GFATM funding to sectoral MTEFs is worth tracking both in terms of the size of contribution and in terms of the intra-sectoral allocation of resources. Although there is no routine mechanism for tracking project funding expenditures at present, this may be further developed during the course of the study, in which case comparison of GFATM funding as a proportion of budgeted and actual expenditure should be tracked. This should of course be possible through other sources of accounting data for GFATM funding, but the extent to which the funding is harmonised in emerging government and sector-wide systems is worth tracking per se. This should include any successful third round funding. Where possible, divergence between expenditure and budget should be explored to determine the extent to which it reflects genuine absorption capacity constraints rather than bureaucratic hurdles. 4 I believe GTZ are planning to fund such an activity, for reporting at the forthcoming “sectoral” HIV/AIDS review in February 2004.

GFATM Tracking Study: Macroeconomics and sectoral background Tanzania
Final draft ix
• Sectoral additionality Current financial reporting makes it relatively difficult to accurately determine the extent to which GFATM funding can be additional due to changing PRSP definitions of the health sector, and identification of HIV/AIDS as a “sector” in its own right. However, it should be possible to track, albeit imperfectly, spending on HIV/AIDS activities over the period of the GFATM funding, and to determine which are funded by GFATM as the activities are relatively easily identified, and thereby to assume some level of additionality where total spending in the health sector has risen more than projected in the past. However, it should be borne in mind that this definition of “additionality” is to a large extent artificial as the majority of funds are fungible, and other sources may still have reduced in response to GFATM inflows, hence the need to monitor the overall government resource envelope as indicated above. • Absorption capacity Concerns have been raised regarding the capacity of the health/HIV/AIDS sector to effectively absorb the new, large inflows of which the GFATM funding is one. The recently completed HIV/AIDS PER update for FY04 indicates that there have been some improvements in TACAIDS ability to use available resources. However, the large increases in multiple sources of funding for HIV/AIDS are likely to present a continued challenge in absorption, with limited human resources and existing co-ordination problems, for example with the recently approved GFATM proposal and planned inflows under the Clinton Foundation Care and Treatment Plan. There are indications already that the performance-related disbursements of funds under the World Bank TMAP are behind schedule for this reason. • Impact on private sector activity As the malaria funding is largely to be channelled to subsidies to enable uptake of bednets provided through private sector activity, it would be useful if possible to monitor the extent of any such increase in private sector activity. This is likely to be beyond the remit and capacity of the tracking study as a primary data collection exercise but is being undertaken separately by the Malaria Control Programme (with LSHTM input), and any available information should therefore be solicited. • Convergence between stated priorities and GFATM activities The comment has been made that the HIV-related GFATM proposals have been developed in parallel to existing strategies and ongoing activities, at least in part due to time constraints, ie the need to submit the proposal at a time when the Health Sector HIV/AIDS Strategy was not finalised. Although the malaria proposal is consistent with existing strategies, it has not been possible to check consistency of the other proposals due to non-availability of the TB medium-term plan or the HSHS. This remains to be done during Phase 2 of the study. In addition, both HIV-related proposals to date refer to expanding certain activities to a number of districts, without there being any clearly identified strategy for taking those activities to national scale. Further information on such strategies would be welcome. • Extent to which GFATM funding contributes to systems strengthening It has not been possible to analyse the extent to which the GFATM proposals approved to date contribute to general systems strengthening, or to which they have freed up more
GFATM Tracking Study: Macroeconomics and sectoral background Tanzania
Final draft x
flexible budgetary funds to address such issues. Based on the (incomplete5) proposals viewed, it would appear that they are largely targeted at vertical programme activities. One problem here is the lack of useful costing in the sector permitting estimates of sectoral investments necessary to achieve targets in terms of the Essential Health Package more generally. • Budgetary versus project funding in the sector The extent to which funding to a given sector is funded through general budgetary resources including external budget support, rather than through earmarked project funds, will influence the degree of flexibility which government has in allocating funds between priority uses within that sector. For example, if GFATM or other project funds pick up direct costs of specific interventions, budgetary funding can be deployed towards broader system strengthening activities. The balance between recurrent and development (largely foreign project funding) in the health sector is currently expected to change substantially in FY05, but it is not clear to what extent this might reflect project funding for HIV/AIDS. • Proportion of GFATM funding at central versus local government level With the ongoing decentralisation and continued capacity strengthening of local government authorities who are mandated to deliver essential services including those addressing GFATM target diseases, it will be interesting to track the extent to which funding is channelled directly, or in terms of drugs/supplies to the council level over the courswe of the study.
5 ie missing a number of key annex documents

GFATM Tracking Study: Macroeconomics and sectoral background Tanzania
Final draft 1
1 Introduction
1.1 Background to the study This paper forms part of a series of four country background papers undertaken as a desk study in order to support an 18-month Tracking Study which aims to report recipients’ (governments and other country stakeholders) perspectives on the operationalisation of the Global Fund for AIDS, Tuberculosis and Malaria (GFATM) at the country level; and to make recommendations that will contribute to successful future GFATM implementation. The study is jointly funded by the UK Department for International Development (DFID), the Danish Agency for Development Assistance (DANIDA), Development Cooperation Ireland (DCI), and the Netherlands Directorate-General for International Cooperation (DGIS). The study is being undertaken by the Health Policy Unit of the London School of Hygiene and Tropical Medicine (LSHTM). The objectives of the tracking study are as follows:
1. to synthesise government and other country stakeholders’ perspectives on CCP (proposal) preparation, functioning of Country Coordinating Mechanisms and implementation processes at the country level;
2. to identify lessons learned and make recommendations on the coordination of the Global Fund and other global health initiatives with existing country-level processes (Sector-Wide Approaches and Poverty Reduction Strategy Papers).
The study will be undertaken through a combination of methods, notably document review, in-country fieldwork, and separately commissioned desk studies on specific areas.
1.2 The country macroeconomic and sectoral financing desk study The purpose of this background paper is to provide an overview of the macroeconomic and sectoral financing context for the second phase of the more detailed fieldwork, to review the planned inflows through GFATM in relation to aid levels and their potential macroeconomic impact, if any, and to propose areas related to economics and financing which might be tracked during Phase 2 of the main study. Terms of reference are attached at Annex A. The need for a separate background paper on these issues has arisen in response to growing debate regarding potential trade-offs between the substantial and acknowledged increase in investment in priority sectors such as health if the Millennium Development Goals and others are to be achieved, and the need for sound policies for macroeconomic stability and growth as a basis for long-term development. This debate has been most strongly articulated in Uganda to date, but is of increasing concern more generally among low income countries. In addition, there is some political concern within countries regarding the wisdom of an increasing share of the government budget and Gross Domestic Product (GDP) coming from external resources, both in terms of predictability of revenue flows but also regarding national sovereignty with respect to the policy-making process. In late 2002, DFID issued a policy paper summarising the macroeconomic effects of aid6. This was based in part on a paper commissioned on aid and monetary policy in Uganda in order to help clarify the position in which Uganda finds itself, ie of needing to trade off the availability and potentially productive use of additional external assistance to the country, with the adverse macroeconomic effects which such an inflow could produce7. These 6 DFID (2002). The macroeconomic effects of aid. Policy paper. London: December 2002 7 Adam C, Uganda: Exchange rate management, monetary policy, and aid. Paper prepared for the Bank of Uganda with DFID support. Revised version. Oxford: September 2001

GFATM Tracking Study: Macroeconomics and sectoral background Tanzania
Final draft 2
primarily involve an appreciation of the exchange rate, resulting in a fall in the demand for exports and increase in imports. Other things being equal, this results in a contraction of the tradable sector of the economy in which it is generally assumed that there is greater long-term scope for productivity gains, and hence a lower long term average growth rate for the economy as a whole. This phenomenon is generally known as “Dutch disease”, after the macroeconomic effects seen following the discovery of natural gas of the Dutch coast. There is a question mark, however, over this general assumption, with an alternative view suggesting that long term productivity can be enhanced by increased investment in the social sectors. Two key assumptions are necessary for the long term benefits of such investment to be delivered: • that the increase in public spending on education and health should result in improved
health and education outcomes; • that these improved health and education outcomes should result in increased
productivity. The evidence from the WHO Commission on Macroeconomics and Health (CMH) supports this position, arguing that use of increased aid inflows to purchase non-tradable goods such as health care and education can and should translate into a healthier and more productive workforce, thereby mitigating, at least in part, the effect of such a contraction of the tradable sector of the economy. For example, the impact of girls’ education on future infant mortality rates (IMR) is well known, and lower IMR translates in term to higher life expectancy and a longer productive life. Higher contraceptive prevalence rates result in smaller, healthier families. Nutritional interventions enhance learning capacity and thus productive potential in later life. In addition, a substantial proportion of aid flows to the health sector is used to purchase imported inputs (eg pharmaceuticals, vehicles) and is therefore exchange rate neutral. GFATM funded interventions could be expected to contribute to such productivity increases through extending life and reducing morbidity. Unfortunately, the two impacts have different timeframes, with improved health outcomes being a longer term effect, while real exchange rate appreciation has an immediate effect. It is therefore generally recommended that some aid be focussed on measures aimed at improving private sector competitiveness through addressing supply side constraints. In addition, intervention in the financial markets is likely to be necessary in order to prevent domestic inflation due to sudden and excessive increases in the money supply. Such intervention might involve “sterilisation” of excess money through selling Government stocks, which in turn results in increased debt and higher interest rates, again crowding out the private sector. Success in this area therefore depends on the strength of individual country fiscal and monetary policy. One key indicator of sound macroeconomic policy relates to the size of the fiscal deficit in relation to national income, or GDP, ie the gap between public expenditure and revenues. A distinction is sometimes made between the government deficit which excludes external grant funding, and the overall deficit which includes such grants. This document generally refers to the overall deficit. Any such gap between government incomes and expenditure clearly needs to be financed, with options including the printing of money, issuing of domestic debt, or borrowing from abroad. There is general acceptance that reducing the fiscal deficit of a country is in itself a good thing, not least as it results in an increased proportion of the overall government resource envelope potentially available for priority poverty-reducing expenditures. Debt service, whether domestic or international, generally has first claim on public resources, and can often lead to a substantial reduction in the pool of funds for “discretionary expenditures”. There is generally less consensus regarding the relative, immediate priority to do so in low
GFATM Tracking Study: Macroeconomics and sectoral background Tanzania
Final draft 3
income country governments with both a heavy burden of disease and substantial economic loss arising from HIV/AIDS, tuberculosis and malaria among other conditions. The potentially large and supposedly additional inflows of funding through GFATM to low income countries has resulting in increased interest both in the broad macroeconomic debate outlined above, but also with respect to the relative advantages or disadvantages, and the potential impacts, within the health sector of different aid mechanisms. In a climate of increased moves towards either general or sectoral budget support, often through a health Sector-Wide Approach (SWAp) to the planning and financing of an agreed sectoral plan and more-or-less integrated package of health services at the operational level, GFATM funding threatens to re-introduce parallel systems and a vertical approach, with subsequent reversals in the efficiency of external support. These background papers therefore aim to explore these issues in the four study countries.
1.3 Structure of the document The paper is structured as follows. Section 2 provides a snapshot of the current macroeconomic situation, describing the structure of the economy, recent economic developments, and the Poverty Reduction Strategy which currently governs inter-sectoral allocation decisions. It goes on to outline agreed arrangements for managing external assistance in Tanzania, focusing particularly on recent moves towards general budget support. Section 3 describes the government budgetary framework, covering the planning and budgeting cycle, the Medium Term Economic Framework, and the current financial management arrangements. Section 4 goes into more detail on health sector planning and financing, and the relationship with GFATM target disease-related activities. This draws heavily on recent Public Expenditure Reviews covering both the health sector and intersectoral HIV/AIDS activities. Overall trends in sector financing are reviewed, and the changing nature of external support is examined. Specific details of financing for activities relating to HIV/AIDS, tuberculosis and malaria are presented. Section 5 pulls out issues specifically related to the GFATM proposals in the country. Tanzania has been less successful to date than the other study countries in obtaining funds through its GFATM applications, but there are still interesting issues around integration into developing planning, budgeting and management systems, and the nature of sectoral financing. In addition, a large revised proposal combining HIV and TB has recently been submitted in the third round. Section 6 summarises some key issues, and highlights specific areas for the second phase of the tracking study to follow-up.
2 The macroeconomic context
2.1 Overview and past performance
2.1.1 Structure of the economy The Tanzanian economy, though still heavily dependent on agriculture which accounts for almost half of GDP, has shown slight signs of diversification over the past 5 years, with a

GFATM Tracking Study: Macroeconomics and sectoral background Tanzania
Final draft 4
small increase in the mining, construction, wholesale and retail sectors as shown in Table 1 below.
Table 1 GDP by sector, 1998 – 2002 (TSh m and %) TSh m (constant 1992 prices) 1998 1999 2000 2001 2002
TSh m % TSh m % TSh m % TSh m % TSh m %Agriculture 739,942 49.1% 770,509 48.9% 796,513 48.1% 840,275 48.0% 882,090 47.5%Mining 30,700 2.0% 33,488 2.1% 38,144 2.3% 43,293 2.5% 49,787 2.7%Manufacturing 126,887 8.4% 131,491 8.3% 137,809 8.3% 144,647 8.3% 156,219 8.4%Electricity and water 25,870 1.7% 26,874 1.7% 28,454 1.7% 29,297 1.7% 30,204 1.6%Construction 65,187 4.3% 70,866 4.5% 76,818 4.6% 83,494 4.8% 92,678 5.0%Wholesale and retail trade 239,830 15.9% 254,114 16.1% 270,567 16.4% 288,718 16.5% 308,928 16.6%Transport and communications 79,755 5.3% 84,403 5.4% 89,515 5.4% 95,154 5.4% 101,244 5.5%Finance, insurance etc 158,089 10.5% 164,568 10.4% 172,291 10.4% 177,911 10.2% 186,485 10.0%Public administration 118,114 7.8% 122,207 7.7% 126,567 7.7% 130,987 7.5% 136,307 7.3%Imputed bank services -78,548 -5.2% -81,229 -5.1% -82,359 -5.0% -84,418 -4.8% -86,781 -4.7%Total GDP at factor cost 1,505,826 1,577,291 1,654,319 1,749,358 1,857,158 Source: adapted from PO-PP (2003), Table 2a, p3 Note: total for 2002 has slight rounding error The agricultural sector is estimated to provide up to 80% of total employment. Roughly 44% of the sector’s contribution to GDP is in non-monetary terms, and in 2001 agriculture contributed about 55% of the country’s foreign exchange earnings. Seen as a key pro-poor sector because of its impact on livelihoods, budgetary allocations have increased in recent years, and tax policy reforms have seen the abolition of taxes on agricultural inputs, the removal of stamp duty on farm produce sales, and other measures. Particular growth areas in 2001 were crop production and fishing. There has been improved performance in the export sector since 1999. The structure of merchandize exports has moved away from agricultural products, in part due to the continued decline in world commodity prices, and towards minerals, horticultural products, fish, and manufactured goods. Transport and tourism have generally contributed an increased share of service exports, although suffering a slight decline after 11 September 20018.
2.1.2 Recent economic performance Tanzania’s economic performance over the last few years is generally accepted as having been strong, with key indicators moving in the desired direction as shown in Table 2 below. Real GDP growth increased by 6.2% in 2002, a slight increase on 2001 despite a fall in the terms of trade, and per capita real GDP growth has been consistently positive over the past five years, rising by 3.4% in 2002. During 2002, overall growth was led by relatively strong performance in agriculture (5.0%), mining (15.0%), wholesale and retail trade including tourism (7.0%), and manufacturing (8.0%, up from 5.0% in 2001)9.
8 GOT, PRSP Draft Progress Report 2001/02, Dar es Salaam: November 2002 9 PO-PP (2003), p3

GFATM Tracking Study: Macroeconomics and sectoral background Tanzania
Final draft 5
Table 2 Trends in selected macroeconomic indicators10
1998 1999 2000 2001 2002Real GDP growth (%) 4.0 4.7 4.9 5.7 6.2Inflation - annual average (%) 12.9 7.8 6.0 5.2 4.5Exchange rate (US$1: TSh) 664.7 744.8 808.4 876.4 978.9Overall BoP (US$ m) -461.9 -111.8 57.7 -14.9 132.4Current account balance (US$ m) -912.4 -858.5 -529.2 -559.5 -448.9Foreign reserves (months of imports) 3.0 4.1 5.6 6.3 8.9
FY98 FY99 FY00 FY01 FY02*Growth in GDP at factor cost (%) 3.7 4.4 4.8 5.3 6.0Govt domestic revenue (% GDP) 12.6 12.5 11.3 12.2 12.2Total Govt expenditure (% GDP) 14.8 14.8 17.1 16.8 18.8Fiscal balance, before grants (% GDPmp) -2.3 -2.3 -5.8 -4.6 -6.6 Source: PO-PP (2003), Tables 1 and 2b Note: GDP mp - Gross Domestic Product at market prices This positive performance is credited to sustained policy action on stabilisation and adjustment, such as a prudent monetary and fiscal stance, increased food production, parastatal reform, and the fostering of an enabling environment for private sector development. Together, these have enabled the economy to withstand external shocks, and have provided a solid basis for future growth. There has been substantial progress since the mid-1990s in restoring macroeconomic stability in Tanzania, with inflation reduced from 27.1% in 1995 to 4.2% by the end of March 2003. This is attributed to an improvement in the food supply situation in the country, together with adherence to conservative fiscal policies, supported by a relatively cautious monetary policy. Recent increases in petroleum prices may reverse this downward trend in the near future. Fiscal performance The most recent assessment of fiscal performance was undertaken in February 2003 as part of the broader Public Expenditure Review (PER) process, and concludes that “(o)verall fiscal performance remained solid in FY02 and FY03”11. Fiscal policy in FY02 was described as “tight”, ie restricting expenditures to expected revenues as far as possible rather than running a deficit to expand the resource envelope. Accordingly, a fiscal deficit of 1.5% of GDP was recorded against a projected 2.5%. The FY03 budget framework provides for a more relaxed policy and a substantial (110%) increase in development expenditure over the previous year. Revenue performance was strong, following high petroleum prices, tax administration reforms and other revenue-enhancing measures, marginally exceeding the government revenue target for the financial year FY02. However, performance is static in terms of % GDP at 12%, and the evaluation concludes that significant increases in revenues are necessary both to provide the resources for Poverty Reduction Strategy Paper (PRSP) implementation, and to reduce the risks inherent in volatile aid flows. There is concern that existing exemptions need revision, and the poverty impact of tax policy measures be explored.
10 The terminology FYXX is used throughout this document to refer to the financial year ending 30th June 19XX or 20XX. Where a calendar year is given (eg 2002), it refers to the period of that calendar year. 11 PER Working Group (2003). External evaluation: Review of fiscal developments and budget management issues FY02 – FY03. Paper presented to the Public Expenditure Review FY03 Consultative Meeting. Karimjee hall, Dar es Salaam. 13 May 2003. (p 2)

GFATM Tracking Study: Macroeconomics and sectoral background Tanzania
Final draft 6
Implementation of a cash budget in recent years, together with persistent shortfalls in the release of external grants, has created an environment whereby expenditures are typically restricted during the first part of the financial year. In the first half of FY03, this practice, despite good revenue performance, led to a large fiscal surplus (2.5% of GDP), with implications for activities in all sectors, and also for the planning and Medium Term Expenditure Framework (MTEF) processes which are undermined by lower disbursements than planned. Recent recommendations from both the PER team and the Poverty Reduction Budget Support review team include front-loading budget support to facilitate first quarter release in full. In FY02, government expenditures increased to 18.1% of GDP, much of which was Other Charges. Personal Emoluments have been held relatively constant in recent years, although overtime, allowances and per diems etc have risen. The FY03 PER external evaluation team recommends that more consideration be given to the implementation of a medium term wage policy as a means of increasing real salaries and thus strengthening the basis for improved public sector performance.
2.2 The current economic programme Macroeconomic policy targets for the current MTEF period, FY03 – FY05 are intended to both maintain the domestic and external stability required to further stimulate economic growth, and to facilitate the implementation of the Poverty Reduction Strategy (PRS). Policy targets for the coming three year period include: an increase in real economic growth to 7.0% by 2005; further reduction in inflation to 4.0% by June 2004; slight growth in domestic revenue collection from 12.2% of GDP at market prices in FY03 to 12.4% in FY05; and expansion in the money supply consistent with inflation and GDP growth targets12. Revenue policy over the medium term focuses on expanding the revenue base, curbing tax evasion, improving tax administration and controlling exemptions. Efforts will be made to encourage small businesses to move from the informal to the formal sector, and to improve on fiscal reporting generally. Public expenditure policy aims to maintain macroeconomic stability, achieve the stated poverty reduction targets, and to enhance economic growth. Implementation of the public sector pay reform programme will continue, but is seen as a residual, to be allocated “as much resources as the resource envelope permits” (URT 2002d). Public expenditure management will continue to be strengthened, though harmonising budgetary codes for recurrent and development expenditures, and for central and local government spending, and across different reporting formats, and through strengthening of the Integrated Financial Management System (IFMS).
2.3 Poverty, and the PRSP
2.3.1 Poverty in Tanzania: an overview Poverty in Tanzania is acknowledged to be both deep and pervasive, although a lack of consistent definitions and officially recognised poverty lines has hampered cross-temporal comparisons. The Tanzanian PRSP refers both to income poverty, related to the ability to meet certain basic needs, and to non-income poverty, which covers education, survival, 12 URT (2002d). Guidelines for the preparation of medium term plan and budget framework for 2003/04 – 2005/06. Draft. Issued by the President’s Office – Planning and Privatisation and Ministry of Finance. Dar es Salaam: December 2002

GFATM Tracking Study: Macroeconomics and sectoral background Tanzania
Final draft 7
nutritional status, access to clean and safe drinking water, social well-being, and vulnerability13. The most recent estimates of income poverty come from the 2000/01 Tanzania Household Budget Survey (HBS), and are reported in the Poverty and Human Development Report (PHDR) (URT 2002e). Two income poverty definitions were measured through this nationally representative survey: the basic needs poverty line and the food poverty line. The former is “an absolute line defining poverty in terms of the exogenous measurement of basic non-food needs expenditure required to provide a defined level of living”, while the latter defines a similar measure in terms of food requirements. Both are measured in Tanzania shillings according to internationally agreed methodologies. Headcount ratios, showing the percentage of the population falling beneath each poverty line, were calculated for different geographical areas. Key findings of a comparison between the HBS of 1991/92 and 2000/01 include the following: • There has been no significant reduction in income poverty for the majority of the
population; • Income poverty has declined significantly only in urban areas; • Although the proportion of people living below both poverty lines has fallen, the absolute
number has increased; • Poverty varies substantially across geographical areas, with urban areas generally better
off than rural areas, although urban poverty remains widespread. Table 3 shows urban-rural comparisons over time for the two measures of poverty, showing that almost one fifth of Tanzanians still fall below the food poverty line, while over a third remain poor in terms of basic needs. The population of Dar es Salaam has seen the greatest improvement in the proportion suffering both food and basic needs poverty. Table 3 Poverty headcount ratios, 1992/92 and 2000/01
Food Basic needs1991/92 2000/01 1991/92 2000/01
Dar es Salaam 13.6% 7.5% 28.1% 17.6%Other urban 15.0% 13.2% 28.7% 25.8%Rural 23.1% 20.4% 40.8% 38.7%Total 21.6% 18.7% 38.6% 35.7% Source: URT 2002e, p10 Non-income aspects of poverty are covered in depth in the PHDR, and a summary of the main findings is given in relation to each aspect in Table 4 below. Table 4 Progress in areas of non-income poverty
Area Current situation and recent progress Policy implications Employment • Agriculture remains the main source of livelihood
for majority of the population (81% of total employment) according to the Integrated Labour Force Survey of 2000/01
• Economic reform in 1990s has led to reduced employment in government and parastatal sectors, but a slight increase in formal private sector employment (to 5% of total)
“A major challenge for the PRS is to enlarge the range of viable economic opportunities for the poor in rural as well as urban areas.” (PHDR, p21)
13 URT (2000b), pp6-10

GFATM Tracking Study: Macroeconomics and sectoral background Tanzania
Final draft 8
Area Current situation and recent progress Policy implications • Unemployment rates are highest in Dar es Salaam,
and among youth Education • Impressive rise in primary enrolment rates since
abolition of fees in 2000 • However, proportion of children from very poor
households who go to school has fallen from 54% to 50%
• Large group of children who are ‘over-age’ and thus ineligible for schooling in current system
• Gender inequities remain, although parity has most been achieved at the primary level
• Significant efforts required to reduce adult illiteracy, particularly in rural areas, and for women
“Increased levels of primary school enrolment put a tremendous strain on the education facilities, and unless sufficient investment in made to ensure the quality of primary education is maintained and enhanced, pupils and parents might be disappointed with the education process, resulting in a loss of the gains made so far.” (PHDR, p30)
Survival • Little progress in reduction of IMR and U5MR during 1990s, and possible increase due to HIV/AIDS
• IMR/U5MR significantly higher for boys, and in rural areas
• Large disparities in immunisation uptake, urban-rural, between districts, and by poverty status
• HIV/AIDS prevalence rates show a worrying upwards trend
• Decline in % deliveries attended by trained health provider from 44% in 1991/92 to 36% in 1999,with large urban-rural disparities, and by education level of the mother
“..it is hard to see how the targets can be reached unless major breakthroughs are made in containing the spread of HIV/AIDS, containing malaria and other infectious diseases and drastically reducing income poverty.” (PHDR, p42) “More emphasis is needed on HIV/AIDS in the PRS, in particular to show how the pandemic threatens the achievement of all the targets set out in the strategy.” (PHDR, p43)
Nutrition • Little progress in reduction of under-nutrition rates for children over 1990s
• Disparities between urban and rural, and richer and poorer households, eg children in poorest quintile are 4 times more likely to be severely underweight than those in richest quintile
Action required to reduce income poverty, control disease, support changes in feeding practices, and boost community capacity to monitor nutritional status and take corrective measures.
Water • Increased use of improved drinking water sources in rural areas over 1990s, but fall in Dar es Salaam
• Almost half of households still use unsafe drinking water sources
• Large disparities still exist between rural and urban areas, and by expenditure quintile
PRS focus on rural areas is correct, but more targeted approach is required to the expansion of safe water.
2.3.2 Poverty reduction policies and strategies Tanzania adopted a National Poverty Eradication Strategy in late 1997, following the publication of Vision 2025. It has subsequently been somewhat overshadowed by the development of the PRSP, a requirement of the process of qualification for debt relief under the Highly Indebted Poor Countries (HIPC) initiative. The Tanzanian PRSP was finalised in October 2000. The process of its development was been guided by three considerations. • Firstly, the PRSP is seen “as an instrument for channelling national efforts toward broadly
agreed objectives and specific inputs and outputs” (PRSP p13);
GFATM Tracking Study: Macroeconomics and sectoral background Tanzania
Final draft 9
• Secondly, in recognition of the fact that much relevant work was already taking place in the country, the PRSP is viewed as “an integral part of ongoing macroeconomic and structural reforms that are being supported by Tanzania’s multilateral and bilateral partners” (PRSP p14);
• Thirdly, in terms of its focus, the PRSP “concentrates on efforts aimed at (i) reducing income poverty; (ii) improving human capabilities, survival and social well-being; and (iii) containing extreme vulnerability among the poor” (PRSP p14).
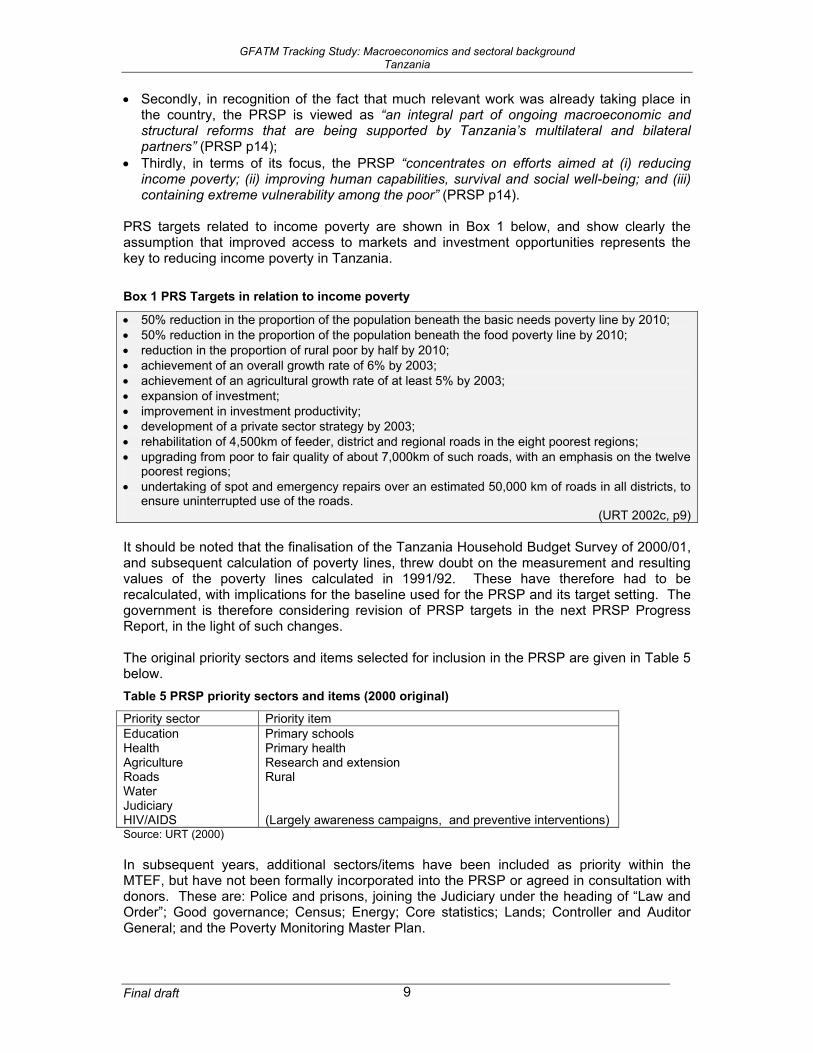
PRS targets related to income poverty are shown in Box 1 below, and show clearly the assumption that improved access to markets and investment opportunities represents the key to reducing income poverty in Tanzania. Box 1 PRS Targets in relation to income poverty
• 50% reduction in the proportion of the population beneath the basic needs poverty line by 2010; • 50% reduction in the proportion of the population beneath the food poverty line by 2010; • reduction in the proportion of rural poor by half by 2010; • achievement of an overall growth rate of 6% by 2003; • achievement of an agricultural growth rate of at least 5% by 2003; • expansion of investment; • improvement in investment productivity; • development of a private sector strategy by 2003; • rehabilitation of 4,500km of feeder, district and regional roads in the eight poorest regions; • upgrading from poor to fair quality of about 7,000km of such roads, with an emphasis on the twelve
poorest regions; • undertaking of spot and emergency repairs over an estimated 50,000 km of roads in all districts, to
ensure uninterrupted use of the roads. (URT 2002c, p9)
It should be noted that the finalisation of the Tanzania Household Budget Survey of 2000/01, and subsequent calculation of poverty lines, threw doubt on the measurement and resulting values of the poverty lines calculated in 1991/92. These have therefore had to be recalculated, with implications for the baseline used for the PRSP and its target setting. The government is therefore considering revision of PRSP targets in the next PRSP Progress Report, in the light of such changes. The original priority sectors and items selected for inclusion in the PRSP are given in Table 5 below. Table 5 PRSP priority sectors and items (2000 original)
Priority sector Priority item Education Health Agriculture Roads Water Judiciary HIV/AIDS
Primary schools Primary health Research and extension Rural (Largely awareness campaigns, and preventive interventions)
Source: URT (2000) In subsequent years, additional sectors/items have been included as priority within the MTEF, but have not been formally incorporated into the PRSP or agreed in consultation with donors. These are: Police and prisons, joining the Judiciary under the heading of “Law and Order”; Good governance; Census; Energy; Core statistics; Lands; Controller and Auditor General; and the Poverty Monitoring Master Plan.

GFATM Tracking Study: Macroeconomics and sectoral background Tanzania
Final draft 10
A recent analysis of government allocations to PRSP priority sectors and areas14 concluded that: • GOT had implemented the FY02 budget in line with commitments to protect allocations to
PRSP priority sectors, despite external budget support falling significantly below budget estimates; but that
• Allocations to PRSP priority sectors and items in the approved budget estimates for FY03 were substantially below PRSP projections for recurrent expenditure.
The latter is probably due both to rushed and potentially incomplete costings on which the original projections were based, and Government rethinking of PRSP coverage.
2.3.3 The PRSP, Health and HIV/AIDS As noted above, the October 2000 PRSP identifies Health as a priority sector, and within Health, Primary Health as a priority item. HIV/AIDS is also identified as a priority sector, but falling within Health (although the figures shown in the original PRSP document indicate funding for HIV/AIDS separately). Health The health sector is expected to play a key role in improving survival and nutritional status, and thus the reduction of non-income poverty in Tanzania and, through intended reductions in mortality, to help reduce vulnerability among the population. The national goal within the PRSP is first to halt the decline in life expectancy (largely due to HIV/AIDS), and subsequently to raise it through strategies designed to reduce morbidity, strengthen nutrition, and improve access to clean and safe water supplies. Health was ranked third in terms of areas deserving priority attention within the PRSP by participants at Zonal workshops, after education and agriculture. Concerns related to weak service provision, particularly in rural areas, the low level of health education, and limited involvement of the poor in the design of health plans and programmes. Specific targets for health-related survival were identified in the original PRSP and are shown in Box 2. Targets related to HIV/AIDs are given in the subsequent sub-section. Box 2 PRS survival targets related to health
• To lower the infant mortality rate from 99 to 85 per 1000 live births by 2003, and to 50 by 2010; • To reduce under-five mortality from 158 to 127 per 1000 live births, and by 50% over the period to
2010; • To reduce maternal mortality from 529 to 450 per 100,000 live births, and by 50% over the period
to 2010; • To increase the percentage of children under 2 years immunised against measles and DPT from
71% to 85% by 2003; • To reduce malaria-related case fatality for under-fives from 12.89% to 10%, and to 8% by 2010; • To increase coverage of births by trained personnel from 50% to 80%; and • To restore life expectancy to 52 years by 2010.15. To achieve these ambitious targets, the following strategies were identified: improvements in childhood immunisation, availability of drugs and medical supplies, greater coverage of deliveries by trained staff, and an increase in the proportion of districts with active HIV/AIDS awareness campaigns. Initiatives specified for costing include: provision of the essential
14 F Ronsholt (2002). Analysis of government expenditure allocations to priorities of the Poverty Reduction Strategy in Tanzania 2002. Prepared for the Government of the United Republic of Tanzania, Ministry of Finance, and the European Commission. 17th September 2002. 15 URT 2000b, pp 19-20, and PHDR p33.

GFATM Tracking Study: Macroeconomics and sectoral background Tanzania
Final draft 11
health package; strengthening and reorientation of referral hospital services; promotion of private sector and civil society activities; strengthening the Integrated Management of Childhood Illness. The draft Progress Report for FY02 gives no updated figures related to the ambitious targets for IMR, U5MR or maternal mortality rate, or for life expectancy, although it is expected that these will become available through additional analysis of the 2002 Census data. However, progress was reported in terms of councils with HIV/AIDS awareness campaigns, a substantial in increase in assisted deliveries from 50% to 80%16, increased coverage of DPT and measles immunisation from 75% to 79%, mainstreaming of the PRS within the new draft Health Policy, synchronisation of health sector and local government reforms, production of the Malaria Medium Term Strategic Plan, and the introduction of a new first line drug policy for malaria. The sectoral progress report continues to refer to the World Bank figure of $12 per capita for the implementation of essential health packages, despite the substantially higher figure now available from the CMH. However, this is most likely due to the fact that no updated costing of health sector priority activities has yet taken place within the context of the PRSP, the most recent costing having been undertaken in 1997, again using the World Development Report of 1993 as the basis17. Tentative figures, taken from the draft Health Sector PER update for FY03 indicate the extent of the potential underestimation of resource requirements, as shown in Table 6 below. Table 6 Rough per capita estimates of requirements for priority disease areas, FY03
Scenario TSh bn US$ pc US$TB+Leprosy 4,576,409,370 4,337,829 0.13
high cost 17,621,902,375 16,703,225 0.48 low cost 8,058,952,057 7,638,817 0.22
Malaria 13,697,803,500 12,983,700 0.38 high cost 20,830,447,500 19,744,500 0.57 low cost 20,830,447,500 19,744,500 0.57
Total high cost 56,726,562,745 53,769,254 1.56 low cost 47,163,612,427 44,704,846 1.29
HIV/AIDS
EPI
Source: MOH (2003a) The priority item “Primary Health” is defined in terms of specific budget lines, although there is some confusion between documents as to whether these comprise both Personal Emoluments and Other Charges, or just the latter. The budget lines specified as Primary Health in the original PRSP are: • Subventions to local authorities – Other charges • Local authorities drugs allocations (kits – budgeted under MOH headquarters) • MOH Preventive Services sub-vote – Other charges • Regions Preventive Services sub-vote – Other charges. The initial targets outlined in the PRSP for health sector recurrent spending (ie Personnel Emoluments and Other Charges) are given in Figure 1 below. These show a consistently
16 Although this seems very optimistic given the data from the Household Budget Survey reported on p8. 17 E Pavignani, Recurrent costs in the Tanzanian health sector 1998-2009: An exploratory analysis. November 1998

GFATM Tracking Study: Macroeconomics and sectoral background Tanzania
Final draft 12
rising share of Discretionary Recurrent Expenditure (DRE)18 both for health as a sector, and for primary health within that. The convention of including external financing within the development budget means that this graph reflects planned government spending only. Figure 1 PRSP projections of health spending as % of DRE, FY00 – FY03
8.1%8.4%
10.1%
11.2%
4.3%
5.4%
6.0%
7.2%
0.0%
2.0%
4.0%
6.0%
8.0%
10.0%
12.0%
FY00 FY01 FY02 FY03
HealthPrimary Health
Source: URT 2000b, p25 (based on figures in Text Table 2) Unfortunately, it is virtually impossible to provide updated actual figures as there is little consistency in the way that expenditures are reported, and there is a lack of clarity regarding the actual definition of priority sectors and items. Efforts have been made by development partners during the course of FY03 to solicit more consistent information from the Government of Tanzania, but at the time of writing, no such data was available. An estimate of total recurrent health spending as a percentage of adjusted DRE was presented in the draft FY03 health sector PER update, and is reproduced below. The adjustment was made in order to reflect the recurrent component of the donor basket funding to central and local government health spending, as traditionally this would be reported through the development budget and therefore understate actual recurrent spending. This problem still exists with other development spending as much covers inputs traditionally considered as “recurrent”, such as drugs and medical supplies, allowances etc.
18 Discretionary Recurrent Expenditure is defined in the PRSP as total recurrent expenditure minus “contractual” obligations such as debt service and pension contributions (URT 2000b, p25). However, there are differences in the definitions given in subsequent progress reports, and it is difficult to provide a comparison.

GFATM Tracking Study: Macroeconomics and sectoral background Tanzania
Final draft 13
Figure 2 Budgeted and actual recurrent health spending as % of adjusted DRE, FY99 – FY03
0.0%
2.0%
4.0%
6.0%
8.0%
10.0%
12.0%
14.0%
BudgetActual
Budget 12.0% 11.1% 11.5% 10.8% 12.5%Actual 11.1% 8.4% 9.9% 9.8%
FY99 FY00 FY01 FY02 FY03
Source: Figure 2 in MOH 2003a, p5. Although not directly comparable with the projections in Figure 1, this shows that although the budget figures have been around 11% or above, expenditure has consistently fallen short, at less than 10% since FY00. HIV/AIDS HIV/AIDS is mentioned throughout the PRSP as a major constraint on the survival element of non-income poverty, through its impact on early mortality, high morbidity, and resulting low life expectancy of the population. At the time of publication, AIDS was identified as the leading killer in the age group 15-59 years in sampled districts of Dar es Salaam, Hai and Morogoro Rural, accounting for 35.5% and 44.5% of male and female deaths in that age group respectively in Dar es Salaam. Malaria and tuberculosis were the next major causes of death. In addition, the growing number of AIDS orphans and patients raises the vulnerability of the population, and thus the need for social safety nets given the limits to traditional support structures in the context of the pandemic. This was raised as an issue of particular concern during the participatory Zonal workshops for the development of the PRSP. PRSP targets related to HIV/AIDS are given in Box 3 below. Box 3 PRSP survival targets related to HIV/AIDS
• Contain sero-positive prevalence rate in pregnant women from 5.5-23% (1996) to 6-27% in 2010; • 75% of districts covered by an active AIDS awareness campaign.
(URT 2002c, p33) The draft PRS Progress Report for 2001/02 (URT 2002c) highlights achievements in the following areas related to HIV/AIDS: • Inclusion of the “sector” in the PER/MTEF process; • The passing of the Act of Parliament to formally establish the Tanzania Commission on
AIDS (TACAIDS) on 31 October 2001, and subsequent operationalisation of the Act on 21st January 2002. This confers legal powers on TACAIDS to coordinate the multi-sectoral response to the pandemic;

GFATM Tracking Study: Macroeconomics and sectoral background Tanzania
Final draft 14
• Inclusion of HIV/AIDS as a top agenda item in aid coordination meetings, with a special sub-group of the Development Assistance Committee being formed;
• Holding of advocacy and sensitisation workshops for religious leaders and the civil-military alliance, and the development of workplace interventions;
• Continued surveillance by National AIDS Control Programme (NACP); • Mainstreaming of HIV/AIDS activities in all sector budgets19; Actions in FY03 are planned to include the recruitment of TACAIDS Secretariat staff, and finalisation of the national multi-sectoral strategic framework for HIV/AIDS, and a costing of the health sector component of which was undertaken in November 2002 and February 2003. In addition, TACAIDS will continue to formulate policy, and to undertake strategic planning, advocacy, regular monitoring and evaluation, and public dissemination of information on HV/AIDS. It is expected that institutional capacity will be substantially strengthened through the establishment of the TACAIDS Secretariat, and therefore enable improved utilisation of funding for HIV/AIDS-related activities. Although HIV/AIDS is included separately in terms of spending in the PRSP projections, it is not entirely clear what these estimates cover, and within which sector they fall. For example, the detailed description of priority items in the original PRSP refers only to “Subvention to the Tanzania Commission on AIDS (TACAIDS)”, which would fall under the President’s Office. However, a footnote to the table showing disaggregation of priority items indicates that “[e]xpenditures on HIV/AIDS will basically fund awareness campaigns, development of strategic plans for combating HIV/AIDS, preventive measures such as the provision of condoms, and carrying out studies and monitoring/surveillance of the incidence and impact of the pandemic as well as actions taken to fight it”20 which would include spending within the health sector. Identification of the total budget for health-related HIV/AIDS spending, and subsequent comparison with actual disbursements/expenditures is therefore very difficult. Information on HIV/AIDS spending more generally is given in Sections 4.3.4 and 4.3.5 below.
2.4 External financing
2.4.1 Tanzania Assistance Strategy The Tanzania Assistance Strategy (TAS) was developed in 2000 as a comprehensive development framework within which GOT and development partners would work to achieve the shared objectives stated in the vision 2025, the National Poverty Eradication Strategy and the PRSP. A government initiative, it was developed through a broad participatory approach, with consultation at national and zonal levels. It covers all development areas traditionally supported by donors, both within and outside the government budget, and is expected to provide the basis for regular discussion and assessment by government and partners of issues in relation to ongoing activities. As stated in the introduction: “(TAS) seeks to promote good governance, transparency, accountability, capacity building and effectiveness in aid delivery. TAS is not a program or a project. TAS is about a process for change”21. It was developed concurrently with the PRSP, and provides the framework for managing external resources to achieve the development objectives articulated therein. TAS builds on a number of identified “best practices” in development cooperation, including the Tanzania-specific Agreed Notes of 1997 based on The Helleiner Report of 199522, which
19 URT (2002c), pp78-9 20 URT (2000b), p35 21 URT (2000a), Tanzania Assistance Strategy, Volume 1. p1 22 GK Helleiner et al (1995). Report of the Group of Independent Advisors on Development Cooperation Issues between Tanzania and its Aid Donors. Royal Danish Ministry of Foreign Affairs.

GFATM Tracking Study: Macroeconomics and sectoral background Tanzania
Final draft 15
was commissioned at a time when donor-government relations were strained due to rising corruption and weak revenue collection. These practices are listed in Box 4 below. Building on these, the TAS sets out the need for a shared vision, and outlines undertakings by both government and development partners, together with a framework for monitoring progress. Box 4 Key areas in strengthening development cooperation
• Promoting local ownership and leadership • Promoting partnership • Improving aid coordination mechanisms • Improving transparency, accountability and predictability of aid; • Harmonising donor policies and procedures; • Strengthening capacity of aid recipient Government; • Capacity strengthening of external resource management.
(TAS, Volume 1, p9) Priority areas under the TAS are set out in Volume 2, and largely mirror those in Vision 2025 and the PRSP, covering both sectoral issues, including health, and cross-cutting areas, such as HIV/AIDS.
2.4.2 Budget support for poverty reduction Increasingly, in Tanzania as in other countries in the region, development partners are moving towards providing general budget support through a budget which explicitly targets expenditures at priority poverty-reducing sectors and activities as articulated through the PRSP. In Tanzania, there are three main sources of budget support:
• The Poverty Reduction Budget Support, which harmonises contributions by a number of bilateral and multilateral partners;
• The International Monetary Fund’s Poverty Reduction Growth Facility; • The Poverty Reduction Support Credit, currently under preparation by the World
Bank. External financing through the Poverty Reduction Budget Support (PRBS) is provided by a number of bilateral and multilateral development partners. PRBS was initially established by the Tanzanian government and a number of bilateral donors as the Multilateral Debt Fund, following the interim HIPC Initiative, as a means of channelling monies intended for settling multilateral debt obligation. After reaching the HIPC Completion Point in November 2001, PRBS was created to provide direct budget support to the poverty reduction effort. The main aim of the PRBS is to coordinate development assistance from budget support donors, and the support has been fully integrated into the budgeting and priority setting process in Tanzania. All donors and financial institutions providing or considering budget support are able to contribute through the PRBS, and the intention is to manage all such support through a single facility in order “to reduce transaction costs and to harmonise performance benchmarks and dialogue within the poverty reduction process”23, in addition to strengthening government systems. PRBS donors are expected to communicate a minimum level of funding in advance of each financial year, and to frontload as much support as possible within the first quarter, in order to improve the predictability of external assistance, one of the major constraints to effective budget performance in the past. In the medium term, harmonisation of the Performance Assessment Framework and the PRS is planned, and agreed allocations for priority sectors 23 URT and PRBS donors (2002). Tanzania Joint PRBS Annual Review. Final Report. December 2002.

GFATM Tracking Study: Macroeconomics and sectoral background Tanzania
Final draft 16
and items will be monitored through a number of review meetings between the government and partners. The Poverty Reduction Growth Facility (PGRF) is provided by the International Monetary Fund (IMF), with the current phase of support having begun in 2000. The PRGF is the IMF's concessional facility for low income countries, and aims to support country-owned PRSPs as a means of ensuring that PRGF-supported programs are consistent with a comprehensive framework for macroeconomic, structural, and social policies to foster growth and reduce poverty. PRGF loans carry an annual interest rate of 0.5 percent and are repayable over 10 years with a 5½-year grace period on principal payments. The approved PRGF for Tanzania was equivalent to approximately US$169m at the time of agreement, with a tranche of US$27m being agreed in November 2002. World Bank support has been provided in the past through the Programmatic Structural Adjustment Credit, but is in the process of being restructured to become the Poverty Reduction Support Credit (PRSC). Agreement has been reached that the list of issues for policy dialogue under the PRBS, ie the Performance Assessment Framework, will be harmonised with the PRSC, and that both will be regulated by a common framework document. Technical input into budget support review from the World Bank is expected to substantially strengthen the process.
2.5 Administrative setup
2.5.1 Administrative decentralisation and Local Government Reform24 Tanzania adopted devolution as its preferred form of decentralisation with the approval of a Government Policy Paper on local government reform in 1998. This paper clearly identified functional responsibilities for local government, with reforms targeting the following areas:
• Assuring popular participation in government at the local level, including through the election of local councils;
• Bringing public services under the control of these local councils; • Giving local councils political powers over all local affairs; • Improving financial and political accountability at the local level; • Securing finances for better public services at the local level; • Creating a new local government administration answerable to the local councils; • De-linking local administrative leaders from their former ministries; and • Creating new central-local government relations based not on orders but on
legislation and negotiations25. The Local Government Reform Programme (LGRP), which falls under the President’s Office – Regional and Local Government (PORALG), was launched in January 1999 to operationalise the government’s local government reform agenda. The LGRP both provides advisory services to the PORALG on policy, planning, capacity building initiatives and management capacity for funding, communication and coordination, and extends technical support to regional administrations and local governments in implementing local government reforms through Zonal Reform Teams and Council Reform Teams. The reforms have been introduced through a phased approach, with councils identified as Phase 1, 2 or 3, depending on whether implementation began in 2000, 2002 or 2003. A full list of councils by reform phase is given in Annex B.
24 This section draws on Section 1 of a report prepared for the Local Government Reform Programme by Georgia State University, Developing a system of intergovernmental grants in Tanzania, November 2002. 25 Cited in Georgia State University (2002), Section 1, p 1-4

GFATM Tracking Study: Macroeconomics and sectoral background Tanzania
Final draft 17
Local governments in Tanzania are independent legal entities governed by elected councils, with their own budgets, sources of revenue, and with the ability to borrow funds. They are responsible for the provision of most primary level services, including basic education, basic health care, local water, and local roads. A distinction is made between district councils which are largely rural, and urban councils which are further distinguished between town, city and municipal councils. Councils elect a Council Chairman or a Mayor (for urban councils), and also hire a chief executive officer known as the District Executive Director in rural councils, and the Urban Executive Director in urban local government areas. The chief executive acts as secretary of Council meetings, is head of all LGA staff, and is in charge of day-to-day running of the LGA. S/he is responsible for revenue collection and expenditures, for maintaining political and public relations with councilors and other external stakeholders, for the implementation of Council business through council and committee meetings, and for policy formulation, coordination and accountability, and legal matters. Each council has a number of departments, generally including education and culture, health, water, communications and works, finance, administration, agriculture, livestock and cooperative development, community development, trade and economy, and natural resources. These departments are headed by a professional who provides advice to the sub-committees in the Council and who is responsible for implementing all decisions reached by the Council on matters of development and the delivery of social services. Within a council, whether urban or rural, there is also a sub-district division of the administrative area into wards. These wards are then further divided, in rural areas into villages and subsequently hamlets known as kitongoji (plural vitongoji), and in urban areas into street neighbourhoods known as mtaa (plural mitaa). Under the Local Government Act (Acts No. 7 and No. 8) of 1982, local governments were given wide-ranging powers and responsibilities, including direct responsibilities for the provision of primary education and health services, water supply, local roads and agricultural extension. These are funded largely through conditional grants from central government, supplemented through locally generated revenues. Regional administration Although the local government is the primary service provider, the Regional Administration Act (No. 19) of 1997 established Regional Secretariats whose purpose is “to facilitate local government authorities in planning and implementing their local development initiatives and to ensure the efficient delivery of local government services”26. The vision of the Regional Secretariat is to be a technical resource for supporting (a) local development opportunities and (b) ministerial services between central and local government27. The Regional Secretariat is headed by a Regional Commissioner who is a political appointee.
2.5.2 Fiscal decentralisation As mentioned above, currently, funds for service delivery are channelled through a number of different mechanisms of which central government conditional grants are generally the most substantial. However, the mechanism for transfer between central and local government has described by the Fiscal Decentralisation Task Force (FDTF) as “largely
26 Georgia State University (2002), Section 1, pp1-8 and 1-9. 27 Regional Secretariat’s Operational Manual 1999, cited in Georgia State University…

GFATM Tracking Study: Macroeconomics and sectoral background Tanzania
Final draft 18
insensitive to policy changes, such as those based on the PRSP” (FDTF prog rpt p2). In addition, a recent situation analysis undertaken as background to proposals for a new allocation formula found that “..budget allocations to local authorities (ie transfers or grants) are made in a non-transparent manner, the budgetary discretion of local authorities has been quite limited, and local government have little discretion to raise own source revenues.” (Boex and Rutasitara, p2). The authors concluded that high dependency on inter-governmental transfers (ie between levels of government, or central to local), most of which are sector-based conditional transfers, has contributed to a failure to achieve service delivery improvements. Work is ongoing on fiscal decentralisation, with the establishment of the Fiscal Decentralisation Task Force in November 2001. The committee includes members from Government, development partners, and civil society (represented by an NGO/consulting body, Research into Poverty Alleviation (REPOA)). It meets on a bi-weekly basis, primarily to discuss issues related to three areas: • The application of the block grant system • Alternative formula-based grant allocation systems; and • A controlled process for increasing the financial autonomy of LGAs, which should be
based on objective financial performance assessment criteria28. One obstacle is (apparently) weak collaboration between MOF and PORALG. Work to develop a new system of inter-governmental grants, and to strengthen both the vertical and horizontal allocation of resources, was commissioned in 2002, and a draft report was presented by the consultants in December 200229. More details for the health sector are given below (Section 4.2.1). It is intended that the new grant allocation formula and application of greater autonomy for selected councils will start in FY 2003/04.
3 The Government budget framework
3.1 The financial year and the planning cycle The financial year (FY) in Tanzania currently differs between central and local government, with the central government FY running from 1 July to 30 June, while local government has adopted the calendar year, ie 1 January to 31 December. This has understandably caused problems in harmonising sectoral plans and budget ceilings between different levels of government. However, it is intended that these cycles will be harmonised with effect from FY05, ie 1 July 2004, although the Association of Local Authorities of Tanzania has expressed concern that this will reduce the predictability of the resource envelope for LGAs. A detailed diagram showing the annual planning cycle at different levels of the government system, and incorporating the timing and role of the Public Expenditure Review process, is given at Annex C30.
3.1.1 Public Expenditure Review Public Expenditure Reviews have become an annual event in Tanzania in recent years, with priority sectors being analysed in some depth for the past three years. The main objectives 28 FDTF progress report, presented to PER Working Group on 8th Oct 2002. 29 Georgia State University (2002). Sections 1 to 5. 30 Taken from A Bird. Design and Implementation features of Medium Term Expenditure Frameworks and their links to poverty reduction: Tanzania country study. Part of a multi-country study by the Overseas Development Institute on “Experience in implementing MTEFs in a PRSP context” funded by DFID (UK) and the EC. Oxford: October 2002

GFATM Tracking Study: Macroeconomics and sectoral background Tanzania
Final draft 19
of this exercise are to a) provide a medium term view of budgetary allocations and trends within the sector; and b) to assess how well these match stated priorities. An overall PER Working Group is chaired by the Ministry of Finance, and meets regularly to review progress throughout the process (although this did not happen in FY03). Individual sectors identified for inclusion in the PER each have their own working groups, and a Macro Working Group undertakes the broad review of the general macroeconomic and public expenditure position. In the Health sector, the Sub-Committee on Planning, Budgets, Finance, Review, Monitoring and Evaluation performs the role of the Sector Working Group. The sectoral PER process is supposed to be completed by early December in order for recommendations arising from the sectoral PERs to feed in submissions from each MDA to the Ministry of Finance for inclusion in the draft Budget Guidelines. Draft budget guidelines are prepared by the PER Macro Working Group and are circulated to sectors and development partners in early January for comment. These present a first indication of sectoral ceilings, and of allocations to key items or areas within sectors, based largely on the submissions from the line MDAs. Following submission and approval of the final sectoral PERs, a composite report is produced, and a consultative meeting is held in May each year to present and discuss the findings of the PER process to and among a wider audience. The first detailed health sector PER was undertaken in FY01, with a subsequent update in FY02. The PER update for the current financial year has just been drafted, and much of the information in the later part of this background paper draws on the findings of the PER FY03.
3.2 The Medium Term Expenditure Framework Following the abandoning of a five year development planning process in the early 1990s, Tanzania initially introduced a Rolling Plan and Forward Budget in 1993/94. For the past three years, Government has been operating a rolling, three year MTEF. However, to date this provides the resource framework for implementing the PRS only, rather than a broader public expenditure framework, as it is restricted to designated priority sectors identified in the PRSP and subsequent progress reports. Each sector currently produces a number of substantial volumes throughout the course of the financial year: • The MTEF table itself, in Excel, details each individual activity, by department, and by
sub-item for a three year rolling period. This includes both government and foreign funding, distinguishing between donor basket funding and other foreign funding. For the period FY04 – FY06, the development estimates include both on-budget development spending (ie local development plus foreign funding officially captured in Treasury estimates) and a larger total which presumably includes information from the MOF External Finance Department database, part of which is “off-budget”, ie not captured in Treasury estimates. This forms part of a larger text document which outlines sectoral policies and key strategies, and also summarises progress in the previous financial year31.
31 It should be noted that a sectoral (or partially sectoral) MTEF such as that prepared by the central level MOH, is not necessarily the same as the budget which is reflected in the official Government estimates produced each financial year. References to “on-budget” throughout this document refer to funding included in Treasury estimates, whereas sectoral MTEFs may include external funding which is not captured by the Treasury. Such funding often contributes to recurrent spending but is not included with other external funding in the development budget (unlike health basket funding which is included), but still uses government coding for activities and expenditure items and could therefore in

GFATM Tracking Study: Macroeconomics and sectoral background Tanzania
Final draft 20
• The Detailed Cash Flow outlines planned expenditures by month for the current financial year, again distinguishing between government and external funds (ie for those which are not provided through general budget support);
• The Physical and Financial Implementation Report is produced quarterly and on an annual basis, and reviews cumulative progress against the activities outlined for a given financial year. The MTEF for FY04 – FY06 (for Health) therefore includes the annual report for FY02, and the cumulative quarterly report for the first half of FY03 (ie July to December).
The diagram in Annex C is drawn directly from Bird (2002), and shows the PER, MTEF, and budgetary process in detail, by level of the administrative system.
3.3 Financial Management The Integrated Financial Management System (IFMS) was introduced in 19xx and aims to computerise information on budgets and expenditures across government. At present it is operational at central government level only, but the intention is to progressively roll it out to the Local Government level in order to strengthen what is recognised as very weak financial management at that level. The IFMS, which uses Platinum software (but which can be exported into Excel for ease of analysis), incorporates information by Ministry, Department, activity, and sub-item and is directly related through a coding system to the MTEF. Information can be produced on a daily basis on approved budgets, releases from Treasury, and actual expenditures. Recently, the government revised the coding system for the budget, introducing standardised Government Financial System (GFS) coding – adopted throughout the central level, but not yet extended to LGAs. Also, the GFS codes are only applied to the Recurrent Budget and not the Development Budget, which means that recurrent elements of Development Budget spending are not fully captured in analysis. The coding system is described in Table 7 below: Table 7 GFS classifications
Classification Description Example Vote Code assigned to a sector ministry or
government agency 52 Ministry of Health
Sub-vote Department within that MDA 2001 Hospital Services Department Item Broad expenditure category 2604 Medical supplies and services Sub-item Detailed expenditure description 260402 Vaccines There is, as in many countries, some confusion regarding the distinction between Recurrent and Development Budgets, with the latter largely reflecting external financing to the sector regardless of type of expenditure, and recurrent and capital spending32. Within the recurrent budget, there is a group of Item codes (3000 onwards) which covers the acquisition of plant,
theory be included in analysis of sectoral spending if comprehensive expenditure data were produced which is not always the case (at least for MOH). 32 Conventionally, in economics, “recurrent costs” are those associated with inputs lasting less than or used within the course of a year, eg salaries (for labour), drugs, fuel, in-service training. “Capital costs” on the other hand are those relating to items lasting more than a year, eg vehicles, construction, equipment, basic training. Ideally, development budgets would be broadly synonymous with “capital”. However, as donors have historically contributed to the “development” of systems, their contributions, when captured in national government budgets, tend to be located within the “development budget” even if their funding is supporting allowances, purchase of drugs and supplies, maintenance of infrastructure etc which would normally be considered “recurrent” cost items.
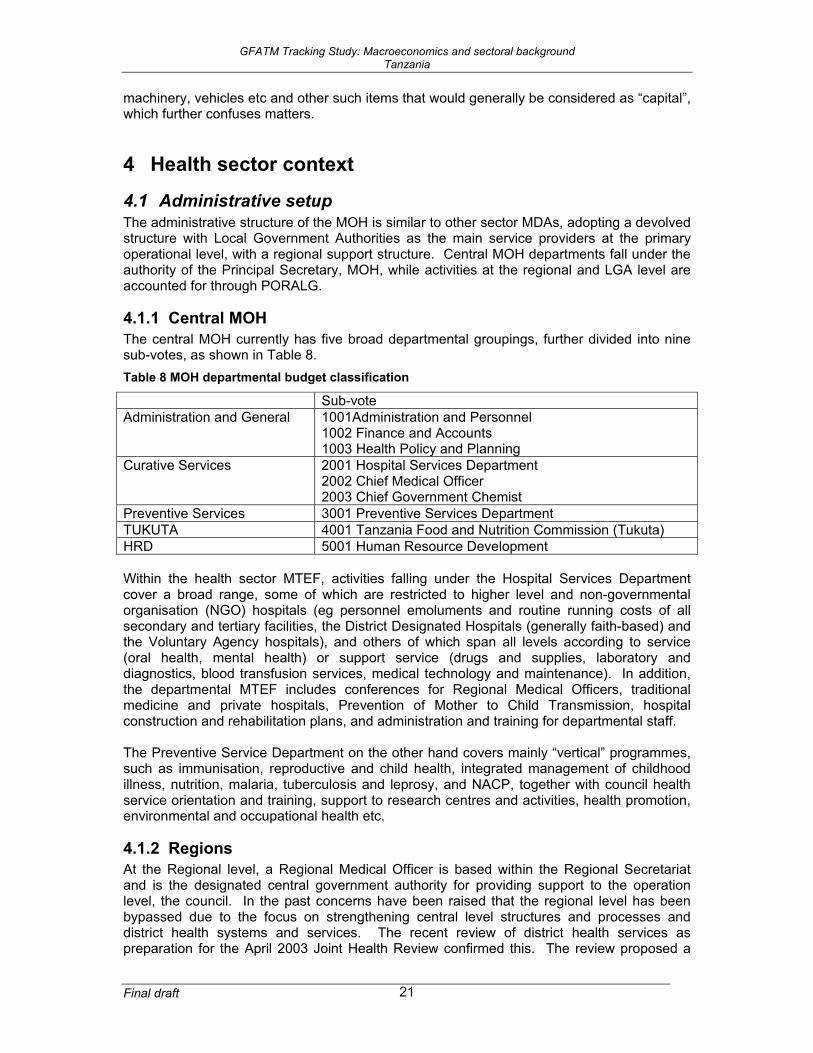
GFATM Tracking Study: Macroeconomics and sectoral background Tanzania
Final draft 21
machinery, vehicles etc and other such items that would generally be considered as “capital”, which further confuses matters.
4 Health sector context
4.1 Administrative setup The administrative structure of the MOH is similar to other sector MDAs, adopting a devolved structure with Local Government Authorities as the main service providers at the primary operational level, with a regional support structure. Central MOH departments fall under the authority of the Principal Secretary, MOH, while activities at the regional and LGA level are accounted for through PORALG.
4.1.1 Central MOH The central MOH currently has five broad departmental groupings, further divided into nine sub-votes, as shown in Table 8. Table 8 MOH departmental budget classification
Sub-vote Administration and General 1001Administration and Personnel
1002 Finance and Accounts 1003 Health Policy and Planning
Curative Services 2001 Hospital Services Department 2002 Chief Medical Officer 2003 Chief Government Chemist
Preventive Services 3001 Preventive Services Department TUKUTA 4001 Tanzania Food and Nutrition Commission (Tukuta) HRD 5001 Human Resource Development Within the health sector MTEF, activities falling under the Hospital Services Department cover a broad range, some of which are restricted to higher level and non-governmental organisation (NGO) hospitals (eg personnel emoluments and routine running costs of all secondary and tertiary facilities, the District Designated Hospitals (generally faith-based) and the Voluntary Agency hospitals), and others of which span all levels according to service (oral health, mental health) or support service (drugs and supplies, laboratory and diagnostics, blood transfusion services, medical technology and maintenance). In addition, the departmental MTEF includes conferences for Regional Medical Officers, traditional medicine and private hospitals, Prevention of Mother to Child Transmission, hospital construction and rehabilitation plans, and administration and training for departmental staff. The Preventive Service Department on the other hand covers mainly “vertical” programmes, such as immunisation, reproductive and child health, integrated management of childhood illness, nutrition, malaria, tuberculosis and leprosy, and NACP, together with council health service orientation and training, support to research centres and activities, health promotion, environmental and occupational health etc.
4.1.2 Regions At the Regional level, a Regional Medical Officer is based within the Regional Secretariat and is the designated central government authority for providing support to the operation level, the council. In the past concerns have been raised that the regional level has been bypassed due to the focus on strengthening central level structures and processes and district health systems and services. The recent review of district health services as preparation for the April 2003 Joint Health Review confirmed this. The review proposed a
GFATM Tracking Study: Macroeconomics and sectoral background Tanzania
Final draft 22
minimum 3 person team, of full-time professional staff, to provide demand-driven support not only in terms of planning, cross-sectoral coordination, resource mobilisation, and provision of routine reports to the Regional Secretariat, but also for convening peer review meetings, compiling and feeding back council level performance data, and undertaking quality assurance activities. Strengthening of this level has been identified as a priority way forward under the new draft medium term sectoral strategic plan.
4.1.3 Local Government Authorities Local Government Authorities, whether municipalities or districts, are responsible for primary service provision across sectors. In the health sector, this requires that within a district, a District Medical Officer (DMO) is responsible for pulling together a District Health Plan based on health plans submitted by the Ward Health Committees. Responsibility for approving the plan lies with the Standing Committee on Health which is accountable to the full council, while responsibility for monitoring and implementation lies with the DMO and the District Health Management Team. Local governments are responsible for promoting public health, and for the establishment and maintenance of district hospitals, health centers, maternity clinics, and dispensaries. Implementation of health sector reform (HSR) at the local government level has proceeded according to the phasing of local government reforms, beginning in 2000 with the 37 councils, known as Phase 1, extending in 2002 to an additional 45 Phase 2 councils, and concluding with the remaining councils in January 2003. A list of LGAs by reform status/phase is included at Annex B. The HSR strategy of decentralisation is designed to be wholly consistent with the more general local government reform programme, although some parallel formats have been introduced for health sector planning and reporting. The recent review of district health services points to duplication and contradiction in some guidelines (from MOH and PORALG) which understandably causes confusion at the council level, and to the fact that comprehensive council level planning has been slowed by the concentration on basket funds.
4.2 Current health policies and strategies Policy within the health sector is guided by the overall policy framework of the Tanzanian Government, ie as spelled out in Vision 2025, the PRS, TAS etc and referred to above. Within the sector, the National Health Policy was produced in 1990, and aimed to improve the health status of all citizens with particular attention to vulnerable groups i.e. mothers, children and the poor, by ensuring health services are available and accessible to both the rural and urban population and improving the population’s understanding and capability to prevent ill health. This policy was revised during 2002, integrating new developments over the intervening period, such as the reform proposals of 1994, the PRSP, the Tanzania Development Vision, a focus on vulnerable groups, and HIV/AIDS. Finalisation of the policy document, including incorporation of comments and revisions from stakeholders, is planned for FY04. The Government approved proposals for sectoral reform in the mid-1990s, and strategies for achieving the overall policy objective since that time have been based on the promotion of health care at a primary level, through ensuring the provision of low cost preventive and curative services to all areas, supported by a network of Government and NGO hospitals to provide referral services for more complex health problems. Recognising systemic weaknesses, a number of specific reform strategies were identified in the HSR proposals: Decentralisation; improvements of central health systems; health management; financing; human resources; and partnership.

GFATM Tracking Study: Macroeconomics and sectoral background Tanzania
Final draft 23
Following work to develop a common approach among partners towards implementation of the health sector reform proposals, a Memorandum of Understanding was signed between the Ministry of Health and partners in 1998. Subsequently, a task force was appointed to develop the 1999-2002 Health Sector Reform Programme of Work, designed to take forward the sector-wide approach in Tanzania, both through further development of joint structures and processes, and more specifically for joint funding of the sector through a common basket. The HSR Programme of Work expanded the number of strategies to eight: • Improvement of district health services; • Improvement of secondary and tertiary health services; • Strengthening the role of the Ministry of Health; • Development of human resources; • Reinforcement of the central support system; • Exploring various options for health financing; • Increased participation of private/public mix; • Establishment of effective relationship between Ministry of Health and donors. The Ministry of Health is currently in the process of producing a new three year sectoral strategy, a draft of which was discussed at the Joint Review meeting in mid-March 200333, and finalisation of which is planned for FY04. The April 2003 draft (referred to henceforth as HSSP2) provides an update on progress both in terms of the sectoral context and implementation during the first strategic plan period 1999-200234, and combines the eight original strategies, together with one on HIV/AIDS which was added during the plan period, into three components: • The district component, which covers community health services, dispensaries, health
centres and the district hospital; • A component covering secondary and tertiary hospitals, together with other health sector
tertiary level institutions such as teaching institutions; and • The central level which outlines the role of the various ministries involved in the sector. Priorities within HSSP2 include a stronger focus on the Essential Health Package, particularly at district level and below, with improved targeting of the budget, and a stated intention to ensure delivery at all levels in order to meet the needs of the poor. At the same time, the role of the central ministry will be strengthened in the areas of policy, governance, legislation, regulation, finance, quality assurance, and monitoring. Finally, urgent attention to a number of human resource issues is critical to enable improvements in service delivery, notably in terms of staff numbers and skill mix, geographical and service level allocations, and incentives and remuneration packages. The GFATM target diseases are recognised within the current policy and strategy documents as key contributors to the burden of death and disease within Tanzania, particularly for the more vulnerable sections of the population, and are therefore implicitly addressed through the strategies listed above. HSSP2 makes explicit the continued intention to progressively integrate vertical programmes, including HIV/AIDS, into the service delivery system. HIV/AIDS was added as a separate 9th strategy in the period of the first strategic plan, and has been updated directly relating to the sectoral HIV/AIDS strategy (see below). In addition, individual disease programmes, which currently fall under the Department of Preventive Services, have developed their own more detailed strategies which are in differing stages of development and approval.
33 MOH (2003). Second Health Sector Strategic Plan (HSSP): (July 2003 – June 2006). Final draft. Dar es Salaam: April 2003 34 assumed to be the same document as the HSR Programme of Work 1999 – 2000.

GFATM Tracking Study: Macroeconomics and sectoral background Tanzania
Final draft 24
HIV/AIDS The NACP played a significant role in the development of the Health Sector HIV/AIDS Strategy 2003-07 (HSHS)35 which was finalised in early 2003. Reflecting the fact that the sectoral response to HIV/AIDS falls across departments within MOH, NACP is to be relocated from the Directorate of Preventive Services into the office of the Chief Medical Officer, thus giving access to all health institutions both within and outside of the public heath sector “for the purpose of providing technical assistance, guidance, and supervision of compliance to set standards in implementing HIV/AIDS interventions” (MOH 2003b, p6). At present however, according to the MTEF for FY2004 – FY2006, the budget for HIV/AIDS through NACP remains in the Directorate of Preventive Services. The HSHS was developed through a participatory process over a number of months, and key elements have been incorporated into the second Health Sector Strategic Plan. The strategy identifies the following goals for the health sector response to the disease36: • To scale up the health sector response to HIV/AIDS and to strengthen the health sector
capacity to support HIV/AIDS interventions; • To promote access and utilisation of affordable and essential interventions and
commodities for HIV/AIDS; and • To improve the quality of HIV/AIDS interventions to the general public, persons living with
HIV/AIDS, health care providers and other vulnerable people. These goals are to be achieved through 12 strategic objectives: 1. Promotion of increased practice of safe sex in vulnerable populations; 2. Increased access to services for prevention of mother to child transmission of HIV in all
hospitals by 2005; 3. Strengthen the provision of blood which is free from HIV and other common blood
transmissible diseases; 4. Implement universal precautions in health care settings to prevent nosocomial
transmission of HIV; 5. Develop and implement comprehensive care strategies in public and community-based
settings by 2005; 6. Provide the highest attainable standard of management of HIV/IAIDS by 2005; 7. Improve the capacity and working conditions of health care personnel; 8. Establish programmes to prevent and reduce stigma, denial and discrimination related to
HIV/AIDS by 2005; 9. Increase access to quality Voluntary Counselling and Testing (VCT) services in all
hospitals and at least two stand-alone sites in every district by 2005; 10. Coordinate and implement research programmes to support the national response to
HIV/AIDS; 11. Strengthen and expand surveillance activities to monitor the dynamics of the epidemic
and impacts of interventions; 12. Strengthen diagnostic services to support prevention, care and other interventions. The establishment of Tanzania Commission for AIDS (TACAIDS) in 2002 has enabled MOH to focus on the health sector response, as it takes over responsibility for coordinating the broader multi-sectoral response. With the status of a separate government agency,
35 Note: This document is sometimes referred to as covering the period 2003 – 2005, sometimes to 2007, sometimes as HIV and sometimes as HIV/AIDS. I don’t have a copy to verify. 36 Taken from A Alban (2003). Analysis of planning, costing and cost-effectiveness of GFATM application for HIV interventions, Tanzania. Draft background paper prepared for LSHTM tracking study and DANIDA. 12 May 2003.

GFATM Tracking Study: Macroeconomics and sectoral background Tanzania
Final draft 25
TACAIDS commands a substantial budget both from government funds and external agencies. Malaria Following the inclusion of Tanzania as a target country for the WHO Accelerated Plan of Action for Malaria Control in the mid-1990s, a four year plan developed in 1997 was succeeded by the Roll Back Malaria plan of action for 2000/01. In order to consolidate efforts against the disease, the Malaria Mid Term Strategic Plan for 2002-2007 (MMTSP) was developed with an aim of reducing morbidity and mortality due to malaria in all regions by 25% by 2007 and by 50% by 201037. The MMTSP identifies four main strategies to malaria control in the country:
• Improved malaria case management (through early case detection and treatment); • Vector control through the universal use of Insecticide-Treated Nets (ITNs); • Control of malaria in pregnancy; and • Malaria epidemic prevention and control.
The document further outlines specific interventions to be introduced, improved, and where necessary scaled up throughout the country, and identifies targets to be monitored over the course of the plan. Tuberculosis The National Tuberculosis and Leprosy Programme developed a Medium Term Development Plan for July 2001 to June 2004 which brings together activities and expected funding from the different partners involved in the programme.
4.2.1 Health planning, budgeting, financing and financial management Responsibility for planning and budgeting within the Ministry of Health headquarters falls under the Department of Policy and Planning, particularly within the Budget Section. The planning cycle follows that of central government, with the PER, development of the MTEF, and agreement on the annual plan of action broadly taking place according to the schedule shown in Annex C. The Joint Review meeting of government and partners which takes place in March/April each year provides an opportunity to review performance and progress over the past year, and to agree donor commitments for the coming year as part of a broader process of assessing medium term plans, priorities and the resource and expenditure framework. Issues of health financing are covered both within the Directorate of Policy and Planning, and also through the Health Sector Reform Secretariat as this is one of the eight reform strategies as noted above. The government budget, including the common basket, forms the major component of the resource envelope, as seen in Section 4.3 below. However, three different cost-sharing mechanisms also exist in the country:
• The Health Service Fund, which covers contributions and expenditures from user fees at government hospitals around the country;
• The Community Health Fund, which is a World Bank-supported, community-based prepayment scheme operating in a limited number of areas in 36 pilot councils; and
• National Health Insurance expenditures, which are made by the National Health Insurance Fund from deductions from civil servants’ pay supplemented by a contribution from central government.
Estimates for the FY03 PER update indicate that expenditure under these three schemes still amounted to only 0.6% of total sectoral expenditure in FY02 (see Table 9 below).
37 MCP (2002). National Malaria Medium Term Strategic Plan 2002 - 2007. Draft 1.8. September 2002
GFATM Tracking Study: Macroeconomics and sectoral background Tanzania
Final draft 26
At present the health sector does not use a resource allocation for determining allocations to councils, but work has been ongoing in this area in parallel to that undertaken through the Local Government Reform Programme (see Section 2.5.2). Finalisation and use of the formula is included within the draft HSSP2 as a priority activity for the coming years under the strategy for health financing. Possible indicators to be incorporated in such a formula include: age and sex-weighted population (50%); poverty levels, based on the Poverty Welfare Index of the geographical area under question (15%); an index of mileage, to and within the LGA (15%); and burden of disease, to incorporate under-five and adult mortality rates plus any others available (20%)38. Central level financial management is the remit of the Accounts Section, largely through the IFMS Platinum system which is able to produce daily reports showing budget, release and expenditure. This means that monthly reports can be produced in a very timely fashion, and these are circulated for the periodic assessments of progress with disbursement and expenditure of the recurrent budget, both government and basket, by the Basket Finance Committee and the Sub-Committee on Health Planning, Budgets, Review, Monitoring and Evaluation. Development expenditures are not yet fully incorporated into the IFMS system, and off-budget project funding is not captured at all, despite some being included within the MOH MTEF. At local government level, financial management is recognised as very weak, to the extent that throughout government disbursement is used as a proxy for expenditure at council level. This is generally recognised as unsatisfactory, with one recent study indicating that local government health department receipts as a percentage of actual sectoral disbursement for Sept – Nov 2000 ranged between 16.8% and 100% in the five LGAs covered39. IFMS is progressively being extended to the local government level, which will eventually assist in this area. First priority has been given to the regional level however.
4.2.2 Monitoring, reporting and evaluation At the central level, the MOH has agreed on a number of indicators for monitoring sectoral performance. These are described, together with a baseline value, in the Health Sector Performance Profile 2001. However, this document has remained in draft form, and as yet a comprehensive performance update has not been compiled. Financial reporting also takes place through the PER process, and indicators for PRSP targets are generally included within the annual PRSP progress reports.
4.3 Sectoral expenditure overview Much of this section is drawn from the recent draft health sector PER update, and the draft HIV/AIDS PER, both for FY03.
4.3.1 Overall spending Data from the most recent PER update40 indicate that nominal spending in the health sector has risen marginally over the past two years, although there was an increase immediately
38 MOH Health Sector Reform Secretariat and Department of Health Policy and Planning. Proposed criteria for allocation of resources in the health sector. November 2002 39 Research on Poverty Alleviation (REPOA)/Economic and Social Research Foundation (ESRF) (2001). Pro poor expenditure tracking. Draft report submitted to the PER Working Group, March 2001. (Table 7) 40 Note: these figures are all taken from the draft of 26 Feb 2003 and may have changed in the final version.

GFATM Tracking Study: Macroeconomics and sectoral background Tanzania
Final draft 27
following publication of the PRSP. Table 9 below shows budgeted and actual expenditure for the period since FY99. Table 9 Total public health expenditure, FY99 – FY03 (TSh bn)
1998/99 1999/2000 2000/2001 2001/2002 2002/2003Budget Actual Budget Actual Budget Actual Budget Actual Budget
RecurrentMOH 37.25 37.15 39.20 32.39 49.39 44.25 61.60 58.99 86.94 Region 9.25 8.68 9.36 9.01 6.21 5.61 7.06 6.58 7.60 Local Govt 15.72 16.34 18.69 17.95 36.35 35.67 46.26 46.28 57.66
Total rec. 62.21 62.18 67.25 59.34 91.95 85.53 114.92 111.86 152.20 Development
MOH 21.21 17.27 17.75 10.19 20.47 14.84 32.07 21.12 33.78 Regions 5.00 0.67 2.57 0.79 4.62 1.39 2.35 1.28 4.75 Local Govt 0.62 - 1.18 1.06 1.73 1.52 1.70 - 2.04
Total devt 26.83 17.94 21.50 12.03 26.81 17.74 36.12 22.40 40.57 Total on budget 89.04 80.11 88.75 71.38 118.76 103.27 151.04 134.26 192.77 Off budget expenditure
Cost sharing - 1.09 - 1.49 - 1.86 - 1.37 1.20 Other foreign funds 35.55 42.76 52.33 60.04 59.41 75.00 66.14 79.37 49.25
Total off budget 35.55 43.85 52.33 61.53 59.41 76.86 66.14 80.74 50.45 Grand total 124.58 123.96 141.08 132.91 178.18 180.13 217.18 215.01 243.23 Source: MOH 2003a, Table 1 Note: basket funding included in the recurrent budget figures When the on-budget share of planned spending is examined as a proportion of the total GOT budget, the stagnation becomes more obvious, rising only 0.2% in two years, as shown in Figure 3 below. Figure 3 On-budget health spending as a proportion of the total GOT budget, FY99 – FY03
0.0%
1.0%
2.0%
3.0%
4.0%
5.0%
6.0%
7.0%
8.0%
9.0%
10.0%
Budget 8.8% 7.5% 8.5% 8.6% 8.7%Actual 8.9% 6.6% 8.1% 8.3%
FY99 FY00 FY01 FY02 FY03
Source: MOH 2003a. Figure 1
4.3.2 External funding in the health sector As in other countries within the region, external financing from development partners accounts for a substantial proportion of total spending in the health sector. The draft PER for FY03 indicates that of the on-budget actual expenditure in the sector in FY02 and estimates

GFATM Tracking Study: Macroeconomics and sectoral background Tanzania
Final draft 28
for FY03, 30.1% and 40.1% respectively were from foreign sources, as illustrated in Figure 4 below. Figure 4 On-budget share of domestic and foreign financing, FY99 – FY03
72.8% 73.6%67.9% 64.2% 59.9%
78.8%85.1%
77.5%69.9%
27.2% 26.4%32.1% 35.8% 40.1%
21.2%14.9%
22.5%30.1%
0%
10%
20%
30%
40%
50%
60%
70%
80%
90%
100%
FY99 FY00 FY01 FY02 FY03 FY99 FY00 FY01 FY02
Foreign fundsGovt funds
Budget Actual
Source: MOH 2003a, Figure 3 This figure substantially underestimates the amount of foreign spending in the sector, as a large proportion is not yet captured in the budget. Table 10 below gives the actual figures (in TSh billion) for domestic and foreign funding, both on and off-budget, over the past five years. Table 10 Public health spending, by funding type (Billion shillings)
1998/99 1999/2000 2000/01 2001/02 2002/03Budget Actual Budget actual budget actual budget actual budget
RecurrentGovt funds 62.21 62.18 60.73 57.98 75.47 74.90 91.63 90.29 109.39 Foreign funds - - 6.52 1.36 16.48 10.63 23.29 21.57 42.81
Total 62.21 62.18 67.25 59.34 91.95 85.53 114.92 111.86 152.20 Development
Govt funds 2.60 0.92 4.56 2.80 5.14 5.13 5.34 3.59 6.03 Foreign funds 24.23 17.01 16.94 9.24 21.67 12.61 30.79 18.82 34.54
Total 26.83 17.94 21.50 12.03 26.81 17.74 36.12 22.40 40.57 Total budget 89.04 80.11 88.75 71.38 118.76 103.27 151.04 134.26 192.77 Off budget
Govt funds - 1.09 - 1.49 - 1.86 - 1.37 1.20 Foreign funds 35.55 42.76 52.33 60.04 59.41 75.00 66.14 79.37 49.25
Total 35.55 43.85 52.33 61.53 59.41 76.86 66.14 80.74 50.45 Grand total 124.58 123.96 141.08 132.91 178.18 180.13 217.18 215.01 243.23 Source: MOH 2003a, Table 2 As part of the government’s attempt to capture an increasing share of total spending within the budget, in order to be able to reduce duplication and ensure consistency with policy objectives, the External Financing section of the Ministry of Finance have developed a database of external funding to each sector. For the health sector, this currently includes 128 projects, from a total of 24 different funding sources. Although there has been progress in the comprehensiveness of data captured in the database, it is not yet complete either in terms of actual projects and donors, or in terms of all details for those projects which are included. Figure 5 below shows the breakdown, according to MOF, of health sector external financing which is or is not captured in the budget, or for which the necessary information is not yet known.

GFATM Tracking Study: Macroeconomics and sectoral background Tanzania
Final draft 29
Figure 5 Health sector external financing, by budget status, FY03
46%
37%
17%
On-budgetOff-budgetNot indicated
Source: MOH 2003a, Figure 11 Figure 5 indicates that over half the foreign spending in the sector (54%) still takes place outside the regular budget. It should be noted that no consistency check has yet been undertaken between information on on-budget foreign spending in the health sector, and that which is actually reflected in the Development Budget for the sector.
4.3.3 Project versus programme support The Tanzanian budget adopts the conventional recording of all foreign financing within the development budget. However, since FY00, a number of development partners have contributed to the “joint basket” for the sector, through which pooled funds are made available to directly support recurrent spending at both central MOH and at the council level. Figure 6 below shows the increasing importance of the basket in recurrent spending in the health sector. Figure 6 Basket funding as a share of recurrent health spending, FY00 – FY03
28.1%
20.3%
17.9%
9.7%
19.3%
2.3%
12.4%
0.0%
5.0%
10.0%
15.0%
20.0%
25.0%
30.0%
FY00 FY01 FY02 FY03
budgetactual
Source: MOH 2003a (Figure 4)

GFATM Tracking Study: Macroeconomics and sectoral background Tanzania
Final draft 30
Figure 6 also shows that there has been substantial improvement in closing the gap between budgeted basket funding and actual expenditures. This is partly due to strengthened functioning of the coordinating bodies, such as the Basket Finance Committee, and improved disbursement by contributing partners. However, it is also felt to reflect improved absorption capacity within the MOH, as well as improved planning and budgeting within the sector as new systems become better established (MOH 2003a). DFID recently decided to withdraw their support from the basket in FY04, and to channel it instead through the PRBS. For FY04, this support (approximately US$22m) will be notionally earmarked for the health sector in the ceilings for FY04, but thereafter cannot be guaranteed to flow to the sector (although one would expect and hope for an increase in the overall sectoral ceilings and the priority items therein as a result of the PRS).
4.3.4 External financing for HIV/AIDS, Malaria and Tuberculosis An attempt was made during the PER FY03 process to categorise the 128 projects listed in the database by broad areas, including HIV/AIDS, malaria and TB. However, it should be noted that the picture obtained from the MOF database is incomplete in terms of HIV/AIDS-related foreign spending as HIV/AIDS was treated as a separate sector and has its own database which we have not yet been able to get hold of. For TB, a separate, small “basket” operates in support of the five year strategic plan. In Malaria, the database excludes substantial funding through the Gates Foundation, and also the successful recent application to GFATM for expansion of the bednet programme (although the figures for the latter were included within the sectoral MTEF for FY03). Table 11 below indicates the number and share of projects related to the GFATM diseases in the MOF database. More detail of these projects is given in Annex C. Table 11 HIV/AIDS, TB and Malaria in the MOF health sector database, FY03
Category No Allocation FY03 % of totalTB/Leprosy 5 2,413,339,701 2.6%HIV/AIDS 9 2,337,414,937 2.5%Malaria 11 1,968,845,930 2.1%Total GFATM diseases 25 6,719,600,568 7.3%Total MOH projects 128 92,262,041,221 Source: adapted from MOH 2003a (Table 11) It should be noted that although these 25 projects only sum to 7.2% of the (vertical) external project funding, spending is undoubtedly higher as much expenditure under the central and district baskets, and under other projects such as the Canadian (IDRC)-funded Tanzania Essential Health Interventions Project and the DFID-funded Adult Morbidity and Mortality Project are targeted at the three diseases as part of a broader intervention package. The HIV/AIDS “sectoral” database compiled by the MOF External Finance Department lists a total of fifty HIV/AIDS-related projects, funded by 16 separate partners. The majority of the projects (33) are implemented by government, with 16 through NGOs, and one through the private sector. Summary details by donor are given in Table 12 below for the coming three years. Notable is the absence of the approved GFATM funding. No attempt has been made to cross-check these against the health sector database for double-counting.

GFATM Tracking Study: Macroeconomics and sectoral background Tanzania
Final draft 31
Table 12 Projected external spending from MOF database for HIV/AIDS “sector”
2003/04 Projections
2004/05 Projections
2005/06 Projections
Axion 103,617,336 - - Belgium 817,500,000 1,420,650,000 986,618,000 Canada 307,932,367 - - IDA 48,765,000,000 27,669,000,000 27,904,117,441 Ireland 2,125,500,000 2,772,000,000 - Italy 1,796,720,030 886,782,204 513,321,328 Japan 40,240,000 37,740,000 - Netherlands 2,225,218,361 1,173,066,472 - Norway 1,272,000,000 1,592,000,000 1,992,000,000 SDC 618,750,000 618,750,000 - Sweden 3,444,747,470 4,479,762,740 4,214,534,787 UNDP 105,791,809 - - UNICEF 3,495,031,330 3,684,945,390 3,885,179,057 USAID 11,607,358,235 10,999,945,284 - WFP 628,494,748 662,646,084 662,646,084 WHO 477,312,248 - - Total 77,831,213,933 55,997,288,173 40,158,416,697 Source: MOF External Finance database Discussion with the NACP during the recent PER exercise indicated that additional funds for HIV/AIDS-related activities included money from the EU, the Italian Government through WHO, from OPEC, and from USAID. In addition, the American Centre for Disease Control is expected to contribute funding for surveillance, the Japanese provide commodities, and Belgian Government support is also expected in the future. Axion International is also involved in VCT and expanding access to drugs for antiretroviral treatment and opportunistic infections. Detailed figures for this additional support were not obtained, and it is also possible that some will be channelled through TACAIDS rather than NACP. Similar discussions with the Malaria Control Programme identified funding of almost US$12m over 2 years through the Gates Foundation which had not been included in the budget or External Finance database, together with support from various NGOs such as Medicins Sans Frontières, Care International, World Vision International and Africare. In the past half year, WHO has announced its “3 x 5 initiative”, aiming to get 3 million people on anti-retroviral treatment by 2005, and of which Tanzania is expected to be a beneficiary. Although some planning for this has begun, no figures regarding potential resources or sources were available at the time of writing (January 2004). In addition, an ambitious business plan41 to support Care and Treatment for HIV/AIDS over a five year period was prepared in September 2003 with support from the William J Clinton Foundation42 This aims to get 400,000 Tanzanians on antiretroviral treatment within a period of five years, at an estimated cost of US$539 million over the plan period, of which drugs (ARVs and for opportunistic infections) will account for 44% finalised. The Plan does not identify full funding for such activities, but is intended to serve in part as a proposal to mobilise additional funding. The absence of detailed figures on total external financing to the GFATM target diseases means that analysis of actual expenditures compared to budget is impossible, yet this would be of substantial interest in assessing absorption capacity within the specific programmes.
41 URT (2003). HIV/AIDS Care and Treatment Plan 2003 – 2008. Business plan 4.0. Developed in collaboration with the William J Clinton Foundation. Dar es Salaam: September 2003 42 Known more commonly as the Clinton Foundation.
GFATM Tracking Study: Macroeconomics and sectoral background Tanzania
Final draft 32
However, the information in Table 10 regarding the generally low disbursement and expenditure of “on-budget” foreign funds compared to government funds suggests that this is likely to be the case with individual disease programmes.
4.3.5 Health sector spending on HIV/AIDS activities The picture regarding HIV/AIDS-related activities by government MDAs is somewhat confusing, with a large number of players both within and outside the health sector. In December 2002/January 2003, a cross-sectoral Public Expenditure Review was undertaken specifically for HIV/AIDS. The main conclusions on budgets and spending are summarised in Box 5.
Box 5 Key findings of the HIV/AIDS PER for FY03
• Financing of HIV/AIDS programmes almost doubled between FY02 and FY03, and within this Government of Tanzania increased its share of total funding from 20% in FY02 to 33% in FY03;
• TACAIDS replaced the MOH as the most important government institution in HIV/AIDS financing, with an increase from 10% to 48% of total HIV/AIDS financing between FY02 and FY03, and a corresponding fall in the share of MOH spending from 69% to 35%;
• The largest contribution to increased funding was through TACAIDS, suggesting that there is still some way to go in improving the mainstreaming of HIV/AIDS planning across sectors;
• TACAIDS was able to absorb only 1% of its budget in FY02, and at the time of the PER (Jan 03) 81% of the FY03 allocation remained unspent;
• Currently, the IFMS seriously under-reports HIV/AIDS budget and expenditure – by 60% for MOH and by 41% for the Ministry of Education and Culture, thus making it difficult to measure the multi-sectoral response to HIV/AIDS.
Source: TACAIDS 2003, pp6-7 In addition, an attempt was made as part of the FY03 health sector PER to explore spending on HIV/AIDS-related activities within the health sector, both at central and local government levels, shown in Table 13 below. At the central MOH, expenditures were identified in the Detailed Cash Flow for both the Preventive and Hospital Services Departments. For Preventive Services, the data are relatively straightforward, as all activities undertaken by the National AIDS Control Programme are given a single sub-item code – 260409 HIV/AIDS epidemics. Those activities undertaken under the remit of the Hospital Services Department were identified through specific descriptions within the MTEF, and covered activities related to ensuring safe blood transfusion, Prevention of Mother to Child Transmission of HIV, technical AIDS committee meetings, development of workplace interventions, and ensuring support to a continuum of care. This undoubtedly underestimates total spending as it does not include the share of broader spending on staff, drugs, laboratory services which contribute to appropriate diagnosis and case management.

GFATM Tracking Study: Macroeconomics and sectoral background Tanzania
Final draft 33
Table 13 HIV/AIDS spending, Central MOH (TSh)
Year Dept Source BudgetFunds
ReleasedTotal
ExpenditureGovt 1,511,962,600 1,511,962,600 1,511,962,600
Preventive Basket 15,000,000 15,000,000 15,000,000 FY02 Total 1,526,962,600 1,526,962,600 1,526,962,600
GovtCurative Basket
TotalGovt 1,567,676,000 898,313,412 674,431,740
Preventive Basket 401,914,000 126,418,000 0FY03* Total 1,969,590,000 1,024,731,412 674,431,740
Govt 0 0 0Curative Basket 1,992,955,000 723,726,000 490,845,000
Total 1,992,955,000 723,726,000 490,845,000 Source: MOH 2003a, Table 9 Note: Data for FY03 reflect the first six months to end December 2002 only. Curative data for FY02 were not calculated during the PER as the detailed MTEF had not been available. However, they are likely to have been both positive and under-estimated, as with FY03. As one of its objectives for the health sector, the PRS indicates that 75% of councils should have developed an HIV/AIDS strategy by 2003. Analysis of local government budgets for FY02 and FY03 indicates that all districts had included spending under a new item code – 1716 HIV/AIDS plans – although there appeared to be no relation between the size of the LGA and the proposed budget. Table 14 shows the total budget for item 1716 in relation to the total Other Charges budget for the health sector. Table 14 HIV/AIDS spending, Local Government Authorities (TSh)
1716 Health OC %FY02 150,791,200 11,749,499,000 1.28%FY03 297,447,700 13,739,092,700 2.16% Source: MOH 2003a, Table 10 Although planned spending at this level is very low, at only 2.2% of the Health OC total, it has at least shown an increase of 68% between FY02 and FY03. Also, as with all spending at the local government level, the OC figure substantially understates the available resources for the sector as drugs and supplies for HIV/AIDS-related activities (particularly for curative services) are largely purchased centrally, either through domestic, basket or project funding.
5 GFATM and specific issues for the tracking study To date, Tanzania mainland has submitted three applications to GFATM, two in Round 1 and one in Round 2. Of these, the Round 1 proposals have now both been approved, while the Round 2 proposal was rejected with classification (3), ie not recommended in its current form but strongly encouraged to resubmit. Details are given in Table 15 below.

GFATM Tracking Study: Macroeconomics and sectoral background Tanzania
Final draft 34
Table 15 Tanzania mainland GFATM proposals
Round 1 Year 1 Total approved
National insecticide treated nets implementation plan (NATNETS) support
$3,258,820 $19,827,716
Scaling up effective district HIV/AIDS response focusing on communities, primary schools and the informal sector in Tanzania
$5,400,000 $5,400,00
Round 2 Scaling up access to quality VCT as an entry point to comprehensive care and support services for TB and HIV/AIDS in Tanzania through coordinated multi-sectoral partnership
Rejected (3)
Round 3 Scaling up access to quality VCT as an entry point to comprehensive care and support services for TB and HIV/AIDS in Tanzania through a coordinated multi-sectoral partnership
$10,932,000 $87,887,000
Source: ?? <<malaria figures don’t tally with actual proposal>> The future inflows through GFATM are likely to have implications for both the sector, and the broader move towards implementation of the PRSP through agreed sector strategies, and these are outlined below.
5.1 Broad macroeconomic issues arising Concern was expressed in a recent presentation to the PER Consultative Meeting regarding the “dependence of the budget on foreign grants and loans”43 of which the GFATM funding is clearly an example. This appears to be due to concerns about future sustainability of the spending related to the government’s ability to finance the budget (but may also be related to domestic policy sovereignty issues). However, the current response of the Government of Tanzania appears to be to renew its efforts to increase domestic revenues as a share of GDP, with the document referring to a target of 13% for FY04 compared with earlier targets of 12.4% by FY05, rather than to restrict the inflow of external funding44. The schedule for disbursement of the approved funds cannot be directly related to Tanzanian financial years, but would appear to be roughly as shown in Table 16 below, based on information from the proposals and the GFATM website regarding the breakdown between Year 1, Year 3 and total approved sums, and given that an initial disbursement for malaria was made in February 2003. Table 16 Possible disbursement of GFATM monies (US$)
Financial year HIV/AIDS Malaria 2002/03 - 489,4782003/04 5,400,000 2,769,3422004/05 ? 8,700,2562005/06 ? 7,868,640
This results in roughly similar sums of around US$8m in each of the three years of the current MTEF period, or an increase of approximately TSh8-9bn per year. This represents an increase of around 1.2% in total projected revenue from project loans and grants in FY04 to FY0645. Given past under-performance of external funding, this is unlikely to create a
43 Ministry of Finance (2003), p13 44 as has been seen in Uganda where foreign inflows have been “neutralized “ through addition to reserves rather than being used to increase priority expenditures (see companion Uganda report for references). 45 Based on the figure of TSh 667.3bn given in MOF (2003x) – Cross-sector MTEF, Table 3, p11.
GFATM Tracking Study: Macroeconomics and sectoral background Tanzania
Final draft 35
major problem in terms of the effective size of the resource envelope available to the Government. However, it could have a substantial impact on the allocation of project funding between sectors. In addition, the picture might be expected to change if the re-submitted third round proposal is approved and rapid disbursement of funding, in the region of US$85m over five years, takes place. Unfortunately, Tanzania-specific information on the overall assessment of fiscal risk due to increased aid flows is not yet available. Comment in a draft PER document from May 2002 indicated that the second half of the 1990s had seen an appreciation in the real exchange rate in Tanzania which might be due to increasing aid flows, and which might represent a movement towards a new equilibrium, but concluded that a more detailed analysis was required to explore possible policy responses in full46. It is not possible to obtain a clear breakdown from either GFATM proposal on the extent to which proposed funding is to be spent on tradable versus non-tradable inputs. However, the nature of the proposals themselves suggests that the majority of funding will be spent in country on non-tradables, and thus liable to contribute to any Dutch disease effect. However, as the majority of approved funding to date is for vouchers to enable target beneficiaries to purchase locally manufactured bednets, there is likely to be a positive impact on private sector activity, contributing to overall GDP growth. The extent to which this will outweigh any negative impact cannot be predicted. In late 2002, concern expressed by the MOF regarding the parallel nature of the GFATM planning and funding mechanisms resulted in delays to the approval process: “We are concerned that the mechanisms of aid delivery proposed by the Global Fund against AIDS, Tuberculosis and Malaria has the potential of undermining government accountability and negate all efforts made so far to improve development partnership and aid effectiveness. …Funds for initiatives to tackle the scourge of AIDS, Tuberculosis and Malaria are urgently needed in Tanzania. However, for these funds to be effective on the ground to bring about real results for the people most in need and in order to the Government of Tanzania to be held accountable for the proper use of these funds, they should be delivered in a manner which supports national public financial management systems and comply with internationally recognized best practices with regard to aid coordination.”47. The extent to which the agreed channels of funding can be harmonised with the systems under development remains to be seen, and will be an area for tracking during the remainder of the study. However, the continued rolling out of a standard financial coding system and the IFMS and Platinum accounting software to implementing MDAs suggests that even if some aspects of the process remain parallel, it should be possible to track and incorporate expenditures using GFATM funding in analyses of sectoral expenditure, with the possible exception of those channelled through PORALG to local governments where the rollout of such systems is somewhat behind.
5.2 Sectoral issues arising
5.2.1 General The discussion regarding incorporation of project funding into sectoral ceilings has not yet reached firm conclusions in Tanzania, and it will remain to be seen to what extent future inflows of GFATM funding might affect allocations to the health sector.
46 PER Working Group (2003), p 18 47 MOF (2002). Brief note on funding mechanism (with reference to the Global Fund against AIDS, Tuberculosis and Malaria). Dar es Salaam: December 2002
GFATM Tracking Study: Macroeconomics and sectoral background Tanzania
Final draft 36
Absorption capacity in the health sector is generally good and improving, at least with respect to central level budgetary resources. The draft FY03 PER update indicated that recurrent expenditure by the central MOH reached 98% of the budgeted amount for government funding and 86% for basket funding in FY02, the latter representing an improvement from 6% in FY00 and 47% in FY01. The picture regarding project funding and health spending from all sources at the local government level is not clear due to lack of comprehensive data. Improvements in the External Finance database are constantly improving upon budgetary data, but it is not clear how quickly the corresponding expenditure data will become available for comparison. The picture with regards to absorption capacity in HIV/AIDS specifically is improving, particularly through TACAIDS which is increasingly taking responsibility for funding and oversight of HIV/AIDS-related activities. For FY02, as shown in Box 5 above, TACAIDS was able to use only 1% of its budgeted funding, with problems attributed to the fledgling status of the agency. However, the recent cross-sectoral PER update indicated that “..TACAIDS disbursed its budget in full in 2002-3 and was responsible for the leap in Government spending from TSh2.3bn to over TSh 7bn”. (TACAIDS 2003b, p15). The MTEF already improves upon Treasury information in terms of capturing some external funding. GFATM funding is included for malaria within the MOH MTEF, but it has not been possible to determine whether the HIV/AIDS funding is included in the TACAIDS or PORALG MTEFs (if indeed they exist). Further work is required to ensure that expenditure as well as budgeted figures are included in the relevant sectoral financial reports. The extent to which GFATM funding will be additional to planned spending in target sectors can only be guessed at, given constant changes in projected external funding, institutional changes such as the establishment of TACAIDS, and weaknesses in local government financial reporting. The inconsistency of GOT financial reporting of PRS priority sectors and activities in recent years also makes time-series comparisons of budgets and actual spending difficult, although it is expected that the picture will become clearer over time.
5.2.2 HIV/AIDS The successful GFATM HIV/AIDS proposal is relatively small at US$5.4m and for one year only. It has three components, is highly multi-sectoral, and involves substantial non-governmental implementation. As such it is difficult to identify where current spending on the various components appears within GOT budget documentation, and thus what the impact might be on sectoral spending. Implementation of the existing District Response Initiative is through LGAs, and therefore under the remit of PORALG. Other funding is expected to be channelled through TACAIDS (personal communication, Mary). The three components are:
• Consolidation and scaling up of District Response Initiative activities in all wards and villages of the 12 districts initially involved in the Initiative;
• School-based interventions in the 12 districts; • Support to an existing informal sector mutual scheme in urban and peri-urban areas.
The proposal begs the question of where the resources will come from for extending these activities to the remaining 112 districts of mainland Tanzania and Zanzibar, on the assumption that they have been agreed as part of the overall Multi-sectoral HIV/AIDS strategy. In the case of the informal sector mutual scheme, it would be useful to know where future funding will be sourced, given that part of the support is for the provision of commodities.

GFATM Tracking Study: Macroeconomics and sectoral background Tanzania
Final draft 37
To the extent that implementation will involve TACAIDS, there may be concerns regarding absorption capacity given the very low demonstrated expenditures relative to potential budget in the past. However, the extensive partner involvement may well assist here, and as TACAIDS becomes a more established entity, its capacity is expected to improve. In sum, far greater concerns are likely to be raised by other new potential resource inflows for HIV/AIDS, eg future successful proposals, or the Clinton Foundation for which figures of $200-400m over a number of years have been mentioned anecdotally. If the resubmitted HIV/TB proposal is approved in the third round, there will be additional issues to follow-up, dependent on the extent to which funding is channelled through the MOH or through TACAIDS, and to which it is captured within sectoral estimates. In addition, the decision to target only 45 districts for scaling up of proposed interventions again begs the question of how reaching national targets will be achieved in the absence of clearly identifiable other sources of funding.
5.2.3 Malaria The planning and implementation of the successful malaria GFATM proposal are unlikely to cause major problems for the programme, as the bednet strategy was more or less prepared as part of the overall medium term strategy, and merely lifted out for funding by GFATM. The funding was included within the programme MTEF for FY03, and $12,277,700 is included within the MTEF for FY04, under the Department of Preventive Services, for an activity to “(F)acilitate promotion of Integrated Treated Nets (ITNs) through communication, research, targeted subsidy, social marketing, direct cost and provision of equipment to all Councils by 2006” (MOH 2003x). However, it does not yet appear in the Ministry of Finance database on external financing. The proposal itself is very clear in terms of its targeting of vulnerable groups – ie pregnant women and infants – and in scaling up use of insecticide-treated nets throughout the country, thus improving access to a cost-effective intervention in poorer areas, and is thus consistent with both national health sector policies and the broader policies as articulated in the PRSP. Through its impact on the incidence of malaria, the successful implementation of the GFATM-funded component might be expected to have a direct impact on two health sector performance indicators - % of under-five outpatient attendances due to malaria, % of all under–five case fatality due to malaria - and a more indirect impact on indicators related to infant and child malnutrition. It should also contribute to the broad PRSP survival indicators of infant, child and potentially maternal mortality. It will not address the specific PRS indicator related to malaria case-fatality which is covered by another programme strategy. The failure to break down the GFATM contribution in the MTEF by type of input, instead labelling the entire contribution as “261103 consultancy fees”, is probably due to the lack of an appropriate item code for subsidies through vouchers which account for most of the GFATM funding. Vouchers will be used to purchase nets available through existing retail channels, the majority of which, if not all, will be locally manufactured. There is therefore very little within the GFATM proposal which could be considered “tradable”./non-tradable component of the proposal will not be possible, unless a different accounts system is used by the Malaria Programme or the Local Fund Agent. In the absence of further discussion regarding appropriate relative allocations between priority diseases or interventions, the addition of GFATM funding is likely to substantially alter the balance of funding between priority programmes, but it is difficult to conclude whether this might be problematic in the absence of a more comprehensive cost-effectiveness analysis across the sector.

GFATM Tracking Study: Macroeconomics and sectoral background Tanzania
Final draft 38
References: Bird A (2002). Design and implementation features of Medium-Term Expenditure
Frameworks and their links to poverty reduction: Tanzania country study. Part of a multi-country study by the Overseas Development Institute on “Experience in implementing MTEFs in a PRSP context”, funding by DFID (UK) and the EC. Mokoro Ltd. Oxford: October 2002
Boex J and Rutasitara L (2002). Inception Report: Developing a system of intergovernmental
grants in Tanzania. September 14, 2002. Fiscal Decentralization Task Force: Progress report. (A brief prepared for the PER Working
Group meeting of 8th October 2002). Georgia State University (2002). Developing a system of intergovernmental grants in
Tanzania. Report prepared for the Local Government Reform Programme. November 2002
IMF/IDA (2002). Informal comments on zero draft Tanzanian PRS Progress Report (October
31, 2002). ???. PRSP Monitoring and Synthesis Project. Briefing Note 4. May 2002 Ministry of Finance (2003). Cross-sector MTEF 2003/04 – 2005/06. Paper presented to the
Public Expenditure Review Consultative Meeting, Karimjee Hall, Dar es Salaam,. 13 May 2003.
MOH (2001). Public Expenditure Review: Health Sector in Tanzania. Draft report February
2001. MOH (2002a). Public Health Sector Performance Profile 2001. Draft. January 2002 MOH (2002b). Public Expenditure Review Health Sector Update for 2002. Final report. May
2002 MOH (2003a). Health Sector PER Update FY2003. First Draft Report. February 2003 MOH (2003b). Second Health Sector Strategic Plan (HSSP): July 2003 – June 2006. Final
draft. Dar es Salaam: April 2003 MOH (2003c). Medium Term Expenditure Framework 2003/2004 – 2005/2006. Volume I. Dar
es Salaam: July 2003 Naschold F and Fozzard A (2002). How, when and why does poverty get budget priority:
poverty reduction strategy and public expenditure in Tanzania. Working Paper 163. Overseas Development Institute. London: April 2002
NGO Policy Forum (2002). NGO statements: Consultative Group meeting, Dar es Salaam
December 2 – 5, 2002. PER Working Group (2003). External evaluation: Review of fiscal developments and budget
management issues FY02 – FY03. Paper presented to Public Expenditure Review FY03 Consultative Meeting. Karimjee Hall, Dar es Salaam. 13 May 2003.
GFATM Tracking Study: Macroeconomics and sectoral background Tanzania
Final draft 39
PO-PP (2003). Recent macroeconomic performance. Paper prepared by the President’s Office - Planning and Privatisation, and presented at the Public Expenditure Review FY03 National Consultative Meeting, Dar es Salaam, 13 May 2003
REPOA and ESRF (2001). Pro poor expenditure tracking. Draft report submitted to the PER
Working Group. March 2001 Ronsholt F (2002). Analysis of government expenditure allocations to priorities of the Poverty
Reduction Strategy in Tanzania 2002. Prepared for the Government of the United Republic of Tanzania, Ministry of Finance and the European Commission. 17th September 2002.
TACAIDS (2003). Public Expenditure Review: HIV/AIDS multisectoral update for 2003. Final
draft. Dar es Salaam: 20 February 2003. TACAIDS (2003b). Public Expenditure Review: HIV/AIDS multi-sectoral update for 2003. 2nd
draft. Dar es Salaam: November 2003 URT (2000a). Tanzania Assistance Strategy. May 2000 URT (2000b). Poverty Reduction Strategy Paper (PRSP). October 2000 URT (2001). Poverty Reduction Strategy Paper: Progress report 2000/01. Dar es Salaam: 14
August 2001 URT (2002a). Public Expenditure Review for FY02: Recent macroeconomic developments.
Paper presented to the National Consultative Meeting, Karimjee Hall, Dar es Salaam, 9th – 10th May 2002
URT (2002b). Public Expenditure Review FY02. Review of fiscal performance FY01-FY02:
an external evaluation. Paper presented to the National Consultative Meeting, Karimjee Hall, Dar es Salaam, 9th – 10th May 2002
URT (2002c). Poverty Reduction Strategy: Draft progress report 2001/02. Draft of 23
November 2002. Dar es Salaam URT (2002d). Guidelines for the preparation of medium term plan and budget framework for
2003/04 – 2005/06. Draft. Issued by President’s Office – Planning and Privatisation and Ministry of Finance. Dar es Salaam: December 2002
URT (2002e). Poverty and Human Development Report. URT (200x). Tanzanian 2000/01 Household Budget Survey. Electronic version. URT/budget support donors (2002). Poverty Reduction Budget Support: Annual review Dec
2002 World Bank (2003). Public Expenditure Review – Tanzania mission. Draft Aide Memoire.
February 2003.

GFATM Tracking Study: Macroeconomics and sectoral background Tanzania
Final draft 40
6 Annexes Annex A Terms of Reference for Macro-economic Desk Study
General objectives:
• To summarise the macroeconomic and sectoral context (policy and performance) for each of the four countries
• To flag issues of concern relating to macroeconomics and financing for subsequent tracking during the country studies (both general and, where appropriate, country-specific), and to propose means of addressing these
Specific objectives: a) To present general macroeconomic issues, as follows:
• To describe country Medium Term Expenditure Frameworks (MTEF), annual budget structures and the pattern of inter-sectoral allocations, in relation to stated country priorities.
• To synthesise available literature on the impact of aid on macroeconomic variables and performance, and to consider the level and planned use of GFATM inflows at the country level in relation to this information
• To review available information on country aid inflows in relation to the breakdown between general and sector budget support and project support, their inclusion within MTEF ceilings; and the level, time-scales and modalities of donor commitments to ongoing funding
b) To present health sector issues, as follows:
• To describe sectoral MTEF and annual budget allocations (to health and other HIV/AIDS activities), and to report recent budgetary performance, comparing planned and actual spending (from MTEF, Public Expenditure Reviews, sectoral budgets, National Health Accounts, etc)
• To summarise current country health policy priorities (particularly relating to HIV/AIDS, TB and malaria) – as reflected in written policy and strategy statements, and budgetary allocations, comparing these with plans and proposed use of GFATM funds
• To summarise current financial management (planning, budgeting, procurement, disbursement, accounting and reporting processes) in each country, in relation to SWAp development and the adoption of common (government) procedures
• To use this information as a baseline for future tracking of the extent to which GFATM processes are integrated with or set up in parallel to existing procedures
• To summarise trends in health sector financing by type: domestic/external, by level of care, across diseases/programmes (where available)
• Where information exists, to review country and sector performance in relation to evidence of absorption capacity (percentage of money released that was spent)
• To analyse existing GFATM proposals in terms of type of support (eg commodity versus systems strengthening; disease specific versus general), and allocations by level of care (e.g. tertiary versus primary or community level interventions)
c) To propose areas for future tracking, e.g.
• Balance of commodity support versus systems strengthening support

GFATM Tracking Study: Macroeconomics and sectoral background Tanzania
Final draft 41
• Extent to which GFATM funding is in fact additional or has substituted for other sources of funding (at the country level, and/or by individual development partners)
• Shifts in the modalities of donor support (between budget, sector, project and GFATM support)
• Degree of integration and/or duplication of new with existing financial management and reporting systems
• GFATM funding as % of total sectoral funding (and implications for financial sustainability) o Generally, and for specific high value commodities such as ARVs
• Extent to which GFATM funding alters the intra-sectoral allocation of resources by: o level of care o geographical area (urban/rural, or more detailed) o disease/programme o type of input o general systems strengthening versus disease-specific activities
Methodology:
• Participation in meetings of tracking study team: o planning of phase 1 field work, January 2003 o review of findings and planning of next phase of field work, mid 2003
• Desk review of general and available country-specific literature (to be provided, or access
to it to be facilitated, by the funders). It should include: o General documentation on macroeconomic implications of aid – general and, if
possible, sector specific o MTEF documentation, with external audit reports, where available o Indicative (e.g. 1 and 3 year) health sector basket funding commitments by
partners – pooling donors and government o Overall general and health sector/HIV-AIDS budgets o Breakdown, where available, of non-pooled (e.g. project) support from major
donors to health / HIV/AIDS activities o Existing and indicative future levels of commitment by donors to general budget
support o GFATM applications (successful ones for each country, or most recent
applications if approval still pending) o Key development agency policy documents (general, HIV/AIDS, health, country) o National Health Accounts reports o Public Expenditure Review reports o Sectoral policy documents o Current country HIV/AIDS, malaria and TB policies and strategies, where these
priorities have been included in GFATM applications o Country Financial Accountability Assessments (where available) o Available audit reports
Outputs: Four country-specific reports, including recommendations for issues to be raised and data to be collected in the tracking study field work.

GFATM Tracking Study: Macroeconomics and sectoral background Tanzania
Final draft 42
Annex B Local Government Authorities by phase of reform Council Region Phase 1 Phase 2 Phase 3
Arusha Arusha MC Monduli
Arumeru
Karatu Ngorongoro
Coast Kisarawe
Bagamoyo Kibaha MC Kibaha DC
Rufiji
Mafia Mkuranga
Dodoma Dodoma MC Kondoa Mpwapwa
Dodoma
Kongwa
Iringa Iringa MC Iringa DC
Makete Mufindi
Ludewa Njombe
Kigoma Kasulu Kibondo Kigoma MC
Kigoma DC
Kilimanjaro Hai Moshi MC
Rombo Same
Moshi DC Mwanga
Lindi Kilwa Lindi MC
Kindi DC Nachingwea Rwangwa
Liwale
Mara Musoma MC Bunda Serengeti
Musoma DC Tarime
Mbeya Mbeya MC Rungwe
Kyela Mbeya DC
Mbozi
Chunya Ileje
Mbarali Morogoro Morogoro MC
Ulanga Kilosa
Morogoro DC Kilombero
Mtwara Masasi Mtwara MC
Mtwara DC Newala
Tandahimba
Mwanza Magu Mwanza MC
Geita Kwimba
Sengerema
Misungwi Ukerewe
Ruvuma Songea DC Songea MC Tunduru
Mbinga
Shinyanga Shinyanga DC Shinyanga MC
Kahama Maswa Meatu
Bariadi Bukombe
Singida Singida DC Manyoni Singida MC
Iramba
Tabora Tabora MC Igunga Tabora DC
Nzega Sikonge Urambo
Tanga Tanga MC Handeni Lushoto Muheza
Korogwe Pangani
Kagera Bukoba DC Bukoba MC Muleba Ngara
Biharamulo Karagwe
Dar es Salaam Ilala MC Kinondoni MC Temeke MC
Rukwa Sumbwanga DC Mpanda Sumbwanga
MC
Nkasi
Manyara Babati Hanang Kiteto
Simanjiro
Mbulu
Notes: MC = municipal council (urban); DC = district council (rural). Where neither is indicated, the council is rural/district

GFATM Tracking Study: Macroeconomics and sectoral background Tanzania
Final draft 43
Annex C Tanzania MTEF and budget calendar
Taken from Bird A, Design and implementation features of Medium-Term Expenditure Frameworks and their links to poverty reduction: Tanzania case study. Mokoro Ltd. Oxford: October 2002
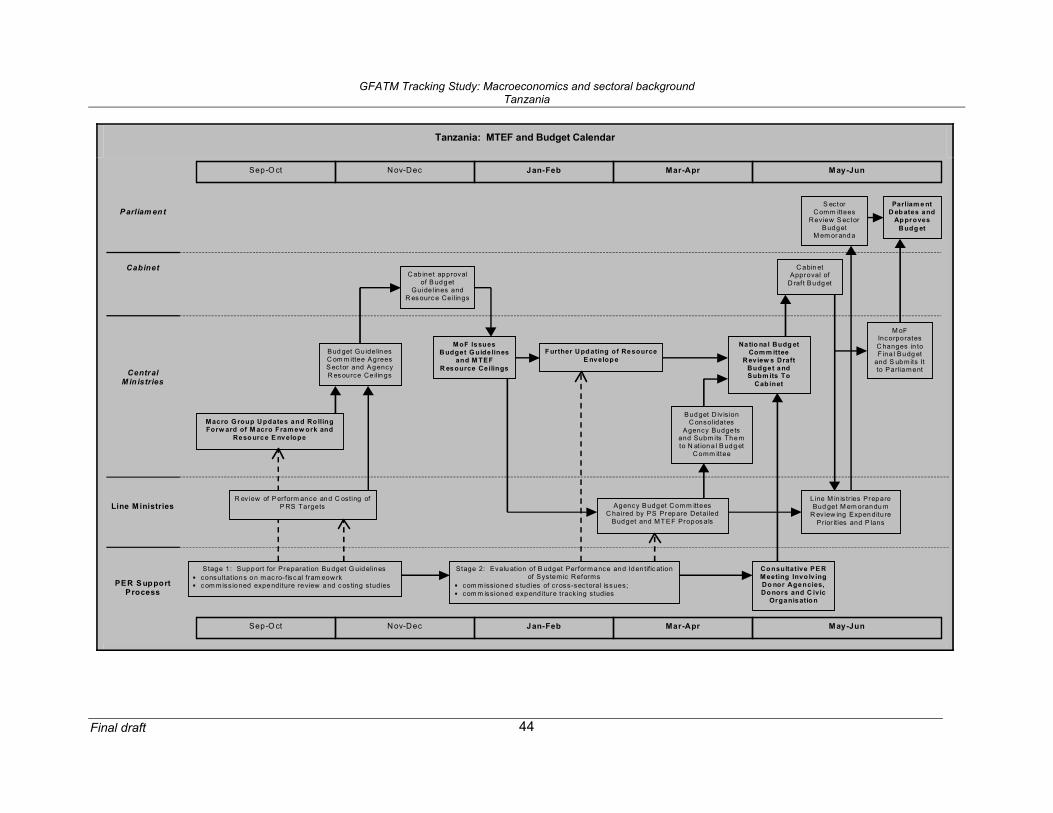
GFATM Tracking Study: Macroeconomics and sectoral background Tanzania
Final draft 44
Tanzania: MTEF and Budget Calendar
Parliam ent
Cabinet
CentralM in istries
Line M inistries
MoF IssuesB udget G uide lines
and M TEFR esource Ce ilings
May-JunJan-FebSep-O ct
Macro G roup U pdates and Ro llingForw ard of M acro Fram ew ork and
Reso urce E nvelope
PER S upportProcess
R ev iew of P erform ance and C osting ofP RS Targets
C ab inet approvalof B udget
Guidelines andR es ourc e Ce ilings
C abin etApproval of
D raf t Budg et
May-Jun
Agency Budget C omm itteesC haired by PS Pr epare Detailed
Budget and MT EF Propos als
Line M in is tr ies PrepareBud get M em orandu m
R eview ing Expen ditu rePrior ities and P lans
M oFIncorporatesC hanges in toF ina l Budg et
and S ubmits Itto Parliament
Parliam e ntD eb ates and
Ap provesB udg et
Budget D iv isionC onsolidates
Agency Budgetsand Subm its Themto N at iona l B udg et
C omm ittee
Stage 1: Support for Preparat ion Bu dget G uidelines consultat ions on m ac ro-f isc al fram eow rk c om miss ioned expe nditure review and c os ting studies
Na tio na l Budg etCom m ittee
R ev iew s DraftBudget andSubm its To
Cab inet
Bud get Gu idelin esC om m ittee AgreesS ector and AgencyR es ource Ce ilin gs
S ectorC omm ittees
Review S ectorBudget
M em or and a
Co nsultative PE RMeeting Invo lv ingDo nor Agencies,Do nors and C ivic
Organisatio n
Stage 2: Evalu ation of B udget Performance and Iden tific ationof Systemic Reforms
com m issioned s tudies of c ross-sec tora l issues; com m issioned expend iture track ing studies
Mar-Apr
F urther U pd ating of Re sourceE nvelop e
Nov-Dec
Mar-AprJan-FebNov-DecSep-O ct
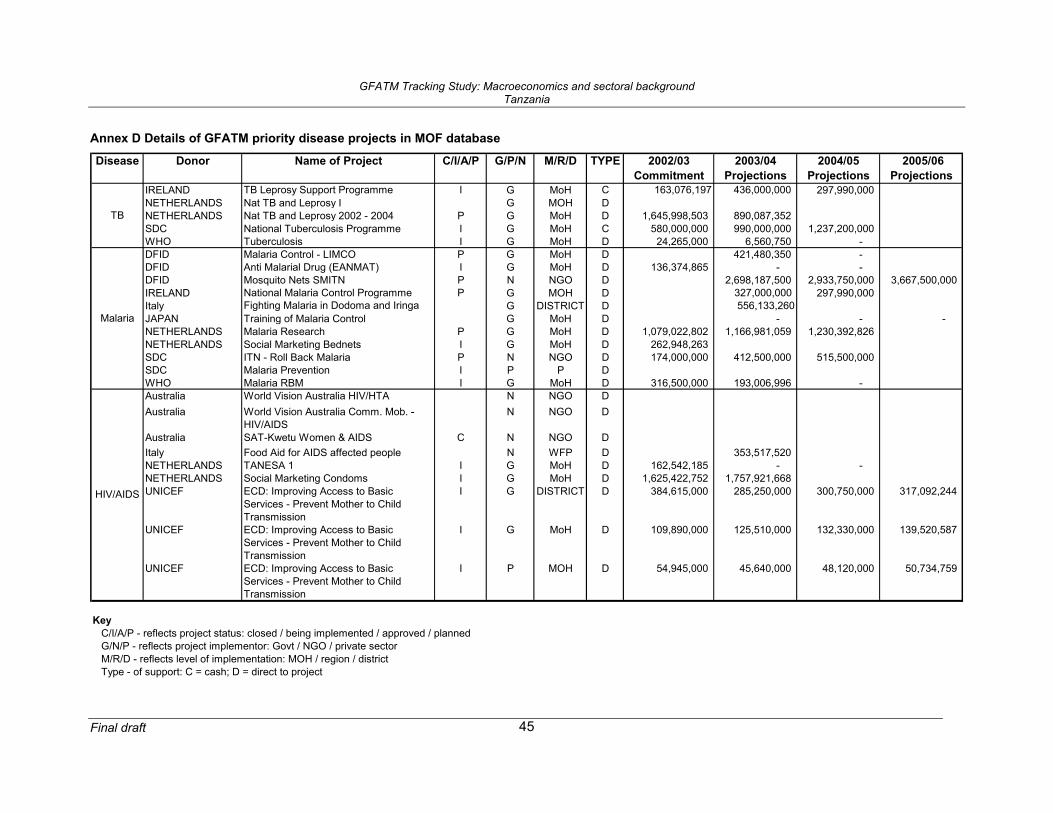
GFATM Tracking Study: Macroeconomics and sectoral background Tanzania
Final draft 45
Annex D Details of GFATM priority disease projects in MOF database
Disease Donor Name of Project C/I/A/P G/P/N M/R/D TYPE 2002/03 Commitment
2003/04 Projections
2004/05 Projections
2005/06 Projections
IRELAND TB Leprosy Support Programme I G MoH C 163,076,197 436,000,000 297,990,000 NETHERLANDS Nat TB and Leprosy I G MOH DNETHERLANDS Nat TB and Leprosy 2002 - 2004 P G MoH D 1,645,998,503 890,087,352 SDC National Tuberculosis Programme I G MoH C 580,000,000 990,000,000 1,237,200,000 WHO Tuberculosis I G MoH D 24,265,000 6,560,750 - DFID Malaria Control - LIMCO P G MoH D 421,480,350 - DFID Anti Malarial Drug (EANMAT) I G MoH D 136,374,865 - - DFID Mosquito Nets SMITN P N NGO D 2,698,187,500 2,933,750,000 3,667,500,000 IRELAND National Malaria Control Programme P G MOH D 327,000,000 297,990,000 Italy Fighting Malaria in Dodoma and Iringa G DISTRICT D 556,133,260JAPAN Training of Malaria Control G MoH D - - - NETHERLANDS Malaria Research P G MoH D 1,079,022,802 1,166,981,059 1,230,392,826 NETHERLANDS Social Marketing Bednets I G MoH D 262,948,263 SDC ITN - Roll Back Malaria P N NGO D 174,000,000 412,500,000 515,500,000 SDC Malaria Prevention I P P DWHO Malaria RBM I G MoH D 316,500,000 193,006,996 - Australia World Vision Australia HIV/HTA N NGO DAustralia World Vision Australia Comm. Mob. -
HIV/AIDSN NGO D
Australia SAT-Kwetu Women & AIDS C N NGO DItaly Food Aid for AIDS affected people N WFP D 353,517,520 NETHERLANDS TANESA 1 I G MoH D 162,542,185 - - NETHERLANDS Social Marketing Condoms I G MoH D 1,625,422,752 1,757,921,668 UNICEF ECD: Improving Access to Basic
Services - Prevent Mother to Child Transmission
I G DISTRICT D 384,615,000 285,250,000 300,750,000 317,092,244
UNICEF ECD: Improving Access to Basic Services - Prevent Mother to Child Transmission
I G MoH D 109,890,000 125,510,000 132,330,000 139,520,587
UNICEF ECD: Improving Access to Basic Services - Prevent Mother to Child Transmission
I P MOH D 54,945,000 45,640,000 48,120,000 50,734,759
KeyC/I/A/P - reflects project status: closed / being implemented / approved / plannedG/N/P - reflects project implementor: Govt / NGO / private sectorM/R/D - reflects level of implementation: MOH / region / districtType - of support: C = cash; D = direct to project
TB
Malaria
HIV/AIDS

GFATM Tracking Study: Macroeconomics and sectoral background Tanzania
Final draft 46