STUDENT READING FOR INTRODUCTORY MACROECONOMICS
39
MACROECONOMICS AND THE ENVIRONMENT STUDENT READING FOR INTRODUCTORY MACROECONOMICS by Jonathan M. Harris and Anne-Marie Codur Copyright © 1998 Global Development and Environment Institute (G-DAE) Tufts University, Medford MA 02155. http://www.tufts.edu/gdae
Transcript of STUDENT READING FOR INTRODUCTORY MACROECONOMICS

MACROECONOMICS AND THE ENVIRONMENT
STUDENT READING FOR INTRODUCTORY MACROECONOMICS
by
Jonathan M. Harris and Anne-Marie Codur
Copyright © 1998 Global Development and Environment Institute (G-DAE) Tufts University, Medford MA 02155.
http://www.tufts.edu/gdae

Copyright release is hereby granted through August 31, 2003 for instructors to copy this module for instructional purposes.
Students may also download the student reading packet directly from http://ase.tufts.edu/gdae
Comments and feedback from course use are welcomed. E-mail: [email protected].
Revisions and updates will be available at http://ase.tufts.edu/gdae.

i
MACROECONOMICS AND THE ENVIRONMENT: OUTLINE 1- THE CIRCULAR FLOW MODEL AND THE BIOSPHERE 1-1: The economic system and the environment 1 ** Natural inputs to the economic process: resources, energy. ** Outputs of pollution and waste. ** The concept of natural capital. 1-2: Linking the economic sphere and the biosphere 2 ** A more complete circular flow model. ** Solar energy and materials recycling. ** The concept of ecosystem limits. 2- REDEFINING NATIONAL INCOME AND WEALTH 2-1: Limitations of GNP/GDP 5 ** Monetary and non-monetary sectors. ** Natural resources and environmental services. ** Human/social dimensions of well-being (health, education, social capital). ** "Defensive" expenditures. ** Depreciation of natural capital. 2-2: Alternatives to GDP and NDP 9 ** Adjusting for natural resource depreciation. ** Satellite accounts -- U.N. system and national accounts. ** Index of Sustainable Economic Welfare (ISEW).

ii
3- LONG-TERM GROWTH AND SUSTAINABLE DEVELOPMENT 3-1: Ecosystem Limits 16 ** Ecosystem limits and "carrying capacity". ** The "cowboy" economy and the "spaceship" economy. ** Growth of the economic system relative to the biosphere. 3-2: The Growth of Economic activity 20 ** Population growth and economic growth. ** The environmental impact of different consumption levels. ** The IPAT equation. 3-3: From Growth to Sustainable Development 24 ** Elements of human development. ** The ends-means spectrum: -- ultimate ends versus intermediate ends. ** Defining sustainable development. ** Ecological irreversibility and the precautionary principle. ** Policies for sustainable development. 4- KEY CONCEPTS 29 5- REFERENCES AND ADDITIONAL READINGS 30 6- DISCUSSION QUESTIONS 32 7- PROBLEMS 33

1
1 -- THE CIRCULAR FLOW MODEL AND THE BIOSPHERE 1-1: The Economic System and the Environment A basic building block of economic theory is the standard "circular flow" model of an economic system. This model shows the exchange of goods, services, and factors of production between two types of economic actors, Consumers (households) and Producers (firms). However, the environment and the natural resources that make economic production possible do not appear in the usual version of this model.
Figure 1: The Standard Circular Flow Model
When a good or service is purchased, two kinds of flow occur: the good moves from the firm to the household and a corresponding payment moves from the household to the firm. Similarly, when firms purchase factors of production, a payment of money for the use of these factors accompanies the flow of factor services from households to firms. These transactions are symbolized on the graph above by a double arrow showing two flows. We distinguish between the two kinds of flows, real economic flows and the monetary flows that are their counterpart. The former are called "real" as they correspond to transfers of tangible things: goods and services flowing from firms to households; factors of production flowing from households to firms. Can we locate the environment or natural resources in this picture? Certainly natural resources are essential to production: agriculture requires productive soils, industry requires fuels, water, and minerals. Consumers need drinking water, and many environmental resources, such as beaches and woodland, are in high demand. How is all this reflected in the circular flow? Factors of production, which are also called inputs for the production process, have traditionally been divided into three categories: Land, Labor, and Capital.
householdsfirms
factors of production: land, labor, capital
output: goods & services
$
$
real flows
monetary flows
counterpart of real flows
2
"Land" is the term which is used by economists to represent all natural resources used in economic production, including soils, water, forests, species, minerals, fossil fuels, and other such resources. The first thinkers who studied economic mechanisms during the eighteenth and nineteenth centuries recognized the importance of land in the production process, and emphasized the existence of natural constraints on economic growth. These theorists included the Physiocrats such as Quesnay, who developed the first circular flow approach in 1758, and the Classical Economists of the late eighteenth and nineteenth centuries, including Adam Smith and David Ricardo. Later, in the second half of the 19th century, economists focused increasingly on the two other factors of production, capital and labor, which were essential in the growth of the industrial sector, as rapid industrialization became the major economic phenomenon of these times. The eclipse of natural resources in economic thought lasted more than a century. Only recently, with the increasing urgency of environmental and resource problems at local, national, and global levels, have economists once again focused on the issues of natural resource constraints and the issue of what has come to be called natural capital. Natural capital includes all natural resources as well as the environment. It is essentially an updated interpretation of the classical economic concept of "land". Using the term "natural capital" emphasizes the importance of these natural factors to the production process. It also indicates that what we ordinarily call "capital" is really manufactured capital. Both types of capital are essential to the productive process, and both contribute to society's wealth. 1-2: Linking the Economic Sphere and the Biosphere Returning to the circular flow, let's consider whether the simple diagram deals adequately with natural capital. Economic models of the circular flow are usually presented as totally self-contained. But who or what ultimately provides households with the factors of production which will become inputs for the production sphere? It is fairly clear that labor and manufactured capital are regenerated through the circular flow -- the provision of food and other necessities makes more labor possible, and investment builds up manufactured capital over time. But what about the first factor of production, natural resources? Obviously, households and firms do not "create" energy, minerals, soils, water, forests, species, and all the diverse elements that form the broad category of natural capital. They may "own" them - if the legal system adequately defines private property rights to these different resources -- but they cannot generate them, or replace them if they are used up. The "hidden" provider of these amenities, whether you call it Nature, Planet Earth or the Biosphere, needs to be reintroduced in the picture as a major actor -- or perhaps better as the stage -- without whom the whole economic "show" could not take place.
3
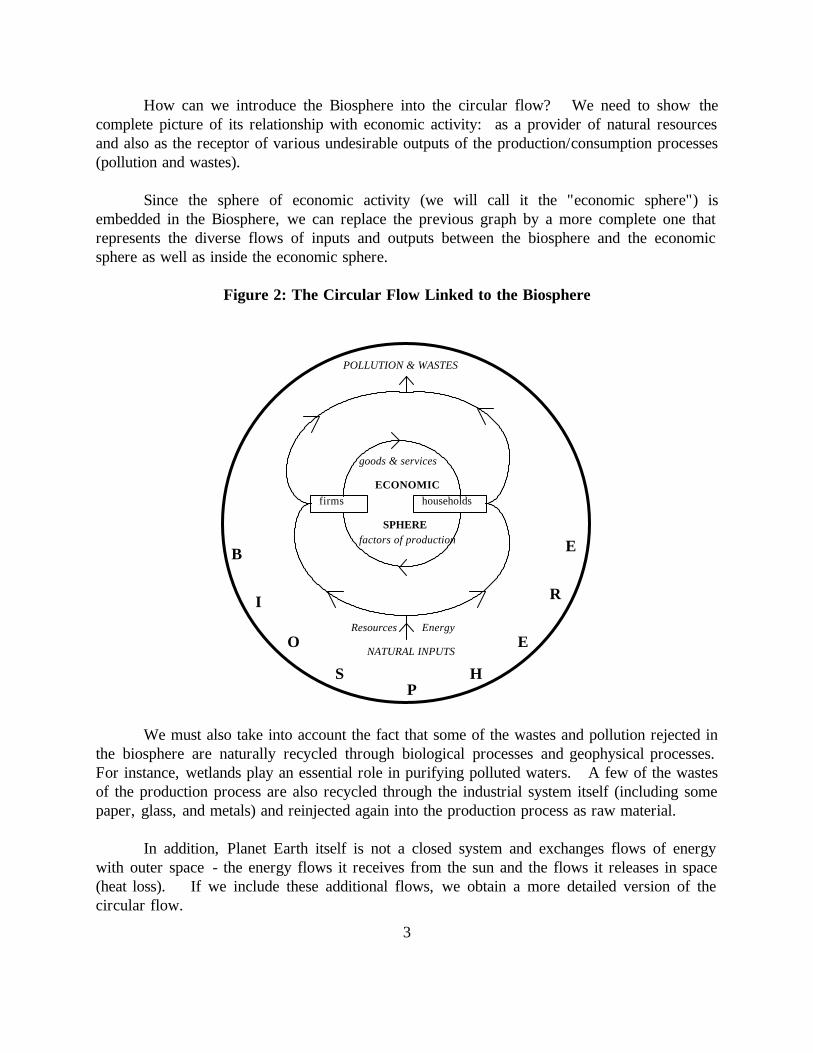
How can we introduce the Biosphere into the circular flow? We need to show the complete picture of its relationship with economic activity: as a provider of natural resources and also as the receptor of various undesirable outputs of the production/consumption processes (pollution and wastes). Since the sphere of economic activity (we will call it the "economic sphere") is embedded in the Biosphere, we can replace the previous graph by a more complete one that represents the diverse flows of inputs and outputs between the biosphere and the economic sphere as well as inside the economic sphere.
Figure 2: The Circular Flow Linked to the Biosphere
householdsfirms
goods & services
factors of production
ECONOMIC
SPHERE
B
I
O
SP
H
E
R
E
Resources Energy
NATURAL INPUTS
POLLUTION & WASTES
We must also take into account the fact that some of the wastes and pollution rejected in the biosphere are naturally recycled through biological processes and geophysical processes. For instance, wetlands play an essential role in purifying polluted waters. A few of the wastes of the production process are also recycled through the industrial system itself (including some paper, glass, and metals) and reinjected again into the production process as raw material. In addition, Planet Earth itself is not a closed system and exchanges flows of energy with outer space - the energy flows it receives from the sun and the flows it releases in space (heat loss). If we include these additional flows, we obtain a more detailed version of the circular flow.

4
Figure 3: Circular Flows with Energy and Recycling
What does this new and expanded picture of the circular flow imply for economic theory? There are at least two major implications: 1- The recognition that natural processes provide an essential support to human well-being that needs to be adequately taken into account in all attempts at measuring well-being. 2- The recognition that this support is finite and that there are limitations both in terms of the inputs which can be extracted from the biosphere and the waste outputs which can be put back into it. This means that we have to do some rethinking of standard economic concepts such as Gross National Product and economic growth. If we take the full circular flow into account, we will need to revise the standard ways of measuring economic wealth and income, and also to reconsider the effects of continual economic growth on human well-being.
ECONOMIC
SPHERE
Resources Energy
Pollution Wastes
goods & services
B
I
O
S
P
HE R E
Firms Households
factors of production
Natural inputs
SOLAR
ENERGY
HEAT
industrialrecycling
B i o l o g i c a l&
G e o p h y s i c a l
P r o c e s s e s
N a t u r a lR e c y c l i n g
LOSS
5
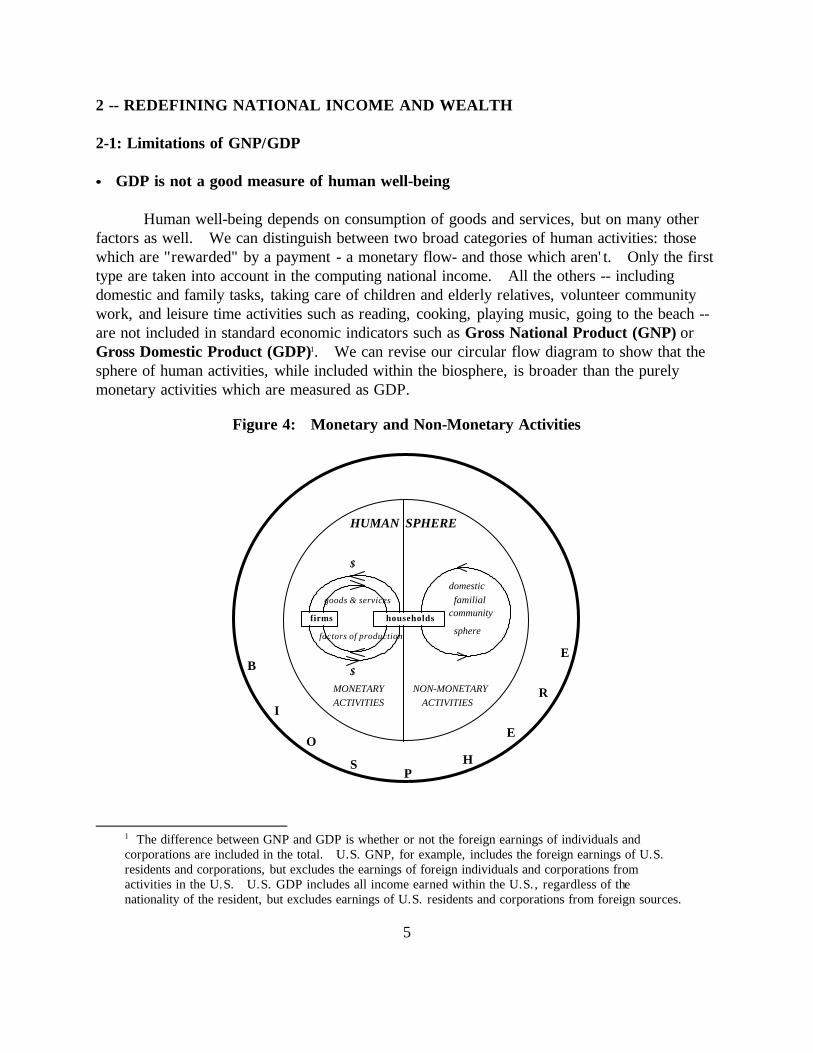
2 -- REDEFINING NATIONAL INCOME AND WEALTH 2-1: Limitations of GNP/GDP •• GDP is not a good measure of human well-being Human well-being depends on consumption of goods and services, but on many other factors as well. We can distinguish between two broad categories of human activities: those which are "rewarded" by a payment - a monetary flow- and those which aren't. Only the first type are taken into account in the computing national income. All the others -- including domestic and family tasks, taking care of children and elderly relatives, volunteer community work, and leisure time activities such as reading, cooking, playing music, going to the beach -- are not included in standard economic indicators such as Gross National Product (GNP) or Gross Domestic Product (GDP)1. We can revise our circular flow diagram to show that the sphere of human activities, while included within the biosphere, is broader than the purely monetary activities which are measured as GDP.
Figure 4: Monetary and Non-Monetary Activities
goods & services
B
I
O
SP
H
E
R
Efactors of production
$
$
firms households
HUMAN SPHERE
MONETARY NON-MONETARYACTIVITIES ACTIVITIES
domesticfamilial
community
sphere
1 The difference between GNP and GDP is whether or not the foreign earnings of individuals and corporations are included in the total. U.S. GNP, for example, includes the foreign earnings of U.S. residents and corporations, but excludes the earnings of foreign individuals and corporations from activities in the U.S. U.S. GDP includes all income earned within the U.S., regardless of the nationality of the resident, but excludes earnings of U.S. residents and corporations from foreign sources.

6
Figure 4 shows the division inside the sphere of human activities between the monetary portion of activities and the non-monetary part. The Gross Domestic Product measures only the first area and neglects the second. However, when measuring human well-being or welfare, it is necessary to take into account the entire scope of the human sphere. The first attempt to take into account some of these non-monetary activities in the measure of economic welfare was done by Nordhaus and Tobin in 1972. They calculated a value for such factors as unpaid household labor and "urban disamenities" (such as congestion and pollution). Using these values to modify the standard GNP measure, they constructed a "Measure of Economic Welfare" (MEW). However, their effort has not been systematically followed up. Most economic analysis generally uses GDP as a measure of economic success, and -- by default -- as a measure of welfare. •• GDP includes monetary flows that correspond to a decrease in well-being When there is a car accident, all kinds of activities involving monetary flows result: mechanical services to repair the cars, medical services if passengers are injured, insurance services to assess the costs, and possibly legal services if parties to the accident hire lawyers to sue other parties. All these flows enter positively into the calculation of GDP -- so the car accident causes an overall increase in GDP. But we certainly cannot say it has contributed to human well-being! The car accident is destructive for human beings - potentially leading to permanent damage or even death - as well as destructive of durable goods (the cars). It has obviously reduced the human well-being of the victims of the accident. The services involved to deal with the consequences of the accident may at most "repair" the cars and the people to try to get back to the state of things before the accident (healthy people and functioning car). Overall this action of putting things back in their previous state does not create well-being but at best prevents a net loss of well-being. And these "repairing" activities all have a cost in terms of the amount of time and effort required and equipment used. In a proper measure of well-being, the costs associated with a car accident should not be considered as "pluses". Possibly they should be seen as "minuses" which reduce well-being. At the least, they should be excluded from a measure of economic activities contributing to well-being. How can economists deal with monetary flows that not only do not increase well-being but may even decrease it? One approach is to measure defensive expenditures made to eliminate, mitigate or avoid damages caused by other economic activity. These defensive expenditures can then be deducted from a standard measure of GDP or GNP. A calculation of such defensive expenditures for the Federal Republic of Germany as a percent of German GNP is shown in Table 1 and represents more than 10% of total GNP.

7
Table 1. Defensive Expenditures as Percent of GNP - Federal Republic of Germany, 1985
Environmental Protection Services of Industry and Government
1.33
Environmental Damages
0.80
Cost of Road Accidents
1.1
Costs of Extended Travel Routes
2.2
Higher Housing Costs Due to Urban Agglomeration
0.75
Costs of Personal Security
1.26
Defensive Health Care Costs
2.6
TOTAL
10.24
Source: Leipert (1989:41)
•• GDP neglects the depreciation of Natural Capital In the process of production, machines, equipment and infrastructure need to be constantly maintained and from time to time replaced. This process of wearing out, repairing, and replacing capital is taken into account by measuring capital depreciation. If we subtract an estimate of capital depreciation from Gross Domestic Product, we obtain Net Domestic Product (NDP):
NDP = GDP - Depreciation of Capital NDP is generally considered to be a better measure of true income than GDP. If, for example, we had high short-term consumption but allowed all our capital stock to wear out without replacement, measured GDP would give an erroneously positive impression of how well we were doing economically.
8
NDP would be a better measure since it would show the negative effects of the loss of productive capital. Similarly, we can subtract depreciation from gross investment to get a measure of net investment, which will accurately reflect the change in the capital stock in any given year:
Net Investment = Gross Investment - Depreciation of Capital But this method of measuring and accounting for capital depreciation applies only to what we have defined as manufactured capital. What about natural capital? The process of production uses up non-renewable natural resources such as coal, oil, and minerals. Often renewable natural resources such as productive soils, forests, and fisheries are also depleted or damaged through over-use. And the wastes emitted from the production process also pollute air, water, and land, and damage ecosystems. All of this can be defined as natural capital depreciation. Despite the obvious importance of this kind of depreciation, it is not accounted for at all in standard measures of NDP or net investment. Only the depreciation of human-made capital such as buildings and machinery is counted. To give a more accurate picture of depreciation losses in an economy, we clearly need to measure and subtract the losses from resource depletion, soil erosion, air and water pollution, and other environmental impacts. Sometimes this is difficult, both because good records of the stocks and flows of natural resources are often unavailable, and also because it can be difficult to put a dollar value on something like soil erosion. But some efforts have been made to tackle the problem, and this has given rise to several efforts to revise, improve, or replace the standard GDP measure.
9
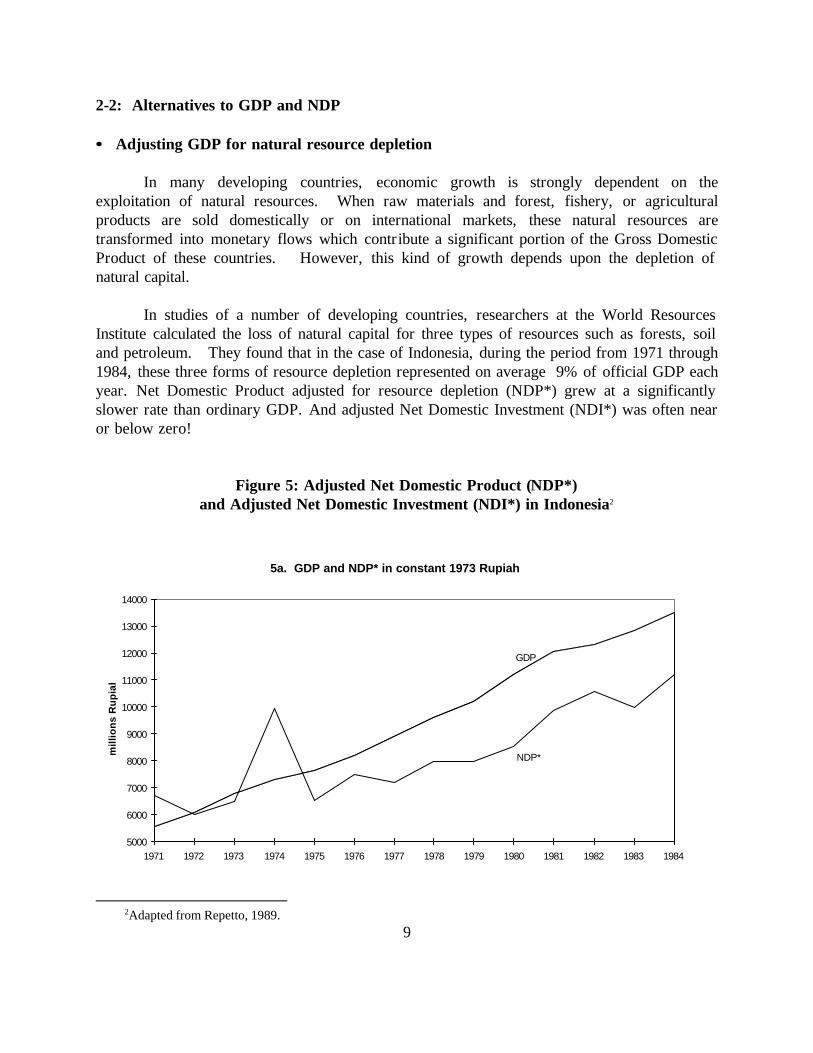
2-2: Alternatives to GDP and NDP •• Adjusting GDP for natural resource depletion In many developing countries, economic growth is strongly dependent on the exploitation of natural resources. When raw materials and forest, fishery, or agricultural products are sold domestically or on international markets, these natural resources are transformed into monetary flows which contribute a significant portion of the Gross Domestic Product of these countries. However, this kind of growth depends upon the depletion of natural capital. In studies of a number of developing countries, researchers at the World Resources Institute calculated the loss of natural capital for three types of resources such as forests, soil and petroleum. They found that in the case of Indonesia, during the period from 1971 through 1984, these three forms of resource depletion represented on average 9% of official GDP each year. Net Domestic Product adjusted for resource depletion (NDP*) grew at a significantly slower rate than ordinary GDP. And adjusted Net Domestic Investment (NDI*) was often near or below zero!
Figure 5: Adjusted Net Domestic Product (NDP*) and Adjusted Net Domestic Investment (NDI*) in Indonesia2
5a. GDP and NDP* in constant 1973 Rupiah
GDP
NDP*
5000
6000
7000
8000
9000
10000
11000
12000
13000
14000
1971 1972 1973 1974 1975 1976 1977 1978 1979 1980 1981 1982 1983 1984
mill
ion
s R
up
iah
2Adapted from Repetto, 1989.

10
5b. GDI and NDI* in constant 1973 Rupiah
GDI
NDI*
-500
0
500
1000
1500
2000
2500
3000
3500
4000
1971 1972 1973 1974 1975 1976 1977 1978 1979 1980 1981 1982 1983 1984
mill
ion
s R
up
iah
In other words, by ignoring the depletion of its natural capital, Indonesia has been able to show impressive rates of economic growth which give a false image of the health of the economy3. •• Accounting for Natural Capital: the Satellite Accounts Approach During recent years both the United Nations and the U.S.Department of Commerce have launched significant revisions of their national income accounting systems to respond to some of the criticisms of standard accounts. The proposed revisions do not alter the fundamental structure of standard GNP/GDP accounting. Rather, they provide additional or "satellite" accounts dealing with the impacts of economic activity on natural resources and the environment. These satellite accounts include developed natural assets like cultivated biological resources, developed land, exploited subsoil reserves, as well as nonproduced environmental assets like uncultivated biological resources, undeveloped land, air and water, unproved subsoil assets. Satellite accounts list these assets in quantitative terms (tons, hectares, cubic meters, etc...). Monetary values can eventually be associated with these quantities, in order to integrate these satellite accounts with the standard system of economic accounting used to calculate GDP.
3 Repetto et al., 1989. World Resources Institute has also analyzed resource depreciation in the Philippines and Costa Rica, and the United Nations has produced similar reports on Mexico and Papua New Guinea (Lutz, 1993).

11

12
Box 1 : The World Bank's New "Green" Approach1
A new system for measuring national wealth that puts a value on natural and mineral resources has been developed by the World Bank. The system is intended to foster a new perspective of development economics by making explicit the costs of environmental degradation and by debiting the national wealth account as mineral resources are depleted. The Bank’s ambitious new report puts numbers on the costs of environmental degradation for the first time, thereby identifying dozens of countries like Kenya, Libya, Nigeria and Venezuela that are, in effect, eating their seed corn - countries where the accumulation of capital has been offset by the depletion of raw materials and fertile land. And the report provides potent ammunition for those who argue that sustainable development turns on factors that often get short shrift from economists. “What we normally measure as capital is a small part of what it takes to sustain human welfare” explained Robert M. Solow, an economist at the Massachusetts Institute of Technology who won the Nobel Prize in 1987. By definition wealth must increase if a country consumes less than it produces - in other words, if it saves. However, since much of an economy’s productive assets are not included in traditional accounting, standard estimates of savings can mislead. Take the case of Norway, which increased its stock of physical capital by about 10% annually in the late 1980's, a seemingly robust rate. But roughly four-fifths of that investment was offset by depletion of Norway's reserves of oil and gas, suggesting that Norway's total wealth was barely growing. [The Bank’s] starting point was existing estimates of physical or “produced” capital. Bank economists then added estimates of “natural” capital, a combination of land, fossil-fuel deposits, other mineral wealth and clean water. Last but hardly least, the researchers included a catchall category for wealth embodied in human skills, health and social organization. _________________________ 1 excerpt from "The Wealth of Nations: a ‘greener’ approach turns list upside down”, by Peter Passell, New York Times, September 19, 1995
Composition of world wealth
Raw material exporters
Natural capital44%
Human resources
36%
Produced assets
20%
Other developing countries
Natural capital28%
Human resources
56%
Produced assets
16%
High-income countries
Produced assets
16%
Human resources
67%
Natural capital17%
Source: The World Bank, Monitoring Environmental Progress, 1995.
13
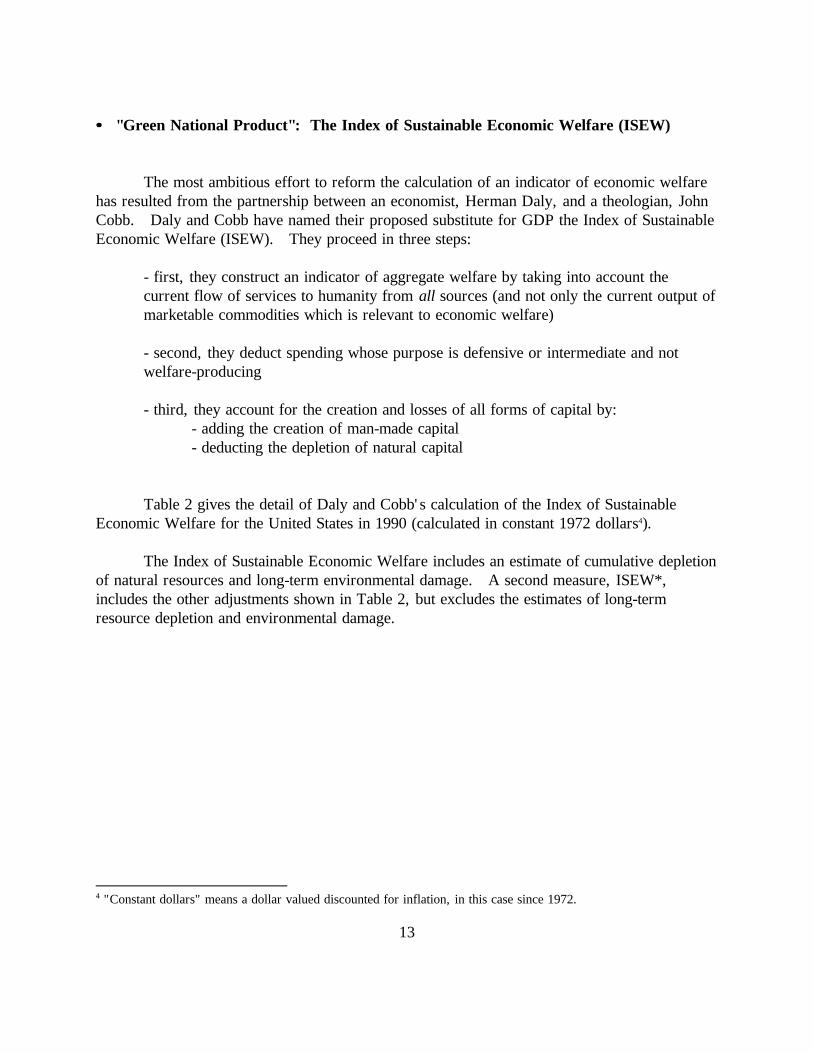
•• "Green National Product": The Index of Sustainable Economic Welfare (ISEW) The most ambitious effort to reform the calculation of an indicator of economic welfare has resulted from the partnership between an economist, Herman Daly, and a theologian, John Cobb. Daly and Cobb have named their proposed substitute for GDP the Index of Sustainable Economic Welfare (ISEW). They proceed in three steps:
- first, they construct an indicator of aggregate welfare by taking into account the current flow of services to humanity from all sources (and not only the current output of marketable commodities which is relevant to economic welfare)
- second, they deduct spending whose purpose is defensive or intermediate and not welfare-producing
- third, they account for the creation and losses of all forms of capital by:
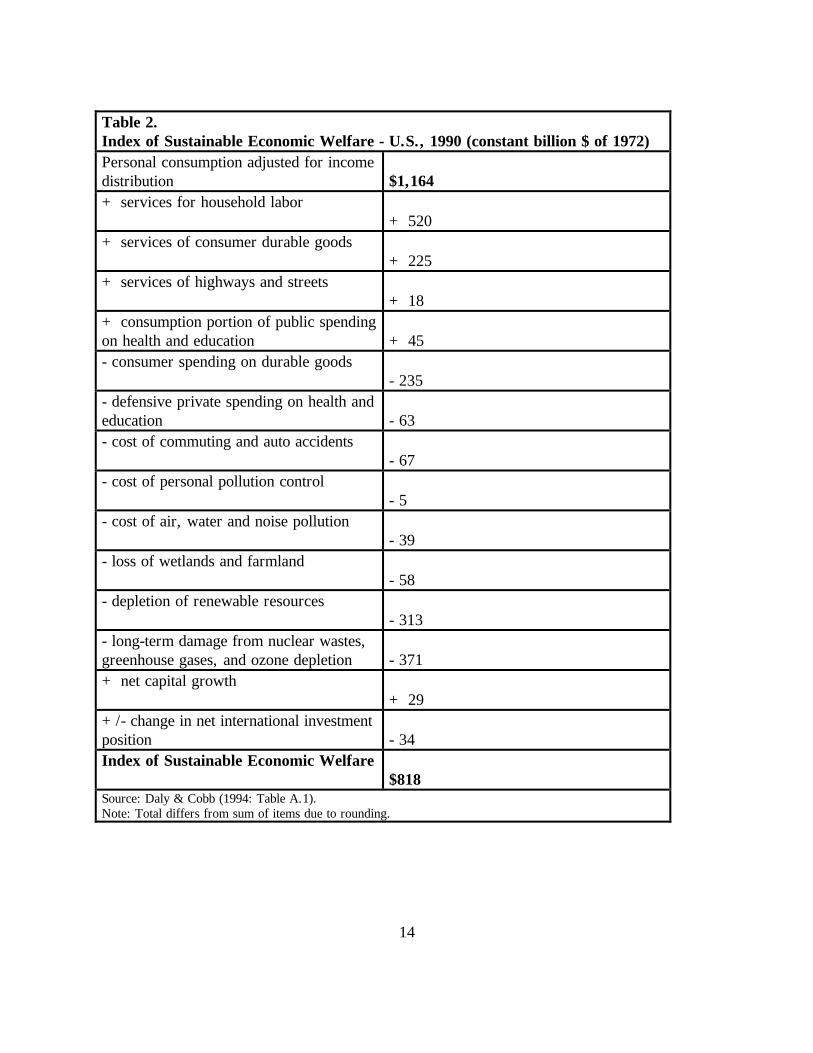
- adding the creation of man-made capital - deducting the depletion of natural capital Table 2 gives the detail of Daly and Cobb's calculation of the Index of Sustainable Economic Welfare for the United States in 1990 (calculated in constant 1972 dollars4). The Index of Sustainable Economic Welfare includes an estimate of cumulative depletion of natural resources and long-term environmental damage. A second measure, ISEW*, includes the other adjustments shown in Table 2, but excludes the estimates of long-term resource depletion and environmental damage.
4 "Constant dollars" means a dollar valued discounted for inflation, in this case since 1972.
14
Table 2. Index of Sustainable Economic Welfare - U.S., 1990 (constant billion $ of 1972) Personal consumption adjusted for income distribution
$1,164
+ services for household labor
+ 520
+ services of consumer durable goods
+ 225
+ services of highways and streets
+ 18
+ consumption portion of public spending on health and education
+ 45
- consumer spending on durable goods
- 235
- defensive private spending on health and education
- 63
- cost of commuting and auto accidents
- 67
- cost of personal pollution control
- 5
- cost of air, water and noise pollution
- 39
- loss of wetlands and farmland
- 58
- depletion of renewable resources
- 313
- long-term damage from nuclear wastes, greenhouse gases, and ozone depletion
- 371
+ net capital growth
+ 29
+/- change in net international investment position
- 34
Index of Sustainable Economic Welfare $818
Source: Daly & Cobb (1994: Table A.1). Note: Total differs from sum of items due to rounding.

15
Figure 6 compares three indicators of welfare for the United States (measured in constant 1972 dollars): - GNP per capita - ISEW per capita - ISEW* per capita (excluding long-term depletion and environmental damage) Figure 6: Per Capita GNP and Per Capita Index of Sustainable Economic Welfare
GNP per cap
ISEW* per cap
ISEW per cap
2000
3000
4000
5000
6000
7000
8000
1950
1952
1954
1956
1958
1960
1962
1964
1966
1968
1970
1972
1974
1976
1978
1980
1982
1984
1986
1988
1990
con
stan
t 19
72 $
Source: Cobb & Cobb, 1994. This graph shows that the growth of GDP per capita can give a misleading message about the health of an economy. An important part of this growth may be due to an increase in defensive/preventive expenditures, as well as an increase in pressure on the environment and depletion of natural capital. ISEW*, which does not include the environmental dimension of the loss of natural capital and long-term degradation, has increased over the last forty years, though its growth in the last 20 years is almost imperceptible.

16
The Index of Sustainable Economic Welfare (ISEW), including long-term environmental costs, increased between 1950 and 1975, but has been constant or declining since then. Clearly, this is in contrast to the steady growth of GDP. A true measure of well-being, according to Daly and Cobb, must take into account all the hidden costs shown in Table 2. Which measure, GDP or ISEW, is a better indicator of the state of the economy? Many economists feel that even if GDP does not directly measure well-being, it measures the ability of a society to obtain the materialistic inputs necessary to a high quality of life. Others would respond that the quantity of goods and services available in an economy may be one factor in improving the quality of life, but there are many more dimensions to human well-being. Using GDP as a measure of how well we are doing reduces the quality of life to only one of its many dimensions.

17
3 -- LONG-TERM GROWTH AND SUSTAINABLE DEVELOPMENT 3-1: Ecosystem Limits The complete circular flow picture in Figure 3 showed us that the biosphere is a source of natural resources for the economic sphere, as well as a sink where the wastes and pollution produced by human activity are rejected5. All economic activities ultimately depend on the biosphere continuing to perform these functions. As long as natural limits were not apparent, as long as nature seemed endless to humans, everything taken from it could be taken from granted. In particular, economics, the science dealing with scarcity, was not concerned about these free gifts of nature to humankind. From the point of view of economic theory, if a good is free --i.e. has no price -- there is no reason to limit consumption, whereas if it has a price consumption will be limited by income. In the past, some civilizations have reached the limits of the ecosystems on which they were relying. Ecological stresses and degradation have then appeared, preventing any further development of these societies and sometimes leading to their collapse. (See Box 2). But never before in human history have we reached the limits of the global ecosystem itself. Today, there are more and more signs that the biosphere as a whole may be affected in its regulation of biological and geophysical processes by the current scale of human activities. The potential threat of global climate change due to accumulating atmospheric emissions of carbon dioxide and other "greenhouse" gases is one example of economic activity pressing up against global limits. Similar global problems are apparent in the degradation of ocean ecosystems, loss of species diversity, and damage to the earth's protective ozone layer. As the scope of human activity grows, its impact on the natural sphere has changed in magnitude: what used to be negligible- and was neglected as such - becomes significant and potentially threatening. These new global ecological problems have lead to the recognition that the natural support is finite and that there are limitations both in terms of the inputs which can be extracted from it and the wastes which it can absorb.
5 The terms "source" and "sink" are used in theories of complex systems to indicate the places where materials and energy originate ("sources") and where they end up ("sinks"). Since 100% recyling of materials is impossible, there must always be some source and sinks in any physical system.

18
Box 2: Exceeding the Limits: The Collapse of A Civilization
The first literate civilization in the world collapsed due to its failure to recognize ecological limits. Around 3000 B.C. the Sumerians of southern Mesopotamia, between the Tigris and Euphrates rivers, built a complex society based on irrigated agriculture, and invented wheeled vehicles, yokes, plows, and sailboats, as well as accounting and legal systems. But their growing population placed too heavy a demand on the natural resources of the region. Deforestation and overgrazing led to heavy soil erosion. Irrigation caused the underground water table to rise, depositing salts which poisoned cropland. Eroded soils loaded the rivers with silt, leading to catastrophic flooding. "The limited amount of land that could be irrigated, rising population, the need to feed more bureaucrats and soldiers, and the mounting competition between the city states all increased the pressure to intensify the agricultural system. The overwhelming requirement to grow more food meant that it was impossible to leave land fallow for long periods.” “Short-term demands outweighed any considerations of the need for long-term stability and the maintenance of a sustainable agricultural system. . . Until about 2400 B.C. crop yields remained high, in some areas as high as in medieval Europe and possibly even higher. Then, as the limit of cultivable land was reached and salinization took an increasing toll, the food surplus began to fall rapidly. . . by 1800 B.C., when yields were only about a third of the level obtained during the Early Dynastic period, the agricultural base of Sumer had effectively collapsed."1 The process of irrigation, salinization of soils, and agricultural collapse was repeated twice more as later societies attempted to rebuild in the same region. Finally the land was exhausted. "Once a thriving land of lush fields, it is now largely desolate, its great cities now barren mounds of clay rising out of the desert in mute testimony to the bygone glory of a spent civilization."2 _________________________ 1 Clive Ponting, A Green History of the World: The Environment and the Collapse of Great Civilizations. New York: Penguin Books, 1993. 2 Daniel Hillel, Out of the Earth: Civilization and the Life of the Soil. New York, The Free Press (MacMillan), 1991.

19
Kenneth Boulding was the first economist to address the necessity of a shift in the way the economic system functions, from what he calls the "cowboy" economy to the "spaceship" economy. In the first case nature appears endless, and in this "frontier" environment economic growth can occur as freely, as ranching expanded across the open plains of the Western United States in the nineteenth century. However, as it becomes apparent that the natural world is not endless but limited, economic behavior must change dramatically. By the late twentieth century, Boulding suggested that the earth was best viewed as a finite spaceship - a lifeboat - in which human kind is embarked and which must be piloted in a wise and not wasteful way6.
Figure 7: The Growing Economic System inside the Finite Global Ecosystem7
economicsphere
EconomicSphere
natural inputs
until the 20th century now
pollution wastes
natural inputsB
I
O
SP H E
R
E
B
I
O
SP H
E
R
E
pollution wastes
How close are we to the limits? One way of answering this question is based on the fact that all animal life on earth depends on green plants, which capture solar energy through photosynthesis. (Without green plants, humans and all other animals would die of starvation since animals cannot produce food directly from the physical environment). According to one study, almost 40% of all terrestrial photosynthesis is already directly or indirectly used by human kind (Vitousek, 1986). This means that 40% of the flow of solar energy that is received on the terrestrial part of the planet is somehow used - through the agricultural processes or the direct exploitation of natural ecosystems - for human needs.
6 Boulding, Kenneth, “The Economics of the Coming Spaceship Earth,” 1966.
7Adapted from Goodland et al., 1991.

20
If the human population doubled over 1986 levels (which many projections show occurring within the next fifty years), could its doubled needs be met without destroying many other species and ecosystems? Possibly, if we became much more efficient in our production and use of food and other necessities. But the 40% figure certainly implies that we have to be aware of ecosystem limits, since doubling our demand to 80% of the planet's capacity would drive many other species to extinction.
Box 3: Ecological Economics Ecological economics has emerged in the past twenty years as a new field of research and study. This new approach builds on a long tradition of thinkers who have been concerned with the issue of the ecological limits to economic activity. Ecological economics claims that the mainstream economic approach to environmental problems is inadequate to deal with the contemporary crises of environment/human interactions and to respond adequately to the complexities of issues such as global climate change, species loss, and ecosystem degradation. Paradoxically, mainstream economics focuses on problems of allocation of scarce resources, but has proven particularly unable to take into account the growing scarcity or degradation of many natural resources and ecological systems. Ecological economics emphasizes the issue of the scale of human activities, which potentially threatens the natural capacities of ecosystems to regenerate. The main founders of the field of ecological economics were economists who had the ability to bring a multidisciplinary perspective on social sciences, such as Kenneth Boulding who introduced in economics many concepts coming from system analysis, or Nicholas Georgescu-Roegen who applied the physical laws of thermodynamics to economic processes. Leading contemporary contributors to the field are Herman Daly and Robert Costanza, who have developed the concepts of long-term sustainability, economic and ecological valuation, and optimum economic scale. For more information on the field of Ecological Economics, see Krishnan, Harris, and Goodwin, A Survey of Ecological Economics (1995).
21
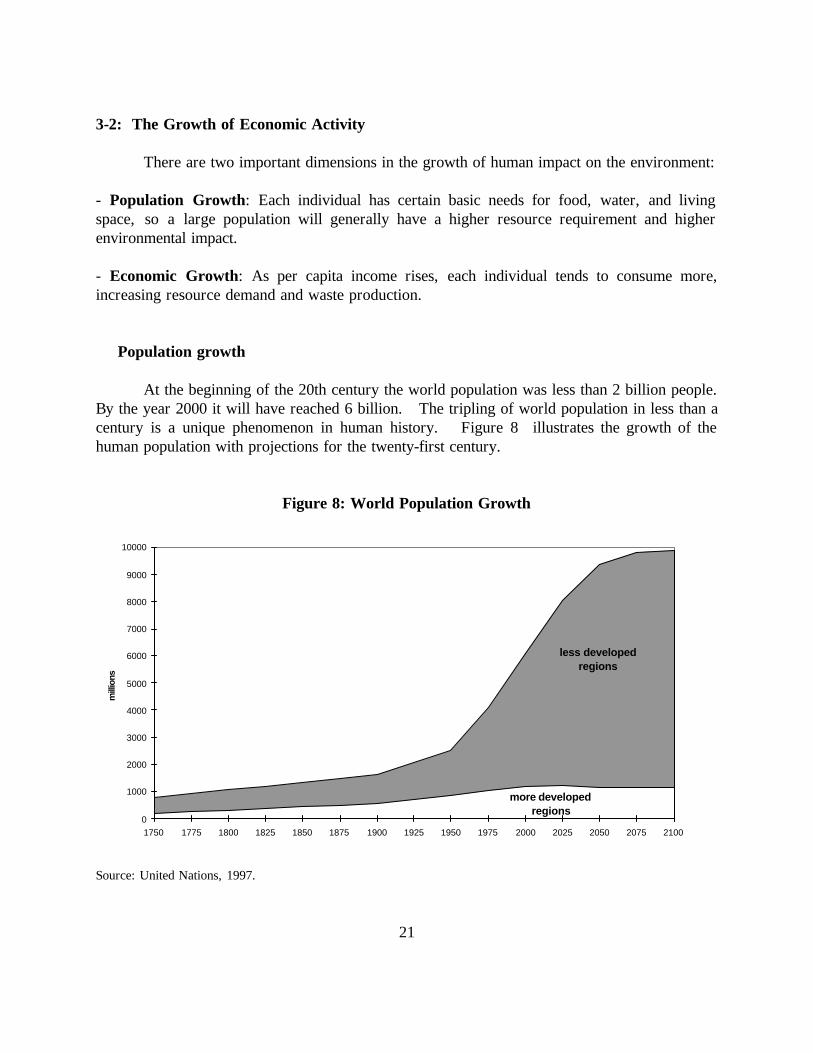
3-2: The Growth of Economic Activity There are two important dimensions in the growth of human impact on the environment: - Population Growth: Each individual has certain basic needs for food, water, and living space, so a large population will generally have a higher resource requirement and higher environmental impact. - Economic Growth: As per capita income rises, each individual tends to consume more, increasing resource demand and waste production. �� Population growth At the beginning of the 20th century the world population was less than 2 billion people. By the year 2000 it will have reached 6 billion. The tripling of world population in less than a century is a unique phenomenon in human history. Figure 8 illustrates the growth of the human population with projections for the twenty-first century.
Figure 8: World Population Growth
more developed regions
less developed regions
0
1000
2000
3000
4000
5000
6000
7000
8000
9000
10000
1750 1775 1800 1825 1850 1875 1900 1925 1950 1975 2000 2025 2050 2075 2100
mill
ions
Source: United Nations, 1997.

22
Box 4: The Exponential Nature of Growth If a population grows at a rate of 3% per year - a rate that is seen in some developing countries such as Nigeria and Guatemala - how long does it take for the population to double? Growth is a cumulative process: if you start with a population P0, one year later the population will be P1 = P0 + 0.03P0 = 1.03 P0. Between year 1 and year 2 the population P1 will again be multiplied by a factor 1.03, so that the population in year 2 will be: P2 = 1.03 P1 = 1.03 * 1.03 Pi = (1.03)2P0. After 20 years, the population will be: P20 = (1.03)* (1.03)*.....* (1.03) P0 = (1.03)20 P0 = 1.806 P0. It takes almost 24 years to double the initial population with a growth rate of 3% per year. If this rate of growth continues, the population will double every 24 years. This is called exponential growth. No population can grow exponentially forever. Ultimately the population will reach the limits of its natural environment to sustain it. This limit is called the carrying capacity of the environment. Currently population growth rates in most areas are slowing, so that global population growth is less than exponential. But global economic output is still growing exponentially. _______________________________________________________________________ Mathematical note: There is a mathematical way to find population doubling time without going through all the iterations year after year. We know that the population we are looking for will be 2 P0 and this will happen after a certain number of years n when: Pn = (1.03)n P0 = 2 P0 This means that we are looking for a number of years n such that: (1.03)n = 2. To find n, we need to apply natural logarithms to both sides of this equation: Ln [(1.03)n] = Ln 2 Since Ln [(1.03)n] = n Ln (1.03) we can easily find the exact number of years n: n = Ln 2 / Ln(1.03) = (0.69315)/(0.02956) = 23.45 Therefore, with a population rate of 3% per year, the population will double in 23.45 years.
23
Demographic projections for the next century take into account several factors. The fertility rate, which is the average number of children born per woman, is one of the major determinants of population growth. In the industrialized world, fertility rates have constantly decreased in the past century to reach current levels below 2 children per woman, which means that the population growth in developed "North" is very slow, about 0.5% per year. However, in developing countries, it is still very common to have average fertility rates of 3 to 5 children per woman, which corresponds to a high population growth rate, in the range of 2 to 3% per year. At this rate the doubling time of the population of these countries is between 20 and 30 years (See Box 4). Therefore the "North" and the "South" show very different patterns in terms of population growth. The North represents today around 25% of the world population. By 2050, if world population reaches 9.4 billion people as projected by the United Nations, the share of the North will have dropped to less than 15% of world population. The reduction of fertility is a universal phenomenon, but occurs at different rates in different countries. Fertility patterns are closely linked with social and cultural norms and family structures. A change in fertility requires a dramatic shift in social structures and in mentality, notably in the status of women, which plays an important role in the determination of fertility patterns. •• The environmental impact of standards of living Different patterns or styles of living imply different impacts on the environment. Take for example an African family living in a rural area and cultivating their fields with traditional agricultural techniques. This family has a limited impact on their local environment in terms of their use of local soil and water resources. Their fuelwood needs may contribute to the deforestation of local forested areas. But their production of pollution and non-degradable wastes is almost nil. On the other hand, consider the environmental impact of an American family. Through their daily consumption of food, clothing, housing, transportation, heating and air conditioning, the American family creates many environmental impacts, most of which they may not even be aware of. Some of these impacts involve the use of renewable resources (soils, water, etc...); some involve the use of non-renewable resources (fuel, gas,..); and others involve the release of pollutants into the environment (wastes from agricultural and industrial production, sewage and household garbage, and greenhouse gases like CO2 which contribute to global climate change). Would it be possible to create an indicator weighting all these different impacts in order to measure the global environmental impact of each human being according to his/her living style?
24
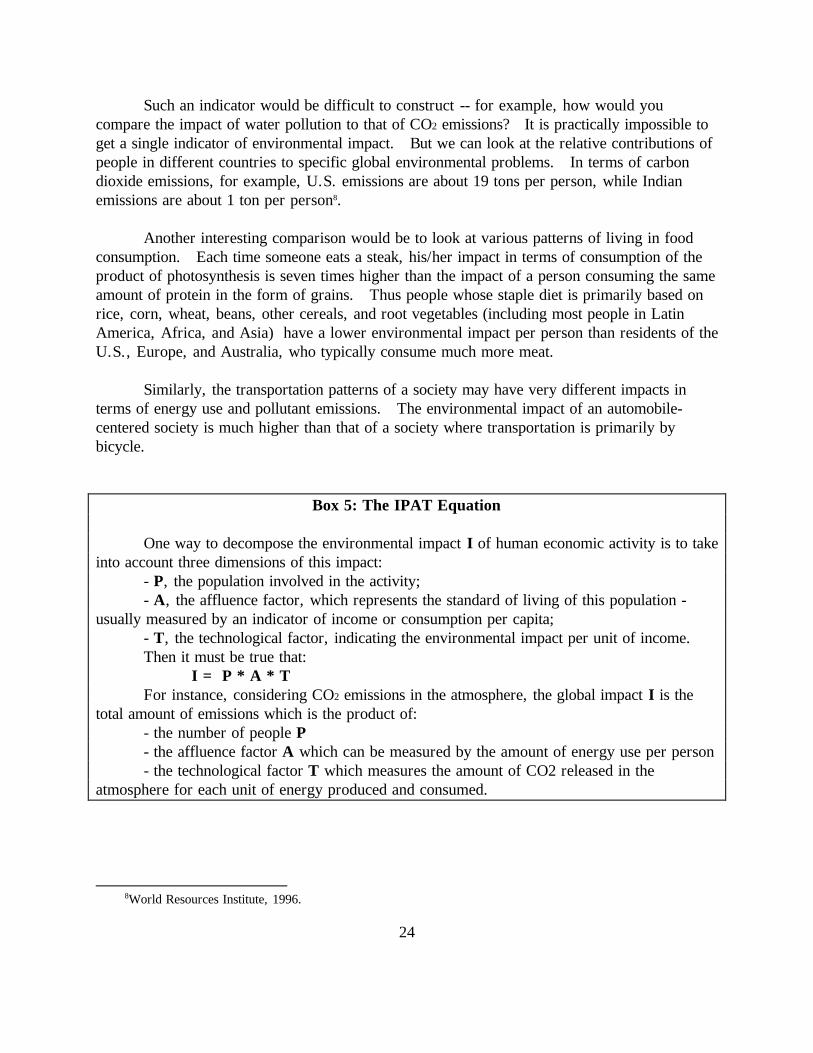
Such an indicator would be difficult to construct -- for example, how would you compare the impact of water pollution to that of CO2 emissions? It is practically impossible to get a single indicator of environmental impact. But we can look at the relative contributions of people in different countries to specific global environmental problems. In terms of carbon dioxide emissions, for example, U.S. emissions are about 19 tons per person, while Indian emissions are about 1 ton per person8. Another interesting comparison would be to look at various patterns of living in food consumption. Each time someone eats a steak, his/her impact in terms of consumption of the product of photosynthesis is seven times higher than the impact of a person consuming the same amount of protein in the form of grains. Thus people whose staple diet is primarily based on rice, corn, wheat, beans, other cereals, and root vegetables (including most people in Latin America, Africa, and Asia) have a lower environmental impact per person than residents of the U.S., Europe, and Australia, who typically consume much more meat. Similarly, the transportation patterns of a society may have very different impacts in terms of energy use and pollutant emissions. The environmental impact of an automobile-centered society is much higher than that of a society where transportation is primarily by bicycle.
Box 5: The IPAT Equation One way to decompose the environmental impact I of human economic activity is to take into account three dimensions of this impact: - P, the population involved in the activity; - A, the affluence factor, which represents the standard of living of this population - usually measured by an indicator of income or consumption per capita; - T, the technological factor, indicating the environmental impact per unit of income. Then it must be true that: I = P * A * T For instance, considering CO2 emissions in the atmosphere, the global impact I is the total amount of emissions which is the product of: - the number of people P - the affluence factor A which can be measured by the amount of energy use per person - the technological factor T which measures the amount of CO2 released in the atmosphere for each unit of energy produced and consumed.
8World Resources Institute, 1996.

25
3-3: From Growth to Sustainable Development •• Components of Human Development Economists have always realized that there was more to the pursuit of "progress" than the mere growth of the quantities of goods and services produced. The process of economic development should improve people's standard of living not only in materialistic terms but also in terms of improving well-being in the broader sense of the quality of life. However, most records of economic progress only take into account the quantitative dimension of well-being, as measured by standard GDP, without considering the qualitative dimensions. If improving human well-being is the goal of any sound economic development, is it possible to measure the qualitative dimensions of development? The United Nations Development Program (UNDP) has constructed a Human Development Index which takes into account 3 dimensions of development: - GDP per capita - life expectancy - the literacy rate and school enrollment These other dimensions represent two essential aspects of human capital: health and education. The three dimensions are combined to give a single Human Development Index. Rating countries using the Human Development Index (HDI) shows that societies which are at similar levels of GDP can have very different levels of human development (see Table 3). Costa Rica, for example, significantly exceeds Brazil and Turkey in human development - especially life expectancy and adult literacy - although its GDP per capita is similar to these other countries. Similarly, Sri Lanka surpasses Congo and Pakistan in human development, despite an almost identical low GDP per capita for the three countries. Table 3. HDI Score, Selected Developing Nations, 1992 Life
Expectancy (years)
Adult Literacy (%)
School Enrollment Ratio (%)
Unadjusted Per Capita GDP ($)
HDI Score
Costa Rica Brazil Turkey
76.3 66.3 66.5
94.3 81.9 80.5
66 70 61
5,480 5,240 5,230
0.883 0.804 0.792
Sri Lanka Congo Pakistan
71.9 51.3 61.5
89.3 70.7 35.7
66 56 25
2,850 2,870 2,890
0.704 0.538 0.483
Source: United Nations (1995:156-157)

26
•• Ends and Means Herman Daly makes a clear distinction between the ends of all human activities and the means used to reach these ends. At the one end of the spectrum he puts what he calls ultimate ends -- the life goals which philosophers deal with when they address the issue of happiness and the question of what constitutes a "good" life. Economic development, by contrast, is concerned with intermediate ends -- providing necessities of life, as well as other goods and services that contribute to people's well-being9. Health and education are important parts of well-being and therefore intermediate ends -- but as the Human Development Index shows, mere economic growth does not necessarily ensure that health and education will be provided on an equitable basis. Some economists have suggested that economics should be concerned only with efficiency, and not with equity. But the idea of ultimate ends suggests that true economic development must provide access to basic needs for all -- and thus that economics cannot avoid the responsibility for some moral judgments about what is or is not equitable. If we are interested in true economic development, therefore, measures such as GDP per capita only tell part of the story. We need to consider both the equitable provision of basic human needs, and the impact of economic production on the environment. Certainly the preservation of the biosphere, which supports all human life and economic activity, should qualify as an ultimate end. •• Defining Sustainable Development True development must provide benefits to all, and must not destroy the natural life-support systems on which it rests. One definition of sustainable development, proposed by the World Commission on Environment and Development, is:
Sustainable development is development that meets the needs of the present without endangering the needs of the future. (WCED, 1987, 8).
The concept of sustainability has now become more widespread in economics. However, there are differing interpretations of the economic meaning of sustainability. One interpretation, sometimes called weak sustainability, is related to the concept of natural capital depreciation that we discussed above. According to this view, any loss of natural capital should be balanced by creation of new capital of at least equal value. Thus future generations will have access to a stock of capital which is of at least the same value as that which the present generation has available. But in this view, it is acceptable to use up or
9Daly, 1980.

27
destroy natural resources, provided that manufactured capital of equal value is substituted for what is lost. For example, a developing nation could cut down its forests, replacing them with plantations and sawmills, or destroy its natural fisheries and replace them with aquaculture facilities where fish are raised in pens for human consumption. This would meet the definition of weak sustainability, provided that the productive value of the new facilities was at least equal to that of the former natural systems. This view is criticized by the Ecological Economics school of thought, on the grounds that economic valuation does not reflect the full value of ecological services, and therefore encourages us to ignore ecological limits. This could lead the process of economic development on very dangerous roads. In the past, destructive ecological feed-backs have caused civilizations to collapse (See Box 2). Where there is a danger of irreversibility -- damage that cannot be repaired -- ecological economists often suggest that we should observe the precautionary principle. This principle implies that we should not risk environmental damage that could permanently harm our own society or future generations. This argument could be applied to atmospheric emissions that result in ozone depletion or unpredictable climate change, the release of long-lived chemicals or bioengineered organisms into the environment, or the creation of long-lived nuclear wastes. In general, advocates of strong sustainability argue that natural systems should be maintained intact wherever possible. They identify critical natural capital -- such as water supplies -- as resources that must be preserved under all circumstances. In this view, for example, maintaining the natural fertility of the soil is essential -- even if it is possible to compensate for degraded soils with extra fertilizer. Either concept of sustainability -- but especially the "strong" version -- implies some limits to economic growth. The part of economic activity that relies heavily on natural resources, raw materials or energy, cannot keep growing indefinitely. Because the planetary ecosystem has certain limits, there must also be limits on macroeconomic scale -- the overall level of resource use and goods output. There is a need in the long term to reach a plateau, a steady-state in terms of the consumption of material and energy resources. Rather than growing indefinitely on an exponential path -- say of 4% GDP growth per year -- national and global economic systems must follow what is called a logistic pattern in which growth is eventually limited, at least in terms of resource consumption (see Figure 9).

28
Figure 9: Growth Reaching a Steady-State
time
resource-using economic activities
STEADY-STATE
On the other hand, activities that do not involve resource consumption, which are environmentally neutral or environmentally friendly, can grow indefinitely. Such activities could include services, arts, communication, and education. Once basic needs are met and reasonable levels of consumption achieved, the concept of sustainable development implies that economic development should be increasingly oriented towards this kind of inherently “sustainable” activity. •• Policies for Sustainable Development Much of macroeconomic theory and policy is oriented towards promoting continuous economic growth. What kind of policies would be required to promote sustainability? Are the goals of economic growth and sustainability compatible? Some ecological economists view "sustainable growth" as a contradiction in terms. They point out that no system can grow without limit. However, some kinds of economic growth seem essential. For the large number of people in the world who lack basic needs, an increase in consumption of food, housing, and other goods is clearly required. For those who have achieved a high level of material consumption, there are possibilities for improved well-being through expanded educational and cultural services which, as we have noted, do not have a negative environmental impact. But, there is nothing in standard macroeconomics that guarantees that economic growth will be either equitable or environmentally benign. Specific policies for sustainable development are therefore needed.

29
What might such policies involve? Some possibilities include: * "Green" taxes which would shift the tax burden away from income and capital taxation, and onto the use of fossil fuels and resources. This would discourage energy- and material- intensive economic activities, while favoring the provision of services and labor-intensive industries10. * Elimination of agricultural and energy subsidies which encourage the over-use of energy, fertilizer, pesticides and irrigation water. Sustainable agricultural systems rely on the recycling of nutrients, crop diversification, and the use of natural pest controls, minimizing the use of artificial chemicals and fertilizer. These systems also tend to be more labor-intensive. * Greater recycling of materials and use of renewable energy. The field of industrial ecology has emerged as scientists and environmental economists have explored how industrial systems can be redesigned to imitate the closed-cycle patterns of natural systems, with reuse of as many materials as possible and minimal waste output. * Efficient transportation systems which replace energy-intensive automotive transport with high-speed trains, public transit, greater use of bicycles, and redesign of cities and suburbs to minimize transportation needs. In countries like the United States where automobile-centered systems are already extensively developed, the use of highly fuel-efficient cars would be important; in some developing countries automobile dependence might be avoided altogether. These proposals have implications for macroeconomic policy. If policies aimed at promoting sustainability also encourage labor-intensive development, this could help to achieve full employment. Public investment in rail transit and renewable energy would have budgetary implications, as would the reduction of subsidies for roads and fossil fuels. Tax changes could be revenue-neutral, meaning that every dollar collected in new energy and resource taxes would be matched by a dollar of income, payroll, corporate or capital gains tax reduction. But even if new tax systems were revenue-neutral, there could be macroeconomic effects due to the different incentives created for employment of labor and capital, and the implications for investment. Thus analysis of macroeconomic issues needs to take account of long-term sustainability. Policies oriented towards economic growth alone risk damage to the broader "circular flow" of the biosphere, unless they are modified to include consideration of environmental impacts and sustainable scale. This adds a new dimension to the debate over macroeconomic policy, a dimension that will be increasingly important for both developed and developing economies in the twenty-first century.
10Labor-intensive production systems are those which use large amounts of labor relative to other factors of production. Similarly, energy-intensive systems use large amounts of energy. For example, automobile transport is energy-intensive; bicycle transport is labor-intensive.

30
KEY CONCEPTS Biosphere Capital Capital depreciation Carrying capacity Critical Natural Capital Defensive expenditures Ecological Economics Economic Sphere Efficiency Equity Exponential growth Fertility rate “Green” taxes Gross Domestic Product (GDP) Gross Investment Gross National Product (GNP) Human Capital Human Development Index (HDI) Human Sphere Index of Sustainable Economic Welfare (ISEW) Industrial Ecology Irreversibility Labor Land Life expectancy Literacy rate Logistic growth Macroeconomic Scale Manufactured capital Natural capital Natural resources Net Domestic Product (NDP) Non-renewable resources Population growth rate Precautionary principle Renewable resources Revenue-neutral tax policy Satellite accounts Sources and sinks Steady-state Stocks and Flows Strong and weak sustainability Sustainable development Well-being

31
REFERENCES AND ADDITIONAL READINGS Boulding, Kenneth E. 1966. "The Economics of the Coming Spaceship Earth", in Henry Jarrett ed., Environmental Quality in a Growing Economy, Baltimore: The Johns Hopkins Press. Cobb, Clifford W. and John B. Cobb. 1994. The Green National Product: A Proposed Index of Sustainable Economic Welfare Lanham, Maryland: University Press of America. Cohen, Joel E. 1995. How Many People can the Earth Support? New York: Norton & Norton. Costanza, Robert. 1991. Ecological Economics: The Science and Management of Sustainability. New York: Columbia University Press. Daly, Herman E., and John B. Cobb. 1994. For the Common Good. Second edition. Boston: Beacon Press. Daly, Herman. 1980. Economics, Ecology, Ethics: Essays toward a Steady-State Economy. New York: W.H. Freeman and Company. Douthwaite, Richard. 1992. The Growth Illusion. London: Green Books. England, Richard W. 1997. "Alternatives to Gross National Product: A Critical Survey,” Part X in Frank Ackerman et al. eds., Human Well-Being and Economic Goals. Washington, D.C.: Island Press. Georgescu-Roegen, Nicholas. 1971. The Entropy Law and the Economic Process. Cambridge, Mass.: Harvard University Press. Goodland, Robert, Herman Daly and Salah El-Serafy. 1992. Population. Technology and Lifestyle: the Transition to Sustainability. Washington, D.C.: Island Press. Hillel, Daniel. 1991. Out of the Earth: Civilization and the Life of the Soil. New York: McMillan. Krishnan, Rajaram, Jonathan M. Harris, and Neva R. Goodwin eds. 1995. A Survey of Ecological Economics. Washington, D.C.: Island Press. Leipert, Christian. 1989. "Social Costs of the Economic Process and National Accounts: The Example of Defensive Expenditures", Journal of Interdisciplinary Economics 3(2): 27-46.

32
Lutz, Ernst ed. 1993. Toward Improved Accounting for the Environment (An UNSTAT-World Bank Symposium) Washington, D.C.: World Bank. Nordhaus, William, and James Tobin, 1972. "Is Growth Obsolete?" in National Bureau of Economic Research, Economic Growth. Research General Series, No. 96E. New York: Columbia University Press. Passel, Peter. "The Wealth of Nations: A ‘Greener’ Approach Turns List Upside Down", New York Times, September 19, 1995. Ponting, Clive. 1991. A Green History of the World: The Environment and the Collapse of Great Civilizations. New York: Penguin Books. Repetto et al. 1989. Wasting Assets: Natural Resources in the National Income Accounts. Washington: World Resources Institute. United Nations Development Program, 1990-1996. Human Development Report. New York: Oxford University Press. United Nations Department for Economic and Social Information and Policy Analysis, Statistical Division. 1993. Integrated Environmental and Economic Accounting. New York: United Nations. United Nations Department of Economic and Social Affairs. 1997. The Sex and Age Distribution of the World Populations: The 1996 Revision. New York: United Nations. Vitousek, Peter M., et al, 1986. "Human appropriation of the products of photosynthesis" in Bioscience 34 (6): 368-73. World Bank, 1995. Monitoring Environmental Progress: A Report on Work in Progress. Washington, D.C.: World Bank. World Commission on Environment and Development, 1987. Our Common Future. New York: Oxford University Press. World Resources Institute. 1996. World Resources 1996-97: A Guide to the Global Environment. New York: Oxford University Press.
33
DISCUSSION QUESTIONS
Part 1 1) What kinds of flows circulate in the traditional circular flow model? What different kinds of flows exist between the economic sphere and the natural environment? 2) How would you define natural capital? Give examples of natural capital. 3) What does the complete circular flow model including the biosphere indicate about economic systems which is diffferent from the simple circular flow? Part 2 1) What elements of human well-being are not included in the calculation of GDP? Give examples. 2) Show how GDP includes monetary flows which correspond to a decrease in human well-being. Give examples. 3) Explain what the depreciation of capital is in traditional economics. What kind of capital is taken into account in this conventional economic perspective? What is the Net Domestic Product in this perspective? Should a measurement of the Net Domestic Product take into account the depreciation of natural capital? Part 3 1) Why are economists like Kenneth Boulding and Herman Daly concerned about the scale of human activities in relation to the Biosphere? Explain the expressions "cowboy economy" and "spaceship economy". What are the differences between these two economic situations? 2) Explain why the growth of GDP does not represent a satisfying indicator of development. 3) How would you define sustainable development? Explain the difference between the concepts of "weak" and "strong" sustainability.

34
PROBLEMS Problem 1: Here is some macroeconomic information for the developing nation of Equatoria (expressed in international $ values): Agricultural Sector output $1200 million Mining Sector output $ 650 million Industrial Sector output $ 900 million Depreciation of Manufactured Capital $ 220 million Equatoria experiences several environmental problems. Here is some information about natural resources and environment in Equatoria: Agricultural area (million Ha) 12 Soil erosion (tons/Ha/year) 200 Value of Crop Yield Loss for each 100 tons per hectare eroded $10 Industrial Pollution (SO2) per year (thousand tons) 1200 Damage Estimate per ton of SO2 emitted $80 a. Calculate the standard measure of Gross Domestic Product (GDP) and Net Domestic Product (NDP) for this economy. b. Calculate an environmentally adjusted measure of Net Domestic Product NDP* for Equatoria. Problem 2: Calculate the Index of Sustainable Economic Welfare given the following economic data: million $ personal consumption adjusted for income distribution 2,000 services for household labor 500 services of highways and streets 10 consumption portion of public spending on health and education 50 services of consumer durable goods 200 defensive private spending on health and education 50 spending on consumer durable goods 240 cost of commuting and auto accidents 70 cost of personal pollution control 5 cost of air, water and noise pollution 40 net capital growth 25 change in net international investment position +10 loss of wetlands and farmland 60 depletion of renewable resources 400 long-term damage from nuclear wastes, greenhouse gas and ozone depletion 450
35
Problem 3: An African country had a population of 50 million inhabitants in 1990. Assuming that its current annual population growth rate (2.5%) will remain unchanged in the near future, what will be the population of this country in 2010? When will the population of this country reach 100 million inhabitants? Problem 4: The total amount of CO2 emissions can be decomposed according to an IPAT equation of this kind: CO2 emissions = Population * GDP per capita * CO2 emissions per $ of GDP Let's write this: CO2 = P * A * T For the United States: Population = 263 million GDP/capita = $ 26,980 Total CO2 emissions = 4,880 million metric tons. In India, population = 930 million GDP/capita = $ 340 Total CO2 emissions = 770 million metric tons. Calculate CO2 emissions per capita in both the US and India and compare them. Calculate the technological factor T for both countries. [Calculate T in kilograms of CO2 per dollar of GDP. There are 1000 kilograms in a metric ton.] Suppose the affluence factor is multiplied by 5 in India and the population multiplied by 1.5 over the next 20 years. With the same technological factor as today, by how much would CO2 emissions increase? If during the same time period India achieves a technological level equal to the current United States level, by how much would CO2 emissions increase in India?


![Uvodna riječ [Introductory word.]](https://static.fdokumen.com/doc/165x107/63331824b6829c19b80c4113/uvodna-rijec-introductory-word.jpg)