mPATH: an interactive visualization framework for behavior history
6
mPATH: An Interactive Visualization Framework for Behavior History Masaki Ito 1 Jin Nakazawa 1 Hideyuki Tokuda 12 1 Graduate School of Media and Governance, Keio University 2 Faculty of Environmental Information, Keio University niya, jin, hxt @ht.sfc.keio.ac.jp Abstract This paper presents an interactive analysis and visual- ization framework for behavior histories, called mPATH framework. In ubiquitous computing environment, it is pos- sible to infer human activities through various sensors and accumulation of their data. Visualization of such human activities is one of the key issues in terms of memory and sharing our experiences, since it acts as a memory assist when we recall, talk about, and report what we did in the past. However, current approaches for analysis and visu- alization are designed for a specific use, and therefore can not be applied to diverse use. Our approach provides users with programmability by a visual language interface for an- alyzing and visualizing the behavior histories. The frame- work includes icons representing data sources of behavior histories, analysis filters, and viewers. By composing them, users can create their own analysis method of behavior his- tories. We also demonstrate several visualizations on the framework. The visualizations show the flexibility of creat- ing behavior history viewers on the mPATH framework. 1. Introduction In ubiquitous computing environment where computers and sensors are embedded in our surroundings and assist our life, cognition of human behavior will be possible. Today, sensing technology is one of the hottest topics for ubiqui- tous computing researchers. Various technologies for gen- erating a sensor network have developed[11][18]. By sensor networks, acquisition of information in a certain place like temperature, humidity, noise level and light level is realized. In addition, tracking an object are also enabled by the coor- dination of sensors. Technologies for mobile computing[5][1][6] are also useful to sense our activities and environmental informa- tion. Sensors equipped with a mobile device acquire various information of the user such as a location, movement orien- tation and a physiological status by alone or coordination with infrastructures in surroundings[21][16]. Inferring highly abstracted behavior of a user and creat- ing predictive model of user’s behavior from the sensed data are also hot challenges in ubiquitous computing research. There are many researches which aim to guess user’s con- text and provide adaptive services. Several context process- ing technologies are proposed for the purpose[23][22]. In addition to processing sensor data in a certain time, storing and utilizing an accumulation of behavior data brings us a possibility to develop new applications[2]. A well presented behavior history helps human activities in terms of memory and sharing our experiences since it acts as a memory assist when we recall, talk about, and report what we did in the past[17][13]. For example, displaying user’s shopping log reminds him or her of goods which he or she intended to buy, and helps explanation of his or her inten- tion of shopping to his or her company. Analysis techniques of behavior history are important to find useful information from it. There are already various proposed methods for analyz- ing accumulated behavior history. However these methods are designed for a specific use, and hence users may not acquire applicable information. The analysis method of be- havior history, therefore, should be flexible enough to find various information from behavior history. In this paper, we presents a programmable analysis and visualization framework for behavior histories, called mPATH framework. In the mPATH framework, analysis methods are modularized and we can create various analysis methods using visual programming language. The frame- work allow every developers and users to mine behavior history intuitively and flexibly. This paper is organized as follows. In the next sec- tion, we argue problems of visualization of behavior his- tory. In section 3, we introduce mPATH frameworkwhich realizes flexible analysis of behavior history using visual language. We also introduce several visualizations on the mPATH framework in section 4. We evaluate the frame- work in section 5 and introduce related works in section 6. In the final session, we conclude this paper. 2. Visualization of Behavior History In this paper, behavior history is an aggregated form of information which contains location, date and description of behavior about a certain person. Location track data obtained by a GPS receiver is an example of the behavior history. A digital photo image is also behavior history if it contains a time stamp and a location information as its Proceedings of the 19th International Conference on Advanced Information Networking and Applications (AINA’05) 1550-445X/05 $20.00 © 2005 IEEE
-
Upload
independent -
Category
Documents
-
view
3 -
download
0
Transcript of mPATH: an interactive visualization framework for behavior history
mPATH: An Interactive Visualization Framework for Behavior History
Masaki Ito 1 Jin Nakazawa 1 Hideyuki Tokuda 1 2
1 Graduate School of Media and Governance, Keio University2 Faculty of Environmental Information, Keio University
�niya, jin, hxt�@ht.sfc.keio.ac.jp
Abstract
This paper presents an interactive analysis and visual-ization framework for behavior histories, called mPATHframework. In ubiquitous computing environment, it is pos-sible to infer human activities through various sensors andaccumulation of their data. Visualization of such humanactivities is one of the key issues in terms of memory andsharing our experiences, since it acts as a memory assistwhen we recall, talk about, and report what we did in thepast. However, current approaches for analysis and visu-alization are designed for a specific use, and therefore cannot be applied to diverse use. Our approach provides userswith programmability by a visual language interface for an-alyzing and visualizing the behavior histories. The frame-work includes icons representing data sources of behaviorhistories, analysis filters, and viewers. By composing them,users can create their own analysis method of behavior his-tories. We also demonstrate several visualizations on theframework. The visualizations show the flexibility of creat-ing behavior history viewers on the mPATH framework.
1. Introduction
In ubiquitous computing environment where computersand sensors are embedded in our surroundings and assist ourlife, cognition of human behavior will be possible. Today,sensing technology is one of the hottest topics for ubiqui-tous computing researchers. Various technologies for gen-erating a sensor network have developed[11][18]. By sensornetworks, acquisition of information in a certain place liketemperature, humidity, noise level and light level is realized.In addition, tracking an object are also enabled by the coor-dination of sensors.
Technologies for mobile computing[5][1][6] are alsouseful to sense our activities and environmental informa-tion. Sensors equipped with a mobile device acquire variousinformation of the user such as a location, movement orien-tation and a physiological status by alone or coordinationwith infrastructures in surroundings[21][16].
Inferring highly abstracted behavior of a user and creat-ing predictive model of user’s behavior from the sensed dataare also hot challenges in ubiquitous computing research.There are many researches which aim to guess user’s con-
text and provide adaptive services. Several context process-ing technologies are proposed for the purpose[23][22].
In addition to processing sensor data in a certain time,storing and utilizing an accumulation of behavior databrings us a possibility to develop new applications[2]. Awell presented behavior history helps human activities interms of memory and sharing our experiences since it acts asa memory assist when we recall, talk about, and report whatwe did in the past[17][13]. For example, displaying user’sshopping log reminds him or her of goods which he or sheintended to buy, and helps explanation of his or her inten-tion of shopping to his or her company. Analysis techniquesof behavior history are important to find useful informationfrom it.
There are already various proposed methods for analyz-ing accumulated behavior history. However these methodsare designed for a specific use, and hence users may notacquire applicable information. The analysis method of be-havior history, therefore, should be flexible enough to findvarious information from behavior history.
In this paper, we presents a programmable analysisand visualization framework for behavior histories, calledmPATH framework. In the mPATH framework, analysismethods are modularized and we can create various analysismethods using visual programming language. The frame-work allow every developers and users to mine behaviorhistory intuitively and flexibly.
This paper is organized as follows. In the next sec-tion, we argue problems of visualization of behavior his-tory. In section 3, we introduce mPATH framework whichrealizes flexible analysis of behavior history using visuallanguage. We also introduce several visualizations on themPATH framework in section 4. We evaluate the frame-work in section 5 and introduce related works in section 6.In the final session, we conclude this paper.
2. Visualization of Behavior History
In this paper, behavior history is an aggregated form ofinformation which contains location, date and descriptionof behavior about a certain person. Location track dataobtained by a GPS receiver is an example of the behaviorhistory. A digital photo image is also behavior history ifit contains a time stamp and a location information as its
Proceedings of the 19th International Conference on Advanced Information Networking and Applications (AINA’05)
1550-445X/05 $20.00 © 2005 IEEE
meta-data.Well presented behavior histories help our memory and
communication. We often remember our past behavior indaily life. For example, we often plan what we will do forthe weekend remembering stores and places which attractedus in the past. Also, we often talk with people remem-bering our past experiences. There are several researchesto assist memory and communication by visualizing pastbehaviors[19][17][13].
When we remember our past behaviors, we do notmerely remember them chronologically, but remember themselecting and organizing the informations that we need then.For instance, when you tell about the travel that you had,you will tell the places and foods that you were interestedin. Also, you might focus on the places where you visitedwith the listener. Thus, which information you need in yourpast behavior varies depending on the situation.
Behavior history also useful in modeling user’s activityand predicting next action. In many context-aware applica-tion, researchers uses behavior history for adaptive behaviorof the systems. Such applications infer user’s interest andpurpose by analyzing behavior histories. While developinga context-aware application, developer need to select andorganize for a certain application.
2.1. Behavior History Analysis for Visualization
We focus on the analysis process of behavior historiesto find interesting data and organize them when we developmemory assist applications and context-aware applications.Following functions are required for analysis system of be-havior history.
Support of Temporal and Spatial Analysis. Since behav-ior histories are characterized as their location and time pa-rameter, supporting temporal and spatial analysis is requiredin addition to generic numeric analysis. Selection of datawithin a certain location or period is one example. Joiningmultiple data using a certain time or location as a key isanother example. These analysis assist in finding character-istics in behavior histories.
Support of Trial and Error Analysis. The diversity andirregularity of captured data from sensors require heuristicdevelopment of analysis method. Users who analyze be-havior history need to adjust algorism and parameters fora certain history data. Thus, the system should be pro-grammable to support such trial and error development ofanalysis method.
Reusability of Analysis Method. Since there are variousbehavior histories, developed analysis method specializedto a certain behavior history should be reused to other his-tories. For example, analysis method for finding interestingpoints from a shopping history should be applied to photog-raphy history. Analysis methods, therefore, are independentof a certain history format.
3. An Interactive Behavior History MiningFramework
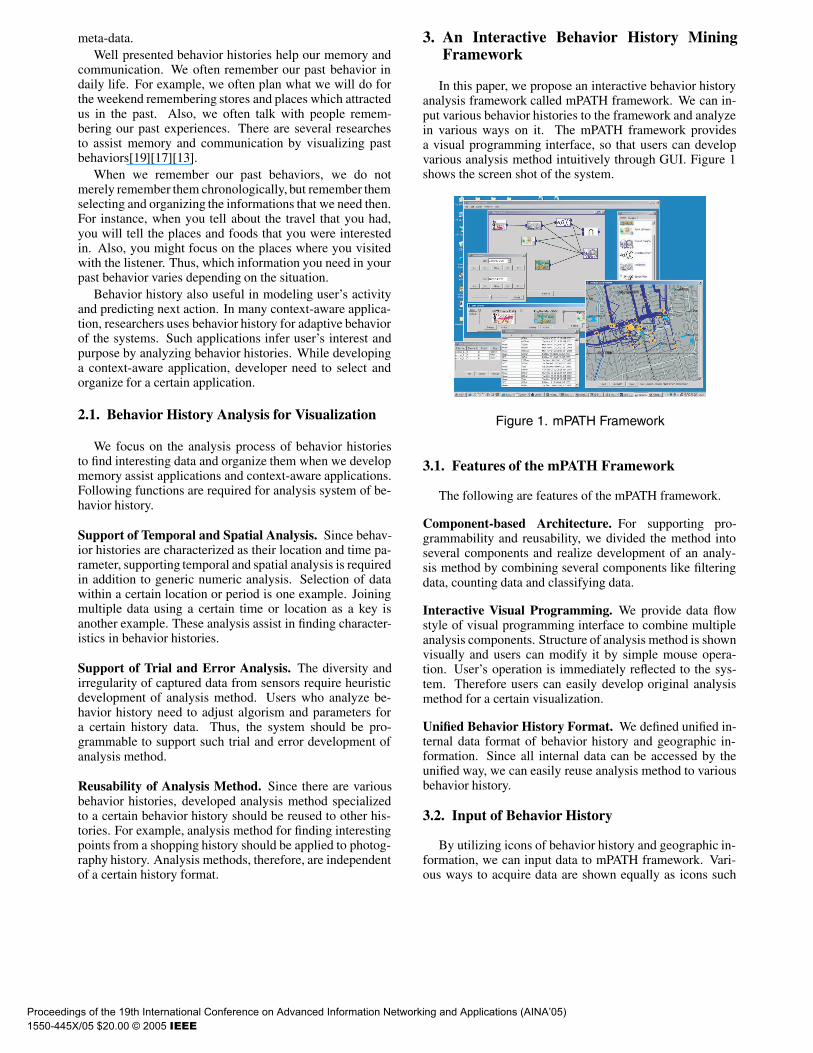
In this paper, we propose an interactive behavior historyanalysis framework called mPATH framework. We can in-put various behavior histories to the framework and analyzein various ways on it. The mPATH framework providesa visual programming interface, so that users can developvarious analysis method intuitively through GUI. Figure 1shows the screen shot of the system.
Figure 1. mPATH Framework
3.1. Features of the mPATH Framework
The following are features of the mPATH framework.
Component-based Architecture. For supporting pro-grammability and reusability, we divided the method intoseveral components and realize development of an analy-sis method by combining several components like filteringdata, counting data and classifying data.
Interactive Visual Programming. We provide data flowstyle of visual programming interface to combine multipleanalysis components. Structure of analysis method is shownvisually and users can modify it by simple mouse opera-tion. User’s operation is immediately reflected to the sys-tem. Therefore users can easily develop original analysismethod for a certain visualization.
Unified Behavior History Format. We defined unified in-ternal data format of behavior history and geographic in-formation. Since all internal data can be accessed by theunified way, we can easily reuse analysis method to variousbehavior history.
3.2. Input of Behavior History
By utilizing icons of behavior history and geographic in-formation, we can input data to mPATH framework. Vari-ous ways to acquire data are shown equally as icons such
Proceedings of the 19th International Conference on Advanced Information Networking and Applications (AINA’05)
1550-445X/05 $20.00 © 2005 IEEE
as acquisition of data from files, through a network, or froma equipped device. Following data can be input in currentimplementation.
GPS Location Track Data. We implemented an inputfunction of location track data acquired by GPS. Withthis function, we can input track data files of handy GPS,Garmin eTrex[12]. We can also input real time location datafrom the handy GPS through RS-232C port with NMEA-0183 format.
Digital Photo. We implemented input function of digitalphoto data. The function generates behavior history of“taking pictures” by reading time stamps and location inEXIF[15] information. In addition, by matching times-tamps of photos with location track data, it estimates lo-cation where the photos were taken without location infor-mation.
Vector Map. We implemented an input function of mapdata in a vector format. There are many map data for GISlike Shape format[10] for ArcGIS[9] and the format of theGeographical Survey Institute of Japan. These map containspoints of station, lines of road and polygons of buildings.Users can infer detail of behavior in a certain position, anduse the map as a background of visualization.
3.3. Analysis of Behavior History
We can analyze behavior history using icons of analysiscomponents. All analysis components are designed as filterswith input and output connector, we can combine severalfilters. Following filters are currently implemented.
Time Filter. Time filter extracts behavior histories duringa specified term.
Speed Filter. Speed filter filters data by its speed. It is use-ful especially to infer transportation means from locationtrack data.
Way point Filter. Way point filter classifies GPS point datainto movements and stops. Users can change threshold oftime to detect the user’s stop.
Matching Filter. Matching filter joins two input data ac-cording to location. When we input one from the map dataand the other from way points data, this filter adds name ofplaces to each way point.
Count Filter. Inside the count filter, geographical regionsare divided into a grid. The filter counts input data in everygrid. Users can learn how many times he or she visited acertain point, i.e. a weight of the point, in behavior history.
3.4. Output Result of Analysis
Result of analysis is connected to an icon of output func-tion, and utilized by various applications. Visualizationapplication and context-aware application are examples ofsuch applications. Applications can run not only within theframework, but also as a distributed application by trans-porting the result through a network.
We currently focus on developing visualization applica-tion as follows, and planning to develop distributed context-aware application using mPATH framework by developingoutput function through a network.
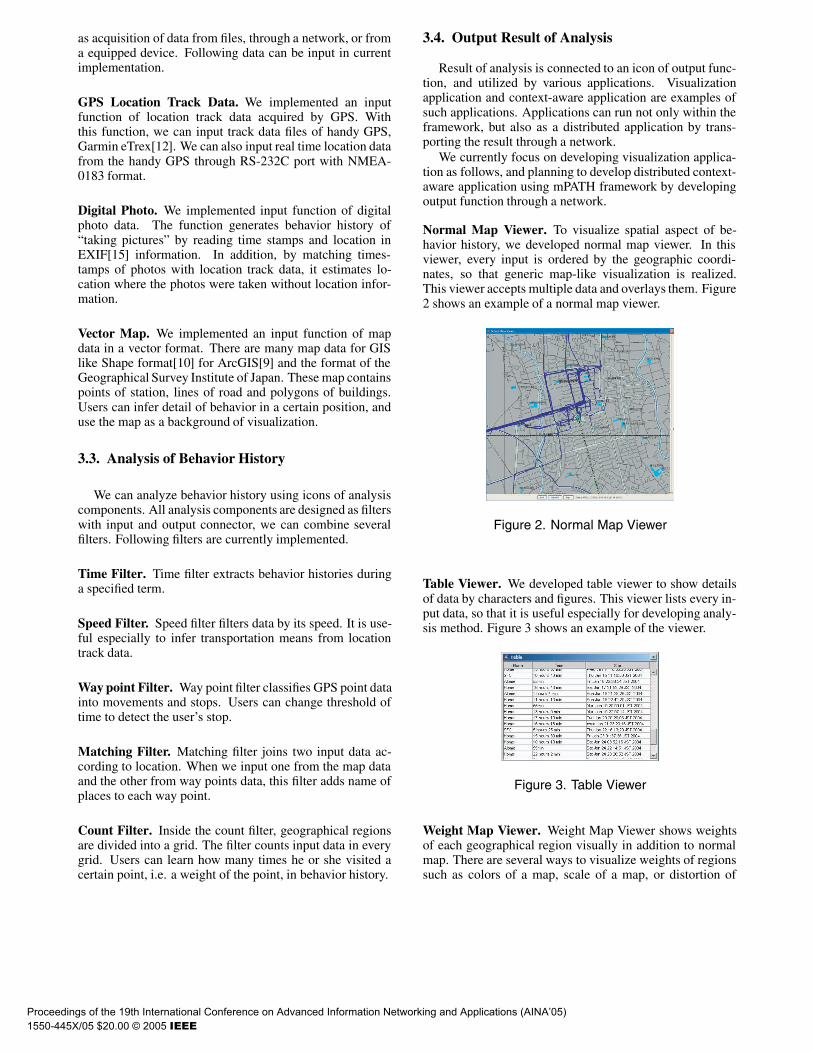
Normal Map Viewer. To visualize spatial aspect of be-havior history, we developed normal map viewer. In thisviewer, every input is ordered by the geographic coordi-nates, so that generic map-like visualization is realized.This viewer accepts multiple data and overlays them. Figure2 shows an example of a normal map viewer.
Figure 2. Normal Map Viewer
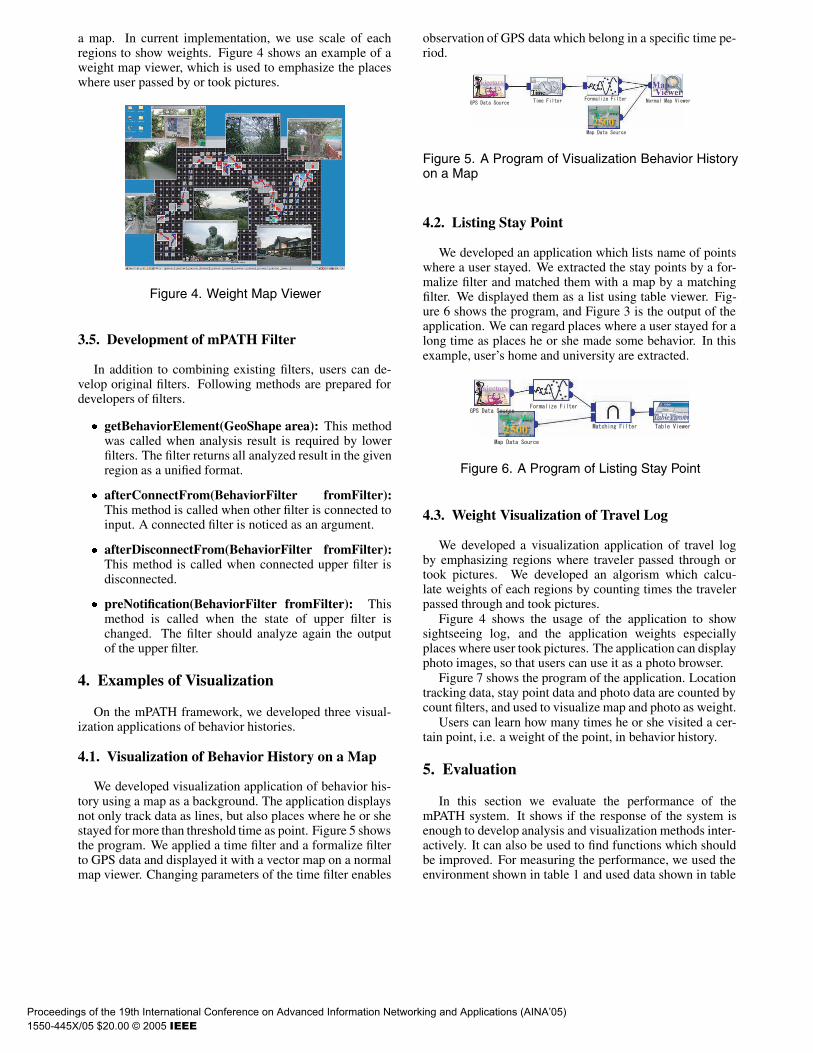
Table Viewer. We developed table viewer to show detailsof data by characters and figures. This viewer lists every in-put data, so that it is useful especially for developing analy-sis method. Figure 3 shows an example of the viewer.
Figure 3. Table Viewer
Weight Map Viewer. Weight Map Viewer shows weightsof each geographical region visually in addition to normalmap. There are several ways to visualize weights of regionssuch as colors of a map, scale of a map, or distortion of
Proceedings of the 19th International Conference on Advanced Information Networking and Applications (AINA’05)
1550-445X/05 $20.00 © 2005 IEEE
a map. In current implementation, we use scale of eachregions to show weights. Figure 4 shows an example of aweight map viewer, which is used to emphasize the placeswhere user passed by or took pictures.
Figure 4. Weight Map Viewer
3.5. Development of mPATH Filter
In addition to combining existing filters, users can de-velop original filters. Following methods are prepared fordevelopers of filters.
� getBehaviorElement(GeoShape area): This methodwas called when analysis result is required by lowerfilters. The filter returns all analyzed result in the givenregion as a unified format.
� afterConnectFrom(BehaviorFilter fromFilter):This method is called when other filter is connected toinput. A connected filter is noticed as an argument.
� afterDisconnectFrom(BehaviorFilter fromFilter):This method is called when connected upper filter isdisconnected.
� preNotification(BehaviorFilter fromFilter): Thismethod is called when the state of upper filter ischanged. The filter should analyze again the outputof the upper filter.
4. Examples of Visualization
On the mPATH framework, we developed three visual-ization applications of behavior histories.
4.1. Visualization of Behavior History on a Map
We developed visualization application of behavior his-tory using a map as a background. The application displaysnot only track data as lines, but also places where he or shestayed for more than threshold time as point. Figure 5 showsthe program. We applied a time filter and a formalize filterto GPS data and displayed it with a vector map on a normalmap viewer. Changing parameters of the time filter enables
observation of GPS data which belong in a specific time pe-riod.
Figure 5. A Program of Visualization Behavior Historyon a Map
4.2. Listing Stay Point
We developed an application which lists name of pointswhere a user stayed. We extracted the stay points by a for-malize filter and matched them with a map by a matchingfilter. We displayed them as a list using table viewer. Fig-ure 6 shows the program, and Figure 3 is the output of theapplication. We can regard places where a user stayed for along time as places he or she made some behavior. In thisexample, user’s home and university are extracted.
Figure 6. A Program of Listing Stay Point
4.3. Weight Visualization of Travel Log
We developed a visualization application of travel logby emphasizing regions where traveler passed through ortook pictures. We developed an algorism which calcu-late weights of each regions by counting times the travelerpassed through and took pictures.
Figure 4 shows the usage of the application to showsightseeing log, and the application weights especiallyplaces where user took pictures. The application can displayphoto images, so that users can use it as a photo browser.
Figure 7 shows the program of the application. Locationtracking data, stay point data and photo data are counted bycount filters, and used to visualize map and photo as weight.
Users can learn how many times he or she visited a cer-tain point, i.e. a weight of the point, in behavior history.
5. Evaluation
In this section we evaluate the performance of themPATH system. It shows if the response of the system isenough to develop analysis and visualization methods inter-actively. It can also be used to find functions which shouldbe improved. For measuring the performance, we used theenvironment shown in table 1 and used data shown in table
Proceedings of the 19th International Conference on Advanced Information Networking and Applications (AINA’05)
1550-445X/05 $20.00 © 2005 IEEE
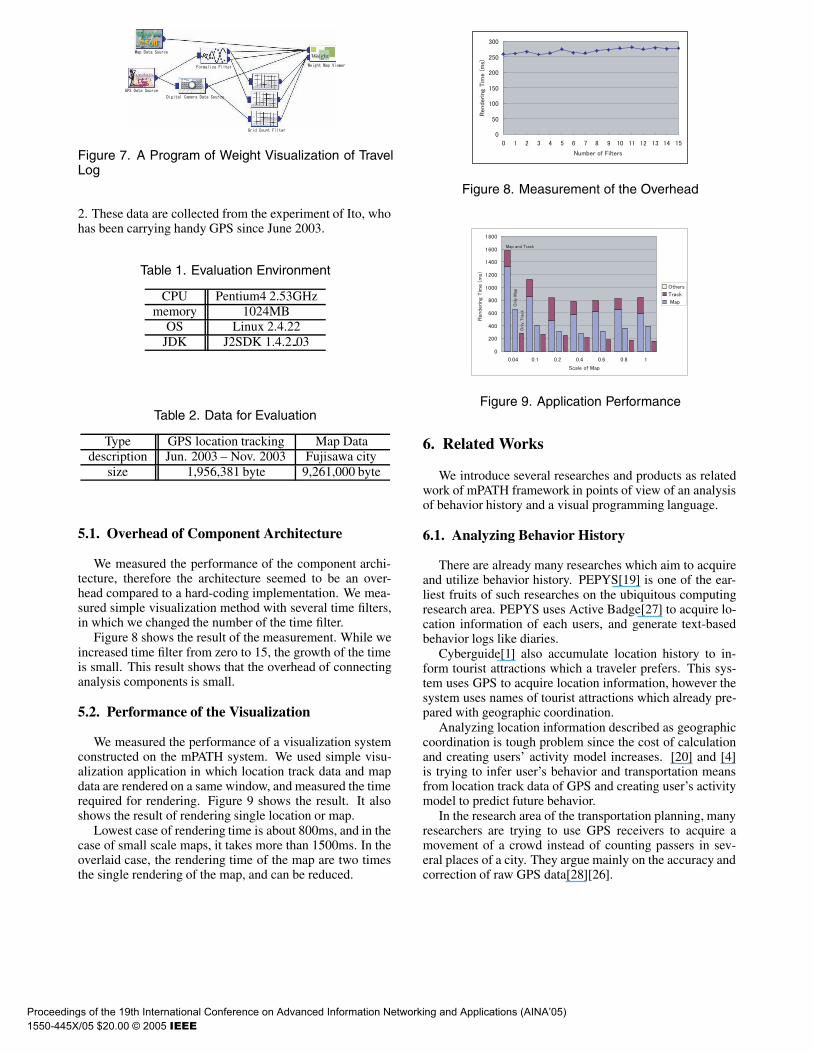
Figure 7. A Program of Weight Visualization of TravelLog
2. These data are collected from the experiment of Ito, whohas been carrying handy GPS since June 2003.
Table 1. Evaluation Environment
CPU Pentium4 2.53GHzmemory 1024MB
OS Linux 2.4.22JDK J2SDK 1.4.2 03
Table 2. Data for Evaluation
Type GPS location tracking Map Datadescription Jun. 2003 – Nov. 2003 Fujisawa city
size 1,956,381 byte 9,261,000 byte
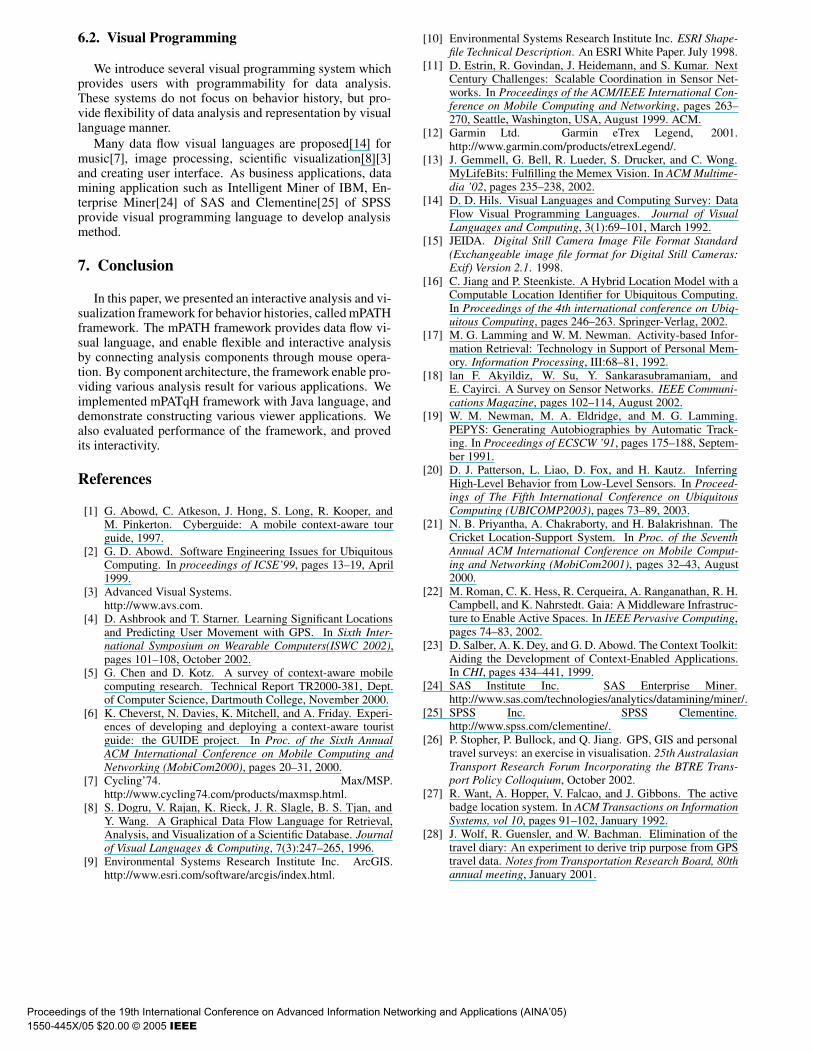
5.1. Overhead of Component Architecture
We measured the performance of the component archi-tecture, therefore the architecture seemed to be an over-head compared to a hard-coding implementation. We mea-sured simple visualization method with several time filters,in which we changed the number of the time filter.
Figure 8 shows the result of the measurement. While weincreased time filter from zero to 15, the growth of the timeis small. This result shows that the overhead of connectinganalysis components is small.
5.2. Performance of the Visualization
We measured the performance of a visualization systemconstructed on the mPATH system. We used simple visu-alization application in which location track data and mapdata are rendered on a same window, and measured the timerequired for rendering. Figure 9 shows the result. It alsoshows the result of rendering single location or map.
Lowest case of rendering time is about 800ms, and in thecase of small scale maps, it takes more than 1500ms. In theoverlaid case, the rendering time of the map are two timesthe single rendering of the map, and can be reduced.
Figure 8. Measurement of the Overhead
Figure 9. Application Performance
6. Related Works
We introduce several researches and products as relatedwork of mPATH framework in points of view of an analysisof behavior history and a visual programming language.
6.1. Analyzing Behavior History
There are already many researches which aim to acquireand utilize behavior history. PEPYS[19] is one of the ear-liest fruits of such researches on the ubiquitous computingresearch area. PEPYS uses Active Badge[27] to acquire lo-cation information of each users, and generate text-basedbehavior logs like diaries.
Cyberguide[1] also accumulate location history to in-form tourist attractions which a traveler prefers. This sys-tem uses GPS to acquire location information, however thesystem uses names of tourist attractions which already pre-pared with geographic coordination.
Analyzing location information described as geographiccoordination is tough problem since the cost of calculationand creating users’ activity model increases. [20] and [4]is trying to infer user’s behavior and transportation meansfrom location track data of GPS and creating user’s activitymodel to predict future behavior.
In the research area of the transportation planning, manyresearchers are trying to use GPS receivers to acquire amovement of a crowd instead of counting passers in sev-eral places of a city. They argue mainly on the accuracy andcorrection of raw GPS data[28][26].
Proceedings of the 19th International Conference on Advanced Information Networking and Applications (AINA’05)
1550-445X/05 $20.00 © 2005 IEEE
6.2. Visual Programming
We introduce several visual programming system whichprovides users with programmability for data analysis.These systems do not focus on behavior history, but pro-vide flexibility of data analysis and representation by visuallanguage manner.
Many data flow visual languages are proposed[14] formusic[7], image processing, scientific visualization[8][3]and creating user interface. As business applications, datamining application such as Intelligent Miner of IBM, En-terprise Miner[24] of SAS and Clementine[25] of SPSSprovide visual programming language to develop analysismethod.
7. Conclusion
In this paper, we presented an interactive analysis and vi-sualization framework for behavior histories, called mPATHframework. The mPATH framework provides data flow vi-sual language, and enable flexible and interactive analysisby connecting analysis components through mouse opera-tion. By component architecture, the framework enable pro-viding various analysis result for various applications. Weimplemented mPATqH framework with Java language, anddemonstrate constructing various viewer applications. Wealso evaluated performance of the framework, and provedits interactivity.
References
[1] G. Abowd, C. Atkeson, J. Hong, S. Long, R. Kooper, andM. Pinkerton. Cyberguide: A mobile context-aware tourguide, 1997.
[2] G. D. Abowd. Software Engineering Issues for UbiquitousComputing. In proceedings of ICSE’99, pages 13–19, April1999.
[3] Advanced Visual Systems.http://www.avs.com.
[4] D. Ashbrook and T. Starner. Learning Significant Locationsand Predicting User Movement with GPS. In Sixth Inter-national Symposium on Wearable Computers(ISWC 2002),pages 101–108, October 2002.
[5] G. Chen and D. Kotz. A survey of context-aware mobilecomputing research. Technical Report TR2000-381, Dept.of Computer Science, Dartmouth College, November 2000.
[6] K. Cheverst, N. Davies, K. Mitchell, and A. Friday. Experi-ences of developing and deploying a context-aware touristguide: the GUIDE project. In Proc. of the Sixth AnnualACM International Conference on Mobile Computing andNetworking (MobiCom2000), pages 20–31, 2000.
[7] Cycling’74. Max/MSP.http://www.cycling74.com/products/maxmsp.html.
[8] S. Dogru, V. Rajan, K. Rieck, J. R. Slagle, B. S. Tjan, andY. Wang. A Graphical Data Flow Language for Retrieval,Analysis, and Visualization of a Scientific Database. Journalof Visual Languages & Computing, 7(3):247–265, 1996.
[9] Environmental Systems Research Institute Inc. ArcGIS.http://www.esri.com/software/arcgis/index.html.
[10] Environmental Systems Research Institute Inc. ESRI Shape-file Technical Description. An ESRI White Paper. July 1998.
[11] D. Estrin, R. Govindan, J. Heidemann, and S. Kumar. NextCentury Challenges: Scalable Coordination in Sensor Net-works. In Proceedings of the ACM/IEEE International Con-ference on Mobile Computing and Networking, pages 263–270, Seattle, Washington, USA, August 1999. ACM.
[12] Garmin Ltd. Garmin eTrex Legend, 2001.http://www.garmin.com/products/etrexLegend/.
[13] J. Gemmell, G. Bell, R. Lueder, S. Drucker, and C. Wong.MyLifeBits: Fulfilling the Memex Vision. In ACM Multime-dia ’02, pages 235–238, 2002.
[14] D. D. Hils. Visual Languages and Computing Survey: DataFlow Visual Programming Languages. Journal of VisualLanguages and Computing, 3(1):69–101, March 1992.
[15] JEIDA. Digital Still Camera Image File Format Standard(Exchangeable image file format for Digital Still Cameras:Exif) Version 2.1. 1998.
[16] C. Jiang and P. Steenkiste. A Hybrid Location Model with aComputable Location Identifier for Ubiquitous Computing.In Proceedings of the 4th international conference on Ubiq-uitous Computing, pages 246–263. Springer-Verlag, 2002.
[17] M. G. Lamming and W. M. Newman. Activity-based Infor-mation Retrieval: Technology in Support of Personal Mem-ory. Information Processing, III:68–81, 1992.
[18] lan F. Akyildiz, W. Su, Y. Sankarasubramaniam, andE. Cayirci. A Survey on Sensor Networks. IEEE Communi-cations Magazine, pages 102–114, August 2002.
[19] W. M. Newman, M. A. Eldridge, and M. G. Lamming.PEPYS: Generating Autobiographies by Automatic Track-ing. In Proceedings of ECSCW ’91, pages 175–188, Septem-ber 1991.
[20] D. J. Patterson, L. Liao, D. Fox, and H. Kautz. InferringHigh-Level Behavior from Low-Level Sensors. In Proceed-ings of The Fifth International Conference on UbiquitousComputing (UBICOMP2003), pages 73–89, 2003.
[21] N. B. Priyantha, A. Chakraborty, and H. Balakrishnan. TheCricket Location-Support System. In Proc. of the SeventhAnnual ACM International Conference on Mobile Comput-ing and Networking (MobiCom2001), pages 32–43, August2000.
[22] M. Roman, C. K. Hess, R. Cerqueira, A. Ranganathan, R. H.Campbell, and K. Nahrstedt. Gaia: A Middleware Infrastruc-ture to Enable Active Spaces. In IEEE Pervasive Computing,pages 74–83, 2002.
[23] D. Salber, A. K. Dey, and G. D. Abowd. The Context Toolkit:Aiding the Development of Context-Enabled Applications.In CHI, pages 434–441, 1999.
[24] SAS Institute Inc. SAS Enterprise Miner.http://www.sas.com/technologies/analytics/datamining/miner/.
[25] SPSS Inc. SPSS Clementine.http://www.spss.com/clementine/.
[26] P. Stopher, P. Bullock, and Q. Jiang. GPS, GIS and personaltravel surveys: an exercise in visualisation. 25th AustralasianTransport Research Forum Incorporating the BTRE Trans-port Policy Colloquium, October 2002.
[27] R. Want, A. Hopper, V. Falcao, and J. Gibbons. The activebadge location system. In ACM Transactions on InformationSystems, vol 10, pages 91–102, January 1992.
[28] J. Wolf, R. Guensler, and W. Bachman. Elimination of thetravel diary: An experiment to derive trip purpose from GPStravel data. Notes from Transportation Research Board, 80thannual meeting, January 2001.
Proceedings of the 19th International Conference on Advanced Information Networking and Applications (AINA’05)
1550-445X/05 $20.00 © 2005 IEEE