VizKid: a behavior capture and visualization system of adult-child interaction
10
VizKid: A Behavior Capture and Visualization System of Adult-Child Interaction Grace Shin, Taeil Choi, Agata Rozga, Mario Romero College of Computing Georgia Institute of Technology, Atlanta, GA, USA {gshin37, tchoi6, agata, mario}@gatech.edu Abstract. We present VizKid, a capture and visualization system for supporting the analysis of social interactions between two individuals. The development of this system is motivated by the need for objective measures of social approach and avoidance behaviors of children with autism. VizKid visualizes the position and orientation of an adult and a child as they interact with one another over an extended period of time. We report on the design of VizKid and its rationale. Keywords: Spatiotemporal visualization, mutual orientation, instantaneous distance, behavior analytics. 1 Introduction The development of VizKid was motivated by the increased prevalence of Autism Spectrum Disorders (ASDs) in the United States, and the concomitant need for objective measures of social behavior to help diagnose the condition and to track children’s development [1]. In particular, measures of the extent to which children with autism seek or avoid social interactions figure prominently in evaluating treatment outcomes for this population [2]. Current methods for measuring such behaviors typically involve parent or teacher-report questionnaires [3, 4], or time- sampled direct observations of specific behaviors [5-7]. The behaviors of particular interest are typically the number of approaches the child makes to their interactive partner, the child’s responsiveness to the interactive partner’s social bids, and the amount of time the child spends in proximity to the partner versus alone in solitary play [5-7]. Whereas parent and teacher reports of such behavior are inherently subjective and may be unduly influenced by external factors, direct observations are often too labor and time intensive to scale up. The current project takes a first step toward developing new objective measures for capturing and visualizing the extent to which a child seeks or avoids social interaction. We take as our starting point interactions between two individuals. After consulting with behavior analysts and therapists at a local autism treatment center, we built a video visualization system that supports the analysis of social approach and social avoidance through interactive graphs of mutual distance and orientation between the two individuals.
Transcript of VizKid: a behavior capture and visualization system of adult-child interaction
VizKid: A Behavior Capture and Visualization System
of Adult-Child Interaction
Grace Shin, Taeil Choi, Agata Rozga, Mario Romero College of Computing
Georgia Institute of Technology, Atlanta, GA, USA {gshin37, tchoi6, agata, mario}@gatech.edu
Abstract. We present VizKid, a capture and visualization system for supporting the analysis of social interactions between two individuals. The development of
this system is motivated by the need for objective measures of social approach and avoidance behaviors of children with autism. VizKid visualizes the position and orientation of an adult and a child as they interact with one another over an extended period of time. We report on the design of VizKid and its rationale.
Keywords: Spatiotemporal visualization, mutual orientation, instantaneous distance, behavior analytics.
1 Introduction
The development of VizKid was motivated by the increased prevalence of Autism
Spectrum Disorders (ASDs) in the United States, and the concomitant need for
objective measures of social behavior to help diagnose the condition and to track
children’s development [1]. In particular, measures of the extent to which children
with autism seek or avoid social interactions figure prominently in evaluating treatment outcomes for this population [2]. Current methods for measuring such
behaviors typically involve parent or teacher-report questionnaires [3, 4], or time-
sampled direct observations of specific behaviors [5-7]. The behaviors of particular
interest are typically the number of approaches the child makes to their interactive
partner, the child’s responsiveness to the interactive partner’s social bids, and the
amount of time the child spends in proximity to the partner versus alone in solitary
play [5-7]. Whereas parent and teacher reports of such behavior are inherently
subjective and may be unduly influenced by external factors, direct observations are often too labor and time intensive to scale up.
The current project takes a first step toward developing new objective measures for
capturing and visualizing the extent to which a child seeks or avoids social interaction. We take as our starting point interactions between two individuals. After consulting
with behavior analysts and therapists at a local autism treatment center, we built a
video visualization system that supports the analysis of social approach and social
avoidance through interactive graphs of mutual distance and orientation between the
two individuals.
2 Related Work
VizKid belongs to the large family of visualization systems that extract meaningful
features from image sequences with the aim of highlighting evidence of target events
without having to linearly browse the video. Here, we provide some of the most
relevant examples from the literature. Daniel and Chen present one of the first
abstract visualizations of behavior in video [10]. They visualize motion in a
translucent space-time cube by mapping greater motion to greater opaqueness, thus
enabling an operator to see through inactive regions and focus on the space-time
volumes where the action occurred. Ivanov et al. present a visualization of the history of living spaces [12]. The authors provide 2D visualizations of space augmented with
motion detection and video data. Through motion detection and path reconstruction,
they visualize the historical flow of people through a building and provide contextual
detail, such as people, objects, and actions, through strategic camera views. Romero et
al. visualize activity in Viz-A-Vis as a stack of 2D aggregate motion heat maps on top
of the space under observation, similar to a geographic information system [14]. The
translucent heat maps have a near one-to-one correspondence with architectural space
that naturally supports space-centric queries. Viz-A-Vis also visualizes aggregate activity in places and periods of interest on the cells of an activity table. Large
patterns of space usage are visible and open for interpretation and analysis coupled
with sequences from the original video. Kubat et al.’s TotalRecall visualizes long-
term video from real home environments in a 2D representation [13]. TotalRecall
slides frames like cards spread out from a deck. The visual effect is that each 2D
location in the visualization is a combination of multiple spatiotemporal coordinates
that provides an overview structure. Crnovrsanin et at. present a proximity-based
visualization plotting traces as distance to a point of interest vs. time [9]. The proximity-based visualization is particularly relevant to our re-mapping of coordinate
systems to highlight relevant events. DeCamp et al. reconstruct the 3D geometry of
the space under observation and project the historical paths of the occupants of the
place into the 3D coordinates in space [11]. Botchen et al. present a 2D time lapse
video visualization with highlighted abstractions of target objects and activities [8].
3 System Implementation
The goal of VizKid is to facilitate the observation and analysis of the flow of the
interaction between two individuals. Specifically, the system’s success will depend on
the extent to which it helps behavior analysts understand reciprocal interactions
between the child under observation and the person interacting with the child. We
implemented the backend of VizKid in Matlab and the frontend in Processing, a Java-
based open source programming language geared towards interactive visualizations.
The next sections describe the three phases of the system: data collection, data
annotation and aggregation, and data visualization.
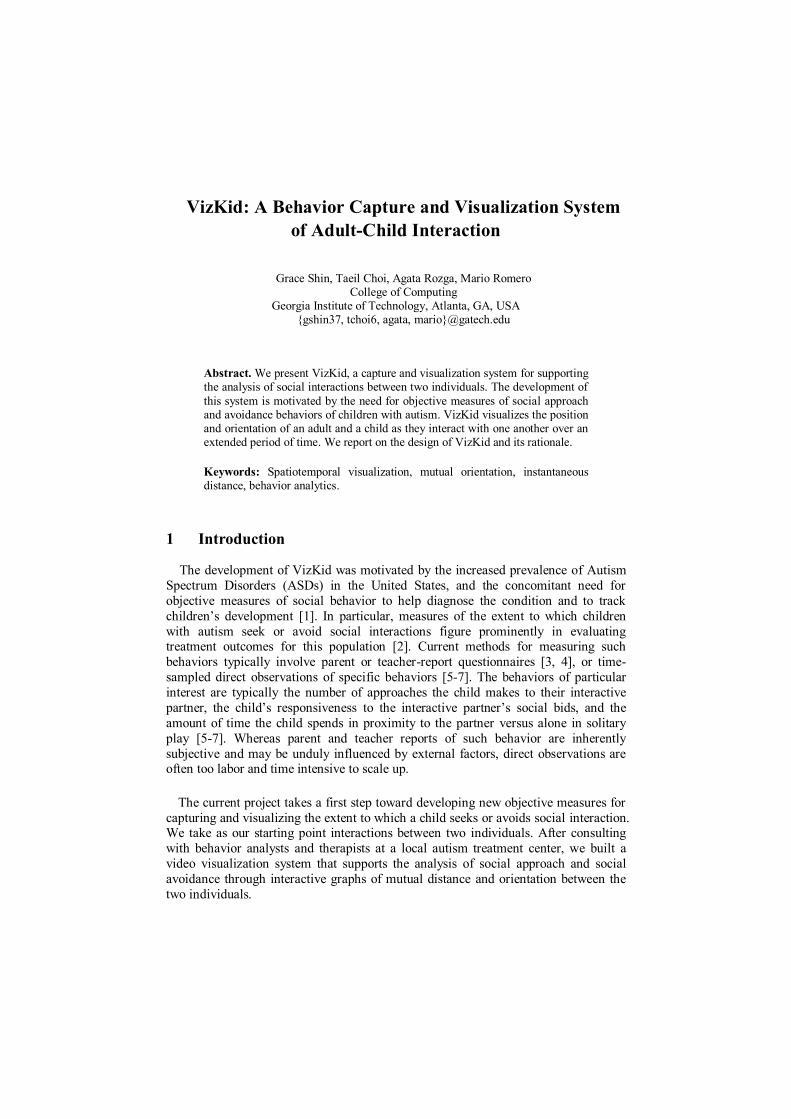
Fig. 1. (a) The inside view of the assessment room. (b) The observation room. (c) A schematic
of the camera deployment in the assessment room.
3.1 Data Collection
We collected the data for designing VizKid at Georgia Tech’s Child Study
Laboratory (CSL), an experimental environment designed to mirror a typical
playroom while facilitating the collection of high-quality video and audio data for
behavioral experiments. CSL consists of two components. The first is an assessment room measuring 14 by 21 feet where data collection takes place. The assessment
room is equipped with child-friendly furniture and toys (see Figure 1a). The second
component of CSL is an observation and control room from which we can monitor
the activity in the assessment room and manage the data collection. A human operator
controls the cameras to optimize the data collection based on position, orientation,
and observed behaviors (see Figure 1b). The assessment room is equipped with 11
cameras, eight around the perimeter of the room and three overhead cameras that fully
cover the floor plan (see Figure 1c). For developing VizKid, we collected video from the overhead camera positioned directly in the middle of the ceiling. The overhead
cameras are Axis 209 MFD recording motion JPEG at a resolution of 640 by 480
pixels (VGA) and at 30 frames per second. We replaced the standard lens with a
shorter 2.8 mm lens with aperture F2.6 and an angle of view of 106°.
One adult and one child participated in a one-hour recording session at CSL. We
provided the participants with a set of play materials (painting set, train set, and
blocks) and told them to play and engage as they wished. We classified a large
number of captured activities, including table-top interaction, floor-play, and larger
movements around the room. To manually pinpoint location and orientation, we selected a representative segment of video lasting 15 minutes and we manually coded
450 frames at a frequency of one frame every two seconds.
3.2 Data annotation and aggregation
We built a simple Matlab application to click on the center of the shoulders and on a vector heading denoting the orientation of the each individual. This resulted in four
clicks per frame or 1800 clicks for the 450-frame sequence at one frame every two
seconds. This Wizard of Oz solution replaces a computer vision system that would
track blob location and orientation. In the future, we will automate this extraction
process by placing colored shoulder pads or similar fiducial markers on the
individuals’ shoulders and by using robust computer vision techniques to accurately
compute location and orientation.
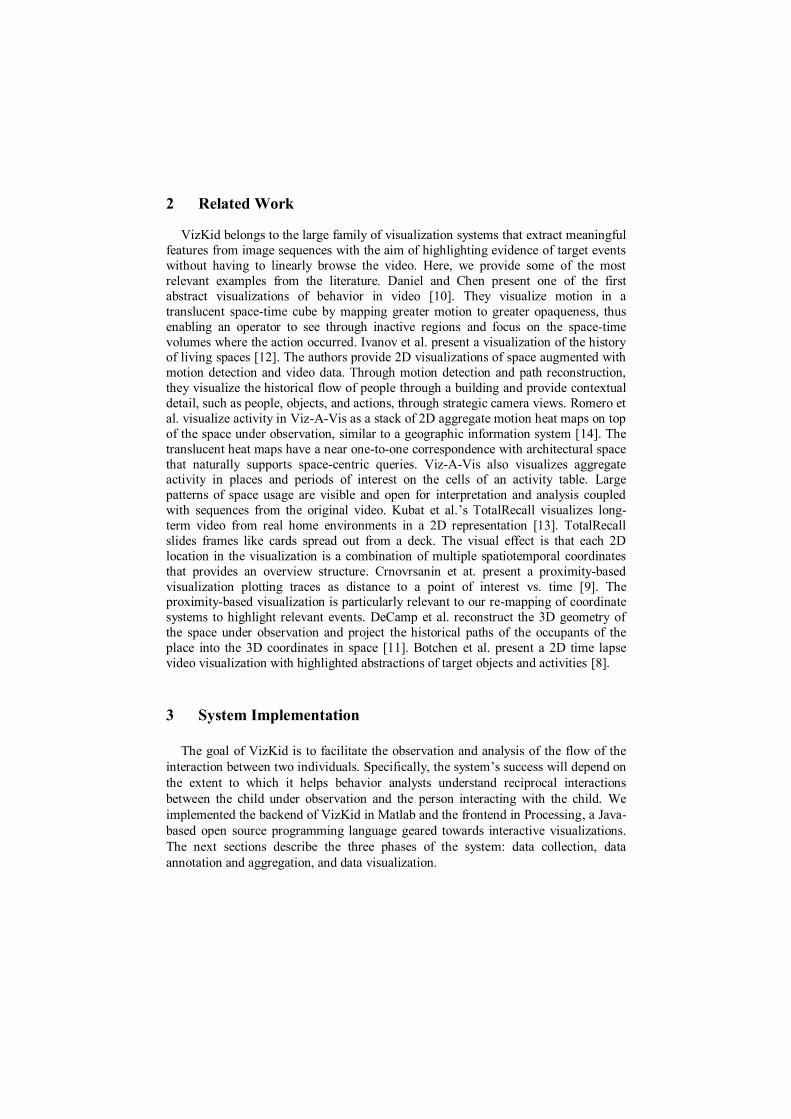
Figure 2 shows the world coordinate system of two individuals, the adult and the child. The distance d of the adult and the child is measured from the center of the
adult’s shoulders to the center of the child’s shoulders in pixels. Orientation values 1
and 2 are obtained by calculating the angles between the line connecting the two individuals and their individual orientations, as defined above. Note that we are not
marking the orientation of the head, which would require a fiducial maker on it. In our
figure, the orientation of the head is denoted by the small black triangle. Rather, we
are marking the orientation of the vector perpendicular to the line connecting the
shoulders, where we will place the markers. We considered it would be more robust
and less invasive to compute the orientation of the chest as an approximation to social
orientation. In future work, we may place fiducial markers on the head as well, especially if our preliminary experiments determine the necessity for them.
Fig. 2. The world coordinate system of the individuals.
From the subjects’ locations, we compute the Euclidian distance between them in
image space using the Pythagorean Theorem and the angle of the line connecting the
two points. We do not calibrate the cameras or reconstruct physical world coordinates.
Thus, distance is not in meters or feet, but in pixels. Because of wide-angle
perspective projection from a 3D world to a 2D image space and because of wide-
angle lens optical distortions, the mapping between pixel distances and physical
distance in a one-camera system is a computationally under-constrained problem.
Furthermore, a heuristic approximation to physical distance is complex and requires
some understanding of the scene, such as people’s height. Again, this metric simply
approximates the common idea of social distance. Part of the purpose of the current
work is to determine the level of accuracy necessary to provide useful support to behavior analysis. If we determine that pixel distance is not enough, we will
reconstruct physical distance with more complex vision algorithms.
Because we wish to visualize distance and orientation on the same graph, we
normalize the two measures to be on the same unit-less scale. To normalize distance,
we linearly map the diagonal of the image (an approximation to the room’s diagonal)
to 1.0 and two adjacent pixels to 0.0. Thus, the furthest two people can be apart is 1.0
and the closest is 0.0. Again, this measure is a simple approximation where we do not
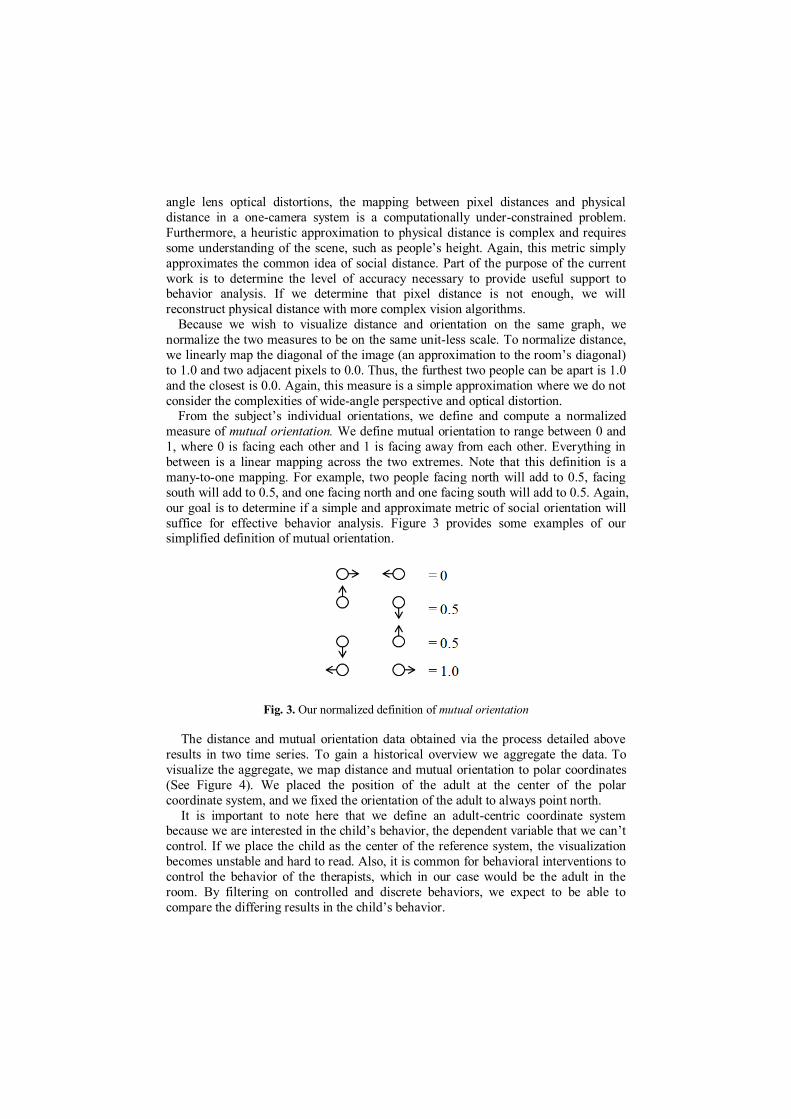
consider the complexities of wide-angle perspective and optical distortion. From the subject’s individual orientations, we define and compute a normalized
measure of mutual orientation. We define mutual orientation to range between 0 and
1, where 0 is facing each other and 1 is facing away from each other. Everything in
between is a linear mapping across the two extremes. Note that this definition is a
many-to-one mapping. For example, two people facing north will add to 0.5, facing
south will add to 0.5, and one facing north and one facing south will add to 0.5. Again,
our goal is to determine if a simple and approximate metric of social orientation will
suffice for effective behavior analysis. Figure 3 provides some examples of our simplified definition of mutual orientation.
Fig. 3. Our normalized definition of mutual orientation
The distance and mutual orientation data obtained via the process detailed above
results in two time series. To gain a historical overview we aggregate the data. To
visualize the aggregate, we map distance and mutual orientation to polar coordinates
(See Figure 4). We placed the position of the adult at the center of the polar
coordinate system, and we fixed the orientation of the adult to always point north.
It is important to note here that we define an adult-centric coordinate system because we are interested in the child’s behavior, the dependent variable that we can’t
control. If we place the child as the center of the reference system, the visualization
becomes unstable and hard to read. Also, it is common for behavioral interventions to
control the behavior of the therapists, which in our case would be the adult in the
room. By filtering on controlled and discrete behaviors, we expect to be able to
compare the differing results in the child’s behavior.
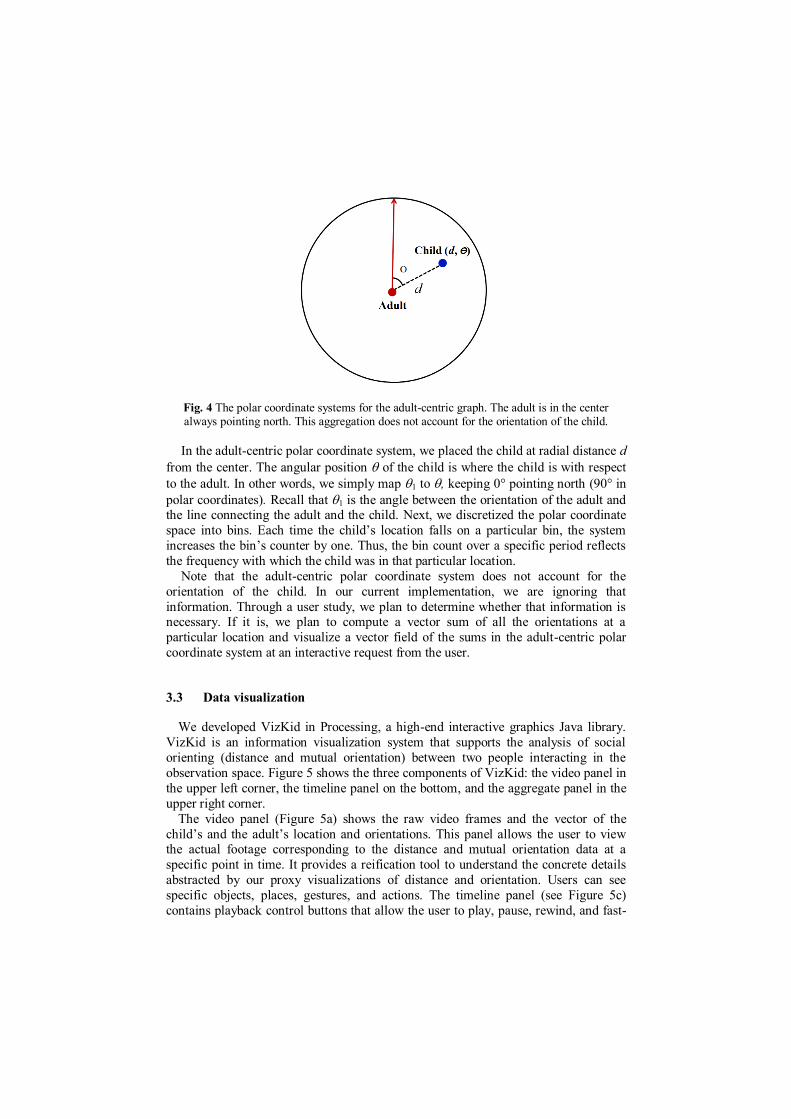
Fig. 4 The polar coordinate systems for the adult-centric graph. The adult is in the center always pointing north. This aggregation does not account for the orientation of the child.
In the adult-centric polar coordinate system, we placed the child at radial distance d
from the center. The angular position of the child is where the child is with respect
to the adult. In other words, we simply map 1 to , keeping 0° pointing north (90° in
polar coordinates). Recall that 1 is the angle between the orientation of the adult and the line connecting the adult and the child. Next, we discretized the polar coordinate
space into bins. Each time the child’s location falls on a particular bin, the system
increases the bin’s counter by one. Thus, the bin count over a specific period reflects
the frequency with which the child was in that particular location.
Note that the adult-centric polar coordinate system does not account for the
orientation of the child. In our current implementation, we are ignoring that
information. Through a user study, we plan to determine whether that information is necessary. If it is, we plan to compute a vector sum of all the orientations at a
particular location and visualize a vector field of the sums in the adult-centric polar
coordinate system at an interactive request from the user.
3.3 Data visualization
We developed VizKid in Processing, a high-end interactive graphics Java library.
VizKid is an information visualization system that supports the analysis of social
orienting (distance and mutual orientation) between two people interacting in the
observation space. Figure 5 shows the three components of VizKid: the video panel in
the upper left corner, the timeline panel on the bottom, and the aggregate panel in the
upper right corner.
The video panel (Figure 5a) shows the raw video frames and the vector of the
child’s and the adult’s location and orientations. This panel allows the user to view the actual footage corresponding to the distance and mutual orientation data at a
specific point in time. It provides a reification tool to understand the concrete details
abstracted by our proxy visualizations of distance and orientation. Users can see
specific objects, places, gestures, and actions. The timeline panel (see Figure 5c)
contains playback control buttons that allow the user to play, pause, rewind, and fast-
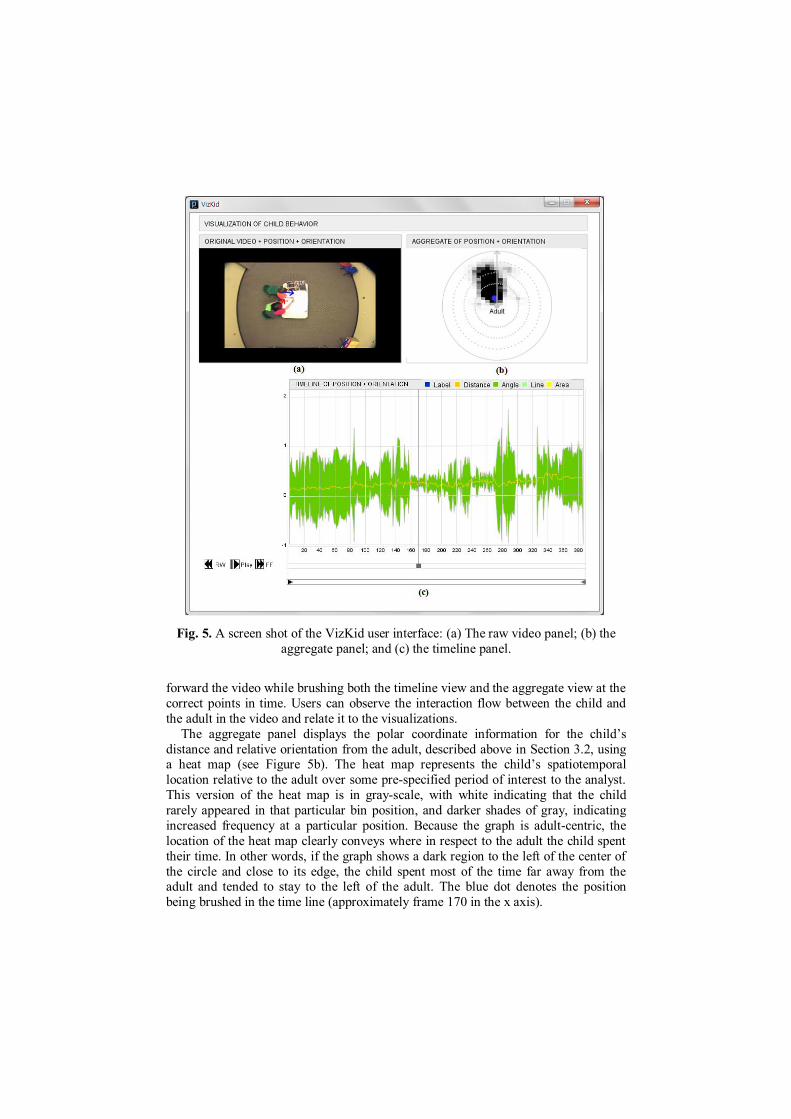
forward the video while brushing both the timeline view and the aggregate view at the
correct points in time. Users can observe the interaction flow between the child and
the adult in the video and relate it to the visualizations.
The aggregate panel displays the polar coordinate information for the child’s
distance and relative orientation from the adult, described above in Section 3.2, using a heat map (see Figure 5b). The heat map represents the child’s spatiotemporal
location relative to the adult over some pre-specified period of interest to the analyst.
This version of the heat map is in gray-scale, with white indicating that the child
rarely appeared in that particular bin position, and darker shades of gray, indicating
increased frequency at a particular position. Because the graph is adult-centric, the
location of the heat map clearly conveys where in respect to the adult the child spent
their time. In other words, if the graph shows a dark region to the left of the center of
the circle and close to its edge, the child spent most of the time far away from the adult and tended to stay to the left of the adult. The blue dot denotes the position
being brushed in the time line (approximately frame 170 in the x axis).
Fig. 5. A screen shot of the VizKid user interface: (a) The raw video panel; (b) the
aggregate panel; and (c) the timeline panel.
A double-sided arrow slide bar at the bottom of the timeline allows users to specify
the window of time over which they wish to aggregate position and orientation data. It
is a tool for dynamic queries. This aspect of the visualization goes beyond a single
moment in time to allow the user to define and observe at a glance how the child
interacted with the adult over some specific period, such as a particular condition
within an experiment or even over the course of the entire experiment. Figure 5c shows the timeline panel that graphs normalized position and orientation
on the vertical axis and time on the horizontal axis. The yellow line shows the
normalized distance and the green area is formed by adding and subtracting the
normalized mutual orientation from the normalized distance. This common
information visualization technique is called Theme Rivers and it is meant to make
visible the patterns in a multivariate time series. Moment by moment, the
instantaneous mutual orientation is both added and subtracted from the instantaneous
distance. Thus, the possible range of values goes from -1 to 2. In other words, the smallest possible value for distance is 0 and the largest possible value for mutual
orientation is 1. If you subtract this value of orientation from distance, you get -1. On
the other hand, if you add the largest possible value for orientation, 1, to the largest
possible value for distance, 1, you get 2. So, the combined normalized scale is [-1:2].
To interpret the visualization the user needs to keep track of the center and the width
of the green area: the wider the area, the less oriented towards each other the
individuals; the higher the center, the more distant the individuals. It is important to
note that a single (x, y) coordinate in this graph is an ambiguous representation due to the fact that multiple distances and orientations may add up to the same value. We
disambiguate the graph by including both metrics in yellow and green.
5 Conclusions and Future Direction
We developed VizKid, a capture and visualization system with the aim of
facilitating more fine-grained examination of children’s social approach and
avoidance behaviors over the course of an extended interaction. The main
contribution of VizKid is the user interface, particularly the integration of the
visualization of the interactions between a child and an adult with original video
frames, and a means for aggregating and visualizing the distance and orientation data
over various time scales. Our next step is to deploy this system with our collaborators at a local treatment center for children with autism, and via a series of case studies,
examine how they apply the system to analyze practical problems, and refine the
system based on their feedback.
On the technical end, we will incorporate computer vision techniques to
automatically extract the spatiotemporal data reflecting the relative orientations and
positions of the individuals being observed. One proposal for doing so is to attach
different colored patches on both of the adult’s and the child’s shoulders and to use
color detection techniques to automatically detect the position of each shoulder. By doing so, we will be able to calibrate the positions of the shoulders and, consequently,
the positions and orientations of the adult and the child. Based on the psychological
and behavioral literature on measuring social behavior in autism, the future
functionality of the system includes: 1) additional capabilities that quantify the
aggregated data; 2) specific measures of who initiates social contact; and 3) the ability
to track the child’s social approach and avoidance behavior to multiple individuals at
the same time. We expect this functionality to approach the affordances necessary for
VizKid to collect and analyze data in real environments, such as in a daycare or in a
school setting.
Acknowledgements
The work described in this paper was supported by the NSF Expeditions Award 1029679. We thank the mother and child who participated in our data collection and
the behavior analysts who guided our design.
References
1. C. Rice, "Prevalence of autism spectrum disorders - Autism and Developmental Disabilities Monitoring Network," MMWR Surveillance Summary, vol. 58, no. 10, pp. 1-20, 2009.
2. S.W. White, K. Koenig, & L. Scahill, “Group Social Skills Instruction for Adolescents With High-Functioning Autism Spectrum Disorders,” Focus on Autism and Other Developmental Disabilities, online-first publication, September 24, 2010.
3. F. M. Gresham & S. N. Elliott, “The Social Skills Rating System,”Circle Pines, MN: American Guidance Service, 1990.
4. P. Castelloe & G. Dawson, “Subclassification of children with autism and pervasive developmental disorder: A questionnaire based on Wing's Subgrouping scheme,” Journal of Autism and Pervasive Developmental Disorders, vol. 23, no. 2, pp. 229-241, 1993.
5. C. Lord & J. Magill-Evans, “Peer interactions of autistic children and adolescents,” Development and Psychopathology, vol. 7, no. 4, pp. 611-626, 1995.
6. M. Hauck, D. Fein, & L. Waterhouse, & C. Feinstein, “Social initiations by autistic children to adults and other children,” Journal of Autism and Developmental Disorders, vol. 25, no. 6, pp. 579-95, 1995.
7. D. H. Ingram, S. D. Mayes, L. B. Troxell, & S. L. Calhoun, “Assessing children with autism, mental retardation, and typical development using the Playground Observation Checklist,” Autism, vol. 11, no. 4, pp. 311-319, 2007.
8. Botchen, R.P., F. Schick, and T. Ertl, Action-Based Multifield Video Visualization. Visualization and Computer Graphics, IEEE Transactions on, 2008. 14(4): p. 885-899.
9. Crnovrsanin, T., Muelder, C., Correa, C., Ma, K., Proximity-based Visualization of Movement Trace Data, in IEEE Symposium on Visual Analytics Science and Technology. October 12 – 13 2009, Atlantic City, New Jersey, USA.
10. Daniel, G. and M. Chen, Video Visualization, in Proceedings of the 14th IEEE Visualization 2003 (VIS'03). 2003, IEEE Computer Society.
11. DeCamp, P., Shaw, G., Kubat, R., Roy, D., An Immersive System for Browsing and
Visualizing Surveillance Video, in ACM MultiMedia, MM 2010. Milan: October 25 – 29, 2010.

12. Ivanov, Y., et al., Visualizing the History of Living Spaces. Visualization and Computer Graphics, IEEE Transactions on, 2007. 13(6): p. 1153-1160.
13. Kubat, R., et al. TotalRecall: Visualization and Semi-Automatic Annotation of Very Large Audio-Visual Corpora. in Ninth International Conference on Multimodal Interfaces (ICMI 2007). 2007.
14. Romero, M., Summet, J., Stasko, J., Abowd, G., "Viz-A-Vis: Toward Visualizing Video through Computer Vision." Visualization and Computer Graphics, IEEE Transactions on. 2008. 14(6): p. 1261-1268.