Interactive Hierarchical Data Investigation using Abstractions ‐ the Waltz Visualization...
10
Interactive Hierarchical Data Investigation using Abstractions – the Waltz Visualization Environment Dr. Jonathan C. Roberts Computing Laboratory, University of Kent, Canterbury, Kent, CT2 7NF, UK [email protected] Technical Report 24-96 December 19, 1996 Abstract Scientific visualization is becoming common in the work-place; hastened by the growth in the power of computers generating data that needs to be visualized. There is a desire to generate quick representations of the data, that can be used to select and specialize the data into smaller manageable sections. This paper describes a visualization environment (Waltz) where the user can segment the data into inter- esting features, select a subset of the features, interact and manipulate the images between views: controlled by the notion of linked abstractions. An abstraction is a view of the data in which the data elements are trans- formed or augmented to facilitate the understanding of the data. 1 Introduction and Motivation Many popular visualization systems [25, 1, 34, 3, 29] are based on the data-flow paradigm. These environ- ments usually provide a visual programming interface, where the user connects a suite of modules that filter, map and display the data. These systems are extensible and adaptable: as user defined modules can be incor- porated and used with existing modules. However the visualization process is often long and involved, requir- ing many modules to achieve a correct visualization. Other visualization environments provide a suite of classes, types and functions that are programmed, inter- preted or compiled to produce the visualization result [9, 16, 23, 14, 5]. These environments are powerful vi- sualization tools, but require programming and specific expertise to generate the visualization image. Our aim is to generate a visualization system that will shorten the visualization cycle, in that the user can im- mediately depict a view of the data, understanding how to generate additional views and dissections of the data. We believe that this can be achieved using the concept of abstractions in the design and implementation of a visualization system. In this paper we define an ‘abstract image’: abbre- viated as an abstraction (section 2); explain how the abstract notion is incorporated with the generalization and specialization processes to form the Waltz visu- alization Metaphor (section 3) describing the modules and user-interface to aid the data investigation using the paradigm. Within section 4 we review related work, section 5 describes some examples using the Waltz en- vironment and the paper finishes with a discussion and conclusion about the described work. 1
Transcript of Interactive Hierarchical Data Investigation using Abstractions ‐ the Waltz Visualization...
Interactive Hierarchical Data Investigation using Abstractions –the Waltz Visualization Environment
Dr. Jonathan C. Roberts
Computing Laboratory,University of Kent,
Canterbury,Kent, CT2 7NF, UK
Technical Report 24-96
December 19, 1996
Abstract
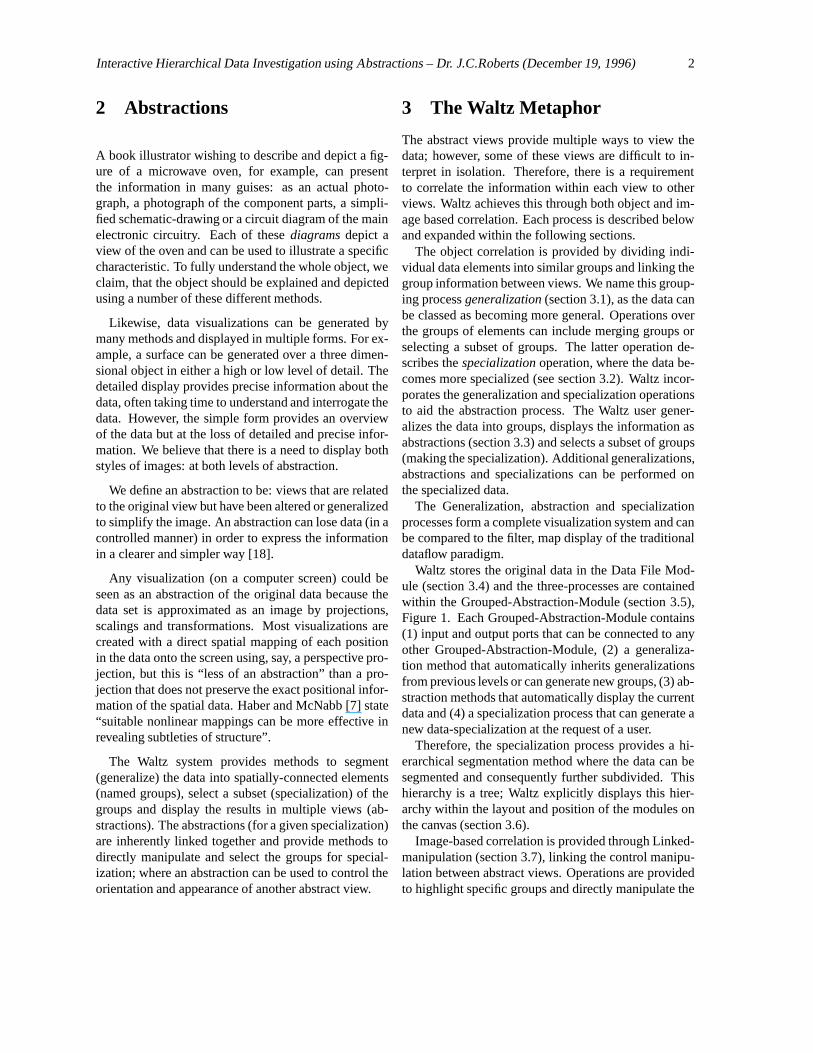
Scientific visualization is becoming common in thework-place; hastened by the growth in the power ofcomputers generating data that needs to be visualized.There is a desire to generate quick representations ofthe data, that can be used to select and specialize thedata into smaller manageable sections.
This paper describes a visualization environment(Waltz) where the user can segment the data into inter-esting features, select a subset of the features, interactand manipulate the images between views: controlledby the notion of linked abstractions. An abstraction isa view of the data in which the data elements are trans-formed or augmented to facilitate the understanding ofthe data.
1 Introduction and Motivation
Many popular visualization systems [25, 1, 34, 3, 29]are based on the data-flow paradigm. These environ-ments usually provide a visual programming interface,where the user connects a suite of modules that filter,map and display the data. These systems are extensibleand adaptable: as user defined modules can be incor-porated and used with existing modules. However the
visualization process is often long and involved, requir-ing many modules to achieve a correct visualization.
Other visualization environments provide a suite ofclasses, types and functions that are programmed, inter-preted or compiled to produce the visualization result[9, 16, 23, 14, 5]. These environments are powerful vi-sualization tools, but require programming and specificexpertise to generate the visualization image.
Our aim is to generate a visualization system that willshorten the visualization cycle, in that the user can im-mediately depict a view of the data, understanding howto generate additional views and dissections of the data.We believe that this can be achieved using the conceptof abstractions in the design and implementation of avisualization system.
In this paper we define an ‘abstract image’: abbre-viated as an abstraction (section 2); explain how theabstract notion is incorporated with the generalizationand specialization processes to form the Waltz visu-alization Metaphor (section 3) describing the modulesand user-interface to aid the data investigation using theparadigm. Within section 4 we review related work,section 5 describes some examples using the Waltz en-vironment and the paper finishes with a discussion andconclusion about the described work.
1
Interactive Hierarchical Data Investigation using Abstractions – Dr. J.C.Roberts (December 19, 1996) 2
2 Abstractions
A book illustrator wishing to describe and depict a fig-ure of a microwave oven, for example, can presentthe information in many guises: as an actual photo-graph, a photograph of the component parts, a simpli-fied schematic-drawing or a circuit diagram of the mainelectronic circuitry. Each of thesediagramsdepict aview of the oven and can be used to illustrate a specificcharacteristic. To fully understand the whole object, weclaim, that the object should be explained and depictedusing a number of these different methods.
Likewise, data visualizations can be generated bymany methods and displayed in multiple forms. For ex-ample, a surface can be generated over a three dimen-sional object in either a high or low level of detail. Thedetailed display provides precise information about thedata, often taking time to understand and interrogate thedata. However, the simple form provides an overviewof the data but at the loss of detailed and precise infor-mation. We believe that there is a need to display bothstyles of images: at both levels of abstraction.
We define an abstraction to be: views that are relatedto the original view but have been altered or generalizedto simplify the image. An abstraction can lose data (in acontrolled manner) in order to express the informationin a clearer and simpler way [18].
Any visualization (on a computer screen) could beseen as an abstraction of the original data because thedata set is approximated as an image by projections,scalings and transformations. Most visualizations arecreated with a direct spatial mapping of each positionin the data onto the screen using, say, a perspective pro-jection, but this is “less of an abstraction” than a pro-jection that does not preserve the exact positional infor-mation of the spatial data. Haber and McNabb [7] state“suitable nonlinear mappings can be more effective inrevealing subtleties of structure”.
The Waltz system provides methods to segment(generalize) the data into spatially-connected elements(named groups), select a subset (specialization) of thegroups and display the results in multiple views (ab-stractions). The abstractions (for a given specialization)are inherently linked together and provide methods todirectly manipulate and select the groups for special-ization; where an abstraction can be used to control theorientation and appearance of another abstract view.
3 The Waltz Metaphor
The abstract views provide multiple ways to view thedata; however, some of these views are difficult to in-terpret in isolation. Therefore, there is a requirementto correlate the information within each view to otherviews. Waltz achieves this through both object and im-age based correlation. Each process is described belowand expanded within the following sections.
The object correlation is provided by dividing indi-vidual data elements into similar groups and linking thegroup information between views. We name this group-ing processgeneralization(section 3.1), as the data canbe classed as becoming more general. Operations overthe groups of elements can include merging groups orselecting a subset of groups. The latter operation de-scribes thespecializationoperation, where the data be-comes more specialized (see section 3.2). Waltz incor-porates the generalization and specialization operationsto aid the abstraction process. The Waltz user gener-alizes the data into groups, displays the information asabstractions (section 3.3) and selects a subset of groups(making the specialization). Additional generalizations,abstractions and specializations can be performed onthe specialized data.
The Generalization, abstraction and specializationprocesses form a complete visualization system and canbe compared to the filter, map display of the traditionaldataflow paradigm.
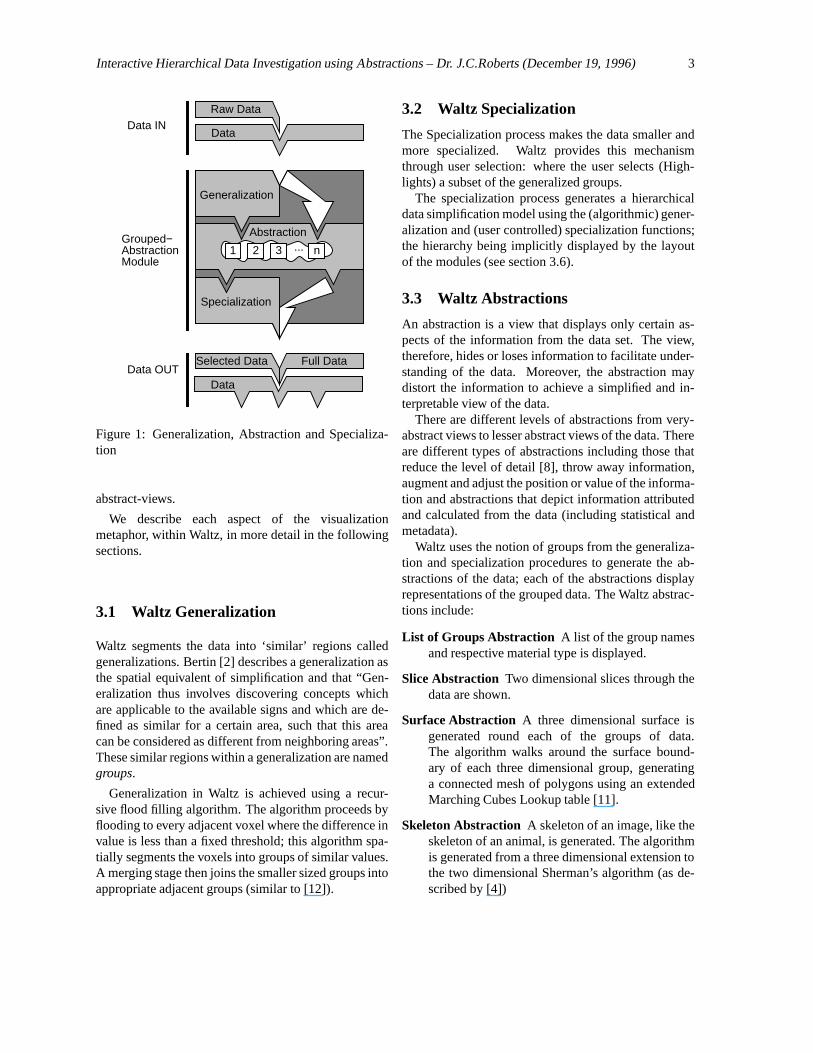
Waltz stores the original data in the Data File Mod-ule (section 3.4) and the three-processes are containedwithin the Grouped-Abstraction-Module (section 3.5),Figure 1. Each Grouped-Abstraction-Module contains(1) input and output ports that can be connected to anyother Grouped-Abstraction-Module, (2) a generaliza-tion method that automatically inherits generalizationsfrom previous levels or can generate new groups, (3) ab-straction methods that automatically display the currentdata and (4) a specialization process that can generate anew data-specialization at the request of a user.
Therefore, the specialization process provides a hi-erarchical segmentation method where the data can besegmented and consequently further subdivided. Thishierarchy is a tree; Waltz explicitly displays this hier-archy within the layout and position of the modules onthe canvas (section 3.6).
Image-based correlation is provided through Linked-manipulation (section 3.7), linking the control manipu-lation between abstract views. Operations are providedto highlight specific groups and directly manipulate the
Interactive Hierarchical Data Investigation using Abstractions – Dr. J.C.Roberts (December 19, 1996) 3
Generalization
Abstraction
1 2 3 n...
Data
Specialization
Data IN
Data OUTFull DataSelected Data
Data
Raw Data
Grouped−AbstractionModule
Figure 1: Generalization, Abstraction and Specializa-tion
abstract-views.
We describe each aspect of the visualizationmetaphor, within Waltz, in more detail in the followingsections.
3.1 Waltz Generalization
Waltz segments the data into ‘similar’ regions calledgeneralizations. Bertin [2] describes a generalization asthe spatial equivalent of simplification and that “Gen-eralization thus involves discovering concepts whichare applicable to the available signs and which are de-fined as similar for a certain area, such that this areacan be considered as different from neighboring areas”.These similar regions within a generalization are namedgroups.
Generalization in Waltz is achieved using a recur-sive flood filling algorithm. The algorithm proceeds byflooding to every adjacent voxel where the difference invalue is less than a fixed threshold; this algorithm spa-tially segments the voxels into groups of similar values.A merging stage then joins the smaller sized groups intoappropriate adjacent groups (similar to [12]).
3.2 Waltz Specialization
The Specialization process makes the data smaller andmore specialized. Waltz provides this mechanismthrough user selection: where the user selects (High-lights) a subset of the generalized groups.
The specialization process generates a hierarchicaldata simplification model using the (algorithmic) gener-alization and (user controlled) specialization functions;the hierarchy being implicitly displayed by the layoutof the modules (see section 3.6).
3.3 Waltz Abstractions
An abstraction is a view that displays only certain as-pects of the information from the data set. The view,therefore, hides or loses information to facilitate under-standing of the data. Moreover, the abstraction maydistort the information to achieve a simplified and in-terpretable view of the data.
There are different levels of abstractions from very-abstract views to lesser abstract views of the data. Thereare different types of abstractions including those thatreduce the level of detail [8], throw away information,augment and adjust the position or value of the informa-tion and abstractions that depict information attributedand calculated from the data (including statistical andmetadata).
Waltz uses the notion of groups from the generaliza-tion and specialization procedures to generate the ab-stractions of the data; each of the abstractions displayrepresentations of the grouped data. The Waltz abstrac-tions include:
List of Groups Abstraction A list of the group namesand respective material type is displayed.
Slice Abstraction Two dimensional slices through thedata are shown.
Surface Abstraction A three dimensional surface isgenerated round each of the groups of data.The algorithm walks around the surface bound-ary of each three dimensional group, generatinga connected mesh of polygons using an extendedMarching Cubes Lookup table [11].
Skeleton Abstraction A skeleton of an image, like theskeleton of an animal, is generated. The algorithmis generated from a three dimensional extension tothe two dimensional Sherman’s algorithm (as de-scribed by [4])

Interactive Hierarchical Data Investigation using Abstractions – Dr. J.C.Roberts (December 19, 1996) 4
Bounding region Abstraction Each of the groups aredisplayed using a bounding box glyph. The glyphencodes the absolute size (extent) and position ofa group.
Net-display Abstraction The net-display abstractiondepicts the data as a connected graph of nodes (anetwork). Each group is represented by a spheri-cal node with the adjacency information encodedby connecting lines. The nodes are positioned torepresent the average position of each of the ele-ments in the group and the diameter is related tothe number of elements in the group.
3.4 Waltz Data File Module
The Data File module holds the data, displays the filename and provides the root module of the specialization(tree) hierarchy. When this module is deleted each ofchildren are likewise removed and the remaining mod-ules are automatically re-positioned. This module is au-tomatically generated when a Waltz Data file is loaded.The Waltz Data File is a metafile, containing the where-abouts, dimensions and aspect ratio of the data file.
3.5 Waltz Grouped Abstraction Module
Each Grouped Abstraction module contains informa-tion about the current generalization and specializationstate, details of the current abstraction methods and thelinkage states. Unique reference names are allocated tothe abstractions to match up the abstraction popup win-dow with the Waltz Canvas. These popup windows canbe iconised into the Grouped Abstraction module, de-picted by a ‘rubbed out’ bitmap representation of theAbstraction Type.
The userExportsthe data from level to level generat-ing multiple Grouped Abstraction Modules that are au-tomatically positioned according to theRight Side Rulelayout strategy.
3.6 Waltz Module Layout
Waltz automatically places the modules on the canvas,using aRight Side Rulemethod, where each first childof a parent lines up with the left side of the parent wid-get and each of the other children are forced to the rightof that one child (Figure 2). The children of the childrenare placed likewise first to line up with the parent, thento display to the right of the older child and to the right
Data File Module Grouped Abstraction Module
Figure 2: Waltz Right Side Rule
of any other children (of this parent) that are older. Thelayout consists of multiple levels and columns. Anotherdata set would be displayed on the right of the mostright child of the previous data set.
Each Grouped Abstraction module can contain mul-tiple abstractions (of the same or different type). Theuser can create and remove the abstraction methodscontained within a Grouped Abstraction module, so themodule automatically expands and contracts to containthe abstraction methods. The other modules in the can-vas move appropriately to accommodate the expandedmodule.
Multiple windows are generated, containing each ab-straction, and are uniquely labelled using numbers sep-arated by dots; consisting of the Data File Version, spe-cialization level, abstraction number and specializationpath. The four-tuple label correlates each separate win-dow with its respective Grouped Abstraction Module onthe canvas. The appropriate labels are updated when anabstraction is deleted.
3.7 Waltz Linkages and Control
Views that are depicted at a high level of abstraction areoften difficult to interpret, therefore, we claim there is aneed to join or link these abstract views together to dis-ambiguate the abstractness of the image. An analogyis taken from the London U.K. Underground Railwaynetwork map. The map is drawn in an abstract formand displays the connectivity of the railway stations andlines, but loses information about the exact position ofa station and the distances between each station. Theuser can quickly understand the connectivity of the sta-tions and effectively navigate the network. However,when the abstract map is used in isolation, it is diffi-
Interactive Hierarchical Data Investigation using Abstractions – Dr. J.C.Roberts (December 19, 1996) 5
cult to evaluate whether it is feasible to walk overgroundbetween two stations. This distance information is re-trieved by consulting a geographical map of the samearea; the stations represent the landmarks of correlationand the distance evaluation becomes trivial – thelostinformation has been regained.
We have discovered six close coupling methods thatare applicable to the Waltz visualization system. Eachof the linkages can be applied to a single abstraction(Self Linked) or connected across multiple views (LocalLinked).
Linked Highlight This allows the same data elementsto be highlighted between views. Multiple groupsare highlighted in different colors.
Linked Specialization Grouping A specialization iscreated when parts of the (generalized) data areextracted. The groups are extracted when the userinitiates anExportaction generating a specializa-tion (subset) of the groups that are currently High-lighted. If no groups are highlighted a completecopy of the current groups is exported. TheExportrequest either updates a current Grouped Abstrac-tion Module or creates a new Grouped AbstractionModule with the new data specialization.
Linked Global Transform Direct Manipulation of ro-tation, scale and translation in one three dimen-sional view controls the orientation and view ofother connected three dimensional abstractions.
Linked Group Transform This allows a transforma-tion to be allocated to a specific group, corre-sponding views (within a generalization), havingthe same transformation applied. This is useful ifa group is obscuring another group, or if a groupneeds to be moved spatially away from surround-ing elements.
Linked Attributes The color, transparency, textureand other attributes are uniform between linkedabstractions. The user can alter the displayed at-tributes for any group.
Linked Data Probes The position of data probes (thedisplayed slice in the slice abstraction, for exam-ple) are linked between views.
Within a Grouped Abstraction Module each of theabstractions are initially linked together. A button onthe Grouped Abstraction module generates a popup
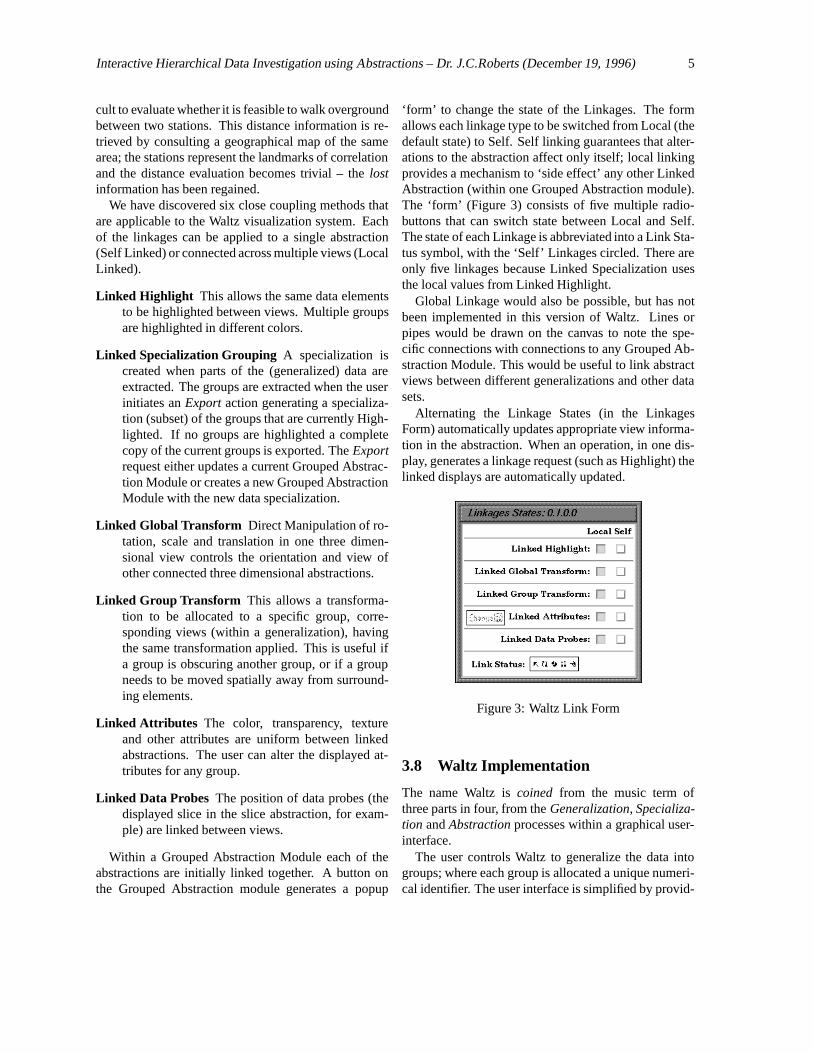
‘form’ to change the state of the Linkages. The formallows each linkage type to be switched from Local (thedefault state) to Self. Self linking guarantees that alter-ations to the abstraction affect only itself; local linkingprovides a mechanism to ‘side effect’ any other LinkedAbstraction (within one Grouped Abstraction module).The ‘form’ (Figure 3) consists of five multiple radio-buttons that can switch state between Local and Self.The state of each Linkage is abbreviated into a Link Sta-tus symbol, with the ‘Self’ Linkages circled. There areonly five linkages because Linked Specialization usesthe local values from Linked Highlight.
Global Linkage would also be possible, but has notbeen implemented in this version of Waltz. Lines orpipes would be drawn on the canvas to note the spe-cific connections with connections to any Grouped Ab-straction Module. This would be useful to link abstractviews between different generalizations and other datasets.
Alternating the Linkage States (in the LinkagesForm) automatically updates appropriate view informa-tion in the abstraction. When an operation, in one dis-play, generates a linkage request (such as Highlight) thelinked displays are automatically updated.
Figure 3: Waltz Link Form
3.8 Waltz Implementation
The name Waltz iscoined from the music term ofthree parts in four, from theGeneralization, Specializa-tion andAbstractionprocesses within a graphical user-interface.
The user controls Waltz to generalize the data intogroups; where each group is allocated a unique numeri-cal identifier. The user interface is simplified by provid-

Interactive Hierarchical Data Investigation using Abstractions – Dr. J.C.Roberts (December 19, 1996) 6
ing two modules (the Data File and Grouped Abstrac-tion modules) where the user adds (and deletes) abstrac-tion and grouping methods to the Grouped AbstractionModule, to control the visualization.
Waltz has been designed in C++ with classes repre-senting the data, groupings of the data and abstractions,and is implemented over X and Xlib using the Motifwidget set, Inventor [33, 28, 24] and Open GL [15] li-braries.
4 Related Work
Abstractions if viewed on their own depict part of theinformation, but like the analogy of the undergroundmap other views need to be consulted. Therefore,link-ing mechanisms between the views are useful and im-perative if thelost information is to be retrieved. Waltzprovides six linking mechanisms orLinkages(see sec-tion 3.7, page 4).
Many systems allow the direct manipulation of theoutput and linking between views. Martin and Wardprovide five selection or brushing techniques in theirXmdvTool [13] of: Highlight (making some pointsstand out), Linking (causing data points to be selectedbetween displays), Masking/deleting (causing somepoints to not be displayed), Moving average (to showthe average values of the selected points) and Quantita-tive presentation (displaying the actual data values).
Klinker [10] describes a method using “Data Prob-ing” allowing the data to be graphically filtered bydefining polygon areas of interest on the screen, using a“Cursor Linking” technique that allows the probe infor-mation to be linked between modules (and views).
The Visualization Input Pipeline (VIP) [6] provides abackward control path (from the image to the data) usedto transport control information backwards up the flowpipeline. In one example, the position of the cursors arelinked together and the translation of one pointer movesthe position of each corresponding cursor.
The Waltz visualization system simplifies the databy generalizing the data into groups, a subset of thesegroups can be selected for display and further process-ing. Schroeder, Lorensen, Montanaro and Volpe [23]use a similar technique, named the “Display filter”, al-lowing the output from one display to be input to an-other display.
Walsum and Post [30] describe a method that sim-plifies the data by using selection criteria. There arethree stages:selection creationto feature extract;se-
lection processingapplying a transformation to the se-lected data; andselective visualizationthat displays thedata. They state that a selection is an area of interest tothe user and can be created by both spatially-connected(as of Klinker [10]) and spatially-unconnected (as ofSchroeder, Lorensen, Montanaro and Volpe [23]). Theirselections are boolean arrays of data. They describe al-gorithms of clustering, filtering the size of clusters, se-lection of clusters, and enlarging and reducing the sizeof clusters (dilation and erosion, respectively) that canbe applied to create and alter selections.
Silver [26] segments data into groups named Objects.The objects simplify the data and can be tracked as theyevolve and move throughout the data [22].
The Abstractions within Waltz represent simplifiedor transformed views of the data. Many multidimen-sional visualization tools provide abstract representa-tions of the data [32, 31]. Icons or glyphs provide a highlevel of abstraction and data reduction and that the datareduction is “... necessary for understanding the infor-mation inherent in very large data sets” [17]. The Tiogasystem [27] generates child abstractions (representingsubsets of the data input) on a query to the database.The children at each level are viewed and controlled bybrowsers. The browsers can also be synchronized, soany manipulation on one browser (either slave or mas-ter) controls a corresponding translation on the other.Program visualization systems also use abstract meth-ods to visualize and display working models of algo-rithms and techniques [21].
5 Examples
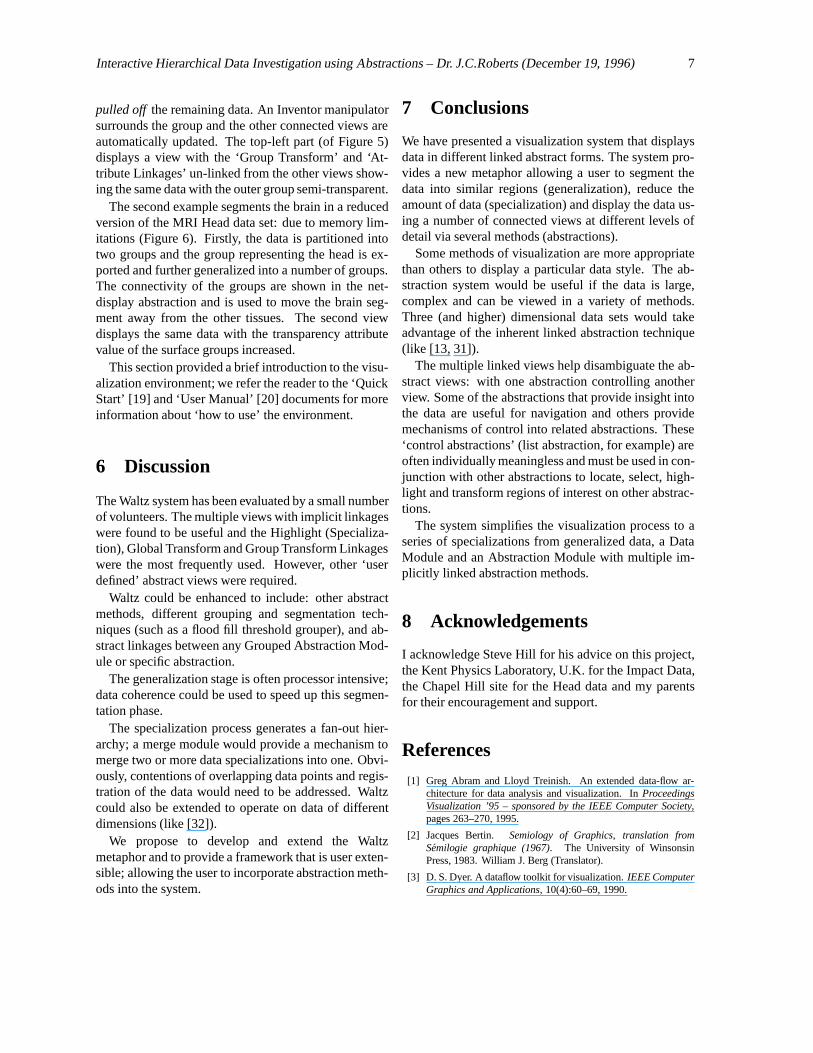
The system has been used on a number of data sets.We describe a session visualizing the data from a spacedust impact simulation (Figure 4). A stationary blockof material isbombardedwith a smaller piece of mate-rial. The data set describes the pressure of the impacton the object; positive (expansion) and negative (com-pression) pressures are represented by the data, and theair is given a reference value. The data is scaled ap-propriately so the most negative pressure is at the valueone and the reference value is set at zero. The data isloaded into Waltz and two paths are created. The firstpath selects two groups to visualize the surround of ob-ject block. The second path provides multiple viewsdisplaying different generalizations of the pressure in-side the stationary block.
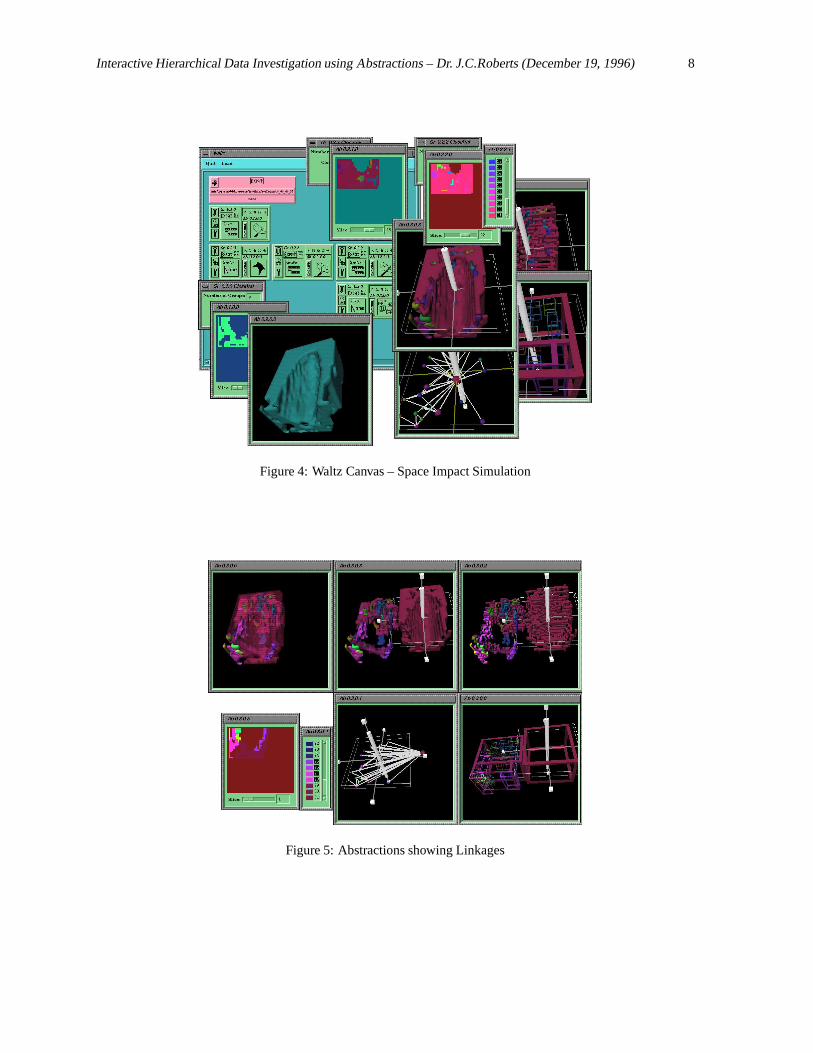
One of the data groups (shown in Figure 5) has been
Interactive Hierarchical Data Investigation using Abstractions – Dr. J.C.Roberts (December 19, 1996) 7
pulled off the remaining data. An Inventor manipulatorsurrounds the group and the other connected views areautomatically updated. The top-left part (of Figure 5)displays a view with the ‘Group Transform’ and ‘At-tribute Linkages’ un-linked from the other views show-ing the same data with the outer group semi-transparent.
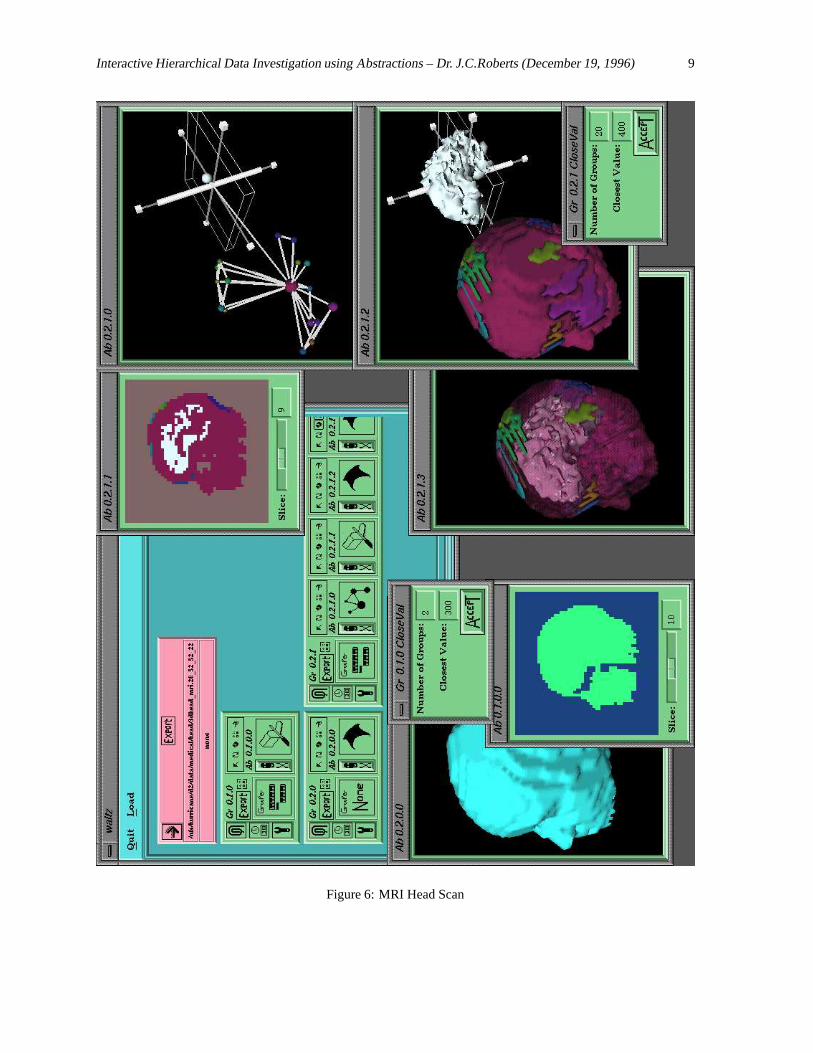
The second example segments the brain in a reducedversion of the MRI Head data set: due to memory lim-itations (Figure 6). Firstly, the data is partitioned intotwo groups and the group representing the head is ex-ported and further generalized into a number of groups.The connectivity of the groups are shown in the net-display abstraction and is used to move the brain seg-ment away from the other tissues. The second viewdisplays the same data with the transparency attributevalue of the surface groups increased.
This section provided a brief introduction to the visu-alization environment; we refer the reader to the ‘QuickStart’ [19] and ‘User Manual’ [20] documents for moreinformation about ‘how to use’ the environment.
6 Discussion
The Waltz system has been evaluated by a small numberof volunteers. The multiple views with implicit linkageswere found to be useful and the Highlight (Specializa-tion), Global Transform and Group Transform Linkageswere the most frequently used. However, other ‘userdefined’ abstract views were required.
Waltz could be enhanced to include: other abstractmethods, different grouping and segmentation tech-niques (such as a flood fill threshold grouper), and ab-stract linkages between any Grouped Abstraction Mod-ule or specific abstraction.
The generalization stage is often processor intensive;data coherence could be used to speed up this segmen-tation phase.
The specialization process generates a fan-out hier-archy; a merge module would provide a mechanism tomerge two or more data specializations into one. Obvi-ously, contentions of overlapping data points and regis-tration of the data would need to be addressed. Waltzcould also be extended to operate on data of differentdimensions (like [32]).
We propose to develop and extend the Waltzmetaphor and to provide a framework that is user exten-sible; allowing the user to incorporate abstraction meth-ods into the system.
7 Conclusions
We have presented a visualization system that displaysdata in different linked abstract forms. The system pro-vides a new metaphor allowing a user to segment thedata into similar regions (generalization), reduce theamount of data (specialization) and display the data us-ing a number of connected views at different levels ofdetail via several methods (abstractions).
Some methods of visualization are more appropriatethan others to display a particular data style. The ab-straction system would be useful if the data is large,complex and can be viewed in a variety of methods.Three (and higher) dimensional data sets would takeadvantage of the inherent linked abstraction technique(like [13, 31]).
The multiple linked views help disambiguate the ab-stract views: with one abstraction controlling anotherview. Some of the abstractions that provide insight intothe data are useful for navigation and others providemechanisms of control into related abstractions. These‘control abstractions’ (list abstraction, for example) areoften individually meaningless and must be used in con-junction with other abstractions to locate, select, high-light and transform regions of interest on other abstrac-tions.
The system simplifies the visualization process to aseries of specializations from generalized data, a DataModule and an Abstraction Module with multiple im-plicitly linked abstraction methods.
8 Acknowledgements
I acknowledge Steve Hill for his advice on this project,the Kent Physics Laboratory, U.K. for the Impact Data,the Chapel Hill site for the Head data and my parentsfor their encouragement and support.
References
[1] Greg Abram and Lloyd Treinish. An extended data-flow ar-chitecture for data analysis and visualization. InProceedingsVisualization ’95 – sponsored by the IEEE Computer Society,pages 263–270, 1995.
[2] Jacques Bertin. Semiology of Graphics, translation fromSemilogie graphique (1967). The University of WinsonsinPress, 1983. William J. Berg (Translator).
[3] D. S. Dyer. A dataflow toolkit for visualization.IEEE ComputerGraphics and Applications, 10(4):60–69, 1990.
Interactive Hierarchical Data Investigation using Abstractions – Dr. J.C.Roberts (December 19, 1996) 8
Figure 4: Waltz Canvas – Space Impact Simulation
Figure 5: Abstractions showing Linkages
Interactive Hierarchical Data Investigation using Abstractions – Dr. J.C.Roberts (December 19, 1996) 9
Figure 6: MRI Head Scan

Interactive Hierarchical Data Investigation using Abstractions – Dr. J.C.Roberts (December 19, 1996) 10
[4] Michael C. Fairhurst.Computer Vision for Robotic Systems –An Introduction. Prentice Hall, 1988.
[5] Jean M. Favre and James Hahn. An object oriented design forthe visualization of multi-variable data objects. InProceedingsVisualization ’94 – sponsored by the IEEE Computer Society,pages 318–325, 1994.
[6] W. Felger and F. Schroder. The visualization input pipeline– enabling semantic interaction in scientific visualization. InEurographics ’92 (Computer Graphics Forum Volume 11 No.3) – Alistair Kilgour and Lars Kjelldahl Eds., pages 139–151.Blackwell Publishers, 1992.
[7] R. B. Haber and D. A. McNabb. Visualization idioms: A con-ceptual model for scientific visualization systems. In B. Shriver,G. M. Nielson, and L. J. Rosenblum, editors,Visualization inScientific Computing, pages 74–93. IEEE Computer SocietyPress, 1990.
[8] T. He, L. Hong, A. Kaufman, A. Varshney, and S. Wang. Voxelbased object simplification. InProceedings Visualization ’95– sponsored by the IEEE Computer Society, pages 296–303,1995.
[9] J. P. M. Hultquist and E. L. Raible. SuperGlue: A programmingenvironment for scientific visualization. InProceedings Visual-ization ’92 – sponsored by the IEEE Computer Society, pages243–250, 1992.
[10] Gudrun J. Klinker. An environment for telecollaborative dataexploration. InProceedings Visualization ’93 – sponsored bythe IEEE Computer Society, pages 110–117, 1993.
[11] William E. Lorensen and Harvey E. Cline. Marching cubes: Ahigh resolution 3D surface construction algorithm.ACM Com-puter Graphics, 21(4):163–169, July 1987.
[12] G. Manos, A. Y. Cairns, I. W. Ricketts, and D. Simclair. Au-tomatic segmentation of hand-wrist radiographs.Image and Vi-sion Computing, 11(2):100–111, 1993.
[13] Allen R. Martin and Matthew O. Ward. High dimensionalbrushing for interactive exploration of multivariate data. In Pro-ceedings Visualization ’95 – sponsored by the IEEE ComputerSociety, pages 271–278, 1995.
[14] James L. Montine. A procedural interface for volume render-ing. In Proceedings Visualization ’90 – sponsored by the IEEEComputer Society, pages 36–44, 1990. (The Alliant VolumeVisualization Environment – AVOLVE).
[15] Jackie Neider, Tom Davis, and Mason Woo.OpenGL Program-ming Guide – The Official Guide to Learning OpenGL, Release1. Addison-Wesley, 1994.
[16] Thomas C. Palmer. A language for molecular visualization.IEEE Computer Graphics and Applications, 12(2):23–32, May1992.
[17] Frank J. Post, Theo van Walsum, Frits H. Post, and Deborah Sil-ver. Iconic techniques for feature visualization. InProceedingsVisualization ’95 – sponsored by the IEEE Computer Society,pages 288–295, 1995.
[18] Jonathan C. Roberts.Aspects of Abstraction in Scientific Visu-alization. Ph.D thesis, Kent University, Computing Laboratory,Canterbury, Kent, England, UK, CT2 7NF, October 1995.
[19] Jonathan C. Roberts. Waltz Quick Start. Technical Report 23-96, Computing Laboratory, University of Kent, Canterbury,UK,December 1996.
[20] Jonathan C. Roberts. Waltz User Manual. Technical Report22-96, Computing Laboratory, University of Kent, Canterbury,UK, December 1996.
[21] Gruia-Catalin Roman and Kenneth C. Cox. A taxonomy ofprogram visualization systems.IEEE Computer, 26(12):11–24,1993.
[22] Ravi Samtaney, Deborah Silver, Norman Zabusky, and JimCao.Visualizing features and tracking their evolution.IEEE Com-puter, 27(7):20–27, July 1994.
[23] W. J. Schroeder, W. E. Lorensen, G. D. Montanaro, and C. R.Volpe. VISAGE: an object-oriented scientific visualization sys-tem. InProceedings Visualization ’92 – sponsored by the IEEEComputer Society, pages 219–226, 1992.
[24] Raj Shekhar and Brian McGinley. Open Inventor 2.0.Computer– IEEE Society Press, 27(7):100–102, July 1994.
[25] Silicon Graphics Computer Systems – Silicon Graphics Inc.IRIS Explorer Technical Overview, April 1992. (http://www.nag.co.uk/visual/IE/iecbb/docs/TechnicalReport.ps).
[26] Deborah Silver. Object-oriented visualization.IEEE ComputerGraphics and Applications, 15(3):54–62, May 1995.
[27] Michael Stonebraker, Jolly Chen, Nobuko Nathan, CarolinePaxon, Alan Su, and Jiang Wu. Tioga: A database-oriented vi-sualization tool. InProceedings Visualization ’93 – sponsoredby the IEEE Computer Society, pages 86–93, 1993.
[28] Paul S. Strauss and Rikk Carey. An object-oriented 3D graphicstoolkit. Computer Graphics, 26(2):341–349, July 1992.
[29] C. Upson, T. Faulhaber, D. Kamins, D. Schlegel, D. Laidlaw,F. Vroom, R. Gurwitz, and A. van Dam. The application vi-sualization system: A computational environment for scien-tific visualization. IEEE Computer Graphics and Applications,9(4):30–42, 1989.
[30] Theo van Walsum and Frits H. Post. Selective visualization ofvector fields. InEurographics ’94 – M. Daehlem and L. Kjell-dahl Eds., pages 339–347, 1994.
[31] Jarke J. van Wijk and Robert van Liere. HyperSlice – visual-ization of scalar functions of many variables. InProceedingsVisualization ’93 – sponsored by the IEEE Computer Society,pages 119–125, 1993.
[32] Matthew O. Ward. XmdvTool: Integrating multiple methodsfor visualizing multivariate data. InProceedings Visualization’94 – sponsored by the IEEE Computer Society, pages 326–333,1994.
[33] Josie Wernecke.The Inventor Mentor: Programming Object-Oriented 3D Graphics with Open Inventor, Release 2. Addison-Wesley, 1994.
[34] Mark Young, Danielle Argiro, and Steven Kubica. Cantata: Vi-sual programming environment for the Khoros system.Com-puter Graphics, 29(2):22–24, May 1995.