Heapviz: interactive heap visualization for program understanding and debugging
10
Heapviz: Interactive Heap Visualization for Program Understanding and Debugging Edward E. Aftandilian [email protected] Sean Kelley [email protected] Connor Gramazio [email protected] Nathan Ricci [email protected] Sara L. Su [email protected] Samuel Z. Guyer [email protected] Department of Computer Science Tufts University http://www.cs.tufts.edu/r/redline ABSTRACT Understanding the data structures in a program is crucial to understanding how the program works, or why it doesn’t work. Inspecting the code that implements the data struc- tures, however, is an arduous task and often fails to yield insights into the global organization of a program’s data. Inspecting the actual contents of the heap solves these prob- lems but presents a significant challenge of its own: finding an effective way to present the enormous number of objects it contains. In this paper we present Heapviz, a tool for visualizing and exploring snapshots of the heap obtained from a running Java program. Unlike existing tools, such as traditional de- buggers, Heapviz presents a global view of the program state as a graph, together with powerful interactive capabilities for navigating it. Our tool employs several key techniques that help manage the scale of the data. First, we reduce the size and complexity of the graph by using algorithms inspired by static shape analysis to aggregate the nodes that make up a data structure. Second, we introduce a dominator-based layout scheme that emphasizes hierarchical containment and ownership relations. Finally, the interactive interface allows the user to expand and contract regions of the heap to mod- ulate data structure detail, inspect individual objects and field values, and search for objects based on type or con- nectivity. By applying Heapviz to both constructed and real-world examples, we show that Heapviz provides pro- grammers with a powerful and intuitive tool for exploring program behavior. Categories and Subject Descriptors D.2.5 [Software Engineering]: Testing and Debugging— Debugging aids ; E.1 [Data Structures]: Graphs and net- Permission to make digital or hard copies of all or part of this work for personal or classroom use is granted without fee provided that copies are not made or distributed for profit or commercial advantage and that copies bear this notice and the full citation on the first page. To copy otherwise, to republish, to post on servers or to redistribute to lists, requires prior specific permission and/or a fee. SOFTVIS’10, October 25–26, 2010, Salt Lake City, Utah, USA. Copyright 2010 ACM 978-1-4503-0028-5/10/10 ...$10.00. works, Lists, stacks, and queues, Trees; I.3.3 [Computer Graphics]: Picture/Image Generation—Display algorithms General Terms Design Keywords Software visualization, program understanding, debugging, interactive visualization, graphs 1. INTRODUCTION Show me your flowcharts and conceal your tables, and I shall continue to be mystified. Show me your tables, and I won’t usually need your flowcharts; they’ll be obvious. – Fred Brooks [2] Understanding modern software has become a significant challenge, even for expert programmers. Part of the prob- lem is that today’s programs are larger and more complex than their predecessors, in terms of static code base (lines of code), runtime behavior, and memory footprint. Another problem is that modern applications, such as web-based e- commerce and cloud computing platforms, are constructed by assembling reusable software components, ranging from simple container classes to huge middleware frameworks. In many cases, these components are instantiated dynamically and wired together using techniques such as reflection or bytecode rewriting. These features make it very challenging for any one programmer to obtain a global understanding of the program’s state and behavior. The size and complexity of software is also a major im- pediment to program understanding tools, particularly those based on static analysis of the code. The programming tech- niques described above often result in very imprecise infor- mation that is of little value to the programmer. Tools that analyze the dynamic behavior of programs have traditionally focused on identifying performance problems rather than on general program understanding [20, 26, 18]. The primary technique currently available for inspecting program state is the debugger, which is extremely painful to use for anything but the smallest data structures.
-
Upload
independent -
Category
Documents
-
view
4 -
download
0
Transcript of Heapviz: interactive heap visualization for program understanding and debugging
Heapviz: Interactive Heap Visualization for ProgramUnderstanding and Debugging
Edward E. [email protected]
Sean [email protected]
Connor [email protected]
Nathan [email protected]
Sara L. [email protected]
Samuel Z. [email protected]
Department of Computer ScienceTufts University
http://www.cs.tufts.edu/r/redline
ABSTRACT
Understanding the data structures in a program is crucialto understanding how the program works, or why it doesn’twork. Inspecting the code that implements the data struc-tures, however, is an arduous task and often fails to yieldinsights into the global organization of a program’s data.Inspecting the actual contents of the heap solves these prob-lems but presents a significant challenge of its own: findingan effective way to present the enormous number of objectsit contains.In this paper we present Heapviz, a tool for visualizing
and exploring snapshots of the heap obtained from a runningJava program. Unlike existing tools, such as traditional de-buggers, Heapviz presents a global view of the program stateas a graph, together with powerful interactive capabilities fornavigating it. Our tool employs several key techniques thathelp manage the scale of the data. First, we reduce the sizeand complexity of the graph by using algorithms inspired bystatic shape analysis to aggregate the nodes that make upa data structure. Second, we introduce a dominator-basedlayout scheme that emphasizes hierarchical containment andownership relations. Finally, the interactive interface allowsthe user to expand and contract regions of the heap to mod-ulate data structure detail, inspect individual objects andfield values, and search for objects based on type or con-nectivity. By applying Heapviz to both constructed andreal-world examples, we show that Heapviz provides pro-grammers with a powerful and intuitive tool for exploringprogram behavior.
Categories and Subject Descriptors
D.2.5 [Software Engineering]: Testing and Debugging—Debugging aids; E.1 [Data Structures]: Graphs and net-
Permission to make digital or hard copies of all or part of this work forpersonal or classroom use is granted without fee provided that copies arenot made or distributed for profit or commercial advantage and that copiesbear this notice and the full citation on the first page. To copy otherwise, torepublish, to post on servers or to redistribute to lists, requires prior specificpermission and/or a fee.SOFTVIS’10, October 25–26, 2010, Salt Lake City, Utah, USA.Copyright 2010 ACM 978-1-4503-0028-5/10/10 ...$10.00.
works, Lists, stacks, and queues, Trees; I.3.3 [ComputerGraphics]: Picture/Image Generation—Display algorithms
General Terms
Design
Keywords
Software visualization, program understanding, debugging,interactive visualization, graphs
1. INTRODUCTION
Show me your flowcharts and conceal your tables, and I
shall continue to be mystified. Show me your tables, and I
won’t usually need your flowcharts; they’ll be obvious.
– Fred Brooks [2]
Understanding modern software has become a significantchallenge, even for expert programmers. Part of the prob-lem is that today’s programs are larger and more complexthan their predecessors, in terms of static code base (linesof code), runtime behavior, and memory footprint. Anotherproblem is that modern applications, such as web-based e-commerce and cloud computing platforms, are constructedby assembling reusable software components, ranging fromsimple container classes to huge middleware frameworks. Inmany cases, these components are instantiated dynamicallyand wired together using techniques such as reflection orbytecode rewriting. These features make it very challengingfor any one programmer to obtain a global understanding ofthe program’s state and behavior.
The size and complexity of software is also a major im-pediment to program understanding tools, particularly thosebased on static analysis of the code. The programming tech-niques described above often result in very imprecise infor-mation that is of little value to the programmer. Tools thatanalyze the dynamic behavior of programs have traditionallyfocused on identifying performance problems rather than ongeneral program understanding [20, 26, 18]. The primarytechnique currently available for inspecting program state isthe debugger, which is extremely painful to use for anythingbut the smallest data structures.

In this paper we present a new tool called Heapviz thatis capable of effectively visualizing heap snapshots obtainedfrom running Java programs. By visualizing the actual con-tents of the heap, we avoid the drawbacks of static analysistools: the problems caused by dynamic software architec-tures and the inaccuracy of heap approximation. The mainchallenge of our approach is the scale of the data: even amodest program can contain an enormous number of ob-jects. We visualize the heap as a graph in which nodes repre-sent objects and edges represent pointers (object references)between them. Our work leverages the Prefuse visualiza-tion toolkit [12], which provides a rich set of software toolsfor building interactive visualizations. Unlike traditional de-buggers, Heapviz provides a global view of the data togetherwith powerful interactive capabilities.Our solution involves two techniques. First, we introduce
algorithms for aggregating and abstracting individual ob-jects to create a more succinct summary of the heap. Forexample, we might display all the elements of a large con-tainer using a single representative element. Second, we usePrefuse to provide interactive query and navigation: (a) ex-pand or collapse regions of the heap, (b) inspect individualobjects and field values, (c) search for objects (or classes ofobjects) based on type, and (d) explore the connectivity ofthe object graph.We demonstrate Heapviz on both constructed examples
and real-world Java benchmark programs to evaluate its ef-fectiveness as a tool for helping programmers visualize andnavigate large, pointer-based data structures at a whole-program scale. This ability could greatly increase program-mer productivity in many aspects of software constructionand maintenance, including finding bugs and memory leaks,identifying opportunities to improve data structures, under-standing the overall system architecture and interaction be-tween software components, and helping new members on adevelopment team come up to speed on the code quickly.
2. RELATEDWORKPrevious work on program analysis and understanding in-
cludes a number of techniques for visualizing the behaviorof programs. A large body of prior research has focused pri-marily on helping programmers navigate and visualize thecode [4, 29, 6, 24]. As many computing researchers and prac-titioners have observed, however, understanding the data
structures of a program is often more valuable. Techniquesfor determining the structure of data in the heap fall intotwo main categories: static analysis and dynamic analysis.Static analysis algorithms, such as shape analysis [10, 25],build a compile-time approximation of possible heap con-figurations. In many cases, however, these abstractions aretoo imprecise for detailed program understanding and de-bugging tasks.Our work is most closely related to dynamic analysis tools
that analyze the concrete heap (or a memory trace) in or-der to present the programmer with a graph or other visualrepresentation of the actual state of the program. Since themain challenge for these tools is managing the scale of thedata, the critical feature that distinguishes them is how theyaggregate information for the user. Different choices lead tosuitability for different tasks. Our specific goal for Heapvizis to help programmers understand the overall organizationand structure of data.Several existing tools provide programmers with an un-
abstracted graph representation of the concrete heap [32,8, 31]. Without aggregation or interactive navigation, how-ever, these visualizations do not scale well beyond a fewhundred or thousand objects. Pheng and Verbrugge [19]present a tool with two visualizations of the heap. The firstis a detailed graph of individual objects and pointers, withno abstraction. Nodes are displayed according to the shapeto which they belong (list, tree, or DAG – from Ghiya andHendren [10]). The second visualization consists of a linegraph of the overall heap contents over time broken downby shape category. Their tool focuses on the evolution of theheap over time; Heapviz, on the other hand, aims to makea single snapshot of the heap comprehensible.
A number of existing heap visualization tools focus pri-marily on identifying memory utilization problems, such asmemory bloat and memory leaks. The main difference be-tween Heapviz and these tools is that they give up much ofthe detail of the heap organization necessary to understandhow the data structures work.
De Pauw et al. [5] present a tool aimed at finding spuriousobject references. The tool collapses the heap graph by ag-gregating groups of objects with similar reference patterns.It also supports interactive navigation, expanding and con-tracting of aggregated nodes. While similar in spirit, thistool is focused on finding spurious references and requiressome programmer intervention to identify which referencesto record and display.
Several tools aggregate objects by ownership [21, 13, 17].These tools first analyze the heap and build a model of ob-ject ownership, then aggregate objects that have similar pat-terns of ownership, type, or lifetime. The visualization typi-cally presents the abstracted graph with annotations thatsummarize the properties of the aggregated nodes. TheDYMEM memory visualization tool [23] shows the heap asa strict tree, duplicating subtrees as necessary, and uses anelaborate coloring scheme to indicate the amount of memoryused and owned by groups of objects. These tools are oftennot well-suited for general program understanding, however,since they abstract away internal organization and individ-ual objects.
Demsky and Rinard [7] present a heap visualization basedon a dynamic analysis of object roles, or patterns of use inthe program. The tool generates a role transition diagram,which focuses on object lifecycles, rather than the overallorganization of the data. While this tool presents a uniqueview, scalability appears to be a concern for large programs.
Most closely related to Heapviz is the work of Marron etal. [15]. They process the heap graph using an abstract func-tion previously developed for use in a sophisticated staticpointer analysis. The analysis attempts to preserve infor-mation about internal structure (such as sharing) whenevernodes are collapsed.
3. SYSTEM OVERVIEWIn this section, we provide a brief overview of the archi-
tecture of Heapviz. We go into further detail in Sections 4and 5. The full Heapviz pipeline (Figure 1) consists of threemajor parts:
1. JVM + HPROF. Generates a heap snapshot froma running Java program using the HPROF tool [18]provided by Sun with the Java Development Kit.
2. Heap analyzer. Parses the heap snapshot, builds a

Java
Program
JVM +
HPROFHeap
Snapshot
Heap
AnalyzerHeap
Abstraction
Interactive
Graph
online o�ine
System Overview
Heap
Visualizer
Figure 1: The Heapviz pipeline. The JVM and HPROF generate a heap snapshot from a running Javaprogram. Our heap analyzer then parses this snapshot, builds a graph representation of the concrete heap,summarizes the graph, and outputs a heap abstraction. Our heap visualizer reads the heap abstraction anddisplays the graph, enabling the user to explore it interactively.
graph representation of the concrete heap, summarizesthe graph, and outputs the resulting heap abstraction.
3. Heap visualizer. Reads the heap abstraction anddisplays the (possibly large) graph, allowing the userto explore it interactively.
Our heap analyzer parses the heap snapshot and buildsa graph representation of the concrete heap. It then sum-marizes the concrete heap using the algorithm described inSection 4. In addition, it computes a dominator tree, whichthe visualization tool uses for layout. We call the combi-nation of the summarized graph and dominator tree a heap
abstraction. Finally, the heap analyzer outputs the heapabstraction to GraphML [11], an XML-based graph format.Our heap visualizer reads the heap abstraction from the
GraphML file and displays the summarized graph. As de-scribed further in Section 5, it displays the graph using aradial layout and uses the dominator tree to decide where inthe hierarchy to place each node. The heap visualizer allowsthe user to explore the graph interactively, selecting nodesto view the contents of their fields, expanding and collapsingnodes, and displaying the connections among the objects inthe heap.
4. HEAP ANALYSIS
4.1 Heap SnapshotOur heap analysis starts with a heap snapshot obtained
from a running Java program. The heap snapshot tells uswhich objects are currently in the heap, what their fieldvalues are, including the pointer values, and the values ofall root references (static variables and stack references).In addition, the heap snapshot provides the runtime typeof each object instance and the number of bytes needed torepresent each object.We use Sun’s HPROF tool [18] to generate heap snap-
shots. HPROF is an agent that connects to a host Javavirtual machine and uses the JVM Tool Interface [30] toenumerate all the objects in the program’s heap. HPROFoutputs the snapshot in a well-documented binary formatthat is supported by many third-party profiling and mem-ory analysis tools. HPROF runs on top of any JVM thatsupports the JVM Tool Interface, so it is independent ofJVM implementation.One of our goals is to allow the programmer to view the
heap at any point in the program’s execution. To supportthis capability we provide a mechanism for dumping a heapsnapshot from within the program itself. Since the source
to HPROF is provided with the Java Development Kit, wemodify it to include a class Dumper with a static methoddumpHeap() that generates the heap snapshot when called.The programmer adds a call to dumpHeap() in the sourcecode at the point where a heap visualization is desired.
4.2 Heap Analyzer
4.2.1 Input Format
Our heap analyzer takes the heap snapshot from HPROFand parses it into a sequence of records. Of interest are theclass records, which tell us details about the types of theobjects in the heap snapshot, the object instance records,which give the types of these objects and their field val-ues, and the root records, which tell us which heap objectsare pointed to by root pointers (stack references and staticreferences). Using these data, the heap analyzer builds agraph representation of the program heap, mapping objectinstances to graph vertices, pointer fields to graph edges,and roots to entry points in the graph.
4.2.2 Summarization Algorithm
Typical Java programs may contain 100,000, 1,000,000, ormore live objects at any given point in program execution [1];drawing all these objects would make the visualization toocluttered to comprehend and too slow to interact with. Ourheap analyzer summarizes the graph to make visualizationmanageable.
Our summarization algorithm is designed to reduce thesize of the graph while retaining the relationship amongnodes. Each node in the summary graph represents a set ofnodes in the concrete graph with the same runtime type andsimilar connectivity, and the edges in the summary graphrepresent sets of edges in the concrete graph. It works bymerging nodes in the concrete graph according to a set ofrules, and repeatedly applying those rules until it reaches afixed point.
The rules for merging are:
1. If there exists a reference from object o1 to ob-ject o2, and o1 and o2 are of the same type,merge o1 and o2. This rule merges the recursivebackbone of a data structure (e.g. the nodes of a linkedlist or the nodes in a tree).
2. If objects o1 and o2 have the same set of prede-cessor objects (objects that point to o1 or o2)and are of the same type, merge o1 and o2. Thisrule merges sets of objects that have the same typeand the same connectivity (e.g. the objects containedby a data structure).

LinkedList
LinkedList$Entry
head
LinkedList$Entry
tail
LinkedList$Entrynext
T
entry
previousLinkedList$Entry
next
T
entry
previous
next
T
entry
previous
T
entry
LinkedList
LinkedList$Entry
head,tail
T
entry
Figure 2: An example of applying our summarization algorithm to a linked list. Our algorithm first summa-rizes all LinkedList$Entry objects into a single node, then summarizes all T objects into a single node. Notethat the summary would look the same regardless of the number of T objects in the linked list.
With these two simple rules, our system can compress verylarge graphs into more manageable ones. Consider the linkedlist data structure of Figure 2. This linked list contains fourobjects of type T. Our summarization algorithm first mergesall the LinkedList$Entry objects into a single object usingrule 1, and then all the T objects into a single object usingrule 2. Note that the summarized graph looks the sameno matter how many elements the linked list contains —whether 4, 400, or 40,000. However, if the linked list containsobjects of different types, the summarized graph will containseparate nodes for the set of objects of each type.
4.2.3 Dominators
In additional to the graph summary, our heap analyzeralso computes dominance information for all nodes in thegraph. In graph theory, a node d dominates a node n if everypath from the root to n must pass through d. Dominance iswidely used in compilers for control flow graphs, and priorwork has also applied dominance to heap snapshots [16]. Inthis work, we use dominance only to decide the layout ofthe graphs on the screen; the actual dominator tree is notdisplayed by default. We use dominance to establish thehierarchy of objects needed for a tree-based graph layout, asproposed by Falke et al. [9] for software dependency graphs.We discuss our graph layout scheme further in Section 5.We use Cooper, Harvey, and Kennedy’s dominance algo-
rithm [3] to compute dominance. Its O(n2) asymptotic com-plexity is worse than the near-linear algorithm of Lengauerand Tarjan [14], but through well-engineered data structuresit performs better in practice.Dominance analysis requires the graph to have a single
root, but the Java heap may have many roots (stack ref-erences and static variables). Therefore, before computingthe dominator tree, we add to the graph a single “fake root”node that points to the roots of the Java heap. This “fakeroot” does not represent any real Java object, so we label itas such in the visualization.
4.2.4 Output Format
We write the summarized graph and dominance informa-tion in GraphML format [11] for the heap visualizer to im-port and display.
5. HEAP VISUALIZATIONGiven a heap graph from the analyzer described in the
previous section, Heapviz creates an interactive radial lay-out. The input file consists of one set of nodes and twosets of edges – a pointer set describing the connections that
actually exist in the heap, and a dominance set describ-ing conceptual parent-child relations between nodes; this isstored in GraphML format. The goals of the visualizationare twofold: (1) to create an intuitive display of summa-rized heap data, and (2) to create an interactive environmentwhere heap data can be easily explored. Heapviz builds uponthe Prefuse toolkit [12]. Although our implementation fo-cuses on facilitating program understanding and debugging,our visualization environment may be extended for otherusage scenarios.
5.1 LayoutThe heap abstraction includes dominance information for
all nodes in the graph; the immediate dominator relation-ship defines a tree over the heap graph. This tree is atthe heart of the layout algorithm. From among many algo-rithms tailored to display trees, we selected one that pro-duces a radial graph because of its space-efficient expansionof the tree in all directions. Efficient use of screen spaceis of utmost importance, as even after summarization thegraph may contain several hundred nodes. Radial graphsalso avoid the restrictions presented by normal tree layouts.Normal tree layouts have many expectations accompanyingthem, such as the lack of back edges, something not guar-anteed in the graphs Heapviz produces. To place emphasison levels of the graph, the user can determine the depth ofnodes by displaying concentric rings around the root nodeof the layout.
5.2 Visual EncodingVisual encoding within the radial graph focuses primarily
on edge and node differentiation to facilitate pattern recog-nition and to accentuate filters the user may have enactedupon the display. Edges appear in three colors: blue if theyare a pointer edge, red if they are a dominance edge, andpurple if they are both. Nodes also have three possibili-ties for both their fill color – indicating they are selected,not selected, or matching the current search query – andtheir outline color – indicating whether they are expanded,collapsed, or have no children in the dominance tree andthus cannot be either (these six states that dictate node col-oration are described in the following section). Additionally,nodes display their object type on mouse hover.
5.3 InteractionThe visualization supports a variety of interaction styles,
listed below according to their familiarity, with the mostapplication-specific interactions last. The supplemental video
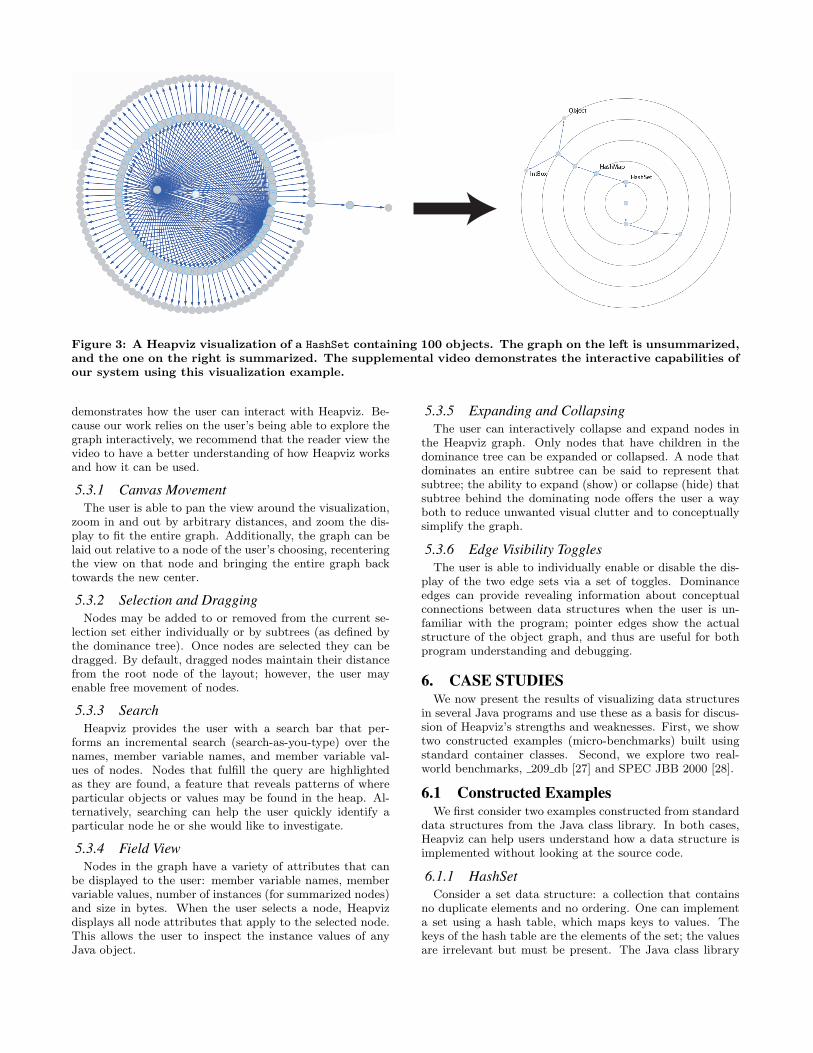
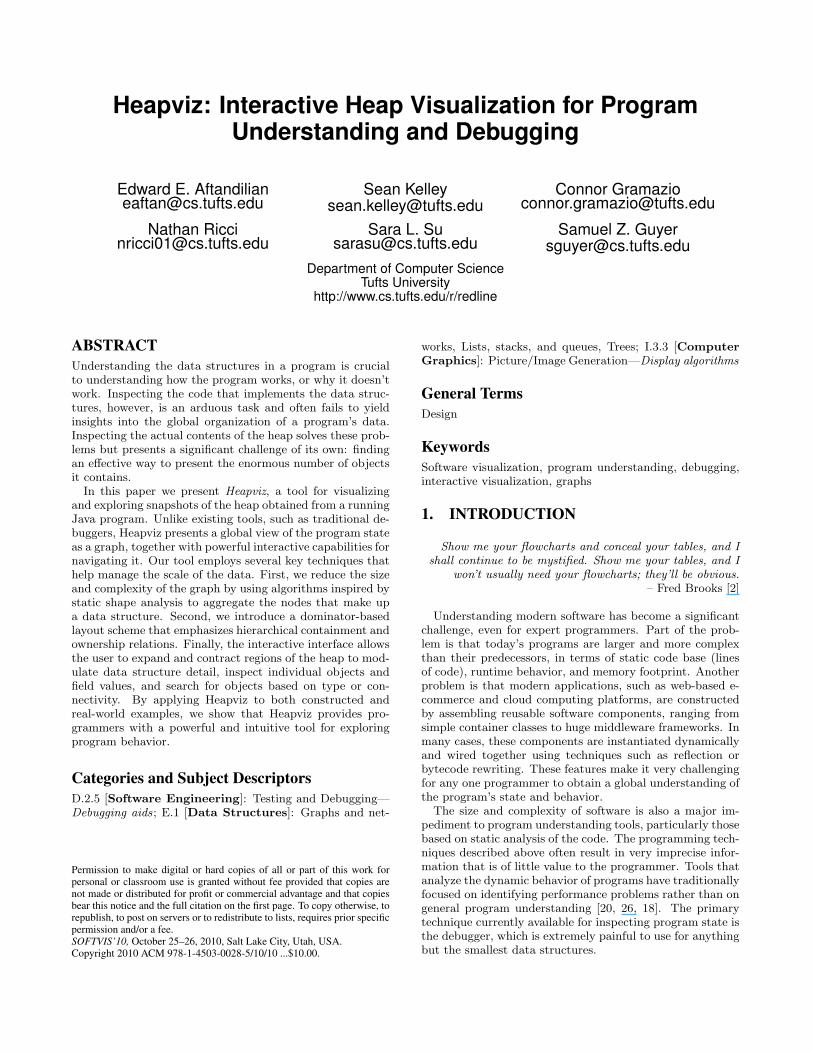
Figure 3: A Heapviz visualization of a HashSet containing 100 objects. The graph on the left is unsummarized,and the one on the right is summarized. The supplemental video demonstrates the interactive capabilities ofour system using this visualization example.
demonstrates how the user can interact with Heapviz. Be-cause our work relies on the user’s being able to explore thegraph interactively, we recommend that the reader view thevideo to have a better understanding of how Heapviz worksand how it can be used.
5.3.1 Canvas Movement
The user is able to pan the view around the visualization,zoom in and out by arbitrary distances, and zoom the dis-play to fit the entire graph. Additionally, the graph can belaid out relative to a node of the user’s choosing, recenteringthe view on that node and bringing the entire graph backtowards the new center.
5.3.2 Selection and Dragging
Nodes may be added to or removed from the current se-lection set either individually or by subtrees (as defined bythe dominance tree). Once nodes are selected they can bedragged. By default, dragged nodes maintain their distancefrom the root node of the layout; however, the user mayenable free movement of nodes.
5.3.3 Search
Heapviz provides the user with a search bar that per-forms an incremental search (search-as-you-type) over thenames, member variable names, and member variable val-ues of nodes. Nodes that fulfill the query are highlightedas they are found, a feature that reveals patterns of whereparticular objects or values may be found in the heap. Al-ternatively, searching can help the user quickly identify aparticular node he or she would like to investigate.
5.3.4 Field View
Nodes in the graph have a variety of attributes that canbe displayed to the user: member variable names, membervariable values, number of instances (for summarized nodes)and size in bytes. When the user selects a node, Heapvizdisplays all node attributes that apply to the selected node.This allows the user to inspect the instance values of anyJava object.
5.3.5 Expanding and Collapsing
The user can interactively collapse and expand nodes inthe Heapviz graph. Only nodes that have children in thedominance tree can be expanded or collapsed. A node thatdominates an entire subtree can be said to represent thatsubtree; the ability to expand (show) or collapse (hide) thatsubtree behind the dominating node offers the user a wayboth to reduce unwanted visual clutter and to conceptuallysimplify the graph.
5.3.6 Edge Visibility Toggles
The user is able to individually enable or disable the dis-play of the two edge sets via a set of toggles. Dominanceedges can provide revealing information about conceptualconnections between data structures when the user is un-familiar with the program; pointer edges show the actualstructure of the object graph, and thus are useful for bothprogram understanding and debugging.
6. CASE STUDIESWe now present the results of visualizing data structures
in several Java programs and use these as a basis for discus-sion of Heapviz’s strengths and weaknesses. First, we showtwo constructed examples (micro-benchmarks) built usingstandard container classes. Second, we explore two real-world benchmarks, 209 db [27] and SPEC JBB 2000 [28].
6.1 Constructed ExamplesWe first consider two examples constructed from standard
data structures from the Java class library. In both cases,Heapviz can help users understand how a data structure isimplemented without looking at the source code.
6.1.1 HashSet
Consider a set data structure: a collection that containsno duplicate elements and no ordering. One can implementa set using a hash table, which maps keys to values. Thekeys of the hash table are the elements of the set; the valuesare irrelevant but must be present. The Java class library

IntBox a
IntBox c
IntBox d
IntBox b
HashMap
TreeMap
LinkedList
Figure 4: A Heapviz visualization of three data structures: a TreeMap, a HashSet, and a LinkedList. Each datastructure contains a subset of IntBox objects. The unsummarized graph is on the left, and the summarizedgraph is on the right. Heapviz reveals the sharing among different data structures without requiring the userto look at the program source code.
includes a HashSet data structure that implements a set inthis way.Figure 3 shows a Heapviz visualization of a Java HashSet
containing one hundred elements. The unsummarized graphshows the overall structure of the HashSet but is too clut-tered to show the specifics of particular nodes. The summa-rized graph is much more manageable, with only ten nodes.In this, we see that the HashSet points to a HashMap (a Javahash table). All IntBox elements (our own implementationof boxed integers) are collapsed into a single node pointedto by a HashSet$Entry node. The user may see how manyconcrete nodes are summarized in one summary node byclicking on the node in the visualization. In this view, wenotice that all HashSet$Entry nodes point to a single con-crete Object node. This Object is the sentinel value in thehash table to ensure that a particular key is in the hash ta-ble and set. The implementor has chosen to save space andtime by using the same Object as the value for all keys, andin fact we were unaware of this implementation detail untilwe viewed this Heapviz graph.
6.1.2 Overlapping Elements
Consider a program that contains multiple data struc-tures. These data structures each contain some subset of thedata objects in the program, and these subsets may overlap.That is, of the objects in data structure x, some are pointedto only by x, some by x and y, and some by x and z. Heapvizcan explain this situation.Figures 4 and 5 show such a program. This program
has three data structures, a TreeMap, a HashSet, and a
LinkedList, using the standard implementations in the Javaclass library. These data structures contain IntBox objects,some of which are shared by two or all three data structures.The unsummarized graph on the left in Figure 4 gives toomuch detail to discover this sharing, but the summarizedgraph makes the sharing clear. Each IntBox node in thesummarized graph represents a set of concrete nodes withthe same set of concrete predecessor nodes. Thus the sum-marized graph explains the sharing of IntBox nodes amongthe different data structures. For example, we can see thatthe IntBox objects represented by node a are pointed to onlyby the HashMap, but the ones represented by nodes c andd are pointed to by both the HashMap and the LinkedList.Thus we can determine that all IntBox objects in the LinkedListare also in the HashMap, but not all of the ones in the HashMapare in the LinkedList. In the interactive visualization, theuser can click on nodes to see exactly how many IntBox
nodes are shared among the data structures, and how manyare only in the HashMap.
From the nodes and edges in Figure 4, without looking atthe source code of the program, we can determine that:
1. There are three data structures in the program: aTreeMap, a HashSet, and a LinkedList.
2. Each data structure contains objects of type IntBox.
3. Some IntBox objects (the ones represented by node a)are pointed to by only the HashMap. The user couldfind the exact number by clicking on node a.
4. Some IntBox objects are shared by all three data struc-tures (node c), and others are shared by only two
A
B
C
D
Figure 5: The same heap as in Figure 4, but showingonly the dominance edges Heapviz uses for graphlayout. The dominance tree clearly separates thethree data structures – a HashSet (D), a TreeMap (C),and a LinkedList (B). Some objects (A) are sharedamong multiple data structures and thus are domi-nated only by the root.
(nodes b and d). Again, the exact number can be foundby clicking on the appropriate summary node.
5. The HashMap contains all IntBox objects in the pro-gram. The other data structures each contain a strictsubset of the IntBox objects.
Heapviz makes clear the sharing among different data struc-tures without requiring the user to look at the programsource code.
6.2 Real ExamplesNow we assess Heapviz’s visualization of two real-world
benchmarks, 209 db [27] and SPEC JBB 2000 [28]. Weconsider how Heapviz is successful in helping us understandthe data structures in 209 db and why it is less successfulin summarizing the graph from SPEC JBB 2000.
6.2.1 _209_db
209 db is a database benchmark from the SPEC JVM 98benchmark suite [27]. It performs multiple database opera-tions on an in-memory database. We took a heap snapshotof an execution of 209 db just after the database is builtfrom an input file and before any operations are performed
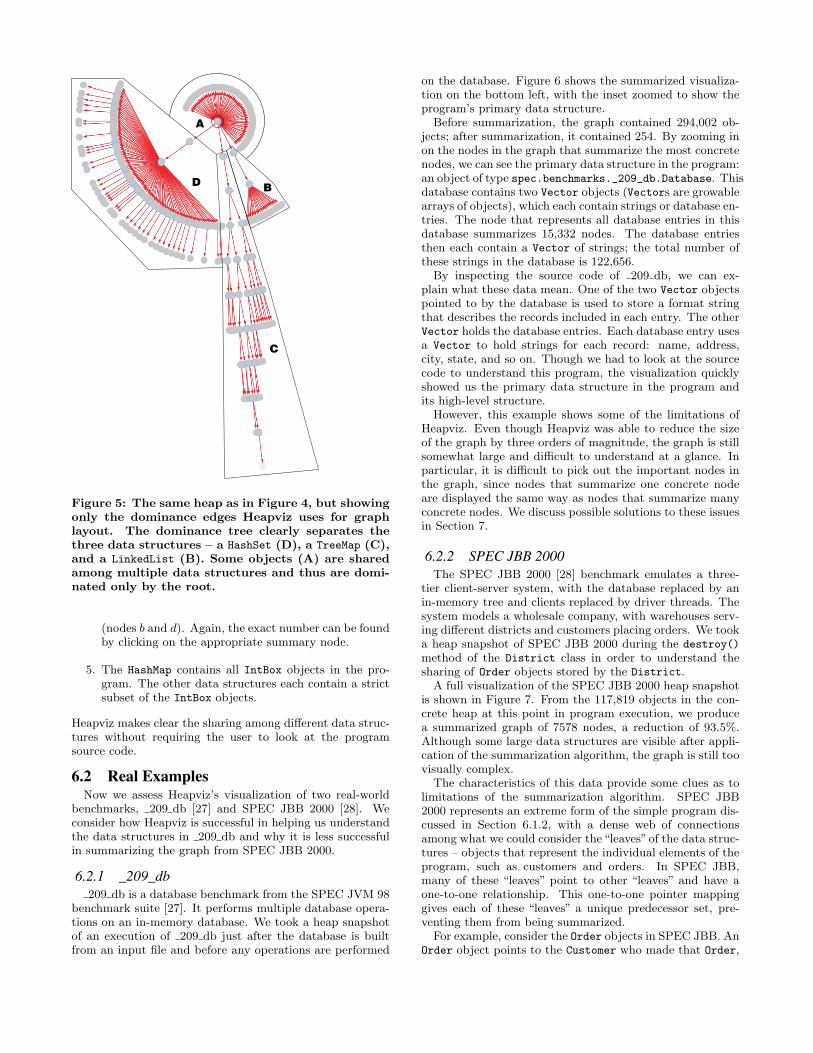
on the database. Figure 6 shows the summarized visualiza-tion on the bottom left, with the inset zoomed to show theprogram’s primary data structure.
Before summarization, the graph contained 294,002 ob-jects; after summarization, it contained 254. By zooming inon the nodes in the graph that summarize the most concretenodes, we can see the primary data structure in the program:an object of type spec.benchmarks._209_db.Database. Thisdatabase contains two Vector objects (Vectors are growablearrays of objects), which each contain strings or database en-tries. The node that represents all database entries in thisdatabase summarizes 15,332 nodes. The database entriesthen each contain a Vector of strings; the total number ofthese strings in the database is 122,656.
By inspecting the source code of 209 db, we can ex-plain what these data mean. One of the two Vector objectspointed to by the database is used to store a format stringthat describes the records included in each entry. The otherVector holds the database entries. Each database entry usesa Vector to hold strings for each record: name, address,city, state, and so on. Though we had to look at the sourcecode to understand this program, the visualization quicklyshowed us the primary data structure in the program andits high-level structure.
However, this example shows some of the limitations ofHeapviz. Even though Heapviz was able to reduce the sizeof the graph by three orders of magnitude, the graph is stillsomewhat large and difficult to understand at a glance. Inparticular, it is difficult to pick out the important nodes inthe graph, since nodes that summarize one concrete nodeare displayed the same way as nodes that summarize manyconcrete nodes. We discuss possible solutions to these issuesin Section 7.
6.2.2 SPEC JBB 2000
The SPEC JBB 2000 [28] benchmark emulates a three-tier client-server system, with the database replaced by anin-memory tree and clients replaced by driver threads. Thesystem models a wholesale company, with warehouses serv-ing different districts and customers placing orders. We tooka heap snapshot of SPEC JBB 2000 during the destroy()
method of the District class in order to understand thesharing of Order objects stored by the District.
A full visualization of the SPEC JBB 2000 heap snapshotis shown in Figure 7. From the 117,819 objects in the con-crete heap at this point in program execution, we producea summarized graph of 7578 nodes, a reduction of 93.5%.Although some large data structures are visible after appli-cation of the summarization algorithm, the graph is still toovisually complex.
The characteristics of this data provide some clues as tolimitations of the summarization algorithm. SPEC JBB2000 represents an extreme form of the simple program dis-cussed in Section 6.1.2, with a dense web of connectionsamong what we could consider the“leaves”of the data struc-tures – objects that represent the individual elements of theprogram, such as customers and orders. In SPEC JBB,many of these “leaves” point to other “leaves” and have aone-to-one relationship. This one-to-one pointer mappinggives each of these “leaves” a unique predecessor set, pre-venting them from being summarized.
For example, consider the Order objects in SPEC JBB. AnOrder object points to the Customer who made that Order,

spec.benchmarks._209_db.Database
java.util.Vector
java.util.Vector
java.lang.Object[]
java.lang.Object[]
java.lang.String
java.lang.String
char[]
char[]
spec.benchmarks._209_db.Entry
Figure 6: A summarized visualization of the 209 db benchmark. The bottom left shows the full graph, withthe inset zoomed to show the program’s primary data structure, a database. This database contains twoVector objects, each containing strings or database entries. The node representing all entries in this databasesummarizes 15,332 nodes. Each database entry contain a Vector of strings; the total number of these stringsin the database is 122,656.
and a Customer object points to the last Order the Customermade. Thus, all Customer objects point to different Order
objects, which then point back to the Customer object. Thissituation is shown in Figure 8.Because Customer objects point to different Order objects,
any Order pointed to by a Customer has a unique predecessorset and will not be merged with any other Order, unlessthe Customer objects are merged first. But because theseOrder objects point back to different Customer objects, thoseCustomer objects also have unique predecessor sets and willnot be merged. As a result, our algorithm cannot mergenodes that exhibit this one-to-one structure. We see thisexact behavior in our graph: None of the three hundredOrder objects are summarized because each of them pointsto and is pointed to by a different Customer object. Wediscuss possible solutions to this problem in Section 7.
7. FUTUREWORKWe have demonstrated Heapviz’s performance on large
programs; however, our summarization algorithm cannotgreatly compress the size of graphs for programs containinga large number of nodes that have unique predecessor sets.
With highly-connected graphs, such as the SPEC JBB 2000benchmark (Figure 7), it is difficult to see the results of aquery, even with highlighting of the relevant nodes. Our cur-rent summarization algorithm applies the same set of rulesfor merging nodes to all heap graphs, regardless of complex-ity. We plan to experiment with adjustable levels of detail,in which the summarization algorithm applies increasingly-powerful abstraction rules to a graph until it reaches a cer-tain threshold of complexity, measured in number of nodesand edges. For example, Heapviz currently preserves sharinginformation among nodes, but for complex graphs like SPECJBB 2000 it could discard sharing information to produce amore manageable visualization.
On a similar note, our visualization currently allows usersto collapse and expand nodes based on the dominator tree.Another possibility would be to expand and collapse the con-crete nodes that a particular summary node represents. Thisapproach would require care to ensure that the graph doesnot become too complex when a summary node is expanded.
Heapviz currently supports searching for nodes by type,but a full-fledged query language would allow users to searchfor objects that meet specific criteria. We envision a querylanguage based on first-order logic, similar to the heap as-

Figure 7: A summarized visualization of the SPECJBB 2000 benchmark, which contains 117,819 ob-jects in the concrete heap at this point in programexecution. The summarized graph contains 7578nodes. Although some large data structures are vis-ible after this significant reduction, the graph is stillcluttered.
sertion language proposed by Reichenbach et al. [22]. Such alanguage would allow queries such as “Which objects of typeString have length ≥ 5?”and“Which objects are reachablefrom object a?” Similarly, we could support a path querylanguage to highlight paths through the heap that matchcertain criteria.Finally, because our long-term goal with Heapviz is to
produce a tool that will be useful to developers, we planto release Heapviz to the developer community. In addition,we plan to conduct formal user studies to determine whetheroutside users find Heapviz useful for program understandingand debugging tasks.
8. CONCLUSIONSWe have presented a tool for helping programmers ana-
lyze, visualize, and navigate heap snapshots from runningJava programs. Heapviz enables users to navigate large,pointer-based data structures at a whole-program scale. Wehave introduced a heap analyzer, which parses a heap snap-shot, builds a graph representation, and applies algorithmsto create a summarized heap abstraction. We have demon-strated how to navigate this abstraction with a heap vi-sualizer which supports several interaction styles, includingdetailed field view, expanding and collapsing of nodes, edgevisibility toggles, and search.Heapviz builds on a body of prior work on tools for de-
bugging, static analysis, and data structure visualization.Our system makes several key contributions. Unlike tradi-
Customer
Order
Customer
Order
Customer
Order
Customer
Order
Figure 8: An example of the one-to-one mappingbetween “leaf” elements that we observed in SPECJBB 2000. No matter what other objects point tothese objects, they will not be summarized becausethe one-to-one structure guarantees that each has aunique predecessor set.
tional debuggers, we provide both an overview and detail;Heapviz provides the global view of the actual heap con-tents, as well as the ability to examine detail on demandwith the field view. This variable level of detail supportsprogrammer productivity in many common usage scenar-ios, including finding bugs and memory leaks, identifyingdata structures that could be improved, and understandingthe overall system architecture. We hope that further ex-ploration of domain-specific usage scenarios will spark thedevelopment of new analysis and visualization techniques.
Acknowledgements
This research has been partially supported by the NationalScience Foundation under grant CCF-0916810. The authorswould like to thank Ben Schwalb, Mark Marron, AudreyGirouard, and the anonymous reviewers for their helpful dis-cussions and comments.
9. REFERENCES
[1] S. M. Blackburn, R. Garner, C. Hoffmann, A. M.Khang, K. S. McKinley, R. Bentzur, A. Diwan,D. Feinberg, D. Frampton, S. Z. Guyer, M. Hirzel,A. Hosking, M. Jump, H. Lee, J. Eliot, B. Moss,A. Phansalkar, D. Stefanovic, T. VanDrunen, D. vonDincklage, and B. Wiedermann. The DaCapobenchmarks: Java benchmarking development andanalysis. In ACM Conference on Object-Oriented
Programming Systems, Languages, and Applications,pages 169–190, 2006.
[2] F. P. Brooks, Jr. The Mythical Man-Month.Addison-Wesley, 1975.
[3] K. D. Cooper, T. J. Harvey, and K. Kennedy. Asimple, fast dominance algorithm. Software—Practice
and Experience, (4):1–10, 2001.
[4] W. De Pauw, R. Helm, D. Kimelman, and J. Vlissides.Visualizing the behavior of object-oriented systems. InACM Conference on Object-Oriented Programming
Systems, Languages, and Applications, pages 326–337,1993.
[5] W. De Pauw and G. Sevitsky. Visualizing referencepatterns for solving memory leaks in Java. In The
European Conference on Object-Oriented
Programming, pages 116–134, 1999.
[6] W. De Pauw and J. M. Vlissides. Visualizingobject-oriented programs with Jinsight. In The
European Conference on Object-Oriented
Programming, pages 541–542, 1998.

[7] B. Demsky and M. Rinard. Automatic extraction ofheap reference properties in object-oriented programs.IEEE Transactions on Software Engineering, pages305–324, 2009.
[8] A. S. Erkan, T. J. VanSlyke, and T. M. Scaffidi. Datastructure visualization with LaTeX and Prefuse. InITiCSE ’07: Proceedings of the 12th Annual SIGCSE
Conference on Innovation and Technology in
Computer Science Education, pages 301–305, NewYork, NY, USA, 2007. ACM.
[9] R. Falke, R. Klein, R. Koschke, and J. Quante. Thedominance tree in visualizing software dependencies.In VISSOFT ’05: Proceedings of the 3rd IEEE
International Workshop on Visualizing Software for
Understanding and Analysis, page 24, Washington,DC, USA, 2005. IEEE Computer Society.
[10] R. Ghiya and L. J. Hendren. Is it a tree, a DAG, or acyclic graph? A shape analysis for heap-directedpointers in C. In ACM Symposium on the Principles
of Programming Languages, pages 1–15, 1996.
[11] Graph Drawing Steering Committee. The GraphMLfile format, 2010. http://graphml.graphdrawing.org,Retrieved April 30, 2010.
[12] J. Heer. Prefuse: a toolkit for interactive informationvisualization. In CHI ’05: Proceedings of the SIGCHI
Conference on Human Factors in Computing Systems,pages 421–430, 2005.
[13] T. Hill, J. Noble, and J. Potter. Scalable visualizationsof object-oriented systems with ownership trees.Journal of Visual Languages and Computing, pages319–339, June 2002.
[14] T. Lengauer and R. E. Tarjan. A fast algorithm forfinding dominators in a flowgraph. ACM Trans.
Program. Lang. Syst., 1(1):121–141, 1979.
[15] M. Marron, C. Sanchez, and Z. Su. High-level heapabstractions for debugging programs. 2010.http://software.imdea.org/~marron/papers/
publications.html, Retrieved April 30, 2010.
[16] N. Mitchell. The runtime structure of objectownership. In The European Conference on
Object-Oriented Programming, pages 74–98, 2006.
[17] N. Mitchell, E. Schonberg, and G. Sevitsky. Makingsense of large heaps. In The European Conference on
Object-Oriented Programming, pages 77–97, 2009.
[18] K. O’Hair. HPROF: A heap/CPU profiling tool inJ2SE 5.0, 2004. http://java.sun.com/developer/technicalArticles/Programming/HPROF.html,Retrieved April 30, 2010.
[19] S. Pheng and C. Verbrugge. Dynamic data structureanalysis for Java programs. In Proceedings of IEEE
International Conference on Program Comprehension,pages 191–201, 2006.
[20] Quest. JProbe Memory Debugger.http://www.quest.com/jprobe/, Retrieved July 22,2010.
[21] D. Rayside, L. Mendel, and D. Jackson. A dynamicanalysis for revealing object ownership and sharing. InWODA ’06: Proceedings of the 2006 International
Workshop on Dynamic Systems Analysis, pages 57–64,2006.
[22] C. Reichenbach, , N. Immerman, Y. Smaragdakis,E. E. Aftandilian, and S. Z. Guyer. What can the GCcompute efficiently? A language for heap assertions atGC time. In ACM Conference on Object-Oriented
Programming Systems, Languages, and Applications,2010.
[23] S. Reiss. Visualizing the Java heap to detect memoryproblems. In VISSOFT ’09: Proceedings of the 5th
IEEE International Workshop on Visualizing Software
for Understanding and Analysis, pages 73–80, 2009.
[24] S. P. Reiss and M. Renieris. Jove: Java as it happens.In ACM Symposium on Software Visualization, pages115–124, 2005.
[25] M. Sagiv, T. Reps, and R. Wilhelm. Parametric shapeanalysis via 3-valued logic. In ACM Symposium on the
Principles of Programming Languages, pages 105–118,1999.
[26] G. Sevitsky, W. De Pauw, and R. Konuru. Aninformation exploration tool for performance analysisof java programs. In TOOLS ’01: Proceedings of the
Technology of Object-Oriented Languages and
Systems, page 85, Washington, DC, 2001. IEEEComputer Society.
[27] Standard Performance Evaluation Corporation.SPECjvm98 Documentation, release 1.03 edition, 1999.
[28] Standard Performance Evaluation Corporation.SPECjbb2000 Documentation, release 1.01 edition,2001.
[29] M.-A. D. Storey and H. A. Muller. Manipulating anddocumenting software structures using shrimp views.In ICSM ’95: Proceedings of the International
Conference on Software Maintenance, page 275,Washington, DC, 1995. IEEE Computer Society.
[30] Sun Microsystems. JVM tool interface, 2010.http://java.sun.com/javase/6/docs/platform/
jvmti/jvmti.html, Retrieved April 30, 2010.
[31] J. Sundararaman and G. Back. HDPV: Interactive,faithful, in-vivo runtime state visualization forC/C++ and Java. In SoftVis ’08: Proceedings of the
4th ACM Symposium on Software Visualization, pages47–56, New York, NY, USA, 2008. ACM.
[32] T. Zimmerman and A. Zeller. Visualizing memorygraphs. Lecture Notes in Computer Science - Software
Visualization, 2269:533–537, 2002.