Impairments of Social Cognition and Decision Making in Alzheimers Disease
Upload
independentCategory
view
4download
0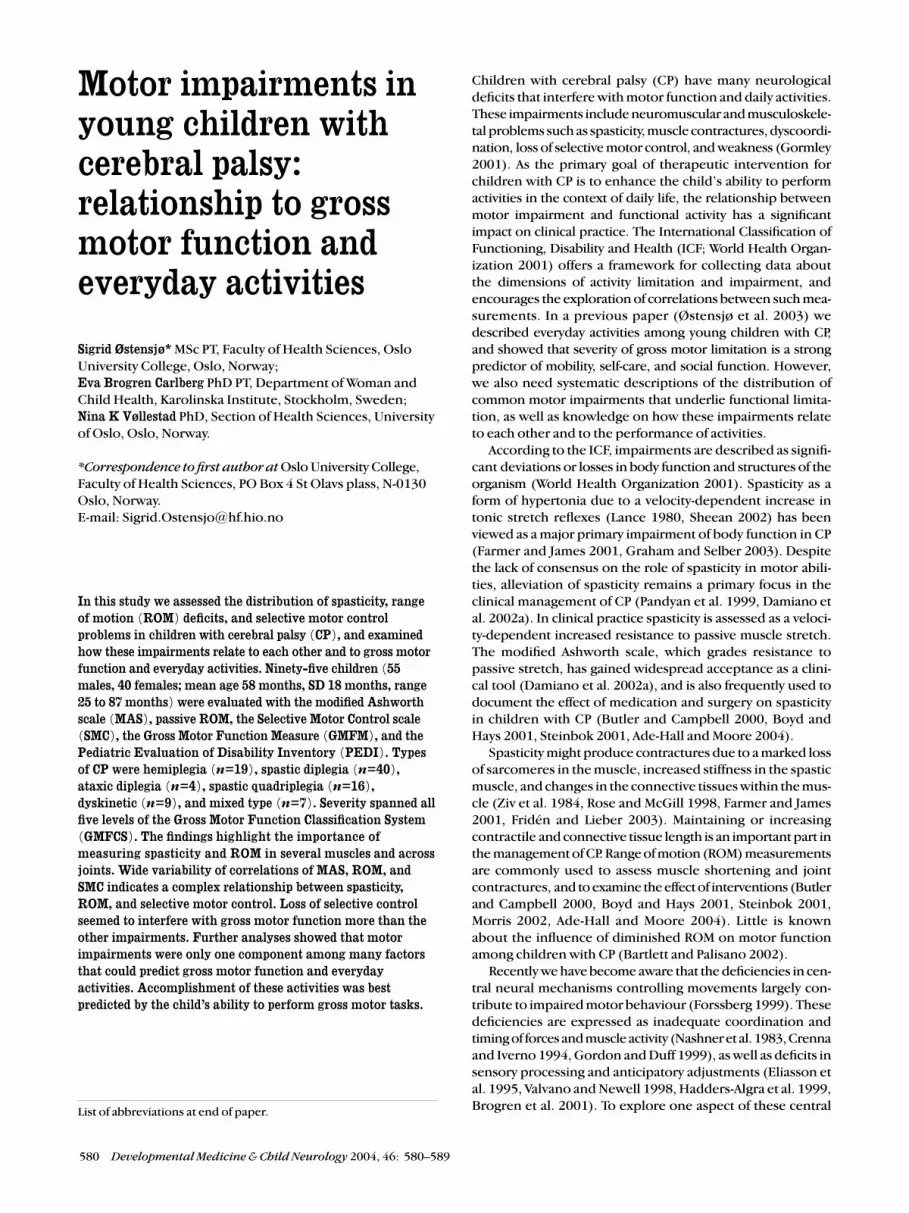
Motor impairments inyoung children withcerebral palsy:relationship to grossmotor function andeveryday activities
Sigrid Østensjø* MSc PT, Faculty of Health Sciences, OsloUniversity College, Oslo, Norway;Eva Brogren Carlberg PhD PT, Department of Woman andChild Health, Karolinska Institute, Stockholm, Sweden;Nina K Vøllestad PhD, Section of Health Sciences, Universityof Oslo, Oslo, Norway.
*Correspondence to first author at Oslo University College,Faculty of Health Sciences, PO Box 4 St Olavs plass, N-0130Oslo, Norway.E-mail: [email protected]
In this study we assessed the distribution of spasticity, rangeof motion (ROM) deficits, and selective motor controlproblems in children with cerebral palsy (CP), and examinedhow these impairments relate to each other and to gross motorfunction and everyday activities. Ninety-five children (55males, 40 females; mean age 58 months, SD 18 months, range25 to 87 months) were evaluated with the modified Ashworthscale (MAS), passive ROM, the Selective Motor Control scale(SMC), the Gross Motor Function Measure (GMFM), and thePediatric Evaluation of Disability Inventory (PEDI). Typesof CP were hemiplegia (n=19), spastic diplegia (n=40),ataxic diplegia (n=4), spastic quadriplegia (n=16),dyskinetic (n=9), and mixed type (n=7). Severity spanned allfive levels of the Gross Motor Function Classification System(GMFCS). The findings highlight the importance ofmeasuring spasticity and ROM in several muscles and acrossjoints. Wide variability of correlations of MAS, ROM, andSMC indicates a complex relationship between spasticity,ROM, and selective motor control. Loss of selective controlseemed to interfere with gross motor function more than theother impairments. Further analyses showed that motorimpairments were only one component among many factorsthat could predict gross motor function and everydayactivities. Accomplishment of these activities was bestpredicted by the child’s ability to perform gross motor tasks.
Children with cerebral palsy (CP) have many neurologicaldeficits that interfere with motor function and daily activities.These impairments include neuromuscular and musculoskele-tal problems such as spasticity, muscle contractures, dyscoordi-nation, loss of selective motor control, and weakness (Gormley2001). As the primary goal of therapeutic intervention forchildren with CP is to enhance the child’s ability to performactivities in the context of daily life, the relationship betweenmotor impairment and functional activity has a significantimpact on clinical practice. The International Classification ofFunctioning, Disability and Health (ICF; World Health Organ-ization 2001) offers a framework for collecting data aboutthe dimensions of activity limitation and impairment, andencourages the exploration of correlations between such mea-surements. In a previous paper (Østensjø et al. 2003) wedescribed everyday activities among young children with CP,and showed that severity of gross motor limitation is a strongpredictor of mobility, self-care, and social function. However,we also need systematic descriptions of the distribution ofcommon motor impairments that underlie functional limita-tion, as well as knowledge on how these impairments relateto each other and to the performance of activities.
According to the ICF, impairments are described as signifi-cant deviations or losses in body function and structures of theorganism (World Health Organization 2001). Spasticity as aform of hypertonia due to a velocity-dependent increase intonic stretch reflexes (Lance 1980, Sheean 2002) has beenviewed as a major primary impairment of body function in CP(Farmer and James 2001, Graham and Selber 2003). Despitethe lack of consensus on the role of spasticity in motor abili-ties, alleviation of spasticity remains a primary focus in theclinical management of CP (Pandyan et al. 1999, Damiano etal. 2002a). In clinical practice spasticity is assessed as a veloci-ty-dependent increased resistance to passive muscle stretch.The modified Ashworth scale, which grades resistance topassive stretch, has gained widespread acceptance as a clini-cal tool (Damiano et al. 2002a), and is also frequently used todocument the effect of medication and surgery on spasticityin children with CP (Butler and Campbell 2000, Boyd andHays 2001, Steinbok 2001, Ade-Hall and Moore 2004).
Spasticity might produce contractures due to a marked lossof sarcomeres in the muscle, increased stiffness in the spasticmuscle, and changes in the connective tissues within the mus-cle (Ziv et al. 1984, Rose and McGill 1998, Farmer and James2001, Fridén and Lieber 2003). Maintaining or increasingcontractile and connective tissue length is an important part inthe management of CP. Range of motion (ROM) measurementsare commonly used to assess muscle shortening and jointcontractures, and to examine the effect of interventions (Butlerand Campbell 2000, Boyd and Hays 2001, Steinbok 2001,Morris 2002, Ade-Hall and Moore 2004). Little is knownabout the influence of diminished ROM on motor functionamong children with CP (Bartlett and Palisano 2002).
Recently we have become aware that the deficiencies in cen-tral neural mechanisms controlling movements largely con-tribute to impaired motor behaviour (Forssberg 1999). Thesedeficiencies are expressed as inadequate coordination andtiming of forces and muscle activity (Nashner et al. 1983, Crennaand Iverno 1994, Gordon and Duff 1999), as well as deficits insensory processing and anticipatory adjustments (Eliasson etal. 1995, Valvano and Newell 1998, Hadders-Algra et al. 1999,Brogren et al. 2001). To explore one aspect of these central
580 Developmental Medicine & Child Neurology 2004, 46: 580–589
List of abbreviations at end of paper.

Motor Impairments and Functional Activities in CP Sigrid Østensjø et al. 581
mechanisms, Boyd and Graham (1999) developed the SelectiveMotor Control (SMC) scale to assess selective dorsiflexion anddexterity of the ankle (see Appendix II). How this scale relatesto spasticity and range of motion (ROM), and to functionalactivities has not been investigated.
The present study had two main objectives: first, to describethe magnitude and distribution of spasticity, ROM deficits, andselective motor control problems related to type and severityof CP, and to examine the interrelation of these impairments;and, second, to examine which of the three motor impairmentsand other factors related to CP are the strongest predictors ofgross motor function and everyday activity performance.
MethodPARTICIPANTS
This study followed a cross-sectional design. The populationand the study group were extensively described in a previ-ous paper (Østensjø et al. 2003). Participants were 95 chil-dren with CP (55 males and 40 females; mean age 58 months,SD 18 months, range 25 to 87 months) of a population of189 children with CP (age range 2 years to 7 years 6 months)living in five counties in south-eastern Norway. Initially, a letterdescribing the study invited the parents of 189 children toparticipate. Participants consisted of those 95 children whoseparents returned the consent form. Ethical approval for thestudy was given by the Regional Committee for Medical Ethics.
MEASUREMENTS
Classification of CP
Subtypes of CP were classified based on type and distributionof impairments: hemiplegia, spastic diplegia, ataxic diplegia,quadriplegia, dyskinetic, and mixed type (Hagberg and Hagberg1993). Topographical distribution was further classified accord-ing to the affected areas of the body: unilateral, leg dominant,and three- to four-limb involvement. The Gross Motor FunctionClassification System (GMFCS; Palisano et al. 1997) was usedto classify severity of limitations in gross motor function. TheGMFCS has shown good validity and reliability (Palisano et al.2000, Wood and Rosenbaum 2000).
Impairments
Spasticity measured as degree of resistance to passive movement(ICF b7350)* was rated on a modified Ashworth scale (MAS;Hedberg et al. 1999; Appendix I). Spasticity in the hip adduc-tors; the knee flexors, and extensors; and the plantar flexorsof the ankle in both legs was measured in the supine positionusing standardized procedures. The test was performed at amoderate speed (180 /̊s). Adequate levels of interrater relia-bility have been reported in adults (Pandyan et al. 1999).Fosang and coworkers (2003) reported lower values amongchildren with CP than in adults with spasticity, particularly forthe plantar flexors of the ankle.
Passive ROM (ICF b1700) was assessed with a plastic univer-sal goniometer. All angles were measured to the nearest 5˚using controlled stabilization procedures. The measure-ments were done in the supine position, with the exceptionof rotation of the hips, which was measured in prone. In the hipregion, flexion, extension, abduction, and internal and exter-nal rotation were measured. Hip flexion and abduction weretested with the contralateral leg extended. To detect flexion
contractures, the pelvis was stabilized and the contralateralhip was flexed as far as possible to measure the angle betweenthe table and the leg. Internal and external rotations were test-ed in the prone position with the knee in 90˚ of flexion. In theknee region flexion, extension, and popliteal angle were mea-sured. Popliteal angle was tested with the hip in 90˚ of flex-ion. In the ankle region, dorsiflexion and plantar flexion weremeasured with the knee extended. Errors of measurements inchildren with CP are estimated to be approximately ±10˚(Harris et al. 1985, Stuberg et al. 1988, McDowell at al. 2000,Fosang et al. 2003, Kilgour et al. 2003).
Selective dorsiflexion and dexterity of the ankle (ICF b7601)was rated on the SMC (Boyd and Graham 1999; Appendix II).Children rested in long-leg sitting with knees comfortablyextended, so they could see their feet. Children who couldnot sit independently were supported in this position. Thechild was instructed to dorsiflex the foot to reach a toy in amid-position above the ankle joint. In children who couldnot cooperate in performing the task, active movement ofthe ankle was observed and scored according to the SMCscale during the motor assessment. Validity and reliability ofthis measure have not been reported.
Activities and participation
Achievement of gross motor skills was assessed using theGMFM-66 (Russell et al. 2002). The original GMFM consists of88 items scored on a 4-point ordinal scale. The GMFM measuresactivities classified in the mobility domain of the ICF (d4), aswell as a few neuromusculoskeletal and movement-relatedbody functions (ICF b7; Bjorbækmo 2002). The Rasch modelof item analysis has been applied to the 88-items scale(Russell et al. 2000, 2002) and 66 items were identified andarranged in order of item difficulty. One of the improvementsof the GMFM-66 was transformation of a percentage score intoan interval score representative of the overall level of grossmotor ability of the child. The GMFM-66 has shown goodvalidity and reliability (Russell et al. 2000, 2002).
The Pediatric Evaluation of Disability Inventory (PEDI; Haleyet al. 1992) was used to assess children’s functioning in self-care, mobility, and social function using the Functional Skillsscale. This scale includes 197 skills from all the nine domainsof the activity and participation classification of the ICF (d1 tod9; Bjorbækmo 2002); measuring if the activities can be per-formed or not in most situations (scored 1/0). The scaled scores(0 to 100), reflecting increasing level of functioning in eachdomain, were used for the analyses. Several studies supportthe PEDI as a valid and reliable assessment of daily activitiesin children with disabilities (Feldman et al. 1990; Haley et al.1991, 1992; Nichols and Case-Schmidt 1996).
DATA COLLECTION
Parents completed questionnaires collecting information aboutfactors related to CP, such as gestational age, age, visual prob-lems, epilepsy, and learning difficulties before the motorassessment of the child and the parent interview. Learningproblems, or learning difficulties, were described as difficul-ties with learning, memorizing, and applying knowledge.Visual problems, epilepsy, and learning difficulties were allrecorded as dichotomous variables (yes or no). Informationabout interventions that aim to improve motor impairments(antispastic medication, stretching exercises, orthotics, andorthopaedic surgery) was also collected. For quality assurance*ICF numbers denote classification codes.
of the data, the project leader (the first author) went throughthe questionnaire with the parent during the interview. Atrained physiotherapist in the children’s rehabilitation cen-tre performed the motor assessment and the classification ofthe children. Any uncertainties about the score of a childwere discussed with the project leader. One caregiver, mostoften one parent, attended the motor assessment and assist-ed the physiotherapist. All children but one finished theassessment in one session. Everyday activities were assessed
using the Norwegian translation of the PEDI (Jahnsen et al.2000). The project leader interviewed all the parents and theprimary caregiver of two children living in residential care.All interviews took place on the same day as the motor assess-ment, except for one child.
DATA ANALYSES
Several motor impairments were measured in both legs. Toindicate the extent or magnitude of spasticity in the legs, thefour MAS scores of each leg were transformed into a summarymeasure (index), calculated as the average of the four measure-ments. To analyze the relationship between spasticity anddeviations in ROM, the amount of leg spasticity was catego-rized into four groups: no increase in muscle tone (index 0 to1), mild increase (index >1 to 2), moderate increase (index>2 to 3), and severe increase in muscle tone (index >3).
To indicate degree of secondary musculoskeletal problemsin the legs, the 10 ROM measurements of each leg were alsotransformed into an index. Initially each measurement wascompared with normative values in children aged 3 to 8 years(Boone and Azen 1979, Svenningsen et al. 1989, Chotza andHolmgren 1999), and values outside 2SD of the normaldistribution were classified as deviations. Children’s ROMindices were calculated summarizing the number of devia-tions of each leg giving a possible score of 0 to 10 deviations.
Furthermore, the MAS index, the ROM index, and the SMCscore of children’s right and left legs were compared to seehow involvement differed between the legs. When the right andleft leg differed by ≥0.5 for MAS index, the child was classifiedas having a ‘side difference’ for spasticity. This cut-off pointimplies a difference of one grade on the Ashworth scale fortwo measurements or two grades for one measurement. Adifference of one deviation in ROM was considered a side dif-ference to capture children with hemiplegia where the onlydivergence could be in dorsiflexion of the ankle. For selectivemotor control one grade difference on the SMC scale was clas-sified as a side difference. Side differences for MAS index werenoted in 28 children, for ROM index in 62 children, and forSMC scores in 38 children. When differences occurred, thesame leg was always the most impaired. All scores were almostequally and normally distributed for children with and with-out side differences, and could, therefore, be pooled. Onlythe scores of the more involved leg were used. A computer-scoring program (Gross Motor Function Estimator CD-ROM;Russell et al. 2002) calculated the child’s GMFM-66 score.Using PEDI software (Haley et al. 1992), raw scores for individ-ual items were transformed into scaled scores.
Statistical analyses were performed with SPSS software(version 11.0). Due to the fact that not all data were normallydistributed, and both continuous and categorical data wereincluded, both parametric and non-parametric statisticswere used. The Mann–Whitney U test was applied to test dif-ferences in impairments between groups, and the Wilcoxontest was performed to test differences between amount ofspasticity in hip, knee, and ankle muscles within groups. Totest associations, both the Pearson’s (r) and Spearman’s rank(rs) correlations were used. Finally, multiple linear regressionanalyses were performed to identify factors that could explainvariations in gross motor function, and in mobility, self-care,and social function. The criterion for entry into regressionequation was p<0.05 and for removal it was α>0.10.
582 Developmental Medicine & Child Neurology 2004, 46: 580–589
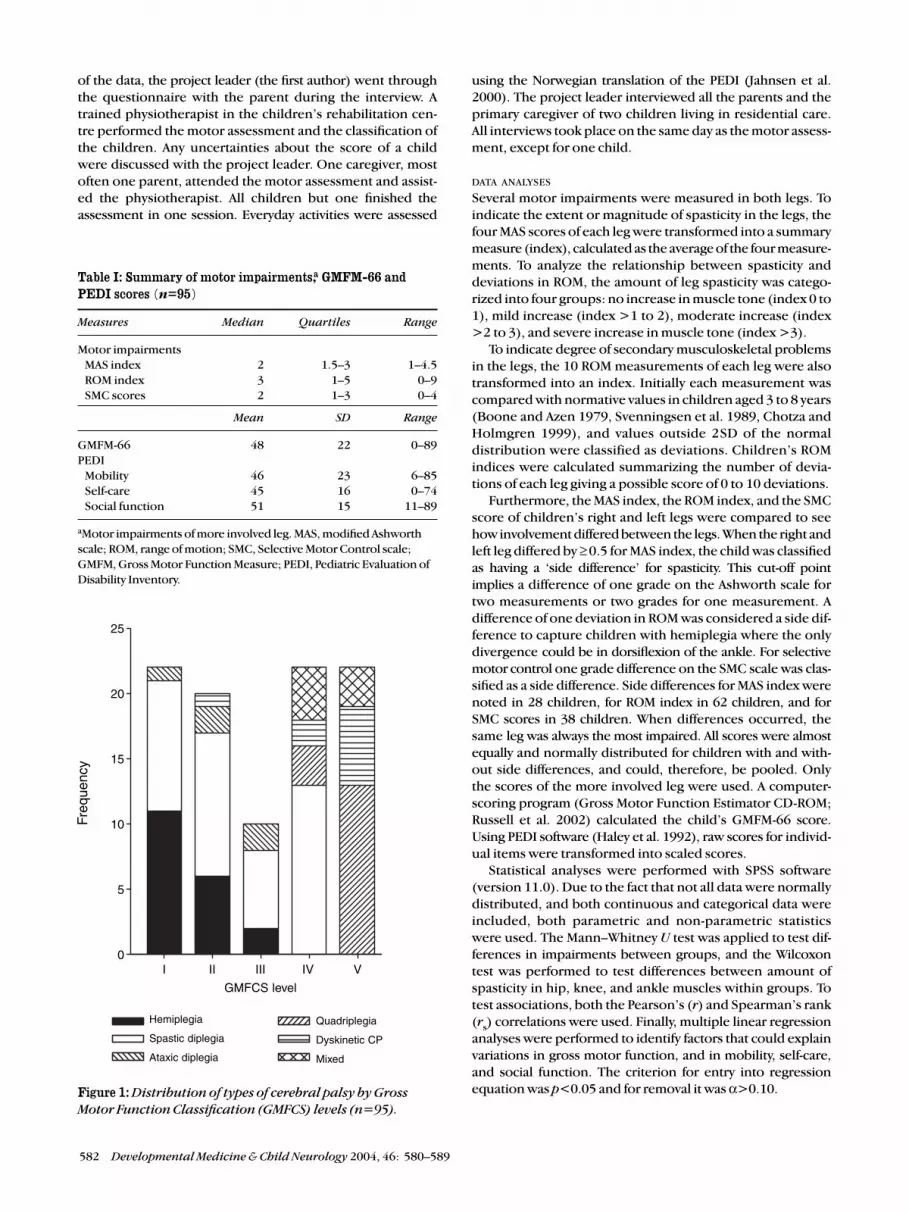
Figure 1: Distribution of types of cerebral palsy by Gross
Motor Function Classification (GMFCS) levels (n=95).
Table I: Summary of motor impairments,a GMFM-66 andPEDI scores (n=95)
Measures Median Quartiles Range
Motor impairmentsMAS index 2 1.5–3 1–4.5ROM index 3 1–5 0–9SMC scores 2 1–3 0–4
Mean SD Range
GMFM-66 48 22 0–89PEDI
Mobility 46 23 6–85Self-care 45 16 0–74Social function 51 15 11–89
aMotor impairments of more involved leg. MAS, modified Ashworthscale; ROM, range of motion; SMC, Selective Motor Control scale;GMFM, Gross Motor Function Measure; PEDI, Pediatric Evaluation ofDisability Inventory.
Hemiplegia
Spastic diplegia
Ataxic diplegia
Quadriplegia
Dyskinetic CP
Mixed
I II III IV V
GMFCS level
Freq
uenc
y
25
20
15
10
5
0

ResultsMOTOR IMPAIRMENTS RELATED TO TYPE AND SEVERITY OF CP
In the 95 studied children, types of CP were hemiplegia (n=19),spastic diplegia (n=40), ataxic diplegia (n=4), spastic quad-riplegia (n=16), dyskinetic (n=9), and mixed (n=7). The topo-graphical distribution was unilateral (n=19), leg dominated(n=44), and three- and four-limb involvement (n=32). Accord-ing to the GMFCS, 22 children were classified at level I, 20 atlevel II, 9 at level III, 22 at level IV, and 22 children at level V. Thedistribution of types of CP by GMFCS levels is illustrated inFigure 1. Some associated problems were reported in 67 of thechildren, most frequently visual problems of any kind (57%),learning difficulties (44%), and epilepsy (36%).
Scores of motor impairments for all children are summarizedin Table I. As expected, a large variability in leg spasticity (MASindex), number of deviations in ROM (ROM index), and loss
of selective motor control in the ankle (SMC scores) was seenamong this heterogeneous group of children with CP.
Table II shows the distribution of motor impairments withinthe different types of CP. Spastic syndromes occurred in 76(80%) of the children. Comparing severity of motor impair-ments in the more involved leg between the spastic groups,children with diplegia showed a higher amount of leg spas-ticity and more deviations in ROM than children with hemi-plegia (Mann–Whitney U, p<0.001). With respect to selectivemotor control, no significant difference was seen betweenthese two groups (p=0.249). The group with quadriplegiahad greater impairment than children with diplegia in allmeasurements (p<0.001 to p=0.021).
Table III shows the distribution of spasticity in the hip, knee,and ankle region within the three spastic groups. In childrenwith hemiplegia, spasticity increased from the hip adductors
Motor Impairments and Functional Activities in CP Sigrid Østensjø et al. 583
Table IV: Distribution of motor impairmentsa by Gross Motor Function Classification System (GMFCS) levels (n=95)
Motor impairments GMFCS
Level I Level II Level III Level IV Level V
(n=22) (n=20) (n=9) (n=22) (n=22)
Median (quartiles) Median (quartiles) Median (quartiles) Median (quartiles) Median (quartiles)
MAS index 1.5 (1.5–2) 2 (1.5–2) 2.5 (2–3) 2.5 (2–3) 3 (2–3.5)
ROM index 2 (1–3) 2 (1–3) 2 (2–6) 4 (3–6) 6 (5–7)
SMC score 3 (2–3) 2 (1–3) 1 (1–2) 1 (1–2) 1 (0–1)
aMotor impairments of more involved leg. MAS, modified Ashworth scale; ROM, range of motion; SMC, Selective Motor Control scale.
Table III: Distribution of MAS scoresa in hip, knee, and ankle muscles by spastic syndromes (n=75)
Muscle groups Spastic syndromes
Hemiplegia Diplegia Quadriplegia
(n= 19) (n=40) (n=16)
Median (quartiles) Median (quartiles) Median (quartiles)
Hip adductors 1 (1–1) 2 (1–3) 3.5 (2–4)
Knee flexors 1 (1–2) 2 (2–3) 3 (2–4)
Knee extensors 1 (1–1) 1 (1–2) 2 (2–3)
Ankle plantar flexors 3 (2–3) 3 (2–3) 3 (3–4)
aMAS, modified Ashworth scale scores of more involved leg.
Table II: Distribution of motor impairmentsa by types of CP (n=95)
Motor impairments Types of CP
Spastic hemiplegia Spastic diplegia Spastic quadriplegia Dyskinetic Mixed
(n=19) (n=40) (n=16) (n=9) (n=7)
Median (quartiles) Median (quartiles) Median (quartiles) Median (quartiles) Median (quartiles)
MAS index 1.5 (1.5–2) 2 (2–3) 3 (2–4) 2 (1–3) 2.5 (2.5–3)
ROM index 1 (1–2) 3 (2–6) 5.5 (3–7) 5 (3–7) 5 (2–6)
SMC score 2 (2–3) 2 (1–3) 0.5 (0–1) 1 (1–3) 1 (0–2)
aMotor impairments of more involved leg. MAS, modified Ashworth scale; ROM, range of motion; SMC, Selective Motor Control scale.NB. Ataxic diplegia was not included here due to small sample size (n=4).

to the knee flexors (Wilcoxon, p=0.025), and from the kneeto the ankle plantar flexors (p<0.001). In the group with diple-gia, spasticity increased from knee to ankle muscles (p=0.002),whereas no significant difference in spasticity between hipand knee (p=0.417), or between knee and ankle muscles wasobserved in children with quadriplegia (p=0.593). Moderatespasticity in the plantar flexors (score 3) was most commonlyseen in all spastic syndromes (see Table III).
Motor impairments by GMFCS levels are presented inTable IV. Comparisons showed that children walking unaided(levels I and II) had significantly less leg spasticity, fewer devi-ations in ROM, and better selective dorsiflexion than childrenwalking with devices or moving on the floor (levels III and IV,Mann–Whitney U, p<0.001). Children with limited self-initi-ated mobility (level V) showed more deviations in ROM andmore reduced selective control compared with those in levelIII and IV (p=0.009 and 0.001). No difference in spasticitywas observed between these two mobility groups (p=0.501).
Many children received a range of therapy services that areregularly given to reduce spasticity and maintain muscle length.Thirty-six children had received antispastic medication. Duringthe 6 months before the assessment, nine children receivedtreatment with botulinum toxin A: seven in calf muscles and twoin hip adductors. Three children were given baclofen contin-uously: one was administered it orally and two intrathecally.Four children had undergone orthopaedic surgery during thelast year, but none within the 4 months before the assess-ment. Orthotics were frequently provided: 46 children usedankle–foot orthoses or night splints regularly, and seven usedhip orthoses. More than half of the parents (63%) performedpassive stretching exercises at home.
RELATIONSHIP BETWEEN MOTOR IMPAIRMENTS
Relationships between MAS index, ROM index, and SMCscores are presented in Figures 2, 3, and 4. Deviations in ROMincreased progressively with level of spasticity (see Fig. 2). Forthis relationship the largest variation was seen within thegroup with moderate spasticity (index >2 to 3). Furthermore,children using mainly the tibialis anterior for dorsiflexion(SMC scores 3 and 4) seemed to have less leg spasticity thanchildren using mainly the toe extensors (SMC scores 1 and 2;see Fig. 3). A similar pattern of correlations was seen for SMCand ROM: that activation of the tibialis anterior was associat-ed with fewer deviations in ROM (see Fig. 4). Particularlylarge variation was observed within the group using merelythe toe extensors (SMC score 1).
Analyses of the relationships between MAS and ROM foropposing muscle groups, in the hip for adductors and abduc-tion, in the knee for flexors and extension and popliteal angle,and in the ankle for plantar flexors and dorsiflexion showedmoderate rank correlation (r
s=0.72 to 0.50, p<0.001). The
correlation between MAS scores of the plantar flexors andSMC scores was fair (r
s=0.30, p=0.004). Fair correlation also
appeared between SMC and passive dorsiflexion (rs=0.40,
p<0.001). The large scatter in the relationships of the MAS,ROM, and SMC scores could be illustrated using the most com-monly observed grade of spasticity in the plantar flexors.With a MAS score of 3, passive dorsiflexion varied between –15˚and 20˚, and SMC scores between 1 and 3.
RELATIONSHIPS BETWEEN MOTOR IMPAIRMENTS, GROSS MOTOR
FUNCTION, AND EVERYDAY ACTIVITIES
There was a large variability in achievement of gross motor
584 Developmental Medicine & Child Neurology 2004, 46: 580–589
Figure 2: Boxplot of relation between modified Ashworth
scale (MAS) index for spasticity and range of motion (ROM)
index of more involved leg (n=95); z=29, df=3, p<0.001.
Box shows 25th to 75th centiles; whisker bars are 10th to
90th centiles; outliers are shown as solid circles.
Figure 3: Boxplot of relation between Selective Motor
Control scale (SMC) score and modified Ashworth scale
(MAS) index of the more involved leg (n=95); z=31, df=4,
p<0.001. Box shows 25th to 75th centiles; whisker bars are
10th to 90th centiles; outliers are shown as solid circles.
0–1 >1–2 >2–3 >3
MAS index
10
8
6
4
2
0
RO
M in
dex
0 1 2 3 4
SMC score
5
4
3
2
1
0
MA
S in
dex

skills (GMFM-66 scores) and everyday activities (PEDI scores)among the children studied (see Table I). The correlations ofmotor impairments with the GMFM-66 and the PEDI scoresare shown in Table V. Among the motor impairments, selec-tive motor control showed the strongest relationship togross motor function (r
s=0.68). The correlation of motor
impairments to mobility, self-care, and social function wassomewhat weaker than for gross motor function. Stepwiseregression analyses were performed to examine which of themotor impairments was the strongest predictor of grossmotor function and everyday activities. The regression modelfor gross motor function explained 51% of the total variance,whereas the model for social function explained only 18%.The SMC score was the strongest predictor explaining15% to42% of the variance, with the exception of mobility where theMAS index accounted for 34% of the total explained varianceof 41%. These results indicate that a large amount of the vari-ations could not be explained by motor impairments.
Several other factors also showed significant correlation withthe GMFM-66 and the PEDI scores (see Table V). Introducingthe variables topographical distribution, learning difficulties,epilepsy, age, and gestational age into the regression analyses,the regression models shown in Table VI explained 60–79% ofthe total variance. Topographical distribution of involvementwas the most predicting factor of gross motor function, mobil-ity, and self-care, with learning difficulties, SMC, and age assignificantly contributing factors. Learning difficulties werethe strongest predictor of social function with a significantcontribution from topographical distribution, age, and ges-tational age.
When introducing the GMFM-66 as an independent vari-able into the models for everyday activities, topographicaldistribution and selective motor control no longer added sig-nificantly to prediction of these activities. The GMFM-66 scoreemerged as a very strong predictor, accounting for 88% of thevariations in mobility, 76% in self-care, and 57% in social func-tion. Learning difficulties and age explained only a small addi-tional amount of the variance in self-care and social function.The normal plots for the residuals were almost linear in all theregression models, which support the validity of the analyses.
Discussion As CP is a multifacited disorder, and as there is conflicting evi-dence for how motor impairments relate to each other and tofunctional activities, this study was performed to describe rela-tionships within and between the two ICF classifications offunction: body functions, and activities and participation. Toexamine these relationships we applied measures that arecommonly used in children with CP. Results indicate a complexrelationship between spasticity, ROM, and selective motor con-trol. Multidimensional and multivariate analyses showed thatmotor impairments are just one component among many fac-tors that could predict gross motor function and achievementof tasks in mobility, self-care, and social function.
MOTOR IMPAIRMENTS
Most of the studies of spasticity and ROM have focused on mus-cles at single joints. Our findings emphasize the importanceof measuring these impairments in multiple muscles and acrossjoints. We documented spasticity in four lower-extremity mus-cle groups and 10 possible deviations in ROM. Transformationof single scores into summary measures showed that amount
of leg spasticity and number of deviations in ROM were relatedto type of CP and GMFCS levels. These findings indicate thatsummary measures like the MAS and the ROM index may berepresentative for determining the overall involvement ofthe legs and, therefore, may serve as valid measures in plan-ning of interventions and evaluation of change in combinationwith single joint measurements. Measuring the distribution ofspasticity in the hip, knee, and ankle region, we found differ-ent profiles for spastic hemiplegia, diplegia, and quadriplegia,confirming the clinical impression that the amount of spas-ticity and the proximal-to-distal involvement vary between thesegroups. These results suggest that grade of spasticity measuredin the hip, knee, and ankle region could be useful in classifica-tion of the topographic involvement in spastic CP. Distributionof spasticity also influences the decision to treat the childfocally or globally, and the specific intervention chosen.
In general, children with spasticity are at risk of developingincreased muscle stiffness and contractures (Tardieu andTardieu 1987, Delph 2003, Fridén and Lieber 2003). Deviationsin ROM were frequently observed in the studied group. Numberof deviations was moderately related to amount of leg spas-ticity. A moderate correlation was also seen between ROM andMAS scores for opposing muscles groups in the hip, knee, andankle. Potential explanations of the large variations in ROMwithin the groups with mild and moderate spasticity might berelated to the validity of the MAS. One can claim that this scaledoes not quantify spasticity exclusively. Rather it measures pas-sive resistance to motion caused by either a heightened, veloci-ty-dependent stretch-reflex response, or by ‘intrinsic stiffness’of the muscles (Pandyan et al. 1999, Damiano et al. 2002a,
Motor Impairments and Functional Activities in CP Sigrid Østensjø et al. 585
Figure 4: Boxplot of relation between Selective Motor
Control scale (SMC) score and range of motion (ROM)
index of the more involved leg (n=95); z=25, df=4, p<0.001.
Box shows 25th to 75th centiles; whisker bars are 10th to
90th centiles; outliers are shown as solid circles.
0 1 2 3 4
SMC score
10
8
6
4
2
0
RO
M in
dex

Sheean 2002). Sheean (2001) even considers that those bio-mechanical changes in muscle and soft-tissues could con-tribute more to hypertonia than stretch hyperreflexia. Varyingpatterns of type-1 and type-2 fibre hypertrophy and atrophy(Rose and McGill 1998), and increased collagen in the spasticmuscles of children with CP (Booth et al. 2001) indicate struc-tural changes in the muscle, supporting the hypothesis that
‘intrinsic stiffness’ of the muscle could play a role in the hyper-tonia assessed by the MAS. Careful assessment of what is ‘true’spasticity as opposed to muscle stiffness and changes in theconnective tissues should thus be essential for appropriateintervention to be applied. Damiano and coworkers (2002a)suggest that measurements evaluating resistance at severalspeeds such as the Modified Tardieu scale (Boyd and Graham
586 Developmental Medicine & Child Neurology 2004, 46: 580–589
Table VI: Multivariate models for prediction of GMFM-66 and PEDI scores (n=95)
Predictor Coefficient Standard error p 95% CI % explained variance
GMFM-66 (Adjusted R2 0.79)Topographical distribution –15.52 1.81 <0.001 –19.1, –11.9 63SMC 6.77 1.07 <0.001 4.6, 8.9 9Learning difficulties –10.65 2.41 <0.001 –15.4, –5.9 4Age 0.22 0.06 <0.001 0.1, 0.3 3
Mobility (Adjusted R2 0.75)Topographical distribution –16.53 2.01 <0.001 –20.5, –12.5 60Learning difficulties –12.84 2.68 <0.001 –18.2, –7.5 6Age 0.31 0.07 <0.001 0.2, 0.4 5SMC 4.95 1.19 <0.001 2.6, 7.3 4
Self-care (Adjusted R2 0.73)Topographical distribution –9.01 1.53 <0.001 –12.0, –6.0 51Learning difficulties –14.75 2.03 <0.001 –18.8, –10.7 13Age 0.24 0.06 <0.001 0.1, 0.3 6SMC 3.15 0.90 0.001 1.4, 4.9 3
Social function (Adjusted R2 0.60)Learning difficulties –14.69 2.27 <0.001 –19.2, –10.2 42Topographical distribution –6.48 1.53 <0.001 –9.5, –3.4 9Age 0.22 0.05 0.002 0.1, 0.3 7Gestational age –0.43 0.17 0.014 –0.7, –0.1 2
Seven explanatory variables (SMC, MAS-index, ROM-index of the more involved leg, topographical distribution, learning difficulties, age, andgestational age) were included in a forward stepwise regression; GMFM, Gross Motor Function Measure; SMC, Selective Motor Control scale;MAS, modified Ashworth scale; CI, confidence interval.
Table V: Correlation of motor impairments,a associated factors, and classifications with GMFM-66 andPEDI scores (n=95)
PEDI
GMFM-66 Mobility Self-care Social function
Motor impairmentsMAS index (r
s) 0.64b 0.61b 0.54b 0.44b
ROM index (r) 0.53b 0.46b 0.42b 0.30b
SMC scores (rs) 0.68b 0.58b 0.53b 0.41b
Associated factorsVisual problems (r
s) 0.30b 0.33b 0.28b 0.31b
Learning difficulties (rs) 0.57b 0.57b 0.66b 0.70b
Epilepsy (rs) 0.32b 0.27b 0.34b 0.36b
Gestational age (r) 0.15 0.09 0.20b 0.29b
Age (r) 0.10 0.19 0.20b 0.27b
Classifications Subtypes of CP(r
s) 0.76b 0.74b 0.70b 0.59b
Topographical distribution (rs) 0.80b 0.80b 0.72b 0.61b
GMFM-66 (r) – 0.94b 0.88b 0.76b
aMotor impairments of more involved leg. bSignificant correlation p<0.05. (r), Pearson’s correlation; (rs)
Spearman’s rank correlation. PEDI, Pediatric Evaluation of Disability Inventory; MAS, modified Ashworth scale;ROM, range of motion; SMC, Selective Motor Control scale; GMFM, Gross Motor Function Measure.

Motor Impairments and Functional Activities in CP Sigrid Østensjø et al. 587
1999) may be more useful for planning and evaluation of inter-ventions that aim to reduce leg spasticity. Fosang and col-leagues (2003) reported this scale to be more reliable thanthe MAS, particularly for the plantar flexors.
The relationship of spasticity to active function is lessclear-cut (Sahrmann and Norton 1977, Sheean 2001). TheSMC scale is a relatively new measure to assess selective dorsi-flexion and dexterity of the ankle (Boyd and Graham 1999).Results of the present study indicate an inverse relationshipbetween amount of leg spasticity and selective control of theankle. Children with the ability to activate the tibialis anteri-or for dorsiflexion showed a lower amount of spasticity thanchildren using mainly the toe extensors. However, such acorrelation does not imply a causal relationship; it mightsimply reflect a correlation between spasticity and the truecause of motor deficit (Sheean 2001). The moderate-to-fairrelationship between selective dorsiflexion and spasticity ofthe plantar flexors seen in our study support the assumptionthat impairment in voluntary movements may be related toother forms of focal muscle overactivity than spasticity, suchas cocontraction. Spinal mechanisms involved during activedorsiflexion were investigated by using the gastrocnemiussoleus H-reflex (Leonard et al. 1990). Reciprocal inhibitionwas impaired in children with CP during dorsiflexion, result-ing in a coactivation of the plantar flexors, opposing themovement. Another explanation for this cocontraction couldbe aberrant parallel corticospinal projections to both tibialisanterior and the gastrocnemius soleus muscles in childrenwith CP (Brouwer and Ashby 1991, Brouwer and Smits 1996).
However, the validity of measuring spasticity under sta-tionary conditions could be questioned as rapid stretching ofa spastic muscle in children with CP during active movementdoes not automatically result in a quick and excessive activa-tion (Nashner et al. 1983, Crenna and Inverno 1994). If aclinical measure of spasticity during active movement hadbeen available, the role of spasticity for functioning mighthave been clearer.
One underlying rationale for many treatments in CP is thatif the plantar flexors are prevented from being so overactive,it may be possible to recover some selective control and/orstrength that were previously not apparent (Gormley 2001,Sheean 2001). However, poor selective motor control maylimit the potential functional improvements of the treatmentof other impairments. For example, a child with severe spas-ticity and poor selective control may have limited improve-ment in active movements after antispastic management if thechild does not have an adequate amount of strength and coor-dination underlying their spasticity (Gormley 2001). Evidencesupports that strength, which is an essential component ofmotor control, is deficient in children with CP (Wiley andDamiano 1998, Engsberg et al. 2000, Damiano et al. 2001 and2002b, Elder et al. 2003). Thus, the complexity of relationsbetween muscle tone and selective control shows the need forcomprehensive assessment to reveal whether the child doesbenefit from the spasticity being present. Information aboutthe reliability of the SMC scale is needed before using thisscale as an outcome measure.
MOTOR IMPAIRMENTS IN RELATION TO GROSS MOTOR FUNCTION
AND EVERYDAY ACTIVITIES
There has been considerable controversy regarding the extentto which spasticity contributes to activity limitations in children
with CP (Sahrmann and Norton 1977, Damiano et al. 2002a).Also, little is known about the influence of diminished ROMand reduced selective motor control on performance of activi-ties. The present study showed that spasticity (MAS), ROM,and SMC were moderately related to gross motor function.Multivariate analyses revealed that selective motor controlwas the strongest predictor of these three impairments. Thisresult does not imply that information about muscle tone andROM is irrelevant, rather, they indicate that loss of selectivemotor control of the ankle interferes more with overall levelof motor function than spasticity and ROM deficits. Whenphysiotherapists working in pediatric rehabilitation were askedto list factors contributing to change in motor abilities of chil-dren with CP (Bartlett and Palisano 2002), they identified spas-ticity, topographical distribution, and ROM as the three mostimportant factors. Selective motor control was not listed as apossible contributing factor.
When topographical distribution, learning difficulties,age, and gestational age are included in the regression analy-ses, only selective motor control predicted GMFM-66 andPEDI scores. Topographical distribution and learning diffi-culties seemed better predictors of everyday activities than themeasured motor impairments. On the basis of the findings,we cannot assume that treatment of the underlying impair-ments will necessarily lead to accomplishment of new tasks indaily life. The evidence so far shows the limited effect oftreatment of lower-limb spasticity on functional activities(Butler and Campbell 2000, McLaughlin et al. 2002, Ade-Halland More 2003). The more composite measure of grossmotor function (GMFM-66) emerged as a very strong pre-dictor of functioning in mobility, self-care, and social func-tion. In a previous paper we reported the GMFCS to be anequally strong predictor of functioning in daily life (Østensjøet al. 2003).
Conclusions Although the measurements chosen for this study are widelyused in clinical practice, they may not be routinely performedto evaluate change in functioning as children with CP growand develop. This study supports the use of various classifica-tions and multidimensional assessment as an integral part ofclinical practice. The findings emphasize the importance ofmeasuring spasticity and ROM in several muscles and acrossjoints. The complicated relation between spasticity, ROM, andselective motor control supports careful assessment of whatis true spasticity as opposed to muscle stiffness and loss ofselective control. The SMC scale might be a measure that linksmotor impairments to gross motor function, a domain of func-tioning that was strongly related to accomplishment of essen-tial tasks in daily life. In conclusion, this study collected dataon the dimensions of impairments and activity limitations ofthe ICF. Further studies also need to include data on thedimension of environment to investigate the influence of theenvironmental factors on everyday functioning in youngchildren with CP.
DOI: 10.1017/S0012162204000994
Accepted for publication 16th February 2004.
Acknowledgements
We are grateful to all the children and the parents who participated.We acknowledge the contribution of the habilitation centres inAkershus, Buskerud, Oslo, Vestfold, and Østfold, and particularlythe physiotherapists Wenche Bjorbækmo, Bente Molin Kongsgård,Jorun Longva, Gro Thorbjørnsen, and Berit Weum, who performedthe motor assessments. A grant for this research was provided by theNorwegian Ministry of Education and Research Affairs.
References Ade-Hall RA, Moore AP. (2004) Botulinum toxin type A in the
treatment of lower limb spasticity in cerebral palsy (CochraneReview). In: The Cochrane Library Issue 1. Chichester, UK: JohnWiley & Sons.
Ashworth B. (1964) Preliminary trial of carsiprodal in multiplesclerosis. Practitioner 192: 540–542.
Bartlett DJ, Palisano RJ. (2002) Physical therapists’ perception offactors influencing the acquisition of motor abilities of childrenwith cerebral palsy: implications for clinical reasoning. Phys Ther
82: 237–249.Bjorbækmo W. (2002) Kartlegging: et spørsmål om perspektiv og
projeksjon [Assessment: a question of perspectives and projection].(Masters Thesis). University of Oslo: Faculty of Medicine. (InNorwegian)
Bohannon RW, Schmidt MB. (1987) Interrater reliability of a modifiedAshworth Scale of muscle spasticity. Phys Ther 67: 206–207.
Boone DC, Azen SP. (1979) Normal range of motion in malesubjects. J Bone Joint Surgery Am 61: 756–759.
Booth CM. Cortina-Borja MJ, Theologis TN. (2001) Collagenaccumulation in muscles of children with cerebral palsy and thecorrelation with severity of spasticity. Dev Med Child Neurol
43: 314–320.Boyd RN, Graham HK. (1999) Objective measures of clinical
findings in the use of botulinum toxin type A for the management of children with cerebral palsy. Eur J Neurol
6 (Suppl. 4): 523–535.Boyd RN, Hays RM. (2001) Current evidences for the use of
botulinum toxin type A in the management of children withcerebral palsy. Eur J Neurol 8 (Suppl. 5): 1–20.
Brogren E, Forssberg H, Hadders-Algra M. (2001) Influence of twositting positions on postural adjustments in children with spasticdiplegia. Dev Med Child Neurol 43: 534–546.
Brouwer B, Ashby P. (1991) Altered corticospinal projections to lower limb motoneurons in subjects with cerebral palsy. Brain
114: 1395–1407.Brouwer B, Smits E. (1996) Corticospinal input onto motor
neurons projecting to ankle muscles in individual with cerebralpalsy. Dev Med Child Neurol 38: 787–796.
Butler C, Campbell S. (2000) Evidence of the effects of intrathecalbaclofen for spastic and dystonic cerebral palsy. Dev Med Child
Neurol 42: 634–645.Chotza A, Holmgren V. (1999) Passivt rörelsesomfång i nedre
extremiteten hos friska barn i åldrarna tre til tolv år In: HedbergÅ, editor. Kvalitetssäkring i samband med CP kirurgi. FOU 99-06. Omsorgsversamheten i Stockhols landsting. (In Swedish)
Crenna P, Iverno M. (1994) Objective detection ofpathophysiological factors contributing to gait disturbances insupraspinal lesions. In: Ferdizzi E, Avanzini G, editors. Motor
Development in Children. John Libbey & Company. p 103–118. Damiano DL, Quinlivan JM, Owen BF, Payne P, Nelson KC, Abel MF.
(2002a) What does the Ashworth scale really measure and areinstrumented measures more valid and precise? Dev Med Child
Neurol 44:112–118.Damiano DL, Dodd K, Taylor NF. (2002b) Should we be testing and
training muscle strength in cerebral palsy? Dev Med Child Neurol
44: 68–72. Damiano DL, Quinlivan BF, Owen M, Shaffrey M, Abel F. (2001)
Spasticity versus strength in cerebral palsy: relationships amonginvoluntary resistance, voluntary torque, and motor function.Eur J Neurol 8 (Suppl. 5): 40–49.
Delp SL. (2003) What causes increased muscle stiffness in cerebralpalsy? Muscle Nerve 27: 131–132.
Eliasson AC, Gordon AM, Forssberg H. (1995) Tactile control ofisometric fingertip forces during grasping in children withcerebral palsy. Dev Med Child Neurol 37: 72–84.
Elder GC, Kirk J, Stewart G, Cook K, Weir D, Marshall A, Leahey L.(2003) Contributing factors to muscle weakness in children withcerebral palsy. Dev Med Child Neurol 45: 542–550.
Engsberg JR, Olree KS, Ross SA, Park TS. (2000) Ankle spasticity andstrength in children with spastic diplegic cerebral palsy. Dev Med
Child Neurol 42: 42–47.Farmer SE, James M. (2001) Contractures in orthopaedic and
neurological conditions: a review of causes and treatment.Disabil Rehabil 13: 549–558.
Feldman AB, Haley SM, Coryell J. (1990) Concurrent and constructvalidity of the Pediatric Evaluation of Disability Inventory. Phys
Ther 70: 602–610.Forssberg H. (1999) Neural control of human motor development.
Curr Opin Neurobiol 9: 676–682.Fosang AL, Galea MP, McCoy AT, Reddihough DS, Story I. (2003)
Measures of muscle and joint performance in the lower limb ofchildren with cerebral palsy. Dev Med Child Neurol 45: 664–670.
Fridén J, Lieber RL. (2003) Spastic muscle cells are shorter andstiffer than normal cells. Muscle Nerve 26: 157–164.
Gordon AM, Duff SV. (1999) Relation between clinical measures andfine manipulative control in children with hemiplegic cerebralpalsy. Dev Med Child Neurol 41: 586–591.
Graham HK, Selber P. (2003) Musculoskeletal aspect of cerebralpalsy. J Bone Joint Surg Br 85: 157–166.
Gormley ME. (2001) Treatment of neuromuscular and musculoskeletalproblems in cerebral palsy. Ped Rehabil 4: 5–16.
Hadders-Algra M, van der Fits IB, Stremmelaar EF, Touwen BC.(1999) Development of postural adjustments during reaching ininfants with CP. Dev Med Child Neurol 41: 766–776.
Hagberg B, Hagberg G. (1993) The origins of cerebral palsy. In:David TJ, editor. Recent Advances in Paediatrics XI. London:Churchill Livingstone. p 67–83.
Haley SM, Coster WJ, Faas RM. (1991) A content validity study of the Pediatric Evaluation of Disability Inventory. Ped Phys Ther
3: 177–84.Haley SM, Coster WJ, Ludlow LH, Haltiwanger JT, Andrellos PJ. (1992)
Pediatric Evaluation of Disability Inventory (PEDI). Development,
Standardization and Administration Manual. Boston: PEDIResearch Group, New England Medical Center Hospitals.
Harris SR, Smith LH, Krukowski L. (1985) Goniometric reliability fora child with spastic quadriplegia. J Ped Orthop 5: 348–351.
Hedberg Å, Brogren E, Ahl LE, Eek MN, Ohlmarks N, Swanberg K,Thews K. (1999) Rekommendationer för bedömning avgrovmotorisk funktion på barn med cerebral pares i sambandmed ortopedisk operation i nedre extremiteten. In: Hedberg E,editior. Kvalitetss kring i samband med CP-kirurgi. Stockholm:Omsorgsverksamhetens FoUU- enhet i Stockholms läns landsting.p 144–145. (In Swedish)
Jahnsen R, Berg M, Dolva AS, Høyem R. (2000) Pediatric
Evaluation of Disability Inventory (PEDI). Norsk tillegg til den
amerikanske manualen. Oslo: Norsk Psykologforening. (InNorwegian)
Kilgour G, McNair P, Stott SN. (2003) Intrarater reliability of lowerlimb sagittal range-of-motion measures in children with spasticcerebral palsy. Dev Med Child Neurol 45: 391–399.
Lance JW. (1980) Symposium synopsis. In: Feldmann RG, Young RR,Koella WP, editors. Spasticity and the Development of Motor
Control: Chicago: Yearbook Medical Publishers. p184–204.Leonard CT, Moritani T, Hirschfeld H, Forssberg H. (1990) Deficits
in reciprocal inhibition of children with cerebral palsy as revealedby H reflex testing. Dev Med Child Neurol 32: 974–984.
McDowell BC, Hewitt V, Nurse A, Weston T, Baker R. (2000) Thevariability of goniometric measurements in ambulatory childrenwith spastic cerebral palsy. Gait Posture 12: 114–121.
McLaughlin J, Bjornson K, Temkin N, Steinbok P, Wright V, Reiner A,Roberts T, Drake J, O’Donnell M, Rosenbaum P, Barber J, Ferrel A.(2002) Selective Dorsal Rhizotomy: meta-analysis of threerandomized controlled trials. Dev Med Child Neurol 44: 17–25.
Morris C. (2002) A review of the efficacy of lower limb orthoses usedfor cerebral palsy. Dev Med Child Neurol 44: 205–211.
588 Developmental Medicine & Child Neurology 2004, 46: 580–589

Motor Impairments and Functional Activities in CP Sigrid Østensjø et al. 589
Nashner LM, Shumway-Cook A, Marion O. (1983) Stance posturecontrol in selected groups of children with cerebral palsy: deficitsin sensory organization and muscular coordination. Ex Brain Res 49: 393–409.
Nichols DS, Case-Schmidt J. (1996) Reliability and validity of thePediatric Evaluation of Disability Inventory. Ped Phys Ther 8: 15–24.
Østensjø S, Carlberg EB, Vøllestad NK. (2003) Everyday functioningin young children with cerebral palsy. Dev Med Child Neurol
45: 603–612.Palisano R, Rosenbaum P, Walter S, Russell D, Wood E, Galuppi B.
(1997) Development and reliability of a system to classify grossmotor function in children with cerebral palsy. Dev Med Child
Neurol 39: 214–223.Palisano RJ, Hanna SE, Rosenbaum PL, Russell DJ, Walter SD,
Wood EP, Raina PS, Galuppi BE. (2000) Validation of a model ofgross motor function for children with cerebral palsy. Phys Ther
80: 974–985.Pandyan AD, Johnson GR, Price CIM, Curless RH, Barnes MP,
Roodgers H. (1999) A review of the properties and limitations ofthe Ashworth and the modified Ashworth Scales as measures ofspasticity. Clin Rehabil 13: 373–383.
Rose J, McGill KC. (1998) The motor unit in cerebral palsy. Dev Med
Child Neurol 40: 270–277.Russell DJ, Avery LM, Raina PS, Walter SD, Palisano RJ. (2000)
Improved scaling of the Gross Motor Function Measure forchildren with cerebral palsy: evidence of reliability and validity.Phys Ther 80: 873–885.
Russell DJ, Rosenbaum PJ, Avery LM, Lane M. (2002) Gross Motor
Function Measure (GMFM-66 & GMFM 88). User’s manual.
Including CD-ROM. London: Mac Keith Press.Sahrmann SA, Norton BJ. (1977) The relationship of voluntary
movement to spasticity in the upper motor neuron syndrome.Ann Neurol 2: 460–405.
Sheean GL. (2001) Botulinum treatment of spasticity: why is it sodifficult to show functional benefit? Curr Opin Neurol
14: 771–776.Sheean G. (2002) The pathophysiology of spasticity. Eur J Neurol
9 (Suppl 1): 3–9. Steinbok P. (2001) Outcomes after selective dorsal rhizotomy for
spastic cerebral palsy. Childs Nerv Syst 17: 1–18.Stuberg WA, Fuchs RH, Miedaner JA. (1988) Reliability of
goniometric measurements of children with cerebral palsy. Dev
Med Child Neurol 30: 657–666.Svenningsen S, Terjesen T, Auflem M, Berg V. (1989) Hip motion
related to age and sex. Acta Ortop Scand 60: 97–100.Tardieu C, Tardieu G. (1987) Muscle hypoextensibility in children
with cerebral palsy. Arch Phys Med Rehabil 7: 63–67.Valvano J, Newell KM. (1998) Practice of a precision isometric grip-
force task by children with spastic cerebral palsy. Dev Med Child
Neurol 40: 464–73.Wiley ME, Damiano DL. (1998) Lower extremity strength profiles in
spastic cerebral palsy. Dev Med Child Neurol 40: 100–107.Wood E, Rosenbaum P. (2000) The Gross Motor Function
Classification System for Cerebral Palsy: a study of reliability andstability over time. Dev Med Child Neurol 45: 292–296.
World Health Organization. (2001) International Classification of
Functioning, Disability and Health (ICF). Geneva: World HealthOrganization.
Ziv I, Blackburn N, Rang M, Koreska J. (1984) Muscle growth innormal and spastic mice. Dev Med Child Neurol 26: 94–99.
List of abbreviations
GMFCS Gross Motor Function Classification SystemGMFM Gross Motor Function MeasureICF The International Classification of Functioning,
Disability and HealthMAS Modified Ashworth scalePEDI Pediatric Evaluation of Disability Inventory ROM Range of motionSMC Selective Motor Control scale
Appendix I: Modified Ashworth scale (Hedberg et al. 1999)
Score Description
0 Hypotonic: less than normal tone, floppy 1 Normal: no increase in muscle tone2 Mild: slight increase in tone, ‘catch’ in limb movement or
minimal resistance to movement through less than half of the range
3 Moderate: more marked increase in tone through most of the range of motion but affected part is easily moved
4 Severe: considerable increase in tone, passive movement difficult
5 Extreme: affected part rigid in flexion and extension
Scale modified from those of Ashworth (1964), Bohannon andSchmidt (1987).
Appendix II: Selective Motor Control scale (dorsiflexion; Boydand Graham 1999)
Score Description
0 No movement when asked to dorsiflex the foot1 Limited dorsiflexion using mainly extensor hallucis longus
and/or extensor digitorum longus2 Dorsiflexion using extensor hallucis longus, extensor
digitorum longus, and some tibialis anterior activity3 Dorsiflexion achieved using mainly tibialis anterior, but
accompanied by hip and/or knee flexion4 Isolated selective dorsiflexion achieved through available
range, using a balance of tibialis anterior activity without hip and knee flexion
Challenging Mobility Disorders in Childhood:Cerebral Palsy and its Pretenders
Oswestry, England, 24–26 November 2004
The successful symposium in Oswestry in 2001 (NewMobility Strategies in Cerebral Palsy) has encouraged us toarrange another meeting on Cerebral Palsy in childhood.
Again, we have a three day format with international andnational experts as guest speakers. Although acomprehensive view of management options is to be animportant theme we also intend exploring pitfalls indiagnosis. This wider remit will allow us to be updated oninteresting topics like the channelopathies, the hereditarydystonias etc.
A new daily feature will be the presentation of achallenging clinical conundrum (“clinundrum”) where thepatient is undiagnosed or perhaps misdiagnosed and whereaudience participation will be encouraged.
More traditional orthopaedic and physiotherapy issueswill of course be well aired, with again an emphasis onexploring challenges to accepted clinical or surgical practice.
Fees: Non-Residential £400 Residential £615
CONTACT: Mrs Karen Edwards, Administration Manager,ORLAU, RJ&AH Hospital, Oswestry, Shropshire, SY10 7AG, UK. Tel. +44 1691 404531. Fax +44 1691 404058 Email: [email protected]
Copyright © 2022 FDOKUMEN