Motor function in Parkinson's disease and supranuclear palsy: simultaneous factor analysis of a...
13
BioMed Central Page 1 of 13 (page number not for citation purposes) BMC Medical Research Methodology Open Access Research article Motor function in Parkinson's disease and supranuclear palsy: simultaneous factor analysis of a clinical scale in several populations Pieter M Kroonenberg* 1 , Frans J Oort 2 , Glenn T Stebbins 3 , Sue E Leurgans 3 , Esther Cubo 3 and Christopher G Goetz 3 Address: 1 Department of Education and Child Study, Wassenaarseweg 52, Leiden University, Leiden, The Netherlands, 2 Department of Medical Psychology, Academic Medical Centre, University of Amsterdam, The Netherlands and 3 Department of Neurological Sciences, Rush-Presbyterian- St. Luke's Medical Center, Chicago, Illinois, USA Email: Pieter M Kroonenberg* - [email protected]; Frans J Oort - [email protected]; Glenn T Stebbins - [email protected]; Sue E Leurgans - [email protected]; Esther Cubo - [email protected]; Christopher G Goetz - [email protected] * Corresponding author Abstract Background: In order to better understand the similarities and differences in the motor behaviour of different groups of patients, their scores on the Motor Examination section of the Unified Parkinson's Disease Rating Scale (UPDRS) were analysed simultaneously. The three groups consisted, respectively, of patients with Parkinson's disease (PD) on medication, patients with Parkinson's disease withdrawn from anti-parkinsonian medication for at least 12 hours, and patients diagnosed with a specific Parkinsonism syndrome: Progressive Supranuclear Palsy (PSP). Methods: A total of 669 consecutively sampled patients from three separate hospital-based clinics participated (294 PD on medication; 200 PD off medication: 175 PSP). The Motor Examination section of the UPDRS was administered by neurologists at the three participating clinics. The patient scores on each item were recorded. To assess similarities and differences among the components of the UPDRS in these samples, we performed simultaneous or multigroup factor analysis on the covariance matrices of the three groups. In addition, it was investigated whether a single model for the Motor Examination section of the UPDRS could be developed which would be valid for all three groups at the same time. Results: A single six-dimensional factor solution was found that fitted all groups, although this was not straightforward due to differences between the tremor-at-rest variables. The factors were identified as Tremor-at-rest, Postural Tremor, Axial Dysfunctioning, Rigidity, Left Bradykinesia and Right Bradykinesia. The analysis also pointed to a somewhat lower lateralization in bradykinesia for PSP patients. The groups differed in intensity of motor impairment, especially with respect to Tremor-at-Rest, but the overall relationships between the variables were shared by the three groups. In addition, apart from the common factor structure evidence of differences in body part-specific and motor-specific variances was found. Conclusion: From a clinical point of view, the analyses showed that using the Motor Examination section of the UPDRS is also appropriate for patients with PSP, because the correlational structure of the items is directly comparable to that of Parkinson's patients. Methodologically, the analysis of all groups together showed that it is possible to evaluate similarities and differences between factor structures in great detail. Published: 13 June 2006 BMC Medical Research Methodology 2006, 6:26 doi:10.1186/1471-2288-6-26 Received: 09 November 2005 Accepted: 13 June 2006 This article is available from: http://www.biomedcentral.com/1471-2288/6/26 © 2006 Kroonenberg et al; licensee BioMed Central Ltd. This is an Open Access article distributed under the terms of the Creative Commons Attribution License (http://creativecommons.org/licenses/by/2.0 ), which permits unrestricted use, distribution, and reproduction in any medium, provided the original work is properly cited.
-
Upload
leidenuniv -
Category
Documents
-
view
1 -
download
0
Transcript of Motor function in Parkinson's disease and supranuclear palsy: simultaneous factor analysis of a...

BioMed Central
BMC Medical Research Methodology
ss
Open AcceResearch articleMotor function in Parkinson's disease and supranuclear palsy: simultaneous factor analysis of a clinical scale in several populationsPieter M Kroonenberg*1, Frans J Oort2, Glenn T Stebbins3, Sue E Leurgans3, Esther Cubo3 and Christopher G Goetz3Address: 1Department of Education and Child Study, Wassenaarseweg 52, Leiden University, Leiden, The Netherlands, 2Department of Medical Psychology, Academic Medical Centre, University of Amsterdam, The Netherlands and 3Department of Neurological Sciences, Rush-Presbyterian-St. Luke's Medical Center, Chicago, Illinois, USA
Email: Pieter M Kroonenberg* - [email protected]; Frans J Oort - [email protected]; Glenn T Stebbins - [email protected]; Sue E Leurgans - [email protected]; Esther Cubo - [email protected]; Christopher G Goetz - [email protected]
* Corresponding author
AbstractBackground: In order to better understand the similarities and differences in the motor behaviour ofdifferent groups of patients, their scores on the Motor Examination section of the Unified Parkinson'sDisease Rating Scale (UPDRS) were analysed simultaneously. The three groups consisted, respectively, ofpatients with Parkinson's disease (PD) on medication, patients with Parkinson's disease withdrawn fromanti-parkinsonian medication for at least 12 hours, and patients diagnosed with a specific Parkinsonismsyndrome: Progressive Supranuclear Palsy (PSP).
Methods: A total of 669 consecutively sampled patients from three separate hospital-based clinicsparticipated (294 PD on medication; 200 PD off medication: 175 PSP). The Motor Examination section ofthe UPDRS was administered by neurologists at the three participating clinics. The patient scores on eachitem were recorded. To assess similarities and differences among the components of the UPDRS in thesesamples, we performed simultaneous or multigroup factor analysis on the covariance matrices of the threegroups. In addition, it was investigated whether a single model for the Motor Examination section of theUPDRS could be developed which would be valid for all three groups at the same time.
Results: A single six-dimensional factor solution was found that fitted all groups, although this was notstraightforward due to differences between the tremor-at-rest variables. The factors were identified asTremor-at-rest, Postural Tremor, Axial Dysfunctioning, Rigidity, Left Bradykinesia and Right Bradykinesia.The analysis also pointed to a somewhat lower lateralization in bradykinesia for PSP patients. The groupsdiffered in intensity of motor impairment, especially with respect to Tremor-at-Rest, but the overallrelationships between the variables were shared by the three groups. In addition, apart from the commonfactor structure evidence of differences in body part-specific and motor-specific variances was found.
Conclusion: From a clinical point of view, the analyses showed that using the Motor Examination sectionof the UPDRS is also appropriate for patients with PSP, because the correlational structure of the itemsis directly comparable to that of Parkinson's patients. Methodologically, the analysis of all groups togethershowed that it is possible to evaluate similarities and differences between factor structures in great detail.
Published: 13 June 2006
BMC Medical Research Methodology 2006, 6:26 doi:10.1186/1471-2288-6-26
Received: 09 November 2005Accepted: 13 June 2006
This article is available from: http://www.biomedcentral.com/1471-2288/6/26
© 2006 Kroonenberg et al; licensee BioMed Central Ltd.This is an Open Access article distributed under the terms of the Creative Commons Attribution License (http://creativecommons.org/licenses/by/2.0), which permits unrestricted use, distribution, and reproduction in any medium, provided the original work is properly cited.
Page 1 of 13(page number not for citation purposes)
BMC Medical Research Methodology 2006, 6:26 http://www.biomedcentral.com/1471-2288/6/26
BackgroundParkinson's Disease (PD) is one of the most commonneuro-degenerative disorders, estimated to afflict approx-imately 1% of Americans over the age of 65 (Bennett,Beckett, Murray, Shannon, Goetz, Pilgrim, & Evans, 1996;Tanner, 1994) [1,2]. PD is associated with the loss ofdopamine-producing cells in the substantia nigra parscompacta, resulting in low levels of dopamine in the stria-tum. Lack of dopamine in the striatum provokes the pri-mary clinical manifestations of PD: tremor, rigidity,bradykinesia (the gradual loss of spontaneous movement;slowness of voluntary movements), and postural refleximpairment (Hornykiewicz, 1966; Bernheimer, Birk-mayer, & Hornykiewicz, 1973) [3,4].
Motor examination of the unified Parkinson's disease rating scaleThe Unified Parkinson's Disease Rating Scale (UPDRS) isa validated quantification of Parkinson's Disease signsand symptoms. (Fahn & Elton, 1987) [5], which assessessix primary areas of disability associated with PD. TheUPDRS is the most widely used measurement tool formotor impairment in PD. The Motor Examination sectionof the UPDRS is the primary focus of this paper, becauseit is only this section that provides a detailed assessmentof PD motor impairment based on physical examinationof the patient. The main motivation behind the presentstudy was to assess the ability of the scale to reliably meas-ure movement disorders across multiple types of diseases.In addition, the aim was to develop a model for motorbehaviour describing the structure of the items of theMotor Examination section which would be valid for allsamples. The basis for this exercise was that the scale'sdomain is motor function assessment, so it should pro-vide similar factor structures regardless of the specific ill-ness. The clinical import of a positive finding is increasedconfidence in the structure and assessment method.
Previous analysesOur earlier studies examined the component structure ofthe UPDRS Motor Examination section in three separatesamples. Two of the samples were composed of patientsfor whom PD was idiopathic, i.e. not related to or causedby other diseases. One of these samples, PD-On, wasexamined while patients were on medication (Stebbins &Goetz, 1998) [6] and the other sample, PD-Off, was exam-ined while the patients had been withdrawn from all anti-parkinsonian medications for at least 12 hours (Stebbins,Goetz, Lang, & Cubo, 1999) [7]. We also had at our dis-posal the motor scores of a sample of patients with a par-kinsonian syndrome different from idiopathic PD(progressive supranuclear palsy: PSP).
For each of the samples the component structures wereanalysed independently, with principal component anal-
yses followed by oblique rotations (Cubo, Stebbins,Golbe, Nieves, et al., 2000) [8]. Reasonably similar sets ofcomponents were observed in all three patient groups, butat the same time specific differences were present, whichwere difficult to evaluate comparatively. In particular, thecomponent structure of the PSP-group deviated fromthose of the PD groups. It consisted of five componentsbut there were problems in fitting the tremor-at-rest vari-ables; also bradykinesia did not seem as lateralised as inthe PD groups.
Detailed comparisons of independently derived compo-nents are fraught with difficulties, because there is nocommon standard with which to compare them. Oftenapproximations to such a common base are used byapplying the same rotation technique to the differentcomponent structures, but such procedures only work inthose cases where there is similarity in structures and theirexplained variances are high (see, for instance, Bennett,Shannon, Beckett, & Wilson, 1999 [9]). However, whendifferent numbers of components have been extracted,such techniques do not perform adequately. What is nec-essary is to analyse all samples simultaneously so that dif-ferences between the groups can be evaluated with respectto a single solution common to all groups.
Modelling approachIn the literature several component and factor analysismethods for modelling multiple samples at the same timeare available. In the research reported here, the emphasiswas on model building using (confirmatory) factor analy-sis models rather than on exploratory analysis using com-ponent models. Because of the knowledge available aboutthe motor section of the UPDRS, explicit model buildingusing factor analysis models was to be preferred here,because it allowed for the formulation and testing of spe-cific models as well as for specifications of detailed restric-tions on the parameters and the residuals. In Additionalfile 1 the differences between exploratory componentanalysis and confirmatory factor analysis are discussed inmore detail including the principles of imposing restric-tions for refined model building. Provided distributionalassumptions are not grossly violated, this model-buildingapproach can provide detailed insight into the similaritiesand differences between the three samples. Furthermore,models can be compared in a hierarchical fashion, i.e.,starting from a baseline model, all further models can bespecified as special cases defined by restrictions on theparameters of the baseline model. Such analyses are espe-cially powerful when considerable substantive informa-tion is available from the literature, so that selection andimprovement of models can be carried out based on suchknowledge in combination with statistical information.
Page 2 of 13(page number not for citation purposes)

BMC Medical Research Methodology 2006, 6:26 http://www.biomedcentral.com/1471-2288/6/26
In the present paper, we will show how simultaneous (ormultigroup) factor analysis (Jöreskog, 1971) [10] can beused to achieve the desired examination of the similaritiesand differences between the samples. Of particular inter-est is the extent to which parts of the simultaneous solu-tion can be restricted, and which parts have to beestimated separately. The search for an adequate and rea-sonably fitting model is described in some detail, so as toserve as an example for similar endeavours. A moredetailed example of this kind can be found in Byrne(2004) [11].
MethodsParticipantsThe UPDRS Motor Examination section items wereassessed for three different groups of patients. The threegroups consisted of 294 PD patients on medication (PD-On group), 200 PD patients withdrawn from all anti-par-kinsonian medications for at least 12 hours (PD-Offgroup), and 175 patients with Progressive SupranuclearPalsy (PSP-group). The UPDRS data for the series of PD-On patients were collected as part of routine clinical man-agement at a single movement-disorder clinic of a univer-sity medical centre. Data for the PD-Off group werecollected from patients being evaluated for participationin specific clinical trials at two movement-disorder clinicsconnected with university medical centres. Data for thePSP-group were collected from three university medicalcentre based movement disorders clinics (see Stebbinsand Goetz (1998) [6], Stebbins et al. (1999) [7], andCubo et al. (2000) [8] for specifics of the participatingsites). Each patient belonged to only one sample. All datafrom the Motor Examination section of the UPDRS weregathered by trained examiners who met published criteriafor inter-rater reliability (Goetz, Stebbins, Chmura, Fahn,Klawans, & Marsden, 1995) [12]. The study was approvedby the local Institutional Review Board at Rush UniversityMedical Center, Chicago. Patients were not explicitlyasked for their consent, due to the anonymous nature ofthe data.
MeasuresThe Motor Examination section of the UPDRS consists of27 items, each of which is scored from 0 (normal) to 4(severe). Note that the scale is defined in such a way that'normal' persons have zero values on all motor items, sothat any deviations from zero indicate impairment ofmotor functioning. The items are listed in abbreviatedform in Table 1, and detailed descriptions can be found inFahn & Elton (1987) [5], or on the web site of the MDVir-tual university [13]. Richards, Marder, Cote, and Mayeux(1994) [14] assessed the inter-rater reliability of the motorsection using three neurologists experienced in theadministration of the scale. Intraclass correlation coeffi-cients indicated good-to-excellent agreement for speeded
repeated movements, resting tremor, arising from a chair,and gait; moderate agreement for action tremor, rigidity,posture, postural stability, and bradykinesia; and pooragreement for speech disorder and facial immobility.Overall their results indicated that satisfactory inter-raterreliability was attainable with the UPDRS motor examina-tion. For the three groups examined in this study, themotor scale had reliabilities between 0.95 and 0.90 usingCronbach's alpha as a measure for internal consistency.Siderowf, McDermott, Kieburtz, Blindauer, Plumb, Shoul-son, & Parkinson Study Group (2002) [15] reported a test-retest reliability of 0.90 for the motor examination asmeasured with the intraclass-coefficient, in accordancewith earlier similar assessments.
Preliminary statistical analysesBefore an analysis of the structure was carried out, for eachgroup numerical characteristics of the distributions of theitems of the Motor section were inspected (means, stand-ard deviations, skewness coefficients, and kurtoses). Sepa-rate principal component analyses were carried out toinvestigate the structure per group (following the initialapproach taken by Stebbins and co-workers). Details onthese analyses can be found in Kroonenberg, Oort, Leur-gans, and Stebbins (2000) [16] and in the original studies.A preliminary joint model for the three groups was formu-lated on the basis of results for the separate componentanalysis. Clinical knowledge about the origins and mani-festation of Parkinson's disease assisted in deciding whichtypes of behaviours should load on the same factor, espe-cially in those cases when the component results werecontradictory.
Simultaneous factor analysesBecause of the differences between Parkinson's and PSPpatients, first a model was sought for the two groups of PDpatients; only after that had been found was the PSPgroup was included in the model search for a joint model.The simultaneous factor analyses were carried out withthe structural equation modelling program LISREL8developed by Jöreskog and Sörbom (1996) [17] using themaximum likelihood (ML) estimation method. Addi-tional file 2 contains the LISREL script used to estimate theparameters of the model reported in this paper. Severalitems in the Motor Examination of the UPDRS were farfrom normal, with serious skewness and kurtosis (seeTable 1). Non-normality poses a problem when choosinga suitable estimation method. We could not use the gen-erally recommended weighted least squares estimationmethod (Bollen, 1989) [18] because our sample sizeswere far too small (around 200). Given violations of theassumption of multivariate normality, the resulting statis-tic need not have a chi-square distribution, and the stand-ard errors need not be correct. However, the estimates ofthe model parameters are probably not seriously biased
Page 3 of 13(page number not for citation purposes)

BMC Medical Research Methodology 2006, 6:26 http://www.biomedcentral.com/1471-2288/6/26
(Bollen, 1989) [18]. A possible alternative to maximumlikelihood estimation would have been to use quasi-max-imum likelihood estimation with polychoric correlationsas the next best alternative for weighted least squares(Satorra, 1992) [19]. However, there has not been muchpractical experience with the application of this methodin multigroup cases.
General model searchIn the present study, first a relatively unrestricted jointmodel was formulated for both PD-groups, primarily onthe basis of the oblique component solutions. Each itemwas restricted to load on a single factor. All factors wereallowed to be correlated. Furthermore, the residuals simi-
lar items whose estimated correlations did not fit ade-quately, were also allowed to be correlated.
The adequacy of the models was primarily assessed by theRoot Mean Squared Error of Approximation (RMSEA;Steiger & Lind, 1980, Browne & Cudeck, 1992) [20,21]. Inparticular, the RMSEA of the baseline model was taken asa starting point. Only those models whose RMSEA stayedwithin the confidence bounds of the RMSEA of the base-line model were taken into consideration. In other words,only those restrictions on the parameters of the baselinemodel were accepted which did not unduly decrease thefit to the data. This procedure is less restrictive than usingtests of chi-squared differences to decide whether differ-
Table 1: Summary statistics of the UPDRS motor items
PD-On PD-Off PSP
UPDRS Motor Items M SD Skew Kurt. M SD Skew Kurt. M SD Skew Kurt.
1 Speech 1.40 0.91 0.37 -.06 1.72 0.93 0.33 .03 2.45 1.00 0.07 -.922 Facial Expression 1.55 0.89 0.44 .11 2.15 0.85 0.06 -.25 2.67 1.02 -0.33 -.58
3 Tremor-at-rest: H/N 0.48 0.73 1.42 1.45 0.36 0.76 2.24 4.71 0.02 0.24 11.69 142.734 RUE 0.81 0.93 0.75 -.52 1.01 1.19 0.80 -.58 0.10 0.42 4.56 22.085 RLE 0.55 0.76 1.15 .35 0.65 1.01 1.28 .44 0.03 0.21 6.86 51.536 LUE 0.69 0.87 0.91 -.38 0.94 1.19 1.08 .10 0.10 0.41 4.72 23.607 LLE 0.52 0.73 1.24 .74 0.65 1.10 1.60 1.52 0.03 0.25 10.47 118.788 Postural tremor R 0.66 0.68 0.87 1.33 0.93 0.87 0.69 .02 0.34 0.55 1.40 1.029 L 0.64 0.63 0.46 -.66 0.98 0.95 0.69 -.28 0.34 0.57 1.65 2.69
10 Rigidity H/N 1.24 0.80 0.19 .00 1.89 1.07 0.03 -.55 2.40 1.19 -0.22 -.9111 RUE 1.68 0.78 -0.24 .16 1.84 0.90 -0.21 .07 1.70 0.98 0.30 .1112 RLE 1.36 0.80 0.29 .29 1.58 1.06 0.01 -.74 1.34 1.01 0.35 -.6913 LUE 1.63 0.78 0.26 .54 1.96 0.91 -0.25 -.01 1.61 1.03 0.23 -.2414 LLE 1.39 0.82 0.44 .60 1.68 1.11 0.07 -.76 1.37 1.04 0.26 -.83
15 Finger taps R 1.58 0.78 0.34 .55 2.20 0.93 0.17 -.46 1.54 1.04 0.42 -.3716 L 1.59 0.82 0.69 1.05 2.38 1.01 -0.28 -.32 1.69 1.12 0.40 -.5917 Hand movements R 1.50 0.83 0.58 .57 1.72 0.94 0.48 -.04 1.59 0.98 0.61 -.0418 L 1.51 0.84 0.79 1.06 1.98 1.00 0.08 -.49 1.65 1.02 0.55 -.2219 Rapid Alternating.
Movements.R 1.45 0.82 0.35 .35 1.85 0.97 0.20 -.29 1.66 1.06 0.43 -.31
20 L 1.50 0.80 0.71 1.14 2.21 1.04 -0.16 -.47 1.76 1.15 0.53 -.5021 Leg agility R 1.44 0.83 0.73 .91 2.05 1.03 0.02 -.64 1.57 1.13 0.42 -.4722 L 1.50 0.85 0.81 1.03 2.25 1.03 -0.17 -.55 1.72 1.18 0.37 -.59
23 Arise from chair 1.23 1.05 1.07 .88 1.70 1.45 0.33 -1.28 2.40 1.24 -0.11 -1.2024 Posture 1.35 0.86 0.67 .66 1.75 1.10 0.26 -.56 1.47 1.14 0.31 -.6125 Gait 1.28 0.91 0.66 .29 2.12 1.13 0.02 -.71 2.60 1.14 -0.42 -.6326 Postural stability 0.89 1.01 1.17 .96 1.95 1.23 0.09 -.97 2.67 1.12 -0.28 -.9227 Body bradykinesia 1.45 0.97 0.73 .14 2.46 1.05 -0.15 -.69 2.39 0.98 -0.26 -.92
Motor Total 32.9 14.8 0.38 44.9 15.0 0.75 39.2 13.9 0.64
Skew = Skewness; Kurt. = Kurtosis;Striking values are in italics. Standard error skewness approx. 0.15; kurtosis approx 0.32 The items are numbered according to the standard way they appear in the Motor Scale of the UPDRS. R = Right-hand side; L = left-hand side; UE = Upper Extremity; LE = Lower Extremity; H/N = Head and Neck
Page 4 of 13(page number not for citation purposes)
BMC Medical Research Methodology 2006, 6:26 http://www.biomedcentral.com/1471-2288/6/26
ences in fit are significant. The main reason for theapproach is that we were trying to build an adequatemodel, rather than testing a number of a priori hypothe-sized ones. Due to the lack of multivariate normality, itwas difficult to use the chi-square distribution to interpretthe (non-central) chi-square statistic, and although theRMSEA depends on the normality assumption as well, itis still possible to use the statistic to compare the fit of dif-ferent models to the same data. Simulation studies (Cur-ran, West, & Finch, 1996) [22] suggested that under non-normality the RMSEA will turn out too high rather thantoo low. In other words, in these circumstances it tends tobe too conservative a measure. Three other fit measureswere used as a check on the procedure, in particular theComparative Fit Index (CFI) and the Tucker-Lewis Index(TLI), and the standardised root mean squared residual,St.RMR (see Hu & Bentler, 1999 [23], for detailed descrip-tions, references, and information on cut-off values).
Model search across samplesTo examine similarities and differences between the sam-ples, restrictions were placed on the baseline model. Inparticular, equality constraints were placed on classes ofparameters in the following order: factor loadings, factorcorrelations, factor variances, and correlations of residu-als. By increasing the number of restrictions in an orderedfashion, a set of nested or hierarchical models was definedwhich could be compared with respect to their fit.
The detailed results of the multigroup factor analysis arereported in its common metric completely standardisedsolution (for details and considerations with respect tostandardising multigroup solutions see Jöreskog & Sör-bom, 1996, p. 290 ff [17]). The major characteristic of thecommon metric standardisation is that the weighted aver-age of the within-group factor covariances is a correlationmatrix, unlike the individual factor covariance matrices.This has the advantage that the invariant loading matricesremain invariant in standardised solution. By using thecompletely standardised solution, the original variablesare also standardised to a common metric across groups,which facilitates the comparison of the factor variancesand covariances (Jöreskog & Sörbom, 1996, p. 293) [17].
ResultsAll three groups showed a substantial burden of motordisability (see Table 1). The mean motor scores were 32.9(an average of 1.2 points per item) for the PD-On group,44.9 for PD-Off (an average of 1.7 points per item) and39.2 for the PSP group (an average of 1.5 points per item).Note that, depending on the state of the disease, patientsmay show high scores on some but not on all items. Thegroups all showed substantial differences between indi-viduals: the SD of the total score was around 15 for eachgroup. The distribution of the total motor scores was not
skewed for the PD-Off group, but the distributions of theother two groups were mildly positively skewed with amoderate kurtosis. For most items, the PSP-group had thehighest skewness, the PD-On groups the lowest, and thePD-off group was intermediate. The five tremor-at-restitems and head/neck tremor did not follow this pattern.Each of the five tremor-at-rest scores had a mean of 0.1 orless in the PSP-group. The SDs for these five items werebetween 0.21 and 0.42, and skewness and kurtosis coeffi-cients were high. These observations reflected the fact thatonly 17 of the 175 (10%) PSP patients exhibited any resttremor. The item-specific SDs were close to 1 for mostother items. The elimination of the 17 PSP patients hadno great influence on the characteristics of the distribu-tions of the items or total scores, except for the tremor-at-rest and head/neck tremor items. In order to establishwhether the high kurtosis for the tremor-at-rest itemsunfavourably affected the solution, the final model wasalso examined without these items and the associatedtremor-at-rest factor. However, it turned out that the othervalues and their standard errors were virtually unaffected,so that we concluded that the high kurtosis had no seriousinfluence on the nature of the solution.
Simultaneous analysis of the PD-On group and PD-Off groupAs indicated above, first a common model was sought forthe two PD-groups on the grounds that the principal com-ponent analyses indicated that there were serious differ-ences between the PD groups and the PSP group. A seriesof five models was tested; their descriptions and fit statis-tics are given in Table 2.
Baseline modelInitially a model was devised without any correlationsbetween the residuals, i.e. all observed covariances wereassumed to be determined by the six factors and their fac-tor correlations. However, due to a very strong correlationbetween Facial Expression and Speech, no convergingmodel could be found. The only solution was to allow thecovariance between the residual factors of these two vari-ables to be estimated as well. Therefore, our baseline modelwas PD1 (see Table 2), which had a chi-square of 1318with 592 df and an RMSEA of 0.071 with a confidenceinterval of 0.065–0.077; it also had acceptable values forCFI (0.93), TLI (0.92) and a marginally acceptable valuefor St.RMR (0.08). In this model, the structure of the solu-tion was same for the two groups, but the loadings of eachgroup were unrelated (configural invariance). In order totest whether not only the structure of the model was thesame for the two groups but also the values of theirparameters, increasingly strict equality constraints wereimposed on the parameters across groups. A restricted ver-sion of the baseline model was accepted, if its RMSEAstayed within the confidence bounds of the RMSEA of the
Page 5 of 13(page number not for citation purposes)

BMC Medical Research Methodology 2006, 6:26 http://www.biomedcentral.com/1471-2288/6/26
baseline model. In addition, the GFI, TLI, and the St.RMRwere examined in order to evaluate the restricted modelwith respect to the baseline model.
Restricting the baseline modelWith Model PD2 an attempt was made to investigatewhether a complete equality of all factor loadings on allfactors for both groups simultaneously would lead to anacceptable model. Such a model implies an equal weight-ing of all items in a factor. This restriction gave a gain of42 df. The PD2 model had a chi-square of 1578 with 634df and an RMSEA of 0.078, which was outside the confi-dence interval of the baseline model. Moreover, both theCFI (0.91) and the TLI (0.90) dropped more than wasdesirable. As these restrictions turned out to be too severecomplete equality was dropped in favour of the require-ment of equality of the loadings for both groups. Thisresulted in a model with a chi-square of 1377 with 613 dfor a smaller gain of degrees-of-freedom (21 df), and aRMSEA of 0.071 (equal to the baseline model) withacceptable values for CFI (0.93), TLI (0.92), and St.RMR(0.07). In other words, this simplified model fitted as wellas the baseline model itself, leaving room for furtherrestrictions. The next logical step was to impose equalityof factor covariances for both groups, i.e. metric invari-ance (Model PD4), which provided an acceptable modelwith a chi-square of 1450 and 634 df or a gain of 20 df, anRMSEA of 0.072, a CFI of 0.92, a TLI of 0.92 and a some-what too large St.RMR. Including further restrictions suchas equal residual variances and covariances led to unac-ceptable model fit (Model PD5: chi-square = 2497, df =674; RMSEA = 0.100, CFI = .83, TLI = .82, St.RMR = 0.13).
Thus, Model PD4 was the simplest acceptable model. Ithad equal loadings for both groups (both the same pat-tern of factor loadings and equal values for all of them),and also the covariances between the factors are the same.It cannot be further simplified in a systematic andstraightforward manner without significant deteriorationin fit. It is always possible to include additional parame-
ters on purely empirical grounds but without theory, thisseems ill-advised. The only concession to this principlewas made for the correlated residual between Facialexpression and Speech, because without this correlationan adequate model could not be found at all. In ModelPD4 the specific variances of all items were systematicallylarger in the PD-Off-group than the PD-On-group, sug-gesting that taking patients off medicine enlarges the spe-cific variability. This can be interpreted to mean that thedifferences between the patients increase when they aretaken off drugs, but that the relationships between the var-iables were not affected.
ConclusionThe equality of factor loadings and their covariances wassatisfactory because apparently medication has no seriousinfluence on the structure or relationships between theitems of the questionnaire, but only on their means. Thusmedication did not change the observed pattern in motorfunctioning for patients with Parkinson's disease, but onlyrestricted its manifestations.
Model development: PD groups and PSP-groupThe model for the Parkinson's disease groups was taken asthe starting point for finding an appropriate model for allthree groups together, but this proved to be not feasible.In hindsight this was not surprising, considering theTremor-at-rest variables. The next candidate was the PD1Model, which had the same pattern of loadings for allthree groups without the requirement of equality for theirvalues (Model PP1, Table 3). Unfortunately, this modelwas not identified empirically and did not converge, againbecause of the very small of variability for Tremor-at-restvariables for the PSP-group. This precluded finding properestimates for them for the PSP-group. By specifying thatthe factor loadings should be equal across groups, modelPP2 did converge with a chi-square of 1949 and 930 df, anadequate RMSEA = 0.070 with a 95% confidence intervalof 0.065–0.075, a satisfactory CFI = 0.97 and TLI = 0.97,and a largish St.RMR = 0.09. This model served as our
Table 2: Model selection: Parkinson disease only: PD-On-Group and PD-Off- Group
Model Description χ2 df RMSEA TLI CFI St.RMR Comments
PD1 Six factors based on component solutions -no constraints across groups; correlated residuals Facial and Speech
1318 592 0.071 .92 .93 0.08 BASELINE MODEL with 95% confidence interval of RMSEA: 0.065 – 0.077
PD2 As PD1: Within a factor all loadings equal 1578 634 0.078 .90 .91 0.10 Outside interval. PD2; too simplePD3 As PD1: Loadings PD-On = Loadings PD-Off 1377 613 0.071 .92 .93 0.07 Simpler model than PD2PD4 As PD3: Also equal factor covariance
matrices1450 634 0.072 .92 .92 0.09 Preferred model: Very simple;
easy interpretation;PD5 As PD4: Also residual variances and residual
covariances equal across groups2497 674 0.100 .82 .83 0.13 Rejected: Oversimplification
Note: RMSEA = Root mean square residual, CFI = comparative fit index, TLI = Tucker-Lewis Index, St.RMR = standardised root mean residual correlation.
Page 6 of 13(page number not for citation purposes)
BMC Medical Research Methodology 2006, 6:26 http://www.biomedcentral.com/1471-2288/6/26
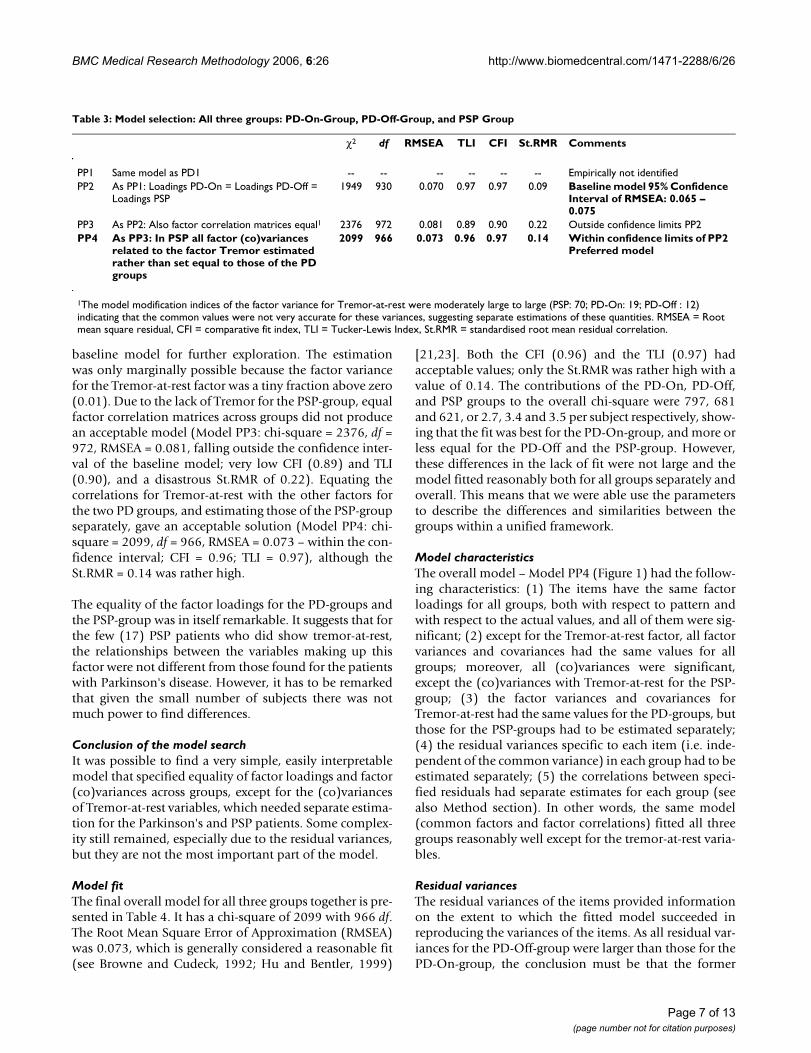
baseline model for further exploration. The estimationwas only marginally possible because the factor variancefor the Tremor-at-rest factor was a tiny fraction above zero(0.01). Due to the lack of Tremor for the PSP-group, equalfactor correlation matrices across groups did not producean acceptable model (Model PP3: chi-square = 2376, df =972, RMSEA = 0.081, falling outside the confidence inter-val of the baseline model; very low CFI (0.89) and TLI(0.90), and a disastrous St.RMR of 0.22). Equating thecorrelations for Tremor-at-rest with the other factors forthe two PD groups, and estimating those of the PSP-groupseparately, gave an acceptable solution (Model PP4: chi-square = 2099, df = 966, RMSEA = 0.073 – within the con-fidence interval; CFI = 0.96; TLI = 0.97), although theSt.RMR = 0.14 was rather high.
The equality of the factor loadings for the PD-groups andthe PSP-group was in itself remarkable. It suggests that forthe few (17) PSP patients who did show tremor-at-rest,the relationships between the variables making up thisfactor were not different from those found for the patientswith Parkinson's disease. However, it has to be remarkedthat given the small number of subjects there was notmuch power to find differences.
Conclusion of the model searchIt was possible to find a very simple, easily interpretablemodel that specified equality of factor loadings and factor(co)variances across groups, except for the (co)variancesof Tremor-at-rest variables, which needed separate estima-tion for the Parkinson's and PSP patients. Some complex-ity still remained, especially due to the residual variances,but they are not the most important part of the model.
Model fitThe final overall model for all three groups together is pre-sented in Table 4. It has a chi-square of 2099 with 966 df.The Root Mean Square Error of Approximation (RMSEA)was 0.073, which is generally considered a reasonable fit(see Browne and Cudeck, 1992; Hu and Bentler, 1999)
[21,23]. Both the CFI (0.96) and the TLI (0.97) hadacceptable values; only the St.RMR was rather high with avalue of 0.14. The contributions of the PD-On, PD-Off,and PSP groups to the overall chi-square were 797, 681and 621, or 2.7, 3.4 and 3.5 per subject respectively, show-ing that the fit was best for the PD-On-group, and more orless equal for the PD-Off and the PSP-group. However,these differences in the lack of fit were not large and themodel fitted reasonably both for all groups separately andoverall. This means that we were able use the parametersto describe the differences and similarities between thegroups within a unified framework.
Model characteristicsThe overall model – Model PP4 (Figure 1) had the follow-ing characteristics: (1) The items have the same factorloadings for all groups, both with respect to pattern andwith respect to the actual values, and all of them were sig-nificant; (2) except for the Tremor-at-rest factor, all factorvariances and covariances had the same values for allgroups; moreover, all (co)variances were significant,except the (co)variances with Tremor-at-rest for the PSP-group; (3) the factor variances and covariances forTremor-at-rest had the same values for the PD-groups, butthose for the PSP-groups had to be estimated separately;(4) the residual variances specific to each item (i.e. inde-pendent of the common variance) in each group had to beestimated separately; (5) the correlations between speci-fied residuals had separate estimates for each group (seealso Method section). In other words, the same model(common factors and factor correlations) fitted all threegroups reasonably well except for the tremor-at-rest varia-bles.
Residual variancesThe residual variances of the items provided informationon the extent to which the fitted model succeeded inreproducing the variances of the items. As all residual var-iances for the PD-Off-group were larger than those for thePD-On-group, the conclusion must be that the former
Table 3: Model selection: All three groups: PD-On-Group, PD-Off-Group, and PSP Group
χ2 df RMSEA TLI CFI St.RMR Comments
PP1 Same model as PD1 -- -- -- -- -- -- Empirically not identifiedPP2 As PP1: Loadings PD-On = Loadings PD-Off =
Loadings PSP1949 930 0.070 0.97 0.97 0.09 Baseline model 95% Confidence
Interval of RMSEA: 0.065 – 0.075
PP3 As PP2: Also factor correlation matrices equal1 2376 972 0.081 0.89 0.90 0.22 Outside confidence limits PP2PP4 As PP3: In PSP all factor (co)variances
related to the factor Tremor estimated rather than set equal to those of the PD groups
2099 966 0.073 0.96 0.97 0.14 Within confidence limits of PP2 Preferred model
1The model modification indices of the factor variance for Tremor-at-rest were moderately large to large (PSP: 70; PD-On: 19; PD-Off : 12) indicating that the common values were not very accurate for these variances, suggesting separate estimations of these quantities. RMSEA = Root mean square residual, CFI = comparative fit index, TLI = Tucker-Lewis Index, St.RMR = standardised root mean residual correlation.
Page 7 of 13(page number not for citation purposes)

BMC Medical Research Methodology 2006, 6:26 http://www.biomedcentral.com/1471-2288/6/26
group had much more unexplained variance, which isconsistent with the idea that different patients react in dif-ferent ways when off medication. The residual variancesfor the PSP-group, except for Tremor-at-rest, were gener-ally closer to the PD-Off-group than to those of the PD-On-group (Table 4) suggesting that the behaviour of PSP-patients is rather more variable in a non-systematic way.For the PSP-group large residual variances for Posture andfor Head & Neck Rigidity indicated that much variabilityin these variables could not be captured by the commonfactors.
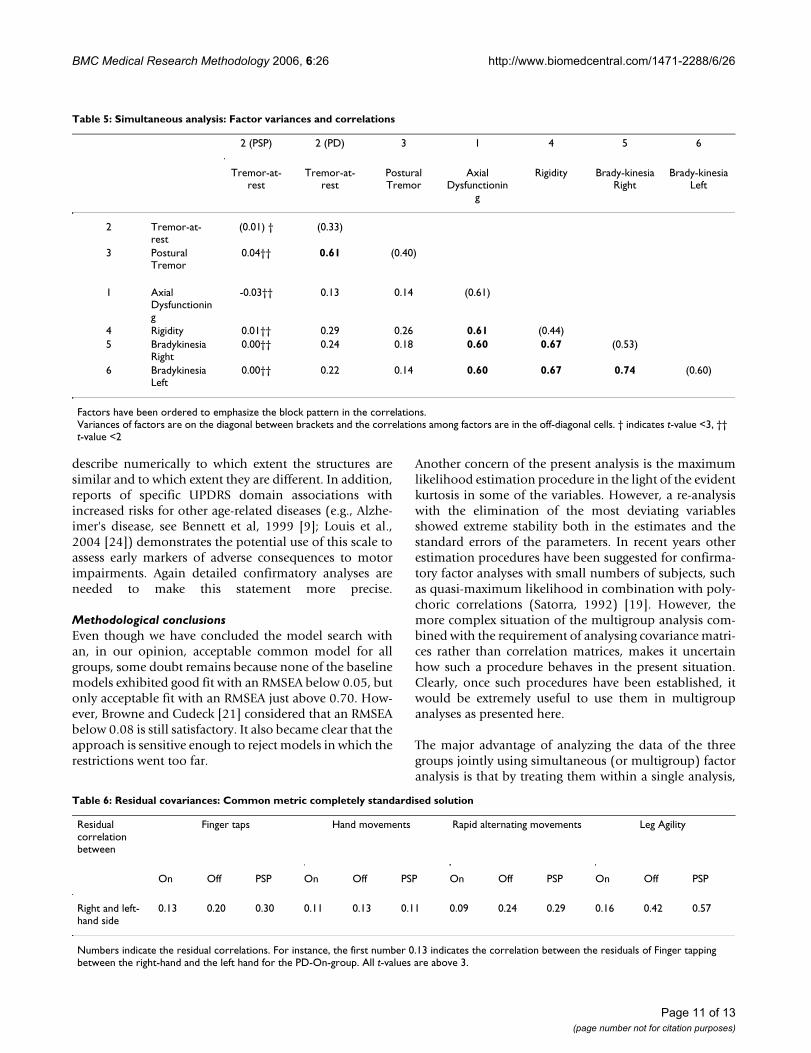
Factor correlationsThe factor correlation matrix (Table 5) has a simple inter-pretation. Six correlations above 0.5 belonged to a blockof four Non-Tremor factors: Axial Dysfunctioning, Rigidityand Left & Right Bradykinesia. The two remaining factorswere the two Tremor factors: Tremor-at-rest and PosturalTremor. In both of the PD groups, the Tremor factors werehighly correlated (0.52), but not surprisingly, given thefact that the correlations were based on very few patients,the correlation of the Tremor factors in the PSP-group waslow (0.13). The highest cross-correlation between theTremor and Non-Tremor factors was also low (0.26), indi-cating that the motor section of the UPDRS primarily con-sists of two reasonably independent parts, tremor andbradykinesia.
Residual covariancesResidual covariances measure what two variables have incommon that is not captured by the common factors(Table 6). The covariances between left and right leg agil-ity (0.16 for PD-On, 0.42 for PD-Off, and 0.57 for PSP)indicated that there was less lateralisation in leg-agilitythan was suggested by the two left and right bradykinesiafactors, which themselves were correlated (0.74). This wasespecially true for the PSP-group (0.57).
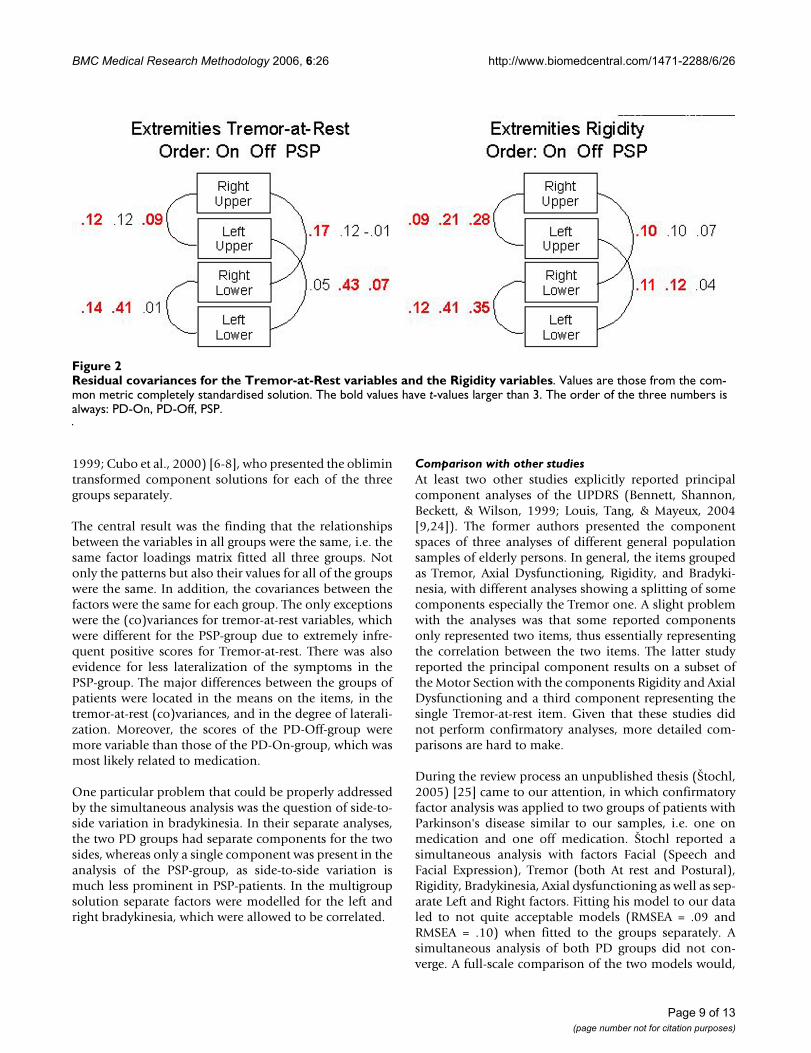
Except for Tremor-at-rest and hand movements, the resid-ual covariances between the same left and right activitiesfor the PSP-group were generally higher than in the othertwo groups, indicating less lateralization of the disease inthat group compared to the Parkinson's groups (Figure 2).Note that this was particularly true for leg agility. In addi-tion, the residual covariances were somewhat higher forthe PD-Off-group than for the PD-On-group, probablyindicating that the drugs also increased some of the later-alization of the disease in Parkinson's patients. Finally, asmentioned earlier, speech and facial expression weremore strongly correlated than could be captured by thesingle Axial Dysfunctioning factor, and the residual corre-lations for the PD-On, PD-Off and PSO groups were moreor less equal (0.28, 0.23, and 0.29, respectively).
DiscussionIn this paper, three different groups of patients, patientswith Parkinson's disease on medication (PD-On),patients with Parkinson's disease withdrawn from anti-parkinsonian medication for at least 12 hours (PD-Off),and patients diagnosed with a specific Parkinsonism syn-drome: Progressive Supranuclear Palsy (PSP), were evalu-ated by means of the Motor Examination section of theUnified Parkinson's Disease Rating Scale – UPDRS (Fahn& Elton, 1987) [5]. The factor structure of this scale wasexamined with simultaneous factor analysis for severalgroups. This approach extended the work of Stebbins andco-workers (Stebbins and Goetz, 1998; Stebbins, et al.,
Complete factor model for the simultaneous modelfor all three groupsFigure 1Complete factor model for the simultaneous model-for all three groups. The values are those from the com-mon metric completely standardised solution. Factor loadings and factor correlations are common to all groups except the factor correlations of the Tremor-at-Rest factor, which are those of the Parkinson's disease groups. The resid-ual variances and covariances are group-specific and the ones shown are those of the PD-On group.
Page 8 of 13(page number not for citation purposes)
BMC Medical Research Methodology 2006, 6:26 http://www.biomedcentral.com/1471-2288/6/26
1999; Cubo et al., 2000) [6-8], who presented the oblimintransformed component solutions for each of the threegroups separately.
The central result was the finding that the relationshipsbetween the variables in all groups were the same, i.e. thesame factor loadings matrix fitted all three groups. Notonly the patterns but also their values for all of the groupswere the same. In addition, the covariances between thefactors were the same for each group. The only exceptionswere the (co)variances for tremor-at-rest variables, whichwere different for the PSP-group due to extremely infre-quent positive scores for Tremor-at-rest. There was alsoevidence for less lateralization of the symptoms in thePSP-group. The major differences between the groups ofpatients were located in the means on the items, in thetremor-at-rest (co)variances, and in the degree of laterali-zation. Moreover, the scores of the PD-Off-group weremore variable than those of the PD-On-group, which wasmost likely related to medication.
One particular problem that could be properly addressedby the simultaneous analysis was the question of side-to-side variation in bradykinesia. In their separate analyses,the two PD groups had separate components for the twosides, whereas only a single component was present in theanalysis of the PSP-group, as side-to-side variation ismuch less prominent in PSP-patients. In the multigroupsolution separate factors were modelled for the left andright bradykinesia, which were allowed to be correlated.
Comparison with other studiesAt least two other studies explicitly reported principalcomponent analyses of the UPDRS (Bennett, Shannon,Beckett, & Wilson, 1999; Louis, Tang, & Mayeux, 2004[9,24]). The former authors presented the componentspaces of three analyses of different general populationsamples of elderly persons. In general, the items groupedas Tremor, Axial Dysfunctioning, Rigidity, and Bradyki-nesia, with different analyses showing a splitting of somecomponents especially the Tremor one. A slight problemwith the analyses was that some reported componentsonly represented two items, thus essentially representingthe correlation between the two items. The latter studyreported the principal component results on a subset ofthe Motor Section with the components Rigidity and AxialDysfunctioning and a third component representing thesingle Tremor-at-rest item. Given that these studies didnot perform confirmatory analyses, more detailed com-parisons are hard to make.
During the review process an unpublished thesis (Štochl,2005) [25] came to our attention, in which confirmatoryfactor analysis was applied to two groups of patients withParkinson's disease similar to our samples, i.e. one onmedication and one off medication. Štochl reported asimultaneous analysis with factors Facial (Speech andFacial Expression), Tremor (both At rest and Postural),Rigidity, Bradykinesia, Axial dysfunctioning as well as sep-arate Left and Right factors. Fitting his model to our dataled to not quite acceptable models (RMSEA = .09 andRMSEA = .10) when fitted to the groups separately. Asimultaneous analysis of both PD groups did not con-verge. A full-scale comparison of the two models would,
Residual covariances for the Tremor-at-Rest variables and the Rigidity variablesFigure 2Residual covariances for the Tremor-at-Rest variables and the Rigidity variables. Values are those from the com-mon metric completely standardised solution. The bold values have t-values larger than 3. The order of the three numbers is always: PD-On, PD-Off, PSP.
Page 9 of 13(page number not for citation purposes)

BMC Medical Research Methodology 2006, 6:26 http://www.biomedcentral.com/1471-2288/6/26
however, take us outside the scope of the present paper.The availability of the Czech data might enable cross-nation comparisons, provided it can be established thatscoring practice across countries are the same.
ConclusionSubstantive conclusionsThe results indicated a stable factor structure for theUPDRS Motor Examination Section. Across the three sam-ples, consistent domains of motor function assessmentwere obtained while maintaining clinical differentiationsbetween the groups. Thus the PSP results indicated raretremor-at-rest and decreased laterality of most motorsigns. Both of these findings are consistent with the clini-cal manifestations of PSP. The general separation of
tremor-related features from non-tremor related featuressupports the differentiation of two cardinal signs of allmovement disorders: tremor and bradykinesia.
Our findings of a stable factor structure and consistent fac-tor loadings across medicated and non-medicated PDpatients as well as patients with PSP, indicate that theUPDRS Motor Examination Section provides a validassessment of motor function independent of specific dis-ease status. The similarity of the UPDRS factor structuresin a large sample of older persons without movement dis-orders (Bennett et al, 1999) implies a clinical utility forthe scale beyond its original intent of assessing motorfunction in patients with Parkinson's disease. However, afurther detailed confirmatory study is necessary to
Table 4: Simultaneous analysis: Final model (Common metric completely standardised solution)
1 2 3 4 5 6 Residual variances
Axial Dysfuncti
oning
Tremor-at-rest
Postural tremor
Rigidity Brady-kinesia Right
Brady-kinesia
Left
On Off PSP
3 Tremor-at-rest: H/N 0.78 0.39 0.63 0.134 R Upper 0.69 0.50 0.85 0.196 Extremities: L Upper 0.74 0.33 0.88 0.185 R Lower 0.70 0.37 1.09 0.067 L Lower 0.73 0.21 1.17 0.088 Postural tremor R 0.90 0.13 0.42 0.049 L 0.75 0.27 0.81 0.31
10 Rigidity Head/Neck
0.67 0.22 0.65 1.02
11 R Upper 0.68 0.40 0.62 0.6912 Extremities: L Upper 0.76 0.24 0.64 0.4913 R Lower 0.70 0.38 0.59 0.6614 L Lower 0.77 0.20 0.64 0.50
15 Finger taps R 0.81 0.21 0.44 0.4516 L 0.82 0.22 0.39 0.4717 Hand
movementsR 0.90 0.14 0.29 0.18
18 L 0.90 0.15 0.27 0.1819 Rapid alt. mov. R 0.82 0.18 0.49 0.4020 L 0.83 0.15 0.45 0.4021 Leg agility R 0.72 0.22 0.67 0.7122 L 0.68 0.31 0.64 0.79
23 Arise from chair 0.82 0.22 0.45 0.3424 Posture 0.72 0.20 0.42 1.0425 Gait 0.82 0.15 0.38 0.6026 Postural stability 0.77 0.28 0.49 0.4927 Body
bradykinesia0.79 0.34 0.40 0.45
1 Speech 0.60 0.50 0.69 0.802 Facial expression 0.60 0.53 056 0.92
The order of some items has been rearranged from their order in the UPDRS to show some patterns more clearly. R = Right-hand side; L = left-hand side; H/N = Head and Neck. All t-values for the loadings were greater than 12.9; for the residual variances they were typically around 8. The smallest t-values were for Right-hand side Postural Tremor (PD-On: 2.2; PD-Off: 4.2; PSP: 0.52); these three residual variances were the only ones with t-values below 4.5.
Page 10 of 13(page number not for citation purposes)
BMC Medical Research Methodology 2006, 6:26 http://www.biomedcentral.com/1471-2288/6/26
describe numerically to which extent the structures aresimilar and to which extent they are different. In addition,reports of specific UPDRS domain associations withincreased risks for other age-related diseases (e.g., Alzhe-imer's disease, see Bennett et al, 1999 [9]; Louis et al.,2004 [24]) demonstrates the potential use of this scale toassess early markers of adverse consequences to motorimpairments. Again detailed confirmatory analyses areneeded to make this statement more precise.
Methodological conclusionsEven though we have concluded the model search withan, in our opinion, acceptable common model for allgroups, some doubt remains because none of the baselinemodels exhibited good fit with an RMSEA below 0.05, butonly acceptable fit with an RMSEA just above 0.70. How-ever, Browne and Cudeck [21] considered that an RMSEAbelow 0.08 is still satisfactory. It also became clear that theapproach is sensitive enough to reject models in which therestrictions went too far.
Another concern of the present analysis is the maximumlikelihood estimation procedure in the light of the evidentkurtosis in some of the variables. However, a re-analysiswith the elimination of the most deviating variablesshowed extreme stability both in the estimates and thestandard errors of the parameters. In recent years otherestimation procedures have been suggested for confirma-tory factor analyses with small numbers of subjects, suchas quasi-maximum likelihood in combination with poly-choric correlations (Satorra, 1992) [19]. However, themore complex situation of the multigroup analysis com-bined with the requirement of analysing covariance matri-ces rather than correlation matrices, makes it uncertainhow such a procedure behaves in the present situation.Clearly, once such procedures have been established, itwould be extremely useful to use them in multigroupanalyses as presented here.
The major advantage of analyzing the data of the threegroups jointly using simultaneous (or multigroup) factoranalysis is that by treating them within a single analysis,
Table 6: Residual covariances: Common metric completely standardised solution
Residual correlation between
Finger taps Hand movements Rapid alternating movements Leg Agility
On Off PSP On Off PSP On Off PSP On Off PSP
Right and left-hand side
0.13 0.20 0.30 0.11 0.13 0.11 0.09 0.24 0.29 0.16 0.42 0.57
Numbers indicate the residual correlations. For instance, the first number 0.13 indicates the correlation between the residuals of Finger tapping between the right-hand and the left hand for the PD-On-group. All t-values are above 3.
Table 5: Simultaneous analysis: Factor variances and correlations
2 (PSP) 2 (PD) 3 1 4 5 6
Tremor-at-rest
Tremor-at-rest
Postural Tremor
Axial Dysfunctionin
g
Rigidity Brady-kinesia Right
Brady-kinesia Left
2 Tremor-at-rest
(0.01) † (0.33)
3 Postural Tremor
0.04†† 0.61 (0.40)
1 Axial Dysfunctioning
-0.03†† 0.13 0.14 (0.61)
4 Rigidity 0.01†† 0.29 0.26 0.61 (0.44)5 Bradykinesia
Right0.00†† 0.24 0.18 0.60 0.67 (0.53)
6 Bradykinesia Left
0.00†† 0.22 0.14 0.60 0.67 0.74 (0.60)
Factors have been ordered to emphasize the block pattern in the correlations.Variances of factors are on the diagonal between brackets and the correlations among factors are in the off-diagonal cells. † indicates t-value <3, †† t-value <2
Page 11 of 13(page number not for citation purposes)

BMC Medical Research Methodology 2006, 6:26 http://www.biomedcentral.com/1471-2288/6/26
we have a base for comparison. Separate component anal-yses are difficult to compare numerically, for instancebecause of the differing number of components. Moreo-ver, the simultaneous factor analyses allowed the testingof equality of factor structure, correlations between fac-tors, and possible equality of residual variances. However,such a model search is not without its difficulties, as wasfor instance shown by the obligatory inclusion of a resid-ual covariance between two variables. Moreover, in sev-eral attempted models no convergent solution was foundand other solutions had to be constructed to fit the modelto the data. Some early variants of the models that weresuggested by the methodologists could find no favour inthe eyes of the medical researchers, and they came up withdifferent suggestions that worked better than those of themethodologists. This emphasizes that without substantiveinput structural equation modelling can be a hazardousbusiness.
Finally, ideally the models that emerged here should betested further on independent samples. However, alreadyfor the present samples, data had to be combined fromseveral clinics to make up the numbers. With a largernumber of clinics and subjects, ascertaining of differentialeffects of variance due to rater and/or clinic could beassessed. However, considerable effort and money will benecessary to collect samples of sizes similar to ours. Actu-ally, larger samples would be preferable as the presentsamples were already on the small side for comfortablestructural equation modelling. However, the equalityrestrictions ensured that for the main parameters the esti-mation was based on all 669 patients.
Competing interestsThe author(s) declare that they have no competing inter-ests.
Authors' contributionsCCG, EC, and GTS conceived of the study, participated inits design, coordination and the data collection in all itsaspects. PMK and SEL drafted the manuscript. PMK andFJO performed the statistical analyses. All authors readand approved the final manuscript.
Additional material
AcknowledgementsThis research was supported by the Parkinson's Disease Foundation. The first two authors (PMK, FJO) were partially supported by a grant from the Netherlands Organisation of Scientific Research (NWO grant 575-30-005).
References1. Bennett DA, Beckett LA, Murray AM, Shannon KM, Goetz CG, Pil-
grim DM, Evans DA: Prevalence of parkinsonian signs and asso-ciated mortality in a community population of older people.New England Journal of Medicine 1996, 334:71-76.
2. Tanner CM: Parkinson's disease. In Handbook of NeuroepidemiologyEdited by: Gorelick PB, Alter M. New York: Marcel Dekker;1994:253-277.
3. Hornykiewicz O: Dopamine and brain function. PharmacologicalReview 1966, 18:925-964.
4. Bernheimer H, Birkmayer W, Hornykiewcz O, Jellinger K, Seitel-berger F: Brain dopamine and the syndromes of Parkinsonand Huntington. Clinical, morphological and neurochemicalcorrelations. Journal of Neurological Sciences 1973, 20:415-455.
5. Fahn S, Elton RL: Unified Parkinson's disease rating scale. InRecent Developments in Parkinson's Disease Volume 2. Edited by: Fahn S,Marsden CD, Calne DB, Goldstein M. Florham Park NJ: MacmillanHealthcare Information; 1987:153-163.
6. Stebbins GT, Goetz CG: Factor structure of the Unified Parkin-son's Disease Rating Scale: Motor Examination section.Movement Disorders 1998, 13:633-636.
7. Stebbins GT, Goetz CG, Lang AE, Cubo E: Factor analysis of themotor section of the unified Parkinson's disease rating scaleduring the off-state. Movement Disorders 1999, 14:585-589.
8. Cubo E, Stebbins GT, Golbe LI, Nieves AV, Leurgans S, Goetz CG,Kompoliti K: Application of the Unified Parkinson's DiseaseRating Scale in progressive supranuclear palsy: Factor analy-sis of the motor scale. Movement Disorders 2000, 15:276-279.
9. Bennett DA, Shannon KM, Beckett LA, Wilson RS: Dimensionalityof Parkinsonian signs in aging and Alzheimer's disease. Jour-nal of Gerontology 1999, 54:191-196.
10. Jöreskog KG: Simultaneous factor analysis in several popula-tions. Psychometrika 1971, 36:409-426.
11. Byrne BM: Testing for multigroup invariance using AMOSgraphics: A road less traveled. Structural Equation Modeling 2004,11:272-300.
12. Goetz CG, Stebbins GT, Chmura TA, Fahn S, Klawans HI, MarsdenCD: Teaching tape for the motor section of the Unified Par-kinson's Disease Rating Scale. Movement Disorders 1995,10:263-266.
Additional file 1Principal component analysis and confirmatory factor analysis and the use of restrictions: A brief comment. In this file the differences between explor-atory component analysis and confirmatory factor analysis are discussed in more detail than in the paper and the principles of imposing restrictions for refined model building are explained.Click here for file[http://www.biomedcentral.com/content/supplementary/1471-2288-6-26-S1.doc]
Additional file 2Simplified LISREL script for final analysis. The file contains a simplified version of the LISREL script which was used to estimate the parameters of the model reported in this paper. Full detailed scripts for all analyses can be obtained from the first author.Click here for file[http://www.biomedcentral.com/content/supplementary/1471-2288-6-26-S2.doc]
Page 12 of 13(page number not for citation purposes)
http://www.ncbi.nlm.nih.gov/entrez/query.fcgi?cmd=Retrieve&db=PubMed&dopt=Abstract&list_uids=8531961
http://www.ncbi.nlm.nih.gov/entrez/query.fcgi?cmd=Retrieve&db=PubMed&dopt=Abstract&list_uids=8531961
http://www.ncbi.nlm.nih.gov/entrez/query.fcgi?cmd=Retrieve&db=PubMed&dopt=Abstract&list_uids=9686766
http://www.ncbi.nlm.nih.gov/entrez/query.fcgi?cmd=Retrieve&db=PubMed&dopt=Abstract&list_uids=9686766

BMC Medical Research Methodology 2006, 6:26 http://www.biomedcentral.com/1471-2288/6/26
Publish with BioMed Central and every scientist can read your work free of charge
"BioMed Central will be the most significant development for disseminating the results of biomedical research in our lifetime."
Sir Paul Nurse, Cancer Research UK
Your research papers will be:
available free of charge to the entire biomedical community
peer reviewed and published immediately upon acceptance
cited in PubMed and archived on PubMed Central
yours — you keep the copyright
Submit your manuscript here:http://www.biomedcentral.com/info/publishing_adv.asp
BioMedcentral
13. MDVU Unified Parkinson's Disease Rating Scale: [http://www.mdvu.org/library/ratingscales/pd/]. seen 7/10/2005
14. Richards M, Marder K, Cote L, Mayeux R: Interrater reliability ofthe Unified Parkinson's Disease Rating Scale motor exami-nation. Movement Disorders 1994, 9:89-91.
15. Siderowf A, McDermott M, Kieburtz K, Blindauer K, Plumb S, Shoul-son I, Parkinson Study Group: Test-retest reliability of the uni-fied Parkinson's disease rating scale in patients with earlyParkinson's disease: results from a multicenter clinical trial.Movement Disorders 2002, 17:758-763.
16. Kroonenberg PM, Oort FJ, Stebbins GT, Leurgans SE: Confirmatory fac-tor analysis of the motor section of the UPDRS 1998 [http://three-mode.leidenuniv.nl/]. Department of Educational Sciences, LeidenUniversity Leiden, The Netherlands
17. Jöreskog KG, Sörbom D: LISREL 8 User's Reference Guide Chicago IL:Scientific Software International; 1996.
18. Bollen KA: Structural Equations with Latent Variables Newbury Park,CA, Sage; 1989.
19. Satorra A: Asymptotic robust inferences in the analysis ofmean and covariance structures. Sociological Methodology 1992,22:249-278.
20. Steiger JH, Lind JC: Statistically based tests for the number of common fac-tors Paper presented at the Psychometric Society Annual Meeting,Iowa City IA; 1980.
21. Browne MW, Cudeck R: Alternative ways of assessing modelfit. Sociological Methods & Research 1992, 21:230-258.
22. Curran PJ, West SG, Finch JF: The robustness of test statistics tononnormality and specification error in confirmatory factoranalysis. Psychological Methods 1996, 1:16-29.
23. Hu L-T, Bentler PM: Cutoff criteria for fit indices in covariancestructure analysis: Conventional versus new alternatives.Structural Equation Modeling 1999, 6:1-55.
24. Louis ED, Tang MX, Mayeux R: Factor structure of Parkinsoniansigns in the community-dwelling elderly. Movement Disorders2004, 19:268-272.
25. Štochl J: Structure of motor symptoms of Parkison's disease 2005 [http://www.ftvs.cuni.cz/doktorske_sk/obhaj/stochl.doc]. Unpublished doc-toral thesis, Charles University in Prague, Czech Republic seen 18/2/2006
Pre-publication historyThe pre-publication history for this paper can be accessedhere:
http://www.biomedcentral.com/1471-2288/6/26/prepub
Page 13 of 13(page number not for citation purposes)
http://www.ncbi.nlm.nih.gov/entrez/query.fcgi?cmd=Retrieve&db=PubMed&dopt=Abstract&list_uids=8139610
http://www.ncbi.nlm.nih.gov/entrez/query.fcgi?cmd=Retrieve&db=PubMed&dopt=Abstract&list_uids=8139610