Anatomically distinct dopamine release during anticipation and experience of peak emotion to music
Upload
independentCategory
view
1download
0
BioMed CentralBMC Genetics
ss
Open AcceResearch articleMost of the extant mtDNA boundaries in South and Southwest Asia were likely shaped during the initial settlement of Eurasia by anatomically modern humansMait Metspalu*1, Toomas Kivisild1, Ene Metspalu1, Jüri Parik1, Georgi Hudjashov1, Katrin Kaldma1, Piia Serk1, Monika Karmin1, Doron M Behar2, M Thomas P Gilbert6, Phillip Endicott7, Sarabjit Mastana4, Surinder S Papiha5, Karl Skorecki2, Antonio Torroni3 and Richard Villems1Address: 1Institute of Molecular and Cell Biology, Tartu University, Tartu, Estonia, 2Bruce Rappaport Faculty of Medicine and Research Institute, Technion and Rambam Medical Center, Haifa, Israel, 3Dipartimento di Genetica e Microbiologia, Università di Pavia, Pavia, Italy, 4Department of Human Sciences, Loughborough University, Loughborough, United Kingdom, 5Department of Human Genetics, University of Newcastle-upon-Tyne, United Kingdom, 6Ecology and Evolutionary Biology, The University of Arizona, Tucson, Arizona, USA and 7Henry Wellcome Ancient Biomolecules Centre, Department of Zoology, University of Oxford, Oxford OX1 3PS,United Kingdom
Email: Mait Metspalu* - [email protected]; Toomas Kivisild - [email protected]; Ene Metspalu - [email protected]; Jüri Parik - [email protected]; Georgi Hudjashov - [email protected]; Katrin Kaldma - [email protected]; Piia Serk - [email protected]; Monika Karmin - [email protected]; Doron M Behar - [email protected]; M Thomas P Gilbert - [email protected]; Phillip Endicott - [email protected]; Sarabjit Mastana - [email protected]; Surinder S Papiha - [email protected]; Karl Skorecki - [email protected]; Antonio Torroni - [email protected]; Richard Villems - [email protected]
* Corresponding author
AbstractBackground: Recent advances in the understanding of the maternal and paternal heritage of southand southwest Asian populations have highlighted their role in the colonization of Eurasia byanatomically modern humans. Further understanding requires a deeper insight into the topology ofthe branches of the Indian mtDNA phylogenetic tree, which should be contextualized within thephylogeography of the neighboring regional mtDNA variation. Accordingly, we have analyzedmtDNA control and coding region variation in 796 Indian (including both tribal and castepopulations from different parts of India) and 436 Iranian mtDNAs. The results were integratedand analyzed together with published data from South, Southeast Asia and West Eurasia.
Results: Four new Indian-specific haplogroup M sub-clades were defined. These, in combinationwith two previously described haplogroups, encompass approximately one third of the haplogroupM mtDNAs in India. Their phylogeography and spread among different linguistic phyla and socialstrata was investigated in detail. Furthermore, the analysis of the Iranian mtDNA pool revealedpatterns of limited reciprocal gene flow between Iran and the Indian sub-continent and allowed theidentification of different assemblies of shared mtDNA sub-clades.
Conclusions: Since the initial peopling of South and West Asia by anatomically modern humans,when this region may well have provided the initial settlers who colonized much of the rest ofEurasia, the gene flow in and out of India of the maternally transmitted mtDNA has been
Published: 31 August 2004
BMC Genetics 2004, 5:26 doi:10.1186/1471-2156-5-26
Received: 07 May 2004Accepted: 31 August 2004
This article is available from: http://www.biomedcentral.com/1471-2156/5/26
© 2004 Metspalu et al; licensee BioMed Central Ltd. This is an open-access article distributed under the terms of the Creative Commons Attribution License (http://creativecommons.org/licenses/by/2.0), which permits unrestricted use, distribution, and reproduction in any medium, provided the original work is properly cited.
Page 1 of 25(page number not for citation purposes)

BMC Genetics 2004, 5:26 http://www.biomedcentral.com/1471-2156/5/26
surprisingly limited. Specifically, our analysis of the mtDNA haplogroups, which are shared betweenIndian and Iranian populations and exhibit coalescence ages corresponding to around the earlyUpper Paleolithic, indicates that they are present in India largely as Indian-specific sub-lineages. Incontrast, other ancient Indian-specific variants of M and R are very rare outside the sub-continent.
BackgroundTwo mtDNA macro-haplogroups (M and N) that arosefrom the African haplogroup L3 encompass virtually allmtDNAs outside Africa [1-4]. The phylogenetic node N(including R) has spread its branches all over Eurasia, incontrast to haplogroup M, which is found in Eastern Eur-asia but is virtually absent in Europe. The numerousbranches of N are, however, generally segregated to eitherthe eastern (e.g. A, B [5], Y [6], R9 [7] or western (e.g. N1[8,9], N2 (comprising of W and its sister-clade identifiedby [10]), TJ, HV, U [11]) Eurasian-specific pools.
The majority of Indian mtDNAs belong to macro-haplo-group M [8,12-21]. While the topology of the M sub-hap-logroups that are common in mainland East Asia (M7, M8(including C, Z), M9 (including E), D, G [7,22,23]) and inAfrica (M1 [24]) is established in detail, the internal hap-logroup structure of M in India has remained largelyundefined. We have previously demonstrated that transi-tions at nps. 477G, 1780, 8502 and 16319 designateIndian-specific haplogroup M2, the most frequent Mclade in India [15]. Another Indian-specific M clade sup-ported by HVS-I variation as well as coding region mark-ers, is M6 [15]. Haplogroups M3, M4 and M5 have beendiscriminated preliminarily by their characteristic HVS-Imutations [19], but since their defining positions, 16126,16311, and 16129, respectively, are phylogeneticallyunstable [25,26], it is unlikely that the proposed haplo-groups are monophyletic. Most numerous sub-groups ofmacro-haplogroup N in India are the Indian-specific vari-ants of the phylogenetic node R including haplogroupsR5, R6, U2(a, b, c) [8,13,27].
The overwhelming majority of the Iranian mtDNAs havebeen shown to lie in the West Eurasian domain of the glo-bal human mtDNA pool [27,28]. Here we focus on theanalysis of mtDNA lineages that are shared between Indi-ans and Iranians and bear signals of pre-Holocene expan-sion in the region.
India congregates four linguistic domains (Indo-Euro-pean, Dravidic, Austro-Asiatic and Tibeto-Burman) thatoccupy non-random spheres of the geographic distribu-tion of its populations. The majority of the recent studiesbased on mtDNA variation have, in contrast to some [21],provided evidence that linguistic groups of India do notrepresent genetically homogeneous units and are not,therefore, traceable to different immigration waves from
distinct sources [8,13,19]. The complexity that arises indefining populations and groups of populations in Indiabased on genetic and cultural criteria has been recentlydemonstrated in South Indian tribal and caste popula-tions. The combined data from mtDNA, Y-chromosomeand autosomal genes indicated that the tribes and castesderive largely from the same genetic heritage of Late Pleis-tocene southern and southwestern Asians, and havereceived limited gene flow from external sources since theHolocene [15]. Similar results were obtained by Cordauxet al. [29], who demonstrated that caste and tribal groupsexhibit similar levels of molecular variance. However,genetic distances indicated that the Tibeto-Burman speak-ing tribal populations (from eastern India) were moreclosely related to East Asians than to other Indians [29].This is consistent with an earlier suggestion placing theorigin of these tribal groups east of India – in Tibet andMyanmar [30].
In this study, we have analyzed the mtDNA variation in asample of 796 Indians and 436 Iranians (Table 1), andcombined the results with previously published data fromthe same geographic area. We also compared the mtDNAvariation in India and Iran with that of Europe, China,and Thailand. The overall aim was to improve our under-standing of the origins and composition of the Indian andIranian gene pools and to determine the nature and theextent of gene flow between these regions. Through theanalyses of the genetic variation of extant Southwest andSouth Asian populations we took an endeavor to envisagethe exodus of anatomically modern humans from Africa.
Results and DiscussionGeographic distribution of macro-clades M and N in IndiaWe found haplogroup M ubiquitous at almost 58%among the caste, and 72% among the tribal populations(Table 2), which is largely consistent with previous reports[8,12-21]. Our results indicate that the frequency distribu-tion of haplogroup M varies across different Indianregions by a significant cline towards the south and theeast (see Figure 4 for Spatial Autocorrelation Analysis(SAA) p < 0.05). The variation among caste populationsclimbs from approximately 40% in Gujarat and (Indian-)Punjab to 65% in the southern states, and peaks at over70% in West Bengal (Table 2). We observed a similar geo-graphic pattern among tribal populations, where the fre-quency varied from just over 50% in the northern states ofPunjab and Himachal Pradesh, increased to 70%–80% in
Page 2 of 25(page number not for citation purposes)

BMC Genetics 2004, 5:26 http://www.biomedcentral.com/1471-2156/5/26
the southern states, and peaked at 86% in West Bengal(Table 8, see Additional file 3).
With the exception of the diverse set of largely Indian-spe-cific R lineages, the most frequent mtDNA haplogroup inIndia that derives from the phylogenetic node N is haplo-group W [13]. The frequency peak of haplogroup W is 5%in the northwestern states – Gujarat, Punjab and Kashmir.Elsewhere in India its frequency is very low (from 0 to0.9%) (Table 2) forming a significant spatial cline (Figure4).
At 15% among the caste and 8% among the tribal popu-lations haplogroup U is the most frequent sub-clade of Rin India (Table 12, see Additional file 7). Approximatelyone half of the U mtDNAs in India belong to the Indian-specific branches of haplogroup U2 (U2i: U2a, U2b andU2c) [13,27] (Table 2). They are present throughout Indiawithout a clear geographical cline (Figure 2, panel U2i,SAA p > 0.05). However, the spread of another subset ofU, haplogroup U7 [13], is similar to that of haplogroupW, peaking at 12% and 9% in Gujarat and Punjab, respec-tively (Table 11, see Additional file 6). The frequency of
U7 is also high in neighboring Pakistan (6%) and partic-ularly in Iran (9%) (Table 9, see Additional file 4).
MtDNA haplogroups in IranOver 90% of the mtDNAs found in Iran belong to haplo-groups HV, TJ, U, N1, N2 and X, commonly found in WestEurasia (Table 2). In contrast to Europe, where H is pre-dominant among the mtDNA haplogroups, in Iran thefrequency of haplogroup U (29%) is higher than that ofhaplogroup H (17%) (Table 9, see Additional file 4). Thisdifference accounts, at least partly for the presence in Iranof U sub-groups, such as U7 (9.4%), that are virtuallyabsent in Europe.
Compared to India, haplogroup M frequency in Iran ismarginally low (5.3%) and there are no distinguished Ira-nian-specific sub-clades of haplogroup M. All Iranian hap-logroup M lineages can be seen as derived from otherregional variants of the haplogroup: eleven show affilia-tion to haplogroup M lineages found in India, twelve inEast and Central Asia (D, G, and M8) and one in northeastAfrica (M1).
Table 1: Characteristics of the Indian and Iranian population samples whose mtDNA variation has been determined in the course of this study.
INDIAState / Region Socio-cultural affiliation Linguistic affiliation Population Code n N
West Bengal Caste Indo-European Mixed caste people Ben 50 80 MillionUttar Pradesh Tribe Indo-European Bhoksa Bho 5 32,000
Kerala Caste Indo-European Mixed caste people from Cochin Co 55 600,000Kerala -a Indo-European Cochin Jews CoJ 45 5,000 (in Israel)Gujarat Caste Indo-European Mixed caste people Guj 53 50 Million
Himachal Tribe Tibeto-Burman Kanet Kan 37 33,000Maharashtra Caste Indo-European Konkanastha Brahmin Kon 58 N/AWest Bengal Caste Indo-European Kurmi Kur 55 N/AWest Bengal Tribe Austro-Asiatic Lodha Lod 56 59,000
Sri Lanka Caste Dravidic Moor Mo 50 3.4 MillionMaharashtra -a Indo-European Parsi Par 55 76,000
Punjab Caste Indo-European Mixed caste people Pun 109 24 MillionRajasthan Caste Indo-European Rajput Raj 35 5 Million (in Rajasthan)Sri Lanka Caste Indo-European Sinhalese Sin 82 14.6 Million
Uttar Pradesh Tribe Indo-European Tharu Tha 26 96,000 (in India)Uttar Pradesh Caste Indo-European Uttar Pradesh Brahmin UPb 25 2.5 Million
total 796IRAN
northwest 226southwest 138northeast 30southeast 6central 36total Indo-European Iranian IR 436 ca. 68 Million
a For some analyzes these populations where grouped with the caste populations. (see Table 1 in the Supplementary Material for the complete set of studied populations including those whose mtDNA variation was previously published)
Page 3 of 25(page number not for citation purposes)

T
R2; U7; W EEe WEf
6.2) 3.4 (2.7–4.2) 10.5 (9.4–11.8) 12.1 (10.9–13.4)1.3) 13.3 (10.4–16.8) 3.9 (2.5–6.2) 90.8 (87.7–93.2)
9.5) 4.8 (3.7–6.2) 4 (3–5.2) 17.1 (15.1–19.3)
4.1) 2 (1.4–2.9) 16.5 (14.6–18.6) 7.5 (6.2–9)
9.7) 6.1 (3.9–9.3) 3.5 (2–6.2) 17.6 (13.8–22.2)
9.9) 3.9 (2.5–5.9) 1.7 (.1–1.4) 16.6 (1.2–3.8)
8.9) 6.9 (5.4–8.6) 4.0 (3–5.5) 19.9 (17.5–22.6)
7.5) 1.2 (.7–2.1) 3.0 (2.1–4.2) 8.8 (7.3–10.7)2.9) 2.0 (.9–4.6) 61.4 (55.3–67.3) 3.2 (1.7–6.2)
–6) 1.1 (.3–6) 0 (0–4) 1.1 (.3–6)
0.1) 4.0 (2.2–7.2) 1.2 (.4–3.5) 13.6 (9.9–18.4)
9.4) 7.9 (6.1–10.1) 5.0 (3.7–6.9) 22.2 (19.3–25.4)
8.9) 2.4 (1.1–5.2) 1.2 (.4–3.5) 8.9 (6–13.2)
1.4)
3.29 (.78–16.6) 9.96 (3.61–25.7) 6.67 (2.04–21.4)
9.2) 17.5 (9.9–29.4) 5.3 (1.9–14.4) 33.3 (22.5–46.3)22.7) 6.4 (2.3–17.2) 0 (.1–7.4) 14.9 (7.5–27.8)31.7) 5.3 (1.2–24.9) 21.1 (8.7–43.7) 31.6 (15.4–54.3)
3.8) 1 (.2–5.4) 4 (1.6–9.8) 11 (6.3–18.7)9.6) 4.3 (1.9–9.6) 5.1 (2.4–10.7) 23.1 (16.4–31.5)
12.7) 14 (9.4–20.5) 5.3 (2.8–10.2) 42.7 (35–50.7)4.2) 5.6 (1.7–18.2) 0 (.1–9.5) 2.8 (.7–14.2)18.8) 2.3 (.8–6.5) 2.3 (.8–6.5) 15.2 (10–22.3)
0.3) 3.9 (1.2–13.2) 23.5 (14–36.8) 7.8 (3.2–18.5)23.8) 3.1 (1.1–8.6) 4.1 (1.7–10) 13.3 (8–21.4)
–13) 0.9 (.2–5.1) 0.9 (.2–5.1) 7.5 (3.9–14.2)
ples) are excluded.
, Orissa (n = 2) and Bihar (n = 2) data.
able 2: Geographic, linguistic and socio-cultural distribution of major Indian-specific mtDNA haplogroups
HAPLOGROUP FREQUENCY (95% CR FOR PROPORTION)
n Mb M2 M3a M4a M6 M18 M25 Rc R5 R6 U2id
India 2544g 65 (63.1–66.8) 6.3 (5.4–7.3) 2.2 (1.7–2.9) 0.6 (.4–1) 2.9 (2.3–3.6) 2.1 (1.6–2.8) 0.9 (.6–1.4) 11.4 (10.2–12.7) 2.2 (1.7–2.8) 1.3 (.9–1.8) 5.3 (4.5–Iran 436 5.3 (3.6–7.8) 0 (0–.8) 0.5 (.1–1.6) 0 (0–.8) 0 (0–.8) 0.2 (.1–1.3) 0 (0–.8) 3.2 (1.9–5.3) 0.9 (.4–2.3) 0 (0–.8) 0.2 (.1–
Socio-cultural affiliation (Indian data only)
Caste population
1204 57.8 (54.9–60.5) 5.1 (4–6.5) 4.2 (3.2–5.5) 1.1 (.6–1.8) 3 (2.2–4.1) 1.4 (.9–2.2) 1.4 (.9–2.2) 14.1 (12.3–16.2) 3.3 (2.5–4.5) 1.7 (1.1–2.5) 7.8 (6.4–
Tribal population
1332 71.5 (69–73.8) 7.5 (6.2–9) 0.5 (.2–1) 0.2 (0–.5) 2.7 (2–3.7) 2.7 (2–3.7) 0.5 (.2–1) 8.9 (7.5–10.6) 1.2 (.7–1.9) 0.9 (.5–1.6) 3 (2.2–
Brahmins & Kshatriyas
313 60.1 (54.5–65.3) 1.9 (.9–4.1) 5.1 (3.2–8.1) 1 (.3–2.8) 0.6 (.2–2.3) 1 (.3–2.8) 2.2 (1.1–4.5) 14.7 (11.2–19.1) 4.5 (2.7–7.4) 1.3 (.5–3.2) 6.4 (4.2–
Other Castesh
517 61.5 (57.2–65.6) 6.2 (4.4–8.6) 4.6 (3.1–6.8) 1.2 (.5–2.5) 2.9 (1.8–4.7) 2.1 (1.2–3.8) 0.8 (.3–2) 12.6 (10–15.7) 2.3 (1.3–4) 1.5 (.8–3) 7.4 (5.4–
Language groups of India
Indo-European
963 57.5 (54.4–60.6) 3.8 (2.8–5.3) 4.5 (3.3–6) 1.0 (.6–1.9) 2.7 (1.9–3.9) 1.1 (.6–2) 1.6 (1–2.6) 7.8 (6.3–9.7) 2.5 (1.7–3.7) 1.6 (1–2.6) 7.1 (5.6–
Dravidic 1063 70.0 (67.2–72.7) 10.8 (9.1–12.8) 1.2 (.7–2.1) 0.5 (.2–1.1) 4.0 (2.9–5.3) 1.4 (.9–2.3) 0.5 (.2–1.1) 8.9 (7.4–10.8) 2.7 (1.9–3.9) 1.4 (.9–2.3) 5.9 (4.7–Tibeto-Burman
249 59.8 (53.6–65.7) 0 (0–1.5) 0.4 (.1–2.2) 0 (0–1.5) 1.6 (.7–4) 1.2 (.4–3.5) 1.2 (.4–3.5) 0.8 (.2–2.9) 1.2 (.4–3.5) 0 (0–1.5) 0.8 (.2–
Austro-Asiatic
(Mundari)
90 86.7 (78.1–92.2) 2.2 (.7–7.7) 0 (0–4) 0 (0–4) 0 (0–4) 26.7 (18.6–36.7) 0 (0–4) 4.4 (1.8–10.9) 0 (0–4) 1.1 (.3–6) 1.1 (.3
Indo-European i
250 66.4 (60.3–72) 8.0 (5.3–12) 0.4 (.1–2.2) 0.8 (.2–2.8) 4.8 (2.8–8.2) 1.6 (.6–4) 0.4 (.1–2.2) 8.8 (5.9–13) 2.0 (.9–4.6) 1.6 (.6–4) 6.4 (4–1
Indo-European j
713 54.4 (50.7–58) 2.4 (1.5–3.8) 5.9 (4.4–7.9) 1.1 (.6–2.2) 2.0 (1.2–3.3) 1.0 (.5–2) 2.0 (1.2–3.3) 7.4 (5.7–9.6) 2.7 (1.7–4.1) 1.5 (.9–2.7) 7.3 (5.6–
Indian States and Bangladesh (excluding tribal populations)k
Andhra Pradesh
245 65.3 (59.1–71.0) 7.7 (5–11.8) 2.8 (1.4–5.7) 1.6 (.6–4.1) 3.3 (1.7–6.4) 4.1 (2.3–7.4) 0 (0–1.5) 18 (13.7–23.2) 4.1 (2.3–7.4) 1.2 (.4–3.5) 5.3 (3.2–
Bangladesh 30 66.67 (48.6–80.8) 9.96 (3.61–25.7) 0 (.08–11.2) 0 (.08–11.2) 3.29 (.78–16.6) 3.29 (.78–16.6) 0 (.08–11.2) 6.67 (2.04–21.4) 0 (.08–11.2) 0 (.08–11.2) 6.67(2.04–2
Gujarat 57 40.4 (28.6–53.4) 5.3 (1.9–14.4) 7 (2.9–16.7) 1.8 (.4–9.2) 1.8 (.4–9.2) 1.8 (.4–9.2) 0 (0–6.2) 17.5 (9.9–29.4) 5.3 (1.9–14.4) 1.8 (.4–9.2) 1.8 (.4–Karnataka 47h 55.3 (41.2–68.6) 2.1 (.5–11.1) 2.1 (.5–11.1) 0 (.1–7.4) 0 (.1–7.4) 0 (.1–7.4) 0 (.1–7.4) 19.1 (10.5–32.6) 6.4 (2.3–17.2) 0 (.1–7.4) 10.6 (4.7–Kashmir 19 26.3 (11.9–49.1) 0 (.1–16.8) 0 (.1–16.8) 5.3 (1.2–
24.9)10.5 (3.2–31.7) 0 (.1–16.8) 0 (.1–16.8) 10.5 (3.2–31.7) 0 (.1–16.8) 5.3 (1.2–24.9) 10.5 (3.2–
Kerala 100 54 (44.2–63.5) 4 (1.6–9.8) 0 (0–3.6) 0 (0–3.6) 0 (0–3.6) 0 (0–3.6) 5 (2.2–11.2) 25 (17.6–34.3) 9 (4.9–16.2) 1 (.2–5.4) 7 (3.5–1Maharashtra 117 65 (55.9–73) 3.4 (1.4–8.5) 11.1 (6.6–18.1) 0.9 (.2–4.6) 0 (0–3.1) 0 (0–3.1) 5.1
(2.4–10.7)6.8 (3.5–12.9) 0.9 (.2–4.6) 0.9 (.2–4.6) 4.3 (1.9–
Punjab 150 36 (28.8–44) 0.7 (.2–3.6) 4.7 (2.3–9.3) 1.3 (.4–4.7) 0.7 (.2–3.6) 0 (0–2.4) 2.7 (1.1–6.6) 11.3 (7.2–17.4) 0.7 (.2–3.6) 0.7 (.2–3.6) 7.3 (4.2–Rajasthan 36 69.4 (53–82) 0 (.1–9.5) 13.9 (6.2–28.8) 0 (.1–9.5) 0 (.1–9.5) 5.6 (1.7–18.2) 0 (.1–9.5) 22.2 (11.8–38.2) 5.6 (1.7–18.2) 2.8 (.7–14.2) 2.8 (.7–1Sri Lanka 132 57.6 (49–65.7) 6.8 (3.7–12.5) 1.5 (.5–5.3) 1.5 (.5–5.3) 1.5 (.5–5.3) 0.8 (.2–4.1) 0 (0–2.7) 12.9 (8.2–19.7) 0.8 (.2–4.1) 3 (1.2–7.5) 12.1 (7.6–
Tamil Nadu 51 64.7 (50.9–76.4) 5.9 (2.1–15.9) 3.9 (1.2–13.2) 2 (.5–10.3) 2 (.5–10.3) 2 (.5–10.3) 0 (0–6.8) 11.8 (5.6–23.4) 0 (0–6.8) 3.9 (1.2–13.2) 2 (.5–1Uttar
Pradesh98 52 (42.2–61.7) 1 (.2–5.5) 8.2 (4.2–15.3) 1 (.2–5.5) 0 (0–3.7) 2 (.6–7.1) 1 (.2–5.5) 11.2 (6.4–19) 3.1 (1.1–8.6) 2 (.6–7.1) 15.3 (9.5–
West Bengal 106 71.7 (62.5–79.4) 3.8 (1.5–9.3) 1.9 (.6–6.6) 0 (0–3.4) 5.7 (2.7–11.8) 0 (0–3.4) 0.9 (.2–5.1) 12.3 (7.3–19.9) 6.6 (3.3–13) 2.8 (1–8) 6.6 (3.3
a a See Tables 8–13 (additional files 3–7, 9) for frequencies of other haplogroups including breakdown of R2, U7 and Wb Includes all haplogroup M sub-haplogroupsc Includes sub-haplogroups R2, R5, R6 and R10d Composite of haplogroups U2a, U2b and U2c [27]e Composite of haplogroups A, B, D, G, M7, M8 (including C and Z), M9 (including E), M10, N9 (including Y), R9 (including F)f Composite of haplogroups HV, TJ, X, N1, N2 and U (except U2i)g Caste and tribal populations plus 8 Siddi [49] who belong to neither groupingsh Datasets where caste affiliation was not determined (undefined/mixed caste population), Scheduled Caste populations (e.g. the Mukri, see text for explanation) and data from [3] (dataset of 27 haplogroup M sami Indo-European speakers of southern India (Tamil Nadu, Kerala, Karnataka, Andhra Pradesh and Sri Lanka)j Indo-European speakers of northern India (States other than listed in the previous footnote)k The sum of the presented caste populations sample sizes is different from that given in the third row of the current table because of the addition of the Bangladeshi (n = 30) and extraction of the Mukri (n = 42)
BMC Genetics 2004, 5:26 http://www.biomedcentral.com/1471-2156/5/26
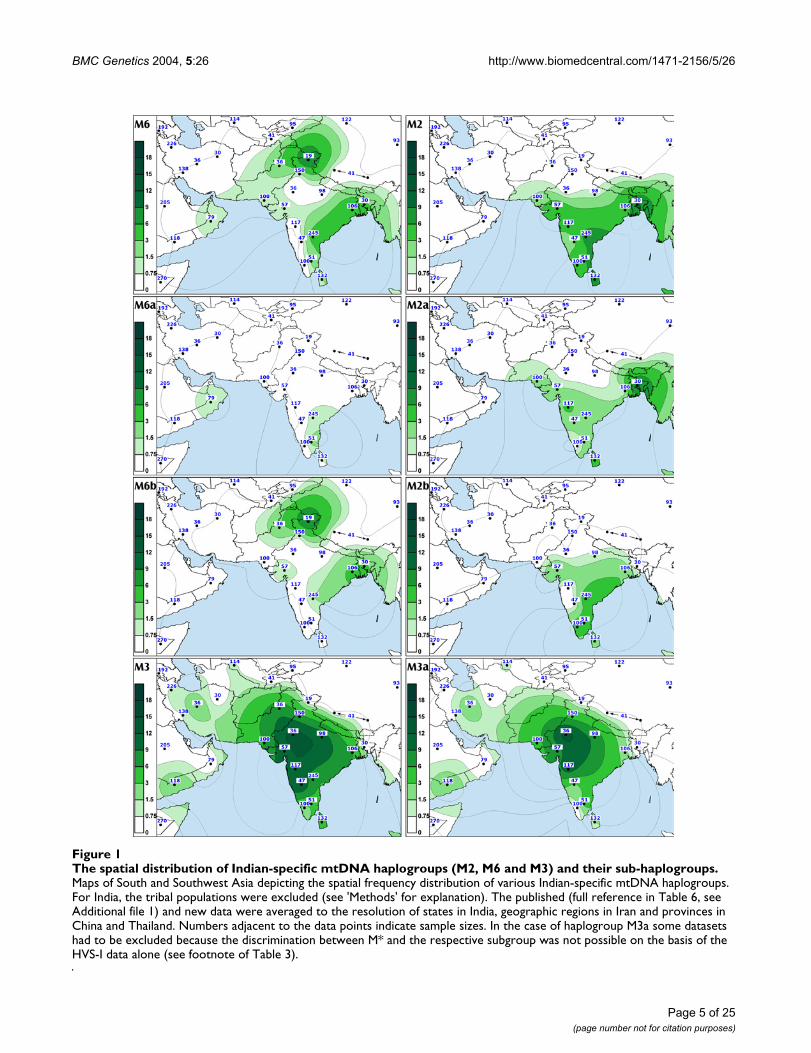
The spatial distribution of Indian-specific mtDNA haplogroups (M2, M6 and M3) and their sub-haplogroupsFigure 1The spatial distribution of Indian-specific mtDNA haplogroups (M2, M6 and M3) and their sub-haplogroups. Maps of South and Southwest Asia depicting the spatial frequency distribution of various Indian-specific mtDNA haplogroups. For India, the tribal populations were excluded (see 'Methods' for explanation). The published (full reference in Table 6, see Additional file 1) and new data were averaged to the resolution of states in India, geographic regions in Iran and provinces in China and Thailand. Numbers adjacent to the data points indicate sample sizes. In the case of haplogroup M3a some datasets had to be excluded because the discrimination between M* and the respective subgroup was not possible on the basis of the HVS-I data alone (see footnote of Table 3).
Page 5 of 25(page number not for citation purposes)

BMC Genetics 2004, 5:26 http://www.biomedcentral.com/1471-2156/5/26
The spatial distribution of Indian-specific mtDNA haplogroups (U2, M4a, M18 and M25) and their sub-haplogroupsFigure 2The spatial distribution of Indian-specific mtDNA haplogroups (U2, M4a, M18 and M25) and their sub-haplogroups. In the case of haplogroup M25 some datasets had to be excluded because the discrimination between M* and the respective subgroup was not possible on the basis of the HVS-I data alone (see footnote of Table 3). For other details see legend to Figure 1.
Page 6 of 25(page number not for citation purposes)

BMC Genetics 2004, 5:26 http://www.biomedcentral.com/1471-2156/5/26
Indian-specific (R5 and Indian-specific M and U2 vari-ants) and East Asian-specific (A, B and East Asian-specificM subgroups) mtDNAs, both, make up less than 4% ofthe Iranian mtDNA pool. We used Turkey (88.8 ± 4.0%)as the third parental population for evaluating the relativeproportions of admixture from India (2.2 ± 1.7%) andChina (9.1 ± 4.1%) into Iran. Therefore we can concludethat historic gene flow from India to Iran has been verylimited.
The package of the most ancient mtDNA haplogroups in IndiaApproximately one tenth of the Indian haplogroup MmtDNAs fall into its major sub-clade M2, which is definedby the motif 477G-1780-8502-16319 [15]. M2 can befurther subdivided into haplogroups M2a (transitions atnps 5252 and 8369) and M2b [15]. Haplogroup M2 andits two major sub-clades reveal coalescence times of 50 to70 thousand years (Table 3). Due to the increased fre-quency towards the southern part of India (Figure 1, panelM2, SAA p < 0.05 Figure 4), M2 is significantly (p < 0.05)more frequent among the Dravidic speakers than amongthe Indo-European speakers who are spread mostly in thenorthern regions of India (Table 2). It is more plausiblethat geography rather than linguistics is behind this pat-tern, because the frequency of M2 amongst the Indo-Euro-pean speaking populations in southern India issignificantly higher than that in the north, while there isno significant difference between Dravidic and Indo-European speaking populations from the same geo-
graphic region (Table 2). It is also notable that the fre-quency of M2 among the Brahmins and the Kshatriyas ofAndhra Pradesh (CR 3.3 – 19.2%) is not significantly (p >0.05) different from that among the other castes or thetribal populations of the region (CR: 5–12.9%, 11.2–18.3%, respectively). On the other hand, none of the 159Brahmins and Kshatriyas from the northern states of India(Punjab, Rajasthan, Uttar Pradesh and West Bengal)belong to M2 while the frequency reaches nearly 3% (CR:1.6–4.6%) among the other castes and tribal populationsof the region.
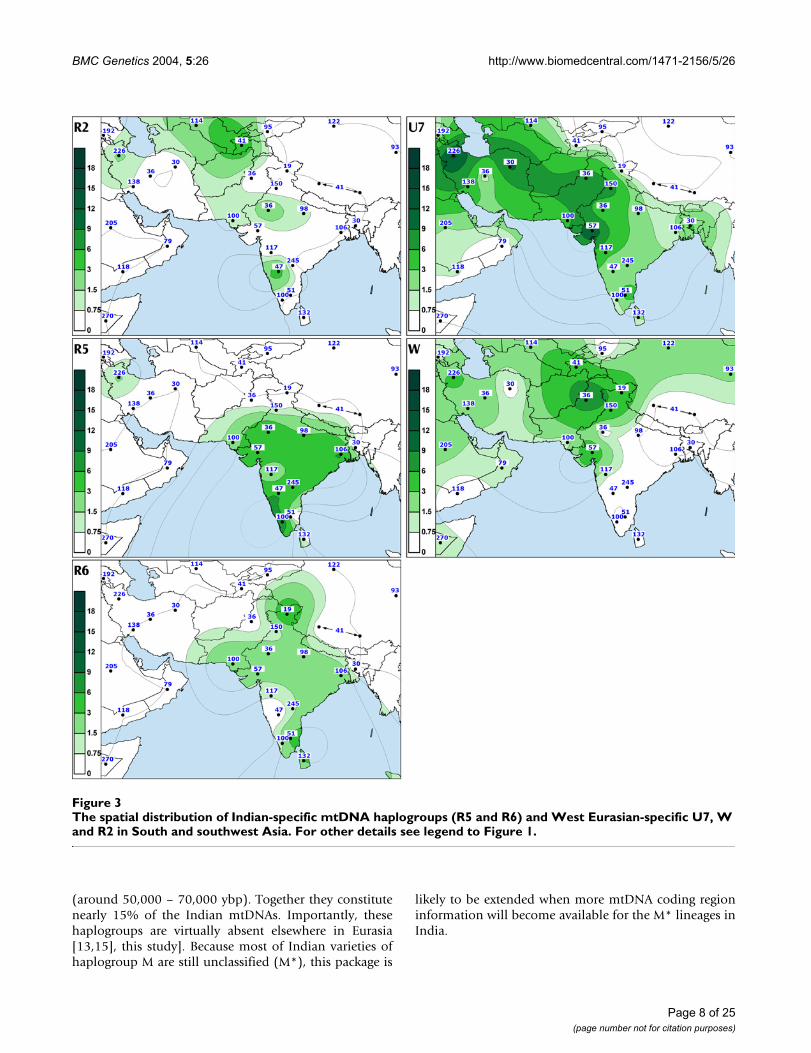
We found that R5, which is defined by transitions at nps8594 [27], 16266 and 16304, is the second most frequentsub-clade of R in India after haplogroup U. The coales-cence age estimate for R5 was similar to that of M2 (Table3), whereas individual boughs within the R5 limb showedexpansions from ca. 20,000 ybp to ca. 50,000 ybp (Figure12, see Additional file 8). Our data indicate that thisdiverse and ancient haplogroup is present over most ofIndia (Figure 3, panel R5). Though absent among the Aus-tro- Asiatic tribal groups, R5 is spread across the other lan-guage boundaries. In contrast to M2, R5 is more frequentamong the caste (CR: 2.5–4.5%) than among the tribalpopulations (CR: 0.7–1.9%) (Table 2).
Together with the Indian-specific sub-clades of haplo-group U2 [13,27], haplogroups M2 and R5 can bediscriminated as a package of Indian-specific mtDNAclades harboring extremely deep coalescence times
Table 3: Indian-specific sub-clades of mtDNA haplogroups M and R.
DIAGNOSTIC CODING REGION
MARKERS
ANCESTRAL HVS-I MOTIF COALESCENCE (years)
ρ/nδ2 a
COALESCENCE b
(years)ρ/nδ2
anc Proportion (95%
CR)
M2 477G-1780-8502 16223–16319 70,600 ± 21,000 0.02 70,100 ± 20,700 0.04 166 6.1 (5.3–7.1)M2a 5252–8369 16223-16319-16270 48,300 ± 20,100 0.03 46,700 ± 22,800 0.06 79 2.9 (2.3–3.6)M2b 16223-16319-16274 54,800 ± 25,000 0.02 57,600 ± 22,300 0.06 87 3.2 (2.6–3.9)
M3a 4580 16126–16223 17,300 ± 7,400 0.10 17,300 ± 7,600 0.11 62 3.0f (2.4 – 3.8)M4a 6620–7859 16223–16311 19,200 ± 9,000 0.23 19,100 ± 9,000 0.25 21 0.8 (0.5–1.2)M6 3537 16223-16231-16362 33,000 ± 13,900 0.04 30,000 ± 13,600 0.08 79 2.9 (2.3–3.6)
M6a 16223-16231-16356-16362 19,100 ± 7,600 0.17 15,700 ± 8,100 d 0.54 37 1.4 (1.0–1.9)M6b 5585 16188-16223-16231-16362 6,000 ± 2,100 0.73 12,100 ± 4,500 0,82 37 1.4 (1.0–1.9)
M18 16223-16318T 9,400 ± 3,200 0.31 17,100 ± 4,700 0.61 58 2.1 (1.7–2.7)M25 15928 16223–16304 19,400 ± 7,200 0.30 22,300 ± 8,600 0.32 25 1.0g (0.7 – 1.5)R2e 4216 16071 40,400 ± 14,300 0.45 52,500 ± 21,700 0.5 8 0.3 (0.2–0.6)R5 8594 16266–16304 66,100 ± 22,000 0.04 69,800 ± 24,800 0.05 58 2.1 (1.7–2.7)R6 -12282 AluI 16129–16362 30,000 ± 11,000 0.14 30,300 ± 11,600 0.19 35 1.3 (0.9–1.8)Total 2719
a Efficiency of the sample for coalescence calculation (Saillard et al. 2000)b Calculated without the tribal populationsc In the Indian subcontinent (a total of 2719 mtDNAs)d Excluding also the scheduled cast of Mukrie R2 is spread also in the Near East, Central Asia and Volga basinf Excluding the datasets where M3* / M3a discrimination was impossible: 246 subjects from Andhra Pradesh (Bamshad et al. 1998); 382 Pushtoon, Koragas, Naga, Yerava, Pardhi, Paniya Adi, Andh, Apatani and Soligas (Cordaux et al. 2003); 35 Kota and Kurumba (Roychoudhury et al. 2001)g Excluding the datasets where M* / M25 discrimination was impossible: 246 subjects from Andhra Pradesh (Bamshad et al. 1998); 39 Thoti and 29 subjects from Bangladesh (Cordaux et al. 2003); 12 Muria (Roychoudhury et al. 2001)
Page 7 of 25(page number not for citation purposes)
BMC Genetics 2004, 5:26 http://www.biomedcentral.com/1471-2156/5/26
(around 50,000 – 70,000 ybp). Together they constitutenearly 15% of the Indian mtDNAs. Importantly, thesehaplogroups are virtually absent elsewhere in Eurasia[13,15], this study]. Because most of Indian varieties ofhaplogroup M are still unclassified (M*), this package is
likely to be extended when more mtDNA coding regioninformation will become available for the M* lineages inIndia.
The spatial distribution of Indian-specific mtDNA haplogroups (R5 and R6) and West Eurasian-specific U7, W and R2 in South and southwest AsiaFigure 3The spatial distribution of Indian-specific mtDNA haplogroups (R5 and R6) and West Eurasian-specific U7, W and R2 in South and southwest Asia. For other details see legend to Figure 1.
Page 8 of 25(page number not for citation purposes)

BMC Genetics 2004, 5:26 http://www.biomedcentral.com/1471-2156/5/26
Spatial Autocorrelation AnalysesFigure 4Spatial Autocorrelation Analyses Correlograms of different haplogroups and haplogroup groupings frequen-cies in South Asia. In the case of haplogroup M3a some datasets had to be excluded because lack of resolution (see footen-ote for Table 3. for detailes). There was no significant cline in the frequencies of haplogroup R2. In the case of haplogroups M6a and M6b only the potential cline along the Bay of Bengal is investigated. Therefor the number of distance classes is reduced to three.
Page 9 of 25(page number not for citation purposes)

BMC Genetics 2004, 5:26 http://www.biomedcentral.com/1471-2156/5/26
The geographic distribution of the M2, R5 and U2i pack-age seems to be rather uniform in the context of theIndian-specific maternal lineages (SAA p > 0.05). Whenexcluding the mtDNAs that are likely to have arrived morerecently from West or East Eurasia, the share of the pack-age among the caste populations in northern and south-ern India is roughly similar (CR: 16.1–24.5% and 19.5–26.0 %, respectively). However, in accordance with expec-tations from the individual haplogroup distributions, thetribal groups speaking Austro-Asiatic and Tibeto-Burmanlanguages are characterized by considerably lower values(CR: 3.9–14.1% and 3.8–15.1%, respectively).
The quest for finding the origin of haplogroup M and a plausible scenario for the peopling of EurasiaBased on the high frequency and diversity of haplogroupM in India and elsewhere in Asia, some authors have sug-gested (versus [3]) that M may have arisen in SouthwestAsia [16,17,31]. Finding M1 or a lineage ancestral to M1in India, could help to explain the presence of M1 inAfrica as a result of a back migration from India. Yet, todate this has not been achieved [15], this study). There-fore, one cannot rule out the still most parsimonious sce-nario that haplogroup M arose in East Africa [3].Furthermore, the lack of L3 lineages other than M and N(indeed, L3M and L3N) in India is more consistent withthe African launch of haplogroup M. On the other hand,one also observes that: i) M1 is the only variant of haplo-group M found in Africa; ii) M1 has a fairly restricted phy-logeography in Africa, barely penetrating into sub-Saharan populations, being found predominantly inassociation with the Afro-Asiatic linguistic phylum – afinding that appears to be inconsistent with the distribu-tion of sub-clades of haplogroups L3 and L2 that havesimilar time depths. That, plus the presence of M1 withoutaccompanying L lineages in the Caucasus [32] and [ourunpublished data], leaves the question about the origin ofhaplogroup M still open.
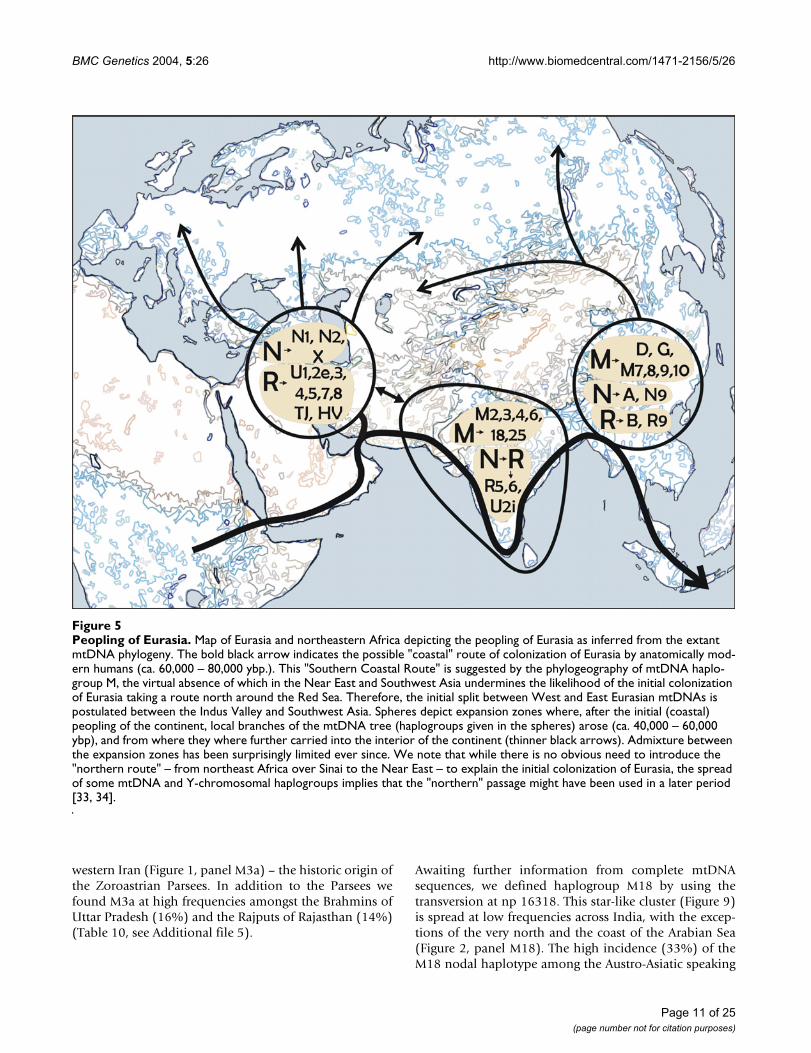
In contrast to haplogroup M, ancient sub-clades of haplo-group N are spread both east and west of India as well aswithin India itself. Several migration scenarios involvingmultiple "out of Africa" events punctuated by space, timeor both, could be invoked to explain the phylogeographyof these mtDNA haplogroups. Yet, using the parsimonycriterion it can be argued that only a single early migrationthat brought ancestral lineages, M and N (with the latterhaving already given rise to R), to South Asia couldaccount for the extant mtDNA phylogeography in Eurasia[15]. The finding of several largely South and West Asian-specific sub-clades (H, L, R2, and F*) of the major Eura-sian Y chromosomal haplogroups F and K also supportsthis scenario [15]. From South and West Asia thecolonization would have sprung both east and west asregion-specific mtDNA and Y chromosomal sub-clades
appeared both in West- and East-Eurasia as well as inIndia itself (Figure 5). However, not all the West-EurasianY-chromosomal founder haplogroups are present inIndia. Haplogroup E, for example, was possibly carried toEurope and Western Asia later via the Levantine corridor[33]. Similarly, a Late Upper Palaeolithic origin andspread of mtDNA haplogroup X from Northeast Africaand Middle East has been suggested lately [34].
The improved structure of autochthonous Indian mtDNA cladesNearly a third of Indian mtDNAs belonging to haplo-group M could be assigned to its existing boughs andlimbs with the current knowledge of the mtDNA codingregion polymorphisms (Table 9, see Additional file 4). Itis likely that the unclassified Indian M* and R* mtDNAsare also to a large extent autochthonous because neitherthe East nor West Eurasian mtDNA pools include such lin-eages at notable frequencies.
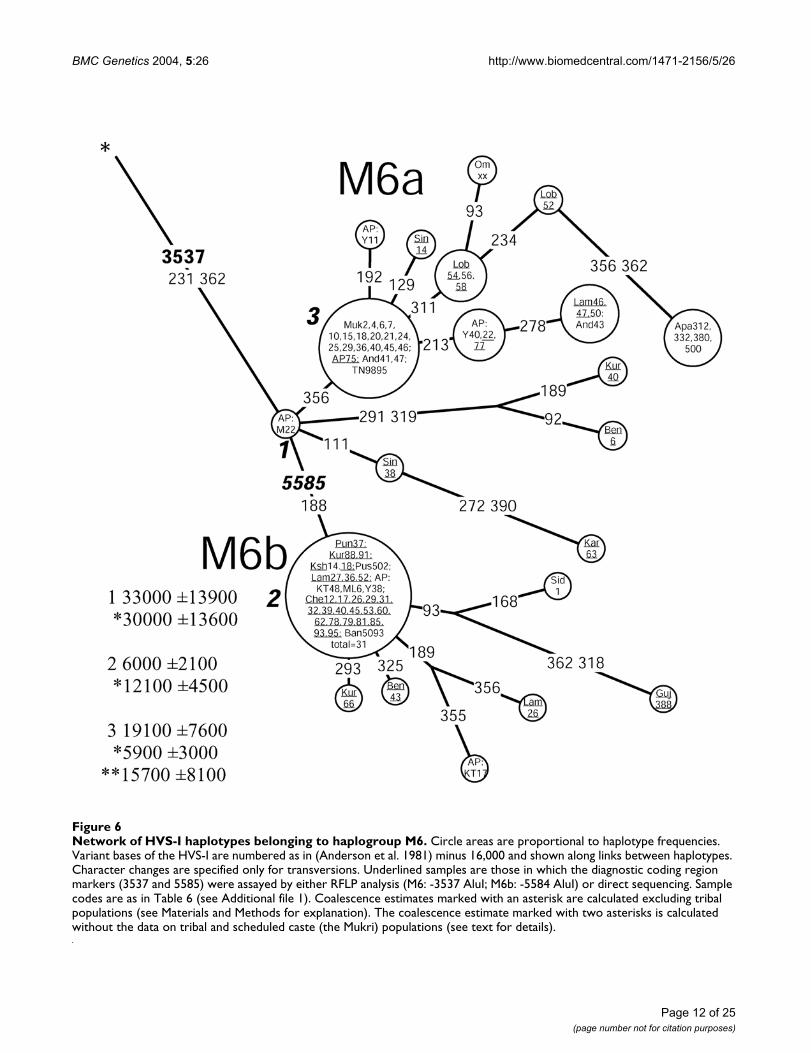
Haplogroup M6 (Figure 6) is primarily found in the IndusValley and on the western shores of the Bay of Bengalwhere its sub-clades M6a and M6b are concentratedtowards the southwest and the northeast, respectively(Figure 1, panel M6, M6b cline is significant SAA p < 0.05,Figure 4). The highest frequencies of M6a and M6b werefound amongst the Mukri scheduled caste from Karnataka(17%) and in Kashmir (10%), respectively. The Mukriform an endogamous group of no more than 10,000 indi-viduals, who dwell on an area less than 2000 km2 [35].That, together with the observation that all the sixteen M6sequences found among the Mukri belong to a single hap-lotype, suggests that genetic drift has played a major rolein the demographic history of the Mukri. The statisticalsignificance of the high M6 frequency in Kashmir isundermined by the small sample size (19 individuals),which results in the very wide error margins for the fre-quency estimate (CR: 3.2–31.7%).
Different geographic distributions characterize the sub-clades of M3 and M4 that we define by mtDNA codingregion markers (Table 3, Figures 7 and 8). Both M3a andM4a show time depths around 20,000 ybp. However,while M4a is sparsely spread in most of India with noobvious geographical cline (Figure 2, panel M4a, SAA p >0.05), the spread of M3a is concentrated into northwest-ern India (Figure 1, panel M3a, SAA p < 0.05), suggestingthat the region may have been the ancestral source. Thefrequency of M3a is at its highest amongst the Parsees ofMumbai (22%). Given the low M3a diversity amongst theParsees – the twelve M3a mtDNAs fall into the two mostcommon haplotypes (Figure 7) – the high frequency islikely a result of admixture and subsequent founderevents. On the other hand, it is intriguing that, despite itslow frequency, M3a penetrates into central and south-
Page 10 of 25(page number not for citation purposes)
BMC Genetics 2004, 5:26 http://www.biomedcentral.com/1471-2156/5/26
western Iran (Figure 1, panel M3a) – the historic origin ofthe Zoroastrian Parsees. In addition to the Parsees wefound M3a at high frequencies amongst the Brahmins ofUttar Pradesh (16%) and the Rajputs of Rajasthan (14%)(Table 10, see Additional file 5).
Awaiting further information from complete mtDNAsequences, we defined haplogroup M18 by using thetransversion at np 16318. This star-like cluster (Figure 9)is spread at low frequencies across India, with the excep-tions of the very north and the coast of the Arabian Sea(Figure 2, panel M18). The high incidence (33%) of theM18 nodal haplotype among the Austro-Asiatic speaking
Peopling of EurasiaFigure 5Peopling of Eurasia. Map of Eurasia and northeastern Africa depicting the peopling of Eurasia as inferred from the extant mtDNA phylogeny. The bold black arrow indicates the possible "coastal" route of colonization of Eurasia by anatomically mod-ern humans (ca. 60,000 – 80,000 ybp.). This "Southern Coastal Route" is suggested by the phylogeography of mtDNA haplo-group M, the virtual absence of which in the Near East and Southwest Asia undermines the likelihood of the initial colonization of Eurasia taking a route north around the Red Sea. Therefore, the initial split between West and East Eurasian mtDNAs is postulated between the Indus Valley and Southwest Asia. Spheres depict expansion zones where, after the initial (coastal) peopling of the continent, local branches of the mtDNA tree (haplogroups given in the spheres) arose (ca. 40,000 – 60,000 ybp), and from where they where further carried into the interior of the continent (thinner black arrows). Admixture between the expansion zones has been surprisingly limited ever since. We note that while there is no obvious need to introduce the "northern route" – from northeast Africa over Sinai to the Near East – to explain the initial colonization of Eurasia, the spread of some mtDNA and Y-chromosomal haplogroups implies that the "northern" passage might have been used in a later period [33, 34].
Page 11 of 25(page number not for citation purposes)
BMC Genetics 2004, 5:26 http://www.biomedcentral.com/1471-2156/5/26
Network of HVS-I haplotypes belonging to haplogroup M6Figure 6Network of HVS-I haplotypes belonging to haplogroup M6. Circle areas are proportional to haplotype frequencies. Variant bases of the HVS-I are numbered as in (Anderson et al. 1981) minus 16,000 and shown along links between haplotypes. Character changes are specified only for transversions. Underlined samples are those in which the diagnostic coding region markers (3537 and 5585) were assayed by either RFLP analysis (M6: -3537 AluI; M6b: -5584 AluI) or direct sequencing. Sample codes are as in Table 6 (see Additional file 1). Coalescence estimates marked with an asterisk are calculated excluding tribal populations (see Materials and Methods for explanation). The coalescence estimate marked with two asterisks is calculated without the data on tribal and scheduled caste (the Mukri) populations (see text for details).
Page 12 of 25(page number not for citation purposes)

BMC Genetics 2004, 5:26 http://www.biomedcentral.com/1471-2156/5/26
Lodha of West Bengal (Table 10, see Additional file 5)suggests a possible founder effect in this population. Thisexplains the nearly two-fold difference between thecoalescence estimates for this cluster calculated with andwithout the tribal data (Table 3).
The G to A transition at np 15928 has been spotted on dif-ferent branches (e. g. haplogroups T and M) of themtDNA phylogeny [3,36]. Quintana-Murci and col-leagues observed this transition within haplogroup M incombination with the HVS-I motif 16048-16129-16223-16390 [27]. None of the mtDNAs in our study which har-
A network of haplogroup M3a haplotypesFigure 7A network of haplogroup M3a haplotypes. Underlined samples are those in which the diagnostic coding region marker (4580) of M3a was assayed by either RFLP analysis (-4577 NlaIII) or direct sequencing. For other details, see the legend to Fig-ure 6.
Page 13 of 25(page number not for citation purposes)

BMC Genetics 2004, 5:26 http://www.biomedcentral.com/1471-2156/5/26
bor – or stem from – the 16048-16129-16223 motif werepositive for the 15928 transition, suggesting an additionaloccurrence. In addition, we recorded this transition asso-ciated with three other HVS-I motifs on the background ofhaplogroup M (M8-Z: 16185-16223-16260-16298; M*:16223 and M*: 16086-16223-16335). These occurrencescannot be monophyletic for obvious reasons. Yet, whencombined with the transition at np 16304, G15928Aroots a star-like subclade of haplogroup M that we tenta-tively named M25 (Figure 10). In this case, monophylec-ity is the most parsimonious assumption. Thishaplogroup is moderately frequent in Kerala and Mahar-ashtra but rather infrequent elsewhere in India (Figure 2,panel M25).
Coalescence estimates for these Indian-specific mtDNAhaplogroups (M3a, M4a, M6, M25 and R6) fall largelybetween 20,000 and 30,000 ybp. These estimates overlapwith those of many West Eurasian-specific (e.g. H, HV,preHV, U3, U4, K, X [9,34]) and East Eurasian-specific (A,F2, D4, M7c1, M7a1, M8a [7,22]) mtDNA clades, suggest-ing a rather synchronic worldwide demographic expan-
sion event in the late Pleistocene, during an interglacialperiod preceding the LGM.
Several Indian-specific mtDNA clades demonstrate a sim-ilar spread-pattern in southern India. We found haplo-groups M4a, M6a and M18 in southeastern Tamil Naduand Andhra Pradesh while they were absent from neigh-boring Karnataka and Kerala (Figure 1 panel M6a and Fig-ure 2 panels M4a and M18). One possible explanation isthat admixture has been facilitated along the coastlines ofthe Arabian Sea and the Bay of Bengal. On the other hand,because the absolute frequencies of these haplogroups arerather low, it cannot be ruled out that an increase of sam-ple sizes would disrupt the observed spread-pattern.
Were the Austro-Asiatic speaking tribal people the earliest inhabitants of India?By calculating nucleotide diversities and expansion times(using the method from [37]) for different linguisticgroups of India, some previous studies on mtDNA varia-tion have distinguished the Austro-Asiatic speaking tribalgroups as the carriers of the genetic legacy of the earliest
Network of HVS-I haplotypes belonging to haplogroup M4aFigure 8Network of HVS-I haplotypes belonging to haplogroup M4a. Underlined samples are those in which the diagnostic coding region marker (6620) of M4a was assayed by either RFLP analysis (+6618 MboI) or direct sequencing. For other details, see the legend to Figure 6.
Page 14 of 25(page number not for citation purposes)

BMC Genetics 2004, 5:26 http://www.biomedcentral.com/1471-2156/5/26
settlers of the subcontinent [17,38]. However, because thelinguistic groups of India do not cluster into distinctbranches of the Indian mtDNA tree [13,15,19], thisstudy], calculating the beginning of expansion for thosegroupings is problematic and likely controversial as well.
Recently, Basu et al. (2003) supported the conclusions of[17,38] by reporting that the frequency of the ancient hap-logroup M2 among the Austro-Asiatic tribal populationsis as high as 19%, and that they lack the slightly youngerhaplogroup M4 (the likely paraphyletic mother-clade ofM4a). The authors have regarded the HVS-I transition at
np 16319 as sufficient in defining haplogroup M2. Thisassumption, however, might lead to an overestimation ofM2 frequency and age. Indeed, the 16319 transition hasarisen several times on the background of other Indianhaplogroup M lineages (Table 7, see Additional file 2),more specifically, in mtDNAs lacking the coding regionmarkers that define M2 [15].
Although two out of the four M2 sequences reported byBasu et al. (2003) among the Lodha, Mundas and Santals(HVS-I sequences originally published by [17]) do harborthe characteristic M2a HVS-I motif (16223-16270-16274-
Network of HVS-I haplotypes belonging to haplogroup M18Figure 9Network of HVS-I haplotypes belonging to haplogroup M18. For other details, see the legend to Figure 6
Page 15 of 25(page number not for citation purposes)

BMC Genetics 2004, 5:26 http://www.biomedcentral.com/1471-2156/5/26
16319-16352), without information from the codingregion it is not clear whether the other two sequences(HVS-I motifs: 16092-16179-16223-16289-16294-16319and 16147G-16172-16223-16319) represent novel M2sub-clades (because these sequences cannot be affiliatedwith M2a or M2b) or derive from two independentbranches of haplogroup M where 16319 transition hasarisen recurrently. HVS-I motif 16147G-16172-16223, forexample, is commonly associated with haplogroup N1a.Since sequence data on the five M2s among the Austro-Asiatic speaking tribe Ho, reported by Basu et al. (2003),have not been made available in the publication, we can-not rely on their haplogroup classification. Thus, we areleft with one Munda and one Santal mtDNA belonging tohaplogroup M2. They make up just 5% of the Austro-Asi-atic tribal sample of 37 subjects (excluding the ten Ho).Interestingly, we found no instances of haplogroup M2among the 56 Lodhas analyzed in this study. Conse-quently, when excluding the recurrences of the 16319transition on the background of other sequence motifs,the frequency of M2 among the Austro-Asiatic speakingtribal groups from West Bengal in the combined dataset
(Table 7, see Additional file 2) is significantly reduced toabout 2%. The corrected value is comparable to the M2frequency (>3%) in tribal populations speaking Indo-European languages of Punjab and Uttar Pradesh, but issignificantly lower than its frequency (>14%) among theDravidic-speaking tribal groups of Andhra Pradesh (Table8, see Additional file 3).
Language families present today in India, such as Indo-European, Dravidic and Austro-Asiatic, are all muchyounger than the majority of indigenous mtDNA lineagesfound among their present-day speakers at high frequen-cies (see Additional file 9). It would make it highly specu-lative to infer, from the extant mtDNA pools of theirspeakers, whether one of the listed above linguisticallydefined group in India should be considered more "auto-chthonous" than any other in respect of its presence in thesubcontinent.
Additionally, we note that some recent linguistic andarchaeological evidence place the spread of the Austro-Asiatic languages in the Neolithic, in conjunction with the
Network of HVS-I haplotypes belonging to haplogroup M25Figure 10Network of HVS-I haplotypes belonging to haplogroup M25. Underlined samples are those in which the diagnostic coding region marker (15928) of M25 was assayed by either RFLP analysis (-15925 MspI) or direct sequencing. For other details, see the legend to Figure 6.
Page 16 of 25(page number not for citation purposes)
BMC Genetics 2004, 5:26 http://www.biomedcentral.com/1471-2156/5/26
dispersal of rice cultivation from the Yangtze River basin[39]. If this were the case, it would imply that the arrivalof this linguistic phylum in India was not associated withfemale gene flow.
Gene flow from West EurasiaBroadly, the average proportion of mtDNAs from WestEurasia among Indian caste populations is 17% (Table 2).In the western States of India and in Pakistan their shareis greater, reaching over 30% in Kashmir and Gujarat,nearly 40% in Indian Punjab, and peaking, expectedly, atapproximately 50% in Pakistan (Table 11, see Additionalfile 6, Figure 11, panel A). These frequencies demonstratea general decline (SAA p < 0.05 Figure 4) towards thesouth (23%, 11% and 15% in Maharashtra, Kerala and SriLanka, respectively) and even more so towards the east ofIndia (13% in Uttar Pradesh and around 7% in West Ben-gal and Bangladesh). The low (<3%) frequency of thewestern Eurasian mtDNAs in Rajasthan may be in part astatistical artifact due to the limited sample size of 35Rajputs.
In comparison to an overall frequency of 17% (CR 15.1–19.3%) among the caste populations, only 7% (CR 6.2 –9.0%) of the mtDNAs from the tribal groups showaffiliation to the West Eurasian haplogroups. Theobserved difference could be caused by differences in theextent of gene flow from the west to different social layersof the Indian society [19], and/or a more pronouncedgenetic drift among the tribal groups.
This western Eurasian contribution into the Indian mater-nal gene pool can be broadly divided into two differentcomponents. Over two thirds of the West Eurasian-spe-cific mtDNAs found in India are made up by haplogroupsHV, TJ, N1 and West Eurasian-specific branches of haplo-group U. It is likely that these mtDNA haplogroups havebeen carried to western India both by relatively low-inten-sity long-lasting admixture at the border regions as well asa consequence of numerous but probably limited migra-tions during the last 10, 000 ybp [13]. The remaining onethird of the West Eurasian-specific mtDNAs found inIndia is comprised of haplogroups U7, R2 and W showingmuch deeper time depths in India – approximately fortythousand years before present (Table 4). A large-scaleimmigration – carrying these haplogroups – could haveintroduced a substantial fraction of the diversity alreadypresent within the putative source areas. This wouldexplain the deep coalescence times of these haplogroupsin India, while their actual arrival could have occurredlater. Alternatively, the coalescence estimates may indeedreflect a deeper autochthonous history of these mtDNAclades in India. It is worthwhile to stress that while inIndia the share of U7, R2 and W in the West Eurasian-spe-
cific mtDNAs mounts to nearly a third, in Iran it staysbelow 15%.
Similarly to HV, TJ, N1, the spread of U7, W and R2 inIndia is geographically uneven – the three haplogroupsare much more frequent in the northwestern states (SAA p< 0.05, Figure 4). Together, they constitute nearly 14% ofthe maternal gene pool in Indian Punjab, Gujarat andRajasthan. Their frequency is also high in Iran (13%) andPakistan (10%) but declines in Central Asia (5%).
Although haplogroup W is not highly frequent in Euro-pean populations, it is nevertheless quite common [9],reaching the highest frequencies among the central-north-ern Finns (9% [40]). Yet, it is virtually absent from theFinno-Ugric speaking populations of the Volga basin [41].In Central Asia the frequency of haplogroup W staysbelow 2%.
Many European populations are lacking haplogroup U7[9], but its frequency climbs over 4% in the Near East andup to 5% in Pakistan, reaching nearly 10% level in Irani-ans (Table 9, see Additional file 4). In India, haplogroupU7 frequency peaks at over 12% in Gujarat, in the west-ernmost state of India, while for the whole of India its fre-quency stays around 2%. Expansion times and haplotypediversities for the Indian and Near and Middle Eastern U7mtDNAs are strikingly similar (Table 4). The possiblehomeland of this haplogroup spans likely in Gujarat andIran because from there its frequency declines steeplyboth to the east and to the west. If the origin were in Iranrather than in India, then its equally high frequency aswell as diversity in Gujarat favors a scenario whereby U7has been introduced to the coastal western India eithervery early, or by multiple founders. Notably, the overlapof the Indian and Iranian lineages is largely restricted tothe ancestral nodes while the coalescence age estimates forthe nearly exclusively Indian (16207-16309-16318T) andWest Eurasian (16126-16309-16318T) founder HVS-Imotifs both yield time depths of about 20,000 to 30,000ybp.
Haplogroup R2 appears at low frequencies in Near andMiddle East and India and is virtually absent elsewhere.The spread of haplogroup R2 in Europe is restricted to afew populations in the Volga basin where it is representedby nodal haplotypes and by a region-specific subcladecharacterized by the HVS-I motif 16037–16172 [41]. Thecoalescence estimate of this sub-clade is 11,400 ± 9,000ybp. However, its wide error range prevents us from draw-ing any firm conclusions.
To summarize, the West and South Asian phylogeographyof haplogroups W, U7 and R2 can be viewed as a geneticcontinuum that spans from the Near East into India,
Page 17 of 25(page number not for citation purposes)
BMC Genetics 2004, 5:26 http://www.biomedcentral.com/1471-2156/5/26
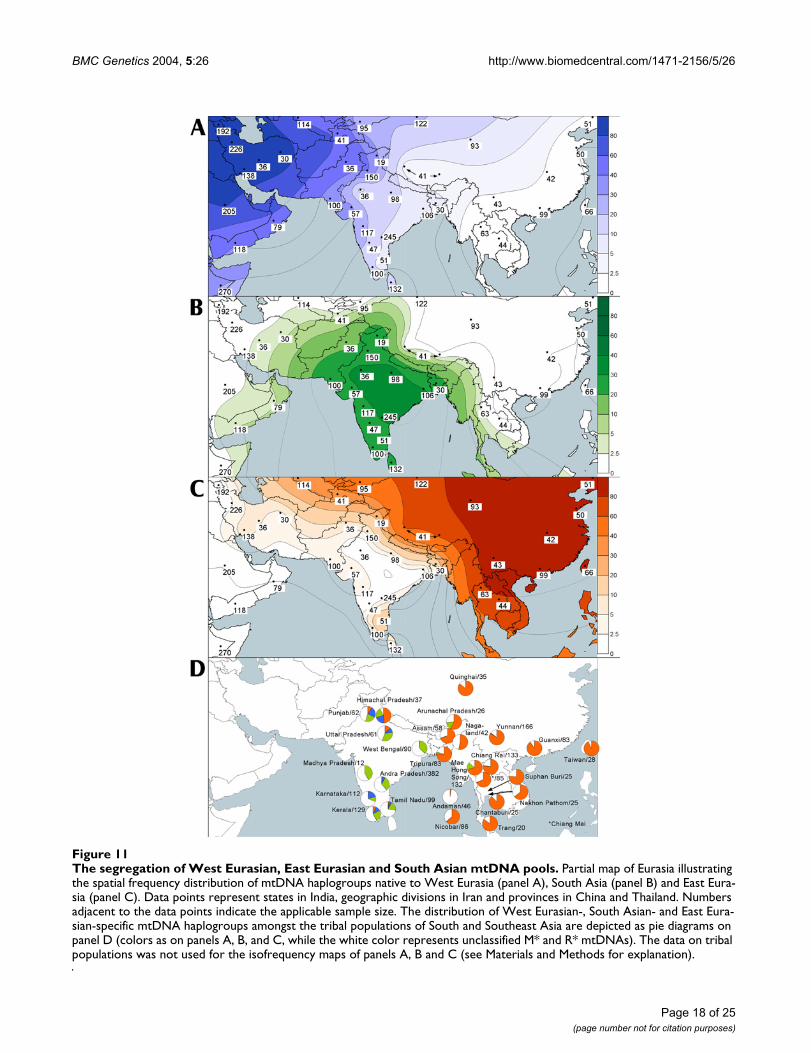
The segregation of West Eurasian, East Eurasian and South Asian mtDNA poolsFigure 11The segregation of West Eurasian, East Eurasian and South Asian mtDNA pools. Partial map of Eurasia illustrating the spatial frequency distribution of mtDNA haplogroups native to West Eurasia (panel A), South Asia (panel B) and East Eura-sia (panel C). Data points represent states in India, geographic divisions in Iran and provinces in China and Thailand. Numbers adjacent to the data points indicate the applicable sample size. The distribution of West Eurasian-, South Asian- and East Eura-sian-specific mtDNA haplogroups amongst the tribal populations of South and Southeast Asia are depicted as pie diagrams on panel D (colors as on panels A, B, and C, while the white color represents unclassified M* and R* mtDNAs). The data on tribal populations was not used for the isofrequency maps of panels A, B and C (see Materials and Methods for explanation).
Page 18 of 25(page number not for citation purposes)
BMC Genetics 2004, 5:26 http://www.biomedcentral.com/1471-2156/5/26
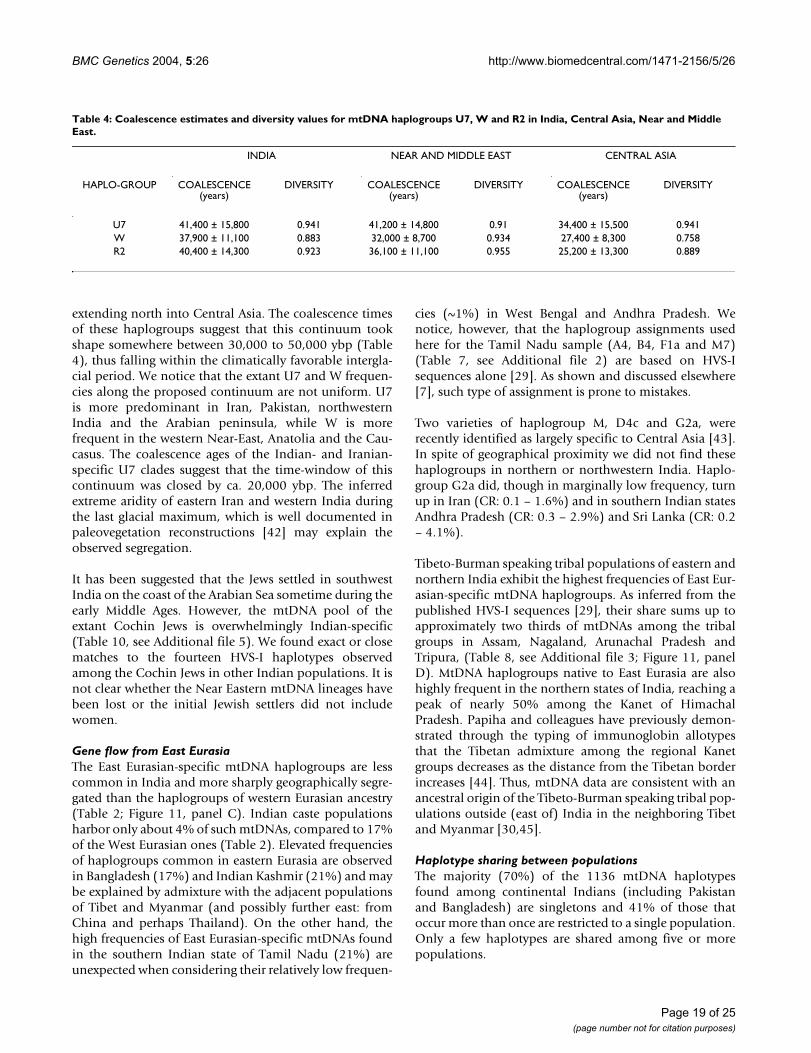
extending north into Central Asia. The coalescence timesof these haplogroups suggest that this continuum tookshape somewhere between 30,000 to 50,000 ybp (Table4), thus falling within the climatically favorable intergla-cial period. We notice that the extant U7 and W frequen-cies along the proposed continuum are not uniform. U7is more predominant in Iran, Pakistan, northwesternIndia and the Arabian peninsula, while W is morefrequent in the western Near-East, Anatolia and the Cau-casus. The coalescence ages of the Indian- and Iranian-specific U7 clades suggest that the time-window of thiscontinuum was closed by ca. 20,000 ybp. The inferredextreme aridity of eastern Iran and western India duringthe last glacial maximum, which is well documented inpaleovegetation reconstructions [42] may explain theobserved segregation.
It has been suggested that the Jews settled in southwestIndia on the coast of the Arabian Sea sometime during theearly Middle Ages. However, the mtDNA pool of theextant Cochin Jews is overwhelmingly Indian-specific(Table 10, see Additional file 5). We found exact or closematches to the fourteen HVS-I haplotypes observedamong the Cochin Jews in other Indian populations. It isnot clear whether the Near Eastern mtDNA lineages havebeen lost or the initial Jewish settlers did not includewomen.
Gene flow from East EurasiaThe East Eurasian-specific mtDNA haplogroups are lesscommon in India and more sharply geographically segre-gated than the haplogroups of western Eurasian ancestry(Table 2; Figure 11, panel C). Indian caste populationsharbor only about 4% of such mtDNAs, compared to 17%of the West Eurasian ones (Table 2). Elevated frequenciesof haplogroups common in eastern Eurasia are observedin Bangladesh (17%) and Indian Kashmir (21%) and maybe explained by admixture with the adjacent populationsof Tibet and Myanmar (and possibly further east: fromChina and perhaps Thailand). On the other hand, thehigh frequencies of East Eurasian-specific mtDNAs foundin the southern Indian state of Tamil Nadu (21%) areunexpected when considering their relatively low frequen-
cies (~1%) in West Bengal and Andhra Pradesh. Wenotice, however, that the haplogroup assignments usedhere for the Tamil Nadu sample (A4, B4, F1a and M7)(Table 7, see Additional file 2) are based on HVS-Isequences alone [29]. As shown and discussed elsewhere[7], such type of assignment is prone to mistakes.
Two varieties of haplogroup M, D4c and G2a, wererecently identified as largely specific to Central Asia [43].In spite of geographical proximity we did not find thesehaplogroups in northern or northwestern India. Haplo-group G2a did, though in marginally low frequency, turnup in Iran (CR: 0.1 – 1.6%) and in southern Indian statesAndhra Pradesh (CR: 0.3 – 2.9%) and Sri Lanka (CR: 0.2– 4.1%).
Tibeto-Burman speaking tribal populations of eastern andnorthern India exhibit the highest frequencies of East Eur-asian-specific mtDNA haplogroups. As inferred from thepublished HVS-I sequences [29], their share sums up toapproximately two thirds of mtDNAs among the tribalgroups in Assam, Nagaland, Arunachal Pradesh andTripura, (Table 8, see Additional file 3; Figure 11, panelD). MtDNA haplogroups native to East Eurasia are alsohighly frequent in the northern states of India, reaching apeak of nearly 50% among the Kanet of HimachalPradesh. Papiha and colleagues have previously demon-strated through the typing of immunoglobin allotypesthat the Tibetan admixture among the regional Kanetgroups decreases as the distance from the Tibetan borderincreases [44]. Thus, mtDNA data are consistent with anancestral origin of the Tibeto-Burman speaking tribal pop-ulations outside (east of) India in the neighboring Tibetand Myanmar [30,45].
Haplotype sharing between populationsThe majority (70%) of the 1136 mtDNA haplotypesfound among continental Indians (including Pakistanand Bangladesh) are singletons and 41% of those thatoccur more than once are restricted to a single population.Only a few haplotypes are shared among five or morepopulations.
Table 4: Coalescence estimates and diversity values for mtDNA haplogroups U7, W and R2 in India, Central Asia, Near and Middle East.
INDIA NEAR AND MIDDLE EAST CENTRAL ASIA
HAPLO-GROUP COALESCENCE (years)
DIVERSITY COALESCENCE (years)
DIVERSITY COALESCENCE (years)
DIVERSITY
U7 41,400 ± 15,800 0.941 41,200 ± 14,800 0.91 34,400 ± 15,500 0.941W 37,900 ± 11,100 0.883 32,000 ± 8,700 0.934 27,400 ± 8,300 0.758R2 40,400 ± 14,300 0.923 36,100 ± 11,100 0.955 25,200 ± 13,300 0.889
Page 19 of 25(page number not for citation purposes)
BMC Genetics 2004, 5:26 http://www.biomedcentral.com/1471-2156/5/26
The number of shared haplotypes between pairs of social,linguistic and geographic groups of Indian populations isslightly (but in most cases insignificantly) lower than thatbetween random groups of Indian populations taken forreference (see Materials and Methods). Where the declineof shared haplotypes is significant relative to the refer-ence, it is most probably caused by large differences in thesample sizes of the groups under comparison (Table 5).
An alternative method that assesses the degree of haplo-type sharing between populations is to investigate thecombined frequency of the shared haplotypes in two pop-ulation groups. Thus, amongst the northern and thesouthern population groups the combined frequency ofthe haplotypes present also in the other group issignificantly lower than that which we observed in thecase of random groups. This is not surprising becauseWest Eurasian-specific mtDNA haplogroups are ratherfrequent in northwest India. Because the Indo-Europeanand the Dravidic speakers of India are largely concen-trated to the northern and southern parts of the subconti-nent, respectively, the differences arising from geographicdivision of the Indian populations also correspond tothese linguistic groupings (Table 5).
ConclusionsThree Indian-specific haplogroups, M2, U2i and R5,which encompass about 15% of the Indian mtDNA pool,exhibit equally deep coalescence ages of about 50,000 –70,000 years. Thus, their spread can be associated with theinitial peopling of South Asia.
Haplogroups U7, W and R2 harbor a number of similartraits. Their overlapping geographic distributions and coa-lescence times suggest some degree of genetic continuumin the area spanning from the Near and Middle Eastthrough northwest India and reaching north into CentralAsia. The coalescence estimates for these haplogroups areequally deep (around 30,000 – 50,000 years) in these dif-ferent regions. That may be a result of either relativelymore recent albeit large in scale migrations that broughtalong most of the diversity or may indeed reflect theregion-specific expansions of these haplogroups. Theformer explanation could be ruled out since it is impossi-ble to envisage a substantial movement of mtDNAs fromSouth Asia that would not include haplogroup M. Thesame is true for the opposite – the share of U7, W and R2within the West Eurasian-specific mtDNA haplogroups istwo-fold higher in India than it is in Iran. Moreover, theSouth- and West Asian-specific sub-branches of haplo-group U7 predate the last glacial maximum. Therefore,deep autochthonous history of these haplogroups in theregion remains to be the most parsimonious explanation.
Through the use of mtDNA coding region markers, wewere able to classify altogether a quarter of the Indian Mand R mtDNAs into a number of Indian-specific mtDNAhaplogroups, four of which we newly identified. Severalof these are characterized by clear patterns in their geo-graphic distribution and/or different frequencies amongdifferent socio-cultural groups of India. Additional effortsshould be undertaken to identify new coding regionmarkers in order to further improve the classification ofIndian mtDNAs. Indeed, much of the information is stillhidden by the poor resolution of the Indian mtDNA treeand further piling of HVS-I datasets would add little todeepen our understanding of the demographic history ofSouth and Southwest Asia.
We found that haplogroup M frequency drops abruptlyfrom about 60% in India to about 5% in Iran, marking thewestern border of the haplogroup M distribution. A simi-larly sharp border cuts the distribution of Indian-specificmtDNA haplogroups to the east and to the north of thesubcontinent. We therefore propose that the initialmtDNA pool established upon the peopling of South Asiahas not been replaced but has rather been reshaped in situby major demographic episodes in the past and garnishedby relatively minor events of gene flow both from theWest and the East during more recent chapters of thedemographic history in the region.
MethodsSubjectsMtDNA sequence variation in a total of 796 Indian sam-ples most of which are held in a collection at NewcastleUniversity [46] was analyzed. The samples cover a widegeographical range that spans from Himachal Pradesh inthe north, Sri Lanka in the south, West Bengal in the eastand Gujarat in the west (Table 1).
Tribal populations constitute 15% of the total samplesize. The Lodha (n = 56) live mostly in the western part ofMidnapore district of West Bengal where they are alsoknown as Kheria or Kharia. Their total population sizewas ~59000 according to the 1981 census. Their languagebelongs to the Mundari branch of the Austro-Asiatic lan-guage family [47]. The Kanet (n = 37) make up two thirdsof the ~50000 inhabitants of the Kinnaur district inHimachal Pradesh [48]. Their language belongs to theHimalayan group of the Tibeto-Burman language family[47]. Five Bhoksa and twenty-six Tharu individuals wereincluded in the present study in addition to those fromthe same populations that we have previously reported[13]. Most of the Tharu live in the Terai areas (a belt ofmarshy land at the foot of the Himalayas) of Nepal (n =720000). Approximately 96000 reside in Uttar Pradeshand Uttaranchal, Indian states adjacent to Nepal. Around32000 Bhoksas live in the lowland areas of Uttaranchal
Page 20 of 25(page number not for citation purposes)

BMC Genetics 2004, 5:26 http://www.biomedcentral.com/1471-2156/5/26
and the neighboring Bijnor district of Uttar Pradesh. Boththese tribal groups speak languages belonging to the Indo-European phylum [47].
The non-tribal Indian samples analyzed contained 105West Bengalis of different caste rank, 58 KonkanasthaBrahmins from Bombay, 53 Gujaratis, 50 Moors and 82Sinhalese from Sri Lanka, 109 Punjabis of different casterank from the Punjab, 25 Brahmins from Uttar Pradesh,35 Rajputs from Rajasthan, 55 Parsees from Maharashtraand 100 subjects from Cochin, Kerala (including 45 Jewswho have moved to Israel) (Table 1).
The Iranian sample of 436 individuals was collected indifferent locations mainly from southwestern and north-western Iran (Table 1).
The new Indian mtDNA sequence data was combinedwith that previously published on Indian populations[3,13,15,17,18,29,35,49-51] to produce a pooled dataset(n = 2572) in which the tribal populations constituteslightly over 50% (Table 6, see Additional file 1). Byincluding also the data on Iranian and published data onPakistani [13,27,29], Bangladeshi [29], Chinese [7,22,52-54] and Thai [53,55,56] populations (n = 145, 29, 919and 552, respectively), a dataset of over 4600 samplesspanning from West to East Asia (Table 6 and 7, see Addi-tional files 1 and 2) was obtained. In many cases thepublished data was reanalyzed. Analogy with the newlyobtained HVS-I motifs, that were classified into haplo-groups using diagnostic markers of the mtDNA codingregion, served as basis for haplogroup assignments of thepublished HVS-I sequences.
An even wider range of data was used for the productionof the isofrequency maps: the published data from Arme-nia (n = 192) [32] and Kyrgyz (n = 95) [57], and theunpublished data from Yemen (n = 118), Oman (n = 79),Saudi Arabia (n = 205), Ethiopia (n = 270), Uzbekistan (n= 114) and Tajikistan (n = 41). Further details about themtDNA variation of these populations will be publishedelsewhere.
MtDNA molecular analysesDNA was extracted using standard phenol-chloroformmethods [58]. The hypervariable segment (HVS)-I(between nucleotide positions (np) 16024–16400) of thecontrol region was sequenced in all the 796 Indian and436 Iranian samples. Preparation of sequencing templateswas carried out following Kaessmann et al. [59]. Purifiedproducts were sequenced with the DYEnamic™ ET termi-nator cycle sequencing kit (Amersham Pharmacia Bio-tech) and analyzed on ABI 377 DNA or Megabace2000Sequencers. Sequences were aligned and analyzed withthe Wisconsin Package (GCG). In addition, informativemtDNA coding region positions [3,11,27] were assayed(Table 7, see Additional file 2) in selected individualsfrom different HVS-I haplotypes to determine haplogroupaffiliations.
Data analysisMedian networks [60,61] were constructed using Network3.111 and Network 2.10B programs [62] with default set-tings (r = 2; ε = 0). MtDNA coding region markers weregiven five times the weight of the HVS-I positions.Coalescence of mtDNA haplogroups and sub-haplo-groups was calculated using ρ (the averaged distance to a
Table 5: Proportion of mtDNA haplotype sharing between population groups of South Asia
Group 1 Group 2
pop. group n nb 1/2d pop. group n nb 2/1e nc
Random 1g 1256 ± 215 617 ± 109 .399 – .453 Random 2g 1426 ± 215 643 ± 114 .396 – .447 132 (112 – 154)Tribals 1197 437 .411 – .467 Castes 1485 806 .324 – .372 107 (90 – 128)
Northern states 1204 647 .277 – .329 Southern states 1478 585 .345 – .394 96 (80 – 116)Western states 1142 508 .453 – .511 Eastern states 1540 735 .331 – .379 107 (90 – 128)
Dravidians 974 380 .428 – 490 Others 1708 846 .273 – .317 90 (74 – 109)Indo-Europeans 1322 686 .328 – .379 Others 1360 556 .393 – .446 106 (89 – 127)
AA tribals 90 35 .552 – .746 Others 2592 1110 .014 – .025 9 (5 – 17)TB tribals 249 142 .174 – .277 Others 2433 1018 .091 – .115 24 (16 – 35)
Indo-Europeans 1322 686 .295 – .346 Dravidians 974 380 .425 – .487 87 (71 – 106)Total 2682 1136 340 f
a continental Indians including Pakistan and Bangladesh (excluding Andaman & Nicobar)b number of haplotypesc number of shared haplotypes between group 1 and group 2 (95% credible regions; CR)d CR of the proportion of those haplotypes in group 1 that occur also in group 2e CR of the proportion of those haplotypes in group 2 that occur also in group 1f 41% of the shared haplotypes are shared only between members of the same populationg ± indicate SD
Page 21 of 25(page number not for citation purposes)

BMC Genetics 2004, 5:26 http://www.biomedcentral.com/1471-2156/5/26
specified founder haplotype) and a mutation rate of onetransition per 20,180 years between nps 16090–16365[63]. Standard errors for coalescence estimates and effi-ciency of a sample for coalescence time calculation (ρ/nδ2) were calculated following [64]. Coalescence timeswere further calculated with the exclusion of tribal popu-lations sequences, yet preserving the cluster topology(coalescence times marked with an asterisk). A moreintense genetic drift (particularly founder effects) couldintroduce a bias into the coalescence time calculation (forexample, see below the coalescence time of haplogroupM18 with and without the Lodha sample).
The software kindly provided by Vincent Macaulay wasadopted in order to calculate the 95% credible regions(CR) from the posterior distribution of the proportion ofa haplogroup/sub-haplogroup in the population.
Haplotype diversity was estimated as
where n is the number of sequences, k the number of dis-tinct haplotypes, and ni number of sequences with onedistinct haplotype.
Haplogroup isofrequency maps were generated using theKriging method in Surfer 7 program of Golden Software.Haplogroup frequencies were averaged over populationsfrom the same state in India, provinces in China and Thai-land and geographic divisions in Iran. The data points forKriging are shown as black dots, while the sample sizeapplicable to the data point is given adjacent to the dot. Inrelatively small and isolated groups (e.g. tribal groups)random genetic drift might seriously affect the haplo-group frequencies, which may become uninformativewhen a whole region (e.g. state) is considered (e.g. M18among the Lodha, see below). Therefore, the tribal datawere excluded from the haplogroup isofrequency mapscalculation. When illustrating the spread of mtDNA hap-logroups native to West Eurasia, East Eurasia and India(Figure 11, panel D) we present these data as pie dia-grams. The respective sample size and origin are indicatedadjacent to the diagrams.
Spatial autocorrelation analysis was done using the PAS-SAGE software packet [65,66]. The correlograms ofMoran's I autocorrelation coefficient were calculatedusing binary weight matrix with five distance classes. Dataon tribal populations was not used (see previous para-graph for explanation).
Haplogroup frequencies based admixture proportionswere calculated using the ADMIX 2.0 software [67].
Haplotypes were defined as the HVS-I motif combinedwith the haplogroup label for haplotype analysis. In thisway it was possible to discriminate between mtDNAs withidentical HVS-I motifs but otherwise known to belong todifferent haplogroups (e.g. sequences with the CRS motifin HVS-I belonging to haplogroups H or R). In order toassess the results of haplotype sharing analysis betweenpopulation groups (e.g. tribal and caste populations) wedivided the Indian populations ten times randomly intotwo sets and analyzed the level of haplotype sharingbetween these sets.
Authors' contributionsSM and SSP collected most of the Indian samples (in1970's) and have been keeping the collection in Newcas-tle University, United Kingdom. MM, TK, GH and KK car-ried out the RFLP analysis and mtDNA sequencing of themajority of the Indian samples. EM, JP, PS and MK carriedout the RFLP analysis and mtDNA sequencing of the Ira-nian samples. DMB collected the DNA and analyzedmtDNA variation amongst the Indian samples fromCochin and the Cochin Jews collected (the latter) in Israelunder supervision of KS, who also contributed to the edit-ing of the manuscript. AT provided some critical newinformation and, in addition to KS, MTPG and PE,engaged into valuable discussions during manuscriptpreparation. MM did most of the phylogenetic analysisand was in charge of manuscript writing while TK and RVcontributed significantly during both stages and wereresponsible for conceiving and designing the study. Allauthors read and approved the final manuscript.
Additional material
Dn
n
n
ni i
ik= −
−−
=∑1
1
11,
Additional File 3Table 8. Excel spreadsheet. MtDNA haplogroup frequencies among tribal populations. Frequencies of mtDNA haplogroups amongst the tribal pop-ulations of India, China and Thailand as averaged over states of India and provinces in China and Thailand.Click here for file[http://www.biomedcentral.com/content/supplementary/1471-2156-5-26-S3.xls]
Additional File 7Table 12. Excel spreadsheet. Comparison of the mtDNA haplogroup fre-quencies amongst the Indian caste and tribal populations.Click here for file[http://www.biomedcentral.com/content/supplementary/1471-2156-5-26-S7.xls]
Additional File 4Table 9. Excel spreadsheet. MtDNA haplogroup frequencies in India and Iran.Click here for file[http://www.biomedcentral.com/content/supplementary/1471-2156-5-26-S4.xls]
Page 22 of 25(page number not for citation purposes)

BMC Genetics 2004, 5:26 http://www.biomedcentral.com/1471-2156/5/26
AcknowledgmentsWe thank Lluis Quintana-Murci for providing data prior to publication, Vin-cent Macaulay for the algorithm for calculating credible regions for haplo-group frequencies, and Jaan Lind and Hille Hilpus for technical assistance.
This work was supported by Estonian Science Foundation grants 514 (to RV), 5574 (to TK), 5807 (to EM), the Italian Ministry of the University: Pro-getti Ricerca Interesse Nazionale 2002 and 2003 (to AT), and European Commission grants ICA1CT20070006 and QLG2-CT-2002-90455 (to RV).
References1. Torroni A, Miller JA, Moore LG, Zamudio S, Zhuang J, Droma T, Wal-
lace DC: Mitochondrial DNA analysis in Tibet: implicationsfor the origin of the Tibetan population and its adaptation tohigh altitude. Am J Phys Anthropol 1994, 93(2):189-199.
2. Chen YS, Torroni A, Excoffier L, Santachiara-Benerecetti AS, WallaceDC: Analysis of mtDNA variation in African populationsreveals the most ancient of all human continent-specifichaplogroups. Am J Hum Genet 1995, 57(1):133-149.
3. Quintana-Murci L, Semino O, Bandelt H-J, Passarino G, McElreavey K,Santachiara-Benerecetti AS: Genetic evidence of an early exit ofHomo sapiens sapiens from Africa through eastern Africa.Nat Genet 1999, 23(4):437-441.
4. Alves-Silva J, da Silva Santos M, Guimarães PE, Ferreira AC, BandeltH-J, Pena SD, Prado VF: The ancestry of Brazilian mtDNAlineages. Am J Hum Genet 2000, 67(2):444-461.
5. Torroni A, Schurr TG, Cabell MF, Brown MD, Neel JV, Larsen M,Smith DG, Vullo CM, Wallace DC: Asian affinities and continen-tal radiation of the four founding Native American mtDNAs.Am J Hum Genet 1993, 53(3):563-590.
6. Schurr TG, Sukernik RI, Starikovskaya YB, Wallace DC: Mitochon-drial DNA variation in Koryaks and Itel'men: populationreplacement in the Okhotsk Sea-Bering Sea region duringthe Neolithic. Am J Phys Anthropol 1999, 108(1):1-39.
7. Kivisild T, Tolk H-V, Parik J, Wang Y, Papiha SS, Bandelt H-J, VillemsR: The emerging limbs and twigs of the East Asian mtDNAtree. Mol Biol Evol 2002, 19(10):1737-1751.
8. Kivisild T, Kaldma K, Metspalu M, Parik J, Papiha SS, Villems R: Theplace of the Indian mitochondrial DNA variants in the globalnetwork of maternal lineages and the peopling of the OldWorld. In: Genomic Diversity Edited by: Papiha SS, Deka R,Chakraborty R. Kluwer Academic/Plenum Publishers; 1999:135-152.
9. Richards M, Macaulay V, Hickey E, Vega E, Sykes B, Guida V, Rengo C,Sellitto D, Cruciani F, Kivisild T, et al.: Tracing European founderlineages in the Near Eastern mtDNA pool. Am J Hum Genet2000, 67(5):1251-1276.
10. Derbeneva OA, Starikovskaia EB, Volod'ko NV, Wallace DC, Suke-rnik RI: [Mitochondrial DNA variation in Kets and Nganasansand the early peoples of Northern Eurasia]. Genetika 2002,38(11):1554-1560.
11. Macaulay VA, Richards MB, Hickey E, Vega E, Cruciani F, Guida V,Scozzari R, Bonné-Tamir B, Sykes B, Torroni A: The emerging treeof West Eurasian mtDNAs: a synthesis of control-regionsequences and RFLPs. Am J Hum Genet 1999, 64(1):232-249.
12. Ballinger SW, Schurr TG, Torroni A, Gan YY, Hodge JA, Hassan K,Chen KH, Wallace DC: Southeast Asian mitochondrial DNAanalysis reveals genetic continuity of ancient mongoloidmigrations. Genetics 1992, 130(1):139-152.
13. Kivisild T, Bamshad MJ, Kaldma K, Metspalu M, Metspalu E, Reidla M,Laos S, Parik J, Watkins WS, Dixon ME, et al.: Deep commonancestry of Indian and western-Eurasian mitochondrial DNAlineages. Curr Biol 1999, 9(22):1331-1334.
14. Kivisild T, Papiha SS, Rootsi S, Parik J, Kaldma K, Reidla M, Laos S,Metspalu M, Pielberg G, Adojaan M, et al.: An Indian Ancestry: akey for understanding human diversity in Europe andbeyond. In: Archaeogenetics: DNA and the population prehistory ofEurope Edited by: Renfrew C, Boyle K. Cambridge: McDonald Insti-tute for Archaeological Research University of Cambridge;2000:267-279.
15. Kivisild T, Rootsi S, Metspalu M, Mastana S, Kaldma K, Parik J, Met-spalu E, Adojaan M, Tolk H-V, Stepanov V, et al.: The genetic her-itage of the earliest settlers persists both in Indian tribal andcaste populations. Am J Hum Genet 2003, 72:313-332.
16. Roychoudhury S, Roy S, Dey B, Chakraborty M, Roy M, Roy B,Ramesh A, Prabhakaran N, Rani MVU, Vishwanathan HMM, et al.:Fundamental genomic unity of ethnic India is revealed byanalysis of mitochondrial DNA. Current Science 2000,79(9):1182-1192.
17. Roychoudhury S, Roy S, Basu A, Banerjee R, Vishwanathan H, UshaRani MV, Sil SK, Mitra M, Majumder PP: Genomic structures and
Additional File 6Table 11. Excel spreadsheet. Frequencies of mtDNA haplogroups amongst the Indian caste populations as averaged over states of India.Click here for file[http://www.biomedcentral.com/content/supplementary/1471-2156-5-26-S6.xls]
Additional File 8Figure 12. Image file in PNG format. Network of HVS-I haplotypes belonging to haplogroup R5. Circle areas are proportional to haplotype fre-quencies. Variant bases of the HVS-I are numbered as in (Anderson et al. 1981) minus 16,000 and shown along links between haplotypes. The diagnostic R5 coding region marker 8594 is shown in bold and numbered as in (Anderson et al. 1981). Character changes are specified only for transversions. Underlined samples are those in which the marker 8594 was assayed by either RFLP analysis (-8592 MboI) or direct sequencing. Sample codes are as in Table 6 (see Additional file 1). Coalescence esti-mates marked with an asterisk are calculated excluding tribal populations (see Materials and Methods for explanation).Click here for file[http://www.biomedcentral.com/content/supplementary/1471-2156-5-26-S8.jpeg]
Additional File 5Table 10. Excel spreadsheet. Frequencies of mtDNA haplogroups amongst the Indian populations.Click here for file[http://www.biomedcentral.com/content/supplementary/1471-2156-5-26-S5.xls]
Additional File 2Table 7. Excel spreadsheet. MtDNA variation in the studied populations (raw data). MtDNA control and coding region variation in the popula-tions that were used in the study. The database includes both the newly obtained datasets and the previously published datasets. The latter were in many cases reanalyzed both in silico and by typing for additional mtDNA coding region markers.Click here for file[http://www.biomedcentral.com/content/supplementary/1471-2156-5-26-S2.xls]
Additional File 1Table 6. Excel spreadsheet. The list of studied populations. List and details of the populations whose mtDNA were used in the study. This includes both newly obtained datasets and previously published datasetsClick here for file[http://www.biomedcentral.com/content/supplementary/1471-2156-5-26-S1.xls]
Additional File 9Table 13. Excel spreadsheet. Frequencies of mtDNA haplogroups amongst different linguistic groupings of Indian populations.Click here for file[http://www.biomedcentral.com/content/supplementary/1471-2156-5-26-S9.xls]
Page 23 of 25(page number not for citation purposes)
BMC Genetics 2004, 5:26 http://www.biomedcentral.com/1471-2156/5/26
population histories of linguistically distinct tribal groups ofIndia. Hum Genet 2001, 109(3):339-350.
18. Bamshad MJ, Watkins WS, Dixon ME, Jorde LB, Rao BB, Naidu JM,Prasad BV, Rasanayagam A, Hammer MF: Female gene flow strat-ifies Hindu castes. Nature 1998, 395(6703):651-652.
19. Bamshad M, Kivisild T, Watkins WS, Dixon ME, Ricker CE, Rao BB,Naidu JM, Prasad BV, Reddy PG, Rasanayagam A, et al.: Genetic evi-dence on the origins of Indian caste populations. Genome Res2001, 11(6):994-1004.
20. Passarino G, Semino O, Bernini LF, Santachiara-Benerecetti AS: Pre-Caucasoid and Caucasoid genetic features of the Indian pop-ulation, revealed by mtDNA polymorphisms. Am J Hum Genet1996, 59(4):927-934.
21. Basu A, Mukherjee N, Roy S, Sengupta S, Banerjee S, Chakraborty M,Dey B, Roy M, Roy B, Bhattacharyya N, et al.: Ethnic India: agenomic view, with special reference to peopling andstructure. Genome Res 2003, 13(10):2277-2290.
22. Yao YG, Kong QP, Bandelt HJ, Kivisild T, Zhang YP: Phylogeo-graphic differentiation of mitochondrial DNA in HanChinese. Am J Hum Genet 2002, 70(3):635-651.
23. Kong QP, Yao YG, Sun C, Bandelt HJ, Zhu CL, Zhang YP: Phylogenyof East Asian mitochondrial DNA lineages inferred fromcomplete sequences. Am J Hum Genet 2003, 73(3):671-676.
24. Passarino G, Semino O, Quintana-Murci L, Excoffier L, Hammer M,Santachiara-Benerecetti AS: Different genetic components inthe Ethiopian population, identified by mtDNA and Y-chro-mosome polymorphisms. Am J Hum Genet 1998, 62(2):420-434.
25. Hasegawa M, Di Rienzo A, Kocher TD, Wilson AC: Toward a moreaccurate time scale for the human mitochondrial DNA tree.J Mol Evol 1993, 37(4):347-354.
26. Wakeley J: Substitution rate variation among sites in hyper-variable region 1 of human mitochondrial DNA. J Mol Evol1993, 37(6):613-623.
27. Quintana-Murci L, Chaix R, Wells S, Behar D, Sayar H, Scozzari R,Rengo C, Al-Zahery N, Semino O, Santachiara-Benerecetti A, et al.:Where West meets East: The complex mtDNA landscape ofthe Southwest and Central Asian corridor. Am J Hum Genet2004, 74:827-845.
28. Kivisild T, Rootsi S, Metspalu M, Metspalu E, Parik J, Kaldma K, UsangaE, Mastana S, Papiha S, Villems R: The Genetics of Language andFarming Spread in India. In: Examining the farming/language disper-sal hypothesis Edited by: Bellwood P, Renfrew C. Cambridge: TheMcDonald Institute for Archaeological Research; 2003:215-222.
29. Cordaux R, Saha N, Bentley G, Aunger R, Sirajuddin S, Stoneking M:Mitochondrial DNA analysis reveals diverse histories oftribal populations from India. Eur J Hum Genet 2003, 3:253-264.
30. Guha B: The racial affinities of the people of India. In: Census ofIndia, 1931, Part III Ethnographical Simla: Government of India Press;1935.
31. Richards M, Rengo C, Cruciani F, Gratrix F, Wilson J, Scozzari R,Macaulay V, Torroni A: Extensive female-mediated gene flowfrom sub-Saharan Africa into near eastern Arab populations.Am J Hum Genet 2003, 72(4):1058-1064.
32. Tambets K, Kivisild T, Metspalu E, Parik J, Kaldma K, Laos S, Tolk H-V, Gölge M, Demirtas H, Geberhiwot T, et al.: The topology of thematernal lineages of the Anatolian and Trans-Caucasus pop-ulations and the peopling of the Europe: some preliminaryconsiderations. In: Archaeogenetics: DNA and the population prehistoryof Europe Edited by: Renfrew C, Boyle K. Cambridge: Cambridge Uni-versity Press; 2000:219-235.
33. Underhill PA, Passarino G, Lin AA, Shen P, Mirazon Lahr M, Foley R,Oefner PJ, Cavalli-Sforza LL: The phylogeography of Y chromo-some binary haplotypes and the origins of modern humanpopulations. Ann Hum Genet 2001, 65(1):43-62.
34. Reidla M, Kivisild T, Metspalu E, Kaldma K, Tambets K, Tolk H, ParikJ, Loogvali E, Derenko M, Malyarchuk B, et al.: Origin and Diffusionof mtDNA Haplogroup X. Am J Hum Genet 2003,73(6):1178-1190.
35. Mountain JL, Hebert JM, Bhattacharyya S, Underhill PA, Ottolenghi C,Gadgil M, Cavalli-Sforza LL: Demographic history of India andmtDNA-sequence diversity. Am J Hum Genet 1995,56(4):979-992.
36. Herrnstadt C, Elson JL, Fahy E, Preston G, Turnbull DM, Anderson C,Ghosh SS, Olefsky JM, Beal MF, Davis RE, et al.: Reduced-median-network analysis of complete mitochondrial DNA coding-
region sequences for the major African, Asian, and Europeanhaplogroups. Am J Hum Genet 2002, 70(5):1152-1171.
37. Slatkin M, Hudson RR: Pairwise comparisons of mitochondrialDNA sequences in stable and exponentially growingpopulations. Genetics 1991, 129(2):555-562.
38. Majumder PP: Ethnic populations of India as seen from an evo-lutionary perspective. J Biosci 2001, 26(4 Suppl):533-545.
39. Higham C: Languages and Farming Dispersals: AustroasiaticLanguages and Rice Cultivation. In: Examining the farming/lan-guage dispersal hypothesis Edited by: Bellwood P, Renfrew C. Cam-bridge: The McDonald Institute for Archaeological Research; 2003.
40. Finnilä S, Lehtonen MS, Majamaa K: Phylogenetic network forEuropean mtDNA. Am J Hum Genet 2001, 68(6):1475-1484.
41. Bermisheva M, Tambets K, Villems R, Khusnutdinova E: Diversity ofmitochondrial DNA haplotypes in ethnic populations of theVolga-Ural region of Russia. Mol Biol (Mosk) 2002,36(6):990-1001.
42. Global land environments since the last interglacial: [http://members.cox.net/quaternary/.]
43. Comas D, Plaza S, Wells RS, Yuldaseva N, Lao O, Calafell F, Bertran-petit J: Admixture, migrations, and dispersals in Central Asia:evidence from maternal DNA lineages. Eur J Hum Genet 2004,12(6):495-504.
44. Papiha SS, Chahal SM, Mastana SS: Variability of genetic markersin Himachal Pradesh, India: variation among thesubpopulations. Hum Biol 1996, 68(5):629-654.
45. Passarino G, Semino O, Pepe G, Shrestha SL, Modiano G, SantachiaraBenerecetti AS: MtDNA polymorphisms among Tharus ofeastern Terai (Nepal). Gene Geogr 1992, 6(3):139-147.
46. Papiha SS: Genetic variation in India. Hum Biol 1996,68(5):607-628.
47. Singh KS, ed: The Scheduled Tribes. Oxford: Oxford UniversityPress; 1997.
48. Papiha SS, Schanfield MS, Chakraborty R: Immunoglobulin allo-types and estimation of genetic admixture among popula-tions of Kinnaur District, Himachal Pradesh, India. Hum Biol1996, 68(5):777-794.
49. Thangaraj K, Ramana GV, Singh L: Y-chromosome and mitochon-drial DNA polymorphisms in Indian populations. Electrophore-sis 1999, 20(8):1743-1747.
50. Prasad B, Ricker C, Watkins W, Dixon M, Rao B, Naidu J, Jorde L,Bamshad M: Mitochondrial DNA variation in NicobareseIslanders. Hum Biol 2001, 73(5):715-725.
51. Thangaraj K, Singh L, Reddy A, Rao V, Sehgal S, Underhill P, PiersonM, Frame I, Hagelberg E: Genetic affinities of the andamanislanders, a vanishing human population. Current Biology 2003,13(2):86-93.
52. Melton T, Clifford S, Martinson J, Batzer M, Stoneking M: Geneticevidence for the proto-Austronesian homeland in Asia:mtDNA and nuclear DNA variation in Taiwanese aboriginaltribes. Am J Hum Genet 1998, 63(6):1807-1823.
53. Yao Y, Nie L, Harpending H, Fu Y, Yuan Z, Zhang Y: Genetic rela-tionship of Chinese ethnic populations revealed by mtDNAsequence diversity. Am J Phys Anthropol 2002, 118(1):63-76.
54. Horai S, Murayama K, Hayasaka K, Matsubayashi S, Hattori Y, Fucha-roen G, Harihara S, Park KS, Omoto K, Pan IH: mtDNA polymor-phism in East Asian Populations, with special reference tothe peopling of Japan. Am J Hum Genet 1996, 59(3):579-590.
55. Oota H, Settheetham-Ishida W, Tiwawech D, Ishida T, Stoneking M:Human mtDNA and Y-chromosome variation is correlatedwith matrilocal versus patrilocal residence. Nat Genet 2001,29(1):20-21.
56. Fucharoen G, Fucharoen S, Horai S: Mitochondrial DNA poly-morphisms in Thailand. J Hum Genet 2001, 46(3):115-125.
57. Comas D, Calafell F, Mateu E, Perez-Lezaun A, Bosch E, Martinez-Arias R, Clarimon J, Facchini F, Fiori G, Luiselli D, et al.: Tradinggenes along the silk road: mtDNA sequences and the originof Central Asian populations. Am J Hum Genet 1998,63(6):1824-1838.
58. Sambrook J, Fritsch EF, Maniatis T: Molecular cloning: a labora-tory manual.,. Second edition. Cold Spring Harbor, NY: Cold SpringHarbor Laboratory Press; 1989.
59. Kaessmann H, Heissig F, von Haeseler A, Paabo S: DNA sequencevariation in a non-coding region of low recombination on thehuman X chromosome. Nat Genet 1999, 22(1):78-81.
Page 24 of 25(page number not for citation purposes)
BMC Genetics 2004, 5:26 http://www.biomedcentral.com/1471-2156/5/26
Publish with BioMed Central and every scientist can read your work free of charge
"BioMed Central will be the most significant development for disseminating the results of biomedical research in our lifetime."
Sir Paul Nurse, Cancer Research UK
Your research papers will be:
available free of charge to the entire biomedical community
peer reviewed and published immediately upon acceptance
cited in PubMed and archived on PubMed Central
yours — you keep the copyright
Submit your manuscript here:http://www.biomedcentral.com/info/publishing_adv.asp
BioMedcentral
60. Bandelt H-J, Forster P, Sykes BC, Richards MB: Mitochondrial por-traits of human populations using median networks. Genetics1995, 141(2):743-753.
61. Bandelt H-J, Forster P, Röhl A: Median-joining networks forinferring intraspecific phylogenies. Mol Biol Evol 1999,16(1):37-48.
62. Free Phylogenetic Network Analysis Shareware Software:NETWORK, [http://www.fluxus-engineering.com.]
63. Forster P, Harding R, Torroni A, Bandelt H-J: Origin and evolutionof Native American mtDNA variation: a reappraisal. Am JHum Genet 1996, 59(4):935-945.
64. Saillard J, Forster P, Lynnerup N, Bandelt H-J, Nørby S: mtDNA var-iation among Greenland Eskimos: the edge of the Beringianexpansion. Am J Hum Genet 2000, 67(3):718-726.
65. Rosenberg MS: PASSAGE. Pattern Analysis, Spatial Statistics,and Geographic Exegesis. Version 1.1. In: Department of Biology,Arizona State University, Tempe, AZ 2001.
66. Rosenberg M: Passage software packet:. [http://lsweb.la.asu.edu/rosenberg/Passage/.].
67. Dupanloup I, Bertorelle G: Inferring admixture proportionsfrom molecular data: extension to any number of parentalpopulations. Mol Biol Evol 2001, 18(4):672-675.
Page 25 of 25(page number not for citation purposes)
Copyright © 2022 FDOKUMEN