Learning Structured Representations for Rigid and Deformable ...

1
Morphological evolution in a strained-heteroepitaxial solid droplet
on a rigid substrate: Dynamical simulations
Tarik Omer Ogurtani,1 Aytac Celik2 and Ersin Emre Oren3
Department of Metallurgical and Materials Engineering, Middle East Technical
University, 06531, Ankara, Turkey
ABSTRACT
A systematic study based on the self-consistent dynamical simulations is presented for
the spontaneous evolution of flat solid droplets (bumps), which are driven by the surface
drift diffusion induced by the capillary and mismatch stresses, during the development of
the Stranski-Krastanow island morphology on a rigid substrate. The physico-
mathematical model, which bases on the irreversible thermodynamics treatment of
surfaces and interfaces with singularities (Ogurtani, T.O., J. Chem. Phys. 124, 144706,
2006) furnishes us to have auto-control on the otherwise free-motion of the triple junction
contour line between the substrate and the droplet without presuming any equilibrium
dihedral contract (wetting) angles at the edges. During the development of Stranski-
Krastanow islands through the mass accumulation at the central region of the droplet via
surface drift-diffusion with and/or without growth, the formation of an extremely thin
wetting layer is observed. This wetting layer has a thickness of a fraction of a nanometer
1 Corresponding author, Tel.: +90-312-210-2512; fax: +90-312-210-1267; e-mail: [email protected]
Url: http://www.csl.mete.metu.edu.tr
2 Electronic mail: [email protected]
3 Electronic mail: [email protected]

2
and covers not only the initial computation domain but also its further extension beyond
the original boundaries. Above a certain threshold level of the mismatch strain and/or the
size (i.e. volume) of the droplets, which depends on the initial physicochemical data and
the aspect ratio (i.e., shape) of the original droplet, the formation of the multiple islands
separated by the shallow wetting layers is also observed. By continuously front-tracking
the developments in the peak height, in the extension of the wetting layer beyond the
domain boundaries, and the change in triple junction contact angle, we observed that
these quantities are reaching certain saturation limits or plateaus, when the growth mode
is turned-off. Therefore, according to the accepted irreversible thermodynamic
terminology as coined by celebrated Prigogine, we state that the Stranski-Krastanow
island morphologies are genuine stationary non-equilibrium states. Our theory allows us
to observe the dynamical behavior of Stranski-Krastanow island formation without even
introducing any external perturbations such as Sine wave undulations or white noise on
the original surfaces of the droplets.
68.35.Md, 66.30.Qa, 68.55.J-, 05.70, Np,85.40.Ls.
Keywords: Quantum dots, Instability of surface morphology, Interfaces and surface,
Non-equilibrium thermodynamics.
I. INTRODUCTION

3
The Stranski-Krastanow (SK) morphology, i.e. formation of ‘nanoscale islands’ or
‘quantum dots (QDs)’ separated by a thin flat wetting layer, is a general growth
characteristics observed in many epitaxially-strained thin solid film systems such as in
InxGa1-x As/GaAs1 and Ge/Si.2 The formation of quantum dots through the SK growth
mode on epitaxially strained thin film surfaces has attracted great attention in the last two
decades due to unique electronic and optical properties of QDs.3,4 The fundamental
understanding of the SK growth mode will provide insights necessary to control precise
positioning of QDs and may open new avenues in QDs fabrication techniques. It was
shown so far that various parameters including surface energy anisotropy, strain level,
wetting conditions and growth kinetics, affect how the surface evolution would reach a
prescribed stationary state i.e. SK morphology. In general, nonlinear analyses in two
dimensional configurations showed that the stress-driven surface instabilities evolve into
deep, crack like groove or cusp morphologies.5,6 However, unlike the semi-infinite
homogenous solids, the presence of a substrate affects the instabilities in several ways:
First, a stiffer substrate tends to stabilize the film and increases the critical wave length,
while the opposite is true for softer substrates. At the limit of a rigid substrate, a critical
film thickness exists as shown by Spencer et al.,7,8 below which the film is stable against
perturbations of any wave lengths. Moreover, the existence of an interface between the
film and the substrate brings more complexity to the problem. At the close proximity of
the film surface to substrate, short range wetting interactions dominate and cause an
increase in the local surface free energy of the film. This increase hinders the penetration
of islands through the boundary layer, and thereby avoids the formation of the Volmer-
Weber (VW), i.e. island formation, type of growth mode and promote SK morphology by

4
preventing the surface of the substrate between islands to exposure to the immediate
environment.9,10,11
The growth or formation of islands in epitaxially thin solid films is a subset of a more
general problem namely capillary- and stress-driven shape and microstructural evolution
in solids. Asaro and Tiller12 made the first serious attempt to develop an equilibrium
thermostatic model of interfacial morphology evolutions during stress corrosion cracking
by adding the elastic strain energy density (ESED) to the so-called chemical potential
employed in their paper (see Ref. [12]). The Asaro/Tiller (AT) theory has shown some
partial success for the isochoric systems, where the elastic strain energy density enters
correctly into the scenario with a positive sign in the Helmholtz free energy density.
Grinfeld13 utilized the Gibbs-Duhem stability theory of thermodynamic equilibrium for
the isothermal and isochoric systems, characterized by the second variance in the total
Helmholtz free energy denoted as 2F 0 for the infinitesimal perturbations on the
surface morphology associated with the surface acoustic waves generated in the
nonhydrostatically stressed linear elastic solids in contact with their melts. Freund and
Jonsdottir11 employed the same criterion and developed the instability theory of a
biaxially stressed thin film on as substrate due to material diffusion over its free surface
by considering only the surface and the elastic strain energies associated with thin film
and the substrate, respectively. In all these theories cited there are two premises in
common; they all treated the isochoric systems implicitly or explicitly, and they all
predict that there is a critical wave length above which the flat free surface becomes
unstable under the sinusoidal perturbations if certain conditions prevail.14

5
Spencer9 and Tekalign and Spencer15,16 have made extensive and very successful
analyses on the morphological instability of growing epitaxially strained dislocation-free
solid films. These analyses were based on the surface diffusion driven by the capillary
forces and misfit strains by elaborating various type of wetting potentials associated with
the thickness dependent surface specific free energy. In their work, similar to the
simulation studies of the stability of epitaxially strained islands by Chiu and Gao,10
Zhang and Bower,17 Srolovitz,14 Krishnamurthy and Srolovitz,18 Medhekar and Shenoy,19
Golovin et al.,20 and Levine et al.21 elastic strain energy density appears to be additive.
Almost without exception, including the work on the equilibrium morphologies by Kukta
and Freund,22 all numerical and analytical studies reported in the literature for the so-
called steady state solutions of the nonlinear free moving boundary value problem
utilized the periodic boundary conditions, and relied mostly on the instabilities initiated
by the white noise or the small amplitude initial perturbations, where the film thickness is
smaller than the wavelength of surface variations.
In the present study, we demonstrated that without even imposing any external
perturbations on the otherwise smooth surface of droplets, this isochoric composite
system (film/substrate) simultaneously evolves towards the stationary state in the absence
of the growth mode by creating the SK islands or other proper morphologies depending
on the imposed external and internal parameters. Unfortunately, the application of the
rigid boundary conditions of any type to the computation domain restricts the natural
motions of the triple junction (TJ) that lines between the isolated islands and the
substrate, and thus the spontaneous evolution kinetics of the ensemble towards the
possible stationary state morphologies are partially hindered. In this work, this restriction
6
on the TJ motion is lifted by employing an irreversible thermodynamic connection
obtained by using the internal entropy production (IEP) hypothesis.23 IEP hypothesis
furnishes the temporal velocity of the TJ singularity with the instantaneous values of the
contact angle (i.e., one sided dihedral angle) and the wetting parameter, which depends
only on the specific surface Helmholtz free energies of the thin film, substrate and the
interface between them. In the absence of the growth term, there are at least two
important morphological features come into the scenario from this non-equilibrium
approach to the free-moving boundary value problem, namely: the zero-contact angle for
SK islands at the stationary state, and the substantial amount of spreading of the wetting
layer associated with the droplet stand beyond the original domain size. During the
transient stage, the SK island morphology looks very similar to the topography of the
composite solution calculated by Spencer9 using the "glued-wetting-layer" model.
However, in the stationary regime SK island describes strictly monotonic decrease in the
profile while approaching to the perfectly flat and highly extended platform with a
relatively sharp turn. This plateau corresponds to the wetting layer, which has almost
uniform thickness, which is very close to the prescribed thickness of the boundary layer,
namely fraction of a nanometer. The transient state profiles look very similar to the ones
reported by Tekalign and Spencer15,16 using the steady state solutions of their non-linear
equation with periodic boundary conditions, but without showing any finite thickness for
the boundary layer at the turning point (see Fig. 4 in Ref. [15]). Inclusion of the growth
term drastically alters the island morphology such that whenever the growth rate exceeds
certain limits the satellite formation is observed without any excess peak broadening on
the central island compared to the height enhancement. On the other hand, lower growth

7
rates cause the replacement of the boundary layer plateau with a bump shape Frank-van
der Merwe (FM) type layered structure with relatively large contact angles at the
spreading edges. The addition of the growth term accelerates the spontaneous spreading
of the wetting layer or platform, which is a very important step for the easy
transformation of the VW type clusters into SK islands. At first, VW morphology is
observed on those substrates having extremely high film/substrate interfacial energies
because of the large misfit ratio. Later, the transformation into SK island morphologies
starts by thermal annealing if there is enough relaxation in strain, which initially caused
by the misfit dislocation creation at the interface,24 by establishing direct contact between
individually formed SK islands at the initial stage of the continuous wetting layer.
II. PHYSICAL AND MATHEMATICAL MODELING
A continuum theory based on the microdiscrete formulation of the irreversible
thermodynamics of surfaces and interfaces, which was extensively elaborated and applied
by Ogurtani23 and Ogurtani and Oren25 for multi-component systems has been enlarged
by taking into account the film thickness dependent surface Helmholtz free energy
(isochoric system) to study the evolution behavior of epitaxial films, especially for the
formation of Stranski-Krastanow islands by computer simulations.
a. The governing equation for the surface drift-diffusion and growth:
The evolution kinetics of surfaces or interfacial layers (simply- or multiply-connected
domains) of an isochoric multi-phase system may be described in terms of surface normal
displacement velocities ordV by the following well-posed free moving boundary value

8
problem in 2D space for ordinary points (i.e., the generalized cylindrical surfaces in 3D
space) using normalized and scaled parameters and variables, which are indicated with
the bar signs. Similarly, the TJ longitudinal velocity LongV associated with the natural
motion of the droplet-substrate contour line may be given in terms of the wetting
parameter /( ) /s ds d sf f f , and the temporal one-sided dihedral or wetting contact
angle W as a dynamical variable. Here sf is the Helmholtz surface free energy of the
substrate, and dsf is the interfacial free energy between the droplet and the substrate, and
/d sf is the height dependent surface free energy of the droplet. In the case of Chiu and
Gao10 type model the wetting parameter defined as such that it becomes identically equal
to unity 1W . In reality it should take values greater than unity in order to have
wetting phenomenon to proceed spontaneously (i.e., natural change). According to our
adopted sign convention, the negative values of ordV and LongV correspond to the local
expansion and/or growth of a droplet. Then one writes;
2/
2/
oord dv h d s
odv dv h d s
V f f y y
f f y y
(Ordinary points) (1)
and
1 cos( ) 1Long Long WV M (Triple junction contour) (2)
9
Where is the wetting constant as defined previously, and W is the dihedral or
contact angle, which varies in the range of 0oW , zero degree corresponds to
full wetting. The variables in Eq. (1) and (2) are described as follows: 310 is the
normalized atomic volume in the particle representation by assuming tentatively that the
scaling length is in the range of 10 atomic spacing (for the more details see Ref. [23] and
Ref. [25]).26 LongM is the ratio of the mobility of the TJ, ˆLongM , to the surface mobility,
ˆdM . Similarly, dv is the normalized growth mobility, which in general may depend on
the temperature and the surface stress.27 is the normalized local curvature and is taken
to be positive for a concave solid surface (troughs), and the positive direction of the
surface displacement and the surface normal vector n are assumed to be towards the bulk
(i.e., droplet) phase, and implies the local shrinkage or evaporation processes. In the
governing equation, Eq. (1), the normalized hoop stress is denoted by h Tr , where
the dimensionless stress intensity parameter corresponds to the intensity of the elastic
strain energy density (ESED) contribution on the stress-driven surface drift diffusion. The
misfit strain o at the film/substrate interface is introduced as a Dirichlet boundary
condition by specifying the displacement vector in 2D space as ˆou i x (i.e., in 3D
pseudo-space ˆˆ ,o ou i x k z ), and taking the droplet center at the film/substrate
interface as the origin of the coordinate system to avoid shifting. Similarly, the stress
used for the normalization procedure is chosen as the biaxial stress / 1o d o dE ,
where, dE and d are, respectively, Young modulus and Poisson’s ratio of the droplet
shape film, and o is misfit strain at the film/substrate interface. This choice is very

10
convenient for the indirect boundary elements method (IBEM) solution of the plain strain
isotropic elasticity problems,28 where one takes o1; 1dE as the initial scaling
data. Then, only the actual value of the Poisson’s ratio of the film has to be supplied for
the computation of the normalized stress distribution. The rest o;dE is embedded in
the definition of . Here, we assumed that the surface Helmholtz free energy density
/ ( )d sf y for an isochoric system depends on the local distance y between the surface
layer and the substrate, and the special form of which will be presented later in this
section. ( )y is the normalized wetting potential, which is given by
/( ) /d y d sy n df dy in particle representation, where ˆˆ.yn n j is the projection of the
surface normal along the y-axis, which is taken as perpendicular to the substrate. The
second group of terms in governing equation Eq. (1) is related to the growth or phase
transformation (condensation or evaporation) kinetics. In the above expression, is the
curvilinear coordinate along the surface (arc length) in 2D space scaled with respect to
o . Where, o is the arbitrary length scale, which may be selected as the peak height of
the droplet or the ratio of the surface Helmholtz free energy of the film in the bulk to the
elastic strain energy density10,16 such as /d of w . Here, 2 21 / 2o d o dw E
denotes ESED, which is associated with the nominal biaxial misfit stress taking the third
dimension into account. If one takes as a length scaling parameter then one should
have the following replacement: 1 , since according to our definition /o . In
the present paper, otherwise it is stated, the initial peak height of the droplet ph is chosen
as the natural scaling length, namely; o ph . The film thickness oh is defined as the

11
integrated film thickness, and it may be given by 2 / 0.637o ph h for the scaled
halve wave length Cosine-shape flat droplets, where 1ph . ( )o o odv v df T f f
represents the thermal part of the Helmholtz free energy of transformation for a flat
interface assuming that the isothermal processes is taking place in an isochoric system.
The positive value corresponds to condensation of the vapor phase or for the growth of
the droplet. ovf
and odf
are the volumetric Helmholtz free energy densities, respectively,
for the realistic vapor and bulk droplet phases.
In the present enlarged formulation of the problem, as we did in Ref. [25], we scaled
the time and space variables ,t in the following fashion: first of all, ˆd an atomic
mobility associated with the mass flow at the surface layer is defined, and then a
normalized time scale is introduced by 4 2 ˆ/o o d df . The bar signs over the
letters indicate the following scaled and normalized quantities:
/ ot t , / o , o , / oL L , o
o dvdv o
d
ff
f
, h
o
h
(3)
22
1
2
do o
d
wE
,
1d
o od
E
,
21
22
d oo
od dE f
(4)
and
2 22
1( )
1
s d
dx
f fy
f yy
(5)
and,

12
/
1( ) arctan( / )
2d s d s
d sd d
f f f ff y y
f f
/
2( )1s ds s ds
d s s d
f f f f
f f f
(6)
Here, we adapted a transition-layer model as advocated by Spencer,9 but reserving the
case for the description of the wetting constant since Spencer9 and his coworkers15
assumed that the interfacial free energy between the droplet and the substrate, dsf , is
negligible. Similar to the definitions of sf and dsf , df is the surface energy of the
droplet in the bulk form. According to the functional relationship given in Eq. (6) for the
boundary layer model, the film specific Helmholtz surface free energy undergoes a rapid
transition from film, df , to substrate, sf , values over a length scale denoted as . That
means when the film thickness becomes equal to zero (i.e., at the TJ) the droplet surface
free energy should be given by / ( ) / 2d s s df f f . This may create some trouble at the
thermodynamic equilibrium, because of the fact that the TJ configuration for the full
wetting is defined by 1 for the reversible changes. This condition requires existence
of the following equality between the surface free energies, 1/ 2ds s df f f if one
adopts the Spencer’s model. Then one would have zero contact angle at the TJ without
pushing the wetting potential to nil. Similarly, the equilibrium wetting or contact angle,
which is given by . /cos /Eq s ds d sarc f f f becomes undefined at the
droplet/substrate TJ unless 1 if one assumes that the relationship Eq. (6) is still holds
along the contour contact line. This is an important dilemma of their model, since this
assumption results a zero wetting potential as defined also by Spencer.9 The model
proposed by Chiu and Gao10 partially removes this awkward situation but brings

13
restrictions to the TJ motion for the quasi-equilibrium case, 1 . But this is not a
necessary condition for the non-equilibrium stationary states. In general, the wetting
parameter should be defined by 1 ( ) / 1W s ds df f f , which covers the
complete range of thermodynamic equilibrium wetting or sticking phenomenon, namely;
starting from the complete wetting configuration (i.e., 0W ) to the another extreme
case of point contact (i.e., W ), which may be described as a rigid ball sitting at the
top of the substrate, at the TJ. In the present computer simulations similar to Spencer9 and
his coworkers,15 we assumed that 0dsf for the wetting potential, which is very
plausible for the coherent boundaries such as the interface between epitaxially grown film
and the substrate.
In the present study, the generalized mobility, dv , associated with the interfacial
displacement reaction (adsorption or desorption) is assumed to be independent of the
orientation of the interfacial layer in crystalline solids. As we already mentioned, This
generalized mobility is normalized with respect to the minimum value of the mobility of
the surface drift-diffusion denoted by ˆd . They are given by: 2ˆ ˆ/dv dv o d and,
ˆ /d d dD h kT where, is the mean atomic volume of chemical species in the
surface layer and dD is the isotropic part (i.e., the minimum value in the case of
anisotropy) of the surface diffusion coefficient.
14
b. Linear instability analysis with the height dependent surface free energy:
We presented the general treatment of the unified linear instability analysis (ULISA)
of the governing equation, Eq. (1), in Ref. [27] by taking any possible diffusivity and
surface free energy anisotropies into account.27 However, in that theory, we did not
consider the wetting effect, which we are going to launch now in this paper. The wetting
effect may be included by linearizing the wetting potential at the position of the original
flat film surface denoted as oh (i.e., defined as the integrated thickness of the droplet of
any shape) by using the local tangent line for the linear extrapolation. This is a similar
approach, introduced by Pang and Huang,29 and gives the growth rate constant in terms of
the critical thickness, ch , normalized wave number, k k , and the time scale
4 2 ˆ/o d d df . Then, one obtains the following expression for the normalized
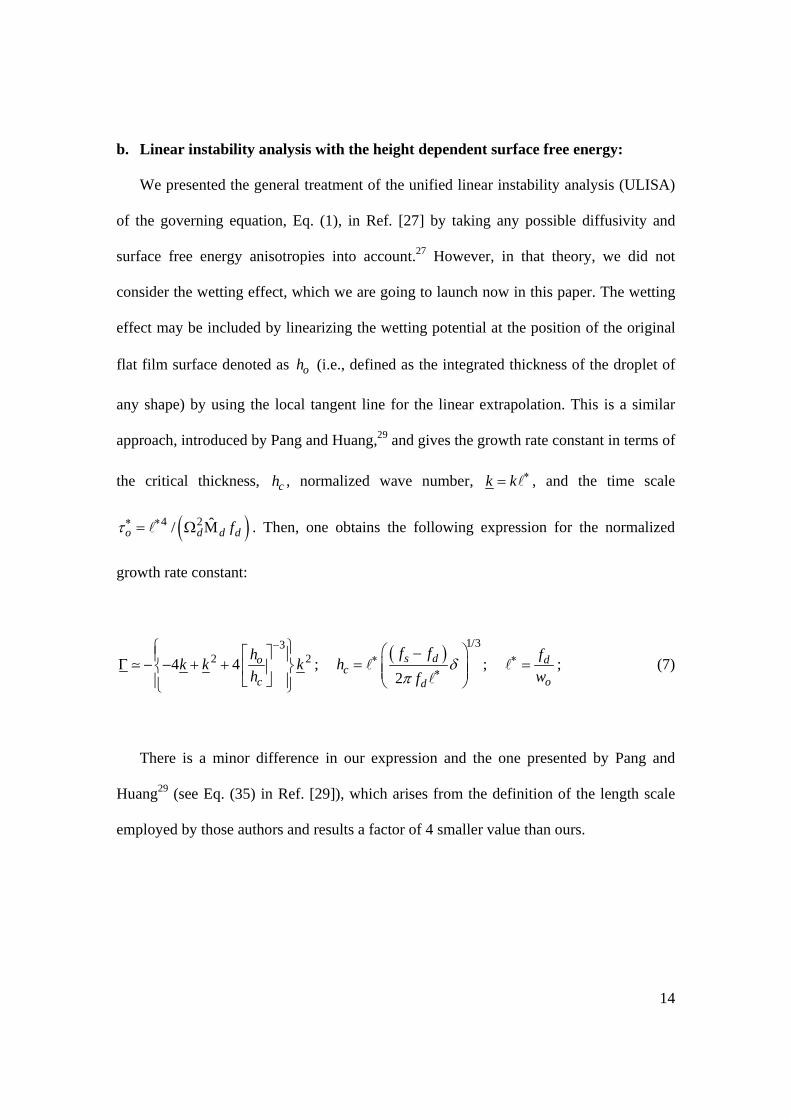
growth rate constant:
32 24 4 o
c
hk k k
h
; 1/3
2s d
cd
f fh
f
; d
o
f
w ; (7)
There is a minor difference in our expression and the one presented by Pang and
Huang29 (see Eq. (35) in Ref. [29]), which arises from the definition of the length scale
employed by those authors and results a factor of 4 smaller value than ours.

15
FIG. 1 (Color online) Linear analysis of the wetting effect: The growth rate constant, ,
is given on the left y-axis, with respect to the normalized wave number, k k , for
various normalized film thicknesses /o ch h . On the right y-axis, the wave number for
the maximum growth rate is also presented with respect to the normalized film thickness
/o ch h that is scaled with respect to the critical film thickness denoted as ch .
The formulation of Pang and Huang29 has another problem in the definition of ESED,
where a factor of two is missing in the dominator of their Eq. (11) in Ref. [29]. In Eq. (7),
is a characteristic length typically encountered in a boundary layer model, and
determines the size of the transition region. Since arctan function is a relatively slow
decaying function, one needs / 0.01 0.005 to be smaller than the effective wetting
layer thickness by a factor of 50 as suggested by Tekalign and Spencer,15 so that the
wetting layer transition should occurs at about one atomic spacing. In Fig. 1, the plots for
16
the normalized growth rate constant versus normalized wave number are presented for
various values of film thickness versus critical thickness ratios /o ch h . The instability
band width for the normalized wave number may be easily calculated form Eq. (7) as
31,2 2 1 1 ( / )o ck h h . The maximum growth rate occurs at the normalized wave
number denoted by 3k , when / 5o ch h , which is identical to the one reported by
Chiu and Gao,10 even though they were using a different functional representation for the
surface free energy but for the same formula for the ESED. According to the present
theory, the upper limit for the normalized wave number for the instability range is given
by max2 4k .
c. Implementation of the IBEM numerical method:
The detailed description of the indirect boundary elements method30 (IBEM), and its
implementation are presented very recently in two comprehensive papers by Ogurtani
and Akyildiz31,32 in connection with the void dynamics in metallic interconnects. In both
papers, the void dynamics were driven by the surface drift-diffusion induced by the
inhomogeneous thermal stress fields in collaboration with the electromigration as the
main driving forces. In this study, we utilized the simplest implementation of the IBEM
that employs the straight constant line elements in the evaluation of the hoop stress at the
free surface of the droplet, as well as along the interface between droplet and the
substrate. In fact, it is also possible to generate the complete stress distribution field in the
interior region of the sample as a byproduct. Here, Neumann (i.e., traction free boundary
condition) and Dirichlet boundary conditions (i.e., prescribed displacements) are utilized,

17
respectively, along the free surface of the droplet and at the interface between droplet and
the substrate. Therefore, we have implicitly assumed that the substrate is rigid, and the
displacement is supplied as a Dirichlet boundary condition along the interface, which is
calculated from the misfit strain, o , by (0)x ou x . This implementation, adopted by
the present author, guarantees the surface smoothness conditions for the validity of the
governing Fredholm integral equation of the second kind at the corners and edges, which
may be generated artificially during the numerical procedure. The explicit Euler’s method
combined with the adapted time step auto-control mechanism is employed in connection
with Gear's stiff stable second-order time integration scheme30 with the initial time step
selected in the range of 8 910 10 in the normalized time domain. This so-called
adapted time step procedure combined with the self-recovery effect of the capillary terms
guarantees the long-time numerical stability and accuracy of the explicit algorithm even
after performing 45 502 2 steps, which is clearly demonstrated in our recent work on the
grain boundary grooving and cathode drifting in the presence of electromigration
forces.32 The network remeshing is continuously applied using the criteria advocated by
Pan and Cocks,33 and the curvature and normal line vector are evaluated at each node
using a discrete geometric relationship in connection with the fundamental definitions of
the radius of curvature.
III. RESULTS AND DISCUSSION
In our computer simulation studies, it is assumed that the thin film on top of the
substrate is represented by a flat crystalline droplet (i.e., bump), which may be described
by a symmetrically disposed, halve-wave length Cosine-function having a wave length

18
and a height (i.e., amplitude) denoted by 2L and ph , respectively. The droplet aspect
ratio may be defined by: / pL h , which prescribes a finite contact angle
arctan( / ) between film and the substrate at the onset of the simulation run.
Therefore, in the normalized and scaled time-length space, the initial shape of a droplet is
uniquely described by one single parameter, namely the aspect ratio , since 1ph
according the scheme adopted in this study. Similarly, a close inspection of the
normalized governing equation without the growth term shows that there is only one
more additional parameter left for the complete predetermination of the morphological
evolution process as an initial data, which is the ESED parameter denoted by
/ /o ph . In real space, the size of the droplet may be described by p oh
for a given value of the aspect ratio, but now it is solely determined by keeping the
shape invariant (i.e, zooming) due to the fact that the characteristic length is an
internal variable for the isochoric systems, and it depends only on the material properties
of the film and the substrate including the misfit strain. Therefore, this unitless parameter
completely dictates the possible size effects of the droplet on the evolution process in
real space; where one has: p oh . Hence, in the absence of the growth term, the
aspect ratio (i.e., shape) and the strain energy density parameter (i.e., size) are two
basic numbers capable to dictate the topographic features of the final stationary states as
will be demonstrated later in this study.
Physically, the droplet is attached to the substrate with a coherent interface, and the
top surface is subjected to the surface drift diffusion, and it is exposed to a vapor
environment, whose pressure may be neglected. Since we are performing 2D simulations
19
(equivalent to parallel ridges or quantum wires in three dimensions), no variation of the
interface profile and the displacement fields in the film and substrate occurs in the
direction (i.e., z axis) perpendicular to the plane of the schematics in Fig. 2(a) (i.e., plane
strain condition). Similarly, to simplify the numerical computations we assumed that the
film/substrate interface is flat and the substrate is stiff. These assumptions guarantees that
the initial displacement along the interface associated with the misfit strain o stays
constant during the evolution process (i.e., Dirichlet boundary condition). In the
simulation studies, scaled and normalized variables which were thoroughly described in
our previous publication32 are utilized, and the length scaling is performed with respect to
the droplet initial peak height designated as o ph .
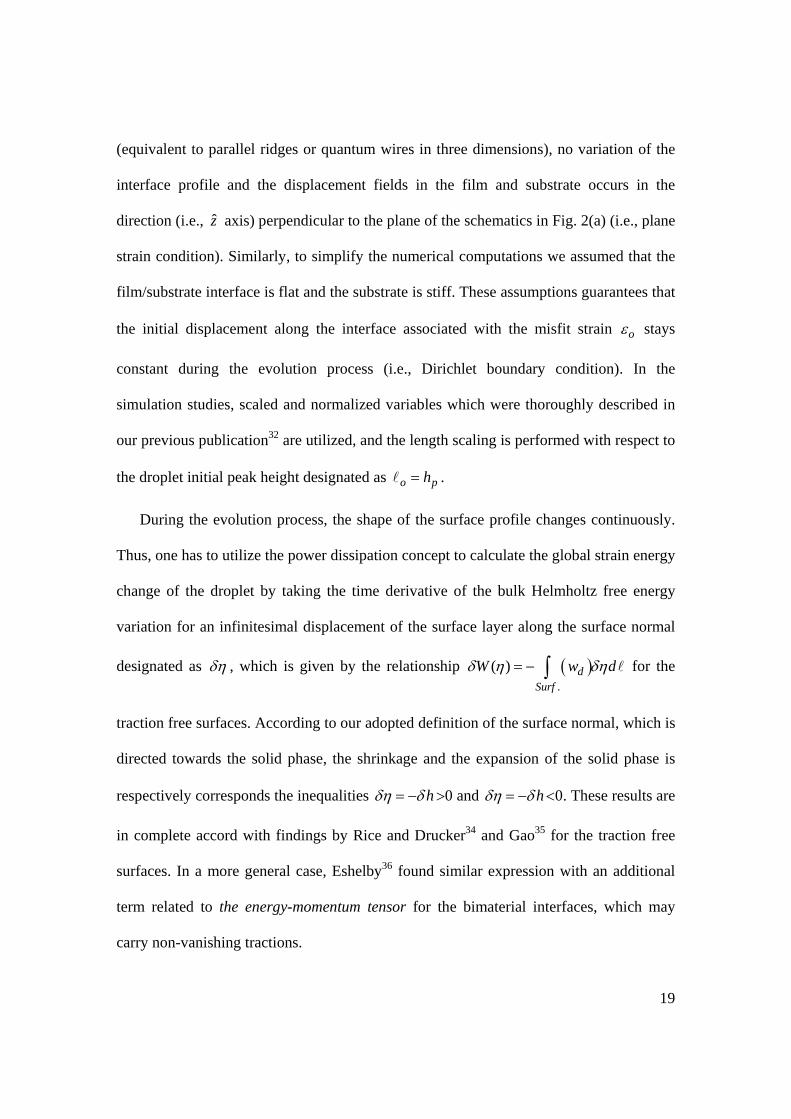
During the evolution process, the shape of the surface profile changes continuously.
Thus, one has to utilize the power dissipation concept to calculate the global strain energy
change of the droplet by taking the time derivative of the bulk Helmholtz free energy
variation for an infinitesimal displacement of the surface layer along the surface normal
designated as , which is given by the relationship .
( ) dSurf
W w d for the
traction free surfaces. According to our adopted definition of the surface normal, which is
directed towards the solid phase, the shrinkage and the expansion of the solid phase is
respectively corresponds the inequalities h 0 and h 0. These results are
in complete accord with findings by Rice and Drucker34 and Gao35 for the traction free
surfaces. In a more general case, Eshelby36 found similar expression with an additional
term related to the energy-momentum tensor for the bimaterial interfaces, which may
carry non-vanishing tractions.

20
Here it has been presumed that the interface between film and substrate is immobile.
Then one reads the following expression in the normalized time-length space, where ‘ n ’
designates the total number of nodes along the traction free surface, and ( )L t is the
instantaneous length of the free surface contour.
21
0.
( )( ) ( ) ( )
njb
o jjSurf
tP t w d w L t t
n
. (8)
In Eq. (8), we did not include the contribution associated with the time variations in
the strain energy density distribution evaluated at the free surface. Because, the numerical
calculations showed that it is three orders of magnitude smaller than the one presented
above with the same trend, i.e., both having a negative sign. Subsequently, the
cumulative change dF in the bulk Helmholtz free energy, which is equal to the total
elastic strain energy for the isothermal changes, during the evolution process may be
calculated as a function of the discrete normalized time mt by using a simple integration
(i.e., summation) procedure applied to above expression. This procedure yields:
00
( ) ( ) ( ) /mt k m
d m m m kk
F t W t dt P t t P t m
. (9)
Similarly, one may also write the Helmholtz surface free energy change sF
associated with the free surface contour enlargement with respect to the initial
configuration, which may be given for a prescribed time, t , as;
21
( ) 0 ( ) 0s d oF t f L t L w L t L (10)
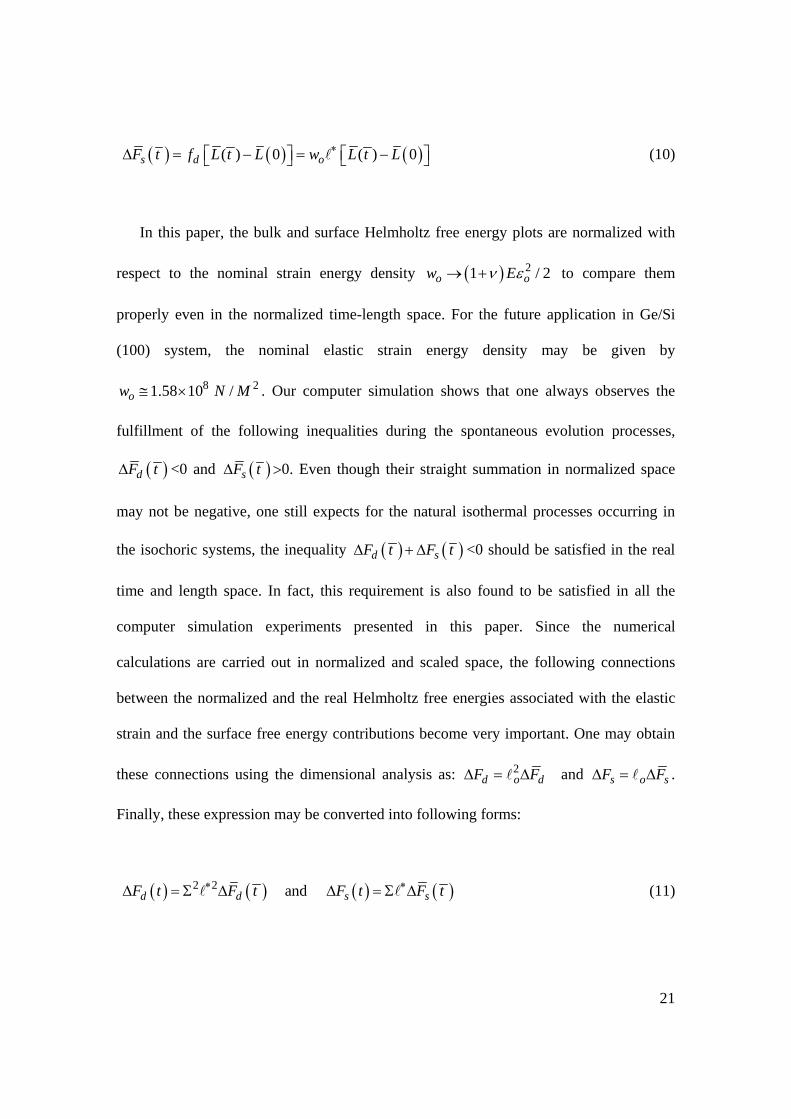
In this paper, the bulk and surface Helmholtz free energy plots are normalized with
respect to the nominal strain energy density 21 / 2o ow E to compare them
properly even in the normalized time-length space. For the future application in Ge/Si
(100) system, the nominal elastic strain energy density may be given by
8 21.58 10 /ow N M . Our computer simulation shows that one always observes the
fulfillment of the following inequalities during the spontaneous evolution processes,
dF t <0 and sF t 0. Even though their straight summation in normalized space
may not be negative, one still expects for the natural isothermal processes occurring in
the isochoric systems, the inequality d sF t F t <0 should be satisfied in the real
time and length space. In fact, this requirement is also found to be satisfied in all the
computer simulation experiments presented in this paper. Since the numerical
calculations are carried out in normalized and scaled space, the following connections
between the normalized and the real Helmholtz free energies associated with the elastic
strain and the surface free energy contributions become very important. One may obtain
these connections using the dimensional analysis as: 2d o dF F and s o sF F .
Finally, these expression may be converted into following forms:
2 2 and d d s sF t F t F t F t (11)
22
a. Morphological evolution of droplet without growth term:
In this section, we will present the results obtained from a set of special computer
experiments done on the specimens having large aspect ratios (i.e., in the range of
10 28 ), and subjected to the misfit strain at the interface between the thin film
and the stiff substrate. Here, the aspect ratio is defined as the ratio of the droplet base
length-to-peak height. The surface of the droplet film initially is represented by a
symmetrically disposed halve-wave length Cosine-curve as illustrated in Fig. 2(a), which
has a normalized base length of 28L , and an amplitude of 1.0ph as compared
to the integrated film thickness, which is given by 2 / 0.637o ph h . Although, we
employed a large number of different elastic strain energy density parameters (ESED) in
our experiments, we will discuss only a few that represents different parts of the spectrum
of morphologies; (i.e., 0.075,0.175, 0.250 ,0.300,0.350,0.400, 0.413 ,0.425,0.450 ).
The double vertical lines, , roughly indicate the transient states found. The lowest
ESED value presented here is 0.075 , which destabilize the initial droplet
configuration by activating the TJ towards the Frank-van der Merwe layer structure by
spreading over the substrate surface before switching to the island formation. Here we
observed not only the singlet but also the island doublets (i.e., twins, etc) separated by the
transient morphologies. During our simulations, besides film morphologies, we also
monitored the kinetics of the peak height development, the displacement of the TJ
singularity during wetting layer extension, and the strain energy release during the
evolution process. In order to illustrate the actual physical size of the islands, we consider
the following parameters,37 which are representative of Ge film grown epitaxially on a

23
stiff silicon substrate.7,37 Namely: 0.042o , GeE 103 GPa, Ge 0.273 ,
2Gef 1.927Jm , and 2
Si f 2.513Jm . These numbers imply a characteristic length of
12.11 nm , which may be used to calculate the heights and the base lengths of the
droplets that are corresponding to the range of the strain energy intensity parameters for a
given aspect ratio (i.e., 28 ), namely; for the singlet islands one has:
: 0.25 0.40 1.91 3.08 :84 134 oh nm nm L nm nm .
FIG. 2. (Color online) (a) The initial and the final stationary island profile at the
transient stage just before the onset of the SK islands formation regime. The final profile
is well represented by a Gaussian bell-shape curve having following parameters:
2.30ph , 3.25w , which corresponds to the peak height-to-peak width ratio of
0.354 . (b) Instantaneous velocity and the hoop stress distributions along the final
droplet profile. (c) Evolution of the contact angle is shown on the left y-axis. On the right
y-axis, the strain energy and surface free energy changes are given for Ge/Si(100) system,
and scaled by 2 1810nm . (d) Time evolution of peak height and TJ displacement.

24
Simulation Data: 0.25 , 1ph , =28 , =0.273 , 2TJM , =1 , 0.005 , sf 1.2
and df 1 .
The results of a computer simulation, which is done on a hypothetical sample by
assigning a critical value for the elastic strain energy density parameter (ESED) such as
0.25 are presented in Fig 2. Fig. 2(a) shows development of a premature or transient
island profile without having any indication of the wetting layer formation even after
46 132 7 10 runs. This profile, which was obtained by performing numerous
experiments in the vicinity of the stability-instability turn-over point for the linearized
systems, corresponds to the transient stage between the SK islands and the FM type
layers structures. This final profile as demonstrated in Fig. 2(a) may be described by a
Gaussian curve (i.e., second degree) given by 2 2( ; , ) .exp (2) /p pG x h w h ln x w ,
having a halve-width of 3.25w , and a peak height of 2.30ph , in normalized space.
These two value, corresponds to the peak height to peak width ratio of 0.354 .
According to the Prigogine38 description, this is a genuine stationary non-equilibrium
state since even though the height of droplet reached a plateau region (Fig. 2(d)), the TJ
contour line is still active with a temporal wetting angle of 0.58oW (Fig. 2(c)). This TJ
activity is the main indicator that the system is in the non-equilibrium state. To reveal the
real physical system parameters, we employed the data given above for the Ge/Si(100)
system to the normalized and scaled parameters and obtained 6.9 ph nm for the peak
height, 2 18.98 W nm for the peak width of and 86.5 L nm for the base (or the
wave length that describes the spacing between islands) length with the help of Fig. 2(b).
25
These values are in the range of numbers reported by Kukta and Freund,22 who were
defining the base of the island as its width, which may create some confusion if there is
no sharp turning point at the corners that separate island from the wetting layer (see Fig.
5 in Ref. [22]). As seen in Fig. 2(d), the peak height showed logarithmic time dependence
during the intermediate regime before the onset of the plateau region, namely;
( ) 2 log( ) 3.6ph t t . In Fig. 2(c), the negative cumulative strain energy release,
2/d oF w nm , and the surface free energy variation 2/s oF w nm , both scaled with
respect to ow , are plotted using the connections given in Eq. (11) for Ge/Si(100). This
plot shows almost perfectly linear decrease for the cumulative strain energy release with
time compared to the surface free energy variation that indicates a leveling off in the
early stages of the development followed by a positive change due to the surface layer
extension during the evolution process. The free energies are plotted by considering the
critical length of Ge/Si (100) system, which is about 12.11 nm for the present case. At the
end of the test run the total strain energy release is calculated to be about
53.203 10dF J , which is very large compared to the total surface energy gain that
amounts to 93.36 10sF J . This figure also shows that the global Helmholtz free
energy is negative all the way through the natural change as one should expect from the
thermodynamic considerations.

26
FIG. 3. (Color online) (a) Spontaneous formation of the SK island with an almost
perfect flat wetting layer from a single crystal droplet on a stiff substrate by the isotropic
surface drift diffusion driven by the combined actions of the misfit strain (isochoric) and
the capillary forces. The inset details the structure of the wetting layer at the TJ. Gaussian
bell-shape curve representing the final profile has the following parameters: 3.15ph ,
2.90w and thus the peak height-to-peak width ratio of 0.543 . (b) Instantaneous
velocity and the hoop stress distributions along the final droplet profile. (c) Evolution of
the contact angle is shown on the left y-axis. On the right y-axis, the strain energy and
surface free energy changes are given for Ge/Si(100) system. (d) Time evolution of peak
height and TJ displacement. Simulation Data: 0.40 , 1ph , =28 , =0.273 ,
2TJM , =1 , 0.005 , sf 1.2 and df 1 .
In Fig. 3, a typical morphological evolution behavior of the SK island is presented in
terms of the final droplet profile, the peak height, the base extension, and the TJ contact
angle with respect to the normalized logarithmic scale. In this experiment, we utilized an
elastic strain energy density parameter of 0.40 that was picked out from the upper

27
edge of the stable singlet SK island formation range : 0.30,0.35,0.40 . The SK profile
reported in this figure shows a very thin simultaneously-formed wetting layer having a
normalized thickness of 0.026h . This wetting layer thickness is about a factor of 5
greater than the adopted boundary layer thickness in our computer simulations, which
enters as 0.005 into the wetting potential presented in Eq. (1). In real space, the
wetting layer thickness for the Ge/Si(100) system may be computed as follows:
0.026 0.026 0.12 oh nm , which may be easily improved by taking the
boundary layer thickness 5 times smaller than the desired effective wetting layer
thickness,15 namely that is about one atomic spacing, 0.6 nm . That means one should
rather take 0.025 .
The insert in Fig. 3(a) demonstrates the structure of the wetting layer at the TJ
contour line, which has a temporal contact angle of 0.74o instead of zero degree,
which indicates that the TJ is still active. A close inspection of Fig. 3(d) shows that the TJ
displacement motion indicates three different time exponent stages, ( ) nL t At where
121; ; 6n , before it enters to the plateau region. Similarly, the peak height shows a
logarithmic time dependence during the intermediate regime before the onset of the
plateau region, namely; ( ) 2 log( )ph t t +5.6. Using the physicochemical data given for
Ge/Si(100) system, one may calculate the critical film thickness from Eq. (7), as:
0.56 Gech nm , and the integrated thickness of the droplet as:
(2 / ) 3.08 Geoh nm . The critical parameter, which is given by
/ 5.546 5Ge Geo ch h is in the range where the wetting parameter does not play any role
28
as may be seen from Fig. 1. The normalized wave number k k , which corresponds to
the maximum growth rate constant, may be calculated from the expression
3max 3 9 8 /c ok h h
, which yields max 2.996k . This result is very close to the
theoretical value of 3. The perturbation wave length for the maximum growth rate
constant now becomes about max 25.4 nm . This figure is about a factor of five smaller
than the domain length of 28 135.7 L nm . According to the linear instability
theory the system should be completely in the instability regime, therefore no stationary
non-equilibrium state SK island formation would be possible. This is completely contrary
to the findings demonstrated in this work, which implies that for the large amplitudes as
well as for the certain initial configurations such as the flat droplets the linear instability
theory is not reliable in predicting evolution behavior of the system.
In Fig. 3(c), the cumulative strain energy change, 2/d oF w nm , as well as the
increase in the surface free energy, 2/s oF w nm , of the droplet due to the island
formation are presented. This figure clearly shows that there is a large increase in the
surface free energy due to the island formation compared to Fig. 2(c) because of a factor
of two peak height enhancement during the evolution process. Even though the surface
free energy levels off after reaching the stationary non-equilibrium state, still the strain
energy release continuous to increase due to the readjustment of the system through the
TJ activities.

29
FIG. 4. (Color online) (a) Spontaneous formation of the SK doublets with an almost
perfect flat wetting layer from a single crystal droplet. The inset details the structure of
the wetting layer between the individual peaks. The doublets has fourth degree Gaussian
bell-shape curve having the following parameters: 2.07ph , 2.06w and thus the peak
height-to-peak width ratio of 0.502 . (b) 3D time evolution of island profile. (c)
Evolution of the contact angle is shown on the left y-axis. On the right y-axis, the strain
energy and surface free energy changes are given for Ge/Si(100) system. (d) Time
evolution of peak height and TJ displacement. Simulation Data: 0.45 , 1ph , =28 ,
=0.273 , 2TJM , =1 , 0.005 , sf 1.2 and df 1 .
In Fig. 4(a and b), we illustrate a fully developed SK doublet at the stationary state
separated by a thin wetting layer having a thickness of 0.0314 0.17 h nm . The
wetting layer thickness between the peaks, and the peak tails are found to be almost
same. In this case,, we utilized an ESED parameter of 0.45 , which is selected from a
range : 4.125 ;4.25;0.45.. , where the doublet formation appears to be the stationary
state instead of singlets. Above this range not only the multiples but also the Volmer-

30
Weber type island formation may seen depending on the ESED value, which should be
further investigated. The extended plateau in the TJ wetting angle plot in Fig. 4(c)
indicates that at the stationary state equilibrium contact angle may not be necessarily
realized, which should be otherwise zero degree. These doublet peaks may be represented
by the fourth degrees Gaussian type function 4 4( ; , ) .exp (2) /p pG x h w h ln x w , where
the peak height and the halve width found to be max 2.07 11.18 h nm and
2.06 11.12 w nm respectively.
There is a strange peak on the wetting angle plot in Fig. 4(c), and the same
phenomenon is also occurred in the formation of the singlet without the sign fluctuation
in the global Helmholtz free energy. This event is strongly correlated with the TJ motion
as may seen from Fig. 4(d), which shows drastic enhancement in the displacement
velocity just at the onset of the stationary non-equilibrium regime.
In Fig. 5, we present a new set of computer simulation studies utilizing an aspect ratio
of 10 which is 2.8 times smaller than the first set reported above. As we expected,
this modification pushed the onset of the SK island formation threshold described by the
ESED parameter to higher values of 0.40 . This is a factor of 1.6 enhancement
compared to the case presented in Fig. 2(a). As seen in Fig. 5, we have a bell shape
profile extended all over the computation domain without the existence of any wetting
layer. This is very typical for this transient regime as observed previously. Figure 5(a and
b) shows that there is only a transformation of the Cosine-shape droplet into the second
degree Gaussian shape profile with a minor increase in height and a very small stretching
of the base line or the computation domain due to TJ motion. Fig. 5(c) indicates that the
wetting contact angle reached a value of 1.52oW , showing some sort of trend towards

31
the plateau behavior. The most interesting event observed here is the sign of the global
Helmholtz free energy change during the evolution process: In general it is negative
indicating that the decrease in the strain energy is greater than the increase in the surface
free energy of the system. However, only in one narrow region, one observes a sign
inversion, which indicates the dynamical nature of the simulation experiment due to TJ
displacement motion and may be interpreted as this abrupt change is unnatural.
Nevertheless, this is a transient region mostly controlled by the TJ motions and involves
additional positive entropy production, which is not accounted in the global Helmholtz
free energy as presented above. A careful inspection of Fig. 5(c) may show that the
surface free energy slowly deviates from linearity by making a turn towards the
stationary non-equilibrium state region, and eventually it may be stabilized. This event is
closely correlated with the behavior of the base line extension in Fig. 5(d). It is clear that
this experiment prematurely terminated before the system reaches to the stationary non-
equilibrium state, which is indicated by the plateau regions in the kinetic parameters such
as the base extension, the TJ contact angle, and finally the peak height. The reason for
this rather premature termination was the need for excessive computation time and
memory, otherwise we may get a profile having little more flattened tails. In this
experiment, the peak height and the peak halve-width are found to be, respectively,
1.47 7.12 ph nm , and 2.20 10.65 w nm for Ge/Si(100) system.

32
FIG. 5. (Color online) (a) The stationary island profile at the transient stage just before
the onset of the SK island formation regime. Gaussian bell-shape curve representing the
final profile has the following parameters: 1.47ph , 2.20w and thus the peak height-
to-peak width ratio of 0.334 . (b) 3D time evolution of island profile. (c) Evolution of
the contact angle is shown on the left y-axis. On the right y-axis, the strain energy and
surface free energy changes are given for Ge/Si(100) system. (d) Time evolution of peak
height and TJ displacement. Simulation Data: 0.4 , 1ph , =10 , =0.273 ,
2TJM , =1 , 0.005 , sf 1.2 and df 1 .
In Fig. 6, we illustrate the effect of decrease in the aspect ratio on the threshold level
of ESED for the formation of SK islands, which shows a substantial increase in ESED
parameter from 0.30 for 28 to 0.50 for 10 . Our findings on the
stationary values, which describes the morphology of SK in terms of a fourth degree
Gaussian profile, may be summarized as: max 1.76h , 1.80w and L 10.784. These
parameters may be converted into the real space by employing the length scale,

33
6.06 o nm , obtained for the Ge/Si(100) system. This conversion results a peak
height of max 10.49 h nm , halve-peak width of 10.82 w nm and the extended domain
length of 65.30 L nm for the SK island formed during the evolution of the droplet
having integrated thickness of 3.85 oh nm , and the base length of 60.55 L nm (i.e.,
the original area 2233.18 A nm ). At the stationary non-equilibrium state the stationary
height-to-base length aspect ratio becomes 5.93S instead of 10 .
FIG. 6. (Color online) (a) Spontaneous formation of the SK island with an almost
perfect flat wetting layer from a single crystal. The inset details the structure of the
wetting layer at the TJ. The singlet has fourth degree Gaussian bell-shape curve having
the following parameters: 1.76ph , 1.80w and thus the peak height-to-peak width
ratio of 0.489 . (b) 3D time evolution of island profile. (c) Evolution of the contact
angle is shown on the left y-axis. On the right y-axis, the strain energy and surface free
energy changes are given for Ge/Si(100) system. (d) Time evolution of peak height and
TJ displacement. Simulation Data: 0.50 , 1ph , =10 , =0.273 , 2TJM , =1 ,
0.005 , sf 1.2 and df 1 .

34
A careful examination of Fig. 6(c and d) clearly shows that this experiment is also
prematurely interrupted at the onset of the stationary non-equilibrium state due to the
same computational requirements. Even though the kinetic parameters such as the base
line extension, and the wetting angle indicate that they have reached the stationary non-
equilibrium state region, the global Helmholtz free energy change still does not show any
sign reversal. This situation is closely correlated with Fig. 6(a), where one does not see
any well developed flat wetting layer formation compared to its counterpart in Fig. 3(a).
The case reported in Fig. 3(c) also shows different kinetic behavior even though
topologically both SK islands appear to be very similar, with the exception of the depth
and extend of the wetting layers.
In order to correlate two different SK states having exactly the same size in real
space, we also performed a special test run using an ESED parameter of 0.30 , which
corresponds to the onset of the SK island formation regime, where the droplet has an
aspect ratio of 28, and the normalized peak height of 1ph . These figures in real
space match up to a droplet having an initial integrated thickness of 2.31 oh nm , and
base length of 101.72 L nm (i.e., the original area 2235.18 A nm ). This test run
resulted following output data for the stationary state, which exhibits a fourth degree
Gaussian profile: max 2.85h (peak height) and 3.0w (halve peak width), and
10.784L (extended domain size). In the real space, for the Ge/Si(100) system, these
data amounts to: max 10.35 h nm , 10.96 w nm , and 101.72 L nm with a
stationary aspect ratio of 9.82S .
35
This is a very interesting result, and clearly shows that two droplets having two
different initial shapes, characterized by the two different aspect ratios in the normalized
space, but having exactly the same sizes (i.e., area in 2D space) in real space evolved into
the SK islands having almost exactly the same shape and size. The only difference
between these two systems is in the extensions of the wetting layer platforms, which are
defined by the original domain sizes with slight enlargements due the TJ activities. This
behavior may be summarized by an analytical expression for the adopted Cosine-shape
droplet by writing:
2 22
2 2 1.59o
AA
(12)
In Eq. (12), the subscript attached to the ESED parameter, , and the numeric
value of 1.59 indicates the onset value for the appearance of the SK island formation
regime (i.e., 10 280.50; 0.30 ), which may have well defined range or band
structure for the singlet and doublet, etc. depending upon the height-to-base length aspect
ratio of the droplet. Kukta and Freund22 found a parabolic connection between the aspect
ratio, which defines the shape of the equilibrium island, and the normalized island area:
2/A . Their aspect ratio is completely different than ours, and it relies on the ratio of
the height-to-base width of the island, which is obtained by a numerical searching
technique that is also based on the Cosine-shape initial film morphology, but it is nothing
to do with self-evolution of the system towards the stationary non-equilibrium states.
36
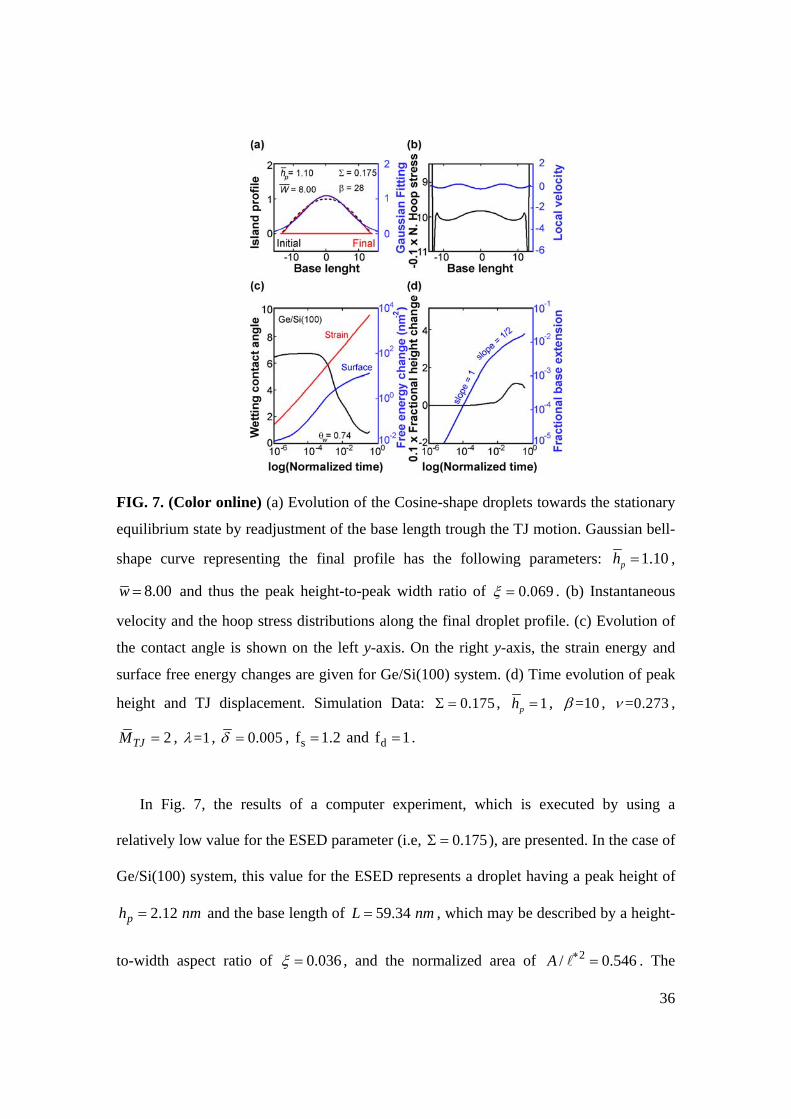
FIG. 7. (Color online) (a) Evolution of the Cosine-shape droplets towards the stationary
equilibrium state by readjustment of the base length trough the TJ motion. Gaussian bell-
shape curve representing the final profile has the following parameters: 1.10ph ,
8.00w and thus the peak height-to-peak width ratio of 0.069 . (b) Instantaneous
velocity and the hoop stress distributions along the final droplet profile. (c) Evolution of
the contact angle is shown on the left y-axis. On the right y-axis, the strain energy and
surface free energy changes are given for Ge/Si(100) system. (d) Time evolution of peak
height and TJ displacement. Simulation Data: 0.175 , 1ph , =10 , =0.273 ,
2TJM , =1 , 0.005 , sf 1.2 and df 1 .
In Fig. 7, the results of a computer experiment, which is executed by using a
relatively low value for the ESED parameter (i.e, 0.175 ), are presented. In the case of
Ge/Si(100) system, this value for the ESED represents a droplet having a peak height of
2.12 ph nm and the base length of 59.34 L nm , which may be described by a height-
to-width aspect ratio of 0.036 , and the normalized area of 2/ 0.546A . The
37
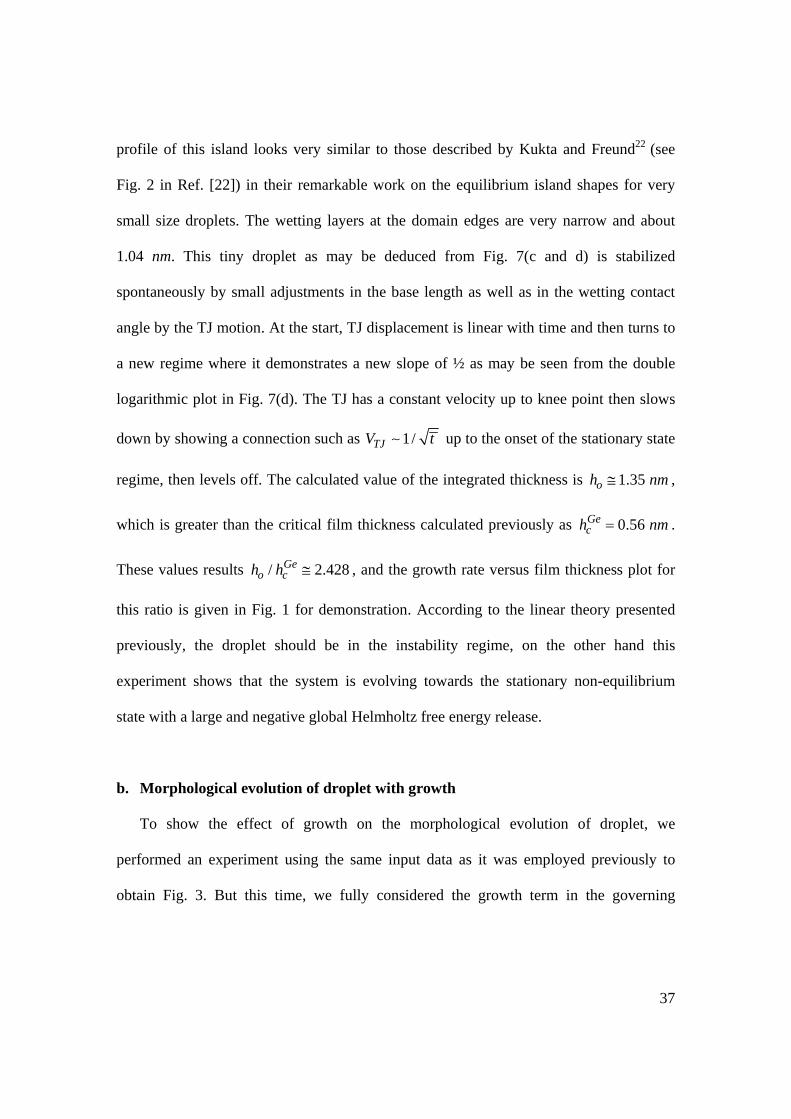
profile of this island looks very similar to those described by Kukta and Freund22 (see
Fig. 2 in Ref. [22]) in their remarkable work on the equilibrium island shapes for very
small size droplets. The wetting layers at the domain edges are very narrow and about
1.04 nm. This tiny droplet as may be deduced from Fig. 7(c and d) is stabilized
spontaneously by small adjustments in the base length as well as in the wetting contact
angle by the TJ motion. At the start, TJ displacement is linear with time and then turns to
a new regime where it demonstrates a new slope of ½ as may be seen from the double
logarithmic plot in Fig. 7(d). The TJ has a constant velocity up to knee point then slows
down by showing a connection such as 1/TJV t up to the onset of the stationary state
regime, then levels off. The calculated value of the integrated thickness is 1.35 oh nm ,
which is greater than the critical film thickness calculated previously as 0.56 Gech nm .
These values results / 2.428Geo ch h , and the growth rate versus film thickness plot for
this ratio is given in Fig. 1 for demonstration. According to the linear theory presented
previously, the droplet should be in the instability regime, on the other hand this
experiment shows that the system is evolving towards the stationary non-equilibrium
state with a large and negative global Helmholtz free energy release.
b. Morphological evolution of droplet with growth
To show the effect of growth on the morphological evolution of droplet, we
performed an experiment using the same input data as it was employed previously to
obtain Fig. 3. But this time, we fully considered the growth term in the governing

38
equation (1) by employing the following values for the growth mobility and the
Helmholtz free energy of condensation, respectively, 1bM and 2ovdF .
FIG. 8 (Color online) (a) The effect of the growth on the SK island morphology:
formation of two satellites shouldering the primary pea, and separated by almost perfectly
flat wetting layers. Gaussian bell-shape curve representing the final profile has the
following parameters: 1.10ph , 8.00w and thus the peak height-to-peak width ratio
of 0.069 . (b) Instantaneous velocity and the hoop stress distributions along the final
droplet profile. (c) Evolution of the contact angle is shown on the left y-axis. On the right
y-axis, the strain energy and surface free energy changes are given for Ge/Si(100) system.
(d) Time evolution of peak height and TJ displacement. Simulation Data: 0.40 ,
1ph , =28 , =0.273 , 2TJM , =1 , 0.005 , sf 1.2 and df 1 and the growth
parameters 1bM , 2ovdF .
Fig. 8(a) illustrates two profiles with (red) and without (blue) the growth term. In fact,
the no growth case was already discussed in the case presented in Fig. 3. In the growth

39
case, we observed a primary peak at the center accompanied by two subsidiary or satellite
peaks in each side which altogether covers the computation domain. By zooming this
figure, one observes very narrow and thin wetting layers ( 0.0587 0.28 Geh nm )
separating the satellites from the primary peak. This clearly indicates that we are still in
the domain of the SK islands formation regime. As can be seen from the kinetics data
presented in Fig. 8(c and d), this system shows some intermediate stationary non-
equilibrium state for the time interval of 0.05 0.1t , where the wetting contact angle
0.998ow as well as the size of the computation domain / 0.01oL L seem to be
stabilized as clearly indicated by the appearance of the plateau regions. Similarly, up to
the onset of this rather short living intermediate regime, the height of the primary peak
does not show any appreciable increase. Otherwise, the system there on evolving
continually unless one turn-off the condensation process completely. In Fig. 8(b), the
instantaneous velocity and the hoop stress distributions are plotted with respect to the
position of the collocation points along the droplet surface. The normalized hoop stress is
compressive in sign, since we have had the Ge/Si(100) system in our mind, which has a
negative misfit strain of 0.042o . One observes very high tension stresses
concentrated only at the edges of the interface, where the contact between droplet and the
substrate takes place through the TJ, which goes up to the level of
2.25 13.389 GPa , and are not illustrated in this diagram. The velocity diagram
(Fig. 8(b)) shows two positive maxima, which correspond to the shoulders of the
satellites next to the primary peak sides. This indicates that there is a high rate of
shrinkage or flatting taking place there, which causes not only the better development of
the satellites by rounding off but also the enlargement of the wetting layers next to the

40
primary peak. The velocity distribution shows plateau regions with zero growth rate at
the wetting layers, which indicates the stabilization there. Unfortunately, system turned-
off automatically because of lag of enough memory space, and we could not pursue
further to see the final destiny of the satellites regions. However, one may speculate that
those two satellite peaks after a long run time might turn into bell shape subsidiary SK
islands extending towards the substrate having very narrow wetting layer with almost
zero contact angle.
IV. CONCLUSIONS
In this paper, we applied the physico-mathematical model, developed by Ogurtani
based on the irreversible thermodynamics treatment of surfaces and interfaces with
singularities,23 to describe the dynamical and spontaneous evolution of flat solid droplets
(bumps) driven by the surface drift diffusion induced by capillary forces and mismatch
stresses, during the development of the Stranski-Krastanow island morphology on a rigid
substrate. The present study showed great potential to shade some more lights on the
fundamental roles played by those parameters, which describe the shape and the size
of epitaxially grown droplets, in SK island formation. These parameters, as
demonstrated here, dictate selectively what type of SK island would be formed among a
large pool of different possibilities (i.e., singlet, doublet, etc.), by the spontaneous
evolutions of this isochoric system without having exposed to any external and/or internal
perturbations. We also demonstrated that for a given aspect number, , defined as the
height-to-length ratio of the droplet, any desired number of SK island multiples formation
may be realized if the strain energy density parameter belongs to the well defined

41
closed (bonded) and continuous set of real numbers in the normalized and scaled length-
time space. We also revealed that the droplets (i.e., furnished by proper sets of shape and
size parameters), having exactly the same size, regardless of their initial shapes may
evolve spontaneously into the same SK island morphologies (i.e., same size and shape) in
real space. The only difference is the extend of the wetting layer platform. The small
aspect ratios result in narrow wetting layer platforms than the large aspect ratio
constituents. Finally, we disclosed that the linear instability theories, which heavily
depend on the small perturbations (i.e., sinusoidal functions or white noise) on the
otherwise smooth surfaces of thin films, are not reliable in predicting the spontaneous
evolution (i.e., natural changes with positive internal entropy production) of large scale
objects.
ACKNOWLEDGMENTS
The authors thanks William D. Nix of Stanford University and Dick Bedeaux of
Norwegian University of Science and Technology, Trondheim for their interest in our
theoretical work on surface and interfaces. Thanks are also due Oncu Akyildiz of METU
for his valuable comments on the paper. This work was partially supported by the
Turkish Scientific and Technological Research Council, TUBITAK through a research
Grant No.107M011.
42
REFERENCES
1 C. W. Snyder, B. G. Orr, D. Kessler and L. M. Sander, Phys. Rev. Lett. 66 (23), 3032
(1991).
2 D. J. Eaglesham and M. Cerullo, Phys. Rev. Lett. 64 (16), 1943 (1990).
3 D. Leonard, M. Krishnamurthy, C. M. Reaves, S. P. Denbaars and P. M. Petroff,
Appl. Phys. Lett. 63 (23), 3203 (1993).
4 G. Wang, S. Fafard, D. Leonard, J. E. Bowers., J. L. Merz and P. M. Petroff, Appl.
Phys. Lett. 64 (21), 2815 (1994).
5 J. Berrehar, C. Caroli, C. Lapersonne-Meyer and D. C. Schott, Phys. Rev. B 46 (20),
13487 (1992).
6 T. O. Ogurtani, J. Apply. Phys. 106 (5), 01-Sep-09 scheduled (2009).
7 B. J. Spencer, P. W. Voorhees and S. H. Davis, Phys. Rev. Lett. 67 (26), 3696 (1991).
8 B. J. Spencer, P. W. Voorhees and S. H. Davis, Phys. Rev. B 47 (15), 9760 (1993).
9 B. J. Spencer, Phys. Rev. B 59 (3), 2011 (1999).
10 C. H. Chiu and H. Gao, in Thin Films: Stresses and Mechanical Properties V, edited
by S.P. Baker et al., MRS Symposia Proceedings No. 356 (Materials Research
Society, Pittsburgh), p. 493 (1995).
11 L. B. Freund and F. Jonsdottir, J. Mech. Phys. Solids 41 (7), 1245 (1993).
12 R. J. Asaro and W. A. Tiller, Metallurgical Transactions B 3 (7), 1789 (1972).
13 M. A. Grinfeld, Doklady Akademii Nauk SSSR 290 (6), 1358 (1986) Soviet Physics
Doklady 31, 831 (1986).
14 D. J. Srolovitz, Acta Metall. 37 (2), 621 (1989).

43
15 W. T. Tekalign and B. J. Spencer, J. Appl. Phys. 96 (10), 5505 (2004).
16 W. T. Tekalign and B. J. Spencer, J. Appl. Phys. 102, 073503 (2007).
17 Y. W. Zhang and A. L. Bower, J. Mech. Phys. Solids 47, 2273 (1999).
18 R. Krishnamurthy and D. J. Srolovitz, J. Appl. Phys. 99, 043504 (2006).
19 N. V. Medhekar and V. B. Shenoy, J. Appl. Phys. 103, 063523 (2008).
20 A. A. Golovin, M. S. Levine, T. V. Savina and S. H. Davis, Phys. Rev. B 70, 235342
(2004).
21 M. S. Levine, A. A. Golovin, S. H. Davis and P. W. Voorhees, Phys. Rev. B 75,
205312 (2007).
22 R. V. Kukta and R B. Freund, J. Mech. Phys. Solids 45, 1835 (1997).
23 T. O. Ogurtani, J. Chem. Phys. 124 (13), 144706 (2006).
24 S. C. Ozkan, W. D. Nix, and H. Gao, Appl. Phys. Lett. 70, 2247 (1997).
25 T. O. Ogurtani and E. E. Oren, Int. J. Solids Struct. 42, 3918 (2005).
26 T. O. Ogurtani, O. Akyildiz and E. E. Oren, J. Appl. Phys. 104, 013518 (2008).
27 T. O. Ogurtani, Phys. Rev. B 74, 155422 (2006).
28 G. Beer and J. O. Watson, Introduction to finite and boundary element methods for
engineers (Wiley, New York, 1992) p.151.
29 Y. Pang and R. Huang, Phys. Rev. B 74, 075413 (2006).
30 C. W. Gear, Numerical Initial Value Problems in Ordinary Differential Equations
(Prentice Hall, New Jersey, 1971), p.151.
31 T. O. Ogurtani and O. Akyildiz, J. Appl. Phys. 104, 023521; 023522 (2008).
32 T. O. Ogurtani and O. Akyildiz, Int. J. Solids Struct. 45, 921 (2008).

44
33 J. Pan and A. C. F. Cocks, Acta Metall. Mater. 43 (4), 1395 (1995).
34 J. R. Rice and D. C. Drucker, Int. J. Fract. Mech. 3, 19 (1967).
35 H. Gao, Int. J. Solids Struct. 28 (6), 703 (1991).
36 J. D. Eshelby, In: M. F. Kanninen, W. F. Adler, A. S. R. Rosenfield, and R. Jaffe,
(Ed.), Inelastic Behavior of Solids (McGraw-Hill, New York, 1970) p. 90.
37 H. Gao, J. Mech. Phys. Solids 42, 741 (1994).
38 I. Prigogine, Thermodynamics of irreversible processes, 2nd ed. (Interscience
Publishers, New York, 1961) p.75.
Copyright © 2022 FDOKUMEN