MONTHLY STATISTIK PERBANKAN INDONESIA INDONESIAN BANKING STATISTICS
Upload
khangminh22Category
view
0download
0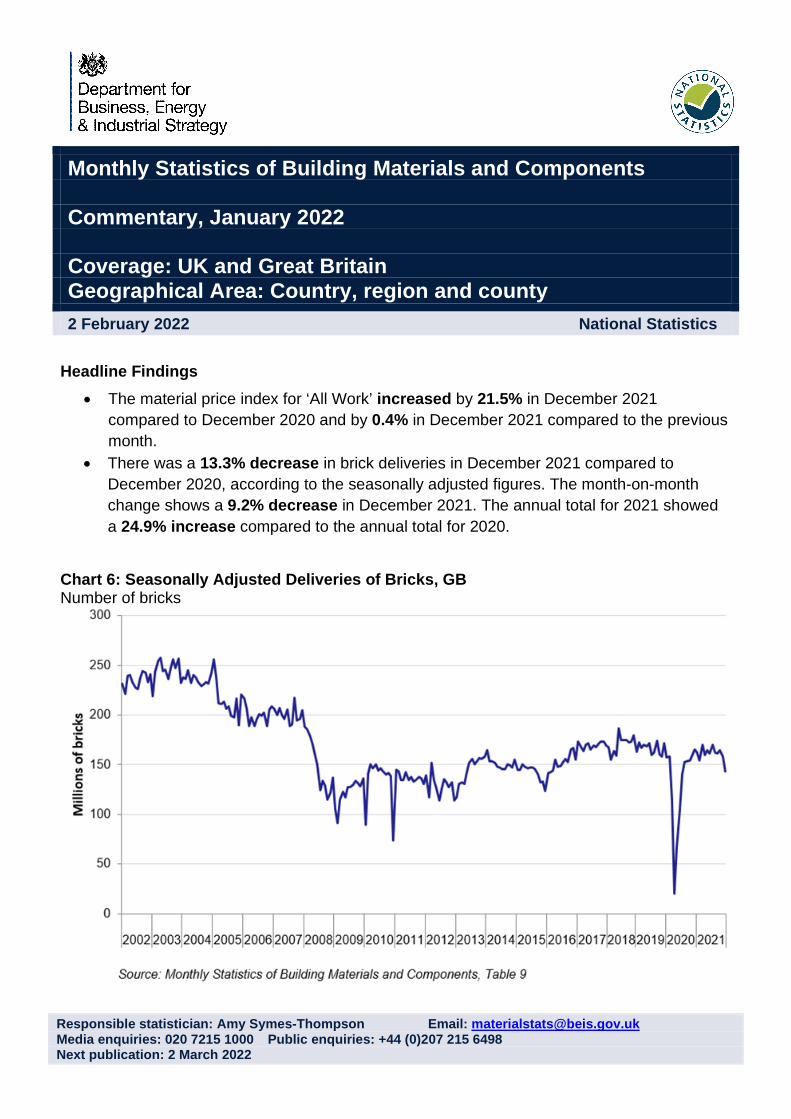
Responsible statistician: Amy Symes-Thompson Email: [email protected] enquiries: 020 7215 1000 Public enquiries: +44 (0)207 215 6498 Next publication: 2 March 2022
Monthly Statistics of Building Materials and Components
Commentary, January 2022
Coverage: UK and Great Britain Geographical Area: Country, region and county
2 February 2022 National Statistics
Headline Findings
The material price index for ‘All Work’ increased by 21.5% in December 2021
compared to December 2020 and by 0.4% in December 2021 compared to the previous
month.
There was a 13.3% decrease in brick deliveries in December 2021 compared to
December 2020, according to the seasonally adjusted figures. The month-on-month
change shows a 9.2% decrease in December 2021. The annual total for 2021 showed
a 24.9% increase compared to the annual total for 2020.
Chart 6: Seasonally Adjusted Deliveries of Bricks, GB Number of bricks
Monthly Statistics of Building Materials and Components – January 2022
_______________________________________________________________
________________________________________________
_________________________________________________________
______________________________________________________
_______________________________________________________
___________________________________________________________
________________________________________________________________
__________________________________________________________________
__________________________________________________________________
__________________________________
______________________________________________________
________________________________________________________
______________________________________________________
______________________________
___________________________________________
___________________________________________
______________________________________________
___________________________________________________________
_______________________________________________________
_______________________________________________________
_______________________________________________________________
_________________________________________________________
____________________________________________
________________________________________________________
_________________________________________________________
____________________________________________________
________________________________________________________
______________________________________________
________________________________________________________________
Contents
Introduction 3
Seasonal Adjustment Review 3
Summary of Results 4
Material Price Indices 4
Cement and Clinker 5
Sand & Gravel 6
Concrete 7
Bricks 8
Blocks 9
Imports and Exports of Construction Materials 10
Economic Background 12
Business Insights 12
Construction Output 12
Bank of England Summary of Business Conditions 13
Gross Domestic Product Estimate 13
Gross Domestic Product Forecast 14
Construction Output Forecasts 14
Manufacturing 16
Accompanying tables 17
Technical information 18
Definitions 20
Further information 20
Future updates to these statistics 20
Related statistics 20
Revisions policy 21
Uses of these statistics 21
User engagement 21
National Statistics designation 21
Contact 22
2
Monthly Statistics of Building Materials and Components – January 2022
Introduction
This commentary accompanies the latest Monthly Statistics of Building Materials and Components data tables, published on the BEIS building materials web page on 2 February
3
2022. It provides an overview of recent trends in the data presented in the tables.
The data tables present the latest detailed information on selected building materials and components. They cover the following building materials statistics:
Construction material price indices (monthly, UK)
Sand and gravel sales (quarterly, GB*)
Slate production, deliveries and stocks (quarterly, GB)
Cement and clinker production, deliveries and stocks (annual, GB)
Bricks production, deliveries and stocks (monthly, GB*)
Concrete building blocks production, deliveries and stocks (monthly, GB*)
Concrete roofing tiles production, deliveries and stocks (quarterly, GB)
Ready-mixed concrete deliveries (quarterly, UK)
Values of overseas imports and exports trades for selected materials and components for use in construction (quarterly, UK)
Value of EU and Non-EU Trade for selected materials and components for use in construction (annual, UK)
Note: * Regional figures available
These statistics support analysis of the construction materials market and business planning. They are regularly reported in the construction press and are used for a variety of purposes, including policy development and evaluation concerning the construction products industry, as well as monitoring market trends. Further detail is available in this document under Uses of these statistics.
Seasonal Adjustment Review
Seasonally adjusted series for deliveries of bricks, concrete blocks, ready-mixed concrete and sales of sand and gravel are published in the data tables. The purpose of correcting the reported series is to allow for seasonal factors such as winter weather (including the reduction in hours of daylight, and frost and rain) and other seasonal events such as Christmas and Easter. Thus, seasonally adjusted figures show the underlying trend more clearly. Further information can be found in this document under Technical Information.
Monthly Statistics of Building Materials and Components – January 2022
Summary of Results
Material Price Indices
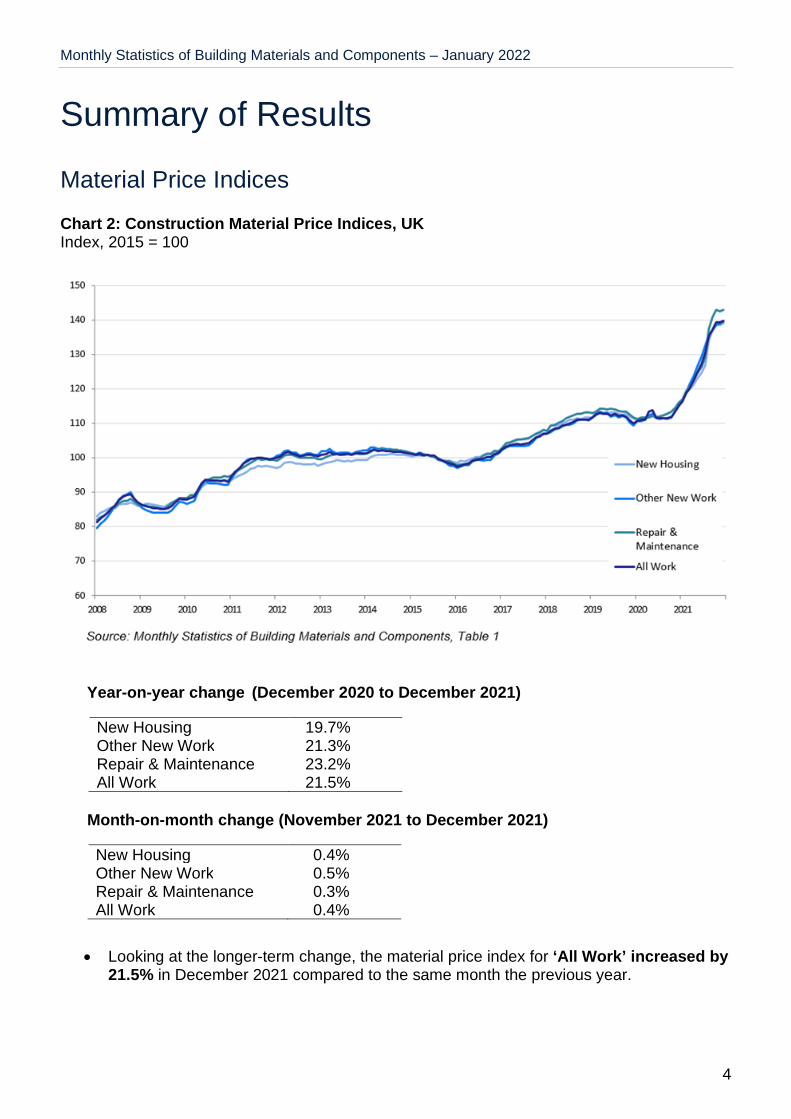
Chart 2: Construction Material Price Indices, UK Index, 2015 = 100
Year-on-year change (December 2020 to December 2021)
4
New Housing 19.7%Other New Work 21.3%Repair & Maintenance 23.2%All Work 21.5%
Month-on-month change (November 2021 to December 2021)
New Housing 0.4%Other New Work 0.5%Repair & Maintenance 0.3%All Work 0.4%
Looking at the longer-term change, the material price index for ‘All Work’ increased by 21.5% in December 2021 compared to the same month the previous year.
Monthly Statistics of Building Materials and Components – January 2022
Cement and Clinker
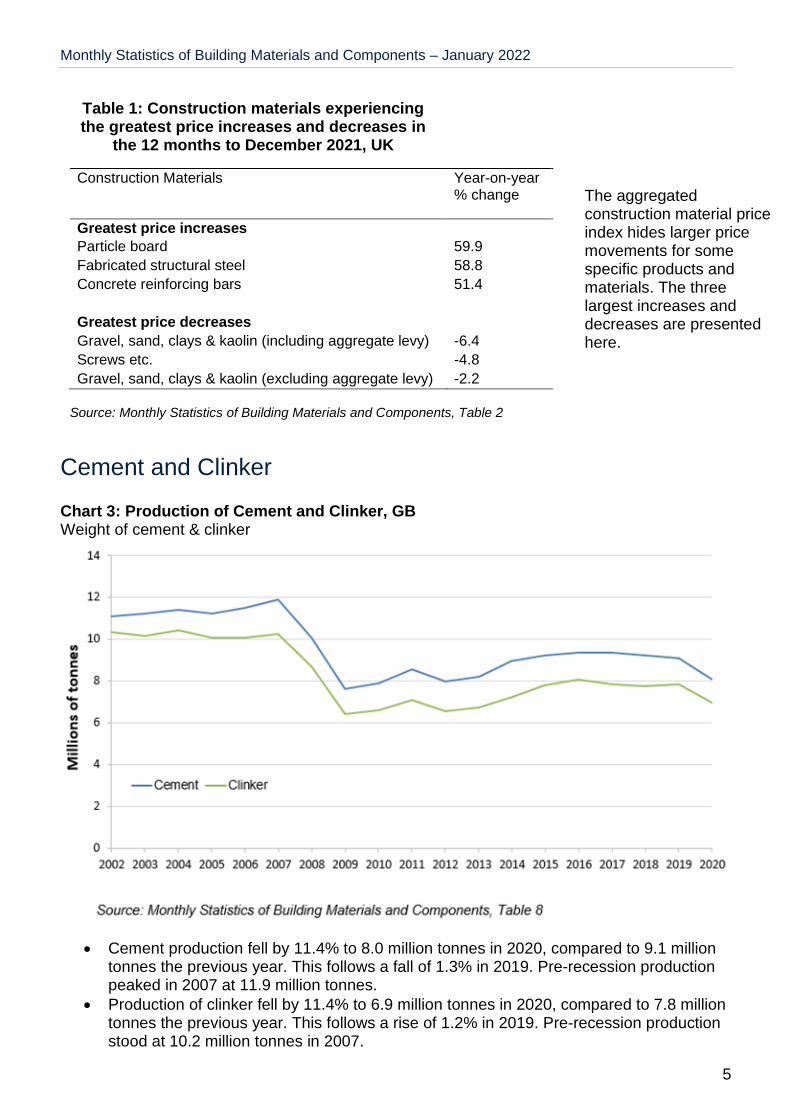
Chart 3: Production of Cement and Clinker, GB Weight of cement & clinker
Cement production fell by 11.4% to 8.0 million tonnes in 2020, compared to 9.1 million tonnes the previous year. This follows a fall of 1.3% in 2019. Pre-recession production peaked in 2007 at 11.9 million tonnes.
Production of clinker fell by 11.4% to 6.9 million tonnes in 2020, compared to 7.8 million tonnes the previous year. This follows a rise of 1.2% in 2019. Pre-recession production stood at 10.2 million tonnes in 2007.
5
Table 1: Construction materials experiencing the greatest price increases and decreases in
the 12 months to December 2021, UK
Construction Materials Year-on-year % change
Greatest price increasesParticle board 59.9
Fabricated structural steel 58.8
Concrete reinforcing bars 51.4
Greatest price decreases
Gravel, sand, clays & kaolin (including aggregate levy) -6.4
Screws etc. -4.8
Gravel, sand, clays & kaolin (excluding aggregate levy) -2.2
Source: Monthly Statistics of Building Materials and Components, Table 2
The aggregated construction material price index hides larger price movements for some specific products and materials. The three largest increases and decreases are presented here.
Monthly Statistics of Building Materials and Components – January 2022
Sand & Gravel
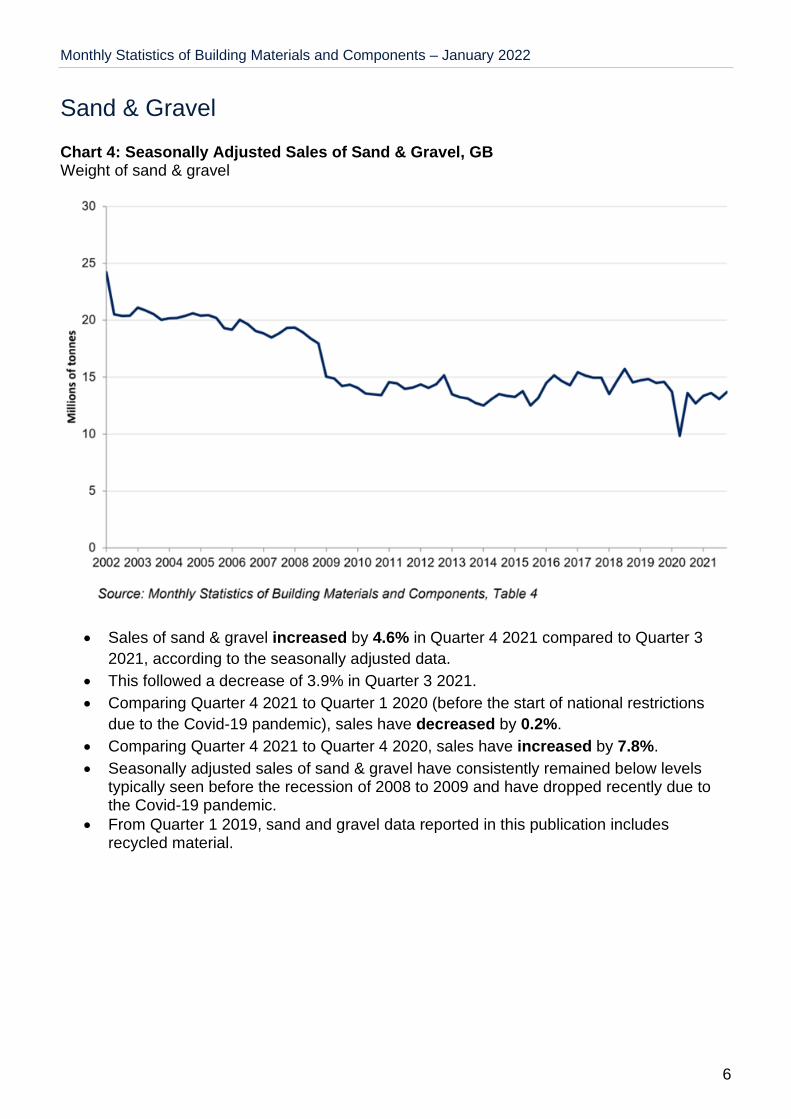
Chart 4: Seasonally Adjusted Sales of Sand & Gravel, GB Weight of sand & gravel
Sales of sand & gravel increased by 4.6% in Quarter 4 2021 compared to Quarter 3
2021, according to the seasonally adjusted data.
This followed a decrease of 3.9% in Quarter 3 2021.
Comparing Quarter 4 2021 to Quarter 1 2020 (before the start of national restrictions
due to the Covid-19 pandemic), sales have decreased by 0.2%.
Comparing Quarter 4 2021 to Quarter 4 2020, sales have increased by 7.8%.
Seasonally adjusted sales of sand & gravel have consistently remained below levels typically seen before the recession of 2008 to 2009 and have dropped recently due to the Covid-19 pandemic.
From Quarter 1 2019, sand and gravel data reported in this publication includes recycled material.
6
Monthly Statistics of Building Materials and Components – January 2022
Concrete
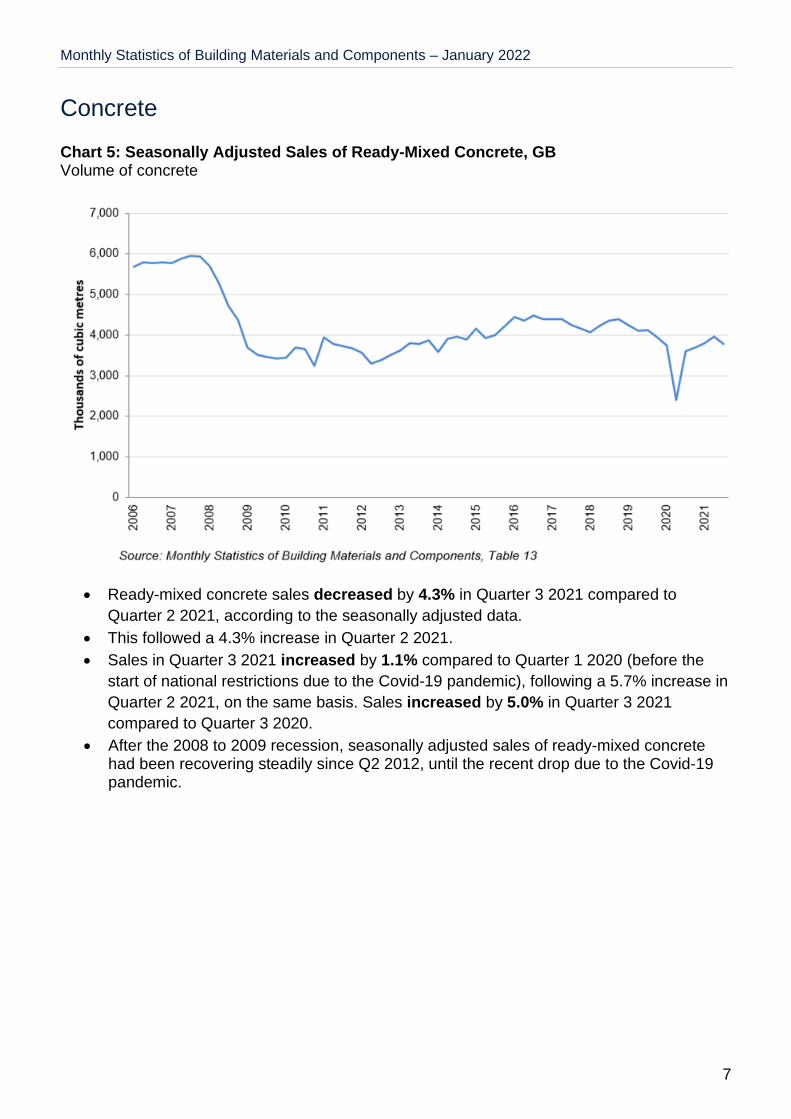
Chart 5: Seasonally Adjusted Sales of Ready-Mixed Concrete, GB Volume of concrete
Ready-mixed concrete sales decreased by 4.3% in Quarter 3 2021 compared to
Quarter 2 2021, according to the seasonally adjusted data.
This followed a 4.3% increase in Quarter 2 2021.
Sales in Quarter 3 2021 increased by 1.1% compared to Quarter 1 2020 (before the
start of national restrictions due to the Covid-19 pandemic), following a 5.7% increase in
Quarter 2 2021, on the same basis. Sales increased by 5.0% in Quarter 3 2021
compared to Quarter 3 2020.
After the 2008 to 2009 recession, seasonally adjusted sales of ready-mixed concrete had been recovering steadily since Q2 2012, until the recent drop due to the Covid-19 pandemic.
7
Monthly Statistics of Building Materials and Components – January 2022
Bricks
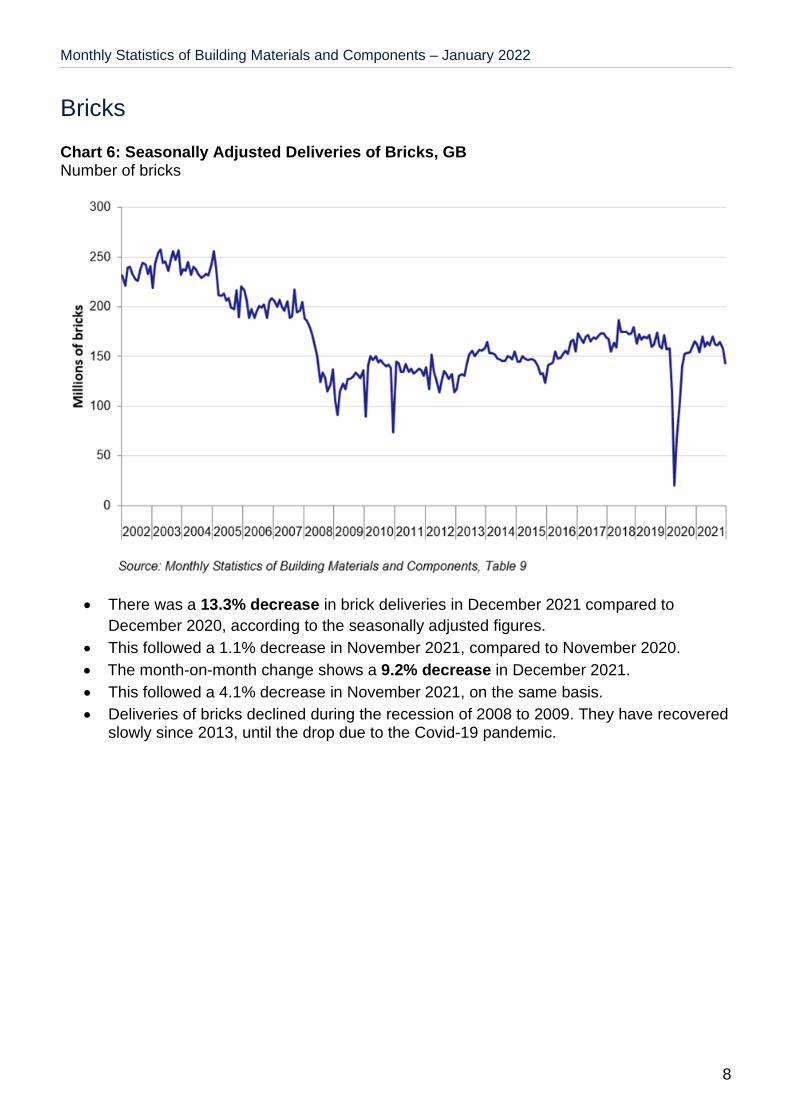
Chart 6: Seasonally Adjusted Deliveries of Bricks, GB Number of bricks
There was a 13.3% decrease in brick deliveries in December 2021 compared to
December 2020, according to the seasonally adjusted figures.
This followed a 1.1% decrease in November 2021, compared to November 2020.
The month-on-month change shows a 9.2% decrease in December 2021.
This followed a 4.1% decrease in November 2021, on the same basis.
Deliveries of bricks declined during the recession of 2008 to 2009. They have recovered slowly since 2013, until the drop due to the Covid-19 pandemic.
8
Monthly Statistics of Building Materials and Components – January 2022
Blocks
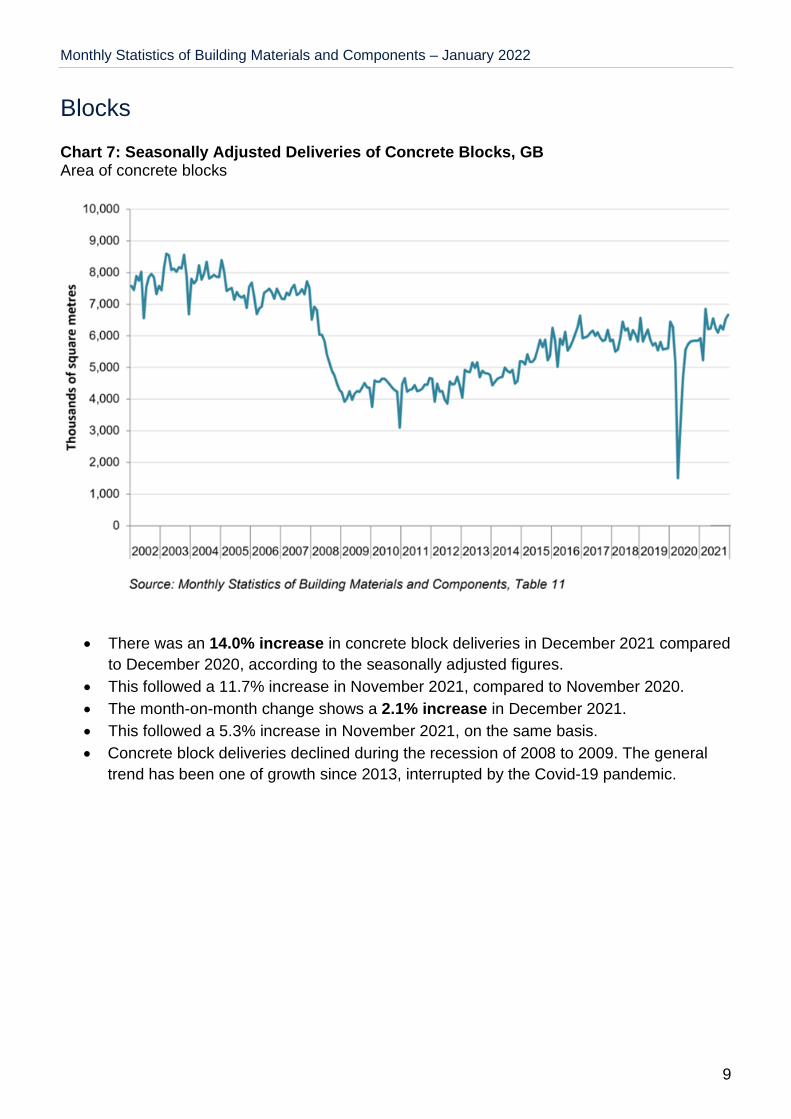
Chart 7: Seasonally Adjusted Deliveries of Concrete Blocks, GB Area of concrete blocks
There was an 14.0% increase in concrete block deliveries in December 2021 compared
to December 2020, according to the seasonally adjusted figures.
This followed a 11.7% increase in November 2021, compared to November 2020.
The month-on-month change shows a 2.1% increase in December 2021.
This followed a 5.3% increase in November 2021, on the same basis.
Concrete block deliveries declined during the recession of 2008 to 2009. The general
trend has been one of growth since 2013, interrupted by the Covid-19 pandemic.
9
Monthly Statistics of Building Materials and Components – January 2022
Imports and Exports of Construction Materials
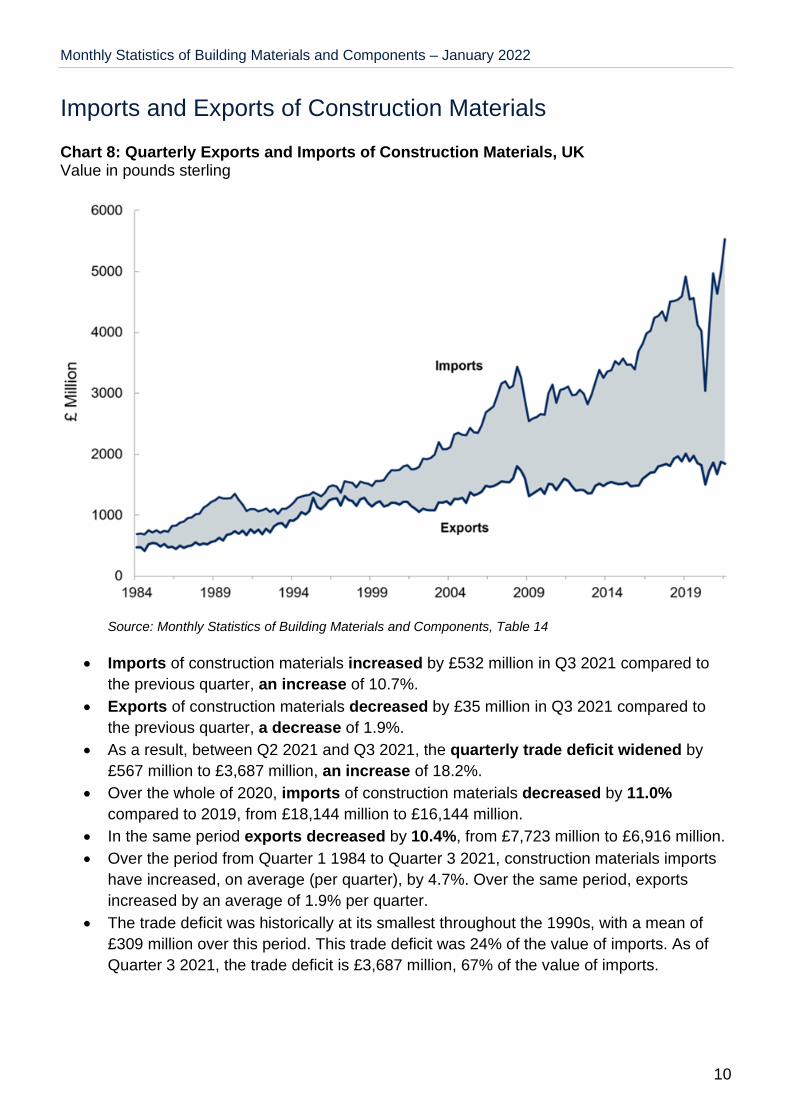
Chart 8: Quarterly Exports and Imports of Construction Materials, UK Value in pounds sterling
Source: Monthly Statistics of Building Materials and Components, Table 14
Imports of construction materials increased by £532 million in Q3 2021 compared to
the previous quarter, an increase of 10.7%.
Exports of construction materials decreased by £35 million in Q3 2021 compared to
the previous quarter, a decrease of 1.9%.
As a result, between Q2 2021 and Q3 2021, the quarterly trade deficit widened by
£567 million to £3,687 million, an increase of 18.2%.
Over the whole of 2020, imports of construction materials decreased by 11.0%
compared to 2019, from £18,144 million to £16,144 million.
In the same period exports decreased by 10.4%, from £7,723 million to £6,916 million.
Over the period from Quarter 1 1984 to Quarter 3 2021, construction materials imports
have increased, on average (per quarter), by 4.7%. Over the same period, exports
increased by an average of 1.9% per quarter.
The trade deficit was historically at its smallest throughout the 1990s, with a mean of
£309 million over this period. This trade deficit was 24% of the value of imports. As of
Quarter 3 2021, the trade deficit is £3,687 million, 67% of the value of imports.
10
Monthly Statistics of Building Materials and Components – January 2022
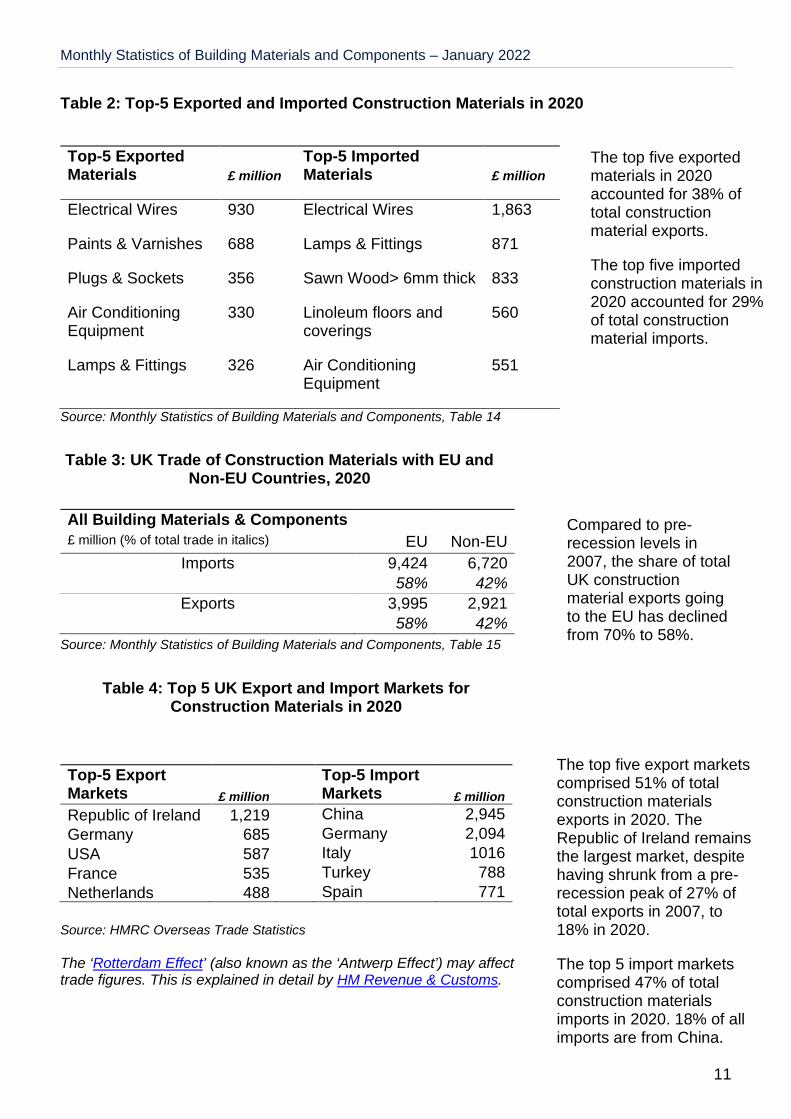
Table 2: Top-5 Exported and Imported Construction Materials in 2020
11
Top-5 Exported Materials £ million
Top-5 Imported Materials £ million
Electrical Wires 930 Electrical Wires 1,863
Paints & Varnishes 688 Lamps & Fittings 871
Plugs & Sockets 356 Sawn Wood> 6mm thick 833
Air Conditioning Equipment
330 Linoleum floors and coverings
560
Lamps & Fittings 326 Air Conditioning 551Equipment
Source: Monthly Statistics of Building Materials and Components, Table 14
Source: Monthly Statistics of Building Materials and Components, Table 15
Source: HMRC Overseas Trade Statistics
The ‘Rotterdam Effect’ (also known as the ‘Antwerp Effect’) may affect trade figures. This is explained in detail by HM Revenue & Customs.
All Building Materials & Components£ million (% of total trade in italics) EU Non-EU
Imports 9,424 6,72058% 42%
Exports 3,995 2,92158% 42%
Top-5 Export Markets £ million
Top-5 Import Markets £ million
Republic of Ireland 1,219 China 2,945
Germany 685 Germany 2,094
USA 587 Italy 1016
France 535 Turkey 788
Netherlands 488 Spain 771
The top five exported materials in 2020 accounted for 38% of total construction material exports.
The top five imported construction materials in 2020 accounted for 29% of total construction material imports.
Table 3: UK Trade of Construction Materials with EU and Non-EU Countries, 2020
Compared to pre-recession levels in 2007, the share of total UK construction material exports going to the EU has declined from 70% to 58%.
Table 4: Top 5 UK Export and Import Markets for Construction Materials in 2020
The top five export markets comprised 51% of total construction materials exports in 2020. The Republic of Ireland remains the largest market, despite having shrunk from a pre-recession peak of 27% of total exports in 2007, to 18% in 2020.
The top 5 import markets comprised 47% of total construction materials imports in 2020. 18% of all imports are from China.
Monthly Statistics of Building Materials and Components – January 2022
Economic Background
Business Insights
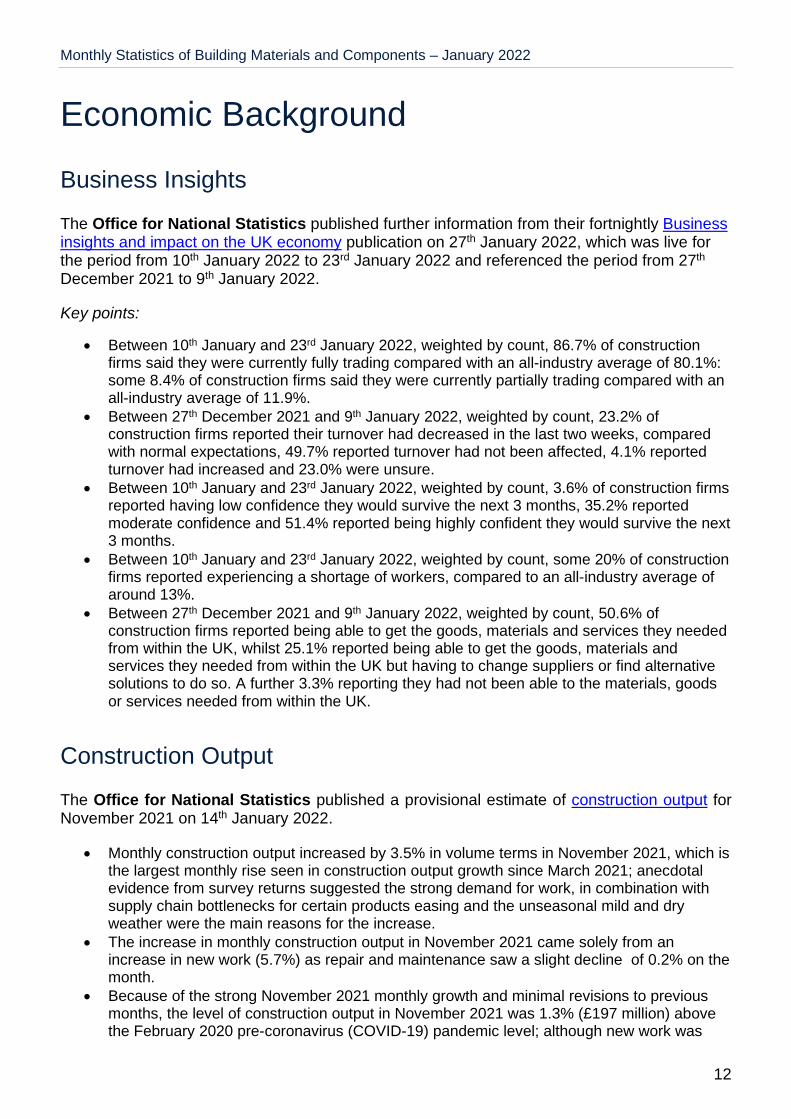
The Office for National Statistics published further information from their fortnightly Business
12
insights and impact on the UK economy publication on 27th January 2022, which was live for the period from 10th January 2022 to 23rd January 2022 and referenced the period from 27th
December 2021 to 9th January 2022.
Key points:
Between 10th January and 23rd January 2022, weighted by count, 86.7% of construction firms said they were currently fully trading compared with an all-industry average of 80.1%: some 8.4% of construction firms said they were currently partially trading compared with an all-industry average of 11.9%.
Between 27th December 2021 and 9th January 2022, weighted by count, 23.2% of construction firms reported their turnover had decreased in the last two weeks, compared with normal expectations, 49.7% reported turnover had not been affected, 4.1% reported turnover had increased and 23.0% were unsure.
Between 10th January and 23rd January 2022, weighted by count, 3.6% of construction firms reported having low confidence they would survive the next 3 months, 35.2% reported moderate confidence and 51.4% reported being highly confident they would survive the next 3 months.
Between 10th January and 23rd January 2022, weighted by count, some 20% of construction firms reported experiencing a shortage of workers, compared to an all-industry average of around 13%.
Between 27th December 2021 and 9th January 2022, weighted by count, 50.6% of construction firms reported being able to get the goods, materials and services they needed from within the UK, whilst 25.1% reported being able to get the goods, materials and services they needed from within the UK but having to change suppliers or find alternative solutions to do so. A further 3.3% reporting they had not been able to the materials, goods or services needed from within the UK.
Construction Output
The Office for National Statistics published a provisional estimate of construction output for November 2021 on 14th January 2022.
Monthly construction output increased by 3.5% in volume terms in November 2021, which is the largest monthly rise seen in construction output growth since March 2021; anecdotal evidence from survey returns suggested the strong demand for work, in combination with supply chain bottlenecks for certain products easing and the unseasonal mild and dry weather were the main reasons for the increase.
The increase in monthly construction output in November 2021 came solely from an increase in new work (5.7%) as repair and maintenance saw a slight decline of 0.2% on the month.
Because of the strong November 2021 monthly growth and minimal revisions to previous months, the level of construction output in November 2021 was 1.3% (£197 million) above the February 2020 pre-coronavirus (COVID-19) pandemic level; although new work was
Monthly Statistics of Building Materials and Components – January 2022
1.6% (£148 million) below the February 2020 level, repair and maintenance work was 6.9% (£345 million) above the February 2020 level.
The recovery to date, since the falls at the start of the pandemic, is mixed at a sector level, with infrastructure 49.3% (£923 million) above and private commercial 28.0% (£698 million) below their respective February 2020 levels in November 2021.
Alongside the monthly increase, construction output rose 1.6% in the three months to November 2021, the first three-monthly increase since July 2021, with similar increases seen in both new work, and repair and maintenance (1.5% and 1.6% respectively).
Bank of England Summary of Business Conditions
The Bank of England published its most recent update to the Agents’ Summary of Business
13
Conditions on 16th December 2021, covering intelligence gathered between mid-July and early September 2021.
Key points:
Construction output slowed as materials, labour shortages and cost increases weighed on activity.
There were widespread reports of output being constrained by supply-chain issues that affected the availability of materials and labour shortages.
Demand for new build private housing remained strong and supported activity, though some housebuilders said shortages and planning delays had led to slower build rates.
Some contacts said that there was caution about committing to new developments due to the uncertainty caused by supply bottlenecks, rising materials and labour costs, lack of availability of land and planning difficulties.
There were also reports of construction projects being postponed due to higher materials costs, and a few instances of companies going into administration, due to the impact of higher costs on their margins.
By contrast, some contacts reported positive demand for renovation work for residential and commercial properties. Public infrastructure projects also continued to support construction output, though there were also some reports of slowing demand from this source.
Gross Domestic Product Estimate
The Office for National Statistics published estimates of GDP for November 2021 on 14 January 2022:
Key points:
Gross domestic product (GDP) is estimated to have grown by 0.9% in November 2021 and is above its pre-coronavirus (COVID-19) pandemic level (February 2020) for the first time, by 0.7%.
Services (0.7%), production (1.0%) and construction (3.5%) output all increased between October and November 2021; this means that services and construction output are both 1.3% above their pre-coronavirus levels while production remains 2.6% below.
In the latest month, output in consumer-facing services grew by 0.8%, mainly because of a 1.4% increase in retail trade, while all other services rose by 0.6%; consumer-facing services are still 5.0% below their pre-coronavirus levels, while all other services are 2.9% above.
Monthly Statistics of Building Materials and Components – January 2022
If there are no other data revisions, quarterly GDP for Quarter 4 (Oct to Dec) 2021 will either reach or surpass its pre-coronavirus level (Quarter 4 2019), provided our monthly December 2021 estimate does not fall by more than 0.2%.
Gross Domestic Product Forecast
The latest monthly Consensus Economics forecast survey (which uses an average of private
14
sector forecasts) results were published in January 2022.
Key points:
The mean GDP forecast for 2022 is 4.3% growth, down from 4.7% the previous month’s survey.
The mean GDP growth forecast for 2023 is 2.2%.
The Office for Budget Responsibility published a new Economic and Fiscal Outlook on27th October 2021.
GDP is expected to grow by 6.5% in 2021 (up from 4.0% from the previous forecast) and to reach pre-pandemic levels by the turn of the year.
Construction Output Forecasts
Experian published their Winter 2021/2022 forecasts for the construction sector in January 2022.
Key points:
The expectation is that in 2021 the construction industry recovered (+14%) most, but not all, of the contraction seen in 2020. However, there were substantial differences in sector performance, ranging from soaring output levels in the infrastructure sector (+36%) to a further decline in commercial construction (-2%).
The trend for construction over the 2022 to 2024 period is predicted to be similar to the economy as a whole, although growth is projected to be stronger in the former, driven by strong private housing, investment in rail, health and education stock, and industrial construction in particular. The primary risk to the forecasts is the rapid spread of the Omicron variant of the Covid 19 virus, which in a worst-case scenario could lead to a fourth national lockdown across the UK.
Public housing is one of only two sectors, the other being the commercial one, in which output is projected to be still below its pre-pandemic level in 2024. Output in the sector fell by almost a third in 2020 and the recovery last year has been a modest 4%. While growth over the three years to 2024 is expected to average around 5% per annum, in the normal course of events a reasonable level of expansion, it will still not be enough to take output back to 2019 levels.
New infrastructure output is estimated to have soared in 2021, by well over a third, after only a modest fall of around 5% in the previous year, making the sector by far the best performer during the two years of the pandemic so far. Electricity, roads and rail (notwithstanding issues around the accuracy of ONS sub-sector breakdowns) were the primary drivers of the very strong growth last year. However, having surged so strongly in 2021, infrastructure output is expected to increase only moderately in the three years to 2024.
Monthly Statistics of Building Materials and Components – January 2022
The public non-residential building sector struggled to show much growth last year, with output in by far the biggest sub-sector, education, which accounts for nearly 50% of the sector, stagnant. However, the drive to build 500 new schools by 2030, combined with a rise in university work should mean that the period of stagnation is short lived, and expansion returns from 2022 onwards.
Industrial construction output rose only marginally in 2021, with the warehouse sub-sector experiencing its first contraction for seven years. However, the sector should return to growth this year and over the three-year forecast period is projected to see the strongest rate of expansion of any construction sector, averaging nearly 13% per annum.
The commercial construction sector suffered one of the biggest contractions in 2020, but it was the only sector to see a fall last year, of an estimated 2%. The big decline in GDP in 2020, substantial changes to office working practices, big drops in footfall and an even faster rise in online retailing, and the complete lockdown of some sectors during the course of the year combined to sharply reduce the demand for new facilities. The problem the sector has moving forward is that a number of the above factors are likely to persist into the medium and long term.
As is the case across the construction industry, non-residential R&M output is expected to have bounced back strongly in 2021 from its pandemic-induced contraction in 2020. After double-digit growth across the non-residential R&M sub-sectors in 2021, expansion is projected to moderate thereafter.
The Construction Products Association published their Construction industry forecasts for
15
Winter 2021/2022 in January 2022.
The Construction Products Association (CPA) forecasts that output in the industry will grow by 4.3% in 2022, slowing to 2.5% in 2023 compared to the 13.3% seen in 2021. This demonstrates the resilience of the sector to the initial Covid-19 lockdown and the end of the Brexit transition period in 2020.
Housebuilding, the largest sector within the UK construction industry, is expected to remain buoyant while infrastructure will be the major driver for growth.
Product supply issues, a major challenge in 2021, have eased recently, but may still cause problems, particularly in the spring period and particularly for smaller building companies.
Continuing to benefit from the ‘race for space’, output in private housing is forecast to rise by 3.0% in both 2022 and 2023 following 17.0% growth in 2021. The CPA suggests that the double-digit inflation in house prices will fall as the impact of the end of the stamp duty holiday and the further restriction of the Help to Buy scheme feeds through. The outlook for volume remains positive, with most major house builders reporting strong near-term demand and healthy profit margins fuelled by demand for housing in affordable areas of the UK.
Also benefiting from the ‘race for space’ in the near-term is the private housing rm&i sector. Here the CPA forecasts output to remain flat at the historically high level reached with 17.0% growth last year. Rising renovation project costs and higher inflation rates are expected to slow down consumer spending on larger projects. UK households have benefited from building up over £200 billion of savings from the past two years but rising costs are spelling caution for spending compared to 2021.
The CPA forecast indicates the infrastructure sector will remain the main driver for growth in 2022.
Key projects include the Thames Tideway Tunnel, Hinkley Point C and HS2. At least two of these projects report delays due to supply constraints and this could result in further work being pushed into 2023. Taking this into account, the sector is still expected to rise by 9.7% in 2022 and 1.1% in 2023, taking the sector to a new all-time high.
Monthly Statistics of Building Materials and Components – January 2022
While supply issues have eased off over the past six months, the CPA still considers these to be the biggest challenges to overall growth. These challenges are not spread equally across the sector, with smaller specialist sub-contractors feeling the pressure more.
Manufacturing
The latest Index of Production data for November 2021 were published on 14th January 2022
16
by the Office for National Statistics.
Key points for the SIC 23.1-4/7-9 industry (includes the manufacture of bricks, tiles and other construction products):
When comparing November 2021 with February 2020 (before the start of restrictions due to COVID-19), output increased by 5.4%
When comparing November 2021 with November 2020, output increased by 10.1% When comparing November 2021 with October 2021, output increased by 0.4%
Key points for the SIC 23.5-6 industry (includes the manufacture of concrete, cement and other products for construction purposes):
When comparing November 2021 with February 2020 (before the start of restrictions due to COVID-19), output increased by 5.4%
When comparing November 2021 with November 2020, output increased by 3.1% When comparing November 2021 with October 2021, output increased by 6.4%
Monthly Statistics of Building Materials and Components – January 2022
Accompanying tables
The most recently published data tables (available in Excel and ODS format) can be found on BEIS’ Building Materials and Components website. The list of tables is as follows:
17
1 Construction Material Price Indices
2 Price Indices of Construction Materials – monthly
3 Price Indices of Construction Materials – annual averages
4 Sales of Sand and Gravel in Great Britain (including seasonally adjusted sales)
5 Sales of Sand and Gravel by English Regions, Wales and Scotland
6 Sales of Sand and Gravel by English and Welsh Counties and Scottish Region
7 Slate: Production, Deliveries and Stocks
8 Cement and Clinker: Production, Deliveries and Stocks
9 Bricks: Production, Deliveries and Stocks for Great Britain (including seasonally adjusted deliveries)
10 Bricks: Production, Deliveries and Stocks by English Regions, Wales and Scotland (including seasonally adjusted deliveries)
11 Concrete Building Blocks: Production, Deliveries and Stocks for Great Britain
12 Concrete Building Blocks: Production, Deliveries and Stocks by English Regions, Wales and Scotland
13 Concrete Roofing Tiles and Ready-Mixed Concrete (including seasonally adjusted sales of ready-mixed concrete)
14 Value of Overseas Trade in Selected Materials and Components for Constructional Use: Imports (CIF) and Exports (FOB)
15 Value of EU and Non-EU Trade in Selected Materials and Components for Constructional Use: Imports (CIF) and Exports (FOB)
Accompanying tables with data relating to 2011 are accessible from this link.
Accompanying tables for 2005 - 2010 are accessible from this link.
Requests for older data should be sent to [email protected].
Monthly Statistics of Building Materials and Components – January 2022
Technical information
1. The Office of National Statistics (ONS) replaced the following price indices for construction
materials from the November 2020 release of this publication (published on 4th December
2020) onwards; Sand & Gravel excluding/including levy, Crushed rock excluding/including
levy, and Bituminous materials. This affects Tables 1, 2 and 3 in the bulletin and Table 1 in
the commentary. Further information is provided in the footnotes of each table. A back
series of both the previous and replacement indices was published alongside the
November 2020 release of this publication.
2. In work done for the Department for Business, Innovation and Skills (BIS) on improving the
quality of statistics published in the Monthly Statistics of Building Materials and
Components, the Office for National Statistics’ Methodology Advisory Service (MAS)
recommended that BIS should start seasonally adjusting key data series (see ONS/MAS
18
review of building materials statistics: final report for more detail). Seasonal adjustment is
widely used in official statistics and aids data interpretation by removing effects associated
with the time of the year or arrangement of the calendar. Seasonal effects often obscure
features of interest in data, such as long-term trends and effects of unusual occurrences.
By removing seasonal effects, users can more readily identify the features of interest.
Following advice from the MAS, and the results of a consultation (see the results of the BIS consultation on seasonal adjustment for more detail), BIS agreed to publish seasonally adjusted data for the following series:
Sand and gravel, total sales Concrete blocks, all types deliveries Bricks, all types deliveries Ready-mixed concrete, deliveries
For initial publication of seasonally adjusted data, data from 1983 onwards was seasonally adjusted. Subsequently, for each monthly publication, data up to 12 months or 4 quarters prior to the new data point is revised. Upon the completion of each year’s data series, data for the previous 12 years is revised. BEIS publishes both non-seasonally adjusted and seasonally adjusted data in the tables of this publication. From the June 2015 edition this publication has used seasonally adjusted data in the commentary for these series. The most recent annual review of seasonal adjustment was carried out in June 2021.
3. Quality issues related to the Building Materials and Components outputs are discussed in the review of the Building Material statistics that was carried out in 2010 by BIS’s construction team. The review aimed to ascertain user needs, examine whether existing data collection methodologies are fit for purpose, estimate compliance costs, assess compliance with the Code of Practice and identify options for change.
The full report can be found on the BEIS Building Materials and Components webpage.
Detailed information on data suppliers, coverage and data collection methodology can be found in sections 2.1-2.10. Quality issues (coverage and accuracy of sample panels, response rates, survey results processing, disclosure etc.) and potential measures that could
Monthly Statistics of Building Materials and Components – January 2022
be employed to improve the quality of the statistics are discussed in section 2.11 of the review. Users’ views on the quality of the Building Materials and Components statistics are given in section 3.3.4. These are derived from a user survey carried out in early 2010, as part of the review (see section 3 for details).
4. Following the review, BIS acted on the recommendations including commissioning the Office for National Statistics Methodology Advisory Service (ONS/MAS) to address some of the recommendations from the 2010 review. In July 2011, MAS published their interim report.
19
In July 2012, MAS published their final report.
5. HM Revenue and Customs use administrative sources to produce Overseas Trade Statistics. A Statement of Administrative Sources used to compile construction material trade statistics is available on the BEIS Building Materials and Components webpage. Separately, HM Revenue and Customs also have a Statement of Administrative Sources which covers Overseas Trade Statistics.
6. The pre-announcement of any major changes to samples or methodology also details some methodological changes to the collection of data.
7. The following table gives a summary of response rates related to some of the latest survey results. Where the response rate is less than 100%, estimates are made for missing values.
For latest data used Bulletin table number Response rate
Quarterly Sand and Gravel 4, 5 & 6 68%Quarterly Sand and Gravel – Land Won 4, 5 & 6 65%Quarterly Sand and Gravel – Marine Dredged 4, 5 & 6 90%
Quarterly Slate 7 89%Quarterly Concrete Roofing Tiles 13 80%Monthly Bricks Provisional data 9 100%
Monthly Bricks Final data 9 & 10 100%Monthly Concrete Blocks 11 & 12 93%
Monthly Statistics of Building Materials and Components – January 2022
Definitions
Further information
Future updates to these statistics
The next publication in this series will be on 2 March 2022.
Related statistics
1. Construction Statistics: Sources and Outputs lists the known sources of information available
20
on the construction industry and their outputs. These include information on employees, employment, enterprises, output and new orders in the construction industry as well as the contribution of the industry to the economy. Related information, for example housing, is also included.
2. The Construction Statistics Annual brings together a wide range of statistics currently available on the construction industry from a variety of sources and provides a broad perspective on statistical trends in the construction industry, with some international comparisons.
3. In its monthly Index of Production (IoP) publication, the Office for National Statistics
Production Products completed and ready for dispatch
publishes Gross Value Added (seasonally adjusted, UK) data for the following two industries:
SIC 23.1-4/7-9 industry, which includes the manufacture of bricks, tiles and other construction products.
SIC 23.5-6 industry, which includes the manufacture of concrete, cement and other products for construction purposes.
Deliveries Sold products which have left the premises
Stocks Manufacturer’s stocks
CIF Cost, insurance and freight (for more information on shipping terms, visit the HMRC website)
FOB Free on-board (for more information on shipping terms, visit the HMRC website)
Sand and gravel -
land won
Sand and gravel -
marine dredged
Sand and gravel from pits and quarries, including that derived from beaches and rivers
Sand and gravel derived from seas and estuaries
Monthly Statistics of Building Materials and Components – January 2022
These data are not directly comparable with the data in this bulletin, due to differences in coverage and methodology. They are nevertheless useful in illustrating the latest output trends of related construction materials as measured by the Office for National Statistics.
Revisions policy
1. Our revisions policy can be found on the BEIS Building Materials webpage.
21
2. The pre-announcement of any major changes to samples or methodology and Summary of Revisions give further information on revisions and other changes to data and can also be found on the BEIS Building Materials webpage.
Uses of these statistics
The Building Materials and Components statistics are used for a variety of purposes, including policy development and evaluation concerning the construction products industry, as well as monitoring market trends. In a wider context, the figures are regularly reported in the construction press to facilitate market analysis and business planning for its wide range of readers. The statistics are also increasingly used by financial institutions for assessing market information and industry trends. For more information on the uses of the Building Materials statistics, their usefulness to users and users’ views on the quality of these statistics, see Section 3 of the Building Materials and Components review.
User engagement
Users are encouraged to provide comments and feedback on how these statistics are used and how well they meet user needs. Comments on any issues relating to this statistical release are welcomed and should be sent to: [email protected]
The Consultative Committee on Construction Industry Statistics (CCCIS) meets twice a year, chaired by BEIS, to discuss issues relating to the collection and dissemination of UK construction statistics. The CCCIS has a wide membership representing government, the construction industry and independent analysts. Minutes of previous CCCIS meetings are available from the BEIS building materials web page.
The BEIS statement on statistical public engagement and data standards sets out the department’s commitments on public engagement and data standards as outlined by the Code of Practice for Statistics.
National Statistics designation
National Statistics status means that our statistics meet the highest standards of trustworthiness, quality and public value, and it is our responsibility to maintain compliance with these standards.
The statistics last underwent a full assessment against the Code of Practice for Statistics in 2011.
Monthly Statistics of Building Materials and Components – January 2022
Since the latest review by the Office for Statistics Regulation, we have continued to comply with the Code of Practice for Statistics, and have made the following improvements:
carried out a public consultation and introduced publication of seasonally adjusted data
22
on deliveries of sand and gravel, concrete blocks, bricks, and ready-mixed concrete
in response to the cessation of DLUHC’s (Department for Levelling Up, Housing and
Communities, formerly MHCLG) Annual Minerals Raised Inquiry, which previously
supplied the sampling frame for the land-won sand and gravel survey, we have:
o changed the survey from sample survey to a census, increasing the panel from
200 sites to around 500 sites
o refreshed the panel of sites annually using information from the British Geological
Survey
o made the survey statutory under the Statistics of Trade Act 1947, bringing it into
line with the marine-dredged sand and gravel survey
improved the design of the blocks survey, making it fully monthly instead of a mixture of
monthly and quarterly data collection
introduced the publication of the tables in an OpenDocument (ODS) spreadsheet, in
addition to Microsoft Excel
rebased all price indices series to 2015=100 in the November 2020 publication
Contact
Responsible statistician: Amy Symes-Thompson
Email: [email protected]
Media enquiries: 020 7215 1000
Public enquiries: +44 (0)207 215 6498

© Crown copyright 2022
This publication is licensed under the terms of the Open Government Licence v3.0 except where otherwise stated. To view this licence, visit nationalarchives.gov.uk/doc/open-government-licence/version/3 or write to the Information Policy Team, The National Archives, Kew, London TW9 4DU, or email: [email protected].
Where we have identified any third-party copyright information you will need to obtain permission from the copyright holders concerned.
This publication is available from: https://www.gov.uk/government/collections/building-materials-and-components-monthly-statistics-2012
If you need a version of this document in a more accessible format, please email [email protected]. Please tell us what format you need. It will help us if you say what assistive technology you use.
Copyright © 2022 FDOKUMEN