Monte Carlo simulations of excitation and electron transfer in grana membranes
14
Monte Carlo simulations of excitation and electron transfer in grana membranes Krzysztof Gibasiewicz a, ⁎, Małgorzata Adamiec b , Robert Luciński b , Wojciech Giera a , Przemysław Chełminiak a , Sebastian Szewczyk a , Weronika Sipińska a , Edyta Głów a , Jerzy Karolczak a,c , Rienk van Grondelle d , Grzegorz Jackowski b a Department of Molecular Biophysics, Faculty of Physics, Adam Mickiewicz University, ul. Umultowska 85, 61-614 Poznań, Poland b Department of Plant Physiology, Institute of Experimental Biology, Faculty of Biology, Adam Mickiewicz University, ul. Umultowska 89, 61-614 Poznań, Poland c Ultrafast Laser Spectroscopy Center, Faculty of Physics, Adam Mickiewicz University, ul. Umultowska 85, 61-614 Poznań, Poland d Department of Physics and Astronomy, VU University, De Boelelaan 1081, 1081 HV Amsterdam, The Netherlands abstract article info Article history: Received 21 July 2014 Received in revised form 5 December 2014 Accepted 9 December 2014 Available online 15 December 2014 Keywords: Photosystem II Light Harvesting Complex II Excitation energy transfer Electron transfer Streak camera Monte Carlo simulation Time-resolved fluorescence measurements on grana membranes with instrumental response function of 3 ps re- veal faster excitation dynamics (120 ps) than those reported previously. A possible reason for the faster decay may be a relatively low amount of “extra” LHCII trimers per reaction center of Photosystem II. Monte Carlo modeling of excitation dynamics in C 2 S 2 M 2 form of PSII–LHCII supercomplexes has been performed using a coarse grained model of this complex, constituting a large majority of proteins in grana membranes. The main factor responsible for the fast fluorescence decay reported in this work was the deep trap constituted by the pri- mary charge separated state in the reaction center (950–1090 cm −1 ). This value is critical for a good fit, whereas typical hopping times between antenna polypeptides (from ~4.5 to ~10.5 ps) and reversible primary charge sep- aration times (from ~4 to ~1.5 ps, respectively) are less critical. Consequently, respective mean migration times of excitation from anywhere in the PSII–LHCII supercomplexes to reaction center range from ~30 to ~80 ps. Thus 1/4–2/3 of the ~120-ps average excitation lifetime is necessary for the diffusion of excitation to reaction center, whereas the remaining time is due to the bottle-neck effect of the trap. Removal of 27% of the Lhcb6 apoprotein pool by mutagenesis of DEG5 gene caused the acceleration of the excitation decay from ~120 to ~100 ps. This effect may be due to the detachment of LHCII-M trimers from PSII–LHCII supercomplexes, accompanied by deep- ening of the reaction center trap. © 2014 Elsevier B.V. All rights reserved. 1. Introduction In grana membranes, Photosystem II occurs as a dimeric PSII–LHCII supercomplex composed of two core complexes (C 2 ) and two sets of symmetrical, peripheral antenna complexes surrounding the cores. Each core complex contains one reaction center and inner light- harvesting complexes CP43 and CP47 (comprising PsbB and PsbC apoproteins, respectively). The set of peripheral antenna complexes makes CP29, CP26 and CP24 which are connected directly to the core as well as two types of LHCII trimers: S trimers (strongly bound to the core, in contact with CP43 and CP26) and M trimers (moderately bound to the core, in contact with CP29 and CP24) [1]. Presumably, the largest supercomplex called C 2 S 2 M 2 – containing two LHCII S trimers and two M trimers – is the complex which is the most abundant one in Arabidopsis thaliana thylakoid membranes [2]. The antenna size of PSII–LHCII supercomplex plays an important role in excitation energy transfer within this complex. Namely, studies per- formed on PSII–LHCII supercomplexes with various antenna sizes (puri- fied from grana membranes by separation on sucrose gradients) demonstrated that a decrease in size of the complex led to speeding up of fluorescence kinetics [3]. However, since purification of PSII– LHCII supercomplexes with different antenna sizes requires the applica- tion of detergents to solubilize thylakoid membranes, which may affect adversely the architecture and excitation energy transfer of the supercomplexes, native membranes (grana or thylakoids) remain a preferable system to study excitation energy transfer in PSII. In the case of thylakoids, however, contribution from Photosystem I makes in- terpretation of the experimental data of excitation energy transfer in PSII much more complex and problematic [4]. Using single photon counting approach it was shown that the aver- age excitation lifetime in grana is about 150 ps [3,5,6], significantly less than the values reported in older papers [7,8] which came likely from Biochimica et Biophysica Acta 1847 (2015) 314–327 Abbreviations: FWHM,fullwidth athalfmaximum; IRF, instrumental response function; MC, Monte Carlo; Hepes, (4-(2-hydroxyethyl)-1-piperazineethanesulfonic acid); PVDF, polyvinylidene difluoride; RC, reaction center ⁎ Corresponding author. Tel.: +48 61 8296370. E-mail address: [email protected] (K. Gibasiewicz). http://dx.doi.org/10.1016/j.bbabio.2014.12.004 0005-2728/© 2014 Elsevier B.V. All rights reserved. Contents lists available at ScienceDirect Biochimica et Biophysica Acta journal homepage: www.elsevier.com/locate/bbabio
-
Upload
independent -
Category
Documents
-
view
0 -
download
0
Transcript of Monte Carlo simulations of excitation and electron transfer in grana membranes
Biochimica et Biophysica Acta 1847 (2015) 314–327
Contents lists available at ScienceDirect
Biochimica et Biophysica Acta
j ourna l homepage: www.e lsev ie r .com/ locate /bbab io
Monte Carlo simulations of excitation and electron transfer ingrana membranes
Krzysztof Gibasiewicz a,⁎, Małgorzata Adamiec b, Robert Luciński b, Wojciech Giera a, Przemysław Chełminiak a,Sebastian Szewczyk a, Weronika Sipińska a, Edyta Głów a, Jerzy Karolczak a,c,Rienk van Grondelle d, Grzegorz Jackowski b
a Department of Molecular Biophysics, Faculty of Physics, Adam Mickiewicz University, ul. Umultowska 85, 61-614 Poznań, Polandb Department of Plant Physiology, Institute of Experimental Biology, Faculty of Biology, AdamMickiewicz University, ul. Umultowska 89, 61-614 Poznań, Polandc Ultrafast Laser Spectroscopy Center, Faculty of Physics, Adam Mickiewicz University, ul. Umultowska 85, 61-614 Poznań, Polandd Department of Physics and Astronomy, VU University, De Boelelaan 1081, 1081 HV Amsterdam, The Netherlands
Abbreviations:FWHM,fullwidthathalfmaximum;IRF,MC, Monte Carlo; Hepes, (4-(2-hydroxyethyl)-1-piperazpolyvinylidenedifluoride; RC, reaction center⁎ Corresponding author. Tel.: +48 61 8296370.
E-mail address: [email protected] (K. Gibasiewicz)
http://dx.doi.org/10.1016/j.bbabio.2014.12.0040005-2728/© 2014 Elsevier B.V. All rights reserved.
a b s t r a c t
a r t i c l e i n f oArticle history:Received 21 July 2014Received in revised form 5 December 2014Accepted 9 December 2014Available online 15 December 2014
Keywords:Photosystem IILight Harvesting Complex IIExcitation energy transferElectron transferStreak cameraMonte Carlo simulation
Time-resolved fluorescencemeasurements on granamembraneswith instrumental response function of 3 ps re-veal faster excitation dynamics (120 ps) than those reported previously. A possible reason for the faster decaymay be a relatively low amount of “extra” LHCII trimers per reaction center of Photosystem II. Monte Carlomodeling of excitation dynamics in C2S2M2 form of PSII–LHCII supercomplexes has been performed using acoarse grained model of this complex, constituting a large majority of proteins in grana membranes. The mainfactor responsible for the fast fluorescence decay reported in this work was the deep trap constituted by the pri-mary charge separated state in the reaction center (950–1090 cm−1). This value is critical for a good fit, whereastypical hopping times between antenna polypeptides (from ~4.5 to ~10.5 ps) and reversible primary charge sep-aration times (from ~4 to ~1.5 ps, respectively) are less critical. Consequently, respective mean migration timesof excitation from anywhere in the PSII–LHCII supercomplexes to reaction center range from ~30 to ~80 ps. Thus1/4–2/3 of the ~120-ps average excitation lifetime is necessary for the diffusion of excitation to reaction center,whereas the remaining time is due to the bottle-neck effect of the trap. Removal of 27% of the Lhcb6 apoproteinpool by mutagenesis of DEG5 gene caused the acceleration of the excitation decay from ~120 to ~100 ps. Thiseffect may be due to the detachment of LHCII-M trimers from PSII–LHCII supercomplexes, accompanied by deep-ening of the reaction center trap.
© 2014 Elsevier B.V. All rights reserved.
1. Introduction
In grana membranes, Photosystem II occurs as a dimeric PSII–LHCIIsupercomplex composed of two core complexes (C2) and two sets ofsymmetrical, peripheral antenna complexes surrounding the cores.Each core complex contains one reaction center and inner light-harvesting complexes CP43 and CP47 (comprising PsbB and PsbCapoproteins, respectively). The set of peripheral antenna complexesmakes CP29, CP26 and CP24 which are connected directly to the coreas well as two types of LHCII trimers: S trimers (strongly bound to thecore, in contact with CP43 and CP26) and M trimers (moderatelybound to the core, in contact with CP29 and CP24) [1]. Presumably,the largest supercomplex called C2S2M2 – containing two LHCII S
instrumentalresponsefunction;ineethanesulfonic acid); PVDF,
.
trimers and twoM trimers – is the complexwhich is themost abundantone in Arabidopsis thaliana thylakoid membranes [2].
The antenna size of PSII–LHCII supercomplex plays an important rolein excitation energy transfer within this complex. Namely, studies per-formed on PSII–LHCII supercomplexeswith various antenna sizes (puri-fied from grana membranes by separation on sucrose gradients)demonstrated that a decrease in size of the complex led to speedingup of fluorescence kinetics [3]. However, since purification of PSII–LHCII supercomplexeswith different antenna sizes requires the applica-tion of detergents to solubilize thylakoid membranes, whichmay affectadversely the architecture and excitation energy transfer of thesupercomplexes, native membranes (grana or thylakoids) remain apreferable system to study excitation energy transfer in PSII. In thecase of thylakoids, however, contribution from Photosystem Imakes in-terpretation of the experimental data of excitation energy transfer inPSII much more complex and problematic [4].
Using single photon counting approach it was shown that the aver-age excitation lifetime in grana is about 150 ps [3,5,6], significantly lessthan the values reported in older papers [7,8] which came likely from

315K. Gibasiewicz et al. / Biochimica et Biophysica Acta 1847 (2015) 314–327
grana samples “contaminated” by closed complexes (with reduced QA
acceptor) or from uncoupled LHCII trimers. In principle in any studiesperformed on grana membranes with the use of fluorescence tech-niques there is some uncertainty associated with the presence of re-gions rich in “extra” LHCII trimers [9]. Precise determination of thenumber of LHCII trimers per PSII core may be helpful in the modelingof excitation energy transfer in native photosynthetic membranes.Recently, a coarse-grained model was successfully introduced allowingcalculation of a few basic parameters influencing the excitation decay inPSII–LHCII supercomplexes and depicting interpolypeptide excitationhopping, primary and secondary charge separation, and charge recom-bination in PSII reaction centers [3,5,6]. These parameters allow estima-tion of mean migration time of excitation from the antenna system toreaction center and, in consequence, allow conclusions on the limitingsteps in excitation decay.
In this paper we report significantly faster excitation decay in granamembranes than previously reported and model this decay using theMonte Carlo method of excitation and electron transfer in PSII–LHCIIsupercomplex. A model of significant reversibility of primary chargeseparation is supported and a new set of hopping and electron transferparameters is proposed to be consistent with a short, 120-ps, averageexcitation lifetime. The data obtained for WT preparations areconfronted with those recorded for mutant lacking ~25% of Lhcb6apoprotein pool (CP24 complex).
2. Materials and methods
2.1. Plant material and growth conditions
A. thaliana plants (ecotype Columbia) were grown for five weeks in42-mm Jiffy peat pellets on sphagnum peat moss and wood pulp(AgroWit, Przylep, Poland) under long-day conditions (16 h/8 h, light/dark)with an irradiance of 110 μmol photonsm−2 s−1 at a constant tem-perature of 22 °C and 70% humidity. A. thaliana seeds (SALK_099162)with a T-DNA insertion in the DEG5 gene (At4g18370) were obtainedfrom NASC (Nottingham Arabidopsis Stock Center, Nottingham, UK).The T-DNA insertion was confirmed and hetero/homozygosity was ana-lyzed by PCR using the following primers: forward, 5′-GCTTTTTCCTCAATCTTCAATAC-3′ and reverse, 5′-AGGATTTAGTTCACGTCCCTC-3′ for theDeg5 sequence, and LBb1 (5′-GCGTGGACCGCTTGCTGCAACT-3′) for theinsertion.
2.2. Isolation of thylakoids and grana membranes (BBY samples)
Intact chloroplasts were prepared using the Sigma Chloroplast Isola-tion Kit (Sigma-Aldrich, St. Louis, MO, USA) as described by us earlier[10] and the isolation of thylakoids was done according to [11]. Granamembranes were isolated from chloroplasts of wild type (WT) or deg5mutant plants according to the method of [12] with the modificationsdescribed by [13], using Triton X-100/Chl ratio of 21.2:1 (v/v) to solubi-lize thylakoid membranes. The pellet of grana membranes was resus-pended in a small volume of a buffer containing 20 mM Hepes/KOH(pH = 7.5), 5 mM MgCl2, 15 mM NaCl and 10% glycerol and storedat −20 °C.
2.3. SDS-PAGE, immunoblotting, protein quantitation and calculation of thenumber of LHCII trimers per PSII core
SDS-PAGE of thylakoids or grana membranes was performed in14.5% acrylamide gels using the [14] buffer system. The gels werestained with 0.025% CBB G-250 by the method of [14]. The stainedgels were scanned using Gelix One software (Biostep, Jahnsdorf,Germany) and the number of LHCII trimers per PSII core was calculatedas [(Lhcb1 + Lhcb2 + Lhcb3) / Lhcb4] / 3. A 1.1 times stronger bindingof CBB G-250 to Lhcb4 vs Lhcb1/2/3 was taken into account [15].
To identify andquantify selected PSII apoproteins electrophoreticallyresolved thylakoid and grana membranes were electrotransferred ontoPVDF membranes (Roche, Basel, Switzerland), reacted with polyclonalantibodies raised against Lhcb1–6, PsaB, PsbC or PsbD apoproteins(Agrisera, Vannas, Sweden), detected by applying goat anti-rabbit bio-tinylated immunoglobulin G (Agrisera, Vannas, Sweden) and visualizedby using the Enhanced Chemiluminescence System (ECL) according tothe manufacturer's recommendations (Lumi-Light Western BlotSubstrate, Roche Diagnostics GmbH, Mannheim, Germany). The quanti-fication of immunostained signals was performed using Gelix Onesoftware.
2.4. Chlorophyll quantitation
The Chl concentration was assayed according to [16].
2.5. Measurements with streak camera
For streak camerameasurements, 20 μl of concentrated granamem-branes solutionwas diluted (to final OD of ~0.1 cm−1 atmaximumof Qy
band) in 2 ml 20 mM Hepes buffer pH = 6.5 containing 15 mM NaCl,5 mM MgCl2, 0.005% β-dodecylmaltoside, and fresh 1 mM K3Fe(CN)6in order to keep the reaction center in open state. The small amount ofdetergentwas added in order tominimize formation of large aggregatesof grana membranes.
The time-resolved fluorescence measurements were performedusing the setup in Laser Centrum, Vrije Universiteit, Amsterdam de-scribed in detail elsewhere [17]. The samples were excited at 400 nmwith a repetition rate of 125 kHz by vertically polarized ~100-fs pulses.The diameter of the laser spot on the sample was of about 200 μm. Thetypical energy of excitation was ~1 nJ per pulse, well below the levelleading to annihilation.
The fluorescence signal, measured at a right angle with respect tothe excitation beam by the detection system composed of spectrograph(Chromex 250IS), streak camera (Hamamatsu C5680), and CCD camera(Hamamatsu C4880), was recorded in three time windows: ~150 ps,~350 ps, and ~1500 ps with temporal resolution (FWHM of instrumentresponse function) of ~3 ps, ~6 ps, and ~16 ps, respectively. In order toobtain good enough signal to noise ratio, thefluorescence signal was ac-cumulated for 4× (10–20 min), 4× (5–10 min), and 4× (1–4 min) inthe respective time windows. The sample was placed in a rotating cu-vette to ensure that each laser pulse illuminated a fully relaxed sample.The rotating cuvette was tilted at ~45° relative to excitation beam andthe optical pathway length in the sample was ~2 mm.
The time resolved fluorescence spectra collected in the range 600–770 nm in all three time windows were analyzed simultaneously andglobally using the GLOTARAN software [18] yielding decay associatedspectra (DAS) [19].
2.6. Time-correlated single photon counting measurements
Time-correlated single photon counting (TC-SPC) measurementswere performed at the Center for Ultrafast Laser Spectroscopy, AdamMickiewicz University, Poznań, using the setup described elsewhere[20–22]. Grana membrane samples were suspended in a similarmedium as in the case of streak camera-based measurements. The con-centrated samplewas diluted in a buffer of pH=7.5 and of similar com-position to that one used for the streak camera measurements.Fluorescence kinetics were recorded by thermoelectrically cooledMCP-PMT R3809U-05 (Hamamatsu), following excitation at 400 nmby 2-ps laser pulses of typical energy of 1 pJ per pulse at a repetitionrate of 4 MHz. The sample was placed in a quartz fluorescence cuvette(1 cm × 1 cm) and stirred with a small magnetic stirrer during themeasurements.
Fluorescence kinetics were recorded in a 2.5 ns timewindowwith aresolution of 0.61 ps per channel (4096 channels) at 680 nm and
316 K. Gibasiewicz et al. / Biochimica et Biophysica Acta 1847 (2015) 314–327
analyzed by software using delta function convolutionmethod [23] andsimplex procedure [22]. According to the delta function convolutionmethod, fluorescence decays were fitted by convolution of the termcontaining three-exponential functions with the reference functionmeasured as fluorescence decay of pinacyanol solution in methanol at680 nm [23]. The decay of pinacyanol solution was characterized by8–10-ps lifetime. Instrument response function (IRF) was measuredalso at 400 nm using light scattered in Ludox solution and was typicallyof 42 ps FWHM. IRF wasmeasured in this way only in order to compareits width (FWHM) with the IRF width reported in other papers, and itwas not used in the fitting procedure since the quality of fits was betterwhen using pinacyanol decay as a reference.
3. Results and discussion
3.1. Biochemical properties of grana membranes of WT and deg5 mutantplants
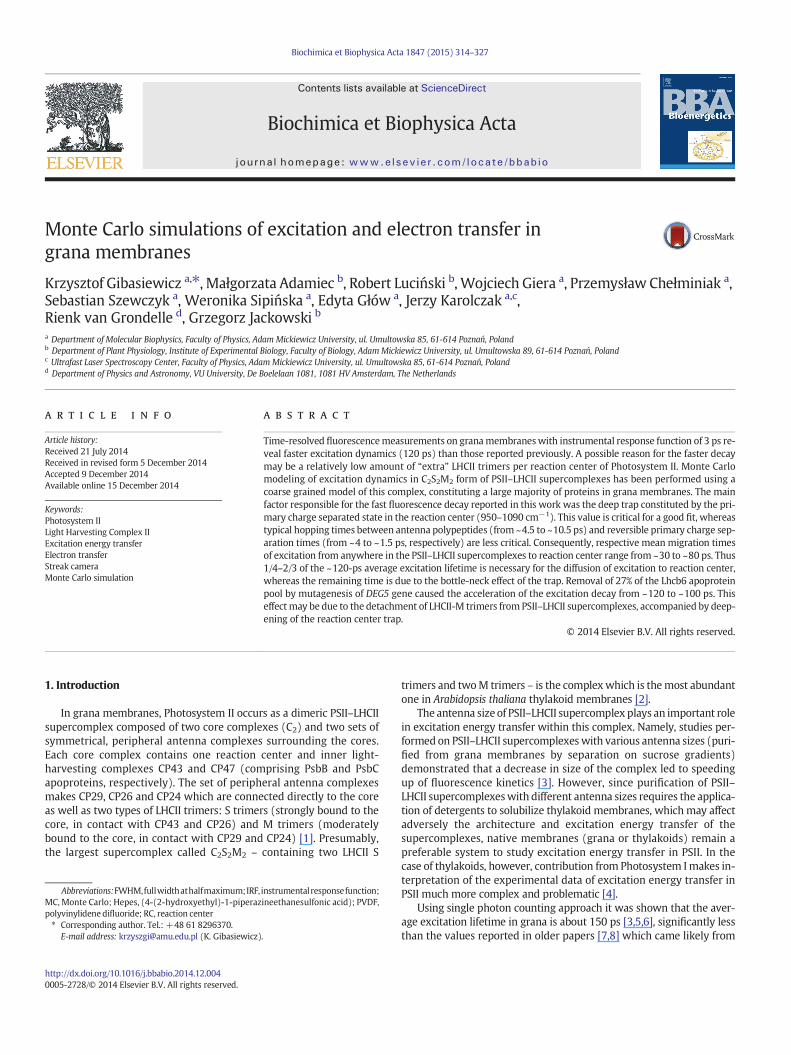
To study excitation dynamics in PSII–LHCII supercomplexes, granamembranes of the WT and deg5 plants were analyzed. The mutants,derived from source SALK_099162 linewere earlier shown to be homo-zygous for T-DNA insertion in the 2nd exon of At4g18370 gene, 429 bpdownstream of ATG codon and complementable by introduction of awild-type copy of the gene [11,24]. To assess accurately the purity ofthe grana membranes in terms of pigments composition, PSI/PSII ratiowas calculated as the total number of Chl a + b molecules associatedwith a PSI complex per the total number of Chl a+ bmolecules associ-atedwith PSII complex in the samples. To perform the calculation it wasnecessary to determine Chl a:Chl b ratio and the number of LHCII tri-mers per PSII core of the grana membranes. The determined Chl a:Chlb ratiowas 2.13:1 and 2.14:1 forWT plants and themutants, respective-ly. Lhcb1–4 levels were quantified by image analysis of CBB G-250stained gels to estimate a number of LHCII trimers per PSII core(Fig. 1). In WT plants and deg5 mutants there were on average 2.18 ±0.01 and 2.14 ± 0.01 LHCII trimers per PSII core, respectively (and adouble amount per PSII core dimer). Chl a:Chl b ratios and numbers ofLHCII trimers per PSII core were used to calculate PSI/PSII ratio, whichindependently of exact number of Chls a in PSII–LHCII supercomplexwas 0.01 or less (see Table A1 in Appendix A for numbers of consideredChls a and for formulas used for calculations). In agreementwith the re-sults of determination of PSI/PSII ratio it was found that grana mem-branes isolated both from chloroplasts of WT plants and deg5 mutants
Fig. 1. Identification and quantification of the number of LHCII trimers per PSII core. Anal-yses were conducted on grana membranes isolated from leaves of wild type plants (WT)and deg5 mutants. (a) Identification of Lhcb1–4 apoproteins. Grana membranes isolatedfrom leaves of wild type plants (WT) were resolved by SDS-PAGE, electrotransferredonto PVDF membranes and the membranes were immunostained with relevantantibodies. (b) Quantification of the number of LHCII trimers per PSII core. Grana mem-brane samples isolated from leaves of wild type (WT) and deg5 plants were resolved bySDS-PAGE (on the basis of an equal amount of chlorophyll), stained by CBB G-250 andthe gels scanned. The number of LHCII trimers per PSII core was calculated as[(Lhcb1 + Lhcb2 + Lhcb3) / Lhcb4] / 3. A 1.1 times stronger binding of CBB G-250 toLhcb4 vs Lhcb1/2/3 was taken into account.
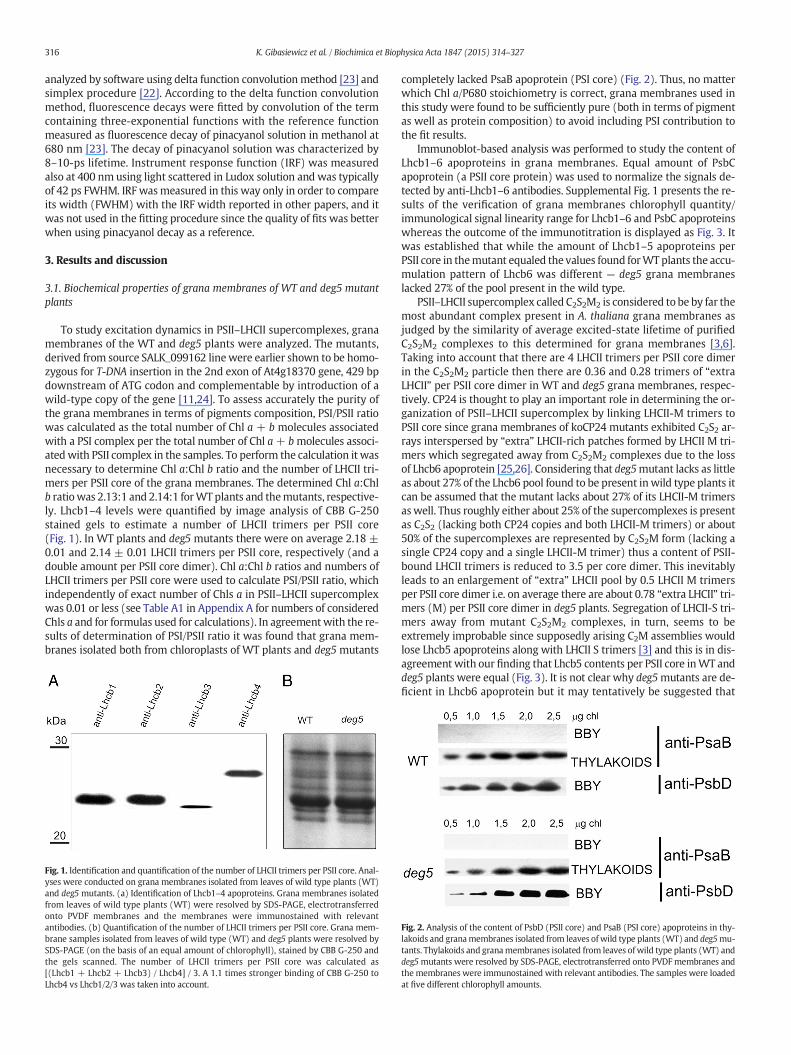
completely lacked PsaB apoprotein (PSI core) (Fig. 2). Thus, no matterwhich Chl a/P680 stoichiometry is correct, grana membranes used inthis study were found to be sufficiently pure (both in terms of pigmentas well as protein composition) to avoid including PSI contribution tothe fit results.
Immunoblot-based analysis was performed to study the content ofLhcb1–6 apoproteins in grana membranes. Equal amount of PsbCapoprotein (a PSII core protein) was used to normalize the signals de-tected by anti-Lhcb1–6 antibodies. Supplemental Fig. 1 presents the re-sults of the verification of grana membranes chlorophyll quantity/immunological signal linearity range for Lhcb1–6 and PsbC apoproteinswhereas the outcome of the immunotitration is displayed as Fig. 3. Itwas established that while the amount of Lhcb1–5 apoproteins perPSII core in themutant equaled the values found forWT plants the accu-mulation pattern of Lhcb6 was different — deg5 grana membraneslacked 27% of the pool present in the wild type.
PSII–LHCII supercomplex called C2S2M2 is considered to be by far themost abundant complex present in A. thaliana grana membranes asjudged by the similarity of average excited-state lifetime of purifiedC2S2M2 complexes to this determined for grana membranes [3,6].Taking into account that there are 4 LHCII trimers per PSII core dimerin the C2S2M2 particle then there are 0.36 and 0.28 trimers of “extraLHCII” per PSII core dimer in WT and deg5 grana membranes, respec-tively. CP24 is thought to play an important role in determining the or-ganization of PSII–LHCII supercomplex by linking LHCII-M trimers toPSII core since grana membranes of koCP24 mutants exhibited C2S2 ar-rays interspersed by “extra” LHCII-rich patches formed by LHCII M tri-mers which segregated away from C2S2M2 complexes due to the lossof Lhcb6 apoprotein [25,26]. Considering that deg5mutant lacks as littleas about 27% of the Lhcb6 pool found to be present inwild type plants itcan be assumed that the mutant lacks about 27% of its LHCII-M trimersaswell. Thus roughly either about 25% of the supercomplexes is presentas C2S2 (lacking both CP24 copies and both LHCII-M trimers) or about50% of the supercomplexes are represented by C2S2M form (lacking asingle CP24 copy and a single LHCII-M trimer) thus a content of PSII-bound LHCII trimers is reduced to 3.5 per core dimer. This inevitablyleads to an enlargement of “extra” LHCII pool by 0.5 LHCII M trimersper PSII core dimer i.e. on average there are about 0.78 “extra LHCII” tri-mers (M) per PSII core dimer in deg5 plants. Segregation of LHCII-S tri-mers away from mutant C2S2M2 complexes, in turn, seems to beextremely improbable since supposedly arising C2M assemblies wouldlose Lhcb5 apoproteins along with LHCII S trimers [3] and this is in dis-agreement with our finding that Lhcb5 contents per PSII core inWT anddeg5 plants were equal (Fig. 3). It is not clear why deg5mutants are de-ficient in Lhcb6 apoprotein but it may tentatively be suggested that
Fig. 2. Analysis of the content of PsbD (PSII core) and PsaB (PSI core) apoproteins in thy-lakoids and granamembranes isolated from leaves of wild type plants (WT) and deg5mu-tants. Thylakoids and granamembranes isolated from leaves of wild type plants (WT) anddeg5mutants were resolved by SDS-PAGE, electrotransferred onto PVDF membranes andthe membranes were immunostained with relevant antibodies. The samples were loadedat five different chlorophyll amounts.
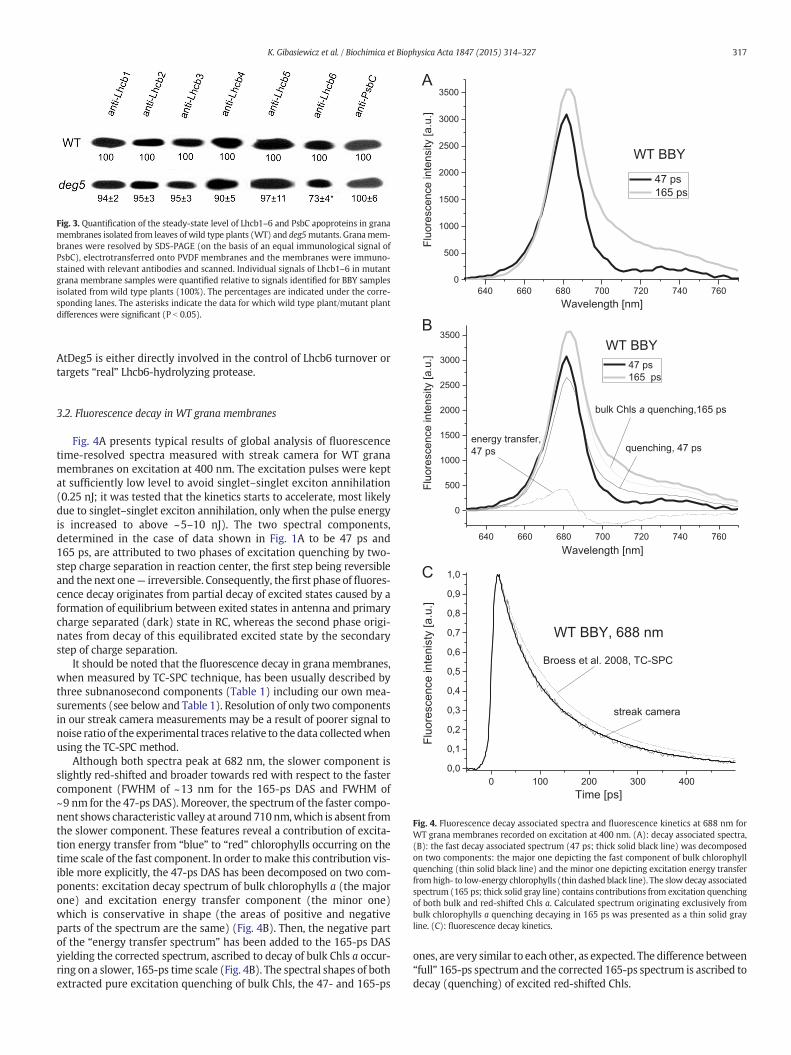
Fig. 3. Quantification of the steady-state level of Lhcb1–6 and PsbC apoproteins in granamembranes isolated from leaves of wild type plants (WT) and deg5mutants. Granamem-branes were resolved by SDS-PAGE (on the basis of an equal immunological signal ofPsbC), electrotransferred onto PVDF membranes and the membranes were immuno-stained with relevant antibodies and scanned. Individual signals of Lhcb1–6 in mutantgrana membrane samples were quantified relative to signals identified for BBY samplesisolated from wild type plants (100%). The percentages are indicated under the corre-sponding lanes. The asterisks indicate the data for which wild type plant/mutant plantdifferences were significant (P b 0.05).
640 660 680 700 720 740 760
0
500
1000
1500
2000
2500
3000
3500
WT BBY
Flu
ore
sce
nce
in
ten
sity [
a.u
.]
Wavelength [nm]
47 ps
165 ps
A
3000
3500
B
WT BBY
[a.u
.]
47 ps
165 ps
317K. Gibasiewicz et al. / Biochimica et Biophysica Acta 1847 (2015) 314–327
AtDeg5 is either directly involved in the control of Lhcb6 turnover ortargets “real” Lhcb6-hydrolyzing protease.
0 100 200 300 400
0,0
0,1
0,2
0,3
0,4
0,5
0,6
0,7
0,8
0,9
1,0
WT BBY, 688 nm
streak camera
Broess et al. 2008, TC-SPC
Flu
orescence inte
nis
ty [a.u
.]
Time [ps]
C
640 660 680 700 720 740 760
0
500
1000
1500
2000
2500
energy transfer,
47 ps quenching, 47 ps
Flu
ore
sce
nce
in
ten
sity
Wavelength [nm]
bulk Chls a quenching,165 ps
Fig. 4. Fluorescence decay associated spectra and fluorescence kinetics at 688 nm forWT grana membranes recorded on excitation at 400 nm. (A): decay associated spectra,(B): the fast decay associated spectrum (47 ps; thick solid black line) was decomposedon two components: the major one depicting the fast component of bulk chlorophyllquenching (thin solid black line) and the minor one depicting excitation energy transferfromhigh- to low-energy chlorophylls (thin dashed black line). The slow decay associatedspectrum (165 ps; thick solid gray line) contains contributions from excitation quenchingof both bulk and red-shifted Chls a. Calculated spectrum originating exclusively frombulk chlorophylls a quenching decaying in 165 ps was presented as a thin solid grayline. (C): fluorescence decay kinetics.
3.2. Fluorescence decay in WT grana membranes
Fig. 4A presents typical results of global analysis of fluorescencetime-resolved spectra measured with streak camera for WT granamembranes on excitation at 400 nm. The excitation pulses were keptat sufficiently low level to avoid singlet–singlet exciton annihilation(0.25 nJ; it was tested that the kinetics starts to accelerate, most likelydue to singlet–singlet exciton annihilation, only when the pulse energyis increased to above ~5–10 nJ). The two spectral components,determined in the case of data shown in Fig. 1A to be 47 ps and165 ps, are attributed to two phases of excitation quenching by two-step charge separation in reaction center, the first step being reversibleand the next one— irreversible. Consequently, the first phase of fluores-cence decay originates from partial decay of excited states caused by aformation of equilibrium between exited states in antenna and primarycharge separated (dark) state in RC, whereas the second phase origi-nates from decay of this equilibrated excited state by the secondarystep of charge separation.
It should be noted that the fluorescence decay in grana membranes,when measured by TC-SPC technique, has been usually described bythree subnanosecond components (Table 1) including our own mea-surements (see below and Table 1). Resolution of only two componentsin our streak camera measurements may be a result of poorer signal tonoise ratio of the experimental traces relative to the data collectedwhenusing the TC-SPC method.
Although both spectra peak at 682 nm, the slower component isslightly red-shifted and broader towards red with respect to the fastercomponent (FWHM of ~13 nm for the 165-ps DAS and FWHM of~9 nm for the 47-ps DAS). Moreover, the spectrum of the faster compo-nent shows characteristic valley at around 710nm,which is absent fromthe slower component. These features reveal a contribution of excita-tion energy transfer from “blue” to “red” chlorophylls occurring on thetime scale of the fast component. In order tomake this contribution vis-ible more explicitly, the 47-ps DAS has been decomposed on two com-ponents: excitation decay spectrum of bulk chlorophylls a (the majorone) and excitation energy transfer component (the minor one)which is conservative in shape (the areas of positive and negativeparts of the spectrum are the same) (Fig. 4B). Then, the negative partof the “energy transfer spectrum” has been added to the 165-ps DASyielding the corrected spectrum, ascribed to decay of bulk Chls a occur-ring on a slower, 165-ps time scale (Fig. 4B). The spectral shapes of bothextracted pure excitation quenching of bulk Chls, the 47- and 165-ps
ones, are very similar to each other, as expected. The difference between“full” 165-ps spectrum and the corrected 165-ps spectrum is ascribed todecay (quenching) of excited red-shifted Chls.
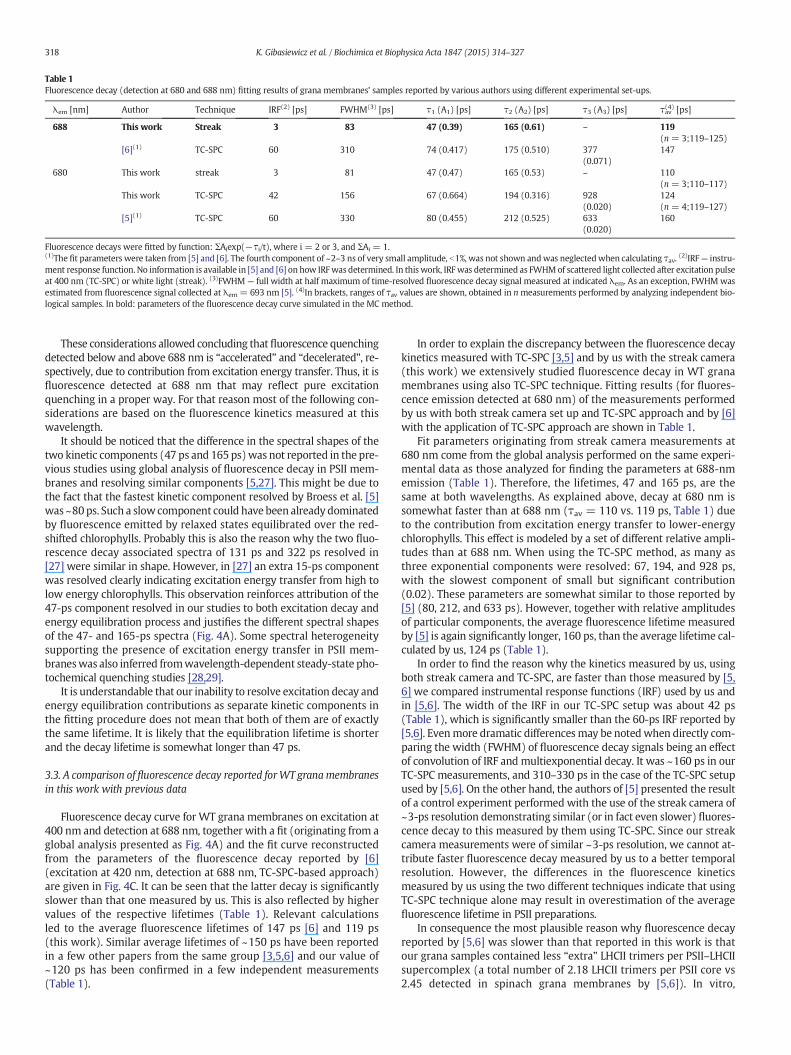
Table 1Fluorescence decay (detection at 680 and 688 nm) fitting results of grana membranes' samples reported by various authors using different experimental set-ups.
λem [nm] Author Technique IRF(2) [ps] FWHM(3) [ps] τ1 (A1) [ps] τ2 (A2) [ps] τ3 (A3) [ps] τav(4) [ps]
688 This work Streak 3 83 47 (0.39) 165 (0.61) – 119(n = 3;119–125)
[6](1) TC-SPC 60 310 74 (0.417) 175 (0.510) 377(0.071)
147
680 This work streak 3 81 47 (0.47) 165 (0.53) – 110(n = 3;110–117)
This work TC-SPC 42 156 67 (0.664) 194 (0.316) 928(0.020)
124(n = 4;119–127)
[5](1) TC-SPC 60 330 80 (0.455) 212 (0.525) 633(0.020)
160
Fluorescence decays were fitted by function: ΣAiexp(−τi/t), where i = 2 or 3, and ΣAi = 1.(1)The fit parameters were taken from [5] and [6]. The fourth component of ~2–3 ns of very small amplitude, b1%, was not shown andwas neglectedwhen calculating τav. (2)IRF— instru-ment response function. No information is available in [5] and [6] on how IRFwas determined. In this work, IRFwas determined as FWHMof scattered light collected after excitation pulseat 400 nm (TC-SPC) or white light (streak). (3)FWHM — full width at half maximum of time-resolved fluorescence decay signal measured at indicated λem. As an exception, FWHMwasestimated from fluorescence signal collected at λem = 693 nm [5]. (4)In brackets, ranges of τav values are shown, obtained in nmeasurements performed by analyzing independent bio-logical samples. In bold: parameters of the fluorescence decay curve simulated in the MC method.
318 K. Gibasiewicz et al. / Biochimica et Biophysica Acta 1847 (2015) 314–327
These considerations allowed concluding thatfluorescence quenchingdetected below and above 688 nm is “accelerated” and “decelerated”, re-spectively, due to contribution from excitation energy transfer. Thus, it isfluorescence detected at 688 nm that may reflect pure excitationquenching in a proper way. For that reason most of the following con-siderations are based on the fluorescence kinetics measured at thiswavelength.
It should be noticed that the difference in the spectral shapes of thetwo kinetic components (47 ps and 165 ps)was not reported in the pre-vious studies using global analysis of fluorescence decay in PSII mem-branes and resolving similar components [5,27]. This might be due tothe fact that the fastest kinetic component resolved by Broess et al. [5]was ~80ps. Such a slow component could have been already dominatedby fluorescence emitted by relaxed states equilibrated over the red-shifted chlorophylls. Probably this is also the reason why the two fluo-rescence decay associated spectra of 131 ps and 322 ps resolved in[27] were similar in shape. However, in [27] an extra 15-ps componentwas resolved clearly indicating excitation energy transfer from high tolow energy chlorophylls. This observation reinforces attribution of the47-ps component resolved in our studies to both excitation decay andenergy equilibration process and justifies the different spectral shapesof the 47- and 165-ps spectra (Fig. 4A). Some spectral heterogeneitysupporting the presence of excitation energy transfer in PSII mem-braneswas also inferred fromwavelength-dependent steady-state pho-tochemical quenching studies [28,29].
It is understandable that our inability to resolve excitation decay andenergy equilibration contributions as separate kinetic components inthe fitting procedure does not mean that both of them are of exactlythe same lifetime. It is likely that the equilibration lifetime is shorterand the decay lifetime is somewhat longer than 47 ps.
3.3. A comparison of fluorescence decay reported forWT granamembranesin this work with previous data
Fluorescence decay curve for WT grana membranes on excitation at400 nm and detection at 688 nm, together with a fit (originating from aglobal analysis presented as Fig. 4A) and the fit curve reconstructedfrom the parameters of the fluorescence decay reported by [6](excitation at 420 nm, detection at 688 nm, TC-SPC-based approach)are given in Fig. 4C. It can be seen that the latter decay is significantlyslower than that one measured by us. This is also reflected by highervalues of the respective lifetimes (Table 1). Relevant calculationsled to the average fluorescence lifetimes of 147 ps [6] and 119 ps(this work). Similar average lifetimes of ~150 ps have been reportedin a few other papers from the same group [3,5,6] and our value of~120 ps has been confirmed in a few independent measurements(Table 1).
In order to explain the discrepancy between the fluorescence decaykinetics measured with TC-SPC [3,5] and by us with the streak camera(this work) we extensively studied fluorescence decay in WT granamembranes using also TC-SPC technique. Fitting results (for fluores-cence emission detected at 680 nm) of the measurements performedby us with both streak camera set up and TC-SPC approach and by [6]with the application of TC-SPC approach are shown in Table 1.
Fit parameters originating from streak camera measurements at680 nm come from the global analysis performed on the same experi-mental data as those analyzed for finding the parameters at 688-nmemission (Table 1). Therefore, the lifetimes, 47 and 165 ps, are thesame at both wavelengths. As explained above, decay at 680 nm issomewhat faster than at 688 nm (τav = 110 vs. 119 ps, Table 1) dueto the contribution from excitation energy transfer to lower-energychlorophylls. This effect is modeled by a set of different relative ampli-tudes than at 688 nm. When using the TC-SPC method, as many asthree exponential components were resolved: 67, 194, and 928 ps,with the slowest component of small but significant contribution(0.02). These parameters are somewhat similar to those reported by[5] (80, 212, and 633 ps). However, together with relative amplitudesof particular components, the average fluorescence lifetime measuredby [5] is again significantly longer, 160 ps, than the average lifetime cal-culated by us, 124 ps (Table 1).
In order to find the reason why the kinetics measured by us, usingboth streak camera and TC-SPC, are faster than those measured by [5,6] we compared instrumental response functions (IRF) used by us andin [5,6]. The width of the IRF in our TC-SPC setup was about 42 ps(Table 1), which is significantly smaller than the 60-ps IRF reported by[5,6]. Evenmore dramatic differencesmay be notedwhen directly com-paring the width (FWHM) of fluorescence decay signals being an effectof convolution of IRF and multiexponential decay. It was ~160 ps in ourTC-SPC measurements, and 310–330 ps in the case of the TC-SPC setupused by [5,6]. On the other hand, the authors of [5] presented the resultof a control experiment performed with the use of the streak camera of~3-ps resolution demonstrating similar (or in fact even slower) fluores-cence decay to this measured by them using TC-SPC. Since our streakcamera measurements were of similar ~3-ps resolution, we cannot at-tribute faster fluorescence decay measured by us to a better temporalresolution. However, the differences in the fluorescence kineticsmeasured by us using the two different techniques indicate that usingTC-SPC technique alone may result in overestimation of the averagefluorescence lifetime in PSII preparations.
In consequence the most plausible reason why fluorescence decayreported by [5,6] was slower than that reported in this work is thatour grana samples contained less “extra” LHCII trimers per PSII–LHCIIsupercomplex (a total number of 2.18 LHCII trimers per PSII core vs2.45 detected in spinach grana membranes by [5,6]). In vitro,
319K. Gibasiewicz et al. / Biochimica et Biophysica Acta 1847 (2015) 314–327
aggregation of purified LHCII trimers was shown to cause fluorescencedecay to be considerably faster with respect to unaggregated trimers[30] thus it may be suggested that grana membranes samples studiedby Broess et al. [5,6] were enriched in unaggregated form of “extra”LHCII trimers with respect to the samples studied in this work. There-fore it may be suggested that aggregation state of “extra” LHCII variesin a species-specific manner.
3.4. Monte Carlo simulations for WT grana membranes
Having found that the overall decay of excited states of PSII–LHCIIsupercomplexes was faster than that reported previously we deter-mined independently a set of four molecular rate constants based on:1) the fluorescence kinetics at 688 nm measured with streak cameraand 2) a coarse-grainedmodel of PSII. These rate constants are similarlydefined as those reported by [3,5,6], and depict: 1) hopping betweenparticular nodes (light harvesting complexes) in the polypeptide net-work (khop; to be accurate, this parameter is modulated by the numbersof Chls a in each node— see below), 2) primary (reversible) charge sep-aration in the reaction center (kCS), 3) charge recombination — leadingto regeneration of excited state in RC from the (dark) charge separatedstate (kCR), 4) secondary (irreversible) charge separation — leading toformation of stable (dark) radical pair state (kRP). At this point, the na-ture of the primary and secondary charge separated states does nothave to be specified.
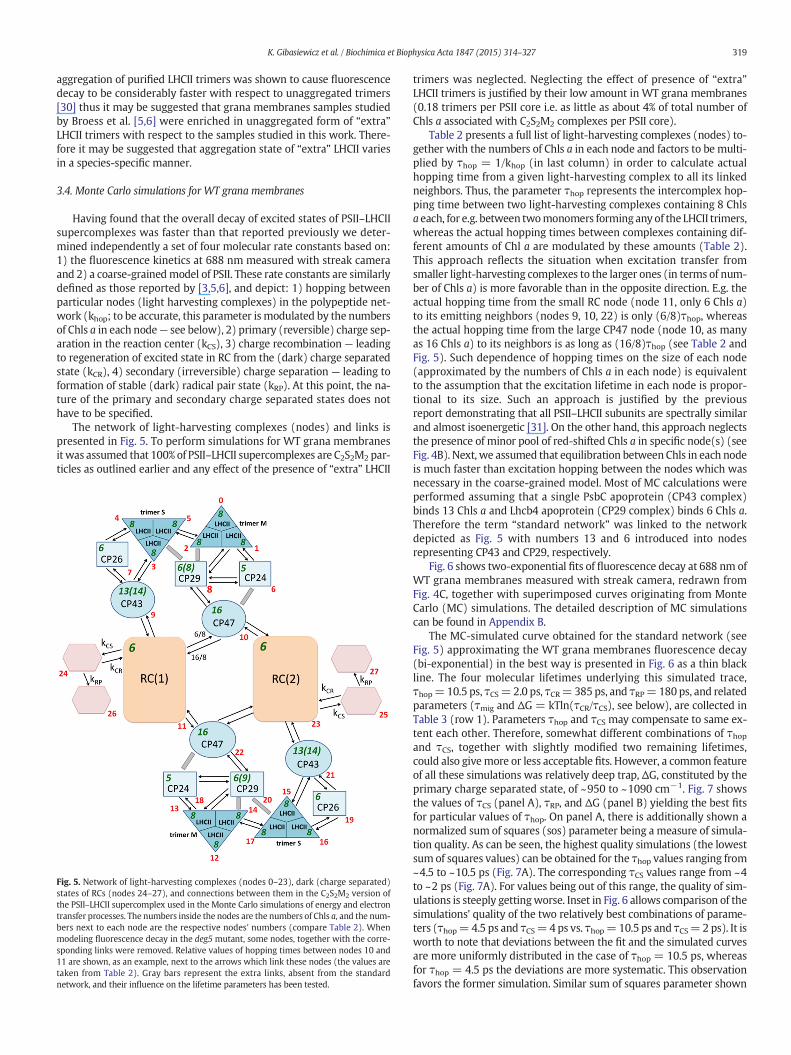
The network of light-harvesting complexes (nodes) and links ispresented in Fig. 5. To perform simulations for WT grana membranesitwas assumed that 100% of PSII–LHCII supercomplexes are C2S2M2 par-ticles as outlined earlier and any effect of the presence of “extra” LHCII
Fig. 5. Network of light-harvesting complexes (nodes 0–23), dark (charge separated)states of RCs (nodes 24–27), and connections between them in the C2S2M2 version ofthe PSII–LHCII supercomplex used in the Monte Carlo simulations of energy and electrontransfer processes. The numbers inside the nodes are the numbers of Chls a, and the num-bers next to each node are the respective nodes' numbers (compare Table 2). Whenmodeling fluorescence decay in the deg5 mutant, some nodes, together with the corre-sponding links were removed. Relative values of hopping times between nodes 10 and11 are shown, as an example, next to the arrows which link these nodes (the values aretaken from Table 2). Gray bars represent the extra links, absent from the standardnetwork, and their influence on the lifetime parameters has been tested.
trimers was neglected. Neglecting the effect of presence of “extra”LHCII trimers is justified by their low amount in WT grana membranes(0.18 trimers per PSII core i.e. as little as about 4% of total number ofChls a associated with C2S2M2 complexes per PSII core).
Table 2 presents a full list of light-harvesting complexes (nodes) to-gether with the numbers of Chls a in each node and factors to be multi-plied by τhop = 1/khop (in last column) in order to calculate actualhopping time from a given light-harvesting complex to all its linkedneighbors. Thus, the parameter τhop represents the intercomplex hop-ping time between two light-harvesting complexes containing 8 Chlsa each, for e.g. between twomonomers forming any of the LHCII trimers,whereas the actual hopping times between complexes containing dif-ferent amounts of Chl a are modulated by these amounts (Table 2).This approach reflects the situation when excitation transfer fromsmaller light-harvesting complexes to the larger ones (in terms of num-ber of Chls a) is more favorable than in the opposite direction. E.g. theactual hopping time from the small RC node (node 11, only 6 Chls a)to its emitting neighbors (nodes 9, 10, 22) is only (6/8)τhop, whereasthe actual hopping time from the large CP47 node (node 10, as manyas 16 Chls a) to its neighbors is as long as (16/8)τhop (see Table 2 andFig. 5). Such dependence of hopping times on the size of each node(approximated by the numbers of Chls a in each node) is equivalentto the assumption that the excitation lifetime in each node is propor-tional to its size. Such an approach is justified by the previousreport demonstrating that all PSII–LHCII subunits are spectrally similarand almost isoenergetic [31]. On the other hand, this approach neglectsthe presence of minor pool of red-shifted Chls a in specific node(s) (seeFig. 4B). Next, we assumed that equilibration between Chls in each nodeis much faster than excitation hopping between the nodes which wasnecessary in the coarse-grained model. Most of MC calculations wereperformed assuming that a single PsbC apoprotein (CP43 complex)binds 13 Chls a and Lhcb4 apoprotein (CP29 complex) binds 6 Chls a.Therefore the term “standard network” was linked to the networkdepicted as Fig. 5 with numbers 13 and 6 introduced into nodesrepresenting CP43 and CP29, respectively.
Fig. 6 shows two-exponential fits of fluorescence decay at 688 nm ofWT grana membranes measured with streak camera, redrawn fromFig. 4C, together with superimposed curves originating from MonteCarlo (MC) simulations. The detailed description of MC simulationscan be found in Appendix B.
The MC-simulated curve obtained for the standard network (seeFig. 5) approximating the WT grana membranes fluorescence decay(bi-exponential) in the best way is presented in Fig. 6 as a thin blackline. The four molecular lifetimes underlying this simulated trace,τhop=10.5 ps, τCS=2.0 ps, τCR= 385 ps, and τRP= 180 ps, and relatedparameters (τmig and ΔG = kTln(τCR/τCS), see below), are collected inTable 3 (row 1). Parameters τhop and τCS may compensate to same ex-tent each other. Therefore, somewhat different combinations of τhopand τCS, together with slightly modified two remaining lifetimes,could also givemore or less acceptable fits. However, a common featureof all these simulations was relatively deep trap, ΔG, constituted by theprimary charge separated state, of ~950 to ~1090 cm−1. Fig. 7 showsthe values of τCS (panel A), τRP, and ΔG (panel B) yielding the best fitsfor particular values of τhop. On panel A, there is additionally shown anormalized sum of squares (sos) parameter being a measure of simula-tion quality. As can be seen, the highest quality simulations (the lowestsum of squares values) can be obtained for the τhop values ranging from~4.5 to ~10.5 ps (Fig. 7A). The corresponding τCS values range from ~4to ~2 ps (Fig. 7A). For values being out of this range, the quality of sim-ulations is steeply gettingworse. Inset in Fig. 6 allows comparison of thesimulations' quality of the two relatively best combinations of parame-ters (τhop=4.5 ps and τCS=4 ps vs. τhop=10.5 ps and τCS=2 ps). It isworth to note that deviations between the fit and the simulated curvesare more uniformly distributed in the case of τhop = 10.5 ps, whereasfor τhop = 4.5 ps the deviations are more systematic. This observationfavors the former simulation. Similar sum of squares parameter shown
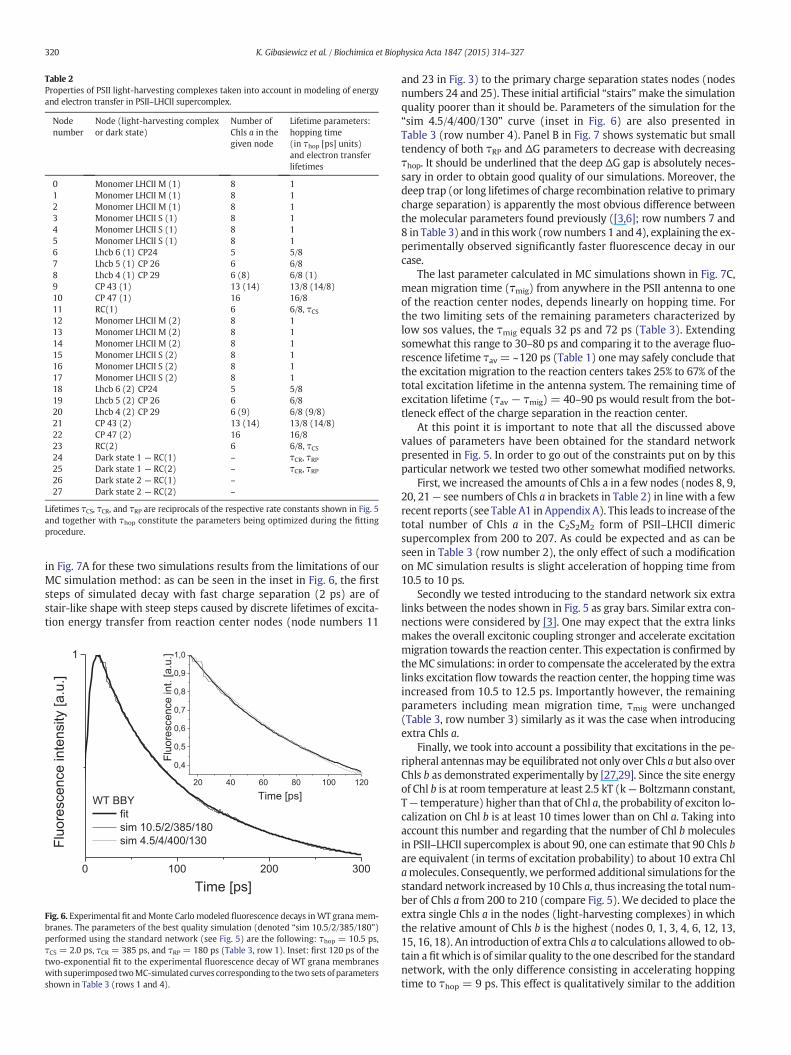
Table 2Properties of PSII light-harvesting complexes taken into account in modeling of energyand electron transfer in PSII–LHCII supercomplex.
Nodenumber
Node (light-harvesting complexor dark state)
Number ofChls a in thegiven node
Lifetime parameters:hopping time(in τhop [ps] units)and electron transferlifetimes
0 Monomer LHCII M (1) 8 11 Monomer LHCII M (1) 8 12 Monomer LHCII M (1) 8 13 Monomer LHCII S (1) 8 14 Monomer LHCII S (1) 8 15 Monomer LHCII S (1) 8 16 Lhcb 6 (1) CP24 5 5/87 Lhcb 5 (1) CP 26 6 6/88 Lhcb 4 (1) CP 29 6 (8) 6/8 (1)9 CP 43 (1) 13 (14) 13/8 (14/8)10 CP 47 (1) 16 16/811 RC(1) 6 6/8, τCS12 Monomer LHCII M (2) 8 113 Monomer LHCII M (2) 8 114 Monomer LHCII M (2) 8 115 Monomer LHCII S (2) 8 116 Monomer LHCII S (2) 8 117 Monomer LHCII S (2) 8 118 Lhcb 6 (2) CP24 5 5/819 Lhcb 5 (2) CP 26 6 6/820 Lhcb 4 (2) CP 29 6 (9) 6/8 (9/8)21 CP 43 (2) 13 (14) 13/8 (14/8)22 CP 47 (2) 16 16/823 RC(2) 6 6/8, τCS24 Dark state 1 — RC(1) – τCR, τRP25 Dark state 1 — RC(2) – τCR, τRP26 Dark state 2 — RC(1) –
27 Dark state 2 — RC(2) –
Lifetimes τCS, τCR, and τRP are reciprocals of the respective rate constants shown in Fig. 5and together with τhop constitute the parameters being optimized during the fittingprocedure.
320 K. Gibasiewicz et al. / Biochimica et Biophysica Acta 1847 (2015) 314–327
in Fig. 7A for these two simulations results from the limitations of ourMC simulation method: as can be seen in the inset in Fig. 6, the firststeps of simulated decay with fast charge separation (2 ps) are ofstair-like shape with steep steps caused by discrete lifetimes of excita-tion energy transfer from reaction center nodes (node numbers 11
0 100 200 300
1
WT BBY
fit
sim 10.5/2/385/180
sim 4.5/4/400/130 Flu
ore
sce
nce
in
ten
sity [
a.u
.]
Time [ps]
20 40 60 80 100 120
0,4
0,5
0,6
0,7
0,8
0,9
1,0
Flu
orescence int. [a.u
.]
Time [ps]
Fig. 6. Experimental fit andMonte Carlo modeled fluorescence decays inWT grana mem-branes. The parameters of the best quality simulation (denoted “sim 10.5/2/385/180”)performed using the standard network (see Fig. 5) are the following: τhop = 10.5 ps,τCS = 2.0 ps, τCR = 385 ps, and τRP = 180 ps (Table 3, row 1). Inset: first 120 ps of thetwo-exponential fit to the experimental fluorescence decay of WT grana membraneswith superimposed twoMC-simulated curves corresponding to the two sets of parametersshown in Table 3 (rows 1 and 4).
and 23 in Fig. 3) to the primary charge separation states nodes (nodesnumbers 24 and 25). These initial artificial “stairs”make the simulationquality poorer than it should be. Parameters of the simulation for the“sim 4.5/4/400/130” curve (inset in Fig. 6) are also presented inTable 3 (row number 4). Panel B in Fig. 7 shows systematic but smalltendency of both τRP and ΔG parameters to decrease with decreasingτhop. It should be underlined that the deep ΔG gap is absolutely neces-sary in order to obtain good quality of our simulations. Moreover, thedeep trap (or long lifetimes of charge recombination relative to primarycharge separation) is apparently the most obvious difference betweenthe molecular parameters found previously ([3,6]; row numbers 7 and8 in Table 3) and in thiswork (rownumbers 1 and 4), explaining the ex-perimentally observed significantly faster fluorescence decay in ourcase.
The last parameter calculated in MC simulations shown in Fig. 7C,mean migration time (τmig) from anywhere in the PSII antenna to oneof the reaction center nodes, depends linearly on hopping time. Forthe two limiting sets of the remaining parameters characterized bylow sos values, the τmig equals 32 ps and 72 ps (Table 3). Extendingsomewhat this range to 30–80 ps and comparing it to the average fluo-rescence lifetime τav = ~120 ps (Table 1) one may safely conclude thatthe excitation migration to the reaction centers takes 25% to 67% of thetotal excitation lifetime in the antenna system. The remaining time ofexcitation lifetime (τav − τmig) = 40–90 ps would result from the bot-tleneck effect of the charge separation in the reaction center.
At this point it is important to note that all the discussed abovevalues of parameters have been obtained for the standard networkpresented in Fig. 5. In order to go out of the constraints put on by thisparticular network we tested two other somewhat modified networks.
First, we increased the amounts of Chls a in a few nodes (nodes 8, 9,20, 21— see numbers of Chls a in brackets in Table 2) in line with a fewrecent reports (see Table A1 in Appendix A). This leads to increase of thetotal number of Chls a in the C2S2M2 form of PSII–LHCII dimericsupercomplex from 200 to 207. As could be expected and as can beseen in Table 3 (row number 2), the only effect of such a modificationon MC simulation results is slight acceleration of hopping time from10.5 to 10 ps.
Secondly we tested introducing to the standard network six extralinks between the nodes shown in Fig. 5 as gray bars. Similar extra con-nections were considered by [3]. One may expect that the extra linksmakes the overall excitonic coupling stronger and accelerate excitationmigration towards the reaction center. This expectation is confirmed bytheMC simulations: in order to compensate the accelerated by the extralinks excitation flow towards the reaction center, the hopping timewasincreased from 10.5 to 12.5 ps. Importantly however, the remainingparameters including mean migration time, τmig were unchanged(Table 3, row number 3) similarly as it was the case when introducingextra Chls a.
Finally, we took into account a possibility that excitations in the pe-ripheral antennasmay be equilibrated not only over Chls a but also overChls b as demonstrated experimentally by [27,29]. Since the site energyof Chl b is at room temperature at least 2.5 kT (k— Boltzmann constant,T— temperature) higher than that of Chl a, the probability of exciton lo-calization on Chl b is at least 10 times lower than on Chl a. Taking intoaccount this number and regarding that the number of Chl bmoleculesin PSII–LHCII supercomplex is about 90, one can estimate that 90 Chls bare equivalent (in terms of excitation probability) to about 10 extra Chlamolecules. Consequently, we performed additional simulations for thestandard network increased by 10 Chls a, thus increasing the total num-ber of Chls a from 200 to 210 (compare Fig. 5). We decided to place theextra single Chls a in the nodes (light-harvesting complexes) in whichthe relative amount of Chls b is the highest (nodes 0, 1, 3, 4, 6, 12, 13,15, 16, 18). An introduction of extra Chls a to calculations allowed to ob-tain a fit which is of similar quality to the one described for the standardnetwork, with the only difference consisting in accelerating hoppingtime to τhop = 9 ps. This effect is qualitatively similar to the addition
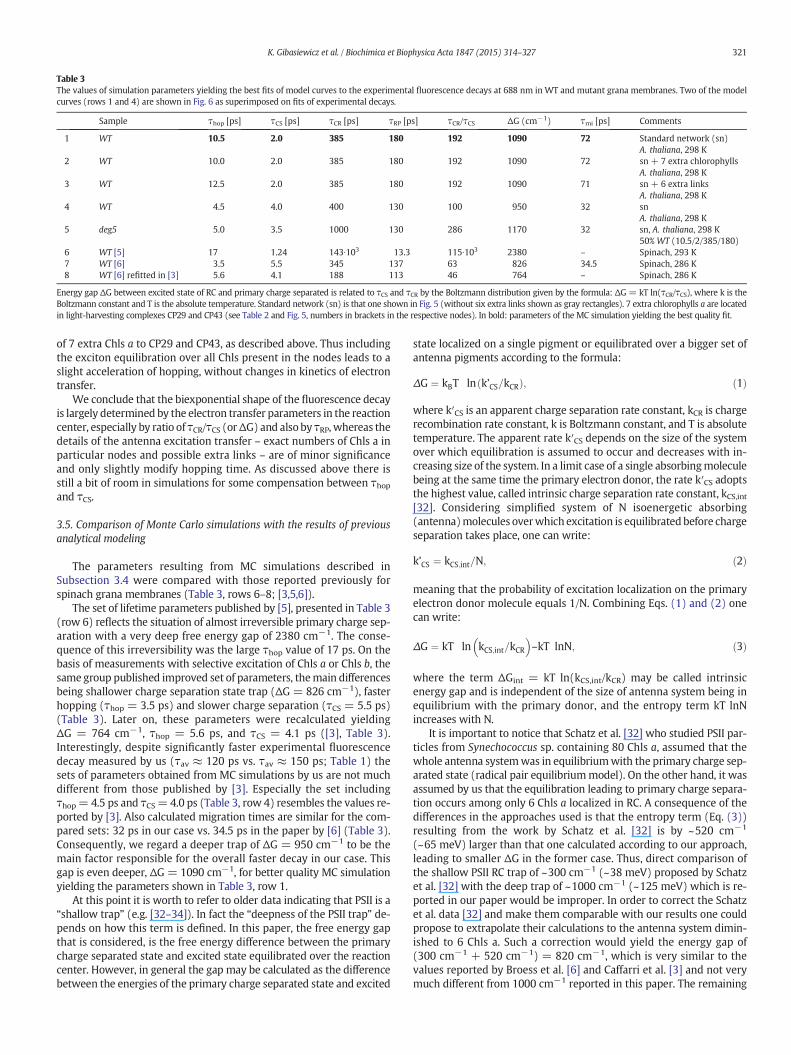
Table 3The values of simulation parameters yielding the best fits of model curves to the experimental fluorescence decays at 688 nm in WT and mutant grana membranes. Two of the modelcurves (rows 1 and 4) are shown in Fig. 6 as superimposed on fits of experimental decays.
Sample τhop [ps] τCS [ps] τCR [ps] τRP [ps] τCR/τCS ΔG (cm−1) τmi [ps] Comments
1 WT 10.5 2.0 385 180 192 1090 72 Standard network (sn)A. thaliana, 298 K
2 WT 10.0 2.0 385 180 192 1090 72 sn + 7 extra chlorophyllsA. thaliana, 298 K
3 WT 12.5 2.0 385 180 192 1090 71 sn + 6 extra linksA. thaliana, 298 K
4 WT 4.5 4.0 400 130 100 950 32 snA. thaliana, 298 K
5 deg5 5.0 3.5 1000 130 286 1170 32 sn, A. thaliana, 298 K50% WT (10.5/2/385/180)
6 WT [5] 17 1.24 143∙103 13.3 115∙103 2380 – Spinach, 293 K7 WT [6] 3.5 5.5 345 137 63 826 34.5 Spinach, 286 K8 WT [6] refitted in [3] 5.6 4.1 188 113 46 764 – Spinach, 286 K
Energy gap ΔG between excited state of RC and primary charge separated is related to τCS and τCR by the Boltzmann distribution given by the formula: ΔG= kT ln(τCR/τCS), where k is theBoltzmann constant and T is the absolute temperature. Standard network (sn) is that one shown in Fig. 5 (without six extra links shown as gray rectangles). 7 extra chlorophylls a are locatedin light-harvesting complexes CP29 and CP43 (see Table 2 and Fig. 5, numbers in brackets in the respective nodes). In bold: parameters of the MC simulation yielding the best quality fit.
321K. Gibasiewicz et al. / Biochimica et Biophysica Acta 1847 (2015) 314–327
of 7 extra Chls a to CP29 and CP43, as described above. Thus includingthe exciton equilibration over all Chls present in the nodes leads to aslight acceleration of hopping, without changes in kinetics of electrontransfer.
We conclude that the biexponential shape of the fluorescence decayis largely determined by the electron transfer parameters in the reactioncenter, especially by ratio of τCR/τCS (orΔG) and also by τRP, whereas thedetails of the antenna excitation transfer – exact numbers of Chls a inparticular nodes and possible extra links – are of minor significanceand only slightly modify hopping time. As discussed above there isstill a bit of room in simulations for some compensation between τhopand τCS.
3.5. Comparison of Monte Carlo simulations with the results of previousanalytical modeling
The parameters resulting from MC simulations described inSubsection 3.4 were compared with those reported previously forspinach grana membranes (Table 3, rows 6–8; [3,5,6]).
The set of lifetime parameters published by [5], presented in Table 3(row 6) reflects the situation of almost irreversible primary charge sep-aration with a very deep free energy gap of 2380 cm−1. The conse-quence of this irreversibility was the large τhop value of 17 ps. On thebasis of measurements with selective excitation of Chls a or Chls b, thesame group published improved set of parameters, themain differencesbeing shallower charge separation state trap (ΔG = 826 cm−1), fasterhopping (τhop = 3.5 ps) and slower charge separation (τCS = 5.5 ps)(Table 3). Later on, these parameters were recalculated yieldingΔG = 764 cm−1, τhop = 5.6 ps, and τCS = 4.1 ps ([3], Table 3).Interestingly, despite significantly faster experimental fluorescencedecay measured by us (τav ≈ 120 ps vs. τav ≈ 150 ps; Table 1) thesets of parameters obtained from MC simulations by us are not muchdifferent from those published by [3]. Especially the set includingτhop= 4.5 ps and τCS= 4.0 ps (Table 3, row 4) resembles the values re-ported by [3]. Also calculated migration times are similar for the com-pared sets: 32 ps in our case vs. 34.5 ps in the paper by [6] (Table 3).Consequently, we regard a deeper trap of ΔG = 950 cm−1 to be themain factor responsible for the overall faster decay in our case. Thisgap is even deeper, ΔG = 1090 cm−1, for better quality MC simulationyielding the parameters shown in Table 3, row 1.
At this point it is worth to refer to older data indicating that PSII is a“shallow trap” (e.g. [32–34]). In fact the “deepness of the PSII trap” de-pends on how this term is defined. In this paper, the free energy gapthat is considered, is the free energy difference between the primarycharge separated state and excited state equilibrated over the reactioncenter. However, in general the gap may be calculated as the differencebetween the energies of the primary charge separated state and excited
state localized on a single pigment or equilibrated over a bigger set ofantenna pigments according to the formula:
ΔG ¼ kBT ln k’CS=kCRð Þ; ð1Þ
where k′CS is an apparent charge separation rate constant, kCR is chargerecombination rate constant, k is Boltzmann constant, and T is absolutetemperature. The apparent rate k′CS depends on the size of the systemover which equilibration is assumed to occur and decreases with in-creasing size of the system. In a limit case of a single absorbingmoleculebeing at the same time the primary electron donor, the rate k′CS adoptsthe highest value, called intrinsic charge separation rate constant, kCS,int[32]. Considering simplified system of N isoenergetic absorbing(antenna)molecules overwhich excitation is equilibrated before chargeseparation takes place, one can write:
k’CS ¼ kCS;int=N; ð2Þ
meaning that the probability of excitation localization on the primaryelectron donor molecule equals 1/N. Combining Eqs. (1) and (2) onecan write:
ΔG ¼ kT ln kCS;int=kCR� �
–kT lnN; ð3Þ
where the term ΔGint = kT ln(kCS,int/kCR) may be called intrinsicenergy gap and is independent of the size of antenna system being inequilibrium with the primary donor, and the entropy term kT lnNincreases with N.
It is important to notice that Schatz et al. [32] who studied PSII par-ticles from Synechococcus sp. containing 80 Chls a, assumed that thewhole antenna systemwas in equilibriumwith the primary charge sep-arated state (radical pair equilibriummodel). On the other hand, it wasassumed by us that the equilibration leading to primary charge separa-tion occurs among only 6 Chls a localized in RC. A consequence of thedifferences in the approaches used is that the entropy term (Eq. (3))resulting from the work by Schatz et al. [32] is by ~520 cm−1
(~65 meV) larger than that one calculated according to our approach,leading to smaller ΔG in the former case. Thus, direct comparison ofthe shallow PSII RC trap of ~300 cm−1 (~38 meV) proposed by Schatzet al. [32] with the deep trap of ~1000 cm−1 (~125 meV) which is re-ported in our paper would be improper. In order to correct the Schatzet al. data [32] and make them comparable with our results one couldpropose to extrapolate their calculations to the antenna system dimin-ished to 6 Chls a. Such a correction would yield the energy gap of(300 cm−1 + 520 cm−1) = 820 cm−1, which is very similar to thevalues reported by Broess et al. [6] and Caffarri et al. [3] and not verymuch different from 1000 cm−1 reported in this paper. The remaining

ττ
τ
τ
τ
τ
τ
τ
A
B
C
Fig. 7. Lifetime and energetic parameters yielding the best fits of Monte Carlo curves tothe experimental fluorescence decay of WT grana membranes at 688 nm measuredwith the streak camera for a range of τhop values. (A) Apart from the dependence of τCSon τhop, there is a plotted normalized sum of squares (sos) parameter calculated asΣ(f(xi) − s(xi))2 / N, where f(xi) is the two-exponential fit to the experimental fluores-cence decay of WT BBY at 688 nm following excitation at 400 nm (see Table 1), s(xi) isthe MC-simulated decay on the basis of the lifetime parameters shown in panels A andB, and N is the number of points contributing to the sum (i = 1.. N). (B) Apart from thedependence of τRP on τhop, there is a shown dependence of ΔG on τhop. τmig and ΔG arecalculated from the lifetime parameters. (C) Mean migration time to the RC nodes(τmig) as a function of τhop. The big symbols in all panels represent a set of parameters giv-ing the best fit: τhop = 10.5 ps, τCS = 2 ps, τCR = 385 ps, τRP = 180 ps.
322 K. Gibasiewicz et al. / Biochimica et Biophysica Acta 1847 (2015) 314–327
difference of ~200 cm−1 could be a consequence of different raw exper-imental results underlying the two studies.
In more recent studies performed on PSII core complexes isolatedfrom Thermosynechoccocus elongatus it was proposed that the firstcharge separated statewas ChlaccD1+ PheoD1− , quickly followed by the sec-ond charge separated state, PD1+ PheoD1− , and then followed by the state
PD1+ QA−, all the states being in equilibrium [35–37]. PD1 is one of the chlo-
rophyll dimer components, PheoD1 is pheophytin, and ChlaccD1 is a mo-nomeric chlorophyll placed in between PD1 and PheoD1, all themolecules being associated with D1 polypeptide of RC. The free energygap between excited state of reaction center, RC*, and the state PD1+ -
PheoD1− calculated in the cited papers was about 880 cm−1 (110 meV)which is again similar to the value of 1000 cm−1 estimated by us. It isunderstandable that the free energy gap between the states RC* andChlaccD1+ PheoD1− was found to be smaller and equal ~320 cm−1
[35–37]. However, in our studies we have not been able to resolve theadditional relatively short lived (~10 ps according to [35]), ChlaccD1+ -
PheoD1− intermediate state. We conclude that the trapping propertiesof RC reported in this paper are not very much different from those re-ported previously by others.
3.6. Fluorescence decay in deg5 mutant grana membranes
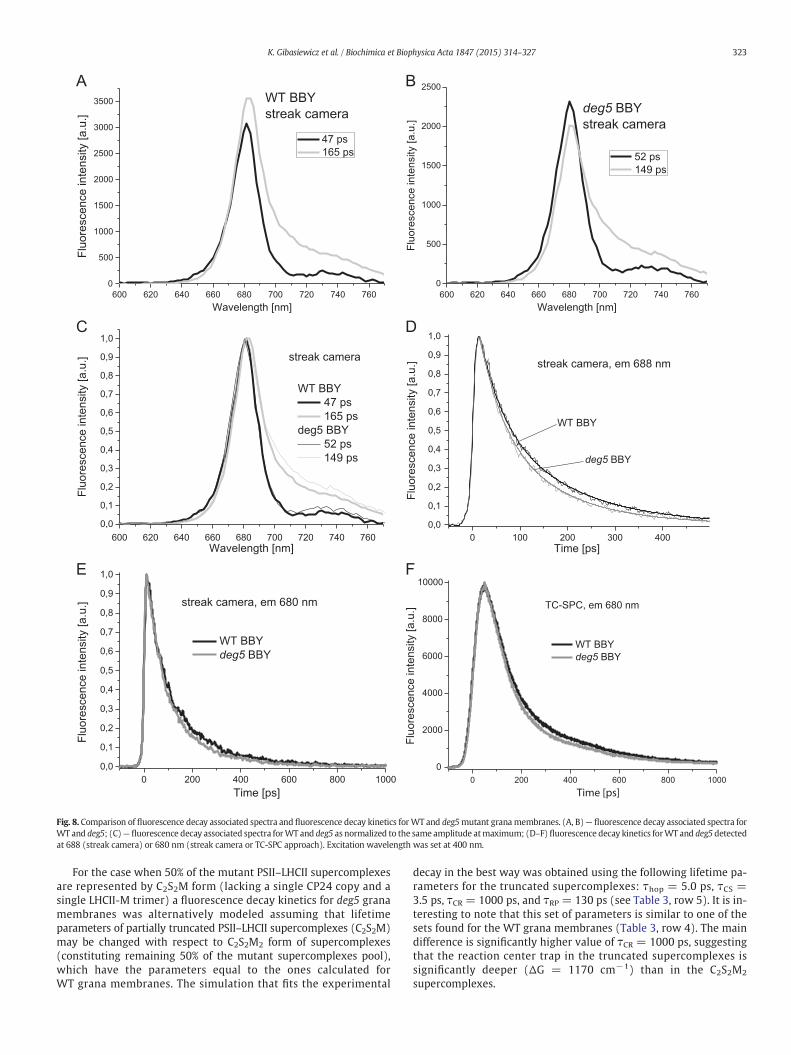
Both streak camera and TC-SPCmeasurements show clearly that theremoval of ~25% of Lhcb6 apoprotein pool (CP24) from PSII–LHCIIsupercomplexes in grana membranes of deg5 mutant of A. thalianaleads to a significant acceleration of fluorescence decay with respecttoWT granamembranes (Fig. 8A–C); relevant fluorescencedecay kinet-ics for WT and deg5 grana membranes are shown as Fig. 8D–F and pa-rameters of the fits, lifetimes and relative amplitudes are displayed inTable 4. A juxtaposition of the data included in Table 1 (WT) andTable 4 (deg5) reveals that as a rule, partial Lhcb6 apoprotein removalis accompanied by a remarkable decrease in average fluorescencelifetimes, no matter whether streak camera or TC-SPC approaches wasapplied (e.g. from 120 to 102 ps when using streak camera with thefluorescence detection at 688 nm). The accelerated fluorescence decayin the mutant deficient in Lhcb6 apoprotein is due both to shorteningof the slower decay component and its lower relative amplitude(Fig. 8A and B). Importantly, the shapes of the both DAS, fast 47/52 psand slow 165/149 ps, are very similar in deg5 mutant and WT plant(Fig. 8C) and this supports the notion that the mutation does not leadto major general changes in spectroscopic features. Interestingly, thestronger mutation, leading to 100% removal of Lhcb6 apoprotein poolin A. thaliana caused a deceleration of fluorescence decay [4]. The differ-ence between the data may be due to different mutation-related rear-rangements in PSII–LHCII supercomplex antenna system and “extra”LHCII pool.
3.7. Monte Carlo simulations for deg5 grana membranes
3.7.1. Simulation of the effect of removal of CP24 and LHCII-M trimers onfluorescence decay kinetics
In order to stimulate fluorescence decay kinetics found for deg5grana membranes we removed CP24 and LHCII M trimer, either fromone or both sides of the PSII–LHCII supercomplex (Fig. 5) keeping un-changed all the lifetime parameters determined for WT grana mem-branes (Table 3, row 1 or row 4 or similar). As a result, the modeledkinetics was found to be comparable or even faster than the one mea-sured for the mutant. However, in order to take into account that themutant is lacking as little as ~25% of Lhcb6 apoprotein pool, the decaysapproximating the experimental kinetics in deg5mutant were calculat-ed (see Subsection 3.1): (1) either as a weighted average of decay sim-ulated for the standard network missing one CP24 complex and onenearby LHCII-M trimer (weight 50%) and the decay found for WT(weight 50%) — see Fig. 9; (2) or as a weighted average of decay simu-lated for the standard network missing both CP24 complexes and bothLHCII-M trimers (weight 25%) and the decay found for WT (weight75%). The two modeled kinetics were similar to each other whereasthe simulated mean decays, although significantly accelerated withrespect to WT grana membranes, were still slower than the kineticsmeasured for deg5 grana membranes (Fig. 9).
600 620 640 660 680 700 720 740 760
0,0
0,1
0,2
0,3
0,4
0,5
0,6
0,7
0,8
0,9
1,0
streak camera
Flu
orescence inte
nsity [
a.u
.]
Wavelength [nm]
WT BBY
47 ps
165 ps
deg5 BBY
52 ps
149 ps
C
0 200 400 600 800 1000
0,0
0,1
0,2
0,3
0,4
0,5
0,6
0,7
0,8
0,9
1,0
streak camera, em 680 nm
Flu
orescence inte
nsity [a.u
.]
Time [ps]
WT BBY
deg5 BBY
E
0 200 400 600 800 1000
0
2000
4000
6000
8000
10000
TC-SPC, em 680 nm
Flu
ore
sce
nce
in
ten
sity [
a.u
.]
Time [ps]
WT BBY
deg5 BBY
F
600 620 640 660 680 700 720 740 760
0
500
1000
1500
2000
2500
Flu
ore
sce
nce
in
ten
sity [
a.u
.]
Wavelength [nm]
52 ps
149 ps
deg5 BBY
streak camera
B
600 620 640 660 680 700 720 740 760
0
500
1000
1500
2000
2500
3000
3500 WT BBY
streak camera
Flu
ore
sce
nce
in
ten
sity [
a.u
.]
Wavelength [nm]
47 ps
165 ps
A
0 100 200 300 400
0,0
0,1
0,2
0,3
0,4
0,5
0,6
0,7
0,8
0,9
1,0
streak camera, em 688 nm
deg5 BBY
WT BBY
Flu
orescence inte
nsity [
a.u
.]
Time [ps]
D
Fig. 8. Comparison of fluorescence decay associated spectra and fluorescence decay kinetics forWT and deg5mutant granamembranes. (A, B)— fluorescence decay associated spectra forWT and deg5; (C)— fluorescence decay associated spectra forWT and deg5 as normalized to the same amplitude atmaximum; (D–F) fluorescence decay kinetics forWT and deg5 detectedat 688 (streak camera) or 680 nm (streak camera or TC-SPC approach). Excitation wavelength was set at 400 nm.
323K. Gibasiewicz et al. / Biochimica et Biophysica Acta 1847 (2015) 314–327
For the case when 50% of the mutant PSII–LHCII supercomplexesare represented by C2S2M form (lacking a single CP24 copy and asingle LHCII-M trimer) a fluorescence decay kinetics for deg5 granamembranes was alternatively modeled assuming that lifetimeparameters of partially truncated PSII–LHCII supercomplexes (C2S2M)may be changed with respect to C2S2M2 form of supercomplexes(constituting remaining 50% of the mutant supercomplexes pool),which have the parameters equal to the ones calculated forWT grana membranes. The simulation that fits the experimental
decay in the best way was obtained using the following lifetime pa-rameters for the truncated supercomplexes: τhop = 5.0 ps, τCS =3.5 ps, τCR = 1000 ps, and τRP = 130 ps (see Table 3, row 5). It is in-teresting to note that this set of parameters is similar to one of thesets found for the WT grana membranes (Table 3, row 4). The maindifference is significantly higher value of τCR = 1000 ps, suggestingthat the reaction center trap in the truncated supercomplexes issignificantly deeper (ΔG = 1170 cm−1) than in the C2S2M2
supercomplexes.
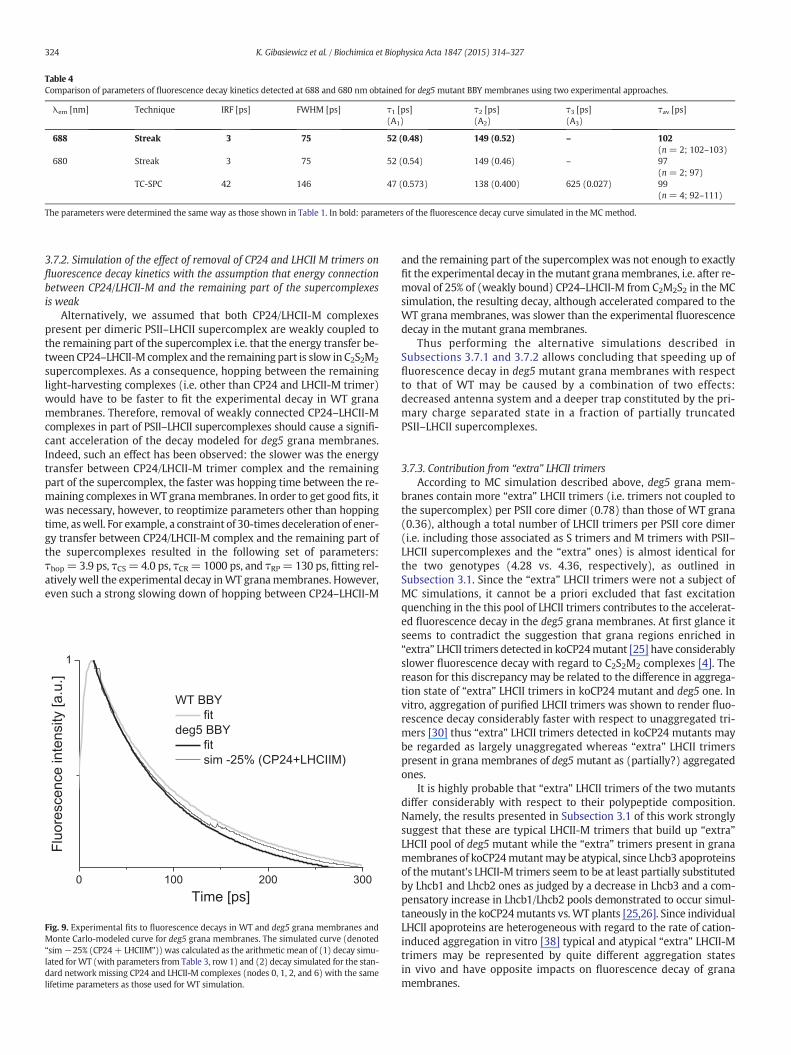
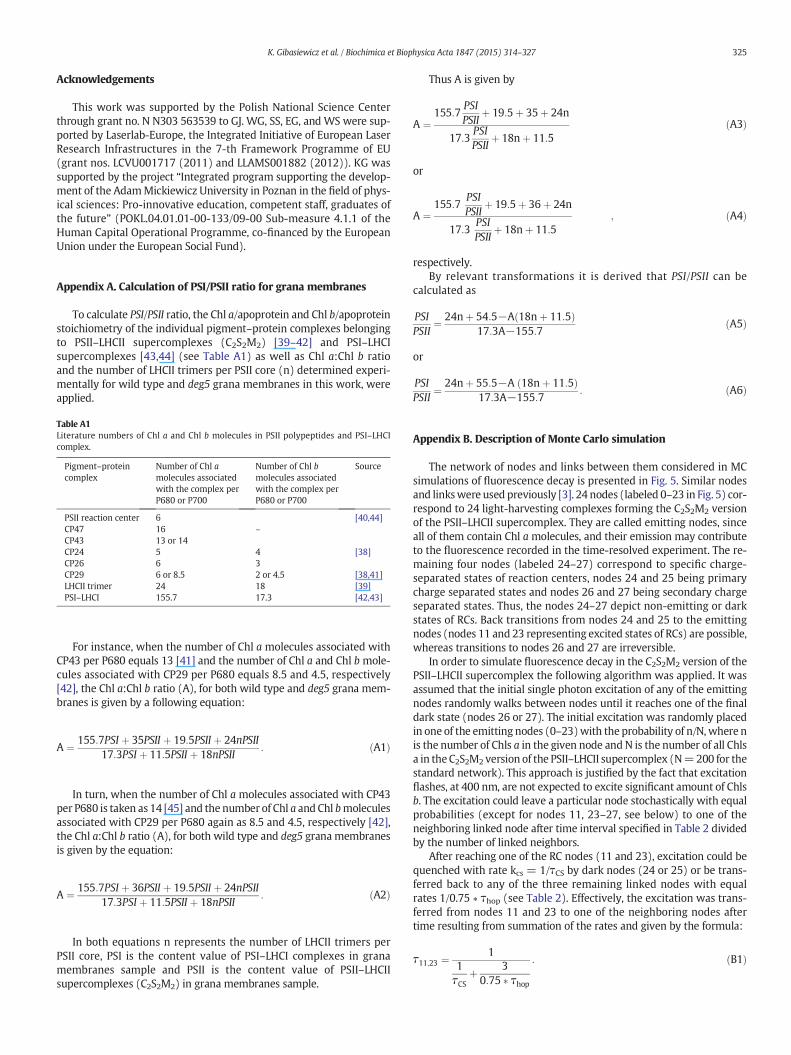
Table 4Comparison of parameters of fluorescence decay kinetics detected at 688 and 680 nm obtained for deg5 mutant BBY membranes using two experimental approaches.
λem [nm] Technique IRF [ps] FWHM [ps] τ1 [ps](A1)
τ2 [ps](A2)
τ3 [ps](A3)
τav [ps]
688 Streak 3 75 52 (0.48) 149 (0.52) – 102(n = 2; 102–103)
680 Streak 3 75 52 (0.54) 149 (0.46) – 97(n = 2; 97)
TC-SPC 42 146 47 (0.573) 138 (0.400) 625 (0.027) 99(n = 4; 92–111)
The parameters were determined the same way as those shown in Table 1. In bold: parameters of the fluorescence decay curve simulated in the MC method.
324 K. Gibasiewicz et al. / Biochimica et Biophysica Acta 1847 (2015) 314–327
3.7.2. Simulation of the effect of removal of CP24 and LHCII M trimers onfluorescence decay kinetics with the assumption that energy connectionbetween CP24/LHCII-M and the remaining part of the supercomplexesis weak
Alternatively, we assumed that both CP24/LHCII-M complexespresent per dimeric PSII–LHCII supercomplex are weakly coupled tothe remaining part of the supercomplex i.e. that the energy transfer be-tween CP24–LHCII-M complex and the remaining part is slow in C2S2M2
supercomplexes. As a consequence, hopping between the remaininglight-harvesting complexes (i.e. other than CP24 and LHCII-M trimer)would have to be faster to fit the experimental decay in WT granamembranes. Therefore, removal of weakly connected CP24–LHCII-Mcomplexes in part of PSII–LHCII supercomplexes should cause a signifi-cant acceleration of the decay modeled for deg5 grana membranes.Indeed, such an effect has been observed: the slower was the energytransfer between CP24/LHCII-M trimer complex and the remainingpart of the supercomplex, the faster was hopping time between the re-maining complexes inWT granamembranes. In order to get good fits, itwas necessary, however, to reoptimize parameters other than hoppingtime, aswell. For example, a constraint of 30-times deceleration of ener-gy transfer between CP24/LHCII-M complex and the remaining part ofthe supercomplexes resulted in the following set of parameters:τhop= 3.9 ps, τCS= 4.0 ps, τCR= 1000 ps, and τRP= 130 ps, fitting rel-atively well the experimental decay inWT granamembranes. However,even such a strong slowing down of hopping between CP24–LHCII-M
0 100 200 300
1
WT BBY
fit
deg5 BBY
fit
sim -25% (CP24+LHCIIM)
Flu
ore
sce
nce
in
ten
sity [
a.u
.]
Time [ps]
Fig. 9. Experimental fits to fluorescence decays in WT and deg5 grana membranes andMonte Carlo-modeled curve for deg5 grana membranes. The simulated curve (denoted“sim−25% (CP24+ LHCIIM”)) was calculated as the arithmetic mean of (1) decay simu-lated forWT (with parameters from Table 3, row 1) and (2) decay simulated for the stan-dard network missing CP24 and LHCII-M complexes (nodes 0, 1, 2, and 6) with the samelifetime parameters as those used for WT simulation.
and the remaining part of the supercomplex was not enough to exactlyfit the experimental decay in themutant granamembranes, i.e. after re-moval of 25% of (weakly bound) CP24–LHCII-M from C2M2S2 in the MCsimulation, the resulting decay, although accelerated compared to theWT grana membranes, was slower than the experimental fluorescencedecay in the mutant grana membranes.
Thus performing the alternative simulations described inSubsections 3.7.1 and 3.7.2 allows concluding that speeding up offluorescence decay in deg5 mutant grana membranes with respectto that of WT may be caused by a combination of two effects:decreased antenna system and a deeper trap constituted by the pri-mary charge separated state in a fraction of partially truncatedPSII–LHCII supercomplexes.
3.7.3. Contribution from “extra” LHCII trimersAccording to MC simulation described above, deg5 grana mem-
branes contain more “extra” LHCII trimers (i.e. trimers not coupled tothe supercomplex) per PSII core dimer (0.78) than those of WT grana(0.36), although a total number of LHCII trimers per PSII core dimer(i.e. including those associated as S trimers and M trimers with PSII–LHCII supercomplexes and the “extra” ones) is almost identical forthe two genotypes (4.28 vs. 4.36, respectively), as outlined inSubsection 3.1. Since the “extra” LHCII trimers were not a subject ofMC simulations, it cannot be a priori excluded that fast excitationquenching in the this pool of LHCII trimers contributes to the accelerat-ed fluorescence decay in the deg5 grana membranes. At first glance itseems to contradict the suggestion that grana regions enriched in“extra” LHCII trimers detected in koCP24mutant [25] have considerablyslower fluorescence decay with regard to C2S2M2 complexes [4]. Thereason for this discrepancy may be related to the difference in aggrega-tion state of “extra” LHCII trimers in koCP24 mutant and deg5 one. Invitro, aggregation of purified LHCII trimers was shown to render fluo-rescence decay considerably faster with respect to unaggregated tri-mers [30] thus “extra” LHCII trimers detected in koCP24 mutants maybe regarded as largely unaggregated whereas “extra” LHCII trimerspresent in grana membranes of deg5 mutant as (partially?) aggregatedones.
It is highly probable that “extra” LHCII trimers of the two mutantsdiffer considerably with respect to their polypeptide composition.Namely, the results presented in Subsection 3.1 of this work stronglysuggest that these are typical LHCII-M trimers that build up “extra”LHCII pool of deg5 mutant while the “extra” trimers present in granamembranes of koCP24mutantmay be atypical, since Lhcb3 apoproteinsof themutant's LHCII-M trimers seem to be at least partially substitutedby Lhcb1 and Lhcb2 ones as judged by a decrease in Lhcb3 and a com-pensatory increase in Lhcb1/Lhcb2 pools demonstrated to occur simul-taneously in the koCP24mutants vs. WT plants [25,26]. Since individualLHCII apoproteins are heterogeneous with regard to the rate of cation-induced aggregation in vitro [38] typical and atypical “extra” LHCII-Mtrimers may be represented by quite different aggregation statesin vivo and have opposite impacts on fluorescence decay of granamembranes.
325K. Gibasiewicz et al. / Biochimica et Biophysica Acta 1847 (2015) 314–327
Acknowledgements
This work was supported by the Polish National Science Centerthrough grant no. N N303 563539 to GJ. WG, SS, EG, and WS were sup-ported by Laserlab-Europe, the Integrated Initiative of European LaserResearch Infrastructures in the 7-th Framework Programme of EU(grant nos. LCVU001717 (2011) and LLAMS001882 (2012)). KG wassupported by the project “Integrated program supporting the develop-ment of the AdamMickiewicz University in Poznan in the field of phys-ical sciences: Pro-innovative education, competent staff, graduates ofthe future” (POKL.04.01.01-00-133/09-00 Sub-measure 4.1.1 of theHuman Capital Operational Programme, co-financed by the EuropeanUnion under the European Social Fund).
Appendix A. Calculation of PSI/PSII ratio for grana membranes
To calculate PSI/PSII ratio, the Chl a/apoprotein and Chl b/apoproteinstoichiometry of the individual pigment–protein complexes belongingto PSII–LHCII supercomplexes (C2S2M2) [39–42] and PSI–LHCIsupercomplexes [43,44] (see Table A1) as well as Chl a:Chl b ratioand the number of LHCII trimers per PSII core (n) determined experi-mentally for wild type and deg5 grana membranes in this work, wereapplied.
Table A1Literature numbers of Chl a and Chl b molecules in PSII polypeptides and PSI–LHCIcomplex.
Pigment–proteincomplex
Number of Chl amolecules associatedwith the complex perP680 or P700
Number of Chl bmolecules associatedwith the complex perP680 or P700
Source
PSII reaction center
6 [40,44] CP47 16 –CP43
13 or 14 CP24 5 4 [38] CP26 6 3 CP29 6 or 8.5 2 or 4.5 [38,41] LHCII trimer 24 18 [39] PSI–LHCI 155.7 17.3 [42,43]For instance, when the number of Chl a molecules associated withCP43 per P680 equals 13 [41] and the number of Chl a and Chl b mole-cules associated with CP29 per P680 equals 8.5 and 4.5, respectively[42], the Chl a:Chl b ratio (A), for both wild type and deg5 grana mem-branes is given by a following equation:
A ¼ 155:7PSI þ 35PSII þ 19:5PSII þ 24nPSII17:3PSI þ 11:5PSII þ 18nPSII
: ðA1Þ
In turn, when the number of Chl a molecules associated with CP43per P680 is taken as 14 [45] and the number of Chl a and Chl bmoleculesassociated with CP29 per P680 again as 8.5 and 4.5, respectively [42],the Chl a:Chl b ratio (A), for both wild type and deg5 grana membranesis given by the equation:
A ¼ 155:7PSI þ 36PSII þ 19:5PSII þ 24nPSII17:3PSI þ 11:5PSII þ 18nPSII
: ðA2Þ
In both equations n represents the number of LHCII trimers perPSII core, PSI is the content value of PSI–LHCI complexes in granamembranes sample and PSII is the content value of PSII–LHCIIsupercomplexes (C2S2M2) in grana membranes sample.
Thus A is given by
A ¼155:7
PSIPSII
þ 19:5þ 35þ 24n
17:3PSIPSII
þ 18nþ 11:5ðA3Þ
or
A ¼155:7
PSIPSII
þ 19:5þ 36þ 24n
17:3PSIPSII
þ 18nþ 11:5; ðA4Þ
respectively.By relevant transformations it is derived that PSI/PSII can be
calculated as
PSIPSII
¼ 24nþ 54:5−A 18nþ 11:5ð Þ17:3A−155:7
ðA5Þ
or
PSIPSII
¼ 24nþ 55:5−A 18nþ 11:5ð Þ17:3A−155:7
: ðA6Þ
Appendix B. Description of Monte Carlo simulation
The network of nodes and links between them considered in MCsimulations of fluorescence decay is presented in Fig. 5. Similar nodesand linkswere used previously [3]. 24 nodes (labeled 0–23 in Fig. 5) cor-respond to 24 light-harvesting complexes forming the C2S2M2 versionof the PSII–LHCII supercomplex. They are called emitting nodes, sinceall of them contain Chl a molecules, and their emission may contributeto the fluorescence recorded in the time-resolved experiment. The re-maining four nodes (labeled 24–27) correspond to specific charge-separated states of reaction centers, nodes 24 and 25 being primarycharge separated states and nodes 26 and 27 being secondary chargeseparated states. Thus, the nodes 24–27 depict non-emitting or darkstates of RCs. Back transitions from nodes 24 and 25 to the emittingnodes (nodes 11 and 23 representing excited states of RCs) are possible,whereas transitions to nodes 26 and 27 are irreversible.
In order to simulate fluorescence decay in the C2S2M2 version of thePSII–LHCII supercomplex the following algorithm was applied. It wasassumed that the initial single photon excitation of any of the emittingnodes randomly walks between nodes until it reaches one of the finaldark state (nodes 26 or 27). The initial excitation was randomly placedin one of the emitting nodes (0–23)with the probability of n/N, where nis the number of Chls a in the given node and N is the number of all Chlsa in the C2S2M2 version of the PSII–LHCII supercomplex (N=200 for thestandard network). This approach is justified by the fact that excitationflashes, at 400 nm, are not expected to excite significant amount of Chlsb. The excitation could leave a particular node stochastically with equalprobabilities (except for nodes 11, 23–27, see below) to one of theneighboring linked node after time interval specified in Table 2 dividedby the number of linked neighbors.
After reaching one of the RC nodes (11 and 23), excitation could bequenched with rate kcs = 1/τCS by dark nodes (24 or 25) or be trans-ferred back to any of the three remaining linked nodes with equalrates 1/0.75 ∗ τhop (see Table 2). Effectively, the excitation was trans-ferred from nodes 11 and 23 to one of the neighboring nodes aftertime resulting from summation of the rates and given by the formula:
τ11;23 ¼ 11τCS
þ 30:75 � τhop
: ðB1Þ
326 K. Gibasiewicz et al. / Biochimica et Biophysica Acta 1847 (2015) 314–327
Consequently, probabilities of charge separation, PCS, and of excita-tion escape via each of the three remaining pathways from RC nodes(11 and 23), P, were calculated, from the following formulas:
PCS ¼ τ11;23=τCS; ðB2Þ
P ¼ τ11;23= 0:75 � τhop� �
: ðB3Þ
Similarly, the lifetime of occupation of dark nodes 24 and 25was cal-culated from the formula:
τ24;25 ¼ 11τCR
þ 1τRP
; ðB4Þ
where τCR and τRP are reciprocals of the respective rate constants shownin Fig. 5. The probabilities of charge recombination, PCR, and formationof irreversible radical pair states, PRP, (nodes 26 and 27)were calculatedfrom the formulas:
PCR ¼ 1=τCRð Þ= 1=τRPð Þ þ 1=τCRð Þ½ �; ðB5Þ
PRP ¼ 1=τRPð Þ= 1=τRPð Þ þ 1=τCRð Þ½ �: ðB6Þ
The state of the excitation was checked every 0.5 ps from time zerountil reaching the final node (26 or 27) and this state was recorded as afunction of time: value 1 was assigned to those 0.5-ps time intervals forwhich excitation was localized on any of the emitting nodes and value0 — to those intervals for which excitation was localized in the revers-ible dark state nodes (24 or 25). Recording of the state of excitation intime was repeated about 20 000 times (starting randomly fromdifferent emitting nodes), and the sum of all these records, after propernormalization (multiplying by a constant), was compared to the exper-imentally measured fluorescence decay. Of course, the quality of thesimulated fit depended on the values of the four fit parameters τhop,τCS, τCR, and τRP. After each simulation these parameters were iterative-ly optimized in order to give possibly best fit of the model curve to theexperimental trace.
Appendix C. Supplementary data
Supplementary data to this article can be found online at http://dx.doi.org/10.1016/j.bbabio.2014.12.004.
References
[1] S. Caffarri, R. Kouřil, S. Kereïche, E.J. Boekema, R. Croce, Functional architecture ofhigher plant Photosystem II supercomplexes, EMBO J. 28 (2009) 3052–3063.
[2] R. Croce, H. van Amerongen, Light-harvesting and structural organization of Photo-system II: from individual complexes to thylakoid membrane, J. Photochem.Photobiol. B Biol. 104 (2011) 142–153.
[3] S. Caffarri, K. Broess, R. Croce, H. Van Amerongen, Excitation energy transfer andtrapping in higher plant Photosystem II complexes with different antenna sizes,Biophys. J. 100 (2011) 2094–2103.
[4] B. van Oort, M. Alberts, S. De Bianchi, L. Dall'Osto, R. Bassi, G. Trinkunas, R. Croce, H.van Amerongen, Effect of antenna-depletion in Photosystem II on excitation energytransfer in Arabidopsis thaliana, Biophys. J. 98 (2010) 922–931.
[5] K. Broess, G. Trinkunas, C.D. van Der Weij-De Wit, J.P. Dekker, A. van Hoek, H. vanAmerongen, Excitation energy transfer and charge separation in Photosystem IImembranes revisited, Biophys. J. 91 (2006) 3776–3786.
[6] K. Broess, G. Trinkunas, A. van Hoek, R. Croce, H. van Amerongen, Determination ofthe excitation migration time in Photosystem II. Consequences for the membraneorganization and charge separation parameters, Biochim. Biophys. Acta Bioenerg.1777 (2008) 404–409.
[7] F.J.E. van Mieghem, G.F.W. Searle, A.W. Rutherford, T.J. Schaafsma, The influence ofthe double reduction of QA on the fluorescence decay kinetics of Photosystem II,Biochim. Biophys. Acta 1100 (1992) 198–206.
[8] M.J. Schilstra, J. Nield, W. Dörner, B. Hankamer, M. Carradus, L.M.C. Barter, J. Barber,D.R. Klug, Similarity between electron donor side reactions in the solubilized Photo-system II–LHC II supercomplex and Photosystem-II-containing membranes,Photosynth. Res. 60 (1999) 191–198.
[9] R. Kouřil, E. Wientjes, J.B. Bultema, R. Croce, E.J. Boekema, High-light vs. low-light:effect of light acclimation on Photosystem II composition and organization inArabidopsis thaliana, Biochim. Biophys. Acta Bioenerg. 1827 (2013) 411–419.
[10] M. Grabsztunowicz, G. Jackowski, Isolation of intact and pure chloroplasts formleaves of Arabidopsis thaliana plants acclimated to low irradiance for studies onRubisco regulation, Acta Soc. Bot. Polon. 82 (2013) 91–95.
[11] R. Luciński, L. Misztal, S. Samardakiewicz, G. Jackowski, Involvement of Deg5 prote-ase in wounding-related disposal of PsbF apoprotein, Plant Physiol. Biochem. 49(2011) 311–320.
[12] D.A. Berthold, G.T. Babcock, C.F. Yocum, A highly resolved, oxygen-evolving Photo-system II preparation form spinach thylakoid membranes, FEBS Lett. 134 (1981)231–234.
[13] T. Dunahay, L.A. Staehelin, M. Seibert, P.D. Ogilvie, S.P. Berg, Structural, biochemicaland biophysical characterization of four oxygen evolving Photosystem II prepara-tions from spinach, Biochim. Biophys. Acta 764 (1984) 179–193.
[14] H. Schagger, Tricine-SDS-PAGE, Nat. Protoc. 1 (2006) 16–22.[15] S.W. Hogewoning, E. Wientjes, P. Douwstra, G. Trouwborst, W. van Ieperen, R. Croce,
J. Harbinson, Photosynthetic quantum yield dynamics: from photosystems to leaves,Plant Cell 24 (2012) 1921–1935.
[16] D. Arnon, Copper enzymes in isolated chloroplasts. Polyphenol oxidase in Betavulgaris, Plant Physiol. 24 (1949) 1–15.
[17] W. Giera, V.M. Ramesh, A.N. Webber, I. van Stokkum, R. van Grondelle, K.Gibasiewicz, Effect of the P700 pre-oxidation and point mutations near A0 on the re-versibility of the primary charge separation in Photosystem I from Chlamydomonasreinhardtii, Biochim. Biophys. Acta Bioenerg. 1797 (2010) 106–112.
[18] J.J. Snellenburg, S. Laptenok, R. Seger, K.M. Mullen, I.H.M. van Stokkum, Glotaran: aJava-based graphical user interface for the R package TIMP, J. Stat. Softw. 49(2012) 1–22.
[19] A.R. Holzwarth, Data analysis of time-resolved measurements, in: J. Amesz, A.J. Hoff(Eds.), Biophysical Techniques in Photosynthesis (Advances in Photosynthesis andRespiration), vol. 3, Kluwer Academic Publishers, Dordrecht, 1996, pp. 75–92.
[20] J. Karolczak, D. Komar, J. Kubicki, M. Szymański, T. Wróżowa, A. Maciejewski, Fluo-rescence dynamics spectrometer of single-picosecond resolution: optimisation ofexperimental performance, Bull. Pol. Acad. Sci. Chem. 47 (1999) 361–380.
[21] J. Karolczak, D. Komar, J. Kubicki, T. Wróżowa, K. Dobek, B. Ciesielska, A.Maciejewski, The measurements of picosecond fluorescence lifetimes with highaccuracy and subpicosecond precision, Chem. Phys. Lett. 344 (2001) 154–164.
[22] T. Wróżowa, B. Ciesielska, D. Komar, J. Karolczak, A. Maciejewski, J. Kubicki,Measurements of picosecond lifetime by time correlated single photon countingmethod: the effect of the refraction index of the solvent on the instrument responsefunction, Rev. Sci. Instrum. 75 (2004) 3107–3121.
[23] M. Zuker, A.G. Szabo, L. Bramall, D.T. Krajcarski, Delta function convolution method(DFCM) for fluorescence decay experiments, Rev. Sci. Instrum. 56 (1985) 14–22.
[24] X.W. Sun, L. Peng, J. Guo, W. Chi, J. Ma, C. Lu, L. Zhang, Formation of DEG5 and DEG8and their involvement in the degradation of photodamaged Photosystem II reactioncenter D1 protein in Arabidopsis, Plant Cell 19 (2007) 1347–1361.
[25] S. de Bianchi, L. Dall'Osto, G. Tognon, T. Morosinotto, R. Bassi, Minor antenna pro-teins CP24 and CP26 affect the interactions between Photosystem II subunits andthe electron transport rate in grana membranes of Arabidopsis, Plant Cell 20(2008) 1012–1028.
[26] L. Kovacs, J. Damkjaer, S. Kereiche, C. Illoaia, A.V. Ruban, E.J. Boekema, S. Jansson, P.Horton, Lack of the light-harvesting complex CP24 affects the structure and functionof the grana membranes of higher plant chloroplasts, Plant Cell 18 (2006)3106–3120.
[27] H. Dau, K. Sauer, Exciton equilibration and Photosystem II exciton dynamics — afluorescence study on Photosystem II membrane particles of spinach, Biochim.Biophys. Acta 1273 (1996) 175–190.
[28] R.C. Jennings, G. Zucchelli, F.M. Garlaschi, The influence of quenching by open reac-tion centres on the Photosystem II fluorescence emission spectrum, Biochim.Biophys. Acta 1060 (1991) 245–250.
[29] R.C. Jennings_, G. Elli, F.M. Garlaschi, S. Santabarbara, G. Zucchelli, Selectivequenching of the fluorescence of core chlorophyll–protein complexes by photo-chemistry indicates that Photosystem II is partly diffusion limited, Photosynth.Res. 66 (2000) 225–233.
[30] B. van Oort, A. van Hoek, A.V. Ruban, H. van Amerongen, Aggregation of Light-Harvesting Complex II leads to formation of efficient excitation energy traps in mo-nomeric and trimeric complexes, FEBS Lett. 581 (2007) 3528–3532.
[31] R.C. Jennings, R. Bassi, F.M. Garlaschi, P. Dainese, G. Zucchelli, Distribution of thechlorophyll spectral forms in the chlorophyll–protein complexes of Photosystem IIantenna, Biochemistry 32 (1993) 3203–3210.
[32] G.H. Schatz, H. Brock, A.R. Holzwarth, Kinetic and energetic model for the primaryprocesses in Photosystem II, Biophys. J. 54 (1988) 397–405.
[33] J.R. Durrant, D.R. Klug, S.L. Kwa, R. van Grondelle, G. Porter, J.P. Dekker, A multimermodel for P680, the primary electron donor of Photosystem II, Proc. Natl. Acad. Sci.U. S. A. 92 (1995) 4798–4802.
[34] K. Gibasiewicz, A. Dobek, J. Breton, W. Leibl, Modulation of primary radical pair ki-netics and energetics in PS II by the redox state of the quinone electron acceptorQA, Biophys. J. 80 (2001) 1617–1630.
[35] A.R. Holzwarth, M.G. Müller, M. Reus, M. Nowaczyk, J. Sander, M. Rögner, Kineticsand mechanism of electron transfer in intact Photosystem II and in the isolated re-action center: pheophytin is the primary electron acceptor, Proc. Natl. Acad. Sci. U. S.A. 103 (2006) 6895–6900.
[36] Y. Miloslavina, M. Szczepaniak, M.G. Müller, J. Sander, M. Nowaczyk, M. Rögner,A.R. Holzwarth, Charge separation kinetics in intact Photosystem II core parti-cles is trap-limited. A picosecond fluorescence study, Biochemistry 45 (2006)2436–2442.

327K. Gibasiewicz et al. / Biochimica et Biophysica Acta 1847 (2015) 314–327
[37] M. Szczepaniak, J. Sander, M. Nowaczyk, M.G. Müller, M. Rogner, A.R. Holzwarth,Charge separation, stabilization, and protein relaxation in Photosystem II core parti-cles with closed reaction center, Biophys. J. 96 (2009) 621–631.
[38] G. Jackowski, E. Kluck, Heterogeneous behaviour of subunits of the light-harvestingchlorophyll a/b-protein complex of photosystem 2 during cation-induced aggregation,Photosynthetica 29 (1993) 401–407.
[39] R. Bassi, B. Pineau, P. Dainese, J. Marquardt, Carotenoid-binding proteins of Photo-system II, Eur. J. Biochem. 212 (1993) 297–303.
[40] Z. Liu, H. Yan, K. Wang, T. Kuang, J. Zhang, L. Giu, W. Chang, Crystal structure ofspinach major light-harvesting complex of Photosystem II at 2.72 Å resolution,Nature 428 (2004) 287–292.
[41] B. Loll, J. Kern, W. Saeneger, A. Zouni, J. Biesiadka, Toward complete cofactorarrangement in the 3 Å resolution structure of Photosystem II, Nature 438 (2005)1040–1044.
[42] X. Pan, M. Li, T. Wan, L. Wang, C. Jia, Z. Hou, X. Zhao, J. Zhang, W. Chang, Structuralinsight into energy regulation of light-harvesting complex CP29 from spinach, Nat.Struct. Biol. 18 (2011) 309–316.
[43] T. Morosinotto, M. Ballottari, F. Klimmek, S. Jansson, R. Bassi, The association of theantenna system to Photosystem I in higher plants, J. Biol. Chem. 280 (2005)31050–31058.
[44] A. Amunts, H. Toporik, A. Borovikova, N. Nelson, Structure determination andimproved model of plant Photosystem I, J. Biol. Chem. 285 (2010) 3478–3486.
[45] K.N. Ferreira, T.M. Iverson, K. Maghlaoui, J. Barber, S. Iwata, Architecture of thephotosynthetic oxygen-evolving center, Science 19 (2004) 1831–1838.