Monitoring statewide urban development using multitemporal multisensoral satellite data covering a...
10
Monitoring state-wide urban Development using multitemporal, multisensoral Satellite Data covering a 40 Year- Time Span in North Rhine-Westphalia (Germany) Birte Schöttker * a , Martin Over a , Matthias Braun a , Gunter Menz a,b Alexander Siegmund c a Zentrum für Fernerkundung der Landoberfläche (ZFL), Universität Bonn, Walter-Flex-Str. 3, 53113 Bonn, Germany; b Remote Sensing Research Group (RSRG), Department of Geography, University of Bonn, Meckenheimer Allee 166, 53115 Bonn, Germany ; c Pädagogische Hochschule Karlsruhe, Department of Geographie, Bismarckstraße 10, 76133 Karlsruhe, Germany ABSTRACT Increasing population growth and growing ecological problems in urban areas require advanced remote sensing technology for the acquisition of detailed and accurate land-use information for urban management and planning issues. Surface consumption of 120 ha per day (2003) for traffic and settlement areas in Germany is far away from the 30 ha per day of the sustainability-strategy intended for the year 2020 by the Federal Environmental Ministry. With regard to the 50ies, imperviousness and sealing almost doubled. The presented study is embedded in a project in North Rhine- Westphalia (NRW), the most densely populated federal state in Germany. During the last decades, industrial transformation processes as well as strong economic and socio-structural changes have taken place, making NRW most suitable as an exemplary region to study and visualize dynamic developments in Europe. The examined time period of this work includes intense urban development and expansion in the suburban regions. LANDSAT data of three time slices (1975, 1984 & 2001) build the backbone to detect the changes taken place. Applying a multisensoral approach with improved spatial and even spectral resolution the focus is on the urban development of certain “hot spots” in NRW. CORONA, IKONOS as well as ASTER satellite data is used to allow a further characterization of urban land- use types and changes in more detail over the last four decades. Classical change detection methods as PCA are combined with classification of segmented urban land-use areas when evaluating the type of change. Keywords: urban areas, multisensor approach, change detection, CORONA, North-Rhine-Westphalia 1. INTRODUCTION One major motivation for this study is the fact that surface assertion can be regarded as one of the most important ecological challenges 1 . The amount of impervious areas is considered a significant environmental indicator of watershed health, water quality, and overall ecosystem well being 2 . About 21 % of the area in NRW belongs to settlement- and traffic. Already between 1997 and 2002 the areas used for settlement-purposes in NRW increased for 4.3 % or about 30.000 ha. 3 Issues like the surface consumption can be addressed through land use decisions made at the county, township and municipal levels of government. A concerted effort is necessary to develop methods and tools in order to raise awareness in the public as well as in the administrative sector and educational institutions 4 . Therefore a considerable need of information, easily used tools, and educational programs exists. Remote sensing is excellently suited to offer this information as numerous studies for detecting changes in the environment have already proven (e.g. Jensen 1996 5 , McLeod & Congalton 1998 6 ; Mas 1999 7 ; Singh 2001 8 ). But, as Civco (2000) 9 proposes more rigorously, Remote Sensing (RS), GIS and other geospatial tools must be simplified, explained and otherwise tailored through professional educators and applications experts to reach certain target groups in the meaning of end-users. Satellite data and aerial photographs can be illustrative and highly fascinating forming a vivid informational basis for environmental education. * [email protected]; phone +49 (0)228 73-4925; fax +49 (0)228 73-6857; zfl.uni-bonn.de
-
Upload
independent -
Category
Documents
-
view
0 -
download
0
Transcript of Monitoring statewide urban development using multitemporal multisensoral satellite data covering a...
Monitoring state-wide urban Development using multitemporal, multisensoral Satellite Data covering a 40 Year-
Time Span in North Rhine-Westphalia (Germany)
Birte Schöttker∗ a, Martin Overa, Matthias Brauna, Gunter Menza,b Alexander Siegmundc aZentrum für Fernerkundung der Landoberfläche (ZFL), Universität Bonn, Walter-Flex-Str. 3, 53113 Bonn, Germany;
b Remote Sensing Research Group (RSRG), Department of Geography, University of Bonn, Meckenheimer Allee 166, 53115 Bonn, Germany ;
c Pädagogische Hochschule Karlsruhe, Department of Geographie, Bismarckstraße 10, 76133 Karlsruhe, Germany
ABSTRACT Increasing population growth and growing ecological problems in urban areas require advanced remote sensing technology for the acquisition of detailed and accurate land-use information for urban management and planning issues. Surface consumption of 120 ha per day (2003) for traffic and settlement areas in Germany is far away from the 30 ha per day of the sustainability-strategy intended for the year 2020 by the Federal Environmental Ministry. With regard to the 50ies, imperviousness and sealing almost doubled. The presented study is embedded in a project in North Rhine-Westphalia (NRW), the most densely populated federal state in Germany. During the last decades, industrial transformation processes as well as strong economic and socio-structural changes have taken place, making NRW most suitable as an exemplary region to study and visualize dynamic developments in Europe. The examined time period of this work includes intense urban development and expansion in the suburban regions. LANDSAT data of three time slices (1975, 1984 & 2001) build the backbone to detect the changes taken place. Applying a multisensoral approach with improved spatial and even spectral resolution the focus is on the urban development of certain “hot spots” in NRW. CORONA, IKONOS as well as ASTER satellite data is used to allow a further characterization of urban land-use types and changes in more detail over the last four decades. Classical change detection methods as PCA are combined with classification of segmented urban land-use areas when evaluating the type of change.
Keywords: urban areas, multisensor approach, change detection, CORONA, North-Rhine-Westphalia
1. INTRODUCTION One major mo tivation for this study is the fact that surface assertion can be regarded as one of the most important ecological challenges1. The amount of impervious areas is considered a significant environmental indicator of watershed health, water quality, and overall ecosystem well being2. About 21 % of the area in NRW belongs to settlement- and traffic. Already between 1997 and 2002 the areas used for settlement-purposes in NRW increased for 4.3 % or about 30.000 ha.3
Issues like the surface consumption can be addressed through land use decisions made at the county, township and municipal levels of government. A concerted effort is necessary to develop methods and tools in order to raise awareness in the public as well as in the administrative sector and educational institutions4. Therefore a considerable need of information, easily used tools, and educational programs exists. Remote sensing is excellently suited to offer this information as numerous studies for detecting changes in the environment have already proven (e.g. Jensen 19965, McLeod & Congalton 19986; Mas 19997; Singh 20018). But, as Civco (2000)9 proposes more rigorously, Remote Sensing (RS), GIS and other geospatial tools must be simplified, explained and otherwise tailored through professional educators and applications experts to reach certain target groups in the meaning of end-users. Satellite data and aerial photographs can be illustrative and highly fascinating forming a vivid informational basis for environmental education.
∗[email protected]; phone +49 (0)228 73-4925; fax +49 (0)228 73-6857; zfl.uni-bonn.de
Schöttker,Over,Braun et al.: Monitoring state wide urban Development using multitemporal multisensoral (…) in NRW
Proceedings of the SPIE 10th International Symposium on Remote Sensing, 8-12th September 2003, Barcelona, Spain
2 / 10/
The project’s main objective is to use remote sensing derived area-wide land use/-cover data to build capacity in regard to the issue of surface assertion and sealing during the last 30 years in an educationally useful way. Via an Internet portal the data is visualized and exp lained and a communicational platform provides possibilities for the interaction between different stakeholders, citizens and scientists. Awareness for ongoing development processes shall be created and especially an encouragement to public participation in dialogues concerning the mentioned topics should be inspired. Although, in Germany, development plans are laid out for public access before their implementation and the citizens have the possibility to criticize the plans the chance of active intervention is rarely taken. The visual information of changing land-cover and land-use and the offered discussion forum could stimulate the interaction.
Furthermore a comprehensive inventory on land use statistics is compiled and integrated with the large GIS database provided by the provincial authorities. For areas of special interest complementary thematic layers (e.g. urban development, open pit mining) are generated using multi-sensor image interpretation (ASTER, CORONA, IKONOS etc.). Moreover, time series of orthophotos and oblique aerial photographs are integrated in the web interface for the purpose of the visualization.
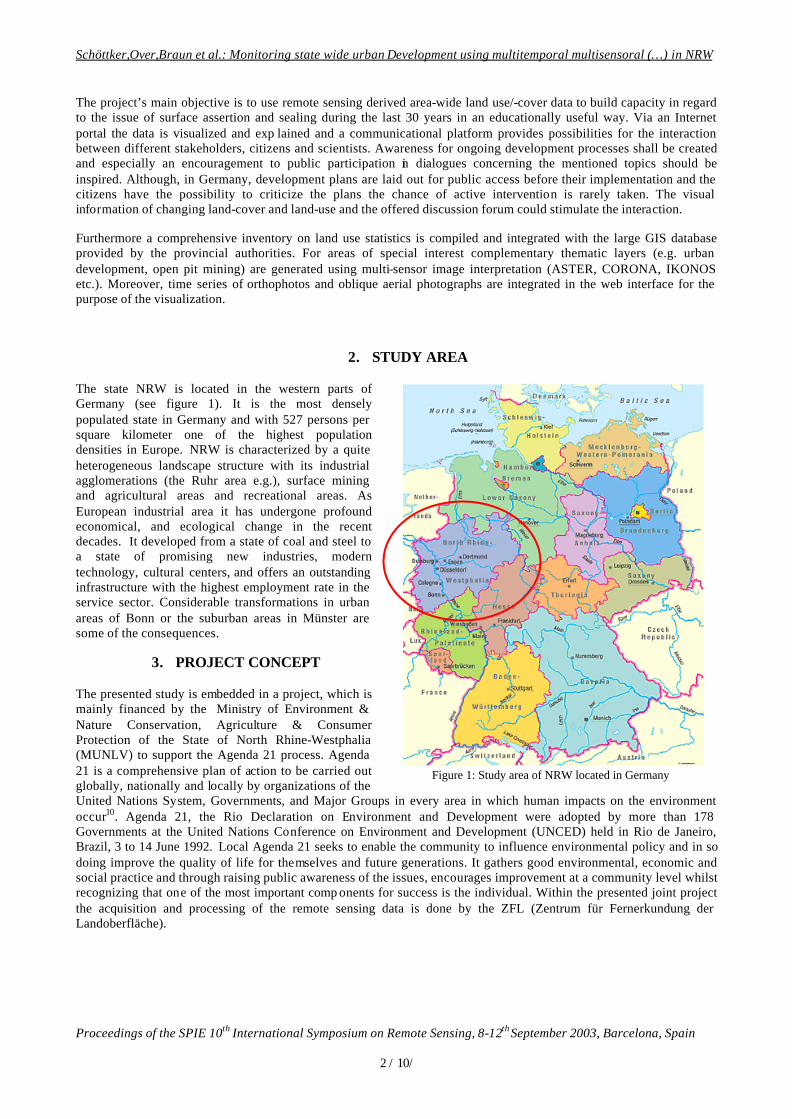
2. STUDY AREA The state NRW is located in the western parts of Germany (see figure 1). It is the most densely populated state in Germany and with 527 persons per square kilometer one of the highest population densities in Europe. NRW is characterized by a quite heterogeneous landscape structure with its industrial agglomerations (the Ruhr area e.g.), surface mining and agricultural areas and recreational areas. As European industrial area it has undergone profound economical, and ecological change in the recent decades. It developed from a state of coal and steel to a state of promising new industries, modern technology, cultural centers, and offers an outstanding infrastructure with the highest employment rate in the service sector. Considerable transformations in urban areas of Bonn or the suburban areas in Münster are some of the consequences.
3. PROJECT CONCEPT The presented study is embedded in a project, which is mainly financed by the Ministry of Environment & Nature Conservation, Agriculture & Consumer Protection of the State of North Rhine-Westphalia (MUNLV) to support the Agenda 21 process. Agenda 21 is a comprehensive plan of action to be carried out globally, nationally and locally by organizations of the United Nations System, Governments, and Major Groups in every area in which human impacts on the environment occur10. Agenda 21, the Rio Declaration on Environment and Development were adopted by more than 178 Governments at the United Nations Conference on Environment and Development (UNCED) held in Rio de Janeiro, Brazil, 3 to 14 June 1992. Local Agenda 21 seeks to enable the community to influence environmental policy and in so doing improve the quality of life for themselves and future generations. It gathers good environmental, economic and social practice and through raising public awareness of the issues, encourages improvement at a community level whilst recognizing that one of the most important comp onents for success is the individual. Within the presented joint project the acquisition and processing of the remote sensing data is done by the ZFL (Zentrum für Fernerkundung der Landoberfläche).
Figure 1: Study area of NRW located in Germany
Schöttker,Over,Braun et al.: Monitoring state wide urban Development using multitemporal multisensoral (…) in NRW
Proceedings of the SPIE 10th International Symposium on Remote Sensing, 8-12th September 2003, Barcelona, Spain
3 / 10/
Via Internet the result of the classification and the natural color images of different district levels (administrative district, district, community) are visualized for the three times slices down to the scale of the community. Additionally, the visual information is supported by statistics, orthophotos, photos and oblique aerial photographs and value added products derived from the remote sensing data. All of this information is provided with explaining texts. Links to the communities and districts shall give the opportunity for the end-user to participate or at least communicate about the presented issue.
4. DATA BASE The entire area of NRW is covered by five LANDSAT TM and ETM+ scenes and six LANDSAT MSS scenes respectively. They build the basis for the statewide classification and monitoring of changes for three time slices 1975, 1984 and 2001, a 25-year time span. Depending on the data quality in the meaning of cloud cover we had to acquire and then classify even within a one-year-time slice different acquisition times in the phenological year, e.g. ranging from May to July 2001. As the major aim was not to derive a differentiation between various crops the data was considered to be appropriate, nonetheless, but this fact resulted in more work-intensive classification approaches, which will be shown later.
For areas of special interest, additional remote sensing data and e.g. orthophotos should be used to illustrate certain issues as well as raise and emphasize the awareness for ongoing changes. Therefore data, either newly acquired or already existing from different institutions was used, that enabled a visualization of different issues in the context of surface assertion as follows:
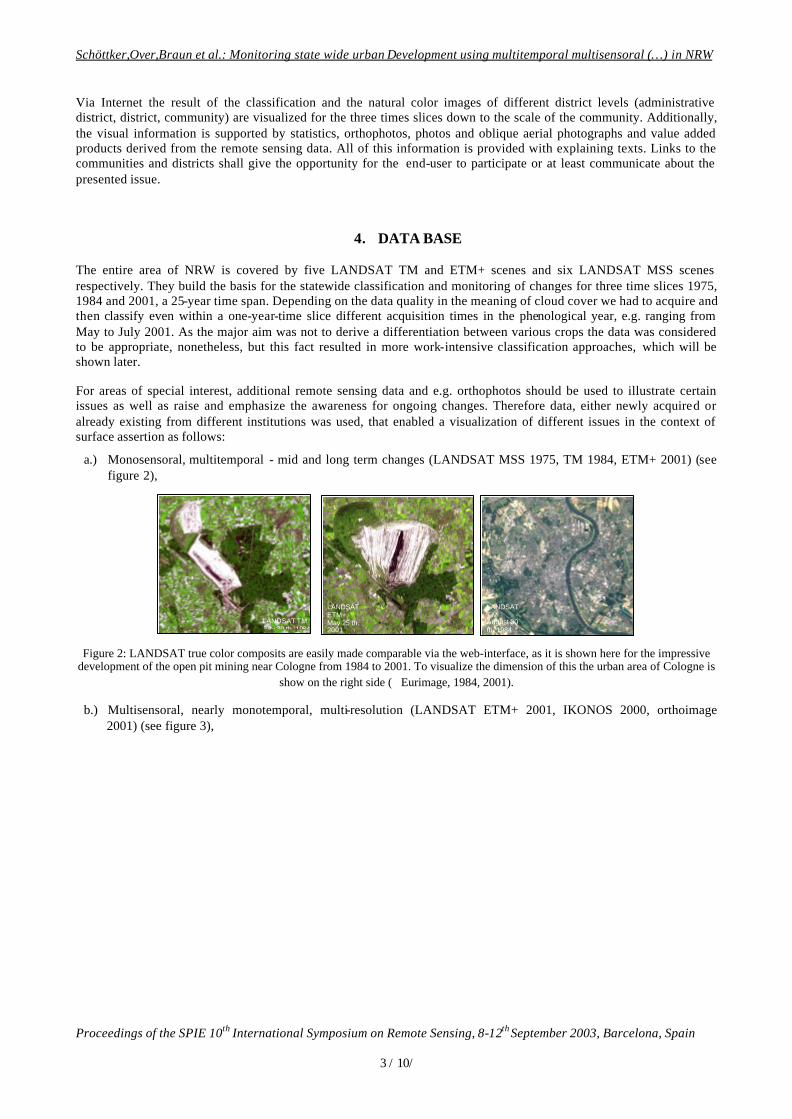
a.) Monosensoral, multitemporal - mid and long term changes (LANDSAT MSS 1975, TM 1984, ETM+ 2001) (see figure 2),
Figure 2: LANDSAT true color composits are easily made comparable via the web-interface, as it is shown here for the impressive development of the open pit mining near Cologne from 1984 to 2001. To visualize the dimension of this the urban area of Cologne is
show on the right side (Eurimage, 1984, 2001).
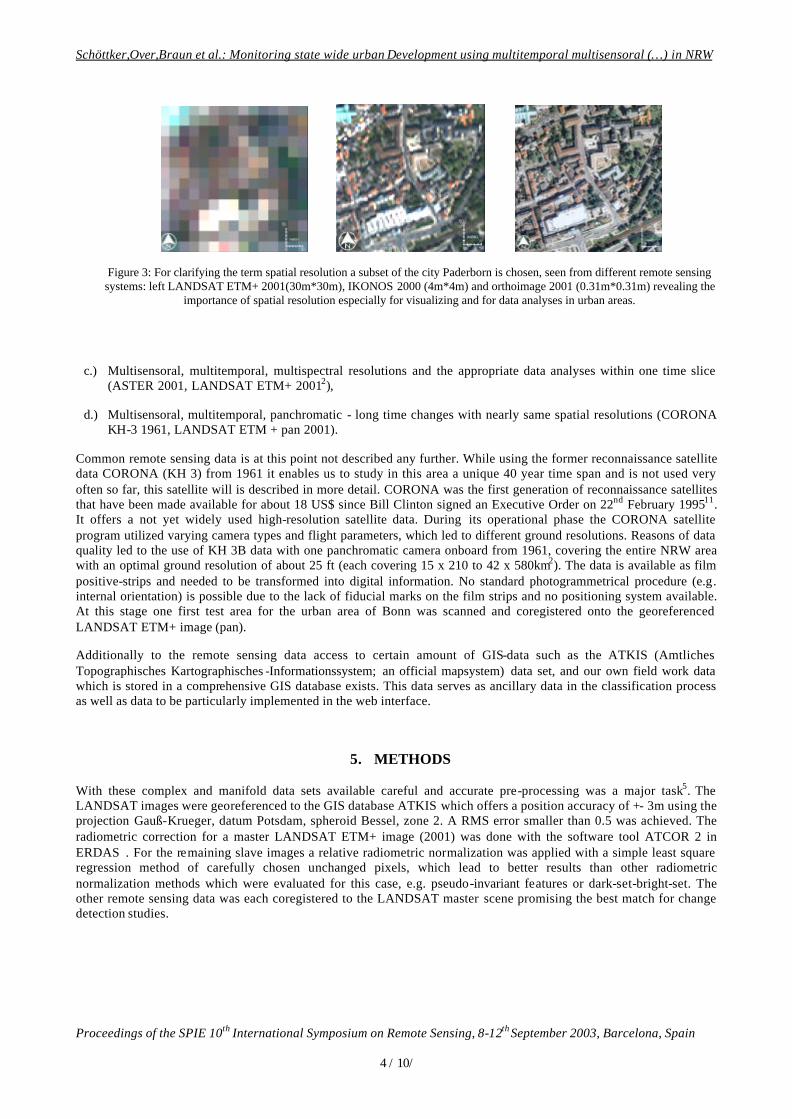
b.) Multisensoral, nearly monotemporal, multi-resolution (LANDSAT ETM+ 2001, IKONOS 2000, orthoimage 2001) (see figure 3),
LANDSAT ETM+, May 25 th, 2001
LANDSAT TM July 30 th, 1984
LANDSAT TM August 30 th, 1984
Schöttker,Over,Braun et al.: Monitoring state wide urban Development using multitemporal multisensoral (…) in NRW
Proceedings of the SPIE 10th International Symposium on Remote Sensing, 8-12th September 2003, Barcelona, Spain
4 / 10/
c.) Multisensoral, multitemporal, multispectral resolutions and the appropriate data analyses within one time slice (ASTER 2001, LANDSAT ETM+ 20012),
d.) Multisensoral, multitemporal, panchromatic - long time changes with nearly same spatial resolutions (CORONA KH-3 1961, LANDSAT ETM + pan 2001).
Common remote sensing data is at this point not described any further. While using the former reconnaissance satellite data CORONA (KH 3) from 1961 it enables us to study in this area a unique 40 year time span and is not used very often so far, this satellite will is described in more detail. CORONA was the first generation of reconnaissance satellites that have been made available for about 18 US$ since Bill Clinton signed an Executive Order on 22nd February 199511. It offers a not yet widely used high-resolution satellite data. During its operational phase the CORONA satellite program utilized varying camera types and flight parameters, which led to different ground resolutions. Reasons of data quality led to the use of KH 3B data with one panchromatic camera onboard from 1961, covering the entire NRW area with an optimal ground resolution of about 25 ft (each covering 15 x 210 to 42 x 580km2). The data is available as film positive-strips and needed to be transformed into digital information. No standard photogrammetrical procedure (e.g. internal orientation) is possible due to the lack of fiducial marks on the film strips and no positioning system available. At this stage one first test area for the urban area of Bonn was scanned and coregistered onto the georeferenced LANDSAT ETM+ image (pan).
Additionally to the remote sensing data access to certain amount of GIS-data such as the ATKIS (Amtliches Topographisches Kartographisches -Informationssystem; an official mapsystem) data set, and our own field work data which is stored in a comprehensive GIS database exists. This data serves as ancillary data in the classification process as well as data to be particularly implemented in the web interface.
5. METHODS With these complex and manifold data sets available careful and accurate pre-processing was a major task5. The LANDSAT images were georeferenced to the GIS database ATKIS which offers a position accuracy of +- 3m using the projection Gauß-Krueger, datum Potsdam, spheroid Bessel, zone 2. A RMS error smaller than 0.5 was achieved. The radiometric correction for a master LANDSAT ETM+ image (2001) was done with the software tool ATCOR 2 in ERDAS. For the remaining slave images a relative radiometric normalization was applied with a simple least square regression method of carefully chosen unchanged pixels, which lead to better results than other radiometric normalization methods which were evaluated for this case, e.g. pseudo-invariant features or dark-set-bright-set. The other remote sensing data was each coregistered to the LANDSAT master scene promising the best match for change detection studies.
Figure 3: For clarifying the term spatial resolution a subset of the city Paderborn is chosen, seen from different remote sensing systems: left LANDSAT ETM+ 2001(30m*30m), IKONOS 2000 (4m*4m) and orthoimage 2001 (0.31m*0.31m) revealing the
importance of spatial resolution especially for visualizing and for data analyses in urban areas.
Schöttker,Over,Braun et al.: Monitoring state wide urban Development using multitemporal multisensoral (…) in NRW
Proceedings of the SPIE 10th International Symposium on Remote Sensing, 8-12th September 2003, Barcelona, Spain
5 / 10/
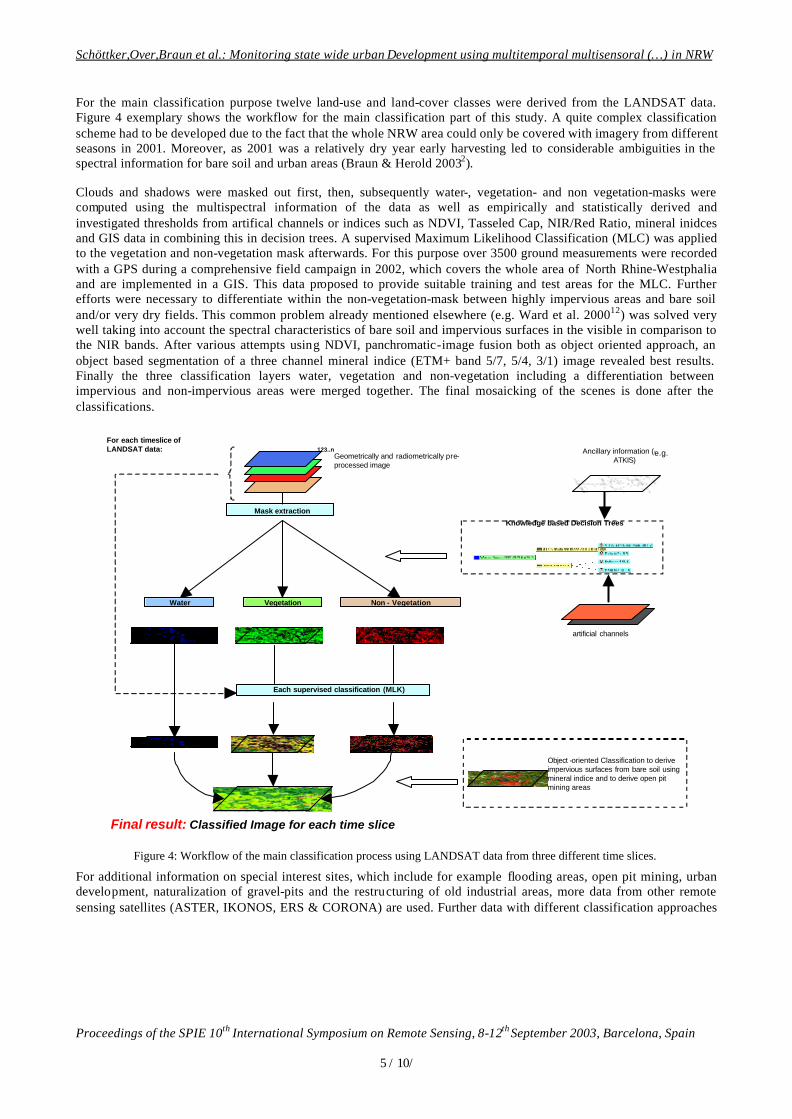
For the main classification purpose twelve land-use and land-cover classes were derived from the LANDSAT data. Figure 4 exemplary shows the workflow for the main classification part of this study. A quite complex classification scheme had to be developed due to the fact that the whole NRW area could only be covered with imagery from different seasons in 2001. Moreover, as 2001 was a relatively dry year early harvesting led to considerable ambiguities in the spectral information for bare soil and urban areas (Braun & Herold 20032).
Clouds and shadows were masked out first, then, subsequently water-, vegetation- and non vegetation-masks were computed using the multispectral information of the data as well as empirically and statistically derived and investigated thresholds from artifical channels or indices such as NDVI, Tasseled Cap, NIR/Red Ratio, mineral inidces and GIS data in combining this in decision trees. A supervised Maximum Likelihood Classification (MLC) was applied to the vegetation and non-vegetation mask afterwards. For this purpose over 3500 ground measurements were recorded with a GPS during a comprehensive field campaign in 2002, which covers the whole area of North Rhine-Westphalia and are implemented in a GIS. This data proposed to provide suitable training and test areas for the MLC. Further efforts were necessary to differentiate within the non-vegetation-mask between highly impervious areas and bare soil and/or very dry fields. This common problem already mentioned elsewhere (e.g. Ward et al. 200012) was solved very well taking into account the spectral characteristics of bare soil and impervious surfaces in the visible in comparison to the NIR bands. After various attempts using NDVI, panchromatic-image fusion both as object oriented approach, an object based segmentation of a three channel mineral indice (ETM+ band 5/7, 5/4, 3/1) image revealed best results. Finally the three classification layers water, vegetation and non-vegetation including a differentiation between impervious and non-impervious areas were merged together. The final mosaicking of the scenes is done after the classifications.
For additional information on special interest sites, which include for example flooding areas, open pit mining, urban development, naturalization of gravel-pits and the restructuring of old industrial areas, more data from other remote sensing satellites (ASTER, IKONOS, ERS & CORONA) are used. Further data with different classification approaches
Figure 3: Workflow for the classification process of the LANDSAT data (source: ??)
Classified Image for each time sliceFinal result:
For each timeslice of LANDSAT data:
Knowledge based Decision Trees
artificial channels
Ancillary information (e..g. ATKIS)
Mask extraction
Vegetation Non - VegetationWater
Object -oriented Classification to derive impervious surfaces from bare soil using mineral indice and to derive open pit mining areas
Each supervised classification (MLK)
0
Geometrically and radiometrically pre-processed image
123..n e.g.
Figure 4: Workflow of the main classification process using LANDSAT data from three different time slices.
Schöttker,Over,Braun et al.: Monitoring state wide urban Development using multitemporal multisensoral (…) in NRW
Proceedings of the SPIE 10th International Symposium on Remote Sensing, 8-12th September 2003, Barcelona, Spain
6 / 10/
is embedded using e.g. ASTER data to detect degrees of impervious surfaces as it is described in Braun & Herold 20032.
The basic software used in this study are ERDAS Inc. 8.6 and for GIS applications mainly ArcGIS or ArcView 3.2 And for object oriented image classification the software ecognition.
6. PRELIMINARY RESULTS
The results can be divided into two groups: state wide classification and visualization of certain hot spots and the changes taken place there.
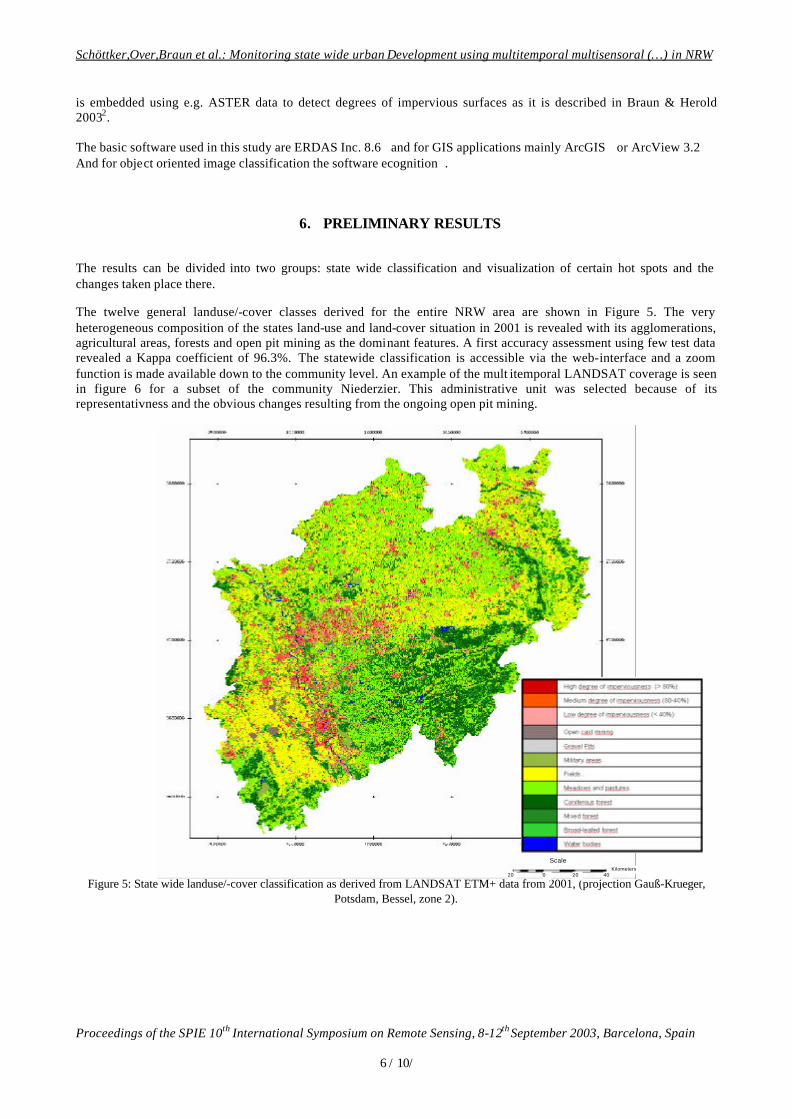
The twelve general landuse/-cover classes derived for the entire NRW area are shown in Figure 5. The very heterogeneous composition of the states land-use and land-cover situation in 2001 is revealed with its agglomerations, agricultural areas, forests and open pit mining as the dominant features. A first accuracy assessment using few test data revealed a Kappa coefficient of 96.3%. The statewide classification is accessible via the web-interface and a zoom function is made available down to the community level. An example of the mult itemporal LANDSAT coverage is seen in figure 6 for a subset of the community Niederzier. This administrative unit was selected because of its representativness and the obvious changes resulting from the ongoing open pit mining.
Figure 5: State wide landuse/-cover classification as derived from LANDSAT ETM+ data from 2001, (projection Gauß-Krueger,
Potsdam, Bessel, zone 2).
Scale
20 20 0 40 Kilometers
Schöttker,Over,Braun et al.: Monitoring state wide urban Development using multitemporal multisensoral (…) in NRW
Proceedings of the SPIE 10th International Symposium on Remote Sensing, 8-12th September 2003, Barcelona, Spain
7 / 10/
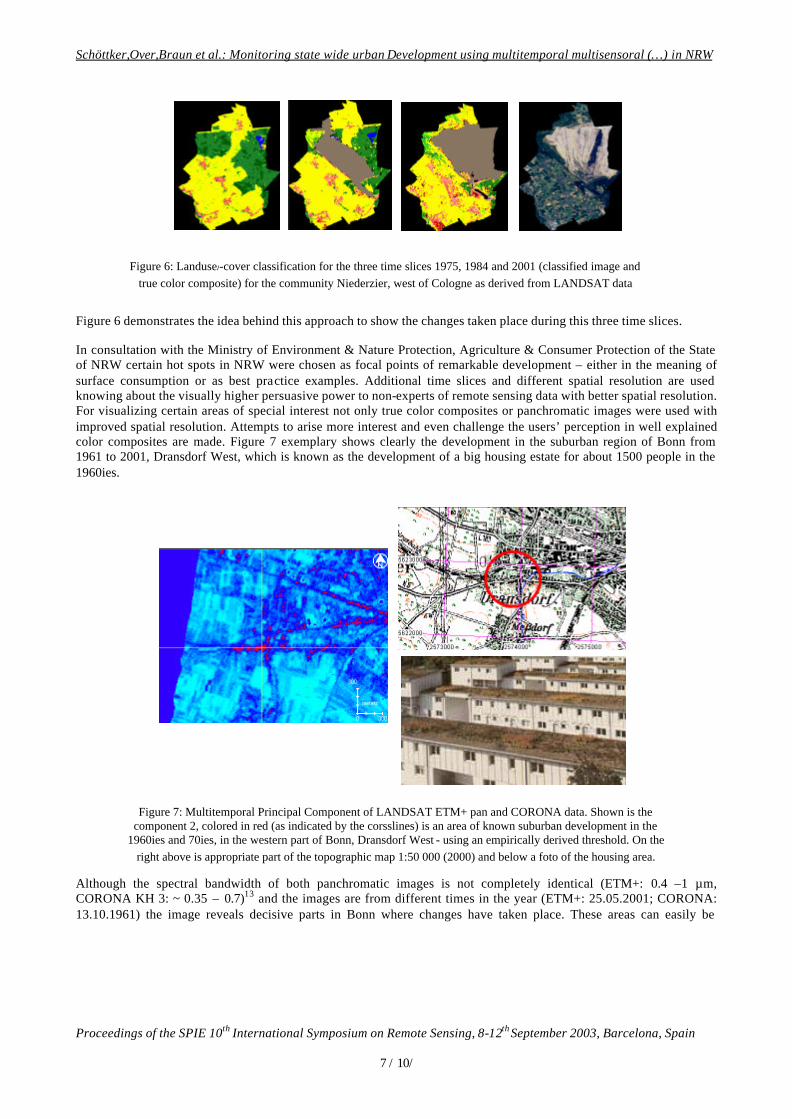
Figure 6 demonstrates the idea behind this approach to show the changes taken place during this three time slices.
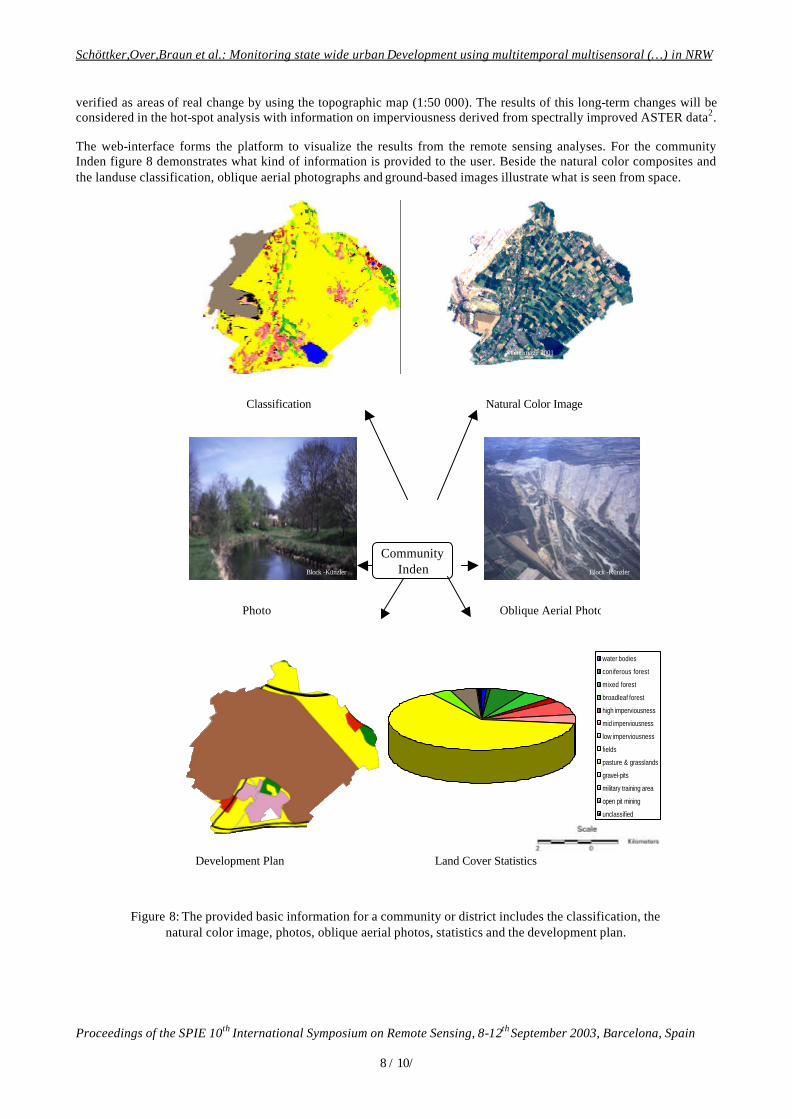
In consultation with the Ministry of Environment & Nature Protection, Agriculture & Consumer Protection of the State of NRW certain hot spots in NRW were chosen as focal points of remarkable development – either in the meaning of surface consumption or as best practice examples. Additional time slices and different spatial resolution are used knowing about the visually higher persuasive power to non-experts of remote sensing data with better spatial resolution. For visualizing certain areas of special interest not only true color composites or panchromatic images were used with improved spatial resolution. Attempts to arise more interest and even challenge the users’ perception in well explained color composites are made. Figure 7 exemplary shows clearly the development in the suburban region of Bonn from 1961 to 2001, Dransdorf West, which is known as the development of a big housing estate for about 1500 people in the 1960ies.
Although the spectral bandwidth of both panchromatic images is not completely identical (ETM+: 0.4 –1 µm, CORONA KH 3: ~ 0.35 – 0.7)13 and the images are from different times in the year (ETM+: 25.05.2001; CORONA: 13.10.1961) the image reveals decisive parts in Bonn where changes have taken place. These areas can easily be
ETM+, 2001 (3-2- 1)
1975 2001
1
Figure 6: Landuse/-cover classification for the three time slices 1975, 1984 and 2001 (classified image and true color composite) for the community Niederzier, west of Cologne as derived from LANDSAT data
Figure 7: Multitemporal Principal Component of LANDSAT ETM+ pan and CORONA data. Shown is the component 2, colored in red (as indicated by the corsslines) is an area of known suburban development in the
1960ies and 70ies, in the western part of Bonn, Dransdorf West - using an empirically derived threshold. On the right above is appropriate part of the topographic map 1:50 000 (2000) and below a foto of the housing area.
Schöttker,Over,Braun et al.: Monitoring state wide urban Development using multitemporal multisensoral (…) in NRW
Proceedings of the SPIE 10th International Symposium on Remote Sensing, 8-12th September 2003, Barcelona, Spain
8 / 10/
verified as areas of real change by using the topographic map (1:50 000). The results of this long-term changes will be considered in the hot-spot analysis with information on imperviousness derived from spectrally improved ASTER data2.
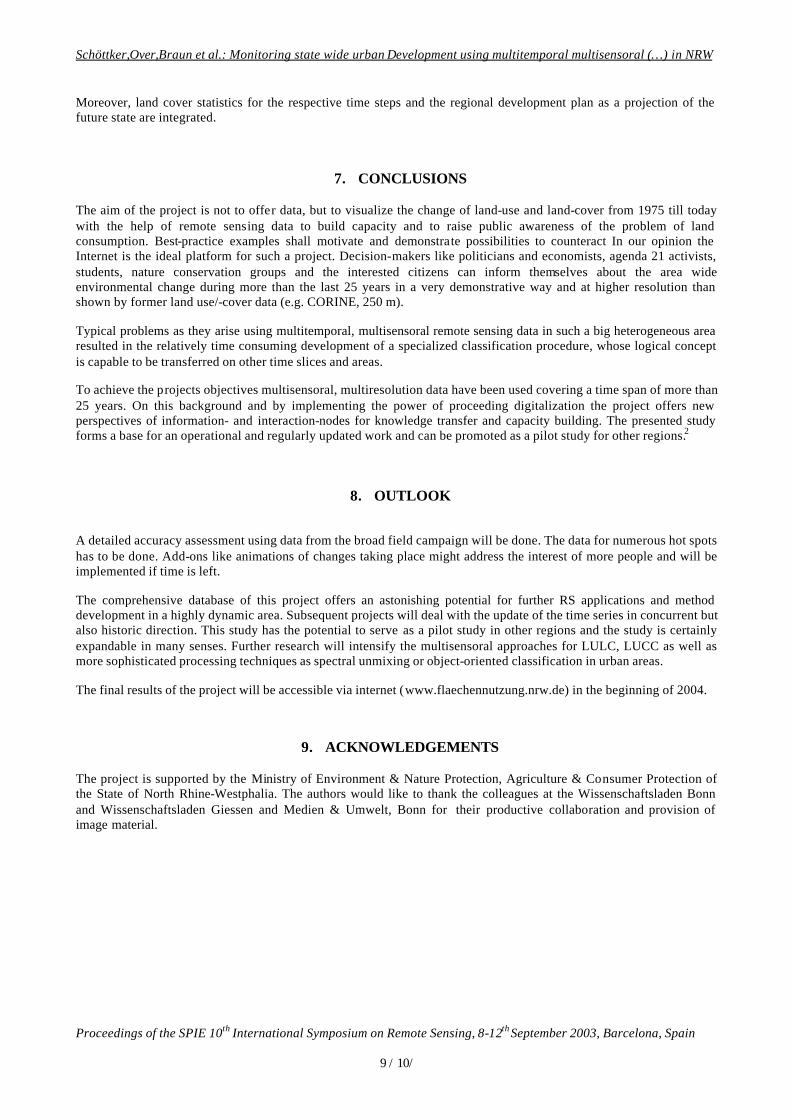
The web-interface forms the platform to visualize the results from the remote sensing analyses. For the community Inden figure 8 demonstrates what kind of information is provided to the user. Beside the natural color composites and the landuse classification, oblique aerial photographs and ground-based images illustrate what is seen from space.
Figure 8: The provided basic information for a community or district includes the classification, the natural color image, photos, oblique aerial photos, statistics and the development plan.
Community Inden
Classification Natural Color Image
water bodies
coniferous forest
mixed forest
broadleaf forest
high imperviousness
mid imperviousness
low imperviousness
fields
pasture & grasslands
gravel-pits
military training area
open pit mining
unclassified
Photo Oblique Aerial Photo
Development Plan Land Cover Statistics
Block -Künzler Block -Künzler
eurimage 2001
CommunityInden
Schöttker,Over,Braun et al.: Monitoring state wide urban Development using multitemporal multisensoral (…) in NRW
Proceedings of the SPIE 10th International Symposium on Remote Sensing, 8-12th September 2003, Barcelona, Spain
9 / 10/
Moreover, land cover statistics for the respective time steps and the regional development plan as a projection of the future state are integrated.
7. CONCLUSIONS The aim of the project is not to offer data, but to visualize the change of land-use and land-cover from 1975 till today with the help of remote sensing data to build capacity and to raise public awareness of the problem of land consumption. Best-practice examples shall motivate and demonstrate possibilities to counteract In our opinion the Internet is the ideal platform for such a project. Decision-makers like politicians and economists, agenda 21 activists, students, nature conservation groups and the interested citizens can inform themselves about the area wide environmental change during more than the last 25 years in a very demonstrative way and at higher resolution than shown by former land use/-cover data (e.g. CORINE, 250 m).
Typical problems as they arise using multitemporal, multisensoral remote sensing data in such a big heterogeneous area resulted in the relatively time consuming development of a specialized classification procedure, whose logical concept is capable to be transferred on other time slices and areas.
To achieve the projects objectives multisensoral, multiresolution data have been used covering a time span of more than 25 years. On this background and by implementing the power of proceeding digitalization the project offers new perspectives of information- and interaction-nodes for knowledge transfer and capacity building. The presented study forms a base for an operational and regularly updated work and can be promoted as a pilot study for other regions.2
8. OUTLOOK
A detailed accuracy assessment using data from the broad field campaign will be done. The data for numerous hot spots has to be done. Add-ons like animations of changes taking place might address the interest of more people and will be implemented if time is left.
The comprehensive database of this project offers an astonishing potential for further RS applications and method development in a highly dynamic area. Subsequent projects will deal with the update of the time series in concurrent but also historic direction. This study has the potential to serve as a pilot study in other regions and the study is certainly expandable in many senses. Further research will intensify the multisensoral approaches for LULC, LUCC as well as more sophisticated processing techniques as spectral unmixing or object-oriented classification in urban areas.
The final results of the project will be accessible via internet (www.flaechennutzung.nrw.de) in the beginning of 2004.
9. ACKNOWLEDGEMENTS The project is supported by the Ministry of Environment & Nature Protection, Agriculture & Consumer Protection of the State of North Rhine-Westphalia. The authors would like to thank the colleagues at the Wissenschaftsladen Bonn and Wissenschaftsladen Giessen and Medien & Umwelt, Bonn for their productive collaboration and provision of image material.
Schöttker,Over,Braun et al.: Monitoring state wide urban Development using multitemporal multisensoral (…) in NRW
Proceedings of the SPIE 10th International Symposium on Remote Sensing, 8-12th September 2003, Barcelona, Spain
10 / 10/
REFERENCES
1. C.A. Jr. Arnold & C.J. Gibbons: “Impervious Surface Coverage: the Emergence of a Key urban environmental Indicator”, Journal of the American Planning association, Vol. 62(2), pp. 243-258, 1996.
2. M. Braun & M. Herold: “Mapping Imperviousness using linear spectral unmixing of ASTER data in the Cologne-
Bonn region (Germany)“, Proceedings of the 10th International Symposium Remote Sensing in Barcelona, 8-12 September 2003, 2003 (submitted).
3. @grar: „NRW: Mehr Siedlungs- und Verkehrsflächen zu Lasten der Landwirtschaft. Anstieg auf 21 Prozent der
Landesfläche – WLV (Westfälisch-Lippischen Landwirtschaftsverbandes): Besonders sparsamer und verantwortungsbewusster Umgang mit den Natur- und Kulturflächen notwendig“. http://news.agrar.de/archiv/20030806-00002/ (date of access: 09.08.2003)
4. B. Schöttker, M. Over, M. Braun, A. Siegmund & G. Menz: “Remote Sensing as a Tool to visualize land use/-
cover change and to support environmental education – a case study in NRW (North Rhine Westphalia, Germany) in context of the local Agenda 21 process”. Proceedings of the EARSeL Symposium in Gent, 2-5 June 2003, 2003 (in press).
5. Jensen, J. R.: “Introductory Digital Image Processing: A Remote Sensing Perspective”. Upper Saddle River, 1996. 6. R.D. MacLeod & R.G. Congalton: “A Quantitative Comparison of Change-Detection Algorithms for Monitoring
Eelgrass from Remotely Sensed Data”. Photogrammetric Engineering and Remote Sensing, Vol. 64(3), pp. 207-216, 1998.
7. J.-F. Mas: “Monitoring land-cover changes: a comparison of change detection techniques”. International Journal of
Remote Sensing, Vol. 20(1), pp. 139-152, 1999. 8. A. Singh: “Digital change detection techniques using remotely -sensed data”. International Journal of Remote
Sensing, Vol. 10(6), pp. 989-1003, 1989. 9. D.L. Civco, J.D. Hurd, C.L. Arnold, S. Prisloe: “Characterization of suburban Sprawl and Forest Fragmentation
through Remote Sensing Applications”. Proceedings 2000 ASPRS annual Convention, Washington D.C., 13p., 2000.
10. Agenda 21 (20.5.2003): http://www.un.org/esa/sustdev/documents/agenda21/index.htm 11. M. Schmidt, R. Goossens, G. Menz, A. Altmaier & D. Devriendt: ”The use of CORONA satellite images for
generating a high resolution digital elevation model”. Proceedings of the IGARSS 2002 Conference, July 2002, Sydney, Australia, 2002.
12. D. Ward, S.R. Phinn & A.T. Murray: “Monitoring growth in rapidly urbanising areas using remotely sensed data”.
Professional Geographer, Vol. 52(3), pp. 371-386, 2000. 13. K.C. Ruffner: “Americas first Satellite Program”. Washington: CIA History Staff, 1995.