Monitoring phenological cycles of desert ecosystems using NDVI and LST data derived from NOAA-AVHRR...
17
int. j. remote sensing, 2002, vol. 23, no. 19, 4055–4071 Monitoring phenological cycles of desert ecosystems using NDVI and LST data derived from NOAA-AVHRR imagery G. DALL’OLMO* and A. KARNIELI† *Center for Advanced Land Management and Information Technologies, 133 Nebraska Hall, Lincoln, NE 68588, USA; e-mail: [email protected] †The Remote Sensing Laboratory, J. Blaustein Institute for Desert Research, Ben Gurion University of the Negev, Sede Boker Campus, 84990, Israel; e-mail: [email protected] (Received October 2000; in nal form July 2001 ) Abstract. The potential of the National Oceanic and Atmospheric Admin- istration (NOAA) Advanced Very High Resolution Radiometer (AVHRR) for monitoring phenological cycles in semi-arid lands has been demonstrated in this study. Attention was focused on two areas located only a few kilometres apart but across the political border between the Negev (Israel) and Sinai (Egypt). Although the areas are identical from the pedological, geomorphological, and climatic points of view, due to diVerent land management, the Negev is under a continuous rehabilitation process while Sinai is under a deserti cation process. Four years of digital data were used to compute the Normalized DiVerence Vegetation Index (NDVI) and Land Surface Temperatures (LST) over two sam- pling polygons. The NDVI was used to monitor the vegetation reaction to rainfall, while LST proved to be a good indicator of seasonal climatic uctuations. Using these biological and physical variables, the potential for following the vegetation dynamics throughout the year was demonstrated. Through cluster analysis, it was shown that the movements of the Sinai deserti ed side in the LST-NDVI space are only due to seasonal climatic uctuations. On the Israeli recovered side, on the other hand, three diVerent parts of the annual ecological cycle of the indigenous vegetation are evident: the dry season in which plants reduce their activity, the rainy season, and a growing season characterised by relatively intense biological activity. Within the LST-NDVI space it was also shown that Sinai is positioned similarly to the Sahara biome and the Negev similarly to the Sahel biome. Finally, LST-NDVI data were used to estimate phenological parameters that can be exploited for de ning protection policies or, on the long term, for climate change studies. 1. Introduction Desert ecosystems are characterised by high spatial and temporal variability mainly due to scarcity of water. The need for long-term and widespread collection Paper presented at an International Workshop on ‘Land Cover/Land Use Change and Water Management in Arid Regions: Remote Sensing Applications in the East’. The workshop took place at the Jacob Blaustein Institute for Desert Research, Sede Boker Campus, Ben Gurion University of the Negev between 23–27 October, 2000. Internationa l Journal of Remote Sensing ISSN 0143-1161 print/ISSN 1366-5901 online © 2002 Taylor & Francis Ltd http: //www.tandf.co.uk/journals DOI: 10.1080/01431160110115988
Transcript of Monitoring phenological cycles of desert ecosystems using NDVI and LST data derived from NOAA-AVHRR...
int j remote sensing 2002 vol 23 no 19 4055ndash4071
Monitoring phenological cycles of desert ecosystems using NDVI andLST data derived from NOAA-AVHRR imagery
G DALLrsquoOLMO and A KARNIELIdagger
Center for Advanced Land Management and Information Technologies133 Nebraska Hall Lincoln NE 68588 USA e-mail gdallcalmitunledudaggerThe Remote Sensing Laboratory J Blaustein Institute for Desert ResearchBen Gurion University of the Negev Sede Boker Campus 84990 Israele-mail karnielibgumailbguacil
(Received October 2000 in nal form July 2001)
Abstract The potential of the National Oceanic and Atmospheric Admin-istration (NOAA) Advanced Very High Resolution Radiometer (AVHRR) formonitoring phenological cycles in semi-arid lands has been demonstrated in thisstudy Attention was focused on two areas located only a few kilometres apartbut across the political border between the Negev (Israel ) and Sinai (Egypt)Although the areas are identical from the pedological geomorphological andclimatic points of view due to diVerent land management the Negev is under acontinuous rehabilitation process while Sinai is under a deserti cation processFour years of digital data were used to compute the Normalized DiVerenceVegetation Index (NDVI) and Land Surface Temperatures (LST) over two sam-pling polygons The NDVI was used to monitor the vegetation reaction to rainfallwhile LST proved to be a good indicator of seasonal climatic uctuations Usingthese biological and physical variables the potential for following the vegetationdynamics throughout the year was demonstrated Through cluster analysis it wasshown that the movements of the Sinai deserti ed side in the LST-NDVI spaceare only due to seasonal climatic uctuations On the Israeli recovered side onthe other hand three diVerent parts of the annual ecological cycle of the indigenousvegetation are evident the dry season in which plants reduce their activity therainy season and a growing season characterised by relatively intense biologicalactivity Within the LST-NDVI space it was also shown that Sinai is positionedsimilarly to the Sahara biome and the Negev similarly to the Sahel biomeFinally LST-NDVI data were used to estimate phenological parameters that canbe exploited for de ning protection policies or on the long term for climatechange studies
1 IntroductionDesert ecosystems are characterised by high spatial and temporal variability
mainly due to scarcity of water The need for long-term and widespread collection
Paper presented at an International Workshop on lsquoLand CoverLand Use Change andWater Management in Arid Regions Remote Sensing Applications in the Eastrsquo The workshoptook place at the Jacob Blaustein Institute for Desert Research Sede Boker Campus BenGurion University of the Negev between 23ndash27 October 2000
Internationa l Journal of Remote SensingISSN 0143-1161 printISSN 1366-590 1 online copy 2002 Taylor amp Francis Ltd
httpwwwtandfcoukjournalsDOI 10108001431160110115988
G DallrsquoOlmo and A Karnieli4056
of data to monitor the state of desert vegetation can be implemented by remotesensing techniques Several advantages arise using satellite data Firstly satelliteimagery provides biological and physical information on diVerent ground featuressecondly remote sensing allows long-term studies at relatively low costs and nallythe above ground vision reaches vast and remote areas that may be inaccessiblebecause of morphological or political reasons
The usefulness of integrating biological and physical variables derived fromsatellite data such as the Normalized DiVerence Vegetation Index (NDVI) and landsurface temperatures (LST) for studying ecological systems was discussed in severalstudies Lambin and Ehrlich (1995 1996 1997) used data of the Advanced VeryHigh Resolution Radiometer (AVHRR) onboard the National Oceanic andAtmospheric Administration (NOAA) satellite for biome diVerentiation and landcover change analysis on a continental scale These authors combined the LST andNDVI data into a unique variable de ned as the arctangent of the LSTNDVIratio in order to obtain a quantitative and continuous variable that is easier toanalyse especially in multitemporal studies They found that this ratio is not verysensitive to the impact of low amplitude interannual variation However they demon-strated that its use increases the accuracy of the classi cation procedure Moreoverthey represented the annual trajectories of diVerent biomes in the LST-NDVI spaceranging from hyper arid to evergreen forest zones They concluded that soil evapora-tion is the main eVect determining the LST-NDVI slope in areas with a low NDVIand that AVHRR coarse resolution data limit the types of land cover changesdetectable Finally they emphasised the need to use long time series of data forassessing land cover changes to take into account the natural uctuations of eco-system parameters The technique has also been applied by other authors at aregional and sub-continental scale for biome discrimination (Roy et al 1997 Guptaet al 1997 Sobrino and Raissouni 2000) for mapping vegetation types monitoringdynamics of diVerent plant communities (Achard and Blasco 1990 Gupta et al 1997 )and for drought monitoring (Vogt et al 1998 )
Among other ecosystem applications numerous researchers have been investi-gating the possibility of assessing natural vegetation phenology using satellite imagery(eg Townshend and Justice 1986) By de nition phenology studies the timing ofrecurring natural phenomena such as leaf shedding owering of plants etc (Achardand Blasco 1990) In terms of remote sensing phenological characteristics of landcover and vegetation species can be diVerentiated from each other by studying theirspectral and temporal signatures This is usually done by drawing the NDVI valuesderived by ground air or space spectral measurements as a function of time alongthe growing season Several methods have been reported for determining phenolo-gical cycles of natural vegetation on global or regional scales These methods include(1) NDVI threshold (Lloyd 1990) (2) divergence of smoothed curve from autoreg-ressive moving average (Reed et al 1994) (3) largest NDVI increase (4) thresholdof normalized NDVI ratio (White et al 1997) (5) lowest NDVI value calculatedfrom the derivative and empirical coeYcient (Moulin et al 1997) and (6) an algo-rithm of maximal curvature detection for measuring four transition dates of phenolo-gical phases (Zhang et al 2001) Although it is well accepted that the greenup onsetas well as the length of the growing season are a function of temperature (egRunning et al 1995 White et al 1997) none of these methods is using LST as anactive variable for determining the phenology phase
The main objective of this work is to investigate on a local scale of a few tens
Middle East Drylands 4057
of kilometres the seasonal dynamics of two diVerent arid land ecosystems usingremote sensing techniques These can be used as test areas to assess the reliabilityof new environmental monitoring techniques More precisely the main hypothesisof this study was that the union of the two types of information namely biologicaland physical could be successfully used for monitoring phenological cycles andestimating phenological parameters of desert vegetation
2 Study areaThe study area is located in the western Negev desert (approximately 310deg N
347deg E) on both sides of the political border between Egypt and Israel It is about45 km south-east of the Mediterranean Sea and 140 m above the mean sea level Thesite is considered to be a transition zone between the Negev-Sinai arid environmentand the sub-humid Mediterranean climate of central-northern Israel The meanannual temperature is about 20degC (mean minimum 125degC mean maximum 265degC)(Berkowicz et al 1995) The long-term mean annual rainfall amount is 90 mm butannual deviations typical of arid areas can be as high as 70 Two out of the fourhydrological years of the study had rainfall amount close to the annual mean Theseare 1996ndash97 and 1997ndash98 with 793 mm and 851 mm respectively The other twoyears 1995ndash96 and 1998ndash99 were dry years with 323 mm and 312 mm respectively
The area on both sides of the political border is considered as one pedologicalgeomorphological and climatic unit characterised by linear sand dunes trendingfrom west to east over the entire site (Tsoar and Moslashller 1986) Nevertheless astriking diVerence between the two sides has been attracting the attention of thescienti c community since the seventies After the establishment of the State of Israelin 1948 diVerent land-use management has been applied by the two countries whichhave led to a rehabilitation process in the Negev (Israel ) and to a deserti cationprocess in Sinai (Egypt) (Marx 1967 Noy-Meir and Seligman 1979) Since then adiVerentiation in albedo has been evident in remotely sensed images (Otterman 1977Danin 1983 and 1991 Tsoar and Moslashller 1986 Karnieli and Tsoar 1995 Tsoar et al1995 Tsoar and Karnieli 1996 Karnieli 1997) the Negev desert showing darkertones than the adjacent Sinai
From an ecological point of view the vegetation growing over the sand dune eld can be divided into three main groups each one de ned by its adaptation tothe dry conditions (Evenari et al 1982 Noy-Meir 1973 Danin 1983 1991 1996)(a) Biological soil crusts composed of cyanobacteria algae lichens and mosses thatare able to return to full photosynthetic activity within a few minutes as soon aswater and light are available and even after a long dormant phase during the summerdry spell (b) Annuals the lsquodrought evadersrsquo group that includes plants not activeduring the dry season (therophytes geophytes and hemicriptophytes) and thatdetermines the desert blooming sprouting a few weeks after the rst eVective rainand completing their cycle in the following months and (c) Perennials the lsquodroughtpersistentrsquo plants that are able to reduce their transpiring surface and that presentdeep roots that allow them to survive even during the dry season showing a responseto meteoric water that can be delayed of some months and that is longer and lessintense than the drought evadersrsquo group
Table 1 presents the percentage ground cover of the above three groups ofvegetation along with bare surfaces (sand dunes and playas) Early studies (Karnieliand Tsoar 1995 Tsoar and Karnieli 1996) conclude that the well-known contrastbetween Sinai (Egypt) and the Negev (Israel ) is not a direct result of higher vegetation
G DallrsquoOlmo and A Karnieli4058
Table 1 Percentage ground cover of diVerent ground features in the Negev (Israel ) and Sinai(Egypt) (after Qin 2001)
Negev () Sinai ()
Bare sands 75 80Biological soil crusts 71 12Perennials 18 45Bare playas 35 35
cover but is caused by an almost complete cover of biological soil crusts in theNegev and a lack of this crust in Sinai largely due to manrsquos activities Further Qinet al (2001) show that there is also a thermal contrast between the two sides of theborder when the Negevrsquos dune eld is higher in several degrees than Sinai In histhesis (Qin 2001) he raised two reasons (1) Since the sand dunes on the Israeli sideare almost covered by biological soil crusts they absorb more incident radiationand emit stronger thermal radiance than the bare sand on the Egyptian side and(2) Although more vegetation is present on the Israeli side due to its scarcityand dormancy during the dry and hot summer its contribution to the regionalevapo-transpiration that cools down the surface can be considered negligible
3 Image processing and data analysisIn this study the high temporal resolution of NOAA-14 AVHRR was used to
study the phenological cycles of the two ecosystems described above A database ofimages starting from 1995 is available at the Remote Sensing Laboratory at SedeBoker Campus Ben Gurion University of the Negev Only images with a viewingzenith angle lower than 30deg were selected for the analysis in order to minimise theeVects of surface anisotropy on the derived re ectances and to avoid loss of spectralresolution and overlapping between adjacent pixels An inspection of the thermalchannels was used to discard cloudy images
31 V isible and near-infrared channelsThe improved radiometric correction proposed by Rao and Chen (1998) was
applied to the red channel (1) and the near-infrared one (2) Data on aerosoloptical thickness at 550 nm and total precipitable water collected by a CIMELsunphotometer at Sede Boker Campus (about 50 km from the study area) wereinserted as input in the Second Simulation of the Satellite Signal in the SolarSpectrum (6S) code (Vermote et al 1997) for atmospheric correction A correctionfor molecular scattering ozone and geometry of the sensor and the sun was alsoapplied All images were eventually registered on a referenced map of the areathrough second order transformation and nearest neighbour resampling methodThe precision of the results lay at the subpixel level Finally after computing theNormalized DiVerence Vegetation Index one subset of 150 pixels on each side ofthe border (about 15 kmtimes10 km was extracted over assumed homogeneous areasfrom each image ( gure 1) An example of a derived NDVI image is presentedin gure 2
32 T hermal channelsRadiometric correction of the two NOAA AVHRR thermal channels (4 and 5)
was performed following Brown et al (1995) and Weinreb et al (1990) Geometric
Middle East Drylands 4059
330
320
310
300
290
280
330
320
310
300
290
280
330 340 350
330 340 350
Figure 1 Subset of a colour composite (R G B=1 2 3) of a NOAA AVHRR-14 imageacquired on 7 September 1998 at 1106 GMT The two boxes on each side of theborderline represent the areas sampled for retrieving data for each part of theecosystem
correction and subset extraction were applied as for the red and near-infraredchannels These operations were necessary at this early step of the processing becauseof the local characteristics of the split window algorithm (Qin et al 2001) used tocorrect the atmospheric in uence aVecting the thermal infrared channels Thealgorithm used has the general form LST=a0+a1 T4 shy a2 T5 and required totalprecipitable water and surface emissivity to compute the coeYcients a0 a1 and a3needed to calculate the LST The rst parameter was obtained from CIMEL datarelative to the image date of acquisition the second was estimated by laboratoryanalysis of soil samples taken in the study area (Qin 2001) Based on this work theemissivity value of bare sand dunes (average value of 095) was assigned to the Sinairsquospolygon while the emissivitiy value of the biological soil crusts (average value of097) for the Negevrsquos one An example of such a product in terms of LST image isshown in gure 2
G DallrsquoOlmo and A Karnieli4060
Figure 2 NDVI and LST images obtained after processing the image acquired on25 May 1998 In both images the borderline between Israel and Egypt has beenmarked to enhance the diVerence in NDVI and LST found on each side of the borderin the study area Note that LST was computed assuming a constant emissivity overthe whole image and equal to unity
33 Data analysisAll pixels present in both subsets of each image were statistically analysed as
follows First a t-test (with separate variance estimate Blalock 1972) was performedon the whole NDVI data set to verify if it was possible to distinguish between thetwo diVerentiated parts of the ecosystem using their NDVI values (table 2) Theneach year was divided into two periods the lsquowet periodrsquo as the part of the year ofabout four and a half months after the rst eVective rain (10ndash20 mm of cumulativerains within 15 days) (Noy-Meir 1973 Evenari et al 1982 Danin 1983 1991 1996)and the lsquodry periodrsquo as the rest of the year In the rst period the vegetation isexpected to be active while in the second dormant This method for assessing onsetand length of natural vegetation greenness is denoted hereby as the lsquoeVective rainfallthreshold methodrsquo and abbreviated as ERTM Again t-tests were used to verify thatthe NDVI values between the two sides were signi cantly diVerent (table 2)
Secondly the NDVI diVerences between the two sides of the border (NDVIdiff
=NDVI
Negevshy NDVI
Sinai) were calculated in order to emphasise how much the vegeta-
tion on the Israeli side is reacting more than that in Sinai Since the series were
Middle East Drylands 4061
Table 2 Results of the t-tests performed on the NDVI data set for the whole data set thedry and the wet periods (t=Studentrsquos t df=degrees of freedom p=statisticalsigni cance)
Mean Number of(SD) observations
Negev Sinai Negev Sinai t df p
All data 012 009 13 800 13 800 9815 17 85045 000(004) (002)
Dry 012 009 9900 9900 8275 13 31681 000(003) (0014 )
Wet 0014 009 3900 3900 6161 478616 000(005) (002)
correlated (rNDVI
=084) the variance of the diVerence was computed as
s2diff
=s2Negev
+s2Sinai
shy r sNegev
sSinai
(1)
where the s2i
are the variances of the diVerence of the Negev and of the Sinaidata sets r is the correlation coeYcient and s
ion the standard deviations For
the sake of consistency the LST diVerences along with their standard deviations(r
LST=099) were also calculated
A K-means cluster analysis was then performed for a better understanding of thephenological cycles on both sides of the border In order to make data comparableboth variables were standardised (Rizzi 1985) as follows
xstd
=x
rawshy m
s(2)
where xstd
is the value of the standardised variable xraw
is the raw value of thevariable m is the mean of the raw data (computed joining the data relative to bothNegev and Sinai areas) s is the standard deviation of the raw data
4 Results and discussion41 NDVI
Time series of the mean NDVI values along with their standard deviations forthe sampling polygons on both sides of the border is presented and related to rainfallamounts in gure 3 From the statistical analysis (table 2 gures 3 and 4) it can bededuced that the Negev ecosystem under an advanced rehabilitation process since1982 shows higher values of vegetation index (mean NDVI for the whole data set=012plusmn004) and high reactivity to rainfall (from 012plusmn003 during the dry period to04plusmn005 in the wet period) especially during wet years (1996ndash97 and 1997ndash98) Onthe contrary the Sinai area presents a very low reaction to meteoric water (from009plusmn002 during the dry period to 01plusmn002 in the wet period) maintaining approxi-mately constant NDVI values (mean NDVI for the whole data set=009plusmn002) Aslight increase in the vegetation index is visible only during the wet years ThediVerences between the mean NDVI values of Negev and Sinai for the entire timeseries and their standard deviations are presented in gure 4 The two sides of theecosystem are clearly distinguishable by means of their NDVI values being the t-testssigni cant for the data along the whole year as well as for those in the dry and wet
G DallrsquoOlmo and A Karnieli4062
Figure 3 NDVI values computed for the Negev and Sinai subsets with daily rainfall amounts
Figure 4 NDVI diVerence computed between Negev and Sinai mean values respectivelywith daily rainfall amounts The horizontal dashed line marks the null NDVI diVerence
periods (table 2) These diVerences can be as high as 01 NDVI value following therainy season of a wet year such as 1996ndash97 and 1997ndash98 In the dry period theNDVI diVerence detected seems to be related to the colour diVerence between thetwo sides of the border due to the presence of the dark biological soil crust and ofhigher vegetation on the Israeli side (Karnieli and Tsoar 1995)
Middle East Drylands 4063
An interpretation of gure 3 can be given considering the diVerent phenologicalcycles of the three above-mentioned groups of plants Early rains aVect the biologicalsoil crusts that start their photosynthetic activity immediately after the rst rain ina time scale of minutes The drought evadersrsquo cycles are evident in gure 4 Theiractivity is evidenced by the peaks of NDVI diVerence that in wet years are qualitat-ively correlated to the total rainfall amount fallen in the same year In dry yearsthe distribution of rain gains importance the soil water storage layer exploitedby annuals requires lsquoat least 10ndash20 mm of rain at intervals of a few weeksrsquo (Noy-Meir 1973) In 1995ndash96 this condition was not satis ed thus no annualsrsquo peak wasdetected while in 1998ndash99 the limited amount of rainfall was more concentratedand allowed annuals to sprout (the peak is visible although lower than in wet years) Perennials are evident in wet years as the part of the NDVI diVerence immediatelyafter the annualsrsquo peak More details about the diVerent phenological cycles of thethree groups of plants are available in Evenari et al (1982) Danin (1983 1991 and1996) Schmidt and Karnieli (2000 this issue) and in Karnieli et al (this issue)
42 L STFigure 5 demonstrates the computed mean land surface temperatures and their
standard deviations in the sampling polygons on both sides of the border No cleardiVerences in phase are evident On the contrary the cyclical temperature trends aresimilar in the Negev and in Sinai and follow the climatic variations throughout theyears During the relatively wet winters evaporation determines large losses of energyfrom the wet soil surface low sun irradiance also contributes less signi cantly thanin summer to the soil heat balance Thus the minimum LST values are always foundin the rainy period during the winter and can be as low as 20degC In these seasonsthe diVerence in the amplitude between the polygons are almost negligible ( gure 6)
Figure 5 Land Surface Temperature data for the Negev and Sinai subsets with daily rainfallamounts
G DallrsquoOlmo and A Karnieli4064
Figure 6 LST diVerence computed between the Negev and Sinai subsets respectively withdaily rainfall amounts The horizontal dashed line marks the null LST diVerence
The maximum temperatures are found in the very middle of the summer and canreach values of 58degC The temperature diVerences can be as high as 7degC ( gure 6)
The explanation of the amplitude diVerences evident in the dry period areaddressed in Qin et al (2001) Since the sand dunes on the Israeli side are almostcompletely covered by dark biological soil crusts they absorb more incident radiationand emit stronger thermal radiation than the bare sand on the Egyptian sideMoreover although more vegetation is present on the Israeli side these desert plantsdue to their scarcity and dormancy in the hot dry summer have a negligiblecontribution to the regional evapotranspiration that cools the surface Thus in thedry season the Israeli side presents higher values of surface temperatures than theSinai one
43 Joining the two variablesFrom the previous discussion it can be concluded that (a) the NDVI values
represent the reaction of the vegetation to rainfall and (b) land surface temperaturesrepresent the seasonal climatic uctuations These two pieces of information can becombined to increase the knowledge of the phenological cycles of vegetation in aridecosystems The two variables NDVI and LST have thus been represented in ascatterplot as suggested by several authors (eg Goward and Hope 1989 Nemaniet al 1993) Figure 7 represents the data obtained in this study within the schematicdiagram proposed by Lambin and Ehrlich (1996 1997)
Cluster analysis showed that the Sinai deserti ed ecosystem exhibits the highestvariability along the LST axis and overlaps the area covered by the Sahara biomein Lambin and Ehrlich (1996) On the other hand the Negev recovered side of theborder exhibits variability on both LST and NDVI axes resembling more the Sahelbiome (although it ts better that in the Southern African Hemisphere) of the samepaper With this representation the seasonal dynamics of the two ecosystems can be
Middle East Drylands 4065
Figure 7 Data obtained for this study in the scatter diagram proposed by Lambin andEhrlich (1996)
Figure 8 Groups obtained from the cluster analysis of NDVI and LST data The numbersin the square boxes refer to the cluster numbers mentioned in the text and in table 2The dashed lines represent one standard deviation from each centroid
described Movements inside the LST-NDVI space along the LST axis are due tophysical meteorological factors The NDVI axis on the contrary is an indicator ofbiological activity
Results of the K-mean analysis reveal that ve clusters characterise the study
G DallrsquoOlmo and A Karnieli4066
area ( gure 8) Each cluster is described in table 3 The Sinai area under a desert-i cation process is characterised by just two clusters (1 and 2) corresponding to thedry and wet seasons respectively and de ned by the uctuations of land surfacetemperatures throughout the year In this area the biological activity is almostnon-existent therefore only the physical meteorological factors are responsible forthe movement inside the LST-NDVI space On the other hand the natural recoveredecosystem of the Negev shows a relatively intense biological activity It is charac-terised by movements over three clusters of the LST-NDVI space In the Negevecosystem like in the Sinai one both dry and rainy seasons are evident (clusters 3and 4) while the third cluster (number 5) represents the growing season which isevident only on the Israeli side of the border and that includes the highest values ofNDVI Only a few points are presented inside cluster number 5 because it correspondsto the very short period of the year in which the desert reaches its maximumgreenness due to the blooming of the annuals
It is interesting to note that several points that belong to the Negev side arelocated inside cluster 1 which represents the Sinai side The explanation for this factcan be found in Holling (1973) Natural arid land systems show a resilient characterrather than a resistant one their stability is not de ned by a unique equilibriumstate but according to uctuations of environmental parameters Beyond certainlimits they can be associated to multiple-equilibrium states of a domain inside whichthe ecosystem does not change its structure This is the result of adaptation to theharsh extremely variable desert environment The overlapping points of cluster 1are relative to the very dry years (1996ndash96 and 1998ndash99) In periods extremelylacking in water the recovered ecosystem is able to reduce its activity to the minimumneeded for surviving in the area of the LST-NDVI space typical of deserti edecosystems However as soon as the precious resource is available again it canimmediately react and produce relatively high values of NDVI On the other handthe disturbed ecosystem (Sinai) shows the result of a man made perturbation thathas changed its structure in wet years only an extremely limited response to rainfallis detected ( gures 3 and 8)
44 Estimation of phenological parametersAn attempt to use LST and NDVI data for quantifying phenological parameters
was done Only the Negev side was considered since it shows a signi cant reactionto rainfall Two parameters the starting and ending dates of the growing seasonwere estimated as follows The minimum LST value within a year was taken as anindex of the onset of the growing season In fact LST values reach their minimaafter winter rainfall when evaporation controls the heat balance of the soil On theother hand the end of it was de ned as the date when the NDVI after having
Table 3 Description of the clusters obtained from the NDVI and LST data analysis
of Negev of Sinai Mean NDVI Mean LSTCluster Season pixels pixels (Std dev) (Std dev)
1 Dry 14 48 008 (001 ) 48 (4)2 Rainy 4 33 001 (001 ) 33 (6)3 Dry 51 7 012 (001 ) 49 (5)4 Rainy 16 5 012 (001 ) 29 (5)5 Growing 9 0 018 (002 ) 39 (8)
Middle East Drylands 4067
reached its maximum decreases to a value equal or close to the one registered onthe date of the onset of the growing period These remotely sensed phenologicalparameters were then compared with those calculated according to the lsquoeVectiverainfall threshold methodrsquo Dates of the onset and end of growing seasons arepresented in table 4 In hydrological years when the growing season is evident(1996ndash97 1997ndash98 and 1998ndash99) the LST-NDVI estimates of its onset seem to bein agreement with those obtained from rainfall measurements ( gure 9) Not onlythey almost match the reference dates (a delay of about ten days is evident and couldbe due to the presence of cloudy images during the rainy season) but they also allowthe length of the growing season to be de ned This period is not constant anddepends on the total cumulative rainfall amount and on its temporal distributionNevertheless in 1995ndash96 which was dry with temporally non-homogeneous rainfall
Table 4 Dates of the onset and end of the growing season calculated for each hydrologicalyear according to the lsquoeVective rainfall threshold methodrsquo (ERTM) (after Noy-Meir1973 Evenari et al 1982 Danin 1983 1991 1996 ) and the proposed LST-NDVImethod
Hydro- On set End ( length in days)logicalyear ERTM LST minimum ERTM NDVI (LSTmin)
1995ndash96 No eVective rain 21 December 1995 No eVective rain 13 February 1996 (54 )1996ndash97 16 January 1997 6 February 1997 1 June 1997 (136) 27 May 1997 (110)1997ndash98 17 January 1998 9 January 1998 27 May 1998 (136) 10 April 1998 (91 )1998ndash99 19 February 1999 29 February 1999 5 July 1999 (136) 4 April 1999 (34)
Figure 9 Starting and ending dates of growing seasons de ned according to the proposedLST-NDVI method (vertical bars) plotted on the Negev mean NDVI data set Thehorizontal lines are the estimates obtained from the lsquoeVective rainfall threshold methodrsquo(ERTM) and serve as validation Cumulative rainfall amounts are also represented
G DallrsquoOlmo and A Karnieli4068
and no eVective rain the proposed method fails since it de nes a short period thatis not related to vegetation growth
Remotely sensed phenological parameters of desert ecosystems may have a widerange of applications Being able to compute the starting and ending dates of thegrowing season and thus its length for every point of a large geographical areaduring some years may allow the de nition of a reference (average) value for thelength of the growing season of every location Negative variations from thesereference values may indicate that particular areas of an ecosystem have undergonestress periods (for example due to low annual rainfall amounts) These areas maybe more vulnerable to further stresses and therefore may need some kind of protec-tion Moreover long-term monitoring for trends of the starting date of spring indeserts may be used as an index of climate change
5 Summary and conclusionsThe overall objective of this study was to analyse the seasonal dynamics of two
ecosystems that are characterised by the same substrate and climate but that aredissimilar by land use and therefore also natural land cover They were used as testareas for assessing new environmental monitoring techniques The analysis in theframework of this research used two NOAA-AVHRR derived biophysical variablesnamely NDVI and LST and was implemented in three steps (1) time series analysisof each variable separately (2) cluster analysis of the two variables in the LST-NDVI space and (3) estimation of phenological parameters
The NDVI values were successfully used to study the ecosystems from thebiological point of view While the deserti ed area (Sinai) presents a relatively stableand low signal the rehabilitated ecosystem of the Negev shows peaks of NDVI afterthe rainy periods The magnitudes of these peaks are qualitatively correlated withthe total amount of rain fallen in the same year This eVect is mainly due to theannual plants present on the Negev side and not on the Sinai one which sproutafter eVective showers and determine the blooming of the desert Land surfacetemperatures were found to be a valuable parameter for de ning the seasonalityalong the year since they are characterised by a regular seasonal pattern themaximum values in the dry season and the minimum values in the rainy period
The usefulness of combining NDVI and LST was demonstrated Because the twovariables follow distinct phenomena their union was found to increase the knowledgeon the environmental dynamics Plotting the two variables one against the otherin the same scatter diagram shows that although the distance between the studiedpolygons are only a few kilometres two distinguished biomes can be recognisedOne is similar to that of the Sahara and represents an area under deserti cationprocess while the other is similar to that of the Sahel and represents an area underrehabilitation process Cluster analysis was applied to follow phenological cyclesThe deserti ed ecosystem exhibits variability in the LST-NDVI space only alongthe LST axis and therefore it is mainly sensitive to the seasonal changes of climaticconditions On the other hand in the natural recovered ecosystem three steps of theannual ecological dynamics can be distinguished the dry rainy and growing seasonsThe predominant feature of this part of the data is its relatively high variabilityespecially from the biological point of view
Finally the estimation of phenological parameters was successfully attemptedUnlike others the proposed method makes use of both biological (NDVI) andphysical (LST) variables to estimate the onset and end of the growing seasons for
Middle East Drylands 4069
each year of the data set These parameters were found to be in agreement withthose obtained from rainfall measurements With the described limitations remotelysensed estimates of phenological dates may be used to identify areas subjected tostress that may need protection or in long term monitoring for climate change studies
One of the limitations of the proposed method is that it does not consider rainfallirregularities such diVerent temporal distribution of precipitation along the growingseason Another limitation resides in the likely presence of cloudy images during therainy period This fact determines some problems in de ning exactly the beginningof the growing season (for example 1998ndash1999 year in gure 9 where a technicalproblem prevented the acquisition of images for a period of about two months) ThediVerence in days between the image where the LST minimum was found and theprevious one could be an indicator of the reliability of the date of the spring onsetAnother diYculty may be the determination of emissivity values over wide geographicareas Such a problem can be solved using remote sensing techniques (eg Li andBecker 1993) Longer time series of digital data and further investigations are neededto verify the proposed method and to understand its usefulness in very dry years
AcknowledgmentsThe authors wish to thank The Arid Ecosystem Research Center (AERC) Hebrew
University of Jerusalem for providing the time series of rainfall at Nizzana MrsSvetlana Gilerman is also acknowledged for her help in image processing The projectwas funded by the International Arid Land Consortium
References
Achard F and Blasco F 1990 Analysis of vegetation seasonal evolution and mappingof forest cover in West Africa with the use of NOAA AVHRR HRPT dataPhotogrammetric Engineering and Remote Sensing 56 1359ndash1365
Berkowicz S Blume H-P and Yair A 1995 The arid ecosystem research center ofthe Hebrew University of Jerusalem In Arid Ecosystems edited by H-P Blume andS M Berkovicz (Cremlingen-Destedt Germany Catena Verlag) pp 1ndash12
Blalock H M 1972 Social statistics 2nd edition (New York McGraw-Hill )Brown O B Brown J W and Evans R H 1985 Calibration of Advanced Very High
Resolution Radiometer infrared observations Journal of Geophysical Research 9011 667ndash11 677
Danin A 1983 Desert vegetation of Israel and Sinai (Jerusalem Cana Publishing house)Danin A 1991 Plant adaptation in desert dunes Journal of Arid Environments 21 193ndash212Danin A 1996 Plants of desert dunes (Berlin Springer)Evenari M Shanan L and Tadmor N 1982 T he Negev T he challenge for a desert
(London Oxford University Press)Goward S N and Hope A S 1989 Evaporation from combined re ected solar and
emitted terrestrial radiation Preliminary FIFE results from AVHRR data Advancesin Space Research 9 239ndash249
Gupta R K Prsad S Sesha Sai M V R and Viswanadham T S 1997 The estimationof surface temperature over an agricultural area in the state of Haryana and PanjabIndia and its relationship with the Normalized DiVerence Vegetation Index (NDVI)using NOAA-AVHRR data International Journal of Remote Sensing 18 3729ndash3741
Kaduk J and Heimann M 1996 A prognostic phenology scheme for global terrestrialcarbon cycle models Climate Research 6 1ndash19
Karnieli A 1997 Development and implementation of a spectral crust index over sanddunes International Journal of Remote Sensing 18 1207ndash1220
Karnieli A and Tsoar H 1995 Spectral re ectance of biogenic crust development ondesert sand dunes along the Israeli-Egyptian border International Journal of RemoteSensing 16 369ndash374
G DallrsquoOlmo and A Karnieli4070
Karnieli A Gabai A Ichoku C Zaady E and Shachak M 2002 Temporal dynamicsof soil and vegetation spectral responses in a semiarid environment InternationalJournal of Remote Sensing (this issue)
Lambin E F and Ehrlich D 1995 Combining vegetation indices and surface temperaturefor land-cover mapping at broad spatial scales International Journal of Remote Sensing16 573ndash579
Lambin E F and Ehrlich D 1996 The surface temperature-vegetation index space forland cover and land-cover change analysis International Journal of Remote Sensing17 463ndash487
Lambin E F and Ehrlich D 1997 Land-cover changes in Sub-Saharan Africa(1982ndash1991) application of a change index based on remotely sensed surface temper-ature and vegetation indices at a continental scale Remote Sensing of Environment61 181ndash200
Li Z and Becker F 1993 Feasibility of land surfaces and emissivity determination fromAVHRR data Remote Sensing of Environment 43 67ndash85
Lloyd D 1990 A phenological classi cation of terrestrial vegetation cover using shortwavevegetation index imagery International Journal of Remote Sensing 11 2269ndash2279
Marx E 1967 Bedouin of the Negev (Manchester Manchester University Press)Nemani R Peirce R Running L S W and Goward S 1993 Developing satellite
derived estimates of surface moisture status Journal of Applied Meteorology 32548ndash557
Moulin S Kergoat L Viovy N and Dedieu G G 1997 Global-scale assessment ofvegetation phenology using NOAAAVHRR satellite measurements Journal ofClimate 10 1154ndash1170
Noy-Meir I 1973 Desert ecosystems environment and producers Annual Review of Ecologyand Systematics 4 25ndash51
Noy-Meir I and Seligman N G 1979 Management of semi-arid ecosystems in Israel InManagement of Semi-arid Ecosystems edited by B H Walker (Amsterdam ElsevierScienti c Publishing Company) pp 113ndash160
Otterman J 1977 Anthropogenic impact on the surface of the Earth Climatic Change1 137ndash155
Qin Z 2001 A study of temperature change on both sides of the Israeli-Egyptian borderremote sensing and micrometeorological modelling PhD thesis Ben GurionUniversity of the Negev Israel
Qin Z Karnieli A and Berliner P 2001 Thermal variation in Israel-Sinai (Egypt)peninsula region International Journal of Remote Sensing 22 915ndash919
Qin Z Dallrsquoolmo G Karnieli A and Berliner P 2001 Derivation of a split windowalgorithm and its sensitivity analysis for retrieving land surface temperature fromNOAA-AVHRR data Journal of Geophysical Research 106 (D19) 22 655ndash22 670
Rao C R N and Chen J 1998 Revised post-launch calibration of the visible and near-infrared channels of the advanced very high resolution radiometer (AVHRR) on theNOAA-14 spacecraft International Journal of Remote Sensing 20 3485ndash3491
Reed B C Brown J F Vanderzee D Loveland T R Merchant J W and OhlenD O 1994 Measuring phenological variability from satellite imagery Journal ofVegetation Science 5 703ndash714
Rizzi A 1985 Analisi dei dati Applicazioni dellrsquoinformatica alla statistica (Roma La NuovaItalia Scienti ca)
Roy D P Kennedy P and Folving S 1997 Combination of the Normalized DiVerenceVegetation Index and surface temperatures for regional scale European forest covermapping using AVHRR data International Journal of Remote Sensing 18 1189ndash1195
Running S W Loveland T R Pierce L L Nemani R R and Hunt E R 1995 Aremote sensing based vegetation classi cation logic for global land cover analysisRemote Sensing of Environment 51 39ndash48
Schmidt H and Karnieli A 2000 Monitoring the seasonal variability of vegetation in asemi-arid environment using remote sensing data A case study in the Negev DesertIsrael Journal of Arid Environments 45 43ndash59
Schmidt H and Karnieli A 2002 Analysis of the temporal and spatial vegetation patternsin a semi-arid environment observed by NOAAAVHRR imagery and spatial groundmeasurements International Journal of Remote Sensing (this issue)
Middle East Drylands 4071
Sobrino J A and Raissouni N 2000 Toward remote sensing methods for land coverdynamic monitoring application to Morocco International Journal of Remote Sensing21 353ndash366
Townshend J R G and Justice C O 1986 Analysis of the dynamics of African vegetationusing the normalized diVerence vegetation index International Journal of RemoteSensing 7 1435ndash1445
Tsoar H and Moslashller J T 1986 The role of vegetation in the formation of linear sanddunes In Aeolian Geomorphology edited by W G Nickling (Boston Allen amp Unwin)pp 75ndash95
Tsoar H and Karnieli A 1996 What determines the spectral re ectance of the Negev-Sinai sand dunes International Journal of Remote Sensing 17 513ndash525
Tsoar H Goldsmith V Schoenhaus S Clarke K and Karnieli A 1995 Reverseddeserti cation on sand dunes along the Sinai-Negev border In Desert Aeolian Processedited by V P Tchakerion (New York Chapman and Hall ) pp 251ndash267
Vermote E Tanrersquo D Deuzersquo J L Herman M and Morcrette J J 1997 SecondSimulation of the Satellite Signal in the Solar Spectrum (6S) an overview IEEET ransactions on Geoscience and Remote Sensing 35 675ndash685
Vogt J V Viau A A Beaudin I Niemeyer S and Somma F 1998 Drought monitoringfrom space using empirical indices and physical indicators In Proceedings ofInternational Symposium on Satellite-based observation a tool for the study of theMediterranean basin 23ndash27 November 1998 T unis (Toulouse CNES)
Weinreb M P Hamilton G Brown S and KoczorR J 1990 Nonlinearity correctionsin calibration of Advanced Very High Resolution Radiometer infrared channelsJournal of Geophysical Research 95 7381ndash7388
White M A Thornton P E and Running S W 1997 A continental phenology modelfor monitoring vegetation responses to interannual climatic variability GlobalBiogeochemical Cycles 11 217ndash234
Zhang X Hodgers J C F Schaaf C B Friedl M A Strahler A H and GaoF 2001 Global vegetation phenology from AVHRR and MODIS data In Proceedingsof the International Geoscience and Remote Sensing Symposium University of New SouthWales (Sydney Australia IGRSS) (on CD-ROM)
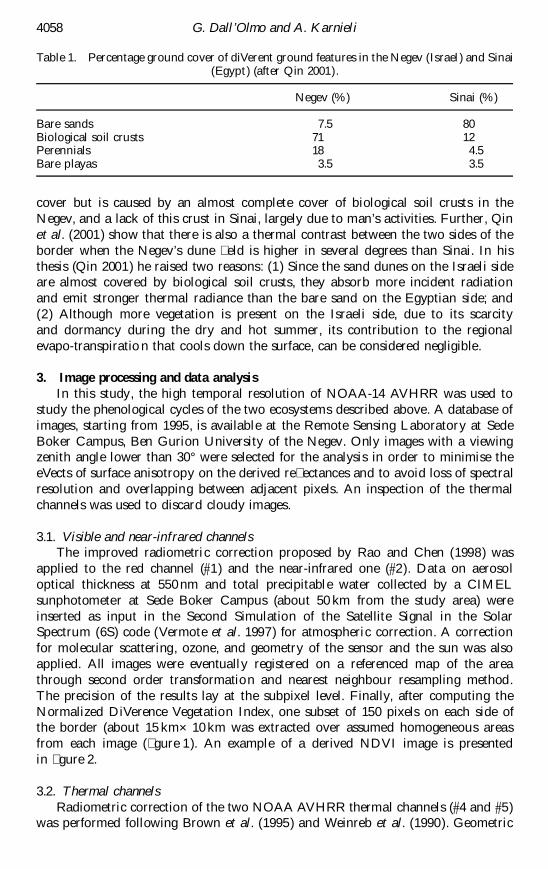
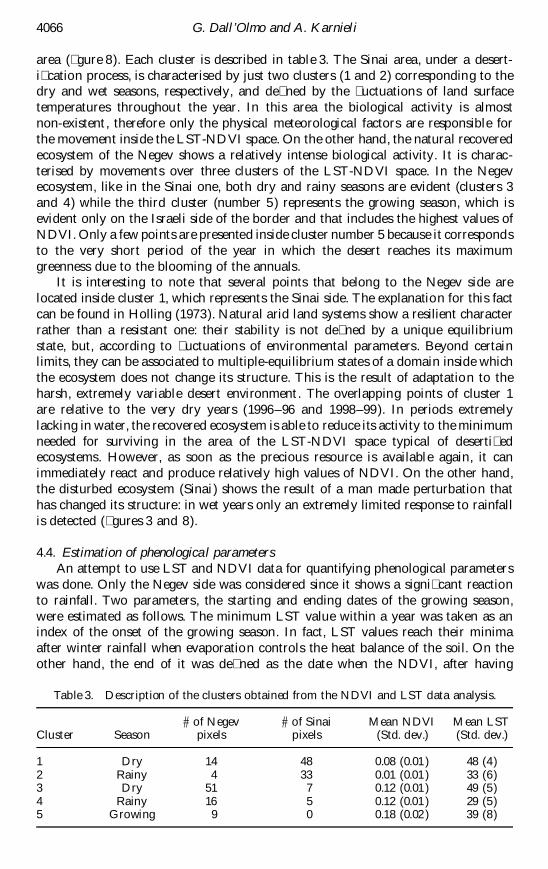
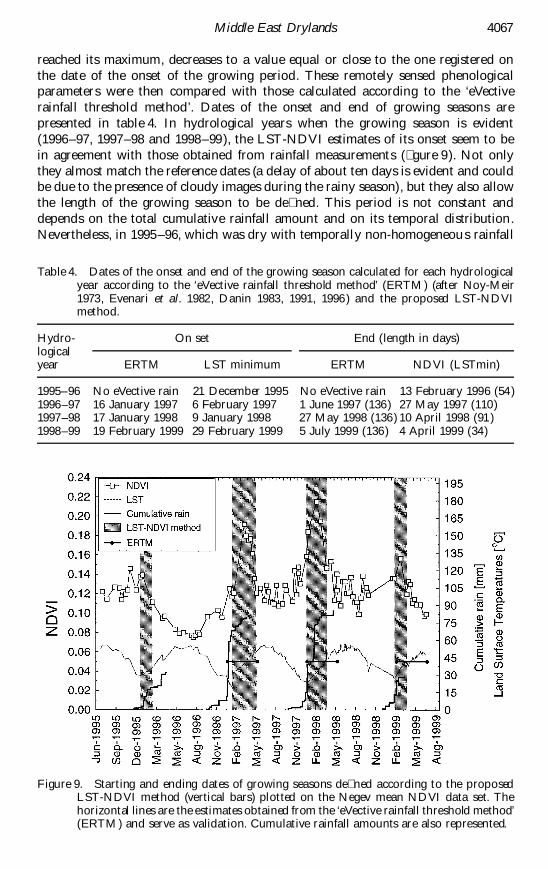