Spatio-temporal variation in phenological response of citrus to climate change in Iran: 1960–2010
9
Agricultural and Forest Meteorology 198–199 (2014) 285–293 Contents lists available at ScienceDirect Agricultural and Forest Meteorology j our na l ho me page: www.elsevier.com/locate/agrformet Spatio-temporal variation in phenological response of citrus to climate change in Iran: 1960–2010 J.M. Fitchett a , S.W. Grab a,∗ , D.I. Thompson b,c , G. Roshan d a School of Geography, Archaeology and Environmental Studies, University of the Witwatersrand, Private Bag 3, Wits 2050, Johannesburg, South Africa b South African Environmental Observation Network (SAEON), Ndlovu Node, Private Bag X1021, Phalaborwa 1390, South Africa 1 c School of Life Sciences, University of KwaZulu-Natal, Private Bag X01, Scottsville Pietermaritzburg 3209, South Africa d Department of Geography, Golestan University, Gorgan, Iran a r t i c l e i n f o Article history: Received 5 February 2014 Received in revised form 8 August 2014 Accepted 22 August 2014 Keywords: Citrus hybrids Peak flowering Temperature Precipitation Climate trends Phenological advance and delay a b s t r a c t Recent studies investigating floral and faunal phenological responses to climate change have highlighted the extent to which these relationships are species and location specific. This study investigates tempo- ral responses of citrus peak flowering to climate change in the cities of Kerman, Shiraz and Gorgan, Iran. Phenological data comprise peak flowering dates of five citrus types: orange, tangerine, sweet lemon, sour lemon and sour orange, collected daily from government heritage gardens located within each of the cities over the period 1960–2010. For the same period, daily T max , T min and rainfall data were acquired from the Iranian Meteorological Organization. Time trend analyses were undertaken for both the phe- nological and meteorological data, followed by linear regression to determine the nature and extent of relationships between these variables. We find that the mean peak flowering dates, and their long-term trends over the 51-year period, are similar across the five citrus types within each city, but demonstrate significant differences between cities. Flowering date advances of 0.12–0.17 d/yr are recorded for Ker- man, and more rapid advances of 0.56–0.65 d/yr for Shiraz. Notably, progressive delays in flowering dates occur in Gorgan (0.05–0.1 d/yr). The peak flowering dates in the former two cities demonstrate strong relationships with mean annual T min , ranging from r = 0.47–0.61 (p = 0.0045; p < 0.0001) for Kerman to r = 0.53–0.67 (p = 0.0386; p < 0.0001) for Shiraz, and equate to peak flowering advances of 3.15–3.39 d/ ◦ C and 4.34–5.47 d/ ◦ C, respectively. By contrast, the strongest relationships between peak flowering dates and annual climate in Gorgan are with rainfall (r = 0.02–0.3, p = 0.8874; p = 0.0528), indicating a weak phenophase response of 0.01 d/mm. For Gorgan, the strongest relationships (r = 0.43–075, p = 0.0002 to p < 0.0001) are between peak flowering date and mean T max for May, the month during which peak flower- ing occurs, with a delay in flowering of 1.26–1.86 d/ ◦ C cooling. This suggests a relatively more influential climatic role directly preceding peak flowering, which may be associated with anomalous cooling in May. However, Kerman and Shiraz demonstrate more consistent strength in correlation between peak flow- ering and climate variables across the months of the year, with only slight peaks for the months flanking peak flowering. Our study highlights the importance of considering location-specific phenophase shifts within given regions, as dissimilar trends may occur within a country; this has important implications for future agricultural planning and fruit crop supply to local and international markets. © 2014 Published by Elsevier B.V. 1. Introduction Phenology is broadly defined as the timing of annually recurrent biological events (Badeck et al., 2004). The phenological response of plants to climate change over recent decades is considered to be both location and species specific (Parmesan, 2007; Miller-Rushing ∗ Corresponding author. Tel.: +27 11 717 6512. E-mail address: [email protected] (S.W. Grab). 1 Primary affiliation. & Primack, 2008). The extent of this variation across species and location is increasingly evident through the accumulation of phe- nological research. Phenologies of the same species are responding at different rates to climate change in locations of different lati- tude and altitude (Ruml et al., 2011) and with distance from the nearest coastline (Wielgolaski, 2003). Within individual locations, there are likewise substantial differences in the rate of phenologi- cal change between plant species. For example, Wang et al. (2008) report advances in cotton flowering of 0.66 d/ ◦ C in Beijing, whilst wheat flowering in the city advances by a considerable 3.4 d/ ◦ C. An analysis of 500 plant and animal species’ phenophase shifts in http://dx.doi.org/10.1016/j.agrformet.2014.08.010 0168-1923/© 2014 Published by Elsevier B.V.
Transcript of Spatio-temporal variation in phenological response of citrus to climate change in Iran: 1960–2010

Sc
Ja
b
c
d
a
ARRA
KCPTPCP
1
bob
h0
Agricultural and Forest Meteorology 198–199 (2014) 285–293
Contents lists available at ScienceDirect
Agricultural and Forest Meteorology
j our na l ho me page: www.elsev ier .com/ locate /agr formet
patio-temporal variation in phenological response of citrus tolimate change in Iran: 1960–2010
.M. Fitchetta, S.W. Graba,∗, D.I. Thompsonb,c, G. Roshand
School of Geography, Archaeology and Environmental Studies, University of the Witwatersrand, Private Bag 3, Wits 2050, Johannesburg, South AfricaSouth African Environmental Observation Network (SAEON), Ndlovu Node, Private Bag X1021, Phalaborwa 1390, South Africa1
School of Life Sciences, University of KwaZulu-Natal, Private Bag X01, Scottsville Pietermaritzburg 3209, South AfricaDepartment of Geography, Golestan University, Gorgan, Iran
r t i c l e i n f o
rticle history:eceived 5 February 2014eceived in revised form 8 August 2014ccepted 22 August 2014
eywords:itrus hybridseak floweringemperaturerecipitationlimate trendshenological advance and delay
a b s t r a c t
Recent studies investigating floral and faunal phenological responses to climate change have highlightedthe extent to which these relationships are species and location specific. This study investigates tempo-ral responses of citrus peak flowering to climate change in the cities of Kerman, Shiraz and Gorgan, Iran.Phenological data comprise peak flowering dates of five citrus types: orange, tangerine, sweet lemon,sour lemon and sour orange, collected daily from government heritage gardens located within each ofthe cities over the period 1960–2010. For the same period, daily Tmax, Tmin and rainfall data were acquiredfrom the Iranian Meteorological Organization. Time trend analyses were undertaken for both the phe-nological and meteorological data, followed by linear regression to determine the nature and extent ofrelationships between these variables. We find that the mean peak flowering dates, and their long-termtrends over the 51-year period, are similar across the five citrus types within each city, but demonstratesignificant differences between cities. Flowering date advances of 0.12–0.17 d/yr are recorded for Ker-man, and more rapid advances of 0.56–0.65 d/yr for Shiraz. Notably, progressive delays in flowering datesoccur in Gorgan (0.05–0.1 d/yr). The peak flowering dates in the former two cities demonstrate strongrelationships with mean annual Tmin, ranging from r = 0.47–0.61 (p = 0.0045; p < 0.0001) for Kerman tor = 0.53–0.67 (p = 0.0386; p < 0.0001) for Shiraz, and equate to peak flowering advances of 3.15–3.39 d/◦Cand 4.34–5.47 d/◦C, respectively. By contrast, the strongest relationships between peak flowering datesand annual climate in Gorgan are with rainfall (r = 0.02–0.3, p = 0.8874; p = 0.0528), indicating a weakphenophase response of 0.01 d/mm. For Gorgan, the strongest relationships (r = 0.43–075, p = 0.0002 top < 0.0001) are between peak flowering date and mean Tmax for May, the month during which peak flower-ing occurs, with a delay in flowering of 1.26–1.86 d/◦C cooling. This suggests a relatively more influentialclimatic role directly preceding peak flowering, which may be associated with anomalous cooling in May.
However, Kerman and Shiraz demonstrate more consistent strength in correlation between peak flow-ering and climate variables across the months of the year, with only slight peaks for the months flankingpeak flowering. Our study highlights the importance of considering location-specific phenophase shiftswithin given regions, as dissimilar trends may occur within a country; this has important implicationsfor future agricultural planning and fruit crop supply to local and international markets.. Introduction
Phenology is broadly defined as the timing of annually recurrent
iological events (Badeck et al., 2004). The phenological responsef plants to climate change over recent decades is considered to beoth location and species specific (Parmesan, 2007; Miller-Rushing∗ Corresponding author. Tel.: +27 11 717 6512.E-mail address: [email protected] (S.W. Grab).
1 Primary affiliation.
ttp://dx.doi.org/10.1016/j.agrformet.2014.08.010168-1923/© 2014 Published by Elsevier B.V.
© 2014 Published by Elsevier B.V.
& Primack, 2008). The extent of this variation across species andlocation is increasingly evident through the accumulation of phe-nological research. Phenologies of the same species are respondingat different rates to climate change in locations of different lati-tude and altitude (Ruml et al., 2011) and with distance from thenearest coastline (Wielgolaski, 2003). Within individual locations,there are likewise substantial differences in the rate of phenologi-
cal change between plant species. For example, Wang et al. (2008)report advances in cotton flowering of 0.66 d/◦C in Beijing, whilstwheat flowering in the city advances by a considerable 3.4 d/◦C.An analysis of 500 plant and animal species’ phenophase shifts in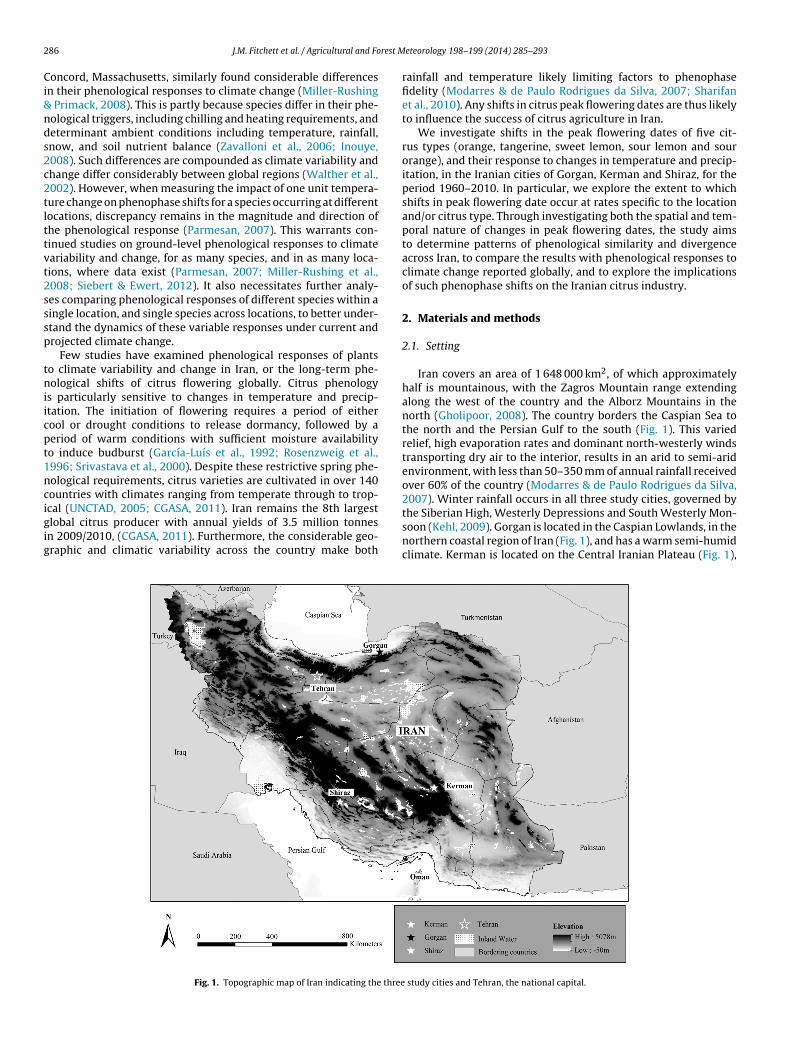
2 rest M
Ci&nds2c2tlttvt2sssp
tniicpt1ncigig
86 J.M. Fitchett et al. / Agricultural and Fo
oncord, Massachusetts, similarly found considerable differencesn their phenological responses to climate change (Miller-Rushing
Primack, 2008). This is partly because species differ in their phe-ological triggers, including chilling and heating requirements, andeterminant ambient conditions including temperature, rainfall,now, and soil nutrient balance (Zavalloni et al., 2006; Inouye,008). Such differences are compounded as climate variability andhange differ considerably between global regions (Walther et al.,002). However, when measuring the impact of one unit tempera-ure change on phenophase shifts for a species occurring at differentocations, discrepancy remains in the magnitude and direction ofhe phenological response (Parmesan, 2007). This warrants con-inued studies on ground-level phenological responses to climateariability and change, for as many species, and in as many loca-ions, where data exist (Parmesan, 2007; Miller-Rushing et al.,008; Siebert & Ewert, 2012). It also necessitates further analy-es comparing phenological responses of different species within aingle location, and single species across locations, to better under-tand the dynamics of these variable responses under current androjected climate change.
Few studies have examined phenological responses of plantso climate variability and change in Iran, or the long-term phe-ological shifts of citrus flowering globally. Citrus phenology
s particularly sensitive to changes in temperature and precip-tation. The initiation of flowering requires a period of eitherool or drought conditions to release dormancy, followed by aeriod of warm conditions with sufficient moisture availabilityo induce budburst (García-Luís et al., 1992; Rosenzweig et al.,996; Srivastava et al., 2000). Despite these restrictive spring phe-ological requirements, citrus varieties are cultivated in over 140ountries with climates ranging from temperate through to trop-
cal (UNCTAD, 2005; CGASA, 2011). Iran remains the 8th largestlobal citrus producer with annual yields of 3.5 million tonnesn 2009/2010, (CGASA, 2011). Furthermore, the considerable geo-raphic and climatic variability across the country make bothFig. 1. Topographic map of Iran indicating the three
eteorology 198–199 (2014) 285–293
rainfall and temperature likely limiting factors to phenophasefidelity (Modarres & de Paulo Rodrigues da Silva, 2007; Sharifanet al., 2010). Any shifts in citrus peak flowering dates are thus likelyto influence the success of citrus agriculture in Iran.
We investigate shifts in the peak flowering dates of five cit-rus types (orange, tangerine, sweet lemon, sour lemon and sourorange), and their response to changes in temperature and precip-itation, in the Iranian cities of Gorgan, Kerman and Shiraz, for theperiod 1960–2010. In particular, we explore the extent to whichshifts in peak flowering date occur at rates specific to the locationand/or citrus type. Through investigating both the spatial and tem-poral nature of changes in peak flowering dates, the study aimsto determine patterns of phenological similarity and divergenceacross Iran, to compare the results with phenological responses toclimate change reported globally, and to explore the implicationsof such phenophase shifts on the Iranian citrus industry.
2. Materials and methods
2.1. Setting
Iran covers an area of 1 648 000 km2, of which approximatelyhalf is mountainous, with the Zagros Mountain range extendingalong the west of the country and the Alborz Mountains in thenorth (Gholipoor, 2008). The country borders the Caspian Sea tothe north and the Persian Gulf to the south (Fig. 1). This variedrelief, high evaporation rates and dominant north-westerly windstransporting dry air to the interior, results in an arid to semi-aridenvironment, with less than 50–350 mm of annual rainfall receivedover 60% of the country (Modarres & de Paulo Rodrigues da Silva,2007). Winter rainfall occurs in all three study cities, governed by
the Siberian High, Westerly Depressions and South Westerly Mon-soon (Kehl, 2009). Gorgan is located in the Caspian Lowlands, in thenorthern coastal region of Iran (Fig. 1), and has a warm semi-humidclimate. Kerman is located on the Central Iranian Plateau (Fig. 1),study cities and Tehran, the national capital.

rest Meteorology 198–199 (2014) 285–293 287
eststeala
2
gvbctoToi(tctTattwoiciSmda
2
idbfcsaeHcsrr
3
3
ttcd
J.M. Fitchett et al. / Agricultural and Fo
xperiencing a semi-arid climate characterised by large diurnal andeasonal temperature ranges, with the topography blocking mois-ure from the Caspian Sea to the north and the Persian Gulf to theouth. Shiraz is located in the foothills of the Zagros Mountains, inhe north western region of Iran (Fig. 1), and consequently experi-nces predominantly orographic rainfall from November to March,nd has a mild, temperate climate. Multi-decadal citrus pheno-ogy (peak flowering), temperature and precipitation data werecquired for these three cities.
.2. Phenology and climate data
Peak bloom phenology data were sourced from governmentardens in each of the study cities, for the period 1960–2010. A pri-ate company, Mohit Sabz, collected and archived data recordedy farmers in three to four government-owned orchards perity. The phenological observations were made every day duringhe growing period of the year. Management practices in theserchards have remained constant throughout the study period.he data comprise peak flowering dates (80% bloom, pooled acrossrchards) for five citrus types: orange (Citrus × sinensis), tanger-ne (Citrus × tangerine), sweet lemon (Citrus limetta), sour lemonCitrus × limon) and sour orange (Citrus × aurantium). All five citrusypes are grown in each of the three cities, thus facilitating spatialomparison. The climate data for this study were obtained fromhe Iranian Meteorological Organization, and comprise daily Tmax,min and rainfall records for the period 1960–2010. With directccountability for the quality of these data, both companies havehe incentive to ensure consistency in data collection, and to checkhe data for errors before archiving. In the few cases where dataere missing (never more than four consecutive days), these were
mitted so as to prevent possible incorrect trends through biasednterpolation. Orchards in Gorgan are not irrigated, as there is suffi-ient annual rainfall for agricultural production, whilst in Kerman,rrigation is only possible when sufficient freshwater is available.hiraz receives year-round irrigation to compensate for the farmoisture deficit. Irritation data were not available, and so rainfall
ata for Gorgan represent most accurately changes in plant watervailability.
.3. Data analysis
Changes in temperature and rainfall over the study period werenvestigated. Trends in the phenological data were analysed toetermine the nature and rate of any shifts in the timing of peakloom. Thereafter, the relationship between temperature and rain-all changes and shifts in phenophase dates were explored. Linearorrelation and regression analyses were used to determine thetrength and nature of relationships between phenophase datesnd each of the climate variables (cf. Rötzer et al., 2000; Sparkst al., 2000; Hegland et al., 2009; Grab & Craparo, 2011; Keatley &udson, 2012; Luedeling & Gassner, 2012). In this paper, correlationoefficients are expressed as absolute values for ease of compari-on, whilst the direction of change is communicated through theate of change of the independent variable, represented in the linearegression coefficient of the independent term, ‘x’.
. Results
.1. Phenological shifts
The mean peak flowering dates for the period 1960–2010, and
he trends in flowering dates over this study period, are similar forhe five citrus types within each city, yet vary considerably betweenities. This is most clearly demonstrated by the difference betweenelays in flowering dates for all five citrus types in Gorgan, butFig. 2. Time trends of citrus flowering dates over the period 1960–2010 for (A)Gorgan, (B) Kerman and (C) Shiraz.
advances in flowering dates for the five citrus types in Kerman andShiraz (Fig. 2).
The trends in delayed flowering dates for Gorgan (Fig. 2A) areonly significant for orange and tangerine (r = 0.41, p = 0.008; r = 0.32,p = 0.035, respectively), with considerably weaker correlations forsweet lemon (r = 0.24, p = 0.1285), sour lemon (r = 0.21, p = 0.1976)and sour orange (r = 0.16, p = 0.3467). Despite this, the data revealphenological shifts of similar magnitude across citrus type, rangingfrom 0.05 d/yr for sour orange to 0.1 d/yr for orange. Differences inthe rates of flowering date shifts for each of the citrus types resultsin a convergence of trends over the period 1960–2010, with a pro-
gressive shift towards common flowering dates for sour orange andsour lemon, and for orange, tangerine and sweet lemon (Fig. 2A).Significant advances in peak flowering dates are exhibitedfor all five citrus types in Kerman (Fig. 2B). These trends are

2 rest Meteorology 198–199 (2014) 285–293
mreolGgl
avtesaflf
3
b(pBi06
f(pTTahoasi(wpt
3
drgfettnp
trioifflf
88 J.M. Fitchett et al. / Agricultural and Fo
oderately strong, ranging from r = 0.33 (p = 0.0313) for orange to = 0.45 (p = 0.0038) for sour lemon. The data reflect advanced flow-ring by 0.12 d/yr for orange to 0.17 d/yr for sweet lemon and sourrange, and shifts of 0.15 d/yr for tangerine and 0.16 d/yr for souremon. A convergence of flowering date trends, similar to that fororgan, is apparent for orange, sour orange and tangerine. Diver-ence in flowering date trends is evident for sweet lemon and souremon (Fig. 2B).
Even stronger advances in flowering dates are demonstrated forll five citrus types in Shiraz (Fig. 2C). The strength of these trendsaries slightly across citrus type (r = 0.84, p < 0.0001 for sour lemono r = 0.91, p < 0.0001 for sour orange), reflecting advances in flow-ring dates of between 0.56 d/yr for sour lemon and 0.65 d/yr forweet lemon; and shifts of 0.60–0.62 d/yr for tangerine, sour orangend orange. The clear patterns of convergence and divergence inowering dates apparent for Gorgan and Kerman are not observed
or Shiraz (Fig. 2C).
.2. Climate changes
Data for Gorgan reveal a considerable shift from above- toelow-average mean annual precipitation over the study periodFig. 3A), corresponding to a significant negative trend (r = 0.57,
< 0.0001) and representing a decrease in rainfall of 4.69 mm/yr.y contrast, trends for mean annual Tmax and Tmin are not signif-
cant; Tmax (r = 0.15, p = 0.2845) demonstrates a weak increase of.01 ◦C/yr, whilst there is no discernible change in Tmin over the0-year period.
The converse is observed for Kerman, with significant trendsor Tmax and Tmin, and an insignificant trend for precipitationFig. 3B). The strongest time-trend is observed for Tmin (r = 0.74,
< 0.0001), equating to an increase of 0.05 ◦C/yr. The trend formax is similar, with an increase of 0.03 ◦C/yr (r = 0.54, p < 0.0001).he non-significant precipitation trend (r = 0.26, p = 0.0663) reflectsn approximate 0.26 mm/yr decrease in rainfall for the alreadyyper-arid Kerman, which has an annual precipitation of 139 mmver the study period. Shiraz experienced a considerable shift tobove-average annual Tmin (Fig. 3C), corresponding with a highlyignificant increase (r = 0.76, p < 0.0001) of 0.07 ◦C/yr. The 0.03 ◦C/yrncrease in annual Tmax has a weaker time trend correlationr = 0.48, p = 0.0005). Precipitation trends for Shiraz are extremelyeak, suggesting a very slight increase in rainfall over time (r = 0.09,
= 0.5270). Throughout the study period, mean monthly tempera-ures for Kerman and Shiraz have remained below 10 ◦C.
.3. Relationship between phenology and climate
There are no significant relationships between peak floweringates and annual climate variables for Gorgan. However, strongerelationships exist with precipitation than with temperature, ran-ing from r = 0.02 (p = 0.8874) for sour lemon to r = 0.30 (p = 0.0528)or tangerine, tentatively suggesting an average delay in peak flow-ring of 0.01 d per 1 mm decrease in mean annual rainfall for thewo citrus types (Table 1). The variability in the strength of the rela-ionships between citrus type and climate variables for Gorgan isotable given the similar trends in delayed flowering over the studyeriod.
In Kerman, by contrast, significant relationships exist betweenhe flowering dates of each citrus type and each of Tmax, Tmin, andainfall, respectively. The strongest correlations exist for flower-ng dates and mean annual Tmin (from r = 0.47, p = 0.0020 for sourrange to r = 0.61, p < 0.0001 for tangerine), equating to advances
n flowering dates in response to an increasing Tmin of 3.15 d/◦Cor sour lemon to 3.93 d/◦C for tangerine (Table 1). Advances inowering dates in response to increasing mean annual Tmax rangerom 1.85 d/◦C for sour orange to 3.08 d/◦C for sweet lemon, with
Fig. 3. Deviation of mean annual Tmax, Tmin and precipitation from 1960 to 2010mean for (A) Gorgan, (B) Kerman and (C) Shiraz.
correlation strengths of r = 0.35, p = 0.0295 for sour lemon to r = 0.59,p < 0.0001 for sweet lemon (Table 1). The weakest relationships aredemonstrated for flowering dates and mean annual precipitation(r = 0.32, p = 0.0448 for sour lemon to r = 0.46, p = 0.0020 for orange),tentatively suggesting advances of 0.03 d/mm for sour lemon to0.06 d/mm for sour orange (Table 1).
For Shiraz, particularly strong relationships are measuredbetween flowering dates and increasing mean annual Tmin (r = 0.53,p = 0.0386 for sour lemon to r = 0.67, p < 0.0001 for tangerine),equating to advances in flowering of between 4.34 d (sour lemon)
and 5.47 d (sour orange) per 1 ◦C increase in Tmin (Table 1).Advanced flowering dates and increases in mean annual Tmaxare also strongly correlated (r = 0.50, p = 0.0018 for sour lemon

J.M. Fitchett et al. / Agricultural and Forest Meteorology 198–199 (2014) 285–293 289
Table 1Correlation between flowering dates for the five citrus types and the mean annual climate parameters for Gorgan, Kerman and Shiraz, 1960–2010. Significant relationshipsare highlighted by an asterisk.
Orange Tangerine Sweet lemon Sour lemon Sour orange
GorganTmax (r) 0.13 0.07 0.21 0.06 0.26Change (d/◦C) −0.49 +0.62 −0.98 −0.35 −1.48Tmin (r) 0.22 0.12 0.08 0.02 0.13Change (d/◦C) −1.06 +0.59 −0.43 +0.12 −0.86Precipitation (r) 0.28 0.30 0.05 0.02 0.13Change (d/mm) −0.01 −0.01 −0.002 −0.001 +0.01
KermanTmax (r) *0.45 *0.43 *0.59 *0.35 *0.40Change (d/◦C) −2.78 −2.48 −3.08 −1.85 −2.96Tmin (r) *0.57 *0.61 *0.52 *0.56 *0.47Change (d/◦C) −3.66 −3.93 −3.52 −3.15 −3.65Precipitation (r) *0.46 *0.38 *0.41 *0.32 *0.45Change (d/mm) +0.05 +0.05 +0.05 +0.03 +0.06
ShirazTmax (r) *0.60 *0.54 *0.59 *0.50 *0.59Change (d/◦C) −7.45 −6.99 −7.86 −6.14 −7.41Tmin (r) *0.65 *0.67 *0.62 *0.53 *0.62
◦
t7sas(
d8pbsato(rtc
dmittiseasmfoppit(amno
Change (d/ C) −5.27 −5.32
Precipitation (r) 0.06 0.08
Change (d/mm) +0.01 −0.01
o r = 0.60, p < 0.0001 for orange), with advances of 6.14 d/◦C and.45 d/◦C, respectively (Table 1). In contrast to Kerman, relation-hips between peak flowering dates and mean annual precipitationre particularly weak for all citrus types (r = 0.01, p = 0.9396 forour lemon to r = 0.08, p = 0.6287 for tangerine and sour orange)Table 1).
Some species-specific relationships between citrus floweringates and climate variables are noted between the three cities. In/9 cases the weakest relationships are recorded between climatearameters and flowering dates of sour lemon. The relationshipsetween tangerine flowering dates and climate parameters are thetrongest in 4/9 cases. This is followed by orange flowering datesnd climate parameters, which are the strongest in 1/3 cases, andhe second strongest in the remaining 2/3 cases (Table 1). Sourrange demonstrates the greatest variability in correlation strengthr = 0.08–0.62) (Table 1). Despite these observations, similarity inesponses to climate parameters remains greatest between citrusypes within each city, rather than for any one citrus type betweenities.
When analysing the relationships between the peak floweringates for each of the five citrus types, and monthly averages of cli-ate variables, it becomes evident that the flowering date of citrus
s controlled significantly by not only annual climate, but also theemperature and precipitation during the period directly precedinghis phenophase. Citrus trees flower in spring, with peak floweringn Gorgan progressively delayed from early to late May during thetudy period, whilst in Kerman and Shiraz the advancement is fromarly April to mid-March. Across the three cities, five citrus types,nd three climate variables, there is a notable apex in correlationtrength between peak flowering and the climate variable for theonth in which peak flowering occurs (Fig. 4). This is most notable
or Gorgan where comparatively large correlation coefficients arebserved between the climate variables for the month of May andeak flowering dates. These correlation coefficients (r = 0.43–0.75,
= 0.0002; p < 0.0001) demonstrate substantially stronger, signif-cant relationships between peak flowering and climate duringhe month of flowering, than for the annually averaged climater = 0.02–0.3, p = 0.8874; p = 0.0528). For Gorgan, this would suggest
strong climatic influence on peak flowering dates during theonth of flowering, rather than the annual climate. Although
o significant change in annual Tmax is measured for Gorganver the study period, Tmax for May demonstrates a weak but
−5.10 −4.34 −5.470.04 0.01 0.08
+0.01 −0.01 +0.01
uncharacteristic decrease over the study period (r = 0.12,p = 0.2856), it would thus seem that in response to coolingTmax during the month of peak flowering, the timing of floweringis delayed by 1.26–1.86 d/◦C. The mean Tmin and precipitation forMay in Gorgan were consistent with the annual data.
Apices in correlation strength for the months of flowering(March and April) are not as clearly defined in Kerman and Shirazas for Gorgan, and extend into months both preceding and follow-ing peak flowering. For these two cities, it thus seems that climatevariables at the time of flowering have a weaker influence on flow-ering dates than in Gorgan, with annual climate exercising a moredominant role. The difference in sensitivity to monthly and annualclimate averages between cities, could be driven by the consistentdirection of change in climate variables in Kerman and Shiraz, withno anomalous climate change noted for any climate variable dur-ing the month of peak flowering. Thus, while warming during themonth of peak flowering would contribute towards earlier flow-ering, this phenological response is supported more strongly byincreasing mean annual Tmax and Tmin. The disparate correlationcoefficient strengths across spatial scales, and at different timesthroughout the year, together with the importance of anomalousclimate trends during the month of peak flowering, highlights crit-ical differences in citrus responses to regional climate cues, andwarrants continued investigation into the climate drivers of phe-nological shifts specific to both species and location.
4. Discussion
4.1. Spatial variation in phenophase shifts
Our results demonstrate considerable variability between loca-tions in citrus peak flowering dates, shifts in this phenophase overrecent decades, and phenological responses to local climate vari-ability and change. Variation in the timing of flowering betweencities, rather than between citrus types within a particular city,together with distinct climatic conditions for each city, is an indi-cation that the timing of citrus flowering, at least in Iran, is driven
by environmental rather than intrinsic cues (also see Tan & Swain,2006; Connellan et al., 2010). These location specific phenophaseshifts are particularly notable due to the delay in peak floweringin Gorgan – which is atypical in climate change response studies,
290 J.M. Fitchett et al. / Agricultural and Forest Meteorology 198–199 (2014) 285–293
mont
raa
sdtlpfneo5f5ppKtmCttflflrd
Fig. 4. Strength of correlation coefficients between peak flowering dates and
elative to advanced flowering dates in both Kerman and Shiraz,nd the differences in time periods during which climate variablesre most strongly associated with the timing of flowering.
Variation in the rates of phenophase shifts within a singlepecies across different locations could be associated with altitu-inal and latitudinal differences (Ruml et al., 2011). In additiono the temperature differences between cooler high altitude andatitude regions and their lower latitude and altitude counter-arts, this response is largely attributed to the poles warmingaster than lower latitude regions, resulting in more rapid phe-ological shifts in high-latitude regions (Parmesan, 2007; Rumlt al., 2011). Latitude and altitude are similar for the inland citiesf Kerman (30◦17′ N, 57◦05′ E, 1755 masl) and Shiraz (29◦37′ N,2◦32′ E, 1488 masl), both of which demonstrated considerably dif-erent peak citrus flowering shifts to those in Gorgan (36◦50′ N,4◦26′ E, 0 masl), which was the only city to record progressivehenophase delays. The most rapid phenological shifts and tem-erature increases in this study are measured for higher altitudeerman and Shiraz, rather than the higher latitude Gorgan. Fur-
hermore, despite relatively similar latitudes, flowering advance isore rapid in Shiraz than Kerman. Due to its location adjacent to the
aspian Sea, the more northerly city of Gorgan remained warmerhan Kerman and Shiraz throughout the study period. These pat-erns suggest that altitude and latitude alone do not control peak
owering phenology in Iran, although more data from early and lateowering orchards stratified across altitude and latitude would beequired to test this hypothesis. Indeed, whilst Parmesan (2007)emonstrated that phenological responses amongst 203 studiedhly averages of climate variables for the cities of Gorgan, Kerman and Shiraz.
species were strongest at high latitudes due to relatively moreextreme climate changes, latitude itself accounted for less than 4%of variation in phenophase shifts.
Mean peak flowering in Gorgan occurred a month later thanin Kerman and Shiraz. In warm regions, both the occurrence oflate flowering, and progressive delays in flowering dates can occursimultaneously with temperature increases (Primack et al., 2009;Schwartz & Hanes, 2010; Campoy et al., 2013; Guo et al., 2013).This is owing to increased difficulties in the fulfilment of chillingrequirements for inflorescence initiation during even marginallywarmer winters as minimum threshold temperatures are not met(Primack et al., 2009; Schwartz & Hanes, 2010; Campoy et al., 2013;Guo et al., 2013), as is increasingly the case in all three cities (Fig. 3).For citrus, the fulfilment of dormancy requires either a chillingperiod, or, should this not be met, a period of drought (Southwick& Davenport, 1986; Srivastava et al., 2000). Gorgan experiencesrainfall throughout the year, thus the fulfilment of the dormancyrequirements must rely entirely on chilling, not drought. Given theobserved annual climate warming between 1960 and 2010, failed ordelayed completion of the chilling requirement and the continuedlack of alternate drought conditions may account for the delayedflowering dates in Gorgan, as has similarly been observed for Chest-nut phenology in China (Guo et al., 2013). As the decrease in Tmax isobserved only for the month of peak flowering, such chilling can
progressively occur only later into the month of May, at whichtime the lower Tmax has the potential to delay bud maturation. Bycontrast, Kerman and Shiraz continue to experience cooler win-ter temperatures than Gorgan: these remain considerably below
rest Meteorology 198–199 (2014) 285–293 291
t(sCmtcdtfitri
titrtfcpciwieGSbmgptWfs
lwlgspcdn
4
stpftloWiSslO1
Table 2Phenological response of sour lemon and orange first flowering dates to select cli-mate variables in Spain (Tortosa) for the period 1943–2003 (*after Gordo and Sanz,2005), and of peak flowering dates in Iran for the period 1960–2010.
Phenological response of citrus flowering dates to climate change
Tmax (2 months prior toflowering) (d/◦C)
Precipitation(October–February)(d/mm)
Sour lemonGorgan −0.64 −0.01Kerman −0.43 +0.02Shiraz −1.33 −0.01Tortosa* −0.31 +0.12
OrangeGorgan −0.68 −0.01Kerman −0.78 +0.06Shiraz −1.66 +0.02
J.M. Fitchett et al. / Agricultural and Fo
he 10 ◦C chilling threshold, and so fulfil the chilling requirementsSrivastava et al., 2000). The two inland cities also have arid toemi-arid climates, with a drought period in spring and summer.itrus here can thus continue to fulfil the requirements for dor-ancy release, and flower early in response to warming through
he late-winter drought, should winter temperatures exceed thishilling threshold in future. With the continued fulfilment of theirormancy requirements, through either sufficiently low winteremperatures or winter drought, advances in peak flowering datesor citrus are supported for Kerman and Shiraz. This is possible evenf temperatures increase to the extent where they contribute littleowards satisfying the chilling requirement and flowering, as flo-al induction is then supported by decreasing rainfall (Fig. 3) andntensifying drought conditions.
Another hypothesis for the differences in the flowering daterends between these Iranian cities could be their coastal andnland locations (Wielgolaski, 2003). Proximity to coastal (relativeo inland) regions influences temperatures through reduced diurnalanges, but more significantly, influences humidity and precipita-ion. In Norway, earlier fruit tree flowering dates were recordedor inland sites, whilst later flowering dates were observed in theoastal regions due to a combination of differences in humidity,recipitation and temperature range (Wielgolaski, 2003). This isonsistent with trends measured for Iran, with progressive delaysn flowering dates observed only for the coastal city of Gorgan,
hich experiences flowering late into spring (May), and advancesn flowering dates for the two inland cities which experience mucharlier flowering in March. Furthermore, peak flowering dates inorgan respond most strongly to annual precipitation, whilst inhiraz and Kerman the timing of peak flowering is influencedy changing annual temperature indices. However, Kerman, theost arid city with lowest humidity and precipitation, and with
reatest temperature ranges, does not experience relatively higheak flowering date advances compared with Shiraz. The similari-ies between coastal-inland phenological relationships reported by
ielgolaski (2003) and those observed in this study, thus requireurther investigation covering a greater sample of regions and/orpecies.
Our location-specific findings, and the multiple hypotheses onatitude, altitude and distance from the sea, which are associated
ith variability in phenological responses elsewhere, suggest thatocal and regional climatic factors can act in isolation, or syner-istically, to satisfy dormancy and maturation requirements of apecies, and thus determine the timing of associated reproductivehenological events. We argue that the region and its associatedlimate and patterns of climate change, rather than the citrus type,etermines which climatic variables serve as the greatest determi-ants of phenophase timing.
.2. Comparative rates of phenophase shifts
The considerable variability in rates of peak flowering datehifts for the citrus types across our three Iranian cities, suggestshat there is no defined intrinsic mean flowering date, nor rate ofhenophase shift per unit change in either temperature or rain-all. To validate the findings of this study, and to better understandhe nature of the species and location specific nature of pheno-ogical shifts, it is, however, important to compare the resultsbtained in this study with similar phenological studies elsewhere.ith a scarcity of phenological studies on citrus, and difficulties
n comparing studies using different climate indices, Gordo andanz (2005) provide the only results suitable for direct compari-
on with the current study; namely flowering date shifts of souremon and orange (among 29 other perennial plant species) at thebservatori de l’Ebre, near Tortosa City in Spain, for the period943–2003 (Table 2). Using linear regression to compare Tmax forTortosa* −0.85 −0.10
the two months preceding flowering and growing season precip-itation with first flowering dates, an advance in flowering datesfor both citrus types is reported, associated with an increase inmaximum temperatures (Gordo & Sanz, 2005). Our findings forKerman and Shiraz, recalculated to fit equivalent time measures(Table 2), are reasonably consistent with the direction and magni-tude of the relationships for Tortosa (Gordo & Sanz, 2005) (Table 2).The anomalous cooling in Gorgan for the period prior to and duringpeak flowering is supported by the direction of the relationship, andthe physiological control thereof. Gordo and Sanz (2005) furtherreport a positive relationship between growing season precipita-tion and lemon flowering dates, similar to Kerman (Table 2), andan inverse relationship for orange flowering, as is measured forGorgan. However, the magnitudes of the rates of change reportedby Gordo and Sanz (2005) are more rapid than those measuredfor any of the Iranian cities (Table 2). Whilst Gorgan experiences aclimate regime most similar to the Mediterranean location of Tor-tosa, the results of Gordo and Sanz (2005) are in most cases closestin magnitude to those of the very arid inland Iranian city of Ker-man. This could be due to Gorgan experiencing cooling rather thanwarming prior to and during flowering. The differences in resultsbetween Tortosa and the Iranian cities is, however, more likely tobe explained, in part, by the phenological data used; Gordo andSanz (2005) investigated first flowering rather than peak floweringdates, which limits seamless comparison, and is a phenophase sub-ject to greater variability (Miller-Rushing et al., 2008). Whilst thesephenophases cannot be directly compared, it is likely that peakflowering in Tortosa would have responded to climate variabilityand change in the same direction, if not at the same magnitude, asthat for first flowering (Miller-Rushing et al., 2008). The differencesobserved between Tortosa and the Iranian cities further strengthenthe notion of location specific citrus phenophases and phenophaseshifts in a changing climate.
Delays in flowering, as observed in Gorgan, are infrequentlyreported. A study of 542 plant and 19 animal species in 21 Euro-pean countries, for the period 1971–2000, found that whilst 30%of species demonstrated a significant shift towards earlier springevents, only 3% shifted towards later dates (Menzel et al., 2006).Similarly, of the 65 species analysed in a single-site study in Vic-toria, Australia, first flowering dates of only three species for theperiod 1983–2006 were delayed (Keatley and Hudson, 2012). Par-ticularly relevant due to locational differences, is the four-weekadvance of spring events in western and central Europe, but a delayof up to two weeks in eastern Europe for hazel, apple, coltsfoot
and lilac for the period 1951–1998 (Ahas et al., 2002). The scarcityof reported delays in flowering dates prevents comparing results
2 rest M
bl
tittldFflpdgtaetsiTscdotglfe
4
owaciKdwi&ptteiopa2dof
psmsHltwp
92 J.M. Fitchett et al. / Agricultural and Fo
etween Gorgan and other studies, but most importantly, high-ights an uncommon phenological response.
The direction and rates of phenophase shifts have resulted in aendency towards eventual convergence of flowering date trendsn Gorgan and Kerman. For the former, there is a general trendowards convergence of flowering date trends for all five citrusypes in future, with the convergence of sour orange and souremon trends, and orange, tangerine and sweet lemon floweringate trends already apparent over the period 1960–2010 (Fig. 2).or Kerman, the convergence of orange, tangerine and sour orangeowering date trends can similarly be observed over the studyeriod. Together with the spatial differences in flowering datesiscussed, convergence in flowering date trends would further sug-est that local environmental factors are increasingly determininghe timing of flowering at these localities, potentially resulting inn eventual common flowering date across citrus types. As flow-ring dates for each of the cities continue to fall within a smallemporal range, this converging trend alone is unlikely to haveubstantial impacts on production, but should be monitored tonform agricultural planning and the projection of harvest dates.he convergence in citrus flowering date trends over the 51-yeartudy period, tentatively suggests a shift towards environmentalonditions suitable to the collective group of citrus. However, theivergence in sour lemon and sour orange trends in Shiraz, andf sweet lemon and sour lemon trends in Kerman, do not supporthis argument. Spatio-temporal patterns of convergence and diver-ence in phenophase trends between related species in a singleocation are not discussed in the phenology literature, and requireurther analysis using longer time series, and should be explored inxisting phenological datasets elsewhere.
.3. Implications for Iranian citrus agriculture
Consistent with the phenology–climate change literature, ratesf citrus phenophase shift and their responses to changing climatearrant concern for the agricultural sector. Progressive advances
nd delays in flowering pose considerable threats to individualitrus trees, and to the continued viability of citrus agriculturen Iran. Early flowers and buds, as are increasingly observed forerman and Shiraz, have a significantly higher likelihood of frostamage and premature flower-fall, whereas late flowers, whichould increasingly occur with delays in peak flowering observed
n Gorgan, have increased risk of heat stress and wilting (Cannell Smith, 1986; Rigby & Porporato, 2008; Fitchett et al., 2014). Inarticular, this poses serious threats for citrus in Kerman, givenhat high aridity permits a large number of frost days in late win-er, and an increasing frequency of threshold temperatures beingxceeded throughout summer (Fitchett et al., 2014). Furthermore,t is unlikely that the reported climate changes would have affectednly the peak flowering dates, but also other temperature-relatedhenophases, such as the subsequent timing of fruit set and harvest,nd potentially the quality of yields (see also Beaubien & Freeland,000; Kafaki et al., 2009). For Gorgan, this poses a threat of either aecrease in the length of the reproductive period, should the datef fruit maturation remain unchanged, or the risk of early winterrost to crops prior to harvest (Menzel, 2002).
Flowering date shifts in either direction pose risks to successfulollination (Fitter & Fitter, 2002; Hegland et al., 2009). Pollinators,uch as bees for citrus, and the plants required for cross-pollination,ay not necessarily respond in the same direction, or by the
ame magnitude, to regional climate change (Fitter & Fitter, 2002;egland et al., 2009; Moghadam et al., 2009). Shifts in plant pheno-
ogy can also increasingly expose plants to pests, particularly wherehe timing of applying pesticides has not adjusted accordingly, orhere warmer (or more/less humid) climates are better suited toest growth (Gordo & Sanz, 2005). These increased risks of frost
eteorology 198–199 (2014) 285–293
damage, unsuccessful pollination, and increased exposure to pests,provide a set of threats to citrus production in Iran throughoutthe growing season. As a major citrus producer, this raises concernfor the global citrus industry (Abbasi et al., 2005; UNCTAD, 2005).Moreover, as Iran uses the majority of its agricultural produce fordomestic consumption, there are also likely impacts on regionalfood security (Abbasi et al., 2005). Whilst the drivers of these envi-ronmental impacts cannot easily be addressed, understanding thenature of plant responses, both directly to temperature and precipi-tation changes, and indirectly to the consequent impacts associatedwith pollination, pests and frost, may facilitate adaptation.
5. Conclusions
The considerable locational variation in citrus phenophase shiftsand their responses to climate change in the cities of Gorgan,Kerman and Shiraz, highlight the importance of establishing ahigher density of fruit phenological monitoring sites within givenregions. In particular, the strong contrast between advancing peakflowering dates in Kerman and Shiraz, and the less commonlyobserved delayed flowering dates in Gorgan, illustrate the sig-nificance of local environmental drivers. Caution is thus requiredwhen attempting to project phenological responses, and associatedindustry impacts, at regional spatial scales.
Little variation in peak flowering dates, or in phenophase shifts,is recorded between citrus types in each city over the study period,yet the existing variation is sufficient to support a gradual andpreviously unreported tendency towards convergence in trends ofpeak flowering dates. Our study covers five hybrids of the Citrusgenus and so does not preclude genus or species variation in pheno-logical response in Iran, but rather highlights important similaritieswithin the genus and species group.
Acknowledgements
We thank the Iranian Meteorological Organization for provid-ing climate data, and Mohit Sabz for the phenology data. Fundingfor this project was generously provided by the National ResearchFoundation of South Africa. We thank the anonymous reviewer forinsightful comments which have helped improve the paper.
References
Abbasi, S., Zandi, P., Mirbagheri, E., 2005. Quantitation of limonin in Iranian orangejuice concentrates using high-performance liquid chromatography and spec-trophotometric methods. Eur. Food Res. Technol. 221, 202–207.
Ahas, R., Aasa, A., Menzel, A., Fedotova, V.G., Scheifinger, H., 2002. Changes in Euro-pean spring phenology. Int. J. Climatol. 22, 1727–1738.
Badeck, F.W., Bondeau, A., Böttcher, K., Doktor, D., Lucht, W., Schaber, J., Sitch, S.,2004. Responses of spring phenology to climate change. N. Phytol. 162, 295–309.
Beaubien, E.G., Freeland, H.J., 2000. Spring phenology trends in Alberta, Canada: linksto ocean temperature. Int. J. Biometeorol. 44, 53–59.
Campoy, J.A., Ruiz, D., Nortes, M.D., Egea, J., 2013. Temperature efficiency for dor-mancy release in apricot varies when applied at different amounts of chillaccumulation. Plant Biol. 15, 28–35.
Cannell, M.G.R., Smith, R.I., 1986. Climatic warming, spring budburst and frost dam-age on trees. J. Appl. Ecol. 23, 177–191.
CGASA (Citrus Growers’ Association of South Africa), 2011. Key industry statisticsfor citrus growers. Citrus Growers’ Association of South Africa, pp. 38.
Connellan, J., Hardy, S., Sanderson, G., Wangdi, P., 2010. Production Guide forMandarin Orchards in Bhutan. Australian Centre for International AgriculturalResearch, Canberra, pp. 1–21.
Fitchett, J.M., Grab, S.W., Thompson, D.I., Roshan, G., 2014. Increasing frost riskassociated with advanced citrus flowering dates in Kerman and Shiraz, Iran:1960–2010. Int. J. Biometeorol., http://dx.doi.org/10.1007/s00484-013-0778-0.
Fitter, A.H., Fitter, R.S.R., 2002. Rapid changes in flowering time in British plants.Science 296, 1689–1691.
García-Luís, A., Kanduser, M., Santamarina, P., Guardiola, J.L., 1992. Low temperatureinfluence on flowering in Citrus. The separation of inductive and bud dormancyreleasing effects. Physiol. Plant. 86, 648–652.
Gholipoor, M., 2008. Comparative evaluating the climate-related run-off productionin slopped-farms of Iran, using simulation. Asian J. Agric. Res. 2 (2), 45–55.

rest M
G
G
G
H
I
K
K
K
L
M
M
M
M
M
M
P
P
Wielgolaski, F.E., 2003. Climatic factors governing plant phenological phases along
J.M. Fitchett et al. / Agricultural and Fo
ordo, O., Sanz, J.J., 2005. Phenology and climate change: a long-term study in aMediterranean locality. Oecologia 146, 484–495.
rab, S., Craparo, A., 2011. Advance of apple and pear tree full bloom dates inresponse to climate change in the southwestern Cape, South Africa: 1973–2009.Agric. Forest Meteorol. 151, 406–413.
uo, L., Dai, J., Ranjitkar, S., Xu, J., Luedeling, E., 2013. Response of chestnut phenologyin China to climate variation and change. Agric. Forest Meteorol. 180, 164–172.
egland, S.J., Nielsen, A., Lázaro, A., Bjerknes, A.L., Totland, Ø., 2009. How does cli-mate warming affect plant–pollinator interactions? Ecol. Lett. 12, 184–195.
nouye, D.W., 2008. Effects of climate change on phenology, frost damage, and floralabundance of montane wildflowers. Ecology 89 (2), 353–362.
afaki, S.B., Mataji, A., Hashemi, S.A., 2009. Monitoring growing season length ofdeciduous broadleaf forest derived from satellite data in Iran. Am. J. Environ.Sci. 5 (5), 647–652.
eatley, M.R., Hudson, I.L., 2012. Detecting change in an Australian flowering record:comparisons of linear regression and cumulative sum analysis change pointanalysis. Austral Ecol. 37 (7), 825–835.
ehl, M., 2009. Quaternary climate change in Iran – the state of knowledge. Erdkunde63 (1), 1–17.
uedeling, E., Gassner, A., 2012. Partial least squares regression for analysing walnutphenology in California. Agric. Forest Meteorol. 158, 43–52.
enzel, A., 2002. Phenology: its importance to the global change community. Aneditorial comment. Clim. Change 54, 379–385.
enzel, A., Sparks, T.H., Estrella, N., Koch, E., Aasa, A., Ahas, R., Alm-Kübler, A., Bis-solli, P., Braslavská, O., Briede, A., Chmielewski, F.M., Crepinsek, Z., Curnel, Y.,Dahl, Å., Defila, C., Donnelly, A., Filella, Y., Jatczak, K., Måge, F., Mestre, A., Nordli,Ø., Penuelas, J., Pirinen, P., Remisová, V., Scheifinger, H., Striz, M., Susnik, A.,Van Vliet, A.J.H., Wielgolaski, F.E., Zach, S., Zust, A., 2006. European phenologicalresponse to climate change matches the warming pattern. Glob. Change Biol.12, 1969–1976.
iller-Rushing, A.J., Primack, R.B., 2008. Global warming and flowering times inThoreau’s Concord: a community perspective. Ecology 89 (2), 332–341.
iller-Rushing, A.J., Inouye, D.W., Primack, R.B., 2008. How well do first floweringdates measure plant responses to climate change? The effects of population sizeand sampling frequency. J. Ecol. 96, 1289–1296.
odarres, R., de Paulo Rodrigues da Silva, V., 2007. Rainfall trends in arid and semi-arid regions of Iran. J. Arid Environ. 70, 344–355.
oghadam, E.G., Hosseini, P., Mokhtarian, A., 2009. Blooming phenology and self-incompatibility of some commercial cherry (Prunus avium L.) cultivars in Iran.Sci. Hortic. 123, 29–33.
armesan, C., 2007. Influences of species, latitudes and methodologies on estimatesof phenological response to climate warming. Glob. Change Biol. 13, 1860–1872.
rimack, R.B., Ibánez, I., Higuchi, H., Lee, S.D., Miller-Rushing, A.J., Wilson, A.M., Silan-der, J.A., 2009. Spatial and interspecific variability in phenological responses towarming temperatures. Biol. Conserv. 142, 2569–2577.
eteorology 198–199 (2014) 285–293 293
Rigby, J.R., Porporato, A., 2008. Spring frost risk in a changing climate. Geophys. Res.Lett. 35, 12703–12707.
Rosenzweig, C., Phillips, J., Goldberg, R., Carroll, J., Hodges, T., 1996. Potential impactsof climate change on citrus and potato production in the US. Agric. Syst. 52,455–479.
Rötzer, T., Wittenzeller, M., Haeckel, H., Nekovar, J., 2000. Phenology in centralEurope – differences and trends of spring phenophases in urban and rural areas.Int. J. Biometeorol. 44, 60–66.
Ruml, M., Vulic, T., Ðor –devic, B., 2011. The effect of altitude and latitude on thephenology of the plum cv. Pozegaca in Serbia. In: The 46th Croatian and 6thInternational Symposium on Agriculture, Opatija, Croatia, pp. 1052–1055 (con-ference paper).
Schwartz, M.D., Hanes, J.M., 2010. Continental-scale phenology: warming and chil-ling. Int. J. Climatol. 30, 1595–1598.
Sharifan, H., Saffar, M., Movahedi, N., Asady, M.M., 2010. Evaluation of relation-ship between soil and air temperatures in semi-wet climate. Geophys. Res. 12,14547.
Siebert, S., Ewert, F., 2012. Spatio-temporal patterns of phenological developmentin Germany in relation to temperature and day length. Agric. Forest Meteorol.152, 44–57.
Southwick, S.M., Davenport, T.L., 1986. Characterization of water stress andlow temperature effects on flower induction in citrus. Plant Physiol. 81,26–29.
Sparks, T.H., Jeffree, E.P., Jeffree, C.E., 2000. An examination of the relationshipbetween flowering times and temperature at the national scale using long-termphenological records from the UK. Int. J. Biometeorol. 44, 82–87.
Srivastava, A.K., Singh, S., Huchche, A.D., 2000. An analysis on citrus flowering – areview. Agric. Rev. 21 (1), 1–15.
Tan, F.C., Swain, S.M., 2006. Genetics of flower initiation and development in annualand perennial plants. Physiol. Plant. 128, 8–17.
UNCTAD, 2005. Citrus fruit market. In: Market Information in the Commodities Area,Retrieved from: http://r0.uctad.org/infocomm/anglais/orange/market.htm(26.10.12).
Walther, G.R., Post, E., Convey, P., Menzel, A., Parmesan, C., Beebee, T.J.C., Fromentin,J.M., Hoegh-Guldberg, O., Bairlein, F., 2002. Ecological responses to recent cli-mate change. Nature 416, 389–395.
Wang, H.L., Gan, Y.T., Wang, R.Y., Niu, J.Y., Zhao, H., Yang, Q.G., Li, G.C., 2008. Pheno-logical trends in winter wheat and spring cotton in response to climate changesin northwest China. Agric. Forest Meteorol. 148, 1242–1251.
a Norwegian fjord. Int. J. Biometeorol. 47, 213–220.Zavalloni, C., Andresen, J.A., Flore, J.A., 2006. Phenological models of flower bud
stages and fruit growth of ‘Montmorency’ sour cherry based on growing degree-day accumulation. J. Am. Soc. Hortic. Sci. 131 (5), 601–607.