Monitoring dietary change in populations and the need for specific food targets; lessons from the...
10
Journal of Human Nutrition and Dietetics (1995), 8, 119-128 Monitoring dietary change in populations and the need for specific food targets; lessons from the North West Thames Regional Health Survey M. Davenport, P. Roderick, L. Elliott,* C. Victort and C. Geissler* North West Thames Regional Health Authority, Paddington, London, UK Dietary goals are usually expressed in the form of consumption of absolute quantities of specific nutrients. Translating such information into food patterns is difficult. Consequently it is not easy to convey these goals in the promotion of a healthy diet or to monitor dietary change in populations. This paper explores the difficulties and advantages of a food frequency questionnaire approach as used in a large regional health survey to describe food patterns and hence to monitor change in relation to dietary variables. There was considerable variation in the frequency of consumption of individual foods between different sub-groups in the population and these were as expected. To assess the overall diet a composite dietary index was proposed. The index score was significantly associated with various socio-demographic and lifestyle variables. Unhealthy lifestyles were associated with low scores (i.e. an ‘unhealthy’ diet) on the index indicating a measure of validity. However there were several limitations in the food frequency questionnaire method used: neither the questionnaire nor simple global indices of a ‘healthy’ diet derived from the questions used had been validated against a more robust quantifiable measure of diet; some of the questions were not specific for population groups of interest; some questions grouped foods in categories that masked differences in consumption and several did not correspond to recent food targets; and finally there was no energy adjustment, which meant that the obese appeared to have a healthy dietary pattern. The use of a valid set of food frequency questions as an efficient and practical way of monitoring a population’s diet by survey is suggested. The questions must be validated against reliable measures of nutrients, and be compatible with food targets based on nutritional recommendations. Key words: dietary surveys, food frequency questionnaire, food targets, monitoring diet Introduction The importance of the Western diet in the aetiology of many adult chronic diseases, such Correspondence: Prof. C. Geissler, Department of Nutrition & Dietetics, King’s College London, University of London, Campden Hill Road, Lon- don Wa 7AH, UK. *Dacorum and St Albans Community NHS Trust, Hertfordshire, UK. ‘Kensington, Chelsea & Westminster Health Agency, London, UK. *Kings College, London, UK. as coronary heart disease, is well recognized [WHO, 1990). Several reports have set target intakes for the major nutrients, such as dietary fat and non-starch polysaccharides (fibre) with the aim of reducing this chronic disease burden [WHO, 1990; DOH, 1991). In the UK, coronary heart disease (CHD) is now a priority area in the Health of the Nation [HOTN) strategy. National targets have been set for reductions in CHD mortality (Secretary of State for Health, 1991), in the percentage of total and saturated fat energy consumption and in body mass index (BMI). Possible ways in which average diets 119
-
Upload
independent -
Category
Documents
-
view
2 -
download
0
Transcript of Monitoring dietary change in populations and the need for specific food targets; lessons from the...
Journal of Human Nutrition a n d Dietetics (1995), 8, 119-128
Monitoring dietary change in populations and the need for specific food targets; lessons from the North West Thames Regional Health Survey
M. Davenport, P. Roderick, L. Elliott,* C. Victort and C. Geissler* North West Thames Regional Health Authority, Paddington, London, UK
Dietary goals are usually expressed in the form of consumption of absolute quantities of specific nutrients. Translating such information into food patterns is difficult. Consequently it is not easy to convey these goals in the promotion of a healthy diet or to monitor dietary change in populations. This paper explores the difficulties and advantages of a food frequency questionnaire approach as used in a large regional health survey to describe food patterns and hence to monitor change in relation to dietary variables. There was considerable variation in the frequency of consumption of individual foods between different sub-groups in the population and these were as expected. To assess the overall diet a composite dietary index was proposed. The index score was significantly associated with various socio-demographic and lifestyle variables. Unhealthy lifestyles were associated with low scores (i.e. an ‘unhealthy’ diet) on the index indicating a measure of validity. However there were several limitations in the food frequency questionnaire method used: neither the questionnaire nor simple global indices of a ‘healthy’ diet derived from the questions used had been validated against a more robust quantifiable measure of diet; some of the questions were not specific for population groups of interest; some questions grouped foods in categories that masked differences in consumption and several did not correspond to recent food targets; and finally there was no energy adjustment, which meant that the obese appeared to have a healthy dietary pattern. The use of a valid set of food frequency questions as an efficient and practical way of monitoring a population’s diet by survey is suggested. The questions must be validated against reliable measures of nutrients, and be compatible with food targets based on nutritional recommendations.
Key words: dietary surveys, food frequency questionnaire, food targets, monitoring diet
Introduction
The importance of the Western diet in the aetiology of many adult chronic diseases, such
Correspondence: Prof. C. Geissler, Department of Nutrition & Dietetics, King’s College London, University of London, Campden Hill Road, Lon- don Wa 7AH, UK.
*Dacorum and St Albans Community NHS Trust, Hertfordshire, UK.
‘Kensington, Chelsea & Westminster Health Agency, London, UK.
*Kings College, London, UK.
as coronary heart disease, is well recognized [WHO, 1990). Several reports have set target intakes for the major nutrients, such as dietary fat and non-starch polysaccharides (fibre) with the aim of reducing this chronic disease burden [WHO, 1990; DOH, 1991). In the UK, coronary heart disease (CHD) is now a priority area in the Health of the Nation [HOTN) strategy. National targets have been set for reductions in CHD mortality (Secretary of State for Health, 1991), in the percentage of total and saturated fat energy consumption and in body mass index (BMI). Possible ways in which average diets
119
120 M. Davenport et al.
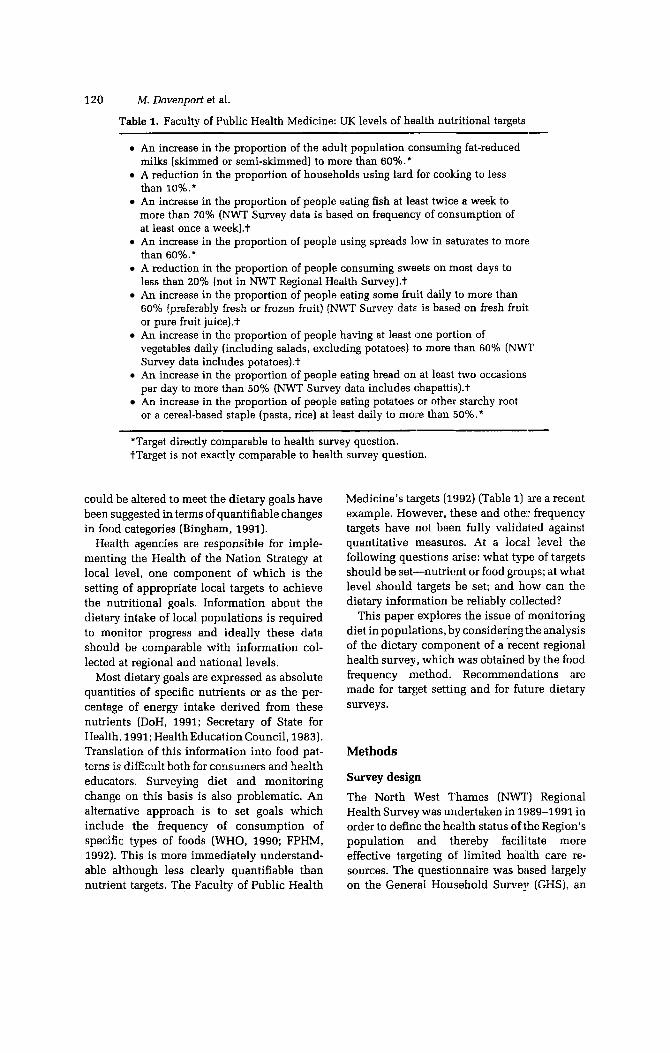
Table 1. Faculty of Public Health Medicine: UK levels of health nutritional targets
An increase in the proportion of the adult population consuming fat-reduced
A reduction in the proportion of households using lard for cooking to less
An increase in the proportion of people eating fish at least twice a week to
milks [skimmed or semi-skimmed) to more than 60%.*
than lo%.*
more than 70% [NWT Survey data is based on frequency of consumption of at least once a week).t An increase in the proportion of people using spreads low in saturates to more than So%.* A reduction in the proportion of people consuming sweets on most days to less than 20% (not in NWT Regional Health Survey).t An increase in the proportion of people eating some fruit daily to more than 60% (preferably fresh or frozen fruit) (NWT Survey data! is based on fresh fruit or pure fruit juice).t
vegetables daily [including salads, excluding potatoes) to more than 60% (NWT Survey data includes potatoes).t
per day to more than 50% [NWT Survey data includes chapattis).t
or a cereal-based staple [pasta, rice) at least daily to more than SO%.*
An increase in the proportion of people having at least tone portion of
An increase in the proportion of people eating bread on at least two occasions
An increase in the proportion of people eating potatoes or other starchy root
*Target directly comparable to health survey question. tTarget is not exactly comparable to health survey question.
could be altered to meet the dietary goals have been suggested in terms of quantifiable changes in food categories (Bingham, 1991).
Health agencies are responsible for imple- menting the Health of the Nation Strategy at local level, one component of which is the setting of appropriate local targets to achieve the nutritional goals. Information about the dietary intake of local populations is required to monitor progress and ideally these data should be comparable with information col- lected at regional and national levels.
Most dietary goals are expressed as absolute quantities of specific nutrients or as the per- centage of energy intake derived from these nutrients (DOH, 1991; Secretary of State for Health, 1991; HealthEducation Council, 1983). Translation of this information into food pat-
Medicine’s targets (1992) (Table 1) ,are a recent example. However, these and other frequency targets have not been fully validated against quantitative measures. At a local level the following questions arise: what type of targets should be set--nutrient or food groups; at what level should targets be set; and how can the dietary information be reliably colllected?
This paper explores the issue of monitoring diet in populations, by considering the analysis of the dietary component of a recent regional health survey, which was obtained by the food frequency method. Recommendations are made for target setting and for future dietary surveys.
Methods terns is difficult both for consumers and health educators. Surveying diet and monitoring change on this basis is also problematic. An The North ‘West Thames (NWT) Regional alternative approach is to set goals which Health Surve:y was undertaken in 1989-1991 in include the frequency of consumption of order to define the health status of the Region’s specific types of foods (WHO, 1990; FPHM, population and thereby facilitate more 1992). This is more immediately understand- effective targeting of limited health care re- able although less clearly quantifiable than sources. The questionnaire was based largely nutrient targets. The Faculty of Public Health on the General Household Survey (GHS), an
design
Monitoring dietary change 121
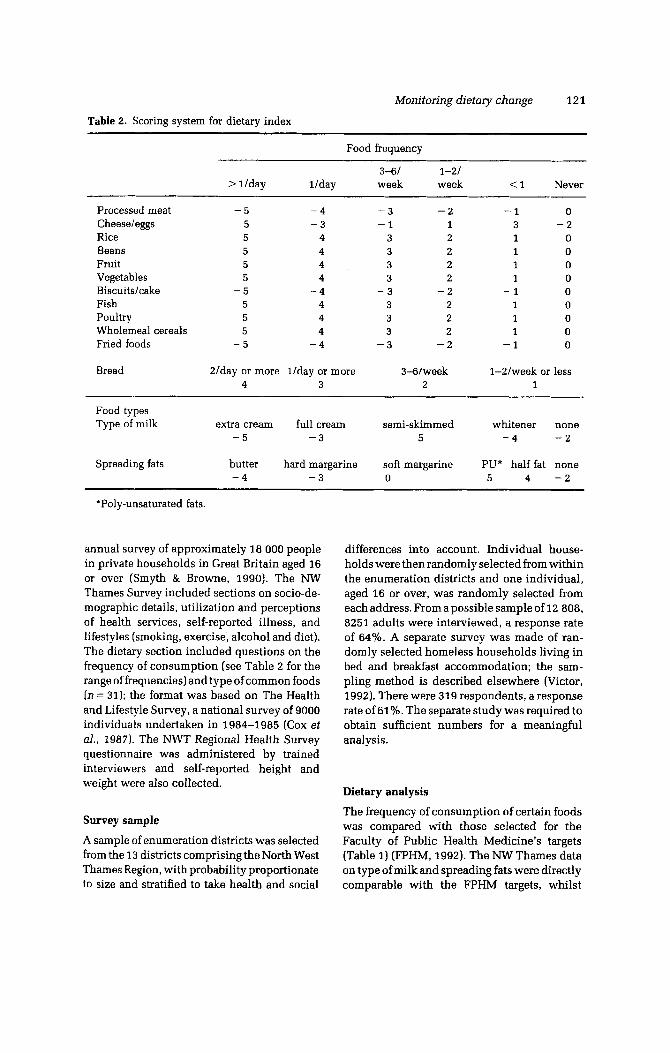
Table 2. Scoring system for dietary index ~~
Food frequency
3-61 1-21 > llday llday week week < 1 Never
Processed meat Cheeseleggs Rice Beans Fruit Vegetables Biscuits/cake Fish Poultry Wholemeal cereals Fried foods
Bread
- 5 -4 - 5 - 3
5 4 5 4 5 4 5 4
- 5 -4 5 4 5 4 5 4
- 5 -4
2/day or more llday or more 4 3
- 3 - 2 -1 1
3 2 3 2 3 2 3 2
- 3 - 2 3 2 3 2 3 2
- 3 - 2
34week 2
-1 0 3 - 2 1 0 1 0 1 0 1 0
-1 0 1 0 1 0 1 0
-1 0
1-2lweek or less 1
Food types Type of milk extra cream full cream semi-skimmed whitener none
- 5 - 3 5 -4 -2
Spreading fats butter hard margarine soft margarine PU* half fat none -4 -3 0 5 4 - 2
*Poly-unsaturated fats.
annual survey of approximately 18 000 people in private households in Great Britain aged 16 or over (Smyth & Browne, 1990). The NW Thames Survey included sections on socio-de- mographic details, utilization and perceptions of health services, self-reported illness, and lifestyles (smoking, exercise; alcohol and diet). The dietary section included questions on the frequency of consumption (see Table 2 for the range of frequencies) and type of common foods [R = 31); the format was based on The Health and Lifestyle Survey, a national survey of 9000 individuals undertaken in 1984-1985 (Cox et al., 1987). The NWT Regional Health Survey questionnaire was administered by trained interviewers and self-reported height and weight were also collected.
Survey sample
A sample of enumeration districts was selected from the 13 districts comprisingthe North West Thames Region, with probability proportionate to size and stratified to take health and social
differences into account. Individual house- holds were then randomly selected from within the enumeration districts and one individual, aged 16 or over, was randomly selected from each address. From a possible sample of 12 808, 8251 adults were interviewed, a response rate of 64%. A separate survey was made of ran- domly selected homeless households living in bed and breakfast accommodation; the sam- pling method is described elsewhere (Victor, 1992). There were 319 respondents, a response rate of 61%. The separate study was required to obtain sufficient numbers for a meaningful analysis.
Dietary analysis
The frequency of consumption of certain foods was compared with those selected for the Faculty of Public Health Medicine’s targets (Table 1) (FPHM, 1992). The NW Thames data on type of milk and spreading fats were directly comparable with the FPHM targets, whilst
122 M. Davenport et al.
some food types and their frequencies of consumption were not specified in exactly the same manner. The NW Thames survey did not ask specifically about the intake of lard, sweets or potatoeslpasta, all separate FPHM targets.
A dietary ‘index’ measure was constructed by selecting a limited range of 14 foods, chosen to represent ‘healthy’ choices. Consumption of these foods was scored so that a ‘healthy’ eating pattern had a high score (Table 21. Foods regarded as ‘healthy’ were scored 0 to 5 and ‘unhealthy’ foods were scored - 5 to 0. Type of milk and spreading fats were scored to reflect their saturated fat content, from - 5 to 5. Cheeseleggs were scored so that non-consump- tion was similar to over-consumption. The index was the sum of the individual food scores.
A second index was constructed with a wider range of foods high in saturated fat or sugar (e.g. chocolate, soft drinks, sugar in tea or coffee, and beef, lamb, pork, ham and bacon), scored inversely to frequency of eating. However, this did not materially alter the conclusions drawn from the first index and so only the data from the first are presented.
The percentage of the population consuming individual foods were analysed by age and sex, ethnic group socio-economic group (SEG), edu- cational attainment, alcohol consumption, smoking, frequency of exercise, and BMI. The homeless sample was analysed separately (Table 3).
The percentages in the top and bottom quartiles of the dietary index score and the mean score for each independent variable are presented (Table 4).
Definitions of non-dietary variables
The ethnic group category was self-reported using the 1991 Census question (GSS, 1992). The category ‘Other’ included Chinese, Japanese, Arabs and Whites (non-UK). Alcohol consumption was categorized as in the General Household Survey (Smyth & Browne, 1990) (Table 5).
‘Current’ and ‘Ex’ smoking categories refer to cigarettes only. Body Mass Index was catego- rized according to the Royal College of Physi- cians classification (1983) (Table 6).
‘Exercise’ was classified by this number of times respondents reported undertaking a range of activities (e.g. swimming, aerobics) in the 2 weeks prior to the interview.
Statistics
The proportion of the population categorized by various socio-demographic and lifestyle factors who achieve food targets and the mean diet score of such groups are shown with the standard error. The Analysis of Variance (ANOVA) was used to test for differences between mean diet index scores in sub-groups of the socio-demographic and lifestyle vari- ables (Table 4).
Results
Individual food fkequencies
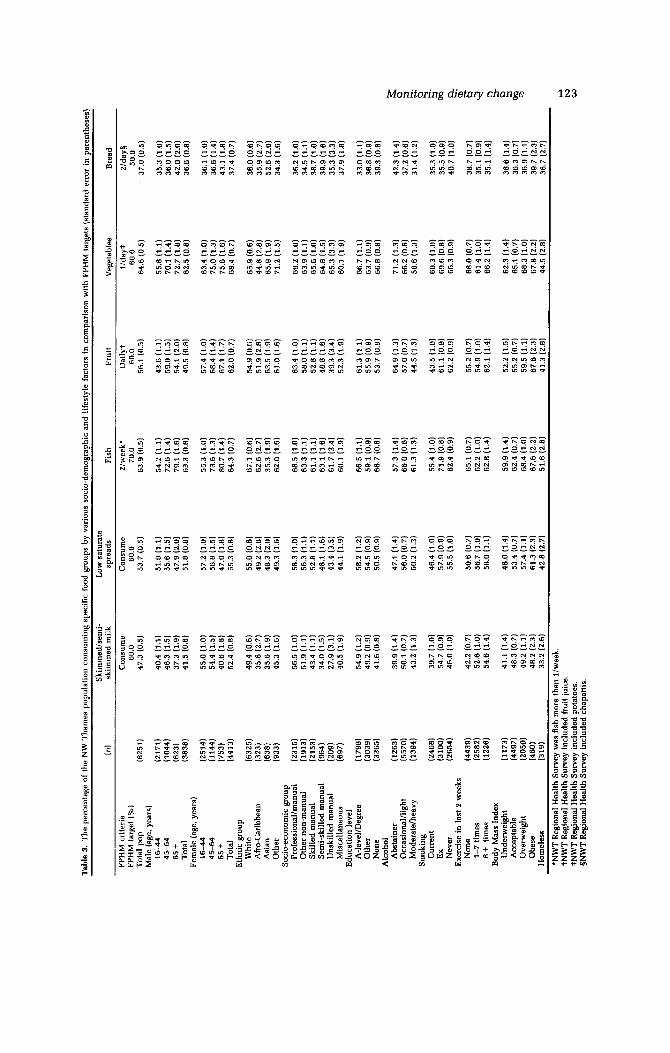
The survey population failed to meet the two FPHM targets that were directly comparable (Table 3). Only 47% and 54% consumed low fat milk and low saturated spreads respectively, compared to FPHM targets of SO% for each. This was also the case where modified criteria were used, despite the less stringent values for fruit, fish, bread and vegetables, with the exception of vegetable consumption, probably because potatoes were included within this category in i he NWT Regional Health Survey.
There wa,s considerable variatiion between population sub-groups in the percentages meet- ing the criteria for fruit, type of milk, fish and spreading fats. For example, 63% of the pro- fessional/managerial socio-economic group re- ported eating fruit or having fruit juice daily compared to 39% of the unskilled manual socio-economic group; the respeictive figures for current and non-smokers were 44% and 62%. In contrast, the questions on vegetables and bread did not discriminate between groups. Better discrimination would probably have been obtained if potatoes had been classified separately and bread reported as wholemeal or white.
The groups that came consistently closest to the targets were the professiona:l/managerial and the obese groups. Young males, the lower socio-economic groups, and those with lower educational ,attainment were less likely to make
Tab
le 3.
The
per
cent
age
of t
he N
W T
ham
es p
opul
atio
n co
nsum
ing
spec
ific
food
gro
ups
by v
ario
us s
ocio
-dem
ogra
phic
and
lif
esty
le f
acto
rs i
n co
mpa
riso
n w
ith
FPH
M ta
rget
s (s
tand
ard
erro
r in
par
enth
eses
)
Skim
med
lsem
i-
Low
sat
urat
e (n
) sk
imm
ed m
ilk
spre
ads
Fish
Fr
uit
Vee
etab
les
Bre
ad
FPH
M c
rite
ria
FPH
M ta
rget
(56
) T
otal
pop
M
ale
(age
, yea
rs)
16-4
4 4
54
4
65 +
Tot
al
Fem
ale
(age
, yea
rs)
16-4
4 45
-64
65 +
Tot
al
Whi
te
Afr
o-C
arib
bean
A
sian
O
ther
So
cio-
econ
omic
gro
up
Prof
essi
onal
lman
ual
Oth
er n
on-m
anua
l Sk
illed
man
ual
Sem
i-sk
illed
man
ual
Uns
kille
d m
anua
l M
isce
llane
ous
A-1
evel
lDeg
ree
Oth
er
Non
e A
lcoh
ol
Abs
tain
er
Occ
asio
nalll
ight
M
oder
atel
heav
y
Cur
rent
Ex
N
ever
Non
e 1-
7 ti
mes
8
+ t
imes
B
ody
Mas
s In
dex
Und
erw
eigh
t A
ccep
tabl
e 0
v e rw e
i g h t
O
bese
Eth
nic
grou
p
Edu
catio
n le
vel
Smok
ing
Exe
rcis
e in
last
2 w
eeks
(625
1)
(217
1)
(104
4)
(623
) (3
638)
(251
4)
(114
4)
(753
) (4
413)
(632
5)
(323
) (638)
(933
)
(231
5)
(191
3)
(215
3)
(964
1 12
091
(697
)
(179
8)
(303
9)
(336
5)
(126
3)
(557
0)
(139
4)
(246
8)
(310
0)
(265
4)
(443
9)
(258
2)
(122
6)
(117
3)
(449
7)
(205
0)
(460
)
Con
sum
e 6
0.0
47
.3 (
0.5)
40.4
(1
.1)
46.3
(1.
5)
41.5
(0
.8)
55.0
(1.0
) 54
.4 (
1.5)
40
.6 (
1.8)
52
.4 (
0.8)
49.4
(0.
6)
35.6
(2.
7)
35.6
(1.
9)
45.3
(1.
6)
56.5
(1.
0)
51.9
(1.1
)
34.0
(1.
5)
27.9
(3.
1)
40.5
(1.
9)
37.3
(1.
9)
43.4
(1.1
)
54.9
(1.
2)
49.2
(0.
9)
41.6
(0.
6)
39.9
(1.
4)
50.1
(0.
7)
43.2
(1.
3)
39.7
(1.0
) 54
.7 (
0.9)
46
.0 (
1.0)
42.2
(0.
7)
52.6
(1.0
) 54
.6 (
1.4)
41.1
(1.
4)
46.3
(0.
7)
49.2
(1.1
) 46
.2 (
2.3)
Con
sum
e 60
.0
53.7
(0.
5)
51.0
(1.1
) 55
.6 (
1.5)
47
.9 (
2.0)
51
.8 (
0.8
)
57.2
(1.0
) 56
.8 (
1.5)
47
.0 (
1.8
) 55
.3 (
0.6)
55.0
(0.
6)
49.2
(2.
6)
48.3
(2.
0)
49.3
(1.
6)
58.3
(1.
0)
56.3
(1.1
) 52
.8 (1.1
) 48
.1 (
1.6)
44.1
(1.
9)
58.2
(1.
2)
50.5
(0.
9)
47.1
(1.
4)
56.0
(0.
7)
50.2
(1.
3)
46.4
(1.0
)
43.4
(3.
5)
54.5
(0.
9)
57.9
(0.
9)
55.5
(1.
0)
50.6
(0.
7)
56.7
(1.
0)
56.0
(1.1
)
Z/w
eek*
70
.0
63.9
(0.
5)
54.2
(1.1
) 72
.6 (
1.4)
79
.1 (
1.6)
63
.3 (
0.8
)
55.3
(1.
0)
73.6
(1.3
) 80
.7 (
1.4)
64
.3 (
0.7)
67.1
(0
.6)
62.6
(2.
7)
35.3
(1.
9)
62.0
(1.
6)
68.5
(1.
0)
63.3
(1.1
) 6
1.1
(1.1
) 63
.1 (1
.6)
61.7
(3.
4)
60.1
(1.
9)
66.5
(1.1
) 59
.1 (
0.9)
66
.7 (
0.8
)
57.3
(1.
4)
66.0
(0.
6)
61.3
(1.
3)
55.4
(1.0)
71.9
(0.
8)
62.4
(0.
9)
65.1
(0.
7)
62.2
(1.
0)
62.8
(1.
4)
46.0
(1.
4)
59.9
(1.
4)
53.4
(0.
7)
62.4
(0.
7)
57.4
(1.1)
68.4
(1.0
) 61
.3 (
2.31
67
.6 1
2.21
Dai
lyt
60.0
56
.1 (0
.5)
43.6
(1.1
)
54.1
(2.
0)
59.0
(1.
5)
49.5
(0
.8)
57.4
(1.0
) 66
.4 (
1.4)
67
.1 (1
.7)
62.0
(0.
7)
54.9
(0
.6)
51.9
(2.
8)
63.5
(1.
9)
61.0
(1
.6)
63.4
(1.0
) 58
.0 (
1.1
) 52
.8 (
1.1
) 48
.8 (
1.6)
52.3
(1.
9)
61.3 (1
.1)
53.7
(0.
9)
64.9
(1.
3)
57.0
(0.
7)
44.5
(1.
3)
39.3
(3.
4)
55.9
(0.
9)
43.5
(1.
0)
61.1
(0.
9)
62.2
(0.
9)
55.2
(0.
7)
62.1
(1.
4)
54.9
(1.
0)
52.2
(1.
5)
55.2
(0.
7)
67.6
(2.
31
59.5
(1.1
)
tlda
yt
60.0
64
.6 (
0.5)
55.8
(1.1
) 70
.1 (
1.4)
72
.7 (
1.8
) 62
.5 (
0.8)
63.4
(1.
0)
75.0
(1.
3)
75.6
(1.
6)
68.4
(0.
7)
65.9
(0
.6)
44.8
(2.
8)
65.9
(1.
9)
71.2
(1.
5)
69.2
(1.0
) 63
.9 (1.1
) 65
.6 (
1.0
) 64
.8 (
1.5)
65
.3 (
3.3)
60
.1 (
1.9)
66.7
(1.1
) 63
.7 (
0.9)
66
.8 (
0.6)
71.2
(1.
3)
66.2
(0
.6)
58.6
(1.3
)
60.3
(1.0
) 69
.6 (
0.8
) 66
.3 (
0.9)
68.0
(0.
7)
61.4
(1.0
) 66
.2 (
1.4)
Z/da
y§
50.0
37
.0 (
0.5)
35.3 (
1.0
) 36
.0 (
1.5)
42
.0 (
2.0)
36
.6 (
0.8
)
36.1
(1.0
) 36
.6 (
1.4)
43
.1 (
1.8
) 37
.4 (
0.7)
36.0
(0
.6)
35.9
(2.
7)
52.6
(2.
0)
34.3
(1.
6)
36.2
(1.
0)
34.5
(1.1
) 38
.7 (
1.0)
39
.9 (
1.6)
35
.3 (
3.3)
37
.9 (
1.8
)
33.0
(1.1)
36.8
(0.
9)
39.3
(0
.8)
% 0 42
.3 (
1.4)
37
.2 1
0.61
!Y L
. i; 35
.3 (
1.0)
35
.5 (
0.9)
O
U
31.4
(1.
2)
g. 40
.7 (
1.0
)
38.7
(0.
7)
35.1
(0.
9)
35.1
(1.4
) %
6
38.6
(1.
4)
h
9% 62.3 (
1.4)
65
.1 (0
.7)
36.3
(0.
7)
68.3
(1.0
) 36
.9 (
1.1
) 67
.8 m
i
39.7
mi
H
omel
ess
(319)
33.2
(2.
6)
42.8
(2.
71
51.6
i2.
8)
41.3
iz.sj
44
.5 i2
.8j
36.7
{G
j
tNW
T R
egio
nal
Hea
lth S
urve
y in
clud
ed f
ruit
juic
e.
SNW
T R
qion
al H
ealth
Sur
vey
incl
uded
pot
atoe
s.
+
N
W
'NW
T R
egio
nal
Hea
lth S
urve
y w
as f
ish
mor
e th
an I
lwee
k.
fNW
T R
egio
nal
Hea
lth S
urve
y in
clud
ed c
hapa
ttis
.
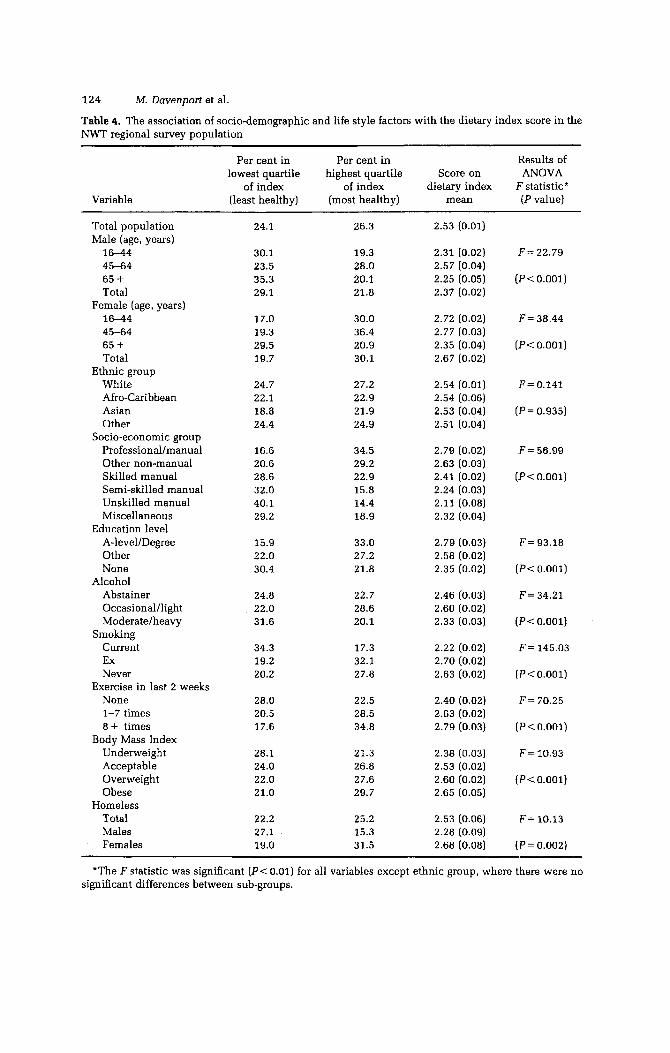
124 M. Davenport et al.
Table 4. The association of socio-demographic and life style factor!; with the dietary index score in the NWT regional survey population
Variable
Per cent in Per cent in Results of
of index of index dietary index I' statistic* lowest quartile highest quartile Score on ANOVA
(least healthy) (most healthy) mean ( P value)
Total population Male (age, years) 16-44 45-64 65 + Total
16-44
65 +
Female (age, years)
45-64
Total
White Afro-Caribbean Asian Other
Socio-economic group Professional/manual Other non-manual Skilled manual Semi-skilled manual Unskilled manual Miscellaneous
A-level/Degree Other None
Alcohol Abstainer Occasional/light Moderate/heavy
Current Ex Never
None 1-7 times 8 + times
Body Mass Index Underweight Acceptable Overweight Obese
Homeless Total Males Females
Ethnic group
Education level
Smoking
Exercise in last 2 weeks
24.1
30.1 23.5 35.3 29.1
17.0 19.3 29.5 19.7
24.7 22.1 18.8 24.4
16.6 20.6 28.6 32.0 40.1 29.2
15.9 22.0 30.4
24.8 22.0 31.6
34.3 19.2 20.2
28.0 20.5 17.6
28.1 24.0 22.0 21.0
22.2 27.1 19.0
26.3
19.3 28.0 20.1 21.8
30.0 36.4 20.9 30.1
27.2 22.9 21.9 24.9
34.5 29.2 22.9 15.8 14.4 18.9
33.0 27.2 21.8
22.7 28.6 20.1
17.3 32.1 27.8
22.5 28.5 34.8
21.3 26.8 27.6 29.7
25.2 15.3 31.5
2.53 (0.01)
2.31 (0.02) 2.57 (0.04) 2.25 (0.05) 2.37 (0.02)
2.72 (0.02) 2.77 (0.03) 2.35 (0.04) 2.67 (0.02)
2.54 (0.01) 2.54 (0.06) 2.53 (0.04) 2.51 (0.04)
2.79 (0.02) 2.63 (0.03) 2.41 (0.02) 2.24 (0.03) 2.11 (0.08) 2.32 (0.04)
2.79 (0.03) 2.58 (0.02) 2.35 (0.02)
2.46 (0.03) 2.60 (0.02) 2.33 (0.03)
2.22 (0.02) 2.70 (0.02) 2.63 (0.02)
2.40 (0.02) 2.63 (0.02) 2.79 (0.03)
2.38 (0.03)
2.60 (0.02) 2.65 (0.05)
2.53 (0.06) 2.28 (0.09) 2.68 (0.08)
2.53 (0.02)
F = 22.79
(,P< 0.001)
F = 38.44
(,P< 0.001)
F= 0.141
(P = 0.935)
F = 56.99
( P < 0.001)
F = 93.18
( P < 0.001)
F = 34.21
(P<O.OOl)
F = 145.03
(P<O.OOl)
F = 70.25
(P < 0.001)
F = 10.93
( P < O . O O l )
F = 10.13
( P = 0.002)
*The F statistic was significant (P< 0.01) for all variables excepi. ethnic group, where there were no significant differences between sub-groups.
Monitoring dietary change 125
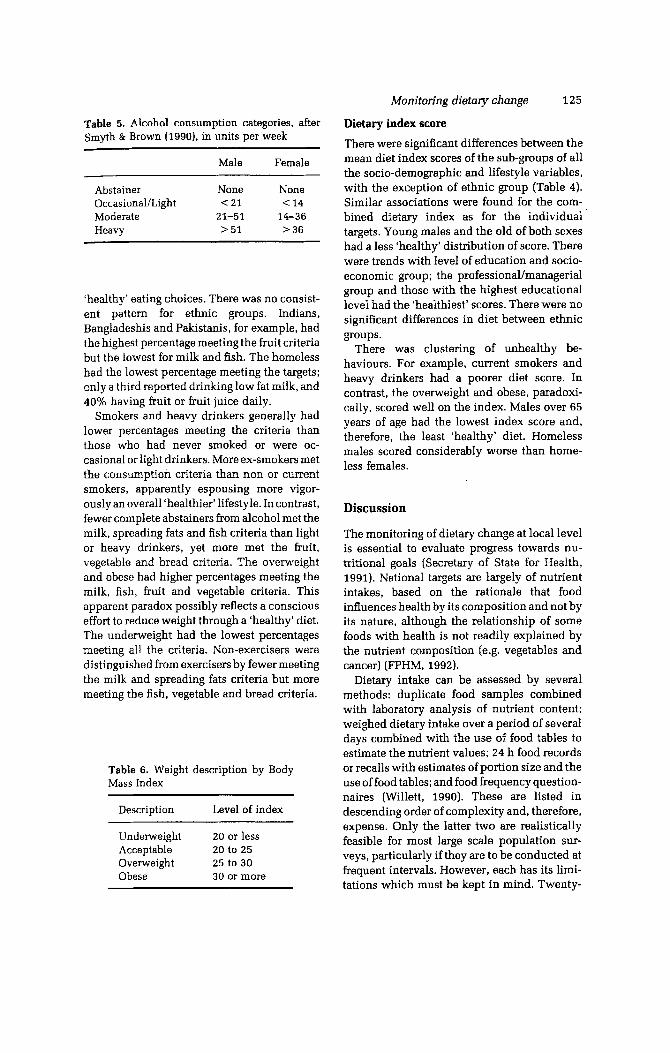
Dietary index score There were significant differences between the mean diet index scores of the sub-groups of all the socio-demographic and lifestyle variables, with the exception of ethnic group (Table 4). Similar associations were found for the com- bined dietary index as for the individual targets. Young males and the old of both sexes had a less ‘healthy’ distribution of score. There were trends with level of education and socio- economic group; the professional/managerial group and those with the highest educational level had the ‘healthiest’ scores. There were no significant differences in diet between ethnic groups.
There was clustering of unhealthy be- haviours. For example, current smokers and heavy drinkers had a poorer diet score. In contrast, the overweight and obese, paradoxi- cally, scored well on the index. Males over 65 years of age had the lowest index score and, therefore, the least ‘healthy’ diet. Homeless males scored considerably worse than home- less females.
Table 5. Alcohol consumption categories, after Smyth & Brown (1990), in units per week
Male Female
Abstainer None None Occasional/Light < 21 < 14 Moderate 21-51 14-36 Heavy > 51 > 36
‘healthy’ eating choices. There was no consist- ent pattern for ethnic groups. Indians, Bangladeshis and Pakistanis, for example, had the highest percentage meeting the fruit criteria but the lowest for milk and fish. The homeless had the lowest percentage meeting the targets; only a third reported drinking low fat milk, and 40% having fruit or fruit juice daily.
Smokers and heavy drinkers generally had lower percentages meeting the criteria than those who had never smoked or were oc- casional or light drinkers. More ex-smokers met the consumption criteria than non or current smokers, apparently espousing more vigor- ously an overall ‘healthier’ lifestyle. In contrast, fewer complete abstainers from alcohol met the milk, spreading fats and fish criteria than light or heavy drinkers, yet more met the fruit, vegetable and bread criteria. The overweight and obese had higher percentages meeting the milk, fish, fruit and vegetable criteria. This apparent paradox possibly reflects a conscious effort to reduce weight through a ‘healthy’ diet. The underweight had the lowest percentages meeting all the criteria. Non-exercisers were distinguished bom exercisers by fewer meeting the milk and spreading fats criteria but more meeting the fish, vegetable and bread criteria.
Table 6. Weight description by Body Mass Index
Description Level of index
Underweight 20 or less Acceptable 20 to 25 Overweight 25 to 30 Obese 30 or more
Discussion
The monitoring of dietary change at local level is essential to evaluate progress towards nu- tritional goals (Secretary of State for Health, 1991). National targets are largely of nutrient intakes, based on the rationale that food influences health by its composition and not by its nature, although the relationship of some foods with health is not readily explained by the nutrient composition (e.g. vegetables and cancer) (FPHM, 1992).
Dietary intake can be assessed by several methods: duplicate food samples combined with laboratory analysis of nutrient content; weighed dietary intake over a period of several days combined with the use of food tables to estimate the nutrient values; 24 h food records or recalls with estimates of portion size and the use of food tables; and food frequency question- naires (Willett, 1990). These are listed in descending order of complexity and, therefore, expense. Only the latter two are realistically feasible for most large scale population sur- veys, particularly if they are to be conducted at frequent intervals. However, each has its limi- tations which must be kept in mind. Twenty-
126 M. Davenport et al.
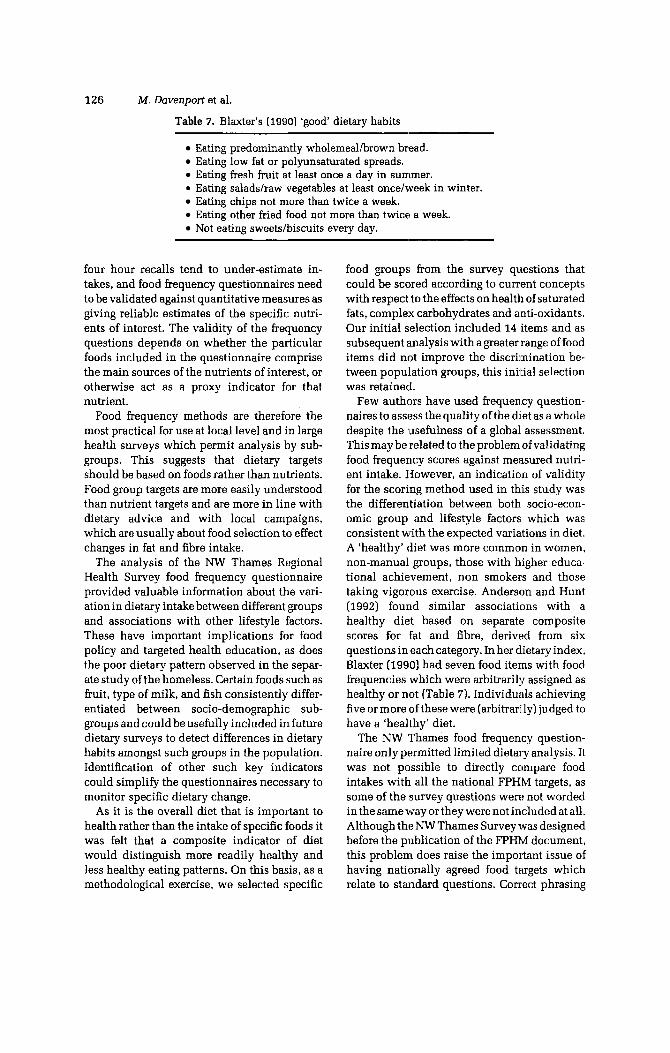
Table 7. Blaxter’s (1990) ‘good’ dietary habits
Eating predominantly wholemeallbrown bread. Eating low fat or polyunsaturated spreads. Eating fresh fruit at least once a day in surruner.
Eating chips not more than twice a week. Eating other fried food not more than twice a week. Not eating sweets/biscuits every day.
Eating saladdraw vegetables at least oncelweek in winter.
four hour recalls tend to under-estimate in- takes, and food frequency questionnaires need to be validated against quantitative measures as giving reliable estimates of the specific nutri- ents of interest. The validity of the frequency questions depends on whether the particular foods included in the questionnaire comprise the main sources of the nutrients of interest, or otherwise act as a proxy indicator for that nutrient.
Food frequency methods are therefore the most practical for use at local level and in large health surveys which permit analysis by sub- groups. This suggests that dietary targets should be based on foods rather than nutrients. Food group targets are more easily understood than nutrient targets and are more in line with dietary advice and with local campaigns, which are usually about food selection to effect changes in fat and fibre intake.
The analysis of the NW Thames Regional Health Survey food frequency questionnaire provided valuable information about the vari- ation in dietary intake between different groups and associations with other lifestyle factors. These have important implications for food policy and targeted health education, as does the poor dietary pattern observed in the separ- ate study of the homeless. Certain foods such as fruit, type of milk, and fish consistently differ- entiated between socio-demographic sub- groups and could be usefully included in future dietary surveys to detect differences in dietary habits amongst such groups in the population. Identification of other such key indicators could simplify the questionnaires necessary to monitor specific dietary change.
As it is the overall diet that is important to health rather than the intake of specific foods it was felt that a composite indicator of diet would distinguish more readily healthy and less healthy eating patterns. On this basis, as a methodological exercise, we selected specific
food groups from the survey questions that could be scored according to current concepts with respect to the effects on health of saturated fats, complex carbohydrates and anti-oxidants. Our initial selection included 14 items and as subsequent analysis with a greater range of food items did not improve the discrimination be- tween population groups, this initial selection was retained.
Few authors have used frequency question- naires to assess the quality of the diet as a whole despite the usefulness of a global assessment. This may be related to the problem of validating food frequency scores against measured nutri- ent intake. However, an indication of validity for the scoring method used in this study was the differentiation between both socio-econ- omic group and lifestyle factors which was consistent with the expected variations in diet. A ‘healthy’ diet was more common in women, non-manual groups, those with higher educa- tional achievement, non smokers and those taking vigorous exercise. Anderson and Hunt (1992) found similar associations with a healthy diet based on separate composite scores for fat and fibre, derived from six questions in each category. In her dietary index, Blaxter (1990) had seven food items with food frequencies which were arbitrarily assigned as healthy or nlDt (Table 7). Individuals achieving five or more (of these were (arbitrarj ly) judged to have a ‘healthy’ diet.
The NW ‘Thames food frequency question- naire only permitted limited dietary analysis. It was not possible to directly compare food intakes with all the national FPHM targets, as some of the survey questions were not worded in the same way or they were not included at all. Althoughthe NW Thames Survey was designed before the publication of the FPHM document, this problem does raise the important issue of having nationally agreed food targets which relate to standard questions. Correct phrasing
Monitoring dietary change 127
so that they remain valid. The definition of national food frequency targets must be based on examination of the relationship between frequency of consumption of specific food groups and levels of intake of key nutrients or constituents, such as saturated fat.
At a national level, food consumption is currently monitored in the UK on an annual basis through the National Food Survey, at a household rather than individual level (MAFF, 1990). The survey records all food expenditure of the househoId but, until 1992, none of food consumed outside the home. Until recently therefore, total household consumption of food was under-estimated. In addition, regular sur- veys of individual intakes for specific age groups in the population are conducted in rotation every few years. The latest adult survey was conducted in 1986-1987 (Gregory et al., 1990). However, neither of these types of survey included food frequency questions to enable the validation and comparison of such questions at a national level. We suggest that further studies of individual intakes should incorporate food frequency questions so that a validation against quantifiable data can be undertaken. Limited analysis may be possible on the existing survey data as it was based on 7-day weighed intakes.
To maximize the usefulness of food fre- quency questionnaires for geographical and secular comparisons they should comprise core questions in an agreed standard format, supplemented with additional questions as appropriate, to reflect dietary diversity, e.g. of ethnic groups. This permits reliable compari- sons at local, regional and national levels, yet allows for flexibility.
In conclusion, the food frequency method is relatively simple and cheap to undertake and could be used for monitoring dietary change by health agencies. However, there need to be nationally agreed standard questions for the whole population, with ethnic variants, incor- porated into local as well as regional and national surveys. The choice of questions needs to be validated against reliable methodologies, and targets based on these chosen food ques- tions set in context of nutritional goals.
of such questions is essential to ensure valid responses. The NW Thames Survey, for exam- ple, combined h i t and fruit juice, it had no seasonal element and it excluded dried and tinned fruit. The questions on vegetables and bread were not sensitive to socio-economic or lifestyle factors, because they were non- specific. The vegetable question, for example, included potatoes, a staple food, and the ‘bread’ question included all types.
The survey dietary questions did attempt to cover ethnic diversity, given the large ethnic minority populations in the NW Thames Re- gion. This is clearly important but in conse- quence the bread question was different from the FPHM target because of the inclusion of chapattis. In addition, the use of fats was not well specified for Asians as they use ghee for frying although they may not regard it as a source of fat or even as frying. A more appropri- ate question to determine the amount of fried food consumption of Asians would be the quantity of cooking oil or ghee used in a certain period. An alternative approach to examining diet within ethnic groups would be to under- take ethnic-specific surveys,
The food frequency format did not contain any quantification of portion size. Correction for energy intake is therefore not possible, with the result that there could be misclassification of the ‘healthiness’ of the diet compared to the true nutrient intake. This may partly explain why the overweight and obese had a ‘healthy’ diet in this study. It is possible that the obese had adopted a healthy pattern of food intake to lose or maintain weight, or that their responses reflect what they feel they should eat rather than their true intake. It has been established that the reporting of consumption is less accu- rate in the overweight and obese (Prentice et a]., 1986).
What are the implications of OUT study? We suggest that there is a need for nationally agreed food targets based on selected food groups with a specified frequency of consumption and indications of portion size. These would pro- vide unambiguous and clearly understood messages for health education and allow for monitoring of changes in consumption by food frequency questionnaires.
The food groups included should be valid indicators of key nutrient intake and minimally affected by the changing nature of food retailing
Acknowledgements
We would like to thank Social and Community
128 M. Davenport et al.
Planning Research, its field workers and the respondents for their involvement i n the North West Thames Regional Health Survey.
References
Anderson, A.S. & Hunt, K. (1992) Who are the healthy eaters? Eating patterns and health promotion in the west of Scotland. Health Educ.
Bingham, S. (1991) Dietary aspects of a health strategy for England. Br. Med. J. 303, 339-396.
Blaxter, M. (1990) Health and Lifestyles. London: Tavistock Routledge.
Cox, B. Buckle, A.L.J., Fenner, N.P., Blaxter, M., Nickson, J., Huppert, F. & Whichelow, M. (1987) The Health and Lifestyle Survey. Cambridge, UK: Health Promotion Research Trust.
DOH, Department of Health (1991) Dietary Refer- ence Values for Food Energy and Nutrients in the United Kingdom. Report on Health and Social Subjects no. 41. London: HMSO.
FPHM. The Faculty of Public Health Medicine of the Royal College of Physicians (1992) UK Lev- els of Health. Second report. London: FPHM.
Government Statistical Service (1992) 1991 Cen- sus Definitions for Great Britain. London: HMSO.
Gregory, J., Foster, K., Tyler, H. & Wiseman, M.
J. 51, 3-10.
(1990) The Dietary and Nutritional Survey of British Adults. London: HMSO.
Health Education Council (1983) A Discussion on Proposals for Nutritional Guidelines for Health Education in Great Britain (NAClrlEJ. London: Health Education Council. .
MAFF. Minictry of Agriculture Fisheries and Foods (199D) Household Food Consumption and Expenditure Survey. Annual report of the National Food Survey Committee. London: HMSO.
Prentice, A.M., Black, A.E., Coward, W.A.,Davies, H.L., Goldberg,G.R., Murgatroyd, P.R.,Ashford, J., Sawyer, M. & Whitehead, R.G. (1986) High levels of energy expenditure in obese women. Br. Med. J. 292, 983-987.
Royal College of Physicians (1983) Obesity report. J. R. Coll. Physicians Lond. 17, 5-65.
Secretary of State for Health (1991) The Health of the Nation. London: HMSO.
Smyth, M. & Browne, F. (1990) GenerdHousehold Survey. London: HMSO.
Victor, C.R. (1'392) Health status of the temporarily homeless population and residents of North West Thames Region. Br. Med. J. 305,387-391.
Willett, W. (1990) Nutritional Epidemiology. Ox- ford, UK: Oxford University Press.
WHO, World Health Organization (1990) Diet, Nutrition and the Prevention of IChronic Dis- eases. Technical Report Series 5 97. Geneva: WHO.
MS accepted December 1994