Remote sensing for mapping and monitoring land-cover and land-use change—an introduction
Upload
independentCategory
view
5download
0
TS 3E - Disaster Risk Management: Approaches and Consequences 1/10 Thu Trinh Hoai Monitoring Changes in Land Use 7th FIG Regional Conference Spatial Data Serving People: Land Governance and the Environment – Building the Capacity Hanoi, Vietnam, 19-22 October 2009
Monitoring Changes in Land Use
THU Trinh Thi Hoai, Vietnam
Key words: Remote sensing, GIS, Land use, Tu Liem SUMMARY Besides big cities strongly effected by industrialization and urbanization, many areas in the suburbs are not exceptional cases. Apart from advantages brought by the development process such as economic growth and social life improvement, they are deeply under pressure between two trends: development and conservation; economic interests and environmental protection and cultural values. Agricultural land uses for different purpose are massive due to needs for houses, unplanned industrial zones construction and infrastructure development. That leads long-term negative influences. Therefore, monitoring and researching changes of land cover and land use are very important for managers to give ultimate solutions to obtain substainable development in those places. In my study, I combine to use methods between Remote Sensing (RS) and geographical information systems (GIS). Remote Sensing materials provide exact and timely information about space and time changes of objects. Additionally, GIS has a remarkable ability of high density information integration, easily-updated information, space analysis, geographic data process as well as evaluation of land fluctuation level. Scope of research in my study is Tu Liem district. Through analysis of SPOT images in 2002 and 2007 and field surveys, we will get an overall assessment of land cover and land use changes in the period from 2002 to 2009. The results of this study are expected to be useful to support decision-makers to build an appropriate land use plan. SUMMARY Từ Liêm là khu vực ven đô của thành phố Hà Nội, những năm gần đây khu vực này diễn ra quá trình công nghiệp hoá và đô thị hoá với tốc độ nhanh chưa từng có. Vì vậy, việc tích hơp viễn thám và hệ thống thông tin địa lý kết hợp với khảo sát thực địa trong nghiên cứu biến động sử dụng đất là cần thiết và cấp bách.

TS 3E - Disaster Risk Management: Approaches and Consequences 2/10 Thu Trinh Hoai Monitoring Changes in Land Use 7th FIG Regional Conference Spatial Data Serving People: Land Governance and the Environment – Building the Capacity Hanoi, Vietnam, 19-22 October 2009
Monitoring Changes in Land Use
THU Trinh Thi Hoai, Vietnam
1. INTRODUCTION
Suburban areas have been changing dramatically in land use in our national modernization and industrialization. In recent years, Tu Liem is the typical area that has had strongly impacted by urbanization process. It has had about 200 construction investment projects, most of which are to expand urban areas by revoking agricultural land estimated up to several thousand hectares. With such a rapid speed, research of land use changes is an urgent task to take action. In order to give its quick and reliable results, the paper research is carried out by combination of methods: Remote Sensing, GIS and field survey. 2. THE STUDY AREA AND DATA
Tu Liem is a district situated in the west and in the suburbs of Hanoi. It spreads along in the direction of North-South and is located between 20058’ and 21006’ N latitude and between 105043’and 105051’E longitude. It is surrounded by four districts: Dong Anh in the Northern East; Tay Ho, Cau Giay and Thanh Xuan in the East and it lies near to Ha Tay districts in the North and East. With about 75.32 kilometers square and its population of over 315,000 people, it has population density: 2.391 persons per kilometers square. It is divided into two categories: dynamic rural areas with trade villages and urban areas.
Figure 1. Tu Liem- Study Area
This study use data from various sources including SPOT_5 (2002) satellite images with 10m resolution and SPOT_4 (2007) images with 20m resolution ; topographic map (2005); land

TS 3E - Disaster Risk Management: Approaches and Consequences 3/10 Thu Trinh Hoai Monitoring Changes in Land Use 7th FIG Regional Conference Spatial Data Serving People: Land Governance and the Environment – Building the Capacity Hanoi, Vietnam, 19-22 October 2009
use maps of 2000 and 2005 (1/50000) and statistical data and field data. Further, remote sensing images are required to have spectral correction and put in UTM (WGS_84, 48N) co-ordinates system. All the data must be standardized before research. 3. METHODS
In the study of changes in land area, Tu Liem District – Hanoi, pre-classification and post-classification are applied in the research as shown in Figure 2. Pre-classification is creating images changes based on the temporal images differencing to see change level in the research area. Post-classification is a common method by getting access into two images taken in two different points of time which are classified independently, and then used to analyse space data via GIS to find the change of objects.
Figure 2. Chart of land use changes detection and research
3.1. Pre-classification Threshold change image is made by using the (SAVI) temporal images differencing method. This method shows us changes at some extent in the land cover. Threshold changes are classified into three levels: no-change, weak change and strong change.
3.2. Post-classification Space images are classified independently by maximum likelihood method. Results after the
Pre-classification
Post-classification.
Change map
Actual land use map Actual land use map
Map overlaying
Change detecion statistics
Changes assessment
Threshold change image
TS 3E - Disaster Risk Management: Approaches and Consequences 4/10 Thu Trinh Hoai Monitoring Changes in Land Use 7th FIG Regional Conference Spatial Data Serving People: Land Governance and the Environment – Building the Capacity Hanoi, Vietnam, 19-22 October 2009
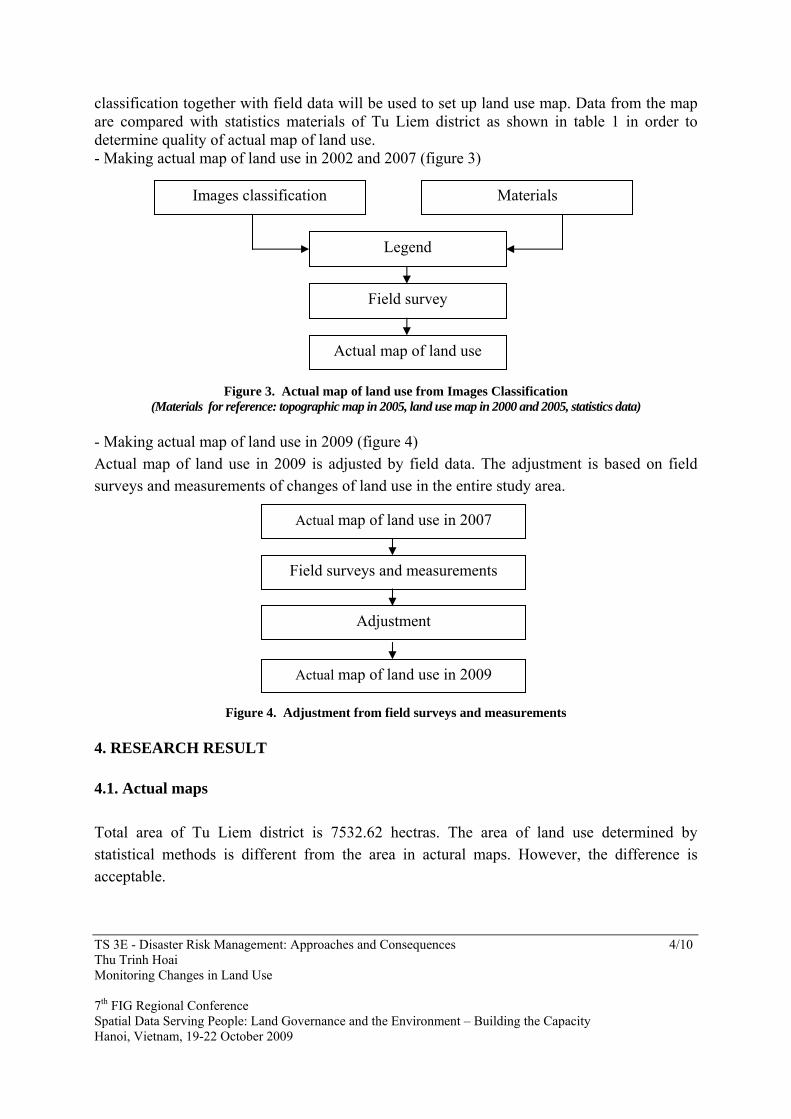
classification together with field data will be used to set up land use map. Data from the map are compared with statistics materials of Tu Liem district as shown in table 1 in order to determine quality of actual map of land use. - Making actual map of land use in 2002 and 2007 (figure 3)
Figure 3. Actual map of land use from Images Classification (Materials for reference: topographic map in 2005, land use map in 2000 and 2005, statistics data)
- Making actual map of land use in 2009 (figure 4) Actual map of land use in 2009 is adjusted by field data. The adjustment is based on field surveys and measurements of changes of land use in the entire study area.
Figure 4. Adjustment from field surveys and measurements 4. RESEARCH RESULT 4.1. Actual maps Total area of Tu Liem district is 7532.62 hectras. The area of land use determined by statistical methods is different from the area in actural maps. However, the difference is acceptable.
Images classification
Legend
Materials
Field survey
Actual map of land use
Actual map of land use in 2007
Field surveys and measurements
Adjustment
Actual map of land use in 2009

TS 3E - Disaster Risk Management: Approaches and Consequences 5/10 Thu Trinh Hoai Monitoring Changes in Land Use 7th FIG Regional Conference Spatial Data Serving People: Land Governance and the Environment – Building the Capacity Hanoi, Vietnam, 19-22 October 2009
According to the statistics of Tu Liem district, water bodies area in 2007 is less than in 2002. However, the area in 2007 was determined to increase more than in 2002 based on the actural map because these images was taken in 2007 when water level was high.
Table1. Area comparison
Area (ha) Statistics data of Tu Liem district
Area (ha) Actural maps Land use
2002 2007 2009 2002 2007 2009 Total area 7532.62 7532.62 7532.62 7532.62 7532.62 7532.62
Agricultural land 4040.78 3172.42 2966.95 4005.29 3140.39 2815.32
Rural land 727.18 1100.48 1214.34 768.12 1105.23 1266.35
Urban land 1792.37 2319.18 2421.13 1789.23 2311.6 2499.78
Water bodies 878.83 868.96 858.63 860.43 898.02 873.79
Non-use land 93.46 71.58 71.57 109.55 77.38 77.38
4.2. Threshold change image
Figure 5. Threshold change image
N Value Threshold Colour
1 2211.09596.0 −÷− Strong change
2 0951.02211.0 ÷− No-change
3 0098.10951.0 ÷ Weak change

TS 3E - Disaster Risk Management: Approaches and Consequences 6/10 Thu Trinh Hoai Monitoring Changes in Land Use 7th FIG Regional Conference Spatial Data Serving People: Land Governance and the Environment – Building the Capacity Hanoi, Vietnam, 19-22 October 2009
4.3. Change detection Change maps in figure 6 is made by overlapping land use maps in 2002 and 2007 on the GIS
Figure 6. Land use changes.
Table 2. Matrix of changes in land use in 2002 and 2007
(Unit: ha) 2002
2007 Agricultural land Rural land Urban land Water bodies Non-use land
Agricultural land 3140.39 312.38 388.52 12.22 1.36 Rural land 1.21 768.12 133.62 0.23 0 Urban land 0.02 0.13 1789.23 0.12 0.15 Water bodies 4.63 2.46 1.03 860.43 0 Non-use land 4.47 5.3 4.2 25.02 77.38

TS 3E - Disaster Risk Management: Approaches and Consequences 7/10 Thu Trinh Hoai Monitoring Changes in Land Use 7th FIG Regional Conference Spatial Data Serving People: Land Governance and the Environment – Building the Capacity Hanoi, Vietnam, 19-22 October 2009
Table 3. Matrix of changes in land use in 2007 and 2009
2007
2009 Agricultural land Rural land Urban land Water bodies Non-use land
Agricultural land 2815.32 149.47 158.51 0.36 0.12 Rural land 0.01 1105.23 26.13 0.07 0 Urban land 0 0.08 2311.6 0 0.09 Water bodies 7.63 4.23 2.37 873.79 0 Non-use land 0.23 0 0 0 77.38
Figure 6. Changes trend in land use in 2002, 2007 and 2009
4.3.1. Land use area change Overlapping actual maps help to identify land use area change. From the change map, land use can be divided into two zones by Nhue river: - Zone 1: There is a strong change in agricultural land area in the East of Nhue river due to urban area expansion. - Zone 2: In the west of the river, land use area change is less than in the east. Agricultural land has decreased because of land revoke for industrial zones construction. With trend of changing agricultural land into non-agricultural land, agricultural land area in Tu Liem decreased 864.9 hectares in the period from 2002 to 2007 and further reduced 325.07 hectares from 2007 to 2009. Thus, a series of new urban areas were built mostly around main roads such as Pham Hung, Pham Van Dong, Le Duc Tho and 32 Highway and urban land area has increased to 710.55 hectares from 2002 to 2009.

TS 3E - Disaster Risk Management: Approaches and Consequences 8/10 Thu Trinh Hoai Monitoring Changes in Land Use 7th FIG Regional Conference Spatial Data Serving People: Land Governance and the Environment – Building the Capacity Hanoi, Vietnam, 19-22 October 2009
4.3.2. Land use/land cover change level There are three threshold changes: weak, strong and non-change Weak change level is mainly owing to changing density of objects in land cover. Besides, it depends on the quality of remote sensing images taken in different points of time. Table 5 shows weak change in two regions as below.
Table 5. Regions of weak change
Region SPOT (2002) SPOT (2007)
Change image Change map
1
2
Table 5. Regions of strong change
Region SPOT (2002) SPOT (2007)
Change image Change map
1
2
There are two causes in strong change level:
- Change in land cover without change in land use. For example: For region 1 (table 5) in the image in 2002, land was used as agricultural land with the land cover determined as scattered vegetables. Yet, in the image in 2007, land use was still agricultural land with the land cover considered as wet land.

TS 3E - Disaster Risk Management: Approaches and Consequences 9/10 Thu Trinh Hoai Monitoring Changes in Land Use 7th FIG Regional Conference Spatial Data Serving People: Land Governance and the Environment – Building the Capacity Hanoi, Vietnam, 19-22 October 2009
- Change in land cover and change in land use as well. Region 2 (table 5) shows land cover change: from vegetables to residential areas and from agricultural land to urban land.
5. CONCLUSION Change research method is a combination of identifying the temporal image differencing (pre-classification) and post-classification based on Maximum Likelihood method. Threshold values in the temporal image differencing define the extent of changes and post-classification result and GIS help determine area changes of objects. Urban area increase annually 101.5 hectares at average and 71.2 hectares for rural land that shows that the area of agricultural land will decrease very rapidly in the future. Therefore, it raises the need of evaluating long-term benefits of the changes of agricultural land to give timely solutions for sustainable development.

TS 3E - Disaster Risk Management: Approaches and Consequences 10/10 Thu Trinh Hoai Monitoring Changes in Land Use 7th FIG Regional Conference Spatial Data Serving People: Land Governance and the Environment – Building the Capacity Hanoi, Vietnam, 19-22 October 2009
REFERENCES J. G. Masek, F. E. Lindsat and S. N. Goward, 1999, Dynamics of urban growth in the Washington DC metropolitan area 1973 -1996, from Landsat observations, Deparment of Geography, University Maryland, College Park, MD 20742, USA. Pham Minh Hai and Yasushi Yamaguchi, 2005, Monitoring land cover change of Hanoi city under impacts of Urbanization by using remote sensing, Nagoaya University, Japan. Report land use of Tu Liem district, 2002 - 2009. Somporn Sangawongse, 1995, Land use/ land cover change detection in Chiang Mai area using Landsat TM, Monash University, Australia. BIOGRAPHICAL NOTES Full name: Thu Trinh Thi Hoai Date of birth: 7th January, 1981 Graduation: Hanoi University of Mining and Geology in 2005 Current career: Lecturer at Hanoi Natural Resources and Environment College Publication: Monitoring changes of resources and environmental factors elements in mineral mining process at Quang Ninh province with remote sensing and GIS in the proceeding published in 2009 named the 20th national conference on mining science and technology. CONTACTS Ms Trinh Thi Hoai Thu
Institution: Geodesy - Cartography department, Hanoi Natural Resources and Environment College
Address: 41A Number , K1 street, Cau Dien town, Tu Liem, Hanoi, Vietnam
City: Hanoi
COUNTRY: Vietnam
Tel. +84-437643330
Fax +84-438370598
Email: [email protected] or [email protected]
Web site: [email protected]
Copyright © 2022 FDOKUMEN