MOLS sampling and its applications in structural biophysics
11
REVIEW MOLS sampling and its applications in structural biophysics L. Ramya & Shankaran Nehru Viji & Pandurangan Arun Prasad & Vadivel Kanagasabai & Namasivayam Gautham Received: 14 October 2010 / Accepted: 19 October 2010 / Published online: 16 November 2010 # International Union for Pure and Applied Biophysics (IUPAB) and Springer 2010 Abstract This review describes the MOLS method and its applications. This computational method has been developed in our laboratory primarily to explore the conformational space of small peptides and identify features of interest, particularly the minima, i.e., the low energy conformations. A systematic “brute-force” search through the vast conforma- tional space for such features faces the insurmountable problem of combinatorial explosion, whilst other techniques, e.g., Monte Carlo searches, are somewhat limited in their region of exploration and may be considered inexhaustive. The MOLS method, on the other hand, uses a sampling technique commonly employed in experimental design theory to identify a small sample of the conformational space that nevertheless retains information about the entire space. The information is extracted using a technique that is a variant of the self-consistent mean field technique, which has been used to identify, for example, the optimal set of side-chain conformations in a protein. Applications of the MOLS method to understand peptide structure, predict the structures of loops in proteins, predict three-dimensional structures of small proteins, and arrive at the best conformation, orienta- tion, and positions of a small molecule ligand in a protein receptor site have all yielded satisfactory results. Keywords Peptide and protein conformations . MOLS sampling . Conformational energy landscape . Docking Introduction The use of mutually orthogonal Latin squares (MOLS) to systematically sample a very large experimental space is well established (Mandl 1985; Colbourn 1995; Colbourn and Dinitz 2001; Abel et al. 2006). This sampling technique has long been employed in the design of experiments to plan, for example, agricultural or clinical experiments (Fisher 1951; Cox 1958; Finney 1955; Raghavarao 1971; Pearce 1983; Meinert 1986; Mead 1988; Montgomery 2000). Such experiments are typically used to identify the most important variables from among those that influence a given outcome, such as for example the crop yield in an agricultural plot. More ambitiously, the experiments may be designed to specifically identify the particular set of values for the variables that maximizes the outcome. The conceptually simplest way to achieve this end would be to try out all possible combinations of the values of the variables. Since this would obviously lead to combinatorial explosion, with astronomical numbers of possible experi- ments for even a small number of variables, experimental design strategies have been developed to limit the number of experiments to be performed to a relative small, systematic sample of the entire experimental space, without seriously compromising the amount or quality of the information obtained (Cochran and Cox 1957; Cochran 1977). The use of MOLS is one such strategy. L. Ramya : S. Nehru Viji : N. Gautham (*) Centre of Advanced Study in Crystallography and Biophysics, University of Madras, Chennai 600025, India e-mail: [email protected] P. Arun Prasad Institute of Structural and Molecular Biology and Crystallography, Department of Biological Sciences, Birkbeck College, University of London, London, UK Present Address: V. Kanagasabai Department of Orthopaedic Surgery, David Geffen School of Medicine, University of California, Los Angeles, CA, USA Biophys Rev (2010) 2:169–179 DOI 10.1007/s12551-010-0039-y
Transcript of MOLS sampling and its applications in structural biophysics
REVIEW
MOLS sampling and its applications in structural biophysics
L. Ramya & Shankaran Nehru Viji &Pandurangan Arun Prasad & Vadivel Kanagasabai &Namasivayam Gautham
Received: 14 October 2010 /Accepted: 19 October 2010 /Published online: 16 November 2010# International Union for Pure and Applied Biophysics (IUPAB) and Springer 2010
Abstract This review describes the MOLS method and itsapplications. This computational method has been developedin our laboratory primarily to explore the conformationalspace of small peptides and identify features of interest,particularly the minima, i.e., the low energy conformations. Asystematic “brute-force” search through the vast conforma-tional space for such features faces the insurmountableproblem of combinatorial explosion, whilst other techniques,e.g., Monte Carlo searches, are somewhat limited in theirregion of exploration and may be considered inexhaustive.The MOLS method, on the other hand, uses a samplingtechnique commonly employed in experimental design theoryto identify a small sample of the conformational space thatnevertheless retains information about the entire space. Theinformation is extracted using a technique that is a variant ofthe self-consistent mean field technique, which has been usedto identify, for example, the optimal set of side-chainconformations in a protein. Applications of the MOLSmethod to understand peptide structure, predict the structuresof loops in proteins, predict three-dimensional structures of
small proteins, and arrive at the best conformation, orienta-tion, and positions of a small molecule ligand in a proteinreceptor site have all yielded satisfactory results.
Keywords Peptide and protein conformations .MOLSsampling . Conformational energy landscape . Docking
Introduction
The use of mutually orthogonal Latin squares (MOLS) tosystematically sample a very large experimental space iswell established (Mandl 1985; Colbourn 1995; Colbournand Dinitz 2001; Abel et al. 2006). This sampling techniquehas long been employed in the design of experiments toplan, for example, agricultural or clinical experiments(Fisher 1951; Cox 1958; Finney 1955; Raghavarao 1971;Pearce 1983; Meinert 1986; Mead 1988; Montgomery2000). Such experiments are typically used to identify themost important variables from among those that influence agiven outcome, such as for example the crop yield in anagricultural plot. More ambitiously, the experiments may bedesigned to specifically identify the particular set of valuesfor the variables that maximizes the outcome. Theconceptually simplest way to achieve this end would be totry out all possible combinations of the values of thevariables. Since this would obviously lead to combinatorialexplosion, with astronomical numbers of possible experi-ments for even a small number of variables, experimentaldesign strategies have been developed to limit the numberof experiments to be performed to a relative small,systematic sample of the entire experimental space, withoutseriously compromising the amount or quality of theinformation obtained (Cochran and Cox 1957; Cochran1977). The use of MOLS is one such strategy.
L. Ramya : S. Nehru Viji :N. Gautham (*)Centre of Advanced Study in Crystallography and Biophysics,University of Madras,Chennai 600025, Indiae-mail: [email protected]
P. Arun PrasadInstitute of Structural and Molecular Biology and Crystallography,Department of Biological Sciences, Birkbeck College,University of London,London, UK
Present Address:V. KanagasabaiDepartment of Orthopaedic Surgery,David Geffen School of Medicine, University of California,Los Angeles, CA, USA
Biophys Rev (2010) 2:169–179DOI 10.1007/s12551-010-0039-y
The application of a similar strategy to explore theconformational space of molecules was conceived on thebasis of the broad similarity that exists between, forexample, the agricultural problem, and that of molecularstructure. The conformational space of a molecule may berepresented by its potential energy hypersurface (Piela et al.1989), which is a function of the stereochemical parameterssuch as bond lengths, bond angles, and torsion angles. Acomplete mapping of the features (such as the minima) onthis hypersurface by calculating the potential energy ofevery possible conformation of the molecule would requireimpossibly large amounts of computational resources. Wehave attempted to solve this problem by applying themethodology of experimental design, in particular that ofmutually orthogonal Latin squares (MOLS) sampling, andhave obtained encouraging results (Gautham and Rafi1992). The large conformational space is represented by asmall sample that is selected using MOLS. This way ofselecting the sample ensures that much of the informationabout the space is preserved and can be retrieved, usuallyby statistical analyses of the sample. We have howevermade a further innovation in this step. Instead of usingtechniques such as ANOVA (Lindman 1974), the sample isanalyzed by a variant of the self-consistent mean fieldtechnique (SCMFT, Koehl and Delarue 1994, 1995, 1996;Finkelstein and Reva 1996). Thus we may also describe themethod in terms of SCMFT, as an extension or variation ofit. In the next section, we briefly describe the technique. Inthe subsequent sections, we describe various applications ofthe method, together with further extensions and modifica-tions to the methodology that we have carried out.
The MOLS method
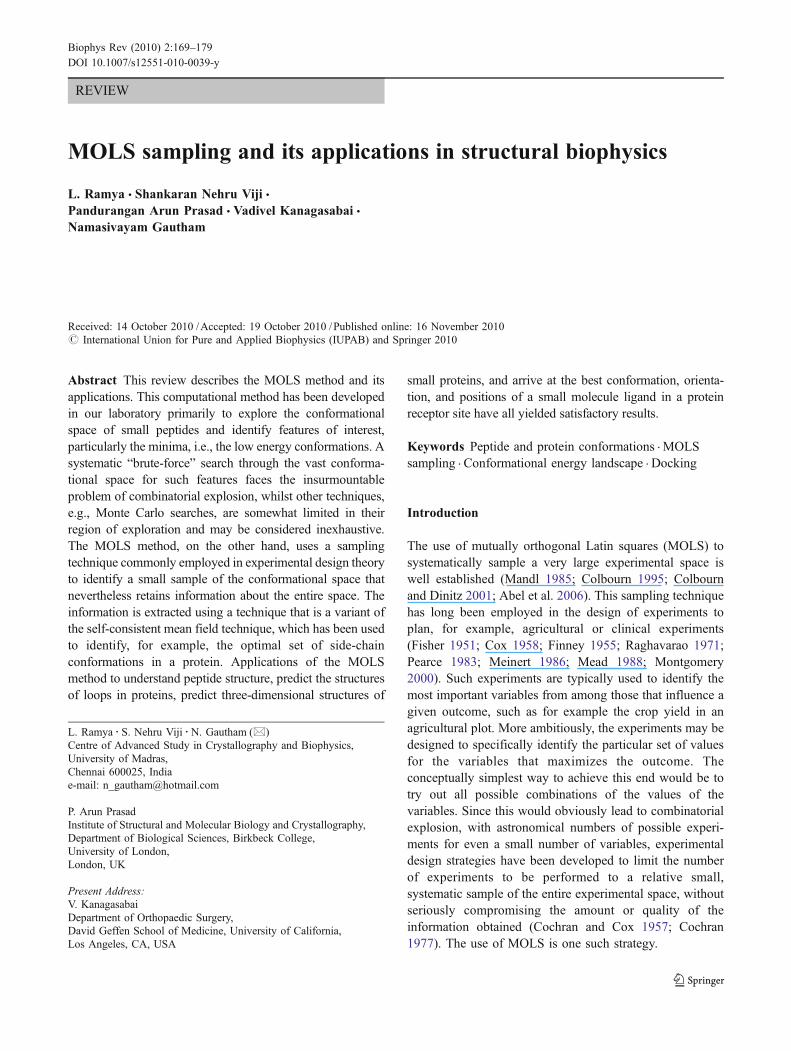
A Latin square of order N consists of N copies of each of Nsymbols (i.e., a total of N2 symbols) arranged in an N by Narray such that each symbol occurs exactly once in each rowand exactly once in each column (Ito 1987). Figure 1a givesan example. A pair of orthogonal Latin squares consists oftwo separate Latin squares, created according to the abovedefinition, with the additional requirement that when the twosquares are superposed, all N2 possible combinations of thesymbols of one square with the symbols of the other arefound to occur, and each symbol of the one square occursonce, and only once, with each symbol of the other square(Fig. 1b). This concept of orthogonal pairs of Latin squarescan be extended to a set of m mutually orthogonal Latinsquares (MOLS), each of order N, every pair of which isorthogonal (Ito 1987) (Fig. 1b). Details of the use of MOLSin experimental design are given in the document http://www.unom.ac.in/Gautham_mols.pdf and in several referencestherein. Their use in the exploration of molecular conforma-
tional space is also extensively discussed in the abovedocument. Here we give a brief summary of this latterapplication. The MOLS method, as applied to molecularstructures, is best approached as a variant of the self-consistent mean field technique applied to protein structureanalyses as described in the literature.
The self-consistent mean field technique has been appliedto protein structure analyses by several workers to accomplishtasks such as prediction of side chain structures (Koehl andDelarue 1995) and ligand-protein interactions (Liu et al.2004). Following the description in Koehl and Delarue(1996), the procedure underlying these applications may besummarized as follows. LetΘ be the search space (for example,all possible side chain conformations). This is divided into anumber of subspaces θi (for example, the conformationalspaces of the individual side chains). Each such subspace hasa number of states θij (for example, the side chain rotamers),each with a probability of occurrence ρij. The effectivepotential due to a state θrs of a subspace θr is given as
Veff qrsð Þ ¼ Σi;jrijV qrs; qij� � ð1Þ
where the summation is over all subspaces i≠r, and all thestates of these subspaces. V(θrs, θij) is the potential energy ofthe interaction between the subspaces θr and θi, calculatedwith θr set to the state θrs, and θi set to the state θij. Theprocedure starts by assigning ρij=1/mi (mi is the number ofstates of the subspace θi, all equally probable). Equation 1 isthen repeatedly used to evaluate the effective potential for allstates of all subspaces. Next the probabilities ρ are re-evaluated as
rrs ¼ exp �Veff qrsð Þ=RT� �=Σq exp �Veff qrq
� �=RT
� � ð2Þwhere the summation is over all the states of the subspace r. Ris the gas constant and T is the temperature. The newly
Fig. 1a, b A Latin square oforder 3 (adapted from Cochranand Cox 1957). a The Latinalphabet letters a, b, and c areused as symbols for Latin squarearrangement. This pattern can beextended to any size. b Twomutually orthogonal Latinsquares (MOLS) of order 3. TheGreek letters α, β, and γ aresymbols of the second Latinsquare, which is orthogonal tothe first Latin square (adaptedfrom Fisher 1951)
170 Biophys Rev (2010) 2:169–179
determined probabilities are then used to re-determine theeffective potentials. This is iterated until the probabilitiesconverge to a set of self-consistent values. The set of mostprobable states of the subspaces defines the most probablestate of the system (e.g., the most probable set of side-chainconformations).
In applying this technique to the conformation ofpeptides, we define the subspaces as the backbone torsionangles, and the states as the values that these angles canassume. Once again, initially all values are equallyprobable, and the effective potential due to setting thebackbone torsion angle θr to the value θrs is calculatedusing Eq. 1. However, this extension to torsion angle spaceis not straightforward, since the potential V in thesummation cannot be calculated by simply considering thetwo backbone torsion angles θr and θi alone—we need toset all other torsions also to specific values. In other words,the interaction between a pair of subspaces (when thesubspaces are the backbone torsion angles) does not dependonly on their respective states but depends also on the statesof all other subspaces. The expression V(θrs, θij) is thus notsensible in this context, and the summation in Eq. 1 has tobe performed over all possible combinations of the states ofall the subspaces except θr. This will clearly lead tocombinatorial explosion since the number of such combi-nations is an exponential function of the number ofsubspaces.
To overcome this problem, we use a small sample of thepossible combinations, in other words, a small sample ofthe conformational space, to calculate the effective poten-tial. We use MOLS to perform this sampling. To use MOLSto systematically sample the conformational space ofpeptides, we map the symbols used in the set of MOLS tothe values of the variable torsion angles in the molecule.Thus, Fig. 1b would represent possible values for onetorsion angle in a “molecule” that has only two variabletorsion angles. a, b, and c represent possible values of oneof them and α, β and γ represent the possible values of theother. If there are n such torsion angles, each with mpossible values, then θrs (r=1, n; s=1, m) defines the searchspace in which the sampling is to be carried out. We buildthe sample by constructing n MOLS of order N. Tocalculate the effective potential due to setting θr to θrs wenow use the following equations:
Veff qrsð Þ ¼ ΣqwqVq qrs . . .ð Þ; for q ¼ 1;N
wq ¼ exp �Vq qrs . . .ð Þ=RT� �=Σq exp �Vq qrs . . .ð Þ=RT� �
ð3ÞThe summation is over all the N points in the MOLS
grid at which θr has been set to θrs. Vq is the potentialfunction. The ellipsis in the expression for the potentialindicates the setting of all the other torsion angles (except
θr), determined using the MOLS algorithm. Veff(θrs) is usedto evaluate the probability of the value θrs for θr—the valuewith the lowest effective potential being the most probable.The set of most probable values for the angles defines thelower energy conformation of the peptide. It may be notedthat in this formulation the procedure is no longer aniterative one. The weights wq in Eq. 3 are not the same asthe probabilities ρ in Eq. 2. Thus one cycle of MOLScalculations leads to one low energy conformation. Tolocate another low energy structure, we perform anothercycle of calculations, again selecting m2 points in theconformational space using a different set of MOLS. For nsubspaces with m states each, there are (m!)n different waysof choosing a set of MOLS (Ryser 1963). Using any one ofthem as the basis for one cycle of calculations would lead toa low energy structure. In principle, therefore, the calcu-lations may be repeated many times to identify all the low-energy conformations. Since many of the conformationsgenerated in subsequent cycles are the same as onegenerated previously, we use a clustering algorithm (Křížet al. 2001) to cluster the structures together and identifythe unique ones. In practice, we have found that for apentapeptide it is sufficient to generate 1,500 conformationsto identify all its 50 or so low-energy conformations.
Applications of the MOLS technique
This technique of using MOLS in a variant of the SCMFThas been applied to sample the conformational space ofpeptides (Vengadesan and Gautham 2003, 2004a; Ramyaand Gautham 2009), to analyze protein loops (Kanagasabaiet al. 2007), to predict protein structure (Arunachalam et al.2006), and to explore the docking of peptides and othersmall molecules to receptor sites on proteins (Arun Prasadand Gautham 2008; Viji et al. 2009).
Peptide structure
Met- and Leu-enkephalin are penta-neuropeptides withmorphine-like activity. Because of their biological signifi-cance, many questions regarding their structures have beeninvestigated. For instance, do the enkephalins assume a singlepreferred conformation or do they exist in equilibriuminvolving a number of different conformers? To what extentdoes the conformation depend on the peptide environment?However despite extensive efforts (Hansmann et al. 1999;Isogai et al. 1977; Kříž et al. 2001), the “true” bioactiveconformation of these molecules remains a puzzle, in partdue to their high conformational freedom. We have used theMOLS technique to map the conformational space of thesemolecules. With the ECEPP/3 force field (Vengadesan andGautham 2003, 2004a, b), 1,500 conformations were
Biophys Rev (2010) 2:169–179 171
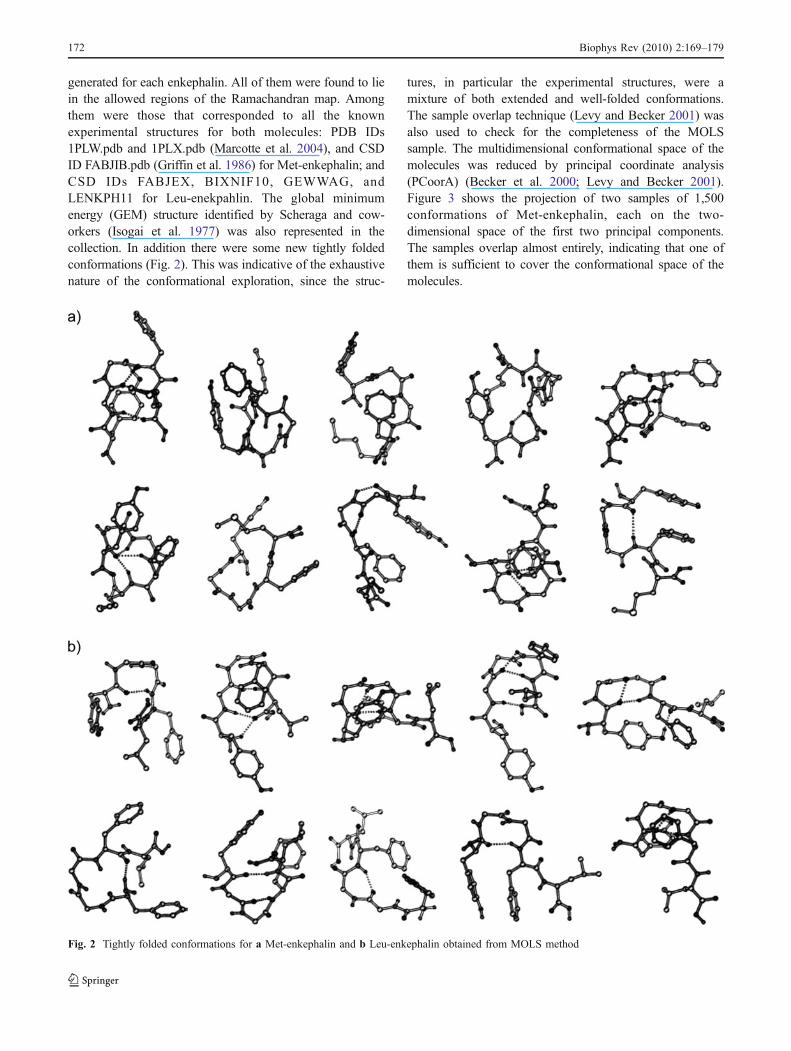
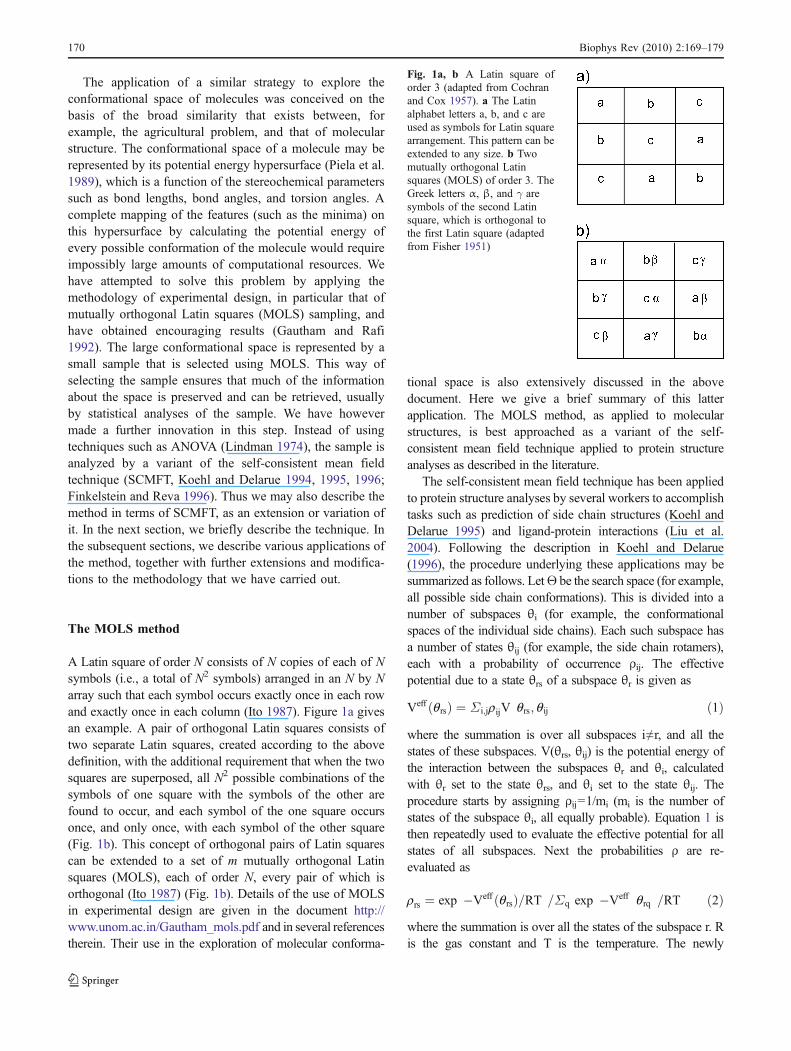
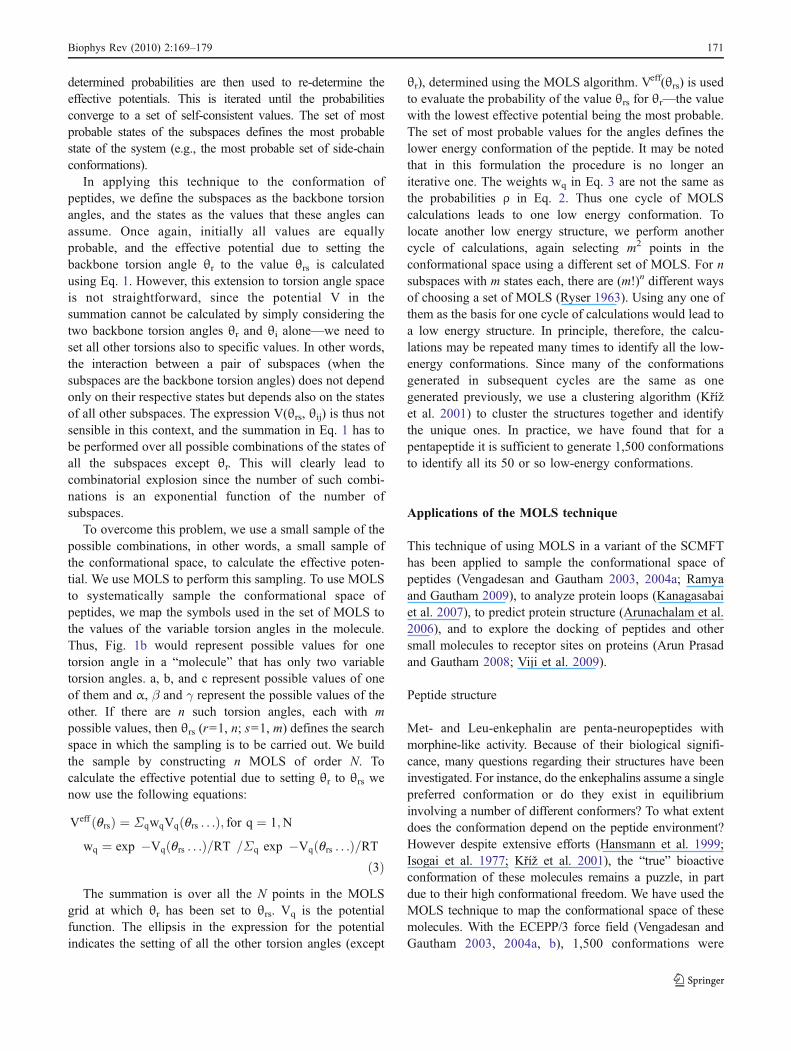
generated for each enkephalin. All of them were found to liein the allowed regions of the Ramachandran map. Amongthem were those that corresponded to all the knownexperimental structures for both molecules: PDB IDs1PLW.pdb and 1PLX.pdb (Marcotte et al. 2004), and CSDID FABJIB.pdb (Griffin et al. 1986) for Met-enkephalin; andCSD IDs FABJEX, BIXNIF10, GEWWAG, andLENKPH11 for Leu-enekpahlin. The global minimumenergy (GEM) structure identified by Scheraga and cow-orkers (Isogai et al. 1977) was also represented in thecollection. In addition there were some new tightly foldedconformations (Fig. 2). This was indicative of the exhaustivenature of the conformational exploration, since the struc-
tures, in particular the experimental structures, were amixture of both extended and well-folded conformations.The sample overlap technique (Levy and Becker 2001) wasalso used to check for the completeness of the MOLSsample. The multidimensional conformational space of themolecules was reduced by principal coordinate analysis(PCoorA) (Becker et al. 2000; Levy and Becker 2001).Figure 3 shows the projection of two samples of 1,500conformations of Met-enkephalin, each on the two-dimensional space of the first two principal components.The samples overlap almost entirely, indicating that one ofthem is sufficient to cover the conformational space of themolecules.
Fig. 2 Tightly folded conformations for a Met-enkephalin and b Leu-enkephalin obtained from MOLS method
172 Biophys Rev (2010) 2:169–179
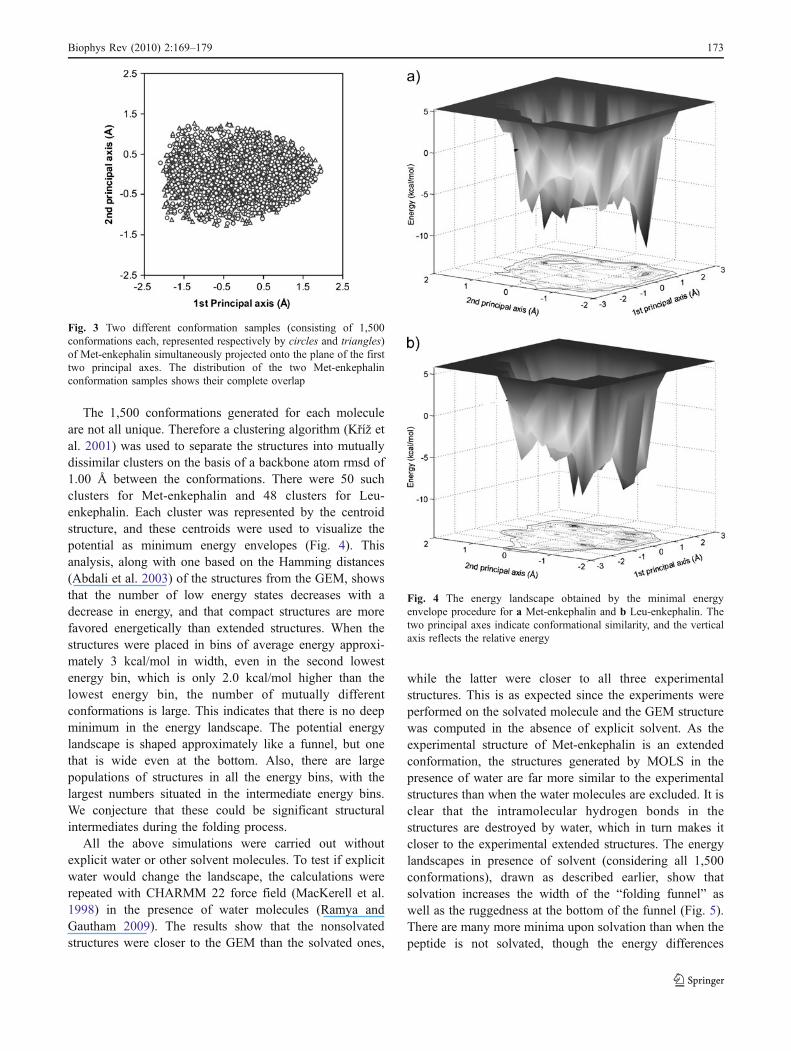
The 1,500 conformations generated for each moleculeare not all unique. Therefore a clustering algorithm (Kříž etal. 2001) was used to separate the structures into mutuallydissimilar clusters on the basis of a backbone atom rmsd of1.00 Å between the conformations. There were 50 suchclusters for Met-enkephalin and 48 clusters for Leu-enkephalin. Each cluster was represented by the centroidstructure, and these centroids were used to visualize thepotential as minimum energy envelopes (Fig. 4). Thisanalysis, along with one based on the Hamming distances(Abdali et al. 2003) of the structures from the GEM, showsthat the number of low energy states decreases with adecrease in energy, and that compact structures are morefavored energetically than extended structures. When thestructures were placed in bins of average energy approxi-mately 3 kcal/mol in width, even in the second lowestenergy bin, which is only 2.0 kcal/mol higher than thelowest energy bin, the number of mutually differentconformations is large. This indicates that there is no deepminimum in the energy landscape. The potential energylandscape is shaped approximately like a funnel, but onethat is wide even at the bottom. Also, there are largepopulations of structures in all the energy bins, with thelargest numbers situated in the intermediate energy bins.We conjecture that these could be significant structuralintermediates during the folding process.
All the above simulations were carried out withoutexplicit water or other solvent molecules. To test if explicitwater would change the landscape, the calculations wererepeated with CHARMM 22 force field (MacKerell et al.1998) in the presence of water molecules (Ramya andGautham 2009). The results show that the nonsolvatedstructures were closer to the GEM than the solvated ones,
while the latter were closer to all three experimentalstructures. This is as expected since the experiments wereperformed on the solvated molecule and the GEM structurewas computed in the absence of explicit solvent. As theexperimental structure of Met-enkephalin is an extendedconformation, the structures generated by MOLS in thepresence of water are far more similar to the experimentalstructures than when the water molecules are excluded. It isclear that the intramolecular hydrogen bonds in thestructures are destroyed by water, which in turn makes itcloser to the experimental extended structures. The energylandscapes in presence of solvent (considering all 1,500conformations), drawn as described earlier, show thatsolvation increases the width of the “folding funnel” aswell as the ruggedness at the bottom of the funnel (Fig. 5).There are many more minima upon solvation than when thepeptide is not solvated, though the energy differences
Fig. 4 The energy landscape obtained by the minimal energyenvelope procedure for a Met-enkephalin and b Leu-enkephalin. Thetwo principal axes indicate conformational similarity, and the verticalaxis reflects the relative energy
Fig. 3 Two different conformation samples (consisting of 1,500conformations each, represented respectively by circles and triangles)of Met-enkephalin simultaneously projected onto the plane of the firsttwo principal axes. The distribution of the two Met-enkephalinconformation samples shows their complete overlap
Biophys Rev (2010) 2:169–179 173
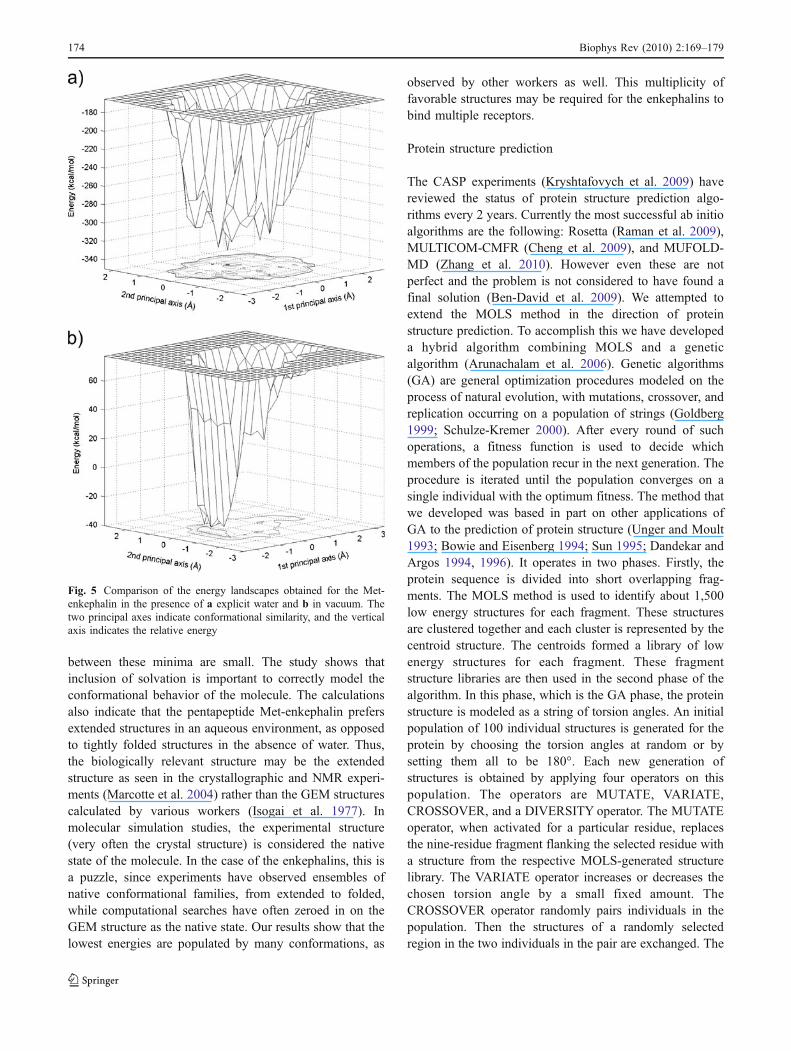
between these minima are small. The study shows thatinclusion of solvation is important to correctly model theconformational behavior of the molecule. The calculationsalso indicate that the pentapeptide Met-enkephalin prefersextended structures in an aqueous environment, as opposedto tightly folded structures in the absence of water. Thus,the biologically relevant structure may be the extendedstructure as seen in the crystallographic and NMR experi-ments (Marcotte et al. 2004) rather than the GEM structurescalculated by various workers (Isogai et al. 1977). Inmolecular simulation studies, the experimental structure(very often the crystal structure) is considered the nativestate of the molecule. In the case of the enkephalins, this isa puzzle, since experiments have observed ensembles ofnative conformational families, from extended to folded,while computational searches have often zeroed in on theGEM structure as the native state. Our results show that thelowest energies are populated by many conformations, as
observed by other workers as well. This multiplicity offavorable structures may be required for the enkephalins tobind multiple receptors.
Protein structure prediction
The CASP experiments (Kryshtafovych et al. 2009) havereviewed the status of protein structure prediction algo-rithms every 2 years. Currently the most successful ab initioalgorithms are the following: Rosetta (Raman et al. 2009),MULTICOM-CMFR (Cheng et al. 2009), and MUFOLD-MD (Zhang et al. 2010). However even these are notperfect and the problem is not considered to have found afinal solution (Ben-David et al. 2009). We attempted toextend the MOLS method in the direction of proteinstructure prediction. To accomplish this we have developeda hybrid algorithm combining MOLS and a geneticalgorithm (Arunachalam et al. 2006). Genetic algorithms(GA) are general optimization procedures modeled on theprocess of natural evolution, with mutations, crossover, andreplication occurring on a population of strings (Goldberg1999; Schulze-Kremer 2000). After every round of suchoperations, a fitness function is used to decide whichmembers of the population recur in the next generation. Theprocedure is iterated until the population converges on asingle individual with the optimum fitness. The method thatwe developed was based in part on other applications ofGA to the prediction of protein structure (Unger and Moult1993; Bowie and Eisenberg 1994; Sun 1995; Dandekar andArgos 1994, 1996). It operates in two phases. Firstly, theprotein sequence is divided into short overlapping frag-ments. The MOLS method is used to identify about 1,500low energy structures for each fragment. These structuresare clustered together and each cluster is represented by thecentroid structure. The centroids formed a library of lowenergy structures for each fragment. These fragmentstructure libraries are then used in the second phase of thealgorithm. In this phase, which is the GA phase, the proteinstructure is modeled as a string of torsion angles. An initialpopulation of 100 individual structures is generated for theprotein by choosing the torsion angles at random or bysetting them all to be 180°. Each new generation ofstructures is obtained by applying four operators on thispopulation. The operators are MUTATE, VARIATE,CROSSOVER, and a DIVERSITY operator. The MUTATEoperator, when activated for a particular residue, replacesthe nine-residue fragment flanking the selected residue witha structure from the respective MOLS-generated structurelibrary. The VARIATE operator increases or decreases thechosen torsion angle by a small fixed amount. TheCROSSOVER operator randomly pairs individuals in thepopulation. Then the structures of a randomly selectedregion in the two individuals in the pair are exchanged. The
Fig. 5 Comparison of the energy landscapes obtained for the Met-enkephalin in the presence of a explicit water and b in vacuum. Thetwo principal axes indicate conformational similarity, and the verticalaxis indicates the relative energy
174 Biophys Rev (2010) 2:169–179
DIVERSITY operator randomly selects a residue and setsthe backbone torsion angles of the next five residues to180°. After each generation, the parent and the offspringgenerations are merged, and all 200 individuals are sortedon the basis of the fitness function, calculated for eachstructure as the conformational potential energy determinedusing the AMBER force field (Weiner et al. 1986). The 100fittest individuals are selected to constitute the nextgeneration. In general, in our applications of the aboveprocedure, after about 500 to a few thousands of iterationsof this procedure, the population converged to a singlestructure.
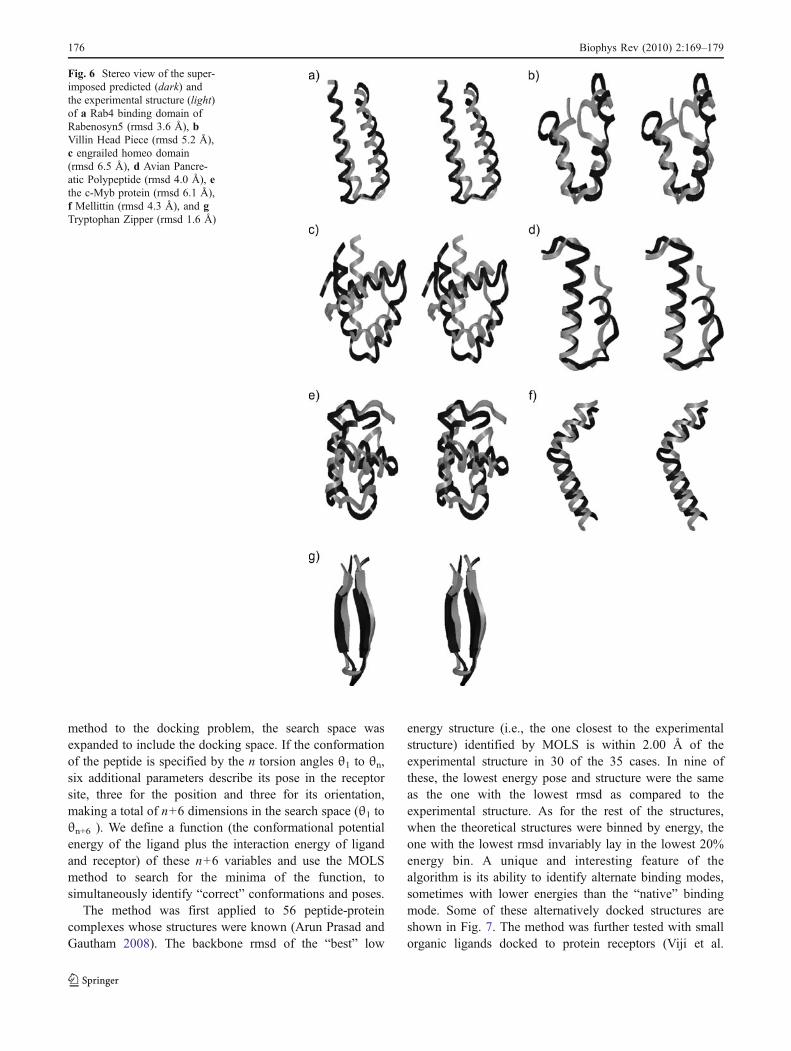
Seven target proteins were selected as the test cases toapply the above method: Avian Pancreatic Polypeptide(Blundell et al. 1981), Villin Head Piece (McKnight et al.1997), Mellittin (Terwilliger and Eisenberg 1982), the c-Mybprotein (Tahirov et al. 2002), Rab4 binding domain ofRabenosyn5 (Ethiraj et al. 2005), engrailed homeo domain(Clarke et al. 1994), and the Tryptophan Zipper (Cochran etal. 2001). These proteins were chosen because of their smallsize, well defined secondary structures, and absence ofdisulphide bonds. All the targets considered here, exceptTryptophan Zipper (TZ), are α helical proteins. TZ alonecontains an anti-parallel sheet. The AMBER force field(Weiner et al. 1986) was used along with a secondarystructure biasing function as described by Crivelli et al.(2002). The results of the prediction are shown in Fig. 6.
Exploring the conformational space of protein loops
Loops in protein structures are regions of the polypeptidechain that connect regular secondary structures. Thecomputational prediction of the three-dimensional structureof the loops has received extensive specific attention, andseveral algorithms have been developed (Sudarsanam et al.1995; van Vlijmen and Karplus 1997; Wojcik et al. 1999;Fiser et al. 2000; DePristo et al. 2003; Deane and Blundell2000). There have also been several attempts to classifyloop structures (Leszczynski and Rose 1986; Ring et al.1992; Efimov 1993). We used the MOLS algorithm to mapthe conformational space of loops (Kanagasabai et al.2007). The loops were chosen from 3,868 nonredundanthigh quality protein structures from the PDB database.Loops in these structures were identified and classifiedaccording to length and structure. Representative exampleswere taken from each length category and subjected to theMOLS calculations. The calculations were carried out withthe ECEPP/3 force field (Némethy et al. 1992) (without anysolvent atoms). [They were repeated with the AMBERenergy function (Weiner et al. 1986) to check for bias duethe selection of the force field. No such bias was seen.]There were no constraints applied to the end points of thepeptide loops. They were free to move and thus the
peptides could assume extended or folded structures thatmay be different from the ones seen when they are part oftheir respective proteins.
The results showed that despite the fact that the energycalculations did not take the rest of the protein into account,the MOLS algorithm could identify low energy structuresfor the loops that were closely similar (less than 2.04 Åbackbone atom rmsd) to the native structure. Views of theentire conformational landscapes of these loops revealedthat the native structures of the loops fell into one of themany energy minima. We concluded that structure of theloop as seen in the protein is determined primarily by itsown sequence, regardless of the interactions it may makewith the rest of the protein, with the solvent, or with other,neighboring molecules. One may broaden this statement asfollows: Each peptide has 100 or so low energy structuresof approximately equal energy value. The precise structureadopted by the loop in the protein may be chosen fromamong these by considerations arising from the rest of theprotein structure and the solvent atoms.
The above calculations were repeated by including in theenergy function a statistical mean force potential (Kanagasabaiet al. 2007). Such a potential had earlier been constructed(Sippl 1995) by analysis of all known high-resolution proteinstructures. Since the force field was now being used only forprediction of the structures of loops, we constructed it basedonly on the experimentally determined loop structures inproteins. This resulted in the following observations. Themean force potential increased the chances of locating thenear native structure in the conformational landscape andreduced the amount of incorrect and nonnative secondarystructural features in the peptides.
Docking of peptides and small molecules to proteins
One of the crucial steps in computer-aided drug discoveryis to identify a range of candidate molecules that bind at anidentified site on a receptor, usually a protein, and therebyinhibit its activity (Taylor et al. 2002; Brooijmans andKuntz 2003). Computer programs that implement in silicodocking procedures have helped speed up an otherwiseexpensive and time-consuming procedure. Such proceduresmake theoretical predictions regarding the association of aflexible ligand with a protein receptor and require anefficient sampling of the conformational space of theligand, as well as a way to arrive at the correct “pose” ofthe molecule in the receptor site. While several dockingmethodologies are currently available (Morris et al. 1998;Rarey et al. 1996; Jones et al. 1997; Makino and Kuntz1997), we have extended the MOLS algorithm as a novel“rigid receptor flexible ligand” docking method to simul-taneously sample both the “docking space” and theconformational space of the ligand. In extending the
Biophys Rev (2010) 2:169–179 175
method to the docking problem, the search space wasexpanded to include the docking space. If the conformationof the peptide is specified by the n torsion angles θ1 to θn,six additional parameters describe its pose in the receptorsite, three for the position and three for its orientation,making a total of n+6 dimensions in the search space (θ1 toθn+6 ). We define a function (the conformational potentialenergy of the ligand plus the interaction energy of ligandand receptor) of these n+6 variables and use the MOLSmethod to search for the minima of the function, tosimultaneously identify “correct” conformations and poses.
The method was first applied to 56 peptide-proteincomplexes whose structures were known (Arun Prasad andGautham 2008). The backbone rmsd of the “best” low
energy structure (i.e., the one closest to the experimentalstructure) identified by MOLS is within 2.00 Å of theexperimental structure in 30 of the 35 cases. In nine ofthese, the lowest energy pose and structure were the sameas the one with the lowest rmsd as compared to theexperimental structure. As for the rest of the structures,when the theoretical structures were binned by energy, theone with the lowest rmsd invariably lay in the lowest 20%energy bin. A unique and interesting feature of thealgorithm is its ability to identify alternate binding modes,sometimes with lower energies than the “native” bindingmode. Some of these alternatively docked structures areshown in Fig. 7. The method was further tested with smallorganic ligands docked to protein receptors (Viji et al.
Fig. 6 Stereo view of the super-imposed predicted (dark) andthe experimental structure (light)of a Rab4 binding domain ofRabenosyn5 (rmsd 3.6 Å), bVillin Head Piece (rmsd 5.2 Å),c engrailed homeo domain(rmsd 6.5 Å), d Avian Pancre-atic Polypeptide (rmsd 4.0 Å), ethe c-Myb protein (rmsd 6.1 Å),f Mellittin (rmsd 4.3 Å), and gTryptophan Zipper (rmsd 1.6 Å)
176 Biophys Rev (2010) 2:169–179
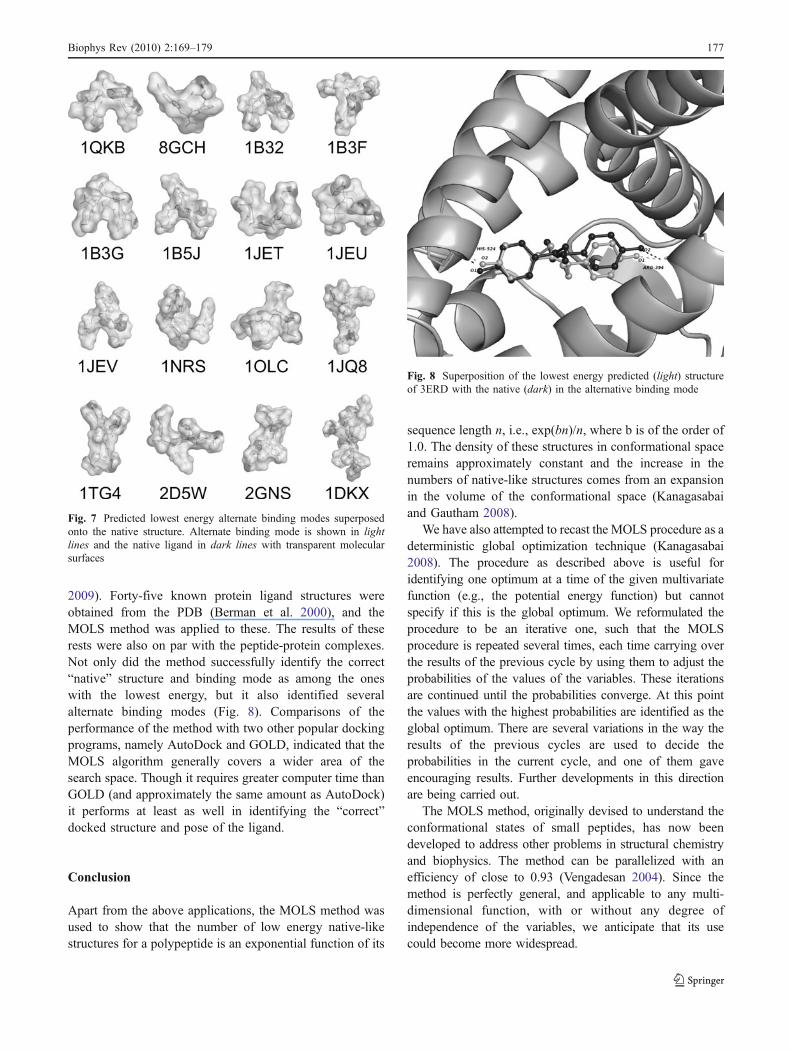
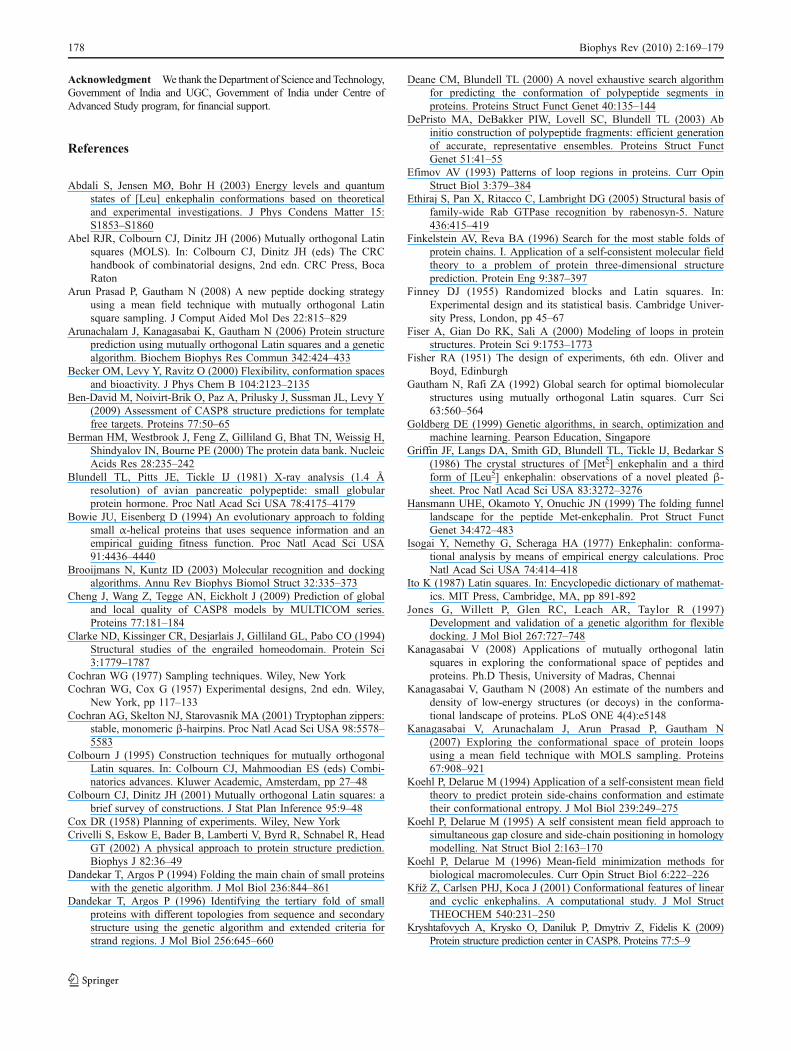
2009). Forty-five known protein ligand structures wereobtained from the PDB (Berman et al. 2000), and theMOLS method was applied to these. The results of theserests were also on par with the peptide-protein complexes.Not only did the method successfully identify the correct“native” structure and binding mode as among the oneswith the lowest energy, but it also identified severalalternate binding modes (Fig. 8). Comparisons of theperformance of the method with two other popular dockingprograms, namely AutoDock and GOLD, indicated that theMOLS algorithm generally covers a wider area of thesearch space. Though it requires greater computer time thanGOLD (and approximately the same amount as AutoDock)it performs at least as well in identifying the “correct”docked structure and pose of the ligand.
Conclusion
Apart from the above applications, the MOLS method wasused to show that the number of low energy native-likestructures for a polypeptide is an exponential function of its
sequence length n, i.e., exp(bn)/n, where b is of the order of1.0. The density of these structures in conformational spaceremains approximately constant and the increase in thenumbers of native-like structures comes from an expansionin the volume of the conformational space (Kanagasabaiand Gautham 2008).
We have also attempted to recast the MOLS procedure as adeterministic global optimization technique (Kanagasabai2008). The procedure as described above is useful foridentifying one optimum at a time of the given multivariatefunction (e.g., the potential energy function) but cannotspecify if this is the global optimum. We reformulated theprocedure to be an iterative one, such that the MOLSprocedure is repeated several times, each time carrying overthe results of the previous cycle by using them to adjust theprobabilities of the values of the variables. These iterationsare continued until the probabilities converge. At this pointthe values with the highest probabilities are identified as theglobal optimum. There are several variations in the way theresults of the previous cycles are used to decide theprobabilities in the current cycle, and one of them gaveencouraging results. Further developments in this directionare being carried out.
The MOLS method, originally devised to understand theconformational states of small peptides, has now beendeveloped to address other problems in structural chemistryand biophysics. The method can be parallelized with anefficiency of close to 0.93 (Vengadesan 2004). Since themethod is perfectly general, and applicable to any multi-dimensional function, with or without any degree ofindependence of the variables, we anticipate that its usecould become more widespread.
Fig. 8 Superposition of the lowest energy predicted (light) structureof 3ERD with the native (dark) in the alternative binding mode
Fig. 7 Predicted lowest energy alternate binding modes superposedonto the native structure. Alternate binding mode is shown in lightlines and the native ligand in dark lines with transparent molecularsurfaces
Biophys Rev (2010) 2:169–179 177
Acknowledgment We thank theDepartment of Science andTechnology,Government of India and UGC, Government of India under Centre ofAdvanced Study program, for financial support.
References
Abdali S, Jensen MØ, Bohr H (2003) Energy levels and quantumstates of [Leu] enkephalin conformations based on theoreticaland experimental investigations. J Phys Condens Matter 15:S1853–S1860
Abel RJR, Colbourn CJ, Dinitz JH (2006) Mutually orthogonal Latinsquares (MOLS). In: Colbourn CJ, Dinitz JH (eds) The CRChandbook of combinatorial designs, 2nd edn. CRC Press, BocaRaton
Arun Prasad P, Gautham N (2008) A new peptide docking strategyusing a mean field technique with mutually orthogonal Latinsquare sampling. J Comput Aided Mol Des 22:815–829
Arunachalam J, Kanagasabai K, Gautham N (2006) Protein structureprediction using mutually orthogonal Latin squares and a geneticalgorithm. Biochem Biophys Res Commun 342:424–433
Becker OM, Levy Y, Ravitz O (2000) Flexibility, conformation spacesand bioactivity. J Phys Chem B 104:2123–2135
Ben-David M, Noivirt-Brik O, Paz A, Prilusky J, Sussman JL, Levy Y(2009) Assessment of CASP8 structure predictions for templatefree targets. Proteins 77:50–65
Berman HM, Westbrook J, Feng Z, Gilliland G, Bhat TN, Weissig H,Shindyalov IN, Bourne PE (2000) The protein data bank. NucleicAcids Res 28:235–242
Blundell TL, Pitts JE, Tickle IJ (1981) X-ray analysis (1.4 Åresolution) of avian pancreatic polypeptide: small globularprotein hormone. Proc Natl Acad Sci USA 78:4175–4179
Bowie JU, Eisenberg D (1994) An evolutionary approach to foldingsmall α-helical proteins that uses sequence information and anempirical guiding fitness function. Proc Natl Acad Sci USA91:4436–4440
Brooijmans N, Kuntz ID (2003) Molecular recognition and dockingalgorithms. Annu Rev Biophys Biomol Struct 32:335–373
Cheng J, Wang Z, Tegge AN, Eickholt J (2009) Prediction of globaland local quality of CASP8 models by MULTICOM series.Proteins 77:181–184
Clarke ND, Kissinger CR, Desjarlais J, Gilliland GL, Pabo CO (1994)Structural studies of the engrailed homeodomain. Protein Sci3:1779–1787
Cochran WG (1977) Sampling techniques. Wiley, New YorkCochran WG, Cox G (1957) Experimental designs, 2nd edn. Wiley,
New York, pp 117–133Cochran AG, Skelton NJ, Starovasnik MA (2001) Tryptophan zippers:
stable, monomeric β-hairpins. Proc Natl Acad Sci USA 98:5578–5583
Colbourn J (1995) Construction techniques for mutually orthogonalLatin squares. In: Colbourn CJ, Mahmoodian ES (eds) Combi-natorics advances. Kluwer Academic, Amsterdam, pp 27–48
Colbourn CJ, Dinitz JH (2001) Mutually orthogonal Latin squares: abrief survey of constructions. J Stat Plan Inference 95:9–48
Cox DR (1958) Planning of experiments. Wiley, New YorkCrivelli S, Eskow E, Bader B, Lamberti V, Byrd R, Schnabel R, Head
GT (2002) A physical approach to protein structure prediction.Biophys J 82:36–49
Dandekar T, Argos P (1994) Folding the main chain of small proteinswith the genetic algorithm. J Mol Biol 236:844–861
Dandekar T, Argos P (1996) Identifying the tertiary fold of smallproteins with different topologies from sequence and secondarystructure using the genetic algorithm and extended criteria forstrand regions. J Mol Biol 256:645–660
Deane CM, Blundell TL (2000) A novel exhaustive search algorithmfor predicting the conformation of polypeptide segments inproteins. Proteins Struct Funct Genet 40:135–144
DePristo MA, DeBakker PIW, Lovell SC, Blundell TL (2003) Abinitio construction of polypeptide fragments: efficient generationof accurate, representative ensembles. Proteins Struct FunctGenet 51:41–55
Efimov AV (1993) Patterns of loop regions in proteins. Curr OpinStruct Biol 3:379–384
Ethiraj S, Pan X, Ritacco C, Lambright DG (2005) Structural basis offamily-wide Rab GTPase recognition by rabenosyn-5. Nature436:415–419
Finkelstein AV, Reva BA (1996) Search for the most stable folds ofprotein chains. I. Application of a self-consistent molecular fieldtheory to a problem of protein three-dimensional structureprediction. Protein Eng 9:387–397
Finney DJ (1955) Randomized blocks and Latin squares. In:Experimental design and its statistical basis. Cambridge Univer-sity Press, London, pp 45–67
Fiser A, Gian Do RK, Sali A (2000) Modeling of loops in proteinstructures. Protein Sci 9:1753–1773
Fisher RA (1951) The design of experiments, 6th edn. Oliver andBoyd, Edinburgh
Gautham N, Rafi ZA (1992) Global search for optimal biomolecularstructures using mutually orthogonal Latin squares. Curr Sci63:560–564
Goldberg DE (1999) Genetic algorithms, in search, optimization andmachine learning. Pearson Education, Singapore
Griffin JF, Langs DA, Smith GD, Blundell TL, Tickle IJ, Bedarkar S(1986) The crystal structures of [Met5] enkephalin and a thirdform of [Leu5] enkephalin: observations of a novel pleated β-sheet. Proc Natl Acad Sci USA 83:3272–3276
Hansmann UHE, Okamoto Y, Onuchic JN (1999) The folding funnellandscape for the peptide Met-enkephalin. Prot Struct FunctGenet 34:472–483
Isogai Y, Nemethy G, Scheraga HA (1977) Enkephalin: conforma-tional analysis by means of empirical energy calculations. ProcNatl Acad Sci USA 74:414–418
Ito K (1987) Latin squares. In: Encyclopedic dictionary of mathemat-ics. MIT Press, Cambridge, MA, pp 891-892
Jones G, Willett P, Glen RC, Leach AR, Taylor R (1997)Development and validation of a genetic algorithm for flexibledocking. J Mol Biol 267:727–748
Kanagasabai V (2008) Applications of mutually orthogonal latinsquares in exploring the conformational space of peptides andproteins. Ph.D Thesis, University of Madras, Chennai
Kanagasabai V, Gautham N (2008) An estimate of the numbers anddensity of low-energy structures (or decoys) in the conforma-tional landscape of proteins. PLoS ONE 4(4):e5148
Kanagasabai V, Arunachalam J, Arun Prasad P, Gautham N(2007) Exploring the conformational space of protein loopsusing a mean field technique with MOLS sampling. Proteins67:908–921
Koehl P, Delarue M (1994) Application of a self-consistent mean fieldtheory to predict protein side-chains conformation and estimatetheir conformational entropy. J Mol Biol 239:249–275
Koehl P, Delarue M (1995) A self consistent mean field approach tosimultaneous gap closure and side-chain positioning in homologymodelling. Nat Struct Biol 2:163–170
Koehl P, Delarue M (1996) Mean-field minimization methods forbiological macromolecules. Curr Opin Struct Biol 6:222–226
Kříž Z, Carlsen PHJ, Koca J (2001) Conformational features of linearand cyclic enkephalins. A computational study. J Mol StructTHEOCHEM 540:231–250
Kryshtafovych A, Krysko O, Daniluk P, Dmytriv Z, Fidelis K (2009)Protein structure prediction center in CASP8. Proteins 77:5–9
178 Biophys Rev (2010) 2:169–179
Leszczynski JF, Rose GD (1986) Loops in globular proteins: a novelcategory of secondary structure. Science 234:849–855
Levy Y, Becker OM (2001) Energy landscapes of conformationallyconstrained peptides. J Chem Phys 114:993–1009
Lindman HR (1974) Analysis of variance in complex experimentaldesigns. W. H. Freeman, San Francisco
Liu Z, Dominy BN, Shakhnovich EI (2004) Structural mining: self-consistent design on flexible protein-peptide docking andtransferable binding affinity potential. J Am Chem Soc126:8515–8528
MacKerell AD Jr, Bashford D, Bellott M, Dunbrack RL Jr, EvanseckJD, Field MJ, Fischer S, Gao J, Guo H, Ha S, Joseph-McCarthyD, Kuchnir L, Kuczera K, Lau FTK, Mattos C, Michnick S, NgoT, Nguyen DT, Prodhom B, Reiher WE III, Roux B, SchlenkrichM, Smith JC, Stote R, Straub J, Watanabe M, Wiorkiewicz-Kuczera J, Yin D, Karplus M (1998) All-atom empirical potentialfor molecular modeling and dynamics studies of proteins. J PhysChem B 102:3586–3616
Makino S, Kuntz ID (1997) Automated flexible ligand dockingmethod and its application for database search. J Comput Chem18(14):1812–1825
Mandl R (1985) Orthogonal Latin squares: an application of experimen-tal design to compiler testing. Commun ACM 28:1054–1058
Marcotte I, Separovic F, AugerM, Gagne SM (2004) Amultidimensional1 H NMR investigation of the conformation of methionine-enkephalin in fast-tumbling. Biophys J 86:1587–1600
McKnight CJ, Matsudaira PT, Kim PS (1997) NMR structure of the35-residue villin headpiece subdomain. Nat Struct Biol 4:180–184
Mead R (1988) The design of experiments. Cambridge UniversityPress, Cambridge
Meinert CL (1986) Clinincal trials: design, conduct and analysis.Oxford University Press, New York
Montgomery DC (2000) Design and analysis of experiments, 5th edn.Wiley, New York
Morris GM, Goodsell DS, Halliday RS, Huey R, Hart WE, Belew RK,Olson AJ (1998) Automated docking using a Lamarckian geneticalgorithm and an empirical binding free energy function. JComput Chem 19:1639–1662
Némethy G, Gibson KD, Palmer KA, Yoon CN, Paterlini G, Zagari A,Rumsey S, Scheraga HA (1992) Energy parameters in polypep-tides. 10. Improved geometrical parameters and nonbondedinteractions for use in the ECEPP/3 algorithm, with applicationto proline-containing peptides. J Phys Chem 96:6472–6484
Pearce SC (1983) The agricultural field experiment: a statisticalexamination of theory and practice. Wiley, New York
Piela L, Kostrowicki J, Scheraga HA (1989) The multiple-minimaproblem in the conformational analysis of molecules. Deforma-tion of the potential energy hypersurface by the diffusionequation method. J Phys Chem 93:3339–3346
Raghavarao D (1971) Construction and combinatorial problems indesign of experiments. Wiley, New York
Raman S, Vernon R, Thompson J, Tyka M, Sadreyev R, Pei J, Kim D,Kellogg E, Di Maio F, Lange O, Kinch L, Sheffler W, Kim B,Das R, Grishin NV, Baker D (2009) Structure prediction forCASP8 with all-atom refinement using Rosetta. Proteins 77:89–99
Ramya L, Gautham N (2009) Effects of hydration on the conforma-tional energy landscape of the pentapeptide Met-enkephalin. JChem Theory Comput 5:2180–2190
Rarey M, Kramer B, Lengauer T, Klebe G (1996) A fast flexibledocking method using an incremental construction algorithm. JMol Biol 261:470–489
Ring CS, Kneller DG, Langridge R, Cohen FE (1992) Taxonomy andconformational analysis of loops in proteins. J Mol Biol224:685–699
Ryser HJ (1963) Combinatorial mathematics. Mathematical Associa-tion of America, Washington, DC pp 79–84
Schulze-Kremer S (2000) Genetic algorithms and protein folding. In:Webster D (ed) Methods in molecular biology, protein structureprediction: methods and protocols. Humana, New Jersey, pp175–222, 143
Sippl MJ (1995) Knowledge-based potentials for proteins. Curr OpinStruct Biol 5:229–235
Sudarsanam S, DuBose RF, March CJ, Srinivasan S (1995) Modellingprotein loops using a φi+1, ψi dimer database. Protein Sci4:1412–1420
Sun S (1995) A genetic algorithm that seeks native states of proteins.Biophys J 69:340–355
Tahirov TH, Sato K, Ichikawa-Iwata E, Sasaki M, Inoue-Bungo T,Shiina M, Kimura K, Takata S, Fujikawa A, Morii H, KumasakaT, Yamamoto M, Ishii S, Ogata K (2002) Mechanism of c-Myb-C/EBPβ cooperation from separated sites on a promoter. Cell108:57–70
Taylor RD, Jewsbury PJ, Essex JW (2002) A review of protein-smallmolecule docking methods. J Comput Aided Mol Des 16:151–166
Terwilliger TC, Eisenberg D (1982) The structure of mellittin. I.Structure determination and partial refinement. J Biol Chem257:6010–6015
Unger R, Moult J (1993) Genetic algorithms for protein foldingsimulations. J Mol Biol 231:75–81
van Vlijmen HWT, Karplus M (1997) PDB based protein loopprediction: parameters for selection and methods for optimiza-tion. J Mol Biol 267:975–1001
Vengadesan K (2004) Sampling the molecular potential energysurface using mutually orthogonal Latin squares and applica-tion to peptide sequences. Ph.D Thesis, University of Madras,Chennai
Vengadesan K, Gautham N (2003) Enhanced sampling of themolecular potential energy surface using mutually orthogonalLatin squares: application to peptide structures. Biophys J84:2897–2906
Vengadesan K, Gautham N (2004a) Conformational studies on enkepha-lins using the MOLS technique. Biopolymers 74:476–494
Vengadesan K, Gautham N (2004b) Energy landscape of Met-enkephalin and Leu-enkephalin drawn using mutually orthogonalLatin squares sampling. J Phys Chem B 108:11196–11205
Viji SN, Arun Prasad P, Gautham N (2009) Protein-ligand dockingusing mutually orthogonal latin squares (MOLSDOCK). J ChemInf Model 49:2687–2694
Weiner SJ, Kollman PA, Nguyen DT, Case DA (1986) An all atomforce field for simulations of proteins and nucleic acids. JComput Chem 7:230–252
Wojcik J, Mornon J, Chomilier J (1999) New efficient statisticalsequence dependant structure prediction of short to medium sizedprotein loops based on an exhaustive loop classification. J MolBiol 289:1469–1490
Zhang J, Wang Q, Barz B, He Z, Kosztin I, Shang Y, Xu D (2010)MUFOLD: A new solution for protein 3D structure prediction.Proteins 78:1137–1152
Biophys Rev (2010) 2:169–179 179