Molecular phylogeny of acariform mites (Acari, Arachnida): Strong conflict between phylogenetic...
21
This article appeared in a journal published by Elsevier. The attached copy is furnished to the author for internal non-commercial research and education use, including for instruction at the authors institution and sharing with colleagues. Other uses, including reproduction and distribution, or selling or licensing copies, or posting to personal, institutional or third party websites are prohibited. In most cases authors are permitted to post their version of the article (e.g. in Word or Tex form) to their personal website or institutional repository. Authors requiring further information regarding Elsevier’s archiving and manuscript policies are encouraged to visit: http://www.elsevier.com/copyright
Transcript of Molecular phylogeny of acariform mites (Acari, Arachnida): Strong conflict between phylogenetic...

This article appeared in a journal published by Elsevier. The attachedcopy is furnished to the author for internal non-commercial researchand education use, including for instruction at the authors institution
and sharing with colleagues.
Other uses, including reproduction and distribution, or selling orlicensing copies, or posting to personal, institutional or third party
websites are prohibited.
In most cases authors are permitted to post their version of thearticle (e.g. in Word or Tex form) to their personal website orinstitutional repository. Authors requiring further information
regarding Elsevier’s archiving and manuscript policies areencouraged to visit:
http://www.elsevier.com/copyright

Author's personal copy
Molecular phylogeny of acariform mites (Acari, Arachnida): Strong conflictbetween phylogenetic signal and long-branch attraction artifacts
Miroslawa Dabert a, Wojciech Witalinski b, Andrzej Kazmierski c, Ziemowit Olszanowski d, Jacek Dabert c,*
a Molecular Biology Techniques Laboratory, Faculty of Biology, Adam Mickiewicz University, Umultowska 89, 61-614 Poznan, Polandb Department of Comparative Anatomy, Institute of Zoology, Jagiellonian University, Ingardena 6, 30-060 Krakow, Polandc Department of Animal Morphology, Faculty of Biology, Adam Mickiewicz University, Umultowska 89, 61-614 Poznan, Polandd Department of Animal Taxonomy and Ecology, Faculty of Biology, Adam Mickiewicz University, Umultowska 89, 61-614 Poznan, Poland
a r t i c l e i n f o
Article history:Received 10 October 2009Revised 19 December 2009Accepted 21 December 2009Available online 6 January 2010
Keywords:ActinotrichidaAstigmataEndeostigmataOribatidaTrombidiformesLBA artifactMolecular datingPhylogeny18S rRNACOINetwork analyses
a b s t r a c t
Acariformes (one of the two main lineages of Acari) represent an exceptionally diverse group of Arach-nida. We performed first comprehensive phylogenetic analysis of Acariformes using sequence data fromthe nuclear small subunit rRNA gene (18S rDNA) and the mitochondrial cytochrome c oxidase subunit I(COI, amino acids). Our analyses confirm the monophyly of Acariformes and recognize two orders withinAcariformes: Sarcoptiformes, consisting of Endeostigmata and Oribatida + Astigmata, and Trombidifor-mes. The data revealed the origin of Astigmata within Oribatida with the desmonomatan superfamilyCrotonioidea as the source of astigmatan radiation and the sexual family Hermanniidae as the sistergroup, which generally supports previous morphological hypotheses. These results were found despitethe strong conflict between long-branch attraction (LBA) artifacts and phylogenetic signal. It is likely thatthe conflict resulted from differences in the substitution rates among acariform lineages, especially com-paring slowly evolving Oribatida with rapidly evolving Astigmata. The use of likelihood methods consid-ered more resistant to LBA only slightly decreased the chance of falling into the LBA trap; the probabilityof recovering the origin of Astigmata within Desmonomata differs only by about 10% from that of havingthe long branched Astigmata and Trombidiformes either connected directly or shifted to deep parts of thetree due to outgroup attraction. Molecular dating using the rate-smoothing method PATHd8 shows thatAcariformes originated c. 435 MYA and were probably among the earliest arthropods invading terrestrialhabitats in late Silurian or the Lower Devonian, when the first vascular plants are thought to have arisen.Our analyses did not support the monophyly of Acari because we recovered clades Acariformes–Solifugaeand Parasitiformes–Pseudoscorpionida. However, a formal revision of arachnid classification that wouldreflect these results must await future analyses.
� 2009 Elsevier Inc. All rights reserved.
1. Introduction
Acari (mites and ticks) are an exceptionally diverse group ofArachnida (Chelicerata) in both form and life strategies. Theapproximately 50 thousand named species represent only a smallfraction of the real taxonomic diversity, which is sometimes esti-mated at more than one million species (Alberti, 2005). The mainmite evolutionary tendency, extreme body miniaturization, makesthem one of the smallest-bodied metazoans and allows them to ex-ploit nearly all imaginable terrestrial and many aquatic habitats(Krantz and Walter, 2009; Walter and Proctor, 1999). A vast mitenumber are commensals and parasites of an equally high diversityof plant and animal hosts. They also have an important influence
on human life, being pests and disease vectors of domesticated ani-mal and crops, and some parasites pose serious medical threats tohumans.
Despite their importance, it is still not clear if this marvelousacarine diversity derives from a single ancestor or if ‘‘a mite-style”body plan originated independently from two or more arachnidancestors (for review see Dunlop and Alberti, 2008). Regardlessof their view on this question, most authors agree that mites com-prise two main, internally monophyletic groups, the superordersAcariformes and Parasitiformes (Lindquist et al., 2009). A pro-nounced difference between them is that typical setae are birefrin-gent in acariform mites but isotropic in parasitiform mites; thisproperty is expressed in the alternative names for these groups,Actinotrichida and Anactinotrichida (Alberti, 2005; van derHammen, 1979).
Traditionally the superorder Acariformes is considered to com-prise four main groups of various taxonomic ranks: Astigmata,Endeostigmata, Oribatida (=Cryptostigmata), and Trombidiformes
1055-7903/$ - see front matter � 2009 Elsevier Inc. All rights reserved.doi:10.1016/j.ympev.2009.12.020
* Corresponding author. Fax: +48 618295739.E-mail addresses: [email protected] (M. Dabert), [email protected] (J. Dabert).
Molecular Phylogenetics and Evolution 56 (2010) 222–241
Contents lists available at ScienceDirect
Molecular Phylogenetics and Evolution
journal homepage: www.elsevier .com/locate /ympev

Author's personal copy
(=Prostigmata s.l. or Actinedida) (Lindquist et al., 2009). The phylo-genetic affinities among these lineages and their taxonomic conse-quences, especially the origin of the vast cohort Astigmata, are asubject of widespread and unfinished debate. The specific existinghypotheses were summarized by Norton (1998). Early authors pos-tulated Oribatida (moss mites) as a group deriving within Astig-mata with Trombidiformes as the sister clade (Berlese, 1897;Jacot, 1933; Oudemans, 1923) or Astigmata being the sister groupof Trombidiformes and lacking close relationship with Oribatida(Grandjean, 1937, 1939). Further morphological investigationshave rejected these ideas and a close phylogenetic relationship be-tween Astigmata and Oribatida, collectively forming the orderSarcoptiformes, and being the sister clade to the second orderTrombidiformes has been widely accepted. In this context, thereare two opposing hypotheses: (1) both Astigmata and Oribatidaare monophyletic and sister groups (Krantz, 1960; Mironov andBochkov, 2009; Woolley, 1961) or (2) a lineage within Oribatidawas the sister group of Astigmata (Lindquist et al., 2009; Norton,1994, 1998, 2007; Norton and Kethley, 1994; OConnor, 1984;Sitnikova, 1978; Zakhvatkin, 1953). The within-Oribatida origin ofAstigmata, probably in the supercohort Desmonomata (Fig. 1A),has been much better supported (14 morphological synapomor-phies; Norton, 1998) and achieved wider acceptance. Especiallyevident and convincing were arguments about the homology ofopisthonotal glands in Astigmata and derived Oribatida, and anal-yses of the chemical composition of their secretions (Raspotniget al., 2007; Sakata and Norton, 2001).
Phylogenetic relationships within the order Trombidiformeshave been analyzed much less intensively, with only two cladistichypotheses available for comparison. Kethley (in Norton et al.,1993; Fig. 2A) concluded that Trombidiformes (=Prostigmata)comprises two large clades, Eleutherengonides (=Eleutherengona)and Anystides + Eupodides (=Anystina + Eupodina). In Lindquist’shypothesis (1996; Fig. 2B) Eupodides are basal to the clade Eleu-therengonides + Anystides. Both authors included the Parasiten-gonina (water mites and velvet mites) in the supercohortAnystides, either as a member of paraphyletic Anystina (Kethley)or as the sister group of Anystina (Lindquist). In addition, thereare doubts concerning boundaries of the entire order Trombidifor-mes. The problem concerns the relatively small but phylogeneti-cally important suborder Endeostigmata, which is consideredeither as a member of Trombidiformes (e.g. Evans, 1992; Kethley,1982; Krantz, 1978) or of Sarcoptiformes (e.g. Lindquist et al.,2009; OConnor, 1984). Endeostigmatids are commonly regardedas the earliest derivative members of Acariformes (Norton et al.,1993). Both their monophyly and taxonomic status (a separate or-der vs. a taxon within Trombidiformes or Sarcoptiformes) havebeen disputed (for review see OConnor, 1984). Thorough morpho-logical analyses based on cladistic methods have revealed thesemites as an artificial paraphyletic taxon (Kethley in Norton et al.,1993; OConnor, 1984). According to this view one group of endeo-stigmatids, Sphaerolichida, is the sister group to Prostigmata s.s.,the most species rich core taxon of Trombidiformes. All remainingendeostigmatid groups, constituting the paraphyletic suborderEndeostigmata s.s., are basal to the clade Oribatida + Astigmataand constitute with them the large order Sarcoptiformes (Lindquistet al., 2009).
Sparse molecular phylogenetic reconstructions of relationshipsamong main groups of Acariformes have given surprisingly contra-dictory results. The first published analyses supported the origin ofAstigmata within Oribatida but suffered from poor (Murrell et al.,2005) or strongly unbalanced taxon sampling (Maraun et al.,2004). The most comprehensive paper devoted to the origin ofAstigmata (Domes et al., 2007) recovered Oribatida and Astigmataas two separate, well-supported monophyletic taxa; moreover,Astigmata were more closely related to the Endeostigmata–Trom-
bidiformes complex than to Oribatida (Fig. 1B). However, thishypothesis was not applied to the most recent classification ofacariform mites (Lindquist et al., 2009) where cohorts Astigmata,Nothrina, and Brachypylina are members of the supercohortDesmonomata.
The validity of molecular phylogenetic reconstructions can bestrongly affected by variation in the rate of nucleotide substitutionamong lineages. Taxa with high substitution rates are representedby long branches in phylogenetic trees; these branches could beerroneously linked as sister groups or placed with the outgroupdue to long-branch attraction (LBA) artifacts (Bergsten, 2005; Fel-senstein, 1978). Several methods to avoid LBA artifacts have beenproposed (Bergsten, 2005): exclusion of rapidly evolving, saturatedand/or randomized alignment positions; including representativetaxa with low substitution rates; and adding more taxa to the anal-ysis to break up long branches are the most widely suggested.Methodological artifacts also can be detected using consensus net-
Fig. 1. Two alternative hypotheses of the Astigmata–Oribatida phylogeneticrelationships. (A) In the morphological reconstruction (Norton, 1994, 1998) thebasal position in oribatid mites is occupied by Palaeosomata and Enarthronotawithout clearly defined reciprocal relationships, the glandulate Parhyposomata aresituated more distally, Mixonomata and Desmonomata are paraphyletic, the lattertaxon is the source for the monophyletic Brachypylina and Astigmata. (B) In themolecular reconstruction (Domes et al., 2007) Enarthronota are the basal taxon andAstigmata are the sister group of part of a polyphyletic Endeostigmata. Dashed line:relationships uncertain, red circle: origin of opisthonotal glands. (For interpretationof the references to color in this figure legend, the reader is referred to the webversion of this paper.)
M. Dabert et al. / Molecular Phylogenetics and Evolution 56 (2010) 222–241 223

Author's personal copy
work analysis (Bandelt, 1995; Holland et al., 2004, 2005; Kennedyet al., 2005). This data-exploration method, similar to spectralanalysis, indicates contradictory phylogenetic signals includingthose caused by LBA (Bergsten, 2005; Bleidorn et al., 2007).
In mites, which are a very ancient and diverse taxon, the substi-tution rates among lineages are remarkably different (Domes et al.,2007; Klompen et al., 2007; Murrell et al., 2005). Murrell et al.(2005) showed, mainly for parasitiform mites, that a high rate ofnucleotide substitution is correlated with a short generation timeand that particular mite taxa differ substantially with respect tothese parameters. Domes et al. (2007) also took into account thatthe vastly different generation times of Astigmata and Oribatidamay result in evolutionary rate differences and lead to LBA arti-facts. They did not detect an LBA influence using standard recom-mended tests, but certain problems—an unbalanced ingrouprepresentation, poor sampling of the outgroup taxa, and the lackof information on relative substitution rates among taxa—raisequestions about their results and make it worthwhile to revisit thisissue.
In this paper we propose first comprehensive phylogeneticreconstruction of the major lineages of Acariformes, in the contextof the remaining acarine groups and other arachnid orders, as in-ferred from sequences coding for the small subunit rRNA (18SrRNA) gene and a fragment of the cytochrome c oxidase subunit I(COI).
2. Material and methods
2.1. Taxonomic sampling
Our sampling strategy incorporated a balanced set of representa-tives of the main acariform mite groups, at the cost of extensive spe-cies sampling. We applied in separate analyses two differentmarkers and sets of taxa representing the same acariform groupsto extract suspected phylogenetic conflict due to LBA artifacts. A to-tal of 176 species belonging to 104 families were analyzed (Table 1).The Acariformes ingroup consisted of 142 species (75 families) andincluded the following: 56 species (25 families) of Astigmata, 51(29) of Oribatida, 29 (16) of Trombidiformes, and 6 (5) of Endeostig-mata. Outgroup taxa consisted of 14 species (11 families) belongingto the second superorder of mites, Parasitiformes, and 20 speciesrepresenting the non-mite arachnid orders: Amblypygi (2 species),Araneae (2), Opiliones (2), Palpigradi (1), Pseudoscorpionida (3), Ric-inulei (2), Schizomida (1), Scorpiones (3), and Solifugae (3). The mer-ostomatid Limulus polyphemus (Xiphosura, Limulidae) was used as adistant outgroup. Detailed information on about the sampled speci-mens is published with sequence data in the GenBank database un-der the listed accession numbers (Table 1) and can be provided uponrequest. Specimen and DNA vouchers are deposited in the collectionof the Department of Animal Morphology and Molecular BiologyTechniques Laboratory (Adam Mickiewicz University in Poznan, Po-land), respectively.
2.2. Molecular markers
Sequences for this study come from universal molecular markersused for phylogenetic studies: small subunit ribosomal RNA gene(18S rDNA hereafter) from the nuclear genome and the amino acid se-quence of the cytochrome c oxidase subunit I (COI hereafter) frommitochondrial DNA. The 18S rRNA gene has proven useful for distantlyrelated lineages of Acari, either used alone (Murrell et al., 2005) or intandem with other sequences, i.e. fragments of the large subunit ribo-somal RNA (28S rDNA) and/or elongation factor 1 alpha (ef1a) (Domeset al., 2007; Klimov and OConnor, 2008; Klompen et al., 2007).
Nucleotide sequences of COI (the DNA barcode region chosen bythe Consortium for the Barcode of Life, http://barcoding.si.edu) havebeen used for Acari only at the species and genus levels (Dabert et al.,2008; Skoracka and Dabert, 2010; Whiteman et al., 2006). However,this marker was recently used for higher-level phylogenetic studiesin other invertebrates, including arachnids (Fuchs et al., 2009; Muri-enne et al., 2008). Moreover, it has been shown that such short se-quences can yield important and accurate information about thecomposition of the entire mitochondrial genome (Min and Hickey,2007). We chose to use amino acid sequences of COI instead of nucle-otides, as nucleotide sequences are more susceptible to substitu-tional saturation. Furthermore, substitution models for amino acidsequences are much simpler than those for DNA sequences, whichresults in a much higher likelihood and may consequently help re-solve problematic nodes (Nei and Kumar, 2000; Rota-Stabelli et al.,2009). Additionally, a specific matrix of amino acid replacement(e.g. MtArt) based on arthropod mitochondrial genomes could sub-stantially improve the phylogenetic analysis (Abascal et al., 2006;Carapelli et al., 2007). In view of the higher substitution rate of themitochondrial genome, we limited the use of COI to resolving rela-tionships within Acariformes in relation to the outgroup revealedby 18S rDNA analyses.
2.3. DNA extraction, amplification, and sequencing
Mites were preserved in 96% ethyl alcohol and mounted onmicroscopic slides in Faure medium, as primary vouchers, after
Fig. 2. Alternative hypotheses concerning phylogenetic relationships in Trombid-iformes based on morphological cladistic analyses. (A) Tree compiled from resultsof Kethley (in Norton et al., 1993) and OConnor (1984). (B) Phylogenetic hypothesisproposed by Lindquist (1996). The position of Labidostomatides within Eupodides isquestioned by other authors (Lindquist et al., 2009; Krantz, 1978).
224 M. Dabert et al. / Molecular Phylogenetics and Evolution 56 (2010) 222–241

Author's personal copy
Table 1Specimens included in this study. Mite classification after Lindquist et al. (2009), remaining arachnid classification after Hallan (2008).
Taxonomy Species Voucher 18S rDNA COI
AcariAcariformes
Astigmata‘‘Acaridia” Acaridae Acarus farris AMUFM681 – GQ864338
Acarus siro – AF022023* –Rhizoglyphus robinii AMURr01 – GQ864356Rhizoglyphus sp. – AF287236* –Sancassania berlesei SAN1606 GQ864331 –Tyroborus lini – EF203768* –Tyroborus sp. AMUENV048 – GQ864332Tyrophagus putrescentiae – DQ025510* –
Carpoglyphidae Carpoglyphus lactis AMUCl01 GQ864327 GQ864345Chortoglyphidae Chortoglyphus arcuatus – AF022028* –Glycyphagidae Lepidoglyphus destructor – AY499557* –Heterocoptidae Heterocoptidae sp. – EU152506* –Histiostomatidae Bonomoia sp. AMUBon02 GQ864326 GQ864343
Histiostoma ferroniarum AMUHF01 GQ864328 –Hypoderatidae Neottialges evansi AMUHyp02 GQ864330 –
Phalacrodectes gaudi AMUHyp01 GQ864329 –Psoroptidia Analgidae Analges corvinus AMUFM649 – GQ864337
Analges passerinus AMUAna01 GQ864306 –Analges sturninus AMUAns01 – GQ864342Anhemialges longipes AMUFM742 – GQ864340Diplaegidia columbae AMUFM232 GQ864310 GQ864351
Avenzoariidae Avenzoaria totani AMUAv063 GQ864307 GQ864348Pomeranzevia ninnii AMUFM210 GQ864313 GQ864359Scutomegninia sp. AMUScu01 – GQ864357
Chirodiscidae Schizocarpus sp. AMUChi01 – GQ864344Falculiferidae Falculifer rostratus AMUFal01 GQ864311 –Freyanidae Freyana anatina AMUFre01 GQ864315 GQ864352Gabuciniiade Hieracolichus nisi AMUVe003 – GQ864360Knemidocoptidae Knemidocoptes sp. AMUKne01 GQ864317 –Kramerellidae Kramerella oti AMUKr02 GQ864318 –Listrophoridae Leporacarus gibbus AMUFM643 – GQ864335
Lynxacarus mustelae AMUFM645 GQ864319 GQ864336Prolistrophorus sp. – EU152589* –
Myocoptidae Myocoptidae sp. AMUMyo01 – GQ864341Proctophyllodidae Joubertophyllodes modularis AMUFM716 – GQ864339
Monojoubertia microphylla AMUPro01 GQ864321 GQ864353Proctophyllodes stylifer AMUPsPj02 GQ864322 GQ864354
Pterolichidae Grallobia fulicae AMUFM205 – GQ864333Pterolichus obtusus – EU152513* –Xoloptes blaszaki AMUFM231 – GQ864350
Pteronyssidae Pteronyssoides striatus AMUPte01 GQ864323 GQ864355Sturnotrogus truncatus AMUStt01 GQ864324 GQ864358
Psoroptidae Chorioptes bovis AMUChor01 GQ864308 –Otodectes cynotis AMUOto01 GQ864320 –
Pyroglyphidae Dermatophagoides farrinae AMUDF01 AMUDF01 –Dermatophagoides pteronyssinus – DQ025511* –Euroglyphus sp. AMUEUR1506 – GQ864346Paralgopsis sp. – EU152575* –Sturnophagoides bakeri – EU152576* –
Syringobiidae Phyllochaeta bouveti AMUFM213 GQ864314 –Syringobia longipenis AMUFM230 – GQ864349
Trouessartiidae Trouessartia funiculata – AY620906* –Trouessartia rosterii AMUTrr01 GQ864325 –Trouessartia sp.n. AMUFM627 – GQ864334
Xolalgidae Glaucalges attenuatus AMUFM211 GQ864316 –Ingrassia sp.n. AMUFM204 GQ864312 GQ864347
Endeostigmata Alicorhagiidae Alicorhagia sp. – AF022024* –Alycidae Alycus roseus AMUENV042 GQ864294 GQ864363
Bimichaelia sp. AMUENV088 GQ864295Nanorchestidae Nanorchestidae sp.1 AMUENV014 – GQ864361
Nanorchestidae sp.2 AMUENV039 – GQ864362Terpnacaridae Terpnacarus gibbosus – AY620904* –
OribatidaBrachypylina Carabodidae Carabodes sp. AMUOR020 GQ864283 GQ864367
Carabodes subarcticus – EF091429* –Chamobatidae Chamobates sp. AMUENV232 – GQ864388Damaeidae Spatiodamaeus subverticillipes AMUENV213 – GQ864382
Damaeidae sp.1 AMUENV005 – GQ864365Damaeidae sp.2 AMUENV006 – GQ864366
Eremaeidae Eremaeus oblongus AMUOR10 GQ864287 GQ864377
(continued on next page)
M. Dabert et al. / Molecular Phylogenetics and Evolution 56 (2010) 222–241 225

Author's personal copy
Table 1 (continued)
Taxonomy Species Voucher 18S rDNA COI
Euzetidae Euzetes globulosus – AF022030* –Galumnidae Acrogalumna longipluma AMUOR04 GQ864304 GQ864373
Pergalumna nervosa AMUENV211 – GQ864381Pergalumna sp. AMUENV220 – GQ864384
Gymnodamaeidae Gymnodamaeus bicostatus AMUOR06 GQ864285 GQ864375Liacaridae Adoristes ovatus AMUOR09 GQ864286 –Liodidae Liodes sp. – AF022035* –Oribatulidae Oribatula tibialis AMUENV231 – GQ864387Phenopelopidae Eupelops torulosus AMUENV218 – GQ864383Scutoverticidae Scutovertex sculptus AMUOR08 GQ864305 GQ864376Tegoribatidae Tegoribatidae sp. AMUENV202 GQ864380 –Tectocepheidae Tectocepheus velatus AMUOR03 GQ864284 GQ864386Xenillidae Xenillus tegeocranus – AF022042* –
Enarthronota Eniochthoniidae Eniochthonius minutissimus – EF091428* –Hypochthoniidae Eohypochthonius gracilis – EF203777* –
Hypochthonius rufulus – AF022033* –Hypochthonius sp. UJMH01 GQ864293 –
Lohmanniidae Lohmannia banksi – AF022036* –Meristolohmannia meristacaroides – AF287234* –
Mixonomata Collohmanniidae Collohmannia sp. – AF022029* –Euphthiracaridae Euphthiracarus sp. AMUOR021 – GQ864368
Rhysotritia duplicata – EF091417* –Nehypochthoniidae Nehypochthonius porosus – EF081308* –Phthiracaridae Atropacarus sp. AMUOR101 – GQ864369
Atropacarus striculus – EF091416* –Phthiracarus longulus AMUENV222 – GQ864385Steganacarus applicatus AMUOR05 GQ864301 GQ864374Steganacarus magnus – AF022040* –Steganacarus spinosus AMUOR106 – GQ864370
Nothrina Camisiidae Camisia biurus – EF081302* –Heminothrus capillatus AMUAnHc GQ864288 –Nothrus sp. UJW03 GQ864292 GQ864379Platynothrus peltifer AMUPP09 GQ864291 –
Hermanniidae Hermannia gibba UJHgib GQ864289 GQ864372Hermannia sp.1 UJHER2 – GQ864371Hermannia sp.2 UJHER1 – GQ864378
Malaconothridae Malaconothrus sp. AMUMal01 GQ864290 –Nanhermanniidae Nanhermannia coronata – EF091421* –Trhypochthoniidae Allonothrus russeolus – AF022025* –
Archegozetes longisetosus AMUAnAl01 AF022027* GQ864364Trhypochthonius americanus – EF081298* –Trhypochthonius tectorum – AF022041* –
Palaeosomata Palaeacaridae Palaeacarus hystricinus – EF204472* –Parhyposomata Gehypochthoniidae Gehypochthonius urticinus – AF022031* –TrombidiformesAnystides Anystidae Anystis sp. – AF022026* –
Caeculidae Microcaeculus sp. – AF287232* –Eleutherengonides Cheyletidae Neochelacheles messersmithi – AY620908* –
Syringophilidae Syringophilidae sp. – GQ864269 –Eupodides Eupodoidea sp.1 AMUENV017 – GQ864395
Eupodoidea sp.2 AMUENV228 – GQ864398Eupodoidea sp.3 AMUENV229 – GQ864399Eupodoidea sp.4 AMUENV214 – GQ864396Eupodoidea sp.5 AMUENV225 – GQ864397
Eupodidae Eupodes variegatus AMUENV031 – GQ864392Eupodidae sp. AMUENV025 GQ864273 –Linopodes motatorius AMUAK01 GQ864270 –Linopodes sp. AMUENV071 GQ864274 –
Iolinidae Tydaeolinae sp. AMUENV015 – GQ864394Penthaleidae Penthaleus cf. major AMUENV012 GQ864271 GQ864389
Penthaleus sp. AMUENV018 – GQ864391Rhagidiidae Rhagidia sp.1 AMUVe007 GQ864275 –
Rhagidia sp.2 AMUENV016 GQ864272 –Tydeidae Lorryia woolleyi AMUENV035 – GQ864393
Labidostomatides Labidostomatidae Labidostomma luteum AMUENV013 GQ864278 GQ864390Labidostomma sp.1 AMUVe009 – GQ864402Labidostomma sp.2 – AF022034* –
Parasitengonina Hydryphantidae Partnunia steinmanni AMUHyd033 GQ864276 –Hygrobatidae Hygrobates longipalpis AMUHyd062 GQ864277 –
Hygrobates sp. AMUHyd037 – GQ864401Johnstonianidae Johnstoniana errans AMUHyd057 GQ864282 –Microtrombidiidae Dactylothrombium pulcherrimum AMUENV085 GQ864281 –Sperchontidae Sperchon violaceus AMUHyd027 GQ864279 GQ864400Trombidiidae Trombidiinae sp. AMUENV055 GQ864280 –
226 M. Dabert et al. / Molecular Phylogenetics and Evolution 56 (2010) 222–241
Author's personal copy
DNA extraction. When feasible, total genomic DNA was extractedfrom single specimens using DNeasy Blood and Tissue Kit (QiagenGmbH, Hilden, Germany) as described by Dabert et al. (2008). Forrelatively small mite species, DNA was extracted from several spec-imens (5–30). The complete 18S rDNA (c. 1.8 kb) was PCR-amplifiedin two overlapping fragments of about 950 and 1500 bp each, usingprimer pairs 18SF/rev960 and f1230/rev18S, respectively (Table 2).PCRs were carried out in 25 ll reaction volumes containing reactionbuffer (10 mM Tris–HCl pH 8.8, 50 mM KCl, 0.08% Nonidet P40),1.5 mM MgCl2, 0.1 mM dNTPs, 0.25 lM each primer, 1.25 U HighFidelity polymerase (Novazym, Poznan, Poland) and 5 ll of DNA tem-plate using a thermocycling profile of one cycle of 3 min at 96 �C fol-lowed by 35 steps of 10 s at 95 �C, 15 s at 50 �C, 90 s at 72 �C, with a
final step of 5 min at 72 �C. The COI gene fragment was amplified andsequenced with degenerate primers (Table 2). PCR was carried out in25 ll reaction volume containing reaction buffer, 1.5 mM MgCl2,0.1 mM dNTPs, 1 lM each primer, 1.25 U Taq polymerase (Allegro,Novazym, Poznan, Poland) and 5 ll of DNA template using a thermo-cycling profile of one cycle of 3 min at 96 �C followed by 40 steps of10 s at 95 �C, 30 s at 50 �C, 1 min at 72 �C, with a final step of 5 min at72 �C.
After amplification, 5 ll of the PCR reaction was analyzed byelectrophoresis on a 1% agarose gel. Samples containing visiblebands were directly sequenced using 1–2 ll of the PCR reactionand 50 pmol of the sequencing primer. Sequencing was performedwith BigDye Terminator v3.1 on an ABI Prism 3130XL Analyzer
Table 1 (continued)
Taxonomy Species Voucher 18S rDNA COI
ParasitiformesHolothyrida Allothyridae Allothyrus sp. – AF018655* –
Holothyridae Sternothyrus braueri – AY620912* –Ixodida Argasidae Argas persicus – L76353* –
Ixodidae Ixodes affinis – L76350* –Mesostigmata Zerconidae Zercon sp. – AY665725* –
Parasitidae Euparasitus similis UJWW51 GQ864299 –Parasitus kraepelini UJWW07 GQ864296 –Vulgarogamasus sp. AgUX087 GQ864300 –
Veigaiidae Veigaia sp. AgUX049 GQ864298 –Trachyuropodidae Trachyuropoda sp. AgUX014 GQ864297 –Trigonuropodidae Trigonuropoda sp. – DQ144648* –Sejidae Uropodella laciniata – AY620930* –
Opilioacarida Opilioacaridae Opilioacaridae sp. – AF287235* –Opilioacarus texanus – AF115375* –
ArachninaAmblypygi Euamblypygi Phrynichidae Damon gracilis – AY829920* –
Neoamblypygi Phrynidae Paraphrynus sp. – AF005445* –Araneae Mesothelae Liphistiidae Liphistius bicoloripes – AF007104* –
Mygalomorphae Hexathelidae Atrax sp. – AF370784* –Opiliones Eupnoi Phalangiidae Oligolophus tridens AMUOli1 GQ864302 –
Rilaena triangularis AMURil1 GQ864303 –Palpigradi Eukoeneniidae Eukoenenia sp. – AF207648* –Pseudoscorpionida Iocheirata Chernetidae Americhernes sp. – AF124934* –
Neobisiidae Roncus cf. pugnax – AF005443* –Olipiidae Calocheiridius cf. termitophilus – AY859559* –
Ricinulei Neoricinulei Ricinoididae Pseudocellus pearsei – U91489* –Ricinoididae sp. – AF124930* –
Schizomida Schizomina Hubbardiidae Stenochrus portoricensis – AF005444* –Scorpiones Neoscorpii Buthidae Androctonus australis – X77908* –
Chactidae Belisarius xambeui – AF005442* –Scorpionidae Pandinus imperator – AY210831* –
Solifugae Ammotrechidae Nothopuga sp. – – EU024482*
Eremobatidae Chanbria regalis – AF124931* –Karschiidae Eusimonia wunderlichi – U29492* –
MerostomataXiphosura Limulina Limulidae Limulus polyphemus – L81949* –
* Sequence drawn from GenBank.
Table 2PCR primers used in this study; a and s refer to amplifying and sequencing, respectively.
Primer Sequence Product Use Specificity Source
18Sfw CTTGTCTCAAAGATTAAGCCATGCA 18S rRNA a, s Arachnida This studyrev480 GTTATTTTTCGTCACTACCT 18S rRNA s Arachnida This studyfw390 AATCAGGGTTCGATTCCGGAGA 18S rRNA a, s Arachnida This studyrev960 GACGGTCCAAGAATTTCAC 18S rRNA a, s Arachnida This studyfw1230 TGAAACTTAAAGGAATTGACG 18S rRNA s Arachnida Skoracka and Dabert (2010)rev1460 CATCACAGACCTGTTATTGC 18S rRNA s Arachnida This studyfw770 ACTTTGAAAAAATTAGAGTGC 18S rRNA s Arachnida This studyrev18S TGATCCTTCCGCAGGTTCACCT 18S rRNA a, s Arachnida This studybcdF05 TTTTCTACHAAYCATAAAGATATTGC COI a, s Astigmata Dabert et al. (2008)bcdF04 TTTTCTACHAAYCAYAAAGATAT COI a, s Acariformes Dabert et al. (2008)bcdF01 CATTTTCHACTAAYCATAARGATATTGG COI a, s Acariformes* This studybcdR04 TATAAACYTCDGGATGNCCAAAAAA COI a, s Acariformes Dabert et al. (2008)
* Except for Astigmata and some Trombidiformes.
M. Dabert et al. / Molecular Phylogenetics and Evolution 56 (2010) 222–241 227

Author's personal copy
(Applied Biosystems, Foster City, CA, USA). Sequence chromato-grams were checked for accuracy and contigs edited and assem-bled using FinchTV 1.3.1 (Geospiza Inc.) and GenDoc 2.7.000(Nicholas and Nicholas, 1997).
2.4. Sequence alignments
Initial sequence alignment of 18S rDNA was made in ClustalX1.81 (Thompson et al., 1997) using default parameters (gap open-ing = 15, gap extension = 6.66, delay divergent sequences = 30%,and DNA transition weight = 0.5). The resulting file was then ad-justed manually based on sequence similarity among closely-re-lated taxa together with available secondary structure ofDrosophila melanogaster (M21017) and a draft of the 18S rRNAstructure for Arachnida (M. Szymanski, personal communication).The core of the secondary structure of 18S rRNA in mites is similarto that in other animals. Although some regions in particular mitelineages have greatly different sequence composition and domainlengths, compared with other arthropods or even other acariformmites, no sequence data were excluded from the final 18S rDNAdataset for phylogenetic analyses. We assumed that the cost ofremoving these data might be greater than the value of avoidingpossible phylogenetic noise. These variable regions comprise sitesthat are alignable across closely-related taxa and contain valuablephylogenetic signal (Lee, 2001; Gillespie, 2004; Mallatt and Giribet,2006; Sanderson and Shaffer, 2002). Also we generated a second18S rDNA alignment in which all ambiguous regions associatedwith gaps were removed. This ‘‘conserved alignment” was usedto test differences in the relative rate of substitution among lin-eages in the search for long-branch attraction artifacts.
The final 18S rDNA alignment comprised 1917 sites for 130 taxa.The amount of missing data and wildcards did not exceed 50% for anyhaplotype, although it was very close to this critical value in Tectoce-pheus velatus (49.6%). The mean base frequencies in 18S rDNA align-ments were: A = 0.26526, C = 0.21433, G = 0.26733, T = 0.25308, andwere homogenous across taxa (v2 = 372.06, p > 0.5). In the data ma-trix 876 characters were parsimony-informative, 804 were constant,and 237 were variable but parsimony-uninformative.
The COI DNA sequences were aligned manually and convertedinto amino acids in GeneDoc. Low-quality base calls that are typi-cally found near the 5’ and 3’ ends of the sequence were excludedfrom the analysis. The final alignment comprised 564 bp (188 ami-no acids) of unambiguous sequence data for 71 acariform speciesand one solifugid outgroup, Nothopuga sp. (NC_009984). The num-ber of variable sites was 109. An amino acid deletion was found intwo Nanorchestidae species (specimen vouchers AMUENV014,AMUENV039) at the position corresponding to valine 89 in theCOI coded by NC_009984.
All sequences generated for this study (63 for the 18S rDNA and71 for the COI) have been deposited in GenBank under AccessionNos. GQ864269–402 (see Table 1). The 18S rDNA alignment andtrees (MP1, ML, and BI) have been published in TreeBASE underthe study Accession No. S2536 (matrix Accession No. M4845).
2.5. Phylogenetic methods
Nucleotide pair frequencies and a chi-square test of base fre-quency homogeneity across all taxa were calculated using PAUP*
4.0b10 (Swofford, 2002). The two datasets (18S rDNA and COI ami-no acid sequence alignments) were analyzed separately, since thespecies sampling differed in details (Table 1). Trees were recon-structed by three methods: maximum parsimony (MP) and twolikelihood approaches, maximum likelihood (ML) and Bayesianinference with Markov Chain Monte Carlo (BI). These methodsare based on different methodological concepts and therefore havedifferent susceptibility to long-branch attraction and other arti-
facts that can produce false results (Anderson and Swofford,2004; Mar et al., 2005; Merl et al., 2005; Reeb et al., 2004). We ap-plied this range of approaches to reveal possible conflicts amongdata and/or methods.
MP analysis was performed with PAUP* 4 on unordered charac-ters using a standard unweighted heuristic search with randomaddition of taxa, 500 replications, and TBR branch swapping. Intwo separate runs gaps were treated either as missing data(MP1) or as a fifth state (MP2). The confidence level of consistencyindex (CI) value was evaluated according to the formula proposedby Klassen et al. (1991). For the two likelihood-based methods, anappropriate model of DNA sequence evolution was determinedusing Modeltest 3.7 (Posada and Buckley, 2004; Posada and Crand-all, 1998) for ML and MrModeltest for BI (Nylander, 2004); for ami-no acid sequences the best-fit model of evolution was selectedusing ProtTest 2.0 (Abascal et al., 2005). ML analyses for 18S rDNAwere performed with Garli v.0.96 (Zwickl, 2006) with 100 searchreplications, while COI amino acids were analyzed with Treefindersoftware (Jobb, 2008) with search-depth level 2. BI was run on theparallel version of MrBayes 3.1.2 (Ronquist and Huelsenbeck,2003) through the on-line Computational Biology Service Unit atCornell University and in a Dell Precision Workstation 490 withQuad Core Xeon processor X5355. The Bayesian analyses of 18SrDNA with 4–8 MCMC chains used following settings: nruns = 2,nst = 6, rates = invgamma, each run of 10 million generations sam-pled every 1000. For the Bayesian analysis of the COI amino aciddataset we applied the same substitution model as for ML (usingappropriate substitution matrix coded by prset command) with 5million generations. The final consensus trees for both 18S rDNAand COI analyses were generated after discarding 25–75% (burn-in fraction) of the initial trees. All analyses were considered as fin-ished when standard deviation of split frequencies dropped below0.01.
Branch support for MP trees was assessed by the bootstrapmethod (Felsenstein, 1985) with 1000 replications as implementedin PAUP; additionally, cluster stability was estimated by decay/support indices (Bremer, 1988) using PRAP 2.06 (Müller, 2004) to-gether with PAUP software. ML support was calculated by 500bootstrap replications in Garli for the 18S rDNA data and by1000 approximate bootstrap tests (LR-ELW edge support, Strimmerand Rambaut, 2002) in Treefinder for the COI data. Bayesian a pos-teriori probability estimated the stability of trees obtained by BI.We considered clades to be ‘‘well supported” if values equaled orexceeded 70% for bootstrap and 0.95 for Bayesian posterior proba-bility (Douady et al., 2003).
Substitution rates among sequences grouped in phylogeneti-cally defined lineages were compared by relative-rate tests usingRRTree v1.1 (Robinson et al., 1998; Robinson-Rechavi and Huchon,2000).
Consensus networks were visualized with SplitsTree v.4.9.1(Huson and Bryant, 2006) using 2500 shortest and suboptimal (1step shorter) trees produced by MP analysis, 2500 trees chosenby random from both run files of Bayesian analysis (fraction afterdiscarding burn-in trees), and 100 best ML trees generated by Garlisoftware; splits transformation was according to convex hullmethod, no edge weights, thresholds applied 0.04–0.4 (alternativesless common than the threshold value were not shown). Treeswere edited using Mesquite v. 2.01 (Maddison and Maddison,2007), TreeView 1.6.6 (Page, 1996), and MEGA4 (Tamura et al.,2007).
2.6. Age estimation and fossil calibrations
To estimate divergence times for major acariform lineages, the18S rDNA tree identified by the ML analysis was used. This topol-ogy was chosen because this tree was better-resolved than those
228 M. Dabert et al. / Molecular Phylogenetics and Evolution 56 (2010) 222–241
Author's personal copy
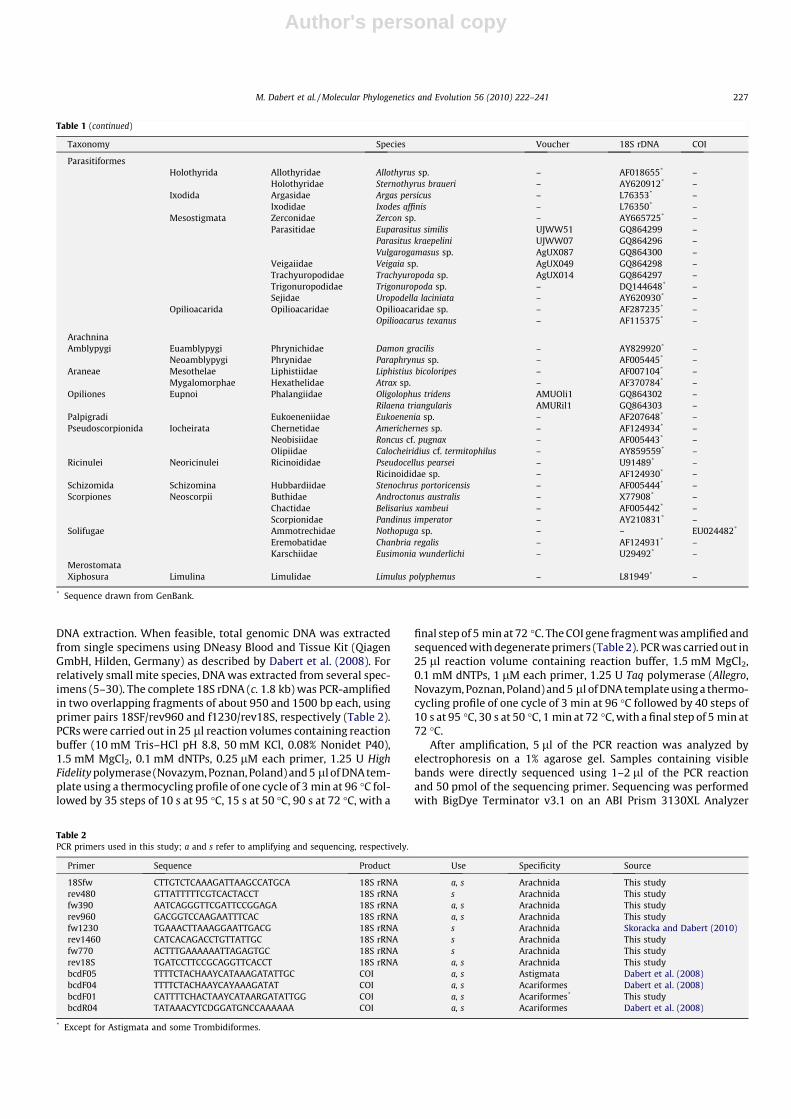
derived from the BI analysis. The chronogram was produced usingthe rate-smoothing method PATHd8 (Britton et al., 2006). Thismethod assumes local molecular clocks in particular tree seg-ments, smoothing the mean substitution rates between sister taxaby sequentially taking averages over path lengths from an inter-node to all its descending terminals (Ericson et al., 2006). The esti-mates of PATHd8 are biased for nodes with no adjacent fixed-agenodes; therefore increasing the number of fixed-age nodes im-proved the estimate (Svennblad, 2008). In age estimation analysiswe used the oldest, to our knowledge, fossils pertaining to therespective group of acariform mites, extensively gathered and crit-ically analyzed by Dunlop and Selden (2009) and supplemented byastigmatan (Perkovsky et al., 2007) and trombidiform (Poinar,1985) records (Table 3). In the PATHd8 analysis we used a fixed-age root (Xiphosura, c. 445 MYA) and minimum-age constraintswhich acted as 36 calibration points for calculation of the remain-ing node ages. The geological time scale derives from the Interna-tional Stratigraphic Chart 2009 prepared by InternationalCommission on Stratigraphy (http://stratigraphy.org/index.php?id=Home).
3. Results
3.1. Phylogenetic reconstruction based on 18S rDNA
The MP analysis treating gaps as missing data (MP1) yielded1085 equally parsimonious trees of length 7541 (Fig. 3). The basicconsistency indices (excluding uninformative characters) for thesetrees were: CI = 0.2464, retention index (RI) = 0.6949, rescaled con-sistency index (RC) = 0.1897. Treating gaps as a 5th character state(MP2) reduced the number of shortest trees to 36 but increasedtheir length to 10816; consistency indices were: CI = 0.2785,RI = 0.7098, RC = 0.2225 (tree not shown). In both cases the ob-tained CI value was much better than the critical one for the givennumber of taxa (0.0318).
Although both reconstructions were greatly inconsistent(p < 0.001) some similarities in relationships among main Acarigroups are evident. Firstly, there is moderate support for the diphy-letic origin of mites. Parasitiform mites form a monophyletic group(MP1 bootstrap 68%, Bremer index 1; MP2 59%, 2) with Pseudoscor-pionida as the sister group (66%, 5; 67%, 5). Acariform mites are
Table 3Classification and ages of fossils used as calibration points for divergence time estimation. MAC: minimum age constraint (MYA, million years ago), node #: node number in thechronogram (Fig. 11).
Taxonomy Oldest fossil record MAC Reference Node #
AstigmataAcaridae (=Tyroglyphidae) Neogene, Miocene 16 Pampaloni (1902) 1‘‘Acarus” rhombeus1 Paleogene, Eocene 40 Perkovsky et al. (2007) 2
EndeostigmataAlicorhagiidae Devonian, Pragian 410 Hirst (1923), Dubinin (1962) 3Alycidae Devonian, Pragian 410 Hirst (1923), Dubinin (1962) 4, 5*
OribatidaCarabodidae Paleogene, Eocene 49 Sellnick (1931) 6Collohmanniidae Paleogene, Eocene 49 Sellnick (1919), Norton (2006) 7Ctenacaridae2 Devonian, Frasnian 385 Subías and Arillo (2002) 8Devonacaridae3 Devonian, Givetian 392 Norton et al. (1988) 9Eremaeidae Paleogene, Eocene 49 Sellnick (1919) 10Euphthiracaridae Quaternary, Holocene 0.01 Sellnick (1919) 11Euzetidae Quaternary, Holocene 0.01 Sellnick (1931) 12Galumnidae Paleogene, Eocene 49 Sellnick (1931) 13Gehypochthoniidae Carboniferous, Mississippian 330 Subías and Arillo (2002) 14Gymnodamaeidae Paleogene, Eocene 49 Sellnick (1919) 15Hermanniidae Paleogene, Eocene 49 Norton (2006) 16Hydrozetidae4 Jurassic, Sinemurian 197 Sivhed and Wallwork (1978) 17Hypochthoniidae Carboniferous, Mississippian 330 Subías and Arillo (2002) 18Liacaridae Paleogene, Eocene 49 Sellnick (1919) 19Liodidae Paleogene, Eocene 49 Sellnick (1919) 20Malaconothridae Quaternary, Holocene 0.01 Norton (2006) 21Nanhermanniidae Quaternary, Holocene 0.01 Krivolutsky and Krasilov (1977) 22Phthiracaridae Paleogene, Eocene 49 Sellnick (1919) 23Scutoverticidae Neogene, Miocene 16 Woolley (1971), Norton and Poinar (1993) 24Tectocepheidae Paleogene, Eocene 49 Sellnick (1931) 25Trhypochthoniidae Jurassic, Upper 161 Krivolutsky and Krasilov (1977) 26
TrombidiformesAnystidae Cretaceous, Albian 112 Zacharda and Krivoluckij (1985) 27Caeculidae Paleogene, Eocene 49 Coineau and Magowski (1994) 28Cheyletidae Cretaceous, Albian 100 Cockerell (1917) 29Lebertiodea Paleogene, Oligocene 35 Poinar (1985) 30Penthalodidae Paleogene, Eocene 49 Koch and Berendt (1854) 31Rhagidiidae Paleogene, Eocene 49 Judson and Wunderlich (2003) 32Trombidiidae Paleogene, Eocene 50 Koch and Berendt (1854) 33Tydeidae5 Devonian, Pragian 410 Hirst (1923), Dubinin (1962) 34Solifugae Carboniferous, Upper 308 Petrunkevitch (1913) 35Xiphosura Ordovician, Upper 445** Rudkin et al. (2008) 36
1 Assumed as most closely related to Glycyphagidae.2 Assumed as basal Palaeosomata.3 Assumed as basal Enarthronota.4 Assumed as basal Brachypylina.5 Assumed as basal Eupodoidea.* Calibration points for Alycus and Bimichaelia are set separately as Alycidae is not monophyletic in our analysis.
** Fixed.
M. Dabert et al. / Molecular Phylogenetics and Evolution 56 (2010) 222–241 229

Author's personal copy
Fig. 3. Maximum parsimony 18S rDNA tree of Arachnida according to reconstruction with gaps treated as missing data (MP1). The support of branches is given as bootstrapvalue for 500 MP replications (italic) and Bremer support (regular). Only bootstrap values above 50% are shown. Taxa in quotations are paraphyletic; aca: Acaridia, amb:Amblypygi, any: Anystides, ar: Araneae, br: Brachypylina, Ele, ele: Eleutherengonides, En, en: Enarthronota, END, end: Endeostigmata, eup: Eupodides, hol: Holothyrida, ix:Ixodida, Lab, lab: Labidostomatides, me: Mesostigmata, Mx, mx: Mixonomata, nt: Nothrina, op: Opiliones, opa: Opilioacarida, Pal, pal: Palaeosomata, par: Parasitengonina, pgr:Palpigradi, psc: Pseudoscorpionida, pso: Psoroptidia, Py, py: Parhyposomata, ric: Ricinulei, sc: Scorpiones, sch: Schizomida, sol: Solifugae, xi: Xiphosura.
230 M. Dabert et al. / Molecular Phylogenetics and Evolution 56 (2010) 222–241
Author's personal copy
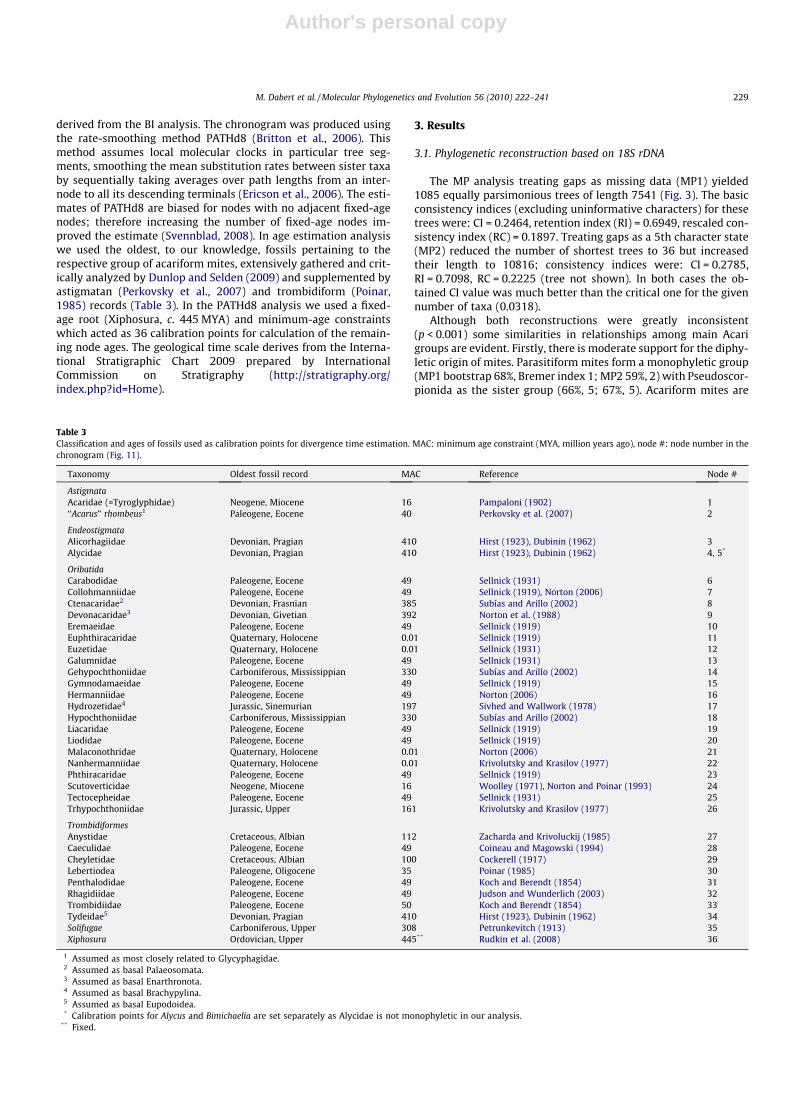
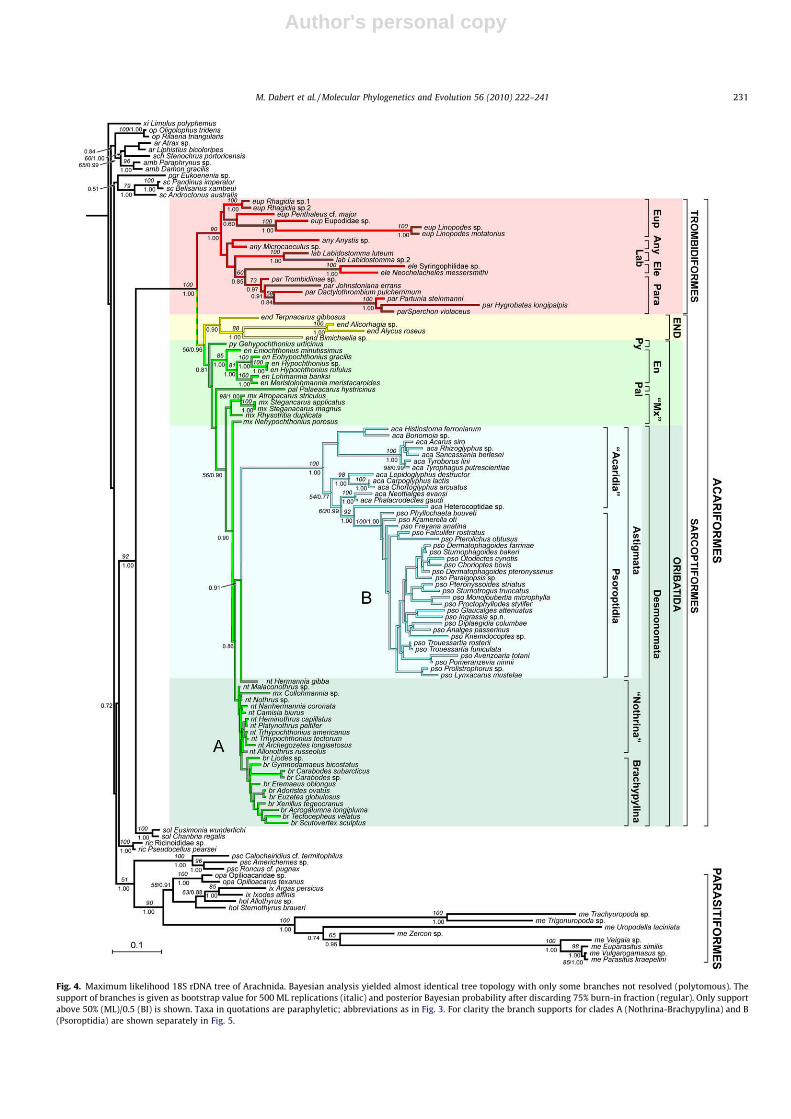
Fig. 4. Maximum likelihood 18S rDNA tree of Arachnida. Bayesian analysis yielded almost identical tree topology with only some branches not resolved (polytomous). Thesupport of branches is given as bootstrap value for 500 ML replications (italic) and posterior Bayesian probability after discarding 75% burn-in fraction (regular). Only supportabove 50% (ML)/0.5 (BI) is shown. Taxa in quotations are paraphyletic; abbreviations as in Fig. 3. For clarity the branch supports for clades A (Nothrina-Brachypylina) and B(Psoroptidia) are shown separately in Fig. 5.
M. Dabert et al. / Molecular Phylogenetics and Evolution 56 (2010) 222–241 231

Author's personal copy
monophyletic (99%, 19; 100%, 20) with solifugids as the sister group(56%, 4; 67%, 4). Also the monophyly of Endeostigmata is postulated(1; 5) although the membership of Terpnacaridae in this clade ispoorly supported. Relationships within Acariformes were differentin the two analyses. In MP1 the acariform mites form two clades,one uniting Endeostigmata with monophyletic Oribatida, the secondconsisting of paraphyletic Trombidiformes from which monophy-letic Astigmata originate (100%, 34). Astigmata comprise a paraphy-letic Acarididia from which is derived a monophyletic Psoroptidia(100%, 24) with Heterocoptidae as the sister group (83%, 7). AnalysisMP2 recovered the clade Trombidiformes (98%, 4) and an oddly com-posed clade (<50%) comprising the remaining acariforms: the upperregions of the astigmatid Psoroptidia subtree included also severalrepresentatives of all main lineages of Oribatida and some represen-tatives of acaridid mites. Because of these unreasonable reconstruc-tions only the MP1 analysis will be considered further.
Both likelihood-based analyses yielded very similar results(Figs. 4 and 5). Differences were all due to unresolved parts of theBI tree that were reconstructed in the ML analysis; however, theseML clades were poorly supported (bootstrap below 50%) and in factboth trees are almost fully consistent. The diphyletic origin of mites,including the same relationships with non-mite arachnids as in theMP1 analysis, was also revealed by ML and BI analyses: the parasiti-form clade (ML bootstrap 90%, BI posterior probability 1.00) haspseudoscorpions as the sister group (51%, 1.00) and the acariformclade (100%, 1.00) has solifugids as the sister group (92%, 1.00). Theinternal structure of Acariformes is very different from that recon-structed by parsimony analysis (MP1). The basal monophyleticTrombidiformes (90%, 1.00) are the sister group of the clade unitingall other acariform mites (<56%, 0.96). Both likelihood analyses re-vealed Eupodides as basal to the clade Anystides (Labidostomatides(Eleutherengonides + Parasitengonina). However these relation-ships are weakly supported, except for the moderately supportedparasitengonine-eleutherengonone clade (60%, 0.85). Well (0.90)to weakly (<50%) supported Endeostigmata are the sister group ofthe clade Oribatida + Astigmata (<50%, 0.81). Oribatid mites are re-vealed as paraphyletic, being the ‘‘source” taxon for Astigmata(100%, 1.00), which diverged within basal Desmonomata; the sis-ter-group relationship between Astigmata and Hermannia is wellsupported by BI analysis (0.91) but weakly by ML (<50%). Astigmatacomprise a paraphyletic Acarididia and a monophyletic Psoroptidia(100%, 1.00) with Heterocoptidae as the sister group (92%, 1.00).
3.2. Phylogenetic reconstruction based on COI amino acids
Relationships within Acariformes were analyzed with ML and BIusing the outgroup revealed by the 18S rDNA analyses (Solifugae).
The recovered phylogenetic structure (Fig. 6) generally is similar tothe 18S rDNA ML and BI trees, but not to the MP1 reconstruction.Paraphyletic Trombidiformes occupy basal positions and comprisetwo well-supported clades: Eupodides (100% edge support, 1.00Bayesian posterior probability) and Labidostomatides + Parasiten-gonina (81%, 1.00). The later clade is the sister group to the weaklysupported clade Endeostigmata + Oribatida + Astigmata (52%,<0.5). Weakly supported Endeostigmata are basal to the Oribat-ida + Astigmata clade, which is strongly supported by ML (96%)but weakly by BI (0.58). As recovered by the likelihood analysesof the 18S rDNA, this analysis also resolves Astigmata as a clade(100%, 1.00) that arises from within Oribatida. However, due topoorly reconstructed internal relationships in all four acariformclades, the inferred sister-group relationship among Astigmataand members of the highly derived oribatid taxon Brachypylina(in ML Spatiodamaeus, 59%, in BI Carabodes, 0.54) is questionable.
3.3. Relative-rate tests
The mean substitution rates (MSR) of 18S rDNA in the four mainacariform groups, relative to the outgroup (Solifugae), are shown inFig. 7. The MSR in Astigmata was highest (0.236), nearly threetimes that of Oribatida (0.085, p < 0.02). In Trombidiformes the ratewas significantly higher than in oribatids (0.187, p < 0.003) butlower than in Astigmata (not significant, p > 0.4). The rate observedin Endeostigmata (0.141) was higher than in Oribatida and lowerthan in Astigmata and Trombidiformes but the differences werenot statistically significant (p > 0.1).
Removing of the ambiguous regions associated with gaps fromthe alignment did not change the observed pattern and even madeit more pronounced. Still Astigmata showed the highest substitu-tion rate (0.179), more than three times that observed in Oribatida(0.055, p < 0.04). Again in Trombidiformes the rate was higher thanin Oribatida (0.130, p < 0.02), but showed no significant differencewith Astigmata (p > 0.4). Endeostigmata with MSR of 0.089 evolvedslower than Astigmata and Trombidiformes (p > 0.1 and p > 0.2,respectively) but faster than Oribatida (differences were not statis-tically significant, p > 0.1).
A similar pattern was discovered for COI amino acid sequences.The astigmatid mites showed the highest substitution rate (0.455),over twice that of Oribatida; the later taxon had the lowest MSR(0.216, p < 0.01). Although the rates in Trombidiformes and Endeo-stigmata were nearly the same (c. 0.324, p > 0.99), the observeddifference in MRS between trombidiforms and Oribatida was atthe lower limit of statistical significance (p = 0.05), while that be-tween endeostigmatids and Oribatida was not significant(p > 0.07).
Fig. 5. Branch supports for Nothrina–Brachypylina (A) and Psoroptidia (B) clades of the 18S rDNA tree (Fig. 4). Only support above 50% (ML)/0.5 (BI) is shown; br:Brachypylina, mx: Mixonomata, nt: Nothrina, pso: Psoroptidia.
232 M. Dabert et al. / Molecular Phylogenetics and Evolution 56 (2010) 222–241

Author's personal copy
3.4. Conflict in phylogenetic signal
Consensus network analysis for all 2500 optimal and selectedsuboptimal (1 step longer) maximum parsimony 18S rDNA treesdiscovered no substantial conflict in the data; the relationshipsamong main lineages discovered in the original MP1 analysis wererecovered in almost all instances (Fig. 8). Sparse conflicts wereweak and concerned Endeostigmata. Compared to the MP1 tree(Fig. 3), the alternative for monophyletic Oribatida (96%) was aclade Endeostigmata + Desmonomata + Palaeacarus (4%). A weak
alternative to the Oribatida + Endeostigmata clade (94%) was aclade Astigmata + Trombidiformes + Endeostigmata (6%). None ofthe MP trees revealed Astigmata as a clade within oribatid mites.
The consensus network analyses carried out for 100 maximumlikelihood and 2500 Bayesian inference 18S rDNA trees (burn-in = 25%) gave almost the same results; some small differencesconcerned only those ML clades that were unresolved in the BItrees (Fig. 8). The likelihood trees contained strong evidence forconflict in the relationships among main acariform lineages wherealternative hypotheses are almost equiprobable. The hypotheses
Fig. 6. Maximum likelihood COI amino acid tree of Acariformes. Bayesian analysis produced a tree having similar relationships but less basal resolution and better structurewithin Astigmata. The support of branches is given as LR-ELW edge support for 1000 ML replications (italic) and posterior Bayesian probability after discarding 25% burn-infraction (regular). Only support above 50% (ML)/0.5 (BI) is shown. Taxa in quotations are paraphyletic; aca: Acaridia, br: Brachypylina, end: Endeostigmata, eup: Eupodides,lab: Labidostomatides, mx: Mixonomata, nt: Nothrina, par: Parasitengonina, pso: Psoroptidia.
M. Dabert et al. / Molecular Phylogenetics and Evolution 56 (2010) 222–241 233

Author's personal copy
postulating paraphyletic Oribatida as a source taxon for Astigmata(54–57%) were only 11–12% more likely to reconstruct thanhypotheses of oribatid (42–45%) and astigmatid-endeostigmatid(43–46%) clades. Raising the burn-in fraction to 75% dramaticallyincreased the probability of recovering the origin of Astigmatawithin nothrine Oribatida (83–86%); monophyly of Oribatida orAstigmata + Endeostigmata were found much more rarely (13–14% and 12–14%, respectively).
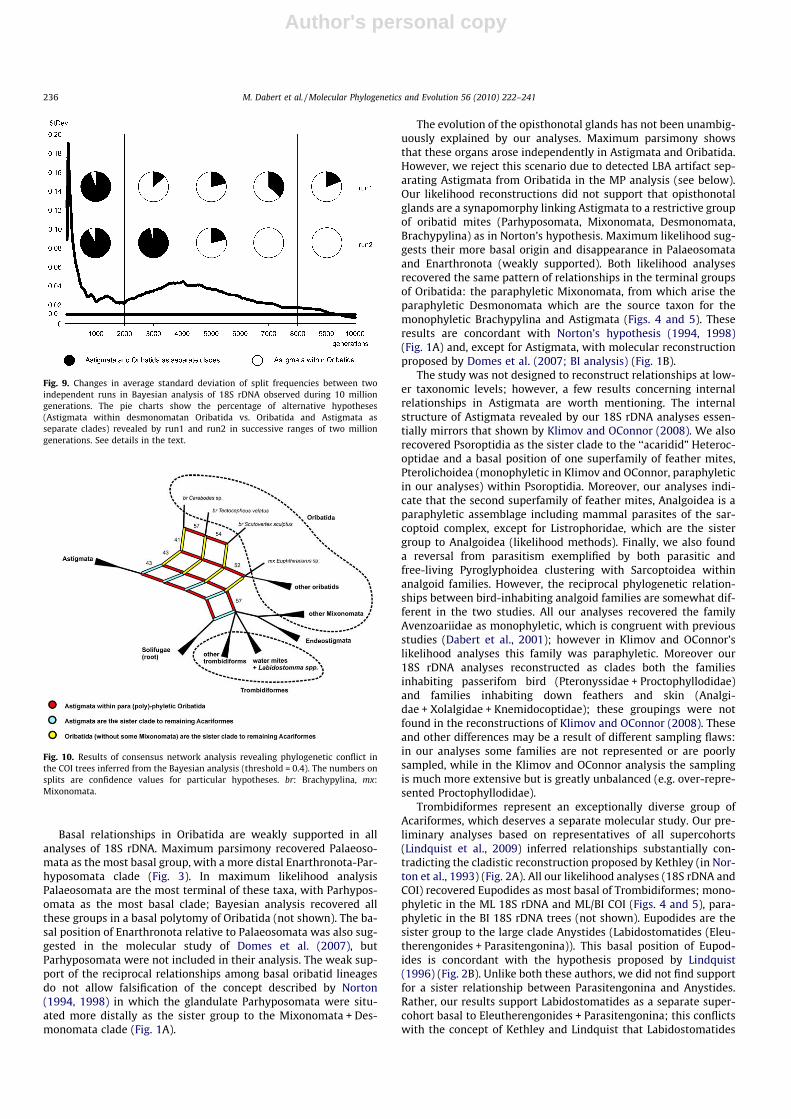
Tracing the standard deviation (SD) of split frequencies in BI anal-ysis recovered problems in achieving convergence between inde-pendent runs (Fig. 9). In the first two million generations both runsconsistently revealed Oribatida and Astigmata as separate cladesand the SD of split frequencies dropped to c. 0.02. In the next 2–3 mil-lion generations both runs started to diverge, preferring differenttree topologies (Astigmata within desmonomatan Oribatida vs. Ori-batida and Astigmata as separate clades), which resulted in the SDincreasing to nearly 0.05. Only after the next five million generationsdid both runs simultaneously begin to more frequently recoverAstigmata within desmonomatan Oribatida (Nothrina) and the SDdropped finally below the critical value of 0.01 just before 10 milliongenerations.
The consensus network analysis of 100 ML and 2500 BI COI ami-no acid trees revealed conflict similar to that found in the 18SrDNA trees (Fig. 10). The origin of Astigmata within paraphyletic(or polyphyletic) Oribatida (52–57%) was only 9–16% more fre-quently reconstructed than the relationships of Astigmata and Ori-batida (without some Mixonomata) being the sister groups of theremaining acariforms (43% and 41–43%, respectively).
3.5. Molecular dating
The PATHd8 analysis suggests that the acariform commonancestor was separated from the ancestor of solifugids in the Llan-dovery Silurian, about 435 MYA (Fig. 11). The main radiation ofAcariformes took place in the Lower Devonian. At this time, threeacariform lines arose nearly simultaneously: Trombidiformes
(c. 415 MYA), Endeostigmata and Oribatida (both c. 410 MYA).The fourth main lineage, Astigmata, originated 40–45 million yearsafter the first acariform split, in the Upper Devonian (c. 370 MYA).
The main lineages of Endeostigmata probably emerged soonafter the origin of the suborder, c. 410 MYA. Simultaneously, a pri-mary radiation of Trombidiformes took place and, as with endeo-stigmatids, almost all trombidiform main lineages originated atthis time. Primary diversifications of Oribatida occurred later inthe Middle Devonian (c. 390 MYA); at this time Enarthronota, Par-hyposomata, and the ancestor of the remaining oribatid lineagesappeared. The crown radiation of Astigmata took place in the Cisu-ralian Permian (c. 285 MYA). Also two more modern major radia-tions were discovered: one concerned of the most advancedoribatid group Brachypylina + Nothrina at the Triassic/Jurassicboundary (c. 200 MYA), the second was related to the primarydiversification of parasitic astigmatan Psoroptidia at the Jurassic/Cretaceous boundary (c. 145 MYA).
4. Discussion
4.1. Internal phylogenetic structure of Acariformes
All our analyses of 18S rDNA unambiguously confirm the mono-phyly of Acariformes (MP 99%, ML 100%, BI 1.00); all recent large-scale phylogenetic studies concerning mites and/or arachnids, bothmorphological and molecular, support this hypothesis (Domeset al., 2007; Klompen et al., 2007; Shultz, 2007), which has neverbeen questioned in the past (for review see Alberti, 2005).
Our likelihood analyses of 18S rDNA support recognizing two or-ders within Acariformes: Sarcoptiformes, consisting of Endeostig-mata and Oribatida + Astigmata (ML 56%, BI 0.96), andTrombidiformes (90%, 1.00) (Fig. 4). These groupings are less clearin the COI analyses (Fig. 5); Trombidiformes are paraphyletic andmonophyletic Sarcoptiformes are weakly supported (52%). Thegrouping of Trombidiformes and Sarcoptiformes as separate ordersis concordant with the concept of OConnor (1984), which is adoptedin the recent classification of Acariformes (Lindquist et al., 2009).
All likelihood trees based on 18S rDNA and COI amino acid se-quences revealed the origin of Astigmata within Oribatida. BothML and BI 18S rDNA reconstructions (Fig. 4) found the desmonoma-tan superfamily Crotonioidea (the only superfamily in the cohortNothrina) as the source of astigmatan radiation but with the sexualfamily Hermanniidae as the sister group (BI 0.91). The ML analysis ofCOI amino acid sequences (Fig. 6) also found Desmonomata as thesource of monophyletic Astigmata (ML 100%, BI 1.00); however,the reconstructed sister-group relationship with desmonomatanBrachypylina seems to be unreliable due to the poor resolution bythis marker of the internal structure in all main acariform taxa,including Oribatida. The within-Oribatida origin of Astigmata is alsoconsistent with some preliminary results suggested in previousmolecular studies (Maraun et al., 2004; Murrell et al., 2005).
In general, our results are congruent with Norton (1998) whoconcluded that the sister group of Astigmata was somewhere with-in Desmonomata. In contrast to Norton’s (1994, 2007) results, thecommon ancestry of Astigmata and the representative of the en-tirely asexual desmonomatan family Malaconothridae (Nothrina)was not supported by our molecular analysis (18S rDNA). However,some morphological synapomorphies which supported a linkagewith Malaconothridae were regressive traits and considered weakevidence (Norton, 1998).
4.2. Phylogenetic relationships within main acariform groups
In general, likelihood analyses of 18S rDNA produced well re-solved and supported internal relationships of clades. The COI amino
Fig. 7. Mean substitution rate (MSR) in the four actinotrichid lineages relative tothe outgroup (Solifugae). The statistically significant differences were betweenOribatida (low rate) and Astigmata (high rate) for both 18S rDNA and COI (p < 0.02and p < 0.01, respectively). Trombidiformes had significantly higher rate thanOribatida in 18S rDNA (p < 0.003) and moderately higher than Oribatida in COI(p = 0.05). Removing all ambiguous regions in the 18S rDNA ‘‘conserved alignment”lowered the MSR in each group but did not change the observed pattern of MSRdifferences among them.
234 M. Dabert et al. / Molecular Phylogenetics and Evolution 56 (2010) 222–241

Author's personal copy
acid data allowed resolving relationships among main lineages ofAcariformes; more recent relationships (i.e. within Trombidiformes,
Oribatida, and Astigmata) were recovered with limited credibility,probably because of the low number of informative characters.
Fig. 8. Phylogenetic conflict in the 18S rDNA trees reconstructed by likelihood analyses (ML/BI) and maximum parsimony (MP) revealed by consensus network analysis.Alternative splits (with their support) are indicated by different colors. Only the best supported conflicting hypotheses are shown; thresholds set at 0.4 for ML and BI afterdiscarding 25% burn-in fraction, 0.1 for BI after discarding 75% burn-in fraction, and 0.04 for MP reconstructions. The numbers on splits are confidence values for particularhypotheses: regular, BI after discarding 25% burn-in fraction (ML/BI) and MP (MP); bold, BI after discarding 75% burn-in fraction; italic, ML. Abbreviations as in Fig. 3.
M. Dabert et al. / Molecular Phylogenetics and Evolution 56 (2010) 222–241 235
Author's personal copy
Basal relationships in Oribatida are weakly supported in allanalyses of 18S rDNA. Maximum parsimony recovered Palaeoso-mata as the most basal group, with a more distal Enarthronota-Par-hyposomata clade (Fig. 3). In maximum likelihood analysisPalaeosomata are the most terminal of these taxa, with Parhypos-omata as the most basal clade; Bayesian analysis recovered allthese groups in a basal polytomy of Oribatida (not shown). The ba-sal position of Enarthronota relative to Palaeosomata was also sug-gested in the molecular study of Domes et al. (2007), butParhyposomata were not included in their analysis. The weak sup-port of the reciprocal relationships among basal oribatid lineagesdo not allow falsification of the concept described by Norton(1994, 1998) in which the glandulate Parhyposomata were situ-ated more distally as the sister group to the Mixonomata + Des-monomata clade (Fig. 1A).
The evolution of the opisthonotal glands has not been unambig-uously explained by our analyses. Maximum parsimony showsthat these organs arose independently in Astigmata and Oribatida.However, we reject this scenario due to detected LBA artifact sep-arating Astigmata from Oribatida in the MP analysis (see below).Our likelihood reconstructions did not support that opisthonotalglands are a synapomorphy linking Astigmata to a restrictive groupof oribatid mites (Parhyposomata, Mixonomata, Desmonomata,Brachypylina) as in Norton’s hypothesis. Maximum likelihood sug-gests their more basal origin and disappearance in Palaeosomataand Enarthronota (weakly supported). Both likelihood analysesrecovered the same pattern of relationships in the terminal groupsof Oribatida: the paraphyletic Mixonomata, from which arise theparaphyletic Desmonomata which are the source taxon for themonophyletic Brachypylina and Astigmata (Figs. 4 and 5). Theseresults are concordant with Norton’s hypothesis (1994, 1998)(Fig. 1A) and, except for Astigmata, with molecular reconstructionproposed by Domes et al. (2007; BI analysis) (Fig. 1B).
The study was not designed to reconstruct relationships at low-er taxonomic levels; however, a few results concerning internalrelationships in Astigmata are worth mentioning. The internalstructure of Astigmata revealed by our 18S rDNA analyses essen-tially mirrors that shown by Klimov and OConnor (2008). We alsorecovered Psoroptidia as the sister clade to the ‘‘acaridid” Heteroc-optidae and a basal position of one superfamily of feather mites,Pterolichoidea (monophyletic in Klimov and OConnor, paraphyleticin our analyses) within Psoroptidia. Moreover, our analyses indi-cate that the second superfamily of feather mites, Analgoidea is aparaphyletic assemblage including mammal parasites of the sar-coptoid complex, except for Listrophoridae, which are the sistergroup to Analgoidea (likelihood methods). Finally, we also founda reversal from parasitism exemplified by both parasitic andfree-living Pyroglyphoidea clustering with Sarcoptoidea withinanalgoid families. However, the reciprocal phylogenetic relation-ships between bird-inhabiting analgoid families are somewhat dif-ferent in the two studies. All our analyses recovered the familyAvenzoariidae as monophyletic, which is congruent with previousstudies (Dabert et al., 2001); however in Klimov and OConnor’slikelihood analyses this family was paraphyletic. Moreover our18S rDNA analyses reconstructed as clades both the familiesinhabiting passerifom bird (Pteronyssidae + Proctophyllodidae)and families inhabiting down feathers and skin (Analgi-dae + Xolalgidae + Knemidocoptidae); these groupings were notfound in the reconstructions of Klimov and OConnor (2008). Theseand other differences may be a result of different sampling flaws:in our analyses some families are not represented or are poorlysampled, while in the Klimov and OConnor analysis the samplingis much more extensive but is greatly unbalanced (e.g. over-repre-sented Proctophyllodidae).
Trombidiformes represent an exceptionally diverse group ofAcariformes, which deserves a separate molecular study. Our pre-liminary analyses based on representatives of all supercohorts(Lindquist et al., 2009) inferred relationships substantially con-tradicting the cladistic reconstruction proposed by Kethley (in Nor-ton et al., 1993) (Fig. 2A). All our likelihood analyses (18S rDNA andCOI) recovered Eupodides as most basal of Trombidiformes; mono-phyletic in the ML 18S rDNA and ML/BI COI (Figs. 4 and 5), para-phyletic in the BI 18S rDNA trees (not shown). Eupodides are thesister group to the large clade Anystides (Labidostomatides (Eleu-therengonides + Parasitengonina)). This basal position of Eupod-ides is concordant with the hypothesis proposed by Lindquist(1996) (Fig. 2B). Unlike both these authors, we did not find supportfor a sister relationship between Parasitengonina and Anystides.Rather, our results support Labidostomatides as a separate super-cohort basal to Eleutherengonides + Parasitengonina; this conflictswith the concept of Kethley and Lindquist that Labidostomatides
Fig. 9. Changes in average standard deviation of split frequencies between twoindependent runs in Bayesian analysis of 18S rDNA observed during 10 milliongenerations. The pie charts show the percentage of alternative hypotheses(Astigmata within desmonomatan Oribatida vs. Oribatida and Astigmata asseparate clades) revealed by run1 and run2 in successive ranges of two milliongenerations. See details in the text.
Fig. 10. Results of consensus network analysis revealing phylogenetic conflict inthe COI trees inferred from the Bayesian analysis (threshold = 0.4). The numbers onsplits are confidence values for particular hypotheses. br: Brachypylina, mx:Mixonomata.
236 M. Dabert et al. / Molecular Phylogenetics and Evolution 56 (2010) 222–241

Author's personal copy
Fig. 11. Chronogram showing origin and divergence ages for Acariformes estimated using PATHd8 analysis. The topology corresponds to the 18S rDNA ML tree. Numbers incircles, referring to Table 3, represent fossil calibration points; black circles indicate crown radiations. The chronostratigraphic scale is given with absolute geological ages(MYA, million years ago). Abbreviations as in Fig. 3.
M. Dabert et al. / Molecular Phylogenetics and Evolution 56 (2010) 222–241 237

Author's personal copy
had a within-eupodid origin but is concordant with the recenttrombidiform classification of Lindquist et al. (2009).
The internal phylogenetic structure of Parasitengonina revealedby our likelihood analyses of 18S rDNA suggests the terrestrial par-asitengonines as ancestral to water mites (Hydrachnidiae). Thisgrouping is consistent with general opinion about the evolutionof Parasitengonina. However, some water mites exhibit plesiotyp-ical characters which might be interpreted as an argument for theancestry of Hydrachnidiae with respect to other parasitengonines(Walter et al., 2009). General phylogenetic relationships amongall water mite superfamilies and their position in Parasitengoninais currently being investigated (H. Proctor, in prep.).
All our analyses reconstructed Endeostigmata as a monophy-letic taxon (well supported in all 18S rDNA trees), which contra-dicts the widespread opinion of endeostigmatid paraphyly(Kethley in Norton et al., 1993; OConnor, 1984; Walter, 2009). Theyalso revealed the most-basal position of Terpnacarina and theparaphyly of Alycina; the above-cited authors considered a mono-phyletic Alycina as the basal endeostigmatid taxon. However, wedid not test whether Sphaerolichida, previously grouped withinEndeostigmata and recently considered as the sister group of Pros-tigmata s.s. (OConnor, 1984), is actually nested within the Trom-bidiformes. Undoubtedly both the monophyly and the internalstructure of Endeostigmata are not yet sufficiently clarified andfurther investigations with better taxon sampling will beindispensable.
4.3. Long-branch attraction artifact
We have shown that the main acariform clades differ signifi-cantly in substitution rate, especially comparing slowly evolvingOribatida with fast evolving Astigmata (Fig. 7). The same patternof differences was observed in the nuclear 18S rRNA gene andmitochondrial COI amino acid sequences, even after removinghighly variable sites from 18S rDNA. It is probably a consequenceof attracting long branches that maximum parsimony analysisgrouped Astigmata with the second fastest evolving group, Trom-bidiformes (Fig. 3). This phylogenetic artifact was strongly sup-ported on the original MP1 tree; sparse phylogenetic conflictsrevealed by consensus network analysis concerned only Endeostig-mata (Fig. 8). This result is concordant with the known high vul-nerability of the parsimony method to long-branch attractionartifacts (Bergsten, 2005; Felsenstein, 2004; Philippe et al., 2005;Pol and Siddall, 2001; Swofford et al., 2001).
However, using likelihood methods (ML and 25% burn-in BI)only slightly decreases the probability of falling into the LBA trap.In fact, the consensus network analysis of the likelihood 18S rDNAand COI trees showed that, for both markers, the probability ofrecovering the origin of Astigmata within Desmonomata differsonly by about 10% from that of having the long branched Astigmataand Trombidiformes either connected directly or shifted to deepparts of the tree due to outgroup attraction (Figs. 8 and 9). Withthis in mind, we think that even slight differences in taxon sam-pling and alignment quality may greatly influence the possibilityof achieving false results.
To minimize influence of the LBA artifact on the results of ourphylogenetic analyses, we applied balanced sampling of represen-tatives of acariform taxa and more extensive sampling of arachnidoutgroups than did Domes et al. (2007). Furthermore we used adifferent alignment strategy. In our case, contrary to all earlieranalyses (Domes et al., 2007; Klimov and OConnor, 2008; Klompenet al., 2007; Murrell et al., 2005) no sequence data were excludedfrom the final dataset of the 18S rDNA alignment. Moreover, wefound, as did Murrell et al. (2005) that the differences betweenthe relative substitution rates after removing ambiguous regionsin the alignment are on the same level as comparisons made for
the complete data set; they may even be higher, as in the case ofAstigmata/Oribatida or Trombidiformes/Oribatida (Fig. 6). Thusour data show that removing the ambiguous parts of the alignmentwould increase the chance of LBA occurrence.
Finally, we demonstrate that achieving convergence of inde-pendent runs in Bayesian analysis is problematic if there is strongphylogenetic conflict (Fig. 7). We were forced to extend the anal-ysis to 10 million generations and then discard as many as 75% ofinitial trees in order to obtain relatively stable results. Domeset al. (2007) did not report if a problem with convergence existedin their analyses. But assuming their 18S rDNA alignments weresimilar to ours, the 3 million generations run by these authorsmight not have been sufficient to get results that were unaffectedby LBA.
4.4. Molecular dating of Acariformes
Molecular dating of Chelicerata based on mitochondrial DNA se-quences (Jeyaprakash and Hoy, 2009) estimated the divergencetime for Acariformes at 395 ± 24 MYA. However, this analysis suf-fered from erroneous statements concerning fossil calibrationpoints (see Dunlop and Selden, 2009). According to our divergencetime analysis (Fig. 11), acariforms originated c. 435 MYA in theLlandovery Silurian. Our estimate is shifted back in time about25 MY with respect to paleontological dating of minimum age(410 MYA) based on the morphology-based tree of Shultz (2007),which was converted into a chronogram by Dunlop and Selden(2009). Thus the acariform mites were probably among the earliestarthropods invading terrestrial habitats in late Silurian or the Low-er Devonian, when the first vascular plants are thought to havearisen (Kethley, 1990).
Although Trombidiformes, Endeostigmata, and Oribatida proba-bly originated much earlier (410–415 MYA) than Astigmata(370 MYA), all these groups had a very ancient origin. Such earlyorigin of Astigmata contradicts the paleontological records; theoldest fossils of astigmatid mites, the enigmatic ‘‘Acarus” rhombeus,are known only from the Eocene/Oligocene Baltic amber from c.35–40 MYA (Perkovsky et al., 2007). However, these soft-bodiedanimals have limited opportunities of fossilization and thereforeare very poorly represented in paleontological data.
The structure of our chronogram suggests an ancient primaryradiation of Trombidiformes, just after their origin, when almostall main extant clades (except water mites) appeared. Endeostig-matid mites showed a similar pattern. These results are generallyconcordant with the evolutionary scenario for the origin of earlyderivative trombidiforms and endeostigmatids proposed by Keth-ley (1990). He suggested that these mites invaded lands from thecoastal habitats and diversified along with the first vascular terres-trial flora in the late Silurian. The contemporary distribution ofthese mites may be relictual and reflect their ancient evolutionaryhistory.
The primary diversification of Oribatida took place 380–390 MYA when Enarthronota, Parhyposomata and, probably, Pal-aeosomata originated. The secondary major diversifications of ori-batid mites—origins of Astigmata and Brachypylina crowns—tookplace c. 285 MYA and c. 200 MYA, respectively. Our results do notsupport the Ordovician existence of brachypyline oribatid mitespostulated by Bernini et al. (2002). In our analysis Brachypylinaoriginated 370 MYA in the Upper Devonian. Using 475 MY oldbrachypylines as a fixed calibration point resulted in the unrealistichypothesis that Acariformes originated in the Precambrian (notshown).
It is possible that some spectacular acariform diversificationswere a result of invading terrestrial niches that were emptied aftermass extinction events. Such a scenario might be responsible fordiversification of the most advanced and species rich oribatid
238 M. Dabert et al. / Molecular Phylogenetics and Evolution 56 (2010) 222–241

Author's personal copy
group, Brachypylina, which radiated rapidly after the Triassic-Jurassic mass extinction (Tanner et al., 2004). At the same timeconiferous plants radiated rapidly (Ingrouille and Eddie, 2006),which might have accelerated the diversification of these plant tis-sue decomposers (Labandeira et al., 1997). Also the origin of Psor-optidia, the astigmatan lineages which are primarily parasitic and/or commensalic on vertebrates (OConnor, 1982, 1993), seems tocorrelate with relatively long-lasting recovery of land vertebratesafter the ‘‘Great Dying”, a mass extinction ending the Paleozoicera (Sahney and Benton, 2008). The reason for the primary diversi-fication of this mite group (c. 145 MYA) seems quite obvious; ourreckoning of this event coincides perfectly with the fossils ofArchaeopteryx having fully developed cover and flight feathers(Fedducia, 1996), which are typical habitats of feather mites.
4.5. The sister group of Acariformes
All of our analyses based on the 18S rDNA strongly supportgrouping the Acari into two large monophyletic groups: Acari-formes and Parasitiformes, corresponding to van der Hammen’s(1979) Actinotrichida and Anactinotrichida, respectively. Buttheir sister relationship, which would support the monophylyof mites, was not recovered. Instead, the analyses revealed theorder Solifugae as the sister group of Acariformes and this rela-tionship was always well supported (MP 65%, ML 89%, BI 1.00).With lesser support, all analyses identify Pseudoscorpionida asthe sister group of parasitiform mites (MP 66%, ML 51%, BI0.95).
The Acariformes–Solifugae relationship is consistent with sper-matological studies and analyses of male genital structures carriedout by Alberti and his collaborators (e.g. Alberti, 1980, 2000, 2005;Alberti and Peretti, 2002; Dunlop and Alberti, 2008; Klann et al.,2005). It was also suggested or implied in some older studies,e.g. those of Grandjean (1936, 1954), who pointed out similaritiesin the body structure of Solifugae and Palaeosomata (Oribatida).Comparisons of the structure of Claparède’s organ in acariformmites and the lateral organ of early instars of Solifugae might indi-cate their homology (Alberti 1979; Telford and Thomas, 1999;Ziessler and Weygoldt, 1975). Finally some early authors noted aclose resemblance of tracheal systems in solifugids and prostigma-tid mites (Carpenter, 1903; Wagner, 1895; but see Reuter, 1909).Interestingly, our results are to some extent reminiscent of oneof the oldest concepts concerning affinities between solifugidsand acariform mites: Banks (1915) noted a close resemblance ofrhagidid mites (Trombidiformes) to solifugids. We recoveredRhagidiidae in the most-basal position in the Eupodides clade(Fig. 4) or even basal to whole Trombidiformes (Bayesian analysisof the 18S rDNA, not shown).
The sister relationship between parasitiform mites and Pseudo-scorpionida revealed by our analyses is rather unusual and to ourknowledge not indicated by any studies based on morphologicalcharacters (for review see Murienne et al., 2008), although Dunlop(2000) pointed out a close resemblance of mouthpart structure andprobably also phylogenetic affinities between Solifugae, Pseudo-scorpionida, and the monophyletic Acari. However, our resultsare congruent with Giribet et al. (2002) who analyzed the phylog-eny of Arachnida with particular emphasis on Opiliones based onmorphological and molecular data. They also recovered Pseudo-scorpionida as the sister group for Opilioacariformes and Parasiti-formes in their molecular analysis (18S rDNA + D3 region of the28S rDNA, Fig. 8).
A formal revision of Acari classification that would reflect theseresults must await future analyses based on more extensive out-group sampling and multigene phylogenetic reconstructions(author’s work in progress).
Acknowledgements
We are deeply grateful to Prof. Roy Norton, SUNY College ofEnvironmental Sciences and Forestry, New York, USA, for his valu-able remarks and very useful critique of the draft version of the MS.We thank Dr. Maciej Szymanski, Laboratory of tRNA Biochemistry,Institute of Bioorganic Chemistry, Polish Academy of Sciences, Poz-nan, Poland, for making available his preliminary results on 18SrRNA secondary structure in mites. An important part of the mate-rial was collected and kindly provided to us by the following per-sons: Dr. Joanna Izdebska, Department of Invertebrate Zoology,University of Gdansk, Gdynia; Poland, Dr. Anna Labrzycka, Molec-ular Biology Techniques Laboratory, AMU, Poznan, Poland; Dr.Reinhard Gerecke, Tübingen, Germany; Dr. Joanna Makol, Depart-ment of Zoology and Ecology, Agricultural University of Wroclaw,Poland; Dr. Maciej Skorupski, Department of Game Managementand Forest Protection, August Cieszkowski Agricultural Universityof Poznan, Poland; Dr. Krzysztof Solorz, Department of Parasitol-ogy, Medical University of Silesia, Sosnowiec, Poland; Dr. AndreasWohltmann, Ritterhude, Germany. This work was supported bygrants from the Polish Ministry for Science and Technology:3P04C05922 (WW) and 2P04C00826 (JD).
References
Abascal, F., Posada, D., Knight, R.D., Zardoya, R., 2006. Parallel evolution of thegenetic code in arthropod mitochondrial genomes. PLoS Biol. 4, e127.
Abascal, F., Zardoya, R., Posada, D., 2005. ProtTest: selection of best-fit models ofprotein evolution. Bioinformatics 21, 2104–2105.
Alberti, G., 1979. Licht- und elektronenmikroskopische Untersuchungen anCoxaldrüsen von Walzenspinnen (Arachnida: Solifugae). Zool. Anz. 203, 48–64.
Alberti, G., 1980. Zur Feinstruktur des Hodenepithels und der Spermien vonEusimonia mirabilis Roewer, 1934 (Solifugae, Arachnida). Zool. Anz. 204, 345–352.
Alberti, G., 2000. Chelicerata. In: Jamieson, B.G.M. (Ed.), Progress in Male GemeteUltrastructureand Phylogeny. In: Adiyodi, K.G., Adiyodi, R.G. (Eds.),Reproductive Biology of the Invertebrates, vol. 9B. Oxford and IBH, New Delhi,pp. 311–388.
Alberti, G., 2005. On some fundamental characteristics in acarine morphology. Attidella Accademia Nazionale Ital. Entomol. R. A 53, 315–360.
Alberti, G., Peretti, A.V., 2002. Fine structure of male genital system and sperm inSolifugae does not support a sister-group relationship with Pseudoscorpiones(Arachnida). J. Arachnol. 30, 268–274.
Anderson, F.E., Swofford, D.L., 2004. Should we be worried about long-branchattraction in real data sets? Investigations using metazoan 18S rDNA. Mol.Phylogenet. Evol. 33, 440–451.
Bandelt, H.-J., 1995. Combination of data in phylogenetic analysis. Plant Syst. Evol. 9(Suppl.), 355–361.
Banks, N., 1915. The acarina or mites. A review of the group for the use of economicentomologists. Rep. US Dept. Agric. 108, 1–142.
Bergsten, J., 2005. A review of long-branch attraction. Cladistics 21, 163–193.Berlese, A., 1897. Acari, Myriapoda et Scorpiones hucusque in Italia reperta. Ordo.
Cryptostigmata (Sarcoptidae). Portici, 190.Bernini, F., Carnevale, G., Bagnoli, G., Stouge, S., 2002. An early Ordovician oribatid
mite (Acari: Oribatida) from the island of Öland, Sweden. In: Bernini, F.,Nannelli, R., Nuzzaci, G., de Lillo, E. (Eds.), Acarid Phylogeny and Evolution:Adaptation in Mites and Ticks. Kluwer Academic Publishers, Dordrecht, pp. 45–47.
Bleidorn, C., Eeckhaut, I., Podsiadlowski, L., Schult, N., McHugh, D., Halanych, K.M.,Milinkovitch, M.C., Tiedemann, R., 2007. Mitochondrial genome and nuclearsequence data support Myzostomida as part of the annelid radiation. Mol. Biol.Evol. 24, 1690–1701.
Bremer, K., 1988. The limits of amino acid sequence data in angiospermphylogenetic reconstruction. Evolution 42, 795–803.
Britton, T., Anderson, C.L., Jaquet, D., Lundqvist, S., Bremer, K., 2006. PATHd8 – a newmethod for estimating divergence times in large phylogenetic trees without amolecular clock. Available from: <www.math.su.se/PATHd8>.
Carapelli, A., Lio, P., Nardi, F., van der Wath, E., Frati, F., 2007. Phylogenetic analysisof mitochondrial protein coding genes confirms the reciprocal paraphyly ofHexapoda and Crustacea. BMC Evol. Biol. 7 (Suppl. 2), S8.
Carpenter, G.H., 1903. On the relationships between the classes of the Arthropoda.Proc. Roy. Irish Acad. 24B, 320–360.
Cockerell, T.D.A., 1917. Arthropods in Burmese amber. Am. J. Sci. 44, 360–368.Coineau, Y., Magowski, W.L., 1994. Caeculidae in amber. Acarologia 35, 243–246.Dabert, J., Dabert, M., Mironov, S.V., 2001. Phylogeny of feather mite subfamily
Avenzoariinae (Acari: Analgoidea: Avenzoariidae) inferred from combinedanalyses of molecular and morphological data. Mol. Phylogenet. Evol. 20,124–135.
M. Dabert et al. / Molecular Phylogenetics and Evolution 56 (2010) 222–241 239
Author's personal copy
Dabert, J., Ehrnsberger, R., Dabert, M., 2008. Glaucalges tytonis sp. n. (Analgoidea:Xolalgidae) from the barn owl Tyto alba (Strigiformes: Tytonidae): compilingmorphology with DNA barcode data for taxon descriptions in mites (Acari).Zootaxa 1719, 41–52.
Domes, K., Althammer, M., Norton, R.A., Scheu, S., Maraun, M., 2007. Thephylogenetic relationship between Astigmata and Oribatida (Acari) asindicated by molecular markers. Exp. Appl. Acarol. 42, 159–171.
Douady, C.J., Delsuc, F., Boucher, Y., Doolittle, W.F., Douzery, E.J.P., 2003. Comparisonof phylogenetic tree robustness as inferred by Bayesian and maximumlikelihood bootstrap analyses. Mol. Biol. Evol. 20, 248–254.
Dubinin, V.B., 1962. Class Acaromorpha: mites or gnathosomic cheliceratearthropods. In: Rodendorf, B.B. (Ed.), Fundamentals of Palaeontology.Academy of Sciences of the USSR, Moscow, pp. 447–473 (in Russian).
Dunlop, J.A., 2000. The epistomo-labral plate and lateral lips in solifuges,pseudoscorpions and mites. Ekologia (Bratislava) 19, 67–78.
Dunlop, J.A., Alberti, G., 2008. The affinities of mites and ticks, a review. J. Zool. Syst.Evol. Res. 46, 1–18.
Dunlop, J.A., Selden, P.A., 2009. Calibrating the chelicerate clock: a paleontologicalreply to Jeyaprakash and Hoy. Exp. Appl. Acarol. 48, 183–197.
Ericson, P.G.P., Anderson, C.L., Britton, T., Elzanowski, A., Johansson, U.S., Källersjö,M., Ohlson, J.I., Parsons, T.J., Zuccon, D., Mayr, G., 2006. Diversification ofNeoaves: integration of molecular sequence data and fossils. Biol. Lett. 2, 543–547.
Evans, G.O., 1992. Principles of Acarology. CAB International, Wallingford.Fedducia, A., 1996. The Origin and Evolution of Birds. Yale University Press, New
Haven, CT.Felsenstein, J., 1978. Cases in which parsimony or compatibility methods will be
positively misleading. Syst. Zool. 27, 401–410.Felsenstein, J., 1985. Confidence limits on phylogenies: an approach using the
bootstrap. Evolution 39, 783–791.Felsenstein, J., 2004. Inferring Phylogenies. Sinauer Associates, Sunderland, MA.Fuchs, J., Obst, M., Sundberg, P., 2009. The first comprehensive molecular phylogeny
of Bryozoa (Ectoprocta) based on combined analyses of nuclear andmitochondrial genes. Mol. Phylogenet. Evol. 52, 225–233.
Gillespie, J.J., 2004. Characterizing regions of ambiguous alignment caused by theexpansion and contraction of hairpin-stem loops in ribosomal RNA molecules.Mol. Phylogenet. Evol. 33, 936–943.
Giribet, G., Edgecombe, G.D., Wheeler, W.C., Babbitt, C., 2002. Phylogeny of theArachnida and Opiliones: a combined approach using morphological andmolecular sequence data. Cladistics 18, 5–70.
Grandjean, F., 1936. Un acarien synthétique: Opilioacarus segmentatus with. Bull.Soc. Hist. Nat. Afr. N. 27, 413–444.
Grandjean, F., 1937. Sur quelques caractères des Acaridiae libres. Bull. Soc. Zool.France 62, 388–398.
Grandjean, F., 1939. Quelques genres d’Acariens appartenant au groupe desEndeostigmata. Ann. Sci. Nat. Zool. 2, 1–122.
Grandjean, F., 1954. Étude sur les Palaeacaroides (Acarina, Oribates). Mem. Mus.Nat. Hist. Natur. A Zool. 7, 179–274.
Hallan, J., 2008. Synopsis of the described Arachnida of the world. Available from:<http://insects.tamu.edu/research/collection/hallan/acari/0ReportHi.htm>.
Hirst, S., 1923. On some arachnid remains from the Old Red Sandstone (RhynieChert Bed, Aberdeenshire). Ann. Mag. Nat. Hist. 12, 455–474.
Holland, B.R., Delsuc, F., Moulton, V., 2005. Visualizing conflicting evolutionaryhypotheses in large collections of trees: using consensus networks to study theorigins of placentals and hexapods. Syst. Biol. 54, 66–76.
Holland, B.R., Huber, K.T., Moulton, V., Lockhart, P.J., 2004. Using consensusnetworks to visualize contradictory evidence for species phylogeny. Mol. Biol.Evol. 21, 1459–1461.
Huson, D.H., Bryant, D., 2006. Application of phylogenetic networks in evolutionarystudies. Mol. Biol. Evol. 23, 254–267. Available from: <www.splitstree.org>.
Ingrouille, M., Eddie, B., 2006. Plants: Diversity and Evolution. Cambridge UniversityPress, New York.
Jacot, A.P., 1933. Ordinal status of the Oribatoidea (Acarina). Entomol. News 44, 10–14.
Jeyaprakash, A., Hoy, M.A., 2009. First divergence time estimate of spiders,scorpions, mites and ticks (subphylum: Chelicerata) inferred frommitochondrial phylogeny. Exp. Appl. Acarol. 47, 1–18.
Jobb, G., 2008. TREEFINDER version of October 2008, Munich, Germany. Availablefrom: <www.treefinder.de>.
Judson, M., Wunderlich, J., 2003. Rhagidiidae (Acari, Eupodoidea) from Baltic amber.Acta Zool. Cracov. 46 (Suppl.-Fossil Insects), 147–152.
Kennedy, M., Holland, B.R., Gray, R.D., Spencer, H.G., 2005. Untangling longbranches: identifying conflicting phylogenetic signals a priori using spectralanalysis, neighbor-net, and consensus networks. Syst. Biol. 54, 620–633.
Kethley, J.B., 1982. Acariformes. In: Parker, S.P. (Ed.), Synopsis and Classification ofLiving Organism. McGraw-Hill, New York, pp. 117–146.
Kethley, J.B., 1990. Acarina: Prostigmata (Actinedida). In: Dindal, D.L. (Ed.), SoilBiology Guide. John Wiley and Sons, New York, pp. 667–756.
Klann, A.E., Peretti, A.F., Alberti, G., 2005. Ultrastructure of male genital system andspermatozoa of a Mexican camel-spider of the Eremobates pallipes species group(Arachnida, Solifugae). J. Arachnol. 33, 613–621.
Klassen, G.J., Mooi, R.D., Locke, A., 1991. Consistency indices and random data. Syst.Zool. 40, 446–457.
Klimov, P.B., OConnor, B.M., 2008. Origin and higher-level relationships ofpsoroptidian mites (Acari: Astigmata: Psoroptidia): evidence from threenuclear genes. Mol. Phylogenet. Evol. 47, 1135–1156.
Klompen, H., Lekveishvili, M., Black IV, W.C., 2007. Phylogeny of parasitiform mites(Acari) based on rRNA. Mol. Phylogenet. Evol. 43, 936–951.
Koch, C.L., Berendt, G.C., 1854. Die im Bernstein befindlichen Myriapoden,Arachniden und Apteren der Vorwelt. In: Berendt, G.C. (Ed.), Die in BernsteinBefindlichen Organischen Reste der Vorwelt Gesammelt in Verbindung mitMehreren Bearbeitetet und Herausgegeben 1. Nicolai, Berlin.
Krantz, G.W., 1960. The Acaridae: a recapitulation. Pan-Pac. Entomol. 36, 157–166.Krantz, G.W., 1978. A Manual of Acarology, second ed. Oregon State Univ.
Bookstores, Corvallis.Krantz, G.W., Walter, D.E., 2009. A Manual of Acarology, third ed. Texas Tech
University Press, Lubbock.Krivolutsky, D.A., Krasilov, B.A., 1977. Oribatid mites from Upper Jura deposits of
USSR. In: Skarlato, O.A., Balashov, Y.S. (Eds.), Morphology and Diagnostics ofMites. Zoological Institute, Leningrad, pp. 16–24 (in Russian).
Labandeira, C.C., Phillips, T.L., Norton, R.A., 1997. Oribatid mites and thedecomposition of plant tissues in paleozoic coal-swamp forests. PALAIOS 12,319–353.
Lee, M.S.Y., 2001. Unalignable sequences and molecular evolution. Trends Ecol. Evol.16, 681–685.
Lindquist, E.E., 1996. Phylogenetic relationships. In: Lindquist, E.E., Sabelis, M.W.,Bruin, J. (Eds.), Eriophyoid Mites. Their Biology, Natural Enemies and Control.World Crop Pests, vol. 6. Elsevier, Amsterdam, pp. 301–327.
Lindquist, E.E., Krantz, G.W., Walter, D.E., 2009. Classification. In: Krantz, G.W.,Walter, D.E. (Eds.), A Manual of Acarology. Texas Tech University Press,Lubbock, pp. 97–103.
Maddison, W.P., Maddison, D.R., 2007. Mesquite: a modular system for evolutionaryanalysis. Available from: <http://mesquiteproject.org>.
Mallatt, J., Giribet, G., 2006. Further use of nearly complete 28S and 18S rRNA genesto classify Ecdysozoa: 37 more arthropods and a kinorhynch. Mol. Phylogenet.Evol. 40, 72–794.
Mar, J.C., Harlow, T.J., Ragan, M.A., 2005. Bayesian and maximum likelihoodphylogenetic analyses of protein sequence data under relative branch-lengthdifferences and model violation. BMC Evol. Biol. 5, 8.
Maraun, M., Heethoff, M., Schneider, K., Scheu, S., Weigmann, G., Cianciolo, J.,Thomas, R.H., Norton, R.A., 2004. Molecular phylogeny of oribatid mites(Oribatida, Acari): evidence for multiple radiations of parthenogeneticlineages. Exp. Appl. Acarol. 33, 183–201.
Merl, D., Escalante, A., Prado, R., 2005. Comparison of Bayesian, maximumlikelihood and parsimony methods for detecting positive selection. AMS Tech.Report 3, 37.
Min, X.J., Hickey, D.A., 2007. DNA barcodes provide a quick preview ofmitochondrial genome composition. PLoS ONE 2 (3), e325.
Mironov, S.V., Bochkov, A.V., 2009. Modern conceptions of macrophylogeny inacariform mites (Chelicerata, Acariformes). Zool. Zh. 88, 922–937 (in Russian).
Müller, K.F., 2004. PRAP – computation of Bremer support for large data sets. Mol.Phylogenet. Evol. 31, 780–782.
Murienne, J., Harvey, M.S., Giribet, G., 2008. First molecular phylogeny of the majorclades of Pseudoscorpiones (Arthropoda: Chelicerata). Mol. Phylogenet. Evol.49, 170–184.
Murrell, A., Dobson, S.J., Walter, D.E., Campbell, N.J.H., Shao, R., Barker, S.C., 2005.Relationships among the three major lineages of the Acari (Arthropoda:Arachnida) inferred from small subunit rRNA: paraphyly of the Parasitiformeswith respect to the Opilioacariformes and relative rates of nucleotidesubstitution. Invert. Syst. 19, 383–389.
Nei, M., Kumar, S., 2000. Molecular Evolution and Phylogenetics. Oxford Univ. Press,New York.
Nicholas, K.B., Nicholas, H.B., 1997. GeneDoc: a tool for editing and annotatingmultiple sequence alignments. Pittsburgh Supercomputing Center’s NationalResource for Biomedical Supercomputing. Available from: <http://www.nrbsc.org/downloads/>.
Norton, R.A., 1994. Evolutionary aspects of oribatid mite life histories andconsequences for the origin of the Astigmata. In: Houck, M.A. (Ed.), Mites:Ecological and Evolutionary Analyses of Life-History Patterns. Chapman andHall, New York, pp. 99–135.
Norton, R.A., 1998. Morphological evidence for the evolutionary origin of Astigmata(Acari: Acariformes). Exp. Appl. Acarol. 22, 559–594.
Norton, R.A., 2006. First record of Collohmannia (C. schusteri n. sp.) and Hermannia(H. sellnicki n. sp.) from Baltic amber, with notes on Sellnick’s genera of fossiloribatid mites (Acari: Oribatida). Acarologia 46, 111–125.
Norton, R.A., 2007. Holistic acarology and ultimate causes: examples from theoribatid mites. In: Morales-Malacara, J.B., Behan-Pelletier, V., Ueckermann, E.,Pérez, T.M., Estrada-Nenegas, E.G., Badii, M. (Eds.), Acarology XI: Proceedings ofthe International Congress. Instituto de Biologia and Facultad de Ciencias,Universidad Nacional Autónoma de México, Sociedad Latinoamericana deAcarología, Mexico.
Norton, R.A., Bonamo, P.N., Grierson, J.D., Shear, W.A., 1988. Oribatid mite fossilsfrom a terrestrial Devonian deposit near Gilboa, New York. J. Paleontol. 62, 259–269.
Norton, R.A., Kethley, J.B., 1994. Ecdysial cleavage lines of acariform mites(Arachnida, Acari). Zool. Scripta 23, 175–191.
Norton, R.A., Kethley, J.B., Johnston, D.E., OConnor, B.M., 1993. Phylogeneticperspectives on genetic systems and reproductive modes of mites. In:Wrensch, D.L., Ebbert, M.A. (Eds.), Evolution and Diversity of Sex Ratio inInsects and Mites. Chapman and Hall, New York, pp. 8–99.
Norton, R.A., Poinar Jr., G.O., 1993. Reassessment and new records of oribatid mitefossils from Tertiary Neotropical amber. Acarologia 34, 57–68.
240 M. Dabert et al. / Molecular Phylogenetics and Evolution 56 (2010) 222–241

Author's personal copy
Nylander, J.A.A., 2004. MrModeltest v2. Program distributed by the author.Evolutionary Biology Centre, Uppsala University.
OConnor, B.M., 1982. Evolutionary ecology of astigmatid mites. Ann. Rev. Entomol.27, 385–409.
OConnor, B.M., 1984. Phylogenetic relationships among higher taxa in theAcariformes, with particular reference to Astigmata. In: Griffiths, D.A.,Bowman, C.E. (Eds.), Acarology VI, vol. 1. Ellis Horwood Ltd., Chichester, pp.19–27.
OConnor, B.M., 1993. Life-history modifications in astigmatid mites. In: Houck, M.A.(Ed.), Mites: Ecological and Evolutionary Analyses of Life History Patterns.Chapman and Hall, New York.
Oudemans, A.C., 1923. Studie over de sedert 1877 ontworpen Systemen der Acari;Nieuwe classificatie; Phylogenetische Beschouwingen. Tijdschr. Entomol. 46,93–134.
Page, R.D.M., 1996. TREEVIEW: an application to display phylogenetic trees onpersonal computers. Comput. Appl. Biosci. 12, 357–358.
Pampaloni, L., 1902. I resti organici nel disodile di Melilli in Sicilia. Palaeontogr. Ital.8, 121–130.
Perkovsky, E.E., Rasnitsyn, A.P., Vlaskin, A.P., Taraschuk, M.V., 2007. A comparativeanalysis of the Baltic and Rovno amber arthropod faunas: representativesamples. Afr. Invertebr. 48, 229–245.
Petrunkevitch, A.I., 1913. A monograph of the terrestrial Palaeozoic Arachnida ofNorth America. Trans. Conn. Acad. Arts Sci. 18, 1–137.
Philippe, H., Lartillot, N., Brinkmann, H., 2005. Multigene analyses of bilateriananimals corroborate the monophyly of Ecdysozoa, Lophotrochozoa andProtostomia. Mol. Biol. Evol. 22, 1246–1253.
Poinar Jr., G.O., 1985. Fossil evidence of insect parasitism by mites. Int. J. Acarol. 11,37–38.
Pol, D., Siddall, M.E., 2001. Biases in maximum likelihood and parsimony: asimulation approach to a 10-taxon case. Cladistics 17, 266–281.
Posada, D., Buckley, T.R., 2004. Model selection and model averaging inphylogenetics: advantages of the AIC and Bayesian approaches over likelihoodratio tests. Syst. Biol. 53, 793–808.
Posada, D., Crandall, K.A., 1998. Modeltest: testing the model of DNA substitution.Bioinformatics 1, 817–818.
Raspotnig, G., Schuster, R., Krisper, G., 2007. A complex system for chemicalcommunication in an oribatid mite (Oribatida, Collohmnanniidae). In: Morales-Malacara, J.B., Behan-Pelletier, V., Ueckermann, E., Pérez, T.M., Estrada-Venegas,E.G., Badii, M. (Eds.), Acarology XI: Proceedings of the International Congress.Instituto de Biologia and Facultad de Ciencias, Universidad Nacional Autónomade México, Sociedad Latinoamericana de Acarología, Mexico.
Reeb, V., Lutzoni, F., Roux, C., 2004. Contribution of RPB2 to multilocus phylogeneticstudies of the euascomycetes (Pezizomycotina, Fungi) with special emphasis onthe lichen-forming Acarosporaceae and evolution of polyspory. Mol.Phylogenet. Evol. 32, 1036–1060.
Reuter, E., 1909. Zur Morphologie und Ontogenie der Acariden mit besondererBerucksichtigung von Pediculopsis graminum (E. Reut.). Acta Soc. Sci. Fenn. 36,1–288.
Robinson, M., Gouy, M., Gautier, C., Mouchiroud, D., 1998. Sensivity of the relative-rate test to taxonomic sampling. Mol. Biol. Evol. 15, 1091–1098.
Robinson-Rechavi, M., Huchon, D., 2000. RRTree: relative-rate tests between groupsof sequences on a phylogenetic tree. Bioinformatics 16, 296–297.
Ronquist, F., Huelsenbeck, J.P., 2003. MRBAYES 3: Bayesian phylogenetic inferenceunder mixed models. Bioinformatics 19, 1572–1574.
Rota-Stabelli, O., Yang, Z., Telford, M.J., 2009. MtZoa: a general mitochondrial aminoacid substitutions model for animal evolutionary studies. Mol. Phylogenet. Evol.52, 268–272.
Rudkin, D.M., Young, G.A., Nowlan, G.S., 2008. The oldest horseshoe crab: a newxiphosurid from late Ordovician Konservatt-Lagerstätten deposits, Manitoba,Canada. Palaeontology 51, 1–9.
Sahney, S., Benton, M.J., 2008. Recovery from the most profound mass extinction ofall time. Proc. R. Soc. B 275, 759–765.
Sakata, T., Norton, R.A., 2001. Opisthonotal gland chemistry of early-derivativeoribatid mites (Acari) and its relevance to systematic relationships of Astigmata.Int. J. Acarol. 27, 281–292.
Sanderson, M.J., Shaffer, H.B., 2002. Troubleshooting molecular phylogeneticanalyses. Annu. Rev. Ecol. Syst. 33, 49–72.
Sellnick, M., 1919. Die Oribatiden der Bernsteinsammlung der UniversitätKönigsberg i. Pr. Schrift Physikal-Okon Gesell Konigsberg 59, 21–42.
Sellnick, M., 1931. Milben in Bernstein. Bernsteinforsch 2, 148–180.Shultz, J.W., 2007. A phylogenetic analysis of the arachnid orders based on
morphological characters. Zool. J. Linn. Soc. 150, 221–265.Sitnikova, L.G., 1978. The main evolutionary trends of the Acari and the problem of
their monophyletism. Entomol. Rev. 57, 303–321.Sivhed, U., Wallwork, J.A., 1978. An early Jurassic oribatid mite from southern
Sweden. Geol. Foren. Stockh. Forh. 100, 65–70.Skoracka, A., Dabert M., 2010. The cereal rust mite Abacarus hystrix (Acari:
Eriophyoidea) is a complex of species: evidence from mitochondrial andnuclear DNA sequences. B. Entomol. Res., doi:10.1017/S0007485309990216.
Strimmer, K., Rambaut, A., 2002. Inferring confidence sets of possibly misspecifiedgene trees. Proc. R. Soc. Lond. B 269, 137–142.
Subías, L.S., Arillo, A., 2002. Oribatid mite fossils from the Upper Devonian of SouthMountain, New York and the Lower Carboniferous of County Antrim NorthernIreland (Acariformes, Oribatida). Est. Mus. Cienc. Nat. Alava 17, 93–106.
Svennblad, B., 2008. Consistent estimation of divergence times in phylogenetic treeswith local molecular clocks. Syst. Biol. 57, 947–954.
Swofford, D.L., 2002. PAUP*. Phylogenetic Analysis Using Parsimony (*and othermethods), Version 4.0b10. Sinauer Associates, Sunderland, MA.
Swofford, D.L., Waddell, P.J., Huelsenbeck, J.P., Foster, P.G., Lewis, P.O., Rogers, J.S.,2001. Bias in phylogenetic estimation and its relevance to the choice betweenparsimony and likelihood methods. Syst. Biol. 50, 525–539.
Tamura, K., Dudley, J., Nei, M., Kumar, S., 2007. MEGA4: molecular evolutionarygenetics analysis (MEGA) software version 4.0. Mol. Biol. Evol 24, 1596–1599.
Tanner, L.H., Lucas, S.G., Chapman, M.G., 2004. Assessing the record and causes ofLate Triassic extinctions. Earth Sci. Rev. 65, 103–139.
Telford, M.J., Thomas, R.H., 1999. Appendage development in embryos of theoribatid mite Archegozetes longisetosus (Acari, Oribatei, Trhypochthoniidae).Acta Zool. Stockholm 80, 193–200.
Thompson, J.D., Gibson, T.J., Plewniak, F., Jeanmougin, F., Higgins, D.G., 1997. TheClustalX windows interface. Flexible strategies for multiple sequence alignmentaided by quality analysis tools. Nucleic Acids Res. 25, 4876–4882.
van der Hammen, L., 1979. Comparative studies in Chelicerata. I. The Cryptognomae(Ricinulei, Architarbi and Anactinotrichida). Zool. Verhand. Leiden 174, 1–62.
Wagner, J., 1895. Contribution to the phylogeny of the Arachnida. On the position ofthe Acarina: the so-called Malpighian tubes and respiratory organs of theArachnida. Ann. Mag. Nat. Hist. 15, 285–315.
Walter, D.E., Lindquist, E.E., Smith, I.M., Cook, D.R., Krantz, G.W., 2009. OrderTrombidiformes. In: Krantz, G.W., Walter, D.E. (Eds.), A Manual of Acarology.Texas Tech University Press, Lubbock, pp. 233–420.
Walter, D.E., 2009. Suborder Endeostigmata. In: Krantz, G.W., Walter, D.E. (Eds.), AManual of Acarology. Texas Tech University Press, Lubbock, pp. 421–429.
Walter, D.E., Proctor, H.C., 1999. Mites: Ecology, Evolution and Behaviour. CABIPublishing, New York.
Whiteman, N.K., Sanchez, P., Merkel, J., Klompen, H., Parker, P.G., 2006. Cryptic hostspecificity of an avian skin mite (Epidermoptidae) vectored by louseflies(Hippoboscidae) associated with two endemic Galapagos bird species. J.Parasitol. 92, 1218–1228.
Woolley, T.A., 1961. A review of the phylogeny of mites. Ann. Rev. Entomol. 6, 263–284.
Woolley, T.A., 1971. Fossil oribatid mites in amber from Chiapas, Mexico (Acarina:Oribatei = Cryptostigmata). Uni. Calif. Pub. Entomol. 63, 91–99.
Zacharda, M., Krivoluckij, D.A., 1985. Prostigmatic mites (Acarina: Prostigmata)from the Upper Cretaceous and Paleogene amber of the USSR. Vest. Cesk. Ven.Spol. Zool. 49, 147–152.
Zakhvatkin, A.A., 1953. Studies on the morphology and postembryonic developmentof tyroglyphids (Sarcoptiformes, Tyroglyphoidea). In: Smirnov, E.S., Dubinin,V.B. (Eds.), A.A. Zachvatkin, Collected Scientific Works. Moscow State UniversityPublishing House, pp. 19–120 (in Russian).
Ziessler, D., Weygoldt, P., 1975. Feinstruktur der embryonalen Lateralorgane derGeißelspinne Tarantula marginemaculata C.L. Koch (Amblypygi, Arachnida).Cytobiologie 11, 466–479.
Zwickl, D.J., 2006. Genetic algorithm approaches for the phylogenetic analysis oflarge biological sequence datasets under the maximum likelihood criterion.Ph.D. Thesis. The University of Texas, Austin.
M. Dabert et al. / Molecular Phylogenetics and Evolution 56 (2010) 222–241 241